10,000 Matching Annotations
- Dec 2025
-
hyperpost.co hyperpost.co
-
-
-
Author response:
The following is the authors’ response to the previous reviews
Public Reviews:
Reviewer #2 (Public review):
Summary:
The current article presents a new type of analytical approach to the sequential organisation of whale song units.
Strengths:
The detailed description of the internal temporal structure of whale songs is something that has been thus far lacking.
Weaknesses:
The conceptual and terminological bases of the paper are problematical and hamper comparison with other taxa, including humans. According to signal theory, codas are indexical rather than symbolic. They signal an individual's group identity. Borrowing from humans and linguistics, coda inter-group variation represents a case of accents - phonologically different varieties of the same call - not dialects, confirming they are an index. This raises serious doubt about whether alleged "symbolism" and similarity between whale and human vocal behaviour is factual.
We respect that the reviewer does not agree with describing codas as symbolic markers of cultural identity in sperm whales, but ultimately we find the quantitative evidence presented in Hersh et al. (2022) compelling, and stand by the framing of our manuscript, which builds on this foundation.
The same applies to the difference between ICIs (inter-click interval) and IOIs (inter-onset interval). If the two are equivalent, variation in click duration needs to be shown so small that can be considered negligible. This raises serious doubt about whether the alleged variation in whale codas is indeed rhythmic in nature and prevents future efforts for comparison with the vocal capacities of other species. The scope and relevance of this paper for the broader field is limited.
We believe there has been a miscommunication. Coda inter-click intervals are calculated as the time between the onsets of sequential clicks within a coda. This is identical to definitions of inter-onset intervals in many publications, including:
-
Burchardt and Knörnschild (2020): “the duration between the beginning of one element and the next”
-
Friberg and Battel (2002): “the time interval between the onset of the tone and the onset of the immediately following tone”
-
De Gregorio et al. (2021): “the time between the onset of a note and the next one”
In response to a comment from this reviewer in the first round of revisions, we made the point that we do not believe rhythm analyses need be restricted to inter-onset intervals alone. Regardless of that stance, we did analyze inter-onset intervals in this manuscript and accordingly are capturing aspects of rhythm in our analyses. We have removed a poorly worded sentence in our introduction and apologize for any confusion it caused. We have also made this explicit in lines 30–35: “This classification is based on the total number of clicks and their rhythm and tempo extrapolated from the time interval between the onsets of consecutive clicks: the inter-click interval (ICI) [15, 16] (Fig. 1A). This measure is equivalent to the inter-onset intervals (IOIs) often used in rhythm analyses [17, 18, 19] but for the sake of compatibility with studies on sperm whale acoustics, we use ICI terminology throughout this paper.”
In our analyses, inter-click intervals and inter-onset intervals are equivalent measures.
Recommendations for the authors:
Reviewer #2 (Recommendations for the authors):
My concerns regarding interdisciplinary terminology and methods remain unaddressed. The study's inaccurate terminology hinders reliable comparison with other taxa, including humans. Being "symbolic" bears no weight on the new method that the authors present, thus, the unwillingness for compatibility is limiting and perplexing. The authors state that codas have been previously described as being symbolic, but just because poor terminology has been used before doesn't justify perpetuating it, especially when it confounds and conflicts with broader comparative efforts.
We agree that being symbolic bears no weight on the new method we present, but we believe it does bear weight on our interpretation of what our method reveals about patterns in sperm whale communication. For that reason, we have opted to maintain the current framing of our manuscript.
The same applies to the difference between ICIs and IOIs. The authors resist amending terminology, even though they state the two represent the same measure. If so, want prevents the correct use of IOIs?
We have opted to use ICI throughout the paper because it is standard terminology in sperm whale acoustics, but we have now made the ICI/IOI equivalence explicitly clear in the introduction.
References:
Burchardt LS, Knörnschild M. 2020. Comparison of methods for rhythm analysis of complex animals’ acoustic signals. PLoS Computational Biology 16. doi:10.1371/journal.pcbi.1007755
De Gregorio C, Valente D, Raimondi T, Torti V, Miaretsoa L, Friard O, Giacoma C, Ravignani A, Gamba M. 2021. Categorical rhythms in a singing primate. Current Biology 31:R1379–R1380. doi:10.1016/j.cub.2021.09.032
Friberg A, Battel GU. 2002. Structural communication In: Parncutt R, McPherson G, editors. The Science & Psychology of Music Performance: Creative Strategies for Teaching and Learning. Oxford University Press. doi:10.1093/acprof:oso/9780195138108.001.0001
Hersh TA, Gero S, Rendell L, Cantor M, Weilgart L, Amano M, Dawson SM, Slooten E, Johnson CM, Kerr I, Payne R, Rogan A, Andrews O, Ferguson EL, Hom-Weaver CA, Norris TF, Barkley YM, Merkens KP, Oleson EM, Doniol-Valcroze T, Pilkington J, Gordon J, Fernandes M, Guerra M, Hickmott L, Whitehead H. 2022. Evidence from sperm whale clans of symbolic marking in non-human cultures. Proceedings of the National Academy of Sciences 119:e2201692119. doi:10.1073/pnas.2201692119
-
Tags
Annotators
URL
-
-
www.biorxiv.org www.biorxiv.org
-
Author response:
The following is the authors’ response to the original reviews.
Reviewer #1 (Public review)
(1) This manuscript addresses an important problem of the uncoupling of oxidative phosphorylation due to hypoxia-ischemia injury of the neonatal brain and provides insight into the neuroprotective mechanisms of hypothermia treatment.
The authors used a combination of in vivo imaging of awake P10 mice and experiments on isolated mitochondria to assess various key parameters of the brain metabolism during hypoxia-ischemia with and without hypothermia treatment. This unique approach resulted in a comprehensive data set that provides solid evidence for the derived conclusions
We thank the reviewer for the positive feedback.
(2) The experiments were performed acutely on the same day when the surgery was performed. There is a possibility that the physiology of mice at the time of imaging was still affected by the previously applied anesthesia. This is particularly of concern since the duration of anesthesia was relatively long. Is it possible that the observed relatively low baseline OEF (~20%) and trends of increased OEF and CBF over several hours after the imaging start were partially due to slow recovery from prolonged anesthesia? The potential effects of long exposure to anesthesia before imaging experiments were not discussed.
We thank the reviewer for this important comment and for pointing out the potential influence of anesthesia on the physiological state of the animals. We apologize for any confusion. To clarify, all PAM imaging experiments were conducted in awake animals. Isoflurane anesthesia was used only during two brief surgical procedures: (1) the installation of the head-restraint plastic head plate and (2) the right common carotid artery (CCA) ligation. Each anesthesia session lasted less than 20 minutes.
We have revised the Methods section to provide additional details:
For the subsection Procedures for PAM Imaging on page 17, we clarified the sequence of procedures during the head plate installation, as well as the corresponding anesthesia duration:
“After the applied glue was solidified (~20 min), the animal was first returned to its cage for full recovery from anesthesia, and then carefully moved to the treadmill and secured to the metal arm-piece with two #4–40 screws for awake PAM imaging. The total duration of anesthesia, including preparation and glue solidification, was approximately 20 minutes.”
For the subsection Neonatal Cerebral HI and Hypothermia Treatment on page 19, we also clarified the CCA ligation procedure:
“Briefly, P10 mice of both sexes anesthetized with 2% isoflurane were subjected to the right CCA-ligation. To manage pain, 0.25% Bupivacaine was administered locally prior to the surgical procedures, which took less than 10 minutes. After a recovery period for one hour, awake mice were exposed to 10% O<sub>2</sub> for 40 minutes in a hypoxic chamber at 37 °C.”
Regarding the reviewer’s concern about the observed trends in OEF and CBF, we agree that residual effects of anesthesia could, in principle, influence physiological parameters. However, we believe this is unlikely in this study for the following reasons. First, all imaging was conducted in awake animals after a clearly defined recovery period. Second, the trend of increasing OEF and CBF over time was consistent across animals and aligned with expected physiological responses following hypoxic-ischemic injury. In particular, the relatively low baseline OEF (0.21 at 37°C) is consistent with our previous study (0.25; (Cao et al., 2018)). The gradual increase in CBF and OEF reflects metabolic compensation and reperfusion following hypoxia-ischemia, as previously described (Lin and Powers, 2018). Therefore, we believe the observed changes are of physiological origin rather than anesthesia-related artifacts.
(3) The Methods Section does not provide information about drugs administered to reduce the pain. If pain was not managed, mice could be experiencing significant pain during experiments in the awake state after the surgery. Since the imaging sessions were long (my impression based on information from the manuscript is that imaging sessions were ~4 hours long or even longer), the level of pain was also likely to change during the experiments. It was not discussed how significant and potentially evolving pain during imaging sessions could have affected the measurements (e.g., blood flow and CMRO<sub>2</sub>). If mice received pain management during experiments, then it was not discussed if there are known effects of used drugs on CBF, CMRO<sub>2</sub>, and lesion size after 24 hr.
We thank the reviewer for this valuable comment regarding pain management. We confirm that local analgesia was administered to all animals prior to surgical procedures. Specifically, 0.25% Bupivacaine was applied locally before both the head-restraint plate installation and the CCA ligation. These details have now been clarified in the Methods section:
For the subsection Procedures for PAM Imaging on page 16, we added:
“To manage pain, 0.25% Bupivacaine was administered locally prior to the surgical procedures.”
For the subsection Neonatal Cerebral HI and Hypothermia Treatment on page 18, we added:
“To manage pain, 0.25% Bupivacaine was administered locally prior to the surgical procedures, which took less than 10 minutes.”
To our knowledge, Bupivacaine has minimal systemic effects at the dose used and is unlikely to significantly alter CBF, CMRO<sub>2</sub>, or lesion development (Greenberg et al., 1998). No other analgesics (e.g., NSAIDs or opioids) were administered unless distress symptoms were observed—which did not occur in this study.
Additionally, although imaging sessions were extended (up to 2 hours), animals remained calm and showed no signs of pain or distress during or after the procedures. Throughout the experimental period (up to 24 hours post-surgery), animals were monitored for signs of discomfort (e.g., abnormal activity, breathing, or weight gain), but no additional analgesia was required. The neonatal HI procedures are considered minimally invasive, and based on our protocol and prior experience, local Bupivacaine provides effective analgesia during and after the brief surgeries. We have added a corresponding note in the Discussion section (newly added subsection: Limitations in this study, the last paragraph) on page 15:
“We observed no signs of distress or pain and did not use stress- or pain-reducing drugs during imaging. However, potential effects of stress or residual pain on CBF and CMRO<sub>2</sub> cannot be fully ruled out. Future studies could incorporate more detailed pain assessment and stress-mitigation strategies to further enhance physiological reliability.”
(4) Animals were imaged in the awake state, but they were not previously trained for the imaging procedure with head restraint. Did animals receive any drugs to reduce stress? Our experience with well-trained young-adult as well as old mice is that they can typically endure 2 and sometimes up to 3 hours of head-restrained awake imaging with intermittent breaks for receiving the rewards before showing signs of anxiety. We do not have experience with imaging P10 mice in the awake state. Is it possible that P10 mice were significantly stressed during imaging and that their stress level changed during the imaging session? This concern about the potential effects of stress on the various measured parameters was not discussed.
We thank the reviewer for this important comment regarding the potential effects of stress during awake imaging. The neonatal mice used in our study were P10, a stage at which animals are still physiologically immature and relatively inactive. Due to their small size and limited mobility, these animals did not struggle or show signs of distress during the imaging sessions. All animals remained calm and stable throughout the procedure, and no stress-reducing drugs were administered.
We agree that, unlike older animals, P10 mice are not amenable to prior behavioral training. However, their underdeveloped motor activity and natural docility at this stage allowed for stable head-restrained imaging without inducing overt stress responses. Although no behavioral signs of stress were observed, we acknowledge that subtle physiological effects cannot be entirely excluded. We have added a brief discussion in the Discussion section (newly added subsection: Limitations in this study, the last paragraph) on page 15:
“Lastly, for awake imaging, the small size of neonatal mice at P10 aids stability during awake PAM imaging, though it limits the feasibility of prior training, which is typically possible in older animals.”
(5) The temperature of the skull was measured during the hypothermia experiment by lowering the water temperature in the water bath above the animal's head. Considering high metabolism and blood flow in the cortex, it could be challenging to predict cortical temperature based on the skull temperature, particularly in the deeper part of the cortex.
We thank the reviewer for this helpful comment and for highlighting an important technical consideration. We acknowledge that we did not directly measure intracortical tissue temperature during the hypothermia experiments. While we recognize that relying on skull temperature may have limitations—particularly in reflecting temperature changes in deeper cortical regions—this approach is consistent with clinical practice, where intracortical temperature is typically not measured. Moreover, prior studies have shown that skull or brain surface temperature generally reflects cortical thermal dynamics to a reasonable extent under controlled conditions (Kiyatkin, 2007). We have added the following note in the Discussion section (newly added subsection: Limitations in this study, the 2<sup>nd</sup> paragraph) on page 14:
“A technical limitation is the absence of direct intracortical temperature measurements during hypothermia; we relied on skull temperature, which may not fully capture temperature dynamics in deeper cortical layers. However, this approach aligns with clinical practice, where intracortical temperature is not typically measured. Future studies could benefit from more precise intracortical assessments.”
(6) The map of estimated CMRO<sub>2</sub> (Fig. 4B) looks very heterogeneous across the brain surface. Is it a coincidence that the highest CMRO<sub>2</sub> is observed within the central part of the field of view? Is there previous evidence that CMRO<sub>2</sub> in these parts of the mouse cortex could vary a few folds over a 1-2 mm distance?
We appreciate the reviewer’s insightful observation regarding the spatial heterogeneity observed in the estimated CMRO<sub>2</sub> map (Fig. 4B). This heterogeneity is not a result of scanning bias, as uniform contour scanning was performed across the entire field of view. The higher CMRO<sub>2</sub> values observed in the central region are unlikely to be artifacts and more likely reflect underlying physiological variability.
Our CMRO<sub>2</sub> estimation is based on an algorithm we previously developed and validated in other tissues. Specifically, we have successfully applied this algorithm to assess oxygen metabolism in the mouse kidney (Sun et al., 2021) and to monitor vascular adaptation and tissue oxygen metabolism during cutaneous wound healing (Sun et al., 2022). These studies demonstrated the algorithm's capability to capture spatial variations in oxygen metabolism. Although the current application to the brain is novel, the algorithm has been validated in controlled experimental settings and shown to produce consistent results. We acknowledge that the observed range of CMRO<sub>2</sub> appears relatively broad across a 1–2 mm distance; however, such heterogeneity may arise from local differences in vascular density, metabolic demand, or tissue oxygenation — all of which can vary across cortical regions, even within small spatial scales. We have added a brief note in the Discussion (Subsection: Optical CMRO<sub>2</sub> detection in neonatal care) on page 13 to acknowledge this point:
“Additionally, the spatial heterogeneity in estimated CMRO<sub>2</sub> observed in our data may reflect underlying physiological variability, including differences in vascular structure or metabolic demand across cortical regions. Future studies will aim to further validate and interpret these spatial patterns.”
(7) The justification for using P10 mice in the experiments has not been well presented in the manuscript.
We thank the reviewer for pointing out the need to clarify our choice of developmental stage. We chose P10 mice for our hypoxia-ischemia injury model because this stage is widely recognized as developmentally comparable to human term infants in terms of brain maturation. This approach has been validated by several previous studies (Clancy et al., 2007; Mallard and Vexler, 2015; Sheldon et al., 2018). We have added the following clarification to the Methods section (Subsection: Neonatal Cerebral HI and Hypothermia Treatment) on page 18:
“P10 mice were chosen for our experiments as they are widely used to model near-term infants in humans. At this developmental stage, the brain maturation in mice closely parallels that of near-term infants, making them an appropriate model for studying neonatal brain injury and therapeutic interventions (Clancy et al., 2007; Mallard and Vexler, 2015; Sheldon et al., 2018).”
(8) It was not discussed how the observations made in this manuscript could be affected by the potential discrepancy between the developmental stages of P10 mice and human babies regarding cellular metabolism and neurovascular coupling.
We thank the reviewer for raising this important point regarding developmental differences between P10 mice and human infants. We have discussed this issue by adding the following statement to the Discussion section (newly added subsection: Limitations in this study, the 1<sup>st</sup> paragraph) on page 15, where we summarize the overall study design and model selection:
“While P10 mice are widely used to model near-term human infants, developmental differences in cellular metabolism and neurovascular coupling may affect the observed outcomes and limit direct clinical translation (Clancy et al., 2007; Mallard and Vexler, 2015; Sheldon et al., 2018). Nevertheless, the P10 model remains a valuable and widely accepted tool for studying neonatal hypoxia-ischemia mechanisms and evaluating therapeutic interventions.”
(9) Regarding the brain temperature measurements, the authors should use a new cohort of mice, implant the miniature thermocouples 1 mm, 0.5 mm, and immediately below the skull in different mice, and verify the temperature in the brain cortex under conditions applied in the experiments. The same approach could be applied to a few mice undergoing 4-hr-long hypothermia treatment in a chamber, which will provide information about the brain temperature that resulted in observed protection from the injury.
We thank the reviewer for this helpful recommendation. We fully agree that direct intracortical temperature measurement would provide more accurate insight into thermal dynamics during hypothermia treatment. However, the primary aim of this study was not to characterize the precise intracortical temperature response under hypothermic conditions, but rather to examine the effects of hypothermia on CMRO<sub>2</sub> and mitochondrial function. Due to the substantial time and resources required to perform direct intracortical temperature monitoring—and considering the technical focus of the current work—we respectfully suggest reserving such investigations for a future study specifically focused on thermal dynamics in hypoxia-ischemia models.
We have acknowledged this limitation in the subsection Limitations in this study of the Discussion on page 15, noting that skull temperature was used as an approximation of brain temperature and that this approach is consistent with clinical practice, where intracortical temperature is typically not measured. We also note that future studies may benefit from more precise assessments using intracortical probes.
(10) The mean values presented in Fig. 4G are much lower than the peak values in the 2D panels and potentially were calculated as the average values over the entire field of view. Please provide more details on how CMRO<sub>2</sub> was estimated and if the validity of the measurements is expected across the entire field of view. If there are parts of the field of view where the estimation of CMRO<sub>2</sub> is more reliable for technical reasons, maybe one way to compute the mean values is to restrict the usable data to the more centralized part of the field of view.
We thank the reviewer for this thoughtful comment. We confirm that CMRO<sub>2</sub> values shown in Figure 4G were calculated as spatial averages over the entire field of view (FOV; ~5 × 3 mm<sup>2</sup>) encompassing both hemicortices, as shown in Figure 1C. Regarding the observed CMRO<sub>2</sub> values, The apparent difference likely reflects a comparison between two different post-HI time points. Specifically, the ~0.5 value shown for the 37°C ipsilateral group in Figure 4G reflects the average CMRO<sub>2</sub> measured 24 hours after HI, while the ~1.5 value in Figure 2D (red line) corresponds to CMRO<sub>2</sub> during the early 0–2 hour post-HI period. The temporal difference accounts for the apparent discrepancy in magnitude. We understand the importance of consistency across the field of view and have clarified this point in the subsection Procedures for PAM Imaging in the Methods on page 17 “For the imaging field covering both hemicortices between the Bregma and Lambda of the neonatal mouse (5 × 3 mm<sup>2</sup> as shown in Figure 1C, with each hemicortex measuring 2.5 × 3 mm<sup>2</sup>)”, as well as in the Figure 4 legend on page 34 “Correlation of CMRO<sub>2</sub> and post-HI brain infarction in mouse neonates at 24 hours”.
In our model and setup, CMRO<sub>2</sub> estimation is spatially robust across the FOV under standard imaging conditions. We recognize, however, that certain peripheral regions may be more prone to signal attenuation. Future refinement of region selection could further improve spatial averaging strategies. For the current study, full-FOV averaging was used consistently across all groups to maintain comparability.
(11) Minor: Results presented in Supplementary Tables have too many significant digits.
Thank you for the helpful suggestion. We have revised Supplementary Tables S1 and S2 to reduce the number of significant digits and improve clarity.
Reviewer #2 (Public review)
(1) In this study, authors have hypothesized that mitochondrial injury in HIE is caused by OXPHOS-uncoupling, which is the cause of secondary energy failure in HI. In addition, therapeutic hypothermia rescues secondary energy failure. The methodologies used are state-of-the art and include PAM technique in live animal, bioenergetic studies in the isolated mitochondria, and others.
The study is comprehensive and impressive. The article is well written and statistical analyses are appropriate.
We thank the reviewer for the positive feedback.
(2) The manuscript does not discuss the limitation of this animal model study in view of the clinical scenario of neonatal hypoxia-ischemia.
We thank the reviewer for this valuable feedback. In response, we have added a dedicated “Limitations in this study” subsection in the Discussion, where we address the potential limitations of this animal model in the context of the clinical scenario of neonatal hypoxia-ischemia in the first paragraph on page 14, including the developmental differences between P10 mice and human infants.
(3) I see many studies on Pubmed on bioenergetics and HI. Hence, it is unclear what is novel and what is known.
We thank the reviewer for this important comment regarding the novelty of our study in the context of existing research on bioenergetics and hypoxia-ischemia (HI). To better clarify the novel aspects of our work, we have highlighted the relevant content in the Abstract (page 4) and Introduction (page 5). Specifically, while many studies have explored HI-related bioenergetic dysfunction, the mechanisms by which therapeutic hypothermia modulates CMRO<sub>2</sub> and mitochondrial function post-HI remain poorly understood.
Abstract on page 4: “However, it is unclear how post-HI hypothermia helps to restore the balance, as cooling reduces CMRO<sub>2</sub>. Also, how transient HI leads to secondary energy failure (SEF) in neonatal brains remains elusive. Using photoacoustic microscopy, we examined the effects of HI on CMRO<sub>2</sub> in awake 10-day-old mice, supplemented by bioenergetic analysis of purified cortical mitochondria.”
Introduction on page 5: “The use of awake mouse neonates avoided the confounding effects of anesthesia on CBF and CMRO<sub>2</sub> (Cao et al., 2017; Gao et al., 2017; Sciortino et al., 2021; Slupe and Kirsch, 2018). In addition, we measured the oxygen consumption rate (OCR), reactive oxygen species (ROS), and the membrane potential of mitochondria that were immediately purified from the same cortical area imaged by PAM. This dual-modal analysis enabled a direct comparison of cerebral oxygen metabolism and cortical mitochondrial respiration in the same animal. Moreover, we compared the effects of therapeutic hypothermia on oxygen metabolism and mitochondrial respiration, and correlated the extent of CMRO<sub>2</sub>-reduction with the severity of infarction at 24 hours after HI. Our results suggest that blocking HI-induced OXPHOS-uncoupling is an acute effect of hypothermia and that optical detection of CMRO<sub>2</sub> may have clinical applications in HIE.”
In this study, we propose that uncoupled oxidative phosphorylation (OXPHOS) underlies the secondary energy failure observed after HI, and we demonstrate that hypothermia suppresses this pathological CMRO<sub>2</sub> surge, thereby protecting mitochondrial integrity and preventing injury. Additionally, our use of photoacoustic microscopy (PAM) in awake neonatal mice represents a novel, non-invasive approach to track cerebral oxygen metabolism, with potential clinical relevance for guiding hypothermia therapy.
(4) What are the limitations of ex-vivo mitochondrial studies?
We thank the reviewer for this insightful comment. We acknowledge that ex-vivo mitochondrial assays do not fully replicate in vivo physiological conditions, as they lack systemic factors such as blood flow, cellular interactions, and intact tissue architecture. However, these assays are well-established and widely accepted in the field for evaluating mitochondrial function under controlled conditions (Caspersen et al., 2008; Niatsetskaya et al., 2012). Despite their limitations, they enable direct comparisons of mitochondrial activity across experimental groups and provide valuable mechanistic insights that complement in vivo observations.
(5) PAM technique limits the resolution of the image beyond 500-750 micron depth. Assessing basal ganglia may not be possible with this approach?
We thank the reviewer for this important comment. We agree that the imaging depth of PAM is limited and may not allow assessment of deeper brain structures such as the basal ganglia. However, in our neonatal HI model—as in many clinical cases of HIE—cortical injury is typically more severe and represents a major focus for mechanistic and therapeutic investigations. The cortical regions assessed with PAM are thus highly relevant to the pathophysiology of neonatal HI. We have now acknowledged this depth limitation in the third paragraph of the newly added Limitations in this study subsection of the Discussion on page 15:
“Another limitation of this study is the restricted imaging depth of the PAM technique, which is typically less than 1 mm and therefore does not allow assessment of deeper brain structures such as the basal ganglia. However, in both our neonatal HI model and most clinical cases of neonatal hypoxia-ischemia, cortical injury tends to be more prominent and functionally significant. As such, our cortical measurements remain highly relevant for investigating the mechanisms of injury and evaluating therapeutic interventions.”
(6) Hypothermia in present study reduces the brain temperature from 37 to 29-32 degree centigrade. In clinical set up, head temp is reduced to 33-34.5 in neonatal hypoxia ischemia. Hence a drop in temperature to 29 degrees is much lower relative to the clinical practice. How the present study with greater drop in head temperature can be interpreted for understanding the pathophysiology of therapeutic hypothermia in neonatal HIE. Moreover, in HIE model using higher temperature of 37 and dropping to 29 seems to be much different than the clinical scenario. Please discuss.
We thank the reviewer for raising this important point regarding temperature ranges in our study. In Figure 1, we used a broader temperature range (down to 29°C) to explore the general relationship between temperature and CMRO<sub>2</sub> in uninjured neonatal mice. This experiment was not intended to model therapeutic hypothermia directly, but rather to characterize the baseline physiological responses.
For all experiments involving hypothermia as a therapeutic intervention following HI, we consistently maintained a brain temperature of 32°C, which falls within the clinically accepted mild hypothermia range for neonatal HIE (typically 33–34.5°C). We believe this temperature closely mimics clinical practice and supports the translational relevance of our findings.
(7) NMR was assessed ex-vivo. How does it relate to in vivo assessment. Infants admitted in Neonatal intensive Care Unit, frequently get MRI with spectroscopy. How do the MRS findings in human newborns with HIE correlate with the ex-vivo evaluation of metabolites.
We thank the reviewer for this insightful question. While our study assessed brain metabolites ex vivo, similar metabolic changes have been observed in vivo using proton magnetic resonance spectroscopy (¹H-MRS) in infants with HIE. Specifically, reductions in N-acetylaspartate (NAA) — a marker of neuronal integrity — have been reported in neonates with severe brain injury, aligning with our ex vivo findings. This correlation between in vivo and ex vivo assessments supports the translational relevance of our model for studying metabolic disruption in neonatal HIE. We have added this point to the subsection Using Optically Measured CMRO<sub>2</sub> to Detect Neonatal HI Brain Injury of the Results on page 8, along with a supporting clinical reference (Lally et al., 2019):
“In addition, in vivo proton MRS in infants with HIE has also shown a reduction in NAA, particularly in cases of severe injury (Lally et al., 2019). This reduction in NAA, observed in neonatal intensive care settings, reflects neuronal and axonal loss or dysfunction and serves as a biomarker for injury severity. The alignment between our ex vivo observations and in vivo MRS findings in clinical studies reinforces the translational relevance of our model for investigating metabolic disturbances in neonatal HIE.”
Reviewer #3 (Public review)
(1) In Sun et al. present a comprehensive study using a novel photoacoustic microscopy setup and mitochondrial analysis to investigate the impact of hypoxia-ischemia (HI) on brain metabolism and the protective role of therapeutic hypothermia. The authors elegantly demonstrate three connected findings: (1) HI initially suppresses brain metabolism, (2) subsequently triggers a metabolic surge linked to oxidative phosphorylation uncoupling and brain damage, and (3) therapeutic hypothermia mitigates HI-induced damage by blocking this surge and reducing mitochondrial stress.
The study's design and execution are great, with a clear presentation of results and methods. Data is nicely presented, and methodological details are thorough.
We thank the reviewer for the positive feedback.
(2) However, a minor concern is the extensive use of abbreviations, which can hinder readability. As all the abbreviations are introduced in the text, their overuse may render the text hard to read to non-specialist audiences. Additionally, sharing the custom Matlab and other software scripts online, particularly those used for blood vessel segmentation, would be a valuable resource for the scientific community. In addition, while the study focuses on the short-term effects of HI, exploring the long-term consequences and definitively elucidating HI's impact on mitochondria would further strengthen the manuscript's impact.
We thank the reviewer for these valuable suggestions. Please find our point-by-point responses below:
Abbreviations: To improve readability, we have added a List of Abbreviations on page 3 to help readers, especially non-specialists, navigate the terminology more easily.
MATLAB Code Availability: The methodology for blood vessel segmentation was described in detail in our previous publication (Sun et al., 2020). We have now updated the subsection Quantification of Cerebral Hemodynamics and Oxygen Metabolism by PAM of the Methods on page 18 to provide additional details and have indicated that the MATLAB scripts are available upon request.
“Briefly, this process involves generating a vascular map using signal amplitude from the Hilbert transformation, selecting a region slightly larger than the vessel of interest, and applying Otsu’s thresholding method to remove background pixels. Isolated or spurious boundary fragments are then removed to improve boundary smoothness. The customized MATLAB code used for vessel segmentation is available upon request.”
Long-Term Effects of Hypothermia: We agree that exploring long-term outcomes would enhance the broader impact of this research. While our study focuses on the acute phase following HI, prior studies have shown long-term neuroprotective benefits of therapeutic hypothermia, such as enhanced white matter development (Koo et al., 2017). We have added this point to the fourth paragraph in the subsection Limitations in this study of the Discussion on page 15:
“While our study focuses on the acute effects of hypothermia, previous research has shown long-term neuroprotective benefits, including improved white matter development post-injury (Koo et al., 2017). These findings highlight hypothermia's potential for both immediate and extended recovery, warranting further study of long-term outcomes.”
(3) Extensive use of abbreviations.
Thank you for the helpful suggestion. To improve readability for a broader audience, we have added a List of Abbreviations on page 3 of the manuscript to assist readers in navigating terminology used throughout the text. This has been included as Response #2 to Reviewer #3.
(4) Share code used to conduct the study.
Thank you for the suggestion. The methodology for vessel segmentation was previously published (Sun et al., 2020), and we have noted in the subsection Quantification of Cerebral Hemodynamics and Oxygen Metabolism by PAM of the Methods on page 18 that the MATLAB code is available upon request. This has also been included as Response #2 to Reviewer #3.
Reference:
Cao R, Li J, Kharel Y, Zhang C, Morris E, Santos WL, Lynch KR, Zuo Z, Hu S. 2018. Photoacoustic microscopy reveals the hemodynamic basis of sphingosine 1-phosphate-induced neuroprotection against ischemic stroke. Theranostics 8:6111–6120. doi:10.7150/thno.29435
Caspersen CS, Sosunov A, Utkina-Sosunova I, Ratner VI, Starkov AA, Ten VS. 2008. An Isolation Method for Assessment of Brain Mitochondria Function in Neonatal Mice with Hypoxic-Ischemic Brain Injury. Developmental Neuroscience 30:319–324. doi:10.1159/000121416
Clancy B, Kersh B, Hyde J, Darlington RB, Anand KJS, Finlay BL. 2007. Web-based method for translating neurodevelopment from laboratory species to humans. Neuroinformatics 5:79–94. doi:10.1385/ni:5:1:79
Greenberg RS, Zahurak M, Belden C, Tunkel DE. 1998. Assessment of oropharyngeal distance in children using magnetic resonance imaging. Anesth Analg 87:1048–1051. doi:10.1097/00000539-199811000-00014
Kiyatkin EA. 2007. Brain temperature fluctuations during physiological and pathological conditions. Eur J Appl Physiol 101:3–17. doi:10.1007/s00421-007-0450-7
Koo E, Sheldon RA, Lee BS, Vexler ZS, Ferriero DM. 2017. Effects of therapeutic hypothermia on white matter injury from murine neonatal hypoxia-ischemia. Pediatr Res 82:518–526. doi:10.1038/pr.2017.75
Lally PJ, Montaldo P, Oliveira V, Soe A, Swamy R, Bassett P, Mendoza J, Atreja G, Kariholu U, Pattnayak S, Sashikumar P, Harizaj H, Mitchell M, Ganesh V, Harigopal S, Dixon J, English P, Clarke P, Muthukumar P, Satodia P, Wayte S, Abernethy LJ, Yajamanyam K, Bainbridge A, Price D, Huertas A, Sharp DJ, Kalra V, Chawla S, Shankaran S, Thayyil S, MARBLE consortium. 2019. Magnetic resonance spectroscopy assessment of brain injury after moderate hypothermia in neonatal encephalopathy: a prospective multicentre cohort study. Lancet Neurol 18:35–45. doi:10.1016/S1474-4422(18)30325-9
Lin W, Powers WJ. 2018. Oxygen metabolism in acute ischemic stroke. J Cereb Blood Flow Metab 38:1481–1499. doi:10.1177/0271678X17722095
Mallard C, Vexler Z. 2015. Modeling ischemia in the immature brain: how translational are animal models? Stroke 46:3006–3011. doi:10.1161/STROKEAHA.115.007776
Niatsetskaya ZV, Sosunov SA, Matsiukevich D, Utkina-Sosunova IV, Ratner VI, Starkov AA, Ten VS. 2012. The Oxygen Free Radicals Originating from Mitochondrial Complex I Contribute to Oxidative Brain Injury Following Hypoxia–Ischemia in Neonatal Mice. J Neurosci 32:3235–3244. doi:10.1523/JNEUROSCI.6303-11.2012
Sheldon RA, Windsor C, Ferriero DM. 2018. Strain-Related Differences in Mouse Neonatal Hypoxia-Ischemia. Dev Neurosci 40:490–496. doi:10.1159/000495880
Sun N, Bruce AC, Ning B, Cao R, Wang Y, Zhong F, Peirce SM, Hu S. 2022. Photoacoustic microscopy of vascular adaptation and tissue oxygen metabolism during cutaneous wound healing. Biomed Opt Express, BOE 13:2695–2706. doi:10.1364/BOE.456198
Sun N, Ning B, Bruce AC, Cao R, Seaman SA, Wang T, Fritsche-Danielson R, Carlsson LG, Peirce SM, Hu S. 2020. In vivo imaging of hemodynamic redistribution and arteriogenesis across microvascular network. Microcirculation 27:e12598. doi:10.1111/micc.12598
Sun N, Zheng S, Rosin DL, Poudel N, Yao J, Perry HM, Cao R, Okusa MD, Hu S. 2021. Development of a photoacoustic microscopy technique to assess peritubular capillary function and oxygen metabolism in the mouse kidney. Kidney International 100:613–620. doi:10.1016/j.kint.2021.06.018
-
-
test2025.mitkoforevents.cz test2025.mitkoforevents.cz
-
Zkontrolujte všechny dostupné rozměry nůžkových stanů a zjistěte více o jejich parametrech a výhodách.
Vyberte rozměr, který nejvíce odpovídá Vašemu účelu.
-
hliníkové, osmihranné nohy (stěna 2 mm)
osmiúhelníková noha o tl. 2 mm
-
Nejoblíbenější řada obchodních stanů Nůžkové stany Octa Optima jsou synonymem pohodlí a spolehlivosti. Jsou extrémně snadné na rozložení, připravené k použití za pouhých 60 sekund. Díky kompaktním rozměrům po složení se vybrané modely bez problémů vejdou do kufru standardního auta. Stany jsou také pohodlné na přenášení, i po rozložení, a mimořádně stabilní – odolné vůči větru a nepříznivým povětrnostním podmínkám. Nemusíte se obávat, že by se převrhly nebo odletěly. Zajišťují plnou bezpečnost během každé akce.
Střední řada nůžkových stanů Zesílený profil stanové nohy o průměru 48 mm, prodloužená záruka a stále zachovaná stavba do 60 s! Stany Octa Optima lze označit za zlatou střední cestu. (next paragraph) Hodí se do náročnějších podmínek nebo tam, kde se dá očekávat zhoršené počasí. Stany v této řadě zvládnou zastřešit od 3x3 m až do největšího rozměru 6x6 m. + change the text in video for CZ
-
-
bafybeih53tgekjmdkenjnnw3yhl5a4vvwf6amcdheuzuowkh5xrictvpky.ipfs.dweb.link bafybeih53tgekjmdkenjnnw3yhl5a4vvwf6amcdheuzuowkh5xrictvpky.ipfs.dweb.link
-
peergos.net peergos.net
-
/hyperpost/🌐/🧊/index.html
-
-
forestdhamma.org forestdhamma.org
-
Salta alrededor por todo el lugar,como un mono, pero nunca recibe ninguna satisfacción.
Una mente no disciplinada se escapa de su centro o de su enfoque.
-
ira puede prevalecer y cambiarel nivel de base de citta
Las acciones o tendencias de la vida práctica pueden forjar la base de citta.
-
esto lo llamamos “la base de citta”, que significael nivel de citta.
¿Qué tanto hemos comprendido o reconocido la citta primordial?
-
Las intenciones se encuentran en la persona, no en lacomputadora
El cuerpo y la mente no son impuros o malos por naturaleza, sino por el modo en que una persona las usa para sus propios fines. Ya sea para bien o para mal.
-
Pero a fin de liberar citta de las kilesas, tene-mos que disponer de ambos, el cuerpo y la mente, como mecanismosnecesarios para ver las kilesas en acción.
La única forma de ver el error o las impurezas es sobre el campo mismo de la acción.
Hay que reconocerlas actuando.
-
Lacitta es modificada de ese modo a causa de avijjā, que penetró citta,usurpa citta y usa los poderes de citta para sus propios fines.
Marión - Cuando el 'yo' se "encarna" o se fija a su existencia, entonces toma propiedad de su realidad, asume su 'yoidad', aunque esto sea un acontecimiento irrepetible, también se trata de una modalidad reducida.
-
La ignorancia fundamental, o avijjā,
La ignorancia fundamental como aquella que trae como consecuencia una vida superficial o basada en la ilusión.
-
Kruba Ajaans
Maestros y monjes budistas de la tradición tailandesa del bosque.
Kruba= monje de alto rango por su experiencia, se les considera autoridad mística. Ajaans= palabra del sánscrito que traduce "Maestro" o "Guía".
Énfasis en la meditación profunda.
-
la verdadera naturaleza de citta no puede serexpresada en palabras o conceptos.
La naturaleza de dicho fenómeno excede a los conceptos.
-
citta
Citta - lo ilimitado - Diferente a nociones como mente, alma o espíritu.
-
los estados dela mente existen en conjunción con el conocimiento de ellos
- Los estados o vivencias.
- La consciencia de ellos.
-
-
compass-onlinelibrary-wiley-com.ezphost.dur.ac.uk compass-onlinelibrary-wiley-com.ezphost.dur.ac.uk
-
[T]o be affected by the unserviceable, resistant, or threatening character of that which is ready-to-hand, becomes ontologically possible only in so far as Being-in as such has been determined existentially beforehand in such a manner that what it encounters within-the-world can ‘matter’ to it in this way. The fact that this sort of thing can ‘matter’ to it is grounded in Befindlichkeit (BT 176/137).
to be affected by that which is ready to hand (equipment; given to us in bare nature) is possible only bc of how dasein is i=determined in its nature
-
-
socialsci.libretexts.org socialsci.libretexts.org
-
o now, after the height of the coronavirus pandemic, what does “health” mean to you?
I dont feel like my perception of health has changed, even after the corona virus. Most of the individuals that were affected by this and unfortunately passed away because of it were elders with already existing medical problems. The pandemic caused a strain on those problems and faced the consequences. But even now, people still need to be wary of what they have and how they take care of themselves, especially around elders who are already facing illness. It's as simple as being careful with your health and to take into consideration who you risk around you if you dont.
-
-
mail.google.com mail.google.com
-
Lei Complementar 214/2025
deixa o imposto mais simples da empresa entender, mas em cotra partida a pessoa so aproveita o imposto da parte agregada.
-
-
www.biorxiv.org www.biorxiv.org
-
Note: This preprint has been reviewed by subject experts for Review Commons. Content has not been altered except for formatting.
Learn more at Review Commons
Referee #2
Evidence, reproducibility and clarity
In this manuscript the authors evaluate the role of Microtubule Associated Protein 7 (MAP7) in postnatal Sertoli cell development. The authors build two novel transgenic mouse lines (Map7-eGFP, Map7 knockout) which will be useful tools to the community. The transgenic mouse lines are used in paired advanced sequencing experiments and advanced imaging experiments to determine how Sertoli cell MAP7 is involved in the first wave of spermatogenesis. The authors identify MAP7 as an important regulator of Sertoli cell polarity and junction formation with loss of MAP7 disrupting intracellular microtubule and F-actin arrangement and Sertoli cell morphology. These structural issues impact the first wave of spermatogenesis causing a meiotic delay that limits round spermatid numbers. The authors also identify possible binding partners for MAP7, key among those MYH9.
The authors did a great job building a complex multi-modal project that addressed the question of MAP7 function from many angles. The is an excellent balance of using many advanced methods while still keeping the project narrowed, to use only tools to address the real questions. The lack of quality testing on the germ cells outside of TUNEL is disappointing, but the Conclusion section implies that this sort of work is being done currently so the omission in this manuscript is acceptable. However, there is an issue with the imaging portion of the work on MYH9. The conclusions from the MYH9 data is currently overstated, super-resolution imaging of Map7 knockouts with microtubule and F-actin stains, and imaging that uses MYH9 with either Map7-eGFP or anti-MAP7 are also needed to both support the MAP7-MYH9 interaction normally and lack of interaction with failure of MYH9 to localize to microtubules and F-actin in knockouts. Since a Leica SP8 was used for the imaging, using either Leica LIGHTNING or just higher magnification will likely be the easiest solution.
This manuscript is nicely organized with almost all of the results spelled out very clearly and almost always paired with figures that make compelling and convincing support for the conclusions. There are minor revision suggestions for improving the manuscript listed below. These include synching up Figure and Supplemental Figure reference mismatches. There are also many minor, but important, details that need to be added to the Methods section including many catalog numbers and some references.
- Some of the imaging, especially Fig4F could benefit and be more convincing with super-resolution imaging in the 150nm range (SIM, Airyscan, LIGHTNING, SoRa) possibly even just imaging with a higher magnification objective (60x or 100x)
- SuppFig1D: Please add context in the legend to the meaning of the Yellow Stars and "O->U" labels. The latter would seem to be to indicate the Ovarian and Uterine sides of the image
- Pg6Line7: ¿up to P23 or up to P35?
- SuppFig4B: ¿Does SuppFig4B reference back to Fig3B or Fig3C? If the latter please update this in the legend.
- Pg7Line21-23: ¿Is SuppFig3D,E meant to be referenced and not SuppFig5A,B?
- Pg8Line22-25: ¿Is SuppFig4A meant to be reference and not SuppFig5?
- Pg8Line34-Pg9Line: ¿Is SuppFig4B meant to be reference and not SuppFig5B?
- Pg9Line28-33: ¿Would the authors be willing to rework this figure to include images that more closely match the reported findings? The current version does not strongly support the idea that MYH9 fails to localize to microtubule and F-actin domains in Map7 knockout P17 seminiferous tubules. This could also just be a matter of acquiring these images at a higher magnification or with a lower-end (150nm range) super-resolution system (SIM, Airyscan, LIGHTNING, SoRa etc)
- SuppFig7A: The legend notes these are P23 samples but the image label says 8W. Please update this to whichever is the correct age.
- Pg16Line4-5: Please include in the text the vendor and catalog number for the C57BL/6 mice
- Pg16Line18-19: Please include in the text the catalog number for the DMEM
- Pg16Line19-20: Please include in the text the vendor and catalog number for the FBS
- Pg16Line20: Please include in the text the vendor and catalog number for the Pen-Strep
- Pg17Line6-12: Thank you for including organized and detailed information about the primers, please also define the PCR protocol used including temperatures, timing, and cycles for Map7 knockout genotyping
- Pg17Line20-27: Thank you for including organized and detailed information about the primers, please also define the PCR protocol used including temperatures, timing, and cycles for Map7-eGFP genotyping
- Pg17Line30: Please include in the text the vendor and catalog number for the Laemmli sample buffer
- Pg17Line32&SuppTable1: Thank you for including an organized and detailed table for the primary antibodies used, please also make either a similar table or expand the current table to include secondary antibody information
- Pg17Line32: Please note in the text which primary antibodies and secondary antibodies from Supp Table 1
- Pg18Line2: Please include in the text the vendor and catalog number for the Bouin's
- Pg18Line3: Please include in the text the catalog number for the CREST-coated glass slides
- Pg18Line7: Please include in the text the catalog number for the OCT compound
- Pg18Line11: Please include in the text the vendor and catalog number for the Donkey Serum
- Pg18Line11: Please include in the text the vendor and catalog number for the Goat Serum
- Pg18Line13: Thank you for including an organized and detailed table for the primary antibodies used, please also make either a similar table or expand the current table to include secondary antibody information
- Pg18Line18: Please include in the text the vendor and catalog number for the DAPI
- Pg18Line19: Please also include information about the objectives used including catalog numbers, detectors used (PMT vs HyD)
- Pg18Line23: Please cite in the text the reference paper for Fiji (Schindelin et al. 2012 Nature Methods PMID: 22743772) and note the version of Fiji used
- Pg18Line24: Please note the version of Aivia used
- Pg18Line25: If possible, please use a more robust and reliable system than Microsoft Excel to do statistics (Graphpad Prism, Stata, R, etc), if this is not possible please note the version of Microsoft Excel used
- Pg18Line25: Please cite in the text the reference paper for R (R Core Team 2021 R Foundation for Statistical Computing "R: A Language and Environment for Statistical Computing") and not ethe version of R used
- Pg18Line25: ¿Please clarify, was a R package called "AVNOVA" used to do ANOVA or is this a typo?
- Pg18Line25: Please note the specific R package with version used to do ANOVA, and cite in the text the reference for this package
- Pg18Line32: Please include in the text the catalog number for the EPON 812 Resin
- Pg19Line3: Please include the version number for Stacker Neo
- Pg19Line5: Please include the vendor and version number for Amira 2022
- Pg19Line5: Please include the version number for Microscopy Image Browser
- Pg19Line5: Please include the version number for MATLAB that was used to run Microscopy Image Browser
- Pg19Line: 9-10: Please include in the text the catalog number for the complete protease inhibitor
- Pg19Line14: Please include in the text the catalog number for the Magnetic Agarose Beads
- Pg19Line16: Please include in the text the catalog number for the GFP-Trap Magnetic Agarose Beads
- Pg19Line21: Please note in the text which primary antibodies and secondary antibodies from Supp Table 1
- Pg19Line21-22: Please include in the text the catalog number for the ECL Prime
- Pg20Line2: Please include the version number for Xcalibur
- Pg20Line5: Please cite in the text the reference paper for SWISS-PROT (Bairoch and Apweiler 1999 Nucleic Acid Research PMID: 9847139)
- Pg19Line26: Please include in the text the catalog number for the NuPAGE gels
- Pg19Line28: Please include in the text the catalog number for the SimpleBlue SafeStain
- Pg20Line26: Please include in the text the catalog number for the Chromium Singel Cell 3' Reagent Kits v3
- Pg21Line3: Please cite in the text the reference paper for R (R Core Team 2021 R Foundation for Statistical Computing "R: A Language and Environment for Statistical Computing")
- Pg21Line3 Please cite in the text the reference for RStudio (Posit team (2025). RStudio: Integrated Development Environment for R. Posit Software, PBC, Boston, MA. URL http://www.posit.co/.)
- Pg21Line23: Please include the version number for Metascape
- SuppFig12: please update the legend to include a description after the title and update the figure labeling to correspond to the legend. Also, this figure is currently not referenced anywhere in the text.
Referee cross-commenting
I generally agree with Reviewer 1 and specifically concur related to adding details about fertility assessment of the Map7 Knockout line, and enhancing the SEM imaging.
Significance
There are mouse lines, and datasets that will be useful resources to the field. This work also advances our understanding of a period in Sertoli cell development that is critical to fertility but very understudied.
-
-
test2025.mitkoforevents.cz test2025.mitkoforevents.czOcta Go4
-
Je náš stan Octa Go odolný vůči nepříznivému počasí? Stany Octa Go si skvěle osvědčují v náročných povětrnostních podmínkách. Vydrží vítr o rychlosti až 50 km/h a jejich konstrukce je odolná vůči korozi. Tkanina si zachovává intenzivní barvy, volitelně je k dispozici verze s dodatečnou ochranou proti slunečnímu záření (UV).
Je stan Octa GO odolný vůči nepříznivému počasí? Jednoznačně ANO! Hliníkovou konstrukci neohrožuje rez, opláštění je dvojitě impregnované a má podlepené švy, je tedy zcela nepromokavé. Správně ukotvený stan odolá rychlosti větru až do 50 km/h.
-
Zkontrolujte všechny dostupné rozměry nůžkových stanů a zjistěte více o jejich parametrech a výhodách.
Vyberte rozměr, který nejvíce odpovídá Vašemu účelu.
-
hliníkové, osmiúhelníkové nohy (stěna 2 mm)
osmiúhelníková noha o tl. 2 mm
-
Nůžkové stany Octa Go poskytují bezpečné a pevné zastřešení pro malé prostory Nůžkové stany ze série Octa Go jsou lehké, a přitom odolné a odolávají silným poryvům větru. Nejmenší model má rozměry 1,5 x 1,5 m, díky čemuž můžete využívat profesionální řešení i při omezeném prostoru pro akce.
Nůžkové stany Octa GO pro jakoukoliv akci Ačkoliv jde o základní řadu našich stanů, rozhodně se nejedná o kompromisní řešení. Celohliníková konstrukce bez praskajících plastových / kaučukových spojek dostupná od rozměru 1,5x1,5 do 3x6 m. Možnost libovolného potisku opláštění!
-
-
www.biorxiv.org www.biorxiv.org
-
Author response:
We thank the reviewers and editors for the careful evaluation of our manuscript. Below, we provide a first refutation of some of the concerns expressed by reviewers.
Both reviewer 1 &3 underscore the importance of controlling for genetic backgrounds. This is actually an issue only for a limited part of the study and this criticism should not apply to major findings of this study, with some exceptions, as detailed below.
It is important to note that we have identified ourselves several of the mutant lines we have been using. For instance, key and MyD88 mutant alleles have been identified in the Exelixis transposon insertion collection that we have screened in collaboration with this firm (e.g., [3, 4, 5]). This resource has been generated in a isogenized w [A5001] strain[6], which we are using as matched control for these mutants (Figs 1B,D). Of note, while they share a common genetic background, the phenotypes of key and MyD88 are opposite in terms of sensitivity to OMV challenge. The imd<sup>shadok</sup> null allele had been identified during our chemical mutagenesis screen with EMS in a yw cn bw background [5, 7, 8, 9], which was used as a control (FigS1A).
With respect to Hayan (Fig. 2C, Fig. S2C) and eater (Fig. S2A-B) mutants[10, 11, 12], we find a similarly strong phenotype with two independent mutants in distinct genetic backgrounds (actually three for Hayan, as we have not included in our original manuscript the Hayan<sup>SK3</sup>allele generated in the Lemaitre laboratory in which OMVs displayed also impaired virulence). We have shown that the Hayan mutants do display the expected phenotype in terms of PPO cleavage (Fig. S2D). Please, also note that in Fig. S2C the two mutant alleles are tested in the same experiment: even though there is some variation between the w<sup>1118</sup> and the w[A5001] strains, the two mutants behave in a remarkably similar manner. As regards the role of the cellular response, we note that we obtained results similar to those obtained with eater mutants using genetic ablation of hemocytes (Fig. 2A) or by saturating the phagocytosis apparatus (Fig. 2B), a confirmation by two totally-independent approaches.
Of note, the observed eater and Hayan phenotypes are strong and not relatively small and thus unlikely to be due to the genetic background.
The PPO mutants have been isogenized in the w<sup>1118</sup> by the lab of Bruno Lemaitre[13, 14] and are also validated biochemically in Fig. S2D. These mutants have been extensively tested in the Lemaitre laboratory[13, 14, 15].
With respect to RNAi silencing driven ubiquitously or in specific tissues using the UAS-Gal4 system, we have mostly used transgenes from the Trip collection and have used as a control the mCherry RNAi provided by this resource[16]. As the RNAi transgenes have been generated in the same genetic background, it follows that independently of the driver used, the genetic background used in mCherry and genes-of-interest (Duox, Nox, Jafrac2) silenced flies is controlled for (Fig. 3D,E).
For UAS-Gal4-mediated overexpression of fly superoxide dismutase genes, we have used SOD1 and SOD2 transgenes that have both been generated by the same laboratory (Phillips laboratory, University of Guelph) presumably in the same genetic background. Using two distinct drivers we find a strongly enhanced susceptibility phenotype when using UAS-SOD2 but not UAS-SOD1 transgenes (Fig. 3F, Fig. 4E). Importantly, the former is associated with mitochondria whereas the other is expressed in the endoplasmic reticulum: we independently confirm this phenotype using the mitoTempo mitochondrial ROS inhibitor.
We shall thus address the criticism with NOS mutants, where genetic background control is indeed critical and for the UAS-kay RNAi line using a Trip line and its associated mCherry RNAi control transgene.
With respect to the Toll pathway mutants, we agree that some of the variability of the phenotypes may be due to the genetic background, especially as regards tube and pelle. The SPE and grass mutants have been retrieved in a screen performed by the group of Jean-Marc Reichhart in our Research Unit. They thus have been generated in the same genetic background, yet grass displays a mildly decreased virulence of injected OMVs whereas SPE mutants display an opposite phenotype (compare Fig. S1E to S1I; the survival experiment shave been performed in the same set of experiments and have been separated for clarity). We do not intend to analyze further the mutants of the Toll pathway as our data suggest that the canonical Toll pathway, likely activated through psh (Fig. S1F) appears to be activated to detectable levels too late by comparison with the time course of OMV pathogenicity. In our opinion, the contribution of the Toll pathway in the host defense against OMV pathogenicity is minor, albeit we acknowledge that some of the findings, especially with SPE are puzzling.
With respect to the IMD pathway, we shall test also PGRP-LC and Relish mutants, as suggested by reviewers 2&3.
Reviewer 2 query: “It is unclear how many Serratia marcescens cells a 69 nL injection of 0.1 ng/nL OMVs corresponds to.”
OMVs were purified from 600 mL of SmDb11 cultures grown to an average OD<sub>600</sub> of 2.0. Based on a cell density of 0.8 × 10<sup>8</sup> cells/mL per OD unit, this corresponds to approximately 9.6 × 10<sup>10</sup> total bacterial cells.
Each OMV preparation was concentrated into a final volume of 400 µL, resulting in a concentration factor of ~1500× relative to the original culture. Therefore, an injection dose of 69 nL of OMVs is equivalent to 0.1 mL of the starting bacterial culture, which corresponds to:
0.2 OD units
Approximately 1.6 × 10<sup>7</sup> bacterial cells
It is likely that such high concentrations occur only toward the end of the infection, if OMVs are produced at the same rate in the host and in vitro.
With respect to other Reviewer 2 queries, we shall give a try at labeling OMVs with the FM4-64 lipophilic dye and examining whether they are taken up by hemocytes. However, an issue may arise with potentially high background, which has been encountered in cell culture. Of note, OMVs are known to attack cultured human THP1 cells, a monocyte cell line [17].Of note, determining whether OMVs are taken up by hemocytes may only be a starting point to understand how they promote the pathogenicity of OMVs. This question constitutes the topic of a full study that we are currently unable to undertake.
We shall also test whether we can document phospho-JNK expression in neural tissues.
Finally, we shall also confirm the data obtained with two elav-Gal4 drivers (including an inducible one) with the nsyb-Gal4 driver line.
References
(1) Xu R, et al. The Toll pathway mediates Drosophila resilience to Aspergillus mycotoxins through specific Bomanins. EMBO Rep 24, e56036 (2023).
(2) Huang J, et al. A Toll pathway effector protects Drosophila specifically from distinct toxins secreted by a fungus or a bacterium. Proc Natl Acad Sci U S A 120, e2205140120 (2023).
(3) Gobert V, et al. Dual Activation of the Drosophila Toll Pathway by Two Pattern Recognition Receptors. Science 302, 2126-2130 (2003).
(4) Gottar M, et al. Dual Detection of Fungal Infections in Drosophila via Recognition of Glucans and Sensing of Virulence Factors. Cell 127, 1425-1437 (2006).
(5) Gottar M, et al. The Drosophila immune response against Gram-negative bacteria is mediated by a peptidoglycan recognition protein. Nature 416, 640-644 (2002).
(6) Thibault ST, et al. A complementary transposon tool kit for Drosophila melanogaster using P and piggyBac. Nat Genet 36, 283-287 (2004).
(7) Rutschmann S, Jung AC, Hetru C, Reichhart J-M, Hoffmann JA, Ferrandon D. The Rel protein DIF mediates the antifungal, but not the antibacterial, response in Drosophila. Immunity 12, 569-580 (2000).
(8) Rutschmann S, Jung AC, Rui Z, Silverman N, Hoffmann JA, Ferrandon D. Role of Drosophila IKKg in a Toll-independent antibacterial immune response. Nat Immunology 1, 342-347 (2000).
(9) Jung A, Criqui M-C, Rutschmann S, Hoffmann J-A, Ferrandon D. A microfluorometer assay to measure the expression of ß-galactosidase and GFP reporter genes in single Drosophila flies. Biotechniques 30, 594- 601 (2001).
(10) Nam HJ, Jang IH, You H, Lee KA, Lee WJ. Genetic evidence of a redox-dependent systemic wound response via Hayan protease-phenoloxidase system in Drosophila. Embo J 31, 1253-1265 (2012).
(11) Kocks C, et al. Eater, a transmembrane protein mediating phagocytosis of bacterial pathogens in Drosophila. Cell 123, 335-346 (2005).
(12) Bretscher AJ, et al. The Nimrod transmembrane receptor Eater is required for hemocyte attachment to the sessile compartment in Drosophila melanogaster. Biology open 4, 355-363 (2015).
(13) Binggeli O, Neyen C, Poidevin M, Lemaitre B. Prophenoloxidase activation is required for survival to microbial infections in Drosophila. PLoS Pathog 10, e1004067 (2014).
(14) Dudzic JP, Kondo S, Ueda R, Bergman CM, Lemaitre B. Drosophila innate immunity: regional and functional specialization of prophenoloxidases. BMC Biol 13, 81 (2015).
(15) Dudzic JP, Hanson MA, Iatsenko I, Kondo S, Lemaitre B. More Than Black or White: Melanization and Toll Share Regulatory Serine Proteases in Drosophila. Cell reports 27, 1050-1061 e1053 (2019).
(16) Perkins LA, et al. The Transgenic RNAi Project at Harvard Medical School: Resources and Validation. Genetics 201, 843-852 (2015).
(17) Goman A, et al. Uncovering a new family of conserved virulence factors that promote the production of host-damaging outer membrane vesicles in gram-negative bacteria. J Extracell Vesicles 14, e270032 (2025).
-
-
test2025.mitkoforevents.cz test2025.mitkoforevents.cz
-
Kde využiji kopulový stan Dome? Kopulový stan Dome nachází uplatnění všude tam, kde jsou důležité vzhled, funkčnost a vnímání značky jako prémiové. Zákazníci se rozhodují pro tento typ stanu nejen kvůli jeho jedinečnému designu, ale také proto, že přispívá k budování image značky z vyšší třídy. Skvěle se hodí jako expozice pro značku, která chce vyniknout mezi standardními řešeními. Může také sloužit jako místo setkání na veletrzích, kde jeho estetika podporuje profesionální image. Kromě toho kopulový stan Dome představuje efektní pozadí pro umělecké akce, premiéry a prezentace, které mají účastníkům dlouho zůstat v paměti. Je také ideálním řešením jako expozice na veletrzích, jejichž cílovou skupinou jsou zákazníci hledající produkty prémiové třídy. Výrobce kopulových stanů Vytváříme prostory, které přitahují pohledy a formují zážitky. Naše kopulové stany nejsou jen konstrukce, ale architektura emocí, místo setkání, expozice a odpočinku. Pro značky, které chtějí být zapamatovány. Pro akce, které mají zůstat v paměti dlouho po jejich skončení. Pro zákazníky, kteří očekávají více než standardní řešení. Každý stan vzniká v naší vlastní výrobní hale v Polsku, pod dohledem týmu, který zná každý detail konstrukce. To nám dává plnou kontrolu. Od prvního návrhu, přes výběr materiálů, až po precizní dokončení. Máte netradiční nápad? Potřebujete verzi “po svém”? Řekněte nám o tom. Přizpůsobíme projekt vaší vizi. Vytvořte prémiový stánek s kopulovým stanem Kopulový stan přitáhne pozornost svým moderním designem a výjimečným tvarem. Zajišťuje stabilní a funkční konstrukci, která se osvědčí i při nepříznivém počasí. Naši zákazníci si tento stan nejčastěji vybírají, když chtějí vytvářet image prémiové značky. Celkový dojem doplní reklamní vlajky, které výrazně zvyšují viditelnost stánku z velké vzdálenosti a vytvářejí dynamický propagační prvek, který přitahuje pohledy.
it´s already written several times above, is it necessary?
-
-
test2025.mitkoforevents.cz test2025.mitkoforevents.cz
-
Osvětlení LED pro Jehlan Připevňuje se přímo na konstrukci. Dostupné v 1-, 2- a 4-halogenové verzi. Bílé světlo. Napájecí kabel o délce 5 m.
use previous correction
-
Hvězdový stan od MITKO, tedy plná bezpečnost To, co skutečně odlišuje hvězdový stan od MITKO, je bezpečnost konstrukce. Stany Jehlan jsou navrženy pro použití v náročných venkovních podmínkách. Jejich hliníkové stožáry o průměru až 76 mm jsou pevnou oporou, která v kombinaci s velkými ocelovými základy zajišťuje stabilitu celé konstrukce. Při správném ukotvení stan odolává poryvům větru o rychlosti až 100 km/h, což z něj činí nejbezpečnější volbu pro venkovní akce bez ohledu na počasí. Není to jen efektní prvek programu, ale také promyšlená investice do komfortu a klidu organizátorů. Potvrzením kvality je 2letá záruka a 10letý pozáruční servis, díky kterému máte jistotu, že i po letech můžete počítat s technickou podporou a dostupností náhradních dílů. Navíc v MITKO můžete počítat s bezplatným grafickým návrhem a plnou podporou obchodníka v každé fázi procesu, od prvního dotazu po realizaci. To je záruka, že vše proběhne hladce a hotový stan bude přizpůsoben jak vašim potřebám, tak vizuální identitě značky. Hvězdový stan – efektní prostor, který je vidět zdaleka Pokud chcete být dobře viditelní a mít solidní pracovní prostor uvnitř, volba je jednoduchá – hvězdový stan od MITKO. Unikátní konstrukce s centrálním stožárem a rozložitými rameny přitahuje pozornost, ale stejně důležité je, že poskytuje až 227 m² zastřešení bez bočních podpěr. V praxi to znamená místo na lehátka, pódium, lavice – a stále spoustu volnosti. Skvěle se hodí na rozsáhlé plochy, náměstí a všude tam, kde záleží na prvním dojmu. Hvězdový stan, který pracuje pro vaše branding S hvězdovým stanem od MITKO se snadno odlišíte. Můžete na něj natisknout velké logo nebo grafiku – díky výšce přes 4 metry budou viditelné i z dálky. Umístěte vedle reklamní vlajky, které ještě lépe přitáhnou pozornost a pomohou návštěvníkům najít váš stánek. Chcete, aby se zastavili na déle? Přidejte lehátka s vlastním potiskem a reklamní slunečníky – celé to bude vypadat souvisle a profesionálně, bez nutnosti shánět prvky z různých zdrojů. Flexibilita konstrukce hvězdového stanu (Jehlan) – vybíráte verzi, která se hodí k události Nemusíte hádat, zda se hvězdový stan osvědčí na vaší akci. V MITKO nabízíme tři konfigurace Jehlana Base: s 1, 2 nebo 3 stožáry. Díky tomu si vybíráte konstrukci přesně podle potřeb události – od menších realizací po velké venkovní akce. Nejčastěji vybíraná verze s jedním stožárem je kompromisem mezi silným vizuálním efektem a efektivním provozem. Montáž trvá od 30 do 45 minut a vyžaduje pouze 2–3 osoby, v závislosti na velikosti stanu. V případě potřeby můžete konstrukci rozšířit o boční stěny, vstupní předsíňku nebo bezpečnostní sadu (kolíky, šňůry, kladivo) – všechny prvky jsou připraveny k okamžitému použití. Hvězdový stan bez zprostředkovatelů Místo řetězce subdodavatelů – jedno místo, plná kontrola. Každý hvězdový stan MITKO vzniká v Polsku. Sami jej šijeme, testujeme a odesíláme přímo k vám. Máte konkrétní termín? Realizujeme ho bez problémů – nic nemusí cestovat přes půl Evropy. Neobvyklé požadavky, např. stěny s oknem? U nás je to standard, nikoli „volitelná verze za 6 týdnů“. Pokud je potřeba úprava – nenarazíte na infolinku, ale mluvíte s lidmi, kteří tento stan skutečně vytvářejí.
it´s already written several times above, is it necessary?
-
Jak se starat o stan hvězdu, aby sloužil co nejdéle? Je třeba dbát na čistotu stanu, pravidelně ho čistit a sušit před uskladněním, aby se předešlo vzniku plísní a poškození materiálu. Snažte se stan skladovat na suchém místě.
Jak se o stan Jehlan starat, aby sloužil co nejdéle? Základem je jeho důkladné očištění před každým uskladněním, aby nedošlo ke vzniku plísně na opláštění, která jej může poškodit. Skladujte na suchém místě.
-
Osvětlení LED pro Jehlan Připevňuje se přímo na konstrukci. Dostupné v 1-, 2- a 4-halogenové verzi. Bílé světlo. Napájecí kabel o délce 5 m.
LED osvětlení Připevňuje se přímo na stožár, dostupné v provedení s 1, 2 a 4 LED zdroji. Napájecí kabel 5 m.
-
Trvanlivost hvězdového stanu od MITKO Potah hvězdového stanu od MITKO je vyroben z materiálu odolného vůči dešti a intenzivnímu slunečnímu záření. Tkanina si zachovává technické vlastnosti i při několika dnech používání za proměnlivých povětrnostních podmínek. Konstrukce stanu umožňuje jeho rozložení na několik dní bez nutnosti demontáže. Materiál se neprohýbá a zůstává napnutý. Stan si zachovává estetiku i po dlouhém čase používání. V případě poškození jednotlivých konstrukčních prvků nebo potahu zajišťujeme náhradní díly po dobu minimálně 10 let.
Odolnost stanu Jehlan Silné hliníkové stožáry o průměru 76 mm a nepromokavé opláštění dělají ze stanů Jehlan spolehlivou volbu pro větší akce. Stavba trvá řádově 30 min a při odpovídajícím kotvení odolá Jehlan rychlosti větru až do 100 km/h! (next paragraph)Přidejte možnost libovolného potisku a máte ideální řešení i pro déle trvající akce. V případě poškození držíme náhradní díly skladem a jejich výměnu zvládnete zcela sami! Případně můžeme stan po sezóně prohlédnout a repasovat na naší výrobě.
-
PausePlay% buffered00:0001:03Exit fullscreenEnter fullscreen Play Stan Jehlan nabízí velkou plochu zastřešení – dostatečnou pro umístění pódia, odpočinkové zóny nebo místa pro hosty. Konstrukce se opírá o centrální stožár a ocelový základ, což zajišťuje stabilitu i při několika dnech používání. Stan se osvědčí jak během jednodenních akcí, tak na událostech trvajících několik nebo dokonce několik dní. Po skončení akce jej lze složit a přepravit ve vlastním automobilu – délka nejdelších prvků se vejde do standardního zavazadlového prostoru kombi.
DELETE
-
Hvězdové stany s potiskem od MITKO jsou konstrukce s centrálním hliníkovým stožárem o průměru 76 mm. Díky ocelovému základu a správnému ukotvení odolávají poryvům větru až do 100 km/h. Potah je vyroben z polyesteru 240 g/m², 275 g/m² nebo PVC 330 g/m², je nepromokavý a udržuje napětí i při dlouhodobém používání. Dále můžeme materiál posílit odolností vůči UV záření a nehořlavostí.
Druhý nejoblíbenější stan v naší nabídce! V porovnání s nůžkovými stany jeho stavba sice vyžaduje cca 30 min, ale odměnou za to je obrovská zastřešená plocha a atraktivní tvar.
(next paragraph)Centrální hliníkové stožáry o průměru 76 mm odolávají pří správném kotvení rychlosti větru až do 100 km/h, což máme podloženo statickými výpočty. Potah můžete zvolit z Polyesteru, Polyesteru se sníženou hořlavostí nebo z PVC materiálu.
-
-
xenero.webs.uvigo.es xenero.webs.uvigo.es
-
No existenada en el hecho de ser ‘mujer’ que una de manera natural a las mujeres. No existeincluso el estado de ’ser’ mujer, que, en sí mismo, es una categoría enormementecompleja construida dentro de contestados discursos científicosexuales y de otrasprácticas sociales
La autora revela que el propio concepto de "mujer" es problemático, ya que la experiencia femenina se construye en base a diferentes factores como son la raza, la clase social o la sexualidad. Por tanto, un feminismo inclusivo debería recoger todas las realidades sociales, basándose en políticas de afinidad y coaliciones donde no sea necesario identificarse con un problema, pero sí ser consciente de ello y aliarse para luchar contra él.
-
-
virtuale.unibo.it virtuale.unibo.it
-
Reliability of TCP-IP
FLUSSO CORRETTO DI COME FUNZIONA UNA RICHIESTA WEB 1. Trovi il computer remoto → IP
Il browser scopre l’IP del server (es. di google.com). Questo dice quale macchina contattare.
- Crei una connessione affidabile → TCP
Il tuo computer apre una connessione TCP verso quell’IP.
TCP fa queste cose:
stabilisce la connessione,
spezza i dati in pacchetti,
garantisce che arrivino in ordine,
richiede ritrasmissioni se qualcosa si perde.
TCP è quindi il trasportatore affidabile dei dati.
- Scegli a quale applicazione parlare → Porta
Per parlare HTTP, il browser contatta la porta 80 (o 443).
IP = dov’è il computer
Porta = quale applicazione dentro quel computer
Il tuo computer usa anche lui una porta, ma una porta alta e temporanea (es. 51234). Serve per distinguere quella connessione da altre.
- Invia la richiesta HTTP
A questo punto TCP è solo il tubo che trasporta i dati. Dentro quel tubo ci metti un messaggio HTTP, tipo:
GET /index.html HTTP/1.1 Host: www.google.com
HTTP è il linguaggio della richiesta.
- Il server legge la richiesta e risponde via TCP
Il server ha un programma (Apache, Nginx, ecc.) che:
ascolta su porta 80,
riceve la richiesta HTTP,
la interpreta,
manda una risposta HTTP dentro la stessa connessione TCP.
Il tutto ritorna al tuo browser.
RIASSUNTO IN UNA FRASE PERFETTA
IP ti porta al computer giusto, TCP ti fornisce un canale affidabile, la porta ti collega all’applicazione giusta, HTTP è il linguaggio della richiesta e della risposta
-
-
courses.d2l.ai courses.d2l.ai课程安排1
-
这是一个非常典型的“PNC(规控)选手误入CV(计算机视觉)深水区”的课表。
作为PNC架构师,我必须敲醒你:李沐老师的课虽然是神课,但他是讲CV和NLP通用的。如果你全看,至少浪费50%的时间。 对于PNC算法岗,你的核心战场是“时序预测”和“决策逻辑”,而不是教车子怎么“看图”。
以下是基于PNC高薪Offer标准的剪裁版学习指南:
第一部分:绝对核心区 (必修 - 死磕)
优先级:S+ 理由:这是现代自动驾驶Prediction(预测)和End-to-End Planning(端到端规划)的基石。不懂这个,你只能做传统的规则代码,拿不到顶薪。
- 7月17日 - 7月18日:序列模型、RNN
- PNC视角:把课程里的“文本/单词”自动脑补替换成“车辆历史轨迹点 (x, y, v, a)”。预测旁车未来3秒怎么走,本质上就是个语言模型(Next Token Prediction)。
- 7月25日:GRU、LSTM
- 面试考点:LSTM怎么解决梯度消失的?在轨迹预测(Social-LSTM)里怎么用?
- 要求:手写代码。弄懂Input/Output的维度。
- 8月7日:Seq2Seq、Encoder-Decoder、束搜索 (Beam Search)
- PNC视角:这是轨迹生成的标准架构。输入过去5秒轨迹(Encoder),输出未来5秒轨迹(Decoder)。
- 实战痛点:Beam Search用于生成多模态轨迹(比如预测前车可能直行,也可能左转,这是两条不同的Beam)。
- 8月8日:注意力机制 (Attention)
- PNC视角:核心中的核心。用于处理交互 (Interaction)。比如:自车在规划时,应该关注左边的车还是右边的车?Attention Score告诉你答案。
- 8月14日 - 8月15日:Transformer、BERT
- 判决:学死它。
- 理由:现在的SOTA预测模型(如VectorNet, TNT)和端到端规划(UniAD)全是Transformer架构。面试必问 Self-Attention 的 $O(n^2)$ 复杂度怎么优化。
第二部分:上下游常识区 (选修 - 速通概念)
优先级:A 理由:PNC的输入是Perception发来的。你不需要会写检测算法,但你必须懂“输入数据”的特性,才能在规划层做鲁棒性处理(Safety Shield)。
- 6月27日:物体检测基础 (边缘框、锚框)
- PNC视角:你需要懂 Bounding Box (bbox)。
- 痛点:感知发给你的bbox经常会抖动(跳变)。如果你不懂IOU(交并比)和NMS(非极大值抑制),你就不知道怎么在规划层过滤这些噪声。
- 7月3日:YOLO vs R-CNN
- PNC视角:只看实时性对比。
- 考点:为什么车端常用YOLO(快,One-stage)而不用R-CNN?因为规控需要感知在30ms内给结果。
- 7月10日:语义分割
- PNC视角:懂概念即可。
- 理由:语义分割的输出就是PNC里的Costmap(代价地图)或可行驶区域 (Drivable Area)。你要知道这个东西是怎么来的,边缘为什么会不准。
- 8月21日:优化算法
- PNC视角:SGD, Adam。虽然PNC主要用QP/SQP求解器,但深度学习优化器的思想(动量、梯度下降)对理解非凸优化有帮助。
第三部分:垃圾时间 (跳过 - 别浪费生命)
优先级:C (Direct Pass) 理由:这是CV算法岗或者Infra架构师的活,PNC看了没用。
- 6月19日:多GPU训练、分布式
- 判决:[跳过]
- 理由:除非你去搞自动驾驶云端训练平台。
- 6月20日:图像增广
- 判决:[跳过]
- 理由:这是感知的活。规划的增广是对轨迹做扰动,不是对图片做旋转/裁剪。
- 6月26日:Kaggle 图像分类实战
- 判决:[跳过]
- 理由:纯CV比赛,对PNC无加分。
- 7月11日:样式迁移 (Style Transfer)
- 判决:[跳过]
- 理由:那是搞滤镜App用的,车不需要画梵高风格的画。
- 7月4日:多尺度检测实现、SSD实现
- 判决:[跳过]
- 理由:实现细节太繁琐,面试不考规控人员手写SSD Loss。
导师的“一针见血”总结
你的学习路径应该是这样的:
- 略过前面的CV卷积部分(知道卷积是提特征的就行)。
- 空降到 7月17日 (RNN) 开始认真学。
- 死磕 Transformer 及其变体。
- 思维转换:每当李沐老师说“单词”时,你脑子里要自动替换成“(x, y)”;每当他说“句子”时,你替换成“轨迹”。
下一步建议: 学完 Transformer 后,不要去微调 BERT 做文本分类。 直接去找一篇自动驾驶轨迹预测的经典论文(比如 VectorNet 或 Trajectron++)的代码读一下,看看他们是怎么用 LSTM/Transformer 处理 (x,y) 坐标序列的。这才是把你学到的东西变现的唯一路径。
- 7月17日 - 7月18日:序列模型、RNN
-
-
www.eljadaae.nl www.eljadaae.nl
-
Hieronder de lijst van AI-boeken die ik gelezen heb en je aan kan raden. Klik meteen door naar de langere omschrijving of scroll verder. Ze staan op de volgorde waarin ik ze uitgelezen heb: Weapons of Math Destruction: over desastreuze algoritmes Code Dependent: over de achterkant van AI Onze kunstmatige toekomst: over de etische kant van AI Empire of AI: over de opkomst van OpenAI Your face belongs to us: over de opkomst van ClearView AI Atlas van de digitale wereld: over de geo-politiek van AI The Digital Republic: over het reguleren van technologie Toezicht houden in het tijdperk van AI: over de juiste vragen stellen over AI
[[Elja Daae]] recommended reading list wrt AI [[Weapons of Math Destruction by Cathy O Neil]] (have it since 2017) [[Code Dependent by Madhumita Murgia]] bought it in August in ramsj [[The Digital Republic by Jamie Susskind]] I noted in 2024 as possible reading. [[Atlas van de digitale wereld by Haroon Sheikh]] I have too Other's are unknown to me. Interesting list, as it shaped their view on their role in AI public policy I presume
-
-
www.sciencedirect.com:5037 www.sciencedirect.com:5037
-
RRID:AB_303248
DOI: 10.1016/j.cmet.2025.11.002
Resource: (Abcam Cat# ab2723, RRID:AB_303248)
Curator: @scibot
SciCrunch record: RRID:AB_303248
-
-
inst-fs-iad-prod.inscloudgate.net inst-fs-iad-prod.inscloudgate.net
-
Teachers note with pride how well their students do despite the school's limited resources, but they far less often discuss the toll that supporting such achievement takes on their own lives.
Educators dedicate a lot of time to their students. It's important o recognize the work and dedication they put into their profession. Teachers are in fact the backbone of the country. Without them we wouldn't have the success that we do, in terms of individuals. While there is still a lot of work to do, educators have made sure that students can learn and continue to different professions where they too can make an impact in peoples lives.
-
-
test2025.mitkoforevents.cz test2025.mitkoforevents.cz
-
Náš tým vám nejprve pomůže vybrat ideální řešení a následně připraví návrh, který co nejvěrněji vystihne vaši představu.
Nepotřebujete svého grafika, stačí Vám jasná představa o designu a logo v křivkách. Nabídka se nevztahuje na kreativní návrhy a obsahuje 1x návrh + 1x korekturu.
-
-
test2025.mitkoforevents.cz test2025.mitkoforevents.cz
-
Kontaktujte nás, a my vám pomůžeme s výběrem a poradíme! Potřebujete pomoc event managera při výběru vybavení? Nebo se chcete dozvědět více o stanu? Kontaktujte náš tým expertů, kteří odpoví na každou vaši otázku. Spojte se s námi
same banner "Nejste si čímkoliv jistí..." as on previous pages
-
Zabezpečovací sada Zajišťuje stan před větrem o rychlosti až 100 km/h. Sada obsahuje: kotvy o délce 45 cm, odtahové lanka a kladivo o hmotnosti 4 kg.
Bezpečnostní kotvení Zajišťuje stan vůči větru až do rychlosti 100 km/h. Sada obsahuje kotvy o délce 45 cm a kladivo.
-
Písečné závaží Písečné závaží o hmotnosti 27,5 kg. Je upevněno vertikálně pomocí suchého zipu k noze stanu.
Pískové závaží Závaží vč. náplně 16 kg se připevňuje ke stanové noze.
+ put there the correct picture of 16 kg sand ballast
-
Polyester Nehořlavý polyester 275 g/m2 Polyester s PVC zátěrem o gramáži 330 g/m² K výrobě používáme tkaniny odolné proti roztržení a mechanickému poškození. Potah si můžete objednat v barvě podle vzorníku 20 základních a pokud o potisk nemáte zájem, máme na výběr z následujících standardních barev.
Polyester 240 g/m2 K výrobě opláštění používáme pouze látky odolné vůči odření a roztržení. Vybírat můžete z následujících standardních barev a to bez příplatku za jednotlivé barvy!
Polyester 275 g/m2 se sníženou hořlavostí Požaduje po Vás pořadatel akce opláštění se sníženou hořlavostí? Zvolte tuto variantu opláštění splňující přísné evropské normy EN ISO 6940, 6941 a DIN 4102-B1.
Polyester s PVC zátěrem 330 g/m2 Jednostranný PVC zátěr garantuje snadnou údržbu a především absolutní vodotěsnost opláštění.
-
-
milenio-nudos.github.io milenio-nudos.github.iopaper1
-
we aim to clarify whether differences in DSE are consistent across contexts or instead a product of how assessments operationalize the construct.
Me hace ruido la segunda afirmación. No tenemos una hipótesis sobre el efecto de la operacionalización de los constructos. El fallo de la invarianza puede deberse a muchas cosas (diferencias culturales, fallos de aplicación, errores de medición, países muy disímiles con el resto), y creo que esto plantea algo binario (o es consistente o está mal operacionalizado).
-
-
bafybeig7nrhxx3nyb5rfmuj7cfy5xbl4ldtwr57ol6lykibww625qkxnke.ipfs.dweb.link bafybeig7nrhxx3nyb5rfmuj7cfy5xbl4ldtwr57ol6lykibww625qkxnke.ipfs.dweb.link
-
☑️The most up to date version will be the canonical version that will point to the latest version using IPNS
all versions thus will be available via links
My to do list is on the annotation margins
use hypothesis search to see a reverse chronological listing of todo tasks
This annotation is at the top of that list when this annotation was made
-
Origo Folder for my hyperpost Peergos Account
No Groan Zome
but
Not just Converge but UpVerge in an autopoietic emregent upward spiral
Beyond all expectations
Imagined a whole new way what that leads to is beyond prior imaginings
-
-
pesquisa.icea.decea.mil.br pesquisa.icea.decea.mil.br
-
INCIDENTE CLASSIFICADO COMO RISCO CRÍTICO
Adicionar o número do KPI
-
INCIDENTE CLASSIFICADO COMO RISCO POTENCIAL
Adicionar o número do KPI
-
ALERTA TCAS RA
Adicionar o número do KPI
-
: Incursão em Pista Mensal
Entrar dentro da padronização de gráficos do relatório. Adicionar inclusive variação e se ficar "too much" retirar depois de analisado o resultado.
-
NÚMERO DE INCURSÕES EM PISTA
Adicionar o número do KPI
-
Grau de Satisfação com o DECEA
Gráfico parecido com o de grau de avaliação do SISCEAB. Talvez seja esse que possui o indicador principal e que deva estar no início do capítulo.
-
Percentual das avaliações do SISCEAB Fonte: Pesquisa 2024
Colocar no padrão dos indicadores. Colocar esse gráfico em primeiro, pois carrega o resultado do indicador que deve ser monitorado.
-
: IDBR 08 - Índice de Operacionalidade em Relação à Média - CINDACTA I
Tentar usar o gráfico padrão de KPI para AD nesse caso juntando os dtceas. Verificar se tem os 3 anos.
-
IDBR 08 - Índice de Operacionalidade por Regional
Adicionar o total SISCEAB que estava no gráfico anterior. Colocar no padrão dos outros gráficos.
-
Principais Causas de Medidas
Irei ajudar a refazer, desculpa o lapso.
-
Demanda de Tráfego Aéreo versus Quantidade de Medidas ATFM
Padronizar no mínimo com o gráfico a seguir. Buscar a padronização do relatório, verificar os padrões dos gráficos do Capítulo 2.
-
Figura 3.31: KPI 09 - Capacidade de Chegada no Aeroporto
01 - Retirar as casas decimais; 02 - Inserir o gráfico de variação; 03 - Leonardo (Adriano) irão verificar a capacidade para os aeroportos zerados.
-
Figura 3.25: KPI 18 - Nivelamento Limite Durante o Cruzeiro
01 - Retirar as casas decimais; 02 - Label da coluna na vertical; 03 - Inserir mais um ano para comparação; 04 - Alterar o título do eixo y (Altitude ao invés de nível); 05 - Harmonizar com gráficos de rotas.
-
KPI 04 - Extensão em Rota de Plano de Voo Apresentado
Adicionar o ano de 2025. Alinhar os labels do eixo X (Rota) com o gráfico do KPI 15
-
KPI 17 - Nivelamento em Subida
Verificar o comentário do KPI 19
-
Rotas Monitoradas no KPI 15 em 2025
01 - Leonardo irá acrescentar a coluna tempo médio de voo na API; 02 - Padronizar o nome da tabela;
-
Dispersão entre KPI 01 - Pontualidade de Partida e KPI 14 - Pontualidade de Chegada por Regional
Alterar o ponto de corte do eixo X e Y. Diminuir a fonte da legenda, para ficar em uma linha.
-
Dispersão entre KPI 01 - Pontualidade de Partida e KPI 14 - Pontualidade de Chegada
Alterar o ponto de corte do eixo X e Y. Diminuir a fonte da legenda, para ficar padronizar com o gráfico do regional.
-
79,6% - SBPS - Porto Seguro; 79,5% - SBUL - Uberlândia; 79,2% - SBJV - Joinville; 79,2% - SBFN - Fernando de Noronha; 78,0% - SBGR - Guarulhos; 77,4% - SBSP - Congonhas; 75,9% - SBRP - Ribeirão Preto; 75,3% - SBEG - Eduardo Gomes; 75,1% - SBPV - Porto Velho; 74,0% - SBJR - Jacarepaguá; e 68,4% - SBGL - Galeão. (Devido ao fato do aeroporto ter o sistema APRON CONTROL, a fonte de dados utilizada nesse relatório pode conter falta de precisão para este indicador).
Gerar tabela para os aeroportos que ficaram abaixo da meta de 80%. Usar os dados do gráfico acima.
-
-
www.biorxiv.org www.biorxiv.org
-
Author response:
The following is the authors’ response to the original reviews
We would like to thank all reviewers for their constructive and in-depth reviews. Thanks to your feedback, we realized that the main objective of the paper was not presented clearly enough, and that our use of the same “modality-agnostic” terminology for both decoders and representations caused confusion. We addressed these two major points as outlined in the following.
In the revised manuscript, we highlight that the main contribution of this paper is to introduce modality-agnostic decoders. Apart from introducing this new decoder type, we put forward their advantages in comparison to modality-specific decoders in terms of decoding performance and analyze the modality-invariant representations (cf. updated terminology in the following paragraph) that these decoders rely on. The dataset that these analyses are based on is released as part of this paper, in the spirit of open science (but this dataset is only a secondary contribution for our paper).
Regarding the terminology, we clearly define modality-agnostic decoders as decoders that are trained on brain imaging data from subjects exposed to stimuli in multiple modalities. The decoder is not given any information on which modality a stimulus was presented in, and is therefore trained to operate in a modality-agnostic way. In contrast, modality-specific decoders are trained only on data from a single stimulus modality. These terms are explained in Figure 2. While these terms describe different ways of how decoders can be trained, there are also different ways to evaluate them afterwards (see also Figure 3); but obviously, this test-time evaluation does not change the nature of the decoder, i.e., there is no contradiction in applying a modality-specific decoder to brain data from a different modality.
Further, we identify representations that are relevant for modality-agnostic decoders using the searchlight analysis. We realized that our choice of using the same “modality-agnostic” term to describe these brain representations created unnecessary debate and confusion. In order to not conflate the terminology, in the updated manuscript we call these representations modality-invariant (and the opposite modality-dependent). Our methodology does not allow us to distinguish whether certain representations merely share representational structure to a certain degree, or are truly representations that abstract away from any modality-dependent information. However, in order to be useful for modality-agnostic decoding, a significant degree of shared representational structure is sufficient, and it is this property of brain representations that we now define as “modality-invariant”.
We updated the manuscript in line with this new terminology and focus: in particular, the first Related Work section on Modality-invariant brain representations, as well as the Introduction and Discussion.
Public Reviews:
Reviewer #1 (Public review):
Summary:
The authors introduce a densely-sampled dataset where 6 participants viewed images and sentence descriptions derived from the MS Coco database over the course of 10 scanning sessions. The authors further showcase how image and sentence decoders can be used to predict which images or descriptions were seen, using pairwise decoding across a set of 120 test images. The authors find decodable information widely distributed across the brain, with a left-lateralized focus. The results further showed that modality-agnostic models generally outperformed modality-specific models, and that data based on captions was not explained better by caption-based models but by modality-agnostic models. Finally, the authors decoded imagined scenes.
Strengths:
(1) The dataset presents a potentially very valuable resource for investigating visual and semantic representations and their interplay.
(2) The introduction and discussion are very well written in the context of trying to understand the nature of multimodal representations and present a comprehensive and very useful review of the current literature on the topic.
Weaknesses:
(1) The paper is framed as presenting a dataset, yet most of it revolves around the presentation of findings in relation to what the authors call modality-agnostic representations, and in part around mental imagery. This makes it very difficult to assess the manuscript, whether the authors have achieved their aims, and whether the results support the conclusions.
Thanks for this insightful remark. The dataset release is only a secondary contribution of our study; this was not clear enough in the previous version. We updated the manuscript to make the main objective of the paper more clear, as outlined in our general response to the reviews (see above).
(2) While the authors have presented a potential use case for such a dataset, there is currently far too little detail regarding data quality metrics expected from the introduction of similar datasets, including the absence of head-motion estimates, quality of intersession alignment, or noise ceilings of all individuals.
As already mentioned in the general response, the main focus of the paper is to introduce modality-agnostic decoders. The dataset is released in addition, this is why we did not focus on reporting extensive quality metrics in the original manuscript. To respond to your request, we updated the appendix of the manuscript to include a range of data quality metrics.
The updated appendix includes head motion estimates in the form of realignment parameters and framewise displacement, as well as a metric to assess the quality of intersession alignment. More detailed descriptions can be found in Appendix 1 of the updated manuscript.
Estimating noise ceilings based on repeated presentations of stimuli (as for example done in Allen et al. (2022)) requires multiple betas for each stimulus. All training stimuli were only presented once, so this could only be done for the test stimuli which were presented repeatedly. However, during our preprocessing procedure we directly calculated stimulus-specific betas based on data from all sessions using one single GLM, which means that we did not obtain separate betas for repeated presentations of the same stimulus. We will however share the raw data publicly, so that such noise ceilings can be calculated using an adapted preprocessing procedure if required.
Allen, E. J., St-Yves, G., Wu, Y., Breedlove, J. L., Prince, J. S., Dowdle, L. T., Nau, M., Caron, B., Pestilli, F., Charest, I., Hutchinson, J. B., Naselaris, T., & Kay, K. (2022). A massive 7T fMRI dataset to bridge cognitive neuroscience and artificial intelligence. Nature Neuroscience, 25(1), 116–126. https://doi.org/10.1038/s41593-021-00962-x
(3) The exact methods and statistical analyses used are still opaque, making it hard for a reader to understand how the authors achieved their results. More detail in the manuscript would be helpful, specifically regarding the exact statistical procedures, what tests were performed across, or how data were pooled across participants.
In the updated manuscript, we improved the level of detail for the descriptions of statistical analyses wherever possible (see also our response to your “Recommendations for the authors”, Point 6).
Regarding data pooling across participants:
Figure 8 shows averaged results across all subjects (as indicated in the caption)
Regarding data pooling for the estimation of the significance threshold of the searchlight analysis for modality-invariant regions: We updated the manuscript to clarify that we performed a permutation test, combined with a bootstrapping procedure to estimate a group-level null distribution: “For each subject, we evaluated the decoders 100 times with shuffled labels to create per-subject chance-level results. Then, we randomly selected one of the 100 chance-level results for each of the 6 subjects and calculated group-level statistics (TFCE values) the exact same way as described in the preceding paragraph. We repeated this procedure 10,000 times resulting in 10,000 permuted group-level results.”
Additionally, we indicated that the same permutation testing methods were applied to assess the significance threshold for the imagery decoding searchlight maps (Figure 10).
(4) Many findings (e.g., Figure 6) are still qualitative but could be supported by quantitative measures.
The Figures 6 and 7 are intentionally qualitative results to support the quantitative decoding results presented in Figures 4 and 5. (see also Reviewer 2 Comment 2)
Figures 4 and 5 show pairwise decoding accuracy as a quantitative measure for evaluation of the decoders. This metric is the main metric we used to compare different decoder types and features. Based on the finding that modality-agnostic decoders using imagebind features achieve the best score on this metric, we performed the additional qualitative analysis presented in Figures 6 and 7. (Note that we expanded the candidate set for the qualitative analysis in order to have a larger and more diverse set of images.)
(5) Results are significant in regions that typically lack responses to visual stimuli, indicating potential bias in the classifier. This is relevant for the interpretation of the findings. A classification approach less sensitive to outliers (e.g., 70-way classification) could avoid this issue. Given the extreme collinearity of the experimental design, regressors in close temporal proximity will be highly similar, which could lead to leakage effects.
It is true that our searchlight analysis revealed significant activity in regions outside of the visual cortex. However, it is assumed that the processing of visual information does not stop at the border of the visual cortex. The integration of information such as the semantics of the image is progressively processed in other higher-level regions of the brain. Recent studies have shown that activity in large areas of the cortex (including many outside of the visual cortex) can be related to visual stimulation (Solomon et al. 2024; Raugel et al. 2025). Our work confirms this finding and we therefore do not see reason to believe that this is due to a bias in our decoders.
Further, you are suggesting that we could replace our regression approach with a 70-way classification. However, this is difficult using our fMRI data as we do not see a straightforward way to assign the training and testing stimuli with class labels (the two datasets consist of non-overlapping sets of naturalistic images).
To address your concerns regarding the collinearity of the experimental design and possible leakage effects, we trained and evaluated a decoder for one subject after running a “null-hypothesis” adapted preprocessing. More specifically, for all sessions, we shifted the functional data of all runs by one run (moving the data of the last run to the very front), but leaving the design matrices in place. Thereby, we destroyed the relationship of stimuli and brain activity but kept the original data and design with its collinearity (and possible biases). We preprocessed this adapted data for subject 1, and ran a whole-brain decoding using Imagebind features and verified that the decoding performance was at chance level: Pairwise accuracy (captions): 0.43 | Pairwise accuracy (images): 0.47 | Pairwise accuracy (imagery): 0.50. This result provides evidence against the notion that potential collinearity or biases in our experimental design or evaluation procedure could have led to inflated results.
Raugel, J., Szafraniec, M., Vo, H.V., Couprie, C., Labatut, P., Bojanowski, P., Wyart, V. and King, J.R. (2025). Disentangling the Factors of Convergence between Brains and Computer Vision Models. arXiv preprint arXiv:2508.18226.
Solomon, S. H., Kay, K., & Schapiro, A. C. (2024). Semantic plasticity across timescales in the human brain. bioRxiv, 2024-02.
(6) The manuscript currently lacks a limitations section, specifically regarding the design of the experiment. This involves the use of the overly homogenous dataset Coco, which invites overfitting, the mixing of sentence descriptions and visual images, which invites imagery of previously seen content, and the use of a 1-back task, which can lead to carry-over effects to the subsequent trial.
Regarding the dataset CoCo: We agree that CoCo is somewhat homogenous, it is however much more diverse and naturalistic than the smaller datasets used in previous fMRI experiments with multimodal stimuli. Additionally, CoCo has been widely adopted as a benchmark dataset in the Machine Learning community, and features rich annotations for each image (e.g. object labels, segmentations, additional captions, people’s keypoints) facilitating many more future analyses based on our data.
Regarding the mixing of sentence descriptions and images: Subjects were not asked to visualize sentences and different techniques for the one-back tasks might have been used. Generally, we do not see it as problematic if subjects are performing visual imagery to some degree while reading sentences, and this might even be the case during normal reading as well. A more targeted experiment comparing reading with and without interleaved visual stimulation in the form of images and a one-back task would be required to assess this, but this was not the focus of our study. For now, it is true that we can not be sure that our results generalize to cases in which subjects are just reading and are less incentivized to perform mental imagery.
Regarding the use of a 1-back task: It was necessary to make some design choices in order to realize this large-scale data collection with approximately 10 hours of recording per subject. Specifically, the 1-back task was included in the experimental setup in order to assure continuous engagement of the participant during the rather long sessions of 1 hour. The subjects did indeed need to remember the previous stimulus to succeed at the 1-back task, which means that some brain activity during the presentation of a stimulus is likely to be related to the previous stimulus. We aimed to account for this confound during the preprocessing stage when fitting the GLM, which was fit to capture only the response to the presented image/caption, not the preceding one. Still, it might have picked up on some of the activity from preceding stimuli, causing some decrease of the final decoding performance.
We added a limitations section to the updated manuscript to discuss these important issues.
(7) I would urge the authors to clarify whether the primary aim is the introduction of a dataset and showing the use of it, or whether it is the set of results presented. This includes the title of this manuscript. While the decoding approach is very interesting and potentially very valuable, I believe that the results in the current form are rather descriptive, and I'm wondering what specifically they add beyond what is known from other related work. This includes imagery-related results. This is completely fine! It just highlights that a stronger framing as a dataset is probably advantageous for improving the significance of this work.
Thanks a lot for pointing this out. Based on this comment and feedback from the other reviewers we restructured the abstract, introduction and discussion section of the paper to better reflect the primary aim. (cf. general response above).
You further mention that it is not clear what our results add beyond what is known from related work. We list the main contributions here:
A single modality-agnostic decoder can decode the semantics of visual and linguistic stimuli irrespective of the presentation modality with a performance that is not lagging behind modality-specific decoders.
Modality-agnostic decoders outperform modality-specific decoders for decoding captions and mental imagery.
Modality-invariant representations are widespread across the cortex (a range of previous work has suggested they were much more localized (Bright et al. 2004; Jung et al. 2018; Man et al. 2012; Simanova et al. 2014).
Regions that are useful for imagery are largely overlapping with modality-invariant regions
Bright, P., Moss, H., & Tyler, L. K. (2004). Unitary vs multiple semantics: PET studies of word and picture processing. Brain and language, 89(3), 417-432.
Jung, Y., Larsen, B., & Walther, D. B. (2018). Modality-Independent Coding of Scene Categories in Prefrontal Cortex. Journal of Neuroscience, 38(26), 5969–5981.
Liuzzi, A. G., Bruffaerts, R., Peeters, R., Adamczuk, K., Keuleers, E., De Deyne, S., Storms, G., Dupont, P., & Vandenberghe, R. (2017). Cross-modal representation of spoken and written word meaning in left pars triangularis. NeuroImage, 150, 292–307. https://doi.org/10.1016/j.neuroimage.2017.02.032
Man, K., Kaplan, J. T., Damasio, A., & Meyer, K. (2012). Sight and Sound Converge to Form Modality-Invariant Representations in Temporoparietal Cortex. Journal of Neuroscience, 32(47), 16629–16636.
Simanova, I., Hagoort, P., Oostenveld, R., & van Gerven, M. A. J. (2014). Modality-Independent Decoding of Semantic Information from the Human Brain. Cerebral Cortex, 24(2), 426–434.
Reviewer #2 (Public review):
Summary:
This study introduces SemReps-8K, a large multimodal fMRI dataset collected while subjects viewed natural images and matched captions, and performed mental imagery based on textual cues. The authors aim to train modality-agnostic decoders--models that can predict neural representations independently of the input modality - and use these models to identify brain regions containing modality-agnostic information. They find that such decoders perform comparably or better than modality-specific decoders and generalize to imagery trials.
Strengths:
(1) The dataset is a substantial and well-controlled contribution, with >8,000 image-caption trials per subject and careful matching of stimuli across modalities - an essential resource for testing theories of abstract and amodal representation.
(2) The authors systematically compare unimodal, multimodal, and cross-modal decoders using a wide range of deep learning models, demonstrating thoughtful experimental design and thorough benchmarking.
(3) Their decoding pipeline is rigorous, with informative performance metrics and whole-brain searchlight analyses, offering valuable insights into the cortical distribution of shared representations.
(4) Extension to mental imagery decoding is a strong addition, aligning with theoretical predictions about the overlap between perception and imagery.
Weaknesses:
While the decoding results are robust, several critical limitations prevent the current findings from conclusively demonstrating truly modality-agnostic representations:
(1) Shared decoding ≠ abstraction: Successful decoding across modalities does not necessarily imply abstraction or modality-agnostic coding. Participants may engage in modality-specific processes (e.g., visual imagery when reading, inner speech when viewing images) that produce overlapping neural patterns. The analyses do not clearly disambiguate shared representational structure from genuinely modality-independent representations. Furthermore, in Figure 5, the modality-agnostic encoder did not perform better than the modality-specific decoder trained on images (in decoding images), but outperformed the modality-specific decoder trained on captions (in decoding captions). This asymmetry contradicts the premise of a truly "modality-agnostic" encoder. Additionally, given the similar performance between modality-agnostic decoders based on multimodal versus unimodal features, it remains unclear why neural representations did not preferentially align with multimodal features if they were truly modality-independent.
We agree that successful modality-agnostic and cross-modal decoding does not necessarily imply that abstract patterns were decoded. In the updated manuscript, we therefore refer to these representations as modality-invariant (see also the updated terminology explained in the general response above).
If participants are performing mental imagery when reading, and this is allowing us to perform cross-decoding, then this means that modality-invariant representations are formed during this mental imagery process, i.e. that the representations formed during this form of mental imagery are compatible with representations during visual perception (or, in your words, produce overlapping neural patterns). While we can not know to what extent people were performing mental imagery while reading (or having inner speech while viewing images), our results demonstrate that their brain activity allows for decoding across modalities, which implies that modality-invariant representations are present.
It is true that our current analyses can not disambiguate modality-invariant representations (or, in your words, shared representational structure) from abstract representations (in your words, genuinely modality-independent representations). As the main goal of the paper was to build modality-agnostic decoders, and these only require what we call “modality-invariant” representations (see our updated terminology in the general reviewer response above), we leave this question open for future work. We do however discuss this important limitation in the Discussion section of the updated manuscript.
Regarding the asymmetry of decoding results when comparing modality-agnostic decoders with the two respective modality-specific decoders for captions and images: We do not believe that this asymmetry contradicts the premise of a modality-agnostic decoder. Multiple explanations for this result are possible: (1) The modality-specific decoder for images might benefit from the more readily decodable lower-level modality-dependent neural activity patterns in response to images, which are less useful for the modality-agnostic decoder because they are not useful for decoding caption trials. The modality-specific decoders for captions might not be able to pick up on low-level modality-dependent neural activity patterns as these might be less easily decodable.
The signal-to-noise ratio for caption trials might be lower than for image trials (cf. generally lower caption decoding performance), therefore the addition of training data (even if it is from another modality) improves the decoding performance for captions, but not for images (which might be at ceiling already).
Regarding the similar performance between modality-agnostic decoders based on multimodal versus unimodal features: Unimodal features are based on rather high-level features of the respective modality (e.g. last-layer features of a model trained for semantic image classification), which can be already modality-invariant to some degree. Additionally, as already mentioned before, in the updated manuscript we only require representations to be modality-invariant and not necessarily abstract.
(2) The current analysis cannot definitively conclude that the decoder itself is modality-agnostic, making "Qualitative Decoding Results" difficult to interpret in this context. This section currently provides illustrative examples, but lacks systematic quantitative analyses.
The qualitative decoding results in Figures 6 and 7 present exemplary qualitative results for the quantitative results presented in Figures 4 and 5 (see also Reviewer 1 Comment 4).
Figures 4 and 5 show pairwise decoding accuracy as a quantitative measure for evaluation of the decoders. This metric is the main metric we used to compare different decoder types and features. Based on the finding that modality-agnostic decoders using imagebind features achieve the best score on this metric, we performed the additional qualitative analysis presented in Figures 6 and 7. (Note that we expanded the candidate set for the qualitative analysis in order to have a larger and more diverse set of images.)
(3) The use of mental imagery as evidence for modality-agnostic decoding is problematic.
Imagery involves subjective, variable experiences and likely draws on semantic and perceptual networks in flexible ways. Strong decoding in imagery trials could reflect semantic overlap or task strategies rather than evidence of abstraction.
It is true that mental imagery does not necessarily rely on modality-agnostic representations. In the updated manuscript we revised our terminology and refer to the analyzed representations as modality-invariant, which we define as “representations that significantly overlap between modalities”.
The manuscript presents a methodologically sophisticated and timely investigation into shared neural representations across modalities. However, the current evidence does not clearly distinguish between shared semantics, overlapping unimodal processes, and true modality-independent representations. A more cautious interpretation is warranted.
Nonetheless, the dataset and methodological framework represent a valuable resource for the field.
We fully agree with these observations, and updated our terminology as outlined in the general response.
Reviewer #3 (Public review):
Summary:
The authors recorded brain responses while participants viewed images and captions. The images and captions were taken from the COCO dataset, so each image has a corresponding caption, and each caption has a corresponding image. This enabled the authors to extract features from either the presented stimulus or the corresponding stimulus in the other modality.
The authors trained linear decoders to take brain responses and predict stimulus features.
"Modality-specific" decoders were trained on brain responses to either images or captions, while "modality-agnostic" decoders were trained on brain responses to both stimulus modalities. The decoders were evaluated on brain responses while the participants viewed and imagined new stimuli, and prediction performance was quantified using pairwise accuracy. The authors reported the following results:
(1) Decoders trained on brain responses to both images and captions can predict new brain responses to either modality.
(2) Decoders trained on brain responses to both images and captions outperform decoders trained on brain responses to a single modality.
(3) Many cortical regions represent the same concepts in vision and language.
(4) Decoders trained on brain responses to both images and captions can decode brain responses to imagined scenes.
Strengths:
This is an interesting study that addresses important questions about modality-agnostic representations. Previous work has shown that decoders trained on brain responses to one modality can be used to decode brain responses to another modality. The authors build on these findings by collecting a new multimodal dataset and training decoders on brain responses to both modalities.
To my knowledge, SemReps-8K is the first dataset of brain responses to vision and language where each stimulus item has a corresponding stimulus item in the other modality. This means that brain responses to a stimulus item can be modeled using visual features of the image, linguistic features of the caption, or multimodal features derived from both the image and the caption. The authors also employed a multimodal one-back matching task, which forces the participants to activate modality-agnostic representations. Overall, SemReps-8K is a valuable resource that will help researchers answer more questions about modality-agnostic representations.
The analyses are also very comprehensive. The authors trained decoders on brain responses to images, captions, and both modalities, and they tested the decoders on brain responses to images, captions, and imagined scenes. They extracted stimulus features using a range of visual, linguistic, and multimodal models. The modeling framework appears rigorous, and the results offer new insights into the relationship between vision, language, and imagery. In particular, the authors found that decoders trained on brain responses to both images and captions were more effective at decoding brain responses to imagined scenes than decoders trained on brain responses to either modality in isolation. The authors also found that imagined scenes can be decoded from a broad network of cortical regions.
Weaknesses:
The characterization of "modality-agnostic" and "modality-specific" decoders seems a bit contradictory. There are three major choices when fitting a decoder: the modality of the training stimuli, the modality of the testing stimuli, and the model used to extract stimulus features. However, the authors characterize their decoders based on only the first choice-"modality-specific" decoders were trained on brain responses to either images or captions, while "modality-agnostic" decoders were trained on brain responses to both stimulus modalities. I think that this leads to some instances where the conclusions are inconsistent with the methods and results.
In our analysis setup, a decoder is entirely determined by two factors: (1) the modality of the stimuli that the subject was exposed to, and (2) the machine learning model used to extract stimulus features.
The modality of the testing stimuli defines whether we are evaluating the decoder in a within-modality or cross-modality setting, but is not an inherent characteristic of a trained decoder
First, the authors suggest that "modality-specific decoders are not explicitly encouraged to pick up on modality-agnostic features during training" (line 137) while "modality-agnostic decoders may be more likely to leverage representations that are modality-agnostic" (line 140). However, whether a decoder is required to learn modality-agnostic representations depends on both the training responses and the stimulus features. Consider the case where the stimuli are represented using linguistic features of the captions. When you train a "modality-specific" decoder on image responses, the decoder is forced to rely on modality-agnostic information that is shared between the image responses and the caption features. On the other hand, when you train a "modality-agnostic" decoder on both image responses and caption responses, the decoder has access to the modality-specific information that is shared by the caption responses and the caption features, so it is not explicitly required to learn modality-agnostic features. As a result, while the authors show that "modality-agnostic" decoders outperform "modality-specific" decoders in most conditions, I am not convinced that this is because they are forced to learn more modality-agnostic features.
It is true that for example a modality-specific decoder trained on fmri data from images with stimulus features extracted from captions might also rely on modality-invariant features. We still call this decoder modality-specific, as it has been trained to decode brain activity recorded from a specific stimulus modality. In the updated manuscript we corrected the statement that “modality-specific decoders are not explicitly encouraged to pick up on modality-invariant features during training” to include the case of decoders trained on features from the other modality which might also rely on modality-invariant features.
It is true that a modality-agnostic decoder can also have access to modality-dependent information for captions and images. However, as it is trained jointly with both modalities and the modality-dependent features are not compatible, it is encouraged to rely on modality-invariant features. The result that modality-agnostic decoders are outperforming modality-specific decoders trained on captions for decoding captions confirms this, because if the decoder was only relying on modality-dependent features the addition of additional training data from another stimulus modality could not increase the performance. (Also, the lack of a performance drop compared to modality-specific decoders trained on images is only possible thanks to the reliance on modality-invariant features. If the decoder only relied on modality-dependent features the addition of data from another modality would equal an addition of noise to the training data which must result in a performance drop at test time.). We can not exclude the possibility that modality-agnostic decoders are also relying on modality-dependent features, but our results suggest that they are relying at least to some degree on modality-invariant features.
Second, the authors claim that "modality-specific decoders can be applied only in the modality that they were trained on, while "modality-agnostic decoders can be applied to decode stimuli from multiple modalities, even without knowing a priori the modality the stimulus was presented in" (line 47). While "modality-agnostic" decoders do outperform "modality-specific" decoders in the cross-modality conditions, it is important to note that "modality-specific" decoders still perform better than expected by chance (figure 5). It is also important to note that knowing about the input modality still improves decoding performance even for "modality-agnostic" decoders, since it determines the optimal feature space-it is better to decode brain responses to images using decoders trained on image features, and it is better to decode brain responses to captions using decoders trained on caption features.
Thanks for this important remark. We corrected this statement and now say that “modality-specific decoders that are trained to be applied only in the modality that they were trained on”, highlighting that their training process optimizes them for decoding in a specific modality. They can indeed be applied to the other modality at test time, this however results in a substantial performance drop.
It is true that knowing the input modality can improve performance even for modality-agnostic decoders. This can most likely be explained by the fact that in that case the decoder can leverage both, modality-invariant and modality-dependent features. We will not further focus on this result however as the main motivation to build modality-agnostic decoders is to be able to decode stimuli without knowing the stimulus modality a priori.
Recommendations for the authors:
Reviewer #1 (Recommendations for the authors):
I will list additional recommendations below in no specific order:
(1) I find the term "modality agnostic" quite unusual, and I believe I haven't seen it used outside of the ML community. I would urge the authors to change the terminology to be more common, or at least very early explain why the term is much better suited than the range of existing terms. A modality agnostic representation implies that it is not committed to a specific modality, but it seems that a representation cannot be committed to something.
In the updated manuscript we now refer to the identified brain patterns as modality-invariant, which has previously been used in the literature (Man et al. 2012; Devereux et al. 2013; Patterson et al. 2016; Deniz et al. 2019, Nakai et al. 2021) (see also the general response on top and the Introduction and Related Work sections of the updated manuscript).
We continue to refer to the decoders as modality-agnostic, as this is a new type of decoder, and describes the fact that they are trained in a way that abstracts away from the modality of the stimuli. We chose this term as we are not aware of any work in which brain decoders were trained jointly on multiple stimulus modalities and in order not to risk contradictions/confusions with other definitions.
Deniz, F., Nunez-Elizalde, A. O., Huth, A. G., & Gallant, J. L. (2019). The Representation of Semantic Information Across Human Cerebral Cortex During Listening Versus Reading Is Invariant to Stimulus Modality. Journal of Neuroscience, 39(39), 7722–7736. https://doi.org/10.1523/JNEUROSCI.0675-19.2019
Devereux, B. J., Clarke, A., Marouchos, A., & Tyler, L. K. (2013). Representational Similarity Analysis Reveals Commonalities and Differences in the Semantic Processing of Words and Objects. The Journal of Neuroscience, 33(48).
Nakai, T., Yamaguchi, H. Q., & Nishimoto, S. (2021). Convergence of Modality Invariance and Attention Selectivity in the Cortical Semantic Circuit. Cerebral Cortex, 31(10), 4825–4839. https://doi.org/10.1093/cercor/bhab125
Man, K., Kaplan, J. T., Damasio, A., & Meyer, K. (2012). Sight and Sound Converge to Form Modality-Invariant Representations in Temporoparietal Cortex. Journal of Neuroscience, 32(47), 16629–16636.
Patterson, K., & Lambon Ralph, M. A. (2016). The Hub-and-Spoke Hypothesis of Semantic Memory. In Neurobiology of Language (pp. 765–775). Elsevier. https://doi.org/10.1016/B978-0-12-407794-2.00061-4
(2) The table in Figure 1B would benefit from also highlighting the number of stimuli that have overlapping captions and images.
The number of overlapping stimuli is rather small (153-211 stimuli depending on the subject). We added this information to Table 1B.
(3) The authors wrote that training stimuli were presented only once, yet they used a one-back task. Did the authors also exclude the first presentation of these stimuli?
Thanks for pointing this out. It is indeed true that some training stimuli were presented more than once, but only for the case of one-back target trials. In these cases the second presentation of the stimulus was excluded, but not the first. As the subject can not be aware of the fact that the upcoming presentation is going to be a one-back target, the first presentation can not be affected by the presence of the subsequent repeated presentation. We updated the manuscript to clarify this issue.
(4) Coco has roughly 80-90 categories, so many image captions will be extremely similar (e.g., "a giraffe walking", "a surfer on a wave", etc.). How can people keep these apart?
It is true that some captions and images are highly similar even though they are not matching in the dataset. This might result in several false button presses because the subjects identified an image-caption pair as matching when in fact it wasn't intended to. However, as there was no feedback given on the task performance, this issue should not have had a major influence on the brain activity of the participants.
(5) Footnotes for statistics are quite unusual - could the authors integrate statistics into the text?
Thanks for this remark, in the updated manuscript all statistics are part of the main text.
(6) It may be difficult to achieve the assumptions of a permutation test - exchangeability, which may bias statistical results. It is not uncommon for densely sampled datasets to use bootstrap sampling on the predictions of the test data to identify if a given percentile of that distribution crosses 0. The lowest p-value is given by the number of bootstrap samples (e.g., if all 10,000 bootstrap samples are above chance, then p < 0.0001). This may turn out to be more effective.
Thanks for this comment. Our statistical procedure was in fact involving a bootstrapping procedure to generate a null distribution on the group-level. We updated the manuscript to describe this method in more detail. Here is the updated paragraph: “To estimate the statistical significance of the resulting clusters we performed a permutation test, combined with a bootstrapping procedure to estimate a group-level null distribution see also Stelzer et al., 2013). For each subject, we evaluated the decoders 100 times with shuffled labels to create per-subject chance-level results. Then, we randomly selected one of the 100 chance-level results for each of the 6 subjects and calculated group-level statistics (TFCE values) the exact same way as described in the preceding paragraph. We repeated this procedure 10,000 times resulting in 10,000 permuted group-level results. We ensured that every permutation was unique, i.e. no two permutations were based on the same combination of selected chance-level results. Based on this null distribution, we calculated p-values for each vertex by calculating the proportion of sampled permutations where the TFCE value was greater than the observed TFCE value. To control for multiple comparisons across space, we always considered the maximum TFCE score across vertices for each group-level permutation (Smith and Nichols, 2009).”
(7) The authors present no statistical evidence for some of their claims (e.g., lines 335-337). It would be good if they could complement this in their description. Further, the visualization in Figure 4 is rather opaque. It would help if the authors could add a separate bar for the average modality-specific and modality-agnostic decoders or present results in a scatter plot, showing modality-specific on the x-axis and modality-agnostic on the y-axis and color-code the modality (i.e., making it two scatter colors, one for images, one for captions). All points will end up above the diagonal.
We updated the manuscript and added statistical evidence for the claims made:
We now report results for the claim that when considering the average decoding performance for images and captions, modality-agnostic decoders perform better than modality-specific decoders, irrespective of the features that the decoders were trained on.
Additionally, we report the average modality-agnostic and modality-specific decoding accuracies corresponding to Figure 4. For modality-agnostic decoders the average value is 81.86\%, for modality-specific decoders trained on images 78.15\%, and for modality-specific decoders trained on captions 72.52\%. We did not add a separate bar to Figure 4 as this would add additional information to a Figure which is already very dense in its information content (cf. Reviewers 2’s recommendations for the authors). We therefore believe it is more useful to report the average values in the text and provide results for a statistical test comparing the decoder types. A scatter plot would make it difficult to include detailed information on the features, which we believe is crucial.
We further provide statistical evidence for the observation regarding the directionality of cross-modal decoding.
Reviewer #2 (Recommendations for the authors):
For achieving more evidence to support modality-agnostic representations in the brain, I suggest more thorough analyses, for example:
(1) Traditional searchlight RSA using different deep learning models. Through this approach, it might identify different brain areas that are sensitive to different formats of information (visual, text, multimodal); subsequently, compare the decoding performance using these ROIs.
(2) Build more dissociable decoders for information of different modality formats, if possible. While I do not have a concrete proposal, more targeted decoder designs might better dissociate representational formats (i.e., unimodal vs. modality-agnostic).
(3) A more detailed exploration of the "qualitative decoding results"--for example, quantitatively examining error types produced by modality-agnostic versus modality-specific decoders--would be informative for clarifying what specific content the decoder captures, potentially providing stronger evidence for modality-agnostic representations.
Thanks for these suggestions. As the main goal of the paper is to introduce modality-agnostic decoders (which should be more clear from the updated manuscript, see also the general response to reviews), we did not include alternative methods for identifying modality-invariant regions. Nonetheless, we agree that in order to obtain more in-depth insight into the nature of representations that were recorded, performing analyses with additional methods such as RSA, comparisons with more targeted decoder designs in terms of their target features will be indispensable, as well as more in-depth error type analyses. We leave these analyses as promising directions for future work.
The writing could be further improved in the introduction and, accordingly, the discussion. The authors listed a series of theories about conceptual representations; however, they did not systematically explain the relationships and controversies between them, and it seems that they did not aim to address the issues raised by these theories anyway. Thus, the extraction of core ideas is suggested. The difference between "modality-agnostic" and terms like "modality-independent," "modality-invariant," "abstract," "amodal," or "supramodal," and the necessity for a novel term should be articulated.
The updated manuscript includes an improved introduction and discussion section that highlight the main focus and contributions of the study.
We believe that a systematic comparison of theories on conceptual representations involving their relationships and controversies would require a dedicated review paper. Here, we focused on the aspects that are relevant for the study at hand (modality-invariant representations), for which we find that none of the considered theories can be rejected based on our results.
Regarding the terminology (modality-agnostic vs. modality-invariant, ..) please refer to the general response.
The figures also have room to improve. For example, Figures 4 and 5 present dense bar plots comparing multiple decoding settings (e.g., modality-specific vs. modality-agnostic decoders, feature space, within-modal vs. cross-modal, etc.); while comprehensive, they would benefit from clearer labels or separated subplots to aid interpretation. All figures are recommended to be optimized for greater clarity and directness in future revisions.
Thanks for this remark. We agree that the figures are quite dense in information. However, splitting them up into subplots (e.g. separate subplots for different decoder types) would make it much less straightforward to compare the accuracy scores between conditions. As the main goal of these figures is to compare features and decoder types, we believe that it is useful to keep all information in the same plot.
You are also suggesting to improve the clarity of the labels. It is true that the top left legend of Figures 4 and 5 was mixing information about decoder type and broad classes of features (vision/language/multimodal). To improve clarity, we updated the figures and clearly separated information on decoder type (the hue of different bars) and features (x-axis labels). The broad classes of features (vision/language/multimodal) are distinguished by alternating light gray background colors and additional labels at the very bottom of the plots.
The new plots allow for easy performance comparison of the different decoder types and additionally provide information on confidence intervals for the performance of modality-specific decoders, which was not available in the previous figures.
Reviewer #3 (Recommendations for the authors):
(1) As discussed in the Public Review, I think the paper would greatly benefit from clearer terminology. Instead of describing the decoders as "modality-agnostic" and "modality-specific", perhaps the authors could describe the decoding conditions based on the train and test modalities (e.g., "image-to-image", "caption-to-image", "multimodal-to-image") or using the terminology from Figure 3 (e.g., "within-modality", "cross-modality", "modality-agnostic").
We updated our terminology to be clearer and more accurate, as outlined in the general response. The terms modality-agnostic and modality-specific refer to the training conditions, and the test conditions are described in Figure 3 and are used throughout the paper.
(2) Line 244: I think the multimodal one-back task is an important aspect of the dataset that is worth highlighting. It seems to be a relatively novel paradigm, and it might help ensure that the participants are activating modality-agnostic representations.
It is true that the multimodal one-back task could play an important role for the activation of modality-invariant representations. Future work could investigate to what degree the presence of widespread modality-invariant representations is dependent on such a paradigm.
(3) Line 253: Could the authors elaborate on why they chose a random set of training stimuli for each participant? Is it to make the searchlight analyses more robust?
A random set of training stimuli was chosen in order to maximize the diversity of the training sets, i.e. to avoid bias based on a specific subsample of the CoCo dataset. Between-subject comparisons can still be made based on the test set which was shared for all subjects, with the limitation that performance differences due to individual differences or to the different training sets can not be disentangled. However, the main goal of the data collection was not to make between-subject comparisons based on common training sets, but rather to make group-level analyses based on a large and maximally diverse dataset.
(4) Figure 4: Could the authors comment more on the patterns of decoding performance in Figure 5? For instance, it is interesting that ResNet is a better target than ViT, and BERT-base is a better target than BERT-large.
A multitude of factors influence the decoding performance, such as features dimensionality, model architecture, training data, and training objective(s) (Conwell et al. 2023; Raugel et al. 2025). Bert-base might be better than bert-large because the extracted features are of lower dimension. Resnet might be better than ViT because of its architecture (CNN vs. Transformer). To dive deeper into these differences further controlled analysis would be necessary, but this is not the focus of this paper. The main objective of the feature comparison was to provide a broad overview over visual/linguistic/multimodal feature spaces and to identify the most suitable features for modality-agnostic decoding.
Conwell, C., Prince, J. S., Kay, K. N., Alvarez, G. A., & Konkle, T. (2023). What can 1.8 billion regressions tell us about the pressures shaping high-level visual representation in brains and machines? (p. 2022.03.28.485868). bioRxiv. https://doi.org/10.1101/2022.03.28.485868
Raugel, J., Szafraniec, M., Vo, H.V., Couprie, C., Labatut, P., Bojanowski, P., Wyart, V. and King, J.R. (2025). Disentangling the Factors of Convergence between Brains and Computer Vision Models. arXiv preprint arXiv:2508.18226.
(5) Figure 7: It is interesting that the modality-agnostic decoder predictions mostly appear traffic-related. Is there a possibility that the model always produces traffic-related predictions, making it trivially correct for the presented stimuli that are actually traffic-related? It could be helpful to include some examples where the decoder produces other types of predictions to dispel this concern.
The presented qualitative examples were randomly selected. To make sure that the decoder is not always predicting traffic-related content, we included 5 additional randomly selected examples in Figures 6 and 7 of the updated manuscript. In only one of the 5 new examples the decoder was predicting traffic-related content, and in this case the stimulus had actually been traffic-related (a bus).
-
-
pesquisa.icea.decea.mil.br pesquisa.icea.decea.mil.br
-
Tabela 2.5: Projetos no SISCEAB
Mudar o nome da tabela e colocar a referência do SIRUS.
-
Figura 2.28: Condições meteorológicas (por aeroporto) em 2025
Deixar padrão o gráfico e parecido com a figura 2.14.
-
Figura 2.14: Composição das frotas dos principais aeródromos brasileiros
Deixar padrão o gráfico e parecido com a figura 2.28.
-
Figura 2.27: Critérios de teto e visibilidade
Copiar o código HTML da página da redemet.
-
Figura 2.26: Percentual de ATCO com NP Operacional (4 ou acima)
01 - Inserir o gráfico de variação; 02 - Inserir a legenda; 03 - Inserir mais um ano de comparação; 04 - Inserir o título do eixo y; 05 - Alterar no nome da figura.
-
Anexando pacote: 'rlang' Os seguintes objetos são mascarados por 'package:purrr': %@%, flatten, flatten_chr, flatten_dbl, flatten_int, flatten_lgl, flatten_raw, invoke, splice Os seguintes objetos são mascarados por 'package:jsonlite': flatten, unbox O seguinte objeto é mascarado por 'package:base': %||%
Retirar a mensagem.
-
Efetivo de ATCO em Organizações Externas ao COMAER
Colocar 2023. tocar o nome fora por 'outros'.
-
Rotas mais voadas pela aviação comercial em 2025
trocar bds e colocar mais rotas. O Léo vai criar uma bds nova. trocar mapa para américa do sul
-
Figura 2.9: Movimentos por FIR
adicionar o total br
-
Figura 2.9: Movimentos por FIR
Alterar o gráfico. Separar o anual de variação do gráfico mensal. Incluir 2023 e colocar os gráficos um abaixo do outro.
-
-
test2025.mitkoforevents.cz test2025.mitkoforevents.cz
-
Kontaktujte nás, a my vám pomůžeme s výběrem a poradíme! Potřebujete pomoc event managera při výběru vybavení? Nebo se chcete dozvědět více o stanu? Kontaktujte náš tým expertů, kteří odpoví na každou vaši otázku. Spojte se s námi
Use the same "contact banner" as on the home page: "Nejste si čímkoliv jistí…"
-
Byly by produkty Mitko vhodným nákupem? Všechny produkty Mitko jsme připravili s maximální péčí o každý detail. Výrobky vyrábíme v Polsku, nespoléháme na dovoz z Číny, což se odráží v kvalitním a odolném produktu, který vám bude sloužit mnoho let, a investované peníze budou skvělou investicí na dlouhou dobu. Instituce – i ty největší – se k nám často vracejí s opakovanými objednávkami.
Jak je to s kvalitou potisku? Tiskneme nejmodernější metodou digitální sublimace, která zajišťuje věrné podání barev, ostrý tisk a UV odolnost barev. U nás tedy nečekejte nevýrazné barvy a rozpité okraje!
-
-
test2025.mitkoforevents.cz test2025.mitkoforevents.cz
-
Kontaktujte nás, a my vám pomůžeme s výběrem a poradíme! Potřebujete pomoc event manažera při výběru vybavení? Nebo se chcete dozvědět více o stanu? Kontaktujte náš tým odborníků, kteří odpoví na každou vaši otá
Nejste si čímkoliv jistí? Kontaktujte nás a probereme detaily! K dispozici je Vám celý obchodní tým vč. zákaznického servisu. Všichni sedíme v Brně, žádné zahraniční objednávky!
-
Zjistěte, co o nás říkají zákazníci Odolný vůči všem podmínkám Stan funguje fantasticky – rozkládá se rychle a bez problémů. Potisk na stěnách a střeše je intenzivní, nebojí se deště ani jiných nepříznivých povětrnostních podmínek. Slovy – ano! Jsme spokojeni s nákupem. Kinga Grundaj-Kamińska Ředitelka marketingu Auto Partner S.A.
Delete this whole segment.
-
Novinky – znalosti o MITKO
Novinky
-
-
exodus90.com exodus90.com
-
o many men are isolated and alone today, and in that place we are susceptible to the whims, temptations, and empty show of the devil. Many men have buddies with whom they can watch sports and drink beer, and there’s nothing wrong with that. But we also need to have brothers who know who we are, what we are going through, and to whom we can be accountable.
need a community to support us and keep us in check to prevent us from becoming lonely and falling into the tempatations of satan
-
-
thousandbrains.org thousandbrains.org
-
Reverse engineering the neocortex to revolutionize AI
-
-
www.oscar.nierstrasz.org www.oscar.nierstrasz.org
-
With TDD, you develop code by incrementally adding a test for a new feature, which fails. Then you write the “simplest code” that passes the new test. You add new tests, refactoring as needed, until you have fully covered everything that the new feature should fulfil, as specified by the tests. But: Where do tests come from? When you write a test, you actually have to “guess first” to imagine what objects to create, exercise and test. How do we write the simplest code that passes? A test that fails gives you a debugger context, but then you have to go somewhere else to add some new classes and methods. What use is a green test? Green tests can be used to detect regressions, but otherwise they don't help you much to create new tests or explore the running system. With Example-Driven Development we try to answer these questions.
Desde que me lo presentaron, siempre me ha desagradado el Test Driven Design (TDD), pues me parecía absurdamente burocrático y contra flujo. Afortunadamente, gracias al podcast de Book Overflow, encontré un autor reconocido, John Ousterhout, creador de Tcl/Tk y "A Philosophy of software design", que comparte mi opinón respecto a escribir los test antes de escribir el código y dice que en el TDD no se hace diseño, sino que se depura el software hasta su existencia.
Mi enfoque, que podría llamarse Argumentative Driven Design o ADD es uno en el que el código se desarrolla para mostrar un argumento en favor de una hipótesis, y las pruebas de código se van creando en la medida en que uno necesita inspeccionar y manipular los objetos que dicho código produce.
En palabras práctica, esto quiere decir que los test y su configuración deberían hacerse cuando uno necesita hacer un "print" (para probar/inspeccionar/manipular un estado/elemento del sistema) y no antes, lo cual aumenta la utilidad, no interrumpe el flujo y responde preguntas similares a las de este apartado, respecto a de dónde provienen las pruebas y qué hacer con los resultados exitosos.
-
-
kevin-carrasco.github.io kevin-carrasco.github.io
-
Existe una relación entre confianza en el Estado y creencia en el interés del gobierno por la opinión pública (H0= no existe relación entre la confianza en el Estado y creencia en el interés del gobierno por la opinión pública) La confianza en el Estado es menor en población joven que en generaciones mayores. (H0 = confianza en el Estado es igual o mayor en población joven que en generaciones mayores) Existe una relación proporcional entre la confianza en el Estado y la confianza en los organismos municipales y locales. (H0= No existe una relación proporcional entre la confianza en el Estado y la confianza en los organismos municipales y locales).
no hay definición de factores asociados
-
En base a esto, definimos la confianza de acuerdo a la definición conceptual de Irarrázaval y Cruz (2023), que la caracteriza como la expectativa que el otro actuará acorde a las normas sociales, de manera honesta o al menos no perjudicial hacia el prójimo; de la misma forma, la confianza puede tener expectativas en la capacidad o en la integridad, ambas fundamentales para el entendimiento de la confianza.
esto es confianza interpersonal, no confianza en instituciones
-
-
docdrop.org docdrop.org
-
fluence and Impact Giving autonomy to persons and groups oo Freeing people to “do their thing Expressing own ideas and feelings as one aspect of the group data Facilitating learning Giving orders Directing subordinates’ behavior Keeping own ideas and feelings “close to the vest” Exercising authority over people and organizations Coercing when necessary Teaching, instructing, advising Evaluating others Stimulating independence in d action Delenuting: siving full responsibility Offering feedback and receiving it Encouraging and relying on self-evaluation Finding rewards in the achievements of others Being rewarded by own achievements > Pp Pp d control. NT . wee Douglas McGregor’s Human Side of eo theory X and theory Y.° They are not oppos ‘ poles views about work—including teaching and obs a ae ement and the assumptions underlying it. Ty nived from research in the social sciences. Three basic assumptions of theory X are ggests two approaches to management, oles on a continuum but two different Theory X applies to traditional s based on assumptions de- isli i id it if Th age human being has an inherent dislike of work and will avoi 4. The aver possible. e of this hu * threatened with punishment to get them to put forth adeq achievement of organizational objectives. i i ibility, e human being prefers to be directed, wishes to avoid responsibility 3. The averag i 1. has relatively little ambition, and wants security above al i e an ick” tivation fits reason- i “ d the stick” theory of mo indicates that the “carrot an oe OE te alan theory X. External rewards and punishments are mu monn ee The oer ‘quent direction and control does not recognize intrinsic ' ms Theory Y is more humanistic and is based on six assumptions: i sh. and mental effort in work is as natural as play or re 1. The expenditure of physical ly means for bringing i the on 2. External controls and the threat of punishment are not i i ise self- iectives. Human beings will exercise sof obi h they are committed. izational o t effort toward organiza s. n ‘ineotion and self-control in the service of objectives to wh Notes 121 3. Commitment to objectives is a function of the rewards associated with their achievement. 4. The average human being learns, under proper conditions, not only to accept but also to seek responsibility, 5. The capacity to exercise a relatively hi creativity in the solution of organizatio tributed in the population. 6. Under the conditions of modern industrial life, th average human being are only partially utilized. gh degree of imagination, ingenuity, and nal problems is widely, not natrowly, dis- e intellectual potentialities of the McGregor saw these assumptions leading to superior—subordinate relationships in which the subordinate would have greater influence over the activities in his or her own work and also have influence on the Superior’s actions. Through participatory manage- Inent, greater creativity and productivity are expected, and also a greater sense of personal accomplishment and satisfaction by the workers. Chris Argyris,”° Warren Bennis,2” and Rensis Likert” cite evidence that a participatory system of management can be more ef- fective than traditional management. Likert’s studies showed that high production can be achieved by people- rather than production-oriented managers. Mor cover, these high-production managers were willing to delegate; to allow subordinates to participate in decisions; to be relatively nonpunitive; and to use open, two-way communication patterns. High morale and effective planning were also characteristic of these “person-centered” managers. The results may be applied to the supervisory relationship in education as well as to industry. There have been at least two theory Z candi broached in Abraham Maslow’s Nature.” The other dealt with when they were applied to pos circles, cooperative learning, influenced by those theories. dates in more recent years. One was posthumous publication, The Farther Reaches of Human the success of ideas from the 1930s in the United States twar Japan following WWII. Innovations such as quality participatory management, and shared decision making were NOTES 1. Shwartz, T. ( 1996). What really matters: Searching for wis- 7. Hersey, P. and Blanchard, K, (1982). Management of organi- dom in America. New York: Bantam Books. zational behavior: Utilizing human resources. Englewood Cliffs, 2. Bales, R. F. (1976). Interaction process analysis: A method NJ: Prentice-Hall. Jor the study of small 8roups. Chicago: Midway Reprint, Univer- 8. Gregorc, A. F. (1986). Gregore style delineator. Gregorc sity of Chicago Press, Associates. 9. Myers-Briggs: Quenk, N. L. (2000). Essentials of Myers- Briges type indicator assessment. New York: John Wiley & Sons. 10. Keirsey, D., & Bates, M. (1978). Please understand me. Del 3, Cattell; See Hall, Lindsey, and Campbell, (1997). Theories of Personality. New York: John Wiley & Sons. 4, Murray, Rorschach: See Buros, O. (1970-1975). Personality tests and reviews (Vol. 1 & 2). Highland Park, NI: Gryphon Mar, CA: Prometheus Nemesis Book Company. Press, : 11. Keirsey, D. (1998). Please understand me TT; Temperament, 5. Amidon, E., & Flanders, N. (1967), Interaction analysis asa character, intelligence. Loughton, UK: Prometheus Books. feedba¢k system. In Interaction Analysis: Theory, Research, and Applica’ ; ‘ 12. Goldberg, L. R. http://www.ori.org/scientists/goldberg. htm! ton (pp. 122-124). Reading, MA: Addison-Wesley. 6.8 . ; 13. Spaulding, R. I. (1967). A coping analysis schedule for edu- o lumberg, A, (1974). Supervisors and teachers: A Private cational settings (CASES). In A. Simon & EG. Boyer (Eds.), ‘var Berkeley, CA: McCutchan, 1974. Mirrors for behavior. Philadelphia: Research for Better Schools.
I agree that most teachers need influence and impact, NOT power and control from their leadership!
-
114 Chapter6 Styles of Interperson al Communication in Clinical Supervision idea to a different situation 18 but one example; pointing to a logical consequence 1S at other. ¥ araphrasing can be OV erdone if to 0 many responses are similar, or if they are inap ee ing 60 miles an hour,” her says, “The car was going . : ed. For example, if a teac . . m obile was ED atta much to respond, “What you are saying 1S a rat to communi- : vel a mile a minute.” An effective paraphrase must bea.g eer: idea shows cate that we understand what the other person 1s a 7 sane Of course, it can be pur- cee ood is pursuing the thougnt. . er heard, understood, and is pu x’s. Generally, ea ar it ceases to be the teacher's idea and becomes the observe sue wev Vv. y y i is rewarding. however, having a person ou respect use your idea is re zg 3 NS COMMUNICATION TECHNIQUE 3: ASK CLARIFYING QUESTIO ify the observer’s understanding , ften need to be probed to clarify ot The Fea teacher vink carefully about inferences and decisions. “Tell me what you eacher to th s nk. 0 1 nat oF “Can you say a little more about that?” are examples. So is mean by idence that... .” | waist Ae © maunoes if we do not clarify, miscommunication 1s ne result woroceeds z someone will say, “You're absolutely right! Moreover ao oh cv Pet SO eel i ht you said. ; t opposite of what you thoug, aid on Oe anal st teay of a case of not listening at all, but a clarifying question avoids u stra’ . : ; . \ understandings. ; . wees stions took place in a high schoo Anexample of paraphrasing and asking clarifying que o fill out anonymously. here the principal gave the faculty an administrator appraisal stactlty meeting, “What you ‘After analyzing the compiled responses, the principal said 5 & would like.” Several aeeatobe ling me in this survey is that I'm not as accessible as you we id look like?” an id almost in unison, “Could you tell us what "being eS a ome ‘drop-in’ we which the ptincipal replied: “Well, I'd keep my door open me = oan ewer it briefly ae And if you stopped me in the hall and asked a question, I'd try cnats. . tone 3? a way to a meeting. ; ant ane and Clarified his iatentions in public, he was destined to become i nced an a Mi sev eesible” in the next few months. Of course he had some help from wags “ T. ing, “ ible?” t resist asking, “Are you feeling accessi station fe veal veints ca be made with this example: (1) the ee pears oft into lech and-blood behavior; (2) the clarifying question checked the per
this is important with the work I often do with teachers who speak english as a second language. We have to clarify and not make assumptions of understanding.
-
-
preprints.scielo.org preprints.scielo.org
-
o gestor
os gestores...
-
Os
sendo pontos positivos da abordagem, acredita-se começar melhor com "É enfatizado pela autora do texto o facto de os currículos oficiais..."
-
- Nov 2025
-
search.credoreference.com search.credoreference.com
-
The code switching, then, is an affirmation of language knowledge of the Mexican American/Chicana/o/Latina/o identity.
It allows speakers to express the full range of their cultural belonging. Moving between English and Spanish, they share cultural signifiers, like humors, dichos, and family language.
-
-
github.com github.com
-
You and 7 others reacted
-
-
onceuponablog44.wordpress.com onceuponablog44.wordpress.com
-
Cho
nel creolo giamaicano, termine utilizzato per rappresentare frustrazione o scocciatura nei confronti di qualcuno o qualcosa.
-
-
learn2.open.ac.uk learn2.open.ac.uk
-
The gas we call air is a mixture of many individual gases, but it is predominantly nitrogen with oxygen. Nitrogen makes up a little over 78% of the atmosphere (Table 2.1.1) and is in the form of nitrogen molecules – that is, a pair of nitrogen (N) atoms strongly bonded together. Atomic N has three unpaired electrons and is very reactive, hence the gas usually forms the triple-bonded molecular dinitrogen, or N2. Oxygen, which makes up 21% of the atmosphere, is composed of O2 molecules, in which two oxygen (O) atoms are bonded together, but with a double bond that is not as strong as the bond connecting the N atoms in N2 molecules.
Nitrogen makes us 78% of air, in the form of nitrogen molecules - a pair of N strongly bonded Atomic N has 3 unpaired electrons and is very reactive, so it normally forms triple bonded moleculer dinitrogen, or N2
Oxygen makes us 21%, composed of O2 molecules, two atoms that are bonded, less strongly than nitrogen
-
-
www.sciencedirect.com:5037 www.sciencedirect.com:5037
-
RRID:AB_397575
DOI: 10.1016/j.celrep.2025.116606
Resource: (BD Biosciences Cat# 610176, RRID:AB_397575)
Curator: @scibot
SciCrunch record: RRID:AB_397575
-
-
it.wikipedia.org it.wikipedia.org
-
Per rendere le vaccinazioni più efficaci vengono stilate successioni cronologiche, riassunte nei cosiddetti "calendari vaccinali", predisposti dalle autorità sanitarie nazionali, e che riguardano principalmente le vaccinazioni in ambito pediatrico.
successioni cronologiche prive di fondamenta scientifiche e la cui validità è non dimostrata. La ripresa dell'incidenza di malattie gravi o potenzialmente mortali (che sarebbero facilmente evitabili tramite semplici vaccinazioni) è arbitraria e gratuita...
-
-
runestone.academy runestone.academy
-
Given a list of numbers in random order, write an algorithm that works in O(nlog(n)) to find the kth smallest number in the list.
would be good to have some answers to the exercises. stuck on number 4
-
-
onceuponablog44.wordpress.com onceuponablog44.wordpress.com
-
flagon
fiasco, caraffa (di vino o altra bevanda)
-
-
www.biorxiv.org www.biorxiv.org
-
Note: This response was posted by the corresponding author to Review Commons. The content has not been altered except for formatting.
Learn more at Review Commons
Reply to the reviewers
Manuscript number: RC -2025-03175
Corresponding author(s): Gernot Längst
[Please use this template only if the submitted manuscript should be considered by the affiliate journal as a full revision in response to the points raised by the reviewers.
- *
If you wish to submit a preliminary revision with a revision plan, please use our "Revision Plan" template. It is important to use the appropriate template to clearly inform the editors of your intentions.]
1. General Statements [optional]
This section is optional. Insert here any general statements you wish to make about the goal of the study or about the reviews.
2. Point-by-point description of the revisions
This section is mandatory. *Please insert a point-by-point reply describing the revisions that were already carried out and included in the transferred manuscript. *
We thank the reviewers for their efforts and detailed evaluation of our manuscript. We think that the comments of the reviewers allowed us to significantly improve the manuscript.
With best regards
The authors of the manuscript
Reviewer #1 (Evidence, reproducibility and clarity (Required)):
Summary: Holzinger et al. present a new automated pipeline, nucDetective, designed to provide accurate nucleosome positioning, fuzziness, and regularity from MNase-seq data. The pipeline is structured around two main workflows-Profiler and Inspector-and can also be applied to time-series datasets. To demonstrate its utility, the authors re-analyzed a Plasmodium falciparum MNase-seq time-series dataset (Kensche et al., 2016), aiming to show that nucDetective can reliably characterize nucleosomes in challenging AT-rich genomes. By integrating additional datasets (ATAC-seq, RNA-seq, ChIP-seq), they argue that the nucleosome positioning results from their pipeline have biological relevance.
Major Comments:
Despite being a useful pipeline, the authors draw conclusions directly from the pipeline's output without integrating necessary quality controls. Some claims either contradict existing literature or rely on misinterpretation or insufficient statistical support. In some instances, the pipeline output does not align with known aspects of Plasmodium biology. I outline below the key concerns and suggested improvements to strengthen the manuscript and validate the pipeline:
Clarification of +1 Nucleosome Positioning in P. falciparum The authors should acknowledge that +1 nucleosomes have been previously reported in P. falciparum. For example, Kensche et al. (2016) used MNase-seq to map ~2,278 TSSs (based on enriched 5′-end RNA data) and found that the +1 nucleosome is positioned directly over the TSS in most genes:
"Analysis of 2278 start sites uncovered positioning of a +1 nucleosome right over the TSS in almost all analysed regions" (Figure 3A).
They also described a nucleosome-depleted region (NDR) upstream of the TSS, which varies in size, while the +1 nucleosome frequently overlaps the TSS. The authors should nuance their claims accordingly. Nevertheless, I do agree that the +1 positioning in P. falciparum may be fuzzier as compared to yeast or mammals. Moreover, the correlation between +1 nucleosome occupancy and gene expression is often weak and that several genes show similar nucleosome profiles regardless of expression level. This raises my question: did the authors observe any of these patterns in their new data?
We appreciate the reviewer’s insightful comment and agree that +1 nucleosomes and nucleosome depleted promoter regions have been previously reported in P. falciparum, notably by the Bartfai and Le Roch groups, including Kensche et al. (PMID: 26578577). Our study advances this understanding by providing, for the first time, a comprehensive view of the entirety of a canonical eukaryotic promoter architecture in P. falciparum—encompassing the NDR, the well-positioned +1 nucleosome, and the downstream phased nucleosome array. This downstream nucleosome array structure has not been characterized before, as prior studies noted a “lack of downstream nucleosomal arrays” (PMID: 26578577) or “relatively random” nucleosome organization within gene bodies (PMID: 24885191). We have revised the manuscript to more clearly acknowledge previous work and highlight our contributions. The changes we applied in the manuscript are highlighted in yellow and shown as well below.
In the Abstract L26-L230: Contrary to the current view of irregular chromatin, we demonstrate for the first time regular phased nucleosome arrays downstream of TSSs, which, together with the established +1 nucleosome and upstream nucleosome-depleted region, reveal a complete canonical eukaryotic promoter architecture in Pf.
Introduction L156-L159: For example, we identify a phased nucleosome array downstream of the TSS. Together with a well-positioned +1 nucleosome and an upstream nucleosome-free region. These findings support a promoter architecture in Pf that resembles classical eukaryotic promoters (Bunnik et al. 2014, Kensche et al. 2016).
Results L181-L183: These new Pf nucleosome maps reveal a nucleosome organisation at transcription start sites (TSS) reminiscent of the general eukaryotic chromatin structure, featuring a reported well-positioned +1 nucleosome , an upstream nucleosome-free region (NFR, Bunnik et al. 2014, Kensche et al. 2016), and shown for the first time in Pf, a phased nucleosome array downstream of the TSS.
Discussion L414-L419: Previous analyses of Pf chromatin have identified +1 nucleosomes and NFRs (Bunnik et al 2014, Kensche et al. 2016). Here we extend this understanding by demonstrating phased nucleosome array structures throughout the genome. This finding provides evidence for a spatial regulation of nucleosome positioning in Pf, challenging the notion that nucleosome positioning is relatively random in gene bodies (Bunnik et al. 2014, Kensche et al. 2016). Consequently our results contribute to the understanding that Pf exhibits a typical eukaryotic chromatin structure, including well-defined nucleosome positioning at the TSS and regularly spaced nucleosome arrays (Schones et al. 2008; Yuan et al. 2005).
Regarding the reviewer’s question on +1 nucleosome dynamics. Our data agrees with the reviewer and other studies (e.g. PMID: 31694866), that the +1 nucleosome position is robust and does not correlate with gene expression strength. In the manuscript we show that dynamic nucleosomes are preferentially detected at the –1 nucleosome position (Figure 2C). In line with that we show that the +1 nucleosome position does not markedly change during transcription initiation of a subset of late transcribed genes (Figure 5A). However, we observe an opening of the NDR and within the gene body increased fuzziness and decreased nucleosome array regularity (Figure S4A). To illustrate the relationship between the +1 nucleosome positioning and expression strength, we have included a heatmap showing nucleosome occupancy at the TSS, ordered according to expression strength (NEW Figure S4C):
We included a sentence describing the relationship of +1 nucleosome position with gene expression in L257-L258: Furthermore, the +1 nucleosome positioning is unaffected by the strength of gene expression (Figure S2C).
__ Lack of Quality Control in the Pipeline __
The authors claim (lines 152-153) that QC is performed at every stage, but this is not supported by the implementation. On the GitHub page (GitHub - uschwartz/nucDetective), QC steps are only marked at the Profiler stage using standard tools (FastQC, MultiQC). The Inspector stage, which is crucial for validating nucleosome detection, lacks QC entirely. The authors should implement additional steps to assess the quality of nucleosome calls. For example, how are false positives managed? ROC curves should be used to evaluate true positive vs. false positive rates when defining dynamic nucleosomes. How sequencing biases are adressed?
The workflow overview chart on GitHub was not properly color coded. Therefore, we changed the graphics and highlighted the QC steps in the overview charts accordingly:
Based on our long standing expertise of analysing MNase-seq data (PMID: 38959309, PMID: 37641864, PMID: 30496478, PMID: 25608606), the best quality metrics to assess the performance of the challenging MNase experiment are the fragment size distributions revealing the typical nucleosomal DNA lengths and the TSS plots showing a positioned +1 nucleosome and regularly phased nucleosome arrays downstream of the +1 nucleosome. Additionally, visual inspection of the nucleosome profiles in a genome browser is advisable. We make those quality metrics easily available in the nucDetective Profiler workflow (Insertsize Histogram, TSS plot and provide nucleosome profile bigwig files). Furthermore, the PC and correlation analysis based on the nucleosome occupancy in the inspector workflow allows to evaluate replicate reproducibility or integrity of time series data, as shown for data evaluated in this manuscript.
The inspector workflow uses the well-established DANPOS toolkit to call nucleosome positions. Based on our experience, this step is particularly robust and well-established in the DANPOS toolkit (PMID: 23193179), so there is no need to reinvent it. Nevertheless, appropriate pre-processing of the data as done in the nucDetective pipeline is crucial to obtain highly resolved nucleosome positions. Using the final nucleosome profiles (bigwig) and the nucleosome reference positions (bed) as output of the Inspector workflow allows visual inspection of the called nucleosomes in a genome viewer. Furthermore, to avoid using false positive nucleosome positions for dynamic nucleosome analysis, we take only the 20% best positioned nucleosomes of each sample, as determined by the fuzziness score.
We understand the value of a gold standard of dynamic nucleosomes to test performance using ROC curves. However, we are not aware that such a gold standard exists in the nucleosome analysis field, especially not when using multi-sample settings, such as time series data. One alternative would be to use simulated data; however, this has several limitations:
- __Lack of biological complexity: __simulated data often fails to capture the full complexity of biological systems including the heterogeneity, variability, and subtle dependencies present in real-world data. Simplifications and omissions in simulation models can result in test datasets that are more tractable but less realistic, causing software to appear robust or accurate under idealized conditions, while underperforming on actual experimental data.
- __Risks of Overfitting: __Software may be tuned to perform well on simulated datasets leading to overfitting and falsely inflated performance metrics. This undermines the predictive or diagnostic value of the results for real biological data
-
Poor Model Fidelity and Hidden Assumptions: The authenticity of simulated data is bounded by the fidelity of the underlying models. If those models are inaccurate or make untested assumptions, the generated data may not reflect real experimental or clinical scenarios. This can mask software shortcomings or bias validation toward specific, perhaps irrelevant, scenarios. Therefore, we decided to validate the performance of the pipeline in the biological context of the analyzed data:
-
PCA analysis of the individual nucleosome features shows a cyclic structure as expected for the IDC (Fig. 1D-G).
- Nucleosome occupancy changes anti-correlate with chromatin accessibility (Fig. 3B) as expected.
- Dynamic nucleosome features correlate with expression changes (Fig. 5C) We are aware that MNase-seq experiments might have sequence bias caused by the enzyme's endonuclease sequence preference (PMID: 30496478). However, the main aim of the nucDetective pipeline is to identify dynamic nucleosome features genome wide. Therefore, we are comparing the nucleosome features across multiple samples to find the positions in the genome with the highest variability. Comparisons are performed between the same nucleosome positions at the same genomic sites across multiple conditions, so the sequence context is constant and does not confound the analysis. This is like the differential expression analysis of RNA-seq data, where the gene counts are not normalized by gene length. Introducing a sequence normalization step might distort and bias the results of dynamic nucleosomes.
We included a paragraph describing the limitations to the discussion (L447-457):
Depending on the degree of MNase digestion, preferentially nucleosomes from GC rich regions are revealed in MNase-seq experiments (Schwartz et al. 2019). However, no sequence or gDNA normalisation step was included in the nucDetective pipeline. To identify dynamic nucleosomes, comparisons are performed between the same nucleosome positions at the same genomic sites across multiple samples. Hence, the sequence context is constant and does not confound the analysis. Introducing a sequence normalization step might even distort and bias the results. Nevertheless, it is highly advisable to use low MNase concentrations in chromatin digestions to reduce the sequence bias in nucleosome extractions. This turned out to be a crucial condition to obtain a homogenous nucleosome distribution in the AT-rich intergenic regions of eukaryotic genomes and especially in the AT-rich genome of Pf (Schwartz et al. 2019, Kensche et al. 2016).
__ Use of Mono-nucleosomes Only __
The authors re-analyze the Kensche et al. (2016) dataset using only mono-nucleosomes and claim improved nucleosome profiles, including identification of tandem arrays previously unreported in P. falciparum. Two key issues arise: 1. Is the apparent improvement due simply to focusing on mono-nucleosomes (as implied in lines 342-346)?
The default setting in nucDetective is to use fragment sizes of 140 – 200 bp, which corresponds to the main mono-nucleosome fraction in standard MNase-seq experiments. However, the correct selection of fragment sizes may vary depending on the organism and the variations in MNase-seq protocols. Therefore, the pipeline offers the option of changing the cutoff parameter (--minLen; --maxLen), accordingly. Kensche et al thoroughly tested and established the best parameters for the data set. We agree with their selected parameters and used the same cutoffs (75-175 bp) in this manuscript. For this particular data set, the fragment size selection is not the reason why we obtain a better resolution. MNase-seq analysis is a multistep process which is optimized in the nucDetective pipeline. Differences in the analysis to Kensche et al are at the pre-processing stage and alignment step:
Kensche et al. : “Paired-end reads were clipped to 72 bp and all data was mapped with BWA sample (Version 0.6.2-r126)”
nucDetective:
- Trimming using TrimGalore --paired -q 10 --stringency 2
- Mapping using bowtie2 --very-sensitive –dovetail --no-discordant
- MAPQ >= 20 filtering of aligned read-pairs (samtools). The manuscript text L379 was changed to
This is achieved using MNase-seq optimized alignment settings, and proper selection of the fragment sizes corresponding to mono-nucleosomal DNA to obtain high resolution nucleosome profiles.
How does the pipeline perform with di- or tri-nucleosomes, which are also biologically relevant (Kensche et al., 2016 and others)? Furthermore, the limitation to mono-nucleosomes is only mentioned in the methods, not in the results or discussion, which could mislead readers.
The pipeline is optimized for mono-nucleosome analysis. However, the cutoffs for fragment size selection can be adjusted to analyse other fragment populations in MNase-seq data (--minLen; --maxLen). For example we know from previous studies that the settings in the pipeline could be used for sub-nucleosome analysis as well (PMID: 38959309). Di- or Tri-nucleosome analysis we have not explicitly tested. However, in a previous study (PMID: 30496478) we observed that the inherited MNase sequence bias is more pronounced in di-nucleosomes, which are preferentially isolated from GC-rich regions. This is in line with the depletion of di-nucleosomes in AT-rich intergenic regions in Pf, as was already described by Kensche et al.
Changes to the manuscript text: We included a paragraph describing the limitations to the discussion (L428-434):
The nucDetective pipeline has been optimized for the analysis of mono-nucleosomes. However, the selection of fragment sizes can be adjusted manually, enabling the pipeline to be used for other nucleosome categories. The pipeline is suitable to map and annotate sub-nucleosomal particles (
__ Reference Nucleosome Numbers __
The authors identify 49,999 reference nucleosome positions. How does this compare to previous analyses of similar datasets? This should be explicitly addressed.
We thank the reviewer for this suggestion. In order to put our results in perspective, it is important to distinguish between reference nucleosome positions (what we reported in the manuscript) and all detectable nucleosomes. The reference positions are our attempt to build a set of nucleosome positions with strong evidence, allowing confident further analysis across timepoints. The selection of a well positioned subset of nucleosomes for downstream analysis has been done previously (PMID: 26578577) and the merging algorithm we used across timepoints is also used by DANPOS to decide if a MNase-Seq peak is a new nucleosome position or belongs to an existing position (PMID: 23193179).
To be able to address the reviewer suggestion we prepared and added a table to the supplementary data, including the total number of all nucleosomes detected by our pipeline at each timepoint. We adjusted the results to the following (L223-226):
“The pipeline identified a total of 127370 ± 1151 (mean ± SD) nucleosomes at each timepoint (Supplementary Data X). To exclude false positive positions in our analysis, we conservatively selected 49,999 reference nucleosome positions, representing sites with a well-positioned nucleosome at least at one time point (see Methods). Among these 1192 nucleosomes exhibited […]”
Several groups reported nucleosome positioning data for P. falciparum (PMID: 20015349, PMID: 20054063, PMID: 24885191, PMID: 26578577), however only Ponts et al (2010) reported resolved numbers (~45000-90000 nucleosomes depending in development stage) and Bunnik et al reported ~ 75000 nucleosomes in a graph. Although we do not know the reason of why the other studies did not include specific numbers, we speculate that the data quality did not allow them to confidently report a number. In fact, nucleosomal reads are severely depleted in AT-rich intergenic regions in the Ponts and Bunnik datasets. In contrast, Kensche et al (and our analysis) shows that nucleosomes can be identified throughout the genome of Pf. Therefore, the nucleosome numbers reported by Ponts et al and Bunnik et al are very likely underestimated.
We included the following text in the discussion, addressing previously published datasets (L404 – 405):
“For example, our pipeline was able to identify a total of ~127,000 nucleosomes per timepoint (=5.4 per kb) in range with observed nucleosome densities in other eukaryotes (typically 5 to 6 per kb). From these, we extracted 49,999 reference nucleosome positions with strong positioning evidence across all timepoints, which we used to characterize nucleosome dynamics of Pf longitudinally. Previous studies of P. falciparum chromatin organization, did not report a total number of nucleosomes (Westenberger et al. 2009, Kensche et al. 2016), or estimated approximately ~45000-90000 nucleosomes across the genome at different developmental stages (Bunnik et al. 2014, Ponts et al. 2010). However, this value likely represents an underestimation due to the depletion of nucleosomal reads in AT-rich intergenic regions observed in their datasets.”
__ Figure 1B and Nucleosome Spacing __
The authors claim that Figure 1B shows developmental stage-specific variation in nucleosome spacing. However, only T35 shows a visible upstream change at position 0. In A4, A6, and A8 (Figure S4), no major change is apparent. Statistical tests are needed to validate whether the observed differences are significant and should be described in the figure legends and main text.
We would like to thank the reviewer for bringing this issue to our attention. We apologize for an error we made, wrongly labelling the figure numbers. The differences in nucleosome spacing across time are visible in Figure 1C. Figure 1B shows the precise array structure of the Pf nucleosomes, when centered on the +1 nucleosome, and is mentioned before. The mistake is now corrected.
In Figure 1C the mean NRL and 95% confidence interval are depicted, allowing a visual assessment of data significance (non-overlapping 95% CI-Intervals correspond to p Taken together we corrected this mistake and edited the text as follows (L194 – 199):
“With this +1 nucleosome annotation, regularly spaced nucleosome arrays downstream of the TSS were detected, revealing a precise nucleosome organization in Pf (Figure 1B). Due to the high resolution maps of nucleosomes we can now observe significantvariations in nucleosome spacing depending on the developmental stage (Figure 1C, ANOVA on bootstrapped values (3 per timepoint) F₇,₇₂ = 35.10, p
__ Genome-wide Occupancy Claims __
The claim that nucleosomes are "evenly distributed throughout the genome" (Figure S2A) is questionable. Chromosomes 3 and 11 show strong peaks mid-chromosome, and chromosome 14 shows little to no signal at the ends. This should be discussed. Subtelomeric regions, such as those containing var genes, are known to have unique chromatin features. For instance, Lopez-Rubio et al. (2009) show that subtelomeric regions are enriched for H3K9me3 and HP1, correlating with gene silencing. Should these regions not display different nucleosome distributions? Do you expect the Plasmodium genome (or any genome) to have uniform nucleosome distribution?
On global scale (> 10 kb) we would expect a homogenous distribution of nucleosomes genome wide, regardless of euchromatin or heterochromatin. We have shown this in a previous study for human cells (PMID: 30496478), which was later confirmed for drosophila melongaster (PMID: 31519205,PMID: 30496478) and yeast (PMID: 39587299).
However, Figure S2A shows the distribution of the dynamic nucleosome features during the IDC, called with our pipeline. We agree with the reviewer, that there are a few exceptions of the uniform distribution, which we address now in the manuscript.
Furthermore, we agree with the reviewer that the H3K9me3 / HP1 subtelomeric regions are special. Those regions are depleted of dynamic nucleosomes in the IDC as shown in Fig. 2D and now mentioned in L280 - L282.
We included an additional genome browser snapshot in Supplemental Figure S2B and changed the text accordingly (L245-249):
We observed a few exceptions to the even distribution of the nucleosomes in the center of chromosome 3, 11 and 12, where nucleosome occupancy changes accumulated at centromeric regions (Figure S2B). Furthermore, the ends of the chromosomes are rather depleted of dynamic nucleosome features.
Genome browser snapshot illustrating accumulation of nucleosome occupancy changes at a centromeric site. Centered nucleosome coverage tracks (T5-T40 colored coverage tracks), nucleosomes occupancy changes (yellow bar) and annotated centromers (grey bar) taken from (Hoeijmakers et al., 2012)
Dependence on DANPOS
The authors criticize the DANPOS pipeline for its limitations but use it extensively within nucDetective. This contradiction confuses the reader. Is nucDetective an original pipeline, or a wrapper built on existing tools?
One unique feature of the nucDetective pipeline is to identify dynamic nucleosomes (occupancy, fuzziness, regularity, shifts) in complex experimental designs, such as time series data (Inspector workflow). To our knowledge, there is no other tool for MNase-seq data which allows multi-condition/time-series comparisons (PMID: 35061087). For example, DANPOS allows only pair-wise comparisons, which cannot be used for time-series data. For the analysis of dynamic nucleosome features we require nucleosome profiles and positions at high resolution. For this purpose, several tools do already exist (PMID: 35061087). However, researchers without experience in MNase-seq analysis often find the plethora of available tools overwhelming, which makes it challenging to select the most appropriate ones. Here we share our experience and provide the user an automated workflow (Profiler), which builds on existing tools.
In summary the Profiler workflow is a wrapper built on existing tools and the Inspector workflow is partly a wrapper (uses DANPOS to normalize nucleosome profiles and call nucleosome positions) and implements our original algorithm to detect dynamic nucleosome features in multiple conditions / time-series data.
__ Control Data Usage __
The authors should clarify whether gDNA controls were used throughout the analysis, as done in Kensche et al. (2016). Currently, this is mentioned only in the figure legend for Figure 5, not in the methods or results.
We used the gDNA normalisation to optimize the visualization of the nucleosome depleted region upstream of the TSS in Fig 5A. Otherwise, we did not normalize the data by the gDNA control. The reason is the same as we did not include sequence normalization in the pipeline (see comment above)
We included a paragraph describing the limitations to the discussion (L447-457):
Depending on the degree of MNase digestion, preferentially nucleosomes from GC rich regions are revealed in MNase-seq experiments (Schwartz et al. 2019). However, no sequence or gDNA normalisation step was included in the nucDetective pipeline. To identify dynamic nucleosomes, comparisons are performed between the same nucleosome positions at the same genomic sites across multiple samples. Hence, the sequence context is constant and does not confound the analysis. Introducing a sequence normalization step might even distort and bias the results. Nevertheless, it is highly advisable to use low MNase concentrations in chromatin digestions to reduce the sequence bias in nucleosome extractions. This turned out to be a crucial condition to obtain a homogenous nucleosome distribution in the AT-rich intergenic regions of eukaryotic genomes and especially in the AT-rich genome of Pf (Schwartz et al. 2019, Kensche et al. 2016).
We added following statement to the methods part: Additionally, the TSS profile shown in Figure 5A was normalized by the gDNA control for better NDR visualization.
__ Lack of Statistical Power for Time-Series Analyses __
Although the pipeline is presented as suitable for time-series data, it lacks statistical tools to determine whether differences in nucleosome positioning or fuzziness are significant across conditions. Visual interpretation alone is insufficient. Statistical support is essential for any differential analysis.
We understand the value of statistical support in such an analysis. However, in biology we often face the limitations in terms of the appropriate sample sizes needed to accurately estimate the variance parameters required for statistical modeling. As MNase-seq experiments require a large amount of input material and high sequencing depth, the number of samples in most experiments is low, often with only two replicates (PMID: 23193179). Therefore, we decided that the nucDetective pipeline should be rather handled as a screening method to identify nucleosome features with high variance across all conditions. This prevents misuse of p-values. A common misinterpretation we observed is the use of non-significant p-values to conclude that no biological change exists, despite inadequate statistical power to detect such changes. We included a paragraph in the limitations section discussing the limitations of statistical analysis of MNase-Seq data.
Changes to the manuscript text: We included a paragraph describing the limitations to the discussion (L435-446).
As MNase-seq experiments require a large amount of input material and high sequencing depths, most published MNase-seq experiments do not provide the appropriate sample sizes required to accurately estimate the variance parameters necessary for statistical modelling (Chen et al. 2013). Therefore, dynamic nucleosomes are not identified through statistical testing but rather by ranking nucleosome features according to their variance across all samples and applying a variance threshold to distinguish them. This concept is well established to identify super-enhancers (Whyte et al. 2013). In this study we set the variance cutoff to a slope of 3, resulting in a high data confidence. However, other data sets might require further adjustment of the variance cutoff, depending on data quality or sequencing depth. The nucDetective identification of dynamic nucleosomes can be seen as a screening approach to provide a holistic overview of nucleosome dynamics in the system, which provides a basis for further research.
Reproducibility of Methods
The Methods section is not sufficient to reproduce the results. The GitHub repository lacks the necessary code to generate the paper's figures and focuses on an exemplary yeast dataset. The authors should either: o Update the repository with relevant scripts and examples, o Clearly state the repository's purpose, or o Remove the link entirely. Readers must understand that nucDetective is dedicated to assessing nucleosome fuzziness, occupancy, shift, and regularity dynamics-not downstream analyses presented in the paper.
We thank the reviewer for this helpful comment. In addition to the main nucDetective repository, a second GitHub link is provided in the Data Availability section, which contains the scripts used to generate the figures presented in the paper. This separation was intentional to distinguish the general-purpose nucDetective tool from the project-specific analyses performed for this study. We acknowledge that this may not have been sufficiently clear.
To have all resources available at a single citable permanent location we included a link to the corresponding Zenodo repository (https://doi.org/10.5281/zenodo.16779899) in the Data and materials availability statement.
The Zenodo repository contains:
Code (scripts.zip) and annotation of Plasmodium falciparum (Annotation.zip) to reproduce the nucDetective v1.1 (nucDetective-1.1.zip) analysis as done in the research manuscript entitled "Deciphering chromatin architecture and dynamics in Plasmodium falciparum using the nucDetective pipeline".
The folder "output_nucDetective" conains the complete output of the nucDetective analysis pipeline as generated by the "01_nucDetective_profiler.sh" and "02_nucDetective_inspector.sh" scripts.
Nucleosome coverage tracks, annotation of nucleosome positions and dynamic nucleosomes are deposited additonally in the folder "Pf_nucleosome_annotation_of_nucDetective".
To make this clearer we added following text to Material and Methods in ”The nucDetective pipeline” section:
Changes in the manuscript text (L518-519):
The code, software and annotations used to run the nucDetective pipeline along with the output have been deposited on Zenodo (https://doi.org/10.5281/zenodo.16779899).
__ Supplementary Tables __
Including supplementary tables showing pipeline outputs (e.g., nucleosome scores, heatmaps, TSS extraction) would help readers understand the input-output structure and support figure interpretations.
See comments above.
We included a link to the corresponding Zenodo repository (https://doi.org/10.5281/zenodo.16779899) in the Data and materials availability statement.
The repository contains:
Code (scripts.zip) and annotation of Plasmodium falciparum (Annotation.zip) to reproduce the nucDetective v1.1 (nucDetective-1.1.zip) analysis as done in the research manuscript entitled "Deciphering chromatin architecture and dynamics in Plasmodium falciparum using the nucDetective pipeline".
The folder "output_nucDetective" conains the complete output of the nucDetective analysis pipeline as generated by the "01_nucDetective_profiler.sh" and "02_nucDetective_inspector.sh" scripts.
Minor Comments:
The authors should moderate claims such as "no studies have reported a well-positioned +1 nucleosome" in P. falciparum, as this contradicts existing literature. Similarly, avoid statements like "poorly understood chromatin architecture of Pf," which undervalue extensive prior work (e.g., discovery of histone lactylation in Plasmodium, Merrick et al., 2023).
We would like to clarify that we neither wrote that ““no studies have reported a well-positioned +1 nucleosome”” in P. falciparum nor did we intend to imply such thing. However, we acknowledge that our original wording may have been unclear. To address this, we have revised the manuscript to explicitly acknowledge prior studies on chromatin organization and highlight our contribution.
In the Abstract L26-L30: Contrary to the current view of irregular chromatin, we demonstrate for the first time regular phased nucleosome arrays downstream of TSSs, which, together with the established +1 nucleosome and upstream nucleosome-depleted region, reveal a complete canonical eukaryotic promoter architecture in Pf.
Introduction L156-L159: For example, we identify a phased nucleosome array downstream of the TSS. Together with a well-positioned +1 nucleosome and an upstream nucleosome-free region. These findings support a promoter architecture in Pf that resembles classical eukaryotic promoters (Bunnik et al. 2014, Kensche et al. 2016).
Results L180-L183: These new Pf nucleosome maps reveal a nucleosome organisation at transcription start sites (TSS) reminiscent of the general eukaryotic chromatin structure, featuring a reported well-positioned +1 nucleosome , an upstream nucleosome-free region (NFR, Bunnik et al. 2014, Kensche et al. 2016), and shown for the first time in Pf, a phased nucleosome array downstream of the TSS.
Discussion L412-L421: Previous analyses of Pf chromatin have identified +1 nucleosomes and NFRs (Bunnik et al 2014, Kensche et al. 2016). Here we extend this understanding by demonstrating phased nucleosome array structures throughout the genome. This finding provides evidence for a spatial regulation of nucleosome positioning in Pf, challenging the notion that nucleosome positioning is relatively random in gene bodies (Bunnik et al. 2014, Kensche et al. 2016). Consequently our results contribute to the understanding that Pf exhibits a typical eukaryotic chromatin structure, including well-defined nucleosome positioning at the TSS and regularly spaced nucleosome arrays (Schones et al. 2008; Yuan et al. 2005).
The phrase “poorly understood chromatin architecture” has been modified to “underexplored chromatin architecture” in order to more accurately reflect the potential for further analyses and contributions to the field, while avoiding any potential misinterpretation of an attempt to undervalue previous work.
Track labels in figures (e.g., Figure 5B) are too small to be legible.
We made the labels bigger.
Several figures (e.g., Figure 5B, S4B) lack statistical significance tests. Are the differences marked with stars statistically significant or just visually different?
We added statistics to S4B.
Differences in 5B were identified by visual inspection. To clarify this, we exchanged the asterisks to arrows in Fig.5B and changed the text in the legend:
Arrows mark descriptive visual differences in nucleosome occupancy.
Figure S3 includes a small black line on top of the table. Is this an accidental crop?
We checked the figure carefully; however, the black line does not appear in our PDF viewer or on the printed paper
The authors should state the weaknesses and limitations of this pipeline.
We added a limitation section in discussion, see comments above
Reviewer #1 (Significance (Required)):
The proposed pipeline is useful and timely. It can benefit research groups willing to analyse MNase-Seq data of complex genomes such as P. falciparum. The tool requires users to have extensive experience in coding as the authors didn't include any clear and explicit codes on how to start processing the data from raw files. Nevertheless, there are multiple tool that can detect nucleosome occupancy and that are not cited by the authors not mention. I have included for the authors a link where a large list of tools for analysis of nucleosome positioning experiments tools/pipelines were developed for (Software to analyse nucleosome positioning experiments - Gene Regulation - Teif Lab). I think it would be useful for the authors to direct the reference this.
We appreciate the reviewer’s valuable suggestion. We included a citation to the comprehensive database of nucleosome analysis tools curated by the Teif lab (Shtumpf et al., 2022). We chose to reference only selected tools in addition to this resource rather than listing all individual tools to maintain clarity and avoid overloading the manuscript with numerous citations.
Despite valid, I still believe that controlling their pipeline by filtering out false positives and including more QC steps at the Inspector stage is strongly needed. That would boost the significance of this pipeline.
We thank the reviewer for the assessment of our study and for recognizing that our MNase-seq analysis pipeline nucDetective can be a useful tool for the chromatin community utilizing MNase-Seq in complex settings.
Reviewer #2 (Evidence, reproducibility and clarity (Required)):
In this manuscript, Holzinger and colleagues have developed a new pipeline to assess chromatin organization in linear space and time. They used this pipeline to reevaluate nucleosome organization in the malaria parasite, P. falciparum. Their analysis revealed typical arrangement of nucleosomes around the transcriptional start site. Furthermore, it further strengthened and refined the connection between specific nucleosome dynamics and epigenetic marks, transcription factor binding sites or transcriptional activity.
Major comments
- I am wondering what is the main selling point of this manuscript is. If it is the development of the nucDetective pipeline, perhaps it would be best to first benchmark it and directly compare it to existing tools on a dataset where nucleosome fussiness, shifting and regularity has been analyzed before. If on the other hand, new insights into Plasmodium chromatin biology is the primary target validation of some of the novel findings would be advantageous (e.g. refinement of TSS positions, relevance of novel motifs, etc).
NucDetective presents a novel pipeline to identify dynamic nucleosome properties within different datasets, like time series or developmental stages, as analysed for the erythrocytic cycle in this manuscript. As such kind of a pipeline, allowing direct comparisons, does not exist for MNase-Seq data, we used the existing analysis and high quality dataset of Kensche et al., to visualize the strong improvements of this kind of analysis. Accordingly, we combined the pipeline development and the reasearch of chromatin structure analysis, being able to showcase the utility of this new pipeline.
- The authors identify a strong positioning of +1 nucleosome by searching for a positioned nucleosomes in the vicinity of the assigned TSS. Given the ill-defined nature of TSSs, this approach sounds logic at first glance. However, given the rather broad search space from -100 till +300bp, I am wondering whether it is a sort of "self-fulfilling prophecy". Conversely, it would be good to validate that this approach indeed helps to refine TSS positions.
We thank the reviewer for raising this important point. We would like to clarify that we do not claim to redefine or precisely determine TSS positions in our study. Instead, we use annotated TSS coordinates as a reference to identify nucleosomes that correspond to the +1 nucleosome, based on their proximity to the TSS.
We selected the search window from -100 to +300 bp to account for known variability in Pf TSS annotation. For example, dominant transcription start sites identified by 5'UTR-seq tag clusters can differ by several hundred base pairs within a single time point (Chappell et al., 2020). The broad window thus allows us to capture the principal nucleosome positions near a TSS, even when the TSS itself is imprecise or heterogeneous. Based on the TSS centered plots (Figure 2C and Figure S1B), we reasoned that a window of -100 to +300 is sufficient to capture the majority of the +1 nucleosomes, which would have been missed by using smaller window sizes. This strategy aligns with well-established conventions in yeast chromatin biology, where the +1 nucleosome is defined relative to the TSS (Jiang and Pugh, 2009; Zhang et al. 2011) and commonly used as an anchor point to visualize downstream phased nucleosome arrays and upstream nucleosome-depleted regions (Rossi et al., 2021; Oberbeckmann et al., 2019; Krietenstein et al., 2016 and many more). Accordingly, our approach leverages these accepted standards to interpret nucleosome positioning without re-defining TSS annotations.
- Figure 1C: I am wondering how should the reader interpret the changes in nucleosomal repeat length changes throughout the cycle. Is linker DNA on average 10 nucleotides shorter at T30 compared to T5 timepoint? If so how could such "dramatic reorganization" be achieved at the molecular level in absence of a known linker DNA-binding protein. More importantly is this observation supported by additional evidence (e.g. dinucleosomal fragment length) or could it be due to slightly different digestion of the chromatin at the different stages or other technical variables?
We thank the reviewer for this insightful question regarding the interpretation of NRL changes across the cell cycle. The reviewer is right in her or his interpretation – linker DNA is on average ~10 bp shorter at T30 than at T5.
To address concerns about additional evidence and potential MNase digestion variability, we now analyzed MNase-seq fragment sizes by shifting mononucleosome peaks of each time point to the canonical 147 bp length, to correct for MNase digestion differences. After this normalisation, dinucleosome fragment length distributions revealed the shortest linker lengths at T30 and T35, whereas T5 and T10 showed longer DNA linkers. These results confirm our previous NRL measurements based on mononucleosomal read distances while controlling for MNase digestion bias.
The molecular basis of this reorganization, is still unclear. While linker histone H1 is considered absent in Plasmodium falciparum, presence of an uncharacterized linker DNA–binding protein or alternative factors fulfilling a similar role can not be excluded (Gill et al. 2010). However, H1 absence across all developmental stages, fails to explain stage-specific chromatin changes. We hypothesize that Apicomplexans evolved specialized chromatin remodelers to compensate for the missing H1, which may also drive the dynamic NRL changes observed. The low NRL coincides with high transcriptional activity in Pf during trophozoite stage is consistent with previous reports linking elevated transcription to reduced NRL in other eukaryotes (Baldi et al. 2018). In addition, the schizont stage involves multiple rounds of DNA replication requiring large histone supplies being produced during that time. It may well be that a high level of histone synthesis and DNA amplification, results in a short time period with increased nucleosome density and shorter NRL, until the system reaches again equilibrium (Beshnova et al. 2014). Although speculative we suggest a model wherein increased transcription promotes elevated nucleosome turnover and re-assembly by specialized remodeling enzymes, combined with high abundance of histones, resulting in higher nucleosome density and decreased NRL. Unfortunately, absolute quantification of nucleosome levels from this MNase-seq dataset is not possible without spike-in controls, which makes it infeasible to test the hypothesis with the available data set (Chen et al. 2016).
Minor comments
- I am wondering whether fuzziness and occupancy changes are truly independent categories. I am asking as both could lead to reduction of the signal at the nucleosome dyad and because they show markedly similar distribution in relation to the TSS and associate with identical epigenetic features (Figure 2B-D). Figure 2A indicates minimal overlap between them, but this could be due to the fact that the criteria to define these subtypes is defined such to place nucleosomes to one or the other category, but at the end they represent two flavors of the same thing.
Indeed, changes in occupancy and fuzziness can appear related because both features may reduce signal intensity at the nucleosome dyad and both are connected to “poor nucleosome positioning”. However, their definitions and measurements are clearly distinct and technically independent. Occupancy reflects the peak height at the nucleosome dyad, while fuzziness quantifies the spread of reads around the peak, measured as the standard deviation of read positions within each nucleosome peak (Jiang and Pugh, 2009; Chen et al., 2013). Although a reduction in occupancy can contribute to increased fuzziness by diminishing the dyad axis signal, fuzziness primarily arises from increased variability in the flanking regions around the nucleosome position center. While this distinction is established in the field, it is also often confused by the concept of well (high occupancy, low fuzziness) and poorly (high fuzziness, low occupancy) positioned nucleosomes, where both of these features are considered.
- Do the authors detect spatial relationship between fuzzy and repositioned/evicted nucleosomes at the level of individual nucleosomes pairs. With other words, can fuzziness be the consequence of repositioning/eviction of the neighboring nucleosome?
In Figure 2A we analyse the spatial overlap of all features to each other. The analysis clearly shows that fuzziness, occupancy changes and position changes occur mostly at distinct spatial sites (overlaps between 3 and 10%, Fig. 2A). Therefore, we suggest that the features correspond to independent processes. Likewise, we do observe an overlap between occupancy and ATAC-seq peaks, but not nucleosome positioning shifts, clearly discriminating different processes.
- Figure 4: enrichment values and measure of statistical significance for the different motifs are missing. Also have there been any other motifs identified.
This information is present in Supplemental Figure S3. Here we show the top 3 hits in each cluster. In the figure legend of Figure 4 we reference to Fig. S3:
L1054 –1055:
“Additional enriched motifs along with the significance of motif enrichment and the fraction of motifs at the respective nucleosome positions are shown in Figure S3”
- The M&M would benefit from some more details, e.g. settings in the piepline, or which fragment sizes were used to map the MNase-seq data?
We included a link to the corresponding Zenodo repository (https://doi.org/10.5281/zenodo.16779899) in the Data and materials availability statement.
The repository contains:
Code (scripts.zip) and annotation of Plasmodium falciparum (Annotation.zip) to reproduce the nucDetective v1.1 (nucDetective-1.1.zip) analysis as done in the research manuscript entitled "Deciphering chromatin architecture and dynamics in Plasmodium falciparum using the nucDetective pipeline".
The folder "output_nucDetective" conains the complete output of the nucDetective analysis pipeline as generated by the "01_nucDetective_profiler.sh" and "02_nucDetective_inspector.sh" scripts.
Nucleosome coverage tracks, annotation of nucleosome positions and dynamic nucleosomes are deposited additonally in the folder "Pf_nucleosome_annotation_of_nucDetective".
To make this clearer we added following text to Material and Methods in ”The nucDetective pipeline” section:
Changes in the manuscript (L518-519):
The code, software and annotations used to run the nucDetective pipeline along with the output have been deposited on Zenodo (https://doi.org/10.5281/zenodo.16779899).
which fragment sizes were used to map the MNase-seq data?
The default setting in nucDetective is to use fragment sizes of 140 – 200 bp, which corresponds to the main mono-nucleosome fraction in standard MNase-seq experiments. However, the correct selection of fragment sizes may vary depending on the organism and the variations in MNase-seq protocols. Therefore, the pipeline offers the option of changing the cutoff parameter (--minLen; --maxLen), accordingly. Kensche et al thoroughly tested the best selection of the fragment sizes for the data set, which is used in this manuscript. We agree with their selection and used the same cutoffs (75-175 bp).
This is stated in line 535-536:
The fragments are further filtered to mono-nucleosome sized fragments (here we used 75 – 175 bp)
We changed the text:
The fragments are further filtered to mono-nucleosome sized fragments (default setting 140-200 bp; changed in this study to 75 – 175 bp)
We highlighted other parameters used in this study in the material and methods part.
Reviewer #2 (Significance (Required)):
Overall, the manuscript is well written and findings are clearly and elegantly presented. The manuscript describes a new pipeline to map and analyze MNase-seq data across different stages or conditions, though the broader applicability of the pipeline and advancements over existing tools could be better demonstrated. Importantly, the manuscript make use of this pipeline to provide a refined and likely more accurate view on (the dynamics of) nucleosome positioning over the AT-rich genome of P. falciparum. While these observations make sense they remain rather descriptive/associative and lack further experimental validation. Overall, this manuscript could be interest to both researchers working on chromatin biology and Plasmodium gene-regulation.
We thank the reviewer for the assessment of our study and for recognizing that the results of our MNase-seq analysis pipeline nucDetective contribute to a better understanding of Pf chromatin biology.
Reviewer #3 (Evidence, reproducibility and clarity (Required)):
The manuscript "Deciphering chromatin architecture and dynamics in Plasmodium 2 falciparum using the nucDetective pipeline" describes computational analysis of previously published data of P falciparum chromatin. This work corrects the prevailing view that this parasitic organism has an unusually disorganized chromatin organization, which had been attributed to its high genomic AT content, lack of histone H1, and ancient derivation. The authors show that instead P falciparum has a very typical chromatin organization. Part of the refinement is due to aligning data on +1 nucleosome positions instead of TSSs, which have been poorly mapped. The computational tools corral some useful features, for querying epigenomic structure that make visualization straightforward, especially for fuzzy nucleosomes.
Reviewer #3 (Significance (Required)):
As a computational package this is a nice presentation of fairly central questions. The assessment and display of fuzzy nucleosomes is a nice feature.
We thank the reviewer for the assessment of our study and are pleased that the reviewer acknowledges the value and usability of our pipeline.
-
-
www.youtube.com www.youtube.com
-
AWS is 10x slower than a dedicated server for the same price
- Video Title: AWS is 10x slower than a dedicated server for the same price
- Core Argument: Cloud providers, particularly AWS, charge significantly more for base-level compute instances than traditional Virtual Private Server (VPS) providers while delivering substantially less performance. The video argues that horizontal scaling is often unnecessary for 95% of businesses.
- Comparison Setup: The video compared an entry-level AWS instance (EC2 and ECS Fargate) with a similarly specced VPS (1 vCPU, 2 GB RAM) from a popular German provider (Hetzner, referred to as HTNA in the video) using the Sysbench tool.
- AWS EC2 Results: The base EC2 instance cost almost 3 times more than the VPS but delivered poor performance:
- CPU: Approximately 20% of the VPS performance.
- Memory: Only 7.74% of the VPS performance.
- AWS ECS Fargate Results: Using the "serverless" Fargate option, setup was complex and involved many AWS services (ECS, ECR, IAM).
- Cost: The instance was 6 times more expensive than the VPS.
- Performance: Performance improved over EC2 but was still slower and less consistent: 23% (CPU), 80% (Memory), and 84% (File I/O) of the VPS's performance, with fluctuations up to 18%.
- Cost Efficiency: A dedicated VPS server with 4vCPU and 16 GB of RAM was found to be cheaper than the 1 vCPU ECS Fargate task used in the test.
- Conclusion: For a similar price point, a dedicated server is about 10 times faster than an equivalent AWS cloud instance. The video concludes that AWS's dominance is due to its large marketing spend, not superior technical or cost efficiency. A real-world example cited is Lichess, which supports 5.2 million chess games per day on a single dedicated server [00:12:06].
Hacker News Discussion
The discussion was split between criticizing the video's methodology and debating the fundamental value proposition of hyperscale cloud providers versus traditional hosting.
- Criticism of Methodology: Several top comments argued the video was a "low effort 'ha ha AWS sucks' video" with an "AWFUL analysis." Critics suggested the author did not properly configure or understand ECS/Fargate and that comparing the lowest-end shared instances isn't a "proper comparison," which should involve mid-range hardware and careful configuration.
- The Value of AWS Services: Many users defended AWS by stating that customers rarely choose it just for the base EC2 instance price. The true value lies in the managed ecosystem of services like RDS, S3, EKS, ELB, and Cognito, which abstract away operational complexity and allow large customers to negotiate off-list pricing.
- Complexity and Cost Rebuttals: Counter-arguments highlighted that managing AWS complexity often requires hiring expensive "cloud wizards" (Solutions Architects or specialized DevOps staff), shifting the high cost of a SysAdmin team to high cloud management costs. Anecdotes about sudden huge AWS bills and complex debugging were common.
- The "Nobody Gets Fired" Factor: The most common justification for choosing AWS, even at a higher cost, is risk aversion and the avoidance of personal liability. If a core AWS region (like US-East-1) goes down, it's a shared industry failure, but if a self-hosted server fails, the admin is solely responsible for fixing it at 3 a.m.
- Alternative Recommendations: The discussion frequently validated the use of non-hyperscale providers like Hetzner and OVH for significant cost savings and comparable reliability for many non-"cloud native" workloads.
-
-
rocio-hernandez.quarto.pub rocio-hernandez.quarto.pub
-
J:={1,2,…,n},n∈N,n≥1, el conjunto finito y numerable de zonas afectadas o potenciales de demanda. C
lo mismo ... ya esta definido antes. Se deinie con claridad y completamente una vez y luego se hace referencia cruzada de la definición
-
-
-
-
bafybeib3do3xiseamt73aevyttzxzordc5gm6nnpndru7tvbm47pl4vhte.ipfs.dweb.link bafybeib3do3xiseamt73aevyttzxzordc5gm6nnpndru7tvbm47pl4vhte.ipfs.dweb.link
-
https://bafybeib3do3xiseamt73aevyttzxzordc5gm6nnpndru7tvbm47pl4vhte.ipfs.dweb.link?filename=index.html
-
-
bafybeib3do3xiseamt73aevyttzxzordc5gm6nnpndru7tvbm47pl4vhte.ipfs.dweb.link bafybeib3do3xiseamt73aevyttzxzordc5gm6nnpndru7tvbm47pl4vhte.ipfs.dweb.link
-
📰 IPFS based IndyWeb constellations
-
-
odp.library.tamu.edu odp.library.tamu.edu
-
oh! John, catch haud o’ him
Johnston keeps up a strict rhyme scheme throughout the poem - aabbccbb, etc. However, the speaker's somewhat fourth wall breaking exclamation here tips that rhyme scheme on its head. Blin', in the Scots dialect, is a near rhyme with the word him, though that rhyme is lost some in other accents. Beyond the loose rhyme here, the outburst also changes the otherwise even flow of the rhythm through the poem.
The thought of her child falling to the floor forces the speaker out of her careful patterns, highlighting the mother's love and care for her children.
-
-
bafybeicmejw5nhrq7pnsqmnmcstesusgobmrsn6pp367gfrfk6erdjpigy.ipfs.localhost:8080 bafybeicmejw5nhrq7pnsqmnmcstesusgobmrsn6pp367gfrfk6erdjpigy.ipfs.localhost:8080
-
/indy0/~/gyuri/anytype/
-
-
milenio-nudos.github.io milenio-nudos.github.iopaper2
-
2 Self-efficacy and Digital Technologies
me parece que esta sección está excesivamente detallada, debería ser un párrafo o a lo más dos.
-
Digital Self-efficacy
pero esto no es lo que ya aparecía arriba? o sea, no queda claro si lo de Ulfert-Blank es otro tipo de DSE?
-
-
link.springer.com link.springer.com
-
RRID: CVCL_0134
DOI: 10.1007/s13402-025-01104-2
Resource: (RRID:CVCL_0134)
Curator: @dhovakimyan1
SciCrunch record: RRID:CVCL_0134
-
-
Local file Local file
-
O Prince of the Faithful! the third is enough for me, givehim the two thirds!” This restored the caliph’s good temper, and, laughing heartily,he rewarded them both.4 bastinado: a form of torture that involves caning (beating with a cane) the bare soles of aperson’s feet.
This is a pretty goofy story which seems rather harmless to me. Sure there are stereotypes, but I feel like this is an almost timeless type of story where locale is irrelevant. If you told me this same story but set it in England or France or anywhere in Europe in the 8th century I would not notice and I doubt anyone would. All that would need to be changed is the people's names and the name of the Tigris.
-
-
openurl.ebsco.com openurl.ebsco.com
-
o convey ideas effectivelyin a language, one must master both productive skills and receptive skills. 5 Importantly, insituations of endangerment, cultural knowledge may be less available than it had been inprevious generations and therefore should be explicitly taught.
Good communication needs speaking and understanding skills, and cultural knowledge should be taught directly.
-
-
www.google.com www.google.com
-
n 1983, at the age of twenty-one, Michael Johnson 1 had a deadly confrontation with a drug dealer and was convicted of second-degree murder and sentenced to fifteen-years-to-life. He spent the next twenty-eight years in California prisons. While incarcerated, Johnson earned his drug counselor certification through an offender-mentor certification program. He cofounded a program that tutors offenders to take their General Education Development high school equivalency test. He also became a licensed x-ray technician and was a team coordinator for California’s Alter- natives to Violence Project. After release, Johnson earned a bachelor’s degree in psychology, graduating summa cum laude. He is an alcohol and drug counselor in two different California counties and a lead facilitator for an Alternatives to Violence Project in his home town. Johnson’s efforts were recently recognized by His Holiness the Dalai Lama. Johnson is well remembered by those remaining within the walls of the prison; his life continues to shine as a beacon of hope to those who knew him. ‘‘I have been helped greatly by the kindness of others,’’ Johnson remembers. ‘‘I was shown unconditional love and com- passion. I want to pass that on to everyone I meet.’’ Vincent Morales was sentenced to fifteen years in prison. As he came closer to his release date, he realized he needed skills in order to support his family. He chose a woodworking arts program, where he developed carpentry skills with an emphasis on crafting guitars. Upon release, he taught his son and brother his artistry. Over a period of years, they developed a family business where Morales and his son now build high- end guitars for famous artists. BOOM: The Journal of California, Vol. 6, Number 2, pps 52–56, ISSN 2153-8018, electronic ISSN 2153-764X. © 2016 by The Regents of the University of California. All rights reserved. Please direct all requests for permission to photocopy or reproduce article content through the University of California Press’s Reprints and Permissions web page, http://www.ucpress.edu/journals.php?p¼reprints. DOI: 10.1525/boom.2016.6.2.52. 52 B O O M C A L I F O R N I A . C O M Justine Sultano struggled with substance abuse for a long time, eventually committing a crime and receiving a five-year prison sentence. While in prison, she took advantage of the rehabilitative services offered by the California Department of Corrections and Rehabilitation (CDCR), participated in self- help groups, received substance-use disorder treatment, and pursued academic and career technical education programs. While in prison, Justine mastered software programs such as Microsoft Word, Excel, and PowerPoint. Upon her release, she entered a rehabilitation facility in San Francisco, where she learned how to send emails, create a re´sume´, and search for a job. After eighteen months, Justine found a desk-clerk position at a local business. After leaving the rehabilitation facility, she enrolled in a prison-run program that provided transitional housing and emotional support; it also helped her navigate the court process to regain custody of her daughter. Sultano states, ‘‘I used to be a person who pointed fingers at others for my problems, but through the programs offered by CDCR, I learned to be honest and upfront with who I was, and where I wanted to go, and CDCR’s programs helped me get here.’’ Justine completed her journey with CDCR on 9 Septem- ber, 2015, successfully finishing her parole. Today, she still works at the local business, has custody of her daughter, and plans to attend school this year to further her career. Every day, men and women are released from prison and return to their homes and communities. Unfortunately, many will commit another crime and return to prison. CDCR has the tools to break the cycle and give offenders the skills that will enable them to be productive members of our communities. Assessment The Division of Rehabilitative Programs (DRP), the rehabil- itative arm of CDCR, provides programming and teaches skills to both prisoners and parolees to reduce their re- conviction or return-to-prison rate, three years after release from a CDCR institution. As part of CDCR, DRP exists to help prisoners leave prison with better life and job skills, more education, and the confidence to reintegrate into our communities. This process begins the moment they enter the prison system through the community reentry process. BOO M | S U M M E R 2 0 1 6 53 Once a convicted felon enters the prison system, their likelihood of being convicted of a new crime is based on a range of risk factors. CDCR uses the California Static Risk Assessment (CSRA) tool to calculate an offender’s risk of being convicted of a new offense after release from prison. Based on their criminal history and demographics, offen- ders are designated as having a low, moderate, or high risk of being convicted of a new offense after release. CDCR uses the Correctional Offender Management and Profiling Alternative Sanctions (COMPAS) tool to assess an offender’s criminogenic needs and inform decisions regard- ing placement, supervision, and case management. Once a prisoner’s needs are assessed, a correctional counselor assists them with program placement. Prisoners have many in-prison rehabilitative services and programs available to them statewide, including treatment for sub- stance abuse, Cognitive Behavioral Therapy (CBT), aca- demic and college education, and technical training. According to CDCR’s 2014 Outcome Evaluation Report, offenders who received in-prison Substance Abuse Treat- ment (SAT) and completed aftercare returned to prison at a lower rate (20.9 percent) after three years of follow-up than offenders who did not receive in-prison SAT or after- care (55.6 percent). Statewide, the three-year return to prison rate—CDCR’s primary measure of recidivism—for all offenders released in fiscal year 2011-12 was almost double (54.3 percent) the rate of offenders who received in-prison SAT and completed aftercare (20.9 percent). 2 CBT addresses negative patterns of thought that can potentially lead to criminal relapse. Negative patterns might include anything from substance abuse, anger mismanage- ment, strained family relationships, and a propensity to think about committing crimes. These negative patterns are addressed through treatment, individual and group discus- sions, counseling, motivational interviewing, role-playing, and other methods. CBT programs help prisoners deter- mine what leads them to certain actions and how to avoid situations that can trigger relapse. Continuing Education DRP’s Office of Correctional Education (OCE) provides edu- cation programming developed to prepare prisoners upon their release. OCE has established an array of educational programs that enhance the prisoners’ skill levels while providing effective tools and resources to reduce recidi- vism. 3 In fact, many enter prison with poor literacy skills and no vocational trade or college diploma. Most prisoners attend classes for at least thirty hours per week in a traditional school setting with desks, marker boards, and a teacher. Mobilizing thousands of students throughout state prisons and classrooms presents organi- zational and safety challenges, but DRP is committed to organizing classes based upon a model that provides indi- vidualized, self-paced programs for each prisoner. Those who fail to meet the behavior standards are not allowed to attend classes. During incarceration, prisoners are tested for basic reading comprehension. If a prisoner demonstrates skills lower than a ninth-grade level, they are enrolled in the Adult Basic Education (ABE) program, offering more remedial levels of education. 4 ABE is an academic program emphasizing reading, writing, and mathematics. ABE pre- pares prisoners for entry into a high school equivalency or high school diploma program, which they can complete in prison. The OCE currently provides 19 CTE programs designed to train prisoners for a career path in multiple employment and vocational sectors upon release. 5 These sectors include building and construction, energy and utilities, finance and business, public service, manufacturing and product development, and transportation. Many CTE programs include green employment skills relevant to solar, geother- mal, and smart energy management practices. Each pro- gram aligns with a positive employment outlook within the state of California, providing opportunities to earn a livable wage. For many prisoners, having the ability and opportuni- ties to earn a livable wage marks the difference between relapsing into crime or becoming a contributing member of the community. Others focus on a college education, many receiving Associate of Arts degrees in Sociology, Human Services, Business, and General Studies. The Transition Transitioning back to society can be intimidating for prison- ers; often the world has shifted dramatically during years of incarceration. The shock of little-to-no contact with the 54 B O O M C A L I F O R N I A . C O M outside world, followed by release into the community fueled with new technology can be overwhelming without assistance. The Male Community Reentry Program (MCRP) is one of CDCR’s efforts to support the transition back into society. 6 CDCR contracts with established community pro- viders for housing, treatment, and other rehabilitative services. To ease reentry into society, the MCRP allows eligible prisoners to serve the last six months of their sentences in a contracted provider’s community facility instead of state prison. Not quite the same as a halfway house, an older term now used to designate sober living homes, in the case of MCRP men are still ‘‘in custody.’’ Parole is also technically a version of being ‘‘in custody,’’ and yet the MCRP function is both pre-parole and pre-release. The significance of this is found when many inmates today, especially with so many increased commuted sentences from major sentencing law changes, never become paroled. MCRP participants are assisted in obtaining their California identification and Social Security cards—both necessary to find employment. Re´sume´ writing, professional certifications, and job search assistance are also provided. If a qualified participant finds a job while participating in MCRP, they are allowed to work while still serving their remaining sentence, and the money they earn is saved for use upon release. In addition, prison- ers in the MCRP are provided access to a wide range of community-based rehabilitative services designed to deflect negative thought patterns that can lead to relapse, such as CBT. Some prisoners close to release from prison may not be eligible for the MCRP due to their level of offense or med- ical/mental health needs. Instead, they are assigned to an in- prison reentry program, where they can receive similar rehabilitative services such as CTE classes, substance-use disorder treatment, anger management and family relation- ship counseling, and trauma informed gender-responsive treatment for women. While some of these programs may be available to prisoners with longer sentences, the in- prison reentry program’s primary focus is to prepare those who will soon return to our communities. Reentry pro- grams provide prisoners, within 18 months of release, with training for career readiness, job search skills, and practical financial literacy to facilitate a successful reentry into their communities. BOO M | S U M M E R 2 0 1 6 55 Technological Advances Like other educational institutions, California’s prisons are harnessing technology to better reach students. Implement- ing new technology in California prisons poses a raft of challenges due to the physical space, location, security, con- nectivity, firewalls, and funding requirements. However, these challenges are not insurmountable. 7 E-readers allow prisoners enrolled in college correspon- dence programs to study for their classes with digital text- books. They also allow prisoners living in high security areas to continue their education through independent study. Streaming television channels exponentially increase the quantity and quality of media content currently available for education, rehabilitation, and training purposes within Cali- fornia’s prison system. Four channels were branded and designated to stream specific content to aid prisoners in different stages and areas of their rehabilitation process. The four channels managed by and streamed to the institutions directly from CDCR headquarters focus on four subjects critical to the success of a recently released prisoner. Freedom TV focuses on how to prepare for reentry to society. Formerly incarcerated individuals and community members help prisoners prepare for the roadblocks they may face upon reentry. Wellness TV provides inmates infor- mation on developing and maintaining healthy habits. This channel teaches the factors that affect wellness of mind and body. Education TV streams academic programming com- plementing the lessons taught within the education classes developed by OCE and community colleges. Employment TV teaches job search techniques, interviewing skills, re´sume´ building and financial literacy. Continuing Rehabilitation Some prisoners, depending on the duration of their sentence, may not complete all programming by the time of their release. To address this issue, Community Reentry Services (CRS) offers rehabilitative DRP services outside of prison.8 CRS works with contracted community-based partnerships statewide, creating a network of services for parolees. This network provides education, substance-use disorder treat- ment, transitional housing, life skills training, financial plan- ning, and assistance in reestablishing family relationships. Thus, DRP displays a commitment to provide prisoners ongoing rehabilitation in an effort to prevent recidivism. Relapses, especially in criminal thinking, can be very hard to avoid and sometimes take years to overcome. Reducing recidivism is, therefore, a continuous effort— an effort that requires more than conventional tools. The Way Forward Part of the effort to ensure quality and proper programming for prisoners includes a governor-commissioned ‘‘Lifer’’ advisory committee, consisting of 20 to 30 formerly incar- cerated men and women who successfully reintegrated into society. Under the direction of DRP, this advisory group meets to weigh the strengths and weaknesses of the in- prison and community reentry system. As portrayed on reality television shows and often in the news media, California prisons can be very difficult, violent places. The media often misses, however, the many positive programs available to those who desire to change. Tens of thousands of California prisoners are enrolled in some form of rehabilitative program—most want to change. Many are carrying books, not shackles. Many encourage peace, not violence. Most will return to our communities. It is our duty to help them become productive citizens when they do
-
-
americanenglish.state.gov americanenglish.state.gov
-
A m o n t i l l a d o
A rare, foreign, and expensive sherry.
-
-
openurl.ebsco.com openurl.ebsco.com
-
Over the past decade, educators have paid more at-tention to multilingual students’ translanguagingpractices (how bilingual and bidialectal studentsdynamically move across and among languages)and how teachers may recognize and honor stu-dents’ dynamic language practices in the classroom(Baker-Bell, 2013; O. García & Kleifgen, 2010; Pacheco& Miller, 2016). As noted by Pacheco and Miller andby García and Kleifgen, translanguaging pedagogiesencourage students to recruit all of their linguis-tic resources in literacy tasks, rather than separat-ing languages. Indeed, recent research has shownthat such pedagogies can support students in morecomplex literacy practices and cognitive tasks thanthey could accomplish monolingually
Research shows students can do more advanced reading and thinking when they are allowed to use all their languages, not just English. Translanguaging: using multiple languages together naturally when speaking or writing. Monolingually: using only one language.
-
-
docdrop.org docdrop.org
-
nshi irecti cal knoll p. The directive coach has speci T-appr pecial knowled and his job is to transfer that knowledge to the coachee. While the . relationship is respectful, it is not equal. In con ilitati cae a to ae coaches who set their expertise aside when working achers, the directive coach’s ex ise i pertise is at the heart of thi i approach. Since their job is t ctnay ton o make sure teachers | de something eect earn the correct way to , directive coaches tell teachers wh at do to, someti oe ' imes model an me observe teachers, and provide constructive feedback to teachers ey can implement the new practice with fidelity. Directi Fach we paces work from the assumption that the teachers they are Rivhy e ‘ O not Know how to use the practices they are learning, which henerally a ane coached. They also assume that teaching strategies uld be implemented with fidelity, which i : way in ea y, which is to say, in the same y ch classroom. Thus, the goal of the directive coach is to ensure fidelity to a proven model, not adaptation of th i of children or strengths of a teacher ENE NGENSS The best directi a neath coaches are excellent communicators who listen to their 7 . . Pa Fa rene understanding using effective questions, and sensitively ee’s understanding or lack of understanding. Since the goal Chapter 1 | What Does It Mean to Improve? 11
Directive coaching: I can see how this way of coaching can support teachers who need to master a skill. It is nerve racking to do this type of coaching, however i can see possiblities based on what jim knight is sharing. I need to go deeper to understand better.
-
-
odp.library.tamu.edu odp.library.tamu.edu
-
Are orphans of the earthly love and heavenly: Let them weep ! let them weep! They look up, with their pale and sunken faces, And their look is dread to see, 150 For they think you see their angels in their places, With eyes meant for Deity;— “How long,” they say, “how long, O cruel nation, Will you stand, to move the world, on a child’s heart, —
(
)
This was a period of time where England was known as the empire on which the sun never sets. Military might and the Industrial Revolution turned England into a juggernaut of powerhouses in the world theater. Little did the world knew that it was the labor of poor children that made the English Industrial Evolution possible as able bodied men were busy fighting. Orphaned children from cities and parishes were contracted from city officials to factory owners to work until they reach 21 or 24 years old. There were no one who fought for their welfare or rights. The children worked 12 to 16 hours a day with little substantial food, hence "their pale and sunken faces". The children were essentially slaves.
-
But the young, young children, O my brothers, Do you ask them why they stand Weeping sore before the bosoms of their mothers, In our happy Fatherland?
EBB's use of "my brothers" is strategic. She is not passing judgement, but rather, rallying society. By placing herself along side with her countrymen, she effectively "elbows" her neighbors in saying, "I don't find this acceptable. Do you?" Like the opening quote, EBB corners her readers in a position where they couldn't endorse the current treatment of the children because that would make them look uncaring and unconscionable.
-
The young lambs are bleating in the meadows ; The young birds are chirping in the nest; The young fawns are playing with the shadows; The young flowers are blowing toward the west— But the young, young children, O my brothers, They are weeping bitterly!
The deliberate refrain of "young" nature and the emphasized double "young, young children" point out the irony and tragedy of how life shouldn't be for these children. While nature frolic and play, the human children are weeping bitterly. In fact, some poems in the Victorian period use this juxtaposition of the free natural world versus the state of the oppressive poor. Thomas Hood's "Song of the Shirt" has these lines: "Oh! but to breathe the breath Of the cowslip and primrose sweet--- With the sky above my head, And the grass beneath my feet". Gerald Massey wrote in "Cry of the Unemployed": "Heaven droppeth down with manna still in many a golden shower, And feeds the leaves with fragrant breath, with silver dew, the flower; There's honeyed fruit for bee and bird, with bloom laughs out the tree". Nature is plentiful, beautiful, and free while humans suffer from hunger and fetters of their working class.
-
-
irp.fas.org irp.fas.org
-
concerned and distressed about.
Carol Cohn fala sobre a necessidade de controle e previsibilidade no discurso de defesa. O tom de Shelby não é apenas de crítica técnica; é de angústia (distressed).
Evidência no Texto: Ele chama o evento de "extremely dangerous situation" e diz estar "very concerned and distressed" (muito preocupado e angustiado).
Análise: A "domesticação" do perigo falhou. Em 1995, o perigo era domesticado pela piada ("exciting watch"). Em 1998, a realidade da proliferação rompeu a bolha da linguagem tecnoestratégica segura. O "cenário sombrio" (previsto no memorando de 95) se concretizou porque a inteligência estava ocupada demais subestimando o vigiado.
-
-
www.biorxiv.org www.biorxiv.org
-
Reviewer #2 (Public review):
Summary:
This article aims to elucidate the potential roles of P-bodies in yeast adaptation to complex environmental conditions, such as the plant leaf phyllosphere. The authors demonstrated that yeast mutants defective in one of the P-body-localized proteins failed to grow in the Arabidopsis thaliana phyllosphere. They conducted detailed imaging analyses, focusing particularly on the co-localization of P-bodies and mRNAs (DAS1) related to the methanol metabolism pathway under various environmental conditions. The study newly revealed that these mRNAs form dot-like structures that occasionally co-localize with a P-body marker. Furthermore, the authors showed that the number of P-body-labeled dots increases under stress conditions, such as H₂O₂ treatment, and that mRNA dots are more frequently localized to P-body-like structures. Based on these detailed observations, the authors hypothesize that P-bodies function to protect mRNAs from degradation, particularly under stress conditions.
Strengths:
I think the authors' attempt to elucidate the potential roles of P-bodies in yeast under stress conditions is novel, and the imaging data are overall very nice.
Weaknesses:
I believe the authors could make additional efforts to more clearly demonstrate that P-bodies are indeed required for yeast proliferation in the phyllosphere, as described below, since this represents the most novel aspect of the study.
-
-
pmc.ncbi.nlm.nih.gov pmc.ncbi.nlm.nih.gov
-
135632
DOI: 10.1117/1.NPh.12.S2.S22808
Resource: RRID:Addgene_135632
Curator: @olekpark
SciCrunch record: RRID:Addgene_135632
-
-
www.jstor.org www.jstor.org
-
o achieve this, it is essential that digital educationaltools and platforms, particularly those using AI, be designed to incorporate multilingual support,ensure equitable access and uphold cultural sensitivity, thereby enabling students from diversebackgrounds to engage with learning materials in their native languages and cultural contexts.
To stop AI from wiping out languages, governments and organizations need to create rules and plans that make sure AI technologies actually help protect and promote the world's many languages and cultures, instead of hurting them
-
-
openurl.ebsco.com openurl.ebsco.com
-
The analysis revealed significant improvements in literacy skills among students in AI-enhancedclassrooms compared to those in traditional classrooms.• Pre-Test Results (Literacy):o Experimental Group (AI-enhanced): Mean score = 45%o Control Group (Traditional): Mean score = 44%• Post-Test Results (Literacy):o Experimental Group (AI-enhanced): Mean score = 78%o Control Group (Traditional): Mean score = 61%• Statistical Analysis
this study did find a 33% increase in the literacy increase showing that AI used in early childhood writing can be more effective than the 17% increase of the 100 students that used traditional methods. this is a good part to use in my research paper.
-
-
pmc.ncbi.nlm.nih.gov pmc.ncbi.nlm.nih.gov
-
118692
DOI: 10.1101/2025.03.26.645490
Resource: RRID:Addgene_118692
Curator: @olekpark
SciCrunch record: RRID:Addgene_118692
-
-
pmc.ncbi.nlm.nih.gov pmc.ncbi.nlm.nih.gov
-
Tet-O-Ngn2-Puro
DOI: 10.1016/j.omtn.2025.102726
Resource: RRID:Addgene_52047
Curator: @olekpark
SciCrunch record: RRID:Addgene_52047
-
-
pmc.ncbi.nlm.nih.gov pmc.ncbi.nlm.nih.gov
-
Plasmid_85793
DOI: 10.21203/rs.3.rs-7473364/v1
Resource: RRID:Addgene_85793
Curator: @scibot
SciCrunch record: RRID:Addgene_85793
-
-
pmc.ncbi.nlm.nih.gov pmc.ncbi.nlm.nih.gov
-
plasmid_1448
DOI: 10.17912/micropub.biology.001821
Resource: RRID:Addgene_1448
Curator: @scibot
SciCrunch record: RRID:Addgene_1448
-
-
-
prostytutki stanowia dla Policji zrddto informa-cji o Srodowisku, w ktorym zyja i pracuja.
prostytutki jako źródła informacji dla policji
-
-
-
Existe una ley interna en la naturaleza a la que ningún ser vivo puede escapar. El cuerpo biológico nace, crece, madura y después decae hasta morir. Algunos pensadores, como Oswald Splenger, cayeron en el error de aplicar este mismo proceso a las sociedades humanas. Como respuesta a esta visión del desarrollo civilizatorio que le llevó a Spengler a escribir su famosa obra «La decadencia de Occidente», autores como Lewis Mumford o Waldo Frank defendieron que las comunidades orgánicas presentan una forma parabólica, siempre abierta y cambiante. El término elegido por Mumford para definir este proceso fue el de «equilibrio dinámico»
¿Es una comunidad orgánica un símil de una [[cibernética]] positiva y abierta? ¿Es posible pensarlo desde ahí?
TFM
-
-
www.sciencedirect.com www.sciencedirect.com
-
VDRC# 105463
DOI: 10.1016/j.cub.2025.10.038
Resource: None
Curator: @areedewitt04
SciCrunch record: RRID:Flybase_FBst0477290
-
-
www.sciencedirect.com www.sciencedirect.com
-
RRID:AB_2296900
DOI: 10.1016/j.celrep.2025.116577
Resource: (Cell Signaling Technology Cat# 4107, RRID:AB_2296900)
Curator: @scibot
SciCrunch record: RRID:AB_2296900
-
-
www.biorxiv.org www.biorxiv.org
-
Author response:
The following is the authors’ response to the original reviews.
Reviewer #1 (Public review):
Summary:
This study focuses on the bacterial metabolite TMA, generated from dietary choline. These authors and others have previously generated foundational knowledge about the TMA metabolite TMAO, and its role in metabolic disease. This study extends those findings to test whether TMAO's precursor, TMA, and its receptor TAAR5 are also involved and necessary for some of these metabolic phenotypes. They find that mice lacking the host TMA receptor (Taar5-/-) have altered circadian rhythms in gene expression, metabolic hormones, gut microbiome composition, and olfactory and innate behavior. In parallel, mice lacking bacterial TMA production or host TMA oxidation have altered circadian rhythms.
Strengths:
These authors use state-of-the-art bacterial and murine genetics to dissect the roles of TMA, TMAO, and their receptor in various metabolic outcomes (primarily measuring plasma and tissue cytokine/gene expression). They also follow a unique and unexpected behavioral/olfactory phenotype. Statistics are impeccable.
Weaknesses:
Enthusiasm for the manuscript is dampened by some ambiguous writing and the presentation of ideas in the introduction, both of which could easily be improved upon revision.
We apologize for the abbreviated and ambiguous writing style in our original submission. Given Reviewer 2 also suggested reorganizing and rewriting certain parts, we have spent time to remove ambiguity by adding additional points of clarification and adding more historical context to justify studying TMA-TAAR5 signaling in regulating host circadian rhythms. We have also reorganized the presentation of data aligned with this.
Reviewer #2 (Public review):
Summary:
In the manuscript by Mahen et al., entitled "Gut Microbe-Derived Trimethylamine Shapes Circadian Rhythms Through the Host Receptor TAAR5," the authors investigate the interplay between a host G protein-coupled receptor (TAAR5), the gut microbiota-derived metabolite trimethylamine (TMA), and the host circadian system. Using a combination of genetically engineered mouse and bacterial models, the study demonstrates a link between microbial signaling and circadian regulation, particularly through effects observed in the olfactory system. Overall, this manuscript presents a novel and valuable contribution to our understanding of hostmicrobe interactions and circadian biology. However, several sections would benefit from improved clarity, organization, and mechanistic depth to fully support the authors' conclusions.
Strengths:
(1) The manuscript addresses an important and timely topic in host-microbe communication and circadian biology.
(2) The studies employ multiple complementary models, e.g., Taar5 knockout mice, microbial mutants, which enhance the depth of the investigation.
(3) The integration of behavioral, hormonal, microbial, and transcript-level data provides a multifaceted view of the observed phenotype.
(4) The identification of olfactory-linked circadian changes in the context of gut microbes adds a novel perspective to the field.
Weaknesses:
While the manuscript presents compelling data, several weaknesses limit the clarity and strength of the conclusions.
(1) The presentation of hormonal, cytokine, behavioral, and microbiome data would benefit from clearer organization, more detailed descriptions, and functional grouping to aid interpretation.
We appreciate this comment and have reorganized the data to improve functional grouping and readability. We have also added additional detail to descriptions of the data in the revised figure legends and results.
(2) Some transitions-particularly from behavioral to microbiome data-are abrupt and would benefit from better contextual framing.
We agree with this comment, and have added additional language to provide smoother transitions. This in many cases brings in historical context of why we focused on both behavioral and microbiome alterations in this body of work.
(3) The microbial rhythmicity analyses lack detail on methods and visualization, and the sequencing metadata (e.g., sample type, sex, method) are not clearly stated.
We apologize for this, and have now added more detail in our methods, figures, and figure legends to ensure the reader can easily understand sample type, sex, and the methods used.
(4) Several figures are difficult to interpret due to dense layouts or vague legends, and key metabolites and gene expression comparisons are either underexplained or not consistently assessed across models.
Aligned with the last comment we now added more detail in our methods, figures, and figure legends to provide clear information. We have now provided additional data showing the same key metabolites, hormones, and gene expression alterations in each model if the same endpoints were measured.
(5) Finally, while the authors suggest a causal role for TAAR5 and its ligand in circadian regulation, the current data remain correlative; mechanistic experiments or stronger disclaimers are needed to support these claims.
We agree with this comment, and as a result have removed any language causally linking TMA and TAAR5 together in circadian regulation. Instead, we only state finding in each model and refrain from overinterpreting.
Reviewer #3 (Public review):
Summary:
Deletion of the TMA-sensor TAAR5 results in circadian alterations in gene expression, particularly in the olfactory bulb, plasma hormones, and neurobehaviors.
Strengths:
Genetic background was rigorously controlled.
Comprehensive characterization.
Weaknesses:
The weaknesses identified by this reviewer are minor.
Overall, the studies are very nicely done. However, despite careful experimentation, I note that even the controls vary considerably in their gene expression, etc, across time (eg, compare control graphs for Cry 1 in IB, 4B). It makes me wonder how inherently noisy these measurements are. While I think that the overall point that the Taar5 KO shows circadian changes is robust, future studies to dissect which changes are reproducible over the noise would be helpful.
We thank the reviewer for this insightful comment. We completely agree that there are clear differences in the circadian data in experiments from Taar5<sup>-/-</sup> mice and those from gnotobiotic mice where we have genetically deleted CutC. Although the data from Taar5<sup>-/-</sup> mice show nice robust circadian rhythms, the data from mice where microbial CutC is altered have inherently more “noise”. We attribute some of this to the fact that the Taar5<sup>-/-</sup> mouse experiment have a fully intact and diverse gut microbiome . Whereas, the gnotobiotic study with CutC manipulation includes only a 6 member microbiome community that does not represent the normal microbiome diversity in the gut. This defined synthetic community was used as a rigorous reductionist approach, but likely affected the normal interactions between a complex intact gut microbiome and host circadian rhythms. We have added some additional discussion to indicate this in the limitations section of the manuscript.
Impact:
These data add to the growing literature pointing to a role for the TMA/TMAO pathway in olfaction and neurobehavioral.
Reviewer #1 (Recommendations for the authors):
I suggest a revision of the writing and organization. The potential impact of the study after reading the introduction is unclear. One example, in the intro, " TMAO levels are associated with many human diseases including diverse forms of CVD5-12, obesity13,14, type 2 diabetes15,16, chronic kidney disease (CKD)17,18, neurodegenerative conditions including Parkinson's and Alzheimer's disease19,20, and several cancers21,22" It would be helpful to explain how the previous literature has distinguished that the driver of these phenotypes is TMA/TMAO and not increased choline intake. Basically, for a TMA/O novice reader, a more detailed intro would be helpful.
We appreciate this insightful comment and have now provided a more expansive historical context for the reader regarding the effects of choline consumption (which impacts many things, including choline, acetylcholine, phosphatidylcholine, TMA, TMAO, etc) versus the primary effects of TMA and TMAO.
There were also many uses of vague language (regulation/impact/etc). Directionality would be super helpful.
We thank the reviewer for this recommendation and have improved language as suggested to show directionality of our findings. The terms regulation, impact, shape etc. are used only when we describe multiple variable changing at the same time over the time course of a 24-hour circadian period (some increased and some decreased).
Reviewer #2 (Recommendations for the authors):
In the manuscript by Mahen et al., entitled "Gut Microbe-Derived Trimethylamine Shapes Circadian Rhythms Through the Host Receptor TAAR5," the authors investigate the interplay between a host G protein-coupled receptor (TAAR5), the gut microbiota-derived metabolite trimethylamine (TMA), and the host circadian system. Using a combination of genetically engineered mouse and bacterial models, the study demonstrates a link between microbial signaling and circadian regulation, particularly through effects observed in the olfactory system. Overall, this manuscript presents a novel and valuable contribution to our understanding of hostmicrobe interactions and circadian biology. However, several sections would benefit from improved clarity, organization, and mechanistic depth to fully support the authors' conclusions. Below are specific major and minor suggestions intended to enhance the presentation and interpretation of the data.
Major suggestions:
(1) Consider adding a schematic/model figure as Panel A early in the manuscript to help readers understand the experimental conditions and major comparisons being made.
We thank the reviewer for this recommendation and have added a graphical abstract figure to help the reader understand the major comparisons being made.
(2) Could the authors present body weight and food intake characteristics in Taar5 KO vs. WT animals?
We have added body weight data as requested in Figure 1, Figure supplement 1. Although we have not stressed these mice with a high fat diet for these behavioral studies, under chow-fed conditions studied here we did not find any significant differences in body weight. Given no difference in body weight, we did not collect data on food consumption and have mentioned this as a limitation in the discussion.
(3) Several figures, especially Figures 3 and 4, and Supplemental Figures, would benefit from more structured organization and expanded legends. Grouping related data into thematic panels (e.g., satiety vs. appetite hormones, behavioral domains) may help improve readability.
We appreciate the reviewer’s thoughtful comments and agree that reorganization would improve clarity. We have reorganized figures to improve clarity and have expanded the figure legends to provide more detail on experimental methods.
(4) Clarify and expand the description of hormonal and cytokine changes. For instance, the phrase "altered rhythmic levels" is vague - do the authors mean dampened, phase-shifted, enhanced, etc., relative to WT controls?
Given a similar suggestion was made by Reviewer 1, we have provided more precise language focused on directionality and which specific endpoints we are referring to. For anything looking at circadian rhythms, the revised manuscript includes specific indications when we are discussing mesor, amplitude, and acrophase alterations. The terms regulation, impact, shape etc. are used only when we describe multiple complex variables changing at the same time over the time course of a 24-hour circadian period (some increased and some decreased).
(5) Consider grouping hormones and cytokines functionally (e.g., satiety vs. appetite-stimulating, pro- vs. antiinflammatory) to better interpret how these changes relate to the KO phenotype.
We thank the reviewer for this recommendation, and have re-organized figure panels to reflect this.
(6) Please provide a more detailed description of the behavioral results, particularly those in Supplemental Figure 2.
We have both expanded the methods description in the revised figure legends, but have also added a more detailed description of the behavioral results.
(7) As with hormonal data, behavioral outcomes would be easier to follow if organized thematically (e.g., locomotor activity, anxiety-like behavior, circadian-related behavior), especially for readers less familiar with behavioral assays.
We appreciate this reviewer’s comment and agree that we can better group our data to show how each test is associated with the type of behavior it assesses. As a result we have reorganized the behavioral data into broad categories such as olfactory-related, innate, cognitive, depressive/anxiety-like, or social behaviors. We have also new data in each of these behavioral categories to provide a more comprehensive understanding of behavioral alterations seen in Taar5<sup>-/-</sup> mice.
(8) The following statement needs clarification: "Also, it is important to note that many behavioral phenotypes examined, including tests not shown, were unaltered in Taar5-/- mice (Figures S2G, S2H, and S2I)." Consider rephrasing to explicitly state the intended message: are the authors emphasizing a lack of behavioral phenotype, or highlighting specific unaltered aspects?
We apologize for this confusing statement, and have changed the verbiage to improve readability. To expand the comprehensive nature of this study, we also now include the tests that were “not shown” in the original submission to provide a more comprehensive understanding of behavioral alterations seen in Taar5<sup>-/-</sup> mice. These new data are included as 6 different figure supplements to main Figure 2.
(9) The transition from behavior to microbiome data feels abrupt. Can the authors better explain whether the behavioral changes are thought to result from gut microbial function, independent of TMA-Taar5 signaling?
We apologize for the poor transitions in our writing style. We have spent time to explain the previous findings linking the TMA pathway to circadian reorganization of the gut microbiome (mostly coming from our original paper Schugar R, et al. 2022, eLife) and how this correlates with behavioral phenotypes. Although at this point it is difficult to know whether the microbiome changes are driving behavioral changes, or vice versa it could be central TAAR5 signaling is altering oscillations in gut microbiome, we present our findings here as a framework for follow up studies to more precisely get at these questions. It is important to note that our experiment using defined community gnotobiotic mice with or without the capacity to produce TMA (i.e. CutC-null community) shows that clearly microbial TMA production can impact host circadian rhythms in the olfactory bulb. Additional experiments beyond the scope of this work will be required to test which phenotypes originate from TMA-TAAR5 signaling versus more broad effects of the restructured gut microbiome.
(10) For Figure 3A, please expand the microbiome results with more granularity:
(a) Indicate in the Results section whether the sequencing method was 16S amplicon or metagenomic.
Sequencing was done using 16S rRNA amplicon sequencing using methods published by our group (PMID: 36417437, PMID: 35448550).
(b) State whether samples were from males, females, or a mix.
We have indicated that all mice from Figure 1 were male mice in the revised figure legend.
(c) Clarify whether beta diversity is based on phylogenetic or non-phylogenetic metrics. Consider using both types if not already done.
Beta diversity was analyzed using the Bray-Curtis dissimilarity index as the metric. Details have been included in the methods section.
(d) Make lines partially transparent in the Beta-diversity plot so that individual points are visible.
We have now updated the Beta-diversity plot with individual points visualized.
(e) Clarify what percentage of variation in the Beta-diversity plot is explained by CCA1, and whether this low percentage suggests minimal community-level differences.
We have updated the Beta-diversity plot to include the R<sup>2</sup> and p-values associated with these data.
(f) Confirm if the y-axis on the Beta-diversity plot should be labeled CCA2 rather than "CCAA 1".
We appreciate this comments, given it identified a typographical error in the plot. The revised figure now include the proper label of CCA2 instead of CCAA 1.
(11) For Figure 3B:
(a) Provide a description of the taxonomy plot in the results.
We have added a description of the taxonomy plot in the revised results section.
(b) Add phylum-level labels and enlarge the legend to improve the readability of genus-level data.
We agree this is a good suggestion so have enlarged the legend for the genus-level data and have also added phylum-level plots as well in the revised manuscript in Figure 3, figure supplement 1.
(12) Rhythmicity of the microbiome is central to the manuscript. The current approach of comparing relative abundance at discrete time points is limiting.
We thank the reviewer for this comment. We agree with this statement that discrete timepoint are not enough to describe circadian rhythmicity. In addition to comparing genotypes at discrete time points, we also used a rigorous cosinor analysis to plot the data over a 24-hour time period, and those differences are shown in the figure itself as well as Table 1.
(a) Please describe how rhythmicity was determined, e.g., what data or statistical method supports the statement: "Taar5-/- mice showed loss of the normal rhythmicity for Dubosiella and Odoribacter genera yet gained in amplitude of rhythmicity for Bacteroides genera (Figure 3 and S3)."
We appreciate this reviewer comment. Rhythmicity was determined using a cosinor analysis by use of an R program. Cosinor analysis is a statistical method used to model and analyze rhythmic patterns in time-series data, typically assuming a sinusoidal (cosine) shape. It estimates key parameters like mesor (mean level), amplitude (height of oscillation), and acrophase (timing of the peak), making it especially useful in fields like chronobiology and circadian rhythm research. We have used this in previous research to describe circadian rhythms. We do plan to improve language considering directionality of these circadian changes.
(b) Supplemental Figure S3 needs reorganization to highlight key findings. It's not currently clear how taxa are arranged or what trends are being shown.
The data in Figure S3 show the entire 24-hour time course of the cecal taxa that were significantly altered for at least one time point between Taar5<sup>+/+</sup> and Taar5<sup>-/-</sup> mice. Given we showed time pointspecific alterations in the Main Figure 3, we thought these more expansive plots would be important to show to depict how the circadian rhythms were altered.
(c) Supplemental Table 1, which includes 16S features, should be referenced and discussed in the microbiome section.
We have now referenced and discussed Supplemental Table 1 which includes all cosinor statistics for microbiome and other data presented in circadian time point studies.
(13) Did the authors quantify the 16S rRNA gene via RT-PCR to determine if this was similar between KO and WT over the 24-hour period?
We did not quantify 16S rRNA gene via RT-PCR, but do not think adding this will change our overall interpretations.
(14) Reorganize Figure 4 to align with the order of results discussed-starting with TMA and TMAO, followed by related metabolites like choline, L-carnitine, and gamma-butyrobetaine.
We thank the reviewer for this comment. We have chosen this organization because it is ordered from substrates (choline, L-carnitine, and betaine) to the microbe-associated products (TMA then TMAO). We will improve the writing associated with this figure to clearly explain this organization.
(a) Although the changes in the latter metabolites are more modest, they may still have physiological relevance. Could the authors comment on their significance?
We appreciate this reviewer comment and agree. We have expanded the results and discussion to address this.
(15) The authors note similarities in circadian gene expression between Taar5 KO mice and Clostridium sporogenes WT vs. ΔcutC mice, but the gene patterns are not consistent.
(a) Can the authors clarify what conclusions can reasonably be drawn from this comparison?
We hesitate to make definitive conclusions in the manuscript on why the gene patterns are not consistent, because it would be speculation. However, one major factor likely driving differences is the status of the diversity of the gut microbiome in the different studies. For instance, in the studies using Taar5<sup>+/+</sup> and Taar5<sup>-/-</sup> mice there is a very diverse microbiome in these conventionally housed mice. In contrast, by design the experiment using Clostridium sporogenes WT vs. ΔcutC communities is a reductionist approach that allows us to genetically define TMA production. In these gnotobiotic mice, the simplified community has very limited diversity and this likely alters the host circadian rhythms in gene expression quite dramatically. Although it is impossible to directly compare the results between these experiments given the difference microbiome diversity, there are clearly alterations in host gene expression when we manipulate TMA production (i.e. ΔcutC community) or TMA sensing (i.e. Taar5<sup>-/-</sup>).
(16) Were circadian and metabolic genes (e.g., Arntl, Cry1, Per2, Pemt, Pdk4) also analyzed in brown adipose tissue of Taar5 KO mice, and how do these results compare to the Clostridium models?
We thank the reviewer for this comment. Unfortunately, we did not collect brown adipose tissue in our original Taar5 study. We plan on doing this in future follow up studies studying cold-induced thermogenesis that are beyond the scope of this manuscript. However, we have decided to include data from our two timepoint Taar5 study which looks at ZT2 (9am) and ZT14 (9pm). There are clear differences in circadian genes between these timepoints.
(17) To allow a more direct comparison, please ensure the same cytokines (e.g., IL-1β, IL-2, TNF-α, IFN-γ, IL6, IL-33) are reported for both the Taar5 KO and microbial models.
We thank the reviewer for this comment and now include data from the same cytokines for each study.
(18) What was the defined microbial community used to colonize germ-free mice with C. sporogenes strains? Did this community exhibit oscillatory behavior?
To define TMA levels using a genetically-tractable model of a defined microbial community, we leveraged access to the community originally described by our collaborator Dr. Federico Rey (University of Wisconsin – Madison) (PMID: 25784704). We chose this community because it provide some functional metabolic diversity and is well known to allow for sufficient versus deficient TMA production. We are thankful for the reviewer comments about oscillatory behavior of this defined community, and to be responsive have performed sequencing to detect the species over time. These data are now included in the revised manuscript and show that there are clear differences in the oscillatory behavior of the defined community members. These data provide additional support that bacterial TMA production not only alters host circadian rhythms, but also the rhythmic behavior of gut bacteria themselves which has never been described before.
(19) Can the authors explain the rationale for measuring additional metabolites such as tryptophan, indole acetic acid, phenylacetic acid, and phenylacetylglycine? How are these linked to CutC gene function or Taar5 signaling?
We appreciate that this could be confusing, but have included other gut microbial metabolites to be as comprehensive as possible. This is important to include because we have found in other gnotobiotic studies where we have genetically altered metabolite production, if we alter one gut microbe-derived metabolite there can be unexpected alterations in other distinct classes of microbe-derived metabolites (PMID: 37352836). This is likely due to the fact that complex microbe-microbe and microbehost interactions work together to define systemic levels of circulating metabolites, influencing both the production and turnover of distinct and unrelated metabolites.
(20) The authors make several strong claims suggesting that loss of Taar5 or disruption of its ligand directly alters the circadian gene network. However, the current data are correlative. The authors should clarify that these findings demonstrate associations rather than direct causal effects, unless additional mechanistic evidence is provided. Approaches such as studies conducted in constant darkness, measurements of wheelrunning behavior, or analyses that control for potential confounding factors, e.g., inflammation or metabolic disruption, would help establish whether the observed changes in clock gene expression are primary or secondary effects. The authors are encouraged to either soften these causal claims or acknowledge this limitation explicitly in the discussion.
We thank the reviewer for this comment. We agree and have softened our language about direct effects of TMA via TAAR5 because we agree the data presented here are correlative only.
Minor suggestions:
(1) Avoid repetitive phrases such as "it is important to note..." for improved flow. Rephrasing these instances will enhance readability.
We thank the reviewer for this suggestion and have deleted such repetitive phrases.
(2) For Figure 2, remove interpretations above he graphs and use simple, descriptive panel labels, similar to those in Supplemental Figure 2.
We have removed these interpretations as suggested, but have retained descriptive panel labels to help the reader understand what type of data are being presented.
Reviewer #3 (Recommendations for the authors):
Minor:
In Figure 1D, UCP1 does not appear to be significantly changed.
We thank the reviewer for this comment and agree that UCP1 gene expression is not significantly altered . However, given the key role that UCP1 plays in white adipose tissue beiging, which is suppressed by the TMAO pathway, we think it is critical to show that this effect appears unaffected by perturbed TMA-TAAR5 signaling.
It would be helpful, in the discussion, to summarize any consistent changes across Taar5 KO, CutC deletion, and FMO3 deletion.
We have added this to the discussion, but as discussed above we hesitate to make strong interpretations about consistency between the models because the microbiome diversity is so different between the studies, and we did not measure all endpoints in both models.
For the Cosinor analysis, it may be helpful to remove the p-values that are >0.05 from the figures.
We have now removed any non-significant p-values that are associated with our figures.
For Figure 2, Supplement 1E, what are the two bars for each genotype?
We appreciate the reviewer pointing this out and will further explain this test in the figure with labels and in the legend.
-
-
-
Suplementy, które MUSISZ brać, i które ZASZKODZĄ. Ranking 15 🏆Tap to unmute2xSuplementy, które MUSISZ brać, i które ZASZKODZĄ. Ranking 15 🏆Dr Bartek Kulczyński 350,605 views 1 month agoSearchCopy linkInfoShoppingIf playback doesn't begin shortly, try restarting your device.Pull up for precise seekingGroup No. 4Mute5:26Group No. 4•Up nextLiveUpcomingCancelPlay nowYou're signed outVideos that you watch may be added to the TV's watch history and influence TV recommendations. To avoid this, cancel and sign in to YouTube on your computer.CancelConfirmDr Bartek KulczyńskiSubscribeSubscribedTu dietetyk dr Bartek Kulczyński. Na tym kanale opowiadam, jak powinna wyglądać zdrowa dieta, aby zażegnać choroby, zmniejszyć ich ryzyko. Poprzez zdrowy styl życia, włączenie do diety niektórych produktów i wykluczenie takich, które nam nie służą, możemy poprawić swoje zdrowie. Na kanale omawia takie tematy jak cukrzyca typu 2, odchudzanie (jak schudnąć zdrowo), jakie zdrowe produkty warto jeść, jakich produktów unikać i jak radzić sobie z chorobami. Pojawia się też gotowanie i zdrowe przepisy. W dorobku mam 67 publikacji naukowych o zasięgu krajowym i międzynarodowym, w takich wydawnictwach jak Elsevier, Springer czy Taylor & Francis. W latach 2015-2019 byłem redaktorem czasopisma naukowego „Postępy Dietetyki w Geriatrii i Gerontologii”. Napisałem około 300 artykułów popularno-naukowych o dietetyce. Od 2018 jestem zatrudniony przez Uniwersytet Przyrodniczy, gdzie prowadzę zajęcia ze studentami dietetyki i technologii żywności. Stopień doktora mam z technologii żywności i żywienia. Najsilniejszy odtruwacz organizmu. Tak zwiększysz jego poziom w ciele16:03HideShareInclude playlistAn error occurred while retrieving sharing information. Please try again later. 20:2020:20 / 21:43Live (21:20)•Watch full video ON OFF •Group No. 1Group No. 1•1:33:271 Bio-Hacker vs 20 Skeptics (ft. Bryan Johnson) | SurroundedJubilee and Bryan Johnson762k views • 4 days agoLivePlaylist ()Mix (50+)25:18The Matterhorn // Europe's Most DEADLY Mountain... SoloMagnus Midtbø2.5m views • 1 month agoLivePlaylist ()Mix (50+)15:26Gut Microbiome WARRIORS - Fighting Cancer NaturallyDr. Dino Prato Podcast252 views • 10 hours agoLivePlaylist ()Mix (50+)16:45HEAVY is the KILL [EP]KILL17k views • 5 months agoLivePlaylist ()Mix (50+)11:03Najważniejsze suplementy, które powinieneś brać do śniadania 🥗Jakub Mauricz82k views • 3 weeks agoLivePlaylist ()Mix (50+)1:16:26"ILE POWINIEN TRWAĆ SEKS I CO SIĘ DZIEJE GDY JEST ZA KRÓTKI" GINEKOLOG O PROBLEMACH W ŁÓŻKUBez Tajemnic926k views • 6 months agoLivePlaylist ()Mix (50+)19:42I Hired a Rental Japanese BOYFRIEND in Tokyo 💘seerasan831k views • 3 months agoLivePlaylist ()Mix (50+)18:15I taught an octopus piano (It took 6 months)Mattias Krantz5m views • 2 weeks agoLivePlaylist ()Mix (50+)11:58You're More Stressed Than Ever - Let's Change ThatKurzgesagt – In a Nutshell3.1m views • 9 days agoLivePlaylist ()Mix (50+)55:50Niedobór TESTOSTERONU u mężczyzn po 40-tce – prawda o spadku energii i libido – Tomasz WaligóraDzień Dobry Długowieczność78 views • 18 hours agoLivePlaylist ()Mix (50+)25:04Why Mastering Your Communication Will Make You Rich!Vinh Giang90k views • 6 days agoLivePlaylist ()Mix (50+)15:378 suplementów, których nigdy nie kupię ⚠️ Nr 2 wręcz szkodliwyDr Bartek Kulczyński716k views • 2 years agoLivePlaylist ()Mix (50+)Speed: 1.4 Suplementy, które MUSISZ brać, i które ZASZKODZĄ. Ranking 15 🏆
-
Wprowadzenie: Film przedstawia ranking 15 popularnych suplementów diety, podzielonych na cztery grupy w zależności od ich udowodnionej skuteczności i uniwersalności zastosowania [00:00:40].
-
GRUPA 1: Warto przyjmować codziennie
- Omega-3 (EPA i DHA) – z uwagi na szerokie korzyści zdrowotne i rzadkie spożywanie ich źródeł w diecie [00:19:41].
- Witamina D – uznawana za hormon, jest kluczowa z uwagi na jej wielokierunkowe działanie i powszechne niedobory (większość osób w Polsce ma jej zbyt niski poziom) [00:20:20].
-
GRUPA 2: Szeroki, korzystny wpływ na zdrowie
- Cynk
- Magnez (wskazany ze względu na to, że Polacy spożywają go o 20-30% za mało) [00:13:44].
- Witamina C
- Błonnik pokarmowy (większość Polaków spożywa go za mało, choć jest powszechny w żywności) [00:16:56].
- Probiotyki (ważne dla regulacji pracy jelit, odporności, a także w łagodzeniu objawów depresyjnych i usprawnianiu mózgu) [00:18:32].
-
GRUPA 3: Potwierdzona skuteczność, ale wąskie zastosowanie
- Preparaty wysokobiałkowe (np. odżywki białkowe) – przydatne dla osób aktywnych fizycznie, budujących masę mięśniową, w rekonwalescencji oraz dla osób starszych zagrożonych sarkopenią [00:07:45].
- Kreatyna – wspomaga wzrost masy i siły mięśni, wzmacnia kości, poprawia sprawność umysłową i pamięć [00:08:40].
- Melatonina – ułatwia zasypianie, a także łagodzi objawy refluksowe i może obniżać ciśnienie tętnicze [00:10:32].
- Kolagen – poprawia kondycję stawów, skóry, wzmacnia kości i naczynia krwionośne [00:11:42].
-
GRUPA 4: Znikoma skuteczność działania, niepolecane
- L-Karnityna – jej efekt odchudzający jest marginalny (ok. 1,1 kg redukcji masy ciała w ciągu 8–30 tygodni) [00:01:56].
- Buzdyganek naziemny (Tribulus Terrestris) – nie ma solidnych dowodów na to, że podnosi poziom testosteronu u większości osób [00:02:50].
- Woda alkaliczna – promowana głównie marketingowo, organizm sam reguluje równowagę kwasowo-zasadową [00:03:30].
- Wapń – suplementacja u dorosłych i starszych ma niewielki wpływ na gęstość kości, a może nieść nieznaczne ryzyko dla układu krążenia [00:05:06].
-
-
-
www.youtube.com www.youtube.com
-
Miliony nowych komórek MÓZGU i mniejsze ryzyko DEMENCJI o 50%
- Tajemnicza substancja BDNF: Kluczowym elementem chroniącym mózg jest BDNF (neurotroficzny czynnik pochodzenia mózgowego), białko działające jak „naturalny nawóz” dla komórek nerwowych [00:00:55]–[00:01:13].
- Wytwarzanie nowych komórek: BDNF stymuluje powstawanie nowych komórek nerwowych i połączeń, zwiększając sprawność umysłową, pojemność pamięci i odporność na zmiany neurodegeneracyjne [00:00:24].
- Mniejsze ryzyko demencji: Wyższy poziom BDNF we krwi wiąże się z aż o 51% mniejszym ryzykiem rozwoju demencji i o 54% mniejszym ryzykiem choroby Alzheimera [00:01:30].
- Osoby szczególnie potrzebujące BDNF: Na podniesieniu poziomu BDNF mogą skorzystać osoby starsze, osoby po udarze mózgu (gdzie poziom spada o ok. 55%) [00:02:14], osoby z depresją [00:02:54], cukrzycą (w kontekście neuropatii) [00:03:30], żyjące w ciągłym stresie [00:05:12] oraz z nadwagą/otyłością [00:05:48].
- Czynniki obniżające BDNF: Negatywny wpływ na poziom BDNF ma przewlekły stres (poprzez kortyzol) [00:05:21] oraz alkohol (niezależnie od dawki) [00:06:33].
- Co podnosi BDNF (Dieta i Suplementacja):
- Ser pleśniowy (np. Brie, Camembert, 30 g dziennie) [00:07:35].
- Produkty bogate w kwas alfa-linolenowy (olej lniany, nasiona lnu, orzechy włoskie, nasiona chia) [00:08:00].
- Kwasy tłuszczowe Omega-3 (tłuste ryby: łosoś, śledź, sardynki, makrela) [00:08:34].
- Kurkumina (powyżej 500 mg dziennie) [00:08:50].
- Cynk (30 mg glukonianu cynku dziennie lub z pożywienia: mięso, ryby, podroby, pestki dyni) [00:09:42]–[00:10:06].
- Probiotyki (mieszanka szczepów Lactobacillus i Bifidobacterium) [00:10:25].
- Dieta ketogeniczna (w badaniu po 3 tygodniach poziom BDNF był wyższy o 47%) [00:11:12].
- Borówki, kakao i gorzka czekolada (badania na zwierzętach) [00:11:46].
- Co podnosi BDNF (Aktywność):
- Ruch i ćwiczenia fizyczne (spacery, bieganie, siłownia, 3-4 razy w tygodniu, łącznie min. 2,5 godz. tygodniowo) [00:11:54]–[00:12:21].
-
-
www.biorxiv.org www.biorxiv.org
-
Author response:
Reviewer #1 (Public review):
Summary:
The authors examine the neural correlates of face recognition deficits in individuals with Developmental Prosopagnosia (DP; 'face blindness'). Contrary to theories that poor face recognition is driven by reduced spatial integration (via smaller receptive fields), here the authors find that the properties of receptive fields in face-selective brain regions are the same in typical individuals vs. those with DP. The main analysis technique is population Receptive Field (pRF) mapping, with a wide range of measures considered. The authors report that there are no differences in goodness-of-fit (R2), the properties of the pRFs (neither size, location, nor the gain and exponent of the Compressive Spatial Summation model), nor their coverage of the visual field. The relationship of these properties to the visual field (notably the increase in pRF size with eccentricity) is also similar between the groups. Eye movements do not differ between the groups.
Strengths:
Although this is a null result, the large number of null results gives confidence that there are unlikely to be differences between the two groups. Together, this makes a compelling case that DP is not driven by differences in the spatial selectivity of face-selective brain regions, an important finding that directly informs theories of face recognition. The paper is well written and enjoyable to read, the studies have clearly been carefully conducted with clear justification for design decisions, and the analyses are thorough.
Weaknesses:
One potential issue relates to the localisation of face-selective regions in the two groups. As in most studies of the neural basis of face recognition, localisers are used to find the face-selective Regions of Interest (ROIs) - OFA, mFus, and pFus, with comparison to the scene-selective PPA. To do so, faces are contrasted against other objects to find these regions (or scenes vs. others for the PPA). The one consistent difference that does emerge between groups in the paper is in the selectivity of these regions, which are less selective for faces in DP than in typical individuals (e.g., Figure 1B), as one might expect. 6/20 prosopagnosic individuals are also missing mFus, relative to only 2/20 typical individuals. This, to me, raises the question of whether the two groups are being compared fairly. If the localised regions were smaller and/or displaced in the DPs, this might select only a subset of the neural populations typically involved in face recognition. Perhaps the difference between groups lies outside this region. In other words, it could be that the differences in prosopagnosic face recognition lie in the neurons that are not able to be localised by this approach. The authors consider in the discussion whether their DPs may not have been 'true DPs', which is convincing (p. 12). The question here is whether the regions selected are truly the 'prosopagnosic brain areas' or whether there is a kind of survivor bias (i.e., the regions selected are normal, but perhaps the difference lies in the nature/extent of the regions. At present, the only consideration given to explain the differences in prosopagnosia is that there may be 'qualitative' differences between the two (which may be true), but I would give more thought to this.
We acknowledge that face-selective ROIs in DPs, relative to controls, may be smaller, less selective, or altogether missing when traditional methods of localization with fixed thresholds are used (Furl et al, 2011). For this reason - to circumvent potential survivor bias and ensure ROI voxel counts across participants are equated - we used a method of ROI definition whereby each subject’s individual statistical map from the localizer was intersected with a generously-sized group mask for each ROI and the top 20% most category-selective voxels were retained for the pRF analysis (Norman-Haignere et al., 2013; Jiahui et al., 2018). This means that the raw number of voxels per ROI was equal across all participants with respect to the common group space, thereby ensuring a fair comparison even in cases where one group shows diminished category-selectivity. The details of the ROI definition are provided in the Methods at the end of the manuscript. To ensure readers understand our approach, we will also make more explicit mention of this in the main body of the manuscript.
With regard to the question of whether face-selective ROIs may be displaced in DPs compared to controls, previous work from the senior author’s lab (Jiahui et al., 2018) shows that, despite exhibiting weaker activations, the peak coordinates of significant clusters in DPs occupy very similar locations to those of controls. And, even if there were indeed slight displacements of face-selective ROIs for some subjects, the group-defined masks used in the present analysis were large enough to capture the majority of the top voxels. In the supplemental materials section, we will include a diagram of the group masks used in our study.
The reviewer here also points out that more DPs than controls were missing the mFUS region (6/20 DPs vs 2/20 controls; Figure 1C). However, ‘missing’ in this context was not based on face-selectivity but rather a lack of retinotopic tuning. PRFs were fit to all voxels within each ROI - with all subjects starting out with equal voxel counts - and thereafter, voxels for which the variance explained by the pRF model was below 20% were excluded from subsequent analysis. We decided that any ROI with fewer than 10 voxels remaining after thresholding on the pRF fit should be deemed ‘missing’ since we considered the amount of data insufficient to reliably characterize the region’s retinotopic profile. While it may be somewhat interesting that four more DPs than controls were ‘missing’ left mFUS, using this particular set of decision criteria, it is important to keep in mind that left mFUS was just one of six face-selective regions under study. The other five regions, many of which evinced strong fits by the pRF model, were represented comparably in DPs and controls and showed high similarity in the pRF parameters. Furthermore, across most participants, mFUS exhibited a low proportion of retinotopically modulated voxels (defined as voxels with pRF R squared greater than 20%, see Figure 1D). A follow-up analysis showed that the count of voxels surviving pRF R squared thresholding in left mFUS was not significantly correlated with mean pRF size (r(30)=0.23, t=1.28, p=0.21) indicating that the greater exclusion of DPs in this region is unlikely to have biased the group’s average pRF size.
The discussion considers the differences between the current study and an unpublished preprint (Witthoft et al, 2016), where DPs were found to have smaller pRFs than typical individuals. The discussion presents the argument that the current results are likely more robust, given the use of images within the pRF mapping stimuli here (faces, objects, etc) as opposed to checkerboards in the prior work, and the use of the CSS model here as opposed to a linear Gaussian model previously. This is convincing, but fails to address why there is a lack of difference in the control vs. DP group here. If anything, I would have imagined that the use of faces in mapping stimuli would have promoted differences between the groups (given the apparent difference in selectivity in DPs vs. controls seen here), which adds to the reliability of the present result. Greater consideration of why this should have led to a lack of difference would be ideal. The latter point about pRF models (Gaussian vs. CSS) does seem pertinent, for instance - could the 'qualitative' difference lead to changes in the shape of these pRFs in prosopagnosia that are better characterised by the CSS model, perhaps? Perhaps more straightforwardly, and related to the above, could differences in the localisation of face-selective regions have driven the difference in prior work compared to here?
We agree that the use of high-level mapping stimuli (including faces) adds to the reliability of the present results for DPs and could have further emphasized differences between the groups if true differences did, in fact, exist. We speculate on the extent to which the type of mapping stimuli and various other methodological factors (e.g. stimulus size, aperture design, pRF model) could have explained the divergent findings in our study versus that of Witthoft et al. (2016) in the section of the Discussion titled, “What factors may have contributed to the different results for the present study and Witthoft et al. (2016)”. In brief, our use of more colorful, naturalistic stimuli targeting higher-level visual areas elicited better model fits than the black and white checkerboard pattern used by Witthoft et al. (2016). The CSS model we used is better suited for higher-level regions and makes fewer assumptions than the linear pRF model. The field of view of our stimulus was smaller but still relevant for real-world perception of faces. Finally, our aperture design and longer run length likely also improved reliability. Overall, these methodological improvements, along with our larger sample size, provide stronger evidence for our findings. These are our best attempts to make sense of the divergent findings, but it is not possible to come to a definitive explanation. Examples abound of exaggerated or spurious effects from small-scale studies that ultimately fail to replicate in the related field of dyslexia research (Jednorog et al., 2015; Ramus et al., 2018) and neuroimaging research more generally (Turner et al., 2018; Poldrack et al., 2017). Sometimes there are clear explanations for a lack of replicability (e.g. software bugs, overly flexible preprocessing methods, etc.), but many times the real reason cannot be determined.
Regarding the type of pRF model deployed, our use of a non-linear exponent (versus a linear model as in the Witthoft et al. (2016) preprint) is unlikely to explain the similarity we observed between the groups in terms of pRF size. Specifically, the groups did not show substantial differences in the exponent by ROI, as seen in Figure 1E, so the use of a linear model should, in theory, produce similar outcomes for the two groups. We will mention this point in the main text.
Finally, the lack of variations in the spatial properties of these brain regions is interesting in light of the theories that spatial integration is a key aspect of effective face recognition. In this context, it is interesting to note the marked drop in R2 values in face-selective regions like mFus relative to earlier cortex. The authors note in some sense that this is related to the larger receptive field size, but is there a broader point here that perhaps the receptive field model (even with Compressive Spatial Summation) is simply a poor fit for the function of these areas? Could it be that these areas are simply not spatial at all? A broader link between the null results presented here and their implications for theories of face recognition would be ideal.
The weaker pRF fits found in mFUS, to us, raise the question of whether there is a more effective pRF stimulus for these more anterior regions. For example, it might be possible to obtain higher and more reliable responses there using single isolated faces (Cf. Kay, Weiner, Grill-Spector, 2015). More broadly, though, we agree that it is important to acknowledge that the receptive field model might ultimately be a coarse and incomplete characterization of neural function in these areas. As the other reviewer suggests, one possibility is that other brain processes (e.g. functional or structural connectivity between ROIs) may give rise to holistic face processing in ways that are not captured by pRF properties.
Reviewer #2 (Public review):
Summary:
This is a well-conducted and clearly written manuscript addressing the link between population receptive fields (pRFs) and visual behavior. The authors test whether developmental prosopagnosia (DP) involves atypical pRFs in face-selective regions, a hypothesis suggested by prior work with a small DP sample. Using a larger cohort of DPs and controls, robust pRF mapping with appropriate stimuli and CSS modeling, and careful in-scanner eye tracking, the authors report no group differences in pRF properties across the visual processing hierarchy. These results suggest that reduced spatial integration is unlikely to account for holistic face processing deficits in DP.
Strengths:
The dataset quality, sample size, and methodological rigor are notable strengths.
Weaknesses:
The primary concern is the interpretation of the results.
(1) Relationship between pRFs and spatial integration
While atypical pRF properties could contribute to deficits in spatial integration, impairments in holistic processing in DPs are not necessarily caused by pRF abnormalities. The discussion could be strengthened by considering alternative explanations for reduced spatial integration, such as altered structural or functional connectivity in the face network, which has been reported to underlie DP's difficulties in integrating facial features.
We agree the Discussion section could benefit from mentioning that alterations to other neural mechanisms, besides pRF organization, could produce deficits in holistic processing. This could take the form of altered functional connectivity (Rosenthal et al., 2017; Lohse et al., 2016; Avidan et al., 2014) or altered structural connectivity (Gomez et al., 2015; Song et al., 2015)
(2) Beyond the null hypothesis testing framework
The title claims "normal spatial integration," yet this conclusion is based on a failure to reject the null hypothesis, which does not justify accepting the alternative hypothesis. To substantiate a claim of "normal," the authors would need to provide analyses quantifying evidence for the absence of effects, e.g., using a Bayesian framework.
We acknowledge that, using frequentist statistical methods, failing to reject the null hypothesis is not sufficient to claim equivalence. For the revision, we will look into additional analyses that could quantify evidence for the null hypothesis. And we will adjust the wording of the title in this regard.
(3) Face-specific or broader visual processing
Prior work from the senior author's lab (Jiahui et al., 2018) reported pronounced reductions in scene selectivity and marginal reductions in body selectivity in DPs, suggesting that visual processing deficits in DPs may extend beyond faces. While the manuscript includes PPA as a high-level control region for scene perception, scene selectivity was not directly reported. The authors could also consider individual differences and potential data-quality confounds (tSNR difference between and within groups, several obvious outliers in the figures, etc). For instance, examining whether reduced tSNR in DPs contributed to lower face selectivity in the DP group in this dataset.
Thank you for this suggestion - we will compare tSNR between the groups as a measure of data quality and we will include these comparisons. A preliminary look indicates that both groups possessed similar distributions of tSNR across many of the face-selective regions investigated here.
(4) Linking pRF properties to behavior
The manuscript aims to examine the relationship between pRF properties and behavior, but currently reports only one aspect of pRF (size) in relation to a single behavioral measure (CFMT), without full statistical reporting:
"We found no significant association between participants' CFMT scores and mean pRF size in OFA, pFUS, or mFUS."
For comprehensive reporting, the authors could examine additional pRF properties (e.g., center, eccentricity, scaling between eccentricity and pRF size, shape of visual field coverage, etc), additional ROIs (early, intermediate, and category-selective areas), and relate them to multiple behavioral measures (e.g., HEVA, PI20, FFT). This would provide a full picture of how pRF characteristics relate to behavioral performance in DP.
We will report the full statistical values (r, p) for the (albeit non-significant) relationship between CFMT score and pRF size - thank you for bringing that to our attention. Additionally, we will add other analyses assessing the relationship between a wider array of pRF measures and the other behavioral tests administered to provide a more comprehensive picture of the relation between pRFs and behavior.
References:
Avidan, G., Tanzer, M., Hadj-Bouziane, F., Liu, N., Ungerleider, L. G., & Behrmann, M. (2014). Selective Dissociation Between Core and Extended Regions of the Face Processing Network in Congenital Prosopagnosia. Cerebral Cortex, 24(6), 1565–1578. https://doi.org/10.1093/cercor/bht007
Furl, N., Garrido, L., Dolan, R. J., Driver, J., & Duchaine, B. (2011). Fusiform gyrus face selectivity relates to individual differences in facial recognition ability. Journal of Cognitive Neuroscience, 23(7), 1723–1740. https://doi.org/10.1162/jocn.2010.21545
Gomez, J., Pestilli, F., Witthoft, N., Golarai, G., Liberman, A., Poltoratski, S., Yoon, J., & Grill-Spector, K. (2015). Functionally Defined White Matter Reveals Segregated Pathways in Human Ventral Temporal Cortex Associated with Category-Specific Processing. Neuron, 85(1), 216–227. https://doi.org/10.1016/j.neuron.2014.12.027
Jednoróg, K., Marchewka, A., Altarelli, I., Monzalvo Lopez, A. K., van Ermingen-Marbach, M., Grande, M., Grabowska, A., Heim, S., & Ramus, F. (2015). How reliable are gray matter disruptions in specific reading disability across multiple countries and languages? Insights from a large-scale voxel-based morphometry study. Human Brain Mapping, 36(5), 1741–1754. https://doi.org/10.1002/hbm.22734
Jiahui, G., Yang, H., & Duchaine, B. (2018). Developmental prosopagnosics have widespread selectivity reductions across category-selective visual cortex. Proceedings of the National Academy of Sciences of the United States of America, 115(28), E6418–E6427. https://doi.org/10.1073/pnas.1802246115
Kay, K. N., Weiner, K. S., Kay, K. N., & Weiner, K. S. (2015). Attention Reduces Spatial Uncertainty in Human Ventral Temporal Cortex Attention Reduces Spatial Uncertainty in Human Ventral Temporal Cortex. Current Biology, 25(5), 595–600. https://doi.org/10.1016/j.cub.2014.12.050
Lohse, M., Garrido, L., Driver, J., Dolan, R. J., Duchaine, B. C., & Furl, N. (2016). Effective connectivity from early visual cortex to posterior occipitotemporal face areas supports face selectivity and predicts developmental prosopagnosia. Journal of Neuroscience, 36(13), 3821–3828. https://doi.org/10.1523/JNEUROSCI.3621-15.2016
Norman-Haignere, S., Kanwisher, N., & McDermott, J. H. (2013). Cortical pitch regions in humans respond primarily to resolved harmonics and are located in specific tonotopic regions of anterior auditory cortex. Journal of Neuroscience, 33(50), 19451–19469. https://doi.org/10.1523/JNEUROSCI.2880-13.2013
Poldrack, R. A., Baker, C. I., Durnez, J., Gorgolewski, K. J., Matthews, P. M., Munafò, M. R., Nichols, T. E., Poline, J. B., Vul, E., & Yarkoni, T. (2017). Scanning the horizon: Towards transparent and reproducible neuroimaging research. Nature Reviews Neuroscience, 18(2), 115–126. https://doi.org/10.1038/nrn.2016.167
Ramus, F., Altarelli, I., Jednoróg, K., Zhao, J., & Scotto di Covella, L. (2018). Neuroanatomy of developmental dyslexia: Pitfalls and promise. Neuroscience and Biobehavioral Reviews, 84(July 2017), 434–452. https://doi.org/10.1016/j.neubiorev.2017.08.001
Rosenthal, G., Tanzer, M., Simony, E., Hasson, U., Behrmann, M., & Avidan, G. (2017). Altered topology of neural circuits in congenital prosopagnosia. ELife, 6, 1–20. https://doi.org/10.7554/eLife.25069
Song, S., Garrido, L., Nagy, Z., Mohammadi, S., Steel, A., Driver, J., Dolan, R. J., Duchaine, B., & Furl, N. (2015). Local but not long-range microstructural differences of the ventral temporal cortex in developmental prosopagnosia. Neuropsychologia, 78, 195–206. https://doi.org/10.1016/j.neuropsychologia.2015.10.010
Turner, B. O., Paul, E. J., Miller, M. B., & Barbey, A. K. (2018). Small sample sizes reduce the replicability of task-based fMRI studies. Communications Biology, 1(1). https://doi.org/10.1038/s42003-018-0073-z
Witthoft, N., Poltoratski, S., Nguyen, M., Golarai, G., Liberman, A., LaRocque, K., Smith, M., & Grill-Spector, K. (2016). Reduced spatial integration in the ventral visual cortex underlies face recognition deficits in developmental prosopagnosia. BioRxiv, 1–26.
-
-
bafkreieyrqkffsj5gymetgjrgxdlcdyohbbbmm3msar4c6lfioqczsgvvy.ipfs.dweb.link bafkreieyrqkffsj5gymetgjrgxdlcdyohbbbmm3msar4c6lfioqczsgvvy.ipfs.dweb.link
-
Local file Local file
-
o
Its pretty sad how bad both our actual relations with middle eastern countries have been and our view of middle eastern people have been. Our government has been focused on meddling and destroying, and our news/figures our focused on spreading pro-war, pro-Israel propaganda.
-
-
www.biorxiv.org www.biorxiv.org
-
Author response:
The following is the authors’ response to the original reviews.
Reviewer #1 (Public review):
Summary:
Recruitment of neutrophils to the lungs is known to drive susceptibility to infection with M. tuberculosis. In this study, the authors present data in support of the hypothesis that neutrophil production of the cytokine IL-17 underlies the detrimental effect of neutrophils on disease. They claim that neutrophils harbor a large fraction of Mtb during infection, and are a major source of IL-17. To explore the effects of blocking IL-17 signaling during primary infection, they use IL-17 blocking antibodies, SR221 (an inverse agonist of Th17 differentiation), and celecoxib, which they claim blocks Th17 differentiation, and observe modest improvements in bacterial burdens in both WT and IFN-γ deficient mice using the combination of IL-17 blockade with celecoxib during primary infection. Celecoxib enhances control of infection after BCG vaccination.
Thank you for the summary.
Strengths:
The most novel finding in the paper is that treatment with celecoxib significantly enhances control of infection in BCG-vaccinated mice that have been challenged with Mtb. It was already known that NSAID treatments can improve primary infection with Mtb.
Thank you.
Weaknesses:
The major claim of the manuscript - that neutrophils produce IL-17 that is detrimental to the host - is not strongly supported by the data. Data demonstrating neutrophil production of IL17 lacks rigor.
Our response: Neutrophil production of IL-17 is supported by two independent methods/ techniques in the current version:
(1) Through Flow cytometry- a large fraction of Ly6G<sup>+</sup>CD11b<sup>+</sup> cells from the lungs of Mtb-infected mice were also positive for IL-17 (Fig. 3C).
(2) IFA co-staining of Ly6G <SUP>+</SUP> cells with IL-17 in the lung sections from Mtb-infected mice (Fig. 3 E_G and Fig. 4H, Fig. 5I). For most of these IFA data, we provide quantified plots to show IL17<SUP>+</SUP>Ly6G<SUP>+</SUP> cells.
(3) Most importantly, conditions that inhibited IL-17 levels and controlled infection also showed a decline in IL-17 staining in Ly6G<SUP>+</SUP> cells.
Our efforts on IL-17 ELISPOT assay were not very successful and it needs further standardization.
Several independent publications support the production of IL-17 by neutrophils (Li et al. 2010; Katayama et al. 2013; Lin et al. 2011). For example, neutrophils have been identified as a source of IL-17 in human psoriatic lesions (Lin et al. 2011), in neuroinflammation induced by traumatic brain injury (Xu et al. 2023) and in several mouse models of infectious and autoimmune inflammation (Ferretti et al. 2003; Hoshino et al. 2008) (Li et al. 2010).
The experiments examining the effects of inhibitors of IL-17 on the outcome of infection are very difficult to interpret. First, treatment with IL-17 inhibitors alone has no impact on bacterial burdens in the lung, either in WT or IFN-γ KO mice. This suggests that IL-17 does not play a detrimental role during infection. Modest effects are observed using the combination of IL-17 blocking drugs and celecoxib, however, the interpretation of these results mechanistically is complicated. Celecoxib is not a specific inhibitor of Th17. Indeed, it affects levels of PGE2, which is known to have numerous impacts on Mtb infection separate from any effect on IL-17 production, as well as other eicosanoids.
The reviewer correctly says that Celecoxib is not a specific inhibitor of Th17. However, COX2 inhibition does have an effect on IL-17 levels, and numerous reports support this observation (Paulissen et al. 2013; Napolitani et al. 2009; Lemos et al. 2009).
(1) The detrimental role of IL-17 is obvious in the IFNγ KO experiment, where IL-17 neutralization led to a significant improvement in the lung pathology.
(2) In the highly susceptible IFNγ KO mice, IL-17 neutralization alone extended the survival of mice by ~10 days.
(3) IL-17 production independent of IL-23 is known to require PGE2 (Paulissen et al. 2013; Polese et al. 2021). In either WT or IFNγ KO mice, in contrast to IL-17 levels, we observed a decline in IL-23 levels. The PGE2 dependence of IL-17 production is obvious in the WT mice, where celecoxib abrogated IL-17 production.
(4) While deciding the impact of celecoxib or IL17 inhibition, looking at the cumulative readout of lung CFU, spleen CFU, Ly6G<sup>+</sup> cell recruitment, Ly6G<sup>+</sup> cell-resident Mtb pool and overall pathology, the effects are quite significant.
(5) Finally, in the revised manuscript, we provide additional results on the effect of SR2211 in BCG-vaccinated animals. It shows the direct impact of IL-17 inhibition on the BCG vaccine efficacy in WT mice.
Finally, the human data simply demonstrates that neutrophils and IL-17 both are higher in patients who experience relapse after treatment for TB, which is expected and does not support their specific hypothesis.
We disagree with the above statement. It also contradicts reviewers’ own assessments in one of the comments below, where a protective role of IL-17 is referred to. The literature lacks consensus in terms of a protective or pathological role of IL-17 in TB. Therefore, it was not expected to see higher IL-17 in patients who experienced relapse, death, or failed treatment outcomes. We do not have evidence from human subjects whether neutrophil-derived IL-17 has a similar pathological role as observed in mice. However, higher IL-17 in failed outcome cases confirm the central theme that IL-17 is pathological in both human and mouse models.
The use of genetic ablation of IL-17 production specifically in neutrophils and/or IL-17R in mice would greatly enhance the rigor of this study.
The reviewer’s point is well-taken. Having a genetic ablation of IL-17 production, specifically in the neutrophils, would be excellent. At present, however, we lack this resource. For the revised manuscript, we include the data with SR2211, a direct inhibitor of RORgt and, therefore, IL-17, in BCG-vaccinated mice.
The authors do not address the fact that numerous studies have shown that IL-17 has a protective effect in the mouse model of TB in the context of vaccination.
Yes, there are a few articles that talk about the protective effect of IL-17 in the mouse model of TB in the context of vaccination (Khader et al. 2007; Desel et al. 2011; Choi et al. 2020). This part was discussed in the original manuscript (in the Introduction section). For the revised manuscript, we also provide results from the experiment where we blocked IL-17 production by inhibiting RORgt using SR2211 in BCG-vaccinated mice. The results clearly show IL-17 as a negative regulator of BCG-mediated protective immunity. We believe some of the reasons for the observed differences could be 1) in our study, we analysed IL-17 levels in the lung homogenates at late phases of infection, and 2) most published studies rely on ex vivo stimulation of immune cells to measure cytokine production, whereas we actually measured the cytokine levels in the lung homogenates. We will elaborate on these points in the revised version.
Finally, whether and how many times each animal experiment was repeated is unclear.
We provide the details of the number of experiments in the revised version. Briefly, the BCG vaccination experiment (Figure 1) and BCG vaccination with Celecoxib treatment experiment (Figure 6) were performed twice and thrice, respectively. The IL-17 neutralization experiment (Figure 4) and the SR2211 treatment experiment (Figure 5) were done once. We will add another SR2211 experiment data in the revised version.
Reviewer #2 (Public review):
Summary:
In this study, Sharma et al. demonstrated that Ly6G+ granulocytes (Gra cells) serve as the primary reservoirs for intracellular Mtb in infected wild-type mice and that excessive infiltration of these cells is associated with severe bacteremia in genetically susceptible IFNγ/- mice. Notably, neutralizing IL-17 or inhibiting COX2 reversed the excessive infiltration of Ly6G+Gra cells, mitigated the associated pathology, and improved survival in these susceptible mice. Additionally, Ly6G+Gra cells were identified as a major source of IL-17 in both wild-type and IFNγ-/- mice. Inhibition of RORγt or COX2 further reduced the intracellular bacterial burden in Ly6G+Gra cells and improved lung pathology.
Of particular interest, COX2 inhibition in wild-type mice also enhanced the efficacy of the BCG vaccine by targeting the Ly6G+Gra-resident Mtb population.
Thank you for the summary.
Strengths:
The experimental results showing improved BCG-mediated protective immunity through targeting IL-17-producing Ly6G+ cells and COX2 are compelling and will likely generate significant interest in the field. Overall, this study presents important findings, suggesting that the IL-17-COX2 axis could be a critical target for designing innovative vaccination strategies for TB.
Thank you for highlighting the overall strengths of the study.
Weaknesses:
However, I have the following concerns regarding some of the conclusions drawn from the experiments, which require additional experimental evidence to support and strengthen the overall study.
Major Concerns:
(1) Ly6G+ Granulocytes as a Source of IL-17: The authors assert that Ly6G+ granulocytes are the major source of IL17 in wild-type and IFN-γ KO mice based on colocalization studies of Ly6G and IL-17. In Figure 3D, they report approximately 500 Ly6G+ cells expressing IL-17 in the Mtb-infected WT lung. Are these low numbers sufficient to drive inflammatory pathology? Additionally, have the authors evaluated these numbers in IFN-γ KO mice?
Thank you for pointing out the numbers in Fig. 3D It was our oversight to label the axis as No. of. For the observation that Ly6G<sup>+</sup> Gra are the major source of IL-17 in TB, we have used two separate strategies- a) IFA and b) FACS IL17<SUP>+</SUP> Ly6G<SUP>+</SUP> Gra/lung. For this data, only a part of the lung was used. For the revised manuscript, we provide the number of these cells at the whole lung level from Mtb-infected WT mice. Unfortunately, we did not evaluate these numbers in IFN-γ KO mice through FACS..
Our efforts to perform the IL-17 ELISpot assay on the sorted Ly6G<SUP>+</SUP>Gra from the lungs of Mtbinfected WT mice were unsuccessful. However, we provide a quantified representation of IFA of the tissue sections to stress upon the role of Ly6G<SUP>+</SUP> cells in IL-17 production in TB pathogenesis.
(2) Role of IL-17-Producing Ly6G Granulocytes in Pathology: The authors suggest that IL-17producing Ly6G granulocytes drive pathology in WT and IFN-γ KO mice. However, the data presented only demonstrate an association between IL-17<SUP>+</SUP> Ly6G cells and disease pathology. To strengthen their conclusion, the authors should deplete neutrophils in these mice to show that IL-17 expression, and consequently the pathology, is reduced.
Thank you for this suggestion. Neutrophil depletion studies in TB remain inconclusive. In some studies, neutrophil depletion helps the pathogen (Rankin et al. 2022; Pedrosa et al. 2000; Appelberg et al. 1995), and in others, it helps the host (Lovewell et al. 2021; Mishra et al. 2017). One reason for this variability is the stage of infection when neutrophil depletion was done. However, another crucial factor is the heterogeneity in the neutrophil population. There are reports that suggest neutrophil subtypes with protective versus pathological trajectories (Nwongbouwoh Muefong et al. 2022; Lyadova 2017; Hellebrekers, Vrisekoop, and Koenderman 2018; Leliefeld et al. 2018). Depleting the entire population using anti-Ly6G could impact this heterogeneity and may impact the inferences drawn.
A better approach would be to characterise this heterogeneous population, efforts towards which could be part of a separate study. Another direct approach could be Ly6G<SUP>+</SUP>-specific deletion of IL-17 function as part of a separate study.
For the revised manuscript, we provide results from the SR2211 experiment in BCG-vaccinated mice and other results to show the role of IL-17-producing Ly6G<SUP>+</SUP> Gra in TB pathology.
(3) IL-17 Secretion by Mtb-Infected Neutrophils: Do Mtb-infected neutrophils secrete IL-17 into the supernatants? This would serve as confirmation of neutrophil-derived IL-17. Additionally, are Ly6G<SUP>+</SUP> cells producing IL-17 and serving as pathogenic agents exclusively in vivo? The authors should provide comments on this.
Secretion of IL-17 by Mtb-infected neutrophils in vitro has been reported earlier (Hu et al. 2017). Our efforts to do a neutrophil IL-17 ELISPOT assay were not successful, and we are still standardising it. Whether there are a few neutrophil roles exclusively seen under in vivo conditions is an interesting proposition.
(4) Characterization of IL-17-Producing Ly6G+ Granulocytes: Are the IL-17-producing Ly6G+ granulocytes a mixed population of neutrophils and eosinophils, or are they exclusively neutrophils? Sorting these cells followed by Giemsa or eosin staining could clarify this.
This is a very important point. While usually eosinophils do not express Ly6G markers in laboratory mice, under specific contexts, including infections, eosinophils can express Ly6G. Since we have not characterized these potential Ly6G<SUP>+</SUP> sub-populations, that is one of the reasons we refer to the cell types as Ly6G<SUP>+</SUP> granulocytes, which do not exclude Ly6G<SUP>+</SUP> eosinophils. A detailed characterization of these subsets could be taken up as a separate study.
Reviewer #3 (Public review):
Summary:
The authors examine how distinct cellular environments differentially control Mtb following BCG vaccination. The key findings are that IL17-producing PMNs harbor a significant Mtb load in both wild-type and IFNg<sup>-/-</sup> mice. Targeting IL17 and Cox2 improved disease and enhanced BCG efficacy over 12 weeks and neutrophils/IL17 are associated with treatment failure in humans. The authors suggest that targeting these pathways, especially in MSMD patients may improve disease outcomes.
Thank you.
Strengths:
The experimental approach is generally sound and consists of low-dose aerosol infections with distinct readouts including cell sorting followed by CFU, histopathology, and RNA sequencing analysis. By combining genetic approaches and chemical/antibody treatments, the authors can probe these pathways effectively.
Understanding how distinct inflammatory pathways contribute to control or worsen Mtb disease is important and thus, the results will be of great interest to the Mtb field
Thank you.
Weaknesses:
A major limitation of the current study is overlooking the role of non-hematopoietic cells in the IFNg/IL17/neutrophil response. Chimera studies from Ernst and colleagues (Desvignes and Ernst 2009) previously described this IDO-dependent pathway following the loss of IFNg through an increased IL17 response. This study is not cited nor discussed even though it may alter the interpretation of several experiments.
Thank you for pointing out this earlier study, which we concede, we missed discussing. We disagree on the point that results from that study may alter the interpretation of several experiments in our study. On the contrary, the main observation that loss of IFNγ causes severe IL-17 levels is aligned in both studies.
IDO1 is known to alter T-helper cell differentiation towards Tregs and away from Th17 (Baban et al. 2009). It is absolutely feasible for the non-hematopoietic cells to regulate these events. However, that does not rule out the neutrophil production of IL-17 and the downstream pathological effect shown in this study. We have discussed and cited this study in the revised manuscript.
Several of the key findings in mice have previously been shown (albeit with less sophisticated experimentation) and human disease and neutrophils are well described - thus the real new finding is how intracellular Mtb in neutrophils are more refractory to BCG-mediated control. However, given there are already high levels of Mtb in PMNs compared to other cell types, and there is a decrease in intracellular Mtb in PMNs following BCG immunization the strength of this finding is a bit limited.
The reviewer’s interpretation of the BCG-refractory Mtb population in the neutrophil is interesting. The reviewer is right that neutrophils had a higher intracellular Mtb burden, which decreased in the BCG-vaccinated animals. Thus, on that account, the reviewer rightly mentions that BCG is able to control Mtb even in neutrophils. However, BCG almost clears intracellular burden from other cell types analysed, and therefore, the remnant pool of intracellular Mtb in the lungs of BCG-vaccinated animals could be mostly those present in the neutrophils. This is a substantial novel development in the field and attracts focus towards innate immune cells for vaccine efficacy.
References:
Appelberg, R., A. G. Castro, S. Gomes, J. Pedrosa, and M. T. Silva. 1995. 'SuscepBbility of beige mice to Mycobacterium avium: role of neutrophils', Infect Immun, 63: 3381-7.
Baban, B., P. R. Chandler, M. D. Sharma, J. Pihkala, P. A. Koni, D. H. Munn, and A. L. Mellor. 2009. 'IDO acBvates regulatory T cells and blocks their conversion into Th17-like T cells', J Immunol, 183: 2475-83.
Choi, H. G., K. W. Kwon, S. Choi, Y. W. Back, H. S. Park, S. M. Kang, E. Choi, S. J. Shin, and H. J. Kim. 2020. 'AnBgen-Specific IFN-gamma/IL-17-Co-Producing CD4(+) T-Cells Are the Determinants for ProtecBve Efficacy of Tuberculosis Subunit Vaccine', Vaccines (Basel), 8.
Cruz, A., A. G. Fraga, J. J. Fountain, J. Rangel-Moreno, E. Torrado, M. Saraiva, D. R. Pereira, T. D. Randall, J. Pedrosa, A. M. Cooper, and A. G. Castro. 2010. 'Pathological role of interleukin 17 in mice subjected to repeated BCG vaccinaBon afer infecBon with Mycobacterium tuberculosis', J Exp Med, 207: 1609-16.
Desel, C., A. Dorhoi, S. Bandermann, L. Grode, B. Eisele, and S. H. Kaufmann. 2011. 'Recombinant BCG DeltaureC hly+ induces superior protecBon over parental BCG by sBmulaBng a balanced combinaBon of type 1 and type 17 cytokine responses', J Infect Dis, 204: 1573-84.
Desvignes, L., and J. D. Ernst. 2009. 'Interferon-gamma-responsive nonhematopoieBc cells regulate the immune response to Mycobacterium tuberculosis', Immunity, 31: 974-85.
Ferreg, S., O. Bonneau, G. R. Dubois, C. E. Jones, and A. Trifilieff. 2003. 'IL-17, produced by lymphocytes and neutrophils, is necessary for lipopolysaccharide-induced airway neutrophilia: IL-15 as a possible trigger', J Immunol, 170: 2106-12.
Hellebrekers, P., N. Vrisekoop, and L. Koenderman. 2018. 'Neutrophil phenotypes in health and disease', Eur J Clin Invest, 48 Suppl 2: e12943.
Hoshino, A., T. Nagao, N. Nagi-Miura, N. Ohno, M. Yasuhara, K. Yamamoto, T. Nakayama, and K. Suzuki. 2008. 'MPO-ANCA induces IL-17 producBon by acBvated neutrophils in vitro via classical complement pathway-dependent manner', J Autoimmun, 31: 79-89.
Hu, S., W. He, X. Du, J. Yang, Q. Wen, X. P. Zhong, and L. Ma. 2017. 'IL-17 ProducBon of Neutrophils Enhances AnBbacteria Ability but Promotes ArthriBs Development During Mycobacterium tuberculosis InfecBon', EBioMedicine, 23: 88-99.
Hult, C., J. T. Magla, H. P. Gideon, J. J. Linderman, and D. E. Kirschner. 2021. 'Neutrophil Dynamics Affect Mycobacterium tuberculosis Granuloma Outcomes and DisseminaBon', Front Immunol, 12: 712457.
Katayama, M., K. Ohmura, N. Yukawa, C. Terao, M. Hashimoto, H. Yoshifuji, D. Kawabata, T. Fujii, Y. Iwakura, and T. Mimori. 2013. 'Neutrophils are essenBal as a source of IL-17 in the effector phase of arthriBs', PLoS One, 8: e62231.
Khader, S. A., G. K. Bell, J. E. Pearl, J. J. Fountain, J. Rangel-Moreno, G. E. Cilley, F. Shen, S. M. Eaton, S. L. Gaffen, S. L. Swain, R. M. Locksley, L. Haynes, T. D. Randall, and A. M. Cooper. 2007. 'IL-23 and IL-17 in the establishment of protecBve pulmonary CD4+ T cell responses afer vaccinaBon and during Mycobacterium tuberculosis challenge', Nat Immunol, 8: 369-77.
Leliefeld, P. H. C., J. Pillay, N. Vrisekoop, M. Heeres, T. Tak, M. Kox, S. H. M. Rooijakkers, T. W. Kuijpers, P. Pickkers, L. P. H. Leenen, and L. Koenderman. 2018. 'DifferenBal anBbacterial control by neutrophil subsets', Blood Adv, 2: 1344-55.
Lemos, H. P., R. Grespan, S. M. Vieira, T. M. Cunha, W. A. Verri, Jr., K. S. Fernandes, F. O. Souto, I. B. McInnes, S. H. Ferreira, F. Y. Liew, and F. Q. Cunha. 2009. 'Prostaglandin mediates IL-23/IL-17induced neutrophil migraBon in inflammaBon by inhibiBng IL-12 and IFNgamma producBon', Proc Natl Acad Sci U S A, 106: 5954-9.
Li, L., L. Huang, A. L. Vergis, H. Ye, A. Bajwa, V. Narayan, R. M. Strieter, D. L. Rosin, and M. D. Okusa. 2010. 'IL-17 produced by neutrophils regulates IFN-gamma-mediated neutrophil migraBon in mouse kidney ischemia-reperfusion injury', J Clin Invest, 120: 331-42.
Lin, A. M., C. J. Rubin, R. Khandpur, J. Y. Wang, M. Riblen, S. Yalavarthi, E. C. Villanueva, P. Shah, M. J. Kaplan, and A. T. Bruce. 2011. 'Mast cells and neutrophils release IL-17 through extracellular trap formaBon in psoriasis', J Immunol, 187: 490-500.
Lovewell, R. R., C. E. Baer, B. B. Mishra, C. M. Smith, and C. M. Sasseg. 2021. 'Granulocytes act as a niche for Mycobacterium tuberculosis growth', Mucosal Immunol, 14: 229-41.
Lyadova, I. V. 2017. 'Neutrophils in Tuberculosis: Heterogeneity Shapes the Way?', Mediators Inflamm, 2017: 8619307.
Mishra, B. B., R. R. Lovewell, A. J. Olive, G. Zhang, W. Wang, E. Eugenin, C. M. Smith, J. Y. Phuah, J. E. Long, M. L. Dubuke, S. G. Palace, J. D. Goguen, R. E. Baker, S. Nambi, R. Mishra, M. G. Booty, C. E. Baer, S. A. Shaffer, V. Dartois, B. A. McCormick, X. Chen, and C. M. Sasseg. 2017. 'Nitric oxide prevents a pathogen-permissive granulocyBc inflammaBon during tuberculosis', Nat Microbiol, 2: 17072.
Napolitani, G., E. V. Acosta-Rodriguez, A. Lanzavecchia, and F. Sallusto. 2009. 'Prostaglandin E2 enhances Th17 responses via modulaBon of IL-17 and IFN-gamma producBon by memory CD4+ T cells', Eur J Immunol, 39: 1301-12.
Nwongbouwoh Muefong, C., O. Owolabi, S. Donkor, S. Charalambous, A. Bakuli, A. Rachow, C. Geldmacher, and J. S. Sutherland. 2022. 'Neutrophils Contribute to Severity of Tuberculosis
Pathology and Recovery From Lung Damage Pre- and Posnreatment', Clin Infect Dis, 74: 175766.
Paulissen, S. M., J. P. van Hamburg, N. Davelaar, P. S. Asmawidjaja, J. M. Hazes, and E. Lubberts. 2013. 'Synovial fibroblasts directly induce Th17 pathogenicity via the cyclooxygenase/prostaglandin E2 pathway, independent of IL-23', J Immunol, 191: 1364-72.
Pedrosa, J., B. M. Saunders, R. Appelberg, I. M. Orme, M. T. Silva, and A. M. Cooper. 2000. 'Neutrophils play a protecBve nonphagocyBc role in systemic Mycobacterium tuberculosis infecBon of mice', Infect Immun, 68: 577-83.
Polese, B., B. Thurairajah, H. Zhang, C. L. Soo, C. A. McMahon, G. Fontes, S. N. A. Hussain, V. Abadie, and I. L. King. 2021. 'Prostaglandin E(2) amplifies IL-17 producBon by gammadelta T cells during barrier inflammaBon', Cell Rep, 36: 109456.
Rankin, A. N., S. V. Hendrix, S. K. Naik, and C. L. Stallings. 2022. 'Exploring the Role of Low-Density Neutrophils During Mycobacterium tuberculosis InfecBon', Front Cell Infect Microbiol, 12: 901590.
Xu, X. J., Q. Q. Ge, M. S. Yang, Y. Zhuang, B. Zhang, J. Q. Dong, F. Niu, H. Li, and B. Y. Liu. 2023. 'Neutrophil-derived interleukin-17A parBcipates in neuroinflammaBon induced by traumaBc brain injury', Neural Regen Res, 18: 1046-51.
Reviewer #1 (Recommendations for the authors):
All figures: Clear information about the number of repeat experiments for each figure must be included.
We have provided the details of the number of repeat experiments in the revised version.
Figure 1: The claim that neutrophils are a dominant cell type infected during Mtb infection of the lungs is undermined by the limited number of markers used to identify cell types. The gating strategy used to initially identify what cells are infected with Mtb divided cells into three categories; granulocytes (Ly6G<SUP>+</SUP> Cd11b<SUP>+</SUP>), CD64+MerTK+ macrophages, or Sca1+CD90.1+CD73+ (mesenchymal stem cells). This strategy leaves out monocyte populations that have been shown to be the dominant infected cells in other strategies (most recently, PMID: 36711606).
Thank you for this important point. We agree that we did not assess the infected monocyte population, specifically the Cd11c<SUP>+</SUP> population. Both CD11c<SUP>Hi</SUP> and CD11c<SUP>Lo</SUP> monocyte cells appear to be important for Mtb infection, in different studies (Lee et al., 2020), (Zheng et al., 2024). Therefore, leaving out the CD11c<SUP>+</SUP> population in our assays was a conscious decision to ensure the clarity of the cell types being studied.
In addition, substantial evidence from multiple studies indicates that Ly6G⁺ granulocytes constitute the predominant infected population in the Mtb-infected lungs of both mice and humans (Lovewell et al., 2021) (Eum et al., 2010). While monocytes may contribute to Mtb infection dynamics, our findings align with a growing body of research emphasizing the significant role of neutrophils as a dominant infected cell type in the lungs during TB pathology.
Figure 1: Putting the data from separate panels together, it appears that very few bacteria are isolated from the three cell types in the lung, suggesting there may be some loss in the preparation steps. Why is the total sorted CFU from neutrophils, macrophages, and MSCs so low, <400 bacteria total, when the absolute CFU is so high? Is it because only a fraction of the lung is being sorted/plated?
Yes, only a fraction of the lung was used for cell sorting and subsequent plating. The CFU plating from sorted cells also does not account for any bacteria growing extracellularly.
Figure 3C: It is difficult to ascertain whether the gating on IL-17<SUP>+</SUP> cells is accurately identifying IL-17 producing cells. It is surprising, based on other published work, that the authors claim that almost half of CD45+CD11b-Ly6G- cells produce IL-17 in WT mice. It would be informative to show cell type-specific production of IL-17 in both WT and IFN-γ KO mice for comparison with the literature. Unstained/isotype controls for IL-17 staining should be shown. With this in mind, it is difficult to interpret the authors' claim that 80% of neutrophils produce IL-17.
Thank you for the points above. We do agree that we were surprised to see ~50% of CD45<SUP>+</SUP> CD11b<SUP>-</SUP>Ly6G<SUP>-</SUP> cells producing IL-17. We have now done multiple experiments to confirm that this number is actually less than 1% (~90 cells) in the uninfected mice and less than 4% (~4000) in the Mtb-infected mice.
Neutrophil-derived IL-17 production in Mtb-infected lungs is supported by two independent techniques in our current study: Flow Cytometry and Immunofluorescence assay. While Neutrophil production of IL-17 is rarely studied in the context of TB, in several other settings it has been widely reported (Gonzalez-Orozco et al., 2019; Li et al., 2010; Ramirez-Velazquez et al., 2013). We consistently get >60% IL-17 positive cells in the CD11b<SUP>+</SUP> Ly6G<SUP>+</SUP> population, specifically in the infected samples.
To specifically address the reviewer’s concerns, we have now used an isotype control for IL17 staining and show the specificity of IL-17A antibody binding. The Author response image 1 is from the uninfected mice, 8 weeks age.
Unfortunately, our efforts to establish an IL-17 ELISPOT assay from neutrophils were not very successful and need further standardisation. The new results are included in Fig. 3C-D and Fig. S2F-G in the revised manuscript.
Author response image 1.
Figure 3 D-H. Quantification of immunofluorescence microscopy should be provided.
In the revised manuscript, we provide the quantification of IFA results.
Figure 4: Effects on neutrophil numbers in IFN-γ Kos do not correlate with CFU reductions, suggesting there may be a neutrophilindependent mechanism.
In the IFN-γ KO, we agree that the effect was less than dramatic. The immune dysfunction in the IFN-γ KO mice is too severe to see a strong reversal in the phenotype through interventions.
While we do not rule out any neutrophil-independent mechanism, in the context of following observations, neutrophil-dependent mechanisms certainly appear to play an important role-
(a) Improved pathology and survival upon IL-17 neutralization, which further improves with the inclusion of celecoxib.
(b) Loss of IL17<sup>+</sup>-Ly6G<sup>+</sup> cells upon IL-17 neutralization, which is further exacerbated when combined with celecoxib.
(c) Significant reduction in PMN number (shown by FACS) without any major impact on Th17 cell population upon IL-17 neutralization.
Finally, we believe some of the observations may become stronger once we characterize the specific sub-population among the Ly6G+ cells that correlates with pathology. For example, as shown in Figure 4I, FACS analysis of the Ly6G<sup>⁺</sup> cell population in Mtb-infected IFNγ<sup>⁻/⁻</sup> mice revealed a substantial subset of CD11b<sup>mid</sup> Ly6G<sup>ʰⁱ</sup> cells, indicative of an immature neutrophil population (Scapini et al., 2016). Efforts are currently underway to identify these important subpopulations.
Figure 4: Differences observed in the spleen cannot be connected to dissemination per se but instead could be a result of enhanced immune control in the spleen.
Thank you for this important point. We have revised this section. The role of neutrophils in Mtb dissemination is an emerging area of research, with growing evidence suggesting that these cells contribute to the spread of Mtb beyond the lungs (Hult et al., 2021). We highlight that the observed correlation could be speculative at this juncture.
Figure 4, 5: IL-17 neutralization alone has no effect on CFU in the lungs of Mtb-infected mice. While the combination of IL-17 neutralization and celecoxib has a very modest effect on CFU, the mechanism behind this observation is unclear. Further, the experiment shown has only 3 mice per group and it is unclear whether this (or any other) mouse experiment was repeated.
For Fig. 4, the experiment was done with 3 mice/group. The IFN KO mice were used to help identify the mechanism. IL-17 neutralisation or Celecoxib treatment alone did not have any significant effect on the bacterial burden (in lungs or isolated PMNs). However, it did show a significant effect on the number of PMNs recruited. Combination of IL-17 neutralisation and celecoxib led to about a one-log decrease in CFU, which is significant.
For Fig. 5, we used SR2211 instead of anti-IL-17 Ab for the experiment. This experiment had WT mice and 5 animals/group. Here, celecoxib and SR2211 alone showed a significant decline in PMN-resident Mtb pool as well as spleen burden. Only in the lungs, the impact of SR2211 alone was not significant.
Figure 6: The decreases in CFU correlate with a decrease in neutrophils; nothing connects this to neutrophil production of IL-17.
We now show quantification of observation in Fig. 5I, where in the WT mice, treatment with Celecoxib reduces the frequency of IL-17-producing Ly6G+ cells. In the revised manuscript, we also show direct evidence of SR2211 activity on BCG vaccine efficacy, which causes a significant decline in the Mtb burden in whole lung or in the isolated PMNs.
Figure 7. The Human data shows that elevated neutrophil levels and elevated IL-17 levels are associated with treatment failure in TB patients. This is expected, and does not
The literature lacks consensus in terms of a protective or pathological role of IL-17 in TB. Therefore, it was not expected to see higher IL-17 in patients who experienced relapse, death, or failed treatment outcomes. We do not have evidence from human subjects whether neutrophil derived IL-17 has a similar pathological role as observed in mice. However, higher IL-17 in failed outcome cases confirm the central theme that IL-17 is pathological in both human and mouse models.
Reviewer #2 (Recommendations for the authors):
(1) Survival of IFN-γ-/- Mice: The survival of IFN-γ-/- mice up to 100 days following a challenge with ~100 CFU of H37Rv is quite unusual. Have the authors checked PDIM expression in their Mtb strain, given that several studies report earlier mortality in these mice?
As shown in Fig. 4F, H37Rv-infected IFN-γ⁻/⁻ mice survived up to a little over 80 days. These figures are not unusual in the light of the following:
(1) In one study, IFNγ⁻/⁻ survived for about 40 days when the hypervirulent Mtb strain was used to infect these mice at 100-200 CFU using nose-only aerosol exposure (Nandi and Behar, 2011)
(2) In yet another study, IFNγ⁻/⁻ mice survived for ~50 days, however, they used H37Rv at 1-3x10<sup>5</sup> CFU to infect through intravenous injection (Kawakami et al., 2004)
Thus, compared with the above observations, where IFN-γ<sup>-/-</sup> mice survived for maximum 50 days due to hypervirulent infection or a very high dose infection, infection with H37Rv at ~100 CFU through the aerosol route and surviving for ~80 days is not unusual. The H37Rv cultures used in our study are always animal-passaged to ensure PDIM integrity.
(2) Granuloma Scoring: The granuloma scores appear to represent the percentage of lesion area. Please clarify and, if necessary, amend this in the manuscript.
The granuloma score is based on the calculation of the number of granulomatous infiltration and their severity. These are not % lesion area. We have added this detail in the revised manuscript.
(3) Pathology Comparison in Figures 4F and 4G: Does the pathology shown in Figure 4G correspond to the same groups as in Figure 4F? The celecoxib group in Figure 4F and the WT group in Figure 4G seem to be missing. Please clarify.
Figures 4F and 4G depict two independent experiments. For the time-to-death experiment, we had to leave the animals. The rest of the panels in Fig. 4 represent animals from the same experiment.
(4) Effect of Celecoxib on Ly6G+ Cells: The authors demonstrated that celecoxib treatment reduces Ly6G+ cells and IL-17-producing Ly6G+ cells. Do Ly6G+ cells express EP2/EP4 receptors? Alternatively, could the reduction in IL-17-producing Ly6G+ cells be due to an improved bactericidal response in other innate cells? The authors should discuss this possibility.
Yes, Ly6G<sup>⁺</sup> granulocytes express EP2/EP4 receptors (Lavoie et al., 2024), which mediate PGE₂ signaling. Prostaglandin E<sub>₂</sub> (PGE<sub>₂</sub>) is known to regulate neutrophil function and can enhance IL-17 production in various immune cells (Napolitani et al., 2009). However, the expression and functional role of EP2/EP4 receptors specifically on Ly6G<sup>⁺</sup> granulocytes in the context of Mtb infection require further investigation.
The alternate suggestion by the reviewer that the reduction in IL-17-producing Ly6G<sup>⁺</sup> cells following celecoxib treatment could be attributed to an improved bactericidal response in other innate immune cells is attractive. While we did not experimentally rule out this possibility, since reduced IL-17 invariably associated with reduced neutrophil-resident Mtb population, a cell-autonomous mechanism operational in Ly6G+ granulocytes is a highly likely mechanism.
(5) Culture Conditions: The methods section indicates that bacteria were cultured in 7H9+ADC. Is there a specific reason why the Oleic acid supplement was not added, given that standard Mtb culture conditions typically use 7H9+OADC supplements? Please comment on this choice.
It is a standard microbiological experimental procedure to use 7H9+ADC for broth culture, while 7H11+OADC for solid culture. Compared to broth culture, solid media are usually more stressful for bacteria because of hypoxia inside the growing colonies. Therefore, the media used are enriched in casein hydrolysate (like 7H11) and oleic acid (OADC).
Reviewer #3 (Recommendations for the authors):
Major suggestion: To really determine the role of neutrophil IL17 will require depletion studies and chimera experiments. These are clearly a major undertaking. I believe making significant re-writes to alter the conclusions or reanalyze any data to determine the role of nonhematopoietic and hematopoietic cells in IL17 is needed. If the conclusions are left as is, further experimentation is needed to fully support those conclusions.
Thank you for the suggestion. We have embarked on the specific deletion studies; however, as mentioned, this is a major undertaking and will take time. As suggested, we have discussed the results in accordance with the strength of evidence currently provided.
Eum, S.Y., J.H. Kong, M.S. Hong, Y.J. Lee, J.H. Kim, S.H. Hwang, S.N. Cho, L.E. Via, and C.E. Barry, 3rd. 2010. Neutrophils are the predominant infected phagocyGc cells in the airways of paGents with acGve pulmonary TB. Chest 137:122-128.
Gonzalez-Orozco, M., R.E. Barbosa-Cobos, P. Santana-Sanchez, L. Becerril-Mendoza, L. Limon-
Camacho, A.I. Juarez-Estrada, G.E. Lugo-Zamudio, J. Moreno-Rodriguez, and V. OrGzNavarrete. 2019. Endogenous sGmulaGon is responsible for the high frequency of IL-17Aproducing neutrophils in paGents with rheumatoid arthriGs. Allergy Asthma Clin Immunol 15:44.
References
Hult, C., J.T. Ma[la, H.P. Gideon, J.J. Linderman, and D.E. Kirschner. 2021. Neutrophil Dynamics Affect Mycobacterium tuberculosis Granuloma Outcomes and DisseminaGon. Front Immunol 12:712457.
Kawakami, K., Y. Kinjo, K. Uezu, K. Miyagi, T. Kinjo, S. Yara, Y. Koguchi, A. Miyazato, K. Shibuya, Y. Iwakura, K. Takeda, S. Akira, and A. Saito. 2004. Interferon-gamma producGon and host protecGve response against Mycobacterium tuberculosis in mice lacking both IL-12p40 and IL-18. Microbes Infect 6:339-349.
Lavoie, J.C., M. Simard, H. Kalkan, V. Rakotoarivelo, S. Huot, V. Di Marzo, A. Cote, M. Pouliot, and N. Flamand. 2024. Pharmacological evidence that the inhibitory effects of prostaglandin E2 are mediated by the EP2 and EP4 receptors in human neutrophils. J Leukoc Biol 115:1183-1189.
Lee, J., S. Boyce, J. Powers, C. Baer, C.M. Sasse[, and S.M. Behar. 2020. CD11cHi monocyte-derived macrophages are a major cellular compartment infected by Mycobacterium tuberculosis. PLoS Pathog 16:e1008621.
Li, L., L. Huang, A.L. Vergis, H. Ye, A. Bajwa, V. Narayan, R.M. Strieter, D.L. Rosin, and M.D. Okusa. 2010. IL-17 produced by neutrophils regulates IFN-gamma-mediated neutrophil migraGon in mouse kidney ischemia-reperfusion injury. J Clin Invest 120:331-342.
Lovewell, R.R., C.E. Baer, B.B. Mishra, C.M. Smith, and C.M. Sasse[. 2021. Granulocytes act as a niche for Mycobacterium tuberculosis growth. Mucosal Immunol 14:229-241.
Nandi, B., and S.M. Behar. 2011. RegulaGon of neutrophils by interferon-gamma limits lung inflammaGon during tuberculosis infecGon. The Journal of experimental medicine 208:22512262.
Napolitani, G., E.V. Acosta-Rodriguez, A. Lanzavecchia, and F. Sallusto. 2009. Prostaglandin E2 enhances Th17 responses via modulaGon of IL-17 and IFN-gamma producGon by memory CD4+ T cells. Eur J Immunol 39:1301-1312.
Ramirez-Velazquez, C., E.C. CasGllo, L. Guido-Bayardo, and V. OrGz-Navarrete. 2013. IL-17-producing peripheral blood CD177+ neutrophils increase in allergic asthmaGc subjects. Allergy Asthma Clin Immunol 9:23.
Sadikot, R.T., H. Zeng, A.C. Azim, M. Joo, S.K. Dey, R.M. Breyer, R.S. Peebles, T.S. Blackwell, and J.W. Christman. 2007. Bacterial clearance of Pseudomonas aeruginosa is enhanced by the inhibiGon of COX-2. Eur J Immunol 37:1001-1009.
Zheng, W., I.C. Chang, J. Limberis, J.M. Budzik, B.S. Zha, Z. Howard, L. Chen, and J.D. Ernst. 2023. Mycobacterium tuberculosis resides in lysosome-poor monocyte-derived lung cells during chronic infecGon. bioRxiv
Zheng, W., I.C. Chang, J. Limberis, J.M. Budzik, B.S. Zha, Z. Howard, L. Chen, and J.D. Ernst. 2024. Mycobacterium tuberculosis resides in lysosome-poor monocyte-derived lung cells during chronic infecGon. PLoS Pathog 20:e1012205.
-
-
docs.google.com docs.google.com
-
Dibujar las estructuras anatómicasExplicar en voz alta o enseñar a otrosVer videos repetidamentePracticar con modelos 3D o piezas anatómicas
Anatomía? Es instrumento de histología
-
. ¿Ha utilizado servicios de tutoría o apoyo académico para Histología? *
“No, no las encontré accesibles en horarios”.
-
microscopios y láminas
Se refiere a los microscopios o a las láminas
-
-
-
Author response:
The following is the authors’ response to the original reviews.
Reviewer #1 (Public review):
Summary:
The study by Gupta et al. investigates the role of mast cells (MCs) in tuberculosis (TB) by examining their accumulation in the lungs of M. tuberculosis-infected individuals, non-human primates, and mice. The authors suggest that MCs expressing chymase and tryptase contribute to the pathology of TB and influence bacterial burden, with MC-deficient mice showing reduced lung bacterial load and pathology.
Strengths:
(1) The study addresses an important and novel topic, exploring the potential role of mast cells in TB pathology.
(2) It incorporates data from multiple models, including human, non-human primates, and mice, providing a broad perspective on MC involvement in TB.
(3) The finding that MC-deficient mice exhibit reduced lung bacterial burden is an interesting and potentially significant observation.
Weaknesses:
(1) The evidence is inconsistent across models, leading to divergent conclusions that weaken the overall impact of the study.
The strength of the study is the use of multiple models including mouse, nonhuman primate as well as human samples. The conclusions have now been refined to reflect the complexity of the disease and the use of multiple models.
(2) Key claims, such as MC-mediated cytokine responses and conversion of MC subtypes in granulomas, are not well-supported by the data presented.
To address the reviewer’ s comments we will carry out further experimentation to strengthen the link between MC subtypes and cytokine responses.
(3) Several figures are either contradictory or lack clarity, and important discrepancies, such as the differences between mouse and human data, are not adequately discussed.
We will further clarify the figures and streamline the discussions between the different models used in the study.
(4) Certain data and conclusions require further clarification or supporting evidence to be fully convincing.
We will either provide clarification or supporting evidence for some of the key conclusions in the paper.
Reviewer #2 (Public review):
Summary:
The submitted manuscript aims to characterize the role of mast cells in TB granuloma. The manuscript reports heterogeneity in mast cell populations present within the granulomas of tuberculosis patients. With the help of previously published scRNAseq data, the authors identify transcriptional signatures associated with distinct subpopulations.
Strengths:
(1) The authors have carried out a sufficient literature review to establish the background and significance of their study.
(2) The manuscript utilizes a mast cell-deficient mouse model, which demonstrates improved lung pathology during Mtb infection, suggesting mast cells as a potential novel target for developing host-directed therapies (HDT) against tuberculosis.
Weaknesses:
(1) The manuscript requires significant improvement, particularly in the clarity of the experimental design, as well as in the interpretation and discussion of the results. Enhanced focus on these areas will provide better coherence and understanding for the readers.
The strength of the study is the use of multiple models including mouse, nonhuman primate as well as human samples. The conclusions have now been refined to reflect the complexity of the disease and the use of multiple models.
(2) Throughout the manuscript, the authors have mislabelled the legends for WT B6 mice and mast cell-deficient mice. As a result, the discussion and claims made in relation to the data do not align with the corresponding graphs (Figure 1B, 3, 4, and S2). This discrepancy undermines the accuracy of the conclusions drawn from the results.
We apologize for the discrepancy which will be corrected in the revised manuscript
(3) The results discussed in the paper do not add a significant novel aspect to the field of tuberculosis, as the majority of the results discussed in Figure 1-2 are already known and are a re-validation of previous literature.
This is the first study which has used mouse, NHP and human TB samples from Mtb infection to characterize and validate the role of MC in TB. We believe the current study provides significant novel insights into the role of MC in TB.
(4) The claims made in the manuscript are only partially supported by the presented data. Additional extensive experiments are necessary to strengthen the findings and enhance the overall scientific contribution of the work.
We will either provide clarification or supporting evidence for some of the key conclusions in the paper.
Reviewer #1 (Recommendations for the authors):
In the study by Gupta et al., the authors report an accumulation of mast cells (MCs) expressing the proteases chymase and tryptase in the lungs of M. tuberculosis-infected individuals and non-human primates, as compared to healthy controls and latently infected individuals. They also MCs appear to play a pathological role in mice. Notably, MC-deficient mice show reduced lung bacterial burden and pathology during infection.
While the topic is of interest, the study is overall quite preliminary, and many conclusions are not wellsupported by the presented data. The reliance on three different models, each suggesting divergent outcomes, weakens the ability to draw definitive conclusions. Specifically, the claim that "MCs (...) mediate cytokine responses to drive pathology and promote Mtb susceptibility and dissemination during TB" is not substantiated by the data.
Major comments
(1) In human samples, the authors conclude that "While MCTCs accumulated in early immature granulomas within TB lesions, MCCs accumulated in late granulomas in TB patients" and that MCTs "likely convert first to MCTCs in early granulomas before becoming MCCs in late mature granulomas with necrotic cores." However, Figure 1B shows the opposite. Furthermore, the assertion that MCTs "convert" into MCTCs is not justified by the data.
Corrections have been made to the figures to ensure clarity for the reader. We demonstrate accumulation of tryptase-expressing MCs in healthy individuals, while the dual tryptase and chymaseexpressing MCs were seen in early granulomas, and only chymase-associated MCs were observed in late granulomas depicting more pathology of the disease. We have removed the line as advised by the reviewer.
(2) In Figure 2 I and J, the panels do not demonstrate co-expression of chymase and tryptase in clusters 0, 1, and 3 in PTB samples, which contradicts the histology data. This discrepancy is left unaddressed and raises concerns about the conclusions drawn from Figures 1 and 2.
We thank the reviewer for pointing this out. We revisited the data and now show the coexpression of the dual expressing cells in the data (Figure 2H). This discrepancy stemmed from the crossspecies nature of the dataset. It turns out the there is a considerable diversity in sequence similarity and tryptase function between human and NHPs (Trivedi et al., 2007). We explain this in the section now (line 313-364). Briefly, while humans express TPSG1 (encoding tryptase) and TPSD1 (encoding tryptase) and have the same gene name in NHP, the gene name for more widely expressed TPSAB1(encoding / tryptase) is different for NHP and the gene names are not shared as they are still predicated putative protein. The putative genes from NHP that map to human TPSAB1 is LOC699599 for M. mulatta and LOC102139613 for M. fasicularis, respectively. Thus, looking for TPSAB1 gene yielded no result in our previous analysis but examining these orthologous gene names, now phenocopy the results we see in the histology data. To strengthen our findings, we have now analyzed an additional single-cell dataset from the lungs of NHP M. fasicularis (Figure 2J-L) and found the co-expression of chymase and tryptase, adding an important validation to our histological findings.
(3) Figure 2 serves more as a resource and contributes little to the core findings of the study. It might be better suited as supplementary material.
We thank the reviewer for the suggestion; however, we believe that Figure 2 serves as an independent validation in a different species (NHP), showing heterogeneity in MCs across species in a TB model. The figure adds value as there are only a handful of studies (Tauber et al., 2023, Derakhshan et al., 2022, Cildir et al., 2021) but none in TB, describing MCs at single cell level, of which one is published from our group showing MC cluster in Mtb infected macaques (Esaulova et al., 2021). We feel strongly that dissecting MCs as specifically done here provides an important insight into the transcriptional heterogeneity of these cells linked to disease states. We have also added an additional NHP lung single cell dataset (Gideon et al., 2022) to complement our analysis, thus adding another validation, strengthening these findings. So, we believe in retaining the figure as an integral part of the main paper.
(4) In lines 275-277, the data referenced should be shown to support the claims.
We thank the reviewer for the suggestion. The text originally noted by the reviewer now appears in the revised manuscript at line 370-372 and the corresponding data has now been included as supplementary Figure S3.
(5) In Figure 3B, the difference between the two mouse strains becomes non-significant by day 150 pi, weakening the overall conclusion that MCs contribute to the bacterial burden.
At 100 dpi, MC-deficient mice exhibit lower Mtb CFU in both the lung and spleen, indicating improved protection. By 150 dpi, lung CFU differences are no longer significant; however, dissemination to the spleen remains reduced in MC-deficient mice. Thus, the overall conclusion that MCs contribute to increased bacterial burden remains valid, particularly with respect to dissemination. This conclusion is further supported by new data showing that adoptive transfer of MCs into B6 Mtb-infected mice increased Mtb dissemination to the spleen (Figure 5E).
(6) Figures 3D and E are not particularly convincing.
Figures 3D and 3E illustrate lung inflammation in MC-deficient mice compared to wild-type which more distinctly show that MC-deficient mice exhibit significantly less inflammation at 150 dpi, supporting the role of MCs in driving lung.
(7) In Figures 4 and S3, the color coding in panels A-F appears incorrect but is accurate in G. This inconsistency is confusing.
We thank the reviewer for noting this. The color coding has been corrected to ensure consistency across all figures.
(8) In the mouse model, MCs seem to disappear during infection, in contrast to observations in human and macaque samples. This discrepancy is not discussed in the paper.
We thank the reviewer for this important observation. In response, we performed a new analysis of lung MCs at baseline in wild-type and MC-deficient mice. Our data show that naïve wild-type lungs contain a small population of MCs, which is further reduced in MC-deficient mice. Following Mtb infection, MCs progressively accumulate in wild-type mice, whereas this accumulation is significantly impaired in MC-deficient mice. These new data are now included in Figure (Figure 4A) and also updated in the text (line 395-403).
(9) In lines 306-307, data should be shown to support the claims.
We thank the reviewer for the suggestion. The text originally noted by the reviewer now appears in the revised manuscript at line 399-400 and the corresponding data has now been included as supplementary Figure S4.
Minor comments
(1) What does "granuloma-associated" cells mean in samples from healthy controls?
We thank the reviewer for this point. The language has been revised to accurately refer to cells in the lung parenchyma in the Figure 1, rather than “granuloma associated” cells.
(2) In line 229, it is unclear what "these cells" refers to.
The phrase “these cells” refers to tryptase-expressing mast cells. This has now been clarified in the revised manuscript (line 276-277).
(3) The citation of Figure 3A in lines 284-285 is misplaced in the text and should be corrected.
The figure citation has been corrected in the text in the revised manuscript (lines 376-379).
Reviewer #2 (Recommendations for the authors):
(1) The data presented in Figure 1 seems to be a re-validation of the already known aspects of mast cells in TB granulomas. While distinct roles for mast cells in regulating Mtb infection have been reported, the manuscript appears to be a failed opportunity to characterize the transcriptional signatures of the distinct subsets and identify their role in previously reported processes towards controlling TB disease progression.
We thank the reviewer for the insight. While it was not our intent to investigate the bulk transcriptome, owing to the high number of cells required to get enough RNA for transcriptomic sequencing, it is technically challenging due to the low abundance of mast cells during TB infection (Figure 2). The motivation for Figure 2, that we utilized a more sensitive transcriptomic analysis to find the different transcriptional states in the distinct TB disease states. We believe that this analysis captures the essence of what the reviewer and provides meaningful insights into mast cell heterogeneity during TB.
(2) The experiments lack uniformity with respect to the strains of Mtb used for experimentation. For eg: Mtb strain HN878 was used for aerosol infection of mice while Mtb CDC1551 was used for macaques. If there were experimental constraints with respect to the choice, the same should be mentioned.
We thank the reviewer for this comment. The Mtb strain usage has been consistent within each species: HN878 for mice and CDC1551 for non-human primates (NHPs), in line with prior studies from our lab. The species-specific choice reflects the differences in pathogenicity of these strains in mice versus NHPs. CDC1551, which exhibits lower virulence, allows the development of a macaque model that recapitulates human latent to chronic TB when administered via aerosol at low to moderate doses (Kaushal et al., 2015; Sharan et al., 2021; Singh et al., 2025). In contrast, the more virulent HN878 strain leads to severe disease and high mortality in NHPs and is therefore not suitable for these models. Using CDC1551 in macaques provides a controlled and clinically relevant platform to study immunological and pathophysiological mechanisms of TB, justifying its use in the current study. This explanation has now been added to the manuscript method section (lines 109-114).
(3) Line 84- 85, the authors state that "Chymase positive MCs contribute to immune pathology and reduced Mtb control". Previous reports including Garcia-Rodriguez et al., 2021 associate high MCTCs with improved lung function. Additionally, in the macaques model of latent TB infection reported in the manuscript, the number of chymase-expressing MCs seems to significantly decrease. The authors should justify the same.
We thank the reviewer for this comment. In Garcia-Rodriguez et al., 2021, chymase-expressing MCs accumulate in fibrotic lung lesions. Fibrosis is a result of excessive inflammation in TB infection and is associated with lung damage. Similarly, in idiopathic pulmonary fibrosis, higher density and percentage of chymase-expressing MCs correlate positively with fibrosis severity (Andersson et al., 2011). In our study, although fibrosis was not directly assessed, chymase-positive MCs increased in late lung granulomas, consistent with advanced inflammatory disease. Therefore, our conclusion that chymaseproducing MCs contribute to lung pathology is justified and aligns with prior observations.
(4) The manuscript would benefit from a brief description of the experimental conditions for the previously published scRNAseq data used in the current study.
We thank the reviewer for the suggestion, and the information has been included in the final manuscript (lines 294-297) and represented as Figure 2A.
(5) The authors have not mentioned the criteria used to categorize early and late granulomas in TB patients. A lucid description of the same is necessary.
Based on reviewer’s comment the detailed categorization of early and late granulomas in TB patients is now included in the revised manuscript (line 256-260). Early granulomas: Discrete conglomerates of immune cells and resident stromal cells with defined borders and absence of central necrosis, and Late granulomas: Large and dense clusters of immune cells and resident cells with an evident necrotic center containing bacteria and dead neutrophils and lymphocytic infiltrating cells on the periphery of the necrotic center. MCs were measured in the periphery and inside early granulomas, while in the late granulomas, they were mainly quantified in the periphery.
(6) The authors mention that "While MCTCs accumulated in early immature granulomas within TB lesions, MCCs accumulated in late granulomas in TB patients". While this is evident from the representative, the quantification in Figure 1B seems to indicate otherwise.
We thank the reviewer for pointing this out. The labeling in the quantitative analysis shown in Figure 1B has been corrected in the revised manuscript to accurately reflect the accumulation of MC<sub>TC</sub>s in early granulomas and MC<sub>C</sub>s in late granulomas.
(7) The labelling followed in Figures 3, 4 and S2 do not match with the discussion. Such errors should be rectified to minimize any ambiguity within the text of the manuscript.
We thank the reviewer for noting this. The color coding has been corrected to ensure consistency across all figures.
(8) The mast cell deficient mice model has a differential number of immune cells at the site of granuloma as reported in the manuscript. This could contribute to the altered mycobacterial survival and inflammation cytokine production in the lung and hence might not be a direct effect of mast cell depletion. The authors can consider reconstituting mast cell populations to analyze the mast cell function.
We thank the reviewers for this suggestion. In the revised manuscript, we have adoptively transferred MCs into WT mice before Mtb challenge to assess if this would increase inflammation and Mtb CFU in the lung and spleen. Our results show that while lung inflammation was not impacted, we found that the dissemination to the spleen and the frequency of neutrophils in the lung were increased in WT mice that received MCs (Figure 5, lines 429-443).
(9) Line 295- 297, the authors state "MCs continued to accumulate in the lung up to 100 dpi in CgKitWsh mice, following which the MC numbers decreased at later stages". However, the quantification in Figure 4A does not reflect the same. This should be addressed.
In response to the reviewers' comments, we conducted a new analysis of lung MCs at baseline, comparing wild-type and MC-deficient mice. The revised data show that MC-deficient mice have fewer mast cells at baseline compared to B6 mice. Furthermore, mast cell numbers increase during infection, peaking at 100 days post-infection (dpi) and subsequently stabilize by 150 dpi. The revised data has been included in Figure 4A and text line 395-403.
(10) Additionally, while the scRNAseq data reflects a lower production of TNF in pulmonary TB granulomas, the mice deficient in mast cells are discussed to have a lower production of proinflammatory cytokines.
Mast cells increasing and contributing to the TB pathogenesis is the theme of the paper and as such we see and increase in the IFNG pathway genes and similar reduction in the production of pro- inflammatory cytokines. The relative decrease in the TNF pathway gene expression can be reconciled by the fact that less TNF gene expression in PTB could also represent loss of Mtb control and increased pathogenesis (Yuk et al., 2024), which is maintained in the LTBI/HC clusters. Higher bacterial burden of Mtb can also decrease the host TNF production, which is in line with what we observe here (Olsen et al., 2016, Reed et al., 2004, Kurtz et al., 2006).
(11) The authors have not annotated Figure 2 I and J in the text while describing their results and interpretation.
We thank the reviewer for noting this and the figure 2 has been revised and the results as pointed out have been added to the revised manuscript.
(12) In line 284, the authors have discussed the results pertaining to Figure 3B, however, mentioned it as Figure 3A in the text.
We thank the reviewer for noting this and the corrections have been made in the revised manuscript (lines 379-384).
References
ANDERSSON, C. K., ANDERSSON-SJOLAND, A., MORI, M., HALLGREN, O., PARDO, A., ERIKSSON, L., BJERMER, L., LOFDAHL, C. G., SELMAN, M., WESTERGREN-THORSSON, G. & ERJEFALT, J. S. 2011. Activated MCTC mast cells infiltrate diseased lung areas in cystic fibrosis and idiopathic pulmonary fibrosis. Respir Res, 12, 139.
CILDIR, G., YIP, K. H., PANT, H., TERGAONKAR, V., LOPEZ, A. F. & TUMES, D. J. 2021. Understanding mast cell heterogeneity at single cell resolution. Trends Immunol, 42, 523-535.
DERAKHSHAN, T., BOYCE, J. A. & DWYER, D. F. 2022. Defining mast cell differentiation and heterogeneity through single-cell transcriptomics analysis. J Allergy Clin Immunol, 150, 739-747.
ESAULOVA, E., DAS, S., SINGH, D. K., CHORENO-PARRA, J. A., SWAIN, A., ARTHUR, L., RANGEL-MORENO, J., AHMED, M., SINGH, B., GUPTA, A., FERNANDEZ-LOPEZ, L. A., DE LA LUZ GARCIA-HERNANDEZ, M., BUCSAN, A., MOODLEY, C., MEHRA, S., GARCIA-LATORRE, E., ZUNIGA, J., ATKINSON, J., KAUSHAL, D., ARTYOMOV, M. N. & KHADER, S. A. 2021. The immune landscape in tuberculosis reveals populations linked to disease and latency. Cell Host Microbe, 29, 165-178 e8.
GARCIA-RODRIGUEZ, K. M., BINI, E. I., GAMBOA-DOMINGUEZ, A., ESPITIA-PINZON, C. I., HUERTA-YEPEZ, S., BULFONE-PAUS, S. & HERNANDEZ-PANDO, R. 2021. Differential mast cell numbers and characteristics in human tuberculosis pulmonary lesions. Sci Rep, 11, 10687.
GIDEON, H. P., HUGHES, T. K., TZOUANAS, C. N., WADSWORTH, M. H., 2ND, TU, A. A., GIERAHN, T. M., PETERS, J. M., HOPKINS, F. F., WEI, J. R., KUMMERLOWE, C., GRANT, N. L., NARGAN, K., PHUAH, J. Y., BORISH, H. J., MAIELLO, P., WHITE, A. G., WINCHELL, C. G., NYQUIST, S. K., GANCHUA, S. K. C., MYERS, A., PATEL, K. V., AMEEL, C. L., COCHRAN, C. T., IBRAHIM, S., TOMKO, J. A., FRYE, L. J., ROSENBERG, J. M., SHIH, A., CHAO, M., KLEIN, E., SCANGA, C. A., ORDOVAS-MONTANES, J., BERGER, B., MATTILA, J. T., MADANSEIN, R., LOVE, J. C., LIN, P. L., LESLIE, A., BEHAR, S. M., BRYSON, B., FLYNN, J. L., FORTUNE, S. M. & SHALEK, A. K. 2022. Multimodal profiling of lung granulomas in macaques reveals cellular correlates of tuberculosis control. Immunity, 55, 827846 e10.
KAUSHAL, D., FOREMAN, T. W., GAUTAM, U. S., ALVAREZ, X., ADEKAMBI, T., RANGEL-MORENO, J., GOLDEN, N. A., JOHNSON, A. M., PHILLIPS, B. L., AHSAN, M. H., RUSSELL-LODRIGUE, K. E., DOYLE, L. A., ROY, C. J., DIDIER, P. J., BLANCHARD, J. L., RENGARAJAN, J., LACKNER, A. A., KHADER, S. A. & MEHRA, S. 2015. Mucosal vaccination with attenuated Mycobacterium tuberculosis induces strong central memory responses and protects against tuberculosis. Nat Commun, 6, 8533.
KURTZ, S., MCKINNON, K. P., RUNGE, M. S., TING, J. P. & BRAUNSTEIN, M. 2006. The SecA2 secretion factor of Mycobacterium tuberculosis promotes growth in macrophages and inhibits the host immune response. Infect Immun, 74, 6855-64.
OLSEN, A., CHEN, Y., JI, Q., ZHU, G., DE SILVA, A. D., VILCHEZE, C., WEISBROD, T., LI, W., XU, J., LARSEN, M., ZHANG, J., PORCELLI, S. A., JACOBS, W. R., JR. & CHAN, J. 2016. Targeting Mycobacterium tuberculosis Tumor Necrosis Factor Alpha-Downregulating Genes for the Development of Antituberculous Vaccines. mBio, 7.
REED, M. B., DOMENECH, P., MANCA, C., SU, H., BARCZAK, A. K., KREISWIRTH, B. N., KAPLAN, G. & BARRY, C. E., 3RD 2004. A glycolipid of hypervirulent tuberculosis strains that inhibits the innate immune response. Nature, 431, 84-7.
SHARAN, R., SINGH, D. K., RENGARAJAN, J. & KAUSHAL, D. 2021. Characterizing Early T Cell Responses in Nonhuman Primate Model of Tuberculosis. Front Immunol, 12, 706723.
SINGH, D. K., AHMED, M., AKTER, S., SHIVANNA, V., BUCSAN, A. N., MISHRA, A., GOLDEN, N. A., DIDIER, P. J., DOYLE, L. A., HALL-URSONE, S., ROY, C. J., ARORA, G., DICK, E. J., JR., JAGANNATH, C., MEHRA, S., KHADER, S. A. & KAUSHAL, D. 2025. Prevention of tuberculosis in cynomolgus macaques by an attenuated Mycobacterium tuberculosis vaccine candidate. Nat Commun, 16, 1957.
TAUBER, M., BASSO, L., MARTIN, J., BOSTAN, L., PINTO, M. M., THIERRY, G. R., HOUMADI, R., SERHAN, N., LOSTE, A., BLERIOT, C., KAMPHUIS, J. B. J., GRUJIC, M., KJELLEN, L., PEJLER, G., PAUL, C., DONG, X., GALLI, S. J., REBER, L. L., GINHOUX, F., BAJENOFF, M., GENTEK, R. & GAUDENZIO, N. 2023. Landscape of mast cell populations across organs in mice and humans. J Exp Med, 220.
TRIVEDI, N. N., TONG, Q., RAMAN, K., BHAGWANDIN, V. J. & CAUGHEY, G. H. 2007. Mast cell alpha and beta tryptases changed rapidly during primate speciation and evolved from gamma-like transmembrane peptidases in ancestral vertebrates. J Immunol, 179, 6072-9.
YUK, J. M., KIM, J. K., KIM, I. S. & JO, E. K. 2024. TNF in Human Tuberculosis: A Double-Edged Sword. Immune Netw, 24, e4.
-
-
www.google.com www.google.com
-
dweb.link This IPFS link is linking to a given state of a file it is immutable name for immutable content
It give no indication of the context the folder structure where it was store when the hasn the Conted ID CID for the resource been created
/ 🧊/ ♖/ hyperpost/ ~/ indyweb/ 2025-11
A Peergos secret link is one that can retrieve the resource identified by i. It is like IPNS that resolves an opque resource identifier to mutable content.
Unlike IPFS it actually shows the folder trail for all its parents rooted at a Peergos Account's name
-
-
algo.monster algo.monster
-
Try It Yourself
def contains_duplicate(nums: list[int]) -> bool: nums_length = len(nums) if nums_length == 0: return False unique_length = len(set(nums)) return unique_length != nums_length
🎯 建議你面試時這樣做: 寫解答版這個: def contains_duplicate(nums: list[int]) -> bool: seen = set() for num in nums: if num in seen: return True seen.add(num) return False 然後主動講(超加分): 「時間複雜度是 O(n),空間是 O(n)。」 「底層用 hash set 做 membership check,平均 O(1)。」 「也可以用 len(set(nums)) != len(nums) 寫得更短,但這樣不能 early exit。」
-
-
vojta.quarto.pub vojta.quarto.pub
-
dlouhodobě stabilní
Není úplně jasné, v čem jsou stabilní. Pokud jde o částky, tak stabilní nejsou, neboť od roku 23 se výdaje zdvojnásobily.
-
Struktura výdajů
Zvážil bych ještě doplnění informací o výdajích na bydlení v EU fondech, zejména výzvy na sociální bydlení (přímý dopad na bydlení) a pak je tam ještě IROP - Snížení energetické náročnosti v sektoru bydlení (nepřímý dopad)
-
výdaje
doplnil bych, že jde právě o ty neinvestiční (dávky) v důsledku úprav legislativy (navýšení normativů) a nárůst cen energií
-
Investiční programy Ministerstva pro místní rozvoj a Státního fondu podpory investic
Je tam ještě jeden investiční program, který byl spravovaný Všeobecnou pokladní zprávou.
Jedná se o program 298D22 Akce financované z rozhodnutí Poslanecké sněmovny Parlamentu a Vlády ČR / 298D22300 Podpora výstavby a obnovy komunální infrastruktury
Celkem 1,2 mld Kč v období 2016-2021, které šly zejména na rekonstrukce bytů v menších obcích.
-
-
espanol.libretexts.org espanol.libretexts.org
-
Ejercicio 1. : Determinar las configuraciones estereoquímicas de los centros quirales en las biomoléculas que se muestran a continuación. Ejercicio 2. : ¿Debe el enantiómero (R) del malato tener una cuña sólida o discontinua para el enlace C-O en la figura siguiente? Ejercicio 3. : Usando cuñas sólidas o discontinuas para mostrar
Cuál es la respuesta
-
-
algo.monster algo.monster
-
Why not shift all items forward to reclaim the space? You could move everything from position 95 onward back to position 0. But this requires copying every single item in the queue to a new position. With 1,000 items in the queue, you'd need 1,000 copy operations. This takes too much time for every dequeue operation, which should be quick and simple.
很直觀想:「把所有剩下的資料直接往前搬,把 slot 0~4(最前端)都填回來,這樣空間就都可重用。」
但這有超重的負擔:如果 queue 還有 1000 個資料,每個 dequeue 都要把 1000 個元素整個搬來搬去,非常慢!
queue 最期待的就是 "dequeue 很快"(O(1)),但如果每次都要 copy 很多資料,就變成 O(n),效率低、設計不合格。
-
-
-
o. By 1963, it appearedthat some of the blood proteins ofhumans were virtually identical inamino acid sequence with those ofapes such as the chimpanzee or go
really interesting, is it because the blood serves a very similar function and therefor didnt need to change throughout evolution?
-
-
la-bufa.netlify.app la-bufa.netlify.app
-
o
acento
-
-
www.planalto.gov.br www.planalto.gov.br
-
penhora dos bens
Tema 135/TST - Na vigência do Código de Processo Civil de 2015, é válida a penhora dos rendimentos (CPC, art. 833, inciso IV) para satisfação de crédito trabalhista, desde que observado o limite máximo de <u>50%</u> dos rendimentos líquidos e garantido o recebimento de, pelo menos, <u>um salário mínimo legal pelo devedor</u>.
Obs.: Precedente vinculante estabeleceu 2 tetos para a penhora em dinheiro: - 1) 50% dos rendimentos líquidos; - 2) Garantia de manutenção de, ao menos, 1 salário-mínimo do devedor.
-
compromisso
Súmula nº 357/TST - TESTEMUNHA. AÇÃO CONTRA A MESMA RECLAMADA. SUSPEIÇÃO - Não torna suspeita a testemunha o simples fato de estar litigando ou de ter litigado contra o mesmo empregador.
Tema 72/TST - A existência de ação contra o mesmo empregador, ainda que possua idêntica pretensão, não torna suspeita a testemunha, salvo quando o julgador se convencer da sua parcialidade mediante o exame da prova constante dos autos.
Precedentes:
-
Nos termos da Súmula n.º 357 deste Tribunal Superior, o simples fato de estar litigando ou de ter litigado contra o mesmo empregador, não torna suspeita a testemunha, <u>ainda que</u> tenham os mesmos pedidos e sejam testemunhas recíprocas nos respectivos feitos. A suspeição somente se revela quando, comprovadamente, o Julgador se convencer da parcialidade, animosidade ou falta de isenção da testemunha, o que não ocorreu na hipótese. Recurso de revista conhecido e provido" (RRAg-10819-68.2020.5.03.0104, 1ª Turma, Relator Ministro Amaury Rodrigues Pinto Junior, Julgamento: 12/02/2025, Publicação: 17/02/2025).
-
Esta Corte tem o firme entendimento que a testemunha não se torna suspeita para depor pelo simples fato de estar litigando ou de ter litigado contra o mesmo empregador da parte autora, ainda que esteja <u>reivindicando pedido idêntico</u> ou com patrocínio do <u>mesmo advogado</u>. É o que se depreende da Súmula 357 do TST, segundo a qual: "Não torna suspeita a testemunha o simples fato de estar litigando ou de ter litigado contra o mesmo empregador". Desse modo, não havendo nos autos comprovação de que houve a troca de favores, a existência de reclamatória trabalhista não autoriza presumir o interesse direto da testemunha no desfecho da causa em favor do Autor. (...)" (Ag-AIRR-565-98.2020.5.19.0004, 3ª Turma, Relator Ministro Mauricio Godinho Delgado, DEJT 07/06/2024).
-
O simples fato de a testemunha exercer seu direito de ação, ainda que também esteja demandando contra a reclamada em ação com o mesmo objeto, não afasta a incidência da Súmula 357 do TST, que não excepciona tal hipótese. Recurso de revista não conhecido." (RR-138-28.2011.5.01.0066, 6ª Turma, Relator Ministro Augusto Cesar Leite de Carvalho, Julgamento: 11/06/2024, Publicação: 14/06/2024).
-
O único aresto paradigma colacionado para confronto de teses trata de situação fática diversa a impossibilitar a aplicação das razões de decidir ao caso concreto. Além disso, também não se vislumbra a contrariedade à Súmula 357 do TST, pois, não macula a isenção de ânimo da testemunha, ao ponto de retirar a neutralidade que se exige da prova testemunhal, o fato de a <u>testemunha ser advogada em outro processo</u> contra a mesma parte reclamada, bem como a situação de reclamante e testemunha terem ajuizados ação com identidade de pedidos em face do mesmo empregador e serem testemunhas recíprocas. Precedentes. Agravo conhecido e desprovido. (...)"Ag-E-ED-RRAg-1921-09.2013.5.10.0010, Subseção I Especializada em Dissídios Individuais, Relator Ministro Augusto Cesar Leite de Carvalho, DEJT 01/12/2023)..”.
-
-
Art. 825
Tema 64/TST
- Não configura cerceio de defesa o ato de indeferir o adiamento da audiência una ou de instrução quando a parte, intimada previamente, não apresenta o rol de testemunhas, tampouco, diante da previsão de comparecimento espontâneo (art. 825, caput, da CLT), justifica a ausência
Precedentes:
-
A Egrégia Turma decidiu consoante jurisprudência pacificada desta Corte, no sentido de que o indeferimento do pedido de adiamento da audiência, sem a prévia intimação das testemunhas, quando a parte, conquanto ciente do efeito preclusivo decorrente da não realização do ato processual relativo ao arrolamento prévio das testemunhas, não apresenta tempestivamente o referido rol, não configura o cerceamento do direito de defesa. Precedentes desta Subseção. Incide, portanto, o disposto no artigo 894, § 2º, da CLT. Correta a aplicação do referido óbice, mantém-se o decidido. Verificada, por conseguinte, a manifesta improcedência do presente agravo, aplica-se a multa prevista no artigo 1.021, § 4º, do Código de Processo Civil. Agravo interno conhecido e não provido (Ag-E-RR-100895-54.2016.5.01.0551, Subseção I Especializada em Dissídios Individuais, Relator Ministro Claudio Mascarenhas Brandao, DEJT 01/07/2022)
-
III. No caso vertente, o Tribunal Regional consignou expressamente que a parte reclamante, intimada a apresentar rol de testemunhas, quedou-se inerte. Corolário logico de seu silêncio foi a aplicação da preclusão temporal. Assentou ainda que, embora tenha a parte reclamante renovado tais protestos em razões finais e reiterado a insurgência em razões de recurso, a preclusão já havia se operado. Assim sendo, verifica-se que o acórdão regional declinou fundamentação devida e suficiente quanto às razões para se declarar a preclusão temporal, o que não caracteriza de modo algum cerceamento de defesa. Aplicação do brocardo latino : "dormientibus non sucurrit ius". IV. Decisão regional em conformidade com a jurisprudência atual e notória desta Corte Superior. Incidência do óbice do art. 896, § 7º, da CLT e da Súmula nº 333 do TST. V. Agravo interno de que se conhece e a que se nega provimento" (Ag-AIRR-1000902-57.2020.5.02.0614, 7ª Turma, Relator Ministro Evandro Pereira Valadao Lopes, DEJT 04/11/2022).
-
11- Esse procedimento adotado objetiva evitar adiamentos desnecessários de audiências, com o escopo de concretizar o princípio da duração razoável do processo ( artigo 5°, LXXVIII, da Constituição Federal ). É fruto de intepretação teleológica do artigo 825 da CLT mediante a qual se conclui que a finalidade da norma é facultar à parte, em caso de resistência da testemunha de comparecer à audiência, a possibilidade de intimação ou até mesmo condução coercitiva desta, não fixando o legislador o momento a partir do qual se deve franquear à parte a intimação da testemunha, se na audiência ou previamente, por meio de notificação para apresentação de rol de testemunhas anteriormente à audiência una ou, como no caso, no prazo fixado na ata de audiência inicial com a determinação expressa da consequência ( preclusão ) para a hipótese de a parte comprometer-se a levar testemunha não arrolada à audiência subsequente e esta não comparecer. 12- Segundo o doutrinador Felipe Bernardes, o procedimento de intimar previamente as partes para apresentarem rol de testemunhas antes da audiência viabiliza-se pois a "interpretação teleológica do dispositivo gera a conclusão de que pouco importa que essa possibilidade de intimação seja concedida na audiência ou em momento prévio, desde que seja inequivocamente assegurada à parte " e conclui que "se a testemunha for arrolada e, requerida sua intimação, não comparecer injustificadamente, o interessado na sua oitiva pode requerer o adiamento da audiência e a condução coercitiva da testemunha; o indeferimento resulta em cerceamento de defesa. Já no caso em que a testemunha não é arrolada (e consequentemente não é intimada, e não comparece injustificadamente, a audiência não deve ser adiada, pois se presume que a parte desistiu da oitiva " (BERNARDES, Felipe. Manual de Processo do Trabalho. v. único. 4ª ed. rev. ampl. e atual. São Paulo: Editora JusPodivm, 2022, p. 575.) 13- A propósito, ao analisar e julgar um processo em que houve notificação para audiência una com determinação expressa para que a parte apresentasse antecipadamente o rol de testemunhas para intimação ou levasse suas testemunhas independentemente de intimação, a SBDI-1 do TST, em razão da determinação expressa e da ciência prévia das consequências decorrentes da ausência de testemunha em audiência, concluiu que não se configurou ofensa ao artigo 825 da CLT ou cerceamento de defesa no indeferimento do requerimento de adiamento de audiência para que fosse intimada a testemunha não arrolada e que não compareceu. (E-RR-1810-18.2012.5.15.0108, Subseção I Especializada em Dissídios Individuais, Redator Ministro Hugo Carlos Scheuermann, DEJT 20/04/2018). 14- Nessa perspectiva, o indeferimento do requerimento de adiamento de audiência para se proceder à oitiva da testemunha não arrolada e que faltou à audiência subsequente não viola o artigo 825 da CLT e não caracteriza cerceamento do direito de defesa. 15- Recurso de revista de que não se conhece.” (ARR-11201-76.2016.5.03.0112, 6ª Turma, Relatora Ministra Katia Magalhaes Arruda, DEJT 07/10/2022).
-
Art. 466
Tema 65/TST
- A inadimplência ou cancelamento da compra pelo cliente não autoriza o empregador a estornar as comissões do empregado.
Precedentes - 1. Em interpretação ao artigo 466 da CLT, a jurisprudência deste Tribunal firmou-se no sentido de não ser cabível o estorno de comissões pagas ao vendedor nos casos em que houve o cancelamento da compra ou inadimplemento por parte do cliente, em respeito ao princípio da alteridade, insculpido no artigo 2º da CLT, segundo o qual os riscos da atividade econômica devem ser suportados pelo empregador. Precedentes de todas as Turmas . 2. Nessa medida, impõe-se confirmar a decisão agravada, uma vez que as razões expendidas pelo agravante não logram demonstrar o apontado equívoco em relação a tal conclusão. Agravo conhecido e não provido" (Ag-ED-ARR-10427-91.2015.5.03.0173, 1ª Turma, Relator Ministro Hugo Carlos Scheuermann, DEJT 07/05/2021).
-
O Tribunal Regional manteve a sentença que indeferiu o pagamento de diferenças de comissões sob o fundamento de que a ausência de pagamento das verbas em virtude do cancelamento da compra ou vendas não faturadas não constitui procedimento ilícito. Contudo, o TST firmou o entendimento no sentido de que, uma vez ultimada a transação, é <u>indevido o estorno das comissões, ainda que haja inadimplência, cancelamento ou não faturamento da compra, em respeito ao princípio da alteridade</u>, segundo o qual os riscos da atividade econômica devem ser suportados pelo empregador. Precedentes. Recurso de revista conhecido e provido. (...)" (RRAg-11131-20.2017.5.03.0049, 2ª Turma, Relatora Ministra Maria Helena Mallmann, DEJT 27/05/2022).
-
jurisprudência consolidada desta Eg. Corte Superior é no sentido de que o cancelamento da venda pelo comprador não implica estorno da comissão do empregado, tendo em vista que o risco da atividade econômica é do empregador. Ademais, é firme o entendimento de que a transação é consumada quando ocorre acordo entre o comprador e o vendedor, sendo <u>irrelevante o cancelamento posterior</u>. Julgados. Recurso de Revista não conhecido" (RR-10194-82.2021.5.03.0012, 4ª Turma, Relatora Ministra Maria Cristina Irigoyen Peduzzi, DEJT 09/12/2022).
Obs.: Vide que o precedente veicula a vedação de estorno de comissões de empregado na hipótese de inadimplência ou cancelamento. Acaso a hipótese seja <u>insolvência</u>, aí sim poderia haver o estorno na forma do art. 7º da Lei 3.207/57, norma essa que deve ser interpretada de forma restritiva.
Tema 57/TST:
- As comissões devidas ao empregado vendedor, em razão de vendas a prazo, devem incidir sobre o valor <u>total</u> da operação, incluídos os juros e demais encargos financeiros, salvo se houver pactuação em sentido contrário.
-
Art. 192
Tema 5/TST
Questão Submetida a Julgamento: - ADICIONAL DE INSALUBRIDADE. OPERADORES DE TELEMARKETING. UTILIZAÇÃO DE FONES DE OUVIDOS. ANEXO 13 DA NR 15 DA PORTARIA Nº 3.214/78 DO MTE - Os operadores de telemarketing, que utilizam fones de ouvidos, têm direito ao recebimento de adicional de insalubridade nos termos do Anexo 13 da NR 15 da Portaria nº 3.214/78 do MTE?
Tese Firmada: 1. O reconhecimento da insalubridade, para fins do percebimento do adicional previsto no artigo 192 da CLT, <u>não prescinde do enquadramento</u> da atividade ou operação na relação elaborada pelo Ministério do Trabalho ou da constatação de extrapolação de níveis de tolerância fixados para agente nocivo expressamente arrolado no quadro oficial.
- A atividade com utilização constante de fones de ouvido, tal como a de operador de telemarketing, não gera direito ao adicional de insalubridade, tão somente por equiparação aos serviços de telegrafia e radiotelegrafia, manipulação em aparelhos do tipo Morse e recepção de sinais em fones, para os fins do Anexo 13 da Norma Regulamentadora 15 da Portaria nº 3.214/78 do Ministério do Trabalho. Situação do Tema: TRANSITADO JULGADO
-
d)
Tema 70/TST
- A ausência ou irregularidade no recolhimento dos depósitos de FGTS caracteriza descumprimento de obrigação contratual, nos termos do art. 483, "d", da CLT, suficiente para configurar a rescisão indireta do contrato de trabalho, sendo desnecessário o requisito da imediatidade.
Tema 85/TST:
- O descumprimento contratual contumaz relativo à ausência do pagamento de horas extraordinárias e a não concessão do intervalo intrajornada <u>autoriza</u> a rescisão indireta do contrato de trabalho, na forma do artigo 483, "d", da CLT.
-
-
www.biorxiv.org www.biorxiv.org
-
Author Response:
Reviewer #1 (Public Review):
The work by Wang et al. examined how task-irrelevant, high-order rhythmic context could rescue the attentional blink effect via reorganizing items into different temporal chunks, as well as the neural correlates. In a series of behavioral experiments with several controls, they demonstrated that the detection performance of T2 was higher when occurring in different chunks from T1, compared to when T1 and T2 were in the same chunk. In EEG recordings, they further revealed that the chunk-related entrainment was significantly correlated with the behavioral effect, and the alpha-band power for T2 and its coupling to the low-frequency oscillation were also related to behavioral effect. They propose that the rhythmic context implements a second-order temporal structure to the first-order regularities posited in dynamic attention theory.
Overall, I find the results interesting and convincing, particularly the behavioral part. The manuscript is clearly written and the methods are sound. My major concerns are about the neural part, i.e., whether the work provides new scientific insights to our understanding of dynamic attention and its neural underpinnings.
1) A general concern is whether the observed behavioral related neural index, e.g., alpha-band power, cross-frequency coupling, could be simply explained in terms of ERP response for T2. For example, when the ERP response for T2 is larger for between-chunk condition compared to within-chunk condition, the alpha-power for T2 would be also larger for between-chunk condition. Likewise, this might also explain the cross-frequency coupling results. The authors should do more control analyses to address the possibility, e.g., plotting the ERP response for the two conditions and regressing them out from the oscillatory index.
Many thanks for the comment. In short, the enhancement in alpha power and cross-frequency coupling results in the between-cycle condition compared with those in the within-cycle condition cannot be accounted for by the ERP responses for T2.
In general, the rhythmic stimulation in the AB paradigm prevents EEG signals from returning to the baseline. Therefore, we cannot observe typical ERP components purely related to individual items, except for the P1 and N1 components related to the stream onset, which reveals no difference between the two conditions and are trailed by steady-state responses (SSRs) resonating at the stimulus rate (Fig. R1).
Fig. R1. ERPs aligned to stream onset. EEG signals were filtered between 1–30 Hz, baseline-corrected (-200 to 0 ms before stream onset) and averaged across the electrodes in left parieto-occipital area where 10-Hz alpha power showed attentional modulation effect.
To further inspect the potential differences in the target-related ERP signals between the within- and between-cycle conditions, we plotted the target-aligned waveforms for these experimental conditions. As shown in Fig. R2, a drop of ERP amplitude occurred for both conditions around T2 onset, and the difference between these two conditions was not significant (paired t-test estimated on mean amplitude every 20 ms from 0 to 700 ms relative to T1 onset, p > .05, FDR-corrected).
Fig. R2. ERPs aligned to T1 onset. EEG signals were filtered between 1–30 Hz, and baseline-corrected using signals -100 to 0 ms before T1 onset. The two dash lines indicate the onset of T1 and T2, respectively.
Since there is a trend of enhanced ERP response for the between-cycle relative to the within-cycle condition during the period of 0 to 100 ms after T2 onset (paired t-test on mean amplitude, p =.065, uncorrected), we then directly examined whether such post-T2 responses contribute to the behavioral attentional modulation effect and behavior-related neural indices. Crucially, we did not find any significant correlation of such T2-related ERP enhancement with the behavioral modulation index (BMI), or with the reported effects of alpha power and cross-frequency coupling (PAC). Furthermore, after controlling for the T2-related ERP responses, there still remains a significant correlation between the delta-alpha PAC and the BMI (rpartial = .596, p = .019), which is not surprising given that the PAC is calculated based on an 800-ms time window covering more pre-T2 than post-T2 periods (see the response to point #4 for details) rather than around the T2 onset. Taken together, these results clearly suggest that the T2-related ERP responses cannot explain the attentional modulation effect and the observed behavior-related neural indices.
2) The alpha-band increase for T2 is indeed contradictory to the well known inhibitory function of alpha-band in attention. How could a target that is better discriminated elicit stronger inhibitory response? Related to the above point, the observed enhancement in alpha-band power and its coupling to low-frequency oscillation might derive from an enhanced ERP response for T2 target.
Many thanks for the comment. We have briefly discussed this point in the revised manuscript (page 18, line 477).
A widely accepted function of alpha activity in attention is that alpha oscillations suppress irrelevant visual information during spatial selection (Kelly et al., 2006; Thut et al., 2006; Worden et al., 2000). However, it becomes a controversial issue when there exists rhythmic sensory stimulation at alpha-band, just like the situation in the current study where both the visual stream and the contextual auditory rhythm were emitted at 10 Hz. In such a case, alpha-band neural responses at the stimulation frequency can be interpreted as either passively evoked steady-state responses (SSR) or actively synchronized intrinsic brain rhythms. From the former perspective (i.e., the SSR view), an increase in the amplitude or power at the stimulus frequency may indicate an enhanced attentional allocation to the stimulus stream that may result in better target detection (Janson et al., 2014; Keil et al., 2006; Müller & Hübner, 2002). Conversely, the latter view of the inhibitory function of intrinsic alpha oscillations would produce the opposite prediction. In a previous AB study, Janson and colleagues (2014) investigated this issue by separating the stimulus-evoked activity at 12 Hz (using the same power analysis method as ours) from the endogenous alpha oscillations ranging from 10.35 to 11.25 Hz (as indexed by individual alpha frequency, IAF). Interestingly, they found a dissociation between these two alpha-band neural responses, showing that the RSVP frequency power was higher in non-AB trials (T2 detected) than in AB trials (T2 undetected) while the IAF power exhibited the opposite pattern. According to these findings, the currently observed increase in alpha power for the between-cycle condition may reflect more of the stimulus-driven processes related to attentional enhancement. However, we don’t negate the effect of intrinsic alpha oscillations in our study, as the current design is not sufficient to distinguish between these two processes. We have discussed this point in the revised manuscript (page 18, line 477). Also, we have to admit that “alpha power” may not be the most precise term to describe our findings of the stimulus-related results. Thus, we have specified it as “neural responses to first-order rhythms at 10 Hz” and “10-Hz alpha power” in the revised manuscript (see page 12 in the Results section and page 18 in the Discussion section).
As for the contribution of T2-related ERP response to the observed effect of 10 Hz power and cross-frequency coupling, please refer to our response to point #1.
References:
Janson, J., De Vos, M., Thorne, J. D., & Kranczioch, C. (2014). Endogenous and Rapid Serial Visual Presentation-induced Alpha Band Oscillations in the Attentional Blink. Journal of Cognitive Neuroscience, 26(7), 1454–1468. https://doi.org/10.1162/jocn_a_00551
Keil, A., Ihssen, N., & Heim, S. (2006). Early cortical facilitation for emotionally arousing targets during the attentional blink. BMC Biology, 4(1), 23. https://doi.org/10.1186/1741-7007-4-23
Kelly, S. P., Lalor, E. C., Reilly, R. B., & Foxe, J. J. (2006). Increases in Alpha Oscillatory Power Reflect an Active Retinotopic Mechanism for Distracter Suppression During Sustained Visuospatial Attention. Journal of Neurophysiology, 95(6), 3844–3851. https://doi.org/10.1152/jn.01234.2005
Müller, M. M., & Hübner, R. (2002). Can the Spotlight of Attention Be Shaped Like a Doughnut? Evidence From Steady-State Visual Evoked Potentials. Psychological Science, 13(2), 119–124. https://doi.org/10.1111/1467-9280.00422
Thut, G., Nietzel, A., Brandt, S., & Pascual-Leone, A. (2006). Alpha-band electroencephalographic activity over occipital cortex indexes visuospatial attention bias and predicts visual target detection. The Journal of Neuroscience : The Official Journal of the Society for Neuroscience, 26(37), 9494–9502. https://doi.org/10.1523/JNEUROSCI.0875-06.2006
Worden, M. S., Foxe, J. J., Wang, N., & Simpson, G. V. (2000). Anticipatory Biasing of Visuospatial Attention Indexed by Retinotopically Specific α-Bank Electroencephalography Increases over Occipital Cortex. Journal of Neuroscience, 20(6), RC63–RC63. https://doi.org/10.1523/JNEUROSCI.20-06-j0002.2000
3) To support that it is the context-induced entrainment that leads to the modulation in AB effect, the authors could examine pre-T2 response, e.g., alpha-power, and cross-frequency coupling, as well as its relationship to behavioral performance. I think the pre-stimulus response might be more convincing to support the authors' claim.
Many thanks for the insightful suggestion. We have conducted additional analyses.
Following this suggestion, we have examined the 10-Hz alpha power within the time window of -100–0 ms before T2 onset and found stronger activity for the between-cycle condition than for the within-cycle condition. This pre-T2 response is similar to the post-T2 response except that it is more restricted to the left parieto-occipital cluster (CP3, CP5, P3, P5, PO3, PO5, POZ, O1, OZ, t(15) = 2.774, p = .007), which partially overlaps with the cluster that exhibits a delta-alpha coupling effect significantly correlated with the BMI. We have incorporated these findings into the main text (page 12, line 315) and the Fig. 5A of the revised manuscript.
As for the coupling results reported in our manuscript, the coupling index (PAC) was calculated based on the activity during the second and third cycles (i.e., 400 to 1200 ms from stream onset) of the contextual rhythm, most of which covers the pre-T2 period as T2 always appeared in the third cycle for both conditions. Together, these results on pre-T2 10-Hz alpha power and cross-frequency coupling, as well as its relationship to behavioral performance, jointly suggest that the observed modulation effect is caused by the context-induced entrainment rather than being a by-product of post-T2 processing.
4) About the entrainment to rhythmic context and its relation to behavioral modulation index. Previous studies (e.g., Ding et al) have demonstrated the hierarchical temporal structure in speech signals, e.g., emergence of word-level entrainment introduced by language experience. Therefore, it is well expected that imposing a second-order structure on a visual stream would elicit the corresponding steady-state response. I understand that the new part and main focus here are the AB effects. The authors should add more texts explaining how their findings contribute new understandings to the neural mechanism for the intriguing phenomena.
Many thanks for the suggestion. We have provided more discussion in the revised manuscript (page 17, line 447).
We have provided more discussion on this important issue in the revised manuscript (page 17, line 447). In brief, our study demonstrates how cortical tracking of feature-based hierarchical structure reframes the deployment of attentional resources over visual streams. This effect, distinct from the hierarchical entrainment to speech signals (Ding et al., 2016; Gross et al., 2013), does not rely on previously acquired knowledge about the structured information and can be established automatically even when the higher-order structure comes from a task-irrelevant and cross-modal contextual rhythm. On the other hand, our finding sheds fresh light on the adaptive value of the structure-based entrainment effect by expanding its role from rhythmic information (e.g., speech) perception to temporal attention deployment. To our knowledge, few studies have tackled this issue in visual or speech processing.
References:
Ding, N., Melloni, L., Zhang, H., Tian, X., & Poeppel, D. (2016). Cortical tracking of hierarchical linguistic structures in connected speech. Nature Neuroscience, 19(1), 158–164. https://doi.org/10.1038/nn.4186
Gross, J., Hoogenboom, N., Thut, G., Schyns, P., Panzeri, S., Belin, P., & Garrod, S. (2013). Speech Rhythms and Multiplexed Oscillatory Sensory Coding in the Human Brain. PLoS Biol, 11(12). https://doi.org/10.1371/journal.pbio.1001752
Reviewer #2 (Public Review):
In cognitive neuroscience, a large number of studies proposed that neural entrainment, i.e., synchronization of neural activity and low-frequency external rhythms, is a key mechanism for temporal attention. In psychology and especially in vision, attentional blink is the most established paradigm to study temporal attention. Nevertheless, as far as I know, few studies try to link neural entrainment in the cognitive neuroscience literature with attentional blink in the psychology literature. The current study, however, bridges this gap.
The study provides new evidence for the dynamic attending theory using the attentional blink paradigm. Furthermore, it is shown that neural entrainment to the sensory rhythm, measured by EEG, is related to the attentional blink effect. The authors also show that event/chunk boundaries are not enough to modulate the attentional blink effect, and suggest that strict rhythmicity is required to modulate attention in time.
In general, I enjoyed reading the manuscript and only have a few relatively minor concerns.
1) Details about EEG analysis.
. First, each epoch is from -600 ms before the stimulus onset to 1600 ms after the stimulus onset. Therefore, the epoch is 2200 s in duration. However, zero-padding is needed to make the epoch duration 2000 s (for 0.5-Hz resolution). This is confusing. Furthermore, for a more conservative analysis, I recommend to also analyze the response between 400 ms and 1600 ms, to avoid the onset response, and show the results in a supplementary figure. The short duration reduces the frequency resolution but still allows seeing a 2.5-Hz response.
Thanks for the comments. Each epoch was indeed segmented from -600 to 1600 ms relative to the stimulus onset, but in the spectrum analysis, we only used EEG signals from stream onset (i.e., time point 0) to 1600 ms (see the Materials and Methods section) to investigate the oscillatory characteristics of the neural responses purely elicited by rhythmic stimuli. The 1.6-s signals were zero-padded into a 2-s duration to achieve a frequency resolution of 0.5 Hz.
According to the reviewer’s suggestion, we analyzed the EEG signals from 400 ms to 1600 ms relative to stream onset to avoid potential influence of the onset response, and showed the results in Figure 4. Basically, we can still observe spectral peaks at the stimulus frequencies of 2.5, 5 (the harmonic of 2.5 Hz), and 10 Hz for both power and ITPC spectrum. However, the peak magnitudes were much weaker than those of 1.6-s signals especially for 2.5 Hz, and the 2.5-Hz power did not survive the multiple comparisons correction across frequencies (FDR threshold of p < .05), which might be due to the relatively low signal-to-noise ratio for the analysis based on the 1.2-s epochs (only three cycles to estimate the activity at 2.5 Hz). Importantly, we did identify a significant cluster for 2.5 Hz ITPC in the left parieto-occipital region showing a positive correlation with the individuals’ BMI (Fig. R3; CP5, TP7, P5, P7, PO5, PO7, O1; r = .538, p = .016), which is consistent with the findings based on the longer epochs.
Fig. R3. Neural entrainment to contextual rhythms during the period of 400–1600 ms from stream onset. (A) The spectrum for inter-trial phase coherence (ITPC) of EEG signals from 400 to 1600 ms after the stimulus onset. Shaded areas indicate standard errors of the mean. (B) The 2.5-Hz ITPC was significantly correlated with the behavioral modulation index (BMI) in a parieto-occipital cluster, as indicated by orange stars in the scalp topographic map.
Second, "The preprocessed EEG signals were first corrected by subtracting the average activity of the entire stream for each epoch, and then averaged across trials for each condition, each participant, and each electrode." I have several concerns about this procedure.
(A) What is the entire stream? It's the average over time?
Yes, as for the power spectrum analysis, EEG signals were first demeaned by subtracting the average signals of the entire stream over time from onset to offset (i.e., from 0 to 1600 ms) before further analysis. We performed this procedure following previous studies on the entrainment to visual rhythms (Spaak et al., 2014). We have clarified this point in the “Power analysis” part of the Materials and Methods section (page 25, line 677).
References:
Spaak, E., Lange, F. P. de, & Jensen, O. (2014). Local Entrainment of Alpha Oscillations by Visual Stimuli Causes Cyclic Modulation of Perception. The Journal of Neuroscience, 34(10), 3536–3544. https://doi.org/10.1523/JNEUROSCI.4385-13.2014
(B) I suggest to do the Fourier transform first and average the spectrum over participants and electrodes. Averaging the EEG waveforms require the assumption that all electrodes/participants have the same response phase, which is not necessarily true.
Thanks for the suggestion. In an AB paradigm, the evoked neural responses are sufficiently time-locked to the periodic stimulation, so it is reasonable to quantify power estimate with spectral decomposition performed on trial-averaged EEG signals (i.e., evoked power). Moreover, our results of inter-trial phase coherence (ITPC), which estimated the phase-locking value across trials based on single-trial decomposed phase values, also provided supporting evidence that the EEG waveforms were temporally locked across trials to the 2.5-Hz temporal structure in the context session.
Nevertheless, we also took the reviewer’s suggestion seriously and analyzed the power spectrum on the average of single-trial spectral transforms, i.e., the induced power, which puts emphasis on the intrinsic non-phase-locked activities. In line with the results of evoked power and ITPC, the induced power spectrum in context session also peaked at 2.5 Hz and was significantly stronger than that in baseline session at 2.5 Hz (t(15) = 4.186, p < .001, FDR-corrected with a p value threshold < .001). Importantly, Person correlation analysis also revealed a positive cluster in the left parieto-occipital region, indicating the induced power at 2.5 Hz also had strong relevance with the attentional modulation effect (P7, PO7, PO5, PO3; r = .606, p = .006). We have added these additional findings to the revised manuscript (page 11, line 288; see also Figure 4—figure supplement 1).
2) The sequences are short, only containing 16 items and 4 cycles. Furthermore, the targets are presented in the 2nd or 3rd cycle. I suspect that a stronger effect may be observed if the sequence are longer, since attention may not well entrain to the external stimulus until a few cycles. In the first trial of the experiment, they participant may not have a chance to realize that the task-irrelevant auditory/visual stimulus has a cyclic nature and it is not likely that their attention will entrain to such cycles. As the experiment precedes, they learns that the stimulus is cyclic and may allocate their attention rhythmically. Therefore, I feel that the participants do not just rely on the rhythmic information within a trial but also rely on the stimulus history. Please discuss why short sequences are used and whether it is possible to see buildup of the effect over trials or over cycles within a trial.
Thanks for the comments. Typically, to induce a classic pattern of AB effect, the RSVP stream should contain 3–7 distractors before the first target (T1), with varying lengths of distractors (0–7) between two targets and at least 2 items after the second target (T2). In our study, we created the RSVP streams following these rules, which allowed us to observe the typical AB effect that T2 performance was deteriorated at Lag 2 relative to that at Lag 8. Nevertheless, we agree with the reviewer that longer streams would be better for building up the attentional entrainment effect, as we did observe the attentional modulation effect ramped up as the stream proceeded over cycles, consistent with the reviewer’s speculation. In Experiments 1a (using auditory context) and 2a (using color-defined visual context), we adopted two sets of target positions—an early one where T2 appeared at the 6th or 8th position (in the 2nd cycle) of the visual stream, and a late one where T2 appeared at the 10th or 12th position (in the 3rd cycle) of the visual stream. In the manuscript, we reported T2 performance with all the target positions combined, as no significant interaction was found between the target positions and the experimental conditions (ps. > .1). However, additional analysis demonstrated a trend toward an increase of the attentional modulation effect over cycles, from the early to the late positions. As shown in Fig. R4, the modulation effect went stronger and reached significance for the late positions (for Experiment 1a, t(15) = 2.83, p = .013, Cohen’s d = 0.707; for Experiment 2a, t(15) = 3.656, p = .002, Cohen’s d = 0.914) but showed a weaker trend for the early positions (for Experiment 1a, t(15) = 1.049, p = .311, Cohen’s d = 0.262; for Experiment 2a, t(15) = .606, p = .553, Cohen’s d = 0.152).
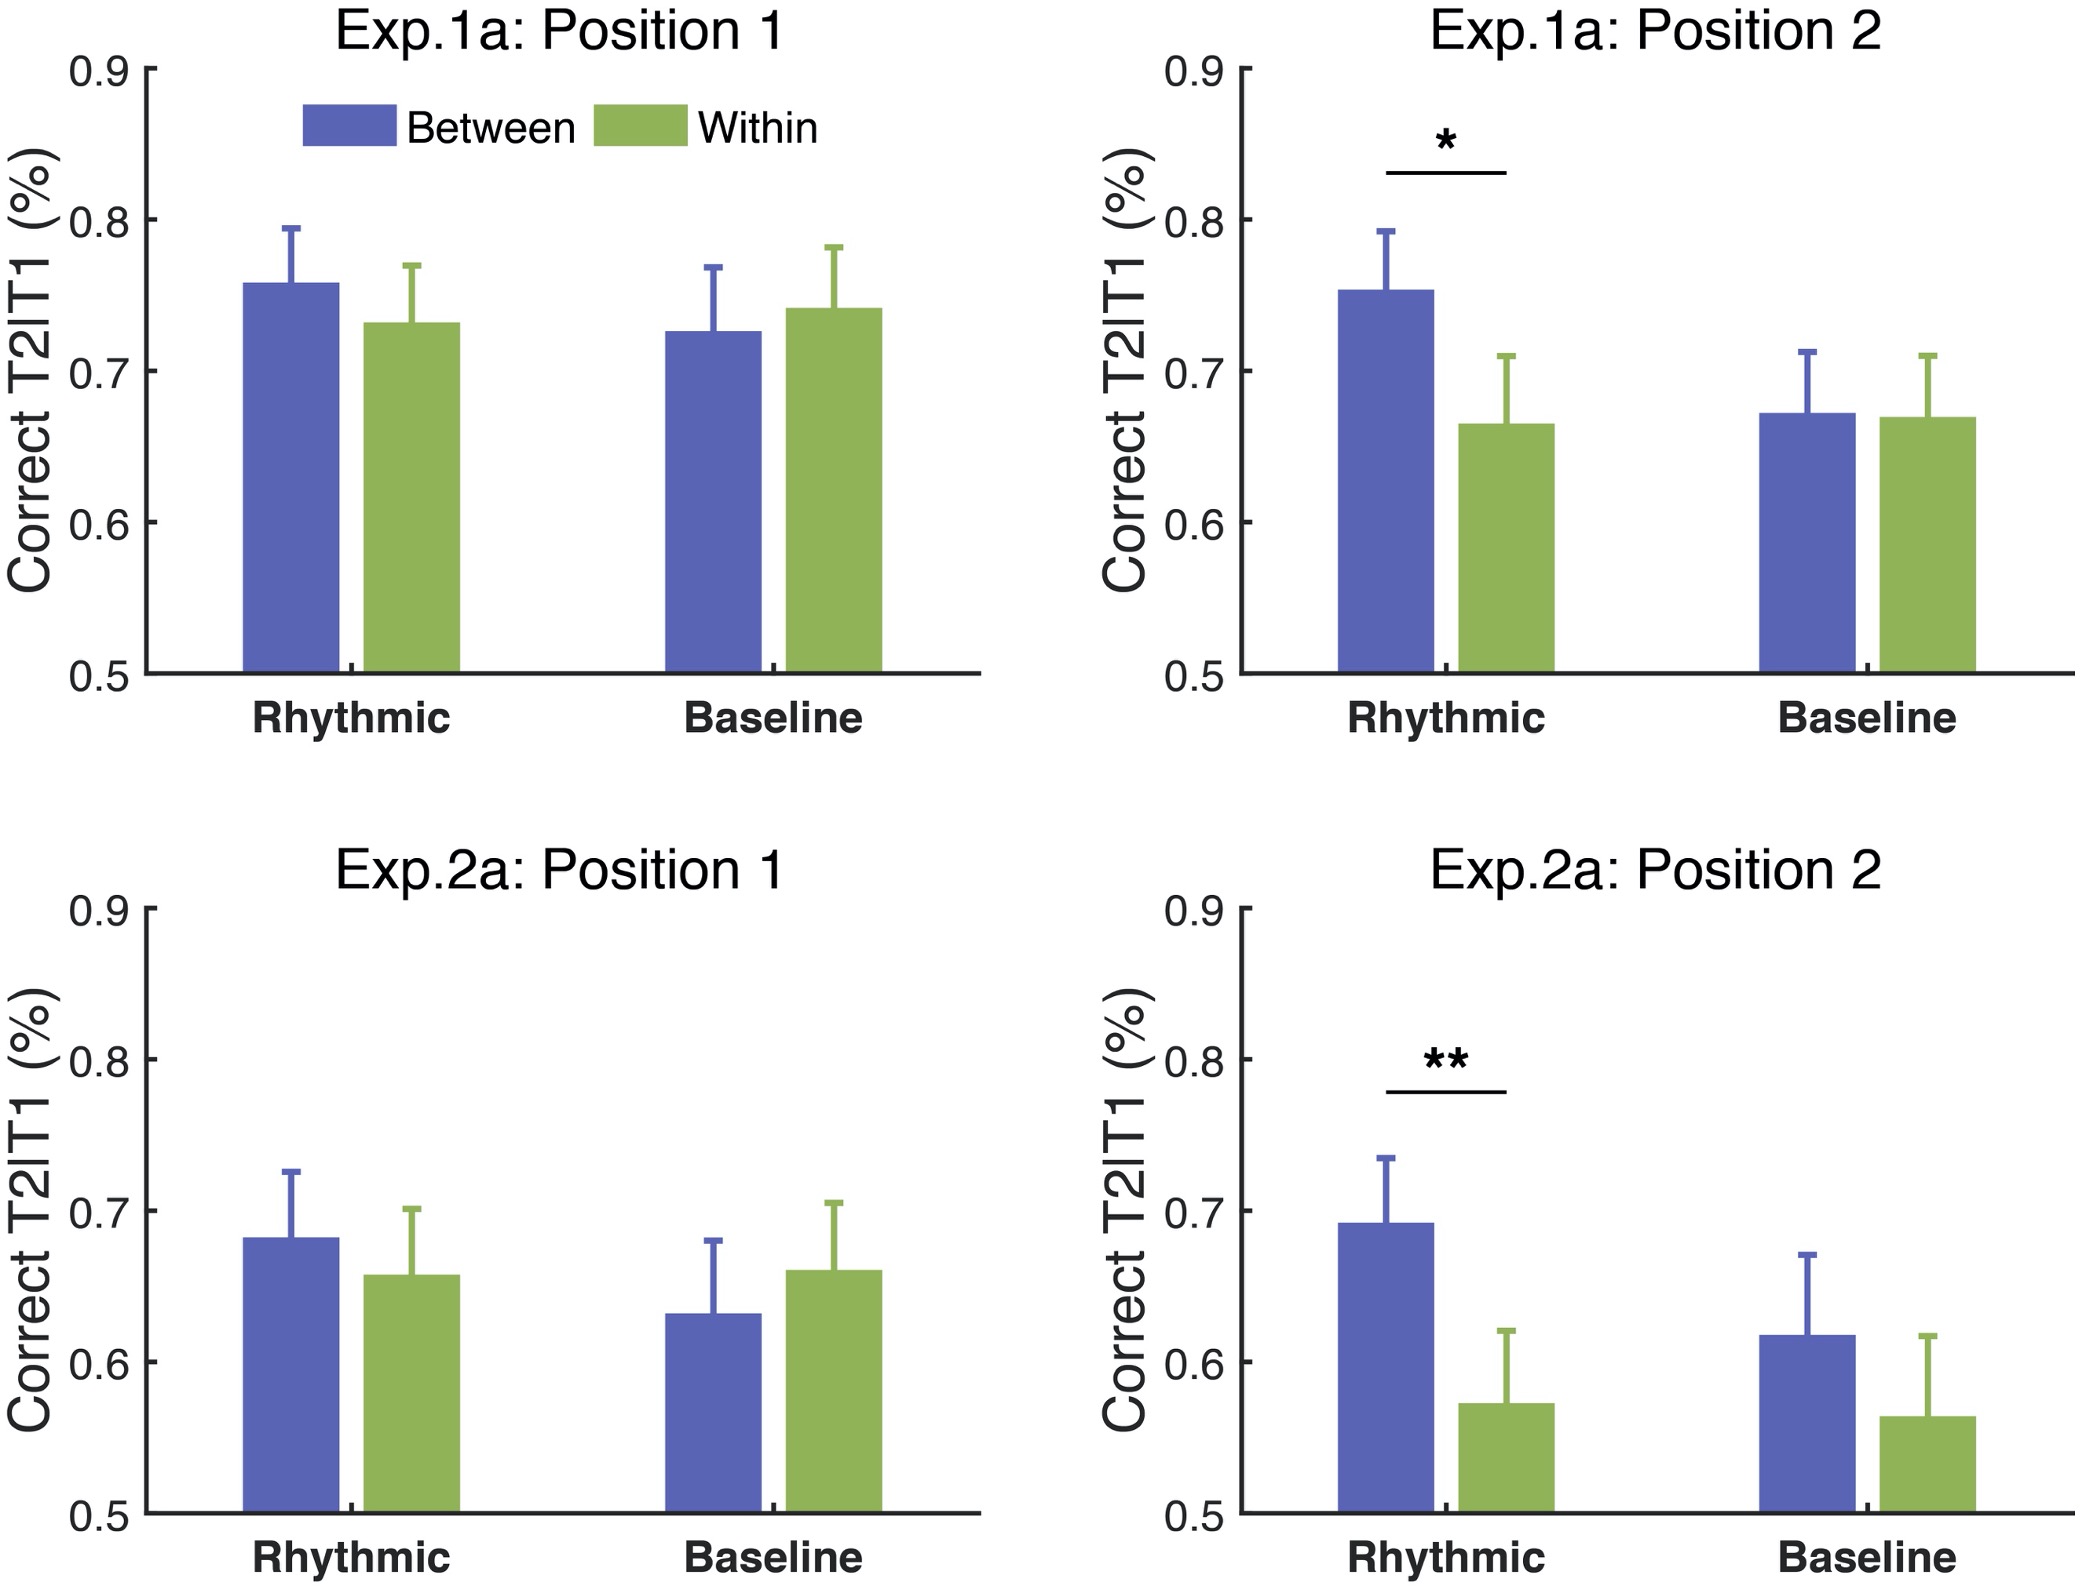
Fig. R4. Attentional modulation effect built up over cycles in Experiments 1a & 2a. Error bars represent 1 SEM; * p<0.05, ** p<0.01.
However, we did not observe an obvious buildup effect across trials in our study. The modulation effect of contextual rhythms seems to be a quick process that the effect is evident in the first quarter of trials in Experiment 1a (for, t(15) = 2.703, p = .016, Cohen’s d = 0.676) and in the second quarter of trials in Experiment 2a (for, t(15) = 2.478, p = .026, Cohen’s d = 0.620.
3) The term "cycle" is used without definition in Results. Please define and mention that it's an abstract term and does not require the stimulus to have "cycles".
Thanks for the suggestion. By its definition, the term “cycle” refers to “an interval of time during which a sequence of a recurring succession of events or phenomena is completed” or “a course or series of events or operations that recur regularly and usually lead back to the starting point” (Merriam-Webster dictionary). In the current study, we stuck to the recurrent and regular nature of “cycle” in general while defined the specific meaning of “cycle” by feature-based periodic changes of the contextual stimuli in each experiment (page 5, line 101; also refer to Procedures in the Materials and Methods section for details). For example, in Experiment 1a, the background tone sequence changed its pitch value from high to low or vice versa isochronously at a rate of 2.5 Hz, thus forming a rhythmic context with structure-based cycles of 400 ms. Note that we did not use the more general term “chunk”, because arbitrary chunks without the regularity of cycles are insufficient to trigger the attentional modulation effect in the current study. Indeed, the effect was eliminated when we replaced the rhythmic cycles with irregular chunks (Experiments 1d & 1e).
4) Entrainment of attention is not necessarily related to neural entrainment to sensory stimulus, and there is considerable debate about whether neural entrainment to sensory stimulus should be called entrainment. Too much emphasis on terminology is of course counterproductive but a short discussion on these issues is probably necessary.
Thanks for the comments. As commonly accepted, entrainment is defined as the alignment of intrinsic neuronal activity to the temporal structure of external rhythmic inputs (Lakatos et al., 2019; Obleser & Kayser, 2019). Here, we are interested in the functional roles of cortical entrainment to the higher-order temporal structure imposed on first-order sensory stimulation, and used the term entrainment to describe the phase-locking neural responses to such hierarchical structure following literature on auditory and visual perception (Brookshire et al., 2017; Doelling & Poeppel, 2015). In our study, the consistent results of power and ITPC have provided strong evidence that neural entrainment at the structure level (2.5 Hz) is significantly correlated with the observed attentional modulation effect. However, this does not mean that the entrainment of attention is necessarily associated with neural entrainment to sensory stimulus in a broader context, as attention may also be guided by predictions based on non-isochronous temporal regularity without requiring stimulus-based oscillatory entrainment (Breska & Deouell, 2017; Morillon et al._2016).
On the other hand, there has been a debate about whether the neural alignment to rhythmic stimulation reflects active entrainment of endogenous oscillatory processes (i.e., induced activity) or a series of passively evoked steady-state responses (Keitel et al., 2019; Notbohm et al., 2016; Zoefel et al., 2018). The latter process is also referred to as “entrainment in a broad sense” by Obleser & Kayser (2019). Given that a presented rhythm always evokes event-related potentials, a better question might be whether the observed alignment reflects the entrainment of endogenous oscillations in addition to evoked steady-state responses. Here we attempted to tackle this issue by measuring the induced power, which emphasizes the intrinsic non-phase-locked activity, in addition to the phase-locked evoked power. Specifically, we quantified these two kinds of activities with the average of single-trial EEG power spectra and the power spectra of trial-averaged EEG signals, respectively, according to Keitel et al. (2019). In addition to the observation of evoked responses to the contextual structure, we also demonstrated an attention-related neural tracking of the higher-order temporal structure based on the induced power at 2.5 Hz (see Figure 4—figure supplement 1), suggesting that the observed attentional modulation effect is at least partially derived from the entrainment of intrinsic oscillatory brain activity. We have briefly discussed this point in the revised manuscript (page 17, line 460).
References:
Breska, A., & Deouell, L. Y. (2017). Neural mechanisms of rhythm-based temporal prediction: Delta phase-locking reflects temporal predictability but not rhythmic entrainment. PLOS Biology, 15(2), e2001665. https://doi.org/10.1371/journal.pbio.2001665
Brookshire, G., Lu, J., Nusbaum, H. C., Goldin-Meadow, S., & Casasanto, D. (2017). Visual cortex entrains to sign language. Proceedings of the National Academy of Sciences, 114(24), 6352–6357. https://doi.org/10.1073/pnas.1620350114
Doelling, K. B., & Poeppel, D. (2015). Cortical entrainment to music and its modulation by expertise. Proceedings of the National Academy of Sciences, 112(45), E6233–E6242. https://doi.org/10.1073/pnas.1508431112
Henry, M. J., Herrmann, B., & Obleser, J. (2014). Entrained neural oscillations in multiple frequency bands comodulate behavior. Proceedings of the National Academy of Sciences, 111(41), 14935–14940. https://doi.org/10.1073/pnas.1408741111
Keitel, C., Keitel, A., Benwell, C. S. Y., Daube, C., Thut, G., & Gross, J. (2019). Stimulus-Driven Brain Rhythms within the Alpha Band: The Attentional-Modulation Conundrum. The Journal of Neuroscience, 39(16), 3119–3129. https://doi.org/10.1523/JNEUROSCI.1633-18.2019
Lakatos, P., Gross, J., & Thut, G. (2019). A New Unifying Account of the Roles of Neuronal Entrainment. Current Biology, 29(18), R890–R905. https://doi.org/10.1016/j.cub.2019.07.075
Morillon, B., Schroeder, C. E., Wyart, V., & Arnal, L. H. (2016). Temporal Prediction in lieu of Periodic Stimulation. Journal of Neuroscience, 36(8), 2342–2347. https://doi.org/10.1523/JNEUROSCI.0836-15.2016
Notbohm, A., Kurths, J., & Herrmann, C. S. (2016). Modification of Brain Oscillations via Rhythmic Light Stimulation Provides Evidence for Entrainment but Not for Superposition of Event-Related Responses. Frontiers in Human Neuroscience, 10. https://doi.org/10.3389/fnhum.2016.00010
Obleser, J., & Kayser, C. (2019). Neural Entrainment and Attentional Selection in the Listening Brain. Trends in Cognitive Sciences, 23(11), 913–926. https://doi.org/10.1016/j.tics.2019.08.004
Zoefel, B., ten Oever, S., & Sack, A. T. (2018). The Involvement of Endogenous Neural Oscillations in the Processing of Rhythmic Input: More Than a Regular Repetition of Evoked Neural Responses. Frontiers in Neuroscience, 12. https://doi.org/10.3389/fnins.2018.00095
Reviewer #3 (Public Review):
The current experiment tests whether the attentional blink is affected by higher-order regularity based on rhythmic organization of contextual features (pitch, color, or motion). The results show that this is indeed the case: the AB effect is smaller when two targets appeared in two adjacent cycles (between-cycle condition) than within the same cycle defined by the background sounds. Experiment 2 shows that this also holds for temporal regularities in the visual domain and Experiment 3 for motion. Additional EEG analysis indicated that the findings obtained can be explained by cortical entrainment to the higher-order contextual structure. Critically feature-based structure of contextual rhythms at 2.5 Hz was correlated with the strength of the attentional modulation effect.
This is an intriguing and exciting finding. It is a clever and innovative approach to reduce the attention blink by presenting a rhythmic higher-order regularity. It is convincing that this pulling out of the AB is driven by cortical entrainment. Overall, the paper is clear, well written and provides adequate control conditions. There is a lot to like about this paper. Yet, there are particular concerns that need to be addressed. Below I outline these concerns:
1) The most pressing concern is the behavioral data. We have to ensure that we are dealing here with a attentional blink. The way the data is presented is not the typical way this is done. Typically in AB designs one see the T2 performance when T1 is ignored relative to when T1 has to be detected. This data is not provided. I am not sure whether this data is collected but if so the reader should see this.
Many thanks for the suggestion. We appreciate the reviewer for his/her thoughtful comments. To demonstrate the AB effect, we did include two T2 lag conditions in our study (Experiments 1a, 1b, 2a, and 2b)—a short-SOA condition where T2 was located at the second lag of T1 (i.e., SOA = 200 ms), and a long-SOA condition where T2 appeared at the 8th lag of T1 (i.e., SOA = 800 ms). In a typical AB effect, T2 performance at short lags is remarkably impaired compared with that at long lags. In our study, we consistently replicated this effect across the experiments, as reported in the Results section of Experiment 1 (page 5, line 106). Overall, the T2 detection accuracy conditioned on correct T1 response was significantly impaired in the short-SOA condition relative to that in the long-SOA condition (mean accuracy > 0.9 for all experiments), during both the context session and the baseline session. More crucially, when looking into the magnitude of the AB effect as measured by (ACClong-SOA - ACCshort-SOA)/ACClong-SOA, we still obtained a significant attentional modulation effect (for Experiment 1a, t(15) = -2.729, p = .016, Cohen’s d = 0.682; for Experiment 2a, t(15) = -4.143, p <.001, Cohen’s d = 1.036) similar to that reflected by the short-SOA condition alone, further confirming that cortical entrainment effectively influences the AB effect.
Although we included both the long- and short-SOA conditions in the current study, we focused on T2 performance in the short-SOA condition rather than along the whole AB curve for the following reasons. Firstly, for the long-SOA conditions, the T2 performance is at ceiling level, making it an inappropriate baseline to probe the attentional modulation effect. We focused on Lag 2 because previous research has identified a robust AB effect around the second lag (Raymond et al., 1992), which provides a reasonable and sensitive baseline to probe the potential modulation effect of the contextual auditory and visual rhythms. Note that instead of using multiple lags, we varied the length of the rhythmic cycles (i.e., a cycle of 300 ms, 400 ms, and 500 ms corresponding to a rhythm frequency of 3.3 Hz, 2.5 Hz, and 2 Hz, respectively, all within the delta band), and showed that the attentional modulation effect could be generalized to these different delta-band rhythmic contexts, regardless of the absolute positions of the targets within the rhythmic cycles.
As to the T1 performance, the overall accuracy was very high, ranging from 0.907 to 0.972, in all of our experiments. The corresponding results have been added to the Results section of the revised manuscript (page 5, line 103). Notably, we did not find T1-T2 trade-offs in most of our experiments, except in Experiment 2a where T1 performance showed a moderate decrease in the between-cycle condition relative to that in the within-cycle condition (mean ± SE: 0.888 ± 0.026 vs. 0.933 ± 0.016, respectively; t(15) = -2.217, p = .043). However, by examining the relationship between the modulation effects (i.e., the difference between the two experimental conditions) on T1 and T2, we did not find any significant correlation (p = .403), suggesting that the better performance for T2 was not simply due to the worse performance in detecting T1.
Finally, previous studies have shown that ignoring T1 would lead to ceiling-level T2 performance (Raymond et al., 1992). Therefore, we did not include such manipulation in the current study, as in that case, it would be almost impossible for us to detect any contextual modulation effect.
References:
Raymond, J. E., Shapiro, K. L., & Arnell, K. M. (1992). Temporary suppression of visual processing in an RSVP task: An attentional blink? Journal of Experimental Psychology: Human Perception and Performance, 18(3), 849–860. https://doi.org/10.1037/0096-1523.18.3.849
2) Also, there is only one lag tested. The ensure that we are dealing here with a true AB I would like to see that more than one lag is tested. In the ideal situation a full AB curve should be presented that includes several lags. This should be done for at least for one of the experiments. It would be informative as we can see how cortical entrainment affects the whole AB curve.
Many thanks for the suggestion. Please refer to our response to the point #1 for “Reviewer #3 (Public Review)”. In short, we did include two T2 lag conditions in our study (Experiments 1a, 1b, 2a and 2b), and the results replicated the typical AB effect. We have clarified this point in the revised manuscript (page 5, line 106).
3) Also, there is no data regarding T1 performance. It is important to show that this the better performance for T2 is not due to worse performance in detecting T1. So also please provide this data.
Many thanks for the suggestion. Please refer to our response to the point #1 or “Reviewer #3 (Public Review)”. We have reported the T1 performance in the revised manuscript (page 5, line 103), and the results didn’t show obvious T1-T2 trade-offs.
4) The authors identify the oscillatory characteristics of EEG signals in response to stimulus rhythms, by examined the FFT spectral peaks by subtracting the mean power of two nearest neighboring frequencies from the power at the stimulus frequency. I am not familiar with this procedure and would like to see some justification for using this technique.
According to previous studies (Nozaradan, 2011; Lenc e al., 2018), the procedure to subtract the average amplitude of neighboring frequency bins can remove unrelated background noise, like muscle activity or eye movement. If there were no EEG oscillatory responses characteristic of stimulus rhythms, the amplitude at a given frequency bin should be similar to the average of its neighbors, and thus no significant peaks could be observed in the subtracted spectrum.
References:
Lenc, T., Keller, P. E., Varlet, M., & Nozaradan, S. (2018). Neural tracking of the musical beat is enhanced by low-frequency sounds. Proceedings of the National Academy of Sciences, 115(32), 8221–8226. https://doi.org/10.1073/pnas.1801421115
Nozaradan, S., Peretz, I., Missal, M., & Mouraux, A. (2011). Tagging the Neuronal Entrainment to Beat and Meter. The Journal of Neuroscience, 31(28), 10234–10240. https://doi.org/10.1523/JNEUROSCI.0411-11.2011
-
-
www.biorxiv.org www.biorxiv.org
-
Author Response:
Evaluation Summary:
Since DBS of the habenula is a new treatment, these are the first data of its kind and potentially of high interest to the field. Although the study mostly confirms findings from animal studies rather than bringing up completely new aspects of emotion processing, it certainly closes a knowledge gap. This paper is of interest to neuroscientists studying emotions and clinicians treating psychiatric disorders. Specifically the paper shows that the habenula is involved in processing of negative emotions and that it is synchronized to the prefrontal cortex in the theta band. These are important insights into the electrophysiology of emotion processing in the human brain.
The authors are very grateful for the reviewers’ positive comments on our study. We also thank all the reviewers for the comments which has helped to improve the manuscript.
Reviewer #1 (Public Review):
The study by Huang et al. report on direct recordings (using DBS electrodes) from the human habenula in conjunction with MEG recordings in 9 patients. Participants were shown emotional pictures. The key finding was a transient increase in theta/alpha activity with negative compared to positive stimuli. Furthermore, there was a later increase in oscillatory coupling in the same band. These are important data, as there are few reports of direct recordings from the habenula together with the MEG in humans performing cognitive tasks. The findings do provide novel insight into the network dynamics associated with the processing of emotional stimuli and particular the role of the habenula.
Recommendations:
How can we be sure that the recordings from the habenula are not contaminated by volume conduction; i.e. signals from neighbouring regions? I do understand that bipolar signals were considered for the DBS electrode leads. However, high-frequency power (gamma band and up) is often associated with spiking/MUA and considered less prone to volume conduction. I propose to also investigate that high-frequency gamma band activity recorded from the bipolar DBS electrodes and relate to the emotional faces. This will provide more certainty that the measured activity indeed stems from the habenula.
We thank the reviewer for the comment. As the reviewer pointed out, bipolar macroelectrode can detect locally generated potentials, as demonstrated in the case of recordings from subthalamic nucleus and especially when the macroelectrodes are inside the subthalamic nucleus (Marmor et al., 2017). However, considering the size of the habenula and the size of the DBS electrode contacts, we have to acknowledge that we cannot completely exclude the possibility that the recordings are contaminated by volume conduction of activities from neighbouring areas, as shown in Bertone-Cueto et al. 2019. We have now added extra information about the size of the habenula and acknowledged the potential contamination of activities from neighbouring areas through volume conduction in the ‘Limitation’:
"Another caveat we would like to acknowledge that the human habenula is a small region. Existing data from structural MRI scans reported combined habenula (the sum of the left and right hemispheres) volumes of ~ 30–36 mm3 (Savitz et al., 2011a; Savitz et al., 2011b) which means each habenula has the size of 2~3 mm in each dimension, which may be even smaller than the standard functional MRI voxel size (Lawson et al., 2013). The size of the habenula is also small relative to the standard DBS electrodes (as shown in Fig. 2A). The electrodes used in this study (Medtronic 3389) have electrode diameter of 1.27 mm with each contact length of 1.5 mm, and contact spacing of 0.5 mm. We have tried different ways to confirm the location of the electrode and to select the contacts that is within or closest to the habenula: 1.) the MRI was co-registered with a CT image (General Electric, Waukesha, WI, USA) with the Leksell stereotactic frame to obtain the coordinate values of the tip of the electrode; 2.) Post-operative CT was co-registered to pre-operative T1 MRI using a two-stage linear registration using Lead-DBS software. We used bipolar signals constructed from neighbouring macroelectrode recordings, which have been shown to detect locally generated potentials from subthalamic nucleus and especially when the macroelectrodes are inside the subthalamic nucleus (Marmor et al., 2017). Considering that not all contacts for bipolar LFP construction are in the habenula in this study, as shown in Fig. 2, we cannot exclude the possibility that the activities we measured are contaminated by activities from neighbouring areas through volume conduction. In particular, the human habenula is surrounded by thalamus and adjacent to the posterior end of the medial dorsal thalamus, so we may have captured activities from the medial dorsal thalamus. However, we also showed that those bipolar LFPs from contacts in the habenula tend to have a peak in the theta/alpha band in the power spectra density (PSD); whereas recordings from contacts outside the habenula tend to have extra peak in beta frequency band in the PSD. This supports the habenula origin of the emotional valence related changes in the theta/alpha activities reported here."
We have also looked at gamma band oscillations or high frequency activities in the recordings. However, we didn’t observe any peak in high frequency band in the average power spectral density, or any consistent difference in the high frequency activities induced by the emotional stimuli (Fig. S1). We suspect that high frequency activities related to MUA/spiking are very local and have very small amplitude, so they are not picked up by the bipolar LFPs measured from contacts with both the contact area for each contact and the between-contact space quite large comparative to the size of the habenula.
A
B
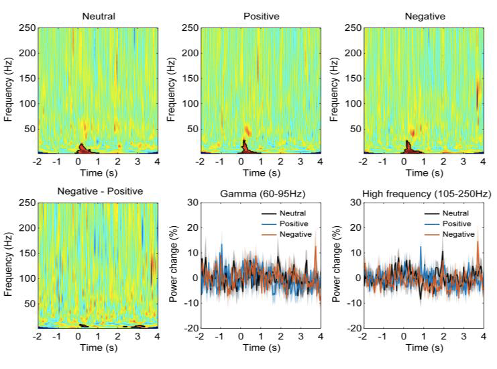
Figure S1. (A) Power spectral density of habenula LFPs across all time period when emotional stimuli were presented. The bold blue line and shadowed region indicates the mean ± SEM across all recorded hemispheres and the thin grey lines show measurements from individual hemispheres. (B) Time-frequency representations of the power response relative to pre-stimulus baseline for different conditions showing habenula gamma and high frequency activity are not modulated by emotional
References:
Savitz JB, Bonne O, Nugent AC, Vythilingam M, Bogers W, Charney DS, et al. Habenula volume in post-traumatic stress disorder measured with high-resolution MRI. Biology of Mood & Anxiety Disorders 2011a; 1(1): 7.
Savitz JB, Nugent AC, Bogers W, Roiser JP, Bain EE, Neumeister A, et al. Habenula volume in bipolar disorder and major depressive disorder: a high-resolution magnetic resonance imaging study. Biological Psychiatry 2011b; 69(4): 336-43.
Lawson RP, Drevets WC, Roiser JP. Defining the habenula in human neuroimaging studies. NeuroImage 2013; 64: 722-7.
Marmor O, Valsky D, Joshua M, Bick AS, Arkadir D, Tamir I, et al. Local vs. volume conductance activity of field potentials in the human subthalamic nucleus. Journal of Neurophysiology 2017; 117(6): 2140-51.
Bertone-Cueto NI, Makarova J, Mosqueira A, García-Violini D, Sánchez-Peña R, Herreras O, et al. Volume-Conducted Origin of the Field Potential at the Lateral Habenula. Frontiers in Systems Neuroscience 2019; 13:78.
Figure 3: the alpha/theta band activity is very transient and not band-limited. Why refer to this as oscillatory? Can you exclude that the TFRs of power reflect the spectral power of ERPs rather than modulations of oscillations? I propose to also calculate the ERPs and perform the TFR of power on those. This might result in a re-interpretation of the early effects in theta/alpha band.
We agree with the reviewer that the activity increase in the first time window with short latency after the stimuli onset is very transient and not band-limited. This raise the question that whether this is oscillatory or a transient evoked activity. We have now looked at this initial transient activity in different ways: 1.) We quantified the ERP in LFPs locked to the stimuli onset for each emotional valence condition and for each habenula. We investigated whether there was difference in the amplitude or latency of the ERP for different stimuli emotional valence conditions. As showing in the following figure, there is ERP with stimuli onset with a positive peak at 402 ± 27 ms (neutral stimuli), 407 ± 35 ms (positive stimuli), 399 ± 30 ms (negative stimuli). The flowing figure (Fig. 3–figure supplement 1) will be submitted as figure supplement related to Fig. 3. However, there was no significant difference in ERP latency or amplitude caused by different emotional valence stimuli. 2.) We have quantified the pure non-phase-locked (induced only) power spectra by calculating the time-frequency power spectrogram after subtracting the ERP (the time-domain trial average) from time-domain neural signal on each trial (Kalcher and Pfurtscheller, 1995; Cohen and Donner, 2013). This shows very similar results as we reported in the main manuscript, as shown in Fig. 3–figure supplement 2. These further analyses show that even though there were event related potential changes time locked around the stimuli onset, and this ERP did NOT contribute to the initial broad-band activity increase at the early time window shown in plot A-C in Figure 3. The figures of the new analyses and following have now been added in the main text:
"In addition, we tested whether stimuli-related habenula LFP modulations primarily reflect a modulation of oscillations, which is not phase-locked to stimulus onset, or, alternatively, if they are attributed to evoked event-related potential (ERP). We quantified the ERP for each emotional valence condition for each habenula. There was no significant difference in ERP latency or amplitude caused by different emotional valence stimuli (Fig. 3–figure supplement 1). In addition, when only considering the non phase-locked activity by removing the ERP from the time series before frequency-time decomposition, the emotional valence effect (presented in Fig. 3–figure supplement 2) is very similar to those shown in Fig.3. These additional analyses demonstrated that the emotional valence effect in the LFP signal is more likely to be driven by non-phase-locked (induced only) activity."
A
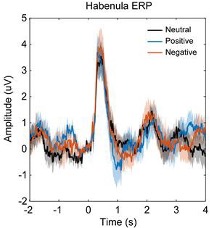
B
Fig. 3–figure supplement 1. Event-related potential (ERP) in habenula LFP signals in different emotional valence (neutral, positive and negative) conditions. (A) Averaged ERP waveforms across patients for different conditions. (B) Peak latency and amplitude (Mean ± SEM) of the ERP components for different conditions.
Fig. 3–figure supplement 2. Non-phase-locked activity in different emotional valence (neutral, positive and negative) conditions (N = 18). (A) Time-frequency representation of the power changes relative to pre-stimulus baseline for three conditions. Significant clusters (p < 0.05, non-parametric permutation test) are encircled with a solid black line. (B) Time-frequency representation of the power response difference between negative and positive valence stimuli, showing significant increased activity the theta/alpha band (5-10 Hz) at short latency (100-500 ms) and another increased theta activity (4-7 Hz) at long latencies (2700-3300 ms) with negative stimuli (p < 0.05, non-parametric permutation test). (C) Normalized power of the activities at theta/alpha (5-10 Hz) and theta (4-7 Hz) band over time. Significant difference between the negative and positive valence stimuli is marked by a shadowed bar (p < 0.05, corrected for multiple comparison).
References:
Kalcher J, Pfurtscheller G. Discrimination between phase-locked and non-phase-locked event-related EEG activity. Electroencephalography and Clinical Neurophysiology 1995; 94(5): 381-4.
Cohen MX, Donner TH. Midfrontal conflict-related theta-band power reflects neural oscillations that predict behavior. Journal of Neurophysiology 2013; 110(12): 2752-63.
Figure 4D: can you exclude that the frontal activity is not due to saccade artifacts? Only eye blink artifacts were reduced by the ICA approach. Trials with saccades should be identified in the MEG traces and rejected prior to further analysis.
We understand and appreciate the reviewer’s concern on the source of the activity modulations shown in Fig. 4D. We tried to minimise the eye movement or saccade in the recording by presenting all figures at the centre of the screen, scaling all presented figures to similar size, and presenting a white cross at the centre of the screen preparing the participants for the onset of the stimuli. Despite this, participants my still make eye movements and saccade in the recording. We used ICA to exclude the low frequency large amplitude artefacts which can be related to either eye blink or other large eye movements. However, this may not be able to exclude artefacts related to miniature saccades. As shown in Fig. 4D, on the sensor level, the sensors with significant difference between the negative vs. positive emotional valence condition clustered around frontal cortex, close to the eye area. However, we think this is not dominated by saccades because of the following two reasons:
1.) The power spectrum of the saccadic spike artifact in MEG is characterized by a broadband peak in the gamma band from roughly 30 to 120 Hz (Yuval-Greenberg et al., 2008; Keren et al., 2010). In this study the activity modulation we observed in the frontal sensors are limited to the theta/alpha frequency band, so it is different from the power spectra of the saccadic spike artefact.
2.) The source of the saccadic spike artefacts in MEG measurement tend to be localized to the region of the extraocular muscles of both eyes (Carl et al., 2012).We used beamforming source localisation to identify the source of the activity modulation reported in Fig. 4D. This beamforming analysis identified the source to be in the Broadmann area 9 and 10 (shown in Fig. 5). This excludes the possibility that the activity modulation in the sensor level reported in Fig. 4D is due to saccades. In addition, Broadman area 9 and 10, have previously been associated with emotional stimulus processing (Bermpohl et al., 2006), Broadman area 9 in the left hemisphere has also been used as the target for repetitive transcranial magnetic stimulation (rTMS) as a treatment for drug-resistant depression (Cash et al., 2020). The source localisation results, together with previous literature on the function of the identified source area suggest that the activity modulation we observed in the frontal cortex is very likely to be related to emotional stimuli processing.
References:
Yuval-Greenberg S, Tomer O, Keren AS, Nelken I, Deouell LY. Transient induced gamma-band response in EEG as a manifestation of miniature saccades. Neuron 2008; 58(3): 429-41.
Keren AS, Yuval-Greenberg S, Deouell LY. Saccadic spike potentials in gamma-band EEG: characterization, detection and suppression. NeuroImage 2010; 49(3): 2248-63.
Carl C, Acik A, Konig P, Engel AK, Hipp JF. The saccadic spike artifact in MEG. NeuroImage 2012; 59(2): 1657-67.
Bermpohl F, Pascual-Leone A, Amedi A, Merabet LB, Fregni F, Gaab N, et al. Attentional modulation of emotional stimulus processing: an fMRI study using emotional expectancy. Human Brain Mapping 2006; 27(8): 662-77.
Cash RFH, Weigand A, Zalesky A, Siddiqi SH, Downar J, Fitzgerald PB, et al. Using Brain Imaging to Improve Spatial Targeting of Transcranial Magnetic Stimulation for Depression. Biological Psychiatry 2020.
The coherence modulations in Fig 5 occur quite late in time compared to the power modulations in Fig 3 and 4. When discussing the results (in e.g. the abstract) it reads as if these findings are reflecting the same process. How can the two effect reflect the same process if the timing is so different?
As the reviewer pointed out correctly, the time window where we observed the coherence modulations happened quite late in time compared to the initial power modulations in the frontal cortex and the habenula (Fig. 4). And there was another increase in the theta band activities in the habenula area even later, at around 3 second after stimuli onset when the emotional figure has already disappeared. Emotional response is composed of a number of factors, two of which are the initial reactivity to an emotional stimulus and the subsequent recovery once the stimulus terminates or ceases to be relevant (Schuyler et al., 2014). We think these neural effects we observed in the three different time windows may reflect different underlying processes. We have discussed this in the ‘Discussion’:
"These activity changes at different time windows may reflect the different neuropsychological processes underlying emotion perception including identification and appraisal of emotional material, production of affective states, and autonomic response regulation and recovery (Phillips et al., 2003a). The later effects of increased theta activities in the habenula when the stimuli disappeared were also supported by other literature showing that, there can be prolonged effects of negative stimuli in the neural structure involved in emotional processing (Haas et al., 2008; Puccetti et al., 2021). In particular, greater sustained patterns of brain activity in the medial prefrontal cortex when responding to blocks of negative facial expressions was associated with higher scores of neuroticism across participants (Haas et al., 2008). Slower amygdala recovery from negative images also predicts greater trait neuroticism, lower levels of likability of a set of social stimuli (neutral faces), and declined day-to-day psychological wellbeing (Schuyler et al., 2014; Puccetti et al., 2021)."
References:
Schuyler BS, Kral TR, Jacquart J, Burghy CA, Weng HY, Perlman DM, et al. Temporal dynamics of emotional responding: amygdala recovery predicts emotional traits. Social Cognitive and Affective Neuroscience 2014; 9(2): 176-81.
Phillips ML, Drevets WC, Rauch SL, Lane R. Neurobiology of emotion perception I: The neural basis of normal emotion perception. Biological Psychiatry 2003a; 54(5): 504-14.
Haas BW, Constable RT, Canli T. Stop the sadness: Neuroticism is associated with sustained medial prefrontal cortex response to emotional facial expressions. NeuroImage 2008; 42(1): 385-92.
Puccetti NA, Schaefer SM, van Reekum CM, Ong AD, Almeida DM, Ryff CD, et al. Linking Amygdala Persistence to Real-World Emotional Experience and Psychological Well-Being. Journal of Neuroscience 2021: JN-RM-1637-20.
Be explicit on the degrees of freedom in the statistical tests given that one subject was excluded from some of the tests.
We thank the reviewers for the comment. The number of samples used for each statistics analysis are stated in the title of the figures. We have now also added the degree of freedom in the main text when parametric statistical tests such as t-test or ANOVAs have been used. When permutation tests (which do not have any degrees of freedom associated with it) are used, we have now added the number of samples for the permutation test.
Reviewer #2 (Public Review):
In this study, Huang and colleagues recorded local field potentials from the lateral habenula in patients with psychiatric disorders who recently underwent surgery for deep brain stimulation (DBS). The authors combined these invasive measurements with non-invasive whole-head MEG recordings to study functional connectivity between the habenula and cortical areas. Since the lateral habenula is believed to be involved in the processing of emotions, and negative emotions in particular, the authors investigated whether brain activity in this region is related to emotional valence. They presented pictures inducing negative and positive emotions to the patients and found that theta and alpha activity in the habenula and frontal cortex increases when patients experience negative emotions. Functional connectivity between the habenula and the cortex was likewise increased in this band. The authors conclude that theta/alpha oscillations in the habenula-cortex network are involved in the processing of negative emotions in humans.
Because DBS of the habenula is a new treatment tested in this cohort in the framework of a clinical trial, these are the first data of its kind. Accordingly, they are of high interest to the field. Although the study mostly confirms findings from animal studies rather than bringing up completely new aspects of emotion processing, it certainly closes a knowledge gap.
In terms of community impact, I see the strengths of this paper in basic science rather than the clinical field. The authors demonstrate the involvement of theta oscillations in the habenula-prefrontal cortex network in emotion processing in the human brain. The potential of theta oscillations to serve as a marker in closed-loop DBS, as put forward by the authors, appears less relevant to me at this stage, given that the clinical effects and side-effects of habenula DBS are not known yet.
We thank the reviewers for the favourable comments about the implication of our study in basic science and about the value of our study in closing a knowledge gap. We agree that further studies would be required to make conclusions about the clinical effects and side-effects of habenula DBS.
Detailed comments:
The group-average MEG power spectrum (Fig. 4B) suggests that negative emotions lead to a sustained theta power increase and a similar effect, though possibly masked by a visual ERP, can be seen in the habenula (Fig. 3C). Yet the statistics identify brief elevations of habenula theta power at around 3s (which is very late), a brief elevation of prefrontal power a time 0 or even before (Fig. 4C) and a brief elevation of Habenula-MEG theta coherence around 1 s. It seems possible that this lack of consistency arises from a low signal-to-noise ratio. The data contain only 27 trails per condition on average and are contaminated by artifacts caused by the extension wires.
With regard to the nature of the activity modulation with short latency after stimuli onset: whether this is an ERP or oscillation? We have now investigated this. In summary, by analysing the ERP and removing the influence of the ERP from the total power spectra, we didn’t observe stimulus emotional valence related modulation in the ERP, and the modulation related to emotional valence in the pure induced (non-phase-locked) power spectra was similar to what we have observed in the total power shown in Fig. 3. Therefore, we argue that the theta/alpha increase with negative emotional stimuli we observed in both habenula and prefrontal cortex 0-500 ms after stimuli onset are not dominated by visual or other ERP.
With regard to the signal-to-noise ratio from only 27 trials per condition on average per participant: We have tried to clean the data by removing the trials with obvious artefacts characterised by increased measurements in the time domain over 5 times the standard deviation and increased activities across all frequency bands in the frequency domain. After removing the trials with artefacts, we have 27 trials per condition per subject on average. We agree that 27 trials per condition on average is not a high number, and increasing the number of trials would further increase the signal-to-noise ratio. However, our studies with EEG recordings and LFP recordings from externalised patients have shown that 30 trials was enough to identify reduction in the amplitude of post-movement beta oscillations at the beginning of visuomotor adaption in the motor cortex and STN (Tan et al., 2014a; Tan et al., 2014b). These results of motor error related modulation in the post-movement beta have been repeated by other studies from other groups. In Tan et al. 2014b, with simultaneous EEG and STN LFP measurements and a similar number of trials (around 30), we also quantified the time-course of STN-motor cortex coherence during voluntary movements. This pattern has also been repeated in a separate study from another group with around 50 trials per participant (Talakoub et al., 2016). In addition, similar behavioural paradigm (passive figure viewing paradigm) has been used in two previous studies with LFP recordings from STN from different patient groups (Brucke et al., 2007; Huebl et al., 2014). In both studies, a similar number of trials per condition around 27 was used. The authors have identified meaningful activity modulation in the STN by emotional stimuli. Therefore, we think the number of trials per condition was sufficient to identify emotional valence induced difference in the LFPs in the paradigm.
We agree that the measurement of coherence can be more susceptible to noise and suffer from the reduced signal-to-noise ratio in MEG recording. In Hirschmann et al. 2013, 5 minutes of resting recording and 5 minutes of movement recording from 10 PD patients were used to quantify movement related changes in STN-cortical coherence and how this was modulated by levodopa (Hirschmann et al., 2013). Litvak et al. (2012) have identified movement-related changes in the coherence between STN LFP and motor cortex with recording with simultaneous STN LFP and MEG recordings from 17 PD patients and 20 trials in average per participant per condition (Litvak et al., 2012). With similar methods, van Wijk et al. (2017) used recordings from 9 patients and around on average in 29 trials per hand per condition, and they identified reduced cortico-pallidal coherence in the low-beta decreases during movement (van Wijk et al., 2017). So the trial number per condition participant we used in this study are comparable to previous studies.
The DBS extension wires do reduce signal-to-noise ratio in the MEG recording. therefore the spatiotemporal Signal Space Separation (tSSS) method (Taulu and Simola, 2006) implemented in the MaxFilter software (Elekta Oy, Helsinki, Finland) has been applied in this study to suppress strong magnetic artifacts caused by extension wires. This method has been proved to work well in de-noising the magnetic artifacts and movement artifacts in MEG data in our previous studies (Cao et al., 2019; Cao et al., 2020). In addition, the beamforming method proposed by several studies (Litvak et al., 2010; Hirschmann et al., 2011; Litvak et al., 2011) has been used in this study. In Litvak et al., 2010, the artifacts caused by DBS extension wires was detailed described and the beamforming was demonstrated to effectively suppress artifacts and thereby enable both localization of cortical sources coherent with the deep brain nucleus. We have now added more details and these references about the data cleaning and the beamforming method in the main text. With the beamforming method, we did observe the standard movement-related modulation in the beta frequency band in the motor cortex with 9 trials of figure pressing movements, shown in the following figure for one patient as an example (Figure 5–figure supplement 1). This suggests that the beamforming method did work well to suppress the artefacts and help to localise the source with a low number of trials. The figure on movement-related modulation in the motor cortex in the MEG signals have now been added as a supplementary figure to demonstrate the effect of the beamforming.
Figure 5–figure supplement 1. (A) Time-frequency maps of MEG activity for right hand button press at sensor level from one participant (Case 8). (B) DICS beamforming source reconstruction of the areas with movement-related oscillation changes in the range of 12-30 Hz. The peak power was located in the left M1 area, MNI coordinate [-37, -12, 43].
References:
Tan H, Jenkinson N, Brown P. Dynamic neural correlates of motor error monitoring and adaptation during trial-to-trial learning. Journal of Neuroscience 2014a; 34(16): 5678-88.
Tan H, Zavala B, Pogosyan A, Ashkan K, Zrinzo L, Foltynie T, et al. Human subthalamic nucleus in movement error detection and its evaluation during visuomotor adaptation. Journal of Neuroscience 2014b; 34(50): 16744-54.
Talakoub O, Neagu B, Udupa K, Tsang E, Chen R, Popovic MR, et al. Time-course of coherence in the human basal ganglia during voluntary movements. Scientific Reports 2016; 6: 34930.
Brucke C, Kupsch A, Schneider GH, Hariz MI, Nuttin B, Kopp U, et al. The subthalamic region is activated during valence-related emotional processing in patients with Parkinson's disease. European Journal of Neuroscience 2007; 26(3): 767-74.
Huebl J, Spitzer B, Brucke C, Schonecker T, Kupsch A, Alesch F, et al. Oscillatory subthalamic nucleus activity is modulated by dopamine during emotional processing in Parkinson's disease. Cortex 2014; 60: 69-81.
Hirschmann J, Ozkurt TE, Butz M, Homburger M, Elben S, Hartmann CJ, et al. Differential modulation of STN-cortical and cortico-muscular coherence by movement and levodopa in Parkinson's disease. NeuroImage 2013; 68: 203-13.
Litvak V, Eusebio A, Jha A, Oostenveld R, Barnes G, Foltynie T, et al. Movement-related changes in local and long-range synchronization in Parkinson's disease revealed by simultaneous magnetoencephalography and intracranial recordings. Journal of Neuroscience 2012; 32(31): 10541-53.
van Wijk BCM, Neumann WJ, Schneider GH, Sander TH, Litvak V, Kuhn AA. Low-beta cortico-pallidal coherence decreases during movement and correlates with overall reaction time. NeuroImage 2017; 159: 1-8.
Taulu S, Simola J. Spatiotemporal signal space separation method for rejecting nearby interference in MEG measurements. Physics in Medicine and Biology 2006; 51(7): 1759-68.
Cao C, Huang P, Wang T, Zhan S, Liu W, Pan Y, et al. Cortico-subthalamic Coherence in a Patient With Dystonia Induced by Chorea-Acanthocytosis: A Case Report. Frontiers in Human Neuroscience 2019; 13: 163.
Cao C, Li D, Zhan S, Zhang C, Sun B, Litvak V. L-dopa treatment increases oscillatory power in the motor cortex of Parkinson's disease patients. NeuroImage Clinical 2020; 26: 102255.
Litvak V, Eusebio A, Jha A, Oostenveld R, Barnes GR, Penny WD, et al. Optimized beamforming for simultaneous MEG and intracranial local field potential recordings in deep brain stimulation patients. NeuroImage 2010; 50(4): 1578-88.
Litvak V, Jha A, Eusebio A, Oostenveld R, Foltynie T, Limousin P, et al. Resting oscillatory cortico-subthalamic connectivity in patients with Parkinson's disease. Brain 2011; 134(Pt 2): 359-74.
Hirschmann J, Ozkurt TE, Butz M, Homburger M, Elben S, Hartmann CJ, et al. Distinct oscillatory STN-cortical loops revealed by simultaneous MEG and local field potential recordings in patients with Parkinson's disease. NeuroImage 2011; 55(3): 1159-68.
I doubt that the correlation between habenula power and habenula-MEG coherence (Fig. 6C) is informative of emotion processing. First, power and coherence in close-by time windows are likely to to be correlated irrespective of the task/stimuli. Second, if meaningful, one would expect the strongest correlation for the negative condition, as this is the only condition with an increase of theta coherence and a subsequent increase of theta power in the habenula. This, however, does not appear to be the case.
The authors included the factors valence and arousal in their linear model and found that only valence correlated with electrophysiological effects. I suspect that arousal and valence scores are highly correlated. When fed with informative yet highly correlated variables, the significance of individual input variables becomes difficult to assess in many statistical models. Hence, I am not convinced that valence matters but arousal not.
For the correlation shown in Fig. 6C, we used a linear mixed-effect modelling (‘fitlme’ in Matlab) with different recorded subjects as random effects to investigate the correlations between the habenula power and habenula-MEG coherence at an earlier window, while considering all trials together. Therefore the reported value in the main text and in the figure (k = 0.2434 ± 0.1031, p = 0.0226, R2 = 0.104) show the within subjects correlation that are consistent across all measured subjects. The correlation is likely to be mediated by emotional valence condition, as negative emotional stimuli tend to be associated with both high habenula-MEG coherence and high theta power in the later time window tend to happen in the trials with.
The arousal scores are significantly different for the three valence conditions as shown in Fig. 1B. However, the arousal scores and the valence scores are not monotonically correlated, as shown in the following figure (Fig. S2). The emotional neutral figures have the lowest arousal value, but have the valence value sitting between the negative figures and the positive figures. We have now added the following sentence in the main text:
"This nonlinear and non-monotonic relationship between arousal scores and the emotional valence scores allowed us to differentiate the effect of the valence from arousal."
Table 2 in the main text show the results of the linear mixed-effect modelling with the neural signal as the dependent variable and the valence and arousal scores as independent variables. Because of the non-linear and non-monotonic relationship between the valence and arousal scores, we think the significance of individual input variables is valid in this statistical model. We have now added a new figure (shown below, Fig. 7) with scatter plots showing the relationship between the electrophysiological signal and the arousal and emotional valence scores separately using Spearman’s partial correlation analysis. In each scatter plot, each dot indicates the average measurement from one participant in one emotional valence condition. As shown in the following figure, the electrophysiological measurements linearly correlated with the valence score, but not with the arousal scores. However, the statistics reported in this figure considered all the dots together. The linear mixed effect modelling taking into account the interdependency of the measurements from the same participant. So the results reported in the main text using linear mixed effect modelling are statistically more valid, but supplementary figure here below illustrate the relationship.
Figure S2. Averaged valence and arousal ratings (mean ± SD) for figures of the three emotional condition. (B) Scatter plots showing the relationship between arousal and valence scores for each emotional condition for each participant.
Figure 7. Scatter plots showing how early theta/alpha band power increase in the frontal cortex (A), theta/alpha band frontal cortex-habenula coherence (B) and theta band power increase in habenula stimuli (C) changed with emotional valence (left column) and arousal (right column). Each dot shows the average of one participant in each categorical valence condition, which are also the source data of the multilevel modelling results presented in Table 2. The R and p value in the figure are the results of partial correlation considering all data points together.
Page 8: "The time-varying coherence was calculated for each trial". This is confusing because coherence quantifies the stability of a phase difference over time, i.e. it is a temporal average, not defined for individual trials. It has also been used to describe the phase difference stability over trials rather than time, and I assume this is the method applied here. Typically, the greatest coherence values coincide with event-related power increases, which is why I am surprised to see maximum coherence at 1s rather than immediately post-stimulus.
We thank the reviewer for pointing out this incorrect description. As the reviewer pointed out correctly, the method we used describe the phase difference stability over trials rather than time. We have now clarified how coherence was calculated and added more details in the methods:
"The time-varying cross trial coherence between each MEG sensor and the habenula LFP was first calculated for each emotional valence condition. For this, time-frequency auto- and cross-spectral densities in the theta/alpha frequency band (5-10 Hz) between the habenula LFP and each MEG channel at sensor level were calculated using the wavelet transform-based approach from -2000 to 4000 ms for each trial with 1 Hz steps using the Morlet wavelet and cycle number of 6. Cross-trial coherence spectra for each LFP-MEG channel combination was calculated for each emotional valence condition for each habenula using the function ‘ft_connectivityanalysis’ in Fieldtrip (version 20170628). Stimulus-related changes in coherence were assessed by expressing the time-resolved coherence spectra as a percentage change compared to the average value in the -2000 to -200 ms (pre-stimulus) time window for each frequency."
In the Morlet wavelet analysis we used here, the cycle number (C) determines the temporal resolution and frequency resolution for each frequency (F). The spectral bandwidth at a given frequency F is equal to 2F/C while the wavelet duration is equal to C/F/pi. We used a cycle number of 6. For theta band activities around 5 Hz, we will have the spectral bandwidth of 25/6 = 1.7 Hz and the wavelet duration of 6/5/pi = 0.38s = 380ms.
As the reviewer noticed, we observed increased activities across a wide frequency band in both habenula and the prefrontal cortex within 500 ms after stimuli onset. But the increase of cross-trial coherence starts at around 300 ms. The increase of coherence in a time window without increase of power in either of the two structures indicates a phase difference stability across trials in the oscillatory activities from the two regions, and this phase difference stability across trials was not secondary to power increase.
Reviewer #3 (Public Review):
This paper describes the oscillatory activity of the habenula using local field potentials, both within the region and, through the use of MEG, in connection to the prefrontal cortex. The characteristics of this activity were found to vary with the emotional valence but not with arousal. Sheding light on this is relevant, because the habenula is a promising target for deep brain stimulation.
In general, because I am not much on top of the literature on the habenula, I find difficult to judge about the novelty and the impact of this study. What I can say is that I do find the paper is well-written and very clear; and the methods, although quite basic (which is not bad), are sound and rigourous.
We thank the reviewer for the positive comments about the potential implication of our study and on the methods we used.
On the less positive side, even though I am aware that in this type of studies it is difficult to have high N, the very low N in this case makes me worry about the robustness and replicability of the results. I'm sure I have missed it and it's specified somewhere, but why is N different for the different figures? Is it because only 8 people had MEG? The number of trials seems also a somewhat low. Therefore, I feel the authors perhaps need to make an effort to make up for the short number of subjects in order to add confidence to the results. I would strongly recommend to bootstrap the statistical analysis and extract non-parametric confidence intervals instead of showing parametric standard errors whenever is appropriate. When doing that, it must be taken into account that each two of the habenula belong to the same person; i.e. one bootstraps the subjects not the habenula.
We do understand and appreciate the concern of the reviewer on the low sample numbers due to the strict recruitment criteria for this very early stage clinical trial: 9 patients for bilateral habenula LFPs, and 8 patients with good quality MEGs. Some information to justify the number of trials per condition for each participant has been provided in the reply to the Detailed Comments 1 from Reviewer 2. The sample number used in each analysis was included in the figures and in the main text.
We have used non-parametric cluster-based permutation approach (Maris and Oostenveld, 2007) for all the main results as shown in Fig. 3-5. Once the clusters (time window and frequency band) with significant differences for different emotional valence conditions have been identified, parametric statistical test was applied to the average values of the clusters to show the direction of the difference. These parametric statistics are secondary to the main non-parametric permutation test.
In addition, the DICS beamforming method was applied to localize cortical sources exhibiting stimuli-related power changes and cortical sources coherent with deep brain LFPs for each subject for positive and negative emotional valence conditions respectively. After source analysis, source statistics over subjects was performed. Non-parametric permutation testing with or without cluster-based correction for multiple comparisons was applied to statistically quantify the differences in cortical power source or coherence source between negative and positive emotional stimuli.
References:
Maris E, Oostenveld R. Nonparametric statistical testing of EEG- and MEG-data. Journal of Neuroscience Methods 2007; 164(1): 177-90.
Related to this point, the results in Figure 6 seem quite noisy, because interactions (i.e. coherence) are harder to estimate and N is low. For example, I have to make an effort of optimism to believe that Fig 6A is not just noise, and the result in Fig 6C is also a bit weak and perhaps driven by the blue point at the bottom. My read is that the authors didn't do permutation testing here, and just a parametric linear-mixed effect testing. I believe the authors should embed this into permutation testing to make sure that the extremes are not driving the current p-value.
We have now quantified the coherence between frontal cortex-habenula and occipital cortex-habenula separately (please see more details in the reply to Reviewer 2 (Recommendations for the authors 6). The new analysis showed that the increase in the theta/alpha band coherence around 1 s after the negative stimuli was only observed between prefrontal cortex-habenula and not between occipital cortex-habenula. This supports the argument that Fig. 6A is not just noise.
-
-
www.biorxiv.org www.biorxiv.org
-
Note: This response was posted by the corresponding author to Review Commons. The content has not been altered except for formatting.
Learn more at Review Commons
Reply to the reviewers
Manuscript number: RC-2025-03220
Corresponding author(s): Ryusuke Niwa, Yuko Shimada-Niwa, and Wei Sun
Dear Editors,
We are pleased to submit our revised manuscript of RC-2025-03220R. The reviewers’ comments from Review Commons are presented in italic.
For submission of our current revised manuscript, we provide two Word files, which are the “clean” and “Track-and-Change” files. Page and line numbers described below correspond to those of the “clean” file. The “Track-and-Change” file might be helpful for Reviewers to find what we have changed for the current revision.
We hope that the revised version is now suitable for the next stage of evaluation.
Sincerely,
Ryusuke Niwa, Yuko Shimada-Niwa, and Wei Sun
1. General Statements [optional]
We sincerely thank the reviewers for their thoughtful feedback on our initial submission. Experiments that we will conduct and the revisions on the manuscript that have already been incorporated are detailed below in the point-by-point response. For this revised submission, two versions of the manuscript are provided: a clean copy and a tracked-changes file. Page and line numbers mentioned below refer to the clean version, while the tracked-changes file is intended to help reviewers easily identify the revisions made.
In preparing the revision plan, we have included additional data, some of which were generated in collaboration with new contributors. Accordingly, we would like to propose adding Yuichi Shichino and Shintaro Iwasaki as co-authors to acknowledge their contributions.
2. Description of the planned revisions__ __
__
- Also, the authors show that two different RNAi lines for NudC give the same defects - it would be good to know if the RNAi lines target the same or different sequences in the NudC transcripts. Alternatively, it would be equally good to show that trans-allelic combinations of NudC mutants have the same defects in the prothoracic glands and the salivary glands as the RNAi. Instead, they examine only overall body size, developmental delays and lethality in the trans-hetero allelic NudC mutants.
Author response:
In response to the second part of the criticism, we will further validate the observed phenotypes by examining tissue and nuclear size, chromosomal structure, and the levels of Fibrillarin and RpS6 proteins in the prothoracic glands and salivary glands of NudC mutants.
__
- It would be quite helpful to characterize the "5 blob" and "shortened polytene chromosome arm" defects shown in Figure 2 and Figure 6. Are these partially polytenized chromosomes or are large sections of the chromosomes missing or just underreplicated? What do the chromosomes look like if you lyse the nuclei, spread the chromosomes and stain with DAPI or Hoechst - this is a pretty standard practice and would reveal much more about the structure of the polytene chromosomes.
Author response:
To address these structural concerns more clearly, we plan to apply established protocols to obtain higher-resolution images and gather more detailed information on chromosome morphology.
__ - Discussion, line 468. I don't think the authors have provided evidence of DNA damage. With the experiments they have shown, the chromosomes look abnormal - not clear what is abnormal.
Author response:
To further confirm DNA damage in NudC knockdown salivary gland cells, we plan to perform a TUNEL assay, which detects DNA fragmentation associated with damage.
We would like to note that, in the current manuscript, we have shown that depletion of NudC, eIF5, RpLP0-like, or Nopp140 increased γH2Av levels, suggesting activation of the DNA damage response (Figures 6B and 6C).
__
*The authors claim that NudC has a dual role as a cell cycle/cytoskeleton regulator and as a ribosome biogenesis factor. However, because NudC knockdown reduces nuclear size and ploidy (Figures 1F and 2H-2I), the authors cannot exclude that decreased rDNA dosage and nucleolar volume contribute to reduced rRNA signals and that the effects seen are due to a NudC involvement in endoreplication, the rRNA reduction being a consequence of lower polyploidy. Different allelic combinations of NudC induce larval growth defects (Figure S5), consistent with a NudC role in endoreplication. To circumvent this, the authors could genetically modulate endocycle progression (e.g., E2F or Fzr overexpression) in the NudC RNAi background to test whether inducing endoreplication rescues rRNA production and nucleolar volume. This would establish causality between the endocycle state and rRNA output and clarify whether NudC's primary role is in RiBi or endocycle control. *
Author response: In response to Reviewer #2’s suggestion, we plan to genetically modify the progression of the endocycle by inducing continuous expression of Cyclin E (CycE), E2F1, and Fzr in NudC RNAi salivary glands to test whether promoting endoreplication can restore rRNA production and nucleolar volume.
In fact, we have attempted to rescue the developmental arrest in animals with NudC-deficient prothoracic glands (PGs) by inducing continuous expression of CycE. Two constructs, UAS-CycE-1 (BDSC#30725) and UAS-CycE-2 (BDSC#30924), were used. UAS-CycE-1 has previously been shown to rescue developmental arrest in PG-specific TOR loss-of-function animals (Ohhara, Kobayashi, and Yamanaka. PLoS Genetics 13 (1): e1006583, 2017). We introduced each construct into NudC knockdown PGs. However, continuous expression of CycE did not restore development (Figure A as shown below), suggesting that NudC functions in the polyploid cells extend beyond endocycle regulation. We do not currently plan to include the PG data shown in Figure A in the revised manuscript. We will evaluate whether it would be meaningful to present PG data alongside salivary gland results once we have obtained and analyzed data from the salivary gland rescue experiment.
__Figure A. _Survival and developmental progression following continuous expression of CycE._ __Control (phtm>dicer2, +), NudC knockdown (phtm>dicer2, NudC RNAi), and NudC RNAi + CycE (phtm>dicer2, NudC RNAi, CycE) flies were analyzed at 10 days after hatching (10 dAH). Dead indicates dead larvae; L3 denotes third-instar larvae. Sample sizes (number of flies) are shown below each bar.
__
*The conclusion that NudC maintains rRNA levels is derived from salivary gland RNAi phenotypes with strong reductions in ITS1/ITS2 and 18S/28S signals (Figure 4B-4K) and reduced 28S by Northern (Figure 4L), plus corroboration in fat body cells (Figure S7). The authors verified knockdown using two independent RNAi lines for growth phenotypes and NudC::GFP reduction (Figure S2) and generated a UAS-FLAG::NudC transgene (Key Resources), but rRNA measurements were reported for only one RNAi line without rescue. Rescue of the rRNA phenotype by transgenic NudC re-expression, or replication of the rRNA decrease with a second, non-overlapping RNAi, would directly attribute the effect to NudC. In the absence of these standard validation controls, an off-target explanation remains plausible. *
Author response:
We plan to analyze rRNA FISH signals in salivary glands and fat bodies using a second, non-overlapping RNAi strain to confirm the reproducibility of the observed effects.
__ - The authors report in Fig. 2 elevated γH2Av in SG cells upon NudC knockdown and interpret this as evidence of chromosome destabilization. They also state that apoptosis is not observed in Fig S10. However, the increase in γH2Av could reflect transient or early apoptotic events or other stress responses triggered by NudC depletion, rather than direct defects in endoreplication or genome stability. I suggest that the authors clarify this important point, for example, by co-expressing apoptotic inhibitors such as P35, or by using the TUNEL assay, which is more sensitive than anti-Caspase3 or Dcp1 antibodies.
Author response:
We plan to perform a TUNEL assay on salivary gland cells to evaluate apoptosis associated with NudC depletion.
__ - Activation of the JNK pathway is often accompanied by apoptosis. It would strengthen the conclusions if the authors included a positive control to confirm that apoptosis is not induced under these experimental conditions, ensuring that the observed effects are specific to autophagy and not confounded by cell death.
Author response:
We will analyze pJNK and autophagy levels in animals expressing a constitutively-active form of hemipterous (hep) (hep[CA] ) under the control of fkh-GAL4 driver as a positive control. hep encodes the Drosophila JNK kinase, and it is well established that forced expression of hep[CA] induces JNK phosphorylation and activation.
__ - In Figure S1, reduction of NudC in the fat body appears to induce a starvation-like phenotype, suggesting a potential impairment of metabolic or nutrient-sensing pathways. It would be important to determine whether modulation of nutrient-responsive signaling could rescue this phenotype. Specifically, have the authors examined whether activation of the TOR or PI3K pathways mitigates the effects of NudC knockdown? Assessing pathway activity (e.g., via phospho-S6K or phospho-Akt levels) or performing genetic rescue experiments with pathway activators could clarify whether the observed phenotypes are mediated through disrupted nutrient signaling rather than a secondary effect of general cellular stress. Such analyses could also provide a mechanistic explanation for the increased autophagy observed in these cells.
Author response:
- We will analyze phospho-S6K levels in salivary glands and fat bodies by immunostaining.
- To activate the TOR pathway in NudC RNAi fat bodies, we will overexpress Rheb, an established upstream activator of the TOR pathway in Drosophila, which has been shown to robustly increase TOR signaling and S6K phosphorylation.
__ - The current images of autophagic vesicles in the SG in Fig. 8B are not clearly visible and quantified. Considering the large size of these polyploid cells, higher-resolution images or alternative imaging approaches should be presented to better visualize and quantify autophagy. This would make the conclusions regarding enhanced autophagy more convincing. In addition, this data could be further strengthened by expanding the analysis of autophagy to other cell types. For example, examining autophagy in fat body cells, where autophagy plays a primary physiological role associated with rRNA accumulation (Fig. S7), rather than a reduction like in SG (Fig. 4), could provide a useful comparison for the function of NudC between polyploid cells.
Author response:
In response to the second part of the reviewer’s comment, we will conduct additional experiments using anti-Atg8a immunostaining and/or LysoTracker staining to analyze autophagy in NudC RNAi fat bodies and prothoracic glands. These experiments will help further characterize the cellular responses associated with NudC depletion.
3. Description of the revisions that have already been incorporated in the transferred manuscript
__
-The title is a bit problematic since they haven't shown that NudC doesn't also affect normal mitotic cells - they only look at polyploid cells, but that doesn't mean normal mitotic cells are not also affected.
Author response:
In response to the suggestion from Reviewer #1, we have revised the title from “NudC moonlights in ribosome biogenesis and homeostasis in Drosophila melanogaster polyploid cells” to “NudC moonlights in ribosome biogenesis and homeostasis in polyploid cells of Drosophila melanogaster” to place greater emphasis on “polyploid cells.”
Regarding mitotic cells, we have added new data in the revised manuscript (Figure S7; lines 249–256 and 417–418) demonstrating that NudC regulates apoptosis and stress responses in mitotic imaginal wing disc cells. However, as the main focus of our study remains polyploid cells, we have chosen to retain the emphasis in the title.
__
- Also, the authors show that two different RNAi lines for NudC give the same defects - it would be good to know if the RNAi lines target the same or different sequences in the NudC transcripts. Alternatively, it would be equally good to show that trans-allelic combinations of NudC mutants have the same defects in the prothoracic glands and the salivary glands as the RNAi. Instead, they examine only overall body size, developmental delays and lethality in the trans-hetero allelic NudC mutants.
Author response:
In response to the first half of criticism, the two RNAi lines used for NudC target distinct sequences. We have added the corresponding RNAi target sites to Figure S4A for clarity.
__
- Results: Lines 261 - 266. Seeing electron dense structures in TEMs and seeing increased Me31B staining by confocal imaging in the cytoplasm is insufficient evidence that the electron dense structures are P-bodies. They could be the P-bodies but they could also be aggregated ribosomes; there is insufficient evidence to "confirm" that they are P-bodies - maybe just say "suggests".
Author response:
In response to Reviewer #1’s suggestion, we have revised lines 261–262 to avoid using the word "confirm." The new sentence reads: “Immunostaining with the P-body marker Me31B reveals numerous cytoplasmic P-bodies in NudC-deficient SG cells,” which appears in lines 293–295.
__
- Abstract, lines 28 - 31. I think this gene has been identified before. The authors probably want to say they have discovered a role for this gene in RiBi.
Author response:
We have followed Reviewer #1’s suggestion and revised the sentence in lines 35–37 to: “In this study, we discovered a role for the gene NudC (nuclear distribution C, dynein complex regulator) in RiBi within polyploid cells of Drosophila melanogaster larvae.”
__
- Introduction, line 66. The protein is imported into the nucleus, where it localizes to the nucleolus - technically the protein is not imported into the nucleolus.
Author response:
To correct the misrepresentation in line 66, we have revised the sentence to: “RP mRNAs are synthesized by RNA polymerase II, and exported to the cytoplasm for translation. Then, RPs are imported into the nucleus, where they localize to the nucleolus.” in lines 70–73.
__ - Introduction, line 70. To be comprehensive in the description of ribosome biogenesis, the authors may want to mention that the 40S and 60S subunits are then exported from the nucleus and form the 80S subunit in the cytoplasm during translation.
Author response:
To improve the representation, we have revised the sentences in lines 73 – 78 as follows: “Within the nucleolus, rRNAs and RPs assemble into pre-40S and pre-60S subunits. immature versions of the small (40S) and large (60S) subunits, respectively, that undergo maturation with numerous ribosome biogenesis factors (RBFs) (Greber, 2016). The 40S and 60S subunits are then transported separately to the cytoplasm, where they combine to form functional 80S ribosomes, capable of sustaining protein synthesis (Pelletier et al., 2018).”
__ - Introduction, line 98. May want to cite paper showing that Minute mutations turn out to be mutations in individual ribosomal protein genes.
Author response:
As Reviewer #1 suggested, we have cited two, Marygold et al. (2007) entitled “The ribosomal protein genes and Minute loci of Drosophila melanogaster” and Recasens-Alvarez et al. (2021) entitled “Ribosomopathy-associated mutations cause proteotoxic stress that is alleviated by TOR inhibition” along with He et al. (2015). The inappropriate citation to Brehme (1939) has been removed.
__ - Results, lines 292. Since they didn't knock down NudC in the fat body cells in this experiment, this comment seems irrelevant.
Author response:
We would like to clarify that the phenotype observed with fkh-GAL4-driven NudC RNAi was specific to salivary glands, and no obvious phenotypes were detected in the surrounding fat body cells, which do not express fkh-GAL4. In this context, the adjacent fat body cells serve as an internal control.
In the revised manuscript, the sentence has been rewritten as: “In contrast, the fat body cells surrounding NudC-deficient SGs did not show this reduction (Figure S9),” in lines 323–324.
__ - Figure 6A. Hoechst is misspelled.
__
- Fig. 2 I - Hoeschest should be Hoescht.
Author response:
We have fixed the error.
__ *- Given that prothoracic gland (PG) size influences ecdysone production, the finding that NudC knockdown alters PG cell size, morphology, and cytoskeletal organization raises the possibility that ecdysone synthesis or signaling may also be affected. This, in turn, could explain the delayed maturation phenotype observed in Figure 1. I recommend testing whether ectopic activation of ecdysone signaling, for instance through 20-hydroxyecdysone (20E) supplementation, can rescue the defects in PG size and developmental timing. Such an experiment would strengthen the link between NudC function, PG morphology, and ecdysone-dependent developmental progression. *
Author response:
We have conducted experiments showing that developmental defects in NudC RNAi animals can be partially rescued by administering 20E. Approximately 32% of NudC RNAi larvae fed with 20E completed pupariation. These new data have been added to Figure S1B and are described in the main text (lines 165-168).
Regarding PG size, our experiments show that PG growth remains inhibited following 20E administration (Figure B as shown below). This observation indicates that treatment with exogenous 20E does not restore PG growth in NudC RNAi animals, suggesting that other factors may be required for normal PG development beyond ecdysone supplementation.
Because this analysis is not the main focus of our manuscript, we currently plan not to include these data in the revised manuscript.
Figure B. Prothoracic gland (PG) size ____after 20E administration.
To assess whether 20E supplementation could restore PG size, control (phtm>dicer2, +) and NudC RNAi (phtm>dicer2, NudC RNAi) larvae were transferred at 60 hours after hatching (hAH) to standard medium containing 20E dissolved in 100% ethanol. Control groups were transferred to medium containing the same volume of 100% ethanol at the same time point. PG size was quantified at the wandering stage. Sample sizes (number of glands) are shown below each bar. Bars represent mean ± SD. **p * *
__ - Additionally, qRT-PCR can be performed to assess the expression levels of ecdysone precursors or target genes in whole larvae, serving as a readout of ecdysone activity, including dilp8, which is usually upregulated when ecdysone levels are reduced.
Author response: To investigate ecdysone biosynthesis, Halloween genes including nvd, spok, sro, phm, dib, and sad were measured by conducting qRT-PCR. In NudC RNAi animals, nvd, sro and phm were suppressed at late L3 stage, indicating that NudC in the PG is required for ecdysone biosynthesis. The new data are described in Figure S1A and in the main text (lines 159-164) in the revised manuscript.
__ - The current images of autophagic vesicles in the SG in Fig. 8B are not clearly visible and quantified. Considering the large size of these polyploid cells, higher-resolution images or alternative imaging approaches should be presented to better visualize and quantify autophagy. This would make the conclusions regarding enhanced autophagy more convincing.
Author response:
Regarding the image quality issue, we have provided improved images of anti-Atg8a immunostaining in the salivary gland mosaic clones (Figure 8B) and included additional data from SG-specific knockdown cells (Supplemental Figures S13A-S13F) to provided quantitative results.
__ - Furthermore, including experiments in other cell types, such as imaginal disc cells, where apoptosis is more readily induced, would help determine whether the effects of NudC knockdown are specific to polyploid cells or are more broadly applicable.
Author response: We found that apoptosis was observed in NudC RNAi wing discs. In the revised manuscript, we have included this data in Figure S7 and referenced it in the main text (lines 249–256).
4. Description of analyses that authors prefer not to carry out
__ - Results, lines 285 to 298. In situs with multiple probes that detect all parts of both the pre-rRNA and processed rRNA indicate that all are down in the SG in NudC knockdowns, but that the 18S and 28S rRNAs are down the internal transcribed spacers go up - can the authors explain or hypothesize how this could happen?
Author response:
As Reviewer #1 indicated, we indeed observed that internal transcribed spacer (ITS) levels decrease in NudC knockdown salivary glands, but increase in knockdown fat bodies. Our hypothesis is that, as noted in the Discussion (lines 529–534), ribosome abundance is typically linked to protein synthesis. Salivary gland cells, which are highly active in protein production, may be particularly sensitive to disruptions in ribosome biogenesis. Therefore, NudC may maintain appropriate levels of rRNA with its impact varying according to the specific regulatory mechanisms of each cell type. We do not have a further explanation for this phenomenon, and therefore we have retained the original sentences without adding new ones.
__ - The data presented in Fig 4 show that NudC knockdown reduces pre-rRNA (ITS1/ITS2) and mature 18S/28S rRNAs in a tissue-specific manner. However, it remains unclear whether these reductions have functional consequences for ribosome assembly and translation. I recommend that the authors perform polysome profiling or an equivalent assay to assess the impact of NudC loss on actively translating ribosomes. This approach would provide a quantitative readout of translation efficiency and clarify whether the observed rRNA defects lead to impaired protein synthesis. Additionally, polysome profiling could help explain the tissue-specific differences observed between salivary glands and fat body cells.
Author response:
We performed ribosome fractionation using wild-type salivary glands and repeated the experiment three times with 56–62 gland pairs per sample. As shown in Figure C, the polyribosome peaks (grey lines) are not prominent, indicating that a much larger number of glands would be required for robust polysome profiling. Given that NudC RNAi salivary glands are significantly smaller than wild-type glands, collecting enough tissue for equivalent profiling would be technically difficult. Therefore, we concluded that obtaining sufficient RNAi samples for polysome profiling is extremely challenging, and these data have not been included in the revised manuscript.
On the other hand, we would like to emphasize that we observed a significant reduction in O-propargyl puromycin (OPP) labeling in NudC-deficient salivary gland cells (Figure 3B), which provides strong evidence for reduced translational activity.
__Figure C. Ribosomal fraction profiles of wild-type salivary glands. __Salivary glands from the late L3 larvae were dissected for analysis. Polyribosome peaks are indicated in grey. The number of salivary gland pairs used for each sample is shown above each bar.
-
-
www.biorxiv.org www.biorxiv.org
-
Reviewer #1 (Public review):
Summary:
Mancl et al. present a comprehensive integrative study combining cryo-EM, SAXS, enzymatic assays, and molecular dynamics (MD) simulations to characterize conformational dynamics of human insulin-degrading enzyme (IDE). In the revised manuscript, the study now also includes time-resolved cryo-EM and coarse-grained MD simulations, which strengthen the mechanistic model by revealing insulin-induced allostery and β-sheet interactions between IDE and insulin. Together, these results expand the original mechanistic insight and further validate R668 as a key residue governing the open-close transition and substrate-dependent activity modulation of IDE.
Strengths:
The authors have substantially expanded the experimental scope by adding time-resolved cryo-EM data and coarse-grained MD simulations, directly addressing requests for mechanistic depth and temporal insight. The integration of multiple resolution scales (cryo-EM heterogeneity analysis, all-atom and coarse-grained MD simulations, and biochemical validation) now provides a coherent description of the conformational transitions and allosteric regulation of IDE. The addition of Aβ degradation assays strengthens the claim that R668 modulates IDE function in a substrate-specific manner. Finally, the manuscript reads more clearly: figure organization, section headers, and inclusion of a new introductory figure make it accessible to a broader audience. Overall, the revision reinforces the conceptual advance that the dynamic interdomain motions of IDE underlie both its unfoldase and protease activities and identifies structural motifs that could be targeted pharmacologically.
Weaknesses:
While the authors acknowledge that future studies on additional IDE substrates (e.g., amylin and glucagon) are warranted, such experiments remain outside the present scope. Their absence modestly limits the generalization of the R668 mechanism across all IDE substrates. Despite improved discussion of kinetic timescales and enzyme-substrate interactions, experimental correlation between MD timescales and catalysis remains primarily inferential. The moderate local resolution of some cryo-EM states (notably O/pO) continues to limit atomic interpretation of the most flexible regions, though the authors address this carefully.
-
Author response:
The following is the authors’ response to the original reviews.
Reviewer #1 (Public review):
Summary:
Mancl et al. present cryo-EM structures of the Insulin Degrading Enzyme (IDE) dimer and characterize its conformational dynamics by integrating structures with SEC-SAXS, enzymatic activity assays, and all-atom molecular dynamics (MD) simulations. They present five cryo-EM structures of the IDE dimer at 3.0-4.1 Å resolution, obtained with one of its substrates, insulin, added to IDE in a 1:2 ratio. The study identified R668 as a key residue mediating the open-close transition of IDE, a finding supported by simulations and experimental data. The work offers a refined model for how IDE recognizes and degrades amyloid peptides, incorporating the roles of IDE-N rotation and charge-swapping events at the IDE-N/C interface.
Strengths:
The study by Mancl et al. uses a combination of experimental (cryoEM, SEC-SAXS, enzymatic assays) and computational (MD simulations, multibody analysis, 3DVA) techniques to provide a comprehensive characterization of IDE dynamics. The identification of R668 as a key residue mediating the open-to-close transition of IDE is a novel finding, supported by both simulations and experimental data presented in the manuscript. The work offers a refined model for how IDE recognizes and degrades amyloid peptides, incorporating the roles of IDE-N rotation and chargeswapping events at the IDE-N/C interface. The study identifies the structural basis and key residues for IDE dynamics that were not revealed by static structures.
Weaknesses:
Based on MD simulations and enzymatic assays of IDE, the authors claim that the R668A mutation in IDE affects the conformational dynamics governing the open-closed transition, which leads to altered substrate binding and catalysis. The functional importance of R668 would be substantiated by enzymatic assays that included some of the other known substrates of IDE than insulin such as amylin and glucagon.
We have included amyloid beta in our enzymatic assays, as shown in Figure 5D, and have updated the manuscript text accordingly. The R668A mutation results in a loss of dose-dependent competition with amyloid beta, but not with insulin. To further substantiate this unexpected finding, we plan to undertake a comprehensive biochemical characterization of the R668A mutation across a variety of substrates, followed by structural analysis of this mutant. However, these investigations are beyond the scope of the current study and, if successful, warrant a separate publication.
It is unclear to what extent the force field (FF) employed in the MD simulations favors secondary structures and if the lack of any observed structural changes within the IDE domains in the simulations - which is taken to suggest that the domains behave as rigid bodies - stems from bias by the FF.
We utilized the widely adopted CHARMM36 force field, whose parameters have been validated by thousands of previous studies. As shown in Figure 2A, our simulations reveal small but noticeable fluctuations in intradomain RMSD values. However, after careful examination, we found that these changes do not correspond to any biologically meaningful motions based on previously reported structural and biophysical characterizations of IDE (e.g., Shen et al., Nature 2006; Noinaj et al., PLOS One 2011; McCord et al., PNAS 2013; Zhang et al., eLife 2018, and references therein).
Reviewer #2 (Public review):
Summary:
The manuscript describes various conformational states and structural dynamics of the Insulin degrading enzyme (IDE), a zinc metalloprotease by nature. Both open and closed-state structures of IDE have been previously solved using crystallography and cryo-EM which reveal a dimeric organization of IDE where each monomer is organized into N and C domains. C-domains form the interacting interface in the dimeric protein while the two N-domains are positioned on the outer sides of the core formed by Cdomains. It remains elusive how the open state is converted into the closed state but it is generally accepted that it involves large-scale movement of N-domains relative to the C-domains. The authors here have used various complementary experimental techniques such as cryo-EM, SAXS, size-exclusion chromatography, and enzymatic assays to characterize the structure and dynamics of IDE protein in the presence of substrate protein insulin whose density is captured in all the structures solved. The experimental structural data from cryo-EM suffered from a high degree of intrinsic motion among the different domains and consequently, the resultant structures were moderately resolved at 3-4.1 Å resolution. A total of five structures were generated by cryo-EM. The authors have extensively used Molecular dynamics simulation to fish out important inter-subunit contacts which involve R668, E381, D309, etc residues. In summary, authors have explored the conformational dynamics of IDE protein using experimental approaches which are complemented and analyzed in atomic details by using MD simulation studies. The studies are meticulously conducted and lay the ground for future exploration of the protease structure-function relationship.
Reviewer #1 (Recommendations for the authors):
The manuscript reads well, however, there are minor details throughout that would tighten it up and, in some cases, make it easier to approach for a broader readership:
Abstract
(1) R668 is referred to by its one-letter code throughout the main text but referred to as arginine-668 in the abstract. The abstract should be corrected to R668.
This has been corrected.
(2) The authors should consider reordering the significance of their work as it is listed at the end of the abstract. As the work first and foremost "offers the molecular basis of unfoldase activity of IDE and provides a new path forward towards the development of substrate-specific modulators of IDE activity" these should come before "the power of integrating experimental and computational methodologies to understand protein dynamics".
We have revised abstract substantially to incorporate the new findings. Consequently, the sentence for "the power of integrating experimental and computational methodologies to understand protein dynamics" has been removed.
Main text
(1) Cryo-EM is consistently referred to as cryoEM throughout the text. The commonly accepted format for referring to cryogenic electron microscopy is cryo-EM. The authors are asked to consider revising the text accordingly.
The text has been revised.
(2) Introduction: The authors are asked to consider including a figure (panel) that provides the general reader with an overview of IDE architecture and topology as a point of reference in the introduction to understanding the pseudo symmetry in IDE, domains, and IDE-C relative to IDE-N, etc. This is relevant for reading most of the figures.
We have added a new figure 1 to provide the background and questions to be answered.
(3) The authors should consider renaming some of the headers in the results section to include the main conclusion. For instance, "CryoEM structures of IDE in the presence of a sub-saturating concentration of insulin" is not really helpful for the reader to understand the work, while "R668A mediates IDE conformational dynamics in vitro" is.
The headings have been altered in an effort to be more informative.
(4) It is unclear what the timescale for insulin cleavage is for IDE. Clearly, it is possible for the authors to capture an insulin-bound IDE from within the 7 million particles, but what is the chance of this? The authors emphasize the IDE:insulin ratio relative to previous experiments, but surely the kinetics would be the same in the two experiments that were presumably set up exactly the same way. In the context of this, the authors should disclose how concentrations were estimated experimentally. The authors are encouraged to touch upon the subject of time scales to tie up cryo-EM and enzyme experiments with MD simulations.
Both reviewers posted the question about time-scale relevant to IDE catalysis. In response to this request, we have revised the manuscript to address the relevance of key kinetic timescales. Specifically, we now discuss the open/closed transition (~0.1 second) and insulin cleavage (~2/sec), both established experimentally in prior studies (McCord et al PNAS 2013).
IDE concentrations were determined by spectrometry (Nanodrop and/or Bradford assay), and its purity was confirmed to be greater than 90% by SDS-PAGE. Insulin was purchased commercially, weighed, and dissolved in buffer, with its concentration subsequently verified using Nanodrop. Catalytically inactive IDE and insulin were mixed and incubated for at least 30 minutes. Given IDE’s low nanomolar affinity for insulin, and the sub-stoichiometric insulin concentrations used, sufficient time was allowed for insulin to bind IDE and remain bound.
To distinguish between IDE’s unfoldase and protease activities, all structural analyses were performed in the presence of EDTA, which chelates catalytic zinc, thereby inactivating IDE. This approach inhibits the enzyme’s catalytic cycle and allows us to capture the fully unfolded state of insulin bound to IDE in its closed conformation, representing the endpoint of the reaction. Under these conditions, the only meaningful kinetic parameter available for investigation was the unfolding of insulin by IDE.
To elaborate the interaction between IDE and insulin in the catalytically relevant time regime, we investigated IDE–insulin interactions within the millisecond time regime by rapidly mixing IDE with a large molar excess of insulin for approximately 120 milliseconds for the cryo-EM single particle analysis. Under these conditions, we observed that both IDE subunits in the dimer predominantly adopt open states, which are distinct from those previously reported. This observation suggests a potential mechanism of allostery in IDE function.
(5) It should be included in the main text that the data was processed with C1 symmetry and not just in Table 1. This is more useful information for understanding the study than the number of micrographs.
We have stated that the data was processed with C1 symmetry at the start of the results section.
(6) The authors should consider adding speculation on what the approximately 6 million particles that did not yield a high-resolution structure represent.
In cryo-EM single particle analysis, particle selection is typically performed automatically using software such as Relion. Due to the low signal-to-noise ratio, many “junk particles”—originating from contaminants such as ice, impurities, aggregates, or incomplete particles—are inevitably included along with the particles of interest. It is standard practice to filter out these junk particles during data processing. In our case, we estimate that the majority of the 6 million particles are likely junk. However, we cannot fully exclude the possibility that some of these particles may originate from IDE and carry potentially useful information about its conformational heterogeneity. Nonetheless, current cryo-EM single particle analysis methods face significant challenges in objectively recovering and interpreting such particles.
Reviewer #2 (Recommendations for the authors):
I have some minor comments regarding the manuscript which are given below.
(1) For O/O state, it will be great to see an explanation regarding why the values are dissimilar for 0.5 and 0.143 FSC.
All of our IDE structures (including previously published data) demonstrate a dip/plateau at moderate resolution in their FSCs. We interpret this an indicator of structural heterogeneity, as the dip/plateau is smallest in the pC/pC state, becomes larger when one of the subunits is open, and is largest when both subunits are open. Because both subunits within the O/O state are highly heterogeneous, the FSC dipped below the 0.5 threshold. Other states, such as the O/pO, display the same FSC trend, the dip remains slightly above the 0.5 threshold.
(2) O/pO state is moderately resolved at 4.1 Å, but this state is populated with many particles (328,870). Can the resolution be improved by more extensive sorting of heterogenous particles which intrinsically causes misalignment amongst particles?
Unfortunately, no. As shown by the local resolution maps in Figure 1-figure supplement 1, the primary source of misalignment is the IDE-N region in the open subunit. We have found that IDE-N is nearly unconstrained in its conformational flexibility in the open state, and does not appear to adopt discrete states, our attempts to better classify particles have failed. We speculate that this may be a failing in kmeans cluster based classification, and this is part of the driving force behind our exploration of advanced methods of heterogeneity analysis.
(3) Given the observation that capturing a substrate-bound open state is difficult, it can be assumed that the substrate capture in the catalytic cleft is a fast event. Please comment on the possible time frame of unfolding of substrate and catalysis. Can authors comment on any cryo-EM experiments that can deal with such a short time frame? If there is a possibility to include data from such experiments, then it may be considered.
This has been addressed in conjunction with the previous reviewer’s comment (see above). Specifically, we now discuss the open/closed transition (~0.1 second) and insulin cleavage (~2/sec), both established experimentally in prior studies. Additionally, we investigated IDE–insulin interactions by rapidly mixing IDE with a large molar excess of insulin for approximately 120 milliseconds for the cryo-EM single particle analysis. Under these conditions, we observed that both IDE subunits in the dimer predominantly adopt open states, which are distinct from those previously reported. This observation suggests a potential mechanism of allostery in IDE function.
(4) How long was incubation time after adding any substrates, such as insulin? Can different incubation times be tested to generate additional information regarding other conformational states that lie in between open and closed states?
The incubation time for IDE with insulin prior to cryo-EM grid freezing was approximately 30 minutes. We agree that it would be exciting to explore shorter time frames to identify new conformational states. As discussed above, we have rapidly mixed IDE with a large molar excess of insulin for approximately 120 milliseconds for the cryo-EM single particle analysis. Under these conditions, we observed that both IDE subunits in the dimer predominantly adopt open states, which are distinct from those previously reported. This observation suggests a potential mechanism of allostery in IDE function.
(5) A complex network of hydrogen bonding interaction initiated by R668 latching onto N-domain is mentioned in MD simulation studies but it is not clear why cryo-EM experiments did not capture such stabilized structures.
We believe that two main factors have prevented us from observing the hydrogen bonding network in our cryo-EM structures. The first factor is the requirement to freeze the sample in liquid ethane. According to the second law of thermodynamics, lowering the temperature reduces the effect of entropy. Our findings suggest that residue R668 interacts with several neighboring residues through a network of polar and electrostatic interactions, rather than being limited to a single partner. These interactions facilitate both the open-closed transitions and rotational movements between IDE-N and IDE-C. From a thermodynamic perspective, these interactions have both enthalpic and entropic components, and cooling the sample diminishes the entropic contribution. In line with this, we observe that the closed-state domains in our cryo-EM studies are positioned closer together than in our MD simulations, though not as tightly as in crystal structures of IDE. This implies that cryogenic data collection may constrain the interface between IDE-N and IDE-C, which can further alter the equilibrium for the network of R668 mediated interactions.
Secondly, our cryo-EM structures represent ensemble averages of tens to hundreds of thousands of particles. MD simulations indicate that IDE-N and IDE-C can rotate relative to one another, resulting in considerable variability in residue interactions. However, the level of particle density in our cryo-EM data does not permit sufficiently fine classification to resolve these differences. As a result, distinct hydrogen bonding networks are likely averaged out in the ensemble structure, particularly in the case of R668, which is indicated to interact with multiple neighboring residues in the conformation-dependent manner. This averaging effect may also contribute to our inability to achieve resolutions below 3 Å.
(6) Despite the observation that IDE is an intrinsically flexible protein, it seems probable that differently-sized substrates might reveal additional interaction networks formed by other novel key players apart from just R668. Will it be helpful to first try this computationally using MD simulations and then try to replicate this in cryo-EM experiments? If needed, additional simulation time may be added to the MD analysis. Please comment!
We agree that this is an exciting avenue to explore. Doubly so when considered in light of our R668A enzymatic results with amyloid beta. However, several challenges must be overcome before we can explore this direction effectively:
(1) We lack experimental knowledge of the initial interaction event between IDE and substrate. All substrate-bound IDE structures have been obtained after unfolding and positioning for cleavage has occurred. Without a solid foundational model for the initial interaction event between IDE and substrate, the interpretation of subsequent MD simulations is open to question.
(2) We have previously observed minimal effect of substrate on IDE in all-atom MD simulations. We believe that observable effects would require a much longer time scale than is currently achievable with all-atom MD, so have turned to Upside, a coarse-grained method to overcome these limitations, but Upside handles side chains with presumptive modeling, which prevent the identification of potential novel residue interactions.
(3) Due to the conformational heterogeneity present within IDE cryo-EM datasets, we struggle to obtain sufficient resolution to clearly identify side chain interactions at the domain interface (see response to 5).
Given these challenges, we plan to explore these directions in future manuscripts.
(7) What is the possibility of water interaction networks and dynamism in this network to contribute to the overall dynamics of the protein in the presence and absence of substrates? How symmetric these networks be in the four domains of dimeric IDE?
This is an interesting idea that we have begun to explore, but consider to be outside the scope of this work. Currently, we do not have any MD simulations containing substrate with explicit solvent (Upside uses implicit solvent), and solvent atoms were removed from our all-atom simulations prior to analysis to speed up processing. That being said, preliminary WAXS data suggests that there may be a difference in water interaction interfaces between WT and R668A IDE, and this is a lead we plan to pursue in future work.
(8) Line 214: Please fix the typo which wrongly describes closed = pO.
This is not a typo, but it is confusing. The pO state has previously been defined as the closed state of IDE lacking bound substrate as determined by cryo-EM. This differentiates the pO state from the pC state, where the pC state contains density indicative of bound substrate. As the MD simulations were conducted with the apo-state, the closed state the simulations were initialized from was the pO state structure, which represents the substrate-free closed state as determined by cryo-EM. We realize that this difference is probably unnecessary to the majority of readers, and have removed the (pO) specificity to avoid confusion.
(9) It is not clear why a cryo-EM structure was not attempted for the R668A mutant. If the authors have tried to generate such a structure, it should be mentioned in the manuscript. Such a structure should yield more information when compared to SAXS experiments.
We have not attempted to obtain a cryo-EM structure for the R668A mutant. Our SAXS analysis suggests a transition from a dominant O/pO state to a dominant O/O state. The O/O state is known to exhibit the highest degree of conformational heterogeneity, which severely limits structural insights. We are working to better handle the sample preparation of IDE and perform such analysis without the need to use Fab. We plan to further characterize IDE R668A biochemically and potentially explore other mutations that would provide insights in how IDE works. Armed with that, we will perform the structural analysis of such IDE mutant(s).
-
-
www.biorxiv.org www.biorxiv.org
-
Author response:
The following is the authors’ response to the original reviews.
Reviewer #1 (Public Review):
Summary:
The study conducted by the Schuldiner's group advances the understanding of mitochondrial biology through the utilization of their bi-genomic (BiG) split-GFP assay, which they had previously developed and reported. This research endeavors to consolidate the catalog of matrix and inner membrane mitochondrial proteins. In their approach, a genetic framework was employed wherein a GFP fragment (GFP1-10) is encoded within the mitochondrial genome. Subsequently, a collection of strains was created, with each strain expressing a distinct protein tagged with the GFP11 fragment. The reconstitution of GFP fluorescence occurs upon the import of the protein under examination into the mitochondria.
We are grateful for the positive evaluation. We would like to clarify that the bi-genomic (BiG) split-GFP assay was developed by the labs of H. Becker and Roza Kucharzyk by highly laborious construction of the strain with mtDNA-encoded GFP<sub>1-10</sub> (Bader et al, 2020).
Strengths:
Notably, this assay was executed under six distinct conditions, facilitating the visualization of approximately 400 mitochondrial proteins. Remarkably, 50 proteins were conclusively assigned to mitochondria for the first time through this methodology. The strains developed and the extensive dataset generated in this study serve as a valuable resource for the comprehensive study of mitochondrial biology. Specifically, it provides a list of 50 "eclipsed" proteins whose role in mitochondria remains to be characterized.
Weaknesses:
The work could include some functional studies of at least one of the newly identified 50 proteins.
In response to this we have expanded the characterization of phenotypic effects resulting from changing the targeting signal and expression levels of the dually localized Gpp1 protein and expanded the data in Fig. 3, panels H and I.
Reviewer #2 (Public Review):
The authors addressed the question of how mitochondrial proteins that are dually localized or only to a minor fraction localized to mitochondria can be visualized on the whole genome scale. For this, they used an established and previously published method called BiG split-GFP, in which GFP strands 1-10 are encoded in the mitochondrial DNA and fused the GFP11 strand C-terminally to the yeast ORFs using the C-SWAT library. The generated library was imaged under different growth and stress conditions and yielded positive mitochondrial localization for approximately 400 proteins. The strength of this method is the detection of proteins that are dually localized with only a minor fraction within mitochondria, which so far has hampered their visualization due to strong fluorescent signals from other cellular localizations. The weakness of this method is that due to the localization of the GFP1-10 in the mitochondrial matrix, only matrix proteins and IM proteins with their C-termini facing the matrix can be detected. Also, proteins that are assembled into multimeric complexes (which will be the case for probably a high number of matrix and inner membrane-localized proteins) resulting in the C-terminal GFP11 being buried are likely not detected as positive hits in this approach. Taking these limitations into consideration, the authors provide a new library that can help in the identification of eclipsed protein distribution within mitochondria, thus further increasing our knowledge of the complete mitochondrial proteome. The approach of global tagging of the yeast genome is the logical consequence after the successful establishment of the BiG split-GFP for mitochondria. The authors also propose that their approach can be applied to investigate the topology of inner membrane proteins, however, for this, the inherent issue remains that it cannot be excluded that even the small GFP11 tag can impact on protein biogenesis and topology. Thus, the approach will not overcome the need to assess protein topology analysis via biochemical approaches on endogenous untagged proteins.
Reviewer #3 (Public Review):
Summary:
Here, Bykov et al move the bi-genomic split-GFP system they previously established to the genomewide level in order to obtain a more comprehensive list of mitochondrial matrix and inner membrane proteins. In this very elegant split-GFP system, the longer GFP fragment, GFP1-10, is encoded in the mitochondrial genome and the shorter one, GFP11, is C-terminally attached to every protein encoded in the genome of yeast Saccharomyces cerevisiae. GFP fluorescence can therefore only be reconstituted if the C-terminus of the protein is present in the mitochondrial matrix, either as part of a soluble protein, a peripheral membrane protein, or an integral inner membrane protein. The system, combined with high-throughput fluorescence microscopy of yeast cells grown under six different conditions, enabled the authors to visualize ca. 400 mitochondrial proteins, 50 of which were not visualised before and 8 of which were not shown to be mitochondrial before. The system appears to be particularly well suited for analysis of dually localized proteins and could potentially be used to study sorting pathways of mitochondrial inner membrane proteins.
Strengths:
Many fluorescence-based genome-wide screens were previously performed in yeast and were central to revealing the subcellular location of a large fraction of yeast proteome. Nonetheless, these screens also showed that tagging with full-length fluorescent proteins (FP) can affect both the function and targeting of proteins. The strength of the system used in the current manuscript is that the shorter tag is beneficial for the detection of a number of proteins whose targeting and/or function is affected by tagging with full-length FPs.
Furthermore, the system used here can nicely detect mitochondrial pools of dually localized proteins. It is especially useful when these pools are minor and their signals are therefore easily masked by the strong signals coming from the major, nonmitochondrial pools of the proteins.
Weaknesses:
My only concern is that the biological significance of the screen performed appears limited. The dataset obtained is largely in agreement with several previous proteomic screens but it is, unfortunately, not more comprehensive than them, rather the opposite. For proteins that were identified inside mitochondria for the first time here or were identified in an unexpected location within the organelle, it remains unclear whether these localizations represent some minor, missorted pools of proteins or are indeed functionally important fractions and/or productive translocation intermediates. The authors also allude to several potential applications of the system but do little to explore any of these directions.
We agree with the reviewer that a single method may not be used for the construction of the complete protein inventory of an organelle or its sub-compartment. We suggest that the value of our assay is in providing a complementary view to the existing data and approaches. For example, we confirm the matrix localization of several proteins that were only found in the two proteomic data and never verified before (Vögtle et al, 2017; Morgenstern et al, 2017). Given that proteomics is a very sensitive technique and false positives are hard to completely exclude, our complementary verification is valuable.
Reviewer #1 (Recommendations for the authors):
In my opinion, the manuscript can be published as it is, and I would expect that future work will advance the functional properties of the newly found mitochondrial proteins.
We thank the reviewer for their positive evaluation
Reviewer #2 (Recommendations for the authors)
(1) Due to the localization of the GFP1-10 in the matrix, only matrix and IM proteins with C-termini facing the matrix can be detected, this should be added e.g. in the heading of the first results part and discussed earlier in the manuscript. In addition, the limitation that assembly into protein complexes will likely preclude detection of matrix and IM proteins needs to be discussed.
To address the first point, we edited the title of the first section to only mention the visualization of the matrix-facing proteome and remove the words “inner membrane”. We also clarified early in the Results section that we only consider the matrix-facing C-termini by extending the sentence early in the results section “To compare our findings with published data, we created a unified list of 395 proteins that are observed with high confidence using our assay indicating that their C-terminus is positioned in the matrix (Fig. 2 – figure supplement 1B-D, Table S1).” (P. 6 Lines 1-3). Concluding the comparison with the earlier proteomic studies we also added the sentence “Many proteins are missing because their C-termini are facing the IMS” (P.8 Line 2).
To address the second point concerning the possible interference of the complex assembly and protein detection by our assay, we conducted an additional analysis. The analysis takes advantage of the protein complexes with known structures where we could estimate if the C-terminus with the GFP<sub>11</sub> tag would be available for GFP1-10 binding. We added the additional figure (Figure 3 – figure supplement 2) and following text in the Results section (P.7 Lines 22-34):
“To examine the influence of protein complex assembly on the performance of the BiG Mito-Split assay we analyzed the published structures of the mitoribosome and ATP synthase (Desai et al, 2017; Srivastava et al, 2018; Guo et al, 2017) and classified all proteins as either having C-termini in, or out of, the complex. There was no difference between the “in” and “out” groups in the percentage observed in the BiG Mito-Split collection (Fig. 3 – figure supplement 2A) suggesting that the majority of the GFP11tagged proteins have a chance to interact with GFP1-10 before (or instead of) assembling into the complex. PCR and western blot verification of eight strains with the tagged complex subunits for which we observed no signal showed that mitoribosomal proteins were incorrectly tagged or not expressed, and the ATP synthase subunits Atp7, Atp19, and Atp20 were expressed (Fig. 3 – Supplement 2B). Atp19 and Atp20 have their C-termini most likely oriented towards the IMS (Guo et al, 2017) while Atp7 is completely in the matrix and may be the one example of a subunit whose assembly into a complex prevents its detection by the BiG Mito-Split assay.”
We also consider related points on the interference of the tag and the influence of protein essentiality in the replies to points 3) and 12) of these reviews.
(2) The imaging data is of high quality, but the manuscript would greatly benefit from additional analysis to support the claims or hypothesis brought forward by the authors. The idea that the nonmitochondrial proteins are imported due to their high sequence similarity to MTS could be easily addressed at least for some of these proteins via import studies, as also suggested by the authors.
The idea that non-mitochondrial proteins may be imported into mitochondria due to occasional sequence similarity was recently demonstrated experimentally by (Oborská-Oplová et al, 2025). We incorporate this information in the Discussion section as follows (P. 14 Lines 10-16):
“It was also recently shown that the r-protein uS5 (encoded by RPS2 in yeast) has a latent MTS that is masked by a special mitochondrial avoidance segment (MAS) preceding it (Oborská-Oplová et al, 2025). The removal of the MAS leads to import of uS5 into mitochondria killing the cells. The case of uS5 is an example of occasional similarity between an r-protein and an MTS caused by similar requirements of positive charges for rRNA binding and mitochondrial import. It remains unclear if other r-proteins have a MAS and if there are other mechanisms that protect mitochondria from translocation of cytosolic proteins.”
We also conducted additional analysis to substantiate the claim that ribosomal (r)-proteins are similar in their physico-chemical properties to MTS-containing mitochondrial proteins. For this we chose not to use prediction algorithms like TartgetP and MitoFates that were already trained on the same dataset of yeast proteins to discriminate cytosolic and mitochondrial localization. Instead, we extended the analysis earlier made by (Woellhaf et al, 2014) and calculated several different properties such as charge, hydrophobicity, hydrophobic moment and amino acid content for mitochondrial MTS-containing proteins, cytosolic non-ribosomal proteins, and r-proteins. The analysis showed striking similarity of r-proteins and mitochondrial proteins. We incorporate a new Figure 3 – figure supplement 3 and the following text in the Results section (P. 8 Lines14-22):
“Five out of eight proteins are components of the cytosolic ribosome (r-proteins). In agreement with previous reports (Woellhaf et al, 2014) we find that their unique properties, such as charge, hydrophobicity and amino acid content, are indeed more similar to mitochondrial proteins than to cytosolic ones (Fig. 3 – figure supplement 3). Additional experiments with heterologous protein expression and in vitro import will be required to confirm the mitochondrial import and targeting mechanisms of these eight non-mitochondrial proteins. The data highlights that out of hundreds of very abundant proteins with high prediction scores only few are actually imported and highlights the importance of the mechanisms that help to avoid translocation of wrong proteins (Oborská-Oplová et al, 2025).”
To further prove the possibility of r-protein import into mitochondria we aimed to clone the r-proteins identified in this work for cell-free expression and import into purified mitochondria. Despite the large effort, we have succeeded in cloning and efficiently expressing only Rpl23a (Author response image 1 A). Rpl23a indeed forms proteinase-protected fractions in a membrane potential-dependent manner when incubated with mitochondria. The inverse import dynamics of Rpl23a could be either indicative of quick degradation inside mitochondria or of background signal during the import experiments (Author response image 1.A). To address the r-protein degradation possibility, we measured how does GFP signal change in the BiG Mito-Split diploid collection strains after blocking cytosolic translation with cycloheximide (CHX). For this we selected Mrpl12a, that had one of the highest signals. We did not detect any drop in fluorescence signal for Rpl12a and the control protein Mrpl6 (Author response image 1 B). This might indicate the lack of degradation, or the degradation of the whole protein except GFP<sub>11</sub> that remains connected to GFP<sub>1-10</sub>. Due to time constrains we could not perform all experiments for the whole set of potentially imported r-proteins. Since more experiments are required to clearly show the mechanisms of mitochondrial r-protein import, degradation, and toxicity, or possible moonlighting functions (such as import into mitochondria derived from pim1∆ strain, degradation assays, fractionations, and analyses with antibodies for native proteins) we decided not to include this new data into the manuscript itself.
Author response image 1.
The import of r-proteins into mitochondria and their stability. (A) Rpl23 was synthesized in vitro (Input), radiolabeled, and imported into mitochondria isolated from BY4741 strain as described before (Peleh et al, 2015); the import was performed for 5,10, or 15 minutes and mitochondria were treated with proteinase K (PK) to degrade nonimported proteins; some reactions were treated with the mix of valinomycin, antimycin, and oligomycin (VAO) to dissipate mitochondrial membrane potential; the proteins were visualized by SDS-PAGE and autoradiography (B) The strains from the diploid BiG Mito-Split collection were grown in YPD to mid-logarithmic growth phase, then CHX was added to block translation and cell aliquots were taken from the culture and analyzed by fluorescence microscopy at the indicated time points. Scale bar is 5 µm.
(3) The claim that the approach can be used to assess the topology of inner membrane proteins is problematic as the C-terminal tag can alter the biogenesis pathway of the protein or impact on the translocation dynamics (in particular as the imaging method applied here does not allow for analysis of dynamics). The hypothesis that the biogenesis route can be monitored is therefore far-reaching. To strengthen the hypothesis the authors should assess if the C-terminal GFP11 influences protein solubility by assessing protein aggregation of e.g. Rip1.
We agree with the reviewer that the tag and assembly of GFP<sub>1-10/11</sub> can further complicate the assessment of topology of the IM proteins that already have complex biogenesis routes (lateral transfer, conservative, and a Rip1-specific Bcs1 pathway). To emphasize that the assessment of the steady state topology needs to be backed up by additional biochemical approaches, we edited the beginning of the corresponding Results sections as follows (P. 11 Lines 2-6):
“Studying membrane protein biogenesis requires an accurate way to determine topology in vivo. The mitochondrial IM is one of the most protein-rich membranes in the cell supporting a wide variety of TMD topologies with complex biogenesis pathways. We aimed to find out if our BiG Mito-Split collection can accurately visualize the steady-state localization of membrane protein C-termini protruding into the matrix or trap protein transport intermediates” (inserted text is underlined).
The collection that we studied by microscopy is diploid and contains one WT copy of each 3xGFP<sub>11</sub>tagged gene. To assess the influence of the tag on the protein function we performed growth assays with haploid strains which have one 3xGFP<sub>11</sub>-tagged gene copy and no GFP<sub>1-10</sub>. We find that Rip13xGFP<sub>11</sub> displays slower growth on glycerol at 30˚C and even slower at 37˚C while tagged Qcr8, Qcr9, and Qcr10 grow normally (Author response image 2 A). Based on the growth assays and microscopy it is not possible to conclude whether the “Qcr” proteins’ biogenesis is affected by the tag. It may be that laterally sorted proteins are functional with the tag and constitute the majority while only a small portion is translocated into the matrix, trapped and visualized with GFP<sub>1-10</sub>. In case of Rip1 it was shown that C-terminal tag can affect its interaction with the chaperone Mzm1 and promote Rip1 aggregation (Cui et al, 2012). The extent of Rip1 function disruption can be different and depends on the tag. We hypothesize that our split-assay may trap the pre-translocation intermediate of Rip1 and can be helpful to study its interactors. To test this, we performed anti-GFP immune-precipitation (IP) using GFP-Trap beads (Author response image 2 B).
Author response image 2.
The influence of 3x-GFP11 on the function and processing of the inner membrane proteins. (A) Drop dilution assays with haploid strains from C-SWAT 3xGFP<Sub>11</sub> library on fermentative (YPD) and respiratory (YPGlycerol) media at different temperatures. (B) Immuno-precipitation with GFP-Trap agarose was performed on haploid strain that has only Rip1-3xGFP<sub>11</sub> and on the diploid strain derived from this haploid mated with BiG Mito-Split strain containing mtGFP<sub>1-10</sub> and WT untagged Rip1 using the lysis (1% TX-100) and washing protocols provided by the manufacturer; the total (T) and eluted with the Laemmli buffer (IP) samples were analyzed by immunoblotting with polyclonal rabbit antibodies against GFP (only visualizes GFP<Sub>11</sub> in these samples) and Rip1 (visualizes both tagged and WT Rip1). Polyclonal home-made rabbit antisera for GFP and Rip1 were kindly provided by Johannes Herrmann (Kaiserslautern) and Thomas Becker (Bonn); the antisera were diluted 1:500 for decorating the membranes.
We find that the haploid strain with Rip1-3xGFP<sub>11</sub> contains not only mature (m) and intermediate (i) forms but also an additional higher Mw band that we interpreted as precursor that was not cleaved by MPP. WT Rip1 in the diploid added two more lower Mw bands: (m) and (i) forms of the untagged Rip1. IP successfully enriched GFP<sub>1-10</sub> fragment as visualized by anti-GFP staining. Interestingly only the highest Mw Rip1-3xGFP<sub>11</sub> band was also enriched when anti-Rip1 antibodies were used to analyze the samples. This suggests that Rip1 precursor gets completely imported and interacts with GFP<sub>1-10</sub> and can be pulled down. It is however not processed. Processed Rip1 is not interacting with GFP<sub>1-10</sub>. Based on the literature we expect all Rip1 in the matrix to be cleaved by MPP including the one interacting with GFP. Due to this discrepancy, we did not include this data in the manuscript. This is however clear that the assay may be useful to analyze biogenesis intermediates of the IM and matrix proteins. To emphasize this, we added information on the C-terminal tagging of Rip1 in the Results section (P. 11 Lines 18-20):
“It was shown that a C-terminal tag on Rip1 can prevent its interaction with the chaperone Mzm1 and promote aggregation in the matrix (Cui et al, 2012). It is also possible that our assay visualizes this trapped biogenesis intermediate.”
We also added a note on biogenesis intermediates in the Discussion (P. 14 Line 36 onwards):
“It is possible that the proteins with C-termini that are translocated into the IMS from the matrix side can be trapped by the interaction with GFP<sub>1-10</sub>. In that case, our assay can be a useful tool to study these pre-translocation intermediates.”
(4) The hypothesis that the method can reveal new substrates for Bcs1 is interesting, and it would strongly increase the relevance for the scientific community if this would be directly tested, e.g. by deleting BCS1 and testing if more IM proteins are then detected by interaction with the matrix GFP110.
we attempted to move the BiG Mito-Split assay into haploid strains where BCS1 and other factors can be deleted, however, this was not successful. Since this was a big effort (We cloned 10 potential substrate proteins but none of them were expressed) we decided not to pursue this further.
(5) The screening of six different growth conditions reflects the strength of the high-throughput imaging readout. However, the interpretation of the data and additional follow-up on this is rather short and would be a nice addition to the present manuscript. In addition, one wonders, what was the rationale behind these six conditions (e.g. DTT treatment)? The direct metabolic shift from fermentation to respiration to boost mitochondrial biogenesis would be a highly interesting condition and the authors should consider adding this in the present manuscript.
we agree with the reviewer that the analysis of different conditions is a strength of this work. However, we did not reveal any clear protein groups with strong conditional import and thus it was hard to select a follow-up candidate. The selection of conditions was partially driven by the technical possibilities: the media change is challenging on the robotic system; heat shock conditions make microscope autofocus unstable; library strain growth on synthetic respiratory media is very slow and the media cannot be substituted with rich media due to its autofluorescence. However, the usage of the spinning disc confocal microscope allowed us to screen directly in synthetic oleate media which has a lot of background on widefield systems due to oil micelles. We extended the explanation of condition choice as follows (P. 4 Line 34 onwards):
“The diploid BiG Mito-Split collection was imaged in six conditions representing various carbon sources and a diversity of stressors the cells can adapt to: logarithmic growth on glucose as a control carbon source and oleic acid as a poorly studied carbon source; post-diauxic (stationary) phase after growth on glucose where mitochondria, are more active and inorganic phosphate (Pi) depletion that was recently described to enhance mitochondrial membrane potential (Ouyang et al, 2024); as stress conditions we chose growth on glucose in the presence of 1 mM dithiothreitol (DTT) that might interfere with the disulfide relay system in the IMS, and nitrogen starvation as a condition that may boost biosynthetic functions of mitochondria. DTT and nitrogen starvation were earlier used for a screen with the regular C’-GFP collection (Breker et al, 2013). Another important consideration for selecting the conditions was the technical feasibility to implement them on automated screening setups.”
Reviewer #3 (Recommendations for the authors )
(6) This is a very elegant and clearly written study. As mentioned above, my only concern is that the biological significance of the obtained data, at this stage, is rather limited. It would have been nice if the authors explored one of the potential applications of the system they propose. For example, it should be relatively easy to analyze whether Cox26, Qcr8, Qcr9, or Qcr10 are new substrates of Bsc1, as the authors speculate.
we thank the reviewer for their positive feedback. We addressed the biological application of the screen by including new data on metabolite concentrations in the strains where Gpp1 N-terminus was mutated leading to loss of the mitochondrial form. We added panels H and I to Figure 4, the new Supplementary Table S2 and appended the description of these results at the end of the third Results subsection (P. 10 Lines 19-35). Our data now show a role for the mitochondrial fraction of Gpp1 which adds mechanistic insight into this dually localized protein.
We also were interested in the applications of our system to the study of mitochondrial import. However, the study of Cox26, Qcr8, Qcr9, and Qcr10 was not successful (also related to point 4, Reviewer #2). We thus decided to investigate the import mechanisms of the poorly studied dually localized proteins Arc1, Fol3, and Hom6 (related to Figure 4 of the original manuscript). To this end, we expressed these proteins in vitro, radiolabeled, and performed import assays with purified mitochondria. Arc1 was not imported, Fol3 and Hom6 gave inconclusive results (Author response image 3). Since it is known that even some genuine fully or dually localized mitochondrial proteins such as Fum1 cannot be imported in vitro post-translationally (Knox et al, 1998), we cannot draw conclusions from these experiments and left them out of the revised manuscript. Additional investigation is required to clarify if there exist special cytosolic mechanisms for the import of these proteins that were not reconstituted in vitro such as co-translational import.
Author response image 3.
In vitro import of poorly studies dually localized proteins. Arc1, Fol3, and Hom6 were cloned into pGEM4 plasmid, synthesized in vitro (Input), radiolabeled, and imported into mitochondria isolated from BY4741 strain as described before (Peleh et al, 2015); the import was performed for 5,10, or 15 minutes and mitochondria were treated with proteinase K (PK) to degrade non-imported proteins; some reactions were treated with the mix of valinomycin, antimycin, and oligomycin (VAO) to dissipate mitochondrial membrane potential. The proteins were separated by SDS-PAGE and visualized by autoradiography.
Minor comments:
(7) It is unclear why the authors used the six growth conditions they used, and why for example a nonfermentable medium was not included at all.
we address this shortcoming in the reply to the previous point 5 (Reviewer #2).
(8) Page 2, line 17 - "Its" should be corrected to "its".
Changed
(9) Page 2, line 25 to the end of the paragraph - the authors refer to the TIM complex when actually the TIM23 complex is probably meant. Also, it would be clearer if the TIM22 complex was introduced as well, especially in the context of the sentence stating that "the IM is a major protein delivery destination in mitochondria".
This was corrected.
(10) Page 5, line 35 - "who´s" should be corrected to "whose".
This was corrected.
(11) Page 9, line 5 - "," after Gpp1 should probably be "and".
This was corrected.
(12) Page 11 - the authors discuss in several places the possible effects of tags and how they may interfere with "expression, stability and targeting of proteins". Protein function may also be dramatically affected by tags - a quick look into the dataset shows that several mitochondrial matrix and inner membrane proteins that are essential for cell viability were not identified in the screen, likely because their function is impaired.
we agree with the reviewer that the influence of tags needs to be carefully evaluated. This is not always possible in the context of whole genomic screens. Sometimes, yeast collections (and proteomic datasets) can miss well-known mitochondrial residents without a clear reason. To address this important point we conducted an additional analysis to look specifically at the essential proteins. We indeed found that several of the mitochondrial proteins that are essential for viability were absent from the collection at the start, but for those present, their essentiality did not impact the likelihood to be detected in our assay. To describe the analysis we added the following text and a Fig. 3 – figure supplement 2. Results now read (P.7 Lines 8-21):
“Next, we checked the two categories of proteins likely to give biased results in high-throughput screens of tagged collections: proteins essential for viability, and molecular complex subunits. To look at the first category we split the proteomic dataset of soluble matrix proteins (Vögtle et al. 2017) into essential and non-essential ones according to the annotations in the Saccharomyces Genome Database (SGD) (Wong et al, 2023). We found that there was no significant difference in the proportion of detected proteins in both groups (17 and 20 % accordingly), despite essential proteins being less represented in the initial library (Fig. 3 – figure supplement 2A). From the three essential proteins of the (Vögtle et al. 2017) dataset for which the strains present in our library but showed no signal, two were nucleoporins Nup57 and Nup116, and one was a genuine mitochondrial protein Ssc1. Polymerase chain reaction (PCR) and western blot verification showed that the Ssc1 strain was incorrect (Fig. 3 – figure supplement 2B). We conclude that essential proteins are more likely to be absent or improperly tagged in the original C’-SWAT collection, but the essentiality does not affect the results of the BiG Mito-Split assay.”
Discussion (P. 13 Lines 23-26):
“We did not find that protein complex components or essential proteins are more likely to be falsenegatives. However, some essential proteins were absent from the collection to start with (Fig. 3 – figure supplement 2A). Thus, a small tag allows visualization of even complex proteins.”
From our data it is difficult to estimate the effect of tagging on protein function. We also addressed the effect of tagging Rip1 as well as performed growth assays on the tagged small “Qcr proteins” in the reply to point 3 (Reviewer #2). It is also difficult to estimate the effect of GFP<sub>1-10</sub> and <sub>11</sub> complex assembly on protein function since the presence of functional, unassembled GFP<sub>11</sub> tagged pool cannot be ruled out in our assay.
Other changes
Figure and table numbers changed after new data additions.
A sentence added in the abstract to highlight the additional experiments on Gpp1 function: “We use structure-function analysis to characterize the dually localized protein Gpp1, revealing an upstream start codon that generates a mitochondrial targeting signal and explore its unique function.”
The reference to the PCR verification (Fig. 3 – Supplement 2B) of correct tagging of Ycr102c was added to the Results section (P.8 Line 6), western blot verification added on.
Added the Key Resources Table at the beginning of the Methods section.
Small grammar edits, see tracked changes.
References:
Bader G, Enkler L, Araiso Y, Hemmerle M, Binko K, Baranowska E, De Craene J-O, Ruer-Laventie J, Pieters J, Tribouillard-Tanvier D, et al (2020) Assigning mitochondrial localization of dual localized proteins using a yeast Bi-Genomic Mitochondrial-Split-GFP. eLife 9: e56649
Cui T-Z, Smith PM, Fox JL, Khalimonchuk O & Winge DR (2012) Late-Stage Maturation of the Rieske Fe/S Protein: Mzm1 Stabilizes Rip1 but Does Not Facilitate Its Translocation by the AAA ATPase Bcs1. Mol Cell Biol 32: 4400–4409
Desai N, Brown A, Amunts A & Ramakrishnan V (2017) The structure of the yeast mitochondrial ribosome. Science 355: 528–531
Guo H, Bueler SA & Rubinstein JL (2017) Atomic model for the dimeric FO region of mitochondrial ATP synthase. Science 358: 936–940
Knox C, Sass E, Neupert W & Pines O (1998) Import into Mitochondria, Folding and Retrograde Movement of Fumarase in Yeast. J Biol Chem 273: 25587–25593
Morgenstern M, Stiller SB, Lübbert P, Peikert CD, Dannenmaier S, Drepper F, Weill U, Höß P, Feuerstein R, Gebert M, et al (2017) Definition of a High-Confidence Mitochondrial Proteome at Quantitative Scale. Cell Rep 19: 2836–2852
Oborská-Oplová M, Geiger AG, Michel E, Klingauf-Nerurkar P, Dennerlein S, Bykov YS, Amodeo S, Schneider A, Schuldiner M, Rehling P, et al (2025) An avoidance segment resolves a lethal nuclear–mitochondrial targeting conflict during ribosome assembly. Nat Cell Biol 27: 336–346
Peleh V, Ramesh A & Herrmann JM (2015) Import of Proteins into Isolated Yeast Mitochondria. In Membrane Trafficking: Second Edition, Tang BL (ed) pp 37–50. New York, NY: Springer
Srivastava AP, Luo M, Zhou W, Symersky J, Bai D, Chambers MG, Faraldo-Gómez JD, Liao M & Mueller DM (2018) High-resolution cryo-EM analysis of the yeast ATP synthase in a lipid membrane. Science 360: eaas9699
Vögtle F-N, Burkhart JM, Gonczarowska-Jorge H, Kücükköse C, Taskin AA, Kopczynski D, Ahrends R, Mossmann D, Sickmann A, Zahedi RP, et al (2017) Landscape of submitochondrial protein distribution. Nat Commun 8: 290
Woellhaf MW, Hansen KG, Garth C & Herrmann JM (2014) Import of ribosomal proteins into yeast mitochondria. Biochem Cell Biol 92: 489–498
-
-
www.biorxiv.org www.biorxiv.org
-
Author Response:
Reviewer #1 (Public Review):
In this manuscript, the authors challenge the long-standing conclusion that Orco and IR-dependent olfactory receptor neurons are segregated into subtypes such that Orco and IR expression do not overlap. First, the authors generate new knock-in lines to tag the endogenous loci with an expression reporter system, QF/QUAS. They then compare the observed expression of these knock-ins with the widely used system of enhancer transgenes of the same receptors, namely Orco, IR8a, IR25a, and IR76b. Surprisingly, they observe an expansion of the expression of the individual knock-in reporters as compared to the transgenic reporters in more chemosensory neurons targeting more glomeruli per receptor type than previously reported. They verify the expression of the knock-in reporters with antibody staining, in situ hybridization and by mining RNA sequencing data.
Finally, they address the question of physiological relevance of such co-expression of receptor systems by combining optogenetic activation with single sensillum recordings and mutant analysis. Their data suggests that IR25a activation can modulate Orco-dependent signaling and activation of olfactory sensory neurons.
The paper is well written and easy to follow. The data are well presented and very convincing due in part to the combination of complementary methods used to test the same point. Thus, the finding that co-receptors are more broadly and overlappingly expressed than previously thought is very convincing and invites speculation of how this might be relevant for the animal and chemosensory processing in general. In addition, the new method to make knock-ins and the generated knock-ins themselves will be of interest to the fly community.
We thank the reviewer for their enthusiasm and support of our work!
The last part of the manuscript, although perhaps the most interesting, is the least developed compared to the other parts. In particular, the following points could be addressed:
- It would be good to see a few more traces and not just the quantifications. For instance, the trace of ethyl acetate in Fig. 6C, and penthyl acetate for 6G.
Thank you for the suggestion. We have added a new figure supplement (Figure 6-Figure Supplement 3) with additional example traces for all odorants from Figure 6 for which we found a statistically significant difference between the two genotypes (Ir25a versus wildtype).
- In Fig. 4D, the authors show the non-retinal fed control, which is great. An additional genetic control fed with retinal would have been nice.
For these experiments, we followed a standard practice in Drosophila optogenetics to test the same experimental genotype in the presence or absence of the essential cofactor all-trans-retinal. This controls for potential effects from the genetic background. It is possible our description of these experiments was unclear (as also suggested by comments from Reviewer 2). As such, we have clarified our experimental design for the optogenetic experiments in the revised manuscript:
Modified text: “No light-induced responses were found in control flies, which had the same genotype as experimental flies but were not fed all-trans retinal (-ATR), a necessary co-factor for channelrhodopsin function (see Methods).” and “Bottom trace is control animal, which has the same genotype as the experimental animal but was not fed the required all-trans retinal cofactor (-ATR).”
Figure 4-Figure Supplement 1 legend: “In all optogenetic experiments, control animals have the same genotypes as the corresponding experimental animals but have not been fed all-trans retinal.”
Methods: “For all optogenetic experiments, the control flies were of the same genotype as experimental flies but had not been fed all-trans retinal.”
- It appears that mostly IR25a is strongly co-expressed with other co-receptors. The provided experiments suggest a possible modulation between IR25a and Orco-dependent neuronal activity. However, what does this mean? How could this be relevant? And moreover, is this a feature of Drosophila melanogaster after many generations in laboratories?
We share this reviewer’s excitement regarding the numerous questions our work now raises. While testing additional functional ramifications of chemosensory co-receptor expression is beyond the scope of this work (but will undoubtedly be the focus of future studies), we did expand on what this might mean in the revised Discussion section of the revised manuscript. Previously, we had raised the hypothesis that chemoreceptor co-expression could be an evolutionary relic of Ir25a expression in all chemoreceptor neurons , or a biological mechanism to broaden the response profile of an olfactory neuron without sacrificing its ability to respond to specific odors. We now extend our discussion to raise additional possible ramifications. For example, we suggest that modulating Ir25a coexpression could alter the electrical properties of a neuron, making it more (or possibly less) sensitive to Orco-dependent responses. We also suggest that Ir25a coexpression might be an evolutionary mechanism to allow olfactory neurons to adjust their response activities. That is, that most Orco-positive olfactory neurons are already primed to be able to express a functional Ir receptor if one were to be expressed. Such co-expression in some olfactory neurons might present an evolutionary advantage by ensuring olfactory responses to a complex but crucial biologically relevant odor, like human odors to some mosquitoes.
Reviewer #2 (Public Review):
In the present study, the authors: 1) generated knock-in lines for Orco, Ir8a, Ir25a, and IR7ba, and examined their expression, with a main focus on the adult olfactory organs. 2) confirmed the expression of these receptors using antibody staining. 3) examined the innervation patterns of these knock-in lines in the nervous system. 4) identified a glomerulus, VM6, that is divided into three subdivisions. 5) examined olfactory responses of neurons co-expressing Orco and Ir25a
The results of the first four sets of experiments are well presented and support the conclusions, but the results of the last set of experiments (the electrophysiology part) need some details. Please find my detailed comments below.
We thank the reviewer for their support of our work and appreciating the importance of our findings. In the revised manuscript, we now provide the additional experimental details for the electrophysiology work as requested.
Major points
Line 167-171: I wonder if the authors also compared the Orco-T2A-QF2 knock-in with antibody staining of the antenna.
We did perform whole-mount anti-Orco antibody staining on Orco-T2A-QF2 > GFP antennae (example image below). We saw broad overlap between Orco+ and GFP+ cells, similar to the palps. However, we did not include these results since quantification of these tissues is challenging for the following reasons:
- There are ~1,200 olfactory neurons in each antenna, many of which are Orco+.
- The thickness of the tissue makes determinations of co-localization difficult in wholemount staining.
- Co-localization is further complicated by the sub-cellular localization of the signals: Orco antibodies preferentially label dendrites and weakly label cell bodies, while our GFP reporter is cytoplasmic and preferentially labels cell bodies. For these reasons, we focused on the numerically simpler palps for quantification. For the Ir8aT2A-QF2 and Ir76b-T2A-QF2 lines, palp quantification was not an option as neither knock-in drove expression in the palps (and the available antibodies did not work with the whole-mount staining protocol). This is why we performed antennal cryosections to validate these lines. Below is an example image of the antennal whole-mount staining in the Orco-T2A-QF2 knock-in line, illustrating the quantification challenges enumerated above.
*Co-staining of anti-Orco and GFP in Orco-T2A-QF2 > 10xQUAS-6xGFP antenna *
Lines 316-319 (Figure 4D): It would be better if the authors compare the responses of Ir25a>CsChrimson to those of Orco>CsChrimson.
The goal of the optogenetic experiments was to provide experimental support for Ir25a expression in Orco+ neurons in an approach independent to previous methods. Our main question was whether we could activate what was previously considered Orco-only olfactory neurons using the Ir25a knock-in. These experiments were not designed to determine if this optogenetic activation recapitulated the normal activity of these neurons. For these reasons, we did not attempt the optogenetic experiments with Orco>CsChrimson flies.
Line 324-326: Why the authors tested control flies not fed all-trans retinal? They should test Ir25a-T2A-QF2>QUAS-CsChrimson not fed all-trans retinal as a control.
We apologize for the confusion. The “control” flies we used were indeed Ir25a-T2AQF2>QUAS-CsChrimson flies not fed all-trans retinal as suggested by the reviewer. This detail was in the methods, yet likely was not clear. We have amended the main text in multiple locations to state the full genotype of the control fly more clearly:
Modified text: “No light-induced responses were found in control flies, which had the same genotype as experimental flies but were not fed all-trans retinal (-ATR), a necessary co-factor for channelrhodopsin function (see Methods).” and “Bottom trace is control animal, which has the same genotype as the experimental animal but was not fed the required all-trans retinal cofactor (-ATR).”
Figure 4-Figure Supplement 1 legend: “In all optogenetic experiments, control animals have the same genotypes as the corresponding experimental animals but have not been fed all-trans retinal.”
Methods: “For all optogenetic experiments, the control flies were of the same genotype as experimental flies but had not been fed all-trans retinal.”
Line 478-500: I wonder if the observed differences between the wildtype and Ir25a2 mutant lines are due to differences in the genetic background between both lines. Did the authors backcross Ir25a2 mutant line with the used wildtype for at least five generations?
Yes, the mutants are outcrossed into the same genetic background as the wildtypes for at least five generations. Please see Methods, revised manuscript: “Ir25a2 and Orco2 mutant fly lines were outcrossed into the w1118 wildtype genetic background for at least 5 generations.”
Line 1602-1603: Does the identification of ab3 sensilla using fluorescent-guided SSR apply for ab3 sensilla in Orco mutant flies. How does this ab3 fluorescent-guided SSR work?
In fluorescence guided SSR (fgSSR; Lin and Potter, PloS One, 2015), the ab3 sensilla is GFPlabelled (genotype: Or22a-Gal4>UAS-mCD8:GFP), which allows this sensilla to be specifically identified under a microscope and targeted for SSR recordings. We generated fly stocks for fgSSR identification of ab3 in all three genetic backgrounds (wildtype, Orco mutant, Ir25a mutant).
These three genotypes are described in the methods:
“Full genotypes for ab3 fgSSR were:
Pin/CyO; Or22a-Gal4,15XUAS-IVS-mcd8GFP/TM6B (wildtype),
Ir25a2; Or22a-Gal4,15XUAS-IVS-mcd8GFP/TM6B (Ir25a2 mutant),
Or22a-Gal4/10XUAS-IVS-mcd8GFP (attp40); Orco2 (Orco2 mutant).”
Line 1602-1604: There is no mention of how the authors identified ab9 sensilla.
Information on the identification of ab9 sensilla is under the optogenetics section of the methods: “Identification of ab9 sensilla was assisted by fluorescence-guided Single Sensillum Recording (fgSSR) (Lin and Potter, 2015) using Or67b-Gal4 (BDSC #9995) recombined with 15XUAS-IVS-mCD8::GFP (BDSC #32193).”
Line 1648: what are the set of odorants that were used to identify the different coeloconic sensilla?
We have added the specific odorants used for sensillar identification for coeloconic SSR in the Methods. The protocol and odorants used were:
*2,3-butanedione (BUT), 1,4-diaminobutane (DIA), Ammonia (AM), hexanol (HEX), phenethylamine (PHEN), and propanal (PROP) to distinguish coeloconic sensilla:
o Wildtype flies: Strong DIA and BUT responses identify ac2 and rule out ac4. Absence of strong AM response rules out ac1, absence of HEX response rules out ac3, absence of PHEN response further rules out ac4.
o Ir25a mutant flies (amine responses lost, so cannot use PHEN and DIA as diagnostics): Strong BUT response and moderate PROP response identify ac2 and rule out ac4. Absence of strong AM response rules out ac1, absence of HEX response rules out ac3. Ac4 is further ruled out anatomically based on sensillar location compared to ac2.
Revised text: “Different classes of coeloconic sensilla were identified by their known location on the antenna and confirmed with their responses to a small panel of diagnostic odorants: in wildtype flies, ac2 sensilla were identified by their strong responses to 1,4-diaminobutane and 2,3-butanedione. The absence of a strong response to ammonia was used to rule out ac1 sensilla, the absence of a hexanol response was used to rule out ac3 sensilla, and the absence of a phenethylamine response was used to rule out ac4 sensilla. In Ir25a mutant flies in which amine responses were largely abolished, ac2 and ac4 sensilla were distinguished based on anatomical location, as well as the strong response of ac2 to 2,3-butanedione and the moderate response to propanal (both absent in ac4). Ac1 and ac3 sensilla were excluded similarly in the mutant and wildtype flies. No more than 4 sensilla per fly were recorded. Each sensillum was tested with multiple odorants, with a rest time of at least 10s between applications.
-
-
-
O, then unfold the passion of my love. 0276 Surprise her with discourse of my dear faith. 0277 It shall become thee well to act my woes. 0278 She will attend it better in thy youth 0279 30 Than in a nuncio’s of more grave aspect.
A special word where we can see an opening in his heart, his ideas, and his woes. Shakespeare manages to be both profound (in a long tirade on love) and comical (talking of love to a person who loves him)
-
-
www.science.org www.science.org
-
SCR_005040
DOI: 10.1126/sciadv.adu0726
Resource: Percolator: Semi-supervised learning for peptide identification from shotgun proteomics datasets (RRID:SCR_005040)
Curator: @scibot
SciCrunch record: RRID:SCR_005040
Tags
Annotators
URL
-
-
hyperpost.peergos.me hyperpost.peergos.me
-
ipfs
https://bafybeid2rtfgfxlqdjo2nedenrk7miue5w6abimo7bz5k5gehglptsc32u.ipfs.dweb.link/?path=/♖/hyperpost/~/indyweb/📓/20/25/11/3
-
-
indy0.peergos.me indy0.peergos.me
-
moved to https://bafybeihtxbr3mkagapvdagtjrllwmoptxu6tuiufgrxmlrdqxyqwueirwq.ipfs.dweb.link/?filename=index.html&urn=/hyperpost/🌐/♖/indy0/🌐/1/gyuri/⭕/0/
-
-
hyperpost.peergos.me hyperpost.peergos.me
-
move to
https://bafybeihtxbr3mkagapvdagtjrllwmoptxu6tuiufgrxmlrdqxyqwueirwq.ipfs.dweb.link/?filename=index.html&urn=/hyperpost/%F0%9F%8C%90/%E2%99%96/indy0/%F0%9F%8C%90/1/gyuri/%E2%AD%95/0/
-
-
dynamic listing in reverse chronological ordera list of all the recently annotated pages
Skip Stream
-
-
biz.libretexts.org biz.libretexts.org
-
Describe a situation where perception biases have or could affect any of the P-O-L-C facets. Use an example you have experienced or observed, or, if you do not have such an example, create a hypothetical situation. How do we manage the fact that human beings develop stereotypes? Is there such as thing as a good stereotype? How would you prevent stereotypes from creating unfairness in management decisions?
People rejected the study that went against their belief as methodologically inferior and ended up believing in their original position even more (Lord, et. al., 1979)! In other words, using data to debunk people’s beliefs or previously established opinions may not necessarily work, a tendency to guard against when conducting Planning and Controlling activities. I have experienced that a first impression from others lasted long.
You can protect yourself against this tendency by being aware of it and making a conscious effort to open your mind to new information.
Self-fulfilling prophecy. This happens when an established stereotype causes one to behave in a certain way, which leads the other party to behave in a way that confirms the stereotype For ex, because you are treating the other person more nicely, the response you get may also be nicer, which confirms your original belief that Asians are friendly
-
-
hyperpost.peergos.me hyperpost.peergos.me
-
https://bafybeihtxbr3mkagapvdagtjrllwmoptxu6tuiufgrxmlrdqxyqwueirwq.ipfs.dweb.link/?filename=index.html&urn=/hyperpost/🌐/♖/indy0/🌐/1/gyuri/⭕/0/
able to share indy0pad created pages for annotations without needing to rely on via.hypothesis
-
-
wiki.simongrant.org wiki.simongrant.org
-
theme: Knowledge Serving Commons
theme: Knowledge Serving Commons
-
-
growingcommons.substack.com growingcommons.substack.com
-
full set of wiki-articles, you can find them
-
Structuring knowledge commons
Part 2 of an ongoing series on knowledge serving commons
https://bafybeicuznswtf2d3sevop4ripd5hy77nauwbicurnruv4ocf3w32ke7ha.ipfs.dweb.link/?filename=index.html&&urn=🧊/♖/hyperpost/~/indyweb/📓/20/25/11/4/do/🏛%EF%B8%8F/growingcommons.substack.com/p/structuring-knowledge-commons
-
-
o-date.github.io o-date.github.io
-
In online advertising, such things are measurement by ‘engagement’ or click-bait. Indeed, ‘clickbait archaeology’ (see e.g., this thread by Erin Thompson) can be considered archaeology done - or promoted - with the express purpose of monetizing outrage in some register because people are more likely to click on negatively or outrageously framed stories (eg Hensinger, Flaounas, and Cristianini (2013), Maldonado (2016)).
This passage just highlights one of the challenges digital archeology faces when introduced to the public. While the digital technology has it's benefit it can also come with risk like exaggerating the message behind certain artifacts which may be misleading.
-
-
hyperpost.peergos.me hyperpost.peergos.me
-
experiment
added this by hand
```html <link rel="canonical" href="https://hyperpost.peergos.me/~/indyweb/scratch/">
<script src="https://hypothes.is/embed.js" async></script>```
4 way to embed hypothesis by the indy0pad
just change the template injected and save to IPFS
-
-
o-date.github.io o-date.github.io
-
Virtual archaeology relies more heavily on the construction of new knowledge through the making or (re)imaging of 2D images, 3D models or 3D printed objects, but also can include immersive environments and non-ocular experiences. What does that mean? As archaeologists, we interpret the archaeological material that reveals itself. We draw from past knowledge and experience; what we have learned in school, on other archaeological excavations, what others have said on the subject before us, but more importantly what the object, landscape or built environment says to us personally. Virtual archaeology helps to support the archaeological narrative, but it also can create new knowledge and thus new narratives.
This is relevant to my project because it shows us how digital archeology is not only recorded data but it allows the archeologist imagine and communicate new stories from the past, evolving from traditional tools to modern method.
-
-
o-date.github.io o-date.github.io
-
The Archaeological Department of the City of Amsterdam has created an impressive website that showcases the 700 000 plus finds, but they’ve done it in an intriguing way. There is a beautiful photo-catalogue called Stuff (details here).
This is relevant to my project because it displays hoe digital technology makes it possible for archeology to present large-scale data to the public.
-
-
hyperpost.peergos.me hyperpost.peergos.me
-
Gyuri's Web Snarf Folder - 4th week of October 2025
-
-
o-date.github.io o-date.github.io
-
Collecting your data digitally holds significant advantages. If you’ve settled on the structure of your destination database, digital data collection can seamlessly integrate information, eliminating extra steps and reducing opportunities for transcription errors.
This highlights how digital tools improve archeology collection. It points out how the shift from the analogue method, which is manual, to the digital method has made data collection more accurate and efficient. This emphasizes the benefits of digital archeology.
-
-
www.w3.org www.w3.org
-
o-date.github.io o-date.github.io
-
digital archaeology as a field rests upon the creative use of primarily open-source and/or open-access materials to archive, re-use, analyze and communicate archaeological data, and the sharing of digital archaeological data, code and workflows. Our reliance on open-source and open-access is a political stance that emerges in opposition to archaeology’s past complicity in colonial enterprises and scholarship that rested on secrecy and restricted training and prevented access to archaeological data. Digital archaeology resists the (digital) neo-colonialism of Google, Facebook, and similar tech giants that typically promote disciplinary silos and closed code and data repositories. Just like in Hotel California, they aim to keep you on their platform indefinitely. Digital archaeology encourages innovative, reflective, and critical use of open access data and the development of open digital tools that facilitate linkages and analysis across varied digital sources.
This shows that with digital archeology people have easy access to collect and study data. This is because it uses free and reachable tools that everyone can use. Archeologist also tend to do their works better because of the smart systems in play. This is relevant to my topic because it shows how much better archeology is because of the introduction of digital tools.
-
-
web.telegram.org web.telegram.org
-
SlipStream
or slip stream
wake of your trailblae
-
-
hyperpost.peergos.me hyperpost.peergos.me
-
indyWiki0pad

-
practical.steps - indy0pad & indy0wiki.pad interplay
-
// experiment - indy0pad & indy0wiki.pad interplay
top-slice
-
autopoiesis of the IndyWeb
-
-
www.planalto.gov.br www.planalto.gov.br
-
estudo prévio de impacto ambiental
Resolução CONAMA Nº 9, de 03 de dezembro de 1987
Art. 1º . A Audiência Pública referida na RESOLUÇÃO CONAMA nº 1/86, tem por finalidade expor aos interessados o conteúdo do produto em análise e do seu referido RIMA, dirimindo dúvidas e recolhendo dos presentes as críticas e sugestões a respeito.
Art. 2º . Sempre que julgar necessário, ou quando for solicitado pôr entidade civil, pelo Ministério Público, ou por 50 (cinqüenta) ou mais cidadãos, o Órgão do Meio Ambiente promoverá a realização de Audiência Pública. - § 1º . O Órgão de Meio Ambiente, a partir da data do recebimento do RIMA, fixará em edital e anunciará pela imprensa local a abertura do prazo que será no mínimo de 45 dias para solicitação de audiência pública. - § 2º . No caso de haver solicitação de audiência pública e na hipótese do Órgão Estadual não realizá-la, a licença não terá validade. - § 3º . Após este prazo, a convocação será feita pelo Órgão licenciador, através de correspondência registrada aos solicitantes e da divulgação em órgãos da imprensa local. - § 4º . A audiência pública deverá ocorrer em local acessível aos interessados. - § 5º . Em função da localização geográfica dos solicitantes se da complexidade do tema, poderá haver mais de uma audiência pública sobre o mesmo projeto e respectivo Relatório de Impacto Ambiental - RIMA.
Art. 3º . A audiência pública será dirigida pelo representante do Órgão licenciador que, após a exposição objetiva do projeto e o seu respectivo RIMA, abrirá as discussões com os interessados presentes.
Art. 4º . Ao final de cada audiência pública lavrada uma ata sucinta. - Parágrafo único . Serão anexadas à ata, todos os documentos escritos e assinados que forem entregues ao presidente dos trabalhos durante a seção.
Art. 5º. A ata da(s) Audiência(s) Pública(s) e seus anexos, servirão de base, juntamente com o RIMA, para a análise e parecer final do licenciador quanto à aprovação ou não do projeto.
RESOLUÇÃO CONAMA nº 237, de 19 de dezembro de 1997
- Dispõe sobre a revisão e complementação dos procedimentos e critérios utilizados para o licenciamento ambiental
- Altera a Resolução no 1/86 (revoga os art. 3º e 7º)
Art. 1º Para efeito desta Resolução são adotadas as seguintes definições: 1. Licenciamento Ambiental: procedimento administrativo pelo qual o órgão ambiental competente licencia a localização, instalação, ampliação e a operação de empreendimentos e atividades utilizadoras de recursos ambientais, consideradas efetiva ou potencialmente poluidoras ou daquelas que, sob qualquer forma, possam causar degradação ambiental, considerando as disposições legais e regulamentares e as normas técnicas aplicáveis ao caso. 2. Licença Ambiental: ato administrativo pelo qual o órgão ambiental competente, estabelece as condições, restrições e medidas de controle ambiental que deverão ser obedecidas pelo empreendedor, pessoa física ou jurídica, para localizar, instalar, ampliar e operar empreendimentos ou atividades utilizadoras dos recursos ambientais consideradas efetiva ou potencialmente poluidoras ou aquelas que, sob qualquer forma, possam causar degradação ambiental. 3. Estudos Ambientais: são todos e quaisquer estudos relativos aos aspectos ambientais relacionados à localização, instalação, operação e ampliação de uma atividade ou empreendimento, apresentado como subsídio para a análise da licença requerida, tais como: relatório ambiental, plano e projeto de controle ambiental, relatório ambiental preliminar, diagnóstico ambiental, plano de manejo, plano de recuperação de área degradada e análise preliminar de risco. 4. Impacto Ambiental Regional: é todo e qualquer impacto ambiental que afete diretamente (área de influência direta do projeto), no todo ou em parte, o território de dois ou mais Estados.
Art. 2º A localização, construção, instalação, ampliação, modificação e operação de empreendimentos e atividades utilizadoras de recursos ambientais consideradas efetiva ou potencialmente poluidoras, bem como os empreendimentos capazes, sob qualquer forma, de causar degradação ambiental, dependerão de prévio licenciamento do órgão ambiental competente, sem prejuízo de outras licenças legalmente exigíveis. - § 1º Estão sujeitos ao licenciamento ambiental os empreendimentos e as atividades relacionadas no anexo 1, parte integrante desta Resolução. - § 2º Caberá ao órgão ambiental competente definir os critérios de exigibilidade, o detalhamento e a complementação do anexo 1, levando em consideração as especificidades, os riscos ambientais, o porte e outras características do empreendimento ou atividade.
Art. 3º A licença ambiental para empreendimentos e atividades consideradas efetiva ou potencialmente causadoras de significativa degradação do meio dependerá de prévio estudo de impacto ambiental e respectivo relatório de impacto sobre o meio ambiente (EIA/RIMA), ao qual dar-se-á publicidade, garantida a realização de audiências públicas, quando couber, de acordo com a regulamentação. - Parágrafo único. O órgão ambiental competente, verificando que a atividade ou empreendimento não é potencialmente causador de significativa degradação do meio ambiente, definirá os estudos ambientais pertinentes ao respectivo processo de licenciamento.
Art. 8º O Poder Público, no exercício de sua competência de controle, expedirá as seguintes licenças: - I - Licença Prévia (LP) - concedida na fase preliminar do planejamento do empreendimento ou atividade aprovando sua localização e concepção, atestando a viabilidade ambiental e estabelecendo os requisitos básicos e condicionantes a serem atendidos nas próximas fases de sua implementação; - II - Licença de Instalação (LI) - autoriza a instalação do empreendimento ou atividade de acordo com as especificações constantes dos planos, programas e projetos aprovados, incluindo as medidas de controle ambiental e demais condicionantes, da qual constituem motivo determinante; - III - Licença de Operação (LO) - autoriza a operação da atividade ou empreendimento, após a verificação do efetivo cumprimento do que consta das licenças anteriores, com as medidas de controle ambiental e condicionantes determinados para a operação. Parágrafo único. As licenças ambientais poderão ser expedidas isolada ou sucessivamente, de acordo com a natureza, características e fase do empreendimento ou atividade.
Art. 9º O CONAMA definirá, quando necessário, licenças ambientais específicas, observadas a natureza, características e peculiaridades da atividade ou empreendimento e, ainda, a compatibilização do processo de licenciamento com as etapas de planejamento, implantação e operação.
Art. 11. Os estudos necessários ao processo de licenciamento deverão ser realizados por profissionais legalmente habilitados, às expensas do empreendedor. - Parágrafo único. O empreendedor e os profissionais que subscrevem os estudos previstos no caput deste artigo serão responsáveis pelas informações apresentadas, sujeitando-se às sanções administrativas, civis e penais.
Art. 12. O órgão ambiental competente definirá, se necessário, procedimentos específicos para as licenças ambientais, observadas a natureza, características e peculiaridades da atividade ou empreendimento e, ainda, a compatibilização do processo de licenciamento com as etapas de planejamento, implantação e operação. - § 1º Poderão ser estabelecidos procedimentos simplificados para as atividades e empreendimentos de <u>pequeno potencial</u> de impacto ambiental, que deverão ser aprovados pelos respectivos Conselhos de Meio Ambiente. - § 2º Poderá ser admitido um único processo de licenciamento ambiental para <u>pequenos</u> empreendimentos e atividades similares e vizinhos ou para aqueles integrantes de planos de desenvolvimento aprovados, previamente, pelo órgão governamental competente, desde que definida a responsabilidade legal pelo conjunto de empreendimentos ou atividades. - § 3º Deverão ser estabelecidos critérios para agilizar e simplificar os procedimentos de licenciamento ambiental das atividades e empreendimentos que implementem planos e programas voluntários de gestão ambiental, visando a melhoria contínua e o aprimoramento do desempenho ambiental.
Art. 18. O órgão ambiental competente estabelecerá os prazos de validade de cada tipo de licença, especificando-os no respectivo documento, levando em consideração os seguintes aspectos: - I - O prazo de validade da Licença Prévia (LP) deverá ser, no mínimo, o estabelecido pelo cronograma de elaboração dos planos, programas e projetos relativos ao empreendimento ou atividade, não podendo ser superior a 5 (cinco) anos. - II - O prazo de validade da Licença de Instalação (LI) deverá ser, no mínimo, o estabelecido pelo cronograma de instalação do empreendimento ou atividade, não podendo ser superior a 6 (seis) anos. - III - O prazo de validade da Licença de Operação (LO) deverá considerar os planos de controle ambiental e será de, no mínimo, 4 (quatro) anos e, no máximo, 10 (dez) anos. § 1º A Licença Prévia (LP) e a Licença de Instalação (LI) poderão ter os prazos de validade prorrogados, desde que não ultrapassem os prazos máximos estabelecidos nos incisos I e II.
RESOLUÇÃO CONAMA Nº 001, de 23 de janeiro de 1986
Artigo 1º: Para efeito desta Resolução, considera-se impacto ambiental qualquer alteração das propriedades físicas, químicas e biológicas do meio ambiente, causada por qualquer forma de matéria ou energia resultante das atividades humanas que, direta ou indiretamente, afetam: - I - a saúde, a segurança e o bem-estar da população; - II - as atividades sociais e econômicas; - III - a biota; - IV - as condições estéticas e sanitárias do meio ambiente; - V - a qualidade dos recursos ambientais.
[...]
Artigo 5º - O estudo de impacto ambiental, além de atender à legislação, em especial os princípios e objetivos expressos na Lei de Política Nacional do Meio Ambiente, obedecerá às seguintes diretrizes gerais:
I - Contemplar todas as alternativas tecnológicas e de localização de projeto, confrontando as com a hipótese de não execução do projeto;
II - Identificar e avaliar sistematicamente os impactos ambientais gerados nas fases de implantação e operação da atividade ;
III - Definir os limites da área geográfica a ser direta ou indiretamente afetada pelos impactos, denominada área de influência do projeto, considerando, em todos os casos, a bacia hidrográfica na qual se localiza;
IV - Considerar os planos e programas governamentais, propostos e em implantação na área de influência do projeto, e sua compatibilidade.
Parágrafo Único - Ao determinar a execução do estudo de impacto ambiental o órgão estadual competente, ou o IBAMA ou, quando couber, o Município, fixará as diretrizes adicionais que, pelas peculiaridades do projeto e características ambientais da área, forem julgadas necessárias, inclusive os prazos para conclusão e análise dos estudos.
-
-
chatgpt.com chatgpt.comChatGPT1
-
Estabilidad estructural: si hay rupturas (crisis, cambio de régimen), considerar re-estimación por ventana móvil o modelos de cambio de régimen. El paper usa estimación estática sobre toda la muestra (2013–2023) con split 80/20
CUIDADO
-
-
www.biorxiv.org www.biorxiv.org
-
Author response:
Reviewer #1 (Public Review):
In this paper, Tompary & Davachi present work looking at how memories become integrated over time in the brain, and relating those mechanisms to responses on a priming task as a behavioral measure of memory linkage. They find that remotely but not recently formed memories are behaviorally linked and that this is associated with a change in the neural representation in mPFC. They also find that the same behavioral outcomes are associated with the increased coupling of the posterior hippocampus with category-sensitive parts of the neocortex (LOC) during a post-learning rest period-again only for remotely learned information. There was also correspondence in rest connectivity (posterior hippocampus-LOC) and representational change (mPFC) such that for remote memories specifically, the initial post-learning connectivity enhancement during rest related to longer-term mPFC representational change.
This work has many strengths. The topic of this paper is very interesting, and the data provide a really nice package in terms of providing a mechanistic account of how memories become integrated over a delay. The paper is also exceptionally well-written and a pleasure to read. There are two studies, including one large behavioral study, and the findings replicate in the smaller fMRI sample. I do however have two fairly substantive concerns about the analytic approach, where more data will be required before we can know whether the interpretations are an appropriate reflection of the findings. These and other concerns are described below.
Thank you for the positive comments! We are proud of this work, and we feel that the paper is greatly strengthened by the revisions we made in response to your feedback. Please see below for specific changes that we’ve made.
1) One major concern relates to the lack of a pre-encoding baseline scan prior to recent learning.
a) First, I think it would be helpful if the authors could clarify why there was no pre-learning rest scan dedicated to the recent condition. Was this simply a feasibility consideration, or were there theoretical reasons why this would be less "clean"? Including this information in the paper would be helpful for context. Apologies if I missed this detail in the paper.
This is a great point and something that we struggled with when developing this experiment. We considered several factors when deciding whether to include a pre-learning baseline on day two. First, the day 2 scan session was longer than that of day 1 because it included the recognition priming and explicit memory tasks, and the addition of a baseline scan would have made the length of the session longer than a typical scan session – about 2 hours in the scanner in total – and we were concerned that participant engagement would be difficult to sustain across a longer session. Second, we anticipated that the pre-learning scan would not have been a ‘clean’ measure of baseline processing, but rather would include signal related to post-learning processing of the day 1 sequences, as multi-variate reactivation of learned stimuli have been observed in rest scans collected 24-hours after learning (Schlichting & Preston, 2014). We have added these considerations to the Discussion (page 39, lines 1047-1070).
b) Second, I was hoping the authors could speak to what they think is reflected in the post-encoding "recent" scan. Is it possible that these data could also reflect the processing of the remote memories? I think, though am not positive, that the authors may be alluding to this in the penultimate paragraph of the discussion (p. 33) when noting the LOC-mPFC connectivity findings. Could there be the reinstatement of the old memories due to being back in the same experimental context and so forth? I wonder the extent to which the authors think the data from this scan can be reflected as strictly reflecting recent memories, particularly given it is relative to the pre-encoding baseline from before the remote memories, as well (and therefore in theory could reflect both the remote + recent). (I should also acknowledge that, if it is the case that the authors think there might be some remote memory processing during the recent learning session in general, a pre-learning rest scan might not have been "clean" either, in that it could have reflected some processing of the remote memories-i.e., perhaps a clean pre-learning scan for the recent learning session related to point 1a is simply not possible.)
We propose that theoretically, the post-learning recent scan could indeed reflect mixture of remote and recent sequences. This is one of the drawbacks of splitting encoding into two sessions rather than combining encoding into one session and splitting retrieval into an immediate and delayed session; any rest scans that are collected on Day 2 may have signal that relates to processing of the Day 1 remote sequences, which is why we decided against the pre-learning baseline for Day 2, as you had noted.
You are correct that we alluded to in our original submission when discussing the LOC-mPFC coupling result, and we have taken steps to discuss this more explicitly. In Brief, we find greater LOC-mPFC connectivity only after recent learning relative to the pre-learning baseline, and cortical-cortical connectivity could be indicative of processing memories that already have undergone some consolidation (Takashima et al., 2009; Smith et al., 2010). From another vantage point, the mPFC representation of Day 1 learning may have led to increased connectivity with LOC on Day 2 due to Day 1 learning beginning to resemble consolidated prior knowledge (van Kesteren et al., 2010). While this effect is consistent with prior literature and theory, it's unclear why we would find evidence of processing of the remote memories and not the recent memories. Furthermore, the change in LOC-mPFC connectivity in this scan did not correlate with memory behaviors from either learning session, which could be because signal from this scan reflects a mix of processing of the two different learning sessions. With these ideas in mind, we have fleshed out the discussion of the post-encoding ‘recent’ scan in the Discussion (page 38-39, lines 1039-1044).
c) Third, I am thinking about how both of the above issues might relate to the authors' findings, and would love to see more added to the paper to address this point. Specifically, I assume there are fluctuations in baseline connectivity profile across days within a person, such that the pre-learning connectivity on day 1 might be different from on day 2. Given that, and the lack of a pre-learning connectivity measure on day 2, it would logically follow that the measure of connectivity change from pre- to post-learning is going to be cleaner for the remote memories. In other words, could the lack of connectivity change observed for the recent scan simply be due to the lack of a within-day baseline? Given that otherwise, the post-learning rest should be the same in that it is an immediate reflection of how connectivity changes as a function of learning (depending on whether the authors think that the "recent" scan is actually reflecting "recent + remote"), it seems odd that they both don't show the same corresponding increase in connectivity-which makes me think it may be a baseline difference. I am not sure if this is what the authors are implying when they talk about how day 1 is most similar to prior investigation on p. 20, but if so it might be helpful to state that directly.
We agree that it is puzzling that we don’t see that hippocampal-LOC connectivity does not also increase after recent learning, equivalently to what we see after remote learning. However, the fact that there is an increase from baseline rest to post-recent rest in mPFC – LOC connectivity suggests that it’s not an issue with baseline, but rather that the post-recent learning scan is reflecting processing of the remote memories (although as a caveat, there is no relationship with priming).
On what is now page 23, we were referring to the notion that the Day 1 procedure (baseline rest, learning, post-learning rest) is the most straightforward replication of past work that finds a relationship between hippocampal-cortical coupling and later memory. In contrast, the Day 2 learning and rest scan are less ‘clean’ of a replication in that they are taking place in the shadow of Day 1 learning. We have clarified this in the Results (page 23, lines 597-598).
d) Fourth and very related to my point 1c, I wonder if the lack of correlations for the recent scan with behavior is interpretable, or if it might just be that this is a noisy measure due to imperfect baseline correction. Do the authors have any data or logic they might be able to provide that could speak to these points? One thing that comes to mind is seeing whether the raw post-learning connectivity values (separately for both recent and remote) show the same pattern as the different scores. However, the authors may come up with other clever ways to address this point. If not, it might be worth acknowledging this interpretive challenge in the Discussion.
We thought of three different approaches that could help us to understand whether the lack of correlations in between coupling and behavior in the recent scan was due to noise. First, we correlated recognition priming with raw hippocampal-LOC coupling separately for pre- and post-learning scans, as in Author response image 1:
Author response image 1.
Note that the post-learning chart depicts the relationship between post-remote coupling and remote priming and between post-recent coupling and recent priming (middle). Essentially, post-recent learning coupling did not relate to priming of recently learned sequences (middle; green) while there remains a trend for a relationship between post-remote coupling and priming for remotely learned sequences (middle; blue). However, the significant relationship between coupling and priming that we reported in the paper (right, blue) is driven both by the initial negative relationship that is observed in the pre-learning scan and the positive relationship in the post-remote learning scan. This highlights the importance of using a change score, as there may be spurious initial relationships between connectivity profiles and to-be-learned information that would then mask any learning- and consolidation-related changes.
We also reasoned that if comparisons between the post-recent learning scan and the baseline scan are noisier than between the post-remote learning and baseline scan, there may be differences in the variance of the change scores across participants, such that changes in coupling from baseline to post-recent rest may be more variable than coupling from baseline to post-remote rest. We conducted F-tests to compare the variance of the change in these two hippocampal-LO correlations and found no reliable difference (ratio of difference: F(22, 22) = 0.811, p = .63).
Finally, we explored whether hippocampal-LOC coupling is more stable across participants if compared across two rest scans within the same imaging session (baseline and post-remote) versus across two scans across two separate sessions (baseline and post-recent). Interestingly, coupling was not reliably correlated across scans in either case (baseline/post-remote: r = 0.03, p = 0.89 Baseline/post-recent: r = 0.07, p = .74).
Finally, we evaluated whether hippocampal-LOC coupling was correlated across different rest scans (see Author response image 2). We reasoned that if such coupling was more correlated across baseline and post-remote scans relative to baseline and post-recent scans, that would indicate a within-session stability of participants’ connectivity profiles. At the same time, less correlation of coupling across baseline and post-recent scans would be an indication of a noisier change measure as the measure would additionally include a change in individuals’ connectivity profile over time. We found that there was no difference in the correlation of hipp-LO coupling is across sessions, and the correlation was not reliably significant for either session (baseline/post-remote: r = 0.03, p = 0.89; baseline/post-recent: r = 0.07, p = .74; difference: Steiger’s t = 0.12, p = 0.9).
Author response image 2.
We have included the raw correlations with priming (page 25, lines 654-661, Supplemental Figure 6) as well as text describing the comparison of variances (page 25, lines 642-653). We did not add the comparison of hippocampal-LOC coupling across scans to the current manuscript, as an evaluation of stability of such coupling in the context of learning and reactivation seems out of scope of the current focus of the experiment, but we find this result to be worthy of follow-up in future work.
In summary, further analysis of our data did not reveal any indication that a comparison of rest connectivity across scan sessions inserted noise into the change score between baseline and post-recent learning scans. However, these analyses cannot fully rule that possibility out, and the current analyses do not provide concrete evidence that the post-recent learning scan comprises signals that are a mixture of processing of recent and remote sequences. We discuss these drawbacks in the Discussion (page 39, lines 1047-1070).
2) My second major concern is how the authors have operationalized integration and differentiation. The pattern similarity analysis uses an overall correspondence between the neural similarity and a predicted model as the main metric. In the predicted model, C items that are indirectly associated are more similar to one another than they are C items that are entirely unrelated. The authors are then looking at a change in correspondence (correlation) between the neural data and that prediction model from pre- to post-learning. However, a change in the degree of correspondence with the predicted matrix could be driven by either the unrelated items becoming less similar or the related ones becoming more similar (or both!). Since the interpretation in the paper focuses on change to indirectly related C items, it would be important to report those values directly. For instance, as evidence of differentiation, it would be important to show that there is a greater decrease in similarity for indirectly associated C items than it is for unrelated C items (or even a smaller increase) from pre to post, or that C items that are indirectly related are less similar than are unrelated C items post but not pre-learning. Performing this analysis would confirm that the pattern of results matches the authors' interpretation. This would also impact the interpretation of the subsequent analyses that involve the neural integration measures (e.g., correlation analyses like those on p. 16, which may or may not be driven by increased similarity among overlapping C pairs). I should add that given the specificity to the remote learning in mPFC versus recent in LOC and anterior hippocampus, it is clearly the case that something interesting is going on. However, I think we need more data to understand fully what that "something" is.
We recognize the importance of understanding whether model fits (and changes to them) are driven by similarity of overlapping pairs or non-overlapping pairs. We have modified all figures that visualize model fits to the neural integration model to separately show fits for pre- and post-learning (Figure 3 for mPFC, Supp. Figure 5 for LOC, Supp. Figure 9 for AB similarity in anterior hippocampus & LOC). We have additionally added supplemental figures to show the complete breakdown of similarity each region in a 2 (pre/post) x 2 (overlapping/non-overlapping sequence) x 2 (recent/remote) chart. We decided against including only these latter charts rather than the model fits since the model fits strike a good balance between information and readability. We have also modified text in various sections to focus on these new results.
In brief, the decrease in model fit for mPFC for the remote sequences was driven primarily by a decrease in similarity for the overlapping C items and not the non-overlapping ones (Supplementary Figure 3, page 18, lines 468-472).
Interestingly, in LOC, all C items grew more similar after learning, regardless of their overlap or learning session, but the increase in model fit for C items in the recent condition was driven by a larger increase in similarity for overlapping pairs relative to non-overlapping ones (Supp. Figure 5, page 21, lines 533-536).
We also visualized AB similarity in the anterior hippocampus and LOC in a similar fashion (Supplementary Figure 9).
We have also edited the Methods sections with updated details of these analyses (page 52, lines 1392-1397). We think that including these results considerably strengthen our claims and we are pleased to have them included.
3) The priming task occurred before the post-learning exposure phase and could have impacted the representations. More consideration of this in the paper would be useful. Most critically, since the priming task involves seeing the related C items back-to-back, it would be important to consider whether this experience could have conceivably impacted the neural integration indices. I believe it never would have been the case that unrelated C items were presented sequentially during the priming task, i.e., that related C items always appeared together in this task. I think again the specificity of the remote condition is key and perhaps the authors can leverage this to support their interpretation. Can the authors consider this possibility in the Discussion?
It's true that only C items from the same sequence were presented back-to-back during the priming task, and that this presentation may interfere with observations from the post-learning exposure scan that followed it. We agree that it is worth considering this caveat and have added language in the Discussion (page 40, lines 1071-1086). When designing the study, we reasoned that it was more important for the behavioral priming task to come before the exposure scans, as all items were shown only once in that task, whereas they were shown 4-5 times in a random order in the post-learning exposure phase. Because of this difference in presentation times, and because behavioral priming findings tend to be very sensitive, we concluded that it was more important to protect the priming task from the exposure scan instead of the reverse.
We reasoned, however, that the additional presentation of the C items in the recognition priming task would not substantially override the sequence learning, as C items were each presented 16 times in their sequence (ABC1 and ABC2 16 times each). Furthermore, as this reviewer suggests, the order of C items during recognition was the same for recent and remote conditions, so the fact that we find a selective change in neural representation for the remote condition and don’t also see that change for the recent condition is additional assurance that the recognition priming order did not substantially impact the representations.
4) For the priming task, based on the Figure 2A caption it seems as though every sequence contributes to both the control and primed conditions, but (I believe) this means that the control transition always happens first (and they are always back-to-back). Is this a concern? If RTs are changing over time (getting faster), it would be helpful to know whether the priming effects hold after controlling for trial numbers. I do not think this is a big issue because if it were, you would not expect to see the specificity of the remotely learned information. However, it would be helpful to know given the order of these conditions has to be fixed in their design.
This is a correct understanding of the trial orders in the recognition priming task. We chose to involve the baseline items in the control condition to boost power – this way, priming of each sequence could be tested, while only presenting each item once in this task, as repetition in the recognition phase would have further facilitated response times and potentially masked any priming effects. We agree that accounting for trial order would be useful here, so we ran a mixed-effects linear model to examine responses times both as a function of trial number and of priming condition (primed/control). While there is indeed a large effect of trial number such that participants got faster over time, the priming effect originally observed in the remote condition still holds at the same time. We now report this analysis in the Results section (page 14, lines 337-349 for Expt 1 and pages 14-15, lines 360-362 for Expt 2).
5) The authors should be cautious about the general conclusion that memories with overlapping temporal regularities become neurally integrated - given their findings in MPFC are more consistent with overall differentiation (though as noted above, I think we need more data on this to know for sure what is going on).
We realize this conclusion was overly simplistic and, in several places, have revised the general conclusions to be more specific about the nuanced similarity findings.
6) It would be worth stating a few more details and perhaps providing additional logic or justification in the main text about the pre- and post-exposure phases were set up and why. How many times each object was presented pre and post, and how the sequencing was determined (were any constraints put in place e.g., such that C1 and C2 did not appear close in time?). What was the cover task (I think this is important to the interpretation & so belongs in the main paper)? Were there considerations involving the fact that this is a different sequence of the same objects the participants would later be learning - e.g., interference, etc.?
These details can be found in the Methods section (pages 50-51, lines 1337-1353) and we’ve added a new summary of that section in the Results (page 17, lines 424- 425 and 432-435). In brief, a visual hash tag appeared on a small subset of images and participants pressed a button when this occurred, and C1 and C2 objects were presented in separate scans (as were A and B objects) to minimize inflated neural similarity due to temporal proximity.
Reviewer #2 (Public Review):
The manuscript by Tompary & Davachi presents results from two experiments, one behavior only and one fMRI plus behavior. They examine the important question of how to separate object memories (C1 and C2) that are never experienced together in time and become linked by shared predictive cues in a sequence (A followed by B followed by one of the C items). The authors developed an implicit priming task that provides a novel behavioral metric for such integration. They find significant C1-C2 priming for sequences that were learned 24h prior to the test, but not for recently learned sequences, suggesting that associative links between the two originally separate memories emerge over an extended period of consolidation. The fMRI study relates this behavioral integration effect to two neural metrics: pattern similarity changes in the medial prefrontal cortex (mPFC) as a measure of neural integration, and changes in hippocampal-LOC connectivity as a measure of post-learning consolidation. While fMRI patterns in mPFC overall show differentiation rather than integration (i.e., C1-C2 representational distances become larger), the authors find a robust correlation such that increasing pattern similarity in mPFC relates to stronger integration in the priming test, and this relationship is again specific to remote memories. Moreover, connectivity between the posterior hippocampus and LOC during post-learning rest is positively related to the behavioral integration effect as well as the mPFC neural similarity index, again specifically for remote memories. Overall, this is a coherent set of findings with interesting theoretical implications for consolidation theories, which will be of broad interest to the memory, learning, and predictive coding communities.
Strengths:
1) The implicit associative priming task designed for this study provides a promising new tool for assessing the formation of mnemonic links that influence behavior without explicit retrieval demands. The authors find an interesting dissociation between this implicit measure of memory integration and more commonly used explicit inference measures: a priming effect on the implicit task only evolved after a 24h consolidation period, while the ability to explicitly link the two critical object memories is present immediately after learning. While speculative at this point, these two measures thus appear to tap into neocortical and hippocampal learning processes, respectively, and this potential dissociation will be of interest to future studies investigating time-dependent integration processes in memory.
2) The experimental task is well designed for isolating pre- vs post-learning changes in neural similarity and connectivity, including important controls of baseline neural similarity and connectivity.
3) The main claim of a consolidation-dependent effect is supported by a coherent set of findings that relate behavioral integration to neural changes. The specificity of the effects on remote memories makes the results particularly interesting and compelling.
4) The authors are transparent about unexpected results, for example, the finding that overall similarity in mPFC is consistent with a differentiation rather than an integration model.
Thank you for the positive comments!
Weaknesses:
1) The sequence learning and recognition priming tasks are cleverly designed to isolate the effects of interest while controlling for potential order effects. However, due to the complex nature of the task, it is difficult for the reader to infer all the transition probabilities between item types and how they may influence the behavioral priming results. For example, baseline items (BL) are interspersed between repeated sequences during learning, and thus presumably can only occur before an A item or after a C item. This seems to create non-random predictive relationships such that C is often followed by BL, and BL by A items. If this relationship is reversed during the recognition priming task, where the sequence is always BL-C1-C2, this violation of expectations might slow down reaction times and deflate the baseline measure. It would be helpful if the manuscript explicitly reported transition probabilities for each relevant item type in the priming task relative to the sequence learning task and discussed how a match vs mismatch may influence the observed priming effects.
We have added a table of transition probabilities across the learning, recognition priming, and exposure scans (now Table 1, page 48). We have also included some additional description of the change in transition probabilities across different tasks in the Methods section. Specifically, if participants are indeed learning item types and rules about their order, then both the control and the primed conditions would violate that order. Since C1 and C2 items never appeared together, viewing C1 would give rise to an expectation of seeing a BL item, which would also be violated. This suggests that our priming effects are driven by sequence-specific relationships rather than learning of the probabilities of different item types. We’ve added this consideration to the Methods section (page 45, lines 1212-1221).
Another critical point to consider (and that the transition probabilities do not reflect) is that during learning, while C is followed either by A or BL, they are followed by different A or BL items. In contrast, a given A is always followed by the same B object, which is always followed by one of two C objects. While the order of item types is semi-predictable, the order of objects (specific items) themselves are not. This can be seen in the response times during learning, such that response times for A and BL items are always slower than for B and C items. We have explained this nuance in the figure text for Table 1.
2) The choice of what regions of interest to include in the different sets of analyses could be better motivated. For example, even though briefly discussed in the intro, it remains unclear why the posterior but not the anterior hippocampus is of interest for the connectivity analyses, and why the main target is LOC, not mPFC, given past results including from this group (Tompary & Davachi, 2017). Moreover, for readers not familiar with this literature, it would help if references were provided to suggest that a predictable > unpredictable contrast is well suited for functionally defining mPFC, as done in the present study.
We have clarified our reasoning for each of these choices throughout the manuscript and believe that our logic is now much more transparent. For an expanded reasoning of why we were motivated to look at posterior and not anterior hippocampus, see pages 6-7, lines 135-159, and our response to R2. In brief, past research focusing on post-encoding connectivity with the hippocampus suggests that posterior aspect is more likely to couple with category-selective cortex after learning neutral, non-rewarded objects much like the stimuli used in the present study.
We also clarify our reasoning for LOC over mPFC. While theoretically, mPFC is thought to be a candidate region for coupling with the hippocampus during consolidation, the bulk of empirical work to date has revealed post-encoding connectivity between the hippocampus and category-selective cortex in the ventral and occipital lobes (page 6, lines 123-134).
As for the use of the predictable > unpredictable contrast for functionally defining cortical regions, we reasoned that cortical regions that were sensitive to the temporal regularities generated by the sequences may be further involved in their offline consolidation and long-term storage (Danker & Anderson, 2010; Davachi & Danker, 2013; McClelland et al., 1995). We have added this justification to the Methods section (page 18, lines 454-460).
3) Relatedly, multiple comparison corrections should be applied in the fMRI integration and connectivity analyses whenever the same contrast is performed on multiple regions in an exploratory manner.
We now correct for multiple comparisons using Bonferroni correction, and this correction depends on the number of regions in which each analysis is conducted. Please see page 55, lines 1483-1490, in the Methods section for details of each analysis.
Reviewer #3 (Public Review):
The authors of this manuscript sought to illuminate a link between a behavioral measure of integration and neural markers of cortical integration associated with systems consolidation (post-encoding connectivity, change in representational neural overlap). To that aim, participants incidentally encoded sequences of objects in the fMRI scanner. Unbeknownst to participants, the first two objects of the presented ABC triplet sequences overlapped for a given pair of sequences. This allowed the authors to probe the integration of unique C objects that were never directly presented in the same sequence, but which shared the same preceding A and B objects. They encoded one set of objects on Day 1 (remote condition), another set of objects 24 hours later (recent condition) and tested implicit and explicit memory for the learned sequences on Day 2. They additionally collected baseline and post-encoding resting-state scans. As their measure of behavioral integration, the authors examined reaction time during an Old/New judgement task for C objects depending on if they were preceded by a C object from an overlapping sequence (primed condition) versus a baseline object. They found faster reaction times for the primed objects compared to the control condition for remote but not recently learned objects, suggesting that the C objects from overlapping sequences became integrated over time. They then examined pattern similarity in a priori ROIs as a measure of neural integration and found that participants showing evidence of integration of C objects from overlapping sequences in the medial prefrontal cortex for remotely learned objects also showed a stronger implicit priming effect between those C objects over time. When they examined the change in connectivity between their ROIs after encoding, they also found that connectivity between the posterior hippocampus and lateral occipital cortex correlated with larger priming effects for remotely learned objects, and that lateral occipital connectivity with the medial prefrontal cortex was related to neural integration of remote objects from overlapping sequences.
The authors aim to provide evidence of a relationship between behavioral and neural measures of integration with consolidation is interesting, important, and difficult to achieve given the longitudinal nature of studies required to answer this question. Strengths of this study include a creative behavioral task, and solid modelling approaches for fMRI data with careful control for several known confounds such as bold activation on pattern analysis results, motion, and physiological noise. The authors replicate their behavioral observations across two separate experiments, one of which included a large sample size, and found similar results that speak to the reliability of the observed behavioral phenomenon. In addition, they document several correlations between neural measures and task performance, lending functional significance to their neural findings.
Thank you for this positive assessment of our study!
However, this study is not without notable weaknesses that limit the strength of the manuscript. The authors report a behavioral priming effect suggestive of integration of remote but not recent memories, leading to the interpretation that the priming effect emerges with consolidation. However, they did not observe a reliable interaction between the priming condition and learning session (recent/remote) on reaction times, meaning that the priming effect for remote memories was not reliably greater than that observed for recent. In addition, the emergence of a priming effect for remote memories does not appear to be due to faster reaction times for primed targets over time (the condition of interest), but rather, slower reaction times for control items in the remote condition compared to recent. These issues limit the strength of the claim that the priming effect observed is due to C items of interest being integrated in a consolidation-dependent manner.
We acknowledge that the lack of a day by condition interaction in the behavioral priming effect should discussed and now discuss this data in a more nuanced manner. While it’s true that the priming effect emerges due to a slowing of the control items over time, this slowing is consistent with classic time-dependent effects demonstrating slower response times for more delayed memories. The fact that the response times in the primed condition does not show this slowing can be interpreted as a protection against this slowing that would otherwise occur. Please see page 29, lines 758-766, for this added discussion.
Similarly, the interactions between neural variables of interest and learning session needed to strongly show a significant consolidation-related effect in the brain were sometimes tenuous. There was no reliable difference in neural representational pattern analysis fit to a model of neural integration between the short and long delays in the medial prefrontal cortex or lateral occipital cortex, nor was the posterior hippocampus-lateral occipital cortex post-encoding connectivity correlation with subsequent priming significantly different for recent and remote memories. While the relationship between integration model fit in the medial prefrontal cortex and subsequent priming (which was significantly different from that occurring for recent memories) was one of the stronger findings of the paper in favor of a consolidation-related effect on behavior, is it possible that lack of a behavioral priming effect for recent memories due to possible issues with the control condition could mask a correlation between neural and behavioral integration in the recent memory condition?
While we acknowledge that lack of a statistically reliable interaction between neural measures and behavioral priming in many cases, we are heartened by the reliable difference in the relationship between mPFC similarity and priming over time, which was our main planned prediction. In addition to adding caveats in the discussion about the neural measures and behavioral findings in the recent condition (see our response to R1.1 and R1.4 for more details), we have added language throughout the manuscript noting the need to interpret these data with caution.
These limitations are especially notable when one considers that priming does not classically require a period of prolonged consolidation to occur, and prominent models of systems consolidation rather pertain to explicit memory. While the authors have provided evidence that neural integration in the medial prefrontal cortex, as well as post-encoding coupling between the lateral occipital cortex and posterior hippocampus, are related to faster reaction times for primed objects of overlapping sequences compared to their control condition, more work is needed to verify that the observed findings indeed reflect consolidation dependent integration as proposed.
We agree that more work is needed to provide converging evidence for these novel findings. However, we wish to counter the notion that systems consolidation models are relevant only for explicit memories. Although models of systems consolidation often mention transformations from episodic to semantic memory, the critical mechanisms that define the models involve changes in the neural ensembles of a memory that is initially laid down in the hippocampus and is taught to cortex over time. This transformation of neural traces is not specific to explicit/declarative forms of memory. For example, implicit statistical learning initially depends on intact hippocampal function (Schapiro et al., 2014) and improves over consolidation (Durrant et al., 2011, 2013; Kóbor et al., 2017).
Second, while there are many classical findings of priming during or immediately after learning, there are several instances of priming used to measure consolidation-related changes to newly learned information. For instance, priming has been used as a measure of lexical integration, demonstrating that new word learning benefits from a night of sleep (Wang et al., 2017; Gaskell et al., 2019) or a 1-week delay (Tamminen & Gaskell, 2013). The issue is not whether priming can occur immediately, it is whether priming increases with a delay.
Finally, it is helpful to think about models of memory systems that divide memory representations not by their explicit/implicit nature, but along other important dimensions such as their neural bases, their flexibility vs rigidity, and their capacity for rapid vs slow learning (Henke, 2010). Considering this evidence, we suggest that systems consolidation models are most useful when considering how transformations in the underlying neural memory representation affects its behavioral expression, rather than focusing on the extent that the memory representation is explicit or implicit.
With all this said, we have added text to the discussion reminding the reader that there was no statistically significant difference in priming as a function of the delay (page 29, lines 764 - 766). However, we are encouraged by the fact that the relationship between priming and mPFC neural similarity was significantly stronger for remotely learned objects relative to recently learned ones, as this is directly in line with systems consolidation theories.
References
Abolghasem, Z., Teng, T. H.-T., Nexha, E., Zhu, C., Jean, C. S., Castrillon, M., Che, E., Di Nallo, E. V., & Schlichting, M. L. (2023). Learning strategy differentially impacts memory connections in children and adults. Developmental Science, 26(4), e13371. https://doi.org/10.1111/desc.13371
Dobbins, I. G., Schnyer, D. M., Verfaellie, M., & Schacter, D. L. (2004). Cortical activity reductions during repetition priming can result from rapid response learning. Nature, 428(6980), 316–319. https://doi.org/10.1038/nature02400
Durrant, S. J., Cairney, S. A., & Lewis, P. A. (2013). Overnight consolidation aids the transfer of statistical knowledge from the medial temporal lobe to the striatum. Cerebral Cortex, 23(10), 2467–2478. https://doi.org/10.1093/cercor/bhs244
Durrant, S. J., Taylor, C., Cairney, S., & Lewis, P. A. (2011). Sleep-dependent consolidation of statistical learning. Neuropsychologia, 49(5), 1322–1331. https://doi.org/10.1016/j.neuropsychologia.2011.02.015
Gaskell, M. G., Cairney, S. A., & Rodd, J. M. (2019). Contextual priming of word meanings is stabilized over sleep. Cognition, 182, 109–126. https://doi.org/10.1016/j.cognition.2018.09.007
Henke, K. (2010). A model for memory systems based on processing modes rather than consciousness. Nature Reviews Neuroscience, 11(7), 523–532. https://doi.org/10.1038/nrn2850
Kóbor, A., Janacsek, K., Takács, Á., & Nemeth, D. (2017). Statistical learning leads to persistent memory: Evidence for one-year consolidation. Scientific Reports, 7(1), 760. https://doi.org/10.1038/s41598-017-00807-3
Kuhl, B. A., & Chun, M. M. (2014). Successful remembering elicits event-specific activity patterns in lateral parietal cortex. The Journal of Neuroscience, 34(23), 8051–8060. https://doi.org/10.1523/JNEUROSCI.4328-13.2014
Richter, F. R., Chanales, A. J. H., & Kuhl, B. A. (2016). Predicting the integration of overlapping memories by decoding mnemonic processing states during learning. NeuroImage, 124, Part A, 323–335. https://doi.org/10.1016/j.neuroimage.2015.08.051
Schapiro, A. C., Gregory, E., Landau, B., McCloskey, M., & Turk-Browne, N. B. (2014). The necessity of the medial-temporal lobe for statistical learning. Journal of Cognitive Neuroscience, 1–12. https://doi.org/10.1162/jocn_a_00578
Schlichting, M. L., & Preston, A. R. (2014). Memory reactivation during rest supports upcoming learning of related content. Proceedings of the National Academy of Sciences, 111(44), 15845–15850. https://doi.org/10.1073/pnas.1404396111
Smith, J. F., Alexander, G. E., Chen, K., Husain, F. T., Kim, J., Pajor, N., & Horwitz, B. (2010). Imaging systems level consolidation of novel associate memories: A longitudinal neuroimaging study. NeuroImage, 50(2), 826–836. https://doi.org/10.1016/j.neuroimage.2009.11.053
Takashima, A., Nieuwenhuis, I. L. C., Jensen, O., Talamini, L. M., Rijpkema, M., & Fernández, G. (2009). Shift from hippocampal to neocortical centered retrieval network with consolidation. The Journal of Neuroscience, 29(32), 10087–10093. https://doi.org/10.1523/JNEUROSCI.0799-09.2009
Tamminen, J., & Gaskell, M. G. (2013). Novel word integration in the mental lexicon: Evidence from unmasked and masked semantic priming. The Quarterly Journal of Experimental Psychology, 66(5), 1001–1025. https://doi.org/10.1080/17470218.2012.724694
van Kesteren, M. T. R. van, Fernández, G., Norris, D. G., & Hermans, E. J. (2010). Persistent schema-dependent hippocampal-neocortical connectivity during memory encoding and postencoding rest in humans. Proceedings of the National Academy of Sciences, 107(16), 7550–7555. https://doi.org/10.1073/pnas.0914892107
Wang, H.-C., Savage, G., Gaskell, M. G., Paulin, T., Robidoux, S., & Castles, A. (2017). Bedding down new words: Sleep promotes the emergence of lexical competition in visual word recognition. Psychonomic Bulletin & Review, 24(4), 1186–1193. https://doi.org/10.3758/s13423-016-1182-7
-
-
www.biorxiv.org www.biorxiv.org
-
Author Response
Reviewer #1 (Public Review):
Iyer et al. address the problem of how cells exposed to a graded but noisy morphogen concentration are able to infer their position reliably, in other words how the positional information of a realistic morphogen gradient is decoded through cell-autonomous ligand processing. The authors introduce a model of a ligand processing network involving multiple ”branches” (receptor types) and ”tiers” (compartments where ligand-bound receptors can be located). Receptor levels are allowed to vary with distance from the source independently of the morphogen concentration. All rates, except for the ligand binding and unbinding rates, are potentially under feedback control. The authors assume that the cells can infer their position from the output of the signalling network in an optimal way. The resulting parameter space is then explored to identify optimal ”network architectures” and parameters, i.e. those that maximise the fidelity of the positional inference. The analysis shows how the presence of both specific and non-specific receptors, graded receptor expression and feedback loops can contribute to improving positional inference. These results are compared with known features of the Wnt signalling system in Drosophila wing imaginal disc.
The authors are doing an interesting study of how feedback control of the signalling network reading a morphogen gradient can influence the precision of the read-out. The main strength of this work is the attention to the development of the mathematical framework. While the family of network architectures introduced here is not completely generic, there is enough flexibility to explore various features of realistic signalling systems. It is exciting to find that some network topologies are particularly efficient at reducing the noise in the morphogen gradient. The comparison with the Wnt system in Drosophila is also promising.
Major comments:
1) The authors assume that the cell estimates its position through the maximum a posteriori estimate, Eq.(5), which is a well-defined mathematical object; it seems to us however that whether the cell is actually capable of performing this measurement is uncertain (it is an optimal measurement in some sense, but there is no guarantee that the cell is optimal in that respect). Notably, this entails evaluating p(theta), which is a probability distribution over the entire tissue, so this estimate can not be done with purely local measurements. Can the authors comment on this and how the conclusions would change if a different position measurement was performed?
This is indeed an important question. Our viewpoint is that if the cells were to use a maximum a posteriori (MAP) estimate (Eq. 5) to decode their positions, then what features of the channel architecture would lead to small errors in positional inference. Whether the maximum a posteriori estimate is employed by the cell, or some other estimate, is an important but difficult question to address. Our choice has been motivated by how this estimate has allowed the precise determination of developmental fates in the context of gap gene expression in Drosophila embryo [1, 2, 3]. We had earlier computed the inference error with a different estimate i.e.
which computes the mean squared deviations of the inferred positions from the true position for each x, taking into account the entire distribution p(x∗|x). While the qualitative results are the same, the inference errors showed spurious jitters from outliers in sampling the noisy morphogen input distribution. This consistency might suggest that our qualitative results are insensitive to the choice of the estimate.
Further, when evaluating the MAP estimate, the term p(θ) in the denominator serves as a normalisation factor to ensure p(x|θ) is a probability density. This is not strictly necessary for MAP estimation. Since p(θ) does not depend on x, the MAP estimate can be written as follows
without the need for evaluating p(θ). In the case of a uniform prior, it would be equivalent to maximum likelihood estimate (MLE) i.e.
2) One of the features of the signalling networks studied in the manuscript is the ability of the system to form a complex (termed a conjugated state, Q) made of two ligands L, one receptor and one nonsignalling receptor. While there are clear examples of a single ligand binding to two signalling receptors (e.g. Bmps), are there also known situations where such a complex with two ligands, one receptor, and one non-signalling receptor can form? In the Wnt example (Fig. 10a), it is not clear what this complex would be? In general, it would be great to have a more extended discussion of how the model hypothesis for the signalling networks could relate to real systems.
This is a good suggestion. We have now added a discussion on the various possible realisations of the “conjugate state” Q in Section 3.6. We have also explored the various states in the context of different signalling contexts such as Dpp, Hh, Fgf in the Discussion section.
The conjugated state ‘Q’ represents a combination of the readings from the two branches i.e. receptor types. This could be realised through processes like ligand exchange or complex formation, both in a shared spatial location such as a compartment. As discussed in the original manuscript (Section 3.6 of the revised manuscript), the ligand Wg in the Wg signalling pathway is internalised through two separate endocytic pathways associated with the receptor types - signalling receptor Frizzled (via Clathrin-mediated endocytosis (CME)) and non-signalling receptor HSPGs (via the CLIC/GEEC pathway (CLIC - (clathrin-independent carriers, GEEC - GPI-anchored protein-enriched early endosomal compartments)). Both pathways meet in a common early endosomal compartment where the ligands may be exchanged between the two receptors [4]. In a previous work by Hemalatha et al [4], we had shown that there are more Wg-DFz2 interactions in the endosomal compartment (measured through FRET) than on the cell surface. Therefore, the non-signalling receptors directing Wg through the CLIC/GEEC pathway titrate the amount of Wg interaction with the signalling receptor, DFz2.
As mentioned in the original manuscript (Section 3.3 and subsection 4.2 of the Discussion in the revised manuscript), apart from Wg signalling, non-signalling receptors such as the HSPGs have also been proposed to act as co-receptors for Dpp, Hh, FGF (reviewed in [5, 6]). Although some ligands bind to the core protein of HSPG, the majority of the ligands bind to the negatively charged HS chains [7, 8]. Here, the coreceptors HSPGs aid in capturing diffusible ligands and presenting the same to signalling receptors (either on the cell surface or within endosomes).
3) The authors consider feedback on reaction rates - it would seem natural to also consider feedback on the total number of receptors; notably, since there are known examples of receptors transcriptionally down-regulated by their ligands (e.g. Dpp/Tkv)? Also it is not clear in insets such as in Fig. 7b, if the concentration plotted corresponds to the concentration of receptors bound to ligands?
As mentioned in the original manuscript (Section 2.2 of the revised manuscript), we have indeed considered control on reaction rates and receptors, although the control on the latter is done with the constraint of receptor profiles being monotonic. Further, while the control on reaction rates is considered via feedbacks explicitly, the control on receptors is done via an approach akin to the openloop control used in control theory. In reality, cellular control on receptors will involve transcriptional up- or down-regulation of receptor and thus warrant a feedback control approach – however, the timescales involved in such a control are different from the binding-unbinding and signalling timescales.
Therefore, in the current work, we take the morphogen profile to be given i.e. independent of receptor concentrations, and we ask for the receptor concentrations that would help reduce the inference errors.
Our predictions of increasing signalling receptor and decreasing non-signalling receptors in a twobranch channel architecture are consistent with the known transcriptional up-regulation of Dally/Dlp and down-regulation of Fz by Wg signalling [9].
In a future work, we will extend the control on receptors to include feedbacks explicitly. Furthermore, the explicit feedback control on receptors may need to be considered concomitantly with the effect of receptors on morphogen dynamics (i.e. morphogen sculpting by receptors) along with the possibility of spatial correlations in receptor concentrations through neighbouring cell-cell interactions.
As mentioned in the original manuscript (Section 2.2 of the revised manuscript), the variables ψ and φ stand for the total (bound + unbound) surface receptor concentrations of the signalling and the non-signalling receptors respectively. Therefore, the insets showing receptor profiles such as in Fig. 6b, 7b, and Appendix H Fig.8b,e correspond to the total surface receptor concentrations.
4) The authors are clear about the fact that they consider the morphogen gradient to be fixed independently of the reaction network; however, that seems like a very strong assumption; in the Dpp morphogen gradient for instance over expression of the Tkv receptor leads to gradient shortening. Can the authors comment on this?
This point is related to the earlier question 4. As discussed in the Discussion of the original manuscript (subsection 4.3 of the revised manuscript), we focus on finding the optimal receptor concentration profiles and reaction networks that enable precision and robustness in positional information from a given noisy morphogen profile. The framework and the optimisation scheme within it will prescribe different receptor profiles and reaction networks for different monotonically behaving, noisy morphogen profiles. It is possible that cells may achieve the optimal receptor concentrations via feedback control on production of the receptors.
Broadly, morphogen dynamics depends on cell surface receptors, which could participate in both the inference and the sculpting of the morphogen profile, and factors independent of them such as extracellular degradation, transport and production, etc. In our present work, we have taken the receptors involved in sculpting and inference as being independent.
In a more general case, feedback control on receptors will change the receptor concentrations as well as the morphogen profile. We are currently working on realising such a feedback control on receptors within the same broader information theoretic framework proposed in the current work.
5) Fig. 10f is showing an exciting result on the change in endocytic gradient CV in the WT and in DN mutant of Garz. Can the authors check that the Wg morphogen gradient is not changing in these two conditions? And can they also show the original gradient, and not only its CV?
The reviewer raises a legitimate concern – could the observed changes in CV upon perturbation of endocytic machinery be attributed to a systematic change in the mean levels of the endocytosed Wg alone? In the original manuscript (Appendix O Fig.17b,c of the revised manuscript), we show the normalised profiles of endocytic Wg in control and myr-Garz-DN cases. Here, in Fig.1 below, we show a comparison between the mean Wg concentrations (measured as fluorescence intensity) in control wing discs and discs wherein CLIC/GEEC endocytic pathway is removed using UAS-myr-Garz-DN. For clarity, we show the discs with largest and smallest fluorescence intensities from the control and myr-Garz-DN discs. It is hard to conclude that the mean concentrations are significantly different in the two cases.
Reviewer #2 (Public Review):
The work of Iyer et al. uses a computational approach to investigate how cells using multiple tiers of processing and multiple parallel receptor types allow more accurate reading of position from a noisy signal. Authors find that combining signaling and non-signaling types of receptors together with additional feedback increases the accuracy of positional readout against extrinsic noise that is conveyed in the morphogen signal. Further, extending the number of layers of signal processing counteracts the intrinsic stochasticity of the signal reading and processing steps. The mathematical formulation of the model is general but comprehensive in the way it handles the difference between branches and tiers for the processing of channels with feedbacks. The results of the model are presented from simple one-branch and one-tier architecture to two-branch and two-tier architecture with feedbacks. Interestingly authors find that adding more tiers results in only very small improvements in the accuracy of positional readout. The model is tested against a perturbation experiment that impairs one of the signaling branches in the Drosophila wing disc, but the comparison is only qualitative as further experiment-oriented work is planned in a separate paper.
Strengths
There is a clear statement of objectives, model, and how the model is evaluated. In particular, the objective is to find what number of receptor types and their concentrations for a given number of tiers and feedback types is resulting in the most accurate positional readout. The employed optimization procedure is capable to find signalling architectures that result in one cell diameter positional precision for most of the tissue with 3-4 cells at the tissue end that is most distant to the morphogen source. This demonstrates that employing additional complexity in signal processing results in a very accurate positional readout, which is comparable with estimates of positional precision obtained in other developmental systems (Petkova et al., Cell 2019, Zagorski et al., Science 2017).
The optimal signalling architectures indicate that both signalling (specific) and non-signalling (nonspecific) receptors affect the precision of positional readout, but the contributions of each type of these receptors are qualitatively different. Even slight perturbation of signalling receptors drives the system out of optimum, resulting in a decrease in positional precision. In contrast, the non-signalling receptors could accommodate much larger perturbations. This observation could provide a biophysical explanation for how cross-talk between different morphogen species could be realized in a way that positional precision is kept at the optimum when morphogen signaling undergoes extrinsic and intrinsic perturbations.
Last, the model formulation allows to specifically address perturbations of signalling and feedbacks, that could be explored to validate model predictions experimentally in Drosophila wing disc, but also in other developmental tissues. The authors present a proof-of-concept by obtaining consistent results of variation of output profiles in two-tier two-branch architectures with non-signaling branch removed and intensity profiles of Wg in wing disc where the CLIC/GEEC endocytic pathway was perturbed.
Weaknesses
The list of model parameters is long including more than 20 entries for two-tier two-branch architectures. This is expected, as the aim of the model is to describe the sophisticated signalling architecture mimicking the biological system. However, this also makes it very challenging or impossible to provide guiding principles or understanding of the system behaviour for the complete space of signalling architectures that optimize positional readout. Although, the employed optimization procedure finds solutions that exhibit very high positional accuracy, there is only very limited notion how these solutions depend on variation of different parameters. The authors do not address the following question, whether these solutions correspond to broad global optima in the space of all solutions, or were rather fine-tuned by the optimization procedure and are quite rare.
It is unclear how contributions from the intrinsic noise affect the system behaviour compared to contributions from extrinsic noise. In principle, the two-branch one-tier architecture results in an already very accurate positional readout across the tissue. The adding of another tier seems to provide only a very weak improvement over a one-tier solution. It is possible that contributions from intrinsic noise for the investigated signalling architectures are only mildly affecting the system compared with contributions from extrinsic noise. Hence, it is difficult to assess whether the claim of reducing intrinsic noise by adding another tier is supported by the presented data, as the contributions from intrinsic noise could overall very weakly affect the positional readout.
The optimal response of the channel to extrinsic and intrinsic noises is very distinct. As noted correctly by the reviewer, an additional tier provides only a marginal improvement in inference error due extrinsic noise (compare Fig.7 and Fig.8 in the revised manuscript). However, as shown in Fig.9c of the revised manuscript (same as in the original manuscript), adding an extra tier provides a substantial improvement in inference errors due to intrinsic noise.
References
[1] Gasper Tkacik, Julien O Dubuis, Mariela D Petkova, and Thomas Gregor. Positional information, positional error, and readout precision in morphogenesis: a mathematical framework. Genetics, 199:39– 59, 2015.
[2] Mariela D Petkova, Gasper Tkacik, William Bialek, Eric F Wieschaus, and Thomas Gregor. Optimal decoding of cellular identities in a genetic network. Cell, 176:844–855, 2019.
[3] Julien O Dubuis, Gaˇsper Tkaˇcik, Eric F Wieschaus, Thomas Gregor, and William Bialek. Positional information, in bits. Proceedings of the National Academy of Sciences, 110:16301–16308, 2013.
[4] Anupama Hemalatha, Chaitra Prabhakara, and Satyajit Mayor. Endocytosis of wingless via a dynaminindependent pathway is necessary for signaling in drosophila wing discs. Proceedings of the National Academy of Sciences, 113:E6993–E7002, 2016.
[5] Xinhua Lin. Functions of heparan sulfate proteoglycans in cell signaling during development. Development, 131:6009–6021, 2004.
[6] Stephane Sarrazin, William C Lamanna, and Jeffrey D Esko. Heparan sulfate proteoglycans. Cold Spring Harbor perspectives in biology, 3(7):a004952, 2011.
[7] Catherine A Kirkpatrick, Sarah M Knox, William D Staatz, Bethany Fox, Daniel M Lercher, and Scott B Selleck. The function of a drosophila glypican does not depend entirely on heparan sulfate modification. Developmental biology, 300(2):570–582, 2006.
[8] Mariana I Capurro, Ping Xu, Wen Shi, Fuchuan Li, Angela Jia, and Jorge Filmus. Glypican-3 inhibits hedgehog signaling during development by competing with patched for hedgehog binding. Developmental cell, 14(5):700–711, 2008.
[9] Kenneth M Cadigan, Matthew P Fish, Eric J Rulifson, and Roel Nusse. Wingless repression of drosophila frizzled 2 expression shapes the wingless morphogen gradient in the wing. Cell, 93(5):767–777, 1998.
-
-
www.biorxiv.org www.biorxiv.org
-
Author Response
We thank the reviewers for their positive feedback and thoughtful suggestions that will improve our manuscript. Here we summarise our plan for immediate action. We will resubmit our manuscript once additional experiments have been performed to clarify all the major and minor concerns of the reviewers and the manuscript has been revised. At that point, we will respond to all reviewer’s points and highlight the changes made in the text.
Reviewer #1 (Public Review):
The authors have tried to correlate changes in the cellular environment by means of altering temperature, the expression of key cellular factors involved in the viral replication cycle, and small molecules known to affect key viral protein-protein interactions with some physical properties of the liquid condensates of viral origin. The ideas and experiments are extremely interesting as they provide a framework to study viral replication and assembly from a thermodynamic point of view in live cells.
The major strengths of this article are the extremely thoughtful and detailed experimental approach; although this data collection and analysis are most likely extremely time-consuming, the techniques used here are so simple that the main goal and idea of the article become elegant. A second major strength is that in other to understand some of the physicochemical properties of the viral liquid inclusion, they used stimuli that have been very well studied, and thus one can really focus on a relatively easy interpretation of most of the data presented here.
There are three major weaknesses in this article. The way it is written, especially at the beginning, is extremely confusing. First, I would suggest authors should check and review extensively for improvements to the use of English. In particular, the abstract and introduction are extremely hard to understand. Second, in the abstract and introduction, the authors use terms such as "hardening", "perturbing the type/strength of interactions", "stabilization", and "material properties", for just citing some terms. It is clear that the authors do know exactly what they are referring to, but the definitions come so late in the text that it all becomes confusing. The second major weakness is that there is a lack of deep discussion of the physical meaning of some of the measured parameters like "C dense vs inclusion", and "nuclear density and supersaturation". There is a need to explain further the physical consequences of all the graphs. Most of them are discussed in a very superficial manner. The third major weakness is a lack of analysis of phase separations. Some of their data suggest phase transition and/or phase separation, thus, a more in-deep analysis is required. For example, could they calculate the change of entropy and enthalpy of some of these processes? Could they find some boundaries for these transitions between the "hard" (whatever that means) and the liquid?
The authors have achieved almost all their goals, with the caveat of the third weakness I mentioned before. Their work presented in this article is of significant interest and can become extremely important if a more detailed analysis of the thermodynamics parameters is assessed and a better description of the physical phenomenon is provided.
We thank reviewer 1 for the comments and, in particular, for being so positive regarding the strengths of our manuscript and for raising concerns that will surely improve the manuscript. At this point, we propose the following actions to address the concerns of Reviewer 1:
1) We will extensively revise the use of English, particularly, in the abstract and introduction, defining key terms as they come along in the text to make the argument clearer.
2) We acknowledge the importance of discussing our data in more detail and we propose the following. We will discuss the graphs and what they mean as exemplified in the paragraph below.
Regarding Figure 3 - As the concentration of vRNPs increases, we observe an increase in supersaturation until 12hpi. This means that contrary to what is observed in a binary mixture, in which the Cdilute is constant (Klosin et al., 2020), the Cdilute in our system increases with concentration. It has been reported that Cdilute increases in a multi-component system with bulk concentration (Riback et al., 2020). Our findings have important implications for how we think about the condensates formed during influenza infection. As the 8 different genomic vRNPs have a similar overall structure, they could, in theory, behave as a binary system between units of vRNPs and Rab11a. However, a change in Cdilute with concentration shows that our system behaves as a multi-component system. This means that the differences in length, RNA sequence and valency that each vRNP have are key for the integrity of condensates.
3) The reviewer calls our attention to the lack of analysis of phase separations. We think that phase separation (or percolation coupled to phase separation) governs the formation of influenza A virus condensates. However, we think we ought to exert caution at this point as the condensates we are working with are very complex and that the physics of our system in cells may not be sufficient to claim phase separation without an in vitro reconstitution system. In fact, IAV inclusions contain cellular membranes, different vRNPs and Rab11a. So far, we can only speculate that the liquid character of IAV inclusions may arise from a network of interacting vRNPs that bridge several cognate vRNP-Rab11 units on flexible membranes, similarly to what happens in phase separated vesicles in neurological synapses. However, the speculative model for our system, although being supported by correlative light and electron microscopy, currently lacks formal experimental validation.
For this reason, we thought of developing the current work as an alternative to explore the importance of the liquid material properties of IAV inclusions. By finding an efficient method to alter the material properties of IAV inclusions, we provide proof of principle that it is possible to impose controlled phase transitions that reduce the dynamics of vRNPs in cells and negatively impact progeny virion production. Despite having discussed these issues in the limitations of the study, we will make our point clearer.
We are currently establishing an in vitro reconstitution system to formally demonstrate, in an independent publication, that IAV inclusions are formed by phase separation. For this future work, we teamed up with Pablo Sartori, a theorical physicist to derive in- depth analysis of the thermodynamics of the viral liquid condensates. Collectively, we think that cells have too many variables to derive meaningful physics parameters (such as entropy and enthalpy) as well as models and need to be complemented by in vitro systems. For example, increasing the concentration inside a cell is not a simple endeavour as it relies on cellular pathways to deliver material to a specific place. At the same time, the 8 vRNPs, as mentioned above, have different size, valency and RNA sequence and can behave very differently in the formation of condensates and maintenance of their material properties. Ideally, they should be analysed individually or in selected combinations. For the future, we will combine data from in vitro reconstitution systems and cells to address this very important point raised by the reviewer.
From the paper on the section Limitations of the study: “Understanding condensate biology in living cells is physiologically relevant but complex because the systems are heterotypic and away from equilibria. This is especially challenging for influenza A liquid inclusions that are formed by 8 different vRNP complexes, which although sharing the same structure, vary in length, valency, and RNA sequence. In addition, liquid inclusions result from an incompletely understood interactome where vRNPs engage in multiple and distinct intersegment interactions bridging cognate vRNP-Rab11 units on flexible membranes (Chou et al., 2013; Gavazzi et al., 2013; Haralampiev et al., 2020; Le Sage et al., 2020; Shafiuddin & Boon, 2019; Sugita, Sagara, Noda, & Kawaoka, 2013). At present, we lack an in vitro reconstitution system to understand the underlying mechanism governing demixing of vRNP-Rab11a-host membranes from the cytosol. This in vitro system would be useful to explore how the different segments independently modulate the material properties of inclusions, explore if condensates are sites of IAV genome assembly, determine thermodynamic values, thresholds accurately, perform rheological measurements for viscosity and elasticity and validate our findings”.
Reviewer #2 (Public Review):
During Influenza virus infection, newly synthesized viral ribonucleoproteins (vRNPs) form cytosolic condensates, postulated as viral genome assembly sites and having liquid properties. vRNP accumulation in liquid viral inclusions requires its association with the cellular protein Rab11a directly via the viral polymerase subunit PB2. Etibor et al. investigate and compare the contributions of entropy, concentration, and valency/strength/type of interactions, on the properties of the vRNP condensates. For this, they subjected infected cells to the following perturbations: temperature variation (4, 37, and 42{degree sign}C), the concentration of viral inclusion drivers (vRNPs and Rab11a), and the number or strength of interactions between vRNPs using nucleozin a well-characterized vRNP sticker. Lowering the temperature (i.e. decreasing the entropic contribution) leads to a mild growth of condensates that does not significantly impact their stability. Altering the concentration of drivers of IAV inclusions impact their size but not their material properties. The most spectacular effect on condensates was observed using nucleozin. The drug dramatically stabilizes vRNP inclusions acting as a condensate hardener. Using a mouse model of influenza infection, the authors provide evidence that the activity of nucleozin is retained in vivo. Finally, using a mass spectrometry approach, they show that the drug affects vRNP solubility in a Rab11a-dependent manner without altering the host proteome profile.
The data are compelling and support the idea that drugs that affect the material properties of viral condensates could constitute a new family of antiviral molecules as already described for the respiratory syncytial virus (Risso Ballester et al. Nature. 2021).
Nevertheless, there are some limitations in the study. Several of them are mentioned in a dedicated paragraph at the end of a discussion. This includes the heterogeneity of the system (vRNP of different sizes, interactions between viral and cellular partners far from being understood), which is far from equilibrium, and the absence of minimal in vitro systems that would be useful to further characterize the thermodynamic and the material properties of the condensates.
We thank reviewer 2 for highlighting specific details that need improving and raising such interesting questions to validate our findings. We will address all the minor comments of Reviewer 2. To address the comments of Reviewer 2, we propose the actions described in blue below each point raised that is written in italics.
1) The concentrations are mostly evaluated using antibodies. This may be correct for Cdilute. However, measurement of Cdense should be viewed with caution as the antibodies may have some difficulty accessing the inner of the condensates (as already shown in other systems), and this access may depend on some condensate properties (which may evolve along the infection). This might induce artifactual trends in some graphs (as seen in panel 2c), which could, in turn, affect the calculation of some thermodynamic parameters.
The concern of using antibodies to calculate Cdense is valid. We will address this concern by validating our results using a fluorescent tagged virus that has mNeon Green fused to the viral polymerase PA (PA-mNeonGreen PR8 virus). Like NP, PA is a component of vRNPs and labels viral inclusions, colocalising with Rab11 when vRNPs are in the cytosol without the need of using antibodies.
This virus would be the best to evaluate inclusion thermodynamics, where it not an attenuated virus (Figure 1A below) with a delayed infection as demonstrated by the reduced levels of viral proteins (Figure 1B below). Consistently, it shows differences in the accumulation of vRNPs in the cytosol and viral inclusions form later in infection. After their emergence, inclusions behave as in the wild-type virus (PR8-WT), fusing and dividing (Figure 1C below) and displaying liquid properties. The differences in concentration may shift or alter thermodynamic parameters such as time of nucleation, nucleation density, inclusion maturation rate, Cdense, Cdilute. This is the reason why we performed the thermodynamics profiling using antibodies upon PR8-WT infection. For validating our results, and taking into account a possible delayed kinetics, and differenced that may occur because of reduced vRNP accumulation in the cytosol, this virus will be useful and therefore we will repeat the thermodynamics using it.
As a side note, vRNPs are composed of viral RNA coated with several molecules of NP and each vRNP also contains 1 copy of the trimeric RNA dependent RNA polymerase formed by PA, PB1 and PB2. It is well documented that in the cytosol the vast majority of PA (and other components of the polymerase) is in the form of vRNPs (Avilov, Moisy, Munier, et al., 2012; Avilov, Moisy, Naffakh, & Cusack, 2012; Bhagwat et al., 2020; Lakdawala et al., 2014), and thus we can use this virus to label vRNPs on condensates to corroborate our studies using antibodies.
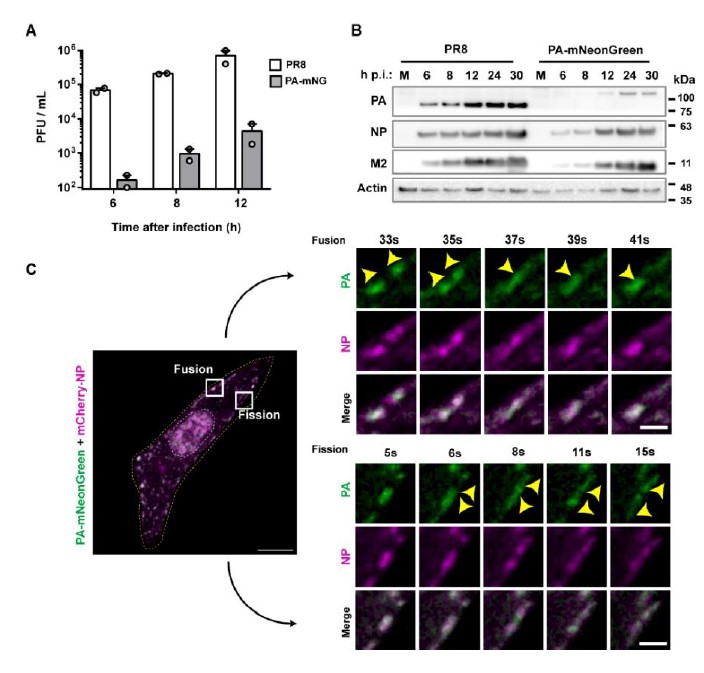
Figure 1 – The PA- mNeonGreen virus is attenuated in comparison to the WT virus. A. Cells (A549) were infected or mock-infected with PR8 WT or PA- mNeonGreen (PA-mNG) viruses, at a multiplicity of infection (MOI) of 3, for the indicated times. Viral production was determined by plaque assay and plotted as plaque forming units (PFU) per milliliter (mL) ± standard error of the mean (SEM). Data are a pool from 2 independent experiments. B. The levels of viral PA, NP and M2 proteins and actin in cell lysates at the indicated time points were determined by western blotting. C. Cells (A549) were transfected with a plasmid encoding mCherry-NP and co-infected with PA-mNeonGreen virus for 16h, at an MOI of 10. Cells were imaged under time-lapse conditions starting at 16 hpi. White boxes highlight vRNPs/viral inclusions in the cytoplasm in the individual frames. The dashed white and yellow lines mark the cell nucleus and the cell periphery, respectively. The yellow arrows indicate the fission/fusion events and movement of vRNPs/ viral inclusions. Bar = 10 µm. Bar in insets = 2 µm.
2) Although the authors have demonstrated that vRNP condensates exhibit several key characteristics of liquid condensates (they fuse and divide, they dissolve upon hypotonic shock or upon incubation with 1,6-hexanediol, FRAP experiments are consistent with a liquid nature), their aspect ratio (with a median above 1.4) is much higher than the aspect ratio observed for other cellular or viral liquid compartments. This is intriguing and might be discussed.
IAV inclusions have been shown to interact with microtubules and the endoplasmic reticulum, that confers movement, and also undergo fusion and fission events. We propose that these interactions and movement impose strength and deform inclusions making them less spherical. To validate this assumption, we compared the aspect ratio of viral inclusions in the absence and presence of nocodazole (that abrogates microtubule-based movement). The data in figure 2 shows that in the presence of nocodazole, the aspect ratio decreases from 1.42±0.36 to 1.26 ±0.17, supporting our assumption.
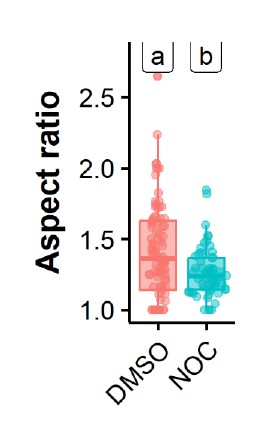
Figure 2 – Treatment with nocodazole reduces the aspect ratio of influenza A virus inclusions. Cells (A549) were infected PR8 WT and treated with nocodazole (10 µg/mL) for 2h time after which the movement of influenza A virus inclusions was captured by live cell imaging. Viral inclusions were segmented, and the aspect ratio measured by imageJ, analysed and plotted in R.
3) Similarly, the fusion event presented at the bottom of figure 3I is dubious. It might as well be an aggregation of condensates without fusion.
We will change this, thank you for the suggestion.
4) The authors could have more systematically performed FRAP/FLAPh experiments on cells expressing fluorescent versions of both NP and Rab11a to investigate the influence of condensate size, time after infection, or global concentrations of Rab11a in the cell (using the total fluorescence of overexpressed GFP-Rab11a as a proxy) on condensate properties.
We will try our best to be able to comply with this suggestion as we think it is important.
Reviewer #3 (Public Review):
This study aims to define the factors that regulate the material properties of the viral inclusion bodies of influenza A virus (IAV). In a cellular model, it shows that the material properties were not affected by lowering the temperature nor by altering the concentration of the factors that drive their formation. Impressively, the study shows that IAV inclusions may be hardened by targeting vRNP interactions via the known pharmacological modulator (also an IAV antiviral), nucleozin, both in vitro and in vivo. The study employs current state-of-the-art methodology in both influenza virology and condensate biology, and the conclusions are well-supported by data and proper data analysis. This study is an important starting point for understanding how to pharmacologically modulate the material properties of IAV viral inclusion bodies.
We thank this reviewer for all the positive comments. We will address the minor issues brought to our attention entirely, including changing the tittle of the manuscript and we will investigate the formation and material properties of IAV inclusions in the presence and absence of nucleozin for the nucleozin escape mutant NP-Y289H.
References
Avilov, S. V., Moisy, D., Munier, S., Schraidt, O., Naffakh, N., & Cusack, S. (2012). Replication- competent influenza A virus that encodes a split-green fluorescent protein-tagged PB2 polymerase subunit allows live-cell imaging of the virus life cycle. J Virol, 86(3), 1433- 1448. doi:10.1128/JVI.05820-11
Avilov, S. V., Moisy, D., Naffakh, N., & Cusack, S. (2012). Influenza A virus progeny vRNP trafficking in live infected cells studied with the virus-encoded fluorescently tagged PB2 protein. Vaccine, 30(51), 7411-7417. doi:10.1016/j.vaccine.2012.09.077
Bhagwat, A. R., Le Sage, V., Nturibi, E., Kulej, K., Jones, J., Guo, M., . . . Lakdawala, S. S. (2020). Quantitative live cell imaging reveals influenza virus manipulation of Rab11A transport through reduced dynein association. Nat Commun, 11(1), 23. doi:10.1038/s41467-019-13838-3
Chou, Y. Y., Heaton, N. S., Gao, Q., Palese, P., Singer, R. H., & Lionnet, T. (2013). Colocalization of different influenza viral RNA segments in the cytoplasm before viral budding as shown by single-molecule sensitivity FISH analysis. PLoS Pathog, 9(5), e1003358. doi:10.1371/journal.ppat.1003358
Gavazzi, C., Yver, M., Isel, C., Smyth, R. P., Rosa-Calatrava, M., Lina, B., . . . Marquet, R. (2013). A functional sequence-specific interaction between influenza A virus genomic RNA segments. Proc Natl Acad Sci U S A, 110(41), 16604-16609. doi:10.1073/pnas.1314419110
Haralampiev, I., Prisner, S., Nitzan, M., Schade, M., Jolmes, F., Schreiber, M., . . . Herrmann, A. (2020). Selective flexible packaging pathways of the segmented genome of influenza A virus. Nat Commun, 11(1), 4355. doi:10.1038/s41467-020-18108-1
Klosin, A., Oltsch, F., Harmon, T., Honigmann, A., Julicher, F., Hyman, A. A., & Zechner, C. (2020). Phase separation provides a mechanism to reduce noise in cells. Science, 367(6476), 464-468. doi:10.1126/science.aav6691
Lakdawala, S. S., Wu, Y., Wawrzusin, P., Kabat, J., Broadbent, A. J., Lamirande, E. W., . . . Subbarao, K. (2014). Influenza a virus assembly intermediates fuse in the cytoplasm. PLoS Pathog, 10(3), e1003971. doi:10.1371/journal.ppat.1003971
Le Sage, V., Kanarek, J. P., Snyder, D. J., Cooper, V. S., Lakdawala, S. S., & Lee, N. (2020). Mapping of Influenza Virus RNA-RNA Interactions Reveals a Flexible Network. Cell Rep, 31(13), 107823. doi:10.1016/j.celrep.2020.107823
Riback, J. A., Zhu, L., Ferrolino, M. C., Tolbert, M., Mitrea, D. M., Sanders, D. W., . . . Brangwynne, C. P. (2020). Composition-dependent thermodynamics of intracellular phase separation. Nature, 581(7807), 209-214. doi:10.1038/s41586-020-2256-2
Shafiuddin, M., & Boon, A. C. M. (2019). RNA Sequence Features Are at the Core of Influenza a Virus Genome Packaging. J Mol Biol. doi:10.1016/j.jmb.2019.03.018
Sugita, Y., Sagara, H., Noda, T., & Kawaoka, Y. (2013). Configuration of viral ribonucleoprotein complexes within the influenza A virion. J Virol, 87(23), 12879- 12884. doi:10.1128/JVI.02096-13
-
-
www.biorxiv.org www.biorxiv.org
-
Author Response
Reviewer #1 (Public Review):
The study by Akter et al demonstrates that astrocyte-derived L-lactate plays a key role in schema memory formation and promotes mitochondrial biogenesis in the Anterior Cingulate Cortex (ACC).
The main tool used by the authors is the DREADD technology that allows to pharmacologically activate receptors in a cell-specific manner. In the study, the authors used the DREADD technique to activate appropriately transfected astrocytes, a subtype of muscarinic receptor that is not normally present in cells. This receptor being coupled to a Gi-mediated signal transduction pathway inhibiting cAMP formation, the authors could demonstrate cell-(astrocyte) specific decreases in cAMP levels that result in decreased L-lactate production by astrocytes.
Behaviorally this pharmacological manipulation results in impairments of schema memory formation and retrieval in the ACC in flavor-place paired associate paradigms. Such impairments are prevented by co-administration of L-lactate.
The authors also show that activation of Gi signaling resulting in L-lactate decreased release by astrocytes impairs mitochondrial biogenesis in neurons in an L-lactate reversible manner.
By using MCT 2 inhibitors and an NMDAR antagonist the authors conclude that the molecular mechanisms underlying the observed effects are mediated by L-lactate entering neurons through MCT2 transporters and involve NMDAR.
Overall, the article's conclusions are warranted by the experimental evidence, but some weak points could be addressed which would make the conclusions even stronger.
The number of animals in some of the experiments is on the low side (4 to 6).
In the revised manuscript, we have increased the animal numbers in two key experimental groups (hM4Di-CNO and Control groups) of behavioral experiments. Now the animal numbers in different groups are as follows:
• 15 rats in hM4Di-CNO group
o Further divided into two subgroups for probe tests (PT1-4) conducted during flavor-place paired associate training; 8 rats in the hM4Di-CNO (saline) and 7 rats in the hM4Di-CNO (CNO) subgroups receiving I.P. saline or I.P. CNO, respectively, before these PTs.
• 8 rats in the Control group
• 7 rats in the Rescue group (hM4Di-CNO+L-lactate)
• 4 rats in the Control-CNO group. Animal number in this group was not increased as it was apparent from these 4 rats that CNO alone was not impairing the PA learning and memory retrieval in these rats (AAV8-GFAP-mCherry injected). Their result was very similar to the control group. Additionally, in a previous study (Liu et al., 2022), we showed that CNO administration in the rats injected with AAV8-GFAP-mCherry into the hippocampus does not show any impairments in schema.
Also, in the newly added open field test experiments to investigate the locomotor activity as suggested by the Reviewer #2, 8 rats were used in each group.
The use of CIN to inhibit MCT2 is not optimal. Authors may want to decrease MCT2 expression by using antisense oligonucleotides.
In the revised manuscript, we have conducted the experiment using MCT2 antisense oligodeoxynucleotide (ODN) as suggested.
To test whether the L-lactate-induced neuronal mitochondrial biogenesis is dependent on MCT2, we bilaterally injected MCT2 antisense oligodeoxynucleotide (MCT2-ODN, n=8 rats, 2 nmol in 1 μl PBS per ACC) or scrambled ODN (SC-ODN, n=8 rats, 2 nmol in 1 μl PBS per ACC) into the ACC. After 11 hours, bilateral infusion of L-lactate (10 nmol, 1 μl) or ACSF (1 μl) was given into the ACC and the rats were kept in the PA event arena. After 60 mins (12 hours from MCT2-ODN or SC-ODN administration), the rats were sacrificed. As shown in Author response image 1B, SC-ODN+L-lactate group showed significantly increased relative mtDNA copy number compared to the SC-ODN+ACSF group (p<0.001, ANOVA followed by Tukey's multiple comparisons test). However, this effect was completely abolished in MCT2-ODN+L-lactate group, suggesting that MCT2 is required for the L-lactate-induced mitochondrial biogenesis in the ACC.
We have integrated this new data and results in the revised manuscript.
Author response image 1.
Mitochondrial biogenesis by L-lactate is dependent on MCT2 and NMDAR. A. Experimental design to investigate whether MCT2 and NMDAR activity are required for L-lactate-induced mitochondrial biogenesis. B and C. mtDNA copy number abundance in the ACC of different rat groups relative to nDNA. Data shown as mean ± SD (n=4 rats in each group). ***p<0.001, ANOVA followed by Tukey's multiple comparisons test.
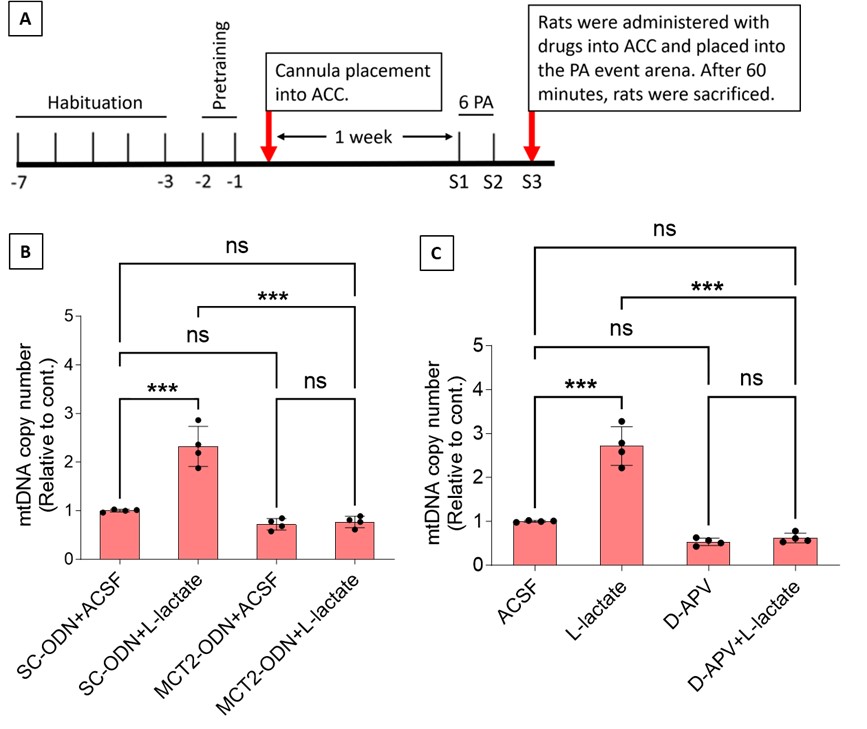
The experiment using AVP to block NMDAR only partially supports the conclusions. Indeed, blocking NMDAR will knock down any response that involves these receptors, whether L-lactate is necessary or not.
In the current study we found that Astrocytic Gi activation in the ACC reduced L-lactate level in the ECF of ACC which was also associated with decreased PGC-1α/SIRT3/ATPB/mtDNA abundance suggesting downregulation of mitochondrial biogenesis pathway. We also found that exogenous administration of L-lactate into the ACC of astrocytic Gi-activated rats rescued this downregulation. In line with this, in a recently published study (Akter et al., 2023), we found upregulation of mitochondrial biogenesis pathway in the hippocampus neurons of exogenous L-lactate-treated anesthetized rats. Another recent study has demonstrated that exercise-induced L-lactate release from skeletal muscle or I.P. injection of L-lactate can induce hippocampal PGC-1α (which is a master regulator of mitochondrial biogenesis) expression and mitochondrial biogenesis in mice (Park et al., 2021). Together, these results provide compelling evidence that L-lactate promotes mitochondrial biogenesis.
L-lactate is known to promote expression of synaptic plasticity genes like Arc, c-Fos, and Zif268 in neurons (Yang et al., 2014). After entry into the neuronal cytoplasm, mainly through MCT2, it is converted into pyruvate by lactate dehydrogenase 1 (LDH1). This conversion also produces NADH, affecting the redox state of the neuron. NADH positively modulates the activity of NMDAR resulting in enhanced Ca2+ currents, the activation of intracellular signaling cascades, and the induction of the expression of plasticity-associated genes (Yang et al., 2014; Magistretti & Allaman, 2018). The study demonstrated that L-lactate–induced plasticity gene expression was abolished in the presence of NMDAR antagonists including D-APV (Yang et al., 2014). These results suggested that the MCT2 and NMDAR are key players in the regulation of L-lactate induced plasticity gene expression.
In the current study, we investigated whether similar mechanisms might be involved in L-lactate-induced neuronal mitochondrial biogenesis. We now used MCT2 antisense oligodeoxynucleotide to decrease the expression of MCT2 (as mentioned in the previous response and Author response image 1B) and showed that MCT2 is necessary for L-lactate-induced mitochondrial biogenesis to manifest, indicating that L-lactate’s entry into the neuron is required. As mentioned before, after entry into neuron, L-lactate is converted into pyruvate by LDH, which also produce NADH, which in turn potentiates NMDAR activity. Therefore, we investigated whether NMDAR activity is required for L-lactate-induced mitochondrial biogenesis. We used D-APV to inhibit NMDAR (Author response image 1C) and found that L-lactate does not increase mtDNA copy number abundance if D-APV is given, suggesting that NMDAR activity is required for L-lactate to promote mitochondrial biogenesis.
NMDAR serves diverse functions. Therefore, as mentioned by the reviewer, blocking NMDAR may knock down many such functions. While our current data only suggests the involvement of MCT2 and NMDAR in the upregulation of mitochondrial biogenesis by L-lactate, we have not investigated other mechanisms and pathways modulating mitochondrial biogenesis that are either dependent or independent of MCT2 and NMDAR activity. Further studies are needed in future to dissect and better understand this interesting observation. We have now clarified this in the discussion section of the manuscript.
Is inhibition of glycogenolysis involved in the observed effects mediated by Gi signaling? Indeed, L-lactate is formed both by glycolysis and glycogenolysis. The authors could test whether the glycogen metabolism-inhibiting drug DAB would mimic the effects of Gi activation.
In this study we have shown that astrocytic Gi activation in the ACC leads to a decrease in the cAMP and L-lactate. L-lactate is produced by glycogenolysis and glycolysis. cAMP in astrocytes acts as a trigger for L-lactate production (Choi et al., 2012; Horvat, Muhič, et al., 2021; Horvat, Zorec, et al., 2021; Zhou et al., 2021) by promoting glycogenolysis and glycolysis (Vardjan et al., 2018; Horvat, Muhič, et al., 2021; Horvat, Zorec, et al., 2021). Therefore, one promising explanation of reduced L-lactate level observed in our study is the reduction of L-lactate production in the astrocyte due to decreased glycogen metabolism as a result of decreased cAMP. We have now mentioned this in the discussion.
DAB is an inhibitor of glycogen phosphorylase that suppresses L-lactate production. It was shown to impair memory by decreasing L-lactate (Newman et al., 2011; Suzuki et al., 2011; Iqbal et al., 2023). As we found that the impairment in the schema memory and mitochondrial biogenesis was associated with decreased L-lactate level in the ACC and that the exogenous L-lactate administration can rescue the impairments, it is likely that DAB will mimic the effect of Gi activation in terms of schema memory and mitochondrial biogenesis. However, further study is needed to confirm this.
Reviewer #2 (Public Review):
The manuscript of Akter et al is an important study that investigates the role of astrocytic Gi signaling in the anterior cingulate cortex in the modulation of extracellular L-lactate level and consequently impairment in flavor-place associates (PA) learning. However, whereas some of the behavioral observations and signaling mechanism data are compelling, the conclusions about the effect on memory are inadequate as they rely on an experimental design that does not allow to differentiate acute or learning effect from the effect outlasting pharmacological treatments, i.e. effect on memory retention. With the addition of a few experiments, this paper would be of interest to the larger group of researchers interested in neuron-glia interactions during complex behavior.
• Largely, I agree with the authors' conclusion that activating Gi signaling in astrocytes impairs PA learning, however, the effect on memory retrieval is not that obvious. All behavioral and molecular signaling effects described in this study are obtained with the continuous presence of CNO, therefore it is not possible to exclude the acute effect of Gi pathway activation in astrocytes. What will happen with memory on retrieval test when CNO is omitted selectively during early, middle, or late session blocks of PA learning?
We have now added 8 more rats to the hM4Di-CNO group (i.e., the group with astrocytic Gi activation) to clarify the memory retrieval. These rats underwent flavor-place paired associate (PA) training similar to the previously described rats (n=7) of this group, that is they received CNO 30 minutes before and 30 minutes after the PA training sessions (S1-2, S4-8, S10-17). However, contrasting to the previous rats of this group which received CNO before PTs (PT1, PT2, PT3), we omitted the CNO (instead administered I.P. saline) selectively on these PTs conducted at the early, middle, and late stage of PA training, as suggested by the reviewer. These newly added rats did not show memory retrieval in these PTs, suggesting that the rats were not learning the PAs from the PA training sessions. See Author response image 2C-E, where this subgroup is denoted as hM4Di-CNO (Saline).
We then continued more PA training sessions (S21 onwards, Author response image 2B) for these rats without CNO. They gradually learned the PAs. PTs (PT5, PT6, PT7; Author response image 2G-I) were done during this continuation phase of PA training; once without CNO (i.e., with I.P. saline instead), and another one with CNO. As seen in the Author response image 2H and 2I, they retrieved the memory when PT6 and PT7 were done without CNO. However, if these PTs were done with CNO, they could not retrieve the memory. Together these results suggest that ACC astrocytic Gi activation by CNO during PT can impair memory retrieval in rats which have already learned the PAs.
As shown in the Author response image 2B, we replaced two original PAs with two new PAs (NPA 9 and 10) at S34. This was followed by PT8 (S35). As seen in Author response image 2J, these rats retrieved the NPA memory if the PT is done without CNO. However, they could not retrieve the NPA memory if the PT was done with CNO. This result suggests that ACC astrocytic Gi activation by CNO during PT can impair NPA memory retrieval.
In summary, these data show that astrocytic Gi activation in the ACC can impair PA memory retrieval. We have integrated this new data and results in the revised manuscript.
Author response image 2.
A. PI (mean ± SD) during the acquisition of the six original PAs (OPAs) (S1-2, 4-8, 10-17) and new PAs (NPAs) (S19) of the control (n=8), hM4Di-CNO (n=15), and rescue (hM4Di-CNO+L-lactate) (n=7) groups. From S6 onwards, hM4Di-CNO group consistently showed lower PI compared to control. However, concurrent L-lactate administration into the ACC (rescue group) can rescue this impairment. B. PI (mean ± SD) of hM4Di-CNO group (n=8) from S21 onwards showing gradual increase in PI when CNO was withdrawn. C, D, and E. Non-rewarded PTs (PT1, PT2, and PT3 conducted on S3, S9, and S18, respectively) to test memory retrieval of OPAs for the control, hM4Di-CNO, and rescue groups. The percentage of digging time at the cued location relative to that at the non-cued locations are shown (mean ± SD). In both PT2 and PT3, the control group spent significantly more time digging the cued sand well above the chance level, indicating that the rats learned OPAs and could retrieve it. Contrasting to this, hM4Di-CNO group did not spend more time digging the cued sand well above the chance level irrespective of CNO administration before the PTs. The rescue group showed results similar to the hM4Di-CNO group if CNO is given without L-lactate. On the other hand, they showed results similar to the control group if L-lactate is concurrently given with CNO, indicating that this group learned OPAs and could retrieve it. p < 0.05, p < 0.01, p < 0.001, one-sample t-test comparing the proportion of digging time at the cued sand well with the chance level of 16.67%. F. Non-rewarded PT4 (S20) which was conducted after replacing two OPAs with two NPAs (NPA 7 & 8) in S19 for the control, hM4Di-CNO, and rescue groups. Results show that the control group spent significantly more time digging the new cued sand well above the chance level indicating that the rats learned the NPAs from S19 and could retrieve it in this PT. Contrasting to this, hM4Di-CNO group did not spend more time digging the new-cued sand well above the chance level irrespective of CNO administration before the PT. The rescue group showed results similar to the hM4Di-CNO group if CNO is given without L-lactate. On the other hand, they showed results similar to the control group if L-lactate is concurrently given with CNO indicating that this group learned NPAs from S19 and could retrieve it. p < 0.001, one-sample t-test comparing the proportion of digging time at the new cued sand well with the chance level of 16.67%. G, H, and I. Non-rewarded PTs (PT5, PT6, and PT7 conducted on S23, S27, and S33, respectively) to test memory retrieval of OPAs for the hM4Di-CNO group. In both PT6 and PT7, the rats spent significantly more time digging the cued sand well above the chance level if the tests are done without CNO, indicating that the rats learned the OPAs and could retrieve it. However, CNO prevented memory retrieval during these PTs. p < 0.001, one-sample t-test comparing the proportion of digging time at the cued sand well with the chance level of 16.67%. J. Non-rewarded PT4 (S35) which was conducted after replacing two OPAs with two NPAs (NPA 9 & 10) in S34 for the hM4Di-CNO group. Results show that the rats spent significantly more time digging the new cued sand well above the chance level if CNO was not given before the PT, indicating that the rats learned the NPAs from S34 and could retrieve it in this PT. However, if CNO is given before the PT, the retrieval is impaired. *p < 0.001, one-sample t-test comparing the proportion of digging time at the new cued sand well with the chance level of 16.67%.
• I found it truly exciting that the administration of exogenous L-lactate is capable to rescue CNO-induced PA learning impairment, when co-applied. Would it be possible that this treatment has a sensitivity to a particular stage of learning (acquisition, consolidation, or memory retrieval) when L-lactate administration would be the most efficacious?
The hM4Di-CNO group, when continued with PA training without CNO (S21-S32) (Author response image 2B), was able to learn the six original PAs (OPAs). In the PT7 done at S33 (Author response image 2I), this group of rats was able to retrieve the memory if the test was done without CNO but could not retrieve the memory if CNO was given. Similarly, the Rescue group (hM4Di-CNO+L-lactate) (Author response image 2A), which received both CNO and L-lactate during PA training sessions (S1-S17), they were able to learn the OPAs. And at PT3 done at S18 (Author response image 2E), these rats were able to retrieve the memory when the test was done with CNO+L-lactate but not if the test is done with only CNO. Together, these results clearly show that ACC astrocytic Gi activation with CNO impairs memory retrieval and exogenous L-lactate can rescue the impairment. Therefore, it can be concluded that the memory retrieval is sensitive to L-lactate.
The PA learning is hippocampus-dependent. Over the course of repeated PA training, systems consolidation occurs in the ACC, after which the already learned PA memory (schema) becomes hippocampus-independent (Tse et al., 2007; Tse et al., 2011). A higher activation (indicated by expression of c-Fos) in the hippocampus relative to the ACC during the early period of schema development, and the reverse at the late stage was observed in our previous study (Liu et al., 2022). However, rapid assimilation of new PA into the ACC requires simultaneous activation/retrieval of previous schema from ACC and hippocampus dependent new PA learning (Tse et al., 2007; Tse et al., 2011). During new PA learning, increase of c-Fos neurons in both CA1 and ACC was detected (Liu et al., 2022).
Our hM4Di-CNO group received CNO 30 mins before and after each PA training session in S1-S17 (Author response image 2A). Also, the Rescue group similarly received CNO+L-lactate before and after each PA training session in S1-S17. Therefore, while this study design allowed us to conclude that ACC astrocytic Gi activation impairs PA learning and that exogenous L-lactate can rescue the impairment, it does not allow clear differentiation of the effects of these treatments on memory acquisition and consolidation. Further studies are needed to investigate this.
• The hypothesis that observed learning impairments could be associated with diminished mitochondrial biogenesis caused by decreased l-lactate in the result of astrocytic Gi-DREADDS stimulation is very appealing, but a few key pieces of evidence are missing. So far, the hypothesis is supported by experiments demonstrating reduced expression of several components of mitochondrial membrane ATP synthase and a decrease in relative mtDNA copy numbers in ACC of rats injected with Gi-DREADDs. L-lactate injections into ACC restored and even further increased the expression of the above-mentioned markers. Co-administration of NMDAR antagonist D-APV or MCT-2 (mostly neuronal) blocker 4-CIN with L-lactate, prevented L-lactate-induced increase in relative mtDNA copy. I am wondering how the interference with mitochondrial biogenesis is affecting neuronal physiology and if it would result in impaired PA learning or schema memory.
The observation of diminished mitochondrial biogenesis in the astrocytic Gi-activated rats that showed impaired PA learning is exciting. However, our study does not provide experimental data on how mitochondrial biogenesis could be associated with impaired PA learning and schema memory. Results from several previous studies linked mitochondrial biogenesis and its regulators such as PGC-1α and SIRT3 to diverse neuronal and cognitive functions as described in the discussion section of the manuscript. In the revised manuscript, we have provided further discussion as follows to discuss potential mechanisms:
“In this study, we have demonstrated that ACC astrocytic Gi activation impairs PA learning and schema formation, PA memory retrieval, and NPA learning and retrieval by decreasing L-lactate level in the ACC. Although we have shown that these impairments are associated with diminished expression of proteins of mitochondrial biogenesis, the precise mechanisms of how astrocytic Gi activation affects neuronal functions and schema memory remain to be elucidated. We previously demonstrated that neuronal inhibition in either the hippocampus or the ACC impairs PA learning and schema formation (Hasan et al., 2019). In another recent study (Liu et al., 2022), we showed that astrocytic Gi activation in the CA1 impaired PA training-associated CA1-ACC projecting neuronal activation. Yao et al. recently showed that reduction of astrocytic lactate dehydrogenase A (an enzyme that reversibly catalyze L-lactate production from pyruvate) in the dorsomedial prefrontal cortex reduces L-lactate levels and neuronal firing frequencies, promoting depressive-like behaviors in mice (Yao et al., 2023). These impairments could be rescued by L-lactate infusion. It is possible that the impairment in PA learning and schema observed in our study might have involved a similar functional consequence of reduced neuronal activity in the ACC neurons upon astrocytic Gi activation.
Schema consolidation is associated with synaptic plasticity-related gene expression (such as Zif268, Arc) in the ACC (Tse et al., 2011). L-lactate, after entry into neurons, can be converted to pyruvate during which NADH is also produced, promoting synaptic plasticity-related gene expression by potentiating NMDA signaling in neurons (Yang et al., 2014; Margineanu et al., 2018). Furthermore, L-lactate acts as an energy substrate to fuel learning-induced de novo neuronal translation critical for long-term memory (Descalzi et al., 2019). On the other hand, mitochondria play crucial role in fueling local translation during synaptic plasticity (Rangaraju et al., 2019). Therefore, it could be hypothesized that the rescue of astrocytic Gi activation-mediated impairment of schema by exogenous L-lactate could have been mediated by facilitating synaptic plasticity-related gene expression by directly fueling the protein translation, potentiating NMDA signaling, as well as increasing mitochondrial capacity for ATP production by promoting mitochondrial biogenesis. Furthermore, the potential involvement of HCAR1, a receptor for L-lactate that may regulate neuronal activity (Bozzo et al., 2013; Tang et al., 2014; Herrera-López & Galván, 2018; Abrantes et al., 2019), cannot be excluded. Future research could explore these potential mechanisms, examining the interactions among them, and determining their relative contributions to schema. Our previous study also showed that ACC myelination is necessary for PA learning and schema formation, and that repeated PA training is associated with oligodendrogenesis in the ACC (Hasan et al., 2019). Oligodendrocytes facilitate fast, synchronized, and energy efficient transfer of information by wrapping axons in myelin sheath. Furthermore, they supply axons with glycolysis products, such as L-lactate, to offer metabolic support (Fünfschilling et al., 2012; Lee et al., 2012). The association of oligodendrogenesis and myelination with schema memory may suggest an adaptive response of oligodendrocytes to enhance metabolic support and neuronal energy efficiency during PA learning. Given the impairments in PA learning observed in the ACC astrocytic Gi-activated rats in the current study, it is reasonable to conclude that the direct metabolic support to axons provided by oligodendrocytes is not sufficient to rescue the schema impairments caused by decreased L-lactate levels upon astrocytic Gi activation. On the other hand, L-lactate was shown to be important for oligodendrogenesis and myelination (Sánchez-Abarca et al., 2001; Rinholm et al., 2011; Ichihara et al., 2017). Therefore, it is tempting to speculate that a decrease in L-lactate level may also impede oligodendrogenesis and myelination, consequently preventing the enhanced axonal support provided by oligodendrocytes and myelin during schema learning. Recently, a study has demonstrated that upon demyelination, mitochondria move from the neuronal cell body to the demyelinated axon (Licht-Mayer et al., 2020). Enhancement of this axonal response of mitochondria to demyelination, by targeting mitochondrial biogenesis and mitochondrial transport from the cell body to axon, protects acutely demyelinated axons from degeneration. Given the connection between schema and increased myelination, it remains an open question whether L-lactate-induced mitochondrial biogenesis plays a beneficial role in schema through a similar mechanism. Nevertheless, our results contribute to the mounting evidence of the glial role in cognitive functions and underscores the new paradigm in which glial cells are considered as integral players in cognitive functions alongside neurons. Disruption of neurons, myelin, or astrocytes in the ACC can disrupt PA learning and schema memory.”
Reviewer #3 (Public Review):
Akter et al. investigated how the astroglial Gi signaling pathway in the rat anterior cingulate cortex (ACC) affects cognitive functions, in particular schema memory formation. Using a stereotactic approach they intracranially introduced AAV8 vectors carrying mCherry-tagged hM4Di DREADD (Designer Receptor Exclusively Activated by Designer Drugs) under astrocyte selective GFAP promotor (AAV8-GFAP-hM4Di-mCherry) into the AAC region of the rat brain. hM4Di DREADD is a genetically modified form of the human M4 muscarinic (hM4) receptor insensitive to endogenous acetylcholine but is activated by the inert clozapine metabolite clozapine-N-oxide (CNO), triggering the Gi signaling pathway. The authors confirmed that hM4Di DREADD is selectively expressed in astrocytes after the application of the AAV8 vector by analysing the mCherry signals and immunolabeling of astrocytes and neurons in the ACC region of the rat brain. They activated hM4Di DREADD (Gi signalling) in astrocytes by intraperitoneal administration of CNO and measured cognitive functions in animals after CNO administration. Activation of Gi signaling in astrocytes by CNO application decreased paired-associate (PA) learning, schema formation, and memory retrieval in tested animals. This was associated with a decrease in cAMP in astrocytes and L-lactate in extracellular fluid as measured by immunohistochemistry in situ and in awake rats by microdialysis, respectively. Administration of exogenous L-lactate rescued the astroglial Gi-mediated deficits in PA learning, memory retrieval, and schema formation, suggesting that activation of astroglial Gi signalling downregulates L-lactate production in astrocytes and its transport to neurons affecting memory formation. Authors also show that expression level of proteins involved in mitochondrial biogenesis, which is associated with cognitive functions, is decreased in neurons, when Gi signalling is activated in astrocytes, and rescued when exogenous L-lactate is applied, suggesting the implication of astrocyte-derived L-lactate in the maintenance of mitochondrial biogenesis in neurons. The latter depended on lactate MCT2 transporter activity and glutamate NMDA receptor activity.
The paper is very well written and discussed. The conclusions of this paper are well supported by the data. Although this is a study that uses established and previously published methodologies, it provides new insights into L-lactate signalling in the brain, particularly in AAC, and further confirms the role of astroglial L-lactate in learning and memory formation. It also raises new questions about the molecular mechanisms underlying astrocyte-derived L-lactate-mediated mitochondrial biogenesis in neurons and its contribution to schema memory formation.
• The authors discuss astrocytic L-lactate signalling without considering the recently discovered L-lactate-sensitive Gs and Gi protein-coupled receptors in the brain, which are present in both astrocytes and neurons. The use of nonendogenous L-lactate receptor agonists (Compound 2, 3-chloro-5-hydroxybenzoic acid) would clarify the implication of L-lactate receptor signalling in schema memory formation.
In the revised manuscript, we have included this point in the discussion section to mention the potential role of HCAR1 in schema memory as follows:
“Schema consolidation is associated with synaptic plasticity-related gene expression (such as Zif268, Arc) in the ACC (Tse et al., 2011). L-lactate, after entry into neurons, can be converted to pyruvate during which NADH is also produced, promoting synaptic plasticity-related gene expression by potentiating NMDA signaling in neurons (Yang et al., 2014; Margineanu et al., 2018). Furthermore, L-lactate acts as an energy substrate to fuel learning-induced de novo neuronal translation critical for long-term memory (Descalzi et al., 2019). On the other hand, mitochondria play crucial role in fueling local translation during synaptic plasticity (Rangaraju et al., 2019). Therefore, it could be hypothesized that the rescue of astrocytic Gi activation-mediated impairment of schema by exogenous L-lactate could have been mediated by facilitating synaptic plasticity-related gene expression by directly fueling the protein translation, potentiating NMDA signaling, as well as increasing mitochondrial capacity for ATP production by promoting mitochondrial biogenesis. Furthermore, the potential involvement of HCAR1, a receptor for L-lactate that may regulate neuronal activity (Bozzo et al., 2013; Tang et al., 2014; Herrera-López & Galván, 2018; Abrantes et al., 2019), cannot be excluded. Future research could explore these potential mechanisms, examining the interactions among them, and determining their relative contributions to schema.”
• The use of control animals transduced with an "empty" AAV9 vector (AAV8-GFAP-mCherry) compared with animals transduced with AAV8-GFAP-hM4Di-mCherry throughout the study would strengthen the results of this study, since transfection itself, as well as overexpression of the mCherry protein, may affect cell function.
We thank the reviewer for pointing this. The schema experiment includes a control group (Control-CNO group) of rats injected with AAV8-GFAP-mCherry bilaterally into the ACC. As shown in Author response image 3, after habituation and pretraining, these rats were trained for PA learning similarly to the other groups. Before 30 mins and after 30 mins of each PA training session, they received I.P. CNO. The PA learning, schema formation, memory retrieval, NPA learning and retrieval, and latency (time needed to commence digging at the correct well) were similar to the control group of rats. This result is consistent with our previous study where rats bilaterally injected with AAV8-GFAP-mCherry into CA1 of hippocampus did not show impairments in PA learning and schema formation upon CNO treatment (Liu et al., 2022).
Author response image 3.
A. PI (mean ± SD) during the acquisition of the original six PAs (OPAs) (S1-2, 4-8, 10-17) and new PAs (NPAs) (S19) of the control (n=6) and control-CNO (n=4) groups. B. Non-rewarded PTs (PT1, PT2, and PT3 done on S3, S9, and S18, respectively) to test memory retrieval of OPAs for the control-CNO group. C. Non-rewarded PT4 (S20) which was done after replacing two OPAs with two NPAs (NPA 7 & 8) in S19 for the control-CNO group. D. Latency (in seconds) before commencing digging at the correct well for control and control-CNO groups. Data shown as mean ± SD.
References
Abrantes, H. d. C., Briquet, M., Schmuziger, C., Restivo, L., Puyal, J., Rosenberg, N., Rocher, A.-B., Offermanns, S., & Chatton, J.-Y. (2019). The Lactate Receptor HCAR1 Modulates Neuronal Network Activity through the Activation of Gα and Gβγ Subunits. The Journal of Neuroscience, 39(23), 4422-4433. https://doi.org/10.1523/jneurosci.2092-18.2019
Akter, M., Ma, H., Hasan, M., Karim, A., Zhu, X., Zhang, L., & Li, Y. (2023). Exogenous L-lactate administration in rat hippocampus increases expression of key regulators of mitochondrial biogenesis and antioxidant defense [Original Research]. Frontiers in Molecular Neuroscience, 16. https://doi.org/10.3389/fnmol.2023.1117146
Bozzo, L., Puyal, J., & Chatton, J.-Y. (2013). Lactate Modulates the Activity of Primary Cortical Neurons through a Receptor-Mediated Pathway. PLoS One, 8(8), e71721. https://doi.org/10.1371/journal.pone.0071721
Choi, H. B., Gordon, G. R., Zhou, N., Tai, C., Rungta, R. L., Martinez, J., Milner, T. A., Ryu, J. K., McLarnon, J. G., Tresguerres, M., Levin, L. R., Buck, J., & MacVicar, B. A. (2012). Metabolic communication between astrocytes and neurons via bicarbonate-responsive soluble adenylyl cyclase. Neuron, 75(6), 1094-1104. https://doi.org/10.1016/j.neuron.2012.08.032
Covelo, A., Eraso-Pichot, A., Fernández-Moncada, I., Serrat, R., & Marsicano, G. (2021). CB1R-dependent regulation of astrocyte physiology and astrocyte-neuron interactions. Neuropharmacology, 195, 108678. https://doi.org/https://doi.org/10.1016/j.neuropharm.2021.108678
Descalzi, G., Gao, V., Steinman, M. Q., Suzuki, A., & Alberini, C. M. (2019). Lactate from astrocytes fuels learning-induced mRNA translation in excitatory and inhibitory neurons. Communications Biology, 2(1), 247. https://doi.org/10.1038/s42003-019-0495-2
Endo, F., Kasai, A., Soto, J. S., Yu, X., Qu, Z., Hashimoto, H., Gradinaru, V., Kawaguchi, R., & Khakh, B. S. (2022). Molecular basis of astrocyte diversity and morphology across the CNS in health and disease. Science, 378(6619), eadc9020. https://doi.org/10.1126/science.adc9020
Fünfschilling, U., Supplie, L. M., Mahad, D., Boretius, S., Saab, A. S., Edgar, J., Brinkmann, B. G., Kassmann, C. M., Tzvetanova, I. D., Möbius, W., Diaz, F., Meijer, D., Suter, U., Hamprecht, B., Sereda, M. W., Moraes, C. T., Frahm, J., Goebbels, S., & Nave, K.-A. (2012). Glycolytic oligodendrocytes maintain myelin and long-term axonal integrity. Nature, 485(7399), 517-521. https://doi.org/10.1038/nature11007
Harris, R. A., Lone, A., Lim, H., Martinez, F., Frame, A. K., Scholl, T. J., & Cumming, R. C. (2019). Aerobic Glycolysis Is Required for Spatial Memory Acquisition But Not Memory Retrieval in Mice. eNeuro, 6(1). https://doi.org/10.1523/ENEURO.0389-18.2019
Hasan, M., Kanna, M. S., Jun, W., Ramkrishnan, A. S., Iqbal, Z., Lee, Y., & Li, Y. (2019). Schema-like learning and memory consolidation acting through myelination. FASEB J, 33(11), 11758-11775. https://doi.org/10.1096/fj.201900910R
Herrera-López, G., & Galván, E. J. (2018). Modulation of hippocampal excitability via the hydroxycarboxylic acid receptor 1. Hippocampus, 28(8), 557-567. https://doi.org/https://doi.org/10.1002/hipo.22958
Horvat, A., Muhič, M., Smolič, T., Begić, E., Zorec, R., Kreft, M., & Vardjan, N. (2021). Ca2+ as the prime trigger of aerobic glycolysis in astrocytes. Cell Calcium, 95, 102368. https://doi.org/https://doi.org/10.1016/j.ceca.2021.102368
Horvat, A., Zorec, R., & Vardjan, N. (2021). Lactate as an Astroglial Signal Augmenting Aerobic Glycolysis and Lipid Metabolism [Review]. Frontiers in Physiology, 12. https://doi.org/10.3389/fphys.2021.735532
Ichihara, Y., Doi, T., Ryu, Y., Nagao, M., Sawada, Y., & Ogata, T. (2017). Oligodendrocyte Progenitor Cells Directly Utilize Lactate for Promoting Cell Cycling and Differentiation. J Cell Physiol, 232(5), 986-995. https://doi.org/10.1002/jcp.25690
Iqbal, Z., Liu, S., Lei, Z., Ramkrishnan, A. S., Akter, M., & Li, Y. (2023). Astrocyte L-Lactate Signaling in the ACC Regulates Visceral Pain Aversive Memory in Rats. Cells, 12(1), 26. https://www.mdpi.com/2073-4409/12/1/26
Jourdain, P., Rothenfusser, K., Ben-Adiba, C., Allaman, I., Marquet, P., & Magistretti, P. J. (2018). Dual action of L-Lactate on the activity of NR2B-containing NMDA receptors: from potentiation to neuroprotection. Sci Rep, 8(1), 13472. https://doi.org/10.1038/s41598-018-31534-y
Kofuji, P., & Araque, A. (2021). G-Protein-Coupled Receptors in Astrocyte-Neuron Communication. Neuroscience, 456, 71-84. https://doi.org/10.1016/j.neuroscience.2020.03.025
Lee, Y., Morrison, B. M., Li, Y., Lengacher, S., Farah, M. H., Hoffman, P. N., Liu, Y., Tsingalia, A., Jin, L., Zhang, P. W., Pellerin, L., Magistretti, P. J., & Rothstein, J. D. (2012). Oligodendroglia metabolically support axons and contribute to neurodegeneration. Nature, 487(7408), 443-448. https://doi.org/10.1038/nature11314
Licht-Mayer, S., Campbell, G. R., Canizares, M., Mehta, A. R., Gane, A. B., McGill, K., Ghosh, A., Fullerton, A., Menezes, N., Dean, J., Dunham, J., Al-Azki, S., Pryce, G., Zandee, S., Zhao, C., Kipp, M., Smith, K. J., Baker, D., Altmann, D., Anderton, S. M., Kap, Y. S., Laman, J. D., Hart, B. A. t., Rodriguez, M., Watzlawick, R., Schwab, J. M., Carter, R., Morton, N., Zagnoni, M., Franklin, R. J. M., Mitchell, R., Fleetwood-Walker, S., Lyons, D. A., Chandran, S., Lassmann, H., Trapp, B. D., & Mahad, D. J. (2020). Enhanced axonal response of mitochondria to demyelination offers neuroprotection: implications for multiple sclerosis. Acta Neuropathologica, 140(2), 143-167. https://doi.org/10.1007/s00401-020-02179-x
Liu, S., Wong, H. Y., Xie, L., Iqbal, Z., Lei, Z., Fu, Z., Lam, Y. Y., Ramkrishnan, A. S., & Li, Y. (2022). Astrocytes in CA1 modulate schema establishment in the hippocampal-cortical neuron network. BMC Biol, 20(1), 250. https://doi.org/10.1186/s12915-022-01445-6
Magistretti, P. J., & Allaman, I. (2018). Lactate in the brain: from metabolic end-product to signalling molecule. Nat Rev Neurosci, 19(4), 235-249. https://doi.org/10.1038/nrn.2018.19
Margineanu, M. B., Mahmood, H., Fiumelli, H., & Magistretti, P. J. (2018). L-Lactate Regulates the Expression of Synaptic Plasticity and Neuroprotection Genes in Cortical Neurons: A Transcriptome Analysis. Front Mol Neurosci, 11, 375. https://doi.org/10.3389/fnmol.2018.00375
Netzahualcoyotzi, C., & Pellerin, L. (2020). Neuronal and astroglial monocarboxylate transporters play key but distinct roles in hippocampus-dependent learning and memory formation. Progress in Neurobiology, 194, 101888. https://doi.org/https://doi.org/10.1016/j.pneurobio.2020.101888
Newman, L. A., Korol, D. L., & Gold, P. E. (2011). Lactate produced by glycogenolysis in astrocytes regulates memory processing. PLoS One, 6(12), e28427. https://doi.org/10.1371/journal.pone.0028427
Park, J., Kim, J., & Mikami, T. (2021). Exercise-Induced Lactate Release Mediates Mitochondrial Biogenesis in the Hippocampus of Mice via Monocarboxylate Transporters. Front Physiol, 12, 736905. https://doi.org/10.3389/fphys.2021.736905
Peterson, S. M., Pack, T. F., & Caron, M. G. (2015). Receptor, Ligand and Transducer Contributions to Dopamine D2 Receptor Functional Selectivity. PLoS One, 10(10), e0141637. https://doi.org/10.1371/journal.pone.0141637
Rangaraju, V., Lauterbach, M., & Schuman, E. M. (2019). Spatially Stable Mitochondrial Compartments Fuel Local Translation during Plasticity. Cell, 176(1), 73-84.e15. https://doi.org/10.1016/j.cell.2018.12.013
Rinholm, J. E., Hamilton, N. B., Kessaris, N., Richardson, W. D., Bergersen, L. H., & Attwell, D. (2011). Regulation of oligodendrocyte development and myelination by glucose and lactate. J Neurosci, 31(2), 538-548. https://doi.org/10.1523/JNEUROSCI.3516-10.2011
Sánchez-Abarca, L. I., Tabernero, A., & Medina, J. M. (2001). Oligodendrocytes use lactate as a source of energy and as a precursor of lipids. Glia, 36(3), 321-329. https://doi.org/10.1002/glia.1119
Suzuki, A., Stern, S. A., Bozdagi, O., Huntley, G. W., Walker, R. H., Magistretti, P. J., & Alberini, C. M. (2011). Astrocyte-neuron lactate transport is required for long-term memory formation. Cell, 144(5), 810-823.
Tang, F., Lane, S., Korsak, A., Paton, J. F. R., Gourine, A. V., Kasparov, S., & Teschemacher, A. G. (2014). Lactate-mediated glia-neuronal signalling in the mammalian brain. Nature Communications, 5(1), 3284. https://doi.org/10.1038/ncomms4284
Tauffenberger, A., Fiumelli, H., Almustafa, S., & Magistretti, P. J. (2019). Lactate and pyruvate promote oxidative stress resistance through hormetic ROS signaling. Cell Death Dis, 10(9), 653. https://doi.org/10.1038/s41419-019-1877-6
Tse, D., Langston, R. F., Kakeyama, M., Bethus, I., Spooner, P. A., Wood, E. R., Witter, M. P., & Morris, R. G. (2007). Schemas and memory consolidation. Science, 316(5821), 76-82. https://doi.org/10.1126/science.1135935
Tse, D., Takeuchi, T., Kakeyama, M., Kajii, Y., Okuno, H., Tohyama, C., Bito, H., & Morris, R. G. (2011). Schema-dependent gene activation and memory encoding in neocortex. Science, 333(6044), 891-895. https://doi.org/10.1126/science.1205274
Vardjan, N., Chowdhury, H. H., Horvat, A., Velebit, J., Malnar, M., Muhič, M., Kreft, M., Krivec, Š. G., Bobnar, S. T., Miš, K., Pirkmajer, S., Offermanns, S., Henriksen, G., Storm-Mathisen, J., Bergersen, L. H., & Zorec, R. (2018). Enhancement of Astroglial Aerobic Glycolysis by Extracellular Lactate-Mediated Increase in cAMP [Original Research]. Frontiers in Molecular Neuroscience, 11. https://doi.org/10.3389/fnmol.2018.00148
Vezzoli, E., Cali, C., De Roo, M., Ponzoni, L., Sogne, E., Gagnon, N., Francolini, M., Braida, D., Sala, M., Muller, D., Falqui, A., & Magistretti, P. J. (2020). Ultrastructural Evidence for a Role of Astrocytes and Glycogen-Derived Lactate in Learning-Dependent Synaptic Stabilization. Cereb Cortex, 30(4), 2114-2127. https://doi.org/10.1093/cercor/bhz226
Wang, J., Tu, J., Cao, B., Mu, L., Yang, X., Cong, M., Ramkrishnan, A. S., Chan, R. H. M., Wang, L., & Li, Y. (2017). Astrocytic l-Lactate Signaling Facilitates Amygdala-Anterior Cingulate Cortex Synchrony and Decision Making in Rats. Cell Rep, 21(9), 2407-2418. https://doi.org/10.1016/j.celrep.2017.11.012
Yang, J., Ruchti, E., Petit, J. M., Jourdain, P., Grenningloh, G., Allaman, I., & Magistretti, P. J. (2014). Lactate promotes plasticity gene expression by potentiating NMDA signaling in neurons. Proc Natl Acad Sci U S A, 111(33), 12228-12233. https://doi.org/10.1073/pnas.1322912111
Yao, S., Xu, M.-D., Wang, Y., Zhao, S.-T., Wang, J., Chen, G.-F., Chen, W.-B., Liu, J., Huang, G.-B., Sun, W.-J., Zhang, Y.-Y., Hou, H.-L., Li, L., & Sun, X.-D. (2023). Astrocytic lactate dehydrogenase A regulates neuronal excitability and depressive-like behaviors through lactate homeostasis in mice. Nature Communications, 14(1), 729. https://doi.org/10.1038/s41467-023-36209-5
Yu, X., Zhang, R., Wei, C., Gao, Y., Yu, Y., Wang, L., Jiang, J., Zhang, X., Li, J., & Chen, X. (2021). MCT2 overexpression promotes recovery of cognitive function by increasing mitochondrial biogenesis in a rat model of stroke. Anim Cells Syst (Seoul), 25(2), 93-101. https://doi.org/10.1080/19768354.2021.1915379
Zhou, Z., Okamoto, K., Onodera, J., Hiragi, T., Andoh, M., Ikawa, M., Tanaka, K. F., Ikegaya, Y., & Koyama, R. (2021). Astrocytic cAMP modulates memory via synaptic plasticity. Proc Natl Acad Sci U S A, 118(3), e2016584118. https://doi.org/10.1073/pnas.2016584118
Zhu, J., Hu, Z., Han, X., Wang, D., Jiang, Q., Ding, J., Xiao, M., Wang, C., Lu, M., & Hu, G. (2018). Dopamine D2 receptor restricts astrocytic NLRP3 inflammasome activation via enhancing the interaction of β-arrestin2 and NLRP3. Cell Death Differ, 25(11), 2037-2049. https://doi.org/10.1038/s41418-018-0127-2
-