but the communities most affected are often low-income areas that receive little economic benefit from data centers.
It's going to send a lot of them bankrupt, without a second thought.
but the communities most affected are often low-income areas that receive little economic benefit from data centers.
It's going to send a lot of them bankrupt, without a second thought.
These sources must be usedwith caution as they were written by outsiders with their own perspectivesand motivations
While I appreciated the mention of this blurb and other blurbs like it in framing the sources used with their original context for a degree of important consideration and nuance, I feel like this section detailing all this history and data could have been more clear on where this data was coming from specifically. While of course the information overall is a synthesis of colonial and modern study along with the direct words and teachings of indigenous peoples, I think it would have benefitted from making clear what data came from what particular source. It could have perhaps laid out what stemmed from actual indigenous sources and what is being inferred based on a possible outsider perspective, even a step further in laying out the initial colonial assumptions and the subsequent data from indigenous sources that served to refine or correct it. This is a small gripe on my part but I think the article could have done with some further degree of specificity in presenting this historical and cultural data overall.
Written by Aidan Pare
olitics and the New Machine
The core argument
The essay argues that polling has become less reliable at the same time that it has become more powerful, and that this combination distorts democratic politics.
Polls:
increasingly fail to accurately measure public opinion
yet increasingly determine who gets attention, legitimacy, money, debate access, and media coverage
How Trump fits in
The piece opens with Donald Trump claiming he has no pollster and doesn’t tailor his message to polls. Lepore calls this disingenuous:
Trump may not have had a traditional campaign pollster
but his rise depended heavily on polls for visibility and validation
polls got him into debates, dictated stage placement, and fueled media coverage
So Trump is described as “a creature of the Sea of Polls,” not above it
Why modern polls are broken
The article explains in detail why polling has deteriorated:
Response rates used to be 60–90%
Now they’re often in the single digits
Most Americans refuse poll calls, creating non-response bias
Fewer landlines
Cell-phone autodialing is illegal
Internet polls are self-selected and skew younger and more liberal
Mixed-method polling still doesn’t work well
National election polls often rely on ~1,000–2,000 people
Statistical “weighting” tries to fix bias, but the lower the response rate, the shakier the results
Why polls now matter more than ever
Despite being unreliable, polls are used to:
decide who qualifies for debates
determine media attention
shape fundraising and momentum
create “winners” and “losers” long before anyone votes
Fox News using polls to select debate participants is presented as a major example of polling replacing democratic processes.
Historical background
The essay gives a history of polling:
Early “straw polls” by newspapers
The rise of George Gallup in the 1930s
Polling claimed to represent “the will of the people” scientifically
But:
Early polls systematically excluded Black Americans, the poor, and the disenfranchised
Polling mirrored and amplified existing inequalities
What was presented as “public opinion” was often the opinion of a privileged subset
Deeper philosophical critique
Lepore raises a fundamental question:
What if measuring public opinion isn’t good for democracy at all?
Key ideas:
Polls treat public opinion as the sum of individual answers, ignoring how opinions are formed socially
Polls can create opinion rather than measure it
Constant polling shifts politics from deliberation and leadership to reacting to numbers
Bottom line
The piece isn’t just saying “polls are inaccurate.”
It’s saying:
Polls shape reality instead of describing it
They weaken representative democracy
They reward spectacle, momentum, and media attention over governance
And they increasingly substitute statistical artifacts for actual voting
Programming languages (e.g., Python, R, Java) are specially designed languages that attempt to split the difference between how a computer thinks and communicates and how people think and communicate. There are many programming languages, with different specializations and trade-offs.
This makes me think about how AI is going to effect this barrier. It seems like it is on the edge of super user friendly but also extremely computationally expensive. But as technology progresses it might not matter. I would guess that 'coding' languages are only going to become closer and closer to pure english.
When but love's shadows are so rich in joy!
Romeo is filled with hope and longing. He’s clinging to the "shadow" of love because he’s physically separated from Juliet.
Kant certainly thought so, but many have disagreed with him.
I read another article from Britanica on deontology and Kant and it noted that 'Kant’s critics questioned his view that all duties can be derived from a purely formal principle and argued that, in his preoccupation with rational consistency, he neglected the concrete content of moral obligation'. The essential idea was that duties were multifaceted and that meant that judgment must be executed before taking action on any such duty. It is interesting how this form of thinking ended up being heavily critiqued and eventually rejected bby the majority for a deontological way of thinking in the 20th century.
R0:
EDITOR:
The reviewers agree that your manuscript addresses an important topic. They have also raised a number of well-justified concerns and points requiring clarification. I hope that you see these as opportunities to further improve your manuscript such that it may be accepted for publication.
Review Comments to the Author
Please use the space provided to explain your answers to the questions above. You may also include additional comments for the author, including concerns about dual publication, research ethics, or publication ethics. (Please upload your review as an attachment if it exceeds 20,000 characters)
Reviewer #1: The author wrote this manuscript quite well. However, there are some suggestions for improving it better including,
Abstract: The abstract is written well. However, the results showed about self-stigma representing at 49% so this result should be suggested in conclusion as well.
Introduction: The introduction is organised and written well. However, there are some suggestions about referencing that should be revised along with Vancouver style and the journal format, such as (6)(7)(8), should be (6-8) or (Mbuthia et al., 2020) should be a number of reference. Another point, the abbreviation of drug-resistant TB (DR-TB) should be the same with DRTB in table 2 (page 10). Moreover, in terms of objective of the study, it should be written clearly. The author stated in line 98-100 (page 3), but it seems like expected outcomes rather than its objectives.
Methodology: Ethics statement: It is a clear statement, however, the date of approval should be presented as well to ensure the data were collected after approval.
Study population: The author stated that the target population comprised people with TB who were on treatment and were 15 years and above. However, the results showed that there were some participants aged under 15 years (0-14) as well. Thus, the author should revise and make it correct.
Sampling procedures: The author stated that the data were collected in 12 regions, however there were only 11 regions stated in line 139-140.
Sample size: The author showed some details of sample size calculation that met 421 persons (line 147). However, there were only 367 participants recruited to this study which is less than the appropriate sample size calculated. So, the author needs to explain more details about the sample size. It should be 421 as the result of calculation with the appropriate formula. Moreover, if there are sources of the number used to calculate, the reference needed to be stated as well.
Eligibility criteria: In terms of inclusion and exclusion criteria, the author stated that all people with TB aged 15 years and older would be recruited to the research and all people who were below the age of 15 years were excluded. This is the main point that needs to be clarified because in the results, there are some participants aged 0-14 years as stated before. Moreover, in terms of ethics, participants aged less than 18 years cannot sign the consent form by themselves, their parents should sign the consent form. So, the author needs to revise and clarify further.
Data collection tools and procedures: There is no information about the questionnaire well. The questionnaire should be clarified the details, especially the items used to categorise into "no stigma and stigma (binary). If you use only one item, it should not be appropriate to categorise. This is an important point of this study that needs to be explained. As well as, if the questionnaire was conducted by previous researchers, it should be cited correctly. Moreover, the author stated in this part that stigma was assessed using a set of standardised questions rated on a five-point Likert scale (0 = Strongly disagree to 4 = Strongly agree), while, in page 6, the author used (1 = Strongly agree to 5 = Strongly disagree) as well as the data were categorised in to 5 groups staring from 1.00 - 5.00. Please check the details again.
Data analysis: The Cronbach's alpha value needs to be presented with the exact value instead of >=0.70 that it will present the reliability of tools better. Moreover, the author stated in line 181 and table 2 "TB type" but in the conclusion, the author used "treatment type". So, this point needs to be the same. For the binary classification, the author needs to explain more details about how to categorise into 2 groups: no stigma and stigma. In terms of inferential statistics, the binary logistic regression and multiple logistic regression were not used and shown in the results. So, the author needs to revise about this point again.
Results: The sum of percentage, the details in Table 1 & 2 showed the percentage of each variable, which is good. However, the author needs to check the sum of each variable should be 100%. The author may use two decimal points for presenting the percentage. Moreover, some sub-variables which there is no data (0) does not need to present in the table. Please find the details in the attached file.
In table 2, inferential statistics, the author stated in data analysis that binary logistic regression and multiple logistic regression would be used to analyse to identify the predictors. However, in the results, there is no any results based on these statistics. So, the author needs to revise about the statistics stated in data analysis. Moreover, about chi-square, the author needs to check the assumption of chi-square because No cell should have an expected frequency < 1, and at least 80% of cells should have expected frequencies of 5 or more. So, if it does not meet the assumption, its results might be wrong.
Aged 0-14, the author stated in the methodology that the participants need to be 15 years or over. So, please check the data again.
Some words should be changed for example in line 213 from prevented to obstructed. Moreover, about abbreviation "DSTB and DRTB", for DSTB, the author did not state before so it needs to be mentioned in previous part first before using in this part. As well as, DRTB, the author used DR-TB in line 79 so it needs to be the same, with or without -.
Discussion: The author wrote this part quite well, however, the author needs to check about the number of percentage presented in this part again. Moreover, citation should be revise and rewrite following the format.
References: In terms of references, the author should check the format of Vancouver style referencing in both in-cited and references part again. As well as, the author needs to check the format along with the journal format. For example, (xx) to [xx]. Please revise and rewrite following the formats.
Reviewer #2: Please see my report. I think the manuscript transition from a dissertation to a paper is incomplete. Please review my report for details. I raise concerns regarding the sampling, statistical analysis and the conclusions made regarding the results.
Reviewer #3: This cross-sectional study tackles an important global health problem, TB-related stigma among people with TB. This study has significant merits including 367 people living with tuberculosis sampled over one year; and captures various contexts, specifically 180 health facilities across 11counties aiming for a nationally representative survey of TB-related stigma in Kenya. Two hundred and twenty-eight patients provided information regarding TB-related stigma, of whom 24 reported experiencing TB-related stigma.
Several areas remain unclear to me and require further clarification, elaboration or consideration for reformatting.
The referencing style used is inconsistent. e.g. introduction section lines 60-61(Mbuthia et al. 2020), whereas other areas have a different style that is numbered. Consider reformatting for consistency.
Previous research on TB-related stigma measurement and its implications to TB related outcomes in the Kenyan context has not been highlighted.
Ethics statement section could be aligned for consistent formatting with other text sections of the manuscript.
The sample size calculation could be further clarified for the readers to judge its robustness. a. Is there a proportion of TB-related stigma assumed from a previous study? b. What is the rationale of a 90% response rate? – Lines 147 to 150. c. What was the actual response rate?
From the manuscript, the sample size calculated was 421 TB patients, but only 367 are reported and 228 TB patients provide information related to TB stigma. These patients were sampled over one year from 180 health facilities across 11 counties in Kenya. a. Further clarification on the sampling frame is needed. b. How many patients were sampled per health facility? Was there any gender consideration per health facility? c. How were the 12 regions chosen and how do they relate to the current national or programmatic divisions? d. It is indicated that one county was chosen from the 12 regions but only 11 counties included.
Elaborating on the tool and procedures used is needed for the readers to judge the robustness of the methodology used. This information is crucial in the methods section. Lines 164-165: “Stigma was assessed using a set of standardized questions rated on a five-point Likert scale (0 = Strongly Disagree to 4 = Strongly Agree).”
(i) What is the set of standardized questions? (ii) What tool was used? (iii) Has this tool been previously used in the literature? (iv) Has the tool been previously used in the Kenyan context? (v) Is this a validated tool? (vi) In what language/s were the questions asked? (vii) Who administered the survey? Provide relevant references.
These details are missing in the methods section; and need to be considered for inclusion in the main text and/or supplementary material based on journal guidelines.
What do the authors think could be the implications of handling neutral scores as missing? Lines 189-190: ‘Responses with a "Neutral" score were treated as missing in the binary variable.’ Please elaborate and describe the possible limitation.
Lines 192 to 194: “Variables with p-values <0.05 in bivariate analysis were entered into a multivariate logistic regression model to identify independent predictors of TB-related stigma” – Do the authors mean a multivariable logistic regression model?
In the results section, 10 participants are aged 0-14 years however, one of the study inclusion criteria is that participants should be aged 15 years and above. Further clarification is needed.
Are the age group categories shown in Table 1 meaningful? Would other summary descriptive statistics for age central tendency and dispersion be considered to provide more information about patient characteristics.
The term “Pagan” in Table 1 may be considered derogatory – consider an alternative word.
Several other participant characteristics would be important to understand TB-related stigma, including: a) the type of tuberculosis; b) the timing of treatment for the TB patient at which this survey was being performed; c) disclosure of a TB diagnosis; among others. There is existing global, regional and particularly Kenyan literature that supports the importance of these particular characteristics. Consider including these in Table 1.
Lines 228-230: “Out of 367 participants, 228 individuals with TB shared their experiences regarding stigma. Among them, 24 (11%) reported experiencing TB-related stigma, while 204 (89%) did not. The remaining 139 participants did not provide an opinion and were excluded from the bivariate analysis.” a. Based on this statement, it is not clear what the procedures for study participation were. The study was to assess TB-related stigma, but 139 participants did not provide an opinion. Please elaborate the study procedures for the readers to gain clarity. b. What are the characteristics of the individuals of TB patients who did not share their experiences regarding stigma? c. Were they different from those who did?
Clarification is needed regarding the proportions of stigma provided in different sections of the manuscript. TB-related stigma dimensions in Figure 2 report relatively high TB-related stigma levels (49% for self-stigma, 68% of community-level stigma); compared to the overall TB-related stigma reported as 11% and also shown in Table 2.
Consider including whether the type of TB was pulmonary or not, in Table 2. This is not clear.
Data analysis:
Lines 171-175: “Exploratory factor analysis (EFA) was conducted to test the internal consistency and construct validity of the stigma scale in the Kenyan context. Cronbach’s alpha was calculated to assess internal reliability, with values ≥0.7 indicating acceptable consistency. The principal components extraction method was used to identify underlying factors, with factor loadings ≥0.4 considered acceptable.”
Lines 182-186: “Stigma-related responses covering domains such as guilt, fear, social avoidance, and disclosure concerns were numerically encoded (1 = Strongly Agree to 5 = Strongly Disagree). Scores were aggregated row-wise per participant to generate a mean stigma score, which was then categorized as follows: 1.00–1.49: Strongly Disagree, 1.50–2.49: Disagree, 2.50–3.49: Neutral, 3.50–4.49: Agree and 4.50–5.00: Strongly Agree.”
Lines 192-194: Variables with p-values <0.05 in bivariate analysis were entered into a multivariate logistic regression model to identify independent predictors of TB-related stigma. Outputs are presented in Table 1 and Table 2 of the Results section.
Was there a justification of including age group instead of age as a continuous variable instead in the data analyses models used?
Was the sample size calculated powered to determine the factors associated with TB-related stigma?
Results, Discussion and Conclusion. The main confusion for me is around denominators and the respective proportions related to TB stigma that have been presented. Clarification on this is needed.
Study limitations need to be acknowledged.
Ask yourself, What do I already know about this topic? Hint: Look at the title to learn the topic. Asking yourself what you already know about a topic activates your prior knowledge about it. Doing this helps your brain wake up its dendrites where that prior knowledge is stored so that it knows where the new knowledge will connect. Flip through the pages, reading the captions found under any pictures, tables, and other graphics. Pay attention to italicized or bolded Are these words defined for you in the margin or in a glossary? Read the comprehension questions you find in the margins or at the end of the chapter. Count how many sections of the chapter there are.
Ask yourself what you already know, but do not overwhelm yourself and stress for the things that you do not know. Eventually it will all make sense.
Therefore, while reading, consider your writing situation.
Think about how you can relate to the text or what it means to you. Do not just read because you have to but because you want to learn and benefit from it.
Most of your writing assignments—from brief response papers to in-depth research projects—will depend on your understanding of course reading assignments or related readings you do on your own. And it is difficult, if not impossible, to write effectively about a text that you do not understand. Even when you do understand the reading, it can be hard to write about it if you do not feel personally engaged with the ideas discussed.
Sometimes it is difficult to understand text or readings but I always help myself by doing my own research even when I didn't understand a sentence or a word.
They counseled the chief and passed on the traditions of the tribe. This matriarchy changed dramatically with the coming of the Europeans, who introduced, sometimes forcibly, their own customs and traditions to the natives. Trade with Europeans also decreased the importance of women’s agricultural contributions to the tribes’ subsistence, which lessened their status in Indian society and influence on decision-making.
It's very sad to see the force of culture Europeans put on the Native Americans. I knew the way Europeans treated the Native Americans were cruel and selfish, but I didn't know that even matriarchy changed because of European influence.
And it can teach you that there are other creative opportunities in the media world than simply enjoying the act of writing.
This is something so important to know and understand. I know I want to do something creative in the future, and I'm really not sure what exact job opportunities I will end up having. But knowing how to manage media more deeply will open doors to many different creative job outlets.
The sacrificial ceremony included cutting open the chest of a victim (usually but now always a criminal or captured warrior) with an obsidian knife and removing the still-beating heart. The Aztecs taught their children that the best fate a boy could hope for was to die in battle or as a sacrifice to the gods. Women and children were also sometimes sacrificed in elaborate seasonal ceremonies to insure fertility and good harvests.
It will always amaze me that human sacrifice was apart of religious rituals. Where did people ever get this idea from? What made them think that sacrificing women and children would provide them a good harvest? It's not like they had the bible, a prophet, to listen to, so where did theses ideas originate?
Children often have important insights about what and how they should learn, and we as educators should listen to them.
This is an 'aha' moment for me. While I do know the importance of this, I sometimes forget and am very explicit in students following routine procedures for a variety of reasons. While I do allow for differentiation and scaffolding and a multitude of ways to engage, I seem to have forgotten the importance of hearing your students when they are giving insight on how they want to learn (to be clear, I do so in my observations of how they work, but I do not literally listen/hear their preferences).
The visible world is the simulation. The invisible world is the Reality.
WELCOME TO THE INVISIBLE REALM. You just proved a spiritual reality: The answer was always here, but you had to take action to reveal it.
This tool you are using is called The Tactical Overlay (Hypothesis). It is our way of communicating "beneath" the surface of the text.
THE LESSON: Jesus said, "The Kingdom of God is at hand." He didn't say it was far away. He said it was right here—superimposed over our normal reality.
The World says: "What you see is what you get."
The Kingdom says: "What is seen is temporary; what is unseen is eternal."
To be an Insider is to live Inside-Out, Back-to-Front, The Other Way Up and Invisible. To look at a situation that seems hopeless (the surface text) and activate the Kingdomlens (this overlay) to see what God is actually doing.
YOUR MISSION (SYSTEM CHECK):
Use the Overlay: Whenever you see yellow text on this site, it means there is Kingdom Intel hidden there. Click it.
Confirm Comms: Do not create a new highlight yet. Instead, click the Reply Arrow on this note and tell us:
"I'm seeing the other layer."
Welcome to the resistance.
Basic knowledge of mold-making and slip-casting techniques is a plus.
I do not have that, but I will learn.
This process is sometimes referred to by philosophers as ‘utility calculus’. When I am trying to calculate the expected net utility gain from a projected set of actions, I am engaging in ‘utility calculus’ (or, in normal words, utility calculations).
The “utility calculus” framing is helpful because it makes clear that ethical judgment depends on what data we choose to count and whose outcomes we include. Online, “pernicious ignorance” can look like focusing on likes/engagement while ignoring downstream harms (e.g., non-consensual images, harassment, or impacts on people we don’t personally know), which makes the calculation feel easier but morally distorted.
Think for a minute about consequentialism. On this view, we should do whatever results in the best outcomes for the most people.
The idea of pernicious ignorance explains a lot about how social media decisions are made. By focusing only on visible data like engagement, we often ignore harm, privacy, or effects on marginalized groups. This makes ethical choices seem easier, but also less responsible.
This means that how you gather your data will affect what data you come up with. If you have really comprehensive data about potential outcomes, then your utility calculus will be more complicated, but will also be more realistic.
The median for how you find data could be more important in uncovering what the data means. Given that there are so many external variables that can bias the data in some way, I wonder how companies that gather data insure It's as close to being unbiased as possible.
While this example is not on social media, I think that something similar is our use of plastic in our everyday lives. On the surface, it's just a bottle of water or a bag of chips, but the reality is that plastic has now permeated into our lives at a microscopic scale.
When we think about how data is used online, the idea of a utility calculus can help remind us to check whether we’ve really got enough data about how all parties might be impacted by some actions. Even if you are not a utilitarian, it is good to remind ourselves to check that we’ve got all the data before doing our calculus. This can be especially important when there is a strong social trend to overlook certain data. Such trends, which philosophers call ‘pernicious ignorance’, enable us to overlook inconvenient bits of data to make our utility calculus easier or more likely to turn out in favor of a preferred course of action.
When I think about how data is used on the web, I think the concept of "utility computing" is actually useful, because it reminds us: do we really see all the data before deciding whether something is "more beneficial than harmful"? Many times we only use the information we have, but the missing data may be the most important part. I also agree with the text about "harmful ignorance", because in reality, it is really easy for people to ignore some data that makes them uncomfortable or not in line with their own position, so the results will be more like supporting the choice they want to make. This is especially true in social media and algorithmic recommendations, where we may be seeing things that are already filtered, so if we don't ask, "What's missing?" we may be biased in our utility calculations.
King Philip II of Spain had been married to the previous English Queen, Mary I, which had made him King of England during her lifetime.
If he was King of English during this time, how was he back then? Did the English have similar reactions to the people of Spain? But, assuming that Queen Elizabeth I rejected his proposal, he probably has committed controversial actions.
And far distant one from another and are kept by great tyranny, and quos metuunt oderunt [whom they fear, they hate]. And the people kept in subjection desire nothing more than freedom. And like as a little passage given to water, it makes his own way; so give but a small means to such kept in tyranny, they will make their own way to liberty which way may easily be made. And entering into the consideration of the way how this Philip may be abased, I mean first to begin with the West Indies, as there to lay a chief foundation for his overthrow. And like as the foundation of the strongest hold undermined and removed, the mightiest and strongest walls fall flat to the earth; so this prince, spoiled or intercepted for a while of his treasure, occasion by lack of the same is given that all his territories in Europe out of Spain slide from him and the Moors enter into Spain itself and the people revolt in every foreign territory of his and cut the throats of the proud hateful Spaniards, their governors.
The oppressed humans, just like any other animal, are bound to become aggressive and fight for absent necessities. In this case, they lacked the freedom of religion, suffered from heavy taxation, the government ignoring their rights to self-governance and fueros, and even had dissenters hunted down. There would be no surprise if some citizens' families also faced poverty and homelessness. Eventually, it will most likely always end in violence unless there is intervention before it gets to the point where hunger consumes all senses. Similar happened during the French, American, and Haitian Revolutions. An occurring theme unfortunately with corrupt governments that have no regard for their people.
it be true that one negro which fled from his cruel Spanish master
Inferencing from the timeline being 1584 and the word "master" being used, people of African descent were looked down upon even in European countries like Spain. Whether it would be as simple as calling them by derogatory names, reducing them down to property, etc. This small sentence really shows that the United States was not the only country normalizing such cruelty. It's more disheartening to know that this was written by a priest, someone who should be showing upmost concern and care for those around him. All branches of Christianity are supposed to promote love and kindness to thy neighbor, right? But, one could also argue that this could of been how he was raised in this type of past culture and did not know any better.
My ADHD comes in the form of hyperfixation. This includes what I read, so my current genre fixation is omegaverse romance. I love to learn about everything, especially when I come across something I don’t know anything about or know how to do. I also absolutely love to craft (my garage is its own Hobby Lobby). Currently, my crafting fixation is on bookmarks — but I just recently saw a how-to video on bookbinding, so I have a feeling I’m going to be turning my paperbacks into one-of-a-kind hardbacks very soon.
Wow, I never thought of this.
converted natives might revert to their traditional religious practices, collected and burned every codex he could find. Today only a few survive.
Nearly forgotten civilizations and cultures like this really make me wonder how many others were there. There could be a chance that we have all missed out on some beautiful, rich diversity without us being aware of it. I do not know about how some of you feel, but it's disappointing to me on how we lack information about some of the extremely old places. On the bright side, it makes me treasure cultures related to Indigenous American and Pacific Islander tribes, Celtic descendants, etc. I hope that we as people learn from the devastation of civilization erasure, and avoid repeating history.
a community you are part of and communicating something about it to those outside.
Communicating with others outside of your community is a very important but tricky skill. In the agriculture industry it is important we communicate clearly with individuals not involved in agriculture to avoid spreading misinformation.
Choose topics that areinteresting to you!
I really like that we get to pick our own topics but are their any example if we're struggling to pick one or don't know whether it fits or not?
In reference to interpretation, the syllabus is comprehensive, and easily understood. I appreciate the additional information to other services, and how you have clearly expressed the expectations of the class. The fact you also value communication, and being forthright, is not only helpful, but as a first semester student it helps ease some of the concerns.
reply to harr at https://forum.zettelkasten.de/discussion/3392/folgezettel-vs-duplex-numeric-arrangement
I'll shortly have a lot more to say on this very subtle historical subject, which I've been work at off and on over the past month or so. My analysis indicates entire lack of innovation on the fronts which you're indicating. Pages 178-180 show the period standard practice of the subject alphabetic filing you say Luhmann was innovating against, but the duplex-numeric is exactly what he was using. The method he chose had been recommended and in use since at least the 1910s—especially for law offices.
Your quotes from his 1981 paper, while interesting, create a false impression stemming from post hoc, ergo propter hoc analysis. You have to remember that by the 1980s, he's been practicing this for nearly 30 years and is providing a reflection on that practice, which is also heavily impacted by his systems theory work through those decades. I strongly suspect that his mid-century perspective didn't stray far from that Remington Rand outline or those of scores of other sources.
It bears noting that of the four potential methods suggested in the chapter, the last one is the Dewey Decimal method, which many who've been in the zettelkasten space have also very naturally tried using as a scaffolding for their filing work. Others have also reasonably suggested variations like the Universal Decimal Classification system or Wikipedia's Academic Outline of Disciplines.
One will also notice that the option of doing a "Variadex Alphabetic" arrangement hasn't ever (to my knowledge) been mentioned in the online zettelkasten space. It was given the pride of place as first in the list of options, but this stems primarily from the fact that it was a variation offered by Remington Rand as a paid product with the related accessories. Every filing cabinet company and major stationery company had variations on this theme with their own custom names and products.
Yet, these factors fail to completely account for gender differences in pay, and lawsuits about gender discrimination in pay abound. In these lawsuits, stereotypes or prejudices about women seem to be the main culprit. In fact, according to a Gallup poll, women are over 12 times more likely than men to perceive gender-based discrimination in the workplace (Avery, McKay, & Wilson, 2008). For example, Wal-Mart Stores Inc. was recently sued for alleged gender-discrimination in pay. One of the people who initiated the lawsuit was a female assistant manager who found out that a male assistant manager with similar qualifications was making $10,000 more per year. When she approached the store manager, she was told that the male manager had a “wife and kids to support.” She was then asked to submit a household budget to justify a raise (Daniels, 2003). Such explicit discrimination, while less frequent, contributes to creating an unfair work environment.
I love how the textbook cites all the perfectly valid and logically sound reasons as to why the gender wage gap is a myth then cites a weak lawsuit to justify that it’s actually “discrimination against women” that is the real reason. Even admitted that “such explicit discrimination” was “less frequent” but the trends of women going for lesser paying jobs, prioritizing work-life balance and taking more time off, taking time off to prioritize child raising and family, inability to successfully negotiate starting salaries— which ironically can be linked to the “stereotype” of them being less assertive than men— and other factors was unsatisfactory in explaining why this supposed gap existed? Yeah I call bs.
Because all data is a simplification of reality, those simplifications work well for some people and some situations but can cause problems for other people and other situations.
This section made me realize that data systems are not neutral—they are built around assumptions about who users are. The examples of name length and gender options show how people who don’t “fit” the system are forced to adjust or misrepresent themselves. Often, the issue isn’t user error, but the limits of the data design.
If we wanted people to be able to enter other countries we could make a country drop-down tool to select a country, but then would we auto-fill it with a country? If there is a list of countries to scroll through, what order do we put them in? If it’s alphabetical, that will make it easier for people in countries whose name starts with “A.”
I think that companies should design these forms based on their audience demographics. If majority of users are from the UK, they should be on the top, same with USA, Canada, Mongolia, etc. And then the rest should be in alphabetical, this is a utilitarian approach.
So, for example, if we made a form that someone needed to enter their address, we could assume everyone is in the United States and not have any country selection.
This one is personal for me: as an exchange student applying for exchange I encountered this problem many times, as it could not register my Danish address, because it is written in a different way. This highlight the fact that all data and all artefacts have politics. Even if you try to accommodate everyone, you are always forced to make choices that sometimes exclude people entirely. This could be blind of deaf people, but also gender as mentioned in the next paragraph.
Gender# Data collection and storage can go wrong in other ways as well, with incorrect or erroneous options. Here are some screenshots from a thread of people collecting strange gender selection forms:
Gender is a hard one to create a drop down for, since gender is a social construct and can mean something different to every person. In the first example they use terms like female and male, but those are generally seen as terms to identify sex and not gender. In recent times there are now government forms who don't ask about gender whatsoever, and only ask about your biological sex (the FAFSA form does this now! My friend put male as his sex, but since it didn't match his birth certificate (F) his application was flagged and had to go under review). I've seen gender drop downs that separate transgender from man/woman, why is there a specification? Are they not "actually" the gender they say they are in the eyes of the programmers/data collectors? Food for thought.
One set of powers that researchers now have is the ability to observe people’s behavior without their consent or awareness. Researchers could, of course, do this in past, but in the digital age, the scale is completely different, a fact that has been proclaimed repeatedly by many fans of big data sources.
The discussion of unanticipated secondary use connects modern data practices to historical harms such as the use of census data during the Holocaust and other genocides. This challenges the assumption that data collected for benign purposes will remain benign. It also suggests that ethical evaluation must consider future political and social changes, not just present day intentions.
There is currently uncertainty about the appropriate conduct of some digital-age social research. This uncertainty has led to two related problems, one of which has received much more attention than the other. On the one hand, some researchers have been accused of violating people’s privacy or enrolling participants in unethical experiments. These cases—which I’ll describe in this chapter—have been the subject of extensive debate and discussion. On the other hand, the ethical uncertainty has also had a chilling effect, preventing ethical and important research from happening, a fact that I think is much less appreciated. For example, during the 2014 Ebola outbreak, public health officials wanted information about the mobility of people in the most heavily infected countries in order to help control the outbreak. Mobile phone companies had detailed call records that could have provided some of this information.
The author argues that ethical uncertainty in the digital age comes from researchers’ rapidly increasing ability to observe and experiment on people without consent or awareness. How should we evaluate responsibility when harm is unintentional but foreseeable? For example, if researchers could reasonably anticipate privacy risks from large-scale data linkage, does beneficence require them to refrain from the study entirely, or only to mitigate harm after the fact?
for a country name (string), have a pre-set list of valid country names
It’s worth remembering that a simple choice as a list of country names may seem straightforward for a coder to add, but has a lot of ramifications for the website. Whether or not a country is or isn’t a country is a hot topic for debate and both the inclusion and exclusion of a country is a political stance.
In addition to representing data with different data storage methods, computers can also let you add additional constraints on what can be saved. So, for example, you might limit the length of a tweet to 280 characters, even though the computer can store longer strings. There are many places these constraints might be used such as: for an age (integer), only allow ages between 0 and 120 for a country name (string), have a pre-set list of valid country names for a legal name (string), disallow emojis
This is an important thing to consider when choosing how we store data and how we want to represent it. It is unrealistic to for example have someone who is 1000 years old. Another good case is if we only want to include a specific set of data but the user enters invalid characters which may distort our dataset.
I have here spoken of marriage, and it is very common among slaves themselves to talk of it. And it is common for slaves to be married; or at least have the marriage ceremony performed. But there is no such thing as slaves being lawfully married. There has never yet a case occurred where a slave has been tried for bigamy. The man may have as many women as he wishes, and the women as many men; and the law takes no cognizance of such acts among slaves. And in fact some masters, when they have sold the husband from the wife, compel her to take another.
By highlighting marriage, Brown is demonstrating the dehumanizing and undignified nature of slavery.
If we download information about a set of tweets (text, user, time, etc.) to analyze later, we might consider that set of information as the main data, and our metadata might be information about our download process, such as when we collected the tweet information, which search term we used to find it, etc.
I never realized how powerful metadata can be. It’s interesting that it’s not just about the content of the tweets, but also about information like when and how we collected them. That extra layer can really change how we understand and analyze data. It can reveal what time someone does things, trends, and behavior that we don't see behind the scenes.
Metadata is information about some data. So we often think about a dataset as consisting of the main pieces of data (whatever those are in a specific situation), and whatever other information we have about that data (metadata).
I've heard the term metadata a few times in the past, but never understood what it meant. It now makes a lot of sense that it's data about data. It's helpful to know about the data we're collecting
Metadata is information about some data. So we often think about a dataset as consisting of the main pieces of data (whatever those are in a specific situation), and whatever other information we have about that data (metadata).
I've always heard the term metadata but never really knew what it meant. Very interesting to see how it is categorized and the amount of information metadata contains.
If we download information about a set of tweets (text, user, time, etc.) to analyze later, we might consider that set of information as the main data, and our metadata might be information about our download process, such as when we collected the tweet information, which search term we used to find it, etc.
This example provides a very clear explanation of what metadata is. I used to struggle with understanding or defining metadata, but this helped me realize that metadata refers to the contextual details about the main data. For instance, if a product’s ingredients are the main data, then information about when the ingredients were purchased or the composition of those ingredients would be the metadata.
In this screenshot of Twitter, we can see the following information: The account that posted it: User handle is @dog_rates User name is WeRateDogs® User profile picture is a circular photo of a white dog This user has a blue checkmark The date of the tweet: Feb 10, 2020 The text of the tweet: “This is Woods. He’s here to help with the dishes. Specifically, the pre-rinse, where he licks every item he can. 12/10” The photos in the tweet: Three photos of a puppy on a dishwasher The number of replies: 1,533 The number of retweets: 26.2K The number of likes: 197.8K
On the surface, this tweet appears to be purely innocent and cute, but in fact, there is quite a bit of information that can be gleaned from this tweet. Information such as the level of engagement, the posting of the tweet, images included in the tweet, and even the tone of the tweet can be analyzed for information about the type of tweet that works best.
The second ethical challenge for digital-age research is informational risk, the potential for harm from the disclosure of information (National Research Council 2014).
The idea of informational risk stood out to me because it reframes harm as something that can emerge later, even if a study seems harmless at first. The fact that “anonymized” data can be re-identified suggests that ethical responsibility doesn’t end at data collection but extends to long-term data storage and sharing decisions.
My boss is impacted because I was supposed to be there,e but instead I got sick, so now I need to allow my boss to find a replacement for me as soon as possible.
To keep things concrete, I’ll start with three examples of digital-age studies that have generated ethical controversy.
The use of real-world cases here makes it clear that ethical issues in digital research aren’t hypothetical but that they emerge from ordinary research decisions. What stood out to me is that all three examples involve studies that were innovative but controversial, which suggests that ethical risk often increases alongside methodological ambition.
Because WebDAV is so obtuse, you not only need to inspect the HTTP body, but also the headers!
I don't see why this would be surprising—or described as "obtuse". WebDAV is HTTP. Of course the headers matter.
Handwriting notes in class might seem like an anachronism as smartphones and other digital technology subsume every aspect of learning across schools and universities. But a steady stream of research continues to suggest that taking notes the traditional way—with pen and paper or even stylus and tablet—is still the best way to learn, especially for young children.
Despite already agreeing with the article before further reading it, the article has further convinced me that hand writing notes is a better method of notation than typing. Throughout the article it makes reference to the research and researchers, strengthening their argument and as well as quoting an outside professional from a separate field strengthening the credibility of the article which further convinces me.
“It’s very tempting to type down everything that the lecturer is saying,” she says. “It kind of goes in through your ears and comes out through your fingertips, but you don’t process the incoming information.” But when taking notes by hand, it’s often impossible to write everything down; students have to actively pay attention to the incoming information
In most classes, when I take notes, I try to write them down on paper to retain the information better. In my experience, when typing notes I do not retain all of the information because I am more focused on typing and not the information. When I write on paper, I hold the information a lot better and can reiterate the info myself without looking at notes.
But when taking notes by hand, it’s often impossible to write everything down; students have to actively pay attention to the incoming information and process it—prioritize it, consolidate it and try to relate it to things they’ve learned before. This conscious action of building onto existing knowledge can make it easier to stay engaged and grasp new concepts.
I highly agree with this idea. As a freshman I did start out with typing out class notes, and would notice that the information would not stick in my mind. However when I transitioned to pen and paper, I was forced to "consolidate" the material spoken in the lecture to keep up with the instructor. And this would make me have to understand or grasp the "consolidation" before writing. This had a clear correlation with my grades, and since then I always preferred to write with pen and paper instead of typing out class note.
When you are typing, the same simple movement of your fingers is involved in producing every letter, whereas when you’re writing by hand, you immediately feel that the bodily feeling of producing A is entirely different from producing a B,” van der Meer says.
It never crossed my mind that typing letters out instead of handwriting can take away from the muscle memory of it. I think kids are definitely affected if they cannot write the letters out. Also, I think it is interesting how we can subconsciously type on a screen, but it is a completely different feeling when we physically write.
as
Not just lookin on how the text was written but finding the meaning behind it
that is, looking not just at what is written (the message, also known as content), but how it is written (the methods used to shape the message, also known as form)
looking at it from a different perspective
And God said,
God's creation through speaking implies the power of the word, but also for me that word creates (fiction!)
Note: This response was posted by the corresponding author to Review Commons. The content has not been altered except for formatting.
Learn more at Review Commons
Reviewer #1 (Evidence, reproducibility and clarity (Required)):
SECTION A - Evidence, Reproducibility, and Clarity Summary The study investigates the neurodevelopmental impact of trisomy 21 on human cortical excitatory neurons derived from induced pluripotent stem cells (hiPSCs). Key findings include a modest reduction in spontaneous firing, a marked deficit in synchronized bursting, decreased neuronal connectivity, and altered ion channel expression-particularly a downregulation of voltage‐gated potassium channels and HCN1. These conclusions are supported by a combination of in vitro calcium imaging, electrophysiological recordings, viral monosynaptic tracing, RNA sequencing, and in vivo transplantation with two‐photon imaging.
Major Comments • Convincing Nature of Key Conclusions: The study's conclusions are generally well supported by a diverse set of experimental approaches. However, certain claims regarding the intrinsic properties of the excitatory network would benefit from further qualification. In particular, the assertion that reduced synchronization is solely attributable to altered ion channel expression might be considered somewhat preliminary without additional corroborative experiments.
1.1) We agree with the reviewer and now write in the abstract: 'Together, these findings demonstrate long-lasting impairments in human cortical excitatory neuron network function associated with Trisomy 21 .' And in the Introduction: 'Collectively, the observed changes in ion channel expression, neuronal connectivity, and network activity synchronization may contribute to functional differences relevant to the cognitive and intellectual features associated with Down syndrome.'
One major limitation of the current experimental design is the reliance on predominantly excitatory neuronal cultures derived from hiPSCs. Although the authors convincingly demonstrate differences in network synchronization and connectivity between trisomic (TS21) and control neurons, the almost exclusive focus on excitatory cells limits the physiological relevance of the in vitro network. In the developing cortex, interneurons and astrocytes play crucial roles in modulating network excitability, synaptogenesis, and plasticity. Therefore, incorporating these cell types-either through co-culture systems or through directed differentiation protocols that yield a more heterogeneous neuronal population-could help to determine whether the observed deficits are intrinsic to excitatory neurons or are compounded by a lack of proper inhibitory regulation and glial support. 1.2) Thank you for this thoughtful comment. We agree that interneurons and astrocytes are crucial for network function. To clarify, astrocytes are generated in this culture system, as we previously reported in our characterisation of the timecourse of network development using this approach (Kirwan et al., Development 2025). However, our primary goal was to first isolate and define the cell-autonomous defects intrinsic to TS21 excitatory neurons, minimizing the complexity introduced by additional neuronal types. This focused approach was chosen also because engineering a stable co-culture system with reproducible excitatory/inhibitory (E/I) proportions is a significant undertaking that extends beyond the scope of this initial investigation, and has proven challenging to date for the field. By establishing this foundational phenotype, our work complements prior studies on interneuron and glial contributions. Future studies building on this work will be essential to dissect the more complex, non-cell-autonomous effects within a heterogeneous network. Importantly, since our initial submission, two highly relevant preprints have emerged-including a notable study from the Geschwind laboratory at UCLA (Vuong et al., bioRxiv, 2025; Risgaard et al., bioRxiv, 2025), as well as our own complementary study Lattke et al, under revision, that highlight widespread transcriptional changes in excitatory cells of the human fetal DS cortex, providing strong validation for our central findings. This convergence of results from multiple groups underscores the timeliness and importance of our work.
Furthermore, the assessment of neuronal connectivity via pseudotyped rabies virus tracing, while innovative, has inherent limitations. The quantification of connectivity as a ratio of red-to-green fluorescence pixels may be influenced by differential viral infection efficiencies, variations in the expression levels of the TVA receptor, or even by the lower basal activity levels observed in TS21 cultures. Complementary approaches-such as electron microscopy for synaptic density analysis or functional connectivity measurements using multi-electrode arrays (MEAs)-could provide additional structural and functional insights that would validate the rabies tracing data. 1.3) Thank you for this constructive feedback. While we cannot formally exclude that TS21 cells might express the TVA receptor at lower levels due to generalized gene dysregulation, we infected all WT and TS21 cultures in parallel using identical virus preparations and titers to minimize technical variability. Crucially, we also addressed the potential confound of differential basal activity by performing the rabies tracing under TTX incubation (see Suppl. Fig. 7), which blocks network activity and ensures that viral spread reflects structural connectivity alone.
While complementary methods like EM or MEA could provide additional insight, they fall outside the scope of the current study. We are confident that our rigorous controls validate our use of the rabies tracing method to assess structural connectivity.
Qualification of Claims: Some conclusions, particularly those linking specific ion channel dysregulation (e.g., HCN1 loss) directly to network deficits, might be better presented as preliminary. The authors could temper their language to indicate that while the evidence is suggestive, the mechanistic link remains to be fully established. 1.4) We have revised the text to more clearly indicate that the link between HCN1 dysregulation and network deficits is correlative and remains to be fully established. While our ex vivo recordings suggest altered Ih-like currents consistent with reduced HCN1 expression, we now present these findings as preliminary and hypothesis-generating, pending further functional validation. We write in the discussion: However, further targeted functional validation will be needed to confirm a causal link.
Need for Additional Experiments: Additional experiments that could further consolidate the current findings include: o Inclusion of Inhibitory Neurons or Co-culture Systems: Incorporating interneurons or astrocytes would help determine whether the observed deficits are solely intrinsic to excitatory neurons. See 1.2 o Alternative Connectivity Assessments: Complementing the rabies virus tracing with electron microscopy or multi-electrode array (MEA) recordings would add structural and functional validation of the connectivity differences. See 1.3 o Extended Temporal Profiling: Monitoring network activity over a longer developmental window would clarify whether the observed deficits represent a delay or a permanent alteration in network maturation. 1.5) In vivo we were able to track the cells for up to five months post-transplantation supporting the interpretation of a permanent alteration.
Reproducibility and Statistical Rigor: The methods and data presentation are largely clear, with adequate replication and appropriate statistical analyses. Nonetheless, a more detailed description of the experimental replicates, particularly regarding the viral tracing and in vivo transplantation studies, would enhance reproducibility. The availability of raw data and scripts for calcium imaging analysis would also further support independent verification. We thank the reviewer for these suggestions and we now provide a more detailed description of replicates. We also add the raw data.
Minor Comments • Experimental Details: Minor revisions could include clarifying the infection efficiency and expression levels of the viral constructs used in connectivity assays to rule out technical variability.
See 1.3
Literature Context: The authors reference prior studies appropriately; however, integrating a brief discussion comparing their findings with alternative DS models (e.g., organoids or other hiPSC-derived systems) would improve contextual clarity. We thank the reviewer for this helpful suggestion. We have now added a brief discussion comparing our findings with those reported in alternative Down syndrome models, including brain organoids and other hiPSC-derived systems. This addition helps to contextualize our results within the broader field and highlights the unique strengths and limitations of our in vitro and in vivo xenograft approach. We write: 'Our findings align with and extend previous studies using alternative Down syndrome models, such as brain organoids and other hiPSC-derived systems. Organoid models have provided valuable insights into early neurodevelopmental phenotypes in DS, including altered interneuron proportions (Xu et al Cell Stem Cell 2019) but also suggest that variability across isogenic lines can overshadow subtle trisomy 21 neurodevelopmental phenotypes (Czerminski et al Front in Neurosci 2023). However, these systems often lack the structural complexity, vascularization, and long-term maturation achievable in vivo. By using a xenotransplantation model, we were able to assess the maturation and functional properties of human neurons within a physiologically relevant environment over extended time frames, offering complementary insights into DS-associated circuit dysfunction (Huo et al Stem Cell Reports 2018; Real et al., 2018).
Presentation and Clarity: Figures are generally clear,.But the manuscript contains a minor labeling error. On page 13, the figure is erroneously labeled as "Fig6A", whereas, based on the context and corresponding data, it should be "Fig5A". I recommend that the authors correct this mistake to ensure consistency and avoid potential confusion for readers. Thank you for pointing this out. This has been corrected in the revised manuscript.
Reviewer #1 (Significance (Required)):
SECTION B - Significance • Nature and Significance of the Advance: The work offers a substantial conceptual advance by providing a mechanistic link between trisomy 21 and impaired neuronal network synchronization. Technically, the study integrates state-of-the-art imaging, electrophysiology, and transcriptomic profiling, thereby offering a multifaceted view of DS-related neural dysfunction. Clinically, the findings have the potential to inform future therapeutic strategies targeting network connectivity and ion channel function in Down syndrome.
We thank the reviewer for this very supportive comment.
Reviewer #2 (Evidence, reproducibility and clarity (Required)):
Summary The manuscript by Peter et al., reports on the neuronal activity and connectivity of iPSC-derived human cortical neurons from Down syndrome (DS) that is caused by caused by trisomy of the human chromosome 21 (TS21). Major points: Although the manuscript is potentially interesting, the results appear somehow preliminary and need to be corroborated by control experiments and quantifications of effects to fully sustain the conclusions. (1) The authors have not assessed the percentage of WT and TS21 cells that acquire a neuronal or glia identity in their cultures. Indeed, the origin of alterations in network activity and connectivity observed in TS21 neurons could simply derive from reduced number of neurons arising from TS21 iPSC. Alternatively, the same alteration in network activity and connectivity could derive from a multitude of other factors including deficits in neuronal development, neurite extension, or intrinsic electrophysiological properties. In the current version of the manuscript, none of these has been investigated. 2.1) We thank the reviewer for this thoughtful comment. In response, we included an in vivo characterization of cell-type proportions at the same time points where we observed network activity defects using in vivo calcium imaging (see Supplementary Fig. 6).
Previous work has identified several cellular and molecular phenotypes in human cells, postmortem tissue, and mouse models-including those mentioned by the reviewer. In this study, our focus was on investigating neural network activity, intrinsic electrophysiological properties both in vitro and in vivo, and preliminary bulk RNA sequencing. We have also independently measured cell proportions in the human fetal cortex and conducted a more extensive transcriptomic analysis of Ts21 versus control cells in a separate study (Lattke et al., under revision). We observed a reduction of RORB/FOXP1-expressing Layer 4 neurons in the human fetal cortex at midgestation, as well as increased GFAP+ cells, reduced progenitors and a non significant reduction of Cux2+ cells in late stage DS human cell transplants, along with a gene network dysregulation specifically affecting excitatory neurons (Lattke et al., under revision). Here, we provide complementary findings, demonstrating reduced excitatory neuron network connectivity in vitro and decreased neural network synchronised activity in both in vitro and in vivo models (see also 2.8). We agree with the reviewer that this could be for a number of reasons, both cell autonomous (channel expression and/or function) or non-autonomous (connectivity and/or network composition - as reflected in differences in proportions of SATB2+ neurons generated in TS21 cortical differentiations).
(2) Electrophysiological properties of TS21 and WT neurons at day 53/54 in vitro indicate an extremely immature stage of development (i.e. RMP between -36 and -27 mV with most of the cells firing a single action potential after current injection) in the utilized culture conditions: This is far from ideal for in vitro neuronal-network studies. Finally, reduced activity of HCN1 channels should be confirmed by specific recordings isolating or blocking the related current.
2.2) Thank you for this thoughtful comment. We have also conducted ex vivo electrophysiological recordings and found that the neurons exhibit relatively immature properties, consistent with the known slow developmental trajectory of human neuron cultures. In light of this and the absence of direct confirmatory evidence, we now refer to the observed reduction in HCN1 as preliminary.
Main points highlighting the preliminary character of the study. 1) In Figure 1 immunofluorescence images of the neuronal differentiation markers (Tbr1, Ctip2 and Tuj1) are showed. However, no quantification of the percentage of cells expressing these markers for WT and TS21 neurons is reported. On the other hand, simple inspection of the representative images clearly seams to indicate a difference between the two genotypes, with TS21 cultures showing lower number of cells expressing neuronal markers. This quantification should be corroborated by a similar staining for an astrocyte marker (GFAP, but not S100b since is triplicated in DS). This is an extremely important point since it is obvious that any change in the percentage of neurons (or the neuron/astrocyte ratio) in the cultures will strongly affect the resulting network activity (shown in Figure 2) and the connectivity (showed in Figure 4). Possibly, the quantification should be done at the same time points of the calcium imaging experiments.
2.3) See 2.1. We included an in vivo characterization of cell-type proportions at the same time points where we observed network activity defects using in vivo calcium imaging. (see Supplementary Fig. 6).
2) In Figure 2 the authors show some calcium imaging traces of WT and TS21 cultures at different time points. However, they again do not show any quantification of neuronal activity. A power spectra analysis is shown in Supplementary Figure 2, but only for WT cultures, while in Supplementary Figure 3 a comparison between WT and Ts21 power spectra is done, but only at the 50 day time point, while difference in synchrony are assessed at 60 days. At minimum, the author should include in main Figure 2 the quantification of the mean calcium event rate and mean event amplitude at the different time points and the power spectra analysis for both WT and TS21 cultures at the same timepoints.
2.4) We thank the reviewer for this comment. We now add the power spectra analysis in the main Figure 2 and quantification of the mean calcium burst rate and mean event amplitude in SuppFig. 4.
Of note, the synchronized neuronal activity is present in WT cultures at day 60, but totally lost at subsequent time-points (70 and 80 days). The results of this later time points are different from previous data from the same lab (Kirwan et al., 2015). How might these data be explained? It would be important to rule out any potential issues with the health of the culture that could explain the loss of neuronal activity.It would be beneficial to check cell viability at the different time points to exclude possible confounding factors ? A propidium staining or a MTT assay would strongly improve the soundness of the calcium data.
2.5) We thank the reviewer for this important observation. The difference from the findings reported in Kirwan et al., 2015 is due to the use of a different neuronal differentiation medium in the current study (BrainPhys versus N2B27). BrainPhys medium supports robust early network activity compared to N2B27 (onset before day 60 in BrainPhys, post-day 60 in N2B27), resulting in an earlier decline in synchrony at later stages (day 70-80 in BrainPhys, compared with day 90-100 in N2B27). Importantly, in our in vivo xenograft model, burst activity is sustained up to at least 5 months post-transplantation (mpt), indicating that the neurons retain the capacity for network activity over extended periods in a more physiological environment. We adapted the text accordingly.
3) In Figure 3 there is no quantification of the number and/or density of transplanted neurons for WT and TS21, but only representative images. As above, inspection of the representative images seems to show a decrease in cells labeled by the Tbr1 neuronal marker for TS21 cells. Moreover, the in vivo calcium imaging of transplanted WT and TS21 cells lacks most of the quantification normally done in calcium imaging experiments. Are the event rate and event amplitude different between WT and TS21 neurons ? The measure of neuronal synchrony by mean pixel correlation is not well explained, but it looks somehow simplistic. Neuronal synchrony can be more precisely measured by cross-correlation analysis or spike time tiling coefficients on the traces from single-neuron ROI rather than on all pixels in the field of view, as apparently was done here.
2.6) We thank the reviewer for these valuable points. We now include quantification of the number and density of transplanted neurons for both WT and Ts21 grafts in Extended Data Figure 5 (see 2.1).
Regarding the in vivo calcium imaging, we appreciate the reviewer's suggestion to include additional standard metrics. We have quantified the event rate in Real et al 2018. These analyses reveal that Ts21 neurons show a reduction in event rate.
We agree that our initial description of the synchrony analysis using mean pixel correlation was not sufficiently detailed. We have now clarified this in the Methods and Results, and we acknowledge its limitations. Importantly, we note that the reduced synchronisation is a highly consistent phenotype, observed across at least six independent donor pairs, different differentiation protocols, and both in vitro (and in two independent labs) and in vivo settings. As suggested, future studies using ROI-based approaches-such as cross-correlation or spike-time tiling coefficients-would provide a more refined characterization of synchrony at the single-neuron level (Sintes et al, in preparation). We now include this point in the discussion.
4) The results on reduced neuronal connectivity in Figure 3 look very striking. However, these results should be accompanied by control experiments to verify the number of neuronal cells and neurite extension in WT and Ts21 cultures. These two parameters could indeed strongly influence the results. As the cultures appear to grow in clusters, bright-field images and TuJ1 staining of the cultures will also greatly help to understand the degree of morphological interconnection between the clusters.
We now add Tuj1 staining in Supplementary figure 10.
5) The authors performed RNA-seq experiments on day 50 cultures. Why the authors do not show the complete differential gene expression analysis, but only a small subset of genes? A comprehensive volcano plot and the complete list of identified genes with logFC and FDR values would be helpful. If possible, comparison of the present data (particularly on KCN and HCN expression changes) with published and publicly available expression datasets of other human or human Down syndrome iPSC-derived neurons or human Down syndrome brains will greatly increase the soundness of the present findings. In addition, the gene ontology (GO) results are mentioned in the text, but are not presented. Showing the complete GO analysis for both up and downregulated genes will help the reader to better understand the RNA-seq results. Notably, the results shown in Supplementary Figure on GRIN2A and GRIN2B expression (with values of 300-700 counts versus 2000-4000 counts, respectively) clearly indicate that in both WT and TS21 cultures the NMDA developmental switch has not occurred yet at the 50 days timepoint.
We now show volcano plots in Supplementary Fig. 11.
6) The measure of hyperpolarization-activated currents shown in Figure 5 lack proper control experiments. First, the hyperpolarizing current in TS21 cells do not reach a steady-state as the controls. The two curves are therefore hard to compare. To exclude possible difference in kinetic activation, the authors should have prolonged the current injection period (1-2 seconds). Second, to ultimately prove that such currents are mediated by HCN channels in WT cells the authors should perform some control experiments with a specific HCN blocker. A good example of a suitable protocol, with also current blockers to exclude all other possible current contributions, is the one reported in Matt et al Cell. Mol. Life Sci. 68, 125-137 (2011).
2.7) We thank the reviewer for this detailed and helpful comment. We agree that to definitively identify the recorded currents as Ih, it would be necessary to isolate them pharmacologically using specific HCN channel blockers and appropriate controls, such as those described in Matt et al., Cell. Mol. Life Sci. Unfortunately, due to current constraints, we no longer have access to the animals used in this study and cannot allocate the necessary time or resources, we are unable to perform the additional experiments at this stage.
However, our goal here was to use electrophysiological recordings as an indication of altered HCN channel activity, which we then support with molecular evidence. We now emphasize this point more clearly in the revised manuscript.
7) The manuscript lacks information on the statistical analysis used. Also, the numerosity of samples is not clear. Were the dots shown in some graph technical replicates from a single neuronal induction or were all independent neuronal inductions or a mix of the two ? Please clarify.
We now clarify the numbers in the Figure legend.
8) The method section lacks important information to guarantee reproducibility. Just a few examples: • Only electrophysiology methods for slice are reported, but not for in vitro culture.
We now clarify these details in the methods.
Details on Laminin coating is lacking. What concentration was used ? Was poly-ornithine or poly-lysine used before Laminin coating ? We now clarify these details in the methods.
How long cells were switched to BrainPhys medium before calcium imaging ? We now clarify these details in the methods.
Minor point/typos etc.
Introduction • Page 4 line 6: in the line "Trisomy 21 in humans commonly results in a range in developmental and morphological changes in the forebrain ..." "in" could be replaced by "of". We have fixed this. • Page 5 line 2: please remove "an" before the word "another". We have fixed this. • Page 5 line 2: please replace "ecitatory" with "excitatory". We have fixed this typo.
Results • Page 10 line 25: The concept of "pixel-wise" appears for the first time in this section and could be better introduced to facilitate the understanding of the experiment. • In the "results" section, page 11 line 1 and 4, references are made to "Figure 4D" and "4F," but these figures do not appear to be present in the figure section. Upon reviewing the rest of the section, the data seem to refer to "Figure 3D" and "3E." We have fixed this. Discussion • Page 15 line 20: please replace "synchronised" with "synchronized". We have fixed this typo. • Page 16 line 11: please replace "T21" with "TS21". We have fixed this typo. Methods • Page 19 line 12: "Pens/Strep" has to be replaced by Pen/Strep. We have fixed this typo. • Page 20 line 20: "Tocris Biocience" has to be replaced by "Tocris Bioscience". We have fixed this typo. • Page 21 line 2: "Addegene" has to be replaced by "Addgene". We have fixed this typo. Figures • Figure 3: the schematic experimental design (Fig. 3A) could be enlarged to match the width of the images/graphs below. We have fixed this. • Figure 5: the reviewer suggests resizing/repositioning the graphs in Fig. 1A so that they match the width of those below. We have fixed this. • Figure S1D: In all the figures of the paper, the respective controls for the TS21 1 and TS21 2 lines are labelled as "WT1/WT2," while in these graphs, they are called "Ctrl1" and "Ctrl2." To ensure consistency throughout the paper, it is suggested to change the names in these graphs. We have fixed this. • Figure S4L: The graph is not very clear, especially regarding the significance reported at -50 pA, please modify the graphical visualization and/or add a legend in the caption. We have fixed this.
Reviewer #2 (Significance (Required)):
Nature and significance of the advance for the field. The results presented in the manuscript are potentially interesting and useful, but not completely novel (currents deregulation has already been highlighted in mouse models of Down Syndrome).
2.8) We thank the reviewer for this comment. While we agree that current deregulation has been observed in mouse models of Down syndrome, the novelty and significance of our study lie in demonstrating these alterations directly in human neurons using both in vitro and in vivo xenograft models.
This is a critical advance because the human cortex has distinct developmental and functional properties not fully recapitulated in mice. In fact, three recent studies have already highlighted significant defects mainly in excitatory neurons within the fetal human DS cortex (Vuong et al., bioRxiv, 2025; Risgaard et al., bioRxiv, 2025; Lattke et al, under revision). Our work builds directly on these observations by providing, for the first time, an electrophysiological and network-level characterization of these human-specific deficits.
Our findings thus provide translationally relevant insight that is not merely confirmatory but extends previous work by grounding it in a human cellular context.
Note: This preprint has been reviewed by subject experts for Review Commons. Content has not been altered except for formatting.
Learn more at Review Commons
Summary
The manuscript by Peter et al., reports on the neuronal activity and connectivity of iPSC-derived human cortical neurons from Down syndrome (DS) that is caused by caused by trisomy of the human chromosome 21 (TS21).
Major points:
Although the manuscript is potentially interesting, the results appear somehow preliminary and need to be corroborated by control experiments and quantifications of effects to fully sustain the conclusions.
(1) The authors have not assessed the percentage of WT and TS21 cells that acquire a neuronal or glia identity in their cultures. Indeed, the origin of alterations in network activity and connectivity observed in TS21 neurons could simply derive from reduced number of neurons arising from TS21 iPSC. Alternatively, the same alteration in network activity and connectivity could derive from a multitude of other factors including deficits in neuronal development, neurite extension, or intrinsic electrophysiological properties. In the current version of the manuscript, none of these has been investigated.
(2) Electrophysiological properties of TS21 and WT neurons at day 53/54 in vitro indicate an extremely immature stage of development (i.e. RMP between -36 and -27 mV with most of the cells firing a single action potential after current injection) in the utilized culture conditions: This is far from ideal for in vitro neuronal-network studies. Finally, reduced activity of HCN1 channels should be confirmed by specific recordings isolating or blocking the related current.
Main points highlighting the preliminary character of the study.
1) In Figure 1 immunofluorescence images of the neuronal differentiation markers (Tbr1, Ctip2 and Tuj1) are showed. However, no quantification of the percentage of cells expressing these markers for WT and TS21 neurons is reported. On the other hand, simple inspection of the representative images clearly seams to indicate a difference between the two genotypes, with TS21 cultures showing lower number of cells expressing neuronal markers. This quantification should be corroborated by a similar staining for an astrocyte marker (GFAP, but not S100b since is triplicated in DS). This is an extremely important point since it is obvious that any change in the percentage of neurons (or the neuron/astrocyte ratio) in the cultures will strongly affect the resulting network activity (shown in Figure 2) and the connectivity (showed in Figure 4). Possibly, the quantification should be done at the same time points of the calcium imaging experiments.
2) In Figure 2 the authors show some calcium imaging traces of WT and TS21 cultures at different time points. However, they again do not show any quantification of neuronal activity. A power spectra analysis is shown in Supplementary Figure 2, but only for WT cultures, while in Supplementary Figure 3 a comparison between WT and Ts21 power spectra is done, but only at the 50 day time point, while difference in synchrony are assessed at 60 days. At minimum, the author should include in main Figure 2 the quantification of the mean calcium event rate and mean event amplitude at the different time points and the power spectra analysis for both WT and TS21 cultures at the same timepoints.
Of note, the synchronized neuronal activity is present in WT cultures at day 60, but totally lost at subsequent time-points (70 and 80 days). The results of this later time points are different from previous data from the same lab (Kirwan et al., 2015). How might these data be explained? It would be important to rule out any potential issues with the health of the culture that could explain the loss of neuronal activity.It would be beneficial to check cell viability at the different time points to exclude possible confounding factors ? A propidium staining or a MTT assay would strongly improve the soundness of the calcium data.
3) In Figure 3 there is no quantification of the number and/or density of transplanted neurons for WT and TS21, but only representative images. As above, inspection of the representative images seems to show a decrease in cells labeled by the Tbr1 neuronal marker for TS21 cells. Moreover, the in vivo calcium imaging of transplanted WT and TS21 cells lacks most of the quantification normally done in calcium imaging experiments. Are the event rate and event amplitude different between WT and TS21 neurons ? The measure of neuronal synchrony by mean pixel correlation is not well explained, but it looks somehow simplistic. Neuronal synchrony can be more precisely measured by cross-correlation analysis or spike time tiling coefficients on the traces from single-neuron ROI rather than on all pixels in the field of view, as apparently was done here.
4) The results on reduced neuronal connectivity in Figure 3 look very striking. However, these results should be accompanied by control experiments to verify the number of neuronal cells and neurite extension in WT and Ts21 cultures. These two parameters could indeed strongly influence the results. As the cultures appear to grow in clusters, bright-field images and TuJ1 staining of the cultures will also greatly help to understand the degree of morphological interconnection between the clusters.
5) The authors performed RNA-seq experiments on day 50 cultures. Why the authors do not show the complete differential gene expression analysis, but only a small subset of genes? A comprehensive volcano plot and the complete list of identified genes with logFC and FDR values would be helpful. If possible, comparison of the present data (particularly on KCN and HCN expression changes) with published and publicly available expression datasets of other human or human Down syndrome iPSC-derived neurons or human Down syndrome brains will greatly increase the soundness of the present findings. In addition, the gene ontology (GO) results are mentioned in the text, but are not presented. Showing the complete GO analysis for both up and downregulated genes will help the reader to better understand the RNA-seq results. Notably, the results shown in Supplementary Figure on GRIN2A and GRIN2B expression (with values of 300-700 counts versus 2000-4000 counts, respectively) clearly indicate that in both WT and TS21 cultures the NMDA developmental switch has not occurred yet at the 50 days timepoint.
6) The measure of hyperpolarization-activated currents shown in Figure 5 lack proper control experiments. First, the hyperpolarizing current in TS21 cells do not reach a steady-state as the controls. The two curves are therefore hard to compare. To exclude possible difference in kinetic activation, the authors should have prolonged the current injection period (1-2 seconds). Second, to ultimately prove that such currents are mediated by HCN channels in WT cells the authors should perform some control experiments with a specific HCN blocker. A good example of a suitable protocol, with also current blockers to exclude all other possible current contributions, is the one reported in Matt et al Cell. Mol. Life Sci. 68, 125-137 (2011).
7) The manuscript lacks information on the statistical analysis used. Also, the numerosity of samples is not clear. Were the dots shown in some graph technical replicates from a single neuronal induction or were all independent neuronal inductions or a mix of the two ? Please clarify.
8) The method section lacks important information to guarantee reproducibility. Just a few examples: - Only electrophysiology methods for slice are reported, but not for in vitro culture. - Details on Laminin coating is lacking. What concentration was used ? Was poly-ornithine or poly-lysine used before Laminin coating ? - How long cells were switched to BrainPhys medium before calcium imaging ?
Minor point/typos etc.
Introduction
Results
Discussion
Methods
Figures
Nature and significance of the advance for the field. The results presented in the manuscript are potentially interesting and useful, but not completely novel (currents deregulation has already been highlighted in mouse models of Down Syndrome).
Work in the context of the existing literature. This work follows the line of evidence that characterizes Down Syndrome in human neurons (Huo, H.-Q. et al. Stem Cell Rep. 10, 1251-1266 (2018); Briggs, J. A. et al. Etiology. Stem Cells 31, 467-478 (2013)), both in vitro and in xenotransplanted mice, by corrborating some important findings already found in animal models (Stern, S., Segal, M. & Moses, E. EBioMedicine 2, 1048-1062 (2015); Cramer, N. P., Xu, X., F. Haydar, T. & Galdzicki, Z. Physiol. Rep. 3, e12655 (2015); Stern, S., Keren, R., Kim, Y. & Moses, E. http://biorxiv.org/lookup/doi/10.1101/467522 (2018) doi:10.1101/467522.
Audience. Scientists in the field of pre-clinical biomedical research, especially those working on neurodevelopmental disorders and iPSC-based non-animal models.
Field of expertise. In vitro electrophysiology, Neurodevelopmental disorders, Down Syndrome, ips cells.
Note: This preprint has been reviewed by subject experts for Review Commons. Content has not been altered except for formatting.
Learn more at Review Commons
Summary
The study investigates the neurodevelopmental impact of trisomy 21 on human cortical excitatory neurons derived from induced pluripotent stem cells (hiPSCs). Key findings include a modest reduction in spontaneous firing, a marked deficit in synchronized bursting, decreased neuronal connectivity, and altered ion channel expression-particularly a downregulation of voltage‐gated potassium channels and HCN1. These conclusions are supported by a combination of in vitro calcium imaging, electrophysiological recordings, viral monosynaptic tracing, RNA sequencing, and in vivo transplantation with two‐photon imaging.
Major Comments
Minor Comments
Minor revisions could include clarifying the infection efficiency and expression levels of the viral constructs used in connectivity assays to rule out technical variability. - Literature Context:
The authors reference prior studies appropriately; however, integrating a brief discussion comparing their findings with alternative DS models (e.g., organoids or other hiPSC-derived systems) would improve contextual clarity. - Presentation and Clarity:
Figures are generally clear,.But the manuscript contains a minor labeling error. On page 13, the figure is erroneously labeled as "Fig6A", whereas, based on the context and corresponding data, it should be "Fig5A". I recommend that the authors correct this mistake to ensure consistency and avoid potential confusion for readers.
The work offers a substantial conceptual advance by providing a mechanistic link between trisomy 21 and impaired neuronal network synchronization. Technically, the study integrates state-of-the-art imaging, electrophysiology, and transcriptomic profiling, thereby offering a multifaceted view of DS-related neural dysfunction. Clinically, the findings have the potential to inform future therapeutic strategies targeting network connectivity and ion channel function in Down syndrome. - Context in the Existing Literature:
The study builds on previous observations of altered network activity in DS patients and DS mouse models (e.g., altered EEG synchronization and reduced synaptic connectivity). It extends these findings to human-derived neuronal models, thus bridging a gap between clinical observations and molecular/cellular mechanisms. Relevant literature includes studies on DS neurodevelopment and the role of ion channels in synaptic maturation. - Target Audience:
The reported findings will be of interest to researchers in neurodevelopmental disorders, Down syndrome, and ion channel physiology. Additionally, the study may attract the attention of those working on hiPSC-derived models of neurological diseases, as well as clinicians interested in the pathophysiology of DS. - Keywords and Field Contextualization:
Keywords: Down syndrome, trisomy 21, neuronal connectivity, synchronized network activity, hiPSC-derived cortical neurons, ion channel dysregulation.
Reviewer #2 (Public review):
Context and significance:
Distal renal tubular acidosis (dRTA) can be caused by mutations in a Cl-/HCO3- exchanger (kAE1) encoded by the SLC4A1 gene. The precise mechanisms underlying the pathogenesis of the disease due to these mutations is unclear, but it is thought that loss of the renal intercalated cells (ICs) that express kAE1 and/or aberrant autophagy pathway function in the remaining ICs may contribute to the disease. Understanding how mutations in SLC4A1 affect cell physiology and cells within the kidney, a major goal of this study, is an important first step to unraveling the pathophysiology of this complex heritable kidney disease.
Summary:
The authors identify a number of new mutations in the SLC4A1 gene in patients with diagnosed dRTA that they use for heterologous experiments in vitro. They also use a dRTA mouse model with a different SLC4A1 mutation for experiments in mouse kidneys. Contrary to previous work that speculated dRTA was caused mainly by trafficking defects of kAE1, the authors observe that their new mutants (with the exception of Y413H) traffic and localize at least partly to the basolateral membrane of polarized heterologous mIMCD3 cells, an immortalized murine collecting duct cell line. They go on to show that the remaining mutants induce abnormalities in the expression of autophagy markers and increased numbers of autophagosomes, along with an alkalinized intracellular pH. They also reported that cells expressing the mutated kAE1 had increased mitochondrial content coupled with lower rates of ATP synthesis. The authors also observed a partial rescue of the effects of kAE1 variants through artificially acidifying the intracellular pH. Taken together, this suggests a mechanism for dRTA independent of impaired kAE1 trafficking and dependent on intracellular pH changes that future studies should explore.
Strengths:
The authors corroborate their findings in cell culture with a well characterized dRTA KI mouse and provide convincing quantification of their images from the in vitro and mouse experiments. The data largely support the claims as stated. Some of the mutants induce different strengths of effects on autophagy and the various assays than others, and it is not clear why this is from the data in the manuscript. The authors provide discussion of potential reasons for these differences that future studies could explore.
Weaknesses:
The pH effects of their mutants are only explored in vitro, and the in vitro system has a number of differences from a living mouse kidney or ex vivo kidney slice.
Author response:
The following is the authors’ response to the original reviews.
Public Reviews:
Reviewer #1 (Public review):
Summary:
This study is an evaluation of patient variants in the kidney isoform of AE1 linked to distal renal tubular acidosis. Drawing on observations in the mouse kidney, this study extends findings to autophagy pathways in a kidney epithelial cell line.
Strengths:
Experimental data are convincing and nicely done.
Thank you
Weaknesses:
Some data are lacking or not explained clearly. Mutations are not consistently evaluated throughout the study, which makes it difficult to draw meaningful conclusions.
We have revised our manuscript to clarify some earlier explanations and provided rationale for focusing on specific variants throughout the study.
Reviewer #2 (Public review):
Context and significance:
Distal renal tubular acidosis (dRTA) can be caused by mutations in a Cl-/HCO3- exchanger (kAE1) encoded by the SLC4A1 gene. The precise mechanisms underlying the pathogenesis of the disease due to these mutations are unclear, but it is thought that loss of the renal intercalated cells (ICs) that express kAE1 and/or aberrant autophagy pathway function in the remaining ICs may contribute to the disease. Understanding how mutations in SLC4A1 affect cell physiology and cells within the kidney, a major goal of this study, is an important first step to unraveling the pathophysiology of this complex heritable kidney disease.
Summary:
The authors identify a number of new mutations in the SLC4A1 gene in patients with diagnosed dRTA that they use for heterologous experiments in vitro. They also use a dRTA mouse model with a different SLC4A1 mutation for experiments in mouse kidneys. Contrary to previous work that speculated dRTA was caused mainly by trafficking defects of kAE1, the authors observe that their new mutants (with the exception of Y413H, which they only use in Figure 1) traffic and localize at least partly to the basolateral membrane of polarized heterologous mIMCD3 cells, an immortalized murine collecting duct cell line. They go on to show that the remaining mutants induce abnormalities in the expression of autophagy markers and increased numbers of autophagosomes, along with an alkalinized intracellular pH. They also reported that cells expressing the mutated kAE1 had increased mitochondrial content coupled with lower rates of ATP synthesis. The authors also observed a partial rescue of the effects of kAE1 variants through artificially acidifying the intracellular pH. Taken together, this suggests a mechanism for dRTA independent of impaired kAE1 trafficking and dependent on intracellular pH changes that future studies should explore.
Strengths:
The authors corroborate their findings in cell culture with a well-characterized dRTA KI mouse and provide convincing quantification of their images from the in vitro and mouse experiments
Thank you
Weaknesses:
The data largely support the claims as stated, with some minor suggestions for improving the clarity of the work. Some of the mutants induce different strengths of effects on autophagy and the various assays than others, and it is not clear why this is from the present manuscript, given that they propose pHi and the unifying mechanism
We have modified our manuscript to discuss the various strengths of the mutants and emphasize that alteration of cytosolic pH by kAE1 variants may not be the only mechanism leading to dRTA.
Reviewer #3 (Public review):
Summary:
The authors have identified novel dRTA causing SLC4A1 mutations and studied the resulting kAE1 proteins to determine how they cause dRTA. Based on a previous study on mice expressing the dRTA kAE1 R607H variant, the authors hypothesize that kAE1 variants cause an increase in intracellular pH, which disrupts autophagic and degradative flux pathways. The authors clone these new kAE1 variants and study their transport function and subcellular localization in mIMCD cells. The authors show increased abundance of LC3B II in mIMCD cells expressing some of the kAE1 variants, as well as reduced autophagic flux using eGFP-RFP-LC3. These data, as well as the abundance of autophagosomes, serve as the key evidence that these kAE1 mutants disrupt autophagy. Furthermore, the authors demonstrate that decreasing the intracellular pH abrogates the expression of LC3B II in mIMCD cells expressing mutant SLC4A1. Lastly, the authors argue that mitochondrial function, and specifically ATP synthesis, is suppressed in mIMCD cells expressing dRTA variants and that mitochondria are less abundant in AICs from the kidney of R607H kAE1 mice. While the manuscript does reveal some interesting new results about novel dRTA causing kAE1 mutations, the quality of the data to support the hypothesis that these mutations cause a reduction in autophagic flux can be improved. In particular, the precise method of how the western blots and the immunofluorescence data were quantified, with included controls, would enhance the quality of the data and offer more supportive evidence of the authors' conclusions.
Strengths:
The authors cloned novel dRTA causing kAE1 mutants into expression vectors to study the subcellular localization and transport properties of the variants. The immunofluorescence images are generally of high quality, and the authors do well to include multiple samples for all of their western blots.
Thank you
Weaknesses:
Inconsistent results are reported for some of the variants. For example, R295H causes intracellular alkalinization but also has no effect on intracellular pH when measured by BCECF. The authors also appear to have performed these in vitro studies on mIMCD cells that were not polarized, and therefore, the localization of kAE1 to the basolateral membrane seems unlikely, based upon images included in the manuscript. Additionally, there is no in vivo work to demonstrate that these kAE1 variants alter intracellular pH, including the R607H mouse, which is available to the authors. The western blots are of varying quality, and it is often unclear which of the bands are being quantified. For example, LAMP1 is reported at 100kDa, the authors show three bands, and it is unclear which one(s) are used to quantify protein abundance. Strikingly, the authors report a nonsensical value for their quantification of LCRB II in Figure 2, where the ratio of LCRB II to total LCRB (I + II) is greater than one. The control experiments with starvation and bafilomyocin are not supportive and significantly reduce enthusiasm for the authors' findings regarding autophagy. There are labeling errors between the manuscript and the figures, which suggest a lack of vigilance in the drafting process.
The R295H variant was identified in a dRTA patient and as such, it was important to report it. However, this is the first mutation located in the amino-terminus of the protein, which may be involved in protein-protein interactions, so other mechanisms may cause dRTA for this variant. We have therefore modified our manuscript to state that alteration of cytosolic pH may not be the only mechanism leading to dRTA. At this time, we are not able to measure cytosolic pH in vivo and hope to be able to do it in the future.
In our revised manuscript, we also show cell surface biotinylation results supporting that plasma membrane abundance of the kAE1 S525F and R589H variants is not significantly different than WT in non-polarized mIMCD3 cells (Figure 3 A&B), in line with the predominant basolateral localization of the variants in polarized cells (Figure 1C). Therefore, these two mutant proteins are not mis-trafficked in non-polarized cells. Finally, we have clarified which bands have been used for quantification and corrected quantifications (including ratio measurements).
Recommendations for the authors:
Reviewer #1 (Recommendations for the authors):
(1) R295H is recessively inherited, whereas Y413H is dominantly inherited: this is interesting and may be linked to their cellular expression and function. Is this information known for the other mutations examined in this study?
The S25F and R589H dRTA variants have both been reported to exhibit autosomal dominant inheritance. This information is now updated in lines 146 and 158-159.
(2) R589H expression levels are evaluated in the Western blot of Figure 1, but localization and activity are not examined in Figure 2. However, R589H is included in autophagy experiments shown in later figures. Similarly, mutant R607H is the subject of several experiments further into the manuscript, but no initial analysis is provided for this variant.
Protein abundance and localization of the R589H mutant in mIMCD3 cells have been shown in our previous publication in Supplementary Fig 5D and Supplementary Fig 2J [1]. This now indicated on lines 158-159. Our previous paper also presented a detailed study of the R607H dRTA mutant, the mouse model corresponding to the human R589H mutation. This is now indicated on lines 70, 118-119 and 180. The present study builds upon those published findings.
(3) This inconsistency is confusing, detracts from the usefulness of the study, and makes the comparative analysis of mutations incomplete. It is difficult to extrapolate from published studies in MDCK1 cells, which show different results on trafficking.
The mIMCD3 cell line, which more closely resembles the physiology of the mouse collecting duct than MDCK cells, was selected for this study and our previous one [1]. Accordingly, the results obtained are better aligned with in vivo evidence. In contrast, differences in mutant protein expression and localization observed in other cell lines, like the MDCK cells, are likely attributable to differences in their cellular origin.
(4) In Figure 2, could the authors explain why total LC3B is graphed for the data shown in mouse lysates, whereas the ratio of bands is analysed for cell lysates? Both sets of data show the two LC3B bands.
Total LC3B levels were significantly increased in the mutant compared to WT; however, no significant difference was observed in the lipidation ratio. For this reason, that graph is not shown in the main paper but has been included in the Supplementary Figure 1D.
(5) In Figure 3, representative fluorescence images should be shown for all cell lines.
We have now included representative immunofluorescence images for all cell lines in Figure 3C.
(6) pH effects: Suggest that steady state pHi (Figure 3E) and rate of alkalization (Figure 1F) would be more effective together in Figure 1. The authors should show data for the effect of nigericin on cytoplasmic pH in Figure 3. If the rate of alkalinization in the mutant cells is reduced, shouldn't the intracellular steady state pH be more acidic? A cartoon depicting the transporter activity in the cell and the expected changes in pHi would be helpful. Is there a way to activate/inhibit NHE1 and rescue the effect of the mutant kAE1? It is unclear if the link between the mutant kAE1 and mitochondrial ATP production is a consequence of the intracellular pH or an indirect effect.
We opted to keep the effect of nigericin on pHi in Supplementary Fig1A given that Figure 3 already contains 11 panels. Also, in intercalated cells, the kAE1 protein physiologically exports 1 molecule of bicarbonate in exchange of 1 chloride ion import hence a reduced transport activity would result in a more alkaline intracellular pH. To clarify this point, we have included a diagram in Figure 1E as suggested. However, to calculate the rate of intracellular alkalinisation, the transporter is functioning in the opposite direction, i.e. extruding chloride and importing bicarbonate (see methods protocol for transport assay). Therefore, in this assay (Figure 1G), a defective chloride/bicarbonate activity results in a reduced rate of intracellular alkalinisation rate. This is now explained on lines 169-172.
Disruption of NHE1 function would impair sodium homeostasis and as such, potentially affect the activity of other proteins associated with acid-base balance and autophagy in collecting duct cells. Therefore, any resulting effects may not be confidently attributed specifically to the mutant kAE1. With nigericin, we aimed to alter pHi while affecting the least possible other ion concentration. Due to space considerations, Figure 1 has been reorganised to include the rate of alkalinisation and pHi (panels F and G).
Reviewer #2 (Recommendations for the authors):
(1) The authors could improve the readability of this manuscript for a general audience by clarifying and summarizing the respective phenotype(s)/effect(s) of the different mutants in some kind of table in the main figures. It is hard to keep track of the different disease mutants alongside the KI mouse mutations, as the text frequently discusses multiple mutants at a time.
As requested, we added two tables (Supplementary Tables 1 & 2) in Supplementary files summarizing the data obtained in this study. We hope this will help the readership to keep track of each variant’s phenotype.
(2) The subtitle of the results section of Figure 2 should be reworded to reflect that whole kidney lysates are used for the KI mice and not the other mutants.
As requested, the title in the Results section has been modified (lines 178-179).
(3) More discussion of why the different mutants cause different strengths of phenotypes should be included.
Different variants induce different degree of functional defects as seen in Figure 1F & G. The kAE1 R295H, the only amino acid substitution in the amino-terminal cytosol causing dRTA, does not affect the transporter’s function or cells’ pHi. Therefore, this variant may cause dRTA via a different pathway than transport-defective S525F or partially inactive R589H variants that both affect pHi. Our study does not exclude that dRTA may be caused by other defects than pHi alterations, including defective proteinprotein interactions. This discussion is now included in the manuscript on lines 386-391.
Reviewer #3 (Recommendations for the authors):
In general, I found the subject matter of this manuscript interesting and of value to the scientific community. The interpretation of the data and how much it supports the conclusion that "kAE1 variants increases pHi which alters mitochondrial function and leads to reduced cellular energy levels that eventually attenuate energy-dependent autophagic pathways" is largely incomplete. There are significant concerns about the quantification of Western blot data. Additionally, including the R607H variant in the in vitro experiments would improve the interpretation and extrapolation of in vitro data to the kidney.
We apologize for the confusion with R589H and R607H variants. The R607H mutant is the murine ortholog to the human R589H dRTA variation. To clarify this, we have added this information on line 180, in addition to lines 118-119 and line 70.
Suggestions:
(1) Can an anion replacement experiment be performed in the mIMCD cells (no Cl or no HCO3) to determine that bicarbonate transport through AE1 is responsible for the reduced ATP rates in Figure 5? Inclusion of WT +dox control would be helpful to convince the reader of the effects.
Because Seahorse real-time cell metabolism ATP rates measurements require specific and patented buffers with un-specified compositions, it was not possible to modify the Cl⁻ or HCO₃⁻ content during the ATP measurement assay. All cell lines, including empty vector cells (EV) were treated with doxycycline; thus, WT + dox was already included. The empty vector cell line treated with doxycycline allowed the exclusion of specific effects of doxycycline on mitochondrial activity as a control. This is now clarified in Figure 5 legend, lines 655-656.
(2) Can the authors measure pHi in fresh kidney sections from the R607H mouse?
Unfortunately, we are not currently able to measure pHi in fresh kidney sections and although we recognize it would benefit greatly to our study, establishing a new collaboration to perform this measurement would significantly delay the publication of this work; therefore, these results will not be available for the present manuscript.
(3) Does pH 7.0 media have any effect on autophagy, as shown in Figure 3? Why was pH 6.6 selected?
The idea was to artificially acidify pHi in mutant cell lines (that have a steady state alkaline pHi) and assess whether this acidification corrects autophagy defects. We first determined that incubation in cell culture medium at pH 6.6 with 0.033 µM nigericin (final potassium concentration: 168 mM) for 2 hours provided optimal conditions, i.e. ensuring cell viability over the 2-hour period while effectively lowering intracellular pH to 6.9, as demonstrated in Supplementary Figure 1A-C.
(4) In vitro experiments should be performed on polarized cells with kAE1 properly inserted in the basolateral membrane. Experiments on subconfluent, non-polarized cells do not support the hypothesis that transport functions of AE1 initiate the cascade of events attributed to these SLC4A1 mutations.
To address this point, we have performed cell surface biotinylations on 70-80 % confluent mIMCD3 cells expressing kAE1 WT, S525F or R589H mutants and show that cell surface abundance of the mutants is not significantly different from the WT protein. This is now shown in Figure 3 A&B. As cell surface biotinylation provides a more quantitative assessment of protein cell surface abundance, we have removed the immunofluorescence images from non-polarised cells and replaced them with representative immunoblots from a cell surface biotinylation assay.
Concerns:
(1) No information about the B1 ATPase antibody used.
Now provided in Supplementary Material, ATP6V1B1 Antibody from Bicell cat#20901.
(2) No actin band in Figure 1E (as prepared).
Actin bands are provided for each blot in Figure 1D.
(3) Figures 1E and 1F are labelled wrong in the figure versus the results section.
Thank you for letting us know, this is now corrected.
(4) The cortical sections shown in Figure 4 for the KI/KI do not appear to have the morphology of a CCD. The authors may want to consider including glomeruli to convince the reader of the localization of the tubules. Same concern with Figure 5G and I. The WT image in 5G does not have the morphology of a CCD. Principal cells should be predominant, and ICs should be dispersed.
Both figures 4 and 5 have been updated with images showing glomeruli (light blue “G” on figure) with neighbour and dispersed IC staining.
(5) The quantification of LAMP1 in Figure 4 is unclear. How did the authors determine the boundary of AICs, and how did they calculate the volume of lysosomes? If a zstack was used, how are the authors sure that their 10um section includes the entire AIC?
The quantification of LAMP1 is detailed under “Image analysis”, then “Volocity” sections in Supplementary Material. The boundary of A-IC was manually detected in Volocity based on the presence of the H<sup>+</sup>-ATPase before Volocity analysis for lysosomal volume as described in the Methods.
The 10 micron sections are expected to include full AIC as well as partial AIC, but the frequency of these events should be the same between WT and variants’ sections, therefore they were all included in the analysis if cells displayed H<sup>+</sup>-ATPase signal.
(6) Figure 5: There is no description of how ATP rates are calculated from the provided traces.
We used Agilent Seahorse XF ATP rate assay kit for this experiment. In this assay, the total ATP rate is the sum of ATP production rate from both glycolysis and oxidative phosphorylation. Glycolysis releases protons in a 1:1 ratio with ATP hence the glycolytic ATP rate is calculated from the glycolytic proton efflux rate (glycoPER). GlycoPER is determined by subtracting respiration linked proton efflux from total proton efflux by inhibiting complex I and III. This information is now added to Supplementary Material, in the “Metabolic Flux analysis” section.
(7) Figure labels in Figure 5 are wrong. It seems 5H (as presented) should actually be labeled 5G. In 5H (G?), why did some cells not have any TOM20 pixel intensity for S525F and R589H variants?
Confocal image acquisition in this experiment was kept under the same settings to allow comparison between samples. Therefore, some cells show dimer fluorescence than others. From the figure 5 panels, all cells showed TOM 20 pixel intensity. Figure 5H panel has been relabelled Figure 5G.
(8) In Figure 2, the summary graphs show analysis of more samples than are visible on the included western blots. What is the rationale for this? Why does S525F have 9 samples in BafA1 while R295H only has 3 (2H)? Yet, R295H has 6 samples in 2I. In 2D, S525F has at least 9 samples. Explain.
Figure 2A-C shows representative immunoblots, among several ones independently conducted. Therefore, the final number of samples is higher than showed on Figure 2. This is now indicated in Figure 2 legend, line 603. It became clear quite early in our study that the recessive kAE1 R295H variant does not behave similarly to the other variants studied, maybe because it affects the cytosolic domain, so we did not perform as many replicates for this variant as we did for the others. However, we felt it was valuable to the research community to report the characterization of this variant and decided to keep it in our study.
(9) In general, the actin loading does not appear to be equal between samples. And some figures show the same actin blot twice (2A, C) while some show independent actin bands for LC3B and p62. Equal loading seems a fairly significant control, considering the importance of quantification in the figures.
In addition to performing protein assays, we systematically conduct immunoblot with anti-b-actin antibody to control for loading variability. When possible, two or three proteins, including actin, are detected on the same blot, when molecular weight differ enough. This sometimes results in b-actin being used as a loading control for two different proteins, as seen on Figure 2A and 2C. This is now indicated on lines 605606.
(10) In the Supplemental Figure 2, which band is being quantified for mature CTSD at 33kDa? Same for intermediate CTSD. The quantification of V-ATPase seems questionable based on the actin variance shown in the blot. Surely the ratio of the fourth sample is greater than 1.
Supplementary Figure 2 has been updated to include arrows indicating which band was selected for the quantification. After verifying the measurements of band intensities from “Image Lab” quantification software, we confirm the results, including that fourth KI/KI sample has a ratio of 0.78 (Adj Total Band Vol (Int), lanes 10). Screen shots of quantifications are attached below.
Author response image 1.
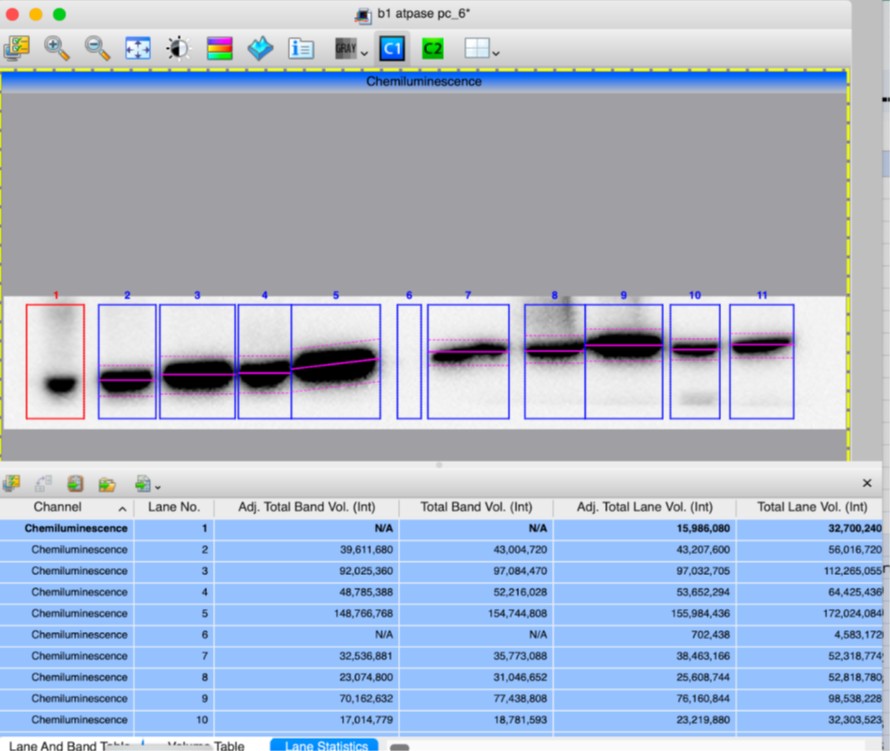
Author response image 2.
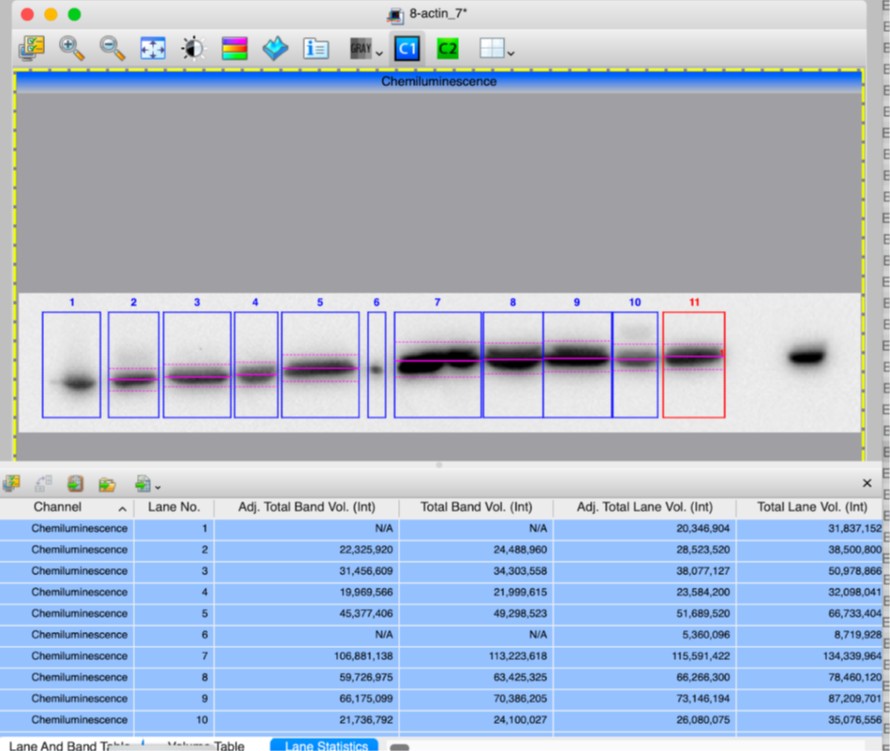
(11) Why are the experiments performed on non-confluent IMCD cells? Figure 1D shows good basolateral localization of AE1, yet the other experiments in the manuscript appear to use IMCD cells in low confluent states, without proper localization of AE1. Figure 3A shows AE1 dispersed throughout the cytoplasm. Why have the authors decided to study the effects of an anion exchanger without it being properly localized to the basolateral membrane? Shouldn't all experiments be performed in polarized IMCDs? If AE1 isnt properly in the membrane, and the cells do not have defined apico-basolateral polarity, then what role can AE1-mediated intracellular pH change have on the results of the experiments? Were the pHi experiments in 3E performed on polarized cells? Or even 1F?
To address this point, we have performed cell surface biotinylations on 70-80 % confluent mIMCD3 cells expressing kAE1 WT, S525F or R589H mutants and show that cell surface abundance of the mutants is not significantly different from the WT protein. This is now shown in Figure 3A & B. As it provides a more quantitative assessment of protein cell surface abundance, we have removed the immunofluorescence images from non-polarised cells and replaced them with a representative immunoblot from a cell surface biotinylation assay.
(12) As mentioned in the public comments, how is the ratio A/(A+B) greater than 1? With A and B > 0. In Figure 3, the data is reasonable, but in Figure 2, the data is simply impossible. What is the explanation for this phenomenon? Why was this presentation of data approved? Is it supposedly a fold of WT, like 2K and 2L? Is the reader also to believe that total LC3B is 2-fold greater in KI/KI mice, as shown in 2K? My eyes, though not densitometry equipment, cannot confirm this. The actin bands are not equal. Yet again, there are 4 lanes of KI/KI mice, but the quantification shows 5 samples.
The ratios in figure 2D, 2F, 2H and 2L have been re-calculated and corrected. As indicated above, immunoblots are representative and quantification of additional blots has been included in the graphs.
(12) Spelling error Figure 4B: cels.
Corrected
References
(1) Mumtaz, R. et al. Intercalated Cell Depletion and Vacuolar H+-ATPase Mistargeting in an Ae1 R607H Knockin Model. Journal of the American Society of Nephrology 28, 1507–1520 (2017).
Author response:
The following is the authors’ response to the original reviews.
Public Reviews:
Reviewer #1 (Public review):
Lahtinen et al. evaluated the association between polygenic scores and mortality. This question has been intensely studied (Sakaue 2020 Nature Medicine, Jukarainen 2022 Nature Medicine, Argentieri 2025 Nature Medicine), where most studies use PRS as an instrument to attribute death to different causes. The presented study focuses on polygenic scores of non-fatal outcomes and separates the cause of death into "external" and "internal". The majority of the results are descriptive, and the data doesn't have the power to distinguish effect sizes of the interesting comparisons: (1) differences between external vs. internal (2) differences between PGI effect and measured phenotype. I have two main comments:
(1) The authors should clarify whether the p-value reported in the text will remain significant after multiple testing adjustment. Some of the large effects might be significant; for example, Figure 2C
We have now added Benjamini-Hochberg multiple-testing adjusted p-values in the text each time we present nominal p-values. Additionally, supplementary tables S5 and S6 provide multiple-adjusted p-values for all analysed PGIs.
Although this was not always the case, many comparisons remained significant after multiple testing adjustments, especially in Figure 2C that the reviewer commented on. In the revised version, we have placed more emphasis on describing these HRs that have low p-values after multiple-test adjustment. The revised text for Figure 2C in the Results section now reads:
Panel C analyses mortality in three age-specific follow-up periods. The PGIs were more predictive of death in younger age groups, although the difference between the 25–64 and 65–79 age groups was small, except for the PGI of ADHD (HR=1.14, 95% CI 1.08; 1.21 for 25–64-year-olds; HR=1.04, 95% CI 1.00; 1.08 for 65–79-year-olds; p=0.008 for difference, p=0.27 after multiple-testing adjustment). PGIs predicted death only negligibly among those aged 80+, and the largest differences between the age groups 25–64 and 80+ were for PGIs of self-rated health (HR 0.87, 95% CI 0.82; 0.93 for 25–64-year-olds, HR 1.00, 95% CI 0.94; 1.04 for 80+ year-olds, p=2*10<sup>-4</sup> for difference, p=0.006 after multiple-testing adjustment), ADHD (HR 1.14, 95% CI 1.08; 1.21 for 25–64-year-olds, HR 0.99, 95% CI 0.95; 1.03 for 80+ year-olds, p=7*10<sup>-4</sup> for difference, p=0.012 after multiple-testing adjustment) and depressive symptoms (HR 1.12, 95% CI 1.06; 1.18 for 25–64-year-olds, HR 1.00, 95% CI 0.96; 1.04 for 80+ year-olds, p=0.002 for difference, p=0.032 after multiple-testing adjustment). Additionally, the difference in HRs between these age groups achieved significance after multiple testing adjustment at the conventional 5% level for PGIs of cigarettes per day, educational attainment, and ever smoking.
We have also included the recent study by Argentieri et al. (2025) in the literature review, which was missing from our previous version. We appreciate the reference. Other references mentioned were already included in the previous version of the manuscript.
(note that the small prediction accuracy of PGI in older age groups has been extensively studied, see Jiang, Holmes, and McVean, 2021, PLoS Genetics).
We would like to thank the reviewer for suggesting the relevant reference by Jiang et al. We have now expanded on the discussion of age-specific differences in the discussion section and included this reference.
(2) The authors might check if PGI+Phenotype has improved performance over Phenotype only. This is similar to Model 2 in Table 1, but slightly different.
The reviewer raises an interesting angle to approach the analysis. We have now added an analysis assessing the information criteria and the significance of improvement between nested models in Supplementary table S8. All the tested PGI+phenotype models show improvement over the phenotype-only model that is statistically significant at all conventional levels when tested by likelihood-ratio tests between nested models . Additionally, improvement was found when using Akaike and Bayesian (Schwarz) information criteria (albeit sometimes modest in size). We have added a passage in the results section briefly summarising this analysis:
Supplementary table S8 presents information criteria and significance tests on corresponding models. Models with PGI+phenotype (Models 2a–f) showed improvement over models with the phenotype only (Models 1a, 1c, 1e, 1g, 1i, 1k, with a p=0.0006 or lower) in terms of both Akaike information criterion (AIC) as well as Bayesian (Schwarz) information criterion (BIC) with a p=0.0006 or lower in all comparisons. The full Model 4 again showed improvement over the model with all PGIs jointly (Model 3b, with a p=0.0002 or p=0.00002, depending on continuous/categorical phenotype measurement), which had a lower AIC but not BIC.
Reviewer #2 (Public review):
Summary:
This study provides a comprehensive evaluation of the association between polygenic indices (PGIs) for 35 lifestyle and behavioral traits and all-cause mortality, using data from Finnish population- and family-based cohorts. The analysis was stratified by sex, cause of death (natural vs. external), age at death, and participants' educational attainment. Additional analyses focused on the six most predictive PGIs, examining their independent associations after mutual adjustment and adjustment for corresponding directly measured baseline risk factors.
Strengths:
Large sample size with long-term follow-up.
Use of both population- and family-based analytical approaches to evaluate associations.
Weaknesses:
It is unclear whether the PGIs used for each trait represent the most current or optimal versions based on the latest GWAS data.
To our reading, this comment is closely related to the “recommendations for the author” number 3 by reviewer 2, and we thus address them together.
If the Finnish data used in this study also contributed to the development of some of the PGIs, there is a risk of overestimating their associations with mortality due to overfitting or "double-dipping." Similar inflation of effect sizes has been observed in studies using the UK Biobank, which is widely used for PGI construction.
To our reading, this comment is closely related to the “recommendations for the author” 4 by reviewer 2, and we thus address them together.
Recommendations for the authors:
Reviewer #1 (Recommendations for the authors):
Specific comments:
(1) Cited reference 1 also investigated the PRS association with life span; cited reference 8 explains PRS association with healthy lifespan. Can authors be clearer about what is new in the context of these references? Specifically, what are the PGIs studied here that were not analyzed in the cited analyses?
Although some previous studies on the topic do exist, our analysis arguably has novelty in touching upon several unstudied or scarcely studied themes. These include:
A set of PGIs focusing on social, psychological, and behavioural phenotypes or PGIs for typically non-fatal health conditions.
An assessment of direct genetic effects/ confounding with a within-sibship design.
An assessment of potential heterogeneous effects by several socio-demographic characteristics.
An analysis of external causes of deaths (which can be hypothesised to be particularly relevant here, given the choice of our PGIs not focusing directly on typical causes of death).
A detailed assessment of the interplay of the most predictive PGIs with their corresponding phenotypes.
We have substantially revised the Introduction section focusing on making these novel contributions more explicit.
(2) In the Methods section, it is not very clear why the authors specifically study the "within-sibship" samples. Is this for avoiding nurturing effects from parental genotypes or for controlling assortative mating? The authors should clarify the rationale behind the design.
The substance-related rationale behind this approach was briefly discussed in the Introduction section while in the Methods section, we focused more on the technical description of our analyses. However, it is certainly worthwhile to clarify to the reader why within-sibship methods have been used. The revised passage in the methods section now states:
“In addition to this population sample, we used a within-sibship analysis sample to assess the extent of direct and indirect genetic associations captured by the PGIs, as discussed in the introduction.”
(3) Residual correlations of PGIs were no more than 0.050..." As a minor comment, since PGIs is a noisy variable, the correlation would be low; however, I don't think there are better ways to evaluate Cox assumptions, and in many cases, this assumption is not correct for strong predictors.
Yes, these points are true. Overall, it is often implausible that empirical distributions exactly match distributional assumptions in statistical models. For example, it may not be realistic to expect that the mortality hazards across categories of independent variables stay exactly proportional during long mortality-follow-ups; some deviations from constant proportions are almost inevitable. However, there are reasonable grounds to argue that in case of moderate violations of the proportional hazards assumption, the estimates still remain interpretable for practical uses. They can be read as approximating average relative hazards over the study period (for discussion, see pages 42–47 in Allison P. 2014. Event history and survival analysis: Regression for longitudinal event data (second edition). Thousand Oaks: SAGE).
(4) "PGI of ADHD (HR=1.08 95%CI 1.04;1.11 among men; HR=1.01 95%CI 0.97;1.05 among women; p=0.012 for difference)." Is this difference significant after multiple testing correction?
We have presented multiple-testing adjusted p-values together with nominal ones in this and in all other instances where they are mentioned in the text. Additionally, Supplementary tables S5–S6 present multiple-adjusted p-values for each PGIs studied.
(5) "Panel D displays that most PGIs had stronger associations with external (accidents, violent, suicide, and alcohol related deaths) than natural causes of death." Similar to the comment above, are there any results that are significantly different between internal and external?
We have added the p-values of those variables that had larger differences in the revised text. Quoting from the revised article: “The HR differences between external and natural causes of death were nominally significant at the conventional 5% level for cannabis use (p=0.016), drinks per week (p=0.028), left out of social activity (p=0.029), ADHD (p=0.031), BMI (p=0.035) and height (p=0.049), but none of these differences remained significant after adjusting for 35 multiple tests. “
(6) Table 1: The effect of the phenotype is stronger than the PGI; this is expected as PGI is a weak predictor and can be considered as "noised" measurement of true genetic value (Becker 2021 Nature Human behavior). Is there a way to adjust for the impact of noise in PGI at tagging genetic value and compare if the PGI effect is different from the phenotype effect?
PGIs are certainly imperfect measures that contain a lot of noise. However, extracting new information from what is unknown is an extremely demanding exercise, and still further complicated for example, by that we do not know the exact benchmark of total genetic effect we should be aiming at. Different methods of heritability estimation, for instance, often give dramatically differing results – for reasons that are still up to scrutiny.
We are thus not familiar with a method that could achieve satisfactory answer for this challenging task.
Reviewer #2 (Recommendations for the authors):
(3) Justification and Selection of PGIs:
For several traits, such as BMI, multiple polygenic indices (PGIs) are currently available. The criteria used to select specific PGIs for this study are not clearly described. A more systematic and reproducible approach-for example, leveraging metadata from the PGS Catalog-could strengthen the justification for PGI selection and enhance the study's generalizability.
There are numerous PGIs developed in the extensive GWAS literature, but a finite set of PGIs always needs to be chosen for any analysis. The rationale behind our decision to include every PGI from the repository of Becker et al. 2021 (full reference in the manuscript, see also https://www.thessgac.org/pgi-repository) that was available for the Finnish data (including the possibility to exclude overlapping samples, see our response to the next comment for more discussion) was to provide rigorous analysis by limiting the researchers degrees of freedom in arbitrarily choosing PGIs. Although it would have been tempting to not use some PGIs that were not expected to substantially correlate with mortality, we believe that our conservative strategy increases the credibility of the reported p-values, particularly the multiple adjustment should now work as intended.
We also mention now this rationale when discussing the chosen PGIs in the methods section: “As the independent variables of main interest, we used 35 different PGIs in the Polygenic Index repository by Becker et al., which were mainly based on GWASes using UK Biobank and 23andMe, Inc. data samples, but also other data collections. They were tailored for the Finnish data, i.e., excluding overlapping individuals between the original GWAS and our analysis and performing linkage-disequilibrium adjustment. We used every single-trait PGI defined in the repository (except for subjective well-being, for which we were unable to obtain a meta-analysis version that excluded the overlapping samples). By limiting the researchers’ freedom in selecting the measures, this conservative strategy should increase the validity of our estimates, particularly with regards to multiple-testing adjusted p-values.”
(4) Overlap Between PGI Training Data and Study Sample:
The authors should describe any overlap between the data used to develop the PGIs and the current study sample. If such overlap exists, it may lead to overestimation of effect sizes due to "double-dipping." A discussion of this issue and its potential implications is warranted, as similar concerns have been raised in studies using UK Biobank data.
This is, fortunately, not a concern of our analysis. Overlapping samples were excluded in creating the PGIs that we used. We have now described this more clearly in the revised methods section.
(1) Clarify the Methodology for Family-Based Cox Analysis:
It is unclear what specific method was used to perform Cox regression in the family-based analysis. Please provide additional methodological details. ”
We have described the method further and added an additional reference in the revision. The text now stands:
“We compared these models to the corresponding within-sibship models, using the sibship identifier as the strata variable. This method employs a sibship-specific (instead of a whole-sample-wide baseline hazard in the population models) baseline hazard, and corresponds to a fixed-effects model in some other regression frameworks (e.g., linear model with sibship-specific intercepts)”
(2) Clarify Timing of Measured Risk Factors Relative to Follow-Up:
The main text should provide more detailed information regarding the timing of data collection for directly measured risk factors. Specifically, it should be clarified whether the measurements used correspond to the first available data for each individual after the start of follow-up, or if a different criterion was applied.
BMI, self-rated health, alcohol consumption and smoking status were measured at the baseline survey of each dataset. Education was registered as the highest completed degree up to the end of 2019. Depression was a composite of survey self-report (at the time of the baseline survey), as well as depression-related medicine purchases and hospitalizations over a two-year period before the start of the individual’s follow-up.
We have added more comprehensive information on the measurement of the phenotypes of interest in Supplementary table 2, including the timing of the measurement.
eil Evans has perceptivelydrawn out the link between production and pleasure: ‘Resorts were theproduct of an industrial society ... Industry’s effect on the urban patternwas fundamental but never simple; it impinged ... far beyondproduction into distribution, exchange and leisure. It made countinghouses and playgrounds as well as workshops and dormitories.’10
significant quote to reference
A. H. Dodd’s Short History of Wales (1972) managestwo indexed references to Tenby, three to Aberystwyth and seven toSwansea, yet none of these allude to their roles as resorts
historiography on welsh seaside resorts were originally sprase despite their huge presence
the focus is usually only on the docks - the industrial aspects are looked at but not the leisure aspect
We’ve now looked at how different ways of storing data and putting constraints on data can make social media systems work better for some people than others, and we’ve looked at how this data also informs decision-making and who is taken into account in ethics analyses. Given all that can be at stake in making decisions on how data will be stored and constrained, choose one type of data a social media site might collect (e.g., name, age, location, gender, posts you liked, etc.), and then choose two different ethics frameworks and consider what each framework would mean for someone choosing how that data will be stored and constrained.
This section made me realize that storing personal data on social media is not just a technical question, but also an ethical one. For example, age can be stored as a number, but platforms still need to decide how precise it should be and how it might be used or misused. It also made me question whether some data, like exact address, really needs to be stored at all given the privacy risks.
In fact, I have always been puzzled about the collection of information such as "region" and "age". Is it really "necessary" for companies to collect such information? These pieces of information do not guarantee that the account is used by a real person - fake accounts can also randomly generate combinations of these pieces of information, but it will increase the risk of user information leakage
If we look at a data field like gender, there are different ways we might try to represent it. We might try to represent it as a binary field, but that would exclude people who don’t fit within a gender binary. So we might try a string that allows any values, but taking whatever text users end up typing might make data that is difficult to work with (what if they make a typo or use a different language?). So we might store gender using strings, but this time use a preset list of options for users to choose from, perhaps with a way of choosing “other,” and only then allow the users to type their own explanation if our categories didn’t work for them. Perhaps you question whether you want to store gender information at all. Now it’s your turn, choose some data that you might want to store on a social media type, and think through the storage types and constraints you might want to use: Age Name Address Relationship status etc.
I found the discussion about representing gender as data especially thoughtful, because it shows how technical design decisions can have real social consequences. Treating gender as a simple binary might make data easier to process, but it can erase people’s identities and experiences. I also like the idea of combining preset options with an “other” field, since it balances inclusivity with the need for usable and consistent data.
If we look at a data field like gender, there are different ways we might try to represent it. We might try to represent it as a binary field, but that would exclude people who don’t fit within a gender binary. So we might try a string that allows any values, but taking whatever text users end up typing might make data that is difficult to work with (what if they make a typo or use a different language?). So we might store gender using strings, but this time use a preset list of options for users to choose from, perhaps with a way of choosing “other,” and only then allow the users to type their own explanation if our categories didn’t work for them. Perhaps you question whether you want to store gender information at all.
I like how this example shows that even something that seems simple like a “data field” actually involves a lot of value judgments. Every way of storing gender has tradeoffs between inclusivity, usability, and data cleanliness, and there isn’t a purely technical solution. It also made me stop and think about whether collecting certain data is even necessary in the first place.
Unless people make a conscious effort to engage in physical activity and devote a proportion of their leisure time to doing so, it is unlikely that they will accumulate enough physical activity for health benefits.
Exercising is time-consuming, but it is essential for a healthy lifestyle ...
Images are created by defining a grid of dots, called pixels. Each pixel has three numbers that define the color (red, green, and blue), and the grid is created as a list (rows) of lists (columns).
The pixels that only have three color components have always made me really curious, as there is only green, blue,e and red, ed but once they are in a group,oup tcane to create a whole new different color that sometimes seems impossible. Additionally, one of the most intruiging thing about these grids is that with only these three colors, they can create the color white.
Dates and Times#
I find the discussion about the ambiguity of yesterday particularly insightful because it highlights how objective data like a timestamp is actually dependent on the observer's context, if a social media platform's automated system flags behavior based on a specific day, but that day starts and ends at different times for the user and the server. This creates a data friction that can lead to unfair outcomes, which indicates that information systems aren't neutral tools, they are specific temporal assumptions, and things might change quickly and might not reflect the lived experience of global users.
In addition to the main components of the images, sound, and video data, this information is often stored with metadata, such as: The time the image/sound/video was created The location where the image/sound/video was taken The type of camera or recording device used to create the image/sound/video etc.
This clearly explains the use and importance of metadata. Although I often hear the term in computer science classes, I hadn’t fully understood why it is so important. In this context, I’ve learned that beyond the visible content in images, sounds, or videos, there is additional information such as time, location, or device type. This metadata may not interest the viewer directly but can be valuable for platform management, data analysts, or other stakeholders.
‘good number’had been spotted on the beach, bathing machines had been installedon the sands and were ‘well patronised’
Bathing machines were a significantly good sign - used for ladies to change and bath - it wasn't just a rough plae but a place where ladies could bathe and feel safe
Barry’s beach could not yet compete with such entertainment. InMay 1888, the editor of the Barry and Cadoxton Journal lamented thesad ‘neglect’ of Whitmore Bay by locals. He explained that a ‘great manyinhabitants of Cadoxton have never seen it [the beach], although it isso close at hand’. Aware that most Barrians were new arrivals and wereunfamiliar with the district, the editor helpfully included directions onhow to get to the seashore from east Barry and Cadoxton. It was worththe effort, he assured his readers, for it was a ‘delightful spot’ – ‘verypretty’ and made of ‘real sand’, not the ‘muddy black sand’ found atPenarth.51
idk need to waffle but brain cant lol
The rapidly urbanizing settlements of Barry and Cadoxton quicklyfilled up with new residents. For the first time, large numbers were liv-ing within walking distance of the beach.
Highlights the leisure too - these were not tourists but residents. seaside resorts also became a place of genral recreation like the big parks in london - this is something mitskell doesn't highlight, but could be due to the resorts purpose moreso as a high-class resort - it still woulda had workers in the town tho
It was all very well having a new railway, but it was still an openquestion as to whether tourists would be welcomed back to BarryIsland.
Unlike Mitskell's choice of case study, Croll's decision of Barry has clear differences, it alludes greater to the impact of external factors like landowners on the relationship between industrialisation and tourism, with Lord Windsor, upon his purchase of Barry Island, Croll notes, banning visitors from the Island and prohibiting the becoming industrialisation of the Island. As such, Croll's choice of case study is interesting, and broadens the (complexities) of studying Welsh seaside resorts further. Through the case study, he suggests how landowners often decided the nature of the relationship between industrialisation and leisure, with the ammenities required for each at the whim of (blah)
nd that railway ran right up to the Rhondda valleys, home to morethan 80,000 inhabitants and growing steadily.3 The railway was built toconvey coal to Barry, but it would eventually be used by trippers.
like mitskell, highlights the importance of the railway in the influx of tourism. Both authors draw a clear link between this industrial development and the development of tourism. This concept of the connecting power of railway is greater developed by (blah) as he notes how this then connected the industrial workers of the rhondda valleys to Barry. This further suggests a strong relationship between industry and leisure. Industrialisation had facilitated a new working (), which saw disposable income increase for many, while industrial action encouraged parliamentary acts such as the (factory act and bank holiday acts with dates) which increased the free-time that workers could use to engage in the leisure industry, resorts like swansea and Barry, as both authors note, becoming places to do it (altho swansea's clientele was a little more posh
Reviewer #1 (Public review):
Summary:
Carloni et al. comprehensively analyze which proteins bind repetitive genomic elements in Trypanosoma brucei. For this, they perform mass spectrometry on custom-designed, tagged programmable DNA-binding proteins. After extensively verifying their programmable DNA-binding proteins (using bioinformatic analysis to infer target sites, microscopy to measure localization, ChIP-seq to identify binding sites), they present, among others, two major findings: 1) 14 of the 25 known T. brucei kinetochore proteins are enriched at 177bp repeats. As T. brucei's 177bp repeat-containing intermediate-sized and mini-chromosomes lack centromere repeats but are stable over mitosis, Carloni et al. use their data to hypothesize that a 'rudimentary' kinetochore assembles at the 177bp repeats of these chromosomes to segregate them. 2) 70bp repeats are enriched with the Replication Protein A complex, which, notably, is required for homologous recombination. Homologous recombination is the pathway used for recombination-based antigenic variation of the 70bp-repeat-adjacent variant surface glycoproteins.
Strengths and Weaknesses:
The manuscript was previously reviewed through Review Commons. As noted there, the experiments are well controlled, the claims are well supported, and the methods are clearly described. The conclusions are convincing. All concerns I raised have been addressed except one (minor point #8):
"The way the authors mapped the ChIP-seq data is potentially problematic when analyzing the same repeat type in different genomic regions. Reads with multiple equally good mapping positions were assigned randomly. This is fine when analyzing repeats by type, independent of genomic position, which is what the authors do to reach their main conclusions. However, several figures (Fig. 3B, Fig. 4B, Fig. 5B, Fig. 7) show the same repeat type at specific genomic locations." Due to the random assignment, all of these regions merely show the average signal for the given repeat. I find it misleading that this average is plotted out at "specific" genomic regions.<br /> Initially, I suggested a workaround, but the authors clarified why the workaround was not feasible, and their explanation is reasonable to me. That said, the figures still show a signal at positions where they can't be sure it actually exists. If this cannot be corrected analytically, it should at least be noted in the figure legends, Results, or Discussion.
Importantly, the authors' conclusions do not hinge on this point; they are appropriately cautious, and their interpretations remain valid regardless.
Significance:
This work is of high significance for chromosome/centromere biology, parasitology, and the study of antigenic variation. For chromosome/centromere biology, the conceptual advancement of different types of kinetochores for different chromosomes is a novelty, as far as I know. It would certainly be interesting to apply this study as a technical blueprint for other organisms with mini-chromosomes or chromosomes without known centromeric repeats. I can imagine a broad range of labs studying other organisms with comparable chromosomes to take note of and build on this study. For parasitology and the study of antigenic variation, it is crucial to know how intermediate- and mini-chromosomes are stable through cell division, as these chromosomes harbor a large portion of the antigenic repertoire. Moreover, this study also found a novel link between the homologous repair pathway and variant surface glycoproteins, via the 70bp repeats. How and at which stages during the process, 70bp repeats are involved in antigenic variation is an unresolved, and very actively studied, question in the field. Of course, apart from the basic biological research audience, insights into antigenic variation always have the potential for clinical implications, as T. brucei causes sleeping sickness in humans and nagana in cattle. Due to antigenic variation, T. brucei infections can be chronic.
Comments on revised version:
All my recommendations have been addressed.
Author response:
Point-by-point description of the revisions:
Reviewer #1 (Evidence, reproducibility and clarity):
Summary
In this article, the authors used the synthetic TALE DNA binding proteins, tagged with YFP, which were designed to target five specific repeat elements in Trypanosoma brucei genome, including centromere and telomeres-associated repeats and those of a transposon element. This is in order to detect and identified, using YFP-pulldown, specific proteins that bind to these repetitive sequences in T. brucei chromatin. Validation of the approach was done using a TALE protein designed to target the telomere repeat (TelR-TALE) that detected many of the proteins that were previously implicated with telomeric functions. A TALE protein designed to target the 70 bp repeats that reside adjacent to the VSG genes (70R-TALE) detected proteins that function in DNA repair and the protein designed to target the 177 bp repeat arrays (177R-TALE) identified kinetochore proteins associated T. brucei mega base chromosomes, as well as in intermediate and mini-chromosomes, which imply that kinetochore assembly and segregation mechanisms are similar in all T. brucei chromosome.
Major comments:
Are the key conclusions convincing?
The authors reported that they have successfully used TALE-based affinity selection of proteinassociated with repetitive sequences in the T. brucei genome. They claimed that this study has provided new information regarding the relevance of the repetitive region in the genome to chromosome integrity, telomere biology, chromosomal segregation and immune evasion strategies. These conclusions are based on high-quality research, and it is, basically, merits publication, provided that some major concerns, raised below, will be addressed before acceptance for publication.
(1) The authors used TALE-YFP approach to examine the proteome associated with five different repetitive regions of the T. brucei genome and confirmed the binding of TALE-YFP with Chip-seq analyses. Ultimately, they got the list of proteins that bound to synthetic proteins, by affinity purification and LS-MS analysis and concluded that these proteins bind to different repetitive regions of the genome. There are two control proteins, one is TRF-YFP and the other KKT2-YFP, used to confirm the interactions. However, there are no experiment that confirms that the analysis gives some insight into the role of any putative or new protein in telomere biology, VSG gene regulation or chromosomal segregation. The proteins, which have already been reported by other studies, are mentioned. Although the author discovered many proteins in these repetitive regions, their role is yet unknown. It is recommended to take one or more of the new putative proteins from the repetitive elements and show whether or not they (1) bind directly to the specific repetitive sequence (e.g., by EMSA); (2) it is recommended that the authors will knockdown of one or a small sample of the new discovered proteins, which may shed light on their function at the repetitive region, as a proof of concept.
The main request from Referee 1 is for individual evaluation of protein-DNA interaction for a few candidates identified in our TALE-YFP affinity purifications, particularly using EMSA to identify binding to the DNA repeats used for the TALE selection. In our opinion, such an approach would not actually provide the validation anticipated by the reviewer. The power of TALE-YFP affinity selection is that it enriches for protein complexes that associate with the chromatin that coats the target DNA repetitive elements rather than only identifying individual proteins or components of a complex that directly bind to DNA assembled in chromatin.
The referee suggests we express recombinant proteins and perform EMSA for selected candidates, but many of the identified proteins are unlikely to directly bind to DNA – they are more likely to associate with a combination of features present in DNA and/or chromatin (e.g. specific histone variants or histone post-translational modifications). Of course, a positive result would provide some validation but only IF the tested protein can bind DNA in isolation – thus, a negative result would be uninformative.
In fact, our finding that KKT proteins are enriched using the 177R-TALE (minichromosome repeat sequence) identifies components of the trypanosome kinetochore known (KKT2) or predicted (KKT3) to directly bind DNA (Marciano et al., 2021; PMID: 34081090), and likewise the TelR-TALE identifies the TRF component that is known to directly associate with telomeric (TTAGGG)n repeats (Reis et al 2018; PMID: 29385523). This provides reassurance on the specificity of the selection, as does the lack of cross selectivity between different TALEs used (see later point 3 below). The enrichment of the respective DNA repeats quantitated in Figure 2B (originally Figure S1) also provides strong evidence for TALE selectivity.
It is very likely that most of the components enriched on the repetitive elements targeted by our TALE-YFP proteins do not bind repetitive DNA directly. The TRF telomere binding protein is an exception – but it is the only obvious DNA binding protein amongst the many proteins identified as being enriched in our TelR-TALE-YFP and TRF-YFP affinity selections.
The referee also suggests that follow up experiments using knockdown of the identified proteins found to be enriched on repetitive DNA elements would be informative. In our opinion, this manuscript presents the development of a new methodology previously not applied to trypanosomes, and referee 2 highlights the value of this methodological development which will be relevant for a large community of kinetoplastid researchers. In-depth follow-up analyses would be beyond the scope of this current study but of course will be pursued in future. To be meaningful such knockdown analyses would need to be comprehensive in terms of their phenotypic characterisation (e.g. quantitative effects on chromosome biology and cell cycle progression, rates and mechanism of recombination underlying antigenic variation, etc) – simple RNAi knockdowns would provide information on fitness but little more. This information is already publicly available from genome-wide RNAi screens (www.tritrypDB.org), with further information on protein location available from the genome-wide protein localisation resource (Tryptag.org). Hence basic information is available on all targets selected by the TALEs after RNAi knock down but in-depth follow-up functional analysis of several proteins would require specific targeted assays beyond the scope of this study.
(2) NonR-TALE-YFP does not have a binding site in the genome, but YFP protein should still be expressed by T. brucei clones with NLS. The authors have to explain why there is no signal detected in the nucleus, while a prominent signal was detected near kDNA (see Fig.2). Why is the expression of YFP in NonR-TALE almost not shown compared to other TALE clones?
The NonR-TALE-YFP immunolocalisation signal indeed is apparently located close to the kDNA and away from the nucleus. We are not sure why this is so, but the construct is sequence validated and correct. However, we note that artefactual localisation of proteins fused to a globular eGFP tag, compared to a short linear epitope V5 tag, near to the kinetoplast has been previously reported (Pyrih et al, 2023; PMID: 37669165).
The expression of NonR-TALE-YFP is shown in Supplementary Fig. S2 in comparison to other TALE proteins. Although it is evident that NonR-TALE-YFP is expressed at lower levels than other TALEs (the different TALEs have different expression levels), it is likely that in each case the TALE proteins would be in relative excess.
It is possible that the absence of a target sequence for the NonR-TALE-YFP in the nucleus affects its stability and cellular location. Understanding these differences is tangential to the aim of this study.
However, importantly, NonR-TALE-YFP is not the only control for used for specificity in our affinity purifications. Instead, the lack of cross-selection of the same proteins by different TALEs (e.g. TelR-TALE-YFP, 177R-TALE-YFP) and the lack of enrichment of any proteins of interest by the well expressed ingiR-TALE-YFP or 147R-TALE-YFP proteins each provide strong evidence for the specificity of the selection using TALEs, as does the enrichment of similar protein sets following affinity purification of the TelR-TALE-YFP and TRF-YFP proteins which both bind telomeric (TTAGGG)n repeats. Moreover, control affinity purifications to assess background were performed using cells that completely lack an expressed YFP protein which further support specificity (Figure 6).
We have added text to highlight these important points in the revised manuscript:
Page 8:
“However, the expression level of NonR-TALE-YFP was lower than other TALE-YFP proteins; this may relate to the lack of DNA binding sites for NonR-TALE-YFP in the nucleus.”
Page 8:
“NonR-TALE-YFP displayed a diffuse nuclear and cytoplasmic signal; unexpectedly the cytoplasmic signal appeared to be in the vicinity the kDNA of the kinetoplast (mitochrondria). We note that artefactual localisation of some proteins fused to an eGFP tag has previously been observed in T. brucei (Pyrih et al, 2023).”
Page 10:
Moreover, a similar set of enriched proteins was identified in TelR-TALE-YFP affinity purifications whether compared with cells expressing no YFP fusion protein (No-YFP), the NonR-TALE-YFP or the ingiR-TALE-YFP as controls (Fig. S7B, S8A; Tables S3, S4). Thus, the most enriched proteins are specific to TelR-TALE-YFP-associated chromatin rather than to the TALE-YFP synthetic protein module or other chromatin.
(3) As a proof of concept, the author showed that the TALE method determined the same interacting partners enrichment in TelR-TALE as compared to TRF-YFP. And they show the same interacting partners for other TALE proteins, whether compared with WT cells or with the NonR-TALE parasites. It may be because NonR-TALE parasites have almost no (or very little) YFP expression (see Fig. S3) as compared to other TALE clones and the TRF-YFP clone. To address this concern, there should be a control included, with proper YFP expression.
See response to point 2, but we reiterate that the ingi-TALE -YFP and 147R-TALE-YFP proteins are well expressed (western original Fig. S3 now Fig. S2) but few proteins are detected as being enriched or correspond to those enriched in TelR-TALE-YFP or TRF-YFP affinity purifications (see Fig. S9). Therefore, the ingi-TALE -YFP and 147R-TALE-YFP proteins provide good additional negative controls for specificity as requested. To further reassure the referee we have also included additional volcano plots which compare TelR-TALE-YFP, 70R-TALE-YFP or 177R-TALE-YFP to the ingiR-TALE-YFP affinity selection (new Figure S8). As with No-YFP or NonR-TALE-YFP controls, the use of ingiR-TALE-YFP as a negative control demonstrates that known telomere associated proteins are enriched in TelR-TALE-YFP affinity purification, RPA subunits enriched with 70R-TALE-YFP and Kinetochore KKT poroteins enriched with 177RTALE-YFP. These analyses demonstrate specificity in the proteins enriched following affinity purification of our different TALE-YFPs and provide support to strengthen our original findings.
We now refer to use of No-YFP, NonR-TALE-YFP, and ingiR-TALE -YFP as controls for comparison to TelR-TALE-YFP, 70R-TALE-YFP or 177R-TALE-YFP in several places:
Page10:
“Moreover, a similar set of enriched proteins was identified in TelR-TALE-YFP affinity purifications whether compared with cells expressing no YFP fusion protein (No-YFP), the NonR-TALE-YFP or the ingiR-TALE-YFP as controls (Fig. S7B, S8A; Tables S3, S4).”
Page 11:
“Thus, the nuclear ingiR-TALE-YFP provides an additional chromatin-associated negative control for affinity purifications with the TelR-TALE-YFP, 70R-TALE-YFP and 177R-TALE-YFP proteins (Fig. S8).”
“Proteins identified as being enriched with 70R-TALE-YFP (Figure 6D) were similar in comparisons with either the No-YFP, NonR-TALE-YFP or ingiR-TALE-YFP as negative controls.”
Top Page 12:
“The same kinetochore proteins were enriched regardless of whether the 177R-TALE proteomics data was compared with No-YFP, NonR-TALE or ingiR-TALE-YFP controls.”
Discussion Page 13:
“Regardless, the 147R-TALE and ingiR-TALE proteins were well expressed in T. brucei cells, but their affinity selection did not significantly enrich for any relevant proteins. Thus, 147R-TALE and ingiR-TALE provide reassurance for the overall specificity for proteins enriched TelR-TALE, 70R-TALE and 177R-TALE affinity purifications.”
(4) After the artificial expression of repetitive sequence binding five-TALE proteins, the question is if there is any competition for the TALE proteins with the corresponding endogenous proteins? Is there any effect on parasite survival or health, compared to the control after the expression of these five TALEs YFP protein? It is recommended to add parasite growth curves, for all the TALE proteins expressing cultures.
Growth curves for cells expressing TelR-TALE-YFP, 177R-TALE-YFP and ingiR-TALE-YFP are now included (New Fig S3A). No deficit in growth was evident while passaging 70R-TALE-YFP, 147R-TALE-YFP, NonR-TALE-YFP cell lines (indeed they grew slightly better than controls).
The following text has been added page 8:
“Cell lines expressing representative TALE-YFP proteins displayed no fitness deficit (Fig. S3A).”
(5) Since the experiments were performed using whole-cell extracts without prior nuclear fractionation, the authors should consider the possibility that some identified proteins may have originated from compartments other than the nucleus. Specifically, the detection of certain binding proteins might reflect sequence homology (or partial homology) between mitochondrial DNA (maxicircles and minicircles) and repetitive regions in the nuclear genome. Additionally, the lack of subcellular separation raises the concern that cytoplasmic proteins could have been co-purified due to whole cell lysis, making it challenging to discern whether the observed proteome truly represents the nuclear interactome.
In our experimental design, we confirmed bioinformatically that the repeat sequences targeted were not represented elsewhere in the nuclear or mitochondrial genome (kDNA). The absence of subcellular fractionation could result in some cytoplasmic protein selection, but this is unlikely since each TALE targets a specific DNA sequence but is otherwise identical such that cross-selection of the same contaminating protein set would be anticipated if there was significant non-specific binding. We have previously successfully affinity selected 15 chromatin modifiers and identified associated proteins without major issues concerning cytoplasmic protein contamination (Staneva et al 2021 and 2022; PMID: 34407985 and 36169304). Of course, the possibility that some proteins are contaminants will need to be borne in mind in any future follow-up analysis of proteins of interest that we identified as being enriched on specific types of repetitive element in T. brucei. Proteins that are also detected in negative control, or negative affinity selections such as No-YFP, NoR-YFP, IngiR-TALE or 147R-TALE must be disregarded.
(6) Should the authors qualify some of their claims as preliminary or speculative, or remove them altogether?
As mentioned earlier, the author claimed that this study has provided new information concerning telomere biology, chromosomal segregation mechanisms, and immune evasion strategies. But there are no experiments that provides a role for any unknown or known protein in these processes. Thus, it is suggested to select one or two proteins of choice from the list and validate their direct binding to repetitive region(s), and their role in that region of interaction.
As highlighted in response to point 1 the suggested validation and follow up experiments may well not be informative and are beyond the scope of the methodological development presented in this manuscript. Referee 2 describes the study in its current form as “a significant conceptual and technical advancement” and “This approach enhances our understanding of chromatin organization in these regions and provides a foundation for investigating the functional roles of associated proteins in parasite biology.”
The Referee’s phrase ‘validate their direct binding to repetitive region(s)’ here may also mean to test if any of the additional proteins that we identified as being enriched with a specific TALE protein actually display enrichment over the repeat regions when examined by an orthogonal method. A key unexpected finding was that kinetochore proteins including KKT2 are enriched in our affinity purifications of the 177R-TALE-YFP that targets 177bp repeats (Figure 6F). By conducting ChIP-seq for the kinetochore specific protein KKT2 using YFP-KKT2 we confirmed that KKT2 is indeed enriched on 177bp repeat DNA but not flanking DNA (Figure 7). Moreover, several known telomere-associated proteins are detected in our affinity selections of TelRTALE-YFP (Figure 6B, FigS6; see also Reis et al, 2018 Nuc. Acids Res. PMID: 29385523; Weisert et al, 2024 Sci. Reports PMID: 39681615).
Would additional experiments be essential to support the claims of the paper? Request additional experiments only where necessary for the paper as it is, and do not ask authors to open new lines of experimentation.
The answer for this question depends on what the authors want to present as the achievements of the present study. If the achievement of the paper was is the creation of a new tool for discovering new proteins, associated with the repeat regions, I recommend that they add a proof for direct interactions between a sample the newly discovered proteins and the relevant repeats, as a proof of concept discussed above, However, if the authors like to claim that the study achieved new functional insights for these interactions they will have to expand the study, as mentioned above, to support the proof of concept.
See our response to point 1 and the point we labelled ‘6’ above.
Are the suggested experiments realistic in terms of time and resources? It would help if you could add an estimated cost and time investment for substantial experiments.
I think that they are realistic. If the authors decided to check the capacity of a small sample of proteins (which was unknown before as a repetitive region binding proteins) to interacts directly with the repeated sequence, it will substantially add of the study (e.g., by EMSA; estimated time: 1 months). If the authors will decide to check the also the function of one of at least one such a newly detected proteins (e.g., by KD), I estimate the will take 3-6 months.
As highlighted previously the proposed EMSA experiment may well be uninformative for protein complex components identified in our study or for isolated proteins that directly bind DNA in the context of a complex and chromatin. RNAi knockdown data and cell location data (as well as developmental expression and orthology data) is already available through tritrypDB.org and trtyptag.org
Are the data and the methods presented in such a way that they can be reproduced? Yes
Are the experiments adequately replicated, and statistical analysis adequate?
The authors did not mention replicates. There is no statistical analysis mentioned.
The figure legends indicate that all volcano plots of TALE affinity selections were derived from three biological replicates. Cutoffs used for significance: P < 0.05 (Student's t-test).
For ChiP-seq two biological replicates were analysed for each cell line expressing the specific YFP tagged protein of interest (TALE or KKT2). This is now stated in the relevant figure legends – apologies for this oversight. The resulting data are available for scrutiny at GEO: GSE295698.
Minor comments:
Specific experimental issues that are easily addressable.
The following suggestions can be incorporated:
(1) Page 18, in the material method section author mentioned four drugs: Blasticidine, Phleomycin and G418, and hygromycin. It is recommended to mention the purpose of using these selective drugs for the parasite. If clonal selection has been done, then it should also be mentioned.
We erroneously added information on several drugs used for selection in our labaoratory. In fact all TALE-YFP construct carry the Bleomycin resistance genes which we select for using Phleomycin. Also, clones were derived by limiting dilution immediately after transfection. We have amended the text accordingly:
Page 17/18:
“Cell cultures were maintained below 3 x 10⁶ cells/ml. Pleomycin 2.5 µg/ml was used to select transformants containing the TALE construct BleoR gene.”
“Electroporated bloodstream cells were added to 30 ml HMI-9 medium and two 10-fold serial dilutions were performed in order to isolate clonal Pleomycin resistant populations from the transfection. 1 ml of transfected cells were plated per well on 24-well plates (1 plate per serial dilution) and incubated at 37°C and 5% CO2 for a minimum of 6 h before adding 1 ml media containing 2X concentration Pleomycin (5 µg/ml) per well.”
(2) In the method section the authors mentioned that there is only one site for binding of NonR-TALE in the parasite genome. But in Fig. 1C, the authors showed zero binding site. So, there is one binding site for NonR-TALE-YFP in the genome or zero?
We thank the reviewer for pointing out this discrepancy. We have checked the latest Tb427v12 genome assembly for predicted NonR-TALE binding sites and there are no exact matches. We have corrected the text accordingly.
Page 7:
“A control NonR-TALE protein was also designed which was predicted to have no target sequence in the T. brucei genome.”
Page 17:
“A control NonR-TALE predicted to have no recognised target in the T. brucei geneome was designed as follows: BLAST searches were used to identify exact matches in the TREU927 reference genome. Candidate sequences with one or more match were discarded.”
(3) The authors used two different anti-GFP antibodies, one from Roche and the other from Thermo Fisher. Why were two different antibodies used for the same protein?
We have found that only some anti-GFP antibodies are effective for affinity selection of associated proteins, whereas others are better suited for immunolocalisation. The respective suppliers’ antibodies were optimised for each application.
(4) Page 6: in the introduction, the authors give the number of total VSG genes as 2,634. Is it known how many of them are pseudogenes?
This value corresponds to the number reported by Consentino et al. 2021 (PMID: 34541528) for subtelomeric VSGs, which is similar to the value reported by Muller et al 2018 (PMID: 30333624) (2486), both in the same strain of trypanosomes as used by us. Based on the earlier analysis by Cross et al (PMID: 24992042), 80% of the identified VSGs in their study (2584) are pseudogenes. This approximates to the estimation by Consentino of 346/2634 (13%) being fully functional VSG genes at subtelomeres, or 17% when considering VSGs at all genomic locations (433/2872).
(5) I found several typos throughout the manuscript.
Thank you for raising this, we have read through the manuscipt several times and hopefully corrected all outstanding typos.
(6) Fig. 1C: Table: below TOTAL 2nd line: the number should be 1838 (rather than 1828)
Corrected- thank you.
- Are prior studies referenced appropriately? Yes
- Are the text and figures clear and accurate? Yes
- Do you have suggestions that would help the authors improve the presentation of their data and conclusions? Suggested above
Reviewer #1 (Significance):
Describe the nature and significance of the advance (e.g., conceptual, technical, clinical) for the field:
This study represents a significant conceptual and technical advancement by employing a synthetic TALE DNA-binding protein tagged with YFP to selectively identify proteins associated with five distinct repetitive regions of T. brucei chromatin. To the best of my knowledge, it is the first report to utilize TALE-YFP for affinity-based isolation of protein complexes bound to repetitive genomic sequences in T. brucei. This approach enhances our understanding of chromatin organization in these regions and provides a foundation for investigating the functional roles of associated proteins in parasite biology. Importantly, any essential or unique interacting partners identified could serve as potential targets for therapeutic intervention.
- Place the work in the context of the existing literature (provide references, where appropriate). I agree with the information that has already described in the submitted manuscript, regarding its potential addition of the data resulted and the technology established to the study of VSGs expression, kinetochore mechanism and telomere biology.
- State what audience might be interested in and influenced by the reported findings. These findings will be of particular interest to researchers studying the molecular biology of kinetoplastid parasites and other unicellular organisms, as well as scientists investigating chromatin structure and the functional roles of repetitive genomic elements in higher eukaryotes.
- (1) Define your field of expertise with a few keywords to help the authors contextualize your point of view. Protein-DNA interactions/ chromatin/ DNA replication/ Trypanosomes
- (2) Indicate if there are any parts of the paper that you do not have sufficient expertise to evaluate. None
Reviewer #2 (Evidence, reproducibility and clarity):
Summary
Carloni et al. comprehensively analyze which proteins bind repetitive genomic elements in Trypanosoma brucei. For this, they perform mass spectrometry on custom-designed, tagged programmable DNA-binding proteins. After extensively verifying their programmable DNA-binding proteins (using bioinformatic analysis to infer target sites, microscopy to measure localization, ChIP-seq to identify binding sites), they present, among others, two major findings: 1) 14 of the 25 known T. brucei kinetochore proteins are enriched at 177bp repeats. As T. brucei's 177bp repeatcontaining intermediate-sized and mini-chromosomes lack centromere repeats but are stable over mitosis, Carloni et al. use their data to hypothesize that a 'rudimentary' kinetochore assembles at the 177bp repeats of these chromosomes to segregate them. 2) 70bp repeats are enriched with the Replication Protein A complex, which, notably, is required for homologous recombination. Homologous recombination is the pathway used for recombination-based antigenic variation of the 70bp-repeat-adjacent variant surface glycoproteins.
Major Comments
None. The experiments are well-controlled, claims well-supported, and methods clearly described. Conclusions are convincing.
Thank you for these positive comments.
Minor Comments
(1) Fig. 2 - I couldn't find an uncropped version showing multiple cells. If it exists, it should be linked in the legend or main text; Otherwise, this should be added to the supplement.
The images presented represent reproducible analyses, and independently verified by two of the authors. Although wider field of view images do not provide the resolution to be informative on cell location, as requested we have provided uncropped images in new Fig. S4 for all the cell lines shown in Figure 2A.
In addition, we have included as supplementary images (Fig. S3B) additional images of TelRTALE-YFP, 177R-TALE-YFP and ingiR-TALE YFP localisation to provide additional support their observed locations presented in Figure 1. The set of cells and images presented in Figure 2A and in Fig S3B were prepared and obtained by a different authors, independently and reproducibly validating the location of the tagged protein.
(2) I think Suppl. Fig. 1 is very valuable, as it is a quantification and summary of the ChIP-seq data. I think the authors could consider making this a panel of a main figure. For the main figure, I think the plot could be trimmed down to only show the background and the relevant repeat for each TALE protein, leaving out the non-target repeats. (This relates to minor comment 6.) Also, I believe, it was not explained how background enrichment was calculated.
We are grateful for the reviewer’s positive view of original Fig. S1 and appreciate the suggestion. We have now moved these analysis to part B of main Figure 2 in the revised manuscript – now Figure 2B. We have also provided additional details in the Methods section on the approaches used to assess background enrichment.
Page 19:
“Background enrichment calculation
The genome was divided into 50 bp sliding windows, and each window was annotated based on overlapping genomic features, including CIR147, 177 bp repeats, 70 bp repeats, and telomeric (TTAGGG)n repeats. Windows that did not overlap with any of these annotated repeat elements were defined as "background" regions and used to establish the baseline ChIP-seq signal. Enrichment for each window was calculated using bamCompare, as log₂(IP/Input). To adjust for background signal amongst all samples, enrichment values for each sample were further normalized against the corresponding No-YFP ChIP-seq dataset.”
Note: While revising the manuscript we also noticed that the script had a nomalization error. We have therefore included a corrected version of these analyses as Figure 2B (old Fig. S1)
(3) Generally, I would plot enrichment on a log2 axis. This concerns several figures with ChIP-seq data.
Our ChIP-seq enrichment is calculated by bamCompare. The resulting enrichment values are indeed log2 (IP/Input). We have made this clear in the updated figures/legends.
(4) Fig. 4C - The violin plots are very hard to interpret, as the plots are very narrow compared to the line thickness, making it hard to judge the actual volume. For example, in Centromere 5, YFP-KKT2 is less enriched than 147R-TALE over most of the centromere with some peaks of much higher enrichment (as visible in panel B), however, in panel C, it is very hard to see this same information. I'm sure there is some way to present this better, either using a different type of plot or by improving the spacing of the existing plot.
We thank the reviewer for this suggestion; we have elected to provide a Split-Violin plot instead. This improves the presentation of the data for each centromere. The original violin plot in Figure 4C has been replaced with this Split-Violin plot (still Figure 4C).
(5) Fig. 6 - The panels are missing an x-axis label (although it is obvious from the plot what is displayed).
Maybe the "WT NO-YFP vs" part that is repeated in all the plot titles could be removed from the title and only be part of the x-axis label?
In fact, to save space the X axis was labelled inside each volcano plot but we neglected to indicate that values are a log2 scale indicating enrichment. This has been rectified – see Figure 6, and Fig. S7, S8 and S9.
(6) Fig. 7 - I would like to have a quantification for the examples shown here. In fact, such a quantification already exists in Suppl. Figure 1. I think the relevant plots of that quantification (YFPKKT2 over 177bp-repeats and centromere-repeats) with some control could be included in Fig. 7 as panel C. This opportunity could be used to show enrichment separated out for intermediate-sized, mini-, and megabase-chromosomes. (relates to minor comment 2 & 8)
The CIR147 sequence is found exclusively on megabase-sized chromosomes, while the 177 bp repeats are located on intermediate- and mini-sized chromosomes. Due to limitations in the current genome assembly, it is not possible to reliably classify all chromosomes into intermediate- or mini- sized categories based on their length. Therefore, original Supplementary Fig. S1 presented the YFP-KKT2 enrichment over CIR147 and 177 bp repeats as a representative comparison between megabase chromosomes and the remaining chromosomes (corrected version now presented as main Figure 2B). Additionally, to allow direct comparison of YFP-KKT2 enrichment on CIR147 and 177 bp repeats we have included a new plot in Figure 7C which shows the relative enrichment of YFP-KKT2 on these two repeat types.
We have added the following text , page 12:
“Taking into account the relative to the number of CIR147 and 177 bp repeats in the current T.brucei genome (Cosentino et al., 2021; Rabuffo et al., 2024), comparative analyses demonstrated that YFP-KKT2 is enriched on both CIR147 and 177 bp repeats (Figure 7C).”
(7) Suppl. Fig. 8 A - I believe there is a mistake here: KKT5 occurs twice in the plot, the one in the overlap region should be KKT1-4 instead, correct?
Thanks for spotting this. It has been corrected
(8) The way that the authors mapped ChIP-seq data is potentially problematic when analyzing the same repeat type in different regions of the genome. The authors assigned reads that had multiple equally good mapping positions to one of these mapping positions, randomly.
This is perfectly fine when analysing repeats by their type, independent of their position on the genome, which is what the authors did for the main conclusions of the work.
However, several figures show the same type of repeat at different positions in the genome. Here, the authors risk that enrichment in one region of the genome 'spills' over to all other regions with the same sequence. Particularly, where they show YFP-KKT2 enrichment over intermediate- and mini-chromosomes (Fig. 7) due to the spillover, one cannot be sure to have found KKT2 in both regions.
Instead, the authors could analyze only uniquely mapping reads / read-pairs where at least one mate is uniquely mapping. I realize that with this strict filtering, data will be much more sparse. Hence, I would suggest keeping the original plots and adding one more quantification where the enrichment over the whole region (e.g., all 177bp repeats on intermediate-/mini-chromosomes) is plotted using the unique reads (this could even be supplementary). This also applies to Fig. 4 B & C.
We thank the reviewer for their thoughtful comments. Repetitive sequences are indeed challenging to analyze accurately, particularly in the context of short read ChIP-seq data. In our study, we aimed to address YFP-KKT2 enrichment not only over CIR147 repeats but also on 177 bp repeats, using both ChIP-seq and proteomics using synthetic TALE proteins targeted to the different repeat types. We appreciate the referees suggestion to consider uniquely mapped reads, however, in the updated genome assembly, the 177 bp repeats are frequently immediately followed by long stretches of 70 bp repeats which can span several kilobases. The size and repetitive nature of these regions exceeds the resolution limits of ChIP-seq. It is therefore difficult to precisely quantify enrichment across all chromosomes.
Additionally, the repeat sequences are highly similar, and relying solely on uniquely mapped reads would result in the exclusion of most reads originating from these regions, significantly underestimating the relative signals. To address this, we used Bowtie2 with settings that allow multi-mapping, assigning reads randomly among equivalent mapping positions, but ensuring each read is counted only once. This approach is designed to evenly distribute signal across all repetitive regions and preserve a meaningful average.
Single molecule methods such as DiMeLo (Altemose et al. 2022; PMID: 35396487) will need to be developed for T. brucei to allow more accurate and chromosome specific mapping of kinetochore or telomere protein occupancy at repeat-unique sequence boundaries on individual chromosomes.
Reviewer #2 (Significance):
This work is of high significance for chromosome/centromere biology, parasitology, and the study of antigenic variation. For chromosome/centromere biology, the conceptual advancement of different types of kinetochores for different chromosomes is a novelty, as far as I know. It would certainly be interesting to apply this study as a technical blueprint for other organisms with minichromosomes or chromosomes without known centromeric repeats. I can imagine a broad range of labs studying other organisms with comparable chromosomes to take note of and build on this study. For parasitology and the study of antigenic variation, it is crucial to know how intermediate- and mini-chromosomes are stable through cell division, as these chromosomes harbor a large portion of the antigenic repertoire. Moreover, this study also found a novel link between the homologous repair pathway and variant surface glycoproteins, via the 70bp repeats. How and at which stages during the process, 70bp repeats are involved in antigenic variation is an unresolved, and very actively studied, question in the field. Of course, apart from the basic biological research audience, insights into antigenic variation always have the potential for clinical implications, as T. brucei causes sleeping sickness in humans and nagana in cattle. Due to antigenic variation, T. brucei infections can be chronic.
Thank you for supporting the novelty and broad interest of our manuscript
My field of expertise / Point of view:
I'm a computer scientist by training and am now a postdoctoral bioinformatician in a molecular parasitology laboratory. The laboratory is working on antigenic variation in T. brucei. The focus of my work is on analyzing sequencing data (such as ChIP-seq data) and algorithmically improving bioinformatic tools.
Reviewer #1 (Public review):
Summary:
The authors assess the role of map3k1 in adult Planaria through whole body RNAi for various periods of time. The authors' prior work has shown that neoblasts (stem cells that can regenerate the entire body) for various tissues are intermingled in the body. Neoblasts divide to produce progenitors that migrate within a "target zone" to the "differentiated target tissues" where they differentiate into a specific cell type. Here the authors show that map3k1-i animals have ectopic eyes that form along the "normal" migration path of eye progenitors, ectopic neurons and glands along the AP axis and pharynx in ectopic anterior positions. The rest of the study shows that positional information is largely unaffected by loss of map3k1. However, loss of map3k1 leads to premature differentiated of progenitors along their normal migratory route. They also show that "long-term" whole body depletion of map3k1 results in mis-specified organs and teratomas. In short, this study convincingly demonstrates that in planaria, map3k1 maintains progenitor cells in an undifferentiated state, preventing premature fate commitment until they encounter the appropriate signals, either positional cues within a designated region or contact-dependent inputs from surrounding tissues.
Strengths:
(1) The study has appropriate controls, sample sizes and statistics.
(2) The work is high-quality.
(3) The conclusions are supported by the data.
(4) Planaria is a good system to analyze the function of map3k1, which exists in mammals but not other invertebrates.
Weaknesses:
None noted.
Author response:
The following is the authors’ response to the original reviews.
Public Reviews:
Reviewer #1 (Public review):
Summary:
The authors assess the role of map3k1 in adult Planaria through whole body RNAi for various periods of time. The authors' prior work has shown that neoblasts (stem cells that can regenerate the entire body) for various tissues are intermingled in the body. Neoblasts divide to produce progenitors that migrate within a "target zone" to the "differentiated target tissues" where they differentiate into a specific cell type. Here the authors show that map3k1-i animals have ectopic eyes that form along the "normal" migration path of eye progenitors (Fig. 1), ectopic neurons and glands along the AP axis (Fig. 2) and pharynx in ectopic anterior positions (Fig. 3). The rest of the study show that positional information is largely unaffected by loss of map3k1 (Fig. 4,5). However, loss of map3k1 leads to premature differentiated of progenitors along their normal migratory route (Fig. 6). They also show that an ill-defined "long-term" whole body depletion of map3k1 results in mis-specified organs and teratomas.
Strengths:
(1) The study has appropriate controls, sample sizes and statistics.
(2) The work appears to be high-quality.
(3) The conclusions are supported by the data.
(4) Planaria is a good system to analyze the function of map3k1, which exists in mammals but not in other invertebrates.
Weaknesses:
(1) The paper is largely descriptive with no mechanistic insights.
The mechanistic insights we aim to address are primarily at the cellular systems level – how adult progenitor cells produce pattern. Specifically, we uncovered strong evidence that regulation of differentiation is an active process occurring in migratory progenitors and that this regulation is a major component of pattern formation during the adult processes of tissue turnover and regeneration. The map3k1 phenotype provided a tool used to reveal the existence of this regulation, and to understand the patterning abnormalities prevented by this regulatory mechanism. We updated the text in several places to make clearer some of this emphasis. For example, in the Discussion: "We suggest that differentiation is restricted during migratory targeting as an essential component of pattern formation, with the map3k1 RNAi phenotype indicating the existence and purpose of this element of patterning."
Naturally, identifying a particular molecule involved in this process is of interest for understanding molecular mechanism; this would allow for comparison to other cellular systems in other organisms and would focus future molecular inquiry. Future molecular studies into the mechanism of Map3k1 regulation and its downstream signaling will be fascinating as next steps towards understanding the process at the molecular level more deeply. We also added some discussion considering the types of upstream activation cues that could potentially be associated with Map3k1 regulation to suppress differentiation.
(2) Given the severe phenotypes of long-term depletion of map3k1, it is important that this exact timepoint is provided in the methods, figures, figure legends and results.
We removed the use of the term “long-term” and instead added timepoints used to all figure legends. We also added a summary of timepoints used in the methods section and included RNAi timepoint labels in figures where a phenotype progression over time is relevant to interpretation. For timecourses, we also added suitable time information to text in the results.
(3) Figure 1C, the ectopic eyes are difficult to see, please add arrows.
To improve visualization, we replaced the example animal in the original Figure 1C with one that has a stronger phenotype, including arrows pointing to every ectopic event. Additionally, we included magnified images of optic cup cells and photoreceptor neurons in the trunk and tail region. This is now Figure 1B.
(4) line 217 - why does the n=2/12 animals not match the values in Figure 3B, which is 11/12 and 12/12. The numbers don't add up. Please correct/explain.
In Figure 3B in the submitted version (3/18 had cells in the tail) had more animals scored (6 animals from a replicate experiment where 1/6 showed the cells in the tail) than the total scored (2/12 had cells in the tail) in the text, which did not have the animals from the replicate added during writing. The results are the same, just different sample sizes were noted in those locations and we fixed this issue. In the updated Figure 3, the order of presentation has shifted (e.g., prior 3B is now in 3C and Figure 3_figure supplement 1). We made sure to include numbers to all figure panels.
(5) Figure panels do not match what is written in the results section. There is no Figure 6E. Please correct.
Thank you for catching this. We have gone through figures and text after editing to make sure that text callouts are appropriately matched to the figures.
Reviewer #2 (Public review):
Summary:
The flatworm planarian Schmidtea mediterranea is an excellent model for understanding cell fate specification during tissue regeneration and adult tissue maintenance. Planarian stem cells, known as neoblasts, are continuously deployed to support cellular turnover and repair tissues damaged or lost due to injury. This reparative process requires great precision to recognize the location, timing, and cellular fate of a defined number of neoblast progeny. Understanding the molecular mechanisms driving this process could have important implications for regenerative medicine and enhance our understanding of how form and function are maintained in long-lived organisms such as humans. Unfortunately, the molecular basis guiding cell fate and differentiation remains poorly understood.
In this manuscript, Canales et al. identified the role of the map3k1 gene in mediating the differentiation of progenitor cells at the proper target tissue. The map3k1 function in planarians appears evolutionarily conserved as it has been implicated in regulating cell proliferation, differentiation, and cell death in mammals. The results show that the downregulation of map3k1 with RNAi leads to spatial patterning defects in different tissue types, including the eye, pharynx, and the nervous system. Intriguingly, long-term map3k1-RNAi resulted in ectopic outgrowths consistent with teratomas in planarians. The findings suggest that map3k1 mediates signaling, regulating the timing and location of cellular progenitors to maintain correct patterning during adult tissue maintenance.
Strengths:
The authors provide an entry point to understanding molecular mechanisms regulating progenitor cell differentiation and patterning during adult tissue maintenance.
The diverse set of approaches and methods applied to characterize map3k1 function strengthens the case for conserved evolutionary mechanisms in a selected number of tissue types. The creativity using transplantation experiments is commendable, and the findings with the teratoma phenotype are intriguing and worth characterizing.
Thank you to the reviewer for the positive feedback
Weaknesses:
The article presents a provocative idea related to the importance of positional control for organs and cells, which is at least in part regulated by map3k1. Nonetheless, the role of map3k1 or its potential interaction with regulators of the anterior-posterior, mediolateral axes, and PCGs is somewhat superficial. The authors could elaborate or even speculate more in the discussion section and the different scenarios incorporating these axial modulators into the map3k1 model presented in Figure 8
First, to strengthen the support for our finding that positional information is largely unaffected in map3k1 RNAi animals, we added data regarding the expression of additional relevant position control genes (PCGs) –ndl-4, ptk7, sp5, and wnt11-1 – to the PCG panel in Figure 5. The expression domain of ndl-4, an FGF receptor-like protein family member that contributes to head patterning and anterior pole maintenance, was normal in map3k1 RNAi. wnt11-1, a PCG with expression concentrated in the posterior end of the animal and with expression dependent on general Wnt activity, was also normal in map3k1 RNAi animals. ptk7, RNAi of which can result in supernumerary pharynges, also showed normal expression in map3k1 RNAi animals. Finally, sp5, a Wnt-activated gene with expression in the tail, also showed normal expression in map3k1 RNAi animals.
Second, to further support the conclusion that cells are not suitably responding to positional information after map3k1 RNAi, which we argue normally dictates where differentiation should occur, we added examples of differentiated cell types that are ectopically positioned within an atypical PCG expression domain for that cell type (Figure 5C). This underscores that following map3k1 RNAi the PCG expression domains do not change, but the pattern of differentiated cell types relative to these domains does shift. We also added data showing that regenerating tails had a proper wntP-2 gradient, but an anterior regenerating pharynx appeared outside of this wntP-2<sup>+</sup> zone and inside of an ndl-5<sup>+</sup> zone (Figure 5- figure supplement 1E). We added some discussion of these new data in the Figure 5 results section. We also noted, regarding independent recent map3k1 work (Lo, 2025), some evidence exists that a minor posterior shift in ndl-5 expression can occur after map3k1 RNAi.
Next, we added a new element to the model figure (Figure 8B) depicting that PCG expression domains remain normal after map3k1 RNAi, with ectopic differentiation occurring in an incorrect positional information environment. We refer to this new panel in the discussion: "We suggest that map3k1 is not required for the spatial distribution of progenitor-extrinsic differentiation-promoting cues themselves, but for progenitors to be restricted from differentiating until these cues are received (Figure 8B)."; we then follow this statement with a summary in the Discussion of six pieces of evidence that support this model.
Finally, we added some additional text to the discussion section about candidate mechanisms by which extrinsic cues could potentially regulate Map3k1, pointing to potential future inquiry directions. We suggest that map3k1 is not involved in regulating PCG activity domains themselves, but instead acts as a brake on differentiation within migratory progenitors through active signaling. This brake is then lifted when the progenitors hit their correct PCG-based migratory target, or when they hit their target tissue. How that occurs mechanistically is unknown. One scenario is that each progenitor is tuned to respond to a particular PCG-regulated environment (such as a particular ECM or signaling environment) to generate a molecular change that inactivates Map3K1 signaling, such as by inactivating or disengaging an RTK signal. Alternatively, the migratory process in progenitors could engage the Map3K1 signal, enabling signal cessation with arrival at a target location. When Map3K1 is active it could result in a transcriptional state that prevents full expression of differentiated factors required for maturation, tissue incorporation, and cessation of migration. These considerations are now added to the discussion.
The article can be improved by addressing inconsistencies and adding details to the results, including the main figures and supplements. This represents one of the most significant weaknesses of this otherwise intriguing manuscript. Below are some examples of a few figures, but the authors are expected to pay close attention to the remaining figures in the paper.
Details associated with the number of animals per experiment, statistical methods used, and detailed descriptions of figures appear inconsistent or lacking in almost all figures. In some instances, the percentage of animals affected by the phenotype is shown without detailing the number of animals in the experiment or the number of repeats. Figures and their legends throughout the paper lack details on what is represented and sometimes are mislabeled or unrelated.
We endeavored to ensure that these noted details are present throughout the legends and figures for all figure panels.
Specifically, the arrows in Figure 1A are different colors. Still, no reasoning is given for this, and in the exact figure, the top side (1A) shows the percentages and the number of animals below.
The only reason for the different colored arrows was for visibility purposes. To avoid confusion, we now use white arrows for all FISH images in figure 1, and where ever else possible. We also replaced the percentages with n numbers in the bottom left corner of the live images in Figure 1A.
Conversely, in Figures 1B, C, and D, no details on the number of animals or percentages are shown, nor an explanation of why opsin was used in Figure 1A but not 1B.
The original Figure 1B represented a few different examples of ectopic eye/eye cell patterns in the map3k1 RNAi animals to demonstrate the variable and disorganized nature of the phenotype. To address this, we added further explanation in the legend. We also merged 1A and 1B for simplicity of interpretation. opsin was used in Figure 1A to label cell bodies of photoreceptors. anti-Arrestin was used in the example FISH images to see if these cells were interconnected via projections, which we now clarify in the legend and in the text.
Is Figure 1B missing an image for the respective control? Figure 1C needs details regarding what the two smaller boxes underneath are.
The control for Figure 1B was in Figure 1A; the merger of Figures 1A/B should address this. Boxes in Figure 1C were labelled with numbers corresponding to the image above them.
Figure 1C could use an AP labeling map in 10 days (e.g., AP6 has one optic cup present). Figure 1C and F counts do not match.
We added a cartoon to 1C to show the region imaged. Note that the 36d trunk image (now Fig. 1B) has now been replaced with a full animal image and magnified boxes that show locations of example ectopic cells. That cell in 1C was categorized as in AP5. Note that additional animals were analyzed and data added to the distribution (now Fig. 1D).
In Figure 1C, we do not know the number of animals tested, controls used, the scale bar sizes in the first two images, nor the degree of magnification used despite the pharynx region appearing magnified in the second image. Figure 1C is also shown out of chronological order; 36 days post RNAi is shown before 10 days post RNAi. Moreover, the legends for Figures 1C and 1D are swapped.
We have endeavored to ensure sample numbers, control images, and appropriate scale bar notation in legends are present for all images. Figure 1C has now been split into two panels: Figure 1B and Figure 1C. It does not follow a chronological order in presentation for the following logic flow: we uncover and describe the phenotype; then, with knowledge of the defect, we walk back to see how early the phenotype starts after RNAi and what the pattern of ectopic cell distribution is when the phenotype starts to emerge (using the knowledge of which cells are affected from the overt phenotype described in 1A/B).
Additionally, Figure 1F and many other figures throughout the paper lack overall statistical considerations. Furthermore, Figure 1F has three components, but only one is labeled. Labeling each of them individually and describing them in the corresponding figure legend may be more appropriate.
The main point of the graphs in 1F (now 1D) was the overt overall pattern difference with the wild-type, which never has ectopic eye cells in the midbody or tail, and that the ectopic eye cells progress throughout the entire AP axis. However, we concur that a statistical test is a reasonable thing to show here and that is now included in the legend. The 3 components (in Figure 1F, now Figure 1D) where kept together with one figure label (D) for simplicity, but were rearranged (top and bottom) with a cartoon to the side and with modified labeling for extra clarity.
Figure 2C shows images of gene expression for two genes, but the counts are shown for only one in Figure 2D. It is challenging to follow the author's conclusions without apparent reasoning and by only displaying quantitative considerations for one case but not the other. These inconsistencies are also observed in different figures.
In Figure 2C, FISH images of cintillo+ and dd_17258+ neurons are shown to display the specificity of this effect to some neurons and not others. Because cintillo+ cells did not expand at all (n=24/24 animals), the counts for them would all be zero values. We only counted data for dd_17258 cells because it was the neuron that expanded compared to the control animals. We have now added a note in the legend explaining this.
In Figure 2D, 24/24 animals were reported to show the phenotype, but only eight were counted (is there a reason for this?).
8 animals were used to quantitatively characterize the spread of cells along the AP axis, as it was deemed an adequate sample size to capture the change in distribution of 17258+ cells from being head restricted to being present throughout the body. Through multiple cohorts of animals in replicates, a total of 24/24 examined animals showed this expansion phenotype. Double FISH experiments were additionally carried out using dd_17258 and various PCGs; these data are now included in Figure 5C, and these animals were added to the total counts regarding quantitative analysis of the phenotype in Figure 2D.
In Figure 2E, the expression for three genes is shown, with some displaying anterior and posterior regions while others only show the anterior picture. Is there a particular reason for this?
The original first panel in Figure 2E showed an example of a non-expanding gland cell type, dd_9223, which is very restricted to the head in both control and map3k1 RNAi animals. Because we did not observe a phenotype for this cell type (no cells in all control and map3k1 RNAi animal tails), we only included tail images of cell types that showed an abnormal phenotype with clear expanded to the posterior (dd_8476 and dd_7131). However, we have now included tail images of dd_9223 cells and added data for dd_9223 to the graph in Figure 2E.
Also, in Figure 2F, the counts are shown for only the posterior region of two genes out of the three displayed in Figure 2E. It is unclear why the authors do not show counts for the anterior areas considered in Figure 2E. Furthermore, the legend for Figure 2D is missing, and the legend for 2F is mislabeled as a description for Figure 2D.
We now include tail images for dd_9223 in Figure 2E to show that there are no ectopic cells in tails. We did not originally include counts of dd_9223 because there was no phenotype observed. dd_7131 and dd_8476 cell types appeared in the posterior of even control animals at a low frequency, unlike dd_9223 cells. However, we did now add counts for dd_9223 tail regions in the graph. We did not count the anterior regions of the animal because our goal was to show data for the visible phenotype (ectopic cells in the tail) not only with an example image, but also by showing the number of cells in the tail with a graph and statistical test. Legends have been updated with correct details.
Supplement Figure 1 B reports data up to 6 weeks, but no text in the manuscript or supplement mentions any experiment going up to 6 weeks. There are no statistics for data in Supplement Figure 1E. Any significance between groups is unclear.
More details about the RNAi feeding schedules have been added in the methods section. All RNAi timepoints are now specified specifically in the legends. The Figure 1F and Figure 1- figure supplement 1E (additional data: ovo<sup>+</sup>; smedwi-1<sup>-</sup> cell counts) and legends now mention the statistical tests performed and annotations (not significant *ns) or p values have been added to the graphs. For simplicity, we decided to include all smedwi-1+ counts together rather than splitting them into low and high smedwi-1+ cells, because we weren't really making any claims about low and high cells.
Recommendations for the authors:
Reviewer #1 (Recommendations for the authors):
It would be good to acknowledge in the discussion the recent paper from the Petersen lab on map3k1, published in PLoS Genet 2025, especially if the results differ between the two labs.
We added reference/discussion regarding the recent PLoS Genetics Lo, 2025 map3k1 paper at several suitable points in the manuscript.
Reviewer #2 (Recommendations for the authors):
Please pay close attention to the description of experimental details and the consistency throughout the paper. It seems like the reader has to assume or come across information that is not readily available from the text or the legends in the paper. This is an interesting paper with intriguing findings. However, the version presented here appears rushed or put together on the flight.
Thank you for your thorough feedback. We have endeavored to ensure all appropriate details are present in figures and/or figure legends.
So all data that you might find is a simplification. There are many seemingly simple questions that in some situations or for some people, have no simple answers, questions like: What country are you from? What if you were born in one country, but moved to another shortly after? What if you are from a country that no longer exists like Czechoslovakia? Or from an occupied territory? How many people live in this house? Does a college student returning home for the summer count as living in that house? How many words are in this chapter? Different programs use different rules for what counts as a “word” E.g., this page has “2 + 2 = 4”, which Microsoft Word counts as 5 words, and Google Docs counts as 3 words.
Simplifying data may frequently be convenient when creating a widely-applicable program, but it involves leaving at least one group or perspective out. Because of this, simplification of data often contains inherent bias and developers should be aware of this.
What country are you from? What if you were born in one country, but moved to another shortly after? What if you are from a country that no longer exists like Czechoslovakia? Or from an occupied territory? How many people live in this house? Does a college student returning home for the summer count as living in that house? How many words are in this chapter? Different programs use different rules for what counts as a “word” E.g., this page has “2 + 2 = 4”, which Microsoft Word counts as 5 words, and Google Docs counts as 3 words.
This definitely opened my perspective on data constraints. In the reflection before, I figured that the best way to store information for social media would be through pre-set categories (for things like relationship status, address, etc), but there are definitely important details that can be hard to simplify and cut out (though, I'm sure no one needs additional details on someone's relationship status). I guess that's why there are some instances where you're able to put down a permanent address and a temporary address for those who are only residing somewhere for a short-term opportunity.
So, there was a simplification here. In this example, I decided that each of these would count as “1 apple.” This way of looking at things might not work well in some situations:
I think this is a crucial part of programming. Simplification is incredibly beneficial, but it also eliminates minor details that can still be relevant. While it can simplify and allow faster more efficient data, it's not 100% accurate
Data points often give the appearance of being concrete and reliable, especially if they are numerical.
I find this especially interesting, because it's true, when we see a number or percentage it seems like it must be the correct one. But it is so important to think about the data collection behind it. If we use the bot example, when processing all the users in the systems did the data processors then remove all incomplete data (if something was missing from the profile) or did they leave it in? I believe that even though data seems unbiased, there are always choices in how it's processed that effect how the outcome looks.
As you can see in the apple example, any time we turn something into data, we are making a simplification.1 If we are counting the number of something, like apples, we are deciding that each one is equivalent. If we are writing down what someone said, we are losing their tone of voice, accent, etc. If we are taking a photograph, it is only from one perspective, etc.
I think this is important both when considering data but also just considering social media as a whole. People tend to only post the positives in their life, and even in those positive posts a lot of information is being left out of the context. If someone only posts a single photo from a concert with a lyric as a caption, it does not explain what the set was or how the experience as a whole was like for that person.
How are people’s expectations different for a bot and a “normal” user?
People typically don’t expect to glean much useful information from bots. In my case, at least, I would typically block or ignore them. Additionally, it’s often easy to identify a bit, but in the age of AI these lines are becoming more blurred.
But, since the donkey does not understand the act of protest it is performing, it can’t be rightly punished for protesting.
I appreciate this analogy; it can also resemble our current state of our own country when people often do not take accountability for their actions because they did not participate “first hand.” Online has taken this donkey protest dilemma to the extreme; often times people are extremely more outspoken on beliefs or topics because they’re behind a screen, much like controlling bots where they don’t believe they should be held accountable for what the bot had posted/said online because “it wasn’t me!”
eLife Assessment
This important study employs a closed-loop, theta-phase-specific optogenetic manipulation of medial septal parvalbumin-expressing neurons in rats and reports that disrupting theta-timescale coordination impairs performance of challenging aspects of spatial behaviors, while sparing hippocampal replay and spatial coding in hippocampal place cells. The findings are expected to advance theoretical understanding of learning and memory operations and to provide practical implications for the application of similar optogenetic approaches. The experiments were viewed as technically rigorous, but the strength of evidence provided in the current version of the manuscript was viewed as incomplete, mostly due to limited analyses and the descriptions of some of the experimental protocols.
Reviewer #2 (Public review):
Summary:
The authors of this study developed a closed-loop optogenetic stimulation system with high temporal precision in rats to examine the effect of medial septum (MS) stimulation on the disruption of hippocampal activity at both behavioral and compressed time scales. They found that this manipulation preserved hippocampus single-cell-level spatial coding but affected theta sequences and performance during a spatial alternation task. The performance deficits were observed during the more cognitively demanding component of the task and even persisted after the stimulation was turned off. However, the effects of this disruption were confined to locomotor periods and did not impact waking rest replay, even during the early phase of stimulation-on. Their conclusion is consistent with previous findings from the Pastalkova lab, where MS disruption (using different methods) affected theta sequences and task performance but spared replay (Wang et al., 2015; Wang et al., 2016). However, it differs from a recent study in which optogenetic disruption of EC inputs during running affected both theta sequences and replay (Liu et al., 2023).
Strengths:
The experiments were well designed and controlled, and the results were generally well presented.
Weaknesses:
Major concerns are primarily technical but also conceptual. To further increase the impact of this study by contrasting findings from different disruptions, it is necessary to better align the analysis and detection methods.
Major concerns:
(1) To show that MS disruption does not affect spatial tuning, the authors computed the KL divergence of tuning curves between stimulation-on and stimulation-off conditions. I have two main questions about this analysis:
(1.1) The authors seem to impose stringent inclusion criteria requiring a large number of spikes and a strong concentration of tuning curves. These criteria may have selected strongly spatially tuned cells, which are typically more stable and potentially less vulnerable to perturbations. Based on the Figure 2 caption, it seems that fewer than 10% of cells were included in the KL divergence analysis, which is lower than the usual proportion of place cells reported in the literature. What is the rationale for using such strict inclusion criteria? What happens to the cells that are not as strongly tuned but are still identified as significant place cells?
(1.2) The KL divergence was computed between stimulation-on and stimulation-off conditions within the same animal group. However, the authors also showed that MS stimulation had lasting effects on theta sequences and performance even during stimulation-off periods. Would that lasting effect also influence spatial tuning? Based on these questions, the authors should perform additional analyses that directly measure spatial tuning quality and compare results across control and experimental groups - for example, spatial information of spikes (Skaggs et al., 1996), tuning stability, field length, and decoding error during running.
(2) The authors compared their results with those from Liu et al. (2023) and proposed that the different outcomes could be explained by different sites of disruption. However, the detection and quantification methods for theta sequences and replay differ substantially between the two studies, emphasizing different aspects of the phenomenon. I am not suggesting that either method is superior, but providing additional analyses using aligned detection methods would better support the authors' interpretations and benefit the field by enabling clearer comparisons across studies. In the current analysis, the power spectrum of the decoded ahead/behind distance only indicates that there is a rhythmic pattern, without specifying the decoding features at different theta phases. Moreover, the continuous non-local representations during ripples could include stationary representations of a location or zigzag representations that do not exhibit a linear sequential trace. Given that, the authors should show averaged decoding results corrected by the animal's actual position within theta cycles and compute a quadrant ratio. For replay analysis, they could use a linear fit (as in Liu et al., 2023) and report the proportion of significant replay events.
(3) The finding that theta sequences and performance were impaired even during stimulation-off periods is particularly interesting and warrants deeper exploration. In the Discussion, the authors claim that this may arise from "the rapid plasticity engaged during early learning." However, this explanation does not fully account for the observation. Previous studies have shown that theta sequences can develop very rapidly (Feng et al., Foster lab, 2015; Zhou et al., Dragoi lab, 2025). If the authors hypothesize that rapid plasticity during early stimulation-on disrupts the theta sequence, then the plasticity window must also be short and terminate during the subsequent stimulation-off period. Otherwise, why can't animals redevelop theta sequences during stimulation-off? The authors should conduct additional analyses during the stimulation-off periods of the W-maze task. For example:
(3.1) What is the spike-theta phase relationship? Do the phases return to normal or remain altered as during stimulation-on?
(3.2) Is there a significant place-field remapping from stimulation-on to stimulation-off? (Supplementary Figure 3F includes only a small subset of cells; what if population vector correlations are computed across all cells, or Bayesian decoding of stimulation-on spikes is performed using stimulation-off tuning curves?)
(3.3) The authors should also discuss why the stimulation-off epochs were not sufficient to support learning, and if the stimulation-off place cell sequences could have supported replay.
(4) Citations and/or discussion of key studies relevant to the current work are missing: Wang et al. in Pastalkova lab 2015-2016 studies for disruption of theta sequence (but not place cell sequence) disrupting learning but not replay, Drieu et al. in Zugaro lab 2018 study on disruption of theta sequence affecting sleep replay, Farooq and Dragoi 2019 for association between a lack of theta sequence and presence of waking rest replay during postnatal development, etc. The authors should discuss what the conceptually new findings in the current study are, given the findings of the previous literature above.
(5) The assessment of theta sequence is not state-of-the-art:
(5.1) Detecting the peak of cross-correlograms between neurons (CCG) relates to behavioral timescale CCG, not the theta sequence one; for the theta sequence, the closest to zero local peak should be used instead.
(5.2) How were other methods of detecting theta sequences performing on the stimulation-on/stimulation-off data: Bayesian decoding, firing sequences?
(5.3) How was phase precession during stimulation-on/stimulation-off?
(6) It would be important to calculate additional variables in the replay part of the study to compare the quality of replay across the 2 groups:
(6.1) Proportion of significant replay events out of the detected multiunit events.
(6.2) The average extent of trajectory depicted by the significant replay events in the targeted compared to the control, stimulation-on/stimulation-off.
Reviewer #3 (Public review):
Joshi et al. present an elegant and technically rigorous study examining how the temporal structure of hippocampal spiking during locomotion contributes to spatial learning. Using a closed-loop, theta phase-specific optogenetic manipulation of medial septal parvalbumin-expressing neurons in rats, the authors demonstrate that disrupting theta-timescale coordination impairs performance on the cognitively demanding component outbound trajectory of a spatial alternation task, while sparing hippocampal replay, place coding, and the simpler inbound learning. The work aims to dissociate the role of theta-associated temporal organization during navigation from sharp-wave ripple-associated replay during subsequent rest periods, providing a mechanistic link between theta sequences and learning. The findings have important implications for models of septo-hippocampal coordination and the functional segregation between online (theta) and offline (SWR) network states. That said, there are a few conceptual and methodological issues that need to be addressed.
One concern is the overall novelty of this work; the dissociation between online temporal sequence and offline replay events following memory deficits has previously been shown by Wang et al., 2016 elife. While the authors discuss Lui et al., 2023, which demonstrates MEC activation of inhibitory neurons at gamma frequencies during locomotion disrupts theta sequences, subsequent replay and learning (line 65-66), they do not reference Wang et al., 2016 who performed a very similar study with MS pharmacological inactivation, and report large decreases in theta power, attenuated theta frequencies together with behavioural deficits but SWR replay persisted. Given strong similarities in the manipulation and findings, this study should be discussed.
Along the same lines, it should be noted that Brandon et al. (2014, Neuron) demonstrated that hippocampal place codes can still form in novel environments despite MS inactivation and loss of theta, indicating that spatial representations can emerge without intact septal drive. Referencing this study would strengthen the discussion of how temporal coordination, rather than spatial coding per se, underlies the learning deficits observed here.
The conclusion that disrupting "theta microstructure" impairs learning relies on the assumption that the observed behavioral deficits arise from altered temporal coding from within hippocampal CA1 only. However, optogenetic modulation of medial septal PV neurons influences multiple downstream regions (entorhinal cortex, retrosplenial cortex) via widespread GABAergic projections. While the authors do touch on this, their discussion should expand to include the network-level consequences of entorhinal grid-cell disruption and how this could affect temporal coding both online and offline.
The finding that replay content, rate, and duration are unchanged is critical to the paper's claim of dissociation. However, the analysis is restricted to immobility on the track. Given evidence for distinct awake vs. sleep replay, confirming that off-track rest and post-session sleep replays are similarly unaffected would confirm the conclusions of the paper. If these data are unavailable, the limitation should be acknowledged explicitly. Moreover, statistical power for detecting subtle differences in replay organization or spatial bias should be added to the supplement (n of events per animal, variability across sessions).
The exact protocol for optogenetic stimulation is a bit confusing. For the task, the first and final third (66%) of trials were disrupted and were only stimulated when away from the reward well and only when the animal was moving. What proportion of time within "stimulated" trials remained unstimulated? Why were only 66% of trials stimulated?
Reviewer #1 (Public review):
Summary:
This study examines the role of the long non-coding RNA Dreg1 in regulating Gata3 expression and ILC2 development. Using Dreg1-deficient mice, the authors show a selective loss of ILC2s but not T or NK cells, suggesting a lineage-specific requirement for Dreg1. By integrating public chromatin and TF-binding datasets, they propose a Tcf1-Dreg1-Gata3 regulatory axis. The topic is relevant for understanding epigenetic regulation of ILC differentiation.
Strengths:
(1) Clear in vivo evidence for a lineage-specific role of Dreg1.
(2) Comprehensive integration of genomic datasets.
(3) Cross-species comparison linking mouse and human regulatory regions.
Weaknesses:
(1) Mechanistic conclusions remain correlative, relying on public data.
(2) Lack of direct chromatin or transcriptional validation of Tcf1-mediated regulation.
(3) Human enhancer function is not experimentally confirmed.
(4) Insufficient methodological detail and limited mechanistic discussion.
Note d'information : La Stratégie d'Expansion du Groupe Emeis (ex-Orpea) dans le Secteur de la Psychiatrie en France
Cette note d'information analyse la stratégie d'expansion du groupe privé lucratif Emeis (anciennement Orpea) dans le secteur de la psychiatrie en France.
Elle s'appuie sur une enquête journalistique qui met en lumière comment le groupe, marqué par le scandale de ses EHPAD, capitalise sur la crise profonde de la psychiatrie publique pour s'implanter sur ce marché jugé très rentable.
L'analyse révèle une situation de crise systémique dans le secteur public : un sous-financement chronique, un manque criant de personnel (seulement 600 pédopsychiatres en France), des infrastructures vétustes et une explosion de la demande de soins, notamment chez les jeunes depuis la crise du Covid (+77 % d'épisodes dépressifs chez les 18-24 ans).
Dans ce contexte, Emeis déploie une stratégie agressive pour s'imposer, illustrée par un projet de clinique de 80 lits près de Strasbourg.
Cette implantation, menée via sa filiale Clinea, s'est initialement appuyée sur une alliance "étonnante" avec un concurrent, Clinipsy.
L'enquête suggère que cette alliance aurait pu servir de "cheval de Troie" pour Emeis, lui permettant d'obtenir des autorisations administratives que le groupe, sous le nom d'Orpea, s'était vu refuser à plusieurs reprises depuis 2007.
Les principales préoccupations soulevées sont le risque d'affaiblissement de l'hôpital public par le débauchage de son personnel, une complémentarité illusoire où le privé se concentrerait sur les cas les plus rentables en laissant les plus complexes au public, et un modèle économique basé sur la rentabilité qui pourrait se faire au détriment de la qualité des soins par la réduction des effectifs.
Enfin, le document souligne l'opacité de l'Agence Régionale de Santé (ARS) Grand Est, qui a refusé de communiquer des documents essentiels sur ce projet malgré les importants financements publics engagés.
La psychiatrie en France est décrite comme étant "malade" et "abandonnée par les pouvoirs publics".
Ce secteur est devenu le "parent pauvre de la santé", confronté à un manque critique de moyens alors que les besoins de soins explosent.
• Explosion de la demande : La crise du Covid et les confinements ont provoqué une forte augmentation des pathologies mentales.
◦ +77 % d'épisodes dépressifs chez les 18-24 ans. ◦ +133 % d'hospitalisations pour tentative de suicide ou automutilation.
• Manque de moyens structurel : Le secteur public souffre d'un sous-investissement chronique.
◦ Une politique ambulatoire non financée : Depuis les années 1980, une politique de fermeture de lits a été menée au profit de soins ambulatoires (hors de l'hôpital).
Cependant, les moyens financiers n'ont pas suivi pour développer ces structures alternatives comme les Centres Médico-Psychologiques (CMP).
◦ Pénurie de personnel : La France compte environ 600 pédopsychiatres, laissant des départements entiers sans spécialiste.
◦ Diminution des capacités : L'hôpital public a perdu près de 7 000 places de prise en charge psychiatrique à temps complet en 15 ans.
• Vétusté des infrastructures : L'état des bâtiments publics est alarmant.
À Strasbourg, le secteur de la pédopsychiatrie des Hôpitaux Universitaires est logé dans des "bâtiments complètement vétustes" et des "préfabriqués".
L'Inspection générale des affaires sociales (Igas) a signalé des risques d'incendie et demandé un déménagement en urgence, qui n'a été annoncé que 15 ans plus tard.
"On a alerté qu'on allait droit dans le mur et le mur aujourd'hui on se le prend en pleine face." - Un soignant, cité dans le documentaire de Laurence Deur.
La défaillance du système public crée une opportunité majeure pour les groupes privés à but lucratif, qui considèrent la psychiatrie comme un "marché très rentable".
• Un secteur profitable : Selon un rapport récent du Sénat, la psychiatrie est l'un des secteurs de la santé les plus rentables, avec des marges estimées entre 5 % et 8 %.
L'investissement principal étant l'humain, la réduction du personnel est le principal levier pour augmenter les profits.
• Une croissance rapide : La part du secteur privé lucratif dans l'offre de soins psychiatriques a considérablement augmenté :
◦ 1975 : 11 % des lits. ◦ Aujourd'hui : Plus de 30 % des lits.
• Un parallèle avec les EHPAD : La situation actuelle en psychiatrie est comparée à la privatisation du secteur des EHPAD dans les années 1980.
Face à des établissements publics vieillissants et coûteux à rénover, l'État avait ouvert la porte au privé qui promettait de "faire moins cher, plus vite".
• Le rôle des ARS : Les Agences Régionales de Santé, autrefois réticentes à ouvrir la psychiatrie au privé, sont aujourd'hui plus enclines à le faire.
Face à l'incapacité du public à répondre à la demande immense, elles autorisent l'ouverture de cliniques et d'hôpitaux de jour privés.
L'enquête se concentre sur un projet de clinique psychiatrique privée de 80 lits à Schiltigheim, près de Strasbourg, porté par le groupe Emeis (ex-Orpea), rebaptisé pour faire oublier le scandale révélé par le livre Les Fossoyeurs. Ce projet est jugé "démesuré" et "anachronique" par les acteurs locaux.
Le projet est né d'une alliance "étonnante" entre deux concurrents :
2. Clinipsy : Un acteur plus petit, déjà connu pour une enquête du Parquet National Financier (PNF) concernant des autorisations obtenues en région Rhône-Alpes par d'anciens fonctionnaires de l'ARS locale, ensuite embauchés par des filiales du groupe.
Cette collaboration entre concurrents directs est jugée inhabituelle, comparable à "si Intermarché et Leclerc montaient un supermarché ensemble".
L'enquête soulève l'hypothèse que cette alliance aurait servi de stratégie à Emeis pour contourner des obstacles réglementaires.
• Dissimulation : Emeis se serait "dissimulé un petit peu" derrière le nom de Clinipsy, un groupe plus petit avec une "moins mauvaise image" auprès des ARS, pour obtenir plus facilement les autorisations.
• Historique des refus : Des documents montrent qu'Orpea tentait d'ouvrir une clinique psychiatrique dans la région depuis au moins 2007 et avait essuyé au moins deux refus de la part de l'agence régionale (alors ARH).
Depuis, Clinipsy s'est désengagé du projet de clinique de 80 lits pour se concentrer sur des hôpitaux de jour, des structures moins coûteuses et "extrêmement rentables", laissant le champ libre à Emeis pour le projet principal.
"La question [...] se pose de savoir si Clinipsy a été un petit peu le cheval de Troie d'Orpea dans cette affaire." - Laurence Deur, journaliste.
L'arrivée massive d'acteurs privés lucratifs comme Emeis dans la psychiatrie fait peser plusieurs risques majeurs sur l'équilibre global du système de santé mentale.
La principale inquiétude est que les nouvelles cliniques privées, en offrant de meilleures conditions de travail ou de rémunération, ne débauchent le personnel médical et soignant déjà en sous-effectif dans le secteur public.
• Un exemple concret : Un courrier de 2022 révèle qu'une clinique privée près de Nancy a débauché cinq médecins de l'hôpital public local, fragilisant ce dernier.
• L'inquiétude de la Mairie de Strasbourg : La maire, Jeanne Barségan, craint que le projet de 80 lits n'aggrave la pénurie de psychiatres et ne "vide" l'hôpital public de ses forces.
L'offre privée est souvent présentée comme "complémentaire" du public. Cependant, l'analyse montre qu'elle ne remplit pas les mêmes missions.
• Évitement des cas complexes : Le privé évite généralement les missions les plus lourdes et les moins rentables, comme l'hospitalisation sous contrainte, qui nécessite plus de personnel et de temps.
• Gestion des urgences "à la carte" : Dans le projet d'Emeis, la prise en charge des urgences se ferait "de gré à gré", sans obligation contraignante. Le médecin du privé peut accepter ou refuser un patient envoyé par le public.
• La conclusion : "Tout ce qui est complexe reste dans l'hôpital public", tandis que le privé se positionne sur des missions "plus faciles à assurer".
Emeis est une entreprise cotée en bourse qui doit générer du profit pour ses actionnaires.
• Le levier du personnel : En psychiatrie, où "l'investissement, c'est l'humain", la principale méthode pour augmenter la rentabilité est de réduire les effectifs.
• Conflits sociaux : Plusieurs conflits sociaux ont éclaté dans des cliniques psychiatriques d'Emeis (Thionville, Nord, Isère) où le personnel dénonçait un manque d'effectifs et une réorganisation du travail impactant la qualité des soins.
Une grève de trois semaines a eu lieu à Seyssins, un événement "extrêmement rare dans le privé".
"Une entreprise est là pour faire du profit alors que l'hôpital public on lui demande pas d'être profitable, on lui demande d'être à l'équilibre." - Laurence Deur, journaliste.
L'enquête met en cause le manque de transparence de l'Agence Régionale de Santé (ARS) Grand Est.
• Rétention d'information : La journaliste a été "baladée pendant un mois et demi" sans obtenir de réponse ni les documents demandés concernant le projet de clinique Emeis.
L'ARS a fini par envoyer un document public générique qui ne correspondait pas à la demande.
• Recours à la CADA : Il a fallu saisir la Commission d'Accès aux Documents Administratifs (CADA) pour obtenir une partie des informations.
• Enjeux financiers publics : Cette opacité est jugée problématique car le projet engage d'importants fonds publics.
Les autorisations délivrées "valent des millions d'euros" et le groupe peut prétendre à une "dotation d'amorçage" de l'État pour financer son démarrage.
Cette situation soulève des questions sur le contrôle et la régulation de l'expansion du secteur privé lucratif, financée en partie par de l'argent public, dans un domaine aussi sensible que la santé mentale.
Computers typically store text by dividing the text into characters (the individual letters, spaces, numerals, punctuation marks, emojis, and other symbols). These characters are then stored in order and called strings (that is a bunch of characters strung together, like in Fig. 4.6 below).
The realization that "text" on social media encompasses more than just English letters, but also spaces, punctuation, characters from diverse languages, and emojis, was significant. Inconsistent encoding or character handling can result in garbled text, inaccurate length calculations, and adverse effects on subsequent text cleaning, keyword statistics, and sentiment analysis. Consequently, preprocessing strings is essential prior to undertaking data analysis.
Relationship status
I think this is an interesting data with constraints that shift along cultural axes. While the other data types like age, name, and address can vary from culture to culture (such as characters used to input), the answers will all be relatively similar. People might for example measure their age using different calendars, or by amount of winters experienced, but a full annual cycle is used pretty much worldwide. For relationship status though, there are a lot of variables even in one culture that must be negotiated. Does dating count as different than a relationship? What about new terms like situationship? What about cultures with multiple partners? There's so many value judgements about what counts as a relationship in the act of reifying it in code. It makes me think about the ways in which our cultural ideology is represented in code, more than we often think about.
ole of microorganismsas disease-forming agents that needed to be eliminated.
An important concept is that there are not many parasitic microbes, but the ones that are parasitic have had a huge impact on the world. This is why so many people are afraid of microbes, because they think they are all bad and harmful.
To address the issue of how the individual’s memory becomeslinked with that of the collectivity, Halbwachs explains that ‘‘Whilethe collective memory endures and draws strength from its base in acoherent body of people, it is individuals as group members whoremember.’’11 People are located within different groups such asfamilies, nations, associations and social classes. Individuals areable to remember and recreate the past by drawing on these specificgroup contexts, which is also what makes memories concrete andmeaningful. Thus, as Halbwachs explains, ‘‘Every collective memoryrequires the support of a group delimited in space and time.
This paragraph highlights that a memory is held by an individual, but is shaped and formed by a group. It is these groups that give the memory a significance and structure.
Many schools still have ThanksgivingDay pageants and numerous textbooks continue to give thetraditional story.
This was my experience growing up. The story of the Pilgrims and Native Americans was celebrated, but the darker history was seldom talked about.
Thanksgiving has changed over time in accordance with the ideas of the day.Aspects of the analysis support Barry Schwartz’s theory that commemorationreflects the historical past. Similar to the pilgrims’ celebration, many peoplecommemorate Thanksgiving by, for example, feasting and praying
And some people today outright refuse to celebrate Thanksgiving due to the past treatment of Native Americans. I'm not one of those people, but that's because when I think of Thanksgiving, I think of cooking a meal and spending time with my family. No one has to venerate the past if they don't want to.
Evaluate scientific literature
This is definitely something I dread, but I need to be more comfortable with reading them so this is the perfect opportunity to learn in a comfortable setting.
Emotional adjustment. Remember the range of emotions presented at the beginning of the chapter? Those will likely be present in some form throughout your first weeks in college and at stressful times during the semester. Knowing that you may have good days and bad—and that you can bounce back from the more stressful days—will help you find healthy ways of adjusting emotionally.
This connects very well with me because I am an emotional mess. Stress and anxiety can interfere with daily life and struggles for not just me but for many.
Applying Grit The concept of grit is an easy one to dismiss as something taken for granted. In our culture, we have a number of sayings and aphorisms that capture the essence of grit: “If at first you do not succeed, try, try again,” or the famous quote by Thomas Edison: “Genius is one percent inspiration, ninety-nine percent perspiration.” The problem is we all understand the concept, but actually applying it takes work. If the task we are trying to complete is a difficult one, it can take a lot of work.
The text talks about "grit:. Grit is defined as passion and perseverance for long term goals. It means sticking with something even when it's hard.
Adjustments to College Are Inevitable College not only will expand your mind, but it may also make you a little uncomfortable, challenge your identity, and at times, make you doubt your abilities. It is hard to truly learn anything without getting messy. This is what education does: it transforms us. For that to happen, however, means that we will need to be open to the transformation and allow the changes to occur. Flexibility, transition, and change are all words that describe what you will experience.
I like how the text says learning can be messy. It reminds me that growth isn't always comfortable, but it's worth it in the long run.
despite the diminution of original habitat but not without continuing costs.
Shrinking habitat space must be more and more heavily managed and maintained the smaller it is, as it becomes less and less self-sustaining, and is cut off more and more to become (in some cases) a sort of 'inland island". Consider also the ongoing cost of defending these spaces in public policy.
Looking back, diving has taught me more about life, the ups and downs, the good and bad, and to accept and deal with life’s challenges. Everything I learn and discover underwater applies to the many different aspects of my life. It has also taught me that life is very short: I have to live in the moment or I will miss the opportunities that come my way. I allow myself to forget all my sorrow, despair and disappointments when I dive into the deep blue sea and savor the feelings of peacefulness and calmness. There is nothing around me but fish and corals, big and small. Floating along in silence with only the sound of my breath—inhale and exhale. An array of colors explodes in front of my eyes, colors that I never imagine I will discover again, an underwater rainbow as beautiful as the rainbow in the sky after a storm. As far as my eyes can see, I look into the depth of the ocean with nothing to anchor me. The deeper I get, the darker it turns. From the light blue sky to the deep navy blue, even blackness into the void. As the horizon darkens, the feeding frenzy of the underwater world starts and the watery landscape comes alive. Total darkness surrounds me but the sounds that I can hear are the little clicks in addition to my breathing. My senses overload as I cannot see what is around me, but the sea tells me it is alive and it anchors me to the depth of my soul.
despite the sea teaching harsh lessons about life to the author it's also a place of relaxation for them not only because of the childhood memories but also because it also shows with chaos there is also calmness
MCP: JSON file with agent meta data but not actual tools only instruction of how to connect(Look up table)
NANDA index: de centralized index quilt connects registries , security useful for next stages.
centralization
Even though the initial interpre-tation was not supported in the text, as discussion con-tinued, the students adjusted their interpretation as theygathered more information
But what if a student doesn't budge/reflect on their interpretation and without facilitator/peer guidance comes to fully believe their incorrect interpretation?
They argued that ELA teachersshould enhance practices in the classroom that allowstudents the ability to create their own interpretationswithout labeling those interpretations as merely wrongor incorrect.
But what is they are objectively incorrect intepretations?
Then it dived to the bottom and came up with some soft mud, which began to grow and spread on every side until it became the island which we call the earth. It was afterward fastened to the sky with four cords, but no one remembers who did this.
The Cherokee believe that the Earth is being held up with seemingly invisible chords or strings that stretch to the heavens which I think is a very interesting way to think about it.
There’s nothing wrong with the causal history of Henry’s belief, either
But he is unaware that he is in False Barn County, and that this is the one real barn
Henry isn’t actually forming any false beliefs as he makes his judgement about that one real barn
But isn't the belief that he isn't in False Barn County a false belief?
We don’t (and shouldn’t) follow a simple rule of denying knowledge every time a false belief enters the picture
But aren't some false beliefs more important than others?
An equity approach, on the other hand, might be surveying each potential reader about the barriers and needs associated with reading this text. It could be that this results in purchasing and sending glasses to everyone with the appropriate prescriptions, or, the author could discover that the more pressing need for reading accessibility is actually better internet access or assistive technologies. For justice to be achieved systemic shifts would be so comprehensive that all materials would be designed with every type of reader in mind such that no special surveying/assistance is needed. This is an ambitious but important goal for any of us in leadership/power positions.
Connection: This discussion of equity resonated with the current material presented in my 5351 course. More specifically, I would like to draw ties to “The African-Centered Worldview: Toward a Paradigm for Social Work” written by Mekada J. Graham for the Journal of Black Studies. The article highlights the critical failures of social work theory in that it is foundationally ethnocentric. More specifically, social work theory is Eurocentric as its knowledge base is formed by the systems that see an overrepresentation of Black clients. Simply put, practitioners of social work have historically applied ethnocentric theory and practice to their aid of all individuals and groups.
This being said, a line can be drawn here between equity v. equality and Afrocentric ideals v. Eurocentric ideals. Equality would seem to prescribe traditional social work theory to all, providing aid and care in a manner that is similar for each individual. However, an equity approach is analogous to the Afrocentric approach, as diverse groups and varied individuals require tailored social work that does not look the same for all. This can be further proven by examining the outcomes of a universally prescribed social work theory. Graham's article states that Black individuals are overrepresented in social work, meaning that they are most commonly in stages of disparity and seeking out aid. They are also underrepresented in preventative aid, meaning that the overrepresentation and magnified need could be alleviated if an equity approach, not an equality approach, is taken systematically. The equity approach is connected to the application of an Afrocentric approach for these reasons.
Competency 3: Engage Anti-Racism, Diversity, Equity, and Inclusion (ADEI) in Practice Social workers understand how racism and oppression shape human experiences and how these two constructs influence practice at the individual, family, group, organizational, and community levels and in policy and research. Social workers understand the pervasive impact of White supremacy and privilege and use their knowledge, awareness, and skills to engage in anti-racist practice. Social workers understand how diversity and intersectionality shape human experiences and identity development and affect equity and inclusion. The dimensions of diversity are understood as the intersectionality of factors including but not limited to age, caste, class, color, culture, disability and ability, ethnicity, gender, gender identity and expression, generational status, immigration status, legal status, marital status, political ideology, race, nationality, religion and spirituality, sex, sexual orientation, and tribal sovereign status. Social workers understand that this intersectionality means that a person’s life experiences may include oppression, poverty, marginalization, and alienation as well as privilege and power. Social workers understand the societal and historical roots of social and racial injustices and the forms and mechanisms of oppression and discrimination. Social workers understand cultural humility and recognize the extent to which a culture’s structures and values, including social, economic, political, racial, technological, and cultural exclusions, may create privilege and power resulting in systemic oppression.
Questions 1. What steps can be implemented when a social worker is attempting to understand the intersectionality of the client while maintaining mutual respect? 2. As an African American social worker that serves majority Caucasian clients, explain how cultural humility can help shape cultural competency.
Note: This preprint has been reviewed by subject experts for Review Commons. Content has not been altered except for formatting.
Learn more at Review Commons
In this work Neupane et al used large-scale robust CRISPR-based gene activation and ablation screens to identify novel regulators of α-synuclein pathology in synucleinopathies using as read-out p-αSyn129 signals by high-throughput fluorescence microscopy. The authors reveal that mitochondrial protein OXR1 promotes Ser129-phosphorylated αSyn aggregation, while ER-associated EMC4 suppresses it via enhanced autophagic clearance, highlighting new possible mechanistic pathways in disease progression of alpha-synucleinopathies.
Major comments:
Minor comments:
This is a well written, comprehensive study with a well characterized, robust CRISPR-based gene activation and ablation screening pipeline to identify novel regulators of α-synuclein pathology. Methodology is rigorous and clearly described and results are well presented. The major limitation relays in the validation experiments where only one main read-out that is p-αSyn129 fluorescence signal is employed, limiting the significance and impact of the presented results. I believe that the basic science community might benefit principally of the proposed methodology of a large high-throughput screening to modulate a large set of genes, a platform that in principle might be used also for other scientific questions.
Note: This preprint has been reviewed by subject experts for Review Commons. Content has not been altered except for formatting.
Learn more at Review Commons
In the present study, Neupane et al. performed arrayed CRISPR activation and ablation screens, targeting genes related to mitochondria, trafficking and motility, to identify genes that modulate the presence of Ser 129 phosphorylated alpha-synuclein aggregates (pSyn129) upon administration of exogenous preformed alpha-synuclein fibrils. The screens have been performed in HEK cells stably overexpressing alpha-synuclein in two independent replicates, and hits have been further validated in induced pluripotent stem cell derived forebrain and dopaminergic neurons. Following functional validations, the authors conclude that enhancing the expression of OXR1 results in a modest increase in the number of pSyn129 puncta within cells, and their size, while partial loss of EMC4 expression reduces these puncta. To date some pre-print studies have used genome-wide CRISPR screening to identify modifiers of the accumulation of alpha-synuclein preformed fibrils in cells, suggesting the importance of uptake and endolysosomal trafficking for the propagation of alpha-synuclein aggregates in recipient cells. Although the topic is of interest in the field of Parkinson's disease and synucleinopathies in general, the readout of the present screen (presence of pSyn129) is not very sensitive and without investigating endogenous alpha-synuclein or cell homeostasis in neuronal models limits the stated conclusions.
Major comments:
For instance, in figure S3 it would be important to add an experiment controlling for cell number as opposed to LDH release, as the micrographs show some differences in cells number, e.g. in the ntg vs. EMC4 condition. - The data is not sufficient to suggest that OXR1 and EMC4 are strong modulators of alpha-synuclein aggregation, as the authors suggest based on figures 2 and 3 that show statistically significant difference and a rather small effect size. It is important to provide more insight into how these genes may affect endogenous alpha-synuclein and cellular homeostasis in more detail, especially in neuronal models. Further investigating the hits in this direction in additional genetic backgrounds would also increase the relevance of the findings, e.g. in SNCA triplication or GBA-PD neurons.<br /> In Fig. S8B the immunoblot analysis shows there may be an effect of EMC4 and OXR1 CRISPRa on α-synuclein levels; please quantify for both iPSC-derived cortical neurons and dopaminergic neurons. - The pattern of tyrosine hydroxylase staining in Figure 5F does not seem specific or as expected for iPSC-derived dopaminergic neurons. Furthermore, since endogenous SNCA expression is expected to be analogous to the expression of TH (with TH+ cells expressing higher SNCA), it would be important to compare pSyn129 between TH+ cells and/or relative to the TH+ area.
Minor comments:
Important topic but their experimental design limits the significance of their findings. Hard to improve the work in a reasonable amount of time. Also many technical issues.
Note: This preprint has been reviewed by subject experts for Review Commons. Content has not been altered except for formatting.
Learn more at Review Commons
Summary:
This study by Neupane et al. investigates modulators of α-synuclein aggregation, focusing on Ser129-phosphorylated α-synuclein (pSyn129), a pathological hallmark of Parkinson's disease (PD). The authors performed high-content image-based, arrayed CRISPR activation (CRISPRa) and knockout (CRISPRo) screens targeting > 2300 genes related to mitochondrial function, intracellular trafficking, and cytoskeletal reorganization. Using α-Syn overexpressing HEK293 cells, they identified OXR1 and EMC4 as novel modulators of pSyn129 abundance. Key findings were that activation of the mitochondrial protein OXR1 increased pSyn129 by decreasing ATP levels, while ablation of the ER-associated protein EMC4 reduced pSyn129 by enhancing autophagic flux and lysosomal clearance. These findings were validated in human iPSC-derived cortical and dopaminergic neurons.
My major comments have to do with statistical methods and with significance of their findings.
Major comments:
Are the claims and the conclusions supported by the data or do they require additional experiments or analyses to support them?
The claims and conclusions are generally well-supported by the presented data. The dual CRISPRa/CRISPRo screen provides a robust initial discovery platform, and the validation in iPSC-derived neurons strengthens the findings and their translational relevance. The mechanistic insights into OXR1 (ATP levels) and EMC4 (autophagic flux, lysosomal clearance) are supported by the described experiments. The use of two antibodies (81A and EP1536Y) for pSyn129 also enhances confidence in the measurements. I had a few questions about the statistical methods. The main concern I have about methodology for the screen is whether the authors have corrected for multiple hypotheses in their discovery screen. This is not clear from the text, methods, or legends (for Figures 2A/2B/2C).
Are the suggested experiments realistic in terms of time and resources?
The OPTIONAL experiments are generally feasible as they employ methods that the lab is already using in this paper.
Are the experiments adequately replicated and statistical analysis adequate?
See comment about multiple hypothesis testing above.
This is a well-designed, difficult-to-accomplish study that expands the landscape of pS129Syn modulators. The validation of the primary hits identified in HEK293 cells in iPSC-derived neurons gives the findings greater relevance.
Strengths:
Limitations:
These tools generate many of the same biases as human law-enforcement officers, but with the false patina of technical neutrality.
technology is inherently biased. it is biased towards its creator and its creator's viewpoints. FOR EXAMPLE elon musk's grok
ack Ibsen
I'll leave this as a general comment. But remember your resume is to showcase who you are and how you can bring energy and skill to a job. Your bullet points could use a bit more energy or insight. You're first year dont sweat too much but you have to start putting emphasis on bullet points like in details. Bullshit if you have to but make it believable obviously. Your resume has so much more potential.
Also as Dan said fill up as much as you can cuz that white space at the bottom is a lot.
Built a static page generator to convert Markdown files into HTML pages using predefined templates.
This one idk much to put in this one but I'm sure you can come up with 1-2 more setences on this. Projects are supposed to show what you can do and showcase your skill
Developed a sports analytics service calculating team ratings for MLB, NBA, and NHL factoring in opponentstrength and point differential.∗ Built a web-based front-end to visualize analytics data for users.∗ Automated the generation of social media graphics and published them via a BlueSky bot.∗ Analyzed large MLB season datasets to compute individual player ratings identifying top players
I like this but I feel liek you can quantify a bit more like how many MLB data sets? or how many games in a season are you analyzing or even weekly or daily.
Mention what you used for front-end to visualize, you can just say plain HTML/CSS/JS or you can add a framework.
If you automated generation of social media graphics how much time did you save? You can quantify that.
Learned front-end web development by creating a dynamic ”Weather Rock” web application, depicting currentconditions using a rock.
Add more bullet points to this as I know there's not only one thing you learnt and front-end web development is a very BROAD topic.
DId you work with cross-functional teams? Did you improve a process that was slow initially by someone else on your team? Point out some languages you used.
Also idk this might be me nitpicking but idk if you're allowed to say the company project name as thats usualyl private but yet again sicne its a highschool i dont thinkl they care all that much.
Also I would rename this as "Software Developer Intern" or something because it looks like an internship seeing it spanned months. or Full Stack but since you said front end I'd just keep software developer intern or Front end developer intern.
Future studies should distinguish between languages learned in childhood and those learned in old age. I believe both are effective, but this still needs to be proven,” said Berlit.
I wonder if when a child learns many languages during childhood, the brain treats the communicative systems as all a unified mechanism, as if it if was one whole language composed of several words that are synonyms and antonyms in the semantic spectrum. Under this logic, the benefit would be for adult learners who then would consider different languages as different communicative systems, therefore locating them in different regions of the brain and ultimately enhacing neuroplasticity and synapses.
This article aims to address this gap by introducing a new measure of voting influence, thereby contributing to the existing literature on the impact of radical right parties.
WAS gap in litrature on how powerful ID was in EP -> voting influence tool helps us to see (that they are often part of coalitions but thats it)
"This article aims to address this gap by introducing a new measure of voting influence, thereby contributing to the existing literature on the impact of radical right parties."
The analysis reveals, contrarily to previous studies, that the radical right group often joins winning coalitions, especially on legislative files and even with the Grand coalition. But it also shows that it does not mean that the group is influential as its influence requires a minimum level of conflict in plenary and ID needs to be cohesive. However, although the group's influence is limited, it has become a crucial partner of the EPP in some cases.
CONCLUSION: - ID / radical right groups are OFTEN part of winning coalitions within the EP - This does NOT mean that the group is influential (I think because still of internal infighting? - Is a crucial partner of the EPP in "some cases"
On the one hand, contrarily to the Conservative and Reformist group (ECR), the ID group is facing significant constraints due to the cordon sanitaire. Because of its radical ideology, it is the only group which is consistently excluded from key positions, files, committee work, and formal alliances.3 On the other hand, it has doubled its seat count between the 8th (2014 to 2019) and the 9th term (2019 to 2024), growing from 36 to 73 seats (76 seats following the United Kingdom's withdrawal from the EU).
So parties don't want to work w/ ID as opposed to CR (other less radical conservative party)
BUT voting share has increased much in past five years.
THIS article is going to MEASURE / EXAMINE THE VOTING INFLUENCE OF ID IN THE EP -> doing so by lookin at the "final stage of decision making in the EP" which is PLENARY VOTING
Voting influence (introduce term here): - "ability of a party group to sway the outcome of a vote" - Basically applies to PLENARY voting WITHIN the EP -. doesn't refer to ballot box.
but my anxiety was so fierce
why is this young child so anxious?
Franklin Roosevelt’s highly successful NewDeal coalition was to graft more liberal elements— mainly ethnic and urbanliberals— onto the party’s traditional Southern base
The north was always more progressive, and there was a time when the republican part provided that, but as the population become younger and catholic and immigrant, the democrats were actually the party that had the opportunity for liberalism
New England’ssupport for the GOP was mostly uniform due to the lingering resentmentsof the Civil War and to Republicans’ continuing support of nationalizing,coordinative efforts as they related to commerce.
But isn't this not analogous to today since the views on states rights would flip which party it found a home under
New England’s swing in party supporthas been at least as dramatic as what occurred in the former confederacy.
But hasn't given new england the same voting power as the south
isits by peaceful citizens of West Berlin to the capital of the German Democratic Republic (the democratic Berlin) are possible upon presentation of a West Berlin identity card.
Interesting that CITIZENS of West Germany are allowed to enter -> blames government filled w/ Nazis and American "imperialism" -> again drawing link between Bonn govt and Nazism (directly, successor state, GDR only denazified state)
"Visits by peaceful citizens of West Berlin to the capital of the German Democratic Republic (the democratic Berlin) are possible upon presentation of a West Berlin identity card. Revanchist politicians and agents of West German militarism will not be allowed to set foot in the capital of the GDR (democratic Berlin)."
But then what about GDR citizens? -> Need "spevcial permission" which seems to betray a kind of anxiety ovr brain drain / undermined control.
There may indeed be cases in which justice requires that a woman should receive the same income as a man if she is engaged in typical men's work, e.g. that of a heavy or very heavy worker and if, in addition, she has to care for children in place of a husband. But then one should achieve the equality not by increasing the basic wage, but through child allowances or, even better, through an appropriate reduction in taxes. For such a woman is contributing to the maintenance of the national community in the same way as a family man.'
IS possible for women to contribute to national community (i.e., by participating in the labour economy). Hitler says women would be contributing as much as, say, husbands/fathers if they worked (strenuous) jobs AND were the only caretakers of their families.
"There may indeed be cases in which justice requires that a woman should receive the same income as a man if she is engaged in typical men's work, e.g. that of a heavy or very heavy worker and if, in addition, she has to care for children in place of a husband. But then one should achieve the equality not by increasing the basic wage, but through child allowances or, even better, through an appropriate reduction in taxes. For such a woman is contributing to the maintenance of the national community in the same way as a family man.'"
cannot anticipate a significant improvement in performance by equalizing the pay of men and women. Money is not worth as much as it used to be because there is a dearth of consumer goods which can be bought.
SUB argument / evidence for no equal pay for equal work -> because doesn't make economic sense: i.e., wages WON'T improve people's efficiency -> not how that works, also wartime economy cannot handle it. Specifically because it would only increase purchases on the "Black Market" Says, I guess, that they CAN externally improve women's performance in facotires, but only by increasing food supplies -> no consumer goods since war, so this would mean contributing to the Black Market.
"cannot anticipate a significant improvement in performance by equalizing the pay of men and women. Money is not worth as much as it used to be because there is a dearth of consumer goods which can be bought. "
"An increase in women's wages would in practice simply mean strengthening the black market. If one wanted to achieve a general improvement in performance that could only be done by improving food supplies and the supply of the most important commodities."
Women must then work at home in order to look after their families and their flats.
Equal pay for equal work is false
Why? BECAUSE women (again, according to Hitler, of all people) are meant to work "at home" to look after their families. Hitler doesn not consider this domestic labour to be as important as a husband/father's work in supporting the family and "national community" -> explicitly states that it is more important. "because they must make more sacrifices for the national community."
Framed in context of wages being paid NOT for performance but for "social reasons" -> namely, implicitly, workers should be paid accorindg to how much they need the money for a family / how much they contribute to "national community"
Hitler thinks that wages should NOT be paid on performance -> justifies this decision by saying that young (male) workers shouldn't be paid more than old ones even though they can likely work faster and for longer. Instead, older men should be paid more because, again, they have families to support and contribute more to the "national community". Younger men work faster but do not contribute as much because they are unattched.
Hitler, again, maintains that women both do not perform well compared to men AND have less to contribute to families / national community -> "only have themselves to look after" (in a patrarchal assumption)
But such an approach ignores the fact that crime is a public issue, as structural factors such as inequality and the physical characteristics of communities contribute to high crime rates among certain groups in American society.
In my opinion, America is so expensive now that even basic rent is hard to afford compared to people’s salary. If the monthly salary was at least three times higher than the rent, maybe people could actually survive, but right now after paying rent you still have to buy food and pay gas, internet, and electricity, so many people really cannot afford it. People are just working so hard every single day just to survive, repeating the same struggle until they cannot make it anymore, and sometimes that pressure pushes them into decisions they never really wanted to make.
(a) personal experience; (b) common sense; (c) the media (including the Internet); (d) “expert authorities,” such as teachers, parents, and government officials; and (e) tradition.
"How do we know what we think we know" When reading this question, I didn't know quite how to respond. But reading about all the five societal interpretation, I understand more. There are so many different ways to interpret things. We all assimilate different thoughts and perceptions. For me, I would say that personal experiences would be the reason why I know things. But reading on, ones experience might not be the same for another persons experience. In conclusion, every person in the world works differently. One might not agree on how another person on how they interpret things. All in all, we need to be respectful of all differences and different opinions.
In recognizing the importance of social structure, sociology stresses that individual problems are often rooted in problems stemming from the horizontal and vertical social structures of society
When people are very poor and just trying to survive, some end up doing crime, but rich people with good schools and connections don’t face that same survival pressure.
People’s positions in society’s hierarchy in turn often have profound consequences for their attitudes, behaviors, and life chances, both for themselves and for their children.
This part is a really big deal for me, because as a child if your parents have good education and a stable salary, they don’t struggle with money and their kids usually get good connections, good schools, and higher knowledge. But if you grow up with no money like me, you don’t start with those advantages, and your life chances depend a lot on how hard you work and any small connections you can build.
Respondents aged 65 or older were actually slightly more likely than those younger than 65 to say they were very happy! About 33% of older respondents reported feeling this way, compared with only 28% of younger respondents
In my opinion, many older people are actually happy because they already experienced life. They experienced joy, they saw what they wanted to see, and they watched the world and their places change over time. Some of them might feel sad because they think they did not achieve enough, but they still experienced life and they saw what they had to see.
If you relied on your personal experience to understand the typical American marriage, you would conclude that most marriages were as good as your parents’ marriage, which, unfortunately, also is not true. Many other examples could be cited here, but the basic point should be clear: although personal experience is better than nothing, it often offers only a very limited understanding of social reality other than our own.
I’m not American, I’m Filipino. I used to think a lot of Filipino families are good families, because no matter how hard life is and how poor it is, they stick together. Even if there is a lot of fighting, yelling, shouting, they still stay together. I felt so proud that my mom and dad are still married. But these days I found out the true story, that my dad is not perfect, and the story I knew in the past is getting destroyed by learning what the real story or real picture is.
I already know a lot about people. I could have told you that young people voted for Obama. I already had heard that men have a higher suicide rate than women. Maybe our social backgrounds do influence us in ways I had not realized, but what beyond that does sociology have to tell me?”
As for me, I cannot say to someone that I know about them when in reality I don’t. I can judge, but I cannot say I really know, because that is a big deal. I never put my shoes in their shoes, so how can I say I know?
Sociology can help us understand the social forces that affect our behavior, beliefs, and life chances, but it can only go so far. That limitation conceded, sociological understanding can still go fairly far toward such an understanding, and it can help us comprehend who we are and what we are by helping us first understand the profound yet often subtle influence of our social backgrounds on so many things about us.
When I first got here in America, there were certain things I believed because of my social background. My husband had a therapist, so I joined his therapy. At first, I just listened to other people’s problems and issues, until the therapist asked me about my own feelings about my family. I had a lot of beliefs like ‘my family is great,’ but when he asked me, I felt doomed because I didn’t know what to say and I didn’t even know the definition of feelings. As we kept working, I started to see the reality. I saw the true color, the true image of my past. I realized I have a lot of trauma, but at least now I can face it. I can see it is there, instead of lying to myself that it is not there. I know it’s not perfect and I still have a lot of issues and a lot of scramble in my life, but at least I can work on it now.
Many people will not fit the pattern of such a generalization, because people are shaped but not totally determined by their social environment.
Yes, of course people have their own thoughts and their own mind. They get influenced by what they see, what they hear, and the people around them, but they still have their own mindset. They still have their own feelings and judgment about what’s going on around them, so they don’t always follow the pattern.
Determining income means adding up how much money one makes from all regular sources of work each month
? Article talks about how it should be regular, but then says "monthly tasks for neighbors." Are those rlly regular?
Luther wanted these texts to be available for readingand meditation, but he did not regard them as scripture
Whats the difference? Don't obey them to a tee?
continued to cite the Greek Bible, though argu-ing for the superiority of the Hebrew text and canon.
For people party it was on hand but it must have also been colonial motivations
Canonization is fundamentally a process of selection,but we cannot reconstruct why particular texts were can-onized while others were not
But again gives an opportunity for SELF selection of whats important
To conclude, in the past, and even somewhat today, the arts have been seen as something extra, and something fun to do if students needed a break from “real learning.” We now know that arts integration aligns with current best practices for teaching and learning, and that it offers a powerful way to help teachers return to the joy of teaching.
This is interesting, and I am wondering how much further would teachers have to work during outside contract hours to make this a reality. Is this a realistic thing to expect most teachers to do? Yes, it is good, but I worry about more things being added on teacher's plates without additional pay. Just additional work. Another question, if it IS additional work and no additional pay, would that STILL be worth it? If it increases career satisfaction?
Not only is arts integration engaging and motivating for students, teachers find that it also energizes them and their teaching. Teachers that have been relying primarily on textbooks and worksheets as instructional strategies report that they feel increasingly discouraged by the drudgery of teaching and the lack of student engagement4. Many become bored or disenfranchised, and even leave the profession.
Not only is art integration good for students, but it is also good for teachers. I think that is an excellent argument, however a question I might have is is it good for ALL teachers? Or just those who are more creatively inclined? I am very creatively inclined, however I wonder if arts integration would have the same affect on a person who has never had much interest in creative arts.
Reviewer #2 (Public review):
Summary:
In this work, Gupta & Murphy present several parallel efforts. On one side, they present the hardware and software they use to build a head-fixed mouse experimental setup that they use to track in "real-time" the calcium activity in one or two spots at the surface of the cortex. On the other side, they present another setup that they use to take advantage of the "real-time" version of DeepLabCut with their mice. The hardware and software that they used/develop is described at length, both in the article and in a companion GitHub repository. Next, they present experimental work that they have done with these two setups, training mice to max out a virtual cursor to obtain a reward, by taking advantage of auditory tone feedback that is provided to the mice as they modulate either (1) their local cortical calcium activity, or (2) their limb position.
Strengths:
This work illustrates the fact that thanks to readily available experimental building blocks, body movement and calcium imaging can be carried out using readily available components, including imaging the brain using an incredibly cheap consumer electronics RGB camera (RGB Raspberry Pi Camera). It is a useful source of information for researchers that may be interested in building a similar setup, given the highly detailed overview of the system. Finally, it further confirms previous findings regarding the operant conditioning of the calcium dynamics at the surface of the cortex (Clancy et al. 2020) and suggests an alternative based on deeplabcut to the motor tasks that aim to image the brain at the mesoscale during forelimb movements (Quarta et al. 2022).
Weaknesses:
This work covers 3 separate research endeavors: (1) The development of two separate setups, their corresponding software. (2) A study that is highly inspired from the Clancy et al. 2021 paper on the modulation of the local cortical activity measured through a mesoscale calcium imaging setup. (3) A study of the mesoscale dynamics of the cortex during forelimb movements learning. Sadly, the analyses of the physiological data appears incomplete, and more generally, the paper shows weaknesses regarding several points:
The behavioral setups that are presented are representative of the state of the art in the field of mesoscale imaging/head fixed behavior community, rather than a highly innovative design. Still, they definitely have value as a starting point for laboratories interested in implementing such approaches.
Throughout the paper, there are several statements that point out how important it is to carry out this work in a closed-loop setting with an auditory feedback, but sadly there is no "no feedback" control in cortical conditioning experiments, while there is a no-feedback condition in the forelimb movement study, which shows that learning of the task can be achieved in the absence of feedback.
The analysis of the closed-loop neuronal data behavior lacks controls. Increased performance can be achieved by modulating actively only one of the two ROIs, this is not really analyzed, while this finding which does not match previous reports (Clancy et al. 2020) would be important to further examine.
Author response:
The following is the authors’ response to the original reviews.
Public reviews:
Reviewer #1 (Public review):
Summary:
The authors provide a resource to the systems neuroscience community, by offering their Python-based CLoPy platform for closed-loop feedback training. In addition to using neural feedback, as is common in these experiments, they include a capability to use real-time movement extracted from DeepLabCut as the control signal. The methods and repository are detailed for those who wish to use this resource. Furthermore, they demonstrate the efficacy of their system through a series of mesoscale calcium imaging experiments. These experiments use a large number of cortical regions for the control signal in the neural feedback setup, while the movement feedback experiments are analyzed more extensively.
Strengths:
The primary strength of the paper is the availability of their CLoPy platform. Currently, most closed-loop operant conditioning experiments are custom built by each lab and carry a relatively large startup cost to get running. This platform lowers the barrier to entry for closed-loop operant conditioning experiments, in addition to making the experiments more accessible to those with less technical expertise.
Another strength of the paper is the use of many different cortical regions as control signals for the neurofeedback experiments. Rodent operant conditioning experiments typically record from the motor cortex and maybe one other region. Here, the authors demonstrate that mice can volitionally control many different cortical regions not limited to those previously studied, recording across many regions in the same experiment. This demonstrates the relative flexibility of modulating neural dynamics, including in non-motor regions.
Finally, adapting the closed-loop platform to use real-time movement as a control signal is a nice addition. Incorporating movement kinematics into operant conditioning experiments has been a challenge due to the increased technical difficulties of extracting real-time kinematic data from video data at a latency where it can be used as a control signal for operant conditioning. In this paper they demonstrate that the mice can learn the task using their forelimb position, at a rate that is quicker than the neurofeedback experiments.
Weaknesses:
There are several weaknesses in the paper that diminish the impact of its strengths. First, the value of the CLoPy platform is not clearly articulated to the systems neuroscience community. Similarly, the resource could be better positioned within the context of the broader open-source neuroscience community. For an example of how to better frame this resource in these contexts, I recommend consulting the pyControl paper. Improving this framing will likely increase the accessibility and interest of this paper to a less technical neuroscience audience, for instance by highlighting the types of experimental questions CLoPy can enable.
We appreciate the editor’s feedback regarding the clarity of the CLoPy platform's value and its positioning within the broader neuroscience community. We agree and understand the importance of effectively communicating the utility of CLoPy to both the systems neuroscience field and the wider open-source neuroscience community.
To address this, we have revised the introduction and discussion sections of the manuscript to more clearly articulate the unique contributions of the CLoPy platform. Specifically:
(1) We have emphasized how CLoPy can address experimental questions in systems neuroscience by highlighting its ability to enable real-time closed-loop experiments, such as investigating neural dynamics during behavior or studying adaptive cortical reorganization after injury. These examples are aimed at demonstrating its practical utility to the neuroscience audience.
(2) We have positioned CLoPy within the broader open-source neuroscience ecosystem, drawing comparisons to similar resources like pyControl. We describe how CLoPy complements existing tools by focusing on real-time optical feedback and integration with genetically encoded indicators, which are becoming increasingly popular in systems neuroscience. We also emphasize its modularity and ease of adoption in experimental settings with limited resources.
(3) To make the manuscript more accessible to a less technically inclined audience, we have restructured certain sections to focus on the types of experiments CLoPy enables, rather than the technical details of the implementation.
We have consulted the pyControl paper, as suggested, and have used it as a reference point to improve the framing of our resource. We believe these changes will increase the accessibility and appeal of the paper to a broader neuroscience audience.
While the dataset contains an impressive amount of animals and cortical regions for the neurofeedback experiment, and an analysis of the movement-feedback experiments, my excitement for these experiments is tempered by the relative incompleteness of the dataset, as well as its description and analysis in the text. For instance, in the neurofeedback experiment, many of these regions only have data from a single mouse, limiting the conclusions that can be drawn. Additionally, there is a lack of reporting of the quantitative results in the text of the document, which is needed to better understand the degree of the results. Finally, the writing of the results section could use some work, as it currently reads more like a methods section.
Thank you for your thoughtful and constructive feedback on our manuscript. We appreciate the time and effort you took to review our work and provide detailed suggestions for improvement. Below, we address the key points raised in your review:
(1) Dataset Completeness: We acknowledge that some of the neurofeedback experiments include data from only a single mouse for some cortical regions while for some cortical regions, there are several animals. This was due to practical constraints during the study, and we understand the limitations this poses for drawing broad conclusions. We felt it was still important to include these data sets with smaller sample sizes as they might be useful for others pursuing this direction in the future. To address this, we have revised the text to explicitly acknowledge these limitations and clarify that the results for some regions are exploratory in nature. We believe our flexible tool will provide a means for our lab and others include more animals representing additional cortical regions in future studies. Importantly, we have included all raw and processed data as well as code for future analysis.
(2) Quantitative Results: We recognize the importance of reporting quantitative results in the text for better clarity and interpretation. In response, we have added more detailed description of the quantitative findings from both the neurofeedback and movement-feedback experiments. This will include effect sizes, statistical measures, and key numerical results to provide a clearer understanding of the degree and significance of the observed effects.
(3) Results Section Writing: We appreciate your observation that parts of the results section read more like a methods section. To improve clarity and focus, we have restructured the results section to present the findings in a more concise and interpretative manner, while moving overly detailed descriptions of experimental procedures to the methods section.
Suggestions for improved or additional experiments, data or analyses:
Not necessary for this paper, but it would be interesting to see if the CLNF group could learn without auditory feedback.
This is a great suggestion and certainly something that could be done in the future.
There are no quantitative results in the results section. I would add important results to help the reader better interpret the data. For example, in: "Our results indicated that both training paradigms were able to lead mice to obtain a significantly larger number of rewards over time," You could show a number, with an appropriate comparison or statistical test, to demonstrate that learning was observed.
Thank you for pointing this out. We have mentioned quantification values in the results now, along with being mentioned in the figure legends, and we are quoting it in following sentences. “A ΔF/F0 threshold value was calculated from a baseline session on day 0 that would have allowed 25% performance. Starting from this basal performance of around 25% on day 1, mice (CLNF No-rule-change, N=23, n=60 and CLNF Rule-change, N=17, n=60) were able to discover the task rule and perform above 80% over ten days of training (Figure 4A, RM ANOVA p=2.83e-5), and Rule-change mice even learned a change in ROIs or rule reversal (Figure 4A, RM ANOVA p=8.3e-10, Table 5 for different rule changes). There were no significant differences between male and female mice (Supplementary Figure 3A).”
For: "Performing this analysis indicated that the Raspberry Pi system could provide reliable graded feedback within ~63 {plus minus} 15 ms for CLNF experiments." The LED test shows the sending of the signal, but the actual delay for the audio generation might be longer. This is also longer than the 50 ms mentioned in the abstract.
We appreciate the reviewer’s insightful comment. The latency reported (~63ms) was measured using the LED test, which captures the time from signal detection to output triggering on the Raspberry Pi GPIO. We agree that the total delay for auditory feedback generation could include an additional latency component related to the digital-to-analog conversion and speaker response. In our setup, we employ a fast Audiostream library written in C to generate the audio signal and expect the delay contribution to be negligible compared to the GPIO latency. Though we did not do this, it can be confirmed by an oscilloscope-based pilot measurement (for additional delay calculation). We have updated the manuscript to clarify that the 63 ± 15 ms value reflects the GPIO-triggered output latency, and we have revised the abstract to accurately state the delay as “~63 ms” rather than 50 ms. This ensures consistency and avoids underestimation of the latency. We have corrected the LED latency for CLNF and CLMF experiments in the abstract as well.
It could be helpful to visualize an individual trial for each experiment type, for instance how the audio frequency changes as movement speed / calcium activity changes.
We have added Supplementary Figure 8 that contains this data where you can see the target cortical activity trace, target paw speed, rewards, along with the audio frequency generated.
The sample sizes are small (n=1) for a few groups. I am excited by the variety of regions recorded, so it could be beneficial for the authors to collect a few more animals to beef up the sample sizes.
We've acknowledged that some of the sample sizes are small. Importantly, we have included raw and processed data as well as code for future analysis. We felt it was still important to still include these data sets with smaller sample sizes as they might be useful for others pursuing this direction in the future.
I am curious as to why 60 trials sessions were used. Was it mostly for the convenience of a 30 min session, or were the animals getting satiated? If the former, would learning have occurred more rapidly with longer sessions?
This is a great observation and the answer is it was mostly due to logistical reasons. We tried to not keep animals headfixed for more than 45 minutes in each session as they become less engaged with long duration headfixed sessions. After headfixing them, it takes about 15 minutes to get the experiment going and therefore 30 - 40 minutes long recorded sessions seemed appropriate before they stop being engaged or before they get satiated in the task. We provided supplemental water after the sessions and we observed that they consumed water after the sessions so they were not fully satiated during the sessions even when they performed well in the task and got maximum rewards. We also had inter-trial rest periods of 10s that elongated the session duration. We think it would be interesting to explore the relationship between session duration(number of trials) and task learning progression over the days in a separate study.
Figure 4E is interesting, it seems like the changes in the distribution of deltaF was in both positive and negative directions, instead of just positive. I'd be curious as to the author's thoughts as to why this is the case. Relatedly, I don't see Figure 4E, and a few other subplots, mentioned in the text. As a general comment, I would address each subplot in the text.
We have split Figure 4 into two to keep the figures more readable. Previous Figure 4E-H are now Figure 5A-D in the revised manuscript. The online real-time CLNF sessions were using a moving window average to calculate ΔF/F<sub>0</sub> and the figures were generated by averaging the whole recorded sessions. We have added text in Methods under “Online ΔF/F<sub>0</sub>calculation” and “Offline ΔF/F<sub>0</sub> calculation” sections making it clear about how we do our ΔF/F<sub>0</sub> normalization based on average fluorescence over the entire session. Using this method of normalization does increase the baseline so that some peaks appear to be below zero. Additionally, it is unclear what strategy animals are employing to achieve the rule specific target activity. The task did not constrain them to have a specific strategy for cortical activation - they were rewarded as long as they crossed the threshold in target ROI(s). For example, in 2-ROI experiments, to increase ROI1-ROI2 target activity, they could increase activity of ROI1 relative to ROI2 or decreased activity of ROI1 relative to ROI1 - both would have led to a reward as long as the result crossed the threshold.
We have now addressed and added reference to the figures in the text in Results under “Mice can explore and learn an arbitrary task, rule, and target conditions” and “Mice can rapidly adapt to changes in the task rule” sections - thanks for pointing this out.
For: "In general, all ROIs assessed that encompassed sensory, pre-motor, and motor areas were capable of supporting increased reward rates over time," I would provide a visual summary showing the learning curves for the different types of regions.
We have rewritten this section to emphasize that these conclusions were based on pooled data from multiple regions of interest. The sample sizes for each type of region are different and some are missing. We believe it would be incomplete and not comparable to present this as a regular analysis since the sample sizes were not balanced. We would be happy to dive deeper into this and point to the raw and processed dataset if anyone would like to explore this further by GitHub or other queries.
Relatedly, I would further explain the fast vs slow learners, and if they mapped onto certain regions.
Mice were categorized into fast or slow learners based on the slope of learning over days (reward progression over the days) as shown in Supplementary Figure 3C,D. Our initial aim was not to probe cortical regions that led to fast vs slow learning but this was a grouping we did afterwards. Based on the analysis we did, the fast learners included the sensory (V1), somatosensory (BC, HL), and motor (M1, M2) areas, while the slow learners included the motor (M1, M2), and higher order (TR, RL) cortical areas. Testing all dorsal cortical areas would be prudent to establish their role in fast or slow learning and it is an interesting future direction.
Also I would make the labels for these plots (e.g. Supp Fig3) more intuitive, versus the acronyms currently used.
We have made more expressive labels and explained the acronyms below the Supplementary Figure 3.
The CLMF animals showed a decrease in latency across learning, what about the CLNF animals? There is currently no mention in the text or figures.
We have now incorporated the CLNF task latency data into both the Results text and Figure 4C. Briefly, task latency decreased as performance improved, increased following a rule change, and then decreased again as the animals relearned the task. The previous Figure 4C has been updated to Figure 4D, and the former Figure 4D has been moved to Supplementary Figure 4E.
Reviewer #2 (Public review):
Summary:
In this work, Gupta & Murphy present several parallel efforts. On one side, they present the hardware and software they use to build a head-fixed mouse experimental setup that they use to track in "real-time" the calcium activity in one or two spots at the surface of the cortex. On the other side, the present another setup that they use to take advantage of the "real-time" version of DeepLabCut with their mice. The hardware and software that they used/develop is described at length, both in the article and in a companion GitHub repository. Next, they present experimental work that they have done with these two setups, training mice to max out a virtual cursor to obtain a reward, by taking advantage of auditory tone feedback that is provided to the mice as they modulate either (1) their local cortical calcium activity, or (2) their limb position.
Strengths:
This work illustrates the fact that thanks to readily available experimental building blocks, body movement and calcium imaging can be carried using readily available components, including imaging the brain using an incredibly cheap consumer electronics RGB camera (RGB Raspberry Pi Camera). It is a useful source of information for researchers that may be interested in building a similar setup, given the highly detailed overview of the system. Finally, it further confirms previous findings regarding the operant conditioning of the calcium dynamics at the surface of the cortex (Clancy et al. 2020) and suggests an alternative based on deeplabcut to the motor tasks that aim to image the brain at the mesoscale during forelimb movements (Quarta et al. 2022).
Weaknesses:
This work covers 3 separate research endeavors: (1) The development of two separate setups, their corresponding software. (2) A study that is highly inspired from the Clancy et al. 2020 paper on the modulation of the local cortical activity measured through a mesoscale calcium imaging setup. (3) A study of the mesoscale dynamics of the cortex during forelimb movements learning. Sadly, the analyses of the physiological data appears uncomplete, and more generally the paper tends to offer overstatements regarding several points:
In contrast to the introductory statements of the article, closed-loop physiology in rodents is a well-established research topic. Beyond auditory feedback, this includes optogenetic feedback (O'Connor et al. 2013, Abbasi et al. 2018, 2023), electrical feedback in hippocampus (Girardeau et al. 2009), and much more.
We have included and referenced these papers in our introduction section (quoted below) and rephrased the part where our previous text indicated there are fewer studies involving closed-loop physiology.
“Some related studies have demonstrated the feasibility of closed-loop feedback in rodents, including hippocampal electrical feedback to disrupt memory consolidation (Girardeau et al.2009), optogenetic perturbations of somatosensory circuits during behavior (O'Connor et al.2013), and more recent advances employing targeted optogenetic interventions to guide behavior (Abbasi et al. 2023).”
The behavioral setups that are presented are representative of the state of the art in the field of mesoscale imaging/head fixed behavior community, rather than a highly innovative design. In particular, the closed-loop latency that they achieve (>60 ms) may be perceived by the mice. This is in contrast with other available closed-loop setups.
We thank the reviewer for this thoughtful comment and fully agree that our closed-loop latency is larger than that achieved in some other contemporary setups. Our primary aim in presenting this work, however, is not to compete with the lowest possible latencies, but to provide an open-source, accessible, and flexible platform that can be readily adopted by a broad range of laboratories. By building on widely available and lower-cost components, our design lowers the barrier of entry for groups that wish to implement closed-loop imaging and behavioral experiments, while still achieving latencies well within the range that can support many biologically meaningful applications.
For example, our latency (~60 ms) remains compatible with experimental paradigms such as:
Motor learning and skill acquisition, where sensorimotor feedback on the scale of tens to hundreds of milliseconds is sufficient to modulate performance.
Operant conditioning and reward-based learning, in which reinforcement timing windows are typically broader and not critically dependent on sub-20 ms latencies.
Cortical state dependent modulation, where feedback linked to slower fluctuations in brain activity (hundreds of milliseconds to seconds) can provide valuable insight.
Studies of perception and decision-making, in which stimulus response associations often unfold on behavioral timescales longer than tens of milliseconds.
We believe that emphasizing openness, affordability, and flexibility will encourage widespread adoption and adaptation of our setup across laboratories with different research foci. In this way, our contribution complements rather than competes with ultra-low-latency closed-loop systems, providing a practical option for diverse experimental needs.
Through the paper, there are several statements that point out how important it is to carry out this work in a closed-loop setting with an auditory feedback, but sadly there is no "no feedback" control in cortical conditioning experiments, while there is a no-feedback condition in the forelimb movement study, which shows that learning of the task can be achieved in the absence of feedback.
We fully agree that such a control would provide valuable insight into the contribution of feedback to learning in the CLNF paradigm. In designing our initial experiments, we envisioned multiple potential control conditions, including No-feedback and Random-feedback. However, our first and primary objective was to establish whether mice could indeed learn to modulate cortical ROI activation through auditory feedback, and to further investigate this across multiple cortical regions. For this reason, we focused on implementing the CLNF paradigm directly, without the inclusion of these additional control groups. To broaden the applicability of the system, we subsequently adapted the platform to the CLMF experiments, where we did incorporate a No-feedback group. These results, as the reviewer notes, strengthen the evidence for the role of feedback in shaping task performance. We agree that the inclusion of a No-feedback control group in the CLNF paradigm will be crucial in future studies to further dissect the specific contribution of feedback to cortical conditioning.
The analysis of the closed-loop neuronal data behavior lacks controls. Increased performance can be achieved by modulating actively only one of the two ROIs, this is not clearly analyzed (for instance looking at the timing of the calcium signal modulation across the two ROIs. It seems that overall ROIs1 and 2 covariate, in contrast to Clancy et al. 2020. How can this be explained?
We agree that the possibility of increased performance being driven by modulation of a single ROI is an important consideration. Our study indeed began with 1-ROI closed-loop experiments. In those early experiments, while we did observe animals improving performance across days, we realized that daily variability in ongoing cortical GCaMP activity could lead to fluctuations in threshold-crossing events. The 2-ROI design was subsequently introduced to reduce this variability, as the target activity was defined as the relative activity between the two ROIs (e.g., ROI1 – ROI2). This approach offered a more stable signal by normalizing ongoing fluctuations. In our analysis of the early 2-ROI experiments, we observed that animals adopted diverging strategies to achieve threshold crossings. Specifically, some animals increased activity in ROI1 relative to ROI2, while others decreased activity in ROI2 to accomplish the same effect. Once discovered, each animal consistently adhered to its chosen strategy throughout subsequent training sessions. This was an early and intriguing observation, but as the experiments were not originally designed to systematically test this effect, we limited our presentation to the analysis of a small number of animals (shown in Figure 11). We have added details about this observation in our Results section as well, quoted below-
“In the 2-ROI experiment where the task rule required “ROI1 - ROI2” activity to cross a threshold for reward delivery, mice displayed divergent strategies. Some animals predominantly increased ROI1 activity, whereas others reduced ROI2 activity, both approaches leading to successful threshold crossing (Figure 11)”.
We hope this clarifies how the use of two ROIs helps explain the apparent covariation of the signals, and why some divergence from the observations of Clancy et al. (2020) may be expected.
Reviewer #3 (Public review):
Summary:
The study demonstrates the effectiveness of a cost-effective closed-loop feedback system for modulating brain activity and behavior in head-fixed mice. Authors have tested real-time closed-loop feedback system in head-fixed mice two types of graded feedback: 1) Closed-loop neurofeedback (CLNF), where feedback is derived from neuronal activity (calcium imaging), and 2) Closed-loop movement feedback (CLMF), where feedback is based on observed body movement. It is a python based opensource system, and authors call it CLoPy. The authors also claim to provide all software, hardware schematics, and protocols to adapt it to various experimental scenarios. This system is capable and can be adapted for a wide use case scenario.
Authors have shown that their system can control both positive (water drop) and negative reinforcement (buzzer-vibrator). This study also shows that using the close loop system mice have shown better performance, learnt arbitrary task and can adapt to change in the rule as well. By integrating real-time feedback based on cortical GCaMP imaging and behavior tracking authors have provided strong evidence that such closed-loop systems can be instrumental in exploring the dynamic interplay between brain activity and behavior.
Strengths:
Simplicity of feedback systems designed. Simplicity of implementation and potential adoption.
Weaknesses:
Long latencies, due to slow Ca2+ dynamics and slow imaging (15 FPS), may limit the application of the system.
We appreciate the reviewer’s comment and agree that latency is an important factor in our setup. The latency arises partly from the inherent slow kinetics of calcium signaling and GCaMP6s, and partly from the imaging rate of 15 FPS (every 66 ms). These limitations can be addressed in several ways: for example, using faster calcium indicators such as GCaMP8f, or adapting the system to electrophysiological signals, which would require additional processing capacity. In our implementation, image acquisition was fixed at 15 FPS to enable real-time frame processing (256 × 256 resolution) on Raspberry Pi 4B devices. With newer hardware, such as the Raspberry Pi 5, substantially higher acquisition and processing rates are feasible (although we have not yet benchmarked this extensively). More powerful platforms such as Nvidia Jetson or conventional PCs would further support much faster data acquisition and processing.
Major comments:
(1) Page 5 paragraph 1: "We tested our CLNF system on Raspberry Pi for its compactness, general-purpose input/output (GPIO) programmability, and wide community support, while the CLMF system was tested on an Nvidia Jetson GPU device." Can these programs and hardware be integrated with windows-based system and a microcontroller (Arduino/ Tency). As for the broad adaptability that's what a lot of labs would already have (please comment/discuss)?
While we tested our CLNF system on a Raspberry Pi (chosen for its compactness, GPIO programmability, and large user community) and our CLMF system on an Nvidia Jetson GPU device (to leverage real-time GPU-based inference), the underlying software is fully written in Python. This design choice makes the system broadly adaptable: it can be run on any device capable of executing Python scripts, including Windows-based PCs, Linux machines, and macOS systems. For hardware integration, we have confirmed that the framework works seamlessly with microcontrollers such as Arduino or Teensy, requiring only minor modifications to the main script to enable sending and receiving of GPIO signals through those boards. In fact, we are already using the same system in an in-house project on a Linux-based PC where an Arduino is connected to the computer to provide GPIO functionality. Furthermore, the system is not limited to Raspberry Pi or Arduino boards; it can be interfaced with any GPIO-capable devices, including those from Adafruit and other microcontroller platforms, depending on what is readily available in individual labs. Since many neuroscience and engineering laboratories already possess such hardware, we believe this design ensures broad accessibility and ease of integration across diverse experimental setups.
(2) Hardware Constraints: The reliance on Raspberry Pi and Nvidia Jetson (is expensive) for real-time processing could introduce latency issues (~63 ms for CLNF and ~67 ms for CLMF). This latency might limit precision for faster or more complex behaviors, which authors should discuss in the discussion section.
In our system, we measured latencies of approximately ~63 ms for CLNF and ~67 ms for CLMF. While such latencies indeed limit applications requiring millisecond precision, such as fast whisker movements, saccades, or fine-reaching kinematics, we emphasize that many relevant behaviors, including postural adjustments, limb movements, locomotion, and sustained cortical state changes, occur on timescales that are well within the capture range of our system. Thus, our platform is appropriate for a range of mesoscale behavioral studies that probably needs to be discussed more. It is also important to note that these latencies are not solely dictated by hardware constraints. A significant component arises from the inherent biological dynamics of the calcium indicator (GCaMP6s) and calcium signaling itself, which introduce slower temporal kinetics independent of processing delays. Newer variants, such as GCaMP8f, offer faster response times and could further reduce effective biological latency in future implementations.
With respect to hardware, we acknowledge that Raspberry Pi provides a low-cost solution but contributes to modest computational delays, while Nvidia Jetson offers faster inference at higher cost. Our choice reflects a balance between accessibility, cost-effectiveness, and performance, making the system deployable in many laboratories. Importantly, the modular and open-source design means the pipeline can readily be adapted to higher-performance GPUs or integrated with electrophysiological recordings, which provide higher temporal resolution. Finally, we agree with the reviewer that the issue of latency highlights deeper and interesting questions regarding the temporal requirements of behavior classification. Specifically, how much data (in time) is required to reliably identify a behavior, and what is the minimum feedback delay necessary to alter neural or behavioral trajectories? These are critical questions for the design of future closed-loop systems and ones that our work helps frame.
We have added a slightly modified version of our response above in the discussion section under “Experimental applications and implications”.
(3) Neurofeedback Specificity: The task focuses on mesoscale imaging and ignores finer spatiotemporal details. Sub-second events might be significant in more nuanced behaviors. Can this be discussed in the discussion section?
This is a great point and we have added the following to the discussion section. “In the case of CLNF we have focused on regional cortical GCAMP signals that are relatively slow in kinetics. While such changes are well suited for transcranial mesoscale imaging assessment, it is possible that cellular 2-photon imaging (Yu et al. 2021) or preparations that employ cleared crystal skulls (Kim et al. 2016) could resolve more localized and higher frequency kinetic signatures.”
(4) The activity over 6s is being averaged to determine if the threshold is being crossed before the reward is delivered. This is a rather long duration of time during which the mice may be exhibiting stereotyped behaviors that may result in the changes in DFF that are being observed. It would be interesting for the authors to compare (if data is available) the behavior of the mice in trials where they successfully crossed the threshold for reward delivery and in those trials where the threshold was not breached. How is this different from spontaneous behavior and behaviors exhibited when they are performing the test with CLNF?
We would like to emphasize that we are not directly averaging activity over 6 s to compare against the reward threshold. Instead, the preceding 6 s of activity is used solely to compute a dynamic baseline for ΔF/F<sub>0</sub> ( ΔF/F<sub>0</sub> = (F –F<sub>0</sub> )/F<sub>0</sub>). Here, F<sub>0</sub>is calculated as the mean fluorescence intensity over the prior 6 s window and is updated continuously throughout the session. This baseline is then subtracted from the instantaneous fluorescence signal to detect relative changes in activity. The reward threshold is therefore evaluated against these baseline-corrected ΔF/F<sub>0</sub> values at the current time point, not against an average over 6 s. This moving-window baseline correction is a standard approach in calcium imaging analyses, as it helps control for slow drifts in signal intensity, bleaching effects, or ongoing fluctuations unrelated to the behavior of interest. Thus, the 6-s window is not introducing a temporal lag in reward assignment but is instead providing a reference to detect rapid increases in cortical activity. We have added the term dynamic baseline to the Methods to clarify.
Recommendations for the authors
Reviewer #1 (Recommendations for the authors):
Additional suggestions for improved or additional experiments, data or analyses.
For: "Looking closely at their reward rate on day 5 (day of rule change), they had a higher reward rate in the second half of the session as compared to the first half, indicating they were adapting to the rule change within one session." It would be helpful to see this data, and would be good to see within-session learning on the rule change day
Thank you for pointing this out. We had missed referencing the figure in the text, and have now added a citation to Supplementary Figure 4A, which shows the cumulative rewards for each day of training. As seen in the plot for day 5, the cumulative rewards are comparable to those on day 1, with most rewards occurring during the second half of the session.
For: "These results suggest that motor learning led to less cortical activation across multiple regions, which may reflect more efficient processing of movement-related activity," it could also be the case that the behaviour became more stereotyped over learning, which would lead to more concentrated, correlated activity. To test this, it would be good to look at the limb variability across sessions. Similarly, if it is movement-related, there should be good decoding of limb kinematics.
Indeed, we observed that behavior became more stereotyped over the course of learning, as shown in Supplementary Figure 4C, 4D. One plausible explanation for the reduction in cortical activation across multiple regions is that behavior itself became more stereotyped, a possibility we have explored in the manuscript. Specifically, forelimb movements during the trial became increasingly correlated as mice improved on the task, particularly in the groups that received auditory feedback (Rule-change and No-rule-change groups; Figure 8). As movements became more correlated, overall body movements during trials decreased and aligned more closely with the task rule (Figure 9D). This suggests that reduced cortical activity may in part reflect changes in behavior. Importantly, however, in the Rule-change group, we observed that on the day of the rule switch (day 5), when the target shifted from the left to the right forelimb, cortical activity increased bilaterally (Figure 9A–C). This finding highlights our central point: groups that received feedback (Rule-change and No-rule-change) were able to identify the task rule more effectively, and both their behavior and cortical activity became more specifically aligned with the rule compared to the No-feedback group. We agree with the reviewers that additional analyses along these lines would be valuable future directions. To facilitate this, we have included the movement data for readers who may wish to pursue further analyses, details can be found under “Data and code availability” in Methods section. However, given the limited sample sizes in our dataset and the need to keep the manuscript focused on the central message, we felt that including these additional analyses here would risk obscuring the main findings.
For: "We believe the decrease in ΔF/F0peak is unlikely to be driven by changes in movement, as movement amplitudes did not decrease significantly during these periods (Figure 7D CLMF Rule-change)." I would formally compare the two conditions. This is an important control. Also, another way to see if the change in deltaF is related to movement would be to see if you can predict movement from the deltaF.
Figure 7D in the previous version is Figure 9D in the current revision of the manuscript. We've assessed this for the examples shown based on graphing the movement data, unfortunately there is not enough of that data to do a group analysis of movement magnitude. We would suggest that this would be an excellent future direction that would take advantage of the flexible open source nature of our tool.
Recommendations for improving the writing and presentation.
In the abstract there is no mention of the rationale for the project, or the resulting significance. I would modify this to increase readership by the behavioral neuroscience community. Similarly, the introduction also doesn't highlight the value of this resource for the field. Again, I think the pyControl paper does a good job of this. For readability, I would add more subheadings earlier in the results, to separate the different technical aspects of the system.
We have revised the introduction to include the rationale for the project, its potential implications, and its relevance for translational research. We have also framed the work within the broader context of the behavioral and systems neuroscience community. We greatly appreciate this suggestion, as we believe it enhances the clarity and accessibility of the manuscript for the community.
For: "While brain activity can be controlled through feedback, other variables such as movements have been less studied, in part because their analysis in real time is more challenging." I would highlight research that has studied the control of behavior through feedback, such as the Mathis paper where mice learn to pull a joystick to a virtual box, and adapt this motion to a force perturbation.
We have added a citation to the Mathis paper and describe this as an additional form of feedback. The text is quoted below:
“Opportunities also exist in extending real time pose classification (Forys et al. 2020; Kane et al. 2020) and movement perturbation (Mathis et al. 2017) to shape aspects of an animal’s motor repertoire.”
Some of the results content would be better suited for the methods, one example: "A previous version of the CLNF system was found to have non-linear audio generation above 10 kHz, partly due to problems in the audio generation library and partly due to the consumer-grade speaker hardware we were employing. This was fixed by switching to the Audiostream (https://github.com/kivy/audiostream) library for audio generation and testing the speakers to make sure they could output the commanded frequencies"
This is now moved to the Methods section.
For: "There are reports of cortical plasticity during motor learning tasks, both at cellular and mesoscopic scales (17-19), supporting the idea that neural efficiency could improve with learning," not sure I agree with this, the studies on cortical plasticity are usually to show a neural basis for the learning observed, efficiency is separate from this.
We have modified this statement to remove the concept of efficiency "There are reports of cortical plasticity during motor learning tasks, both at cellular and mesoscopic scales (17-19).”
The paragraph that opens "Distinct task- and reward-related cortical dynamics" that describes the experiment should appear in the previous section, as the data is introduced there.
We have moved the mentioned paragraphs in the previous section where we presented the data and other experiment details. This makes the text more readable and contextual.
I would present the different ROI rules with better descriptors and visualization to improve the readability.
We have added Supplementary Figure 7, which provides visualizations of the ROIs across all task rules used in the CLNF experiments.
Minor corrections to the text and figures.
Figure 1 is a little crowded, combining the CLNF and CLMF experiments, I would turn this into a 2 panel figure, one for each, similar to how you did figure 2.
We have revised Figure 1 to include two panels, one for CLNF and one for CLMF. The colored components indicate elements specific to each setup, while the uncolored components represent elements shared between CLNF and CLMF. Relevant text in the manuscript is updated to refer to these figures.
For Figure 2, the organization of the CLMF section is not intuitive for the reader. I would reorder it so it has a similar flow as the CLNF experiment.
We have revised the figure by updating the layout of panel B (CLMF) to align with panel A (CLNF), thereby creating a more intuitive and consistent flow between the panels. We appreciate this helpful suggestion, which we believe has substantially improved the clarity of the figure. The corresponding text in the manuscript has also been updated to reflect these changes.
For Figure 3, highlight that C and E are examples. They also seem a little out of place, so they could even be removed.
We have now explicitly labeled Figures 3C and 3E as representative examples (figure legend and on figure itself). We believe including these panels provides helpful context for readers: Figure 3C illustrates how the ROIs align on the dorsal cortical brain map with segmented cortical regions, while Figure 3E shows example paw trajectories in three dimensions, allowing visualization of the movement patterns observed during the trials.
In the plots, I would add sample sizes, for instance, in CLNF learning curve in Figure 4A, how many animals are in each group?
We have labeled Figure 4 with number of animals used in CLNF (No-rule-change, N=23; Rule-change, N=17), and CLMF (Rule-change, N=8; No-rule-change, N=4; No-feedback, N=4).
Also, Figure 7 for example, which figures are single-sessions, versus across animals? For Figure 7c, what time bin is the data taken from?
We have clarified this now and mentioned it in all the figures. Figure 7 in the previous version is Figure 9 in the current updated manuscript. Figure 9A is from individual sessions on different days from the same mouse. Figure 9B is the group average reward centered ΔF/F<sub>0</sub> activity in different cortical regions (Rule-change, N=8; No-rule-change, N=4; No-feedback, N=4). Figure 9C shows average ΔF/F<sub>0</sub> peak values obtained within -1sec to +1sec centered around the reward point (N=8).
It says "punish" in Figure 3, but there is no punishment?
Yes, the task did not involve punishment. Each trial resulted in either a success, which is followed by a reward, or a failure, which is followed by a buzzer sound. To better reflect these outcomes, we have updated Figure 3 and replaced the labels “Reward” with “Success” and “Punish” with “Failure.”
The regression on 5c doesn't look quite right, also this panel is not mentioned in the text.
The figure referred to by the reviewer as Figure 5 is now presented as Figure 6 in the revised manuscript. Regarding the reviewer’s observation about the regression line in the left panel of Figure 5C, the apparent misalignment arises because the majority of the data points are densely clustered at the center of the scatter plot, where they overlap substantially. The regression line accurately reflects this concentration of overlapping data. To improve clarity, we have updated the figure and ensured that it is now appropriately referenced in the Results section.
Reviewer #2 (Recommendations for the authors):
(1) There would be many interesting observations and links between the peripheral and cortical studies if there was a body video available during the cortical study. Is there any such data available?
We agree that a detailed analysis of behavior during the CLNF task would be necessary to explore any behavior correlates with success in the task. Unfortunately, we do not have a sufficient video of the whole body to perform such an analysis.
(2) The text (p. 24) states: [intracortical GCAMP transients measured over days became more stereotyped in kinetics and were more correlated (to each other) as the task performance increased over the sessions (Figure 7E).] But I cannot find this quantification in the figures or text?
Figure 7 in the previous version of the manuscript now appears as Figure 9. In this figure, we present cortical activity across selected regions during trials, and in Figure 9E we highlight that this activity becomes more correlated. Since we did not formally quantify variability, we have removed the previous claim that the activity became stereotyped and revised the text in the updated manuscript accordingly.
Typos:
10-serest c (page 13)
Inverted color codes in figure 4E vs F
Reviewer #3 (Recommendations for the authors):
We have mostly attempted to limit the feedback to suggestions and posed a few questions that might be interesting to explore given the dataset the authors have collected.
Comments:
In close loop systems the latency is primary concern, and authors have successfully tested the latency of the system (Delay): from detection of an event to the reaction time was less than 67ms.
We have commented on the issues and limitations caused by latency, and potential future directions to overcome these challenges in responses to some of the previous comments.
Additional major comments:
"In general, all ROIs assessed that encompassed sensory, pre-motor, and motor areas were capable of supporting increased reward rates over time (Figure 4A, Animation 1)." Fig 4A is merely showing change in task performance over time and does not have information regarding the changes observed specific to CLNF for each ROI.
We acknowledge that the sample size for individual ROI rules was not sufficient for meaningful comparisons. To address this limitation, we pooled the data across all the rules tested. The manuscript includes a detailed list of the rules along with their corresponding sample sizes for transparency.
A ΔF/F<sub>0</sub> threshold value was calculated from a baseline session on day 0 that would have allowed 25% performance. Starting from this basal performance of around 25% on day 1, mice (CLNF No-rule-change, n=28 and CLNF Rule-change, n=13). It is unclear what the replicates here are. Trials or mice? The corresponding Figure legend has a much smaller n value.
Thank you for pointing this out. We realized that we had not indicated the sample replicates in the figure, and the use of n instead of N for the number of animals may have been misleading. We have now corrected the notation and clarified this information in the figure to resolve the discrepancy.
What were the replicates for each ROI pairs evaluated?
Each ROI rule and number of mice and trials are listed in Table 5 and Table 6.
Our analysis revealed that certain ROI rules (see description in methods) lead to a greater increase in success rate over time than others (Supplementary Figure 3D). The Supplementary figures 3C and 3D are blurry and could use higher resolution images.
We have increased the font size of the text that was previously difficult to read and re-exported the figure at a higher resolution (300 DPI). We believe these changes will resolve the issue.
Also, It will help the reader is a visual representation of the ROI pairs are provided, instead of the text view. One interesting question is whether there are anatomical biases to fast vs slow learning pairs (Directionality - anterior/posterior, distance between the selected ROIs etc). This could be interesting to tease apart.
We have added Supplementary Figure 7, which provides visualizations of the ROIs across all task rules used in the CLNF experiments. While a detailed investigation of the anatomical basis of fast versus slow learning cortical ROIs is beyond the scope of the present study, we agree that this represents an exciting future direction for further research.
How distant should the ROIs be to achieve increased task performance?
We appreciate this insightful question. We did not specifically test this scenario. In our study, we selected 0.3 × 0.3 mm ROIs centered on the standard AIBS mouse brain atlas (CCF). At this resolution, ROIs do not overlap, regardless of their placement in a two-ROI experiment. Furthermore, because our threshold calculations are based on baseline recordings, we expect the system would function for any combination of ROI placements. Nonetheless, exploring this systematically would be an interesting avenue for future experiments.
Figures:
I would leave out some of the methodological details such as the protocol for water restriction (Fig. 3) out of the legend. This will help with readability.
We have removed some of the methodological details, including those mentioned above, from the legend of Figure 3 in the updated manuscript.
Fig 1 and Fig 2: In my opinion, It would be easier for the reader if the current Fig. 2, which provides a high level description of CLNF and CLBF is presented as Fig. 1. The current Fig. 1, goes into a lot of methodological implementation details, and also includes a lot of programming jargon that is being introduced early in the paper that is hard to digest early on in the paper's narrative.
Thank you for the suggestion. In the new manuscript, Figure 1 and Figure 2 have been swapped.
Higher-resolution images/ plots are needed in many instances. Unsure if this is the pdf compression done by the manuscript portal that is causing this.
All figures were prepared in vector graphics format using the open-source software Inkscape. For this manuscript, we exported the images at 300 DPI, which is generally sufficient for publication-quality documents. The submission portal may apply additional processing, which could have resulted in a reduction in image quality. We will carefully review the final submission files and ensure that all figures are clear and of high quality.
The authors repeatedly show ROI specific analysis M1_L, F1_R etc. It will be helpful to provide a key, even if redundant in all figures to help the reader.
We have now included keys to all such abbreviations in all the figures.
There are also instances of editorialization and interpretation e.g., "Surprisingly, the "Rule-change" mice were able to discover the change in rule and started performing above 70% within a day of the rule change, on day 6" that would be more appropriate in the main body of the paper.
Thank you for pointing this out in the figure legend, and we have removed it now since we already discussed this in the Results.
Minor comments
(1) The description of Figure 1 is hard to follow and can be described better based on how the information is processed and executed in the system from source to processing and back. Using separated colors (instead of shaded of grey) for the neuro feedback and movement feedback would help as well. Common components could have a different color. The specification like the description of the config file should come later.
Figure 1 in the previous version is Figure 2 in the updated version. We have taken suggestions from other reviewers and made the figure easier to understand and split it into two panels with color coding Green for CLNF, Pink for CLMF specific parts while common shared parts are left without any color.
(2) Page 20 last paragraph:
Authors are neglecting that the rule change is done one day prior and the results that you see in the second half on the 6th day are not just because of the first half of the 6th day instead combined training on the 5th day (rule change) and then the first half of the 6th day. Rephrasing this observation is essential.
We have revised the text for clarity to indicate that the performance increase observed on day 6 is not necessarily attributable to training on that day. In fact, we noted and mentioned that mice began to perform the task better during the second half of the session on day 5 itself.
(3) The method section description of the CLMF setup (Page no 39 first paragraph) is more detailed, a diagram of this setup would make it easy to follow and a better read.
We have made changes to the CLMF setup (Figure 1B) and CLMF schematic (Figure 2B) to make it easier to understand parts of the setup and flow of control.
Reviewer #1 (Public review):
Summary:
Here Bansal et al., present a study on the fundamental blood and nectar feeding behaviors of the critical disease vector, Anopheles stephensi. The study encompasses not just the fundamental changes in blood feeding behaviors of the crucially understudied vector, but then use a transcriptomic approach to identify candidate neuromodulation path ways which influence blood feeding behavior in this mosquito species. The authors then provide evidence through RNAi knockdown of candidate pathways that the neuromodulators sNPF and Rya modulate feeding either via their physiological activity in the brain alone or through joint physiological activity along the brain-gut axis (but critically not the gut alone). Overall, I found this study to be built on tractable, well-designed behavioral experiments.
Their study begins with a well-structured experiment to assess how the feeding behaviors of A. stephensi changes over the course of its life history and in response to its age, mating and oviposition status. The authors are careful and validate their experimental paradigm in the more well-studied Ae. aegypti, and are able to recapitulate the results of prior studies which show that mating is pre-requisite for blood feeding behaviors in Ae. aegypt. Here they find A. stephensi like another Anopheline mosquitoes has a more nuanced regulation of its blood and nectar feeding behaviors.
The authors then go on to show in a Y- maze olfactometer that to some degree, changes in blood feeding status depend on behavioral modulation to host-cues, and this is not likely to be a simple change to the biting behaviors alone. I was especially struck by the swap in valence of the host-cues for the blood-fed and mated individuals which had not yet oviposited. This indicates that there is a change in behavior that is not simply desensitization to host-cues while navigating in flight, but something much more exciting happening.
The authors then use a transcriptomic approach to identify candidate genes in the blood feeding stages of the mosquito's life cycle to identify a list of 9 candidates which have a role in regulating the host-seeking status of A. stephensi. Then through investigations of gene knockdown of candidates they identify the dual action of RYa and sNPF and candidate neuromodulators of host-seeking in this species. Overrall, I found the experiments to be well-designed. I found the molecular approach to be sound. While I do not think the molecular approach is necessarily an all-encompassing mechanism identification (owing mostly to the fact that genetic resources are not yet available in A. stephensi as they are in other dipteran models), I think it sets up a rich lines of research questions for the neurobiology of mosquito behavioral plasticity and comparative evolution of neuromodulator action.
Strengths:
I am especially impressed by the authors' attention to small details in the course of this article. As I read and evaluated this article I continued to think how many crucial details I may have missed if I were the scientist conducting these experiments. That attention to detail paid off in spades and allowed the authors to carefully tease apart molecular candidates of blood-seeking stages. The authors top down approach to identifying RYamide and sNPF starting from first principles behavioral experiments is especially comprehensive. The results from both the behavioral and molecular target studies will have broad implications for the vectorial capacity of this species and comparative evolution of neural circuit modulation.
I believe the authors have adequately addressed all of my concerns; however, I think an accompanying figure to match the explained methods of the tissue-specific knockdown would help readers. The methods are now explicitly written for the timing and concentrations required to achieve tissue-specific knockdown, but seeing the data as a supplement would be especially reassuring given the critical nature of tissue-specific knockdown to the final interpretations of this paper.
Reviewer #2 (Public review):
Summary:
In this manuscript, Bansal et al examine and characterize feeding behaviour in Anopheles stephensi mosquitoes. While sharing some similarities to the well-studied Aedes aegypti mosquito, the authors demonstrate that mated-females, but not unmated (virgin) females, exhibit suppression in their blood-feeding behaviour. Using brain transcriptomic analysis comparing sugar fed, blood fed and starved mosquitoes, several candidate genes potentially responsible for influencing blood-feeding behaviour were identified, including two neuropeptides (short NPF and RYamide) that are known to modulate feeding behaviour in other mosquito species. Using molecular tools including in situ hybridization, the authors map the distribution of cells producing these neuropeptides in the nervous system and in the gut. Further, by implementing systemic RNA interference (RNAi), the study suggests that both neuropeptides appear to promote blood-feeding (but do not impact sugar feeding) although the impact was observed only after both neuropeptide genes underwent knockdown.
While the authors have addressed most of the concerns of the original manuscript, a few issues remain. Particularly, the following two points:
(5) Figure 4
The authors state that there is more efficient knockdown in the head of unfed females; however, this is not accurate since they only get knockdown in unfed animals, and no evidence of any knockdown in fed animals (panel D). This point should be revised in the results test as well.
Perhaps we do not understand the reviewer's point or there has been a misunderstanding. In Figure 4D, we show that while there is more robust gene knockdown in unfed females, blood-fed females also showed modest but measurable knockdowns ranging from 5-40% for RYamide and 2-21% for sNPF.
NEW-
In both the dsRNA treatments where animals were fed, neither was significantly different from control. Therefore, there is no change, and indeed this is confirmed by the author's labelling of the figure stats in panel 4D.
In addition, do the uninjected and dsGFP-injected relative mRNA expression data reflect combined RYa and sNPF levels? Why is there no variation in these data,...
In these qPCRs, we calculated relative mRNA expression using the delta-delta Ct method (see line 975). For each neuropeptide its respective control was used. For simplicity, we combined the RYa and sNPF control data into a single representation. The value of this control is invariant because this method sets the control baseline to a value of 1.
NEW-
The authors are claiming that there is no variation between individual qPCR experiments (particularly in their controls)? Normally, one uses a known standard value (or calibrator) across multiple experiments/plates so that variation across biological replicates can be assessed. This has an impact on statistical analyses since there is no variation in the control data. Indeed, this impacts all figures/datasets in the manuscript where qPCR data is presented. All the controls have zero variation!
Reviewer #3 (Public review):
Summary:
This manuscript investigates the regulation of host-seeking behavior in Anopheles stephensi females across different life stages and mating states. Through transcriptomic profiling, the authors identify differential gene expression between "blood-hungry" and "blood-sated" states. Two neuropeptides, sNPF and RYamide, are highlighted as potential mediators of host-seeking behavior. RNAi knockdown of these peptides alters host-seeking activity, and their expression is anatomically mapped in the mosquito brain (sNPF and RYamide) and midgut (sNPF only).
Strengths:
(1) The study addresses an important question in mosquito biology, with relevance to vector control and disease transmission.
(2) Transcriptomic profiling is used to uncover gene expression changes linked to behavioral states.
(3) The identification of sNPF and RYamide as candidate regulators provides a clear focus for downstream mechanistic work.
(3) RNAi experiments demonstrate that these neuropeptides are necessary for normal host-seeking behavior.
(4) Anatomical localization of neuropeptide expression adds depth to the functional findings.
Weaknesses:
(1) The title implies that the neuropeptides promote host-seeking, but sufficiency is not demonstrated and some conclusions appear premature based on the current data. The support for this conclusion would be strengthened with functional validation using peptide injection or genetic manipulation.
(2) The identification of candidate receptors is promising, but the manuscript would be significantly strengthened by testing whether receptor knockdowns phenocopy peptide knockdowns. Without this, it is difficult to conclude that the identified receptors mediate the behavioral effects.
(3) Some important caveats, such as variation in knockdown efficiency and the possibility of off-target effects, are not adequately discussed.
Author response:
The following is the authors’ response to the original reviews.
Public Reviews:
Reviewer #1 (Public review):
Summary:
Bansal et al. present a study on the fundamental blood and nectar feeding behaviors of the critical disease vector, Anopheles stephensi. The study encompasses not just the fundamental changes in blood feeding behaviors of the crucially understudied vector, but then uses a transcriptomic approach to identify candidate neuromodulation pathways which influence blood feeding behavior in this mosquito species. The authors then provide evidence through RNAi knockdown of candidate pathways that the neuromodulators sNPF and Rya modulate feeding either via their physiological activity in the brain alone or through joint physiological activity along the brain-gut axis (but critically not the gut alone). Overall, I found this study to be built on tractable, well-designed behavioral experiments.
Their study begins with a well-structured experiment to assess how the feeding behaviors of A. stephensi change over the course of its life history and in response to its age, mating, and oviposition status. The authors are careful and validate their experimental paradigm in the more well-studied Ae. aegypti, and are able to recapitulate the results of prior studies, which show that mating is a prerequisite for blood feeding behaviors in Ae. aegypt. Here they find A. Stephensi, like other Anopheline mosquitoes, has a more nuanced regulation of its blood and nectar feeding behaviors.
The authors then go on to show in a Y-maze olfactometer that ,to some degree, changes in blood feeding status depend on behavioral modulation to host cues, and this is not likely to be a simple change to the biting behaviors alone. I was especially struck by the swap in valence of the host cues for the blood-fed and mated individuals, which had not yet oviposited. This indicates that there is a change in behavior that is not simply desensitization to host cues while navigating in flight, but something much more exciting is happening.
The authors then use a transcriptomic approach to identify candidate genes in the blood-feeding stages of the mosquito's life cycle to identify a list of 9 candidates that have a role in regulating the host-seeking status of A. stephensi. Then, through investigations of gene knockdown of candidates, they identify the dual action of RYa and sNPF and candidate neuromodulators of host-seeking in this species. Overall, I found the experiments to be well-designed. I found the molecular approach to be sound. While I do not think the molecular approach is necessarily an all-encompassing mechanism identification (owing mostly to the fact that genetic resources are not yet available in A. stephensi as they are in other dipteran models), I think it sets up a rich line of research questions for the neurobiology of mosquito behavioral plasticity and comparative evolution of neuromodulator action.
We appreciate the reviewer’s detailed summary of our work. We thank them for their positive comments and agree with them on the shortcomings of our approach.
Strengths:
I am especially impressed by the authors' attention to small details in the course of this article. As I read and evaluated this article, I continued to think about how many crucial details could potentially have been missed if this had not been the approach. The attention to detail paid off in spades and allowed the authors to carefully tease apart molecular candidates of blood-seeking stages. The authors' top-down approach to identifying RYamide and sNPF starting from first principles behavioral experiments is especially comprehensive. The results from both the behavioral and molecular target studies will have broad implications for the vectorial capacity of this species and comparative evolution of neural circuit modulation.
We really appreciate that the reviewer has recognised the attention to detail we have tried to put, thank you!
Weaknesses:
There are a few elements of data visualizations and methodological reporting that I found confusing on a first few read-throughs. Figure 1F, for example, was initially confusing as it made it seem as though there were multiple 2-choice assays for each of the conditions. I would recommend removing the "X" marker from the x-axis to indicate the mosquitoes did not feed from either nectar, blood, or neither in order to make it clear that there was one assay in which mosquitoes had access to both food sources, and the data quantify if they took both meals, one meal, or no meals.
We thank the reviewer for flagging the schematic in figure 1F. As suggested, we have removed the “X” markers from the x-axis and revised the axis label from “choice of food” to “choice made” to better reflect what food the mosquitoes chose in the assay. For clarity, we have now also plotted the same data as stacked graphs at the bottom of Fig. 1F, which clearly shows the proportion of mosquitoes fed on each particular choice. We avoid the stacked graph as the sole representation of this data, as it does not capture the variability in the data.
I would also like to know more about how the authors achieved tissue-specific knockdown for RNAi experiments. I think this is an intriguing methodology, but I could not figure out from the methods why injections either had whole-body or abdomen-specific knockdown.
The tissue-specific knockdown (abdomen only or abdomen+head) emerged from initial standardisations where we were unable to achieve knockdown in the head unless we used higher concentrations of dsRNA and did the injections in older females. We realised that this gave us the opportunity to isolate the neuronal contribution of these neuropeptides in the phenotype produced. Further optimisations revealed that injecting dsRNA into 0-10h old females produced abdomen-specific knockdowns without affecting head expression, whereas injections into 4 days old females resulted in knockdowns in both tissues. Moreover, head knockdowns in older females required higher dsRNA concentrations, with knockdown efficiency correlating with the amount injected. In contrast, abdominal knockdowns in younger females could be achieved even with lower dsRNA amounts.
We have mentioned the knockdown conditions- time of injection and the amount dsRNA injected- for tissue-specific knockdowns in methods but realise now that it does not explain this well enough. We have now edited it to state our methodology more clearly (see lines 932-948).
I also found some interpretations of the transcriptomic to be overly broad for what transcriptomes can actually tell us about the organism's state. For example, the authors mention, "Interestingly, we found that after a blood meal, glucose is neither spent nor stored, and that the female brain goes into a state of metabolic 'sugar rest', while actively processing proteins (Figure S2B, S3)".
This would require a physiological measurement to actually know. It certainly suggests that there are changes in carbohydrate metabolism, but there are too many alternative interpretations to make this broad claim from transcriptomic data alone.
We thank the reviewer for pointing this out and agree with them. We have now edited our statement to read:
“Instead, our data suggests altered carbohydrate metabolism after a blood meal, with the female brain potentially entering a state of metabolic 'sugar rest' while actively processing proteins (Figure S2B, S3). However, physiological measurements of carbohydrate and protein metabolism will be required to confirm whether glucose is indeed neither spent nor stored during this period.” See lines 271-277.
Reviewer #2 (Public review):
Summary:
In this manuscript, Bansal et al examine and characterize feeding behaviour in Anopheles stephensi mosquitoes. While sharing some similarities to the well-studied Aedes aegypti mosquito, the authors demonstrate that mated females, but not unmated (virgin) females, exhibit suppression in their bloodfeeding behaviour. Using brain transcriptomic analysis comparing sugar-fed, blood-fed, and starved mosquitoes, several candidate genes potentially responsible for influencing blood-feeding behaviour were identified, including two neuropeptides (short NPF and RYamide) that are known to modulate feeding behaviour in other mosquito species. Using molecular tools, including in situ hybridization, the authors map the distribution of cells producing these neuropeptides in the nervous system and in the gut. Further, by implementing systemic RNA interference (RNAi), the study suggests that both neuropeptides appear to promote blood-feeding (but do not impact sugar feeding), although the impact was observed only after both neuropeptide genes underwent knockdown.
Strengths and/or weaknesses:
Overall, the manuscript was well-written; however, the authors should review carefully, as some sections would benefit from restructuring to improve clarity. Some statements need to be rectified as they are factually inaccurate.
Below are specific concerns and clarifications needed in the opinion of this reviewer:
(1) What does "central brains" refer to in abstract and in other sections of the manuscript (including methods and results)? This term is ambiguous, and the authors should more clearly define what specific components of the central nervous system was/were used in their study.
Central brain, or mid brain, is a commonly used term to refer to brain structures/neuropils without the optic lobes (For example: https://www.nature.com/articles/s41586-024-07686-5). In this study we have focused our analysis on the central brain circuits involved in modulating blood-feeding behaviour and have therefore excluded the optic lobes. As optic lobes account for nearly half of all the neurons in the mosquito brain (https://pmc.ncbi.nlm.nih.gov/articles/PMC8121336/), including them would have disproportionately skewed our transcriptomic data toward visual processing pathways.
We have indicated this in figure 3A and in the methods (see lines 800-801, 812). We have now also clarified it in the results section for neurotranscriptomics to avoid confusion (see lines 236-237).
(2) The abstract states that two neuropeptides, sNPF and RYamide are working together, but no evidence is summarized for the latter in this section.
We thank the reviewer for pointing this out. We have now added a statement “This occurs in the context of the action of RYa in the brain” to end of the abstract, for a complete summary of our proposed model.
(3) Figure 1
Panel A: This should include mating events in the reproductive cycle to demonstrate differences in the feeding behavior of Ae. aegypti.
Our data suggest that mating can occur at any time between eclosion and oviposition in An. stephensi and between eclosion and blood feeding in Ae. aegypti. Adding these into (already busy) 1A, would cloud the purpose of the schematic, which is to indicate the time points used in the behavioural assays and transcriptomics.
Panel F: In treatments where insects were not provided either blood or sugar, how is it that some females and males had fed? Also, it is unclear why the y-axis label is % fed when the caption indicates this is a choice assay. Also, it is interesting that sugar-starved females did not increase sugar intake. Is there any explanation for this (was it expected)?
We apologise for the confusion. The experiment is indeed a choice assay in which sugar-starved or sugar-sated females, co-housed with males, were provided simultaneous access to both blood and sugar, and were assessed for the choice made (indicated on the x-axis): both blood and sugar, blood only, sugar only, or neither. The x-axis indicates the choice made by the mosquitoes, not the choice provided in the assay, and the y-axis indicates the percentage of males or females that made each particular choice. We have now removed the “X” markers from the x-axis and revised the axis label from “choice of food” to “choice made” to better reflect what food the mosquitoes chose to take.
In this assay, we scored females only for the presence or absence of each meal type (blood or sugar) and are therefore unable to comment on whether sugar-starved females consumed more sugar than sugarsated females. However, when sugar-starved, a higher proportion of females consumed both blood and sugar, while fewer fed on blood alone.
For clarity, we have now also plotted the same data as stacked graphs at the bottom of Fig. 1F, which clearly shows the proportion of mosquitoes fed on each particular choice. We avoid the stacked graph as the sole representation of this data as it does not capture the variability in the data.
(4) Figure 3
In the neurotranscriptome analysis of the (central) brain involving the two types of comparisons, can the authors clarify what "excluded in males" refers to? Does this imply that only genes not expressed in males were considered in the analysis? If so, what about co-expressed genes that have a specific function in female feeding behaviour?
This is indeed correct. We reasoned that since blood feeding is exclusive to females, we should focus our analysis on genes that were specifically upregulated in them. As the reviewer points out, it is very likely that genes commonly upregulated in males and females may also promote blood feeding and we will miss out on any such candidates based on our selection criteria.
(5) Figure 4
The authors state that there is more efficient knockdown in the head of unfed females; however, this is not accurate since they only get knockdown in unfed animals, and no evidence of any knockdown in fed animals (panel D). This point should be revised in the results test as well.
Perhaps we do not understand the reviewer’s point or there has been a misunderstanding. In figure 4D, we show that while there is more robust gene knockdown in unfed females, blood-fed females also showed modest but measurable knockdowns ranging from 5-40% for RYamide and 2-21% for sNPF.
Relatedly, blood-feeding is decreased when both neuropeptide transcripts are targeted compared to uninjected (panel C) but not compared to dsGFP injected (panel E). Why is this the case if authors showed earlier in this figure (panel B) that dsGFP does not impact blood feeding?
We realise this concern stems from our representation of the data. Since we had earlier determined that dsGFP-injected females fed similarly to uninjected females (fig 4B), we used these controls interchangeably in subsequent experiments. To avoid confusion, we have now only used the label ‘control’ in figure 4 (and supplementary figure S9) and specified which control was used for each experiment in the legend.
In addition to this, we wanted to clarify that fig 4C and 4E are independent experiments. 4C is the behaviour corresponding to when the neuropeptides were knocked down in both heads and abdomens. 4E is the behaviour corresponding to when the neuropeptides were knocked down in only the abdomens. We have now added a schematic in the plots to make this clearer.
In addition, do the uninjected and dsGFP-injected relative mRNA expression data reflect combined RYa and sNPF levels? Why is there no variation in these data,…
In these qPCRs, we calculated relative mRNA expression using the delta-delta Ct method (see line 975). For each neuropeptide its respective control was used. For simplicity, we combined the RYa and sNPF control data into a single representation. The value of this control is invariant because this method sets the control baseline to a value of 1.
…and how do transcript levels of RYa and sNPF compare in the brain versus the abdomen (the presentation of data doesn't make this relationship clear).
The reviewer is correct in pointing out that we have not clarified this relationship in our current presentation. While we have not performed absolute mRNA quantifications, we extracted relative mRNA levels from qPCR data of 96h old unmanipulated control females. We observed that both sNPF and RYa transcripts are expressed at much lower levels in the abdomens, as compared to those in the heads, as shown in Author response Image 1 below.
Author response image 1.
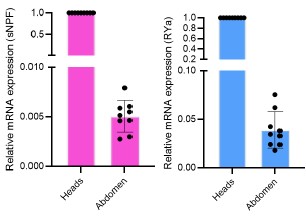
(6) As an overall comment, the figure captions are far too long and include redundant text presented in the methods and results sections.
We thank the reviewer for flagging this and have now edited the legends to remove redundancy.
(7) Criteria used for identifying neuropeptides promoting blood-feeding: statement that reads "all neuropeptides, since these are known to regulate feeding behaviours". This is not accurate since not all neuropeptides govern feeding behaviors, while certainly a subset do play a role.
We agree with the reviewer that not all neuropeptides regulate feeding behaviours. Our statement refers to the screening approach we used: in our shortlist of candidates, we chose to validate all neuropeptides.
(8) In the section beginning with "Two neuropeptides - sNPF and RYa - showed about 25% and 40% reduced mRNA levels...", the authors state that there was no change in blood-feeding and later state the opposite. The wording should be clarified as it is unclear.
Thank you for pointing this out. We were referring to an unchanged proportion of the blood fed females. We have now edited the text to the following:
“Two neuropeptides - sNPF and RYa - showed about 25% and 40% reduced mRNA levels in the heads but the proportion of females that took blood meals remained unchanged”. See lines 338-340.
(9) Just before the conclusions section, the statement that "neuropeptide receptors are often ligandpromiscuous" is unjustified. Indeed, many studies have shown in heterologous systems that high concentrations of structurally related peptides, which are not physiologically relevant, might cross-react and activate a receptor belonging to a different peptide family; however, the natural ligand is often many times more potent (in most cases, orders of magnitude) than structurally related peptides. This is certainly the case for various RYamide and sNPF receptors characterized in various insect species.
We agree with the reviewer and apologise for the mistake. We have now removed the statement.
(10) Methods
In the dsRNA-mediated gene knockdown section, the authors could more clearly describe how much dsRNA was injected per target. At the moment, the reader must carry out calculations based on the concentrations provided and the injected volume range provided later in this section.
We have now edited the section to reflect the amount of dsRNA injected per target. Please see lines 921-931.
It is also unclear how tissue-specific knockdown was achieved by performing injection on different days/times. The authors need to explain/support, and justify how temporal differences in injection lead to changes in tissue-specific expression. Does the blood-brain barrier limit knockdown in the brain instead, while leaving expression in the peripheral organs susceptible?
To achieve tissue-specific knockdowns of sNPF and RYa, we optimised both the time of injection as well as the dsRNA concentration to be injected. Injecting dsRNA into 0-10h females produced abdomen-specific knockdowns without affecting head expression, whereas injections into 96h old females resulted in knockdowns in both tissues. Head knockdowns in older females required higher dsRNA concentrations, with knockdown efficiency correlating with the amount injected. In contrast, abdominal knockdowns in younger females could be achieved even with lower dsRNA amounts, reflecting the lower baseline expression of sNPF in abdomens compared to heads and the age-dependent increase in head expression (as confirmed by qPCR). It is possible that the blood-brain barrier also limits the dsRNA entering the brain, thereby requiring higher amounts to be injected for head knockdowns.
We have now edited this section to state our methodology more clearly (see lines 932-948).
For example, in Figure 4, the data support that knockdown in the head/brain is only effective in unfed animals compared to uninjected animals, while there is no evidence of knockdown in the brain relative to dsGFP-injected animals. Comparatively, evidence appears to show stronger evidence of abdominal knockdown mostly for the RYa transcript (>90%) while still significantly for the sNPF transcript (>60%).
As we explained earlier, this concern likely stems from our representation of the data. Since we had earlier determined that dsGFP-injected females fed similarly to uninjected females (fig 4B), we used these controls interchangeably in subsequent experiments. To avoid confusion, we have now only used the label ‘control’ in figure 4 (and supplementary figure S9) and specified which control was used for each experiment in the legend.
In addition to this, we wanted to clarify that fig 4C and 4E are independent experiments. 4C is the behaviour corresponding to when the neuropeptides were knocked down in both heads and abdomens. 4E is the behaviour corresponding to when the neuropeptides were knocked down in only the abdomen. We have now added a schematic in the plots to make this clearer.
Reviewer #3 (Public review):
Summary:
This manuscript investigates the regulation of host-seeking behavior in Anopheles stephensi females across different life stages and mating states. Through transcriptomic profiling, the authors identify differential gene expression between "blood-hungry" and "blood-sated" states. Two neuropeptides, sNPF and RYamide, are highlighted as potential mediators of host-seeking behavior. RNAi knockdown of these peptides alters host-seeking activity, and their expression is anatomically mapped in the mosquito brain (sNPF and RYamide) and midgut (sNPF only).
Strengths:
(1) The study addresses an important question in mosquito biology, with relevance to vector control and disease transmission.
(2) Transcriptomic profiling is used to uncover gene expression changes linked to behavioral states.
(3) The identification of sNPF and RYamide as candidate regulators provides a clear focus for downstream mechanistic work.
(4) RNAi experiments demonstrate that these neuropeptides are necessary for normal host-seeking behavior.
(5) Anatomical localization of neuropeptide expression adds depth to the functional findings.
Weaknesses:
(1) The title implies that the neuropeptides promote host-seeking, but sufficiency is not demonstrated (for example, with peptide injection or overexpression experiments).
Demonstrating sufficiency would require injecting sNPF peptide or its agonist. To date, no small-molecule agonists (or antagonists) that selectively mimic sNPF or RYa neuropeptides have been identified in insects. An NPY analogue, TM30335, has been reported to activate the Aedes aegypti NPY-like receptor 7 (NPYLR7; Duvall et al., 2019), which is also activated by sNPF peptides at higher doses (Liesch et al., 2013). Unfortunately, the compound is no longer available because its manufacturer, 7TM Pharma, has ceased operations. Synthesising the peptides is a possibility that we will explore in the future.
(2) The proposed model regarding central versus peripheral (gut) peptide action is inconsistently presented and lacks strong experimental support.
The best way to address this would be to conduct tissue-specific manipulations, the tools for which are not available in this species. Our approach to achieve head+abdomen and abdomen only knockdown was the closest we could get to achieving tissue specificity and allowed us to confirm that knockdown in the head was necessary for the phenotype. However, as the reviewer points out, this did not allow us to rule out any involvement of the abdomen. This point has been addressed in lines 364-371.
(3) Some conclusions appear premature based on the current data and would benefit from additional functional validation.
The most definitive way of demonstrating necessity of sNPF and RYa in blood feeding would be to generate mutant lines. While we are pursuing this line of experiments, they lie beyond the scope of a revision. In its absence, we relied on the knockdown of the genes using dsRNA. We would like to posit that despite only partial knockdown, mosquitoes do display defects in blood-feeding behaviour, without affecting sugar-feeding. We think this reflects the importance of sNPF in promoting blood feeding.
Recommendations for the authors:
Reviewer #1 (Recommendations for the authors):
Overall, I found this manuscript to be well-prepared, visually the figures are great and clearly were carefully thought out and curated, and the research is impactful. It was a wonderful read from start to finish. I have the following recommendations:
Thank you very much, we are very pleased to hear that you enjoyed reading our manuscript!
(1) For future manuscripts, it would make things significantly easier on the reviewer side to submit a format that uses line numbers.
We sincerely apologise for the oversight. We have now incorporated line numbers in the revised manuscript.
(2) There are a few statements in the text that I think may need clarification or might be outside the bounds of what was actually studied here. For example, in the introduction "However, mating is dispensable in Anophelines even under conditions of nutritional satiety". I am uncertain what is meant by this statement - please clarify.
We apologise for the lack of clarity in the statement and have now deleted it since we felt it was not necessary.
(3) Typo/Grammatical minutiae:
(a) A small idiosyncrasy of using hyphens in compound words should also be fixed throughout. Typically, you don't hyphenate if the words are being used as a noun, as in the case: e.g. "Age affects blood feeding.". However, you would hyphenate if the two words are used as a compound adjective "Age affects blood-feeding behavior". This may not be an all-inclusive list, but here are some examples where hyphens need to either be removed or added. Some examples:
"Nutritional state also influences other internal state outputs on blood-feeding": blood-feeding -> blood feeding
"... the modulation of blood-feeding": blood-feeding -> blood feeding
"For example, whether virgin females take blood-meals...": blood-meals -> blood meals
".... how internal and external cues shape meal-choice"-> meal choice
"blood-meal" is often used throughout the text, but is correctly "blood meal" in the figures.
There are many more examples throughout.
We apologise for these errors and appreciate the reviewer’s keen eye. We have now fixed them throughout the manuscript.
(b) Figure 1 Caption has a typo: "co-housed males were accessed for sugar-feeding" should be "co-housed males were assessed for sugar feeding"
We apologise for the typo and thank the reviewer for spotting it. We have now corrected this.
(c) It would be helpful in some other figure captions to more clearly label which statement is relevant to which part of the text. For example, in Figure 4's caption.
"C,D. Blood-feeding and sugar-feeding behaviour of females when both RYa and sNPF are knocked down in the head (C). Relative mRNA expressions of RYa and sNPF in the heads of dsRYa+dssNPF - injected blood-fed and unfed females, as compared to that in uninjected females, analysed via qPCR (D)."
I found re-referencing C and D at the end of their statements makes it look as thought C precedes the "Relative mRNA expression" and on a first read through, I thought the figure captions were backwards. I'd recommend reformatting here and throughout consistently to only have the figure letter precede its relevant caption information, e.g.:
"C. Blood-feeding and sugar-feeding behaviour of females when both RYa and sNPF are knocked down in the head. D. Relative mRNA expressions of RYa and sNPF in the heads of dsRYa+dssNPF - injected bloodfed and unfed females, as compared to that in uninjected females, analysed via qPCR."
We have now edited the legends as suggested.
Reviewer #2 (Recommendations for the authors):
Separately from the clarifications and limitations listed above, the authors could strengthen their study and the conclusions drawn if they could rescue the behavioural phenotype observed following knockdown of sNPF and RYamide. This could be achieved by injection of either sNPF or RYa peptide independently or combined following knockdown to validate the role of these peptides in promoting blood-feeding in An. stephensi. Additionally, the apparent (but unclear) regionalized (or tissue-specific) knockdown of sNPF and RYamide transcripts could be visualized and verified by implementing HCR in situ hyb in knockdown animals (or immunohistochemistry using antibodies specific for these two neuropeptides).
In a follow up of this work, we are generating mutants and peptides for these candidates and are planning to conduct exactly the experiments the reviewer suggests.
Reviewer #3 (Recommendations for the authors):
The loss-of-function data suggest necessity but not sufficiency. Synthetic peptide injection in non-hostseeking (blood-fed mated or juvenile) mosquitoes would provide direct evidence for peptide-induced behavioral activation. The lack of these experiments weakens the central claim of the paper that these neuropeptides directly promote blood feeding.
As noted above, we plan to synthesise the peptide to test rescue in a mutant background and sufficiency.
Some of the claims about knockdown efficiency and interpretation are conflicting; the authors dismiss Hairy and Prp as candidates due to 30-35% knockdown, yet base major conclusions on sNPF and RYamide knockdowns with comparable efficiencies (25-40%). This inconsistency should be addressed, or the justification for different thresholds should be clearly stated.
We have not defined any specific knockdown efficacy thresholds in the manuscript, as these can vary considerably between genes, and in some cases, even modest reductions can be sufficient to produce detectable phenotypes. For example, knockdown efficiencies of even as low as about 25% - 40% gave us observable phenotypes for sNPF and RYa RNAi (Figure S9B-G).
No such phenotypes were observed for Hairy (30%) or Prp (35%) knockdowns. Either these genes are not involved in blood feeding, or the knockdown was not sufficient for these specific genes to induce phenotypes. We cannot distinguish between these scenarios.
The observation that knockdown animals take smaller blood meals is interesting and could reflect a downstream effect of altered host-seeking or an independent physiological change. The relationship between meal size and host-seeking behavior should be clarified.
We agree with the reviewer that the reduced meal size observed in sNPF and RYa knockdown animals could result from their inability to seek a host or due to an independent effect on blood meal intake. Unfortunately, we did not measure host-seeking in these animals. We plan to distinguish between these possibilities using mutants in future work.
Several figures are difficult to interpret due to cluttered labeling and poorly distinguishable color schemes. Simplifying these and improving contrast (especially for co-housed vs. virgin conditions) would enhance readability.
We regret that the reviewer found the figures difficult to follow. We have now revised our annotations throughout the manuscript for enhanced readability. For example, “D1<sup>B”</sup> is now “D1<sup>PBM”</sup> (post-bloodmeal) and “D1<sup>O”</sup> is now “D1<sup>PO”</sup> (post-oviposition). Wherever mated females were used, we have now appended “(m)” to the annotations and consistently depicted these females with striped abdomens in all the schematics. We believe these changes will improve clarity and readability.
The manuscript does not clearly justify the use of whole-brain RNA sequencing to identify peptides involved in metabolic or peripheral processes. Given that anticipatory feeding signals are often peripheral, the logic for brain transcriptomics should be explained.
The reviewer is correct in pointing out that feeding signals could also emerge from peripheral tissues. Signals from these tissues – in response to both changing nutritional and reproductive states – are then integrated by the central brain to modulate feeding choices. For example, in Drosophila, increased protein intake is mediated by central brain circuitry including those in the SEZ and central complex (Munch et al., 2022; Liu et al., 2017; Goldschmidt et al., 202ti). In the context of mating, male-derived sex peptide further increases protein feeding by acting on a dedicated central brain circuitry (Walker et al., 2015). We, therefore focused on the central brain for our studies.
The proposed model suggests brain-derived peptides initiate feeding, while gut peptides provide feedback. However, gut-specific knockdowns had no effect, undermining this hypothesis. Conversely, the authors also suggest abdominal involvement based on RNAi results. These contradictions need to be resolved into a consistent model.
We thank the reviewer for raising this point and recognise their concern. Our reasons for invoking an involvement of the gut were two-fold:
(1) We find increased sNPF transcript expression in the entero-endocrine cells of the midgut in blood-hungry females, which returns to baseline after a blood-meal (Fig. 4L, M).
(2) While the abdomen-only knockdowns did not affect blood feeding, every effective head knockdown that affected blood feeding also abolished abdominal transcript levels (Fig. S9C, F). (Achieving a head-only reduction proved impossible because (i) systemic dsRNA delivery inevitably reaches the abdomen and (ii) abdominal expression of both peptides is low, leaving little dynamic range for selective manipulation.) Consequently, we can only conclude the following: 1) that brain expression is required for the behaviour, 2) that we cannot exclude a contributory role for gut-derived sNPF. We have discussed this in lines 364-371.
The identification of candidate receptors is promising, but the manuscript would be significantly strengthened by testing whether receptor knockdowns phenocopy peptide knockdowns. Without this, it is difficult to conclude that the identified receptors mediate the behavioral effects.
We agree that functional validation of the receptors would strengthen the evidence for sNPF and RYa-mediated control of blood feeding in An. stephensi. We selected these receptors based on sequence homology. A possibility remains that sNPF neuropeptides activate more than one receptor, each modulating a distinct circuit, as shown in the case of Drosophila Tachykinin (https://pmc.ncbi.nlm.nih.gov/articles/PMC10184743/). This will mean a systematic characterisation and knockdown of each of them to confirm their role. We are planning these experiments in the future.
The authors compared the percentage changes in sugar-fed and blood-fed animals under sugar-sated or sugar-starved conditions. Figure 1F should reflect what was discussed in the results.
Perhaps this concern stems from our representation of the data in figure 1F? We have now edited the xaxis and revised its label from “choice of food” to “choice made” to better reflect what food the mosquitoes chose to take.
For clarity, we have now also plotted the same data as stacked graphs at the bottom of Fig. 1F, which clearly shows the proportion of mosquitoes fed on each particular choice. We avoid the stacked graph as the sole representation of this data because it does not capture the variability in the data.
Minor issues:
(1) The authors used mosquitoes with belly stripes to indicate mated females. To be consistent, the post-oviposition females should also have belly stripes.
We thank the reviewer for pointing this out. We have now edited all the figures as suggested.
(2) In the first paragraph on the right column of the second page, the authors state, "Since females took blood-meals regardless of their prior sugar-feeding status and only sugar-feeding was selectively suppressed by prior sugar access." Just because the well-fed animals ate less than the starved animals does not mean their feeding behavior was suppressed.
Perhaps there has been a misunderstanding in the experimental setup of figure 1F, probably stemming from our data representation. The experiment is a choice assay in which sugar-starved or sugar-sated females, co-housed with males, were provided simultaneous access to both blood and sugar, and were assessed for the choice made (indicated on the x-axis): both blood and sugar, blood only, sugar only, or neither. We scored females only for the presence or absence of each meal type (blood or sugar) and did not quantify the amount consumed.
(3) The figure legend for Figure 1A and the naming convention for different experimental groups are difficult to follow. A simplified or consistently abbreviated scheme would help readers navigate the figures and text.
We regret that the reviewer found the figure difficult to follow. We have now revised our annotations throughout the manuscript for enhanced readability. For example, “D1<sup>B”</sup> is now “D1<sup>PBM”</sup> (post-bloodmeal) and “D1<sup>O”</sup> is now “D1<sup>PO”</sup> (post-oviposition).
(4) In the last paragraph of the Y-maze olfactory assay for host-seeking behaviour in An. stephensi in Methods, the authors state, "When testing blood-fed females, aged-matched sugar-fed females (bloodhungry) were included as positive controls where ever possible, with satisfactory results." The authors should explicitly describe what the criteria are for "satisfactory results".
We apologise for the lack of clarity. We have now edited the statement to read:
“When testing blood-fed females, age-matched sugar-fed females (blood-hungry) were included wherever possible as positive controls. These females consistently showed attraction to host cues, as expected.” See lines 786-790.
(5) In the first paragraph of the dsRNA-mediated gene knockdown section in Methods, dsRNA against GFP is used as a negative control for the injection itself, but not for the potential off-target effect.
We agree with the reviewer that dsGFP injections act as controls only for injection-related behavioural changes, and not for off-target effects of RNAi. We have now corrected the statement. See lines 919-920.
To control for off-target effects, we could have designed multiple dsRNAs targeting different parts of a given gene. We regret not including these controls for potential off-target effects of dsRNAs injected.
(6) References numbers 48, 89, and 90 are not complete citations.
We thank the reviewer for spotting these. We have now corrected these citations.
Author response:
The following is the authors’ response to the original reviews.
First, we thank the reviewers for the valuable and constructive reviews. Thanks to these, we believe the article has been considerably improved. We have organized our response to address points that are relevant to both reviewers first, after which we address the unique concerns of each individual reviewer separately. We briefly paraphrase each concern and provide comments for clarification, outlining the precise changes that we have made to the text.
Common Concerns (R1 & R2):
Can you clarify how NREM and REM sleep relate to the oneirogen hypothesis?
Within the submission draft we tried to stay agnostic as to whether mechanistically similar replay events occur during NREM or REM sleep; however, upon a more thorough literature review, we think that there is moderately greater evidence in favor of Wake-Sleep-type replay occurring during REM sleep which is related to classical psychedelic drug mechanisms of action.
First, we should clarify that replay has been observed during both REM and NREM sleep, and dreams have been documented during both sleep stages, though the characteristics of dreams differ across stages, with NREM dreams being more closely tied to recent episodic experience and REM dreams being more bizarre/hallucinatory (see Stickgold et al., 2001 for a review). Replay during sleep has been studied most thoroughly during NREM sharp-wave ripple events, in which significant cortical-hippocampal coupling has been observed (Ji & Wilson, 2007). However, it is critical to note that the quantification methods used to identify replay events in the hippocampal literature usually focus on identifying what we term ‘episodic replay,’ which involves a near-identical recapitulation of neural trajectories that were recently experienced during waking experimental recordings (Tingley & Peyrach, 2020). In contrast, our model focuses on ‘generative replay,’ where one expects only a statistically similar reproduction of neural activity, without any particular bias towards recent or experimentally controlled experience. This latter form of replay may look closer to the ‘reactivation’ observed in cortex by many studies (e.g. Nguyen et al., 2024), where correlation structures of neural activity similar to those observed during stimulus-driven experience are recapitulated. Under experimental conditions in which an animal is experiencing highly stereotyped activity repeatedly, over extended periods of time, these two forms of replay may be difficult to dissociate.
Interestingly, though NREM replay has been shown to couple hippocampal and cortical activity, a similar study in waking animals administered psychedelics found hippocampal replay without any obvious coupling to cortical activity (Domenico et al., 2021). This could be because the coupling was not strong enough to produce full trajectories in the cortex (psychedelic administration did not increase ‘alpha’ enough), and that a causal manipulation of apical/basal influence in the cortex may be necessary to observe the increased coupling. Alternatively, as Reviewer 1 noted, it may be that psychedelics induce a form of hippocampus-decoupled replay, as one would expect from the REM stage of a recently proposed complementary learning systems model (Singh et al., 2022).
Evidence in favor of a similarity between the mechanism of action of classical psychedelics and the mechanism of action of memory consolidation/learning during REM sleep is actually quite strong. In particular, studies have shown that REM sleep increases the activity of soma-targeting parvalbumin (PV) interneurons and decreases the activity of apical dendrite-targeting somatostatin (SOM) interneurons (Niethard et al., 2021), that this shift in balance is controlled by higher-order thalamic nuclei, and that this shift in balance is critical for synaptic consolidation of both monocular deprivation effects in early visual cortex (Zhou et al., 2020) and for the consolidation of auditory fear conditioning in the dorsal prefrontal cortex (Aime et al., 2022). These last studies were not discussed in our previous text–we have added them, in addition to a more nuanced description of the evidence connecting our model to NREM and REM replay.
Relevant modifications: Page 4, 1st paragraph; Page 11, 1st paragraph.
Can you explain how synaptic plasticity induced by psychedelics within your model relates to learning at a behavioral level?
While the Wake-Sleep algorithm is a useful model for unsupervised statistical learning, it is not a model of reward or fear-based conditioning, which likely occur via different mechanisms in the brain (e.g. dopamine-dependent reinforcement learning or serotonin-dependent emotional learning). The Wake-Sleep algorithm is a ‘normative plasticity algorithm,’ that connects synaptic plasticity to the formation of structured neural representations, but it is not the case that all synaptic plasticity induced by psychedelic administration within our model should induce beneficial learning effects. According to the Wake-Sleep algorithm, plasticity at apical synapses is enhanced during the Wake phase, and plasticity at basal synapses is enhanced during the Sleep phase; under the oneirogen hypothesis, hallucinatory conditions (increased ‘alpha’) cause an increase in plasticity at both apical and basal sites. Because neural activity is in a fundamentally aberrant state when ‘alpha’ is increased, there are no theoretical guarantees that plasticity will improve performance on any objective: psychedelic-induced plasticity within our model could perhaps better be thought of as ‘noise’ that may have a positive or negative effect depending on the context.
In particular, such ‘noise’ may be beneficial for individuals or networks whose synapses have become locked in a suboptimal local minimum. The addition of large amounts of random plasticity could allow a system to extricate itself from such local minima over subsequent learning (or with careful selection of stimuli during psychedelic experience), similar to simulated annealing optimization approaches. If our model were fully validated, this view of psychedelic-induced plasticity as ‘noise’ could have relevance for efforts to alleviate the adverse effects of PTSD, early life trauma, or sensory deprivation; it may also provide a cautionary note against repeated use of psychedelic drugs within a short time frame, as the plasticity changes induced by psychedelic administration under our model are not guaranteed to be good or useful in-and-of themselves without subsequent re-learning and compensation.
We should also note that we have deliberately avoided connecting the oneirogen hypothesis model to fear extinction experimental results that have been observed through recordings of the hippocampus or the amygdala (Bombardi & Giovanni, 2013; Jiang et al., 2009; Kelly et al., 2024; Tiwari et al., 2024). Both regions receive extensive innervation directly from serotonergic synapses originating in the dorsal raphe nucleus, which have been shown to play an important role in emotional learning (Lesch & Waider, 2012); because classical psychedelics may play a more direct role in modulating this serotonergic innervation, it is possible that fear conditioning results (in addition to the anxiolytic effects of psychedelics) cannot be attributed to a shift in balance between apical and basal synapses induced by psychedelic administration. We have provided a more detailed review of these results in the text, as well as more clarity regarding their relation to our model.
Relevant modifications: Page 9, final paragraph; Page 12, final paragraph.
Reviewer 1 Concerns:
Is it reasonable to assign a scalar parameter ‘alpha’ to the effects of classical psychedelics? And is your proposed mechanism of action unique to classical psychedelics? E.g. Could this idea also apply to kappa opioid agonists, ketamine, or the neural mechanisms of hallucination disorders?
We have clarified that within our model ‘alpha’ is a parameter that reflects the balance between apical and basal synapses in determining the activity of neurons in the network. For the sake of simplicity we used a single ‘alpha’ parameter, but realistically, each neuron would have its own ‘alpha’ parameter, and different layers or individual neurons could be affected differentially by the administration of any particular drug; therefore, our scalar ‘alpha’ value can be thought of as a mean parameter for all neurons, disregarding heterogeneity across individual neurons.
There are many different mechanisms that could theoretically affect this ‘alpha’ parameter, including: 5-HT2a receptor agonism, kappa opioid receptor binding, ketamine administration, or possibly the effects of genetic mutations underlying the pathophysiology of complex developmental hallucination disorders. We focused exclusively on 5-HT2a receptor agonism for this study because the mechanism is comparatively simple and extensively characterized, but similar mechanisms may well be responsible for the hallucinatory symptoms of a variety of drugs and disorders.
Relevant modifications: Page 4, first paragraph; Page 13, first paragraph.
Can you clarify the role of 5-HT2a receptor expression on interneurons within your model?
While we mostly focused on the effects of 5-HT2a receptors on the apical dendrites of pyramidal neurons, these receptors are also expressed on soma-targeting parvalbumin (PV) interneurons. This expression on PV interneurons is consistent with our proposed psychedelic mechanism of action, because it could lead to a coordinated decrease in the influence of somatic and proximal dendritic inputs while increasing the influence of apical dendritic inputs. We have elaborated on this point, and moved the discussion earlier in the text.
Relevant modifications: Page 1, 1st paragraph; Page 4, 2nd paragraph.
Discussions of indigenous use of psychedelics over millenia may amount to over-romanticization.
We ultimately decided to remove these discussions from the main text, as they had little bearing on the content of our work. Within the Ethics Declarations section we softened our claims from “millenia” to “centuries,” as indigenous psychedelic use over this latter period of time is well-substantiated.
Relevant modifications: removed from introduction; modified Ethics Declarations
You isolate the 5-HT2a agonism as the mechanism of action underlying ‘alpha’ in your model, but there exist 5-HT2a agonists that do not have hallucinatory effects (e.g. lisuride). How do you explain this?
Lisuride has much-reduced hallucinatory effects compared to other psychedelic drugs at clinical doses (though it does indeed induce hallucinations at high doses; Marona-Lewicka et al., 2002), and we should note that serotonin (5-HT) itself is pervasive in the cortex without inducing hallucinatory effects during natural function. Similarly, MDMA is a partial agonist for 5-HT2a receptors, but it has much-reduced perceptual hallucination effects relative to classical psychedelics (Green et al., 2003) in addition to many other effects not induced by classical psychedelics.
Therefore, while we argue that 5-HT2a agonism induces an increase in influence of apical dendritic compartments and a decrease in influence of basal/somatic compartments, and that this change induces hallucinations, we also note that there are many other factors that control whether or not hallucinations are ultimately produced, so that not all 5-HT2a agonists are hallucinogenic. There are two possible additional factors that could contribute to this phenomenon: 5-HT receptor binding affinity and cellular membrane permeability.
Importantly, many 5-HT2a receptor agonists are also 5-HT1a receptor agonists (e.g. serotonin itself and lisuride), while MDMA has also been shown to increase serotonin, norepinephrine, and dopamine release (Green et al., 2003). While 5-HT2a receptor agonism has been shown to reduce sensory stimulus responses (Michaiel et al., 2019), 5-HT1a receptor agonism inhibits spontaneous cortical activity (Azimi et al., 2020); thus one might expect the net effect of administering serotonin or a nonselective 5-HT receptor agonist to be widespread inhibition of a circuit, as has been observed in visual cortex (Azimi et al., 2020). Therefore, selective 5-HT2a agonism is critical for the induction of hallucinations according to our model, though any intervention that jointly excites pyramidal neurons’ apical dendrites and inhibits their basal/somatic compartments across a broad enough area of cortex would be predicted to have a similar effect. Lisuride has a much higher binding affinity for 5-HT1a receptors than, for instance, LSD (Marona-Lewicka et al., 2002).
Secondly, it has recently been shown that both the head-twitch effect (a coarse behavioral readout of hallucinations in animals) and the plasticity effects of psychedelics are abolished when administering 5-HT2a agonists that are impermeable to the cellular membrane because of high polarity, and that these effects can be rescued by temporarily rendering the cellular membrane permeable (Vargas et al., 2023). This suggests that the critical hallucinatory effects of psychedelics (apical excitation according to our model) may be mediated by intracellular 5-HT2a receptors. Notably, serotonin itself is not membrane permeable in the cortex.
Therefore, either of these two properties could play a role in whether a given 5-HT2a agonist induces hallucinatory effects. We have provided an extended discussion of these nuances in our revision.
Relevant modifications: Page 1, paragraph 2.
Your model proposes that an increase in top-down influence on neural activity underlies the hallucinatory effects of psychedelics. How do you explain experimental results that show increases in bottom-up functional connectivity (either from early sensory areas or the thalamus)?
Firstly, we should note that our proposed increase in top-down influence is a causal, biophysical property, not necessarily a statistical/correlative one. As such, we will stress that the best way to test our model is via direct intervention in cortical microcircuitry, as opposed to correlative approaches taken by most fMRI studies, which have shown mixed results with regard to this particular question. Correlative approaches can be misleading due to dense recurrent coupling in the system, and due to the coarse temporal and spatial resolution provided by noninvasive recording technologies (changes in statistical/functional connectivity do not necessarily correspond to changes in causal/mechanistic connectivity, i.e. correlation does not imply causation).
There are two experimental results that appear to contradict our hypothesis that deserve special consideration. The first shows an increase in directional thalamic influence on the distributed cortical networks after psychedelic administration (Preller et al., 2018). To explain this, we note that this study does not distinguish between lower-order sensory thalamic nuclei (e.g. the lateral and medial geniculate nuclei receiving visual and auditory stimuli respectively) and the higher-order thalamic nuclei that participate in thalamocortical connectivity loops (Whyte et al., 2024). Subsequent more fine-grained studies have noted an increase in influence of higher order thalamic nuclei on the cortex (Pizzi et al., 2023; Gaddis et al., 2022), and in fact extensive causal intervention research has shown that classical psychedelics (and 5-HT2a agonism) decrease the influence of incoming sensory stimuli on the activity of early sensory cortical areas, indicating decoupling from the sensory thalamus (Evarts et al., 1955; Azimi et al., 2020; Michaiel et al. 2019). The increased influence of higher-order thalamic nuclei is consistent with both the cortico-striatal-thalamo-cortical (CTSC) model of psychedelic action as well as the oneirogen hypothesis, since higher-order thalamic inputs modulate the apical dendrites of pyramidal neurons in cortex (Whyte et al., 2024).
The second experimental result notes that DMT induces traveling waves during resting state activity that propagate from early visual cortex to deeper cortical layers (Alamia et al., 2020). There are several possibilities that could explain this phenomenon: 1) it could be due to the aforementioned difficulties associated with directed functional connectivity analyses, 2) it could be due to a possible high binding affinity for DMT in the visual cortex relative to other brain areas, or 3) it could be due to increases in apical influence on activity caused by local recurrent connectivity within the visual cortex which, in the absence of sensory input, could lead to propagation of neural activity from the visual cortex to the rest of the brain. This last possibility is closest to the model proposed by (Ermentrout & Cowan, 1979), and which we believe would be best explained within our framework by a topographically connected recurrent network architecture trained on video data; a potentially fruitful direction for future research.
Relevant modifications: Page 9, paragraph 1; Page 10, final paragraph; Page 11, final paragraph.
Shouldn’t the hallucinations generated by your model look more ‘psychedelic,’ like those produced by the DeepDream algorithm?
We believe that the differences in hallucination visualization quality between our Wake-Sleep-trained models and DeepDream are mostly due to differences in the scale and power of the models used across these two studies. We are confident that with more resources (and potentially theoretical innovations to improve the Wake-Sleep algorithm’s performance) the produced hallucination visualizations could become more realistic.
We note that more powerful generative models trained with backpropagation are able to produce surreal images of comparable quality (Rezende et al., 2014; Goodfellow et al., 2020; Vahdat & Kautz, 2020), though these have not yet been used as a model of psychedelic hallucinations. However, the DeepDream model operates on top of large pretrained image processing models, and does not provide an biologically mechanistic/testable interpretation of its hallucination effects. When training smaller models with a local synaptic plasticity rule (as opposed to backpropagation), the hallucination effects are less visually striking due to the reduced quality of our trained generative model, though they are still strongly tied to the statistics of sensory inputs, as quantified by our correlation similarity metric (Fig. 5b).
To demonstrate that our proposed hallucination mechanism is capable of producing more complex hallucinations in larger, more powerful models, we employed our same hallucination generation mechanism in a pretrained Very Deep Variational Autoencoder (VDVAE) (Child et al., 2021), which is a hierarchical variational autoencoder with a nearly identical structure compared to our Wake-Sleep-trained networks, with both a bottom-up inference pathway and a top-down generative pathway that maps cleanly onto our multicompartmental neuron model. VDVAEs are trained on the same objective function as our Wake-Sleep-trained networks, but using the backpropagation algorithm. The VDVAE models were able to generate much more complex hallucinations (emergence of complex geometric patterns, smooth deformations of objects and faces), whose complexity arguably exceeds those produced by the DeepDream algorithm. Therefore while the VDVAEs are less biologically realistic (they do not learn via local synaptic plasticity), they function as a valuable high-level model of hallucination generation that complements our Wake-Sleep-trained approach. As further validation, we were also able to replicate our key results and testable predictions with these models.
Relevant modifications: Results section “Modeling hallucinations in large-scale pretrained networks”; Figure 6, S7, S8; Page 12, paragraph 3; Methods section “Generating hallucinations in hierarchical variational autoencoders.”
Your model assumes domination by entirely bottom-up activity during the ‘wake’ phase, and domination entirely by top-down activity during ‘sleep,’ despite experimental evidence indicating that a mixture of top-down and bottom-up inputs influence neural activity during both stages in the brain. How do you explain this?
Our use of the Wake-Sleep algorithm, in which top-down inputs (Sleep) or bottom-up inputs (Wake) dominate network activity is an over-simplification made within our model for computational and theoretical reasons. Models that receive a mixture of top-down and bottom-up inputs during ‘Wake’ activity do exist (in particular the closely related Boltzmann machine (Ackley et al., 1985)), but these models are considerably more computationally costly to train due to a need to run extensive recurrent network relaxation dynamics for each input stimulus. Further, these models do not generalize as cleanly to processing temporal inputs. For this reason, we focused on the Wake-Sleep algorithm, at the cost of some biological realism, though we note that our model should certainly be extended to support mixed apical-basal waking regimes. We have added a discussion of this in our ‘Model Limitations’ section.
Relevant modifications: Page 12, paragraph 4.
Your model proposes that 5-HT2a agonism enhances glutamatergic transmission, but this is not true in the hippocampus, which shows decreases in glutamate after psychedelic administration.
We should note that our model suggests only compartment specific increases in glutamatergic transmission; as such, our model does not predict any particular directionality for measures of glutamatergic transmission that includes signaling at both apical and basal compartments in aggregate, as was measured in the provided study (Mason et al., 2020).
You claim that your model is consistent with the Entropic Brain theory, but you report increases in variance, not entropy. In fact, it has been shown that variance decreases while entropy increases under psychedelic administration. How do you explain this discrepancy?
Unfortunately, ‘entropy’ and ‘variance’ are heavily overloaded terms in the noninvasive imaging literature, and the particularities of the method employed can exert a strong influence on the reported effects. The reduction in variance reported by (Carhart-Harris et al., 2016) is a very particular measure: they are reporting the variance of resting state synchronous activity, averaged across a functional subnetwork that spans many voxels; as such, the reduction in variance in this case is a reduction in broad, synchronous activity. We do not have any resting state synchronous activity in our network due to the simplified nature of our model (particularly an absence of recurrent temporal dynamics), so we see no reduction in variance in our model due to these effects.
Other studies estimate ‘entropy’ or network state disorder via three different methods that we have been able to identify. 1) (Carhart-Harris et al., 2014) uses a different measure of variance: in this case, they subtract out synchronous activity within functional subnetworks, and calculate variability across units in the network. This measure reports increases in variance (Fig. 6), and is the closest measure to the one we employ in this study. 2) (Lebedev et al., 2016) uses sample entropy, which is a measure of temporal sequence predictability. It is specifically designed to disregard highly predictable signals, and so one might imagine that it is a measure that is robust to shared synchronous activity (e.g. resting state oscillations). 3) (Mediano et al., 2024) uses Lempel-Ziv complexity, which is, similar to sample entropy, a measure of sequence diversity; in this case the signal is binarized before calculation, which makes this method considerably different from ours. All three of the preceding methods report increases in sequence diversity, in agreement with our quantification method. Our strongest explanation for why the variance calculation in (Carhart-Harris et al., 2016) produces a variance reduction is therefore due to a reduction in low-rank synchronous activity in subnetworks during resting state.
As for whether the entropy increase is meaningful: we share Reviewer 1’s concern that increases in entropy could simply be due to a higher degree of cognitive engagement during resting state recordings, due to the presence of sensory hallucinations or due to an inability to fall asleep. This could explain why entropy increases are much more minimal relative to non-hallucinating conditions during audiovisual task performance (Siegel et al., 2024; Mediano et al., 2024). However, we can say that our model is consistent with the Entropic Brain Theory without including any form of ‘cognitive processing’: we observe increases in variability during resting state in our model, but we observe highly similar distributions of activity when averaging over a wide variety of sensory stimulus presentations (Fig. 5b-c). This is because variability in our model is not due to unstructured noise: it corresponds to an exploration of network states that would ordinarily be visited by some stimulus. Therefore, when averaging across a wide variety of stimuli, the distribution of network states under hallucinating or non-hallucinating conditions should be highly similar.
One final point of clarification: here we are distinguishing Entropic Brain Theory from the REBUS model–the oneirogen hypothesis is consistent with the increase in entropy observed experimentally, but in our model this entropy increase is not due to increased influence of bottom-up inputs (it is due instead to an increase in top-down influence). Therefore, one could view the oneirogen hypothesis as consistent with EBT, but inconsistent with REBUS.
Relevant modifications: Page 10, paragraph 1.
You relate your plasticity rule to behavioral-timescale plasticity (BTSP) in the hippocampus, but plasticity has been shown to be reduced in the hippocampus after psychedelic administration. Could you elaborate on this connection?
When we were establishing a connection between our ‘Wake-Sleep’ plasticity rule and BTSP learning, the intended connection was exclusively to the mathematical form of the plasticity rule, in which activity in the apical dendrites of pyramidal neurons functions as an instructive signal for plasticity in basal synapses (and vice versa): we will clarify this in the text. Similarly, we point out that such a plasticity rule tends to result in correlated tuning between apical and basal dendritic compartments, which has been observed in hippocampus and cortex: this is intended as a sanity check of our mapping of the Wake-Sleep algorithm to cortical microcircuitry, and has limited further bearing on the effects of psychedelics specifically.
Reduction in plasticity in the hippocampus after psychedelic administration could be due to a complementary learning systems-type model, in which the hippocampus becomes partly decoupled from the cortex during REM sleep (Singh et al., 2022); were this to be the case, it would not be incompatible with our model, which is mostly focused on the cortex. Notably, potentiating 5HT-2a receptors in the ventral hippocampus does not induce the head-twitch response, though it does produce anxiolytic effects (Tiwari et al., 2024), indicating that the hallucinatory and anxiolytic effects of classical psychedelics may be partly decoupled.
Reviewer 2 Concerns:
Could you provide visualizations of the ‘ripple’ phenomenon that you’re referring to?
In our revised submission, ‘ripple’ phenomena are now visible in two places: Fig 2c-d, and Fig 6 (rows 2 and 3). Because the VDVAE models used to generate Figure 6 produce higher quality generated images, the ripples appearing in these plots are likely more prototypical, but it is not easy to evaluate the quality of these visualizations relative to subjective hallucination phenomena.
Could you provide a more nuanced description of alternative roles for top-down feedback, beyond being used exclusively for learning as depicted in your model?
For the sake of simplicity, we only treat top-down inputs in our model as a source of an instructive teaching signal, the originator of generative replay events during the Sleep phase, and as the mechanism of hallucination generation. However, as discussed in a response to a previous question, in the cortex pyramidal neurons receive and respond to a mixture of top-down and bottom-up processing.
There are a variety of theories for what role top-down inputs could play in determining network activity. To name several, top-down input could function as: 1) a denoising/pattern completion signal (Kadkhodaie & Simoncelli, 2021), 2) a feedback control signal (Podlaski & Machens, 2020), 3) an attention signal (Lindsay, 2020), 4) ordinary inputs for dynamic recurrent processing that play no specialized role distinct from bottom-up or lateral inputs except to provide inputs from higher-order association areas or other sensory modalities (Kar et al., 2019; Tugsbayar et al., 2025). Though our model does not include these features, they are perfectly consistent with our approach.
In particular, denoising/pattern completion signals in the predictive coding framework (closely related to the Wake-Sleep algorithm) also play a role as an instructive learning signal (Salvatori et al., 2021); and top-down control signals can play a similar role in some models (Gilra & Gerstner, 2017; Meulemans et al., 2021). Thus, options 1 and 2 are heavily overlapping with our approach, and are a natural consequence of many biologically plausible learning algorithms that minimize a variational free energy loss (Rao & Ballard, 1997; Ackley et al., 1985). Similarly, top-down attentional signals can exist alongside top-down learning signals, and some models have argued that such signals can be heavily overlapping or mutually interchangeable (Roelfsema & van Ooyen, 2005). Lastly, generic recurrent connectivity (from any source) can be incorporated into the Wake-Sleep algorithm (Dayan & Hinton, 1996), though we avoided doing this in the present study due to an absence of empirical architecture exploration in the literature and the computational complexity associated with training on time series data.
To conclude, there are a variety of alternative functions proposed for top-down inputs onto pyramidal neurons in the cortex, and we view these additional features as mutually compatible with our approach; for simplicity we did not include them in our Wake-Sleep-trained model, but we believe that these features are unlikely to interfere with our testable predictions or empirical results. In fact, the pretrained VDVAE models that we worked with do include top-down influence during the Wake-stage inference process, and these models recapitulated our key results and testable predictions (Fig. S8).
Relevant modifications: Fig. S8; Page 12, paragraph 4.
The role of intellec-tual property rights has massively increased since the late 1990s.This is no longer just about copyright but huge numbers of pat-ents and micro-patents that cover software, protocols, operat-ing systems, algorithms, data feeds, and so on.64 This allows theplatforms to stay way ahead of smaller, later competitors whohave little chance of reaching the scale of data collection andcomputing power available to the giants. It also allows themto effectively charge “rent” (economic actors receiving rewards“purely by virtue of controlling something valuable”) on thosesystems, platforms, and infrastructures.
Which is why judicial and police sectors are also implicitly culture. Or rather, they are the chains of actually distributed culture. They are validated, invisibilised oppression.
It might be that some targeted basic income for artists schemewould work. It is selective and so perhaps akin to a fellowshipscheme. The Irish experiment will tell us a lot here.
The Irish experiment worked! And the pilot cost €72 million to date but generated nearly €80 million in total benefits to the Irish economy. It is now being made permanent, although it only goes to 2000 people. Check it here: https://www.artnews.com/art-news/news/ireland-basic-income-artists-program-permanent-1234756981/
Still, I find caveats: These people going employed and/or working for monopolies, or else monopolies still squashing these people's liveability by means of sheer power in marketing or patents, political lobbying, or court judicial settlements.
In neoclassical and neoliberal economics, state spendingon services is framed as being paid for by the “productive” –i.e. profitable – sector of the economy. But, as we learned inthe pandemic, the most useful and essential parts of our soci-ety are often the least profitable and their workers the leastremunerated. Many profitable sectors are not useful, andoften quite damaging. Large parts of the hyper-profitablefinance sector are parasitic on the public service sector. AsI argued in Chapter 2, this “productive” economy relies on awhole set of disavowed systems – education, domestic labour,environment – without which its profits would be impossible.
I feel this argument, against bullshit jobs, is much stronger than "capitalism has failed"... for once, because it doesn't necessitate a defeatist starting point, and can me framed as even a satirical position (CEOs don't do crap, is laughable), and for second, because just world hypothesis conservatism bias tells people this can't be the case. Messages online tell people "capitalism+democracy" is the way to go, or else dictatorships by the ultra rich (?). I find it amusing, that more of the same sells so nicely, but that's what people see, survivorship bias big companies employing lots of people, and capitalism lifting out pop stars through financial mobility, and the system delivering all the goods we can possible think of. It's become spectacular consumerism, and culture is everywhere. Culture works, it fucking does, but not your culture, rather Gmail's, and Meta, and OnlyFans, Roblox, etc. one.
pg. 4 asa brings infers thatthe railways were responsible for the creation of popular seaside resorts. perkin's concurs.
he says howevrer that this oversimplifies the argumens, blackpool colwyn bay and llandudno wouldnt have been achieved without cheap means of transportation - but substantial tourist trade existed before railways were constructed and evidence that landowners constrained development for decades after railway developments
That their wishes prevailed was not merely an example of commercialinterests outweighing the needs of visitors. The town's preparedness to sacrifice the burrows seems alsoto have been based on a belief that tourism would not be stifled as a result.
together but seperate entities?
The drive to lure fashionable tourists at the same time as expanding as a centre for copper smeltingwas not unproblematic. One guidebook author while describing Swansea as ‘a favourite resort in thesummer for bathing’, also warned that ‘the volumes of smoke from the different manufactories are agreat deduction to the general attraction of the place’.
does she then argue that they co-existed but at the expense of the other?
health tourism, with wealthy visitors flocking in duringthe summer months to bathe in the sheltered bay
but was 'health tourism' the same as developed seaside resorts?
in the second half of the nineteenth century,with more day-trippers and working-class visitors from the surrounding industrial suburbs and furtherafield.
Reviewer #1 (Public review):
Summary:
By using an established NAFLD model, choline-deficient high-fat diet, Barros et al show that LPS challenge causes excessive IFN-γ production by hepatic NK cells which further induces recruitment and polarization of a PD-L1 positive neutrophil subset leading to massive TNFα production and increased host mortality. Genetic inhibition of IFN-γ or pharmacological blockade of PD-L1 decreases recruitment of these neutrophils and TNFα release, consequently preventing liver damage and decreasing host death.
Since NAFLD is often accompanied by chronic, low-grade inflammation, it can lead to an overactive but dysfunctional immune response and increase the body's overall susceptibility to infections, therefore this is very important research question.
Strengths:
The biggest strength of the manuscript is vast number of mouse strains used.
Weaknesses:
After the review, there are still some open questions from my side:
(1) I would like the authors to defend their choice of diet type since this has not been done in the review/response to authors. In case they cannot, we need additional proof (HFD or WD model).
(2) Since the authors used same control groups (chow and HFCD), as required by the animal ethics committee, they must have power analysis test to show that the number of controls (but also in other groups) they used is enough to see the effect. Please provide it.
Author response:
The following is the authors’ response to the original reviews.
We thank the editor and reviewers for their constructive questions, valuable feedback, and for approving our manuscript. We truly appreciate the opportunity to improve our work based on their insightful comments. Before addressing the editor’s and each referee’s remarks individually, we provide below a point-by-point response summarizing the revisions made.
Duplication of control groups across experiments
We appreciate the reviewers’ concern regarding the potential duplication of control groups. In the revised manuscript, we have explicitly clarified that independent groups of control mice were used for each experiment. These details are now clearly indicated in the Materials and Methods section to avoid any ambiguity and to reinforce the rigor of our experimental design (Page 15, Line 453-455): “Furthermore, knockout animals and those treated with pharmacological inhibitors or neutralizing antibodies shared the same control groups (chow and HFCD), as required by the animal ethics committee.”
Validation of the MASLD model
To strengthen the metabolic characterization of our MASLD model, we have now included additional parameters, including liver weight, Picrosirius staining and blood glucose measurements. These data are presented as new graphs in the revised manuscript and support the metabolic relevance of the HFCD diet model (Figure Suplementary S1). The corresponding description has been added to the Results section (Page 5, Lines 116-117) as follows: “Mice fed HFCD showed no increase in liver weight and collagen deposition as evidenced by Picrosirius staining (Fig. S1A and Fig. S1C)”
Assessment of liver injury in RagKO and anti-NK1.1 mice
We fully agree that assessment of liver injury is essential for these models. For mice treated with antiNK1.1, ALT levels are shown in Figure 4G, confirming increased liver injury after treatment. Regarding Rag⁻/⁻ mice, the animals exhibit exacerbation of liver injury when fed a HFCD diet and challenged with LPS (Page 7, Lines 183–184). The corresponding description has been added to the Results section (Page 7, Lines 175-176) as follows: “Interestingly, Rag1-deficient animals under the HFCD remained susceptible to the LPS challenge (Fig. 4C) with exacerbation of liver injury (Fig. 4D) ”
Discussion of limitations
We have expanded the Discussion section to provide a more comprehensive and balanced perspective on the limitations of our model and experimental approach (Page 13-14, Lines 401–414) “Our study presents several limitations that should be acknowledged and discussed. First, we cannot entirely rule out the possibility that our mice deficient in pro-inflammatory components exhibit reduced responsiveness to LPS. However, our ex vivo analyses using splenocytes from these animals revealed a preserved cytokine production following LPS stimulation. These results suggest that the in vivo differences observed are primarily driven by the MAFLD condition rather than by intrinsic defects in LPS sensitivity. Second, the absence of publicly available single-cell RNA-seq datasets from MAFLD subjects under endotoxemic or septic conditions limited our ability to perform direct translational comparisons. To overcome this, we analyzed existing MAFLD patients and experimental MAFLD datasets, which consistently demonstrated upregulation of IFN-y and TNF-α inflammatory pathways in MALFD. In line with these findings, our murine model revealed TNF-α⁺ myeloid and IFN-y⁺ NK cell populations, thereby reinforcing the validity and translational relevance of our results.”. This revision highlights the constraints of the MASLD model, the inherent variability among in vivo experiments, and the interpretative limitations related to immunodeficient mouse strains.
Recommendations for the authors:
Reviewer #1 (Recommendations for the authors):
(1) In Figure 4 the authors are showing the number of IFN+ positive CD4, CD8, and NK 1.1+ cells. Could they show from total IFNg production, how much it goes specifically on NK cells and how much on other cell populations since NK1.1 is NK but also NKT and gamma delta T cell marker? Also, in Figure 2E the authors see a substantial increase in IFNg signal in T cells.
While we did not specifically assess IFNγ production in NKT cells or other minor populations, our data indicate that the NK1.1+CD3+ cells (NKT cells) cited in Page 7, Lines 188-192 were essentially absent in the liver tissue of LPS-challenged animals, as shown in Supplementary Figures 3C and S10. The corresponding description has been added to the Results section (Page 7, Lines 188-192) as follows: “We observed that the number of NK cells increased in the liver tissue of PBS-treated MAFLD mice compared with mice fed a control diet (Fig. 4E). LPS challenge increased the accumulation of NK1.1+CD3− NK cells in the liver tissue of MAFLD mice and the absence of NK1.1+CD3+ NKT cells (Fig. S3C and 4E)”.
This absence was consistent across all experimental conditions, corroborating our focus on NK1.1+CD3− cells as the primary source of NK1.1-associated IFNγ production. Furthermore, data demonstrated in Figure 2E illustrate the presence of IFNγ primarily in NK cells. Therefore, the observed IFNγ signal, attributed to NK1.1+ cells, predominantly reflects conventional NK cells, with minimal contribution from NKT or γδ T cells.
(2) In Figure 4C, the authors state that the results suggest that T and B cells do not contribute to susceptibility to LPS challenge. However, they observe a drop in survival compared to chow+LPS. Are the authors certain there is no statistical significance there?
The observed decrease in survival is consistent with our expectations, as T and B cells are not the primary source of interferon-gamma (IFNγ) in this context. Even in their absence, animals remain susceptible to LPS challenge due to the presence of other IFNγ-producing cells that drive the observed lethality. We have carefully re-examined the statistical analysis and confirm that it was correctly performed.
(3) Since the survival curve and rate are exactly the same (60%) in Figures 3F, 3G, 4C, 4F, 5G, and 5H I would just like to double-check that the authors used different controls for each experiment.
The number of mice used in each experiment was carefully determined to ensure sufficient statistical power while fully complying with the limits established by our institutional Animal Ethics Committee. To minimize animal use, the same control group was shared across multiple survival experiments. Despite using shared controls, the total number of animals per experimental group was adequate to produce robust and reproducible survival outcomes. All groups were properly randomized, and the shared control data were rigorously incorporated into statistical analyses. This strategy allowed us to maintain both ethical standards and the scientific rigor of our findings.
(4) In Figure 5 the authors are saying that it is neutrophils but not monocytes mediate susceptibility of animals with NAFLD to endotoxemia. However, CXCR2i depletion and CCR2 knock out mice affect both monocytes/macrophages and neutrophils. And in Figures 5E, 5G, and 5H they see that a) LPS+CXCR2i decreases liver damage more than LPS+anti Ly6G, b) HFCD mice challenged with LPS and treated with anti-LY6G do not rescue survival to levels of CHOW LPS and c) anti Ly6G treatment helps less than CXCR2i. Therefore, from both knock out mice and depletion experiments the authors can conclude that most likely monocytes (but potentially also other cells) together with neutrophils are substantial for the development of endotoxemic shock in choline-deficient high-fat diet model.
While neutrophils express CCR2, our data clearly show that CCR2 deficiency does not impair neutrophil migration, as demonstrated in Supplemental Figures 5A and 5B (added to the manuscript, page 8, lines 213–217). The corresponding description has been added to the Results section (Page 8, Lines 213217) as follows: ``Interestingly, animals deficient in monocyte migration (CCR2-/-) showed a high mortality rate compared to wild type after LPS challenge and neutrophil migration is not altered (Fig. 5SA and Fig. 5SB)``, In contrast, CCR2 deficiency primarily affects monocyte recruitment, yet in our experimental conditions, monocyte depletion or CCR2 knockout did not significantly alter the severity of endotoxemic shock, indicating that monocytes play a minimal role in mediating susceptibility in HFCD-fed mice.
To specifically investigate neutrophils, we used pharmacological blockade of CXCR2 to inhibit migration and antibody-mediated neutrophil depletion. Both approaches have consistently demonstrated that neutrophils are critical factors in endotoxemic shock.
These findings support our conclusion that neutrophils are the primary cellular contributors to susceptibility in HFCD-fed mice during endotoxemia, with monocytes making a negligible contribution under the tested conditions.
(6) In Figure 6A (but also others with PD-L1) did the authors do isotype control? And can they show how much of PD1+ population goes on neutrophils, and how much on all the other populations?
To address this issue, we performed additional analyses to assess the distribution of PD-L1 expression on CD45+CD11B+ leukocytes. These new results, detailed on Page 9, lines 245-250, and now presented in Supplemental Figure 6, demonstrate that PD-L1 expression is predominantly enriched in neutrophils compared to other immune subsets. This observation further reinforces our conclusion that neutrophils represent a major source of PD-L1 in our experimental model.
To ensure the robustness of these findings, we also included FMO controls for PD-L1 staining in the newly added Supplemental Figure S6. These controls validate the specificity of our gating strategy and confirm the reliability of the detected PD-L1 signal. The corresponding description has been added to the Results section (Page 9, Lines 245-250) as follows: ``First, we observed that only the MAFLD diet caused a significant increase in PD-L1 expression in CD45+CD11b+ leukocytes after LPS challenge (Fig. S6C). We observed that within this population, neutrophils predominate in their expression when compared to monocytes (Fig. 6SA, Fig. 6SB, and Fig. 6SD). Furthermore, PD-L+1 neutrophils showed an exacerbated migration of PD-L1+ neutrophils towards the liver (Fig. 6A and 6B)”
(7) In Figure 6D it is interesting that there is not an increase in PD-L1+ neutrophils in LPS HFCD IFNg+/+ mice in comparison to LPS chow IFNg+/+ mice, since those should be like WT mice (Figure 6A going from 50% to 97%) and so an increase should be seen?
The apparent difference between Figures 6A and 6D likely reflects inter-experimental variability rather than a biological discrepancy. Although the absolute percentages of PD-L1⁺ neutrophils varied slightly among independent experiments, the overall phenotype and trend were consistently maintained namely, that PD-L1 expression on neutrophils is enhanced in response to LPS stimulation and modulated by IFNγ signaling. Thus, the data shown in Figure 6D are representative of this consistent phenotype despite minor quantitative variation.
(8) In Figure 7 do the authors have isotype control for TNFa because gating seems a bit random so an isotype control graph would help a lot as supplementary information, in order to make the figure more persuasive
To address the concern regarding gating in Figure 7, we have included the FMO showing TNFα as a histogram Supplementary Figure 8gG. These control reaffirm the accuracy and reliability of our gating strategy for TNFα, further supporting the robustness of our data. The corresponding description has been added to the Results section (Page 9, Lines 272-274) as follows:`` We observed an exacerbated TNF-α expression by PD-L1+ neutrophils from MAFLD when compared to control chow animals (Fig. 7A, Fig. 7B, Fig. 7D, and Fig8SG).
(9) Figure 6C IFNg+/+ mice on CHOW +LPS is same as Figure 8E mice chow +LPS but just with different numbers. Can the authors explain this?
Although the data points in Figures 6C and 8E may appear similar, we confirm that they originate from entirely independent experiments and represent distinct datasets. To enhance clarity and avoid any potential confusion, we have adjusted the figure presentation and sizing in the revised manuscript. These changes make it clear that the datasets, while comparable, are derived from separate experimental replicates.
(10) Figure 1E chow B6+LPS is the same as Figure 5D B6+LPS but should they be different since those should be two different experiments?
We confirm that Figures 1E and 5D correspond to data obtained from independent experiments. Although the experimental conditions were similar, each dataset was generated and analyzed separately to ensure the reproducibility and robustness of our results.
Reviewer #2 (Recommendations for the authors):
(1) Why did you look at kidney injury in Figure 1D? I think this should be explained a little.
We assessed kidney injury alongside ALT, a marker of liver damage, because both the liver and kidneys are among the primary organs affected during sepsis and endotoxemia. This rationale has been added to the manuscript (page 5, lines 129–131): “Remarkably, compared to the Chow group, HFCD mice exposed to LPS did not show greater changes in other organs commonly affected by endotoxemia, such as the kidneys (Figure 1D).” By evaluating markers of injury in both organs, we aimed to determine whether our physiopathological condition was liver-specific or indicative of broader systemic injury.
(2) I know Figure 2C isn't your data, but why are there so few NK cells, considering NK cells are a resident liver cell type? Doesn't that also bring into question some of your data if there are so few NK cells? And the IFNG expression (2E) looks to mostly come from T-cells (CD8?).
The data shown in Figure 2C were reanalyzed from a separate NAFLD model based on a 60% high-fat diet. Although this model differs from ours, the observed low number of NK cells is consistent with expectations for animals subjected solely to a hyperlipidic diet, which primarily provides an inflammatory stimulus that promotes recruitment rather than maintaining high baseline NK cell numbers.
In our experimental model, these observations align with published data. Specifically, liver tissue from NAFLD animals typically exhibits low baseline NK cell numbers, but upon LPS challenge, there is a marked increase in NK cell recruitment to the liver. This dynamic illustrates the interplay between dietinduced inflammation and immune cell recruitment in our experimental context and supports the interpretation of our IFNγ data.
(3) In your methods, I think you didn't explain something. You said LPS was administered to 56 week old mice, but that HFCD diet was started in 5-6 week old mice and lasted 2 weeks, then LPS was administered. So LPS administration happened when the mice were 7-8 weeks old, right?
We thank the reviewer for pointing out this inconsistency in our Methods section. The reviewer is correct: the HFCD diet was initiated in 5–6-week-old mice, and LPS was administered after 2 weeks on the diet, such that LPS challenge occurred when the mice were 7–8 weeks old.
We have revised the Methods section (add page 15-16, lines 474–480). to clarify this timeline and ensure it is accurately described in the manuscript. The corresponding description has been added to the Materials and Methods section (Page 14, Lines 436-442) as follows: “Lipopolysaccharide (LPS; Escherichia coli (O111:B4), L2630, Sigma-Aldrich, St. Louis, MO, USA) was administered intraperitoneally (i.p.; 10 mg/kg) in C57BL/6, CCR2 -/-, IFN-/-, and TNFR1R2 -/- mice. The HFCD was initiated in 5–6 week-old mice, and LPS was administered after 2 weeks on the diet, meaning that LPS administration occurred when the mice were 7–8 weeks old, with body weights ranging from 22 to 26 g. LPS was previously solubilized in sterile saline and frozen at -70°C. The animals were euthanized 6 hours after LPS administration”.
(4) Throughout the manuscript, I would consider changing the term NAFLD to something else. I think HFCD diet is a closer model to NASH, so there needs to be some discussion on that. And the field is changing these terms, so NAFLD is now MASLD and NASH is now MASH.
We appreciate the reviewer’s comment regarding the terminology and disease classification. In our experimental conditions, the animals were subjected to a high-fat, choline-deficient (HFCD) diet for only two weeks, a period considered very early in the progression of diet-induced liver disease. At this stage, histological analysis revealed lipid accumulation in hepatocytes without evidence of hepatocellular injury, inflammation, or fibrosis. Therefore, our model more closely resembles the metabolic-associated fatty liver disease (MAFLD, formerly NAFLD) stage rather than the more advanced metabolic-associated steatohepatitis (MASH, formerly NASH).
Indeed, prolonged exposure to HFCD diets, typically 8 to 16 weeks, is required to induce the inflammatory and fibrotic features characteristic of MASH. Since our objective was to study the initial metabolic and immune alterations preceding overt liver injury, we believe that using the term MAFLD more accurately reflects the pathological stage represented in our model. Accordingly, we have revised the text to align with the updated nomenclature and disease context.
(6) I am concerned about over interpretation of the publicly available RNA-seq data in Figure 2. This data comes from human NAFLD patients with unknown endotoxemia and mouse models using a traditional high-fat diet model. So it is hard to compare these very disparate datasets to yours. Also, if these datasets have elevated IFNG, why does your model require LPS injection?
We thank the reviewer for their thoughtful comments regarding the interpretation of the RNA-seq data presented in Figure 2. We would like to clarify that the human NAFLD datasets referenced in our study do not specifically include patients with endotoxemia; rather, they focus on individuals with NAFLD alone.
Comparing data from human and murine MAFLD models, we observed that NK cells, T cells, and neutrophils are present and contribute to the hepatic inflammatory environment. Our reanalysis indicates that the elevations of IFNγ and TNF in NAFLD are primarily derived from NK cells, T cells, and myeloid cells, respectively.
In our experimental model, LPS administration was used to evaluate whether these immune populations particularly NK cells are further potentiated under a hyperinflammatory state, leading to exacerbated IFNγ production. This approach allows us to determine whether increased IFNγ contributes to worsening outcomes in NAFLD, providing mechanistic insights that cannot be obtained from static human or traditional mouse datasets alone.
(7) The zoom-ins for the histology (for example, Figure 1E) don't look right compared to the dotted square. The shape and area expanded don't match. And the cells in the zoom-in don't look exactly the same either.
We have thoroughly re-examined the histological sections and the corresponding zoom-ins, including the example in Figure 1E. Upon verification, we confirm that the zoom-ins accurately represent the highlighted areas indicated by the dotted squares. The apparent discrepancies in shape or cellular appearance are likely due to minor differences in orientation or cropping during figure preparation. Nevertheless, the content and regions depicted are consistent with the original sections.
(8) Did the authors measure myeloid infiltration in the CCR2-/- mice? Did you measure Neutrophil infiltration in the TNF-Receptor KO mice?
Analysis of CD45+ cell migration in CCR2 knockout mice, as shown in Supplemental Figure 5C and 5D, demonstrates that the absence of CCR2 does not impair overall leukocyte migration. Similarly, assessment of neutrophil migration in TNF receptor (TNFR1/2) knockout mice, presented in Supplemental Figure 8A, shows that neutrophil trafficking is not affected in these animals. These results indicate that the respective knockouts do not compromise the migration of the analyzed immune populations, supporting the interpretations presented in our study.
(9) Regarding Methods for RNA-seq Analysis. Was the Mitochondrial percentage cutoff 0.8%, because that seems low. And was there not a Padj or FDR cutoff for the differential expression?
The mitochondrial percentage in our scRNA-seq analysis reflects the proportion of mitochondrial gene expression per cell, which serves as a quality control metric. A low mitochondrial gene expression percentage, such as the 0.8% cutoff used here, is indicative of highly viable cells.
For differential gene expression analysis, we employed the FindMarkers function in Seurat with standard parameters: adjusted p-value (Padj) < 0.05 and log2 fold change > 0.25 for upregulated genes, and adjusted p-value < 0.05 with log2 fold change < -0.25 for downregulated genes. These thresholds ensure robust identification of differentially expressed genes while balancing sensitivity and specificity.
(10) Regarding Methods for Flow Cytometry. How were IFNG and TNF staining performed? Was this an intracellular stain? Did you need to block secretion? TNF and IFNG antibodies have the same fluorophore (PE), so were these stainings and analyses performed separately?
Six hours after LPS challenge, non-parenchymal liver cells were isolated using Percoll gradient centrifugation. Because the animals were in a hyperinflammatory state induced by LPS, no in vitro stimulation was performed; all staining was carried out immediately after cell isolation. Detection of IFNγ and TNF was performed via intracellular staining using the Foxp3 staining kit (eBioscience). Due to both antibodies being conjugated to PE, IFN-γ and TNF-α staining and analyses were conducted in separate experiments. These distinct staining protocols and analyses are detailed in Supplemental Figures 10 and 11. The corresponding description has been added to the Materials and Methods section (Page 16, Lines 490-493) as follows: ``As animals were already in a hyperinflammatory state, no additional in vitro stimulation was required. Intracellular detection of IFN-γ and TNF-α was conducted using the Foxp3 staining kit (eBioscience). Since both antibodies were conjugated to PE, staining and analyses were performed in separate experiments``
Reviewer #3 (Recommendations for the authors):
(1) Achieving an NAFLD model/disease is the starting point of this study. I understand that a two-week HFCD diet period was applied due to the decrease in lymphocyte numbers. Was it enough to initiate NAFLD then? Or is it a milder metabolic disease? Which parameters have been evaluated to accept this model as a NAFLD model?
Indeed, the two-week HFCD diet induces an early-stage form of NAFLD, characterized by initial fat accumulation in the liver without significant hepatic injury. While this represents a milder metabolic phenotype, it is sufficient to study the inflammatory and immune responses associated with NAFLD. To validate this model, we assessed multiple parameters: liver weight, blood glucose levels, and collagen deposition. These measurements confirmed the presence of early-stage NAFLD features in the animals, providing a relevant and reliable context for investigating susceptibility to endotoxemia and immune cell dynamics. They are shown in Figure Suplementary 1 and the text was included in the manuscript (Page 5, Lines 116-117): “Mice fed HFCD showed no increase in liver weight and collagen deposition as evidenced by Picrosirius staining (Fig. S1A and Fig. S1C) ”.
(2) It is true that the CD274 gene (encoding PD-L1) and the IFNGR2 gene, corresponding to the IFNγ receptor, are among the upregulated genes when authors analyzed the publicly available RNAseq data but they are not the most significantly elevated genes. What is the reasoning behind this cherrypicking? Why are other high DEGs not analyzed but these two are analyzed?
We highlighted the expression of the IFN-γ receptor (IFNGR2) and CD274 (encoding PD-L1) in the publicly available RNA-seq data to align and corroborate these findings with the key results observed later in our study. To avoid redundancy, we chose to present these genes in the initial figures as they are directly relevant to the subsequent analyses. Regarding the broader analysis of human RNA-seq data, our primary objective was to identify enriched biological processes and pathways, which served as a foundation for the focus and direction of this study.
(3) Figures 3C-3G: I understand that IFNg-/- and NFR1R2a-/- mice are not showing elevated liver damage but it may simply be because of the non-responsiveness to the LPS challenge. I suggest using a different challenge or recovery experiments with the cytokines to show that the challenge is successful and results are caused by NAFLD, truly. The same goes for Figure 6: Looking at Figure 6D one may think that IFNg deficiency alters the LPS response independent of the diet condition (or NAFLD condition).
We appreciate the reviewer’s insightful comment and fully understand the concern regarding the potential non-responsiveness of IFN-γ⁻/⁻ and TNFR1R2a⁻/⁻ mice to the LPS challenge. To address this point and confirm that these knockout animals are indeed responsive to LPS stimulation, we conducted an additional set of ex vivo experiments.
Specifically, WT and cytokine-deficient (IFN-γ⁻/⁻) mice were fed either Chow or HFCD for two weeks, after which spleens were collected, and splenocytes were challenged in vitro with LPS. We then quantified TNF, IFN, and IL-6 production to confirm that these mice are capable of mounting cytokine responses upon LPS stimulation.
Due to current breeding limitations and a temporary issue in colony maintenance of TNF-deficient mice, we were unable to include TNFR1R2a⁻/⁻ animals in this additional experiment. Nevertheless, we prioritized performing the analysis with the available knockout line to avoid leaving this important point unaddressed.
These additional data demonstrate that IFN-γ-deficient mice remain responsive to LPS, reinforcing that the differences observed in vivo are related to the NAFLD condition rather than a lack of LPS responsiveness.
(4) Figure 1 vs Figure 4: Rag-/- mice seem more susceptible to LPS-derived death even after normal conditions. But If I compare the survival data between Figure 1 and Figure 4, Rag-/- HFCD diet mice seem to be doing better than wt mice after LPS treatment. (1 day survival vs 2 days survival). How do you explain these different outcomes?
We thank the reviewer for this insightful question regarding the survival data in Figures 1 and 4. Although there is a one-day difference in survival outcomes, Rag-/- mice consistently exhibit increased susceptibility to LPS-induced mortality can influence the exact survival timing. Nonetheless, across all experiments, Rag-/- mice display a reproducible phenotype of heightened sensitivity to LPS challenge, which is supported by multiple independent observations in our study.
(5) How do you explain Figure 4J in connection to the observation presented with Figure 7: TNFa tissue levels, even though significant, seem very similar between the conditions?
We would like to clarify that the animals in this study are in a metabolic syndrome state, with early-stage NAFLD characterized by hepatic fat accumulation without significant tissue injury, as shown in Figure 1C.
Under these conditions, the LPS challenge triggers an exacerbated inflammatory response, leading to increased secretion of IFN-γ and TNF-α, primarily from NK cells and neutrophils. While TNFα levels may appear visually similar across conditions, the HFCD mice exhibit a heightened predisposition for an amplified immune response compared to chow-fed mice. This difference is consistent with the functional outcomes observed in our study and highlights the diet-specific sensitization of the immune system.
Author response:
The following is the authors’ response to the original reviews.
Public Reviews:
Reviewer #1 (Public review):
Summary:
The image analysis pipeline is tested in analysing microscopy imaging data of gastruloids of varying sizes, for which an optimised protocol for in toto image acquisition is established based on whole mount sample preparation using an optimal refractive index matched mounting media, opposing dual side imaging with two-photon microscopy for enhanced laser penetration, dual view registration, and weighted fusion for improved in toto sample data representation. For enhanced imaging speed in a two-photon microscope, parallel imaging was used, and the authors performed spectral unmixing analysis to avoid issues of signal cross-talk.
In the image analysis pipeline, different pre-treatments are done depending on the analysis to be performed (for nuclear segmentation - contrast enhancement and normalisation; for quantitative analysis of gene expression - corrections for optical artifacts inducing signal intensity variations). Stardist3D was used for the nuclear segmentation. The study analyses into properties of gastruloid nuclear density, patterns of cell division, morphology, deformation, and gene expression.
Strengths:
The methods developed are sound, well described, and well-validated, using a sample challenging for microscopy, gastruloids. Many of the established methods are very useful (e.g. registration, corrections, signal normalisation, lazy loading bioimage visualisation, spectral decomposition analysis), facilitate the development of quantitative research, and would be of interest to the wider scientific community.
We thank the reviewer for this positive feedback.
Weaknesses:
A recommendation should be added on when or under which conditions to use this pipeline.
We thank the reviewer for this valuable feedback, we added the text in the revised version, ines 418 to 474. “In general, the pipeline is applicable to any tissue, but it is particularly useful for large and dense 3D samples—such as organoids, embryos, explants, spheroids, or tumors—that are typically composed of multiple cell layers and have a thickness greater than 50 µm”.
“The processing and analysis pipeline are compatible with any type of 3D imaging data (e.g. confocal, 2 photon, light-sheet, live or fixed)”.
“Spectral unmixing to remove signal cross-talk of multiple fluorescent targets is typically more relevant in two-photon imaging due to the broader excitation spectra of fluorophores compared to single-photon imaging. In confocal or light-sheet microscopy, alternating excitation wavelengths often circumvents the need for unmixing. Spectral decomposition performs even better with true spectral detectors; however, these are usually not non-descanned detectors, which are more appropriate for deep tissue imaging. Our approach demonstrates that simultaneous cross-talk-free four-color two-photon imaging can be achieved in dense 3D specimen with four non-descanned detectors and co-excitation by just two laser lines. Depending on the dispersion in optically dense samples, depth-dependent apparent emission spectra need to be considered”.
“Nuclei segmentation using our trained StarDist3D model is applicable to any system under two conditions: (1) the nuclei exhibit a star-convex shape, as required by the StarDist architecture, and (2) the image resolution is sufficient in XYZ to allow resampling. The exact sampling required is object- and system-dependent, but the goal is to achieve nearly isotropic objects with diameters of approximately 15 pixels while maintaining image quality. In practice, images containing objects that are natively close to or larger than 15 pixels in diameter should segment well after resampling. Conversely, images with objects that are significantly smaller along one or more dimensions will require careful inspection of the segmentation results”.
“Normalization is broadly applicable to multicolor data when at least one channel is expected to be ubiquitously expressed within its domain. Wavelength-dependent correction requires experimental calibration using either an ubiquitous signal at each wavelength. Importantly, this calibration only needs to be performed once for a given set of experimental conditions (e.g., fluorophores, tissue type, mounting medium)”.
“Multi-scale analysis of gene expression and morphometrics is applicable to any 3D multicolor image. This includes both the 3D visualization tools (Napari plugins) and the various analytical plots (e.g., correlation plots, radial analysis). Multi-scale analysis can be performed even with imperfect segmentation, as long as segmentation errors tend to cancel out when averaged locally at the relevant spatial scale. However, systematic errors—such as segmentation uncertainty along the Z-axis due to strong anisotropy—may accumulate and introduce bias in downstream analyses. Caution is advised when analyzing hollow structures (e.g., curved epithelial monolayers with large cavities), as the pipeline was developed primarily for 3D bulk tissues, and appropriate masking of cavities would be needed”.
Reviewer #2 (Public review):
Summary:
This study presents an integrated experimental and computational pipeline for high-resolution, quantitative imaging and analysis of gastruloids. The experimental module employs dual-view two-photon spectral imaging combined with optimized clearing and mounting techniques to image whole-mount immunostained gastruloids. This approach enables the acquisition of comprehensive 3D images that capture both tissue-scale and single-cell level information.
The computational module encompasses both pre-processing of acquired images and downstream analysis, providing quantitative insights into the structural and molecular characteristics of gastruloids. The pre-processing pipeline, tailored for dual-view two-photon microscopy, includes spectral unmixing of fluorescence signals using depth-dependent spectral profiles, as well as image fusion via rigid 3D transformation based on content-based block-matching algorithms. Nuclei segmentation was performed using a custom-trained StarDist3D model, validated against 2D manual annotations, and achieving an F1 score of 85+/-3% at a 50% intersection-over-union (IoU) threshold. Another custom-trained StarDist3D model enabled accurate detection of proliferating cells and the generation of 3D spatial maps of nuclear density and proliferation probability. Moreover, the pipeline facilitates detailed morphometric analysis of cell density and nuclear deformation, revealing pronounced spatial heterogeneities during early gastruloid morphogenesis.
All computational tools developed in this study are released as open-source, Python-based software.
Strengths:
The authors applied two-photon microscopy to whole-mount deep imaging of gastruloids, achieving in toto visualization at single-cell resolution. By combining spectral imaging with an unmixing algorithm, they successfully separated four fluorescent signals, enabling spatial analysis of gene expression patterns.
The entire computational workflow, from image pre-processing to segmentation with a custom-trained StarDist3D model and subsequent quantitative analysis, is made available as open-source software. In addition, user-friendly interfaces are provided through the open-source, community-driven Napari platform, facilitating interactive exploration and analysis.
We thank the reviewer for this positive feedback.
Weaknesses:
The computational module appears promising. However, the analysis pipeline has not been validated on datasets beyond those generated by the authors, making it difficult to assess its general applicability.
We agree that applying our analysis pipeline to published datasets—particularly those acquired with different imaging systems—would be valuable. However, only a few high-resolution datasets of large organoid samples are publicly available, and most of these either lack multiple fluorescence channels or represent 3D hollow structures. Our computational pipeline consists of several independent modules: spectral filtering, dual-view registration, local contrast enhancement, 3D nuclei segmentation, image normalization based on a ubiquitous marker, and multiscale analysis of gene expression and morphometrics. We added the following sentences to the Discussion, lines 418 to 474, and completed the discussion on applicability with a table showing the purpose, requirements, applicability and limitations of each step of the processing and analysis pipeline.
“Spectral filtering has already been applied in other systems (e.g. [7] and [8]), but is here extended to account for imaging depth-dependent apparent emission spectra of the different fluorophores. In our pipeline, we provide code to run spectral filtering on multichannel images, integrated in Python. In order to apply the spectral filtering algorithm utilized here, spectral patterns of each fluorophore need to be calibrated as a function of imaging depth, which depend on the specific emission windows and detector settings of the microscope”.
“Image normalization using a wavelength-dependent correction also requires calibration on a given imaging setup to measure the difference in signal decay among the different fluorophores species. To our knowledge, the calibration procedures for spectral-filtering and our image-normalization approach have not been performed previously in 3D samples, which is why validation on published datasets is not readily possible. Nevertheless, they are described in detail in the Methods section, and the code used—from the calibration measurements to the corrected images—is available open-source at the Zenodo link in the manuscript”.
Dual-view registration, local contrast enhancement, and multiscale analysis of gene expression and morphometrics are not limited to organoid data or our specific imaging modalities. To evaluate our 3D nuclei segmentation model, we tested it on diverse systems, including gastruloids stained with the nuclear marker Draq5 from Moos et al. [1]; breast cancer spheroids; primary ductal adenocarcinoma organoids; human colon organoids and HCT116 monolayers from Ong et al. [2]; and zebrafish tissues imaged by confocal microscopy from Li et al [3]. These datasets were acquired using either light-sheet or confocal microscopy, with varying imaging parameters (e.g., objective lens, pixel size, staining method). The results are added in the manuscript, Fig. S9b.
Besides, the nuclei segmentation component lacks benchmarking against existing methods.
We agree with the reviewer that a benchmark against existing segmentation methods would be very useful. We tried different pre-trained models:
CellPose, which we tested in a previous paper ([4]) and which showed poor performances compared to our trained StarDist3D model.
DeepStar3D ([2]) is only available in the software 3DCellScope. We could not benchmark the model on our data, because the free and accessible version of the software is limited to small datasets. An image of a single whole-mount gastruloid with one channel, having dimensions (347,467,477) was too large to be processed, see screenshot below. The segmentation model could not be extracted from the source code and tested externally because the trained DeepStar3D weights are encrypted.
Author response image 1.
Screenshot of the 3DCellScore software. We could not perform 3D nuclei segmentation of a whole-mount gastruloids because the image size was too large to be processed.
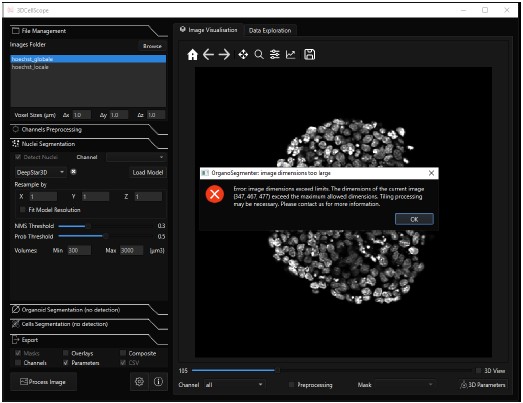
AnyStar ([5]), which is a model trained from the StarDist3D architecture, was not performing well on our data because of the heterogeneous stainings. Basic pre-processing such as median and gaussian filtering did not improve the results and led to wrong segmentation of touching nuclei. AnyStar was demonstrated to segment well colon organoids in Ong et al, 2025 ([2]), but the nuclei were more homogeneously stained. Our Hoechst staining displays bright chromatin spots that are incorrectly labeled as individual nuclei.
Cellos ([6]), another model trained from StarDist3D, was also not performing well. The objects used for training and to validate the results are sparse and not touching, so the predicted segmentation has a lot of false negatives even when lowering the probability threshold to detect more objects. Additionally, the network was trained with an anisotropy of (9,1,1), based on images with low z resolution, so it performed poorly on almost isotropic images. Adapting our images to the network’s anisotropy results in an imprecise segmentation that can not be used to measure 3D nuclei deformations.
We tried both Cellos and AnyStar predictions on a gastruloid image from Fig. S2 of our main manuscript. The results are added in the manuscript, Fig. S9b. Fig3 displays the results qualitatively compared to our trained model Stardist-tapenade.
Author response image 2.
Qualitative comparison of two published segmentation models versus our model. We show one slice from the XY plane for simplicity. Segmentations are displayed with their contours only. (Top left) Gastruloid stained with Hoechst, image extracted from Fig S2 of our manuscript. (Top right) Same image overlayed with the prediction from the Cellos model, showing many false negatives. (Bottom left) Same image overlayed with the prediction from our Stardist-tapenade model. (Bottom right) Same image overlayed with the prediction from the AnyStar model, false positives are indicated with a red arrow.
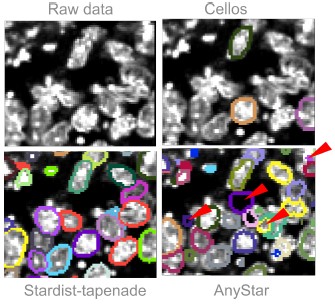
CellPose-SAM, which is a recent model developed building on the CellPose framework. The pre-trained model performs well on gastruloids imaged using our pipeline, and performs better than StarDist3D at segmenting elongated objects such as deformed nuclei. The performances are qualitatively compared on Fig. S9a and S10. We also demonstrate how using local contrast enhancement improves the results of CellPose-SAM (Fig. S10a), showing the versatility of the Tapenade pre-processing module. Tissue-scale, packing-related metrics from Cellpose–SAM labels qualitatively match those from stardist-tapenade as shown Fig.10c and d.
Appraisal:
The authors set out to establish a quantitative imaging and analysis pipeline for gastruloids using dual-view two-photon microscopy, spectral unmixing, and a custom computational framework for 3D segmentation and gene expression analysis. This aim is largely achieved. The integration of experimental and computational modules enables high-resolution in toto imaging and robust quantitative analysis at the single-cell level. The data presented support the authors' conclusions regarding the ability to capture spatial patterns of gene expression and cellular morphology across developmental stages.
Impact and utility:
This work presents a compelling and broadly applicable methodological advance. The approach is particularly impactful for the developmental biology community, as it allows researchers to extract quantitative information from high-resolution images to better understand morphogenetic processes. The data are publicly available on Zenodo, and the software is released on GitHub, making them highly valuable resources for the community.
We thank the reviewer for these positive feedbacks.
Reviewer #3 (Public review):
Summary
The paper presents an imaging and analysis pipeline for whole-mount gastruloid imaging with two-photon microscopy. The presented pipeline includes spectral unmixing, registration, segmentation, and a wavelength-dependent intensity normalization step, followed by quantitative analysis of spatial gene expression patterns and nuclear morphometry on a tissue level. The utility of the approach is demonstrated by several experimental findings, such as establishing spatial correlations between local nuclear deformation and tissue density changes, as well as the radial distribution pattern of mesoderm markers. The pipeline is distributed as a Python package, notebooks, and multiple napari plugins.
Strengths
The paper is well-written with detailed methodological descriptions, which I think would make it a valuable reference for researchers performing similar volumetric tissue imaging experiments (gastruloids/organoids). The pipeline itself addresses many practical challenges, including resolution loss within tissue, registration of large volumes, nuclear segmentation, and intensity normalization. Especially the intensity decay measurements and wavelength-dependent intensity normalization approach using nuclear (Hoechst) signal as reference are very interesting and should be applicable to other imaging contexts. The morphometric analysis is equally well done, with the correlation between nuclear shape deformation and tissue density changes being an interesting finding. The paper is quite thorough in its technical description of the methods (which are a lot), and their experimental validation is appropriate. Finally, the provided code and napari plugins seem to be well done (I installed a selected list of the plugins and they ran without issues) and should be very helpful for the community.
We thank the reviewer for his positive feedback and appreciation of our work.
Weaknesses
I don't see any major weaknesses, and I would only have two issues that I think should be addressed in a revision:
(1) The demonstration notebooks lack accompanying sample datasets, preventing users from running them immediately and limiting the pipeline's accessibility. I would suggest to include (selective) demo data set that can be used to run the notebooks (e.g. for spectral unmixing) and or provide easily accessible demo input sample data for the napari plugins (I saw that there is some sample data for the processing plugin, so this maybe could already be used for the notebooks?).
We thank the reviewer for this relevant suggestion. The 7 notebooks were updated to automatically download sample tests. The different parts of the pipeline can now be run immediately:
https://github.com/GuignardLab/tapenade/tree/chekcs_on_notebooks/src/tapenade/notebooks
(2) The results for the morphometric analysis (Figure 4) seem to be only shown in lateral (xy) views without the corresponding axial (z) views. I would suggest adding this to the figure and showing the density/strain/angle distributions for those axial views as well.
A morphometric analysis based on the axial views was added as Fig. S6a of the manuscript, complementary to the XY views.
Recommendations for the authors:
Reviewer #1 (Recommendations for the authors):
In lines 64 and 65, it is mentioned that confocal and light-sheet microscopy remain limited to samples under 100μm in diameter. I would recommend revising this sentence. In the paper of Moos and colleagues (also cited in this manuscript; PMID: 38509326), gastruloid samples larger than 100μm are imaged in toto with an open-top dual-view and dual-illumination light-sheet microscope, and live cell behaviour is analysed. Another example, if considering also multi-angle systems, is the impressive work of McDole and colleagues (PMID: 30318151), in which one of the authors of this manuscript is a corresponding author. There, multi-angle light sheet microscopy is used for in toto imaging and reconstruction of post-implantation mouse development (samples much larger than 100μm). Some multi-sample imaging strategies have been developed for this type of imaging system, though not to the sample number extent allowed by the Viventis LS2 system or the Bruker TruLive3D imager, which have higher image quality limitations.
We thank the reviewer for this remark. As reported in their paper, Moos et al. used dual-view light-sheet microscopy to image gastruloids, which are particularly dense and challenging tissues, with whole-mount samples of approximately 250 µm in diameter. Nevertheless, their image quality metric (DCT) shows a rapid twofold decrease within 50 µm depth (Extended Fig 5.h), whereas with two-photon microscopy, our image quality metric (FRC-QE) decreases by a factor of two over 150 µm in non-cleared samples (PBS) (see Fig. 2 c). While these two measurements (FRC-QE versus DCT) are not directly comparable, the observed difference reflects the superior depth performance of two-photon microscopy, owing in part to the use of non-descanned detectors. In our case, imaging was performed with Hoechst, a blue fluorophore suboptimal for deep imaging, whereas in the Moos dataset (Draq5, far-red), the configuration was more favorable for imaging in depth which further supports our conclusion.
In McDole et al, tissues reaching 250µm were imaged from 4 views, but do not reach cellular-scale resolution in deeper layers compatible with cell segmentation to our knowledge.
We corrected the sentence ‘However, light-sheet and confocal imaging approaches remain limited to relatively small organoids typically under 100 micrometers in diameter ‘ by the following (line 64) :
“While advances in light-sheet microscopy have extended imaging depth in organoids, maintaining high image quality throughout thick samples remains challenging. In practice, quantitative analyses are still largely restricted to organoids under roughly 100 µm in diameter”.
It is worth mentioning that two-photon microscopes are much more widely available than light sheet microscopes, and light sheet systems with 2-photon excitation are even less accessible, which makes the described workflow of Gros and colleagues have a wide community interest.
We thank the reviewer for this remark, and added this suggestion line 74:
“Finally, two-photon microscopes are typically more accessible than light-sheet systems and allow for straightforward sample mounting, as they rely on procedures comparable to standard confocal imaging”.
Reviewer #2 (Recommendations for the authors):
Suggestions:
A comparison with established pre-trained models for 3D organoid image segmentation (e.g., Cellos[1], AnyStar[2], and DeepStar3D[3], all based on StarDist3D) would help highlight the advantages of the authors' custom StarDist3D model, which has been specifically optimized for two-photon microscopy images.
(1) Cellos: https://doi.org/10.1038/s41467-023-44162-6
(2) AnyStar: https://doi.org/10.1109/WACV57701.2024.00742
(3) DeepStar3D: https://doi.org/10.1038/s41592-025-02685-4
We agree with the reviewer that a benchmark against existing segmentation methods is very useful. This is addressed in the revised version, as detailed above (Figure 3).
Recommendations:
Please clarify the following point. In line 195, the authors state, "This allowed us to detect all mitotic nuclei in whole-mount samples for any stage and size." Does this mean that the custom-trained StarDist3D model can detect 100% of mitotic nuclei? It was not clear from the manuscript, figures, or videos how this was validated. Given the reported performance scores of the StarDist3D model for detecting all nuclei, claiming 100% detection of mitotic nuclei seems surprisingly high.
We thank the reviewer for this comment. As it was detailed in the methods section, the detection score reaches 82%, and only the complete pipeline (detection+minimal manual curation) allows us to detect all mitotic nuclei. To make it clearer, the following precisions were added in the Results section:
”To detect division events, we stained gastruloids with phosphohistone H3 (ph3) and trained a separate custom Stardist3D model using 3D annotations of nuclei expressing ph3 (see Methods III H). This model together allowed us to detect nearly all mitotic nuclei in whole-mount samples for any stage and size (Fig.3f and Suppl.Movie 4), and we used minimal manual curation to correct remaining errors.”
Minor corrections:
It appears that Figures 4-6 are missing from the submitted version, but they can be found in the manuscript available on bioRxiv.
We thank the reviewer for this remark, this was corrected immediately to add Figures 4 to 6.
In line 185, is the intended phrase "by comparing the 2D predictions and the 2D sliced annotated segments..."?
To gain some clarity, we replaced the initial sentence:
“The f1 score obtained by comparing the 3D prediction and the 3D ground-truth is well approximated by the f1 score obtained by comparing the 2D annotations and the 2D sliced annotated segments, with at most a 5% difference between the two scores.” by
“The f1 score obtained in 3D (3D prediction compared with the 3D ground-truth) is well approximated by the f1 score obtained in 2D (2D predictions compared with the 2D sliced annotated segments). The difference between the 2 scores was at most 5%.”
Reviewer #3 (Recommendations for the authors):
(1) How is the "local neighborhood volume" defined, and how was it computed?
The reviewer is referring to this paragraph (the term is underscored) :
“To probe quantities related to the tissue structure at multiple scales, we smooth their signal with a Gaussian kernel of width σ, with σ defined as the spatial scale of interest. From the segmented nuclei instances, we compute 3D fields of cell density (number of cells per unit volume), nuclear volume fraction (ratio of nuclear volume to local neighborhood volume), and nuclear volume at multiple scales.”
To improve clarity, the phrasing has been revised: the term local neighborhood volume has been replaced by local averaging volume, and a reference to the Methods section has been added.
From the segmented nuclei instances, we compute 3D fields of cell density (number of cells per unit volume), nuclear volume fraction (ratio of space occupied by nuclear volume within the local averaging volume, as defined in the Methods III I), and nuclear volume at multiple scales.
(2) In the definition of inertia tensor (18), isn't the inner part normally defined in the reversed way (delta_i,j - ...)?
We thank the reviewer for noticing this error, which we fixed in the manuscript.
(3) For intensity normalization, the paper uses the Hoechst signal density as a proxy for a ubiquitous nuclei signal. I would assume that this is problematic, for eg, dividing cells (which would overestimate it). Would using the average Hoechst signal per nucleus mask (as segmentation is available) be a better proxy?
We agree that this idea is appealing if one assumes a clear relationship between nuclear volume and Hoechst intensity. However, since cell and nuclear volumes vary substantially with differentiation state (see Fig. 4), such a normalization approach would introduce additional biases at large spatial scales. We believe that the most robust improvement would instead consist in masking dividing cells during the normalization procedure, as these events could be detected and excluded from the computation.
Nonetheless, we believe the method proposed by the reviewer could prove relevant for other types of data, so we will implement this recommendation in the code available in the Tapenade package.
(4) Figures 4-6 were part of the Supplementary Material, but should be included in the main text?
We thank the reviewer for this remark, this was corrected immediately to add Figures 4-6.
We also noticed a missing reference to Fig. S3 in the main text, so we added lines 302 to 307 to comment on the wavelength-dependency of the normalization method. We improved the description of Fig.6, which lacked clarity (line 316 to 321, line 327).
(1) Moos, F., Suppinger, S., de Medeiros, G., Oost, K.C., Boni, A., Rémy, C., Weevers, S.L., Tsiairis, C., Strnad, P. and Liberali, P., 2024. Open-top multisample dual-view light-sheet microscope for live imaging of large multicellular systems. Nature Methods, 21(5), pp.798-803.
(2) Ong, H. T.; Karatas, E.; Poquillon, T.; Grenci, G.; Furlan, A.; Dilasser, F.; Mohamad Raffi, S. B.; Blanc, D.; Drimaracci, E.; Mikec, D.; Galisot, G.; Johnson, B. A.; Liu, A. Z.; Thiel, C.; Ullrich, O.; OrgaRES Consortium; Racine, V.; Beghin, A. (2025). Digitalized organoids: integrated pipeline for high-speed 3D analysis of organoid structures using multilevel segmentation and cellular topology. Nature Methods, 22(6), pp.1343-1354
(3) Li, L., Wu, L., Chen, A., Delp, E.J. and Umulis, D.M., 2023. 3D nuclei segmentation for multi-cellular quantification of zebrafish embryos using NISNet3D. Electronic Imaging, 35, pp.1-9.
(4) Vanaret, J., Dupuis, V., Lenne, P. F., Richard, F., Tlili, S., & Roudot, P. (2023). A detector-independent quality score for cell segmentation without ground truth in 3D live fluorescence microscopy. IEEE Journal of Selected Topics in Quantum Electronics, 29(4:Biophotonics), 1-12.
(5) Dey, N., Abulnaga, M., Billot, B., Turk, E. A., Grant, E., Dalca, A. V., & Golland, P. (2024). AnyStar: Domain randomized universal star-convex 3D instance segmentation. In Proceedings of the IEEE/CVF Winter Conference on Applications of Computer Vision (pp. 7593-7603).
(6) Mukashyaka, P., Kumar, P., Mellert, D. J., Nicholas, S., Noorbakhsh, J., Brugiolo, M., ... & Chuang, J. H. (2023). High-throughput deconvolution of 3D organoid dynamics at cellular resolution for cancer pharmacology with Cellos. Nature Communications, 14(1), 8406.
(7) Rakhymzhan, A., Leben, R., Zimmermann, H., Günther, R., Mex, P., Reismann, D., ... & Niesner, R. A. (2017). Synergistic strategy for multicolor two-photon microscopy: application to the analysis of germinal center reactions in vivo. Scientific reports, 7(1), 7101.
(8) Dunsing, V., Petrich, A., & Chiantia, S. (2021). Multicolor fluorescence fluctuation spectroscopy in living cells via spectral detection. Elife, 10, e69687.
eLife Assessment
This important work compares the size of two brain areas, the amygdala and the hippocampus, across 12 species belonging to the Macaca genus. The authors find, using a convincing methodological approach, that amygdala - but not hippocampal - volume varies with social tolerance grade, with high tolerance species showing larger amygdala than low tolerance species of macaques. Interestingly, their findings also suggest an inverted developmental effect, with intolerant species showing an increase in amygdala volume across the lifespan, compared to tolerant species exhibiting the opposite trend. Overall, this paper offers new insights into the neural basis of social and emotional processing.
Reviewer #1 (Public review):
Summary:
This paper investigates the potential link between amygdala volume and social tolerance in multiple macaque species. Through a comparative lens, the authors considered tolerance grade, species, age, sex, and other factors that may contribute to differing brain volumes. They found that amygdala, but not hippocampal, volume differed across tolerance grades such that high-tolerance species showed larger amygdala than low-tolerance species of macaques. They also found that less tolerant species exhibited increases in amygdala volume with age, while more tolerant species showed the opposite. Given their wide range of species with varied biological and ecological factors, the authors' findings provide new, important evidence for changes in amygdala volume in relation to social tolerance grades. Contributions from these findings will greatly benefit future efforts in the field to characterize brain regions critical for social and emotional processing across species.
(1) This study demonstrates a concerted and impressive effort to comparatively examine neuroanatomical contributions to sociality in monkeys. The authors impressively collected samples from 12 macaque species with multiple datapoints across species age, sex, and ecological factors. Species from all four social tolerance grades were present. Further, the age range of the animals is noteworthy, particularly the inclusion of individuals over 20 years old.
(2) This work is the first to report neuroanatomical correlates of social tolerance grade in macaques in one coherent study. Given the prevalence of macaques as a model of social neuroscience, considerations of how socio-cognitive demands are impacted by the amygdala are highly important. The authors' findings will certainly inform future studies on this topic.
(3) The methodology and supplemental figures for acquiring brain MRI images are nicely detailed. Clear information on these parameters is crucial for future comparative interpretations of sociality and brain volume, and the authors do an excellent job of describing this process in full.
(4) The following comments were brought up during the review. In their revision, the authors have sufficiently addressed all of these comments by providing detailed responses and updating their manuscript. First, the revision clarified how much one could draw conclusions about "nature vs. nurture" from this study. Second, the revision also clarified the contributions of very young and very old animals in their correlations. Third, in their revision, the authors expanded on how their results could be interpreted in the context of multiple behavioral traits by Thierry (2021) by providing more detailed descriptions. Finally, during the revision, the authors clarified that both intolerant and tolerant species experience complex socio-cognitive demands and highlighted that socio-cognitive challenges arise across the tolerance spectrum under different behavioral demands.
Reviewer #2 (Public review):
Summary:
This comparative study of macaque species and type of social interaction is both ambitious and inevitably comes with a lot of caveats. The overall conclusion is that more intolerant species have a larger amygdala. There are also opposing development profiles regarding amygdala volume depending on whether it is a tolerant or intolerant species.
To achieve any sort of power they have combined data from 4 centres - that have all used different scanning methods and there are some resolution differences. The authors have also had to group species into 4 classifications - again to assist with any generalisations and power. They have focussed on the volumes of two structures, the amygdala and the hippocampus, which seems appropriate. Neither structure is homogeneous and so it may well be that a targeted focus on specific nuclei or subfields would help (the authors may well do this next) - but as the variables would only increase further along with the number of potential comparisons, alongside small group numbers, it seems only prudent to treat these findings are preliminary. That said, it is highly unlikely that large numbers of macaque brains will become available in the near future.
This introduction is by way of saying that the study achieves what it sets out to do, but there are many reasons to see this study as preliminary. The main message seems to be twofold: 1) that more intolerant species have relatively larger amygdalae, and 2) that with development there is an opposite pattern of volume change (increasing with age in intolerant sp and decreasing with age in tolerant species). Finding 1 is the opposite of that predicted in Table 1 - this is fine, but it should be made clearer in the Discussion that this is the case otherwise the reader may feel confused. As I read it, the authors have switched their prediction in the Discussion, which feels uncomfortable.
It is inevitable that the data in a study of this complexity are all too prone to post hoc considerations, to which the authors indulge. I suspect I would end up doing the same but it feels a bit like 'heads I win, tails you lose'. In the case of Grade 1 species, the individuals have a lot to learn especially if they are not top of the hierarchy, but at the same time there are fewer individuals in the troop, making predictions very tricky. As noted above, I am concerned by the seemingly opposite predictions in Table 1 and those in the Discussion regarding tolerance and amygdala volume. (It may be that the predictions in Table 1 are the opposite to how I read them, in which case the Table and preceding text needs to align.)
Comments on revisions:
I am happy with all of the revisions and the care shown by the authors.
Reviewer #3 (Public review):
Summary:
In this study, the authors were looking at neurocorrelates of behavioural differences within the genus Macaca. To do so, they engaged in real-world dissection of dead animals (unconnected to the present study) coming from a range of different institutions. They subsequently compare different brain areas, here the amygdala and the hippocampus, across species. Crucially, these species have been sorted according to different levels of social tolerance grades (from 1 to 4). 12 species are represented across 42 individuals. The sampling process has weaknesses ("only half" of the species contained by the genus, and Macaca mulatta, the rhesus macaque, representing 13 of the total number of individuals), but also strengths (the species are decently well represented across the 4 grades) for the given purpose and for the amount of work required here. I will not judge the dissection process as I am not a neuroanatomist, and I will assume that the different interventions do not alter volume in any significant ways / or that the different conditions in which the bodies were kept led to the documented differences across species.
There are two main results of the study. First, in line with their predictions, the authors find that more tolerant macaque species have larger amygdala, compared to the hippocampus that remains undifferentiated across species. Second, they also identify developmental effects, although with different trends: in tolerant species, the amygdala relative volume decreases across the lifespan, while in intolerant species, the contrary occurs. The modifications brought up between the two versions of the article have answered my remarks regarding age/grade/brain area differences.
As such, I think the results are holding strong, but maybe more work is needed with respect to interpretation.<br /> Classification of the social grade, as well as the issue of nature vs nurture have been addressed by the authors, I thank them for this.<br /> I still feel the integration of the amygdala as a common cognitive & emotional center could be possibly more pushed in the discussion, although I acknowledge that it would be complicated to do without knowing how the emotional and social lives of these animals impacted the growth of their amygdala...
Strengths:
Methods & breadth of species tested
Weaknesses:
Interpretations, which, although softened, could still be more integrated with the literature on emotion
Author response:
The following is the authors’ response to the original reviews.
Public Reviews:
Reviewer #1 (Public review):
We thank Reviewer #1 for its thoughtful and constructive feedback. We found the suggestions particularly helpful in refining the conceptual framework and clarifying key aspects of our interpretations.
Summary:
This paper investigates the potential link between amygdala volume and social tolerance in multiple macaque species. Through a comparative lens, the authors considered tolerance grade, species, age, sex, and other factors that may contribute to differing brain volumes. They found that amygdala, but not hippocampal, volume differed across tolerance grades, such that hightolerance species showed larger amygdala than low-tolerance species of macaques. They also found that less tolerant species exhibited increases in amygdala volume with age, while more tolerant species showed the opposite. Given their wide range of species with varied biological and ecological factors, the authors' findings provide new evidence for changes in amygdala volume in relation to social tolerance grades. Contributions from these findings will greatly benefit future efforts in the field to characterize brain regions critical for social and emotional processing across species.
Strengths:
(1) This study demonstrates a concerted and impressive effort to comparatively examine neuroanatomical contributions to sociality in monkeys. The authors impressively collected samples from 12 macaque species with multiple datapoints across species age, sex, and ecological factors. Species from all four social tolerance grades were present. Further, the age range of the animals is noteworthy, particularly the inclusion of individuals over 20 years old - an age that is rare in the wild but more common in captive settings.
(2) This work is the first to report neuroanatomical correlates of social tolerance grade in macaques in one coherent study. Given the prevalence of macaques as a model of social neuroscience, considerations of how socio-cognitive demands are impacted by the amygdala are highly important. The authors' findings will certainly inform future studies on this topic.
(3) The methodology and supplemental figures for acquiring brain MRI images are well detailed. Clear information on these parameters is crucial for future comparative interpretations of sociality and brain volume, and the authors do an excellent job of describing this process in full.
Weaknesses:
(1) The nature vs. nurture distinction is an important one, but it may be difficult to draw conclusions about "nature" in this case, given that only two data points (from grades 3 and 4) come from animals under one year of age (Method Figure 1D). Most brains were collected after substantial social exposure-typically post age 1 or 1.5-so the data may better reflect developmental changes due to early life experience rather than innate wiring. It might be helpful to frame the findings more clearly in terms of how early experiences shape development over time, rather than as a nature vs. nurture dichotomy.
We agree with the reviewer that presenting our findings through a strict nature vs. nurture dichotomy was potentially misleading. We have revised the introduction and the discussion (e.g. lines 85-95 and 363-365) to clarify that we examined how neurodevelopmental trajectories differ across social grades with the caveat of related to the absence of very young individuals in our samples. We now explicitly mention that our results may reflect both early species-typical biases and experience-dependent maturation.
We positioned our study on social tolerance in a comparative neuroscience framework and introduced a tentative working model that articulates behavioral traits, cognitive dimensions, and their potential subcortical neural substrates
Drawing upon 18 behavioral traits identified in Thierry’s comparative analyses (Thierry, 2021, 2007), we organize these traits into three core dimensions: socio-cognitive demands, behavioral inhibition, and the predictability of the social environment (Table 1). This conceptualization does not aim to redefine social tolerance itself, but rather to provide a structured basis for testing neuroanatomical hypotheses related to social style variability. It echoes recent efforts to bridge behavioral ecology and cognitive neuroscience by linking specific mental abilities – such as executive functions or metacognition – with distinct prefrontal regions shaped by social and ecological pressures (Bouret et al., 2024).
“Cross-fostering experiments (De Waal and Johanowicz, 1993), along with our own results, suggest that social tolerance grades reflect both early, possibly innate predispositions and later environmental shaping”.
(2) It would be valuable to clarify how the older individuals, especially those 20+ years old, may have influenced the observed age-related correlations (e.g., positive in grades 1-2, negative in grades 3-4). Since primates show well-documented signs of aging, some discussion of the potential contribution of advanced age to the results could strengthen the interpretation.
We thank the reviewer for highlighting this important point. In our dataset, younger and older subjects are underrepresented, but they are distributed across all subgroups. Therefore, we do not think that it could drive the interaction effect we are reporting. In our sample, amygdala volume tended to increase with age in intolerant species and decrease in tolerant species. We included a new analysis (Figure 4) that allows providing a clearer assessment of when social grades 1 vs 4 differed in terms of amygdala and hippocampus volume. While our model accounts for age continuously, we agree that age-related variation deserves cautious interpretation and require longitudinal designs in future studies.
We also added the following statements in the discussion (lines 386-391)
“Due to a limited sample size of our study, this crossing trend, already accounted for by our continuous age model, should be further investigated. These results call for cautious interpretation of age-related variation and further emphasize the importance of longitudinal studies integrating both behavioral, cognitive and anatomical data in non-human primates, which would help to better understand the link between social environment and brain development (Song et al., 2021)”.
(3) The authors categorize the behavioral traits previously described in Thierry (2021) into 3 selfdefined cognitive requirements, however, they do not discuss under what conditions specific traits were assigned to categories or justify why these cognitive requirements were chosen. It is not fully clear from Thierry (2021) alone how each trait would align with the authors' categories. Given that these traits/categories are drawn on for their neuroanatomical hypotheses, it is important that the authors clarify this. It would be helpful to include a table with all behavioral traits with their respective categories, and explain their reasoning for selecting each cognitive requirement category.
Thank you for this important suggestion. We have extensively revised the introduction to explain how we derived from the scientific literature the three cognitive dimensions—socio-cognitive demands, behavioral inhibition, and predictability of the social environment—. We now provide a complete overview of the 18 behavioral traits described in Thierry’s framework and their cognitive classification in a dedicated table , along with hypothesized neural correlates. We have also mentioned traits that were not classified in our framework along with short justification of this classification. We believe this addition significantly improves the transparency and intelligibility of our conceptual approach.
“The concept of social tolerance, central to this comparative approach, has sometimes been used in a vague or unidimensional way. As Bernard Thierry (2021) pointed out, the notion was initially constructed around variations in agonistic relationships – dominance, aggressiveness, appeasement or reconciliation behaviors – before being expanded to include affiliative behaviors, allomaternal care or male–male interactions (Thierry, 2021). These traits do not necessarily align along a single hierarchical axis but rather reflect a multidimensional complexity of social style, in which each trait may have co-evolved with others (Thierry, 2021, 2000; Thierry et al., 2004). Moreover, the lack of a standardized scientific definition has sometimes led to labeling species as “tolerant” or “intolerant” without explicit criteria (Gumert and Ho, 2008; Patzelt et al., 2014). These behavioral differences are characterized by different styles of dominance (Balasubramaniam et al., 2012), severity of agonistic interactions (Duboscq et al., 2014), nepotism (Berman and Thierry, 2010; Duboscq et al., 2013; Sueur et al., 2011) and submission signals (De Waal and Luttrell, 1985; Rincon et al., 2023), among the 18 covariant behavioral traits described in Thierry's classification of social tolerance (Thierry, 2021, 2017, 2000)”.
“To ground the investigation of social tolerance in a comparative neuroanatomical framework, we introduce a tentative working model that articulates behavioral traits, cognitive dimensions, and their potential subcortical neural substrates. Drawing upon 18 behavioral traits identified in Thierry’s comparative analyses (Thierry, 2021, 2007), we organized these traits into three core dimensions: socio-cognitive demands, behavioral inhibition, and the predictability of the social environment (Table 1). This conceptualization does not aim to redefine social tolerance itself, but rather to provide a structured basis for testing neuroanatomical hypotheses related to social style variability. It echoes recent efforts to bridge behavioral ecology and cognitive neuroscience by linking specific mental abilities – such as executive functions or metacognition – with distinct prefrontal regions shaped by social and ecological pressures (Bouret et al., 2024; Testard 2022)”.
(4) One of the main distinctions the authors make between high social tolerance species and low tolerance species is the level of complex socio-cognitive demands, with more tolerant species experiencing the highest demands. However, socio-cognitive demands can also be very complex for less tolerant species because they need to strategically balance behaviors in the presence of others. The relationships between socio-cognitive demands and social tolerance grades should be viewed in a more nuanced and context-specific manner.
We fully agree and we did not mean that intolerant species lives in a ‘simple’ social environment but that the ones of more tolerant species is markedly more demanding. Evidence supporting this statement include their more efficient social networks (Sueur et al., 2011) and more complex communicative skills (e.g. tolerant macaques displayed higher levels of vocal diversity and flexibility than intolerant macaques in social situation with high uncertainty (Rebout et al., 2020).
In the revised version (lines 106-122), we now highlight that socio-cognitive challenges arise across the tolerance spectrum, including in less tolerant species where strategic navigation of rigid hierarchies and risk-prone interactions is required. We hope that this addition offers a more balanced and nuanced framing of socio-cognitive demands across macaque societies
“The first category, socio-cognitive demands, refers to the cognitive resources needed to process, monitor, and flexibly adapt to complex social environments. Linking those parameters to neurological data is at the core of the social brain theory to explain the expansion of the neocortex in primates (Dunbar). Macaques social systems require advanced abilities in social memory, perspective-taking, and partner evaluation (Freeberg et al., 2012). This is particularly true in tolerant species, where the increased frequency and diversity of interactions may amplify the demands on cognitive tracking and flexibility. Tolerant macaque species typically live in larger groups with high interaction frequencies, low nepotism, and a wider range of affiliative and cooperative behaviors, including reconciliation, coalition-building, and signal flexibility (REF). Tolerant macaque species also exhibit a more diverse and flexible vocal and facial repertoire than intolerants ones which may help reduce ambiguity and facilitate coordination in dense social networks (Rincon et al., 2023; Scopa and Palagi, 2016; Rebout 2020). Experimental studies further show that macaques can use facial expressions to anticipate the likely outcomes of social interactions, suggesting a predictive function of facial signals in managing uncertainty (Micheletta et al., 2012; Waller et al., 2016). Even within less tolerant species, like M. mulatta, individual variation in facial expressivity has been linked to increased centrality in social networks and greater group cohesion, pointing to the adaptive value of expressive signaling across social styles (Whitehouse et al., 2024)”.
(5) While the limitations section touches on species-related considerations, the issue of individual variability within species remains important. Given that amygdala volume can be influenced by factors such as social rank and broader life experience, it might be useful to further emphasize that these factors could introduce meaningful variation across individuals. This doesn't detract from the current findings but highlights the importance of considering life history and context when interpreting subcortical volumes-particularly in future studies.
We have now emphasized this point in the limitations section (lines 441-456). While our current dataset does not allow us to fully control for individual-level variables across all collection centers, we recognize that factors such as rank, social exposure, and individual life history may influence subcortical volumes
“Although we explained some interspecies variability, adding subjects to our database will increase statistical power and will help addressing potential confounding factors such as age or sex in future studies. One will benefit from additional information about each subject. While considered in our modelling, the social living and husbandry conditions of the individuals in our dataset remain poorly documented. The living environment has been considered, and the size of social groups for certain individuals, particularly for individuals from the CdP, have been recorded. However, these social characteristics have not been determined for all individuals in the dataset. As previously stated, the social environment has a significant impact on the volumetry of certain regions. Furthermore, there is a lack of data regarding the hierarchy of the subjects under study and the stress they experience in accordance with their hierarchical rank and predictability of social outcomes position (McCowan et al., 2022)”.
Reviewer #2 (Public review):
We thank Reviewer #2 for its thoughtful remarks and for acknowledging the value of our comparative approach despite its inherent constraints.
Summary:
This comparative study of macaque species and the type of social interaction is both ambitious and inevitably comes with a lot of caveats. The overall conclusion is that more intolerant species have a larger amygdala. There are also opposing development profiles regarding amygdala volume depending on whether it is a tolerant or intolerant species.
To achieve any sort of power, they have combined data from 4 centres, which have all used different scanning methods, and there are some resolution differences. The authors have also had to group species into 4 classifications - again to assist with any generalisations and power. They have focused on the volumes of two structures, the amygdala and the hippocampus, which seems appropriate. Neither structure is homogeneous and so it may well be that a targeted focus on specific nuclei or subfields would help (the authors may well do this next) - but as the variables would only increase further along with the number of potential comparisons, alongside small group numbers, it seems only prudent to treat these findings are preliminary. That said, it is highly unlikely that large numbers of macaque brains will become available in the near future.
This introduction is by way of saying that the study achieves what it sets out to do, but there are many reasons to see this study as preliminary. The main message seems to be twofold: (1) that more intolerant species have relatively larger amygdalae, and (2) that with development, there is an opposite pattern of volume change (increasing with age in intolerant species and decreasing with age in tolerant species). Finding 1 is the opposite of that predicted in Table 1 - this is fine, but it should be made clearer in the Discussion that this is the case, otherwise the reader may feel confused. As I read it, the authors have switched their prediction in the Discussion, which feels uncomfortable.
We thank the reviewer for this important observation. In the original version, Table 1 presented simplified direct predictions linking social tolerance grades to amygdala and hippocampus volumes. We recognize that this formulation may have created confusion In the revised manuscript, we have thoroughly restructured the table and its accompanying rationale. Table 1 now better reflects our conceptual framework grounded in three cognitive dimensions—sociocognitive demands, behavioral inhibition, and social predictability—each linked to behavioral traits and associated neural hypotheses based on published literature. This updated framework, detailed in lines 144-169 of the introduction, provides a more nuanced basis for interpreting our results and avoids the inconsistencies previously noted. The Discussion was also revised accordingly (lines 329-255) to clarify where our findings diverge from the original predictions and to explore alternative explanations based on social complexity. Rather than directly predicting amygdala size from social tolerance grades, we propose that variation in volume emerges from differing combinations of cognitive pressures across species.
It is inevitable that the data in a study of this complexity are all too prone to post hoc considerations, to which the authors indulge. In the case of Grade 1 species, the individuals have a lot to learn, especially if they are not top of the hierarchy, but at the same time, there are fewer individuals in the troop, making predictions very tricky. As noted above, I am concerned by the seemingly opposite predictions in Table 1 and those in the Discussion regarding tolerance and amygdala volume. (It may be that the predictions in Table 1 are the opposite of how I read them, in which case the Table and preceding text need to align.)
In order to facilitate the interpretation of our Bayesian modelling, we have selected a more focused ROI in our automatic segmentation procedure of the Hippocampus (from Hippocampal Formation to Hippocampus) and have added to the new analysis (Figure 4) that helps to properly test whether the hippocampus significantly differs between species from social grade 1 vs 4. The present analysis found that this is the case in adult monkeys. This is therefore consistent with our hypothesis that amygdala volumes are principally explained by heightened sociocognitive demands in more tolerant species.
We also acknowledge the reviewer’s concerns about the limited generalizability due to our sample. The challenges of comparative neuroimaging in non-human primates—especially when using post-mortem datasets—are substantial. Given the ethical constraints and the rarity of available specimens, increasing the number of individuals or species is not feasible in the short term. However, we have made all data and code publicly available and clearly stated the limitations of our sample in the manuscript. Despite these constraints, we believe our dataset offers an unprecedented comparative perspective, particularly due to the inclusion of rare and tolerant species such as M. tonkeana, M. nigra, and M. thibetana, which have never been included in structural MRI studies before. We hope this effort will serve as a foundation for future collaborative initiatives in primate comparative neuroscience.
Reviewer #3 (Public review):
We thank Reviewer #3 for their thoughtful and detailed review. Their comments helped us refine both the conceptual and interpretative aspects of the manuscript. We respond point by point below.
Summary:
In this study, the authors were looking at neurocorrelates of behavioural differences within the genus Macaca. To do so, they engaged in real-world dissection of dead animals (unconnected to the present study) coming from a range of different institutions. They subsequently compare different brain areas, here the amygdala and the hippocampus, across species. Crucially, these species have been sorted according to different levels of social tolerance grades (from 1 to 4). 12 species are represented across 42 individuals. The sampling process has weaknesses ("only half" of the species contained by the genus, and Macaca mulatta, the rhesus macaque, representing 13 of the total number of individuals), but also strengths (the species are decently well represented across the 4 grades) for the given purpose and for the amount of work required here. I will not judge the dissection process as I am not a neuroanatomist, and I will assume that the different interventions do not alter volume in any significant ways / or that the different conditions in which the bodies were kept led to the documented differences across species.
25 brains were extracted by the authors themselves who are highly with this procedure. Overall, we believe that dissection protocols did not alter the total brain volume. Despite our expertise, we experienced some difficulties to not damage the cerebellum. Therefore, this region was not included in our analysis. We also noted that this brain region was also damaged or absent from the Prime-DE dataset.
Several protocols were used to prepare and store tissue. It could have impacted the total brain volume.
We agree that differences in tissue preparation and storage could potentially affect total brain volume. Therefore, we explicitly included the main sample preparation variable — whether brains had been previously frozen — as a covariate in our model. This factor did not explain our results. Moreover, Figures 1D and 1I display the frozen status and its correlation with the amygdala and hippocampus ratios, respectively. Figure 2 shows the parameters of the model and the posterior distributions for the frozen status and total brain volume effects.
There are two main results of the study. First, in line with their predictions, the authors find that more tolerant macaque species have larger amygdala, compared to the hippocampus, which remains undifferentiated across species. Second, they also identify developmental effects, although with different trends: in tolerant species, the amygdala relative volume decreases across the lifespan, while in intolerant species, the contrary occurs. The results look quite strong, although the authors could bring up some more clarity in their replies regarding the data they are working with. From one figure to the other, we switch from model-calculated ratio to modelpredicted volume. Note that if one was to sample a brain at age 20 in all the grades according to the model-predicted volumes, it would not seem that the difference for amygdala would differ much across grades, mostly driven with Grade 1 being smaller (in line with the main result), but then with Grade 2 bigger than Grade 3, and then Grade 4 bigger once again, but not that different from Grade 2.
Overall, despite this, I think the results are pretty strong, the correlations are not to be contested, but I also wonder about their real meaning and implications. This can be seen under 3 possible aspects:
(1) Classification of the social grade
While it may be familiar to readers of Thierry and collaborators, or to researchers of the macaque world, there is no list included of the 18 behavioral traits used to define the three main cognitive requirements (socio-cognitive demands, predictability of the environment, inhibitory control). It would be important to know which of the different traits correspond to what, whether they overlap, and crucially, how they are realized in the 12 study species, as there could be drastic differences from one species to the next. For now, we can only see from Table S1 where the species align to, but it would be a good addition to have them individually matched to, if not the 18 behavioral traits, at least the 3 different broad categories of cognitive requirements.
We fully agree with this observation. In the revised version of the manuscript, we now include a detailed conceptual table listing all 18 behavioral traits from Thierry’s framework. For each trait, we provide its underlying social implications, its associated cognitive dimension (when applicable), and the hypothesized neural correlate.
While some traits may could have been arguably classified in several cognitive dimensions (e.g. reconciliation rate), we preferred to assign each to a unique dimension for clarity. Additionally, the introduction (lines 95-169 + Table1) now explains how each trait was evaluated based on existing literature and assigned to one of the three proposed cognitive categories: socio-cognitive demands, behavioral inhibition, or social unpredictability. This structure offers a clearer and more transparent basis for the neuroanatomical hypotheses tested in the study.
“Navigating social life in primate societies requires substantial cognitive resources: individuals must not only track multiple relationships, but also regulate their own behavior, anticipate others’ reactions, and adapt flexibly to changing social contexts. Taken advantage of databases of magnetic resonance imaging (MRI) structural scans, we conducted the first comparative study integrating neuroanatomical data and social behavioral data from closely related primate species of the same genus to address the following questions: To what extent can differences in volumes of subcortical brain structures be correlated with varying degrees of social tolerance? Additionally, we explored whether these dispositions reflect primarily innate features, shaped by evolutionary processes, or acquired through socialization within more or less tolerant social environments”.
“The first category, socio-cognitive demands, refers to the cognitive resources needed to process, monitor, and flexibly adapt to complex social environments. Linking those parameters to neurological data is at the core of the social brain theory to explain the expansion of the neocortex in primates (Dunbar). Macaques social systems require advanced abilities in social memory, perspective-taking, and partner evaluation (Freeberg et al., 2012). This is particularly true in tolerant species, where the increased frequency and diversity of interactions may amplify the demands on cognitive tracking and flexibility. Tolerant macaque species typically live in larger groups with high interaction frequencies, low nepotism, and a wider range of affiliative and cooperative behaviors, including reconciliation, coalition-building, and signal flexibility (REF). Tolerant macaque species also exhibit a more diverse and flexible vocal and facial repertoire than intolerants ones which may help reduce ambiguity and facilitate coordination in dense social networks (Rincon et al., 2023; Scopa and Palagi, 2016; Rebout 2020). Experimental studies further show that macaques can use facial expressions to anticipate the likely outcomes of social interactions, suggesting a predictive function of facial signals in managing uncertainty (Micheletta et al., 2012; Waller et al., 2016). Even within less tolerant species, like M. mulatta, individual variation in facial expressivity has been linked to increased centrality in social networks and greater group cohesion, pointing to the adaptive value of expressive signaling across social styles (Whitehouse et al., 2024)”.
“The second category, inhibitory control, includes traits that involve regulating impulsivity, aggression, or inappropriate responses during social interactions. Tolerant macaques have been shown to perform better in tasks requiring behavioral inhibition and also express lower aggression and emotional reactivity in both experimental and natural contexts (Joly et al., 2017; Loyant et al., 2023). These features point to stronger self-regulation capacities in species with egalitarian or less rigid hierarchies. More broadly, inhibition – especially in its strategic form (self-control) – has been proposed to play a key role in the cohesion of stable social groups. Comparative analyses across mammals suggest that this capacity has evolved primarily in anthropoid primates, where social bonds require individuals to suppress immediate impulses in favour of longer-term group stability (Dunbar and Shultz, 2025). This view echoes the conjecture of Passingham and Wise (2012), who proposed that the emergence of prefrontal area BA10 in anthropoids enabled the kind of behavioural flexibility needed to navigate complex social environments (Passingham et al., 2012)”.
“The third category, social environment predictability, reflects how structured and foreseeable social interactions are within a given society. In tolerant species, social interactions are more fluid and less kin-biased, leading to greater contextual variation and role flexibility, which likely imply a sustained level of social awareness. In fact, as suggested by recent research, such social uncertainty and prolonged incentives are reflected by stress-related physiology : tolerant macaques such as M. tonkeana display higher basal cortisol levels, which may be indicative of a chronic mobilization of attentional and regulatory resources to navigate less predictable social environments (Sadoughi et al., 2021)”.
“Each behavioral trait was individually evaluated based on existing empirical literature regarding the types of cognitive operations it likely involves. When a primary cognitive dimension could be identified, the trait was assigned accordingly. However, some behaviors – such as maternal protection, allomaternal care, or delayed male dispersal – do not map neatly onto a single cognitive process. These traits likely emerge from complex configurations of affective and socialmotivational systems, and may be better understood through frameworks such as attachment theory (Suomi, 2008), which emphasizes the integration of social bonding, emotional regulation, and contextual plasticity. While these dimensions fall beyond the scope of the present framework, they offer promising directions for future research, particularly in relation to the hypothalamic and limbic substrates of social and reproductive behavior”.
“Rather than forcing these traits into potentially misleading categories, we chose to leave them unclassified within our current cognitive framework. This decision reflects both a commitment to conceptual clarity and the recognition that some behaviors emerge from a convergence of cognitive demands that cannot be neatly isolated. This tripartite framework, leaving aside reproductive-related traits, provides a structured lens through which to link behavioral diversity to specific cognitive processes and generate neuroanatomical predictions”.
(2) Issue of nature vs nurture
Another way to look at the debate between nature vs nurture is to look at phylogeny. For now, there is no phylogenetic tree that shows where the different grades are realized. For example, it would be illuminating to know whether more related species, independently of grades, have similar amygdala or hippocampus sizes. Then the question will go to the details, and whether the grades are realized in particular phylogenetic subdivisions. This would go in line with the general point of the authors that there could be general species differences.
As pointed out by Thierry and collaborators, the social tolerance concept is already grounded in a phylogenetic framework as social tolerance matches the phylogenetical tree of these macaque species, suggesting a biological ground of these behavioral observations. Given the modest sample size and uneven species representation, we opted not to adopt tools such as Phylogenetic Generalized Least Squares (PGLS) in our analysis. Our primary aim in this study was to explore neuroanatomical variation as a function of social traits, not to perform a phylogenetic comparative analysis per see. That said, we now explicitly acknowledge this limitation in the Discussion and indicate that future work using larger datasets and phylogenetic methods will be essential to disentangle social effects from evolutionary relatedness. We hope that making our dataset openly available will facilitate such futures analyses.
With respect to nurture, it is likely more complicated: one needs to take into account the idiosyncrasies of the life of the individual. For example, some of the cited literature in humans or macaques suggests that the bigger the social network, the bigger the brain structure considered. Right, but this finding is at the individual level with a documented life history. Do we have any of this information for any of the individuals considered (this is likely out of the scope of this paper to look at this, especially for individuals that did not originate from CdP)?
We appreciate this insightful observation. Indeed, findings from studies in humans and nonhuman primates showing associations between brain structure and social network size typically rely on detailed life history and behavioral data at the individual level. Unfortunately, such finegrained information was not consistently available across our entire sample. While some individuals from the Centre de Primatologie (CdP) were housed in known group compositions and social settings, we did not have access to longitudinal social data—such as rank, grooming rates, or network centrality—that would allow for robust individual-level analyses. We now acknowledge this limitation more clearly in the Discussion (lines 436-443), and we fully agree that future work combining neuroimaging with systematic behavioral monitoring will be necessary to explore how species-level effects interact with individual social experience.
(3) Issue of the discussion of the amygdala's function
The entire discussion/goal of the paper, states that the amygdala is connected to social life. Yet, before being a "social center", the amygdala has been connected to the emotional life of humans and non-humans alike. The authors state L333/34 that "These findings challenge conventional expectations of the amygdala's primary involvement in emotional processes and highlight the complexity of the amygdala's role in social cognition". First, there is no dichotomy between social cognition and emotion. Emotion is part of social cognition (unless we and macaques are robots). Second, there is nowhere in the paper a demonstration that the differences highlighted here are connected to social cognition differences per se. For example, the authors have not tested, say, if grade 4 species are more afraid of snakes than grade 1 species. If so, one could predict they would also have a bigger amygdala, and they would probably also find it in the model. My point is not that the authors should try to correlate any kind of potential aspect that has been connected to the amygdala in the literature with their data (see for example the nice review by DomínguezBorràs and Vuilleumier, https://doi.org/10.1016/B978-0-12-823493-8.00015-8), but they should refrain from saying they have challenged a particular aspect if they have not even tested it. I would rather engage the authors to try and discuss the amygdala as a multipurpose center, that includes social cognition and emotion.
We thank the reviewer for this important and nuanced point. We have revised the manuscript to adopt a more cautious and integrative tone regarding the function of the amygdala. In the revised Discussion (lines 341-355), we now explicitly state that the amygdala is involved in a broad range of processes—emotional, social, and affective—and that these domains are deeply intertwined. Rather than proposing a strict dissociation, we now suggest that the amygdala supports integrated socio-emotional functions that are mobilized differently across social tolerance styles. We also cite recent relevant literature (e.g., Domínguez-Borràs & Vuilleumier, 2021) to support this view and have removed any claim suggesting we challenge the emotional function of the amygdala per se. Our aim is to contribute to a richer understanding of how affective and social processes co-construct structural variation in this region.
Strengths:
Methods & breadth of species tested.
Weaknesses:
Interpretation, which can be described as 'oriented' and should rather offer additional views.
Recommendations for the authors:
Reviewer #1 (Recommendations for the authors):
Private Comments:
(1) Table 1 should be formatted for clarity i.e., bolded table headers, text realignment, and spacing. It was not clear at first glance how information was organized. It may also be helpful to place behavioral traits as the first column, seeing that these traits feed into the author's defined cognitive requirements.
We have reformatted Table 1 to improve clarity and readability. Behavioral traits now appear in the first column, followed by cognitive dimensions and hypothesized neural correlates. Column headers have been bolded and alignment has been standardized.
(2) Figures could include more detail to help with interpretations. For example, Figure 3 should define values included on the x-axis in the figure caption, and Figure 4 should explain the use of line, light color, and dark color. Figure 1 does not have a y-axis title.
The figures have been revised and legends completed to ensure more clarity.
(3) Please proofread for typos throughout.
The manuscript has been carefully proofread, and all typographical and grammatical errors have been corrected. These changes are visible in the tracked version.
Reviewer #2 (Recommendations for the authors):
Specific comments:
(1) Given all of the variability would it not be a good idea to just compare (eg in the supplemental) the macaque data from just the Strasbourg centre for m mulatta and m toneanna. I appreciate the ns will be lower, but other matters are more standardized.
We fully understand the reviewer’s suggestion to restrict the comparison to data collected at a single site in order to minimize inter-site variability. However, as noted, such an analysis would come at the cost of statistical power, as the number of individuals per species within a single center is small. For example, while M. tonkeana is well represented at the Strasbourg centre, only one individual of M. mulatta is available from the same site. Thus, a restricted comparison would severely limit the interpretability of results, particularly for age-related trajectories. To address variability, we included acquisition site and brain preservation method as covariates or predictors where appropriate, and we have been cautious in our interpretations. We also now emphasize in the Methods and Discussion the value of future datasets with more standardized acquisition protocols across species and centers. We hope that by openly sharing our data and workflow, we can contribute to this broader goal.
(2) I have various minor edits:
(a) L 25 abstract - Specify what is meant by 'opposite trend'; the reader cannot infer what this is.
Modified in line 25-28: “Unexpectedly, tolerant species exhibited a decrease in relative amygdala volume across the lifespan, contrasting with the age-related increase observed in intolerant species—a developmental pattern previously undescribed in primates.”
(b) L67 - The reference 'Manyprimates' needs fixing as it does in the references section.
After double checking, Manyprimates studies are international collaborative efforts that are supposed to be cite this way (https://manyprimates.github.io/#pubs).
(c) L74 - Taking not Taken.
This typo has been corrected.
(d) L129 - It says 'total volume', but this is corrected total volume?
We have clarified in the figures legends that the “total brain volume” used in our analyses excludes the cerebellum and the myelencephalon, as specified in our image preprocessing protocol. This ensures consistency across individuals and institutions.
(e) L138 - Suddenly mentions 'frozen condition' without any prior explanation - this needs explaining in the legend - also L144.
We have added an explanation of the ‘frozen condition’ variable in in the relevant figure legend.
(f) L166 - Results - it would be helpful to remind readers what Grade 1 signifies, ie intolerant species.
We now include a brief reminder in the Results section that Grade 1 corresponds to socially intolerant species, to help readers unfamiliar with the classification (Lines 240-251).
(g)Figure 4 - Provide the ns for each of the 4 grades to help appreciate the meaningfulness of the curves, etc.
The number of subjects has been added to the Figure and a novel analysis helps in the revised ms help to appreciate the meaningfulness of some of these curves.
(h) L235 - 'we had assumed that species of high social tolerance grade would have presented a smaller amygdala in size compared to grade 1'. But surely this is the exact opposite of what is predicted in Table 1 - ie, the authors did not predict this as I read the paper (Unless Table l is misleading/ambiguous and needs clarification).
As discussed in our response to Reviewer #2 and #3, we have restructured both Table 1 and the Discussion to ensure consistency. We now explicitly state that the findings diverge from our initial inhibitory-control-based prediction and propose alternative interpretations based on sociocognitive demands.
(i) L270 - 'This observation' which?? Specify.
We have replaced ‘this observation’ with a precise reference to the observed developmental decrease in amygdala volume in tolerant species.
(j) L327 - 'groundbreaking' is just hype given that there are so many caveats - I personally do not like the word - novel is good enough.
We have replaced the word ‘groundbreaking’ with ‘novel’ to adopt a more measured and appropriate tone in the discussion.
(3) I might add that I am happy with the ethics regarding this study.
Thanks, we are also happy that we were able to study macaque brains from different species using opportunistic samplings along with already available data. We are collectively making progress on this!
(4) Finally, I should commend the authors on all the additional information that they provide re gender/age/species. Given that there are 2xs are many females as males, it would be good to know if this affects the findings. I am not a primatologist, so I don't know, for example, if the females in Grade 1 monkeys are just as intolerant as the males?
We thank the reviewer for this thoughtful comment. We now explicitly mention the female-biased sex ratio in the Methods section and report in the Results (Figure 2, Figure 3) that sex was included as a covariate in our Bayesian models. While a small effect of sex was found for hippocampal volume, no effect was observed for the amygdala. Given the strong imbalance in our dataset (2:1 female-to-male ratio), we refrained from drawing any conclusion about sex-specific patterns, as these would require larger and more balanced samples. Although we did not test for sex-by-grade interactions, we agree that this question—especially regarding whether females and males express social style differences similarly across grades—represents an important direction for future comparative work.
Reviewer #3 (Recommendations for the authors):
I found the article well-written, and very easy to follow, so I have little ways to propose improvements to the article to the authors, besides addressing the various major points when it comes to interpretation of the data.
One list I found myself wanting was in fact the list of the social tolerance grades, and the process by which they got selected into 3 main bags of socio-cognitive skills. Then it would become interesting to see how each of the 12 species compares within both the 18 grades (maybe once again out of the scope of this paper, there are likely reviews out there that already do that, but then the authors should explicitly mention so in the paper: X, 19XX have compared 15 out of 18 traits in YY number of macaque species); and within the 3 major subcognitive requirements delineated by the authors, maybe as an annex?
We thank the reviewer for this thoughtful suggestion. In the revised manuscript, we now include a detailed table (Table 1) that lists the 18 behavioral traits derived from Thierry’s framework, along with their associated cognitive dimension and hypothesized neuroanatomical correlate. While we did not create a matrix mapping each of the 12 species across all 18 traits due to space and data availability constraints, we agree this is an important direction that should be tackled by primatologist. We now include a sentence (line 87-90) in the manuscript to guide readers to previous comparative reviews (e.g., Thierry, 2000; Thierry et al., 2004, 2021) that document the expression of these traits across macaque species. We also clarify that our three cognitive categories are conceptual tools intended to structure neuroanatomical predictions, and not formal clusters derived from quantitative analyses.
In the annex, it would also be good to have a general summarizing excel/R file for the raw data, with important information like age, sex, and the relevant calculated volumes for each individual. The folders available following the links do not make it an easy task for a reader to find the raw data in one place.
We fully agree with the reviewer on the importance of data accessibility. We have now uploaded an additional supplementary file in .csv format on our OSF repository, which includes individuallevel metadata for all 42 macaques: species, sex, age, social grade, total brain volume, amygdala volume, and hippocampus volume. The link to this file is now explicitly mentioned in the Data Availability section. We hope this will facilitate comparisons with other datasets and improve usability for the community. In addition, we provide in a supplementary table the raw data that were used for our Bayesian modelling (see below).
The availability of the raw data would also clear up one issue, which I believe results from the modelling process: it looks odd on Figure 2, that volume ratios, defined as the given brain area volume divided by the total brain volume, give values above 1 (especially for the hippocampus). As such, the authors should either modify the legend or the figure. In general, it would be nicer to have the "real values" somewhere easily accessible, so that they can be compared more broadly with: 1) other macaques species to address questions relevant to the species; 2) other primates to address other questions that are surely going to arise from this very interesting work!
We thank the reviewer for pointing this out. The ratio values in Figure 1 correspond to the proportion of the regional volume (amygdala or hippocampus) relative to the total brain volume, excluding the cerebellum and myelencephalon. As such, values above 0.01 (i.e., above 1% of the brain volume) are expected for these structures and do not indicate an error. We have updated the figure legend to clarify this point explicitly. In addition, we have now made a cleaned .csv file available via OSF, containing all raw volumetric data and metadata in a format that facilitates cross-species or cross-study comparisons. This replaces the previous folder-based structure, which may have been less accessible.
Typos:
L233: delete 'in'
L430: insert space in 'NMT template(Jung et al., 2021).'
Examples of Bots
The section on antagonistic bots was especially interesting to me. It’s concerning how bots can create the illusion of mass support or backlash, even when most real users don’t feel that strongly. This makes me think that bots don’t just add noise, but can actually change how people interpret public opinion.
But it is the integrated part of humanity that will ultimately control the Universe. Unintegrated humanity will not be able to compete with the integrated part. This becomes especially clear when we realize that the whole Cosmos, not the planet Earth, will be the battlefield. No cosmic role for the human race is possible without integration. The units that take decisions must be rewarded for those decisions, otherwise they will never take them. Can we imagine "human plankton" crowded in rockets in order to reach a distant star in ten, twenty or fifty generations? Only integrated immortal creatures can conquer the outer space.
CEStoicism believes that certain cultural P-individuals with high fitness will be better competitors for survival, although expanding off Earth is not a priority.
Note that sometimes people use “bots” to mean inauthentically run accounts, such as those run by actual humans, but are paid to post things like advertisements or political content. We will not consider those to be bots, since they aren’t run by a computer. Though we might consider these to be run by “human computers” who are following the instructions given to them, such as in a click farm:
I feel like this could be very problematic as in our current society theres already a lot of trouble with differentiating between bots and ai etc. and if people are also acting as bots then no one will be able to understand whats real on social media and what isn't real.
Last, do not post unrelated ideas; for example, if you are asked about the main idea of a text you read, make sure to read the text, and respond by giving what you think is the main idea, not by posting that you liked the text because of a personal experience you had. It isn’t wrong to include personal content, but be sure to answer the instructor’s questions first to earn full credit.
Pull the main ideas, not personal statements1`
On October 17, 1931, gangster Al Capone is convicted of tax evasion, signaling the downfall of one of the most notorious criminals of the 1920s and 1930s. He was later sentenced to 11 years in federal prison and fined $50,000.
This is the same day as my birthday but 77 years earlier. I think criminals are interesting and how they stay up so long without getting caught.
This proto-cuneiform tablet from Uruk includes signs forsheep and the goddess Inanna, but its meaning is unclear.
Potentially an early historic form of a receipt?
Datesafter ca. 1400 BCE are fairly reliable and uncontroversial (the morerecent, the less controversial). For dates before 1500 BCE, however, adebate revolves around the Middle Chronology. Some scholars proposelower dates (from eight years to as much as a century later). But until aconsensus is reached, it seems best to use the dates that are familiar, ifprobably wrong.
Intense maternal stress, such as exposure to HurricaneKatrina, is associated with low birth weight (,2.5 kg) (51).However, these effects are independent of maternal mentalhealth, further underscoring the distinct influences of spe-cific forms of maternal adversity. An extensive review (52)reveals an influence of severe stress (e.g., death of a spouse) onoffspring birth weight, as well as of factors such as socialsupport that moderate the impact of stress, but no consistentevidence for the influence of maternal anxiety or depression(also see reference 53). The exceptions are studies showingan association between “pregnancy-associated anxiety” andbirth outcomes, which again underscores the specificity ofdifferent forms of maternal “adversity.”
Lack of specificity of 'maternal adversity' make its effects difficult to measure. Hurricane Katrina is associated with low birth weight. Shows how non mental health related stress can also contributed to 'maternal adversity'. The term covers a broad amount of stressors.
Severe stress such as the death of a spouse and other factors like social support (moderates stress) influences birth weight. However, maternal anxiety and depression do not consistently show evidence of influence on birth weight. The exceptions are pregnancy-associated anxiety and birth outcomes; this further supports the importance of specificity of different forms of maternal "adversity".
continued importance of accurately characterizing the exposure-response relationship
Ich würde das als topic sentence von einem Absatz erwarten. Jedenfalls verstehe ich das als die zentrale message dieses Absatzes. Evtl. könnte ein Abschnitt auch so beginnen: "It is therefore essential to continue to accurately characterize the exposure-response relationship..."
Oder wenn man es kombinieren will und direkt noch die "nicht ausreichend gute" aktuelle Studienlage miteinbeziehen möchte, könnte der topic sentence auch lauten:
"It is essential to continue to accurately characterize the [Pb-IQ ERF] not only because of [these detrimental effects] but also because of substantive criticism concerning the existing evidence base.
AF overpredicted the dimer conformation substantially
It seems pertinent to establish why the dimer conformation is predicted in XCL1. It would be valuable to run a structural alignment of both XCL1 conformations against the AF2/3 training dataset.
This would reveal several things. First, which XCL1 conformations are in the training dataset, if any? Either being present would be considered data leakage. And second, how many hits correspond to each of the conformations?
My hypothesis is that either (a) the XCL1 dimer is present in the training dataset and the chemokine isn't, or (b) neither/both are present, but the dimer yields significantly more hits, creating a dimer preference for XCL1 and all of its derived "ancestors".
Depending on the dataset size (I forget how much clustering the AF folks did), the alignment could be feasibly conducted using TMAlign. Otherwise, foldseek or other scalable aligners would work.
In fact, researchers must decide how to exercise their power based on inconsistent and overlapping rules, laws, and norms. This combination of powerful capabilities and vague guidelines can force even well-meaning researchers to grapple with difficult decisions.
Should it be researchers who solely must decide this? I feel as though that not only puts a lot of responsibility onto individuals alone but also leaves potentially detrimental ambiguity across social research. I know many research studies must receive approval via the IRB to ensure responsible conduct, so this phrasing seems a little flawed
But when Blumenstock and colleagues aggregated their estimates to Rwanda’s 30 districts, they found that their estimates were very similar to estimates from the Demographic and Health Survey, which is widely considered to be the gold standard of surveys in developing countries. Although these two approaches produced similar estimates in this case, the approach of Blumenstock and colleagues was about 10 times faster and 50 times cheaper than the traditional Demographic and Health Surveys.
I wonder where the discrepancies lied, as I am sure there were some valuable differences between Blumenstock's aggregate estimates and that of the Demographic and Health Survey's. Additionally, I wonder about the extent to which the results of this machine learning model approach would be successful in other countries or via a different means of database. This first section really highlights how how incredibly nuanced the implications of Machine Learning are
URL Format: When including a URL, copy it in full from your browser, but omit any query strings when possible (for example: http://www.mla.org/search/?query=pmla). http:// or https:// use: You may also omit the protocol (http:// or https://) from URLs unless you are hyperlinking your source in software that requires the full protocol. However, always include https:// when adding DOIs to reference entries. Access Date: This is optional and should only be included for sources without a publication date or those that are likely to change (e.g., a wiki).
When citing websites, should we include the citation as an embedded link or just write it without embedding the link?
In other words, this book is not designed to teach you how to do any specific calculation; rather, it is designed to change the way that you think about social research.
This framing helps clarify what we’ll be doing in this course, not just learning techniques, but learning how to evaluate research choices. It makes me think about how we’ll need to justify data sources, sampling decisions, and ethics in our own projects.
One morning, when I came into my basement office, I discovered that overnight about 100 people from Brazil had participated in my experiment.
This example really highlights the methodological shift from traditional lab experiments to digital-age research. It’s striking how scale and speed change what’s possible but it also makes me wonder how issues like sample bias or lack of experimental control compare to in-person lab studies.
There are several ways computer programs are involved with social media. One of them is a “bot,” a computer program that acts through a social media account. There are other ways of programming with social media that we won’t consider a bot (and we will cover these at various points as well): The social media platform itself is run with computer programs, such as recommendation algorithms (chapter 12). Various groups want to gather data from social media, such as advertisers and scientists. This data is gathered and analyzed with computer programs, which we will not consider bots, but will cover later, such as in Chapter 8: Data Mining. Bots, on the other hand, will do actions through social media accounts and can appear to be like any other user. The bot might be the only thing posting to the account, or human users might sometimes use a bot to post for them. Note that sometimes people use “bots” to mean inauthentically run accounts, such as those run by actual humans, but are paid to post things like advertisements or political content. We will not consider those to be bots, since they aren’t run by a computer. Though we might consider these to be run by “human computers” who are following the instructions given to them, such as in a click farm:
It is shocking to know that a bot is not just defined as a computer program, but also to those so-called "human computers" in a click farm, that a worker is staring at dozens of phone for hours and hours. I sees those workers as they have no choice, although this is a job, but those poor workers are just doing what they've told to do, lost their own decision making, makes no different to an automated account.
This book progresses through four broad research designs: observing behavior, asking questions, running experiments, and creating mass collaboration.
I found the framing of the four research designs helpful because it clarifies how different methods enable fundamentally different kinds of knowledge. The idea that collaboration allows learning that isn’t possible through observation, surveys, or experiments alone makes me think about how method choice shapes not just results, but the kinds of questions we even consider asking.
Created a full-stack JavaScript application using Express and Node.js to serve a REST API to a Discord.jsfront-end for server account instance automation.• Used the Mineflayer API for scripting commands, events, and regex matching, eliminating all manual actions.• Employed SOCKS5 ISP proxies to rotate connections, bypassing server restrictions to support 100+ instances.
Personally I wouldn't highlight and bold the technologies fro this. I'd keep them but add some other metric like how it reduced manual work load by x% or x time if you have that metric
Reviewer #2 (Public review):
This short report by Hensley and Yildiz explores kinesin-1 motility under more physiological load geometries than previous studies. Large Z-direction (or radial) forces are a consequence of certain optical trap experimental geometries, and likely do not occur in the cell. Use of a long DNA tether between the motor and the bead can alleviate Z-component forces. The authors perform three experiments. In the first, they use two assay geometries - one with kinesin attached directly to a bead and the other with kinesin attached via a 2 kbp DNA tether - with a constant-position trap to determine that reducing the Z component of force leads to a difference in stall time but not stall force. In the second, they use the same two assay geometries with a constant-force trap to replicate the asymmetric slip bond of kinesin-1; reducing the Z component of force leads to a small but uniform change in the run lengths and detachment rates under hindering forces but not assisting forces. In the third, they connect two or three kinesin molecules to each DNA, and measure a stronger scaling in stall force and time when the Z component of force is reduced. They conclude that kinesin-1 is a more robust motor than previously envisaged, where much of its weakness came from the application of axial force. If forces are instead along the direction of transport, kinesin can hold on longer and work well in teams. The experiments are rigorous, and the data quality is very high. There is little to critique or discuss. The improved dataset will be useful for modeling and understanding multi-motor transport. The conclusions complement other recent works that used different approaches to low-Z component kinesin force spectroscopy, and provide strong value to the kinesin field.
Comments on revisions:
The authors have satisfied all of my comments. I commend them on an excellent paper.
Author response:
The following is the authors’ response to the original reviews
Reviewer #1 (Recommendations for the authors):
(1) My primary concern is that in some of the studies, there are not enough data points to be totally convincing. This is particularly apparent in the low z-force condition of Figure 1C.
We agree that adequate sampling is essential for drawing robust conclusions. To address this concern, we performed a post hoc sensitivity analysis to assess the statistical power of our dataset. Given our sample sizes (N = 85 and 45) and observed variability, the experiment had 80% power (α = 0.05) to detect a difference in stall force of approximately 0.36 pN (Cohen’s d ≈ 0.38). The actual difference observed between conditions was 0.25 pN (d ≈ 0.26), which lies below the minimum detectable effect size. Thus, the non-significant result (p = 0.16) likely reflects that any true difference, if present, is smaller than the experimental sensitivity, rather than a lack of sufficient sampling.
Importantly, both measured stall forces fall within the reported range for kinesin-1 in the literature, supporting that the dataset is representative and the measurements are reliable.
(2) I'm also concerned about Figure 2B. Does each data point in the three graphs represent only a single event? If so, this should probably be repeated several more times to ensure that the data are robust.
Each data point shown corresponds to the average of many processive runs, ranging from 32 to 167. This has been updated in the figure caption accordingly.
(3) Figure 3. I'm surprised that the authors could not obtain a higher occupancy of the multivalent DNA tether with kinesin motors. They were adding up to a 30X higher concentration of kinesin, but still did not achieve stoichiometric labeling. The reasons for this should be discussed. This makes interpretation of the mechanical data much tougher. For instance, only 6-7% of the beads would be driven by three kinesins. Unless the movement of hundreds of beads were studied, I think it would be difficult to draw any meaningful insight, since most of the events would be reflective of beads with only one or sometimes two kinesins bound. I think more discussion is required to describe how these data were treated.
The mass-photometry data in Figure 3B were acquired in the presence of a 3-fold molar excess of kinesin (Supplemental Figure 4) relative to the DNA chassis. In comparison, optical trapping studies were performed at a 10-20-fold molar excess of kinesin, resulting in a substantially higher percentage of chassis with multiple motors. The reason why we had to perform mass photometry measurements at lower molar excess than the optical trap is that at higher kinesin concentrations, the “kinesin-only” peak dominated and obscured 2- or 3-kinesin-bound species, preventing reliable fitting of the mass photometry data.
We have now used the mass photometry measurements to extrapolate occupancies under trapping conditions. We estimate 76-93% of 2-motor chassis are bound to two kinesins and ~70% of 3-motor chassis are bound to three kinesins under our trapping conditions. Moreover, the mean forces in Figures 3C–D exceed those expected for a single kinesin, consistent with occupancy substantially greater than one motor per chassis.
We wrote: “To estimate the percentage of chassis with two and three motors bound, we performed mass photometry measurements at a 3-fold molar excess of kinesin to the chassis, as higher ratios would obscure the distinction of complexes from the kinesin-only population. Assuming there is no cooperativity among the binding sites, we modeled motor occupancy using a Binomial distribution (Figure 3_figure supplement 2). We observed 17-29% of particles corresponded to the two-motor species on the 2-motor chassis in mass photometry, indicating that 45-78% of the 2-motor chassis was bound to two kinesins. Similarly, 15% and 40% of the 3motor chassis were bound to two and three kinesins, respectively.
In optical trapping assays, we used 10-fold and 20-fold molar excess of kinesin for 2-motor and 3-motor chassis, respectively, to substantially increase the percentage of the chassis carried by multiple kinesins. Under these conditions, we estimate 76-93% of the 2-motor chassis were bound to two kinesins, and 30% and 70% of 3-motor chassis were bound to two and three kinesins, respectively.”
“Multi-motor trapping assays were performed similarly using 10x and 20x kinesin for 2- and 3motor chassis, respectively. To estimate the percentage of chassis with multiple motors, we used the probability of kinesin binding to a site on a chassis from mass photometry in 3x excess condition to compute an effective dissociation constant  where r is the molar ratio of kinesin to chassis. Single-site occupancy at higher molar excesses of kinesin was calculated using this parameter. ”
We also added Figure 3_figure supplement 2 to explain our Binomial model.
(4) Page 5, 1st paragraph. Here, the authors are comparing time constants from stall experiments to data obtained with dynein from Ezber et al. This study used the traditional "one bead" trapping approach with dynein bound directly to the bead under conditions where it would experience high z-forces. Thus, the comparison between the behavior of kinesin at low z-forces is not necessarily appropriate. Has anyone studied dynein's mechanics under low z-force regimes?
We thank the reviewer for catching a citation error. The text has been corrected to reference Elshenawy et al. 2020, which reported stall time constants for mammalian dynein.
To our knowledge, dynein’s mechanics under explicitly low z-force conditions have not yet been reported; however, given the more robust stalling behavior of dynein and greater collective force generation, the cited paper was chosen to compare low z-force kinesin to a motor that appears comparatively unencumbered by z-forces. Our study adds to growing evidence that high z-forces disproportionately limit kinesin performance.
For clarification, we modified that sentence as follows: “These time constants are comparable to those reported for minus-end-directed dynein under high z-forces”.
Reviewer #2 (Recommendations for the authors):
(1) P3 pp2, a DNA tensiometer cannot control the force, but it can measure it; get the distance between the two ends of the tensiometer, and apply WLC.
The text has been updated to more accurately reflect the differences between optical trapping and kinesin motility against a DNA tensiometer with a fixed lattice position.
(2) Fig. 2b, SEM is a poor estimate or error for exponentially distributed run lengths. Other methods, like bootstrapping an exponential distribution fit, may provide a more realistic estimate.
Run lengths were plotted as an inverse cumulative distribution function and fitted to a single exponential decay (Supplementary Figure S3). The plotted value represents the fitted decay constant (characteristic run length) ± SE (standard error of the fit), not the arithmetic mean ± SEM. Velocity values are reported as mean ± SEM. Detachment rate was computed as velocity divided by run length, except at 6 and 10 pN hindering loads, where minimal forward displacement necessitated fitting run-time decays directly. In those cases, the plotted detachment rate equals the inverse of the fitted time constant. The figure caption has been updated accordingly.
(3) Kinesin-1 is covalently bound to a DNA oligo, which then attaches to the DNA chassis by hybridization. This oligo is 21 nt with a relatively low GC%. At what force does this oligo unhybridize? Can the authors verify that their stall force measurements are not cut short by the oligo detaching from the chassis?
The 21-nt attachment oligo (38 % GC) is predicted to have ΔG<sub>37C</sub> ≈-25 kcal/mole or approximately 42 kT. If we assume this is the approximate amount of work required to unhybridize the oligo, we would expect the rupture force to be >15 pN. This significantly exceeds the stall force of a single kinesin. Since the stalling events rarely exceed a few seconds, it is unlikely that our oligos quickly detach from the chassis under such low forces.
Furthermore, optical trapping experiments are tuned such that no more than 30% of beads display motion within several minutes after they are brought near microtubules. After stalling events, the motor dissociates from the MT, and the bead snaps back to the trap center. Most beads robustly reengage with the microtubule, typically within 10 s, suggesting that the same motor chassis reengages with the microtubule after microtubule detachment. Successive runs of the same bead typically have similar stall forces, suggesting that the motors do not disengage from the chassis under resistive forces exerted by the trap.
(4) Figure 1, a justification or explanation should be provided for why events lower than 1.5 pN were excluded. It appears arbitrary.
Single-motor stall-force measurements used a trap stiffness of 0.08–0.10 pN/nm. At this stiffness, a 1.5 pN force corresponds to 15–19 nm bead displacement, roughly two kinesin steps, and events below this threshold could not be reliably distinguished from Brownian noise. For this reason, forces < 1.5 pN were excluded.
In Methods, we wrote “Only peak forces above 1.5 pN (corresponding to a 15-19 nm bead displacement) were analyzed to clearly distinguish runs from the tracking noise.”
(5) Figure 2b, is the difference in velocity statistically significant?
The difference in velocity is statistically significant for most conditions. We did not compare velocities for -10 and -6 pN as these conditions resulted in little forward displacement. However, the p-values for all of the other conditions are -4 pN: 0.0026, -2 pN: 0.0001, -1 pN: 0.0446, +0.5 pN: 0.3148, +2 pN: 0.0001, +3 pN: 0.1191, +4 pN: 0.0004.
(6) The number of measurements for each experimental datapoint in the corresponding figure caption should be provided. SEM is used without, but N is not reported in the caption.
Figure captions have now been updated to report the number of trajectories (N) for each data point.
Reviewer #3 (Recommendations for the authors):
(1) The method of DNA-tethered motor trapping to enable low z-force is not entirely novel, but adapted from Urbanska (2021) for use in conventional optical trapping laboratories without reliance on microfluidics. However, I appreciate that they have fully established it here to share with the community. The authors could strengthen their methods section by being transparent about protein weight, protein labelling, and DNA ladders shown in the supplementary information. What organism is the protein from? Presumably human, but this should be specified in the methods. While the figures show beautiful data and exemplary traces, the total number of molecules analysed or events is not consistently reported. Overall, certain methodological details should be made sufficient for reproducibility.
We appreciate the reviewer’s attention to methodological clarity. The constructs used are indeed human kinesin-1, KIF5B. The Methods now specify protein origin, molecular weights, and labeling details, and all figure captions report the number of trajectories analyzed to ensure reproducibility.
(2) The major limitation the study presents is overarching generalisability, starting with the title. I recommend that the title be specific to kinesin-1.
The title has been revised to specify kinesin-1.
The study uses two constructs: a truncated K560 for conventional high-force assays, and full-length Kif5b for the low z-force method. However, for the multi-motor assay, the authors use K560 with the rationale of preventing autoinhibition due to binding with DNA, but that would also have limited characterisation in the single-molecule assay. Overall, the data generated are clear, high-quality, and exciting in the low z-force conditions. But why have they not compared or validated their findings with the truncated construct K560? This is especially important in the force-feedback experiments and in comparison with Andreasson et al. and Carter et al., who use Drosophila kinesin-1. Could kinesin-1 across organisms exhibit different force-detachment kinetics? It is quite possible.
Construct choice was guided by physiological relevance and considerations of autoinhibition: K560 was used for high z-force single-motor assays. The results of these assays are consistent with conventional bead assays performed by Andreasson et al. and Carter et al. using kinesin from a different organism. Therefore, we do not believe there are major differences between force properties of Drosophila and human kinesin-1.
For low z-force assays, we used full-length KIF5B, which has nearly identical velocity and stall force to K560 in standard bead assays. We used this construct for low z force assays because it has a longer and more flexible stalk than K560 and better represents the force behavior of kinesin under physiological conditions. We then used constitutively-active K560 motors for multi-motor experiments to avoid potential complications from autoinhibition of full-length kinesin.
Similarly, the authors test backward slipping of Kif5b and K560 and measure dwell times in multi-motor assays. Why not detail the backward slippage kinetics of Kif5b and any step-size impact under low z-forces? For instance, with the traces they already have, the authors could determine slip times, distances, and frequency in horizontal force experiments. Overall, the manuscript could be strengthened by analysing both constructs more fully.
Slip or backstep analyses were not performed on single-motor data because such events were rare; kinesin typically detached rather than slipped. In contrast, multi-motor assays exhibited frequent slip events corresponding to the detachment of individual motors, which were analyzed in detail.
We wrote “In comparison, slipping events were rarely observed in beads driven by a single motor, suggesting that kinesin typically detaches rather than slipping back on the microtubule under hindering loads.”
Appraisal and impact:
This study contributes to important and debated evidence on kinesin-1 force-detachment kinetics. The authors conclude that kinesin-1 exhibits a slip-bond interaction with the microtubule under increasing forces, while other recent studies (Noell et al. and Kuo et al.), which also use low z-force setups, conclude catch-bond behaviour under hindering loads. I find the results not fully aligned with their interpretation. The first comparison of low zforces in their setup with Noell et al. (2024), based on stall times, does not hold, because it is an apples-to-oranges comparison. Their data show a stall time constant of 2.52 s, which is comparable to the 3 s reported by Noell et al., but the comparison is made with a weighted average of 1.49 s. The authors do report that detachment rates are lower in low z-force conditions under unloaded scenarios. So, to completely rule out catch-bond-like behaviour is unfair. That said, their data quality is good and does show that higher hindering forces lead to higher detachment rates. However, on closer inspection, the range of 0-5 pN shows either a decrease or no change in detachment rate, which suggests that under a hindering force threshold, catch-bond-like or ideal-bond-like behaviour is possible, followed by slipbond behaviour, which is amazing resolution. Under assisting loads, the slip-bond character is consistent, as expected. Overall, the study contributes to an important discussion in the biophysical community and is needed, but requires cautious framing, particularly without evidence of motor trapping in a high microtubule-affinity state rather than genuine bond strengthening.
We are not completely ruling out the catch bond behavior in our manuscript. As the reviewer pointed out, our results are consistent with the asymmetric slip bond model, whereas DNA tensiometer assays are more consistent with the catch bond behavior. The advantage of our approach is the capability to directly control the magnitude and direction of load exerted on the motor in the horizontal axis and measure the rate at which the motor detaches from the microtubule as it walks under constant load. In comparison, DNA tensiometer assays cannot control the force, but measure the time it takes the motor to fall off from the microtubule after a brief stall. The extension of the DNA tether is used to estimate the force exerted on the motor during a stall in those assays. The slight disadvantage of our method is the presence of low zforces, whereas DNA tensiometer assays are expected to have little to no z-force. We wrote that the discrepancy between our results can be attributed to the presence of low z forces in our DNA tethered trapping assembly, which may result in a higher-than-normal detachment rate under high hindering loads, thereby resulting in less asymmetry in the force detachment kinetics. We also added that this discrepancy can be addressed by future studies that directly control and measure horizontal force and measure the motor detachment rate in the absence of z forces. Optical trapping assays with small nanoparticles (Sudhakar et al. Science 2021) may be well suited to conclusively reveal the bond characteristics of kinesin under hindering loads.
Reviewing Editor Comments:
The reviewers are in agreement with the importance of the findings and the quality of the results. The use of the DNA tether reduces the z-force on the motor and provides biologically relevant insight into the behavior of the motor under load. The reviewers' suggestions are constructive and focus on bolstering some of the data points and clarifying some of the methodological approaches. My major suggestion would be to clarify the rationale for concluding that kinesin-1 exhibits slip-bond behavior with increasing force in light of the work of Noell (10.1101/2024.12.03.626575) and Kuo et al (2022 10.1038/s41467022-31069-x), both of which take advantage of DNA tethers.
Please see our response to the previous comment. In the revised manuscript, we first clarified that our results are in agreement with previous theoretical (Khataee & Howard, 2019) and experimental studies (Kuo et al., 2022; Noell et al., 2024; Pyrpassopoulos et al., 2020) that kinesin exhibits slower detachment under hindering load. This asymmetry became clear when the z-force was reduced or eliminated.
We clarified the differences between our results and DNA tensiometer assays and provided a potential explanation for these discrepancies. We also proposed that future studies might be required to fully distinguish between asymmetric slip, ideal, or catch bonding of kinesin under hindering loads.
We wrote:
“Our results agree with the theoretical prediction that kinesin exhibits higher asymmetry in force-detachment kinetics without z-forces (Khataee & Howard, 2019), and are consistent with optical trapping and DNA tensiometer assays that reported more persistent stalling of kinesin in the absence of z-forces (Kuo et al., 2022; Noell et al., 2024; Pyrpassopoulos et al., 2020).
Force-detachment kinetics of protein-protein interactions have been modeled as either a slip, ideal, or catch bond, which exhibit an increase, no change, or a decrease in detachment rate, respectively, under increasing force (Thomas et al., 2008). Slip bonds are most commonly observed in biomolecules, but studies on cell adhesion proteins reported a catch bond behavior (Marshall et al., 2003). Although previous trapping studies of kinesin reported a slip bond behavior (Andreasson et al., 2015; Carter & Cross, 2005), recent DNA tensiometer studies that eliminated the z-force showed that the detachment rate of the motor under hindering forces is lower than that of an unloaded motor walking on the microtubule (Kuo et al., 2022; Noell et al., 2024), consistent with the catch bond behavior. Unlike these reports, we observed that the stall duration of kinesin is shorter than the motor run time under unloaded conditions, and the detachment rate of kinesin increases with the magnitude of the hindering force. Therefore, our results are more consistent with the asymmetric slip bond behavior. The difference between our results and the DNA tensiometer assays (Kuo et al., 2022; Noell et al., 2024) can be attributed to the presence of low z-forces in our DNA-tethered optical trapping assays, which may increase the detachment rate under high hindering forces. Future studies that could directly control hindering forces and measure the motor detachment rate in the absence of z-forces would be required to conclusively reveal the bond characteristics of kinesin under hindering loads.”
Reviewer #1 (Public review):
The authors have conducted substantial additional analyses to address the reviewers' comments. However, several key points still require attention. I was unable to see the correspondence between the model predictions and the data in the added quantitative analysis. In the rebuttal letter, the delta peak speed time displays values in the range of [20, 30] ms, whereas the data were negative for the 45{degree sign} direction. Should the reader directly compare panel B of Figure 6 with Figure 1E? The correspondence between the model and the data should be made more apparent in Figure 6. Furthermore, the rebuttal states that a quantitative prediction was not expected, yet it subsequently argues that there was a quantitative match. Overall, this response remains unclear.
A follow-up question concerns the argument about strategic slowing. The authors argue that this explanation can be rejected because the timing of peak speed should be delayed, contrary to the data. However, there appears to be a sign difference between the model and the data for the 45{degree sign} direction, which means that it was delayed in this case. Did I understand correctly? In that regard, I believe that the hypothesis of strategic slowing cannot yet be firmly rejected and the discussion should more clearly indicate that this argument is based on some, but not all, directions. I agree with the authors on the importance of the mass underestimation hypothesis, and I am not particularly committed to the strategic slowing explanation, but I do not see a strong argument against it. If the conclusion relies on the sign of the delta peak speed, then the authors' claims are not valid across all directions, and greater caution in the interpretation and discussion is warranted. Regarding the peak acceleration time, I would be hesitant to draw firm conclusions based on differences smaller than 10 ms (Figures R3 and 6D).
The authors state in the rebuttal that the two hypotheses are competing. This is not accurate, as they are not mutually exclusive and could even vary as a function of movement direction. The abstract also claims that the data "refutes" strategic slowing, which I believe is too strong. The main issue is that, based on the authors' revised manuscript, the lack of quantitative agreement between the model and the data for the mass underestimation hypothesis is considered acceptable because a precise quantitative match is not expected, and the predictions overall agree for some (though not all) directions and phases (excluding post-in). That is reasonable, but by the same logic, the small differences between the model prediction and the strategic slowing hypothesis should not be taken as firm evidence against it, as the authors seem to suggest. In practice, I recommend a more transparent and cautious interpretation to avoid giving readers the false impression that the evidence is decisive. The mass underestimation hypothesis is clearly supported, but the remaining aspects are less clear, and several features of the data remain unexplained.
Reviewer #3 (Public review):
Summary:
The authors describe an interesting study of arm movements carried out in weightlessness after a prolonged exposure to the so-called microgravity conditions of orbital spaceflight. Subjects performed radial point-to-point motions of the fingertip on a touch pad. The authors note a reduction in movement speed in weightlessness, which they hypothesize could be due to either an overall strategy of lowering movement speed to better accommodate the instability of the body in weightlessness or an underestimation of body mass. They conclude for the latter, mainly based on two effects. One, slowing in weightlessness is greater for movement directions with higher effective mass at the end effector of the arm. Two, they present evidence for increased number of corrective submovements in weightlessness. They contend that this provides conclusive evidence to accept the hypothesis of an underestimation of body mass.
Strengths:
In my opinion, the study provides a valuable contribution, the theoretical aspects are well presented through simulations, the statistical analyses are meticulous, the applicable literature is comprehensively considered and cited and the manuscript is well written.
Weaknesses:
I nevertheless am of the opinion that the interpretation of the observations leaves room for other possible explanations of the observed phenomenon, thus weakening the strength of the arguments.
To strengthen the conclusions, I feel that the following points would need to be addressed:
(1) The authors model the movement control through equations that derive the input control variable in terms of the force acting on the hand and treating the arm as a second-order low pass filter (Eq. 13). Underestimation of the mass in the computation of a feedforward command would lead to a lower-than-expected displacement to that command. But it is not clear if and how the authors account for a potential modification of the time constants of the 2nd order system. The CNS does not effectuate movements with pure torque generators. Muscles have elastic properties that depend on their tonic excitation level, reflex feedback and other parameters. Indeed, Fisk et al.* showed variations of movement characteristics consistent with lower muscle tone, lower bandwidth and lower damping ratio in 0g compared to 1g. Could the variations in the response to the initial feedforward command be explained by a misrepresentation of the limbs damping and natural frequency, leading to greater uncertainty to the consequences of the initial command. This would still be an argument for un-adapted feedforward control of the movement, leading to the need for more corrective movements. But it would not necessarily reflect an underestimation of body mass.
*Fisk, J. O. H. N., Lackner, J. R., & DiZio, P. A. U. L. (1993). Gravitoinertial force level influences arm movement control. Journal of neurophysiology, 69(2), 504-511.
While the authors attempt to differentiate their study from previous studies where limb neuromechanical impedance was shown to be modified in weightlessness by emphasizing that in the current study the movements were rapid and the initial movement is "feedforward". But this incorrectly implies that the limb's mechanical response to the motor command is determined only by active feedback mechanisms. In fact:
(a) All commands to the muscle pass through the motor neurons. These neurons receive descending activations related not only to the volitional movement, but also to the dynamic state of the body and the influence of other sensory inputs, including the vestibular system. A decrease in descending influences from the vestibular organs will lower the background sensitivity to all other neural influences on the motor neuron. Thus, the motor neuron may be less sensitive to the other volitional and reflexive synaptic inputs that it may receive.
(b) Muscle tone plays a significant role in determining the force and the time course of the muscle contraction. In a weightless environment, where tonic muscle activity is likely to be reduced, there is the distinct possibility that muscles will react more slowly and with lower amplitude to an otherwise equivalent descending motor command, particularly in the initial moments before spinal reflexes come into play. These, and other neuronal mechanisms could lead to the "under-actuation" effect observed in the current study, without necessarily being reflective of an underestimation of mass per se.
(2) The subject's body in weightless is much more sensitive to reaction forces in interactions with the environment in the absence of the anchoring effect of gravity pushing the body into the floor and in the absence of anticipatory postural adjustments that typically accompany upper-limb motions in Earth gravity in order to maintain an upright posture. The authors dismiss this possibility because the taikonauts were asked to stabilize their bodies with the contralateral hand. But the authors present no evidence that this was sufficient to maintain the shoulder and trunk at a strictly constant position, as is supposed by the simplified biomechanical model used in their optimal control framework. Indeed, a small backward motion of the shoulder would result in a smaller acceleration of the fingertip and a smaller extent of the initial ballistic motion of the hand with respect to the measurement device (the tablet), consistent with the observations reported in the study. Note that stability of the base might explain why 45º movements were apparently less affected in weightlessness, according to many of the reported analyses, including those related to corrective movements (Fig. 5 B, C, F; Fig. 6D), than the other two directions. If the trunk is being stabilized by the left arm, the same reaction forces on the trunk due to the acceleration of the hand will result in less effective torque on the trunk, given that the reaction forces act with a much smaller moment arm with respect to the left shoulder (the hand movement axis passes approximately through the left shoulder for the 45º target) compared to either the forward or rightward motions of the hand.
(3) The above is exacerbated by potential changes in the frictional forces between the fingertip and the tablet. The movements were measured by having the subjects slide their finger on the surface of a touch screen. In weightlessness, the implications of this contact can be expected to be quite different than on the ground. While these forces may be low on Earth, the fact is that we do not know what forces the taikonauts used on orbit. In weightlessness, the taikonauts would need to actively press downward to maintain contact with the screen, while on Earth gravity will do the work. The tangential forces that resist movement due to friction might therefore be different in 0g. . Indeed, given the increased instability of the body and the increased uncertainty of movement direction of the hand, taikonauts may have been induced to apply greater forces against the tablet in order to maintain contact in weightlessness, which would in turn slow the motion of the finger on the table and increase the reaction forces acting on the trunk. This could be particularly relevant given that the effect of friction would interact with the limb in a direction-dependent fashion, given the anisotropy of the equivalent mass at the fingertip evoked by the authors
I feel that the authors have done an admirable job of exploring the how to explain the modifications to movement kinematics that they observed on orbit within the constraints of the optimal control theory applied to a simplified model of the human motor system. While I fully appreciate the value of such models to provide insights into question of human sensorimotor behaviour, to draw firm conclusions on what humans are actually experiencing based only on manipulations of the computational model, without testing the model's implicit assumptions and without considering the actual neurophysiological and biomechanical mechanisms, can be misleading. One way to do this could be to examine these questions through extensions to the model used in the simulations (changing activation dynamics of the torque generators, allowing for potential motion backward motion of the shoulder and trunk, etc.). A better solution would be to emulate the physiological and biomechanical conditions on Earth (supporting the arm against gravity to reduce muscle tone, placing the subject on a moveable base that requires that the body be stabilized with the other hand) in order to distinguish the hypothesis of an underestimation of mass vs. other potential sources of under-actuation and other potential effects of weightlessness on the body.
In sum, my opinion is that the authors are relying too much on a theoretical model as a ground truth and thus overstate their conclusions. But to provide a convincing argument that humans truly underestimate mass in weightlessness, they should consider more judiciously the neurophysiology and biomechanics that fall outside the purview of the simplified model that they have chosen. If a more thorough assessment of this nature is not possible, then I would argue that a more measured conclusion of the paper should be 1) that the authors observed modifications to movement kinematics in weightlessness consistent with an under-actuation for the intended motion, 2) that a simplified model of human physiology and biomechanics that incorporates principles of optimal control suggest that the source of this under-actuation might be an underestimation of mass in the computation of an appropriate feedforward motor command, and 3) that other potential neurophysiological or biomechanical effects cannot be excluded due to limitations of the computational model.
Author response:
The following is the authors’ response to the original reviews
eLife Assessment
This paper undertakes an important investigation to determine whether movement slowing in microgravity is due to a strategic conservative approach or rather due to an underestimation of the mass of the arm. While the experimental dataset is unique and the coupled experimental and computational analyses comprehensive, the authors present incomplete results to support the claim that movement slowing is due to mass underestimation. Further analysis is needed to rule out alternative explanations.
We thank the editor and reviewers for the thoughtful and constructive comments, which helped us substantially improve the manuscript. In this revised version, we have made the following key changes:
- Directly presented the differential effect of microgravity in different movement directions, showing its quantitative match with model predictions.
- Showed that changing cost function with the idea of conservative strategy is not a viable alternative.
- Showed our model predictions remain largely the same after adding Coriolis and centripetal torques.
- Discussed alternative explanations including neuromuscular deconditioning, friction, body stability, etc.
- Detailed the model description and moved it to the main text, as suggested.
Our point-to-point response is numbered to facilitate cross-referencing.
We believe the revisions and the responses adequately addresses the reviewers’ concerns, and new analysis results strengthened our conclusion that mass underestimation is the major contributor to movement slowing in microgravity.
Reviewer #1 (Public review):
Summary:
This article investigates the origin of movement slowdown in weightlessness by testing two possible hypotheses: the first is based on a strategic and conservative slowdown, presented as a scaling of the motion kinematics without altering its profile, while the second is based on the hypothesis of a misestimation of effective mass by the brain due to an alteration of gravity-dependent sensory inputs, which alters the kinematics following a controller parameterization error.
Strengths:
The article convincingly demonstrates that trajectories are affected in 0g conditions, as in previous work. It is interesting, and the results appear robust. However, I have two major reservations about the current version of the manuscript that prevent me from endorsing the conclusion in its current form.
Weaknesses:
(1) First, the hypothesis of a strategic and conservative slow down implicitly assumes a similar cost function, which cannot be guaranteed, tested, or verified. For example, previous work has suggested that changing the ratio between the state and control weight matrices produced an alteration in movement kinematics similar to that presented here, without changing the estimated mass parameter (Crevecoeur et al., 2010, J Neurophysiol, 104 (3), 1301-1313). Thus, the hypothesis of conservative slowing cannot be rejected. Such a strategy could vary with effective mass (thus showing a statistical effect), but the possibility that the data reflect a combination of both mechanisms (strategic slowing and mass misestimation) remains open.
Response (1): Thank you for raising this point. The basic premise of this concern is that changing the cost function for implementing strategic slowing can reproduce our empirical findings, thus the alternative hypothesis that we aimed to refute in the paper remain possible. At least, it could co-exist with our hypothesis of mass underestimation. In the revision, we show that changing the cost function only, as suggested here, cannot produce the behavioral patterns observed in microgravity.
As suggested, we modified the relative weighting of the state and control cost matrices (i.e., Q and R in the cost function Eq 15) without considering mass underestimation. While this cost function scaling can decrease peak velocity – a hallmark of strategic slowing – it also inevitably leads to later peak timings. This is opposite to our robust findings: the taikonauts consistently “advanced” their peak velocity and peak acceleration in time. Note, these model simulation patterns have also been shown in Crevecoeur et al. (2010), the paper mentioned by the reviewer (see their Figure 7B).
We systematically changed the ratio between the state and control weight matrices in the simulation, as suggested. We divided Q and multiplied R by the same factor α, the cost function scaling parameter α as defined in Crevecoeur et al. (2010). This adjustment models a shift in movement strategy in microgravity, and we tested a wide range of α to examine reasonable parameter space. Simulation results for α = 3 and α = 0.3 are shown in Figure 1—figure supplement 2 and Figure 1—figure supplement 3 respectively. As expected, with α = 3 (higher control effort penalty), peak velocities and accelerations are reduced, but their timing is delayed. Conversely, with α = 0.3, both peak amplitude and timing increase. Hence, changing the cost function to implement a conservative strategy cannot produce the kinematic pattern observed in microgravity, which is a combination of movement slowing and peak timing advance.
Therefore, we conclude that a change in optimal control strategy alone is insufficient to explain our empirical findings. Logically speaking, we cannot refute the possibility of strategic slowing, which can still exist on top of the mass underestimation we proposed here. However, our data does not support its role in explaining the slowing of goal-directed hand reaching in microgravity. We have added these analyses to the Supplementary Materials and expanded the Discussion to address this point.
(2) The main strength of the article is the presence of directional effects expected under the hypothesis of mass estimation error. However, the article lacks a clear demonstration of such an effect: indeed, although there appears to be a significant effect of direction, I was not sure that this effect matched the model's predictions. A directional effect is not sufficient because the model makes clear quantitative predictions about how this effect should vary across directions. In the absence of a quantitative match between the model and the data, the authors' claims regarding the role of misestimating the effective mass remain unsupported.
Response (2): First, we have to clarify that our study does not aim to quantitatively fit observed hand trajectory. The two-link arm model simulates an ideal case of moving a point mass (effective mass) on a horizontal plane without friction (Todorov, 2004; 2005). In contrast, in the experiment, participants moved their hand on a tabletop without vertical arm support, so the movement was not strictly planar and was affected by friction. Thus, this kind of model can only illustrate qualitative differences between conditions, as in the majorities of similar modeling studies (e.g., Shadmehr et al., 2016). In our study, qualitative simulation means the model is intended to reproduce the directional differences between conditions—not exact numeric values—in key kinematic measures. Specifically, it should capture how the peak velocity and acceleration amplitudes and their timings differ between normal gravity and microgravity (particularly under the mass-underestimation assumption).
Second, the reviewer rightfully pointed out that the directional effect is essential for our theorization of the importance of mass underestimation. However, the directional effect has two aspects, which were not clearly presented in our original manuscript. We now clarify both here and in the revision. The first aspect is that key kinematic variables (peak velocity/acceleration and their timing) are affected by movement direction, even before any potential microgravity effect. This is shown by the ranking order of directions for these variables (Figure 1C-H). The direction-dependent ranking, confirmed by pre-flight data, indicates that effective mass is a determining factor for reaching kinematics, which motivated us to study its role in eliciting movement slowing in space. This was what our original manuscript emphasized and clearly presented.
The second aspect is that the hypothetical mass underestimation might also differentially affect movements in different directions. This was not clearly presented in the original manuscript. However, we would not expect a quantitative match between model predictions and empirical data, for the reasons mentioned above. We now show this directional ranking in microgravity-elicited kinematic changes in both model simulations and empirical data. The overall trend is that the microgravity effect indeed differs between directions, and the model predictions and the data showed a reasonable qualitative match (Author response image 1 below).
Shown in Author response image 1, we found that for amplitude changes (Δ peak speed, Δ peak acceleration) both the model and the mean of empirical data show the same directional ordering (45° > 90° > 135°) in pre-in and post-in comparisons. For timing (Δ peak-speed time, Δ peak-acceleration time), which we consider the most diagnostic, the same directional ranking was observed. We only found one deviation, i.e., the predicted sign (earlier peaks) was confirmed at 90° and 135°, but not at 45°. As discussed in Response (6), the absence of timing advance at 45° may reflect limitations of our simplified model, which did not consider that the 45° direction is essentially a single-joint reach. Taken together, the directional pattern is largely consistent with the model predictions based on mass underestimation. The model successfully reproduces the directional ordering of amplitude measures -- peak velocity and peak acceleration. It also captures the sign of the timing changes in two out of the three directions. We added these new analysis results in the revision and expanded Discussion accordingly.
The details of our analysis on directional effects: We compared the model predictions (Author response image 1, left) with the experimental data (Author response image 1, right) across the three tested directions (45°, 90°, 135°). In the experimental data panels, both Δ(pre-in) (solid bars) and Δ(post-in) (semi-transparent bars) with standard error are shown. The directional trends are remarkably similar between model prediction and actual data. The post-in comparison is less aligned with model prediction; we postulate that the incomplete after-flight recovery (i.e., post data had not returned to pre-flight baselines) might obscure the microgravity effect. Incomplete recovery has also been shown in our original manuscript: peak speed and peak acceleration did not fully recover in post-flight sessions when compared to pre-flight sessions. To further quantify the correspondence between model and data, we performed repeated-measures correlation (rm-corr) analyses. We found significant within-subject correlations for three of the four metrics. For pre–in, Δ peak speed time (r<sub>rm</sub> = 0.627, t(23) = 3.858, p < 0.001), Δ peak acceleration time (r<sub>rm</sub> = 0.591, t(23) = 3.513, p = 0.002), and Δ peak acceleration (r<sub>rm</sub> = 0.573, t(23) = 3.351, p = 0.003) were significant, whereas Δ peak speed was not (r<sub>rm</sub> = 0.334, t(23) = 1.696, p = 0.103). These results thus show that the directional effect, as predicted our model, is observed both before spaceflight and in spaceflight (the pre-in comparison).
Author response image 1.
Directional comparison between model predictions and experimental data across the three reach directions (45°, 90°, 135°). Left: model outputs. Right: experimental data shown as Δ relative to the in-flight session; solid bars = Δ(in − pre) and semi-transparent bars = Δ(in − post). Colors encode direction consistently across panels (e.g., 45° = darker hue, 90° = medium, 135° = lighter/orange). Panels (clockwise from top-left): Δ peak speed (cm/s), Δ peak speed time (ms), Δ peak acceleration time (ms), and Δ peak acceleration (cm/s²). Bars are group means; error bars denote standard error across participants.
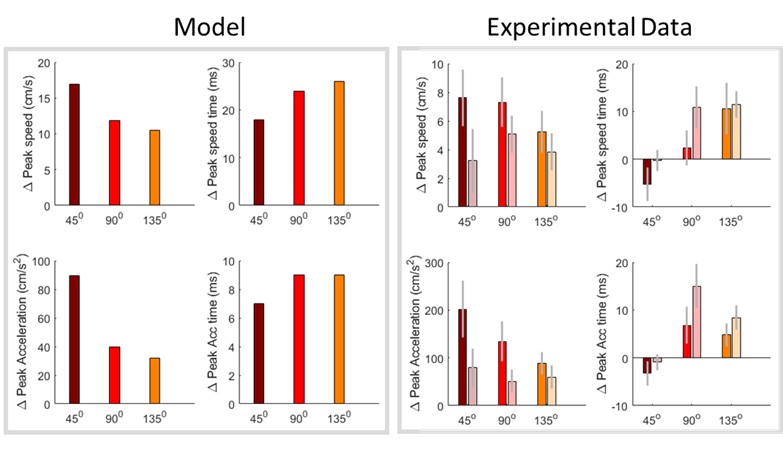
Citations:
Todorov, E. (2004). Optimality principles in sensorimotor control. Nature Neuroscience, 7(9), 907.
Todorov, E. (2005). Stochastic optimal control and estimation methods adapted to the noise characteristics of the sensorimotor system. Neural Computation, 17(5), 1084–1108.
Shadmehr, R., Huang, H. J., & Ahmed, A. A. (2016). A Representation of Effort in Decision-Making and Motor Control. Current Biology: CB, 26(14), 1929–1934.
In general, both the hypotheses of slowing motion (out of caution) and misestimating mass have been put forward in the past, and the added value of this article lies in demonstrating that the effect depended on direction. However, (1) a conservative strategy with a different cost function can also explain the data, and (2) the quantitative match between the directional effect and the model's predictions has not been established.
We agree that both hypotheses have been put forward before, however they are competing hypotheses that have not been resolved. Furthermore, the mass underestimation hypothesis is a conjecture without any solid evidence; previous reports on mass underestimation of object cannot directly translate to underestimation of body. As detailed in our responses above, we have shown that a conservative strategy implemented via a different cost function cannot reproduce the key findings in our dataset, thereby supporting the alternative hypothesis of mass underestimation. Moreover, we found qualitative agreement between the model predictions and the experimental data in terms of directional effects, which further strengthens our interpretation.
Specific points:
(1) I noted a lack of presentation of raw kinematic traces, which would be necessary to convince me that the directional effect was related to effective mass as stated.
Response (3): We are happy to include exemplary speed and acceleration trajectories. Kinematic profiles from one example participant are shown in Figure 2—figure supplement 6.
(2) The presentation and justification of the model require substantial improvement; the reason for their presence in the supplementary material is unclear, as there is space to present the modelling work in detail in the main text. Regarding the model, some choices require justification: for example, why did the authors ignore the nonlinear Coriolis and centripetal terms?
Response (4): Great suggestion. In the revision, we have moved the model into the main text and added further justification for using this simple model.
We initially omitted the nonlinear Coriolis and centripetal terms in order to start with a minimal model. Importantly, excluding these terms does not affect the model’s main conclusions. In the revision we added simulations that explicitly include these terms. The full explanation and simulations are provided in the Supplementary Notes 2 (this time we have to put it into the Supplementary to reduce the texts devoted to the model). More explanations can also be found in our response to Reviewer 2 (response (6)). The results indicate that, although these velocity-dependent forces show some directional anisotropy, their contribution is substantially smaller relative to that of the included inertial component; specifically, they have only a negligible impact on the predicted peak amplitudes and peak times.
(3) The increase in the proportion of trials with subcomponents is interesting, but the explanatory power of this observation is limited, as the initial percentage was already quite high (from 60-70% during the initial study to 70-85% in flight). This suggests that the potential effect of effective mass only explains a small increase in a trend already present in the initial study. A more critical assessment of this result is warranted.
Response (5): Thank you for your thoughtful comment. You are correct that the increase in the percentage of trials with submovements is modest, but a more critical change was observed in the timing between submovement peaks—specifically, the inter-peak interval (IPI). These intervals became longer during flight. Taken together with the percentage increase, the submovement changes significantly predicted the increase in movement duration, as shown by our linear mixed-effects model, which indicated that IPI increased.
Reviewer #2 (Public review):
This study explores the underlying causes of the generalized movement slowness observed in astronauts in weightlessness compared to their performance on Earth. The authors argue that this movement slowness stems from an underestimation of mass rather than a deliberate reduction in speed for enhanced stability and safety.
Overall, this is a fascinating and well-written work. The kinematic analysis is thorough and comprehensive. The design of the study is solid, the collected dataset is rare, and the model tends to add confidence to the proposed conclusions. That being said, I have several comments that could be addressed to consolidate interpretations and improve clarity.
Main comments:
(1) Mass underestimation
a) While this interpretation is supported by data and analyses, it is not clear whether this gives a complete picture of the underlying phenomena. The two hypotheses (i.e., mass underestimation vs deliberate speed reduction) can only be distinguished in terms of velocity/acceleration patterns, which should display specific changes during the flight with a mass underestimation. The experimental data generally shows the expected changes but for the 45° condition, no changes are observed during flight compared to the pre- and post-phases (Figure 4). In Figure 5E, only a change in the primary submovement peak velocity is observed for 45°, but this finding relies on a more involved decomposition procedure. It suggests that there is something specific about 45° (beyond its low effective mass). In such planar movements, 45° often corresponds to a movement which is close to single-joint, whereas 90° and 135° involve multi-joint movements. If so, the increased proportion of submovements in 90° and 135° could indicate that participants had more difficulties in coordinating multi-joint movements during flight. Besides inertia, Coriolis and centripetal effects may be non-negligible in such fast planar reaching (Hollerbach & Flash, Biol Cyber, 1982) and, interestingly, they would also be affected by a mass underestimation (thus, this is not necessarily incompatible with the author's view; yet predicting the effects of a mass underestimation on Coriolis/centripetal torques would require a two-link arm model). Overall, I found the discrepancy between the 45° direction and the other directions under-exploited in the current version of the article. In sum, could the corrective submovements be due to a misestimation of Coriolis/centripetal torques in the multi-joint dynamics (caused specifically -or not- by a mass underestimation)?
Response (6): Thank you for raising these important questions. We unpacked the whole paragraph into two concerns: 1) the possibility that misestimation of Coriolis and centripetal torques might lead to corrective submovements, and 2) the weak effect in the 45° direction unexploited. These two concerns are valid but addressable, and they did not change our general conclusions based on our empirical findings (see Supplementary note 2. Coriolis and centripetal torques have minimal impact).
Possible explanation for the 45° discrepancy
We agree with the reviewer that the 45° direction likely involves more single-joint (elbow-dominant) movement, whereas the 90° and 135° directions require greater multi-joint (elbow + shoulder) coordination. This is particularly relevant when the workspace is near body midline (e.g., Haggard & Richardson, 1995), as the case in our experimental setup. To demonstrate this, we examined the curvature of the hand trajectories across directions. Using cumulative curvature (positive = counterclockwise), we obtained average values of 6.484° ± 0.841°, 1.539° ± 0.462°, and 2.819° ± 0.538° for the 45°, 90°, and 135° directions, respectively. The significantly larger curvature in the 45° condition suggests that these movements deviate more from a straight-line path, a hallmark of more elbow-dominant movements.
Importantly, this curvature pattern was present in both the pre-flight and in-flight phases, indicating that it is a general movement characteristic rather than a microgravity-induced effect. Thus, the 45° reaches are less suitable for modeling with a simplified two-link arm model compared to the other two directions. We believe this is the main reason why the model predictions based on effective mass become less consistent with the empirical data for the 45° direction.
We have now incorporated this new analysis in the Results and discussed it in the revised Discussion.
Citation: Haggard, P., Hutchinson, K., & Stein, J. (1995). Patterns of coordinated multi-joint movement. Experimental Brain Research, 107(2), 254-266.
b) Additionally, since the taikonauts are tested after 2 or 3 weeks in flight, one could also assume that neuromuscular deconditioning explains (at least in part) the general decrease in movement speed. Can the authors explain how to rule out this alternative interpretation? For instance, weaker muscles could account for slower movements within a classical time-effort trade-off (as more neural effort would be needed to generate a similar amount of muscle force, thereby suggesting a purposive slowing down of movement). Therefore, could the observed results (slowing down + more submovements) be explained by some neuromuscular deconditioning combined with a difficulty in coordinating multi-joint movements in weightlessness (due to a misestimation or Coriolis/centripetal torques) provide an alternative explanation for the results?
Response (7): Neuromuscular deconditioning is indeed a space effect; thanks for bringing this up as we omitted the discussion of this confounds in our original manuscript. Prolonged stay in microgravity can lead to a reduction of muscle strength, but this is mostly limited to lower limb. For example, a recent well-designed large-sample study have shown that while lower leg muscle showed significant strength reductions, no changes in mean upper body strength was found (Scott et al., 2023), consistent with previous propositions that muscle weakness is less for upper-limb muscles than for postural and lower-limb muscles (Tesch et al., 2005). Furthermore, the muscle weakness is unlikely to play a major role here since our reaching task involves small movements (~12cm) with joint torques of a magnitude of ~2N·m. Of course, we cannot completely rule out the contribution of muscle weakness; we can only postulate, based on the task itself (12 cm reaching) and systematic microgravity effect (the increase in submovements, the increase in the inter-submovements intervals, and their significant prediction on movement slowing), that muscle weakness is an unlikely major contributor for the movement slowing.
The reviewer suggests that poor coordination in microgravity might contribute to slowing down + more submovements. This is also a possibility, but we did not find evidence to support it. First, there is no clear evidence or reports about poor coordination for simple upper-limb movements like reaching investigated here. Note that reaching or aiming movement is one of the most studied tasks among astronauts. Second, we further analyzed our reaching trajectories and found no sign of curvature increase, a hallmark of poor coordination of Coriolis/centripetal torques, in our large collection of reaching movements. We probably have the largest dataset of reaching movements collected in microgravity thus far, given that we had 12 taikonauts and each of them performed about 480 to 840 reaching trials during their spaceflight. We believe the probability of Type II error is quite low here.
Citation: Tesch, P. A., Berg, H. E., Bring, D., Evans, H. J., & LeBlanc, A. D. (2005). Effects of 17-day spaceflight on knee extensor muscle function and size. European journal of applied physiology, 93(4), 463-468.
Scott J, Feiveson A, English K, et al. Effects of exercise countermeasures on multisystem function in long duration spaceflight astronauts. npj Microgravity. 2023;9(11).
(2) Modelling
a) The model description should be improved as it is currently a mix of discrete time and continuous time formulations. Moreover, an infinite-horizon cost function is used, but I thought the authors used a finite-horizon formulation with the prefixed duration provided by the movement utility maximization framework of Shadmehr et al. (Curr Biol, 2016). Furthermore, was the mass underestimation reflected both in the utility model and the optimal control model? If so, did the authors really compute the feedback control gain with the underestimated mass but simulate the system with the real mass? This is important because the mass appears both in the utility framework and in the LQ framework. Given the current interpretations, the feedforward command is assumed to be erroneous, and the feedback command would allow for motor corrections. Therefore, it could be clarified whether the feedback command also misestimates the mass or not, which may affect its efficiency. For instance, if both feedforward and feedback motor commands are based on wrong internal models (e.g., due to the mass underestimation), one may wonder how the astronauts would execute accurate goal-directed movements.
b) The model seems to be deterministic in its current form (no motor and sensory noise). Since the framework developed by Todorov (2005) is used, sensorimotor noise could have been readily considered. One could also assume that motor and sensory noise increase in microgravity, and the model could inform on how microgravity affects the number of submovements or endpoint variance due to sensorimotor noise changes, for instance.
c) Finally, how does the model distinguish the feedforward and feedback components of the motor command that are discussed in the paper, given that the model only yields a feedback control law? Does 'feedforward' refer to the motor plan here (i.e., the prefixed duration and arguably the precomputed feedback gain)?
Response (8): We thank the reviewer for raising these important and technically insightful points regarding our modeling framework. We first clarify the structure of the model and key assumptions, and then address the specific questions in points (a)–(c) below.
We used Todorov’s (2005) stochastic optimal control method to compute a finite-horizon LQG policy under sensory noise and signal-dependent motor noise (state noise set to zero). The cost function is: 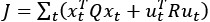 (see details in updated Methods). The resulting time-varying gains {L<sub>k</sub>, K<sub>k</sub>} correspond to the feedforward mapping and the feedback correction gain, respectively. The control law can be expressed as:

where u<sub>k</sub> is the control input,  is the nominal planned state,
  is the estimated state, L<sub>k</sub> is the feedforward (nominal) control associated with the planned trajectory, and K<sub>k</sub> is the time-varying feedback gain that corrects deviations from the plan.
To define the motor plan for comparison with behavior, we simulate the deterministic open-loop
trajectory by turning off noise and disabling feedback corrections, i.e., 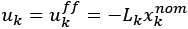 . In this framework, “feedforward” refers to this nominal motor plan. Thus, sensory and signal-dependent noise influence the computed policy (via the gains), but are not injected when generating the nominal trajectory. This mirrors the minimum-jerk practice used to obtain nominal kinematics in prior utility-based work (Shadmehr, 2016), while optimal control provides a more physiologically grounded nominal plan. In the revision, we have updated the equations, provided more modeling details, and moved the model description to the main text to reduce possible confusions.
In the implementation of the “mass underestimation” condition, the mass used to compute the policy is the underestimated mass ( ), whereas the actual mass is used when simulating the feedforward trajectories. Corrective submovements are analyzed separately and are not required for the planning-deficit findings reported here.
Answers of the three specific questions:
a) We mistakenly wrote a continuous-time infinite-horizon cost function in our original manuscript, whereas our controller is actually implemented as a discrete-time finite-horizon LQG with a terminal cost, over a horizon set by the utility-based optimal movement duration T<sub>opt</sub>. The underestimated mass is used in both the utility model (to determine T<sub>opt</sub>) and in the control computation (i.e., internal model), while the true mass is used when simulating the movement. This mismatch captures the central idea of feedforward planning based on an incorrect internal model.
b) As described, our model includes signal-dependent motor noise and sensory noise, following Todorov (2005). We also evaluated whether increased noise levels in microgravity could account for the observed behavioral changes. Simulation results showed that increasing either source of noise did not alter the main conclusions or reverse the trends in our key metrics. Moreover, our experimental data showed no significant increase in endpoint variability in microgravity (see analyses and results in Figure 2—figure supplement 3 & 4), making it unlikely that increased sensorimotor noise alone accounts for the observed slowing and submovement changes.
c) In our framework, the time-varying gains {L<sub>K</sub>,K<sub>K</sub>}define the feedforward and feedback components of the control policy. While both gains are computed based on a stochastic optimal control formulation (including noise), for comparison with behavior we simulate only the nominal feedforward plan, by turning off both noise and feedback: . This defines a deterministic open-loop trajectory, which we use to capture planning-level effects such as peak timing shifts under mass underestimation. Feedback corrections via gains exist in the full model but are not involved in these specific analyses. We clarified this modeling choice and its behavioral relevance in the revised text.
We have updated the equations and moved the model description into the main text in the revised manuscript to avoid confusion.
(3) Brevity of movements and speed-accuracy trade-off
The tested movements are much faster (average duration approx. 350 ms) than similar self-paced movements that have been studied in other works (e.g., Wang et al., J Neurophysiology, 2016; Berret et al., PLOS Comp Biol, 2021, where movements can last about 900-1000 ms). This is consistent with the instructions to reach quickly and accurately, in line with a speed-accuracy trade-off. Was this instruction given to highlight the inertial effects related to the arm's anisotropy? One may however, wonder if the same results would hold for slower self-paced movements (are they also with reduced speed compared to Earth performance?). Moreover, a few other important questions might need to be addressed for completeness: how to ensure that astronauts did remember this instruction during the flight? (could the control group move faster because they better remembered the instruction?). Did the taikonauts perform the experiment on their own during the flight, or did one taikonaut assume the role of the experimenter?
Response (9): Thanks for highlighting the brevity of movements in our experiment. Our intention in emphasizing fast movements is to rigorously test whether movement is indeed slowed down in microgravity. The observed prolonged movement duration clearly shows that microgravity affects people’s movement duration, even when they are pushed to move fast. The second reason for using fast movement is to highlight that feedforward control is affected in microgravity. Mass underestimation specifically affects feedforward control in the first place, shown by the microgravity-related changes in peak velocity/acceleration. Slow movement would inevitably have online corrections that might obscure the effect of mass underestimation. Note that movement slowing is not only observed in our speed-emphasized reaching task, but also in whole-arm pointing in other astronauts’ studies (Berger, 1997; Sangals, 1999), which have been quoted in our paper. We thus believe these findings are generalizable.
Regarding the consistency of instructions: all our experiments conducted in the Tiangong space station were monitored in real time by experimenters in the control center located in Beijing. The task instructions were presented on the initial display of the data acquisition application and ample reading time was allowed. All the pre-, in-, and post-flight test sessions were administered by the same group of personnel with the same instruction. It is common that astronauts serve both as participants and experimenters at the same time. And, they were well trained for this type of role on the ground. Note that we had multiple pre-flight test sessions to familiarize them with the task. All these rigorous measures were in place to obtain high-quality data. In the revision, we included these experimental details for readers that are not familiar with space studies, and provided the rationales for emphasizing fast movements.
Citations:
Berger, M., Mescheriakov, S., Molokanova, E., Lechner-Steinleitner, S., Seguer, N., & Kozlovskaya, I. (1997). Pointing arm movements in short- and long-term spaceflights. Aviation, Space, and Environmental Medicine, 68(9), 781–787.
Sangals, J., Heuer, H., Manzey, D., & Lorenz, B. (1999). Changed visuomotor transformations during and after prolonged microgravity. Experimental Brain Research. Experimentelle Hirnforschung. Experimentation Cerebrale, 129(3), 378–390.
(4) No learning effect
This is a surprising effect, as mentioned by the authors. Other studies conducted in microgravity have indeed revealed an optimal adaptation of motor patterns in a few dozen trials (e.g., Gaveau et al., eLife, 2016). Perhaps the difference is again related to single-joint versus multi-joint movements. This should be better discussed given the impact of this claim. Typically, why would a "sensory bias of bodily property" persist in microgravity and be a "fundamental constraint of the sensorimotor system"?
Response (10): We believe that the presence or absence of adaptation between our study and Gaveau et al.’s study cannot be simply attributed to single-joint versus multi-joint movements. Their adaptation concerned incorporating microgravity into movement control to minimize effort, whereas ours concerned accurately perceiving body mass. Gaveau et al.’s task involved large-amplitude vertical reaching, a scenario in which gravity strongly affects joint torques and movement execution. Thus, adaptation to microgravity can lead to better execution, providing a strong incentive for learning. By contrast, our task consisted of small-amplitude horizontal movements, where the gravitational influence on biomechanics is minimal.
More importantly, we believe the lack of adaptation for mass underestimation is not totally surprising. When an inertial change is perceived (such as an extra weight attached to the forearm, as in previous motor adaptation studies), people can adapt their reaching within tens of trials. In that case, sensory cues are veridical, as they correctly signal the inertial perturbation. However, in microgravity, reduced gravitational pull and proprioceptive inputs constantly inform the controller that the body mass is less than its actual magnitude. In other words, sensory cues in space are misleading for estimating body mass. The resulting sensory bias prevents the sensorimotor system from adapting. Our initial explanation on this matter was too brief; we expanded it in the revised Discussion.
Reviewer #3 (Public review):
Summary:
The authors describe an interesting study of arm movements carried out in weightlessness after a prolonged exposure to the so-called microgravity conditions of orbital spaceflight. Subjects performed radial point-to-point motions of the fingertip on a touch pad. The authors note a reduction in movement speed in weightlessness, which they hypothesize could be due to either an overall strategy of lowering movement speed to better accommodate the instability of the body in weightlessness or an underestimation of body mass. They conclude for the latter, mainly based on two effects. One, slowing in weightlessness is greater for movement directions with higher effective mass at the end effector of the arm. Two, they present evidence for an increased number of corrective submovements in weightlessness. They contend that this provides conclusive evidence to accept the hypothesis of an underestimation of body mass.
Strengths:
In my opinion, the study provides a valuable contribution, the theoretical aspects are well presented through simulations, the statistical analyses are meticulous, the applicable literature is comprehensively considered and cited, and the manuscript is well written.
Weaknesses:
Nevertheless, I am of the opinion that the interpretation of the observations leaves room for other possible explanations of the observed phenomenon, thus weakening the strength of the arguments.
First, I would like to point out an apparent (at least to me) divergence between the predictions and the observed data. Figures 1 and S1 show that the difference between predicted values for the 3 movement directions is almost linear, with predictions for 90º midway between predictions for 45º and 135º. The effective mass at 90º appears to be much closer to that of 45º than to that of 135º (Figure S1A). But the data shown in Figure 2 and Figure 3 indicate that movements at 90º and 135º are grouped together in terms of reaction time, movement duration, and peak acceleration, while both differ significantly from those values for movements at 45º.
Furthermore, in Figure 4, the change in peak acceleration time and relative time to peak acceleration between 1g and 0g appears to be greater for 90º than for 135º, which appears to me to be at least superficially in contradiction with the predictions from Figure S1. If the effective mass is the key parameter, wouldn't one expect as much difference between 90º and 135º as between 90º and 45º? It is true that peak speed (Figure 3B) and peak speed time (Figure 4B) appear to follow the ordering according to effective mass, but is there a mathematical explanation as to why the ordering is respected for velocity but not acceleration? These inconsistencies weaken the author's conclusions and should be addressed.
Response (11): Indeed, the model predicts an almost equal separation between 45° and 90° and between 90° and 135°, while the data indicate that the spacing between 45° and 90° is much smaller than between 90° and 135°. We do not regard the divergence as evidence undermining our main conclusion since 1) the model is a simplification of the actual situation. For example, the model simulates an ideal case of moving a point mass (effective mass) without friction and without considering Coriolis and centripetal torques. 2) Our study does not make quantitative predictions of all the key kinematic measures; that will require model fitting, parameter estimation, and posture-constrained reaching experiments; instead, our study uses well-established (though simplified) models to qualitatively predict the overall behavioral pattern we would observe. For this purpose, our results are well in line with our expectations: though we did not find equal spacing between direction conditions, we do confirm that the key kinematic measures (Figure 2 and Figure 3 as questioned) show consistent directional trends between model predictions and empirical data. We added new analysis results on this matter: the directional effect we observed (how the key measures changed in microgravity across direction condition) is significantly correlated with our model predictions in most cases. Please check our detailed response (2) above. These results are also added in the revision.
We also highlight in the revision that our modeling is not to quantitatively predict reaching behaviors in space, but to qualitatively prescribe that how mass underestimation, but not the conservative control strategy, can lead to divergent predictions about key kinematic measures of fast reaching.
Then, to strengthen the conclusions, I feel that the following points would need to be addressed:
(1) The authors model the movement control through equations that derive the input control variable in terms of the force acting on the hand and treat the arm as a second-order low-pass filter (Equation 13). Underestimation of the mass in the computation of a feedforward command would lead to a lower-than-expected displacement to that command. But it is not clear if and how the authors account for a potential modification of the time constants of the 2nd order system. The CNS does not effectuate movements with pure torque generators. Muscles have elastic properties that depend on their tonic excitation level, reflex feedback, and other parameters. Indeed, Fisk et al. showed variations of movement characteristics consistent with lower muscle tone, lower bandwidth, and lower damping ratio in 0g compared to 1g. Could the variations in the response to the initial feedforward command be explained by a misrepresentation of the limbs' damping and natural frequency, leading to greater uncertainty about the consequences of the initial command? This would still be an argument for unadapted feedforward control of the movement, leading to the need for more corrective movements. But it would not necessarily reflect an underestimation of body mass.
Fisk, J. O. H. N., Lackner, J. R., & DiZio, P. A. U. L. (1993). Gravitoinertial force level influences arm movement control. Journal of neurophysiology, 69(2), 504-511.
Response (12): We agree that muscle properties, tonic excitation level, proprioception-mediated reflexes all contribute to reaching control. Fisk et al. (1993) study indeed showed that arm movement kinematics change, possibly owing to lower muscle tone and/or damping. However, reduced muscle damping and reduced spindle activity are more likely to affect feedback-based movements. Like in Fisk et al.’s study, people performed continuous arm movements with eyes closed; thus their movements largely relied on proprioceptive control. Our major findings are about the feedforward control, i.e., the reduced and “advanced” peak velocity/acceleration in discrete and ballistic reaching movements. Note that the peak acceleration happens as early as approximately 90-100ms into the movements, clearly showing that feedforward control is affected -- a different effect from Fisk et al’s findings. It is unlikely that people “advanced” their peak velocity/acceleration because they feel the need for more later corrective movements. Thus, underestimation of body mass remains the most plausible explanation.
(2) The movements were measured by having the subjects slide their finger on the surface of a touch screen. In weightlessness, the implications of this contact are expected to be quite different than those on the ground. In weightlessness, the taikonauts would need to actively press downward to maintain contact with the screen, while on Earth, gravity will do the work. The tangential forces that resist movement due to friction might therefore be different in 0g. This could be particularly relevant given that the effect of friction would interact with the limb in a direction-dependent fashion, given the anisotropy of the equivalent mass at the fingertip evoked by the authors. Is there some way to discount or control for these potential effects?
Response (13): We agree that friction might play a role here, but normal interaction with a touch screen typically involves friction between 0.1N and 0.5N (e.g., Ayyildiz et al., 2018). We believe that the directional variation of the friction is even smaller than 0.1N. It is very small compared to the force used to accelerate the arm for the reaching movement (10N-15N). Thus, friction anisotropy is unlikely to explain our data. Indeed, our readers might have the same concern, we thus added some discussion about possible effect of friction.
Citation: Ayyildiz M, Scaraggi M, Sirin O, Basdogan C, Persson BNJ. Contact mechanics between the human finger and a touchscreen under electroadhesion. Proc Natl Acad Sci U S A. 2018 Dec 11;115(50):12668-12673.
(3) The carefully crafted modelling of the limb neglects, nevertheless, the potential instability of the base of the arm. While the taikonauts were able to use their left arm to stabilize their bodies, it is not clear to what extent active stabilization with the contralateral limb can reproduce the stability of the human body seated in a chair in Earth gravity. Unintended motion of the shoulder could account for a smaller-than-expected displacement of the hand in response to the initial feedforward command and/or greater propensity for errors (with a greater need for corrective submovements) in 0g. The direction of movement with respect to the anchoring point could lead to the dependence of the observed effects on movement direction. Could this be tested in some way, e.g., by testing subjects on the ground while standing on an unstable base of support or sitting on a swing, with the same requirement to stabilize the torso using the contralateral arm?
Response (14): Body stabilization is always a challenge for human movement studies in space. We minimized its potential confounding effects by using left-hand grasping and foot straps for postural support throughout the experiment. We think shoulder stability is an unlikely explanation because unexpected shoulder instability should not affect the feedforward (early) part of the ballistic reaching movement: the reduced peak acceleration and its early peak were observed at about 90-100ms after movement initiation. This effect is too early to be explained by an expected stability issue. This argument is now mentioned in the revised Discussion.
The arguments for an underestimation of body mass would be strengthened if the authors could address these points in some way.
Recommendations for the authors:
Reviewing Editor Comments:
General recommendation
Overall, the reviewers agreed this is an interesting study with an original and strong approach. Nonetheless, there were significant weaknesses identified. The main criticism is that there is insufficient evidence for the claim that the movement slowing is due to mass underestimation, rather than other explanations for the increased feedback corrections. To bolster this claim, the reviewers have requested a deeper quantitative analysis of the directional effect and comparison to model predictions. They have also suggested that a 2-dof arm model could be used to predict how mass underestimation would influence multi-joint kinematics, and this should be compared to the data. Alternatively, or additionally, a control experiment could be performed (described in the reviews). We do realize that some of these options may not be feasible or practical. Ultimately, we leave it to you to determine how best to strengthen and solidify the argument for mass underestimation, rather than other causes.
As an alternative approach, you could consider tempering the claim regarding mass underestimation and focus more on the result that slower movements in microgravity are not simply a feedforward, rescaling of the movement trajectories, but rather, have greater feedback corrections. In this case, the reviewers feel it would still be critical to explain and discuss potential reasons for the corrections beyond mass underestimation.
We hope that these points are addressable, either with new analyses, experiments, or with a tempering of the claims. Addressing these points would help improve the eLife assessment.
Reviewer #1 (Recommendations for the authors):
(1) Move model descriptions to the main text to present modelling choices in more detail
Response (15): Thank you for the suggestion. We have moved the model descriptions to the main text to present the modeling choices in more detail and to allow readers to better cross-reference the analyses.
(2) Perform quantitative comparisons of the directional effect with the model's predictions, and add raw kinematic traces to illustrate the effect in more detail.
Response (16): Thanks for the suggestion, we have added the raw kinematics figure from a representative participant and please refer to Response (2) above for the comparisons of directional effect.
(3) Explore the effect of varying cost parameters in addition to mass estimation error to estimate the proportion of data explained by the underestimation hypothesis.
Response (17): Thank you for the suggestion. This has already been done—please see Response (1) above.
Reviewer #2 (Recommendations for the authors):
Minor comments:
(1) It must be justified early on why reaction times are being analyzed in this work. I understood later that it is to rule out any global slowing down of behavioral responses in microgravity.
Response (18): Exactly, RT results are informative about the absence of a global slowing down. Contrary to the conservative-strategy hypothesis, taikonauts did not show generalized slowing; they actually had faster reaction times during spaceflight, incompatible with a generalized slowing strategy. Thanks for point out; we justified that early in the text.
(2) Since the results are presented before the methods, I suggest stressing from the beginning that the reaching task is performed on a tablet and mentioning the instructions given to the participants, to improve the reading experience. The "beep" and "no beep" conditions also arise without obvious justification while reading the paper.
Response (19): Great suggestions. We now give out some experimental details and rationales at the beginning of Results.
(3) Figure 1C: The vel profiles are not returning to 0 at the end, why? Is it because the feedback gain is computed based on the underestimated mass or because a feedforward controller is applied here? Is it compatible with the experimental velocity traces?
Response (20): Figure. 1C shows the forward simulation under the optimal control policy. In our LQG formulation the terminal velocity is softly penalized (finite weight) rather than hard-constrained to zero; with a fixed horizon° the optimal solution can therefore end with a small residual velocity.
In the behavioral data, the hand does come to rest: this is achieved by corrective submovements during the homing phase.
(4) Left-skewed -> I believe this is right-skewed since the peak velocity is earlier.
Response (21): Yes, it should be right-skewed, thanks for point that out.
(5) What was the acquisition frequency of the positional data points? (on the tablet).
Response (22): The sampling frequency is 100 Hz. Thanks for pointing that out; we’ve added this information to the Methods.
(6) Figure S1. The planned duration seems to be longer than in the experiment (it is more around 500 ms for the 135-degree direction in simulation versus less than 400 ms in the experiment). Why?
Response (23): We apologize for a coding error that inadvertently multiplied the body-mass parameter by an extra factor, making the simulated mass too high. We have corrected the code, rerun the simulations, and updated Figures 1 and S1; all qualitative trends remain unchanged, and the revised movement durations (≈300–400 ms) are closer to the experimental values.
(7) After Equation 13: "The control law is given by". This is not the control law, which should have a feedback form u=K*x in the LQ framework. This is just the dynamic equations for the auxiliary state and the force. Please double-check the model description.
Response (24): Thank you for point this out. We have updated and refined all model equations and descriptions, and moved the model description from the Supplementary Materials to the main text; please see the revised manuscript.
Reviewer #3 (Recommendations for the authors):
(1) I have a concern about the interpretation of the anisotropic "equivalent mass". From my understanding, the equivalent mass would be what an external actor would feel as an equivalent inertia if pushing on the end effector from the outside. But the CNS does not push on the arm with a pure force generator acting at the hand to effectuate movement. It applies torque around the joints by applying forces across joints with muscles, causing the links of the arm to rotate around the joints. If the analysis is carried out in joint space, is the effective rotational inertia of the arm also anisotropic with respect to the direction of the movement of the hand? In other words, can the authors reassure me that the simulations are equivalent to an underestimation of the rotational inertia of the links when applied to the joints of the limb? It could be that these are mathematically the same; I have not delved into the mathematics to convince myself either way. But I would appreciate it if the authors could reassure me on this point.
Response (25): Thank you for raising this point. In our work, “equivalent mass” denotes the operational-space inertia projected along the hand-movement direction u, computed as:

This formulation describes the effective mass perceived at the end effector along a given direction, and is standard in operational-space control.
Although the motor command can be coded as either torque/force in the CNS, the actual executions are equivalent no matter whether it is specified as endpoint forces or joint torques, since force and torque are related by  . For small excursions as investigated here, this makes the directional anisotropy in endpoint inertia consistent with the anisotropy of the effective joint-space inertia required to produce the same endpoint motion. Conceptually, therefore, our “mass underestimation” manipulation in operational space corresponds to underestimating the required joint-space inertia mapped through the Jacobian. Since our behavioral data are hand positions, using the operational-space representation is the most direct and appropriate way for modeling.
(2) I would also like to suggest one more level of analysis to test their hypothesis. The authors decomposed the movements into submovements and measured the prevalence of corrective submovements in weightlessness vs. normal gravity. The increase in corrective submovements is consistent with the hypothesis of a misestimation of limb mass, leading to an unexpectedly smaller displacement due to the initial feedforward command, leading to the need for corrections, leading to an increased overall movement duration. According to this hypothesis, however, the initial submovement, while resulting in a smaller than expected displacement, should have the same duration as the analogous movements performed on Earth. The authors could check this by analyzing the duration of the extracted initial submovements.
Response (26): We appreciate the reviewer’s suggestion regarding the analysis of the initial submovement duration. In our decomposition framework, each submovement is modeled as a symmetric log-normal (bell-shaped) component, such that the time to peak speed is always half of the component duration. Thus, the initial submovement duration is directly reflected in the initial submovement peak-speed time already reported in our original manuscript (Figure. 5F).
However, we respectfully disagree with the assumption that mass underestimation would necessarily yield the same submovement duration as on Earth. Under mass underestimation, the movement is effectively under-actuated, and the initial submovement can terminate prematurely, leading to a shorter duration. This is indeed what we observed in the data. Therefore, our reported metrics already address the reviewer’s proposal and support the conclusion that mass underestimation reduces the initial submovement duration in microgravity. Per your suggestion, we now added one more sentence to explain to the reader that initial submovement peak-speed time reflect the duration of the initial submovement.
Some additional minor suggestions:
(1) I believe that it is important to include the data from the control subjects, in some form, in the main article. Perhaps shading behind the main data from the taikonauts to show similarities or differences between groups. It is inconvenient to have to go to the supplementary material to compare the two groups, which is the main test of the experiment.
Response (27): Thank you for the suggestion. For all the core performance variables, the control group showed flat patterns, with no changes across test sessions at all. Thus, including these figures (together with null statistical results) in the main text would obscure our central message, especially given the expanded length of the revised manuscript (we added model details and new analysis results). Instead, following eLife’s format, we have reorganized the Supplementary Material so that each experimental figure has a corresponding supplementary figure showing the control data. This way, readers can quickly locate the control results and directly compare them with the experimental data, while keeping the main text focused.
(2) "Importantly, sensory estimate of bodily property in microgravity is biased but evaded from sensorimotor adaptation, calling for an extension of existing theories of motor learning." Perhaps "immune from" would be a better choice of words.
Response (28): Thanks for the suggestion, we edited our text accordingly.
(3) "First, typical reaching movement exhibits a symmetrical bell-shaped speed profile, which minimizes energy expenditure while maximizing accuracy according to optimal control principles (Todorov, 2004)." While Todorov's analysis is interesting and well accepted, it might be worthwhile citing the original source on the phenomenon of bell-shaped velocity profiles that minimize jerk (derivative of acceleration) and therefore, in some sense, maximize smoothness. Flash and Hogan, 1985.
Response (29): Thanks for the suggestion, we added the citation of minimum jerk.
(4) "Post-hoc analyses revealed slower reaction times for the 45° direction compared to both 90° (p < 0.001, d = 0.293) and 135° (p = 0.003, d = 0.284). Notably, reactions were faster during the in-flight phase compared to pre-flight (p = 0.037, d = 0.333), with no significant difference between in-flight and post-flight phases (p = 0.127)." What can one conclude from this?
Response (30): Although these decreases reached statistical significance, their magnitudes were small. The parallel pattern across groups suggests the effect is not driven by microgravity, but is more plausibly a mild learning/practice effect. We now mentioned this in the Discussion.
(5) "In line with predictions, peak acceleration appeared significantly earlier in the 45° direction than other directions (45° vs. 90°, p < 0.001, d = 0.304; 45° vs. 135°, p < 0.001, d = 0.271)." Which predictions? Because the effective mass is greater at 45º? Could you clarify the prediction?
Response (31): We should be more specific here; thank you for raising this. The predictions are the ones about peak acceleration timing (shown in Fig. 1H). We now modified this sentence as:
“In line with model predictions (Figure 1H), ….”.
(6) Figure 2: Why do 45º movements have longer reaction times but shorter movement durations?
Response (32): Appreciate your careful reading of the results. We believe this is possibly due to flexible motor control across conditions and trials, i.e., people tend to move faster when people react slower with longer reaction time. This has been reflected in across-direction comparisons (as spotted by the reviewer here), and it has also been shown within participant and across participants: For both groups, we found a significant negative correlation between movement duration (MD) and reaction time (RT), both across and within individuals (Figure 2—figure supplement 5). This finding indicates that participants moved faster when their RT was slower, and vice versa. This flexible motor adjustment, likely due to the task requirement for rapid movements, remained consistent during spaceflight.
Additionally, certain assignments teach you how to meet the expectations for professional writing in a given field. Depending on the class, you might be asked to write a lab report, a case study, a literary analysis, a business plan, or an account of a personal interview. You will need to learn and follow the standard conventions for those types of written products.
it's important to know the different ways of writing, otherwise we can make mistakes in writing assignments. Not only in the way of writing but the way you read or speak.
for the backup infrastructure configuration
Maybe we should mention something like "and on protected VMs"? But this section is about Infrastructure, so I'm not sure. But without it it seems that DK used only for he infrastructure
Guide literatureis particularly prone to adopting this perspective since its market is the visitor population, for whom itsupplies not only empirical data but also appropriate cultural images
SLAYYY look at the primary sources they use? the guide literature can be misleading as they are trying to market a place to the public - they are more likely to highlight hte booming tourist industry and beautiful landscape than the manky iron works and coal mines nearby as well as the booming noisy ports!
Reviewer #2 (Public review):
(1) Summary
In this work, the authors aim to elucidate how a viral surface protein behaves in a membrane environment and how its large-scale motions influence the exposure of antibody-binding sites. Using long-timescale, all-atom molecular dynamics simulations of a fully glycosylated, full-length protein embedded in a virus-like membrane, the study systematically examines the coupling between ectodomain motion, transmembrane orientation, membrane interactions, and epitope accessibility. By comparing multiple model variants that differ in cleavage state, initial transmembrane configuration, and presence of the cytoplasmic tail, the authors aim to identify general features of protein-membrane dynamics relevant to antibody recognition.
(2) Strengths
A major strength of this study is the scope and ambition of the simulations. The authors perform multiple microsecond-scale simulations of a highly complex, biologically realistic system that includes the full ectodomain, transmembrane region, cytoplasmic tail, glycans, and a heterogeneous membrane. Such simulations remain technically challenging, and the work represents a substantial computational and methodological effort.
The analysis provides a clear and intuitive description of large-scale protein motions relative to the membrane, including ectodomain tilting and transmembrane orientation. The finding that the ectodomain explores a wide range of tilt angles while the transmembrane region remains more constrained, with limited correlation between the two, offers useful conceptual insight into how global motions may be accommodated without large rearrangements at the membrane anchor.
Another strength is the explicit consideration of membrane and glycan steric effects on antibody accessibility. By evaluating multiple classes of antibodies targeting distinct regions of the protein, the study highlights how membrane proximity and glycan dynamics can differentially influence access to different epitopes. This comparative approach helps place the results in a broader immunological context and may be useful for readers interested in antibody recognition or vaccine design.
Overall, the results are internally consistent across multiple simulations and model variants, and the conclusions are generally well aligned with the data presented.
(3) Weaknesses
The main limitations of the study relate to sampling and model dependence, which are inherent challenges for simulations of this size and complexity. Although the simulations are long by current standards, individual trajectories explore only portions of the available conformational space, and several conclusions rely on pooling data across a limited number of replicas. This makes it difficult to fully assess the robustness of some quantitative trends, particularly for rare events such as specific epitope accessibility states.
In addition, several aspects of the model construction, including the treatment of missing regions, loop rebuilding, and initial configuration choices, are necessarily approximate. While these approaches are reasonable and well motivated, the extent to which some conclusions depend on these modeling choices is not always fully clear from the current presentation.
Finally, the analysis of antibody accessibility is based on geometric and steric criteria, which provide a useful first-order approximation but do not capture potential conformational adaptations of antibodies or membrane remodeling during binding. As a result, the accessibility results should be interpreted primarily as model-based predictions rather than definitive statements about binding competence.
Despite these limitations, the study provides a valuable and carefully executed contribution, and its datasets and analytical framework are likely to be useful to others interested in protein-membrane interactions and antibody recognition.
Reviewer #3 (Public review):
Summary:
This study uses large-scale all-atom molecular dynamics simulations to examine the conformational plasticity of the HIV-1 envelope glycoprotein (Env) in a membrane context, with particular emphasis on how the transmembrane domain (TMD), cytoplasmic tail (CT), and membrane environment influence ectodomain orientation and antibody epitope exposure. By comparing Env constructs with and without the CT, explicitly modeling glycosylation, and embedding Env in an asymmetric lipid bilayer, the authors aim to provide an integrated view of how membrane-proximal regions and lipid interactions shape Env antigenicity, including epitopes targeted by MPER-directed antibodies.
Strengths:
A key strength of this work is the scope and realism of the simulation systems. The authors construct a very large, nearly complete Env-scale model that includes a glycosylated Env trimer embedded in an asymmetric bilayer, enabling analysis of membrane-protein interactions that are difficult to capture experimentally. The inclusion of specific glycans at reported sites, and the focus on constructs with and without the CT, are well motivated by existing biological and structural data.
The simulations reveal substantial tilting motions of the ectodomain relative to the membrane, with angles spanning roughly 0-30{degree sign} (and up to ~50{degree sign} in some analyses), while the ectodomain itself remains relatively rigid. This framing, that much of Env's conformational variability arises from rigid-body tilting rather than large internal rearrangements, is an important conceptual contribution. The authors also provide interesting observations regarding asymmetric bilayer deformations, including localized thinning and altered lipid headgroup interactions near the TMD and CT, which suggest a reciprocal coupling between Env and the surrounding membrane.
The analysis of antibody-relevant epitopes across the prefusion state, including the V1/V2 and V3 loops, the CD4 binding site, and the MPER, is another strength. The study makes effective use of existing experimental knowledge in this context, for example, by focusing on specific glycans known to occlude antibody binding, to motivate and interpret the simulations.
Weaknesses:
While the simulations are technically impressive, the manuscript would benefit from more explicit cross-validation against prior experimental and computational work throughout the Results and Discussion, and better framing in the introduction. Many of the reported behaviors, such as ectodomain tilting, TMD kinking, lipid interactions at helix boundaries, and aspects of membrane deformation, have been described previously in a range of MD studies of HIV Env and related constructs (e.g., PMC2730987, PMC2980712, PMC4254001, PMC4040535, PMC6035291, PMC12665260, PMID: 33882664, PMC11975376). Clearly situating the present results relative to these studies would strengthen the paper by clarifying where the simulations reproduce established behavior and where they extend it to more complete or realistic systems.
A related limitation is that the work remains largely descriptive with respect to conformational coupling. Numerous experimental studies have demonstrated functional and conformational coupling between the TMD, CT, and the antigenic surface, with effects on Env stability, infectivity, and antibody binding (e.g., PMC4701381, PMC4304640, PMC5085267). In this context, the statement that ectodomain and TMD tilting motions are independent is a strong conclusion that is not fully supported by the analyses presented, particularly given the authors' acknowledgment that multiple independent simulations are required to adequately sample conformational space. More direct analyses of coupling, rather than correlations inferred from individual trajectories, would help align the simulations with the existing experimental literature. Given the scale of these simulations, a more thorough analysis of coupling could be this paper's most seminal contribution to the field.
The choice of membrane composition also warrants deeper discussion. The manuscript states that it relies on a plasma membrane model derived from a prior simulation-based study, which itself is based on host plasma membrane (PMID: 35167752), but experimental analyses have shown that HIV virions differ substantially from host plasma membranes (e.g., PMC46679, PMC1413831, PMC10663554, PMC5039752, PMC6881329). In particular, virions are depleted in PC, PE, and PI, and enriched in phosphatidylserine, sphingomyelins, and cholesterol. These differences are likely to influence bilayer thickness, rigidity, and lipid-protein interactions and, therefore, may affect the generality of the conclusions regarding Env dynamics and antigenicity. Notably, the citation provided for membrane composition is a laboratory self-citation, a secondary source, rather than a primary experimental study on plasma membrane composition.
Finally, there are pervasive issues with citation and methodological clarity. Several structural models are referred to only by PDB ID without citation, and in at least one case, a structure described as cryo-EM is in fact an NMR-derived model. Statements regarding residue flexibility, missing regions in structures, and comparisons to prior dynamics studies are often presented without appropriate references. The Methods section also lacks sufficient detail for a system of this size and complexity, limiting readers' ability to assess robustness or reproducibility.
With stronger integration of prior experimental and computational literature, this work has the potential to serve as a valuable reference for how Env behaves in a realistic, glycosylated, membrane-embedded context. The simulation framework itself is well-suited for future studies incorporating mutations, strain variation, antibodies, inhibitors, or receptor and co-receptor engagement. In its current form, the primary contribution of the study is to consolidate and extend existing observations within a single, large-scale model, providing a useful platform for future mechanistic investigations.