Author response:
The following is the authors’ response to the original reviews.
Public Reviews:
Reviewer #1 (Public review):
Summary:
In this paper, the authors analyze connectome data from Drosophila and compare the physical wiring with functional connectivity estimated from calcium imaging data. They quantify structure-function relationships as a correlation of the two connectivity modalities. They report correlations roughly comparable to what has been described in the literature on sc/fc relationships in mammalian connectome data at the meso-scale. They then repeat their analysis, focusing on segregated versus unsegregated synapses. They derive separate connectomes using one or the other class of synapse. They show differential contributions to the sc/fc relationships by segregated versus unsegregated synapses.
Strengths:
There is nice synthesis of multimodal imaging data (Ca and EM data from flies and meso-scale data from human and marmoset).
Thank you very much for your comments.
Weaknesses:
(1) The paper is written in an unusual way. The introduction intermingles results with background, making it hard to figure out what precisely is being tested.
Thank you for pointing this out. We have revised the introduction to make it more concise.
(2) There are also major methodological gaps. Though the mammalian connectomes are used as a point of reference, no descriptions of their origins or processing are included.
The reanalysis of marmoset data is presented in Ext. Data Figure. However, as pointed out by other reviewers, the data was obtained in [10], and the processing is also described in [10]. Therefore, we have revised the caption and removed the Ethics Declaration.
(3) A major weakness stems from the actual calculation of the sc/fc correlation. In general, SC is sparse. In the case of the EM connectomes, it is *exceptionally* sparse (most neural elements are not connected to one another). The authors calculated sc/fc coupling by correlating the off-diagonal elements of sc (the logarithm of its edge weights) and fc matrices with one another. The logarithmic transformation yields a value of infinity for all zero entries. The authors simply impute these elements with 0. This makes no sense and, depending on whether these zero elements are distributed systematically versus uniformly random, could either inflate or deflate the sc/fc correlations. Care must be taken here.
Thank you for pointing this out. As you mentioned, the SC matrix becomes increasingly sparse as the number of ROIs increases (Ext. Data Fig.2-2b). In contrast, the FC matrix may contain values even when there are no direct connections between ROIs (indirect connections). We conducted an investigation into this issue. To deal with this issue, Honey et al. (2009) [6] resampled the elements of the SC matrix in rank order using a Gaussian distribution and calculated the FC-SC correlation between this resampled SC and FC.
Ext. Data Fig.2-2a shows a comparison between resampled SC (Honey et al.’s method) and log-scaled SC (our method). Up to 200 ROIs, the proportion of SC matrix elements that are zero is less than 10% (Ext. Data Fig.2-2b), and there is little zero replacement of logarithmic elements. In this situation, replacing with Gaussian arithmetic tends to increase the correlation coefficient (Ext. Data Fig.2-2a). On the other hand, with 10,000 ROIs, where sparsity is extremely high, the proportion of SC matrix elements that are zero exceeds 70%. In this situation, 70-80% of the zeros are randomly assigned from the smaller end of the Gaussian distribution, which causes a lowering of the correlation coefficient (Ext. Data Fig.2-2a, c, d). For these reasons, we believe that log-scaled SC has less bias than resampling with a Gaussian distribution, and conclude that using log-scaled SC as is in this paper is reasonable. Log-scaled SC has also been used in previous studies [9, 68] and is considered a simple method for showing the relationship (correlation) between FC and SC. To show that we have considered this issue, Ext. Data Fig.2-2 has been added to the manuscript.
(4) Further, in constructing the segregated versus unsegregated connectomes, they use absolute thresholds for collecting synapses. It is unclear, however, whether similar numbers of synapses were included in both matrices. If the number is different, that might explain the differential relationship with fc; one matrix has more non-zero entries (and as noted earlier, those zero entries are problematic).
Author response image 1.
a, Sparsity rate histogram of SC matrix with cPPSSI (0-0.1) and subsampled null SC matrices corresponding Fig.4e. Red line indicates sparsity rate of SC matrix with cPPSSI (0-0.1). b, Sparsity rate histogram of SC matrix with cPPSSI (0.9-1) and subsampled null SC matrices corresponding Fig.4f. c, Sparsity rate histogram of SC matrix with reciprocal synapse (≤2𝜇𝑚) and subsampled null SC matrices corresponding Fig.4i.
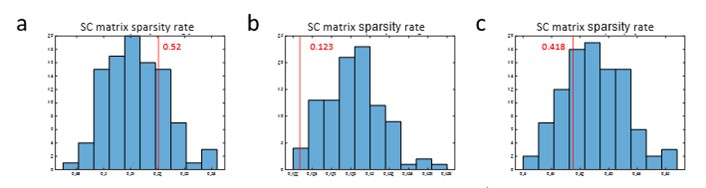
Thank you for pointing this out. The number of synaptic connections in the SC matrix shows a large difference between those extracted from cPPSSI (0-0.1) and cPPSSI (0.9-1) (Fig. 4e, f). However, when null SC matrices (99) were generated for each and compared with the cPPSSI-extracted matrices, the FC-SC correlation was significantly higher or lower. At this point, since the sparsity rates of the null SC matrices differed a lot from that of the SC matrices extracted by cPPSSI, we regenerated the null SC matrices in Fig. 4e and 4i. As shown in Author response image 1, we ensured that the extracted SCs (red lines) fit within the null-generated matrices. This figure was added to Ext. Data Fig.4-5, and the main text was also revised. The sparsity rates are 0.52 for cPPSSI (0-0.1) and 0.123 for cPPSSI (0.9-1). Since both cases involve comparisons with null SC matrices that have closely similar sparsity rates, we believe comparison using log-scaled SC is appropriate.
(5) There was also considerable text (in the results) describing the processing of the Ca data. In this section, the authors frequently refer to some pipelines as "better" or "worse" (more or less effective). But it is not clear what measures they adopted to assess the effectiveness of a pipeline.
Detailed registration flow of Ca data is described in “Preprocessing of D. melanogaster calcium imaging data” in Materials and Methods section (Ext. Data Fig. 1-1a). Then, optimal nuisance factor removal methods and smoothing size were investigated. We used both correlation analysis (FC-SC correlation) and ROC curve analysis (FC-SC detection). Since signals are assumed to be transmitted between regions based on SC, when SC is treated as the ground truth, we considered a pipeline with a FC-SC higher similarity and higher detection to be better. We updated the Results section to include this point.
Reviewer #2 (Public review):
Summary:
Okuno et al. investigate the structure-function relationship in the fruit fly Drosophila melanogaster. To do so, they combine published data from two recent synapse-level connectomes ("hemibrain" and "FlyWire") with a dataset comprising functional whole-brain calcium imaging and behavioural data. First, they investigate the applicability of fMRI pre-processing techniques on data from calcium imaging. They then cross-correlate this pre-processed functional data with structural data extracted from the connectomes, including a comparison to humans. The authors proceed to compare the two connectomes and find significant differences, which they attribute to differences in the accuracy of the synapse detections. Next, they present a novel algorithm to quantify whether neurons are segregated (pre- and postsynapses are spatially separate) or unsegregated (pre- and postsynapses are mixed). Using this approach, they find that unsegregated neurons may contribute more to function than segregated neurons. Applying a general linear model to the functional dataset suggests that activity in two brain areas (Wedge and AVLP) is suppressed during walking. The authors identify a GABAergic neuron in the connectome that could be responsible for this effect and suggest it may provide feedback to the fly's "compass" in the central complex.
Strengths:
The study tackles a relevant question in connectomics by exploring the relationship between structural and functional connectivity in the Drosophila brain. The authors apply a range of established and adapted analytical methods, including fMRI-style preprocessing and a novel synaptic segregation index. The effort to integrate multiple datasets and to compare across species reflects a broad and methodical approach.
Thank you very much for your comments.
Weaknesses:
The manuscript would benefit from a clearer overarching narrative to unify the various analyses, which currently appear somewhat disjointed. While the technical methods are extensive, the writing is often convoluted and lacks crucial details, making it difficult to follow the logic and interpret key findings. Additionally, the conclusions are relatively incremental and lack a compelling conceptual advance, limiting the overall impact of the work.
(1) The introduction currently contains a number of findings and conclusions that would be better placed in the results and discussion to clearly delineate past findings from new results and speculations.
Thank you for pointing this out. We have revised the introduction to make it more concise.
(2) The narrative would benefit greatly from some clear statements along the lines of "we wanted to find out X, therefore we did Y".
Thank you for pointing this out. In many biology papers, the problem is clear, but as you say, this paper starts by comparing the very fine SC and FC of flies, which makes the problem unclear and the results sporadic. We have revised the structure of the introduction.
(3) More concise terminology would be helpful. For example, the connectomes are currently referred to as either "hemibrain", "FlyEM", "whole-brain", or "FlyWire".
Thank you for pointing this out. We revised the manuscript to separate "hemibrain" and "whole-brain" from "connectome." "hemibrain" and "whole-brain" retain their original meanings.
(4) The abstract claims "a new, more robust method to quantify the degree of pre- and post-synaptic segregation". However, the study fails to provide evidence that this method is indeed more robust than existing methods.
We apologize, but this information was not included in the main figures or the Results section. It is presented in the Methods section and Ext. Data Fig. 4-1i, j. We moved related texts from the Methods to the Results section.
(5) The authors define unsegregated neurons as having mixed pre- and postsynapses in the same space. However, this ignores the neurons' topology: a neuron can exhibit a clearly defined dendrite with (mostly) postsynapses and a clearly defined axon with (mostly) presynapses, which then occupy the same space. This is different from genuinely unsegregated neurons with no distinct dendritic and axonal compartments, such as CT1.
Thank you for pointing this out. Regarding this point, we think it is difficult to discuss the neuron’s topology in this paper. We defined PPSSI and demonstrated only that unsegregated neurons with mixed pre- and post-synapses are scattered throughout the brain (Ext. Data Fig. 4-2e). Further research is needed to determine the relationship with morphology in individual neurons.
One possibility is that inhibitory, non-spiking unsegregated neurons, such as CT1 amacrine cell [24, 27, 28] or interneurons in Antennal Lobe [29], may be widely used throughout the brain (WAGN is also a candidate for this). Grimes et al. [34] mentioned “The retina is a beautiful example of a neural network that optimizes signal processing capacity while minimizing cellular cost.” To maintain the signal dynamic range, A17 amacrine cells must optimize the processing units and wiring costs. If one unit equaled one cell, an enormous number of cell bodies would be required, reducing the number of processing units per volume and increasing the energy cost during development. To optimize this, they proposed arranging units capable of parallel processing within a single cell, thereby maximizing the processing units and wiring costs per volume.
Signal bursts might also occur in the central nervous system (CNS), in which case CNS neurons also require dynamic range adjustment. The concept of optimizing processing units per volume is highly compelling and is thought to apply not only to the retina but throughout the entire brain.
(6) It is not entirely clear where the marmoset dataset originates from. Was it generated for this study? If not, why is there a note in the Ethics Declaration?
Marmoset data were reported in [10] and it was not generated for this study. We therefore removed the Ethics Declaration.
(7) On the differences between hemibrain and FlyWire: What is the "18.8 million post-synapses" for FlyWire referring to? The (thresholded) FlyWire synapse table has 130M connections (=postsynapses). Subsetting that synapse cloud to the hemibrain volume still gives ~47M synapses. Further subsetting to only connections between proofread neurons inside the hemibrain volume gives 19.4M - perhaps the authors did something like that? Similarly, the hemibrain synapse table contains 64M postsynapses. Do the 21M "FlyEM" post-synapses refer to proofread neurons only? If the authors indeed used only (post-)synapses from proofread neurons, they need to make that explicit in results and methods, and account for differences in reconstruction status when making any comparisons. For example, the mushroom body in the hemibrain got a lot more attention than in FlyWire, which would explain the differences reported here. For that reason, connection weights are often expressed as, e.g., a fraction of the target's inputs instead of the total number of synapses when comparing connectivity across connectomic datasets. Furthermore, in Figure 3b, it looks like the FlyWire synapse cloud was not trimmed to the exact hemibrain boundaries: for example, the trimmed FlyWire synapse cloud seems to extend further into the optic lobes than the hemibrain volume does.
Thank you for pointing this out. FlyEM connectome data version 1.2 was downloaded and used as described in Data Availability. This data is provided in the format defined by https://neuprint.janelia.org/public/neuprintuserguide.pdf, and we extracted neurons and synapses from it.
The entire segmentation body is 28M segmentations, and there were 99,644 Traced proofread neurons. In addition, there were 73M (pre- or post- alone) synapses, 87M records in synapseSets and 128M records in synapseSet-to-synapse. When we extracted post-synapses between Traced neurons, the total number was 21.4M (i.e., connections from Traced neurons to other body fragments like Orphans were excluded).
The FlyWire dataset (v783) was downloaded from the flywire codex and Zenodo. This dataset contained 139,255 proofread neurons and 54.5M (pair of pre- and post-) synapses, as described in Dorkenwald et al. [13], with 18.8M post-synapses in the regions corresponding to the hemibrain primary ROIs. We have updated the Results and Methods sections by taking into account your comment.
In Fig. 3b, these images were created using a mask that extended the boundaries of the hemibrain primary ROIs, making the boundaries unclear. Therefore, we corrected the images in Fig. 3b by adjusting the mask so that the boundaries were properly aligned.
Reviewer #3 (Public review):
Summary:
In this manuscript, Okuno et al. re-analyze whole-brain imaging data collected in another paper (Brezovec et al., 2024) in the context of the two currently available Drosophila connectome datasets: the partial "FlyEM" (hemibrain) dataset (Scheffer et al., 2020) and the whole-brain "FlyWire" dataset (Dorkenwald et al., 2024). They apply existing fMRI signal processing algorithms to the fly imaging data and compute function-structure correlations across a variety of post-processing parameters (noise reduction methods, ROI size), demonstrating an inverse relationship between ROI size and FC-SC correlation. The authors go on to look at structural connectivity amongst more polarized or less polarized neurons, and suggest that stronger FC-SC correlations are driven by more polarized neurons.
Strengths:
(1) The result that larger mesoscale ROIs have a higher correlation with structural data is interesting. This has been previously discussed in Drosophila in Turner et al., 2021, but here it is quantified more extensively.
(2) The quantification of neuron polarization (PPSSI) as applied to these structural data is a promising approach for quantifying differences in spatial synapse distribution.
Thank you very much for your comments.
Weaknesses:
One should not score noise/nuisance removal methods solely by their impact on FC-SC correlation values, because we do not know a priori that direct structural connections correspond with strong functional correlations. In fact, work in C. elegans, where we have access to both a connectome and neuron-resolution functional data, suggests that this relationship is weak (Yemini et al., 2021; Randi et al., 2023). Similarly, I don't think it's appropriate to tune the confidence scores on the EM datasets using FC-SC correlations as an output metric.
Thank you for pointing this out. We believe that the FC in C. elegans uses cell body dynamics, which is different from the synaptic population dynamics in a region of fly calcium imaging or fMRI data (BOLD [Blood Oxygenation Level Dependent] signal). The BOLD signal in a region is thought to correspond to the neurovascular coupling of synaptic population dynamics. Furthermore, compartmentalization of a neuron has been observed in C. elegans (Hendricks et al., 2012)*, showing different dynamics across neuron compartments. Thus, the dynamics of the cell body and the dynamics of the synaptic population in other regions are different in C. elegans. We speculate that there is some relationship between FC-SC between regions, because the FC-SC correlation in the fly brain reached r=0.87 with 20 ROIs (Fig. 2d). We believe that this result is different from the cell body dynamics in C. elegans.
*Hendricks et al., “Compartmentalized calcium dynamics in a C. elegans interneuron encode head movement,” Nature 487, 99-103 (2012)
Any discussion of FC-SC comparisons should include an analysis of excitatory/inhibitory neurotransmitters, which are available in the fly connectome dataset. However, here the authors do not perform any analyses with neurotransmitter information.
A comparison between FC-SC and neurotransmitter has been written in the Results section. We investigated the ratios of neurotransmitter input (ExtFig.3-2a) and output (Fig. 3f) in each region, and investigated the relationship between this ratio and FC-SC correlation in each neurotransmitter. This revealed significant correlations for acetylcholine (r=0.39, p=0.0013) and GABA (r=-0.25, p=0.046) (Fig. 3g). That is, the higher the percentage of excitatory connections, the higher the FC-SC correlation; conversely, the higher the percentage of inhibitory connections, the lower the FC-SC correlation.
Comparisons between fly and human MRI data are also premature here. Firstly, the fly connectomes, which are derived from neuron-scale EM reconstructions, are a qualitatively different kind of data from human connectomes, which are derived from DSI imaging of large-scale tracts. Likewise, calcium data and fMRI data are very different functional data acquisition methods-the fact that similar processing steps can be used on time-series data does not make them surprisingly similar, and does not in my view, constitute evidence of "similar design concepts."
Thank you for pointing this out. As you say, fiber bundles of DTI and EM connectome are completely different. Nevertheless, the fact remains that the FC-SC correlation is high in both the fly and human brains. As mentioned above, both regional signal from calcium imaging and BOLD signal from fMRI are based on synaptic population dynamics. It was estimated that 43% of the energy consumption in the gray matter is due to synaptic activity of neurons (Harris et al., 2012), and the BOLD signal fluctuates greatly due to this activity. Furthermore, synaptic activity is thought to be much faster than the activity of microglia and astrocytes, so the FC of fMRI is thought to mainly capture the regional correlation of synaptic activity. In other words, in both flies and humans, although the size is different, the pre-synaptic activity in one region and the pre-synaptic activity in another region via neural fibers are being compared in a common manner in the form of FC-SC.
In addition, non-spiking unsegregated neuron exists in mammals as well, such as the amacrine cell of the retina [34], and even pyramidal cells in the neocortex show local mixtures of pre- and post-synapses (Ext. Data Fig.1-2). If a functional unit is realized by local compartment in a neuron as mentioned in [34], the fly will be a powerful model organism for investigating them, and its functional “design concept” may also be useful for mammals.
Harris et al., “The Energetics of CNS White Matter,” J. Neurosci., 2012, 32 (1) 356-371
The comparison of FlyEM/FlyWire connectomes concludes that differences are more likely a result of data processing than of inter-individual variability. If this is the case, the title should not claim that the manuscript covers individual variability.
Thank you for pointing this out. Inter-individual variability is relevant to both SC and FC. Regarding SC, we think the difference in the number of synapses between the two individuals is due to the difference in detection power caused by differences in the resolution of the electron microscope. Regarding FC, as stated in the Results section, “Spatial smoothing is useful for absorbing inter-individual variability and conducting second-level group analysis.” Increasing the smoothing size improves the correlation and AUC between group-averaged FC and SC, indicating the presence of inter-individual variability in FC (Fig. 2b, Ext. Data Fig. 2-1b, especially when the number of ROIs is high). We added this text in the Introduction and Results sections to address your comment.
The analysis of the wedge-AVLP neuron strikes me as highly speculative, given that the alignment precision between the connectome and the functional data is around 5 microns (Brezovec* et al, PNAS 2024).
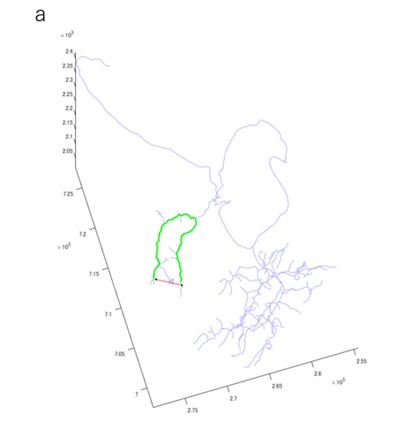
As you mentioned, functional analysis has limitations in spatial resolution. In particular, the resolution in the Z axis is 4 μm, which is 1,000 times lower than the resolution of electron microscopy data. This makes it difficult to perfectly match synaptic activity to a synapse in the structural data. Furthermore, spatial smoothing is applied to functional images to absorb inter-individual variability, which can only provide blurred results for group analyses. These are considered limitations of the methods used in fMRI analysis. Despite these limitations, we applied GLM analysis to walking behavior and observed clear inactivity region. This region roughly corresponds to the synaptic cloud of a neuron named WAGN (Fig.5b and c). This neuron also connects to WPNb and ANs in the connectome data, suggesting a possibility that it is related to walking behavior. This is merely a screening reference; therefore, further biological experimentation is needed to pursue this topic.
Recommendations for the authors:
Reviewing Editor Comments:
We should emphasize that the reviewers encouraged revision and resubmission. If the reviewers' comments were to be addressed in full in a revision to strengthen the evidence, this would significantly increase the impact of the findings and the relevance of the work to the fly neuroscience community and to the connectomics field more broadly.
Thank you very much for your comments.
Major Issues:
(1) Structural correlation and functional correlation measure very different aspects of network data, yet a simple correlation between the off-diagonal elements of the two is used. It would be expected that this would not be directly proportional, and it's not clear why this would be a sensible measure. The authors need a better solution for dealing with the zero entries in the SC matrix. Replacing the infinities with zeros and then running the linear regression to get an SC/FC relationship is not appropriate. Even with a better metric, given that both intuition and other studies have shown a weak correlation between FC and SC, using FC-SC correlation as a quality descriptor for other properties is not proper. Furthermore, the authors don't account for neurotransmitter identity in the structural data, which would have strong implications for the relationships between FC and SC.
Thank you for pointing this out. To investigate this issue we compared the FC-SC correlation between the Gaussian resampled SC approach used in Honey et al. (2009) [6] and the log-scaled SC used in this study (Ext. Data Fig.2-2a). With a small number of ROIs, the sparsity rate is low (Ext. Data Fig.2-2b), resulting in less zero replacement. Therefore, log-scaled SC is likely to more accurately represent the FC-SC relationship. Furthermore, with a large number of ROIs, the sparsity rate exceeds 70%, and Gaussian resampled SC randomly assigns a large number of zero elements from the smaller end of the distribution. This tends to lower the correlation (Ext. Data Fig.2-2c, d), suggesting that log-scaled SC provides fairer results. Log-scaled SC has been used in previous studies [9, 68] and is considered a simple method for showing the relationship (correlation) between FC and SC. When zero replacement is undesirable, using connection weights (the proportion of connections originating from the target region among all connections) can yield results similar to log-scaled SC (data not shown). It may be possible to compare various methods, but this is outside the scope of this study and requires further research.
The C. elegans studies presented by Reviewer #3 showed a weak correlation between FC and SC. However, C. elegans neurons do not fire and exhibited different calcium fluctuations depending on the region (Hendricks et al., 2012). This suggested that the cell body and various synaptic terminal regions have different FCs, which is consistent with the objective of our study (neuronal compartmentalization). If a functional unit is locally composed of multiple neurons and synapses, it is expected that SC and FC from that region will show a strong relationship. Larger regions would include multiple functional units, and a relationship between SC and FC would also be found, which is consistent with the results of our study. The C. elegans study compared FC of the cell body (a region) with SC of whole cell (not a same region), which would be inconsistent.
(2) Synaptic segregation on neurons can be topologically present even if pre- and post-synaptic synapses are present in similar regions of space, as an axon branch and dendrite branch can overlap in space but remain distinct along the arbor. The authors emphasize a region-based definition that does not reflect cellular anatomy. Moreover, the authors do not make an argument for their claim of better robustness of their new synaptic segregation measures.
Author response image 2.
Distance calculation for DBSCAN. a, Example synapse pair (black dot) of distance calculation. Red line shows the straight-line distance, and green line shows the morphology-based distance. DBSCAN will places two synapses in the same cluster based on straight-line distance, but they will be in different clusters based on the morphology-based distance.
Thank you for pointing this out. We changed from using DBSCAN based on the straight-line distance between synapses to DBSCAN based on the morphology-based distance via the branch nearest to the synapse (Author response image 2a). This resulted in a synaptic segregation measure that incorporates cellular anatomy. We updated all related figures, such as Figure.4, Ext. Data Figure.4-1, 4-2, 4-3, 4-4, Figure.5h. Also, we updated related text in the Results and Methods sections.
(3) Reviewers found the overall structure of the paper is difficult to follow, with sections appearing disjoint and the aims of different sections not well described. This extended to the paper organization as well, with the introduction not clearly setting up the questions and being distinct from the results. The manuscript would benefit from a clearer overarching narrative to unify the various analyses.
Thank you for pointing this out. We have revised the introduction to make it more concise.
(4) Similarly, there are several descriptions of data and analysis that are unclear or lacking, including the source of the marmoset data and how the FlyWire synapse was subsampled.
As pointed out by other reviewers, the marmoset data was obtained in [10], and the processing is also described in [10]. Therefore, we have revised the caption and removed the Ethics Declaration.
We have updated the Results and Methods sections regarding the extraction of "traced" neurons and synapses in FlyEM connectome data, and the extraction of post-synapses in hemibrain primary ROIs in FlyWire connectome data.
(5) Comparisons between FlyWire and Hemibrain have shown many similarities and some clear examples of inter-individual variability. There was concern that technical decisions with handling FlyWire synapse sampling were responsible for some of the differences observed between the datasets.
In response to Reviewer #2's question, we answered that both FlyEM and FlyWire use proofread neurons and their connecting synapses. We also updated Fig. 3b and the Results and Methods sections.
Reviewer #1 (Recommendations for the authors):
The paper is written in an unusual way. It would be helpful if the introduction read more like a standard introduction. Describe the relevant background that the reader needs to understand the results that come later. Frame the experiments in terms of a question or hypothesis. Results should be relegated to the results section (or, if you like, a final paragraph that summarizes the findings). They should not be intermingled throughout the introduction.
Thank you for pointing this out. We have revised the introduction to make it more concise.
The authors must be more attentive in terms of how they construct the segregated/unsegregated connectomes. I suggest exploring various thresholds/bins, but also considering proportionality thresholds that match the number of synapses.
Thank you for pointing this out. As pointed out by other reviewers, we changed from using DBSCAN based on the straight-line distance between synapses to DBSCAN based on the morphology-based distance via the branch nearest to the synapse (Author response image 2a). This resulted in a synaptic segregation measure that incorporates cellular anatomy.
We also considered about the sparsity rates of the SC matrices. Since the sparsity rates of the null SC matrices differed a lot from that of the SC matrices extracted by cPPSSI, we regenerated the null SC matrices, shown in Fig. 4e and 4i. As shown in Author response image 1, we ensured that the extracted SCs fit within the null-generated matrices. This figure was added to Ext. Data Fig.4-5, and the main text was also revised.
The authors need a better solution for dealing with the zero entries in the sc matrix. Replacing the infinities with zeros and then running the linear regression to get an sc/fc relationship is not appropriate.
Thank you for pointing this out. To investigate this issue, as pointed out by other reviewers, we compared the FC-SC correlation between the Gaussian resampled SC approach used in Honey et al. (2009) [6] and the log-scaled SC used in this study (Ext. Data Fig.2-2a). With a small number of ROIs, the sparsity rate was low (Ext. Data Fig.2-2b), resulting in less zero replacement. Therefore, log-scaled SC is likely to more accurately represent the relationship. Furthermore, with a large number of ROIs, the sparsity rate exceeds 70%, and resampled SC randomly assigns a large number of zero elements from the smaller end of the distribution. This tends to lower the correlation (Ext. Data Fig.2-2c, d), suggesting that log-scaled SC provides fairer results. Using connection weights (the proportion of connections originating from the target region among all connections) can yield results similar to log-scaled SC (data not shown), because this matrix can also be very sparse. It may be possible to compare various methods, but this is outside the scope of this study and requires further research.
It would be useful to include a description of where the human/marmoset datasets came from. It would be useful to describe the processing of those datasets and whether they're comparable to how the fly data was processed.
As pointed out by other reviewers, the marmoset data was obtained in [10], and the processing is also described in [10]. Therefore, we have revised the caption and removed the Ethics Declaration.
The pre-processing of fly calcium imaging data is described in the Methods section. Unfortunately, this processing method is not comparable to that used in humans/marmosets as it was highly customized.
The authors report sc/fc correlations for the human/marmoset datasets based on single papers. However, in the human case, especially, the strength of sc/fc correlations is highly variable. Not just based on number/size of parcels, but based on amount of data, processing pipeline, single-subject versus group averaged (incidentally, single-subject sc/fc is ‘much’* lower than group-averaged, which has big implications for this study, where the fly datasets are, in essence, N=1 studies).
Yes, there are numerous FC-SC correlation studies. We think Honey et al. (2009) [6] to be a highly representative study. It showed r = 0.39 to 0.48 for individual participants in 998 ROIs, and r = 0.36 for averaged one, but it increased r = 0.53 excluding absent or inconsistent structural connections. So, single-subject may not be much lower than group-averaged. Since the SC for a fly is an N=1 study, the FC-SC correlation for the same individual cannot be calculated. We think further research will be necessary.
Reviewer #2 (Recommendations for the authors):
Abstract:
Please introduce the term "ROI"
Thank you for pointing this out. We have revised the Abstract.
Introduction:
(1) On a general note: the introduction reads like an extended abstract (i.e., a mix of results and discussion).
Thank you for pointing this out. We have revised the introduction to make it more concise.
(2) Line 43: Does this mean FC-SC correlation is higher in flies but not significantly so? Please clarify.
We performed Mann-Whitney U test and it was not significant (p= 0.2667).
(3) Line 51: The "confidence" score does not indicate the degree of synaptic detection.
In the NeuPrint user guide, https://neuprint.janelia.org/public/neuprintuserguide.pdf it states “confidence - The certainty that an annotated synapse is correct and valid.” Since “degree of synaptic detection” may be difficult to understand, we changed it to “certainty of an annotated synapse.”
(4) Line 59-61: This statement needs refining: post-synapses do not "receive" neurotransmitters, action potentials aren't conducted along nerve fibres.
We changed “receive” to “sense.” About “action potentials,” we changed “conduct an action potential” to “graded potentials”, and removed “along nerve fibers.”
(5) Line 61: calcium activity as detected via GCaMP correlates with (electric) neuronal activity - please cite relevant GCaMP literature here.
We added F. Helmchen and J. Waters, "Ca2+ imaging in the mammalian brain in vivo," Eur J Pharmacol., vol. 447, pp. 119-129, 2002.
(6) Line 76: "interconnected" is rather vague; just say "many Drosophila neurons are reciprocally connected".
Thank you for pointing this out. Lin et al., (2024) showed motif analysis and there are many reciprocal, three-node and rich-club connections. However, introduction was updated and this sentence was removed.
(7) Line 77: comparing unsegregated vs reciprocal synapses is overly simplistic; these are separate features of the same object - i.e., a synapse can be reciprocal and at the same time be segregated in the presynaptic neuron but unsegregated in the postsynaptic neuron.
Thank you for pointing this out. As you say, the relationship is complicated. In this paper, we are concerned with the degree of segregation of pre- and post-synapses, and we are looking at the segregation within a neuron. In this case, nearby reciprocal synapses (<=2 μm) are included in unsegregated synapses. We have made a correction to the sentence.
(8) Line 79: I don't understand how we get from unsegregated synapses to local activity.
Retinal amacrine cells have extensive unsegregated synapses, which provide local feedback inhibition of burst inputs [34]. We changed the text around these descriptions.
(9) Line 80: What does "more essential function" mean?
We removed this sentence.
(10) Line 85: "as shown earlier": Is this based on results in this study or prior work? See also the general above note on mixing results/discussion into the introduction.
Thank you for pointing this out. We have revised the introduction to make it more concise.
(11) Line 85-87: I don't understand how the applicability of certain fMRI analysis methods in turn means that functional activity is locally compartmentalized. Did you mean to say something along the lines of "we applied common fMRI methods which showed functional activity is locally compartmentalized"?
These sentences discuss the commonality between fMRI (BOLD signal) and calcium signal, which both represent presynaptic population dynamics within a local region (voxel). Furthermore, unsegregated synapses are widespread throughout the fly brain (Ext. Data Fig.4-2) and can also be observed in human pyramidal cells (Ext. Data Fig.1-2). Unsegregated synapses suggest local compartment activity [33, 34, 39, 40] and contribute more to functional activity (Fig.4b). Therefore, the similar trend in FC-SC correlation (Fig.2d) between humans and flies suggest that both species exhibit localized compartmental activity via unsegregated synapses throughout the entire brain.
Because these sentences contain many conclusions, they have been moved from the Introduction to the Discussion section.
(12) Line 87: Please provide a reference for "common among various species".
Thank you for pointing this out. Because these sentences contain many conclusions, they have been moved from the Introduction to the Discussion section.
Results:
(1) Line 91-92:
(a) Please explain where the calcium data came from, how it was generated, etc.
We added the data source and a reference (Brezovec et al. [14]).
(b) Please clarify: what registration method?
This is not simple. Please see the Methods section and Ext. Data Fig.1-1. This is also indicated in the text.
(c) "calcium image" → "calcium image data"?
We changed “calcium image” to “calcium imaging data”.
(d) What is the "FDA template"?
This is a brain template created by Brezovec et al. [14]. JRC2018 is a well-known brain template, but it was created by immunostaining postmortem brains and did not fit well with calcium imaging data from living flies. Therefore, we used the FDA template.
(2) Line 93: Please introduce the term "ROI".
We added “(Region of Interest)” in Line 38.
(3) Line 94: Ito et al., Neuron (2014) "A systematic nomenclature for the insect brain" is a better reference for Drosophila neuropils; for the hemibrain, the ROIs were generated to match that original atlas
Thank you for pointing this out. We added a reference.
(4) Line 95/96: It is unclear what was used as the basis for the k-means/distance-based clustering
This was because we wanted to investigate whether nuisance factor removal methods are robust, even for such diverse types of ROI. We added this point to the text.
(5) Line 120ff: I'm not sure how the total number of ROIs is relevant for comparing flies and humans, given (a) the huge difference in brain size and (b) the difference in resolution of the functional data.
Indeed, the fly brain and the human neocortex are completely different. We are investigating whether there are commonalities between them using a metric called FC-SC correlation. As described in our answer for (11), both the fMRI (BOLD signal) and calcium signal represent presynaptic population dynamics within a local region (voxel). FC represents the synchronization of synaptic activity between regions, and SC represents the structural connectivity of neurons. Both flies and humans showed high SC-FC correlation and showed similar trends (Fig. 2d), so we believe it would be interesting to investigate this phenomenon.
(6) Line 123: "by contrast" is misleading here since, as you say, there isn't really a difference.
We changed “by contrast” to “and.”
(7) Line 141: I'm somewhat worried that the differences between FlyWire and hemibrain synapse counts are due to the issues mentioned above.
Thank you for the comment but we are not sure about “the issues mentioned above” is referring to.
(8) Line 148: There is no evidence that any differences in synapse are due to the resolution or anisotropy (as suggested in the introduction).
We apologize that we don’t have direct evidence for it. We changed this to the sentence “This may be caused by differences in detection accuracy resulting from the resolution of EM scanning, but not to inter-individual variability.”
(9) Line 155: References "39,45" have no brackets.
These are not referencing numbers, but brain regions of Brodmann area 39 and 45.
(10) Line 155-157: I don't think we can infer the composition of brain areas in humans based on a tenuous correlation in flies; this is highly speculative and really should be in the discussion.
In humans, there are areas with strong and weak FC-SC correlations [8], which may be due to the E-I (Excitatory-Inhibitory) balance of connections. We investigated this possibility by comparing the correlation between neurotransmitters and FC-SC correlations in the fly brain. We slightly changed this sentence.
(11) Line 159: I find the first 2-3 sentences in this paragraph confusing. Are you saying that you did all these things in the prior results sections, or that you wanted to look at X and therefore you did Y? Maybe there is an issue with the tense here?
We changed the sentences around this description.
(12) Line 161: "whole-brain" = FlyWire?
We changed “whole-brain” to “FlyWire”.
(13) Line 163: Please explain the "PPSSI" acronym.
This is now explained on Line 75.
(14) Line 165: The description of how the cPPSSI was calculated is hard to follow. For example, what's the "fraction of synapse number".
We changed our sentences around this description to be clearer. The cPPSSI is the degree of segregation within a cluster and is also assigned to each synapse. The PPSSI is then the average of the cPPSSI values of all synapses in a neuron.
(15) Line 166: Is there a difference between "cPPSSI" and "PPSSI"?
Yes, there is. Please see our answer for (14).
(16) Line 167: "The result showed a histogram resembling a normal distribution" → I suggest running a normality test.
Thank you for pointing this out. We tested it by Lilliefors test and the result was p=0.001 (significantly not a normal distribution). Since there are numerous values with PPSSI=1, it is not judged to be a normal distribution. We therefore changed this description.
(17) Line 173: I am somewhat worried about a selection bias in your correlation of segregated vs unsegregated synapses. First, it seems like only a small fraction of neurons are in the 0-0.1 and 0.9-1 PPSSI range. I would suggest running a proper correlation between PPSSI and FC-SC correlation instead of looking at just the two extremes. Second, your examples for segregated neurons (APL + CT1) are large neurons that densely innervate spatially close and functionally very similar neuropils. If the sample of unsegregated neurons consists mainly of these large interneurons, I'm not at all surprised that they contributed strongly to FC-SC correlation.
Thank you for pointing this out. For this work we investigated synapses (not neurons), extracting those with cPPSSI of 0-0.1 and 0.9-1, and performed a rank text with the FC-SC correlation of random sub-sampled synapses. We aimed to demonstrate that unsegregated synapses in particular, strongly contribute to FC-SC, and we hope to investigate overall trends in a future study.
(18) Line 185: I don't think the function of reciprocal synapses is "considered to be clear". There are examples of feedback inhibition through reciprocal synapses, in particular in the visual system, but that does not mean that this is true across the board.
We changed “considered to be clear” to “considered to be clearer than unsegregated synapses.” Of course, the function of reciprocal synapses is unknown for the whole brain, but we think it is more well-studied than unsegregated synapses.
(19) Line 188 / Figure 4h: that figure panel does not appear to show transmitter pairs.
Figure 4h (FlyWire) showed transmitter pairs. Ext. Data Fig.4-1g did not, because FlyEM does not have transmitter information.
(20) Line 192: Please clarify "functionally common".
We changed our sentences to clarify this.
(21) Line 199: "ventral nerve code" → "ventral nerve cord".
We fixed this typo.
(22) Line 201: I don't think you can use "conversely" here.
We changed “Conversely” to “Moreover.”
(23) Line 201: How certain are you that the WAGN neuron is the only candidate? Also, it would be nice to provide the neuron IDs so that people can identify them in the connectome.
Thank you for pointing this out. We added Root ID: 720575940644632087 in the text. Actually, we found several GABA neuron candidates, such as 720575940637611365, 720575940644632087, 720575940613552947, 720575940640333109 and 720575940612264817. We investigated whether ER1(L) was present in these downstream connections and found that 720575940644632087 had the strongest connection with the largest number of synapses, so we adopted this.
(24) Line 207: When you say "the left WAGN was strongly connected", are those connections not also present for the right WAGN?
There is a right WAGN (Root ID: 720575940624377224), but it does not have strong interconnections with WPNb tier 2/3 (left) neurons. For the right WAGN, there are few inputs from WPNb tier 2/3 (left). We added “(left)” in the text.
(25) Line 212: I don't think you can use "however" here.
We removed “however.”
(26) Line 214: "well unsegregated" → "very unsegregated"?
This sentence was removed, because we recalculated Fig. 5h.
Ethics Declaration:
It seems the marmoset data were reported on in [10], so why is there a reference to the generation of the dataset?
Yes, marmoset data were reported in [10], so we removed the Ethics Declaration.
Reviewer #3 (Recommendations for the authors):
(1) In my opinion, the title and framing of this manuscript dramatically overstate the results presented here. Also, the results presented in the different figures in this manuscript seem disjointed and are not very related to each other.
Thank you for pointing this out. We have rewritten our manuscript slightly to address this. Inter-individual variability is relevant to both SC and FC. Regarding SC, we think the difference in the number of synapses between the two individuals is due to the difference in detection power caused by differences in the resolution of the electron microscope. Regarding FC, as stated in the Results section, “Spatial smoothing is useful for absorbing inter-individual variability and conducting second-level group analysis.” Increasing the smoothing size improves the correlation and AUC between group-averaged FC and SC, indicating the presence of inter-individual variability in FC (Fig. 2b, Ext. Data Fig. 2-1b, especially when the number of ROIs is high). We added this text in the Introduction and Results sections.
(2) There are multiple ways to compute structural correlation matrices-the methods the authors implemented should be discussed in greater detail in the manuscript.
Thank you for pointing this out. To investigate this issue, as pointed out by other reviewers, we compared the FC-SC correlation between the Gaussian resampled SC approach, used in Honey et al. (2009) [6] and the log-scaled SC approach, used in this study (Ext. Data Fig.2-2a). With a small number of ROIs, the sparsity rate was low (Ext. Data Fig.2-2b), resulting in fewer zero replacement. Therefore, log-scaled SC is likely to more accurately represent the relationship in our study. Furthermore, with a large number of ROIs, the sparsity rate exceeds 70%, and resampled SC randomly assigns a large number of zero elements from the smaller end of the Gaussian distribution. This tends to lower the correlation (Ext. Data Fig.2-2c, d), suggesting that log-scaled SC provides fairer results. Using connection weights (the proportion of connections originating from the target region among all connections) can yield results similar to log-scaled SC (data not shown), because this matrix can be also very sparse. The log-scaled SC aprroach has been used in previous studies [9, 68] and is considered a simple method for showing the relationship (correlation) between FC and SC. It may be possible to compare various methods in-depth, but this is outside the scope of this study and requires further research.
(3) The use of the FC-SC detection score defined by the authors should be discussed and justified more extensively in the text.
Thank you for pointing this out. This has already been discussed in [10]. We defined our own “FC-SC detection score,” but we consider the overall approach to be well established in the literature. For example, Stafford et al. (2014) carried out FC-SC detection for 168 mouse cortical regions, and obtained 78.26% sensitivity and 81.69% specificity for the top 1% of SC. Hori et al. (2020) also investigated FC-SC detection for 55 cortical regions of the marmoset brain left hemisphere, achieving an AUC of 0.72. We think FC-SC detection is an index that evaluates the relationship between FC and SC from a different angle than FC-SC correlation and is worthwhile.
Hori et al., (2020). Comparison of resting-state functional connectivity in marmosets with tracer-based cellular connectivity. NeuroImage, 204, 116241.
Stafford et al., (2014). Large-scale topology and the default mode network in the mouse connectome. Proc. Natl. Acad. Sci. U.S.A., 111(52), 18745-18750.