faceted.hypothes.is.search?beginner#s+mind

faceted.hypothes.is.search?beginner#s+mind
Liberal arts schools can come with a hefty price tag, and their high cost presents an obstacle for students on a tight budget; moreover, while some students might appreciate a liberal arts school’s intimate atmosphere, others might encounter a lack of diversity in the student body.
Explanation/Advice: Students need to be aware of a extremley hefty price if they want to be at a Liberal Arts School.
[^jc]
mi tag personal?
ssignments and Quizzes posted after 11:59:01 on Sunday are late and this is indicated with the late tag in Brightspace.Discussion postings posted after 11:59:01 on Thursday are late and follow up posting posted after Sunday 11:59:01 arelate. For assignments and quizzes posted after 11:59:01 with a late Tag as identified in Brightspace will receive anautomatic 30% reduction in grade. Assignments posted after 11:59:01 PM on Tuesday (2 days after the due date), willreceive a 35% reduction in grade. Assignments posted after 11:59:01 on Thursday (4 days late) will receive a 40%reduction in grade. No assignments will be accepted after 11:59:01 the Sunday after the initial due date (7 days late) andwill receive a zero.
I think this policy abt late work is very informative and explains clearly what consequences can occur for having late work. It also explains you can turn in things late even after the due date with a reduction in grade of course which is fair.
Late Policy:Assignments and Quizzes posted after 11:59:01 on Sunday are late and this is indicated with the late tag in Brightspace.Discussion postings posted after 11:59:01 on Thursday are late and follow up posting posted after Sunday 11:59:01 arelate. For assignments and quizzes posted after 11:59:01 with a late Tag as identified in Brightspace will receive anautomatic 30% reduction in grade. Assignments posted after 11:59:01 PM on Tuesday (2 days after the due date), willreceive a 35% reduction in grade. Assignments posted after 11:59:01 on Thursday (4 days late) will receive a 40%reduction in grade. No assignments will be accepted after 11:59:01 the Sunday after the initial due date (7 days late) andwill receive a zero.
This part of the syllabus is one of the most important because it gives clear grading instructions on our assignments. I also think its very nice of the professor to accept late assignments as many online classes do not accept any.
Assignments and Quizzes posted after 11:59:01 on Sunday are late and this is indicated with the late tag in Brightspace.Discussion postings posted after 11:59:01 on Thursday are late and follow up posting posted after Sunday 11:59:01 arelate. For assignments and quizzes posted after 11:59:01 with a late Tag as identified in Brightspace will receive anautomatic 30% reduction in grade. Assignments posted after 11:59:01 PM on Tuesday (2 days after the due date), willreceive a 35% reduction in grade. Assignments posted after 11:59:01 on Thursday (4 days late) will receive a 40%reduction in grade. No assignments will be accepted after 11:59:01 the Sunday after the initial due date (7 days late) andwill receive a zero.
I think this part of the syllabus is very important, it explains the consequences of a late assignment submission. It is very clear and very forward in terms of the late policy for this course.
Assignments and Quizzes posted after 11:59:01 on Sunday are late and this is indicated with the late tag in Brightspace.Discussion postings posted after 11:59:01 on Thursday are late and follow up posting posted after Sunday 11:59:01 arelate. For assignments and quizzes posted after 11:59:01 with a late Tag as identified in Brightspace will receive anautomatic 30% reduction in grade. Assignments posted after 11:59:01 PM on Tuesday (2 days after the due date), willreceive a 35% reduction in grade. Assignments posted after 11:59:01 on Thursday (4 days late) will receive a 40%reduction in grade. No assignments will be accepted after 11:59:01 the Sunday after the initial due date (7 days late) andwill receive a zero.
So quick question. On the discussion assignments you put that due dates for the initial response is due Friday at 11:59 pm but here in your Syllabus you say the the initial response is due Thursday at 11:59 pm. My question is which one is correct?
For assignments and quizzes posted after 11:59:01 with a late Tag as identified in Brightspace will receive anautomatic 30% reduction in grade
Above, it was stated that late assignments would not be graded at all, but the Late Policy later explains a system of partial credit. It is unclear whether late work is completely not accepted or accepted with penalties.
Clear Text Search Saved Searches Advanced Search Search Catalogue Website Events Digital ArchiveCatalogue CatalogueWebsiteEventsDigital Archive by Keyword Title Author Subject Series Tag List User Broadened KeywordKeyword KeywordTitleAuthorSubjectSeriesTagListUserBroadened Keyword for All Content News Blog PostsAll Content All ContentNewsBlog Posts Clear Text Search Saved Searches Advanced Search Books, DVDs & Music Books, DVDs & MusicBooks, DVDs & MusicBooksBooks by TypeChildren's BooksTeen BooksGraphic BooksAudiobooksLarge Print BooksFictionGeneral FictionMysteryRomanceScience FictionNonfictionAll NonfictionBiographyFood and DrinkHealth and WellnessHistoryMovies & VideoExplore Movies & VideoNew DVDsNew Children's DVDsMusicExplore MusicNew MusicMultilingualMaterial in Your LanguageFrançais简化字 | 繁體字 eResources & Research eResources & ResearcheResources & ResearcheBooks & AudiobooksDigital Video & MusicDigital MagazinesDigital NewspapersDigital ComicsArticles & Online ResearchA-Z List of DatabaseseLearningSpecial Collections & Rare BooksLocal History & GenealogyDigital Archive Programs ProgramsAll ProgramsKids & FamiliesTeensBook Clubs & Writers' GroupsCareer & Job SearchComputer & Library TrainingCulture, Arts & EntertainmentCrafts & HobbiesHealth & WellnessNewcomerPersonal FinanceSmall BusinessProgram SeriesSalon SeriesOn Civil SocietyOur Fragile PlanetExhibits & DisplaysTD Gallery Using the Library
Good practice: The main navigation menu uses clear, descriptive category labels that are logically grouped. This helps users—especially those using assistive technologies—understand the site structure and navigate efficiently.
Get the perfect custom design, every time With the world's #1 custom design marketplace
The order of heading tags is not respected. It starts with h1 header as expected but subtitle "with the world's #1 ..." is h3 instead of being h2 which might confuse the screen reader
Author response:
Public Reviews:
Reviewer #1 (Public review):
The researchers conducted their study using advanced techniques. They found almost no difference in calcium binding between the two proteins and observed no impact on calcium signaling, specifically store-operated calcium entry (SOCE). The study also noted an increase in ER luminal calcium-binding chaperone proteins. Surprisingly, the authors selected flow cytometry as a technique for measurements of ER luminal calcium. Considering the limitations of this approach, it would be better to use alternative approaches.
The flow cytometric assay shows good responsiveness to conditions expected to alter ER calcium levels (Figure 4C), is high throughput compared to microscopy, and allows for averaging of signals across a large number of cells. This was thus our original method of choice.
This is particularly important as previous reports, using cells from MPN patients, indicate reduced ER luminal calcium and effects on SOCE (Blood, 2020). This issue matters because earlier research with MPN patient cells reported reduced ER luminal calcium levels and altered SOCE (Blood, 2020). How do the authors explain the difference between their results and previous findings about lower ER luminal calcium and changed SOCE in MPN patient cells expressing CRTDel52?
We thank the reviewer for asking for these clarifications. The referenced study (Di Buduo et al. Blood, 135(2):133-143, 2020) first showed that thrombopoietin induces spontaneous cytosolic calcium spikes in cultured megakaryocytes, which is dependent on store operated calcium entry (SOCE). In parallel, STIM1-ORAI interactions were induced by thrombopoietin. On the other hand, the addition of thrombopoietin caused the dissociation of STIM1-calreticulin interactions, based on proximity ligation assays. The implication is that signaling via the thrombopoietin receptor (TPOR/MPL) activation induces the dissociation of calreticulin-STIM1 complexes, and the formation of STIM1-ORAI complexes, which contribute to the measured spontaneous cytosolic calcium spikes. Different MPN mutations induced spontaneous calcium spikes in a thrombopoietin-independent manner, including the JAK2V617F mutations and the CALR type I and type II mutations. The study found that the number of megakaryocytes exhibiting spontaneous calcium spikes was enhanced in the context of both type I and type II CALR mutations compared to the JAK2V617F mutant. Correspondingly, the calreticulin-STIM1 interactions/cell were more significantly reduced for type I and type II CALR mutations compared to the JAK2V617F mutant. It was suggested that defective interactions between mutant calreticulin, ERp57, and STIM1 activated SOCE and generated spontaneous cytosolic calcium spikes. However, based on the findings with thrombopoietin, the spontaneous calcium spikes could simply result from thrombopoietin-independent MPL activation by the mutant calreticulin and JAK2V617F and downstream signaling. Importantly, the referenced studies did not directly measure ER luminal calcium. A number of undefined factors could account for the measured differences between the megakaryocytes from patients with calreticulin mutations vs. JAK2V617F. These include the relative mutant allele burdens, the extent of MPL activation, as well as genetic differences unrelated to calreticulin. Different from these experiments, through the use of purified proteins, our studies show that the Del52 mutant has calcium binding characteristics resembling that of the wild type protein. Additionally, through genetic manipulations in cell lines, our studies directly address the effects of calreticulin KO and its Del52 mutation upon ER luminal and cytosolic calcium levels, and cellular SOCE signals. We did not measure significant differences in any of these parameters between the KO cells and those reconstituted with wild type calreticulin or the Del52 mutant. As noted by the editors, these results show that Ca2+ binding by calreticulin and store-operated Ca2+ entry in a cell are not fundamentally impacted by the type I deletion mutation. On the other hand, in primary megakaryocytes, when co-expressed with MPL, the Del52 mutant, through its known ability to bind and activate TPOR/MPL, is expected to induce SOCE and calcium fluxes similar to those induced by thrombopoietin. These points will be clarified in the revised discussion.
Other studies have found that unfolded protein responses are activated in MPN cells with CRTDel52 calreticulin (see Blood, 2021), and increased UPR could account for higher levels of some ER-resident calcium-binding proteins observed here.
Multiple studies have suggested the induction of the unfolded protein response (UPR) in cells expressing MPN mutants of calreticulin. We don’t know the specific signals that cause the upregulation of various calcium binding proteins in calreticulin-KO cells and cells expressing the Del52 mutant. Indeed, these could result from increased protein misfolding in cells with wild type calreticulin deficiency. Alternatively, the sensing of cellular calcium perturbations could induce their expression. Regardless of the precise mechanisms underlying the expression changes in calcium binding proteins, the upregulated factors are predicted to compensate for calreticulin deficiency and contribute to the maintenance of the overall cellular calcium homeostasis. These points will be clarified in the revised discussion.
Overall, it remains unclear how this work improves our understanding of MPN or clarifies calreticulin's role in MPN pathophysiology.
The points discussed above as well as their implications for the understanding of calreticulin’s role in MPN pathophysiology will be clarified in the revised manuscript.
Reviewer #2 (Public review):
Tagoe and colleagues present a thorough analysis of the calcium (Ca2+) binding capacity of calreticulin (CRT), an endoplasmic reticulum (ER) Ca2+-buffer protein, using a mutant version (CRT del52) found in myeloproliferative neoplasms (MPNs). The authors use purified human CRT protein variants, CRT-KO cell lines, and an MPN cell line to elucidate the differing Ca2+ dynamics, both on the level of the protein and on cell-wide Ca2+-governed processes. In sum, the authors provide new insights into CRT that can be applied to both normal and malignant cell biology.
First, the authors purify CRT protein and perform isothermal titration calorimetry to quantify the Ca2+ binding capacity of CRT. They use full-length human CRT, CRT del52, and two truncations of CRT (1-339 and 1-351, the former of which should lead to the entire loss of low-affinity Ca2+ binding). While CRT del52 has previously been shown to lead to a decrease in Ca2+ binding affinity in other models, the ITC data show that this is retained in CRT del52.
Next, the authors utilize a CRT-KO cell line with subsequent addition of CRT protein variants to validate these findings with flow cytometric analysis. Cells were transfected with a ratiometric ER Ca2+ probe, and fluorescence indicates that CRT del52 is unable to restore basal ER Ca2+ levels to the same extent as CRT wild-type. To translate these findings to MPNs, the authors perform CRT-KO in a megakaryocytic cell line, where reconstitution with either CRT variant did not cause a difference in cytosolic calcium levels. The authors further test store-operated calcium entry (SOCE), an important process for maintaining ER Ca2+ levels, in these cells, and find that CRT-KO cells have lower SOCE activity, and that this can be slightly recovered with CRT addition.
Finally, the authors ask whether other effects of CRT-KO/reconstitution can affect the cellular Ca2+ signaling pathway and levels. RNASeq analysis revealed that CRT-KO leads to an increase in various chaperone protein expressions, and that reconstitution with CRT del52 is unable to reduce expression to the same extent as reconstitution with CRT wildtype.
Strengths:
The authors provide new insights into CRT that can be applied to both normal and malignant cell biology.
We thank the reviewer for the recognition that this study is important for our understanding of both normal and malignant cell biology.
Weaknesses:
(1) The authors should consider discussing the high-affinity Ca2+ binding site more in the introduction. Can they show a proof-of-concept experiment that validates that incubation of recombinant CRT reduces the function of that high-affinity Ca2+ binding site?
In a previous study (Wijeyesakere et al. 2011 J. Biol Chem, 286 8771-8785), we showed that at a starting calcium concentration of 0 mM and with 3.3 mM injections of CaCl<sub>2</sub>, the measured K<sub>D</sub> value was 16.6 mM for calcium binding to wild type murine calreticulin, (which has ~95% % sequence identity with human calreticulin), corresponding to the high affinity site. On the other hand, at a starting calcium concentration of 50 mM and with 33 mM CaCl<sub>2</sub> injections, the measured K<sub>D</sub> value for calcium binding to wild type murine calreticulin was 590 mM (corresponding to the low affinity sites). Thus, we did not measure the high affinity sites when the starting calcium concentration was 50 mM. This point will be clarified in the revised manuscript.
(2) For Figure 2B, do you have an explanation for why the purified proteins run higher than predicted (48-52kDa) - are these proteins still tagged with pGB1?
Yes, the purified proteins shown in Figure 2B retained a GB1 tag. This point will be clarified in the revised manuscript.
(3) The MEG-01 cell line has the BCR:ABL1 translocation, while CRT mutations are strictly found in BCR:ABL1 negative MPNs. Could these experiments be repeated in these cells treated with imatinib to decrease these effects, or see if basal MEG-01 Ca2+ levels/activity are changed with or without imatinib?
Thank you for the important point. We will assess cytosolic calcium levels in MEG-01 cells with or without imatinib.
Human
The above photograph does not have a description or alt tag.
Author response:
The following is the authors’ response to the original reviews
Public Reviews:
Reviewer #1 (Public review):
Summary:
This work addresses a key question in cell signalling: how does the membrane composition affect the behaviour of a membrane signalling protein? Understanding this is important, not just to understand basic biological function but because membrane composition is highly altered in diseases such as cancer and neurodegenerative disease. Although parts of this question have been addressed on fragments of the target membrane protein, EGFR, used here, Srinivasan et al. harness a unique tool, membrane nanodisks, which allow them to probe full-length EGFR in vitro in great detail with cutting-edge fluorescent tools. They find interesting impacts on EGFR conformation in differently charged and fluid membranes, explaining previously identified signalling phenotypes.
Strengths:
The nanodisk system enables full-length EGFR to be studied in vitro and in a membrane with varying lipid and cholesterol concentrations. The authors combine this with single-molecule FRET utilising multiple pairs of fluorophores at different places on the protein to probe different conformational changes in response to EGF binding under different anionic lipid and cholesterol concentrations. They further support their findings using molecular dynamics simulations, which help uncover the full atomistic detail of the conformations they observe.
Weaknesses:
Much of the interpretation of the results comes down to a bimodal model of an 'open' and 'closed' state between the intracellular tail of the protein and the membrane. Some of the data looks like a bimodal model is appropriate, but its use is not sufficiently justified (statistically or otherwise) in this work in its current form. The experiments with varying cholesterol in particular appear to suggest an alternate model with longer fluorescent lifetimes. More justification of these interpretations of the central experiment of this work would strengthen the paper.
We thank the reviewer for highlighting the strengths of the study, including the use of nanodiscs, single-molecule FRET, and MD simulations to probe full-length EGFR in controlled membrane environments.
We agree that statistical justification is important for interpreting the distributions. To address this, we performed global fits of the data with both two- and three-Gaussian models and evaluated them using the Bayesian Information Criterion (BIC), which balances the model fit with a penalty for additional parameters. The three-Gaussian model gave a substantially lower BIC, indicating statistical preference for the more complex model. However, we also assessed the separability of the Gaussian components using Ashman’s D, which quantifies whether peaks are distinct. This analysis showed that two Gaussians (µ = 2.64 and 3.43 ns) are not separable, implying they represent one broad distribution rather than two states.
Author response table 1.
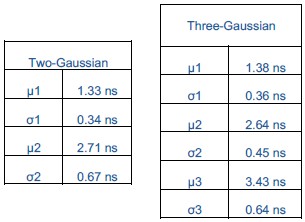
Both the two- and three-Gaussian models include a low-value component (µ = ~1.3 ns), but the apparent improvement of the three-Gaussian model arises only from splitting the central population into two overlapping Gaussians. Thus, while the BIC favors the three-Gaussian model statistically, Ashman’s D demonstrates that the central peak should not be interpreted as bimodal. Therefore, when all the distributions are fit globally, the data are best explained as two Gaussians, one centered at ~1.3 ns and the other at ~2.7 ns, with cholesterol-dependent shifts reflecting changes in the distribution of this population rather than the emergence of a separate state. Finally, we acknowledge that additional conformations may exist, but based on this analysis a bimodal model describes the populations captured in our data and so we limit ourselves to this simplest framework.
We have clarified this in the revised manuscript by adding a section in the Methods (page 26) titled Model Selection and Statistical Analysis, which describes the results of the global two- versus three-Gaussian fits evaluated using BIC and Ashman’s D. Additional details of these analyses are also provided in response to Reviewer #1, Question 8 (Recommendations for the authors).
Reviewer #2 (Public review):
Summary:
Nanodiscs and synthesized EGFR are co-assembled directly in cell-free reactions. Nanodiscs containing membranes with different lipid compositions are obtained by providing liposomes with corresponding lipid mixtures in the reaction. The authors focus on the effects of lipid charge and fluidity on EGFR activity.
Strengths:
The authors implement a variety of complementary techniques to analyze data and to verify results. They further provide a new pipeline to study lipid effects on membrane protein function.
We thank the reviewer for noting the strengths of our approach, particularly the use of complementary techniques and the development of a new pipeline to study lipid effects on membrane protein function.
Weaknesses:
Due to the relative novelty of the approach, a number of concerns remain.
(1) I am a little skeptical about the good correlation of the nanodisc compositions with the liposome compositions. I would rather have expected a kind of clustering of individual lipid types in the liposome membrane, in particular of cholesterol. This should then result in an uneven distribution upon nanodisc assembly, i.e., in a notable variation of lipid composition in the individual nanodiscs. Could this be ruled out by the implemented assays, or can just the overall lipid composition of the complete nanodisc fraction be analyzed?
We monitored insertion of anionic lipids into nanodiscs by performing zeta potential measurements, which report on surface charge, and cholesterol insertion by Laurdan fluorescence, which reports on membrane order. Both assays provide information at the ensemble level, not single-nanodisc resolution. We clarified this in the Methods section (see below).
Cholesterol clustering is well documented in ternary systems with saturated lipids and sphingolipids [Veatch, Biophys J., 2003; Risselada, PNAS, 2008]. However, in unsaturated POPC-cholesterol mixtures such as those used here, cholesterol primarily alters bilayer order and large-scale segregation is not typically observed. The addition of POPS to the POPC-cholesterol mixture perturbs cholesterol-induced ordering, lowering the likelihood of cholesterol-rich domains [Kumar, J. Mol. Graphics Modell., 2021].
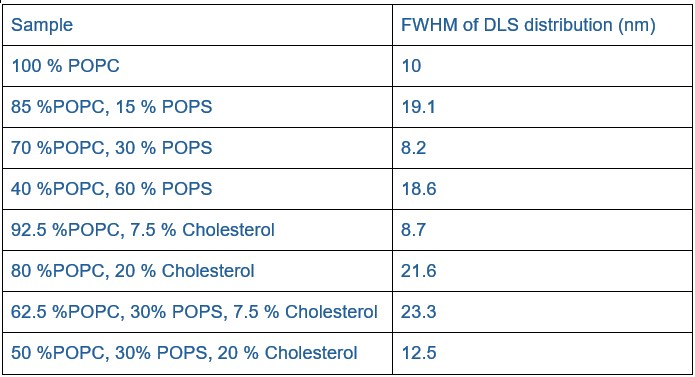
Lipid heterogeneity between nanodiscs would be expected to give rise to heterogeneity in hydrodynamic properties, including potentially broadening the dynamic light scattering (DLS) distributions. However, the full width at half maximum (FWHM) values from the DLS measurements (see Author response table 2) do not indicate a broadening with cholesterol. Statistical testing (Mann-Whitney U test for non-normal data) showed no significant difference between samples with and without cholesterol (p = 0.486; n = 4 per group). While the sample size is small making firm conclusions challenging, these results suggest that large-scale heterogeneity is unlikely.
Author response table 2.
In the case of POPS lipids, clustering of POPS in EGFR embedded nanodiscs is a recognized property of receptor-lipid interactions. Molecular dynamics simulations have shown that POPS, although constituting only 30% of the inner leaflet, accounts for ~50% of the lipids directly contacting EGFR [Arkhipov, Cell, 2013], underscoring that anionic lipids are preferentially recruited to the receptor’s immediate environment.
For nanodiscs containing cholesterol and anionic lipids, our smFRET experiments were designed to isolate the effect of EGF binding. The nanodisc population is the same in the ± EGF conditions as EGF was introduced just prior to performing sm-FRET experiments, and not during nanodisc assembly. Thus, for a given lipid composition, any observed differences between ligand-free and ligand-bound states reflect conformational changes of EGFR.
Methods, page 23, “Zeta potential measurements to quantify surface charge of nanodiscs: Data analysis was processed using the instrumental Malvern’s DTS software to obtain the mean zeta-potential value. This ensemble measurement reports the average surface charge of the nanodisc population, verifying incorporation of anionic POPS lipids.”
Methods, page 23, “Fluorescence measurements with Laurdan to confirm cholesterol insertion into nanodiscs: The excitation spectrum was recorded by collecting the emission at 440 nm and emission spectra was recorded by exciting the sample at 385 nm. Laurdan fluorescence provides an ensemble readout of membrane order and confirms cholesterol incorporation into the nanodisc population. While laurdan does not resolve the composition of individual nanodiscs, prior work has shown that POPC–cholesterol mixtures are miscible without forming cholesterol-rich domains[91,92], thus the observed ordering changes likely reflect the intended input cholesterol content at the ensemble level.”
(91) Veatch, S. L. & Keller, S. L. Separation of liquid phases in giant vesicles of ternary mixtures of phospholipids and cholesterol. Biophysical journal, 85(5), 3074-3083 (2003).
(92) Risselada, H. J. & Marrink, S. J. The molecular face of lipid rafts in model membranes. Proceedings of the National Academy of Sciences 105(45), 17367–17372 (2008).
(2) Both templates have been added simultaneously, with a 100-fold excess of the EGFR template. Was this the result of optimization? How is the kinetics of protein production? As EGFR is in far excess, a significant precipitation, at least in the early period of the reaction, due to limiting nanodiscs, should be expected. How is the oligomeric form of the inserted EGFR? Have multiple insertions into one nanodisc been observed?
We thank the reviewer for these insightful questions. Yes, the EGFR:ApoA1∆49 template ratio of 100:1 was empirically determined through optimization experiments now shown in the revised Supplementary Fig. 3. Cell-free reactions were performed across a range of EGFR:ApoA1∆49 template ratios (1:2 to 1:200) and sampled at different time points (2-19 hours). As shown in the gels, EGFR expression increased with higher template ratios and longer reaction times up to ~9 hours, while ApoA1 expression became clearly detectable only after 6 hours. Based on these results, we selected an EGFR:ApoA1∆49 ratio of 100:1 and 8-hour reaction time as the optimal condition, which yielded sufficient full-length EGFR incorporated into nanodiscs for ensemble and single-molecule experiments.
In cell-free systems, protein yield does not scale directly with DNA template concentration, as translation efficiency is limited by factors such as ribosome availability and co-translational membrane insertion [Hunt, Chem. Rev., 2024; Blackholly, Front. Mol. Biosci., 2022]. Consistent with this, we observed that ApoA1∆49 is produced at higher levels than EGFR despite the lower DNA input (Supplementary Fig. 2b). Providing an excess EGFR template prevents the reaction from becoming limited by scaffold availability and helps compensate for the fact that, as a large multi-domain receptor, EGFR expression can yield truncated as well as full-length products. This strategy ensures that sufficient full-length receptors are available for nanodisc incorporation. We will clarify this in the Methods section (see below).
We observed little to no visible precipitation under the reported cell-free conditions, likely due to the following reasons: (i) EGFR and ApoA1∆49 are co-expressed in the cell-free reaction, and ApoA1∆49 assembles into nanodiscs concurrently with receptor translation, providing an immediate membrane sink (ii) ApoA1∆49 is expressed at high levels, maintaining disc concentrations that keep the reaction in a soluble regime.
The sample contains donor-labeled EGFR (snap surface 594) together with acceptor-labeled lipids (cy5-labeled PE doped in the nanodisc). We assess the oligomerization state of EGFR in nanodiscs using single-molecule photobleaching of the donor channel. Snap surface 594 is a benzyl guanine derivative of Atto 594 that reacts with the SNAP tag with near-stoichiometry efficiency [Sun, Chembiochem, 2011]. Most molecules (~75%) exhibited a single photobleaching step, consistent with incorporation of a single EGFR per nanodisc [Srinivasan, Nat. Commun., 2022]. A minority of traces (~15%) showed two photobleaching steps and about ~10% of traces showed three or more photobleaching steps, consistent with occasional multiple insertions. For all smFRET analysis, we restricted the dataset to single-step photobleaching traces, ensuring measurements were performed on monomeric EGFR.
Methods, page 20, “Production of labeled, full-length EGFR nanodiscs: Briefly, the E.Coli slyD lysate, in vitro protein synthesis E.Coli reaction buffer, amino acids (-Methionine), Methionine, T7 Enzyme, protease inhibitor cocktail (Thermofisher Scientific), RNAse inhibitor (Roche) and DNA plasmids (20ug of EGFR and 0.2ug of ApoA1∆49) were mixed with different lipid mixtures. The DNA template ratio of EGFR:ApoA1∆49 = 100:1 was empirically chosen by testing different ratios on SDS-PAGE gels and selecting the condition that maximized full-length EGFR expression in DMPC lipids (Supplementary Fig. 3).”
(3) The IMAC purification does not discriminate between EGFR-filled and empty nanodiscs. Does the TEM study give any information about the composition of the particles (empty, EGFR monomers, or EGFR oligomers)? Normalizing the measured fluorescence, i.e., the total amount of solubilized receptor, with the total protein concentration of the samples could give some data on the stoichiometry of EGFR and nanodiscs.
Negative-stain TEM was performed to confirm nanodisc formation and morphology, but this method does not resolve whether a given disc contains EGFR. To directly assess receptor stoichiometry, we instead relied on single-molecule photobleaching of snap surface 594-labeled EGFR (see response to Point 2). These experiments showed that the majority of nanodiscs contain a single receptor, with a minority containing two receptors. For all smFRET analyses, we restricted data to single-step photobleaching traces, ensuring measurements were performed on monomeric EGFR.
We did not normalize EGFR fluorescence to total protein concentration because the bulk protein fraction after IMAC purification includes both receptor-loaded and empty nanodiscs. The latter contribute to ApoA1∆49 mass but do not contain receptors and including them would underestimate receptor occupancy. Importantly, the presence of empty nanodiscs does not affect our measurements as photobleaching and single-molecule FRET analyses selectively report only on receptor-containing nanodiscs. This clarification has been added to the Methods.
Methods, page 26, “Fluorescence Spectroscopy: Traces with a single photobleaching step for the donor and acceptor were considered for further analysis. Regions of constant intensity in the traces were identified by a change-point algorithm95. Donor traces were assigned as FRET levels until acceptor photobleaching. The presence of empty nanodiscs does not influence these measurements, as photobleaching and single-molecule FRET analyses selectively report on receptor-containing nanodiscs.”
(4) The authors generally assume a 100% functional folding of EGFR in all analyzed environments. While this could be the case, with some other membrane proteins, it was shown that only a fraction of the nanodisc solubilized particles are in functional conformation. Furthermore, the percentage of solubilized and folded membrane protein may change with the membrane composition of the supplied nanodiscs, while non-charged lipids mostly gave rather poor sample quality. The authors normalize the ATP binding to the total amount of detectable EGFR, and variations are interpreted as suppression of activity. Would the presence of unfolded EGFR fractions in some samples with no access to ATP binding be an alternative interpretation?
We agree that not all nanodisc-embedded EGFR molecules may be fully functional and that the fraction of folded protein could vary with lipid composition. In our ATP-binding assay, EGFR detection relies on the C-terminal SNAP-tag fused to an intrinsically disordered region. Successful labeling requires that this segment be translated, accessible, and folded sufficiently to accommodate the SNAP reaction, which imposes an additional requirement compared to the rigid, structured kinase domain where ATP binds. Misfolded or truncated EGFR molecules would therefore likely fail to label at the C-terminus. These factors strongly imply that our assay predominantly reports on receptor molecules that are intact and well folded.
Additionally, our molecular dynamics simulations at 0% and 30% POPS support the experimental ATP-binding measurements (Fig. 2c, d). This consistency between both the experimental and simulated evidence, including at 0% POPS where reduced receptor folding might be expected, suggests that the observed lipid-dependent changes are more likely due to modulation of the functional receptor rather than receptor misfolding. We have clarified these points by adding the following
Results, page 7, “Role of anionic lipids in EGFR kinase activity: In the presence of EGF, increasing the anionic lipid content decreased the number of contacts from 71.8 ± 1.8 to 67.8 ± 2.4, indicating increased accessibility, again in line with the experimental findings. Because detection of EGFR relies on labeling at the C-terminus and ATP binding requires an intact kinase domain, the ATPbinding assay is for receptors that are properly folded and competent for nucleotide binding. The consistency between experimental results and MD simulations suggests that the observed lipiddependent changes are more likely due to modulation of functional EGFR than to artifacts from misfolding.”
Reviewer #1 (Recommendations for the authors):
The experimental program presented here is excellent, and the results are highly interesting. My enthusiasm is dampened by the presentation in places which is confusing, especially Figure 3, which contains so many of the results. I also have some reservations about the bimodal interpretation of the lifetime data in Figure 3.
We thank the reviewer for their positive assessment of our experimental approach and results. In the revised version, we have improved figure organization and readability by adding explicit labels for lipid composition and EGF presence/absence in all lifetime distributions, moving key supplementary tables into main text, and reorganizing the supplementary figures as Extended Data Figures following eLife’s format. Figures and tables now appear in the order in which they are referenced in the text to further improve readability.
Regarding the bimodal interpretation of the lifetime distribution, we have performed global fits of the data with both two- and three-Gaussian models and evaluated them using the Bayesian Information Criterion (BIC) and Ashman’s D analysis, which supported the bimodal interpretation. Details of this analysis are provided in our response to comment (8) below and included in the manuscript.
Specific comments below:
(1) Abstract -"Identifying and investigating this contribution have been challenging owing to the complex composition of the plasma membrane" should be "has".
We have corrected this error in the revised manuscript.
(2) Results - p4 - some explanation of what POPC/POPS are would be helpful.
We have added the text below discussing POPC and POPS.
Results, page 4, “POPC is a zwitterionic phospholipid forming neutral membranes, whereas POPS carries a net negative charge and provides anionic character to the bilayer[56]. Both PC and PS lipids are common constituents of mammalian plasma membranes, with PC enriched in the outer leaflet and PS in the inner leaflet[22].”
(22) Lorent, J. H., Levental, K. R., Ganesan, L., Rivera-Longsworth, G., Sezgin, E., Doktorova, M., Lyman, E. & Levental, I. Plasma membranes are asymmetric in lipid unsaturation, packing and protein shape. Nature Chemical Biology 16, 644–652 (2020).
(56) Her, C., Filoti, D. I., McLean, M. A., Sligar, S. G., Ross, J. A., Steele, H. & Laue, T. M. The charge properties of phospholipid nanodiscs. Biophysical journal 111(5), 989–998 (2016).
(3) Figure 2b - it would be easier to compare if these were plotted on top of each other. Are we at saturating ATP binding concentration or below it? Also, please put a key to say purple - absent and orange +EGF on the figure. I am also confused as to why, with no EGF, ATP binding is high with 0% POPS, but low when EGF is present, but that then reverses with physiological lipid content.
While we agree that a direct comparison would be easier, the ATP-binding experiments for the ± EGF conditions were actually performed independently on separate SDS-PAGE gels, which unfortunately precludes such a comparison. We have added a color key to clarify the -EGF and +EGF datasets.
The experiments were carried out at 1 µM of the fluorescently labeled ATP analogue (atto647Nγ ATP). Reported kinetic measurements for the isolated EGFR kinase domain indicate an K<sub>m</sub> of 5.2 µM suggesting that our experimental concentration is below, but close to the saturating range ensuring sensitivity to changes in accessibility of the binding site rather than saturating all available receptors.
We have revised the manuscript to clarify these details by including the following text:
Results, page 6, “To investigate how the membrane composition impacts accessibility, we measured ATP binding levels for EGFR in membranes with different anionic lipid content. 1 µM of fluorescently-labeled ATP analogue, atto647N-γ ATP, which binds irreversibly to the active site, was added to samples of EGFR nanodiscs with 0%, 15%, 30% or 60% anionic lipid content in the absence or presence of EGF.”
Methods, page 24, “ATP binding experiments: Full-length EGFR in different lipid environments was prepared using cell-free expression as described above. 1μM of snap surface 488 (New England Biolabs) and atto647N labeled gamma ATP (Jena Bioscience) was added after cell-free expression and incubated at 30 °C , 300 rpm for 60 minutes. 1μM of atto647N-γ ATP was used, corresponding to a concentration near the reported Km of 5.2 µM for ATP binding to the isolated EGFR kinase domain[93], ensuring sensitivity to lipid-dependent changes in ATP accessibility.”
(ii) Nucleotide binding is suppressed under basal conditions, likely to ensure that the catalytic activity is promoted only upon EGF stimulation.
The molecular dynamics simulations at 0% and 30% POPS further support this interpretation, showing that anionic lipids modulate the accessibility of the ATP-binding site in a manner consistent with experimental trends (Fig. 2c and 2d).
We have clarified these points in the main text with the following additions:
Results, page 6, “In the presence of EGF, ATP binding overall increased with anionic lipid content with the highest levels observed in 60% POPS bilayers. In the neutral bilayer, ligand seemed to suppress ATP binding, indicating anionic lipids are required for the regulated activation of EGFR.”
Results, page 7, “In the absence of EGF, increasing the anionic lipid content from 0\% POPS to 30% POPS increased the number of ATP-lipid contacts 58.6±0.7 to 74.4±1.2, indicating reduced accessibility, consistent with the experimental results and suggesting anionic lipids are required for ligand-induced EGFR activity.”
(93) Yun, C. H., Mengwasser, K. E., Toms, A. V., Woo, M. S., Greulich, H., Wong, K. K., Meyerson,M. & Eck, M.J. The T790M mutation in EGFR kinase causes drug resistance by increasing the affinity for ATP. PNAS, 105(6), 2070–2075 (2008).
(4) Figure 2d - how was the 16A distance arrived at?
We thank the reviewer for pointing this out. The 16 Å cutoff was chosen based on the physical dimensions of the ATP analogue used in the experiments. Specifically, the largest radius of the atto647N-γ ATP molecule is ~16.9 Å, which defines the maximum distance at which lipid atoms could sterically obstruct access of ATP to the binding pocket. Accordingly, in the simulations, contacts were defined as pairs of coarse-grained atoms between lipid molecules and the residues forming the ATP-binding site (residues 694-703, 719, 766-769, 772-773, 817, 820, and 831) separated by less than 16 Å.
We have rewritten the rationale for selecting the 16 Å cutoff in the Methods section to improve clarity.
Methods, page 28, “Coarse-grained, Explicit-solvent Simulations with the MARTINI Force Field: We analyzed our simulations using WHAM[108,109] to reweight the umbrella biases and compute the average values of various metrics introduced in this manuscript. Specifically, we calculated the distance between Residue 721 and Residue 1186 (EGFR C-terminus) of the protein. To quantify the accessibility of the ATP-binding site, we calculated the number of contacts between lipid molecules and the residues forming the ATP-binding pocket (residues 694-703, 719, 766-769, 772-773, 817, 820, and 831)[110]. Close contact between the bilayer and these residues would sterically hinder ATP binding; thus, the contact number serves as a proxy for ATP-site accessibility. The cutoff distance for defining a contact was set to 16 Å, corresponding to the largest molecular radius of the fluorescent ATP analogue (atto647N-γ ATP, 16.96 Å111). Accordingly, we defined a contact as a pair of coarse-grained atoms, one from the lipid membrane and one from the ATP binding site, within a mutual distance of less than 16 Å.”
(5) Figure 2e-h - I think a bar chart/violin plot/jitter plot would make it easier to compare the peak values. The statistics in the table should just be quoted in the text as value +/- error from the 95% confidence interval. The way it is written currently is confusing, as it implies that there is no conformational change with the addition of EGF in neutral lipids, but there is ~0.4nm one from the table. I don't understand what you mean by "The larger conformational response of these important domains suggests that the intracellular conformation may play a role in downstream signaling steps, such as binding of adaptor proteins"?
We thank the reviewer for these suggestions. For the smFRET lifetime distributions (Figure 2j, k; previously Figure 2e, f), we have now included jitter plots of the donor lifetimes in the Supplementary Figure 11 to facilitate direct visual comparison of the median and distribution widths for each lipid composition and ±EGF conditions. The distance distributions for the ATP to C-terminus in Figure 2e, f (previously Figure 2g, h) were obtained from umbrella-sampling simulations that calculate free-energy profiles rather than raw, unbiased distance values. Because the sampling is guided by biasing potentials, individual distance values cannot be used to construct violin or jitter plots. We therefore present the simulation data only as probability density distributions, which best reflect the equilibrium distributions derived from them.
We have also revised the text to report the median ± 95% confidence interval, improving clarity and consistency with the statistical table.
Results, page 9: “In the neutral bilayer (0% POPS), the distributions in the absence of EGF peaks at 8.1 nm (95% CI: 8.0–8.2 nm) and in the presence of EGF peaks at 8.6 nm (95% CI: 8.5–8.7 nm) (Table 1, Supplementary Table 1). In the physiological regime of 30% POPS nanodiscs, the peak of the donor lifetime distribution shifts from 9.1 nm (95% CI: 8.9–9.2 nm) in the absence of EGF to 11.6 nm (95% CI: 11.1–12.6 nm) in the presence of EGF (Table 1, Supplementary Table 1), which is a larger EGF-induced conformational response than in neutral lipids.”
Finally, we have rephrased the sentence in question for clarity. The revised text now reads:
Results, page 9: “The larger conformational response observed in the presence of anionic lipids suggests that these lipids enhance the responsiveness of the intracellular domains to EGF, potentially ensuring interactions between C-terminal sites and adaptor proteins during downstream signaling.”
(6) "r, highlighting that the charged lipids can enhance the conformational response even for protein regions far away from the plasma membrane" - is it not that the neutral membrane is just very weird and not physiological that EGFR and other proteins don't function properly?
We agree with the reviewer that completely neutral (0% POPS) membranes are not physiological and likely do not support the native organization or activity of EGFR. We have revised the text to clarify that the 30% POPS condition represents a more native-like lipid environment that restores or stabilizes the expected conformational response, rather than "enhancing" it. The revised sentence now reads:
Results, page 10: “Both experimental and computational results show a larger EGF-induced conformational change in the partially anionic bilayer, consistent with the notion that a partially anionic lipid bilayer provides a more native environment that supports proper receptor activation, compared to the non-physiological neutral membrane.”
(7) "snap surface 594 on the C-terminal tail as the donor and the fluorescently-labeled lipid (Cy5) as the acceptor (Supplementary Fig. 2, 11)." Why not refer to Figure 3a here to make it easier to read?
We have added the reference to Figure 3a, and we thank the Reviewer for the suggestion.
(8) Figure 3 - the bimodality in many of these plots is dubious. It's very clear in some, i.e. 0% POPS +EGF, but not others. Can anything be done to justify bimodality better?
We agree that statistical justification is important for interpreting lifetime distributions. To address this, we performed global fits of the data with both two- and three-Gaussian models and evaluated them using the Bayesian Information Criterion (BIC), which balances the model fit with a penalty for additional parameters. The three-Gaussian model gave a substantially lower BIC, indicating statistical preference for the more complex model. However, we also assessed the separability of the Gaussian components using Ashman’s D, which quantifies whether peaks are distinct. This analysis showed that two of the Gaussians are not separable, implying they represent one broad distribution rather than two discrete states. Therefore, when all the distributions are fit globally, the data are best described as two Gaussians, one centered at ~1.3 ns and the other at ~2.7 ns, with cholesterol-dependent shifts reflecting changes in the distribution of this population rather than the emergence of a separate state. We better justified our choice of model by incorporating the results of the global two- vs three-Gaussian fits with BIC and Ashman’s D analysis in the revised manuscript.
Methods, page 27: “Model Selection and Statistical Analysis
Global fitting of lifetime distributions was performed across all experimental conditions using maximum likelihood estimation. Both two-Gaussian and three-Gaussian distribution models were evaluated as described previously.62 Model performance was compared using the Bayesian Information Criterion (BIC),[101] which balances model likelihood and complexity according to
BIC = -2 ln L + k ln n
where L is the likelihood, k is the number of free parameters, and n is the number of singlemolecule photon bunches across all experimental conditions. A lower BIC value indicates a statistically better model[101]. The separation between Gaussian components was subsequently assessed using the Ashman’s D where a score above 2 indicates good separation[102]. For two Gaussian components with means µ1, µ2 and standard deviations σ1, σ2,
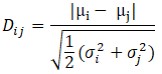
where Dij represents the distance metric between Gaussian components i and j. All fitted parameters, likelihood values, BIC scores, and Ashman’s D values are summarized in Supplementary Table 5.”
(101) Schwarz, G. Estimating the dimension of a model. The Annals of Statistics, 461–464 (1978).
(102) Ashman, K. M., Bird, C. M. & Zepf, S. E. Detecting bimodality in astronomical datasets. The Astronomical Journal 108(6), 2348–2361 (1994).
(9) Figure 3c - can you better label the POPS/POPC on here?
We thank the reviewer for this suggestion. In the revised manuscript, Figure 3b (previously Figure 3c) has been updated to label the lipid composition corresponding to each smFRET distribution to make the comparison across conditions easier to follow.
(10) Figure 3g - it looks like cholesterol causes a shift in both the peaks, such that the previous open and closed states are not the same, but that there are 2 new states. This is key as the authors state: "Remarkably, high anionic lipids and cholesterol content produce the same EGFR conformations but with opposite effects on signaling-suppression or enhancement." But this is only true if there really are the same conformational states for all lipid/cholesterol conditions. Again, the bimodal models used for all conditions need to be justified.
We appreciate the reviewer’s insightful comment. We agree that the interpretation of the lifetime distributions depends on whether cholesterol and anionic lipids modulate existing conformational states or create new ones. To test this, we performed global fits of all distributions using the two- and three-Gaussian models and compared them using the Bayesian Information Criterion (BIC) and Ashman’s D, the results of which are described in detail in response to (8) above.
Both fitting models, two- and three-Gaussian, identified the same short lifetime component (µ = 1.3 ns), suggesting this reflects a well separated conformation. While the three-Gaussian model gave a lower BIC, Ashman’s D analysis indicated that the two of the three components (µ = 2.6 ns and 3.4 ns) are not statistically separable, suggesting they represent a single broad conformational population rather than distinct states. If instead these two components reflected distinct states present under different conditions, Ashman’s D analysis would have found the opposite result. This supports our interpretation that high cholesterol and high anionic lipid content produce similar conformation ensembles with opposite effects on signaling output.
Finally, we acknowledge that additional conformations may exist, but based on this analysis a bimodal model describes the populations captured in our data and so we limit ourselves to this simplest framework. We have clarified this rationale in the revised manuscript and added the results of the BIC and Ashman’s D analysis to support this interpretation.
(11) Why are we jumping about between figures in the text? Figure 1d is mentioned after Figure 2. Also, DMPC is shown in the figures way before it is described in the text. It is very confusing. Figure 3 is so compact. I think it should be spread out and only shown in the order presented in the text. Different parts of the figure are referred to seemingly at random in the text. Why is DMPC first in the figure, when it is referred to last in the text?
Following the Reviewer’s comment, we have revised the figure order and layout to improve readability and ensure consistency with the text. The previous Figures 1d-f which introduce the single-molecule fluorescence setup are now Figure 2g-i, positioned immediately before the first single-molecule FRET experiments (Fig 2j, k). The DMPC distribution in Figure 3 has been moved to the Supplementary Information (Supplementary Fig. 17), where it is shown alongside POPC, as these datasets are compared in the section “Mechanism of cholesterol inhibition of EGFR transmembrane conformational response”. The smFRET distributions in Figure 3 are now presented in the same sequence as they are discussed in the text, and the figure has been spread out for better clarity.
(12) Throughout, I find the presentation of numerical results, their associated error, and whether they are statistically significantly different from each other confusing. A lot of this is in supplementary tables, but I think these need to go in the main text.
To improve clarity and ensure that key quantitative results are easily accessible, we have moved the relevant supplementary tables to the main text. Specifically, the following tables have been incorporated into the main manuscript:
(i) Median distance between the ATP binding site and the EGFR C-terminus, or between membrane and EGFR C-terminus from smFRET measurements (previously supplementary table 1 is now main table 1)
(ii) Median distance between the membrane and the EGFR C-terminus in different anionic lipid environments (previously supplementary table 4 is now main table 2)
(iii) Median distance between the membrane and the EGFR C-terminus in different cholesterol environments (previously supplementary table 8 and 12 is now combined to be main table 3)
(13) Supplementary figures - in general, there is a need to consider how to combine or simplify these for eLife, as they will have to become extended data figures.
We thank the reviewer for this helpful suggestion. In the revised manuscript, we have reorganized the supplementary figures into extended data figures in accordance with eLife’s format. Specifically:
- Supplementary Figs. 1–7 are now grouped as Extended Data Figures for Figure 1 in the main text. They are now Figure 1 - figure supplements 1–7.
- Supplementary Fig. 8–11 is now Extended Data Figure associated with Figure 2. It is now Figure 2 - figure supplements 1–4.
- Supplementary Figs. 12–17 are now grouped as Extended Data Figures for Figure 3. They are now Figure 3 - figure supplements 1–6.
(14) Supplementary Figure 2 - label what the two bands are in the EGFR and pEGFR sets at the bottom of panel c.
We thank the reviewer for this comment. The two bands shown in the EGFR and pEGFR blots in Supplementary Fig. 2d (previously Supplementary Fig. 2c) corresponds to replicate samples under identical conditions. We have now clarified this in the figure legend and labeled the lanes as “Rep 1” and “Rep 2” in the revised figure and modified the figure legend.
Supplementary Figure 2, page 31: “(d) Western blots were performed on labelled EGFR in nanodiscs. Anti-EGFR Western blots (left) and anti-phosphotyrosine Western blots (right) tested the presence of EGFR and its ability to undergo tyrosine phosphorylation, respectively, consistent with previous experiments on similar preparations[18, 54, 55]. The two lanes in each blot correspond to replicate samples under identical conditions.”
(15) Supplementary Figures 3+4 - a bar chart/boxplot or similar would be easier for comparison here.
In the revised version, we have replaced the histograms with jitter plots showing the nanodisc size distributions for each condition in supplementary figures 4 and 5 (previously supplementary figures 3 and 4). The plots display individual measurements with a horizontal line indicating the mean size (mean ± standard deviation values provided in the caption).
(16) Supplementary Figures 10, 12, 13, 15, 16 - I would jitter these.
We have incorporated jitter plots for the relevant datasets in Supplementary Figures 11, 13, 15, 16 and 17 (previously supplementary figures 10, 12 13, 15 and 16) to provide a clearer visualization of the data distributions and median values.
Reviewer #2 (Recommendations for the authors):
(1) Reactions were performed in 250 µL volumes. What is the average yield of solubilized EGFR in those reactions? Are there differences in the EGFR solubilization with the various lipid mixtures?
The amount of solubilized EGFR produced in each 250 µL cell-free reaction was below the reliable detection limit for quantitative absorbance assays. At these protein levels, little to no EGFR precipitation was observed for all lipid compositions. Although exact yields could not be determined, fluorescence-based detection confirmed the presence of functional, nanodiscincorporated EGFR suitable for smFRET and ensemble fluorescence experiments. We observed variability in total yield between independent reactions within the same lipid composition, which is common for cell-free systems, but no consistent trend attributable to lipid composition.
(2) Figure S2: It would be better to have a larger overview of the particles on a grid to get a better impression of sample homogeneity.
TEM images showing a larger field of view have been added for each lipid composition in Supplementary Figures 4 and 5.
(3) Figure 2b: It appears that there is some variation in the stoichiometry of ApoA1 and EGFR within the samples. Have equal amounts of each sample been analyzed? Are there, in addition, some precipitates of EGFR? It would further be good to have a negative control without expression to get more information about the additional bands in Figure S2b. As they do not appear in the fluorescent gel, it is unlikely that they represent premature terminations of EGFR.
The fluorescence intensity from the bound ATP analogue (Atto 647N-ATP) and from the snap surface 488 label, which binds stoichiometrically to the SNAP tag at the EGFR C-terminus, was measured for each sample. The relative amount of ATP binding was quantified for each sample by normalizing to the EGFR content (Figure 2b). This normalization accounts for the different amounts of EGFR produced in each condition.
We did not observe any visible precipitation under the reported cell-free conditions, likely due to the following reasons:
(i) EGFR and ApoA1 are co-expressed in the cell-free reaction, and ApoA1 assembles into nanodiscs concurrently with receptor translation, providing an immediate membrane sink
(ii) ApoA1 is expressed at high levels, maintaining disc concentrations that keep the reaction in a soluble regime.
A control cell-free reaction containing only ApoA1∆49 (1 µg) and no EGFR template, analyzed after affinity purification, showed a single prominent band at ~ 25 kDa (gel image below), corresponding to ApoA1, along with faint background bands typical of Ni-NTA purification from cell-lysates. These weak, non-specific bands likely arise from co-purification of endogenous E.coli proteins.
The ApoA1∆49-only control gel has now been included as part of the supplementary figure 2.
(4) Figure S2c: It would be better to show the whole lanes to document the specificity of the antibodies. Anti-Phosphor antibodies are frequently of poor selectivity. In that case, a negative control with corresponding tyrosine mutations would be helpful.
We have updated Figure S2d (previously Figure S2c) to include the full gel lanes to better illustrate the specificity of both the total EGFR and phospho-EGFR (Y1068) antibodies. The results show a single clear band at the expected molecular weight for EGFR, conforming antibody specificity.
(5) The Results section already contains quite some discussion. I would thus recommend combining both sections.
We thank the reviewer for the suggestion. We have now created a results and discussion section to better reflect the content of these paragraphs, with the previous discussion section now a subsection focused on implications of these results.
WiderrufsbelehrungInformationen zum Widerrufsrecht bei der Nutzung von TIPARKein Widerrufsrecht bei individualisierten LeistungenDie über TIPAR erstellten Tierpatenschaftsvereinbarungen werden individuell nach den Angaben des Kunden angefertigt. Gemäß § 312g Abs. 2 Nr. 1 BGB besteht daher kein Widerrufsrecht. Mit Abschluss des Bestellvorgangs bestätigt der Kunde, dass er von diesem Ausschluss des Widerrufsrechts Kenntnis genommen hat und diesem zustimmt.Gründe für den Ausschluss des WiderrufsrechtsIndividuell erstellte LeistungJede Tierpatenschaftsvereinbarung über TIPAR wird auf Basis der individuellen Angaben des Kunden zu Tier, Paten und persönlichen Wünschen erstellt. Es handelt sich um eine nach Kundenspezifikation angefertigte Leistung.Sofortiger Beginn der LeistungMit Vertragsschluss beginnt der Anbieter unverzüglich mit der Bearbeitung und Erstellung der vereinbarten Unterlagen. Dies schließt die Prüfung und Aufbereitung der übermittelten Daten ein.RechtsgrundlageGemäß § 312g Abs. 2 Nr. 1 BGB besteht bei Verträgen über die Lieferung von Waren, die nicht vorgefertigt sind und für deren Herstellung eine individuelle Auswahl oder Bestimmung durch den Verbraucher maßgeblich ist, kein Widerrufsrecht.Ablauf nach VertragsschlussDer Anbieter beginnt unmittelbar nach Zahlungsbestätigung mit der Bearbeitung.1. DatenübermittlungDer Kunde übermittelt alle erforderlichen Angaben zu Tier und Paten über die Plattform. Der Anbieter prüft die Vollständigkeit der Daten.2. Erstellung der UnterlagenDer Anbieter erstellt die individualisierte Patenschaftsvereinbarung und bereitet ggf. zugehörige Materialien wie QR-Codes oder Notfallkarten vor.3. BereitstellungDie fertiggestellten Unterlagen werden dem Kunden digital bereitgestellt. Ab diesem Zeitpunkt ist eine Stornierung ausgeschlossen.Korrekturen vor FertigstellungSollten unmittelbar nach der Bestellung Änderungen an den übermittelten Daten erforderlich sein, bitten wir um umgehende Kontaktaufnahme. Sofern mit der Erstellung noch nicht begonnen wurde, bemühen wir uns, Korrekturen zu berücksichtigen.Kontakt: support@tipar.deWeitere InformationenWeitere Informationen finden sich in den Allgemeinen Geschäftsbedingungen sowie in der Datenschutzerklärung.
Wir brauchen doch diesbezüglich saubere Checkbox-Einwilligungen!! Diese haben wir bereits gemacht - Mittwoch dann mehr :)
Widerrufsrecht Verbraucher haben das Recht, binnen vierzehn Tagen ohne Angabe von Gründen diesen Vertrag zu widerrufen. Die Widerrufsfrist beträgt vierzehn Tage ab dem Tag des Vertragsschlusses. Um Ihr Widerrufsrecht auszuüben, müssen Sie uns (Solid Deal GmbH, Horneburger Str. 44, 45711 Datteln, Deutschland, E-Mail: support@tipar.de, Telefon: +49 (0) 2363 – 39 88 93 60) mittels einer eindeutigen Erklärung (z. B. ein mit der Post versandter Brief oder eine E-Mail) über Ihren Entschluss, diesen Vertrag zu widerrufen, informieren. Sie können dafür das beigefügte Muster-Widerrufsformular verwenden, das jedoch nicht vorgeschrieben ist. Zur Wahrung der Widerrufsfrist reicht es aus, dass Sie die Mitteilung über die Ausübung des Widerrufsrechts vor Ablauf der Widerrufsfrist absenden.
Folgen des Widerrufs Wenn Sie diesen Vertrag widerrufen, haben wir Ihnen alle Zahlungen, die wir von Ihnen erhalten haben, unverzüglich und spätestens binnen vierzehn Tagen ab dem Tag zurückzuzahlen, an dem die Mitteilung über Ihren Widerruf dieses Vertrags bei uns eingegangen ist. Für diese Rückzahlung verwenden wir dasselbe Zahlungsmittel, das Sie bei der ursprünglichen Transaktion eingesetzt haben, es sei denn, mit Ihnen wurde ausdrücklich etwas anderes vereinbart. In keinem Fall werden Ihnen wegen dieser Rückzahlung Entgelte berechnet. Haben Sie verlangt, dass wir mit der Leistung während der Widerrufsfrist beginnen sollen, so haben Sie uns einen angemessenen Betrag zu zahlen, der dem Anteil der bis zu dem Zeitpunkt, zu dem Sie uns von der Ausübung des Widerrufsrechts hinsichtlich dieses Vertrags unterrichten, bereits erbrachten Leistungen im Vergleich zum Gesamtumfang der im Vertrag vorgesehenen Leistungen entspricht.
Ausschluss bzw. vorzeitiges Erlöschen des Widerrufsrechts 1) Kein Widerrufsrecht bei personalisierten Produkten Ein Widerrufsrecht besteht nicht bei Verträgen zur Lieferung von Waren, die nicht vorgefertigt sind und für deren Herstellung eine individuelle Auswahl oder Bestimmung durch den Verbraucher maßgeblich ist oder die eindeutig auf die persönlichen Bedürfnisse des Verbrauchers zugeschnitten sind. Dies betrifft bei TIPAR insbesondere personalisierte Produkte wie gravierte Notfallkarten, QR-Tiermarken oder Plaketten. Rechtsgrundlage ist § 312g Abs. 2 Nr. 1 BGB. (Dejure) 2) Vorzeitiges Erlöschen bei digitalen Inhalten/Leistungen Soweit TIPAR digitale Inhalte oder digitale Leistungen bereitstellt und Sie verlangen, dass wir vor Ablauf der Widerrufsfrist mit der Vertragserfüllung beginnen, kann das Widerrufsrecht vorzeitig erlöschen. Dies gilt insbesondere, wenn Sie im Bestellprozess * ausdrücklich zustimmen, dass wir vor Ablauf der Widerrufsfrist mit der Leistung beginnen, und * bestätigen, dass Sie durch diese Zustimmung Ihr Widerrufsrecht verlieren können, soweit die gesetzlichen Voraussetzungen erfüllt sind. Rechtsgrundlage sind die Regelungen in § 356 BGB. (Dejure)
Korrekturen nach Bestellung Wenn Sie unmittelbar nach der Bestellung Korrekturen an Ihren Angaben benötigen, kontaktieren Sie uns bitte schnellstmöglich unter support@tipar.de. Sofern die Personalisierung eines Produkts noch nicht begonnen hat, bemühen wir uns, Änderungen zu berücksichtigen. Gesetzliche Rechte bleiben unberührt.
Muster-Widerrufsformular (Wenn Sie den Vertrag widerrufen wollen, dann füllen Sie bitte dieses Formular aus und senden Sie es zurück.) An: Solid Deal GmbH, Horneburger Str. 44, 45711 Datteln, Deutschland, E-Mail: support@tipar.de Hiermit widerrufe ich den von mir abgeschlossenen Vertrag über die Erbringung der folgenden Leistung / den Kauf der folgenden Waren: Bestellt am: __ / erhalten am: _ Name des Verbrauchers: Anschrift des Verbrauchers: Unterschrift des Verbrauchers (nur bei Mitteilung auf Papier): Datum: ___
Author response:
General Statements
We are delighted that all reviewers found our manuscript to be a technical advance by providing a much sought after method to arrest budding yeast cells in metaphase of mitosis or both meiotic metaphases. The reviewers also valued our use of this system to make new discoveries in two areas. First, we provided evidence that the spindle checkpoint is intrinsically weaker in meiosis I and showed that this is due to PP1 phosphatase. Second, we determined how the composition and phosphorylation of the kinetochore changes during meiosis, providing key insights into kinetochore function and providing a rich dataset for future studies.
The reviewers also made some extremely helpful suggestions to improve our manuscript, which we will now implement:
(1) Improvements to the discussion throughout the manuscript. The reviewers recommended that we focus our discussion on the novel findings of the manuscript and drew out some key points of interest that deserve more attention. We fully agree with this and we will address this in a revised version.
(2) We will add a new supplemental figure to help interpret the mass spectrometry data, to address Reviewer #3, point 4.
(3) We are currently performing an additional control experiment to address the minor point 1 from reviewer #3. Our experiment to confirm that SynSAC relies on endogenous checkpoint proteins was missing the cell cycle profile of cells where SynSAC was not induced for comparison. We will add this control to our full revision.
(4) In our full revision we will also include representative images of spindle morphology as requested by Reviewer #1, point 2
Description of the planned revisions
Reviewer #1 (Evidence, reproducibility and clarity):
These authors have developed a method to induce MI or MII arrest. While this was previously possible in MI, the advantage of the method presented here is that it works for MII, and chemically inducible because it is based on a system that is sensitive to the addition of ABA. Depending on when the ABA is added, they achieve a MI or MII delay. The ABA promotes dimerizing fragments of Mps1 and Spc105 that can't bind their chromosomal sites. The evidence that the MI arrest is weaker than the MII arrest is convincing and consistent with published data and indicating the SAC in MI is less robust than MII or mitosis. The authors use this system to find evidence that the weak MI arrest is associated with PP1 binding to Spc105. This is a nice use of the system.
The remainder of the paper uses the SynSAC system to isolate populations enriched for MI or MII stages and conduct proteomics. This shows a powerful use of the system but more work is needed to validate these results, particularly in normal cells.
Overall the most significant aspect of this paper is the technical achievement, which is validated by the other experiments. They have developed a system and generated some proteomics data that maybe useful to others when analyzing kinetochore composition at each division. Overall, I have only a few minor suggestions.
We appreciate the reviewers’ support of our study.
(1) In wild-type - Pds1 levels are high during M1 and A1, but low in MII. Can the authors comment on this? In line 217, what is meant by "slightly attenuated? Can the authors comment on how anaphase occurs in presence of high Pds1? There is even a low but significant level in MII.
The higher levels of Pds1 in meiosis I compared to meiosis II has been observed previously using immunofluorescence and live imaging[1–3]. Although the reasons are not completely clear, we speculate that there is insufficient time between the two divisions to re-accumulate Pds1 prior to separase re-activation.
We agree “slightly attenuated” was confusing and we have re-worded this sentence to read “Addition ABA at the time of prophase release resulted in Pds1securin stabilisation throughout the time course, consistent with delays in both metaphase I and II”.
We do not believe that either anaphase I or II occur in the presence of high Pds1. Western blotting represents the amount of Pds1 in the population of cells at a given time point. The time between meiosis I and II is very short even when treated with ABA. For example, in Figure 2B, spindle morphology counts show that the anaphase I peak is around 40% at its maxima (105 min) and around 40% of cells are in either metaphase I or metaphase II, and will be Pds1 positive. In contrast, due to the better efficiency of meiosis II, anaphase II hardly occurs at all in these conditions, since anaphase II spindles (and the second nuclear division) are observed at very low frequency (maximum 10%) from 165 minutes onwards. Instead, metaphase II spindles partially or fully breakdown, without undergoing anaphase extension. Taking Pds1 levels from the western blot and the spindle data together leads to the conclusion that at the end of the time-course, these cells are biochemically in metaphase II, but unable to maintain a robust spindle. Spindle collapse is also observed in other situations where meiotic exit fails, and potentially reflects an uncoupling of the cell cycle from the programme governing gamete differentiation[3–5]. We will explain this point in a revised version while referring to representative images that from evidence for this, as also requested by the reviewer below.
(2) The figures with data characterizing the system are mostly graphs showing time course of MI and MII. There is no cytology, which is a little surprising since the stage is determined by spindle morphology. It would help to see sample sizes (ie. In the Figure legends) and also representative images. It would also be nice to see images comparing the same stage in the SynSAC cells versus normal cells. Are there any differences in the morphology of the spindles or chromosomes when in the SynSAC system?
This is an excellent suggestion and will also help clarify the point above. We will provide images of cells at the different stages. For each timepoint, 100 cells were scored. We have already included this information in the figure legends
(3) A possible criticism of this system could be that the SAC signal promoting arrest is not coming from the kinetochore. Are there any possible consequences of this? In vertebrate cells, the RZZ complex streams off the kinetochore. Yeast don't have RZZ but this is an example of something that is SAC dependent and happens at the kinetochore. Can the authors discuss possible limitations such as this? Does the inhibition of the APC effect the native kinetochores? This could be good or bad. A bad possibility is that the cell is behaving as if it is in MII, but the kinetochores have made their microtubule attachments and behave as if in anaphase.
In our view, the fact that SynSAC does not come from kinetochores is a major advantage as this allows the study of the kinetochore in an unperturbed state. It is also important to note that the canonical checkpoint components are all still present in the SynSAC strains, and perturbations in kinetochore-microtubule interactions would be expected to mount a kinetochore-driven checkpoint response as normal. Indeed, it would be interesting in future work to understand how disrupting kinetochore-microtubule attachments alters kinetochore composition (presumably checkpoint proteins will be recruited) and phosphorylation but this is beyond the scope of this work. In terms of the state at which we are arresting cells – this is a true metaphase because cohesion has not been lost but kinetochore-microtubule attachments have been established. This is evident from the enrichment of microtubule regulators but not checkpoint proteins in the kinetochore purifications from metaphase I and II. While this state is expected to occur only transiently in yeast, since the establishment of proper kinetochore-microtubule attachments triggers anaphase onset, the ability to capture this properly bioriented state will be extremely informative for future studies. We appreciate the reviewers’ insight in highlighting these interesting discussion points which we will include in a revised version.
Reviewer #1 (Significance):
These authors have developed a method to induce MI or MII arrest. While this was previously possible in MI, the advantage of the method presented here is it works for MII, and chemically inducible because it is based on a system that is sensitive to the addition of ABA. Depending on when the ABA is added, they achieve a MI or MII delay. The ABA promotes dimerizing fragments of Mps1 and Spc105 that can't bind their chromosomal sites. The evidence that the MI arrest is weaker than the MII arrest is convincing and consistent with published data and indicating the SAC in MI is less robust than MII or mitosis. The authors use this system to find evidence that the weak MI arrest is associated with PP1 binding to Spc105. This is a nice use of the system.
The remainder of the paper uses the SynSAC system to isolate populations enriched for MI or MII stages and conduct proteomics. This shows a powerful use of the system but more work is needed to validate these results, particularly in normal cells.
Overall the most significant aspect of this paper is the technical achievement, which is validated by the other experiments. They have developed a system and generated some proteomics data that maybe useful to others when analyzing kinetochore composition at each division.
We appreciate the reviewer’s enthusiasm for our work.
Reviewer #2 (Evidence, reproducibility and clarity):
The manuscript submitted by Koch et al. describes a novel approach to collect budding yeast cells in metaphase I or metaphase II by synthetically activating the spinde checkpoint (SAC). The arrest is transient and reversible. This synchronization strategy will be extremely useful for studying meiosis I and meiosis II, and compare the two divisions. The authors characterized this so-named syncSACapproach and could confirm previous observations that the SAC arrest is less efficient in meiosis I than in meiosis II. They found that downregulation of the SAC response through PP1 phosphatase is stronger in meiosis I than in meiosis II. The authors then went on to purify kinetochore-associated proteins from metaphase I and II extracts for proteome and phosphoproteome analysis. Their data will be of significant interest to the cell cycle community (they compared their datasets also to kinetochores purified from cells arrested in prophase I and -with SynSAC in mitosis).
I have only a couple of minor comments:
(1) I would add the Suppl Figure 1A to main Figure 1A. What is really exciting here is the arrest in metaphase II, so I don't understand why the authors characterize metaphase I in the main figure, but not metaphase II. But this is only a suggestion.
This is a good suggestion, we will do this in our full revision.
(2) Line 197, the authors state: “...SyncSACinduced a more pronounced delay in metaphase II than in metaphase I”. However, line 229 and 240 the authors talk about a "longer delay in metaphase <i compared to metaphase II"... this seems to be a mix-up.
Thank you for pointing this out, this is indeed a typo and we have corrected it.
(3) The authors describe striking differences for both protein abundance and phosphorylation for key kinetochore associated proteins. I found one very interesting protein that seems to be very abundant and phosphorylated in metaphase I but not metaphase II, namely Sgo1. Do the authors think that Sgo1 is not required in metaphase II anymore? (Top hit in suppl Fig 8D).
This is indeed an interesting observation, which we plan to investigate as part of another study in the future. Indeed, data from mouse indicates that shugoshin-dependent cohesin deprotection is already absent in meiosis II in mouse oocytes[6], though whether this is also true in yeast is not known. Furthermore, this does not rule out other functions of Sgo1 in meiosis II (for example promoting biorientation). We will include this point in the discussion.
Reviewer #2 (Significance):
The technique described here will be of great interest to the cell cycle community. Furthermore, the authors provide data sets on purified kinetochores of different meiotic stages and compare them to mitosis. This paper will thus be highly cited, for the technique, and also for the application of the technique.
Reviewer #3 (Evidence, reproducibility and clarity):
In their manuscript, Koch et al. describe a novel strategy to synchronize cells of the budding yeast Saccharomyces cerevisiae in metaphase I and metaphase II, thereby facilitating comparative analyses between these meiotic stages. This approach, termed SynSAC, adapts a method previously developed in fission yeast and human cells that enables the ectopic induction of a synthetic spindle assembly checkpoint (SAC) arrest by conditionally forcing the heterodimerization of two SAC components upon addition of the plant hormone abscisic acid (ABA). This is a valuable tool, which has the advantage that induces SAC-dependent inhibition of the anaphase promoting complex without perturbing kinetochores. Furthermore, since the same strategy and yeast strain can be also used to induce a metaphase arrest during mitosis, the methodology developed by Koch et al. enables comparative analyses between mitotic and meiotic cell divisions. To validate their strategy, the authors purified kinetochores from meiotic metaphase I and metaphase II, as well as from mitotic metaphase, and compared their protein composition and phosphorylation profiles. The results are presented clearly and in an organized manner.
We are grateful to the reviewer for their support.
Despite the relevance of both the methodology and the comparative analyses, several main issues should be addressed:
(1) In contrast to the strong metaphase arrest induced by ABA addition in mitosis (Supp. Fig. 2), the SynSAC strategy only promotes a delay in metaphase I and metaphase II as cells progress through meiosis. This delay extends the duration of both meiotic stages, but does not markedly increase the percentage of metaphase I or II cells in the population at a given timepoint of the meiotic time course (Fig. 1C). Therefore, although SynSAC broadens the time window for sample collection, it does not substantially improve differential analyses between stages compared with a standard NDT80 prophase block synchronization experiment. Could a higher ABA concentration or repeated hormone addition improve the tightness of the meiotic metaphase arrest?
For many purposes the enrichment and extended time for sample collection is sufficient, as we demonstrate here. However, as pointed out by the reviewer below, the system can be improved by use of the 4A-RASA mutations to provide a stronger arrest (see our response below). We did not experiment with higher ABA concentrations or repeated addition since the very robust arrest achieved with the 4A-RASA mutant deemed this unnecessary.
(2) Unlike the standard SynSAC strategy, introducing mutations that prevent PP1 binding to the SynSAC construct considerably extended the duration of the meiotic metaphase arrests. In particular, mutating PP1 binding sites in both the RVxF (RASA) and the SILK (4A) motifs of the Spc105(1-455)-PYL construct caused a strong metaphase I arrest that persisted until the end of the meiotic time course (Fig. 3A). This stronger and more prolonged 4A-RASA SynSAC arrest would directly address the issue raised above. It is unclear why the authors did not emphasize more this improved system. Indeed, the 4A-RASA SynSAC approach could be presented as the optimal strategy to induce a conditional metaphase arrest in budding yeast meiosis, since it not only adapts but also improves the original methods designed for fission yeast and human cells. Along the same lines, it is surprising that the authors did not exploit the stronger arrest achieved with the 4A-RASA mutant to compare kinetochore composition at meiotic metaphase I and II.
We agree that the 4A-RASA mutant is the best tool to use for the arrest and going forward this will be our approach. We collected the proteomics data and the data on the SynSAC mutant variants concurrently, so we did not know about the improved arrest at the time the proteomics experiment was done. Because very good arrest was already achieved with the unmutated SynSAC construct, we could not justify repeating the proteomics experiment which is a large amount of work using significant resources. However, we will highlight the potential of the 4A-RASA mutant more prominently in our full revision.
(3) The results shown in Supp. Fig. 4C are intriguing and merit further discussion. Mitotic growth in ABA suggest that the RASA mutation silences the SynSAC effect, yet this was not observed for the 4A or the double 4A-RASA mutants. Notably, in contrast to mitosis, the SynSAC 4A-RASA mutation leads to a more pronounced metaphase I meiotic delay (Fig. 3A). It is also noteworthy that the RVAF mutation partially restores mitotic growth in ABA. This observation supports, as previously demonstrated in human cells, that Aurora B-mediated phosphorylation of S77 within the RVSF motif is important to prevent PP1 binding to Spc105 in budding yeast as well.
We agree these are intriguing findings that highlight key differences as to the wiring of the spindle checkpoint in meiosis and mitosis and potential for future studies, however, currently we can only speculate as to the underlying cause. The effect of the RASA mutation in mitosis is unexpected and unexplained. However, the fact that the 4A-RASA mutation causes a stronger delay in meiosis I compared to mitosis can be explained by a greater prominence of PP1 phosphatase in meiosis. Indeed, our data (Figure 4A) show that the PP1 phosphatase Glc7 and its regulatory subunit Fin1 are highly enriched on kinetochores at all meiotic stages compared to mitosis.
We agree that the improved growth of the RVAF mutant is intriguing and points to a role of Aurora B-mediated phosphorylation, though previous work has not supported such a role [7].
We will include a discussion of these important points in a revised version.
(4) To demonstrate the applicability of the SynSAC approach, the authors immunoprecipitated the kinetochore protein Dsn1 from cells arrested at different meiotic or mitotic stages, and compared kinetochore composition using data independent acquisition (DIA) mass spectrometry. Quantification and comparative analyses of total and kinetochore protein levels were conducted in parallel for cells expressing either FLAG-tagged or untagged Dsn1 (Supp. Fig. 7A-B). To better detect potential changes, protein abundances were next scaled to Dsn1 levels in each sample (Supp. Fig. 7C-D). However, it is not clear why the authors did not normalize protein abundance in the immunoprecipitations from tagged samples at each stage to the corresponding untagged control, instead of performing a separate analysis. This would be particularly relevant given the high sensitivity of DIA mass spectrometry, which enabled quantification of thousands of proteins. Furthermore, the authors compared protein abundances in tagged-samples from mitotic metaphase and meiotic prophase, metaphase I and metaphase II (Supp. Fig. 7E-F). If protein amounts in each case were not normalized to the untagged controls, as inferred from the text (lines 333 to 338), the observed differences could simply reflect global changes in protein expression at different stages rather than specific differences in protein association to kinetochores.
While we agree with the reviewer that at first glance, normalising to no tag appears to be the most appropriate normalisation, in practice there is very low background signal in the no tag sample which means that any random fluctuations have a big impact on the final fold change used for normalisation. This approach therefore introduces artefacts into the data rather than improving normalisation.
To provide reassurance that our kinetochore immunoprecipitations are specific, and that the background (no tag) signal is indeed very low, we will provide a new supplemental figure showing the volcanos comparing kinetochore purifications at each stage with their corresponding no tag control.
It is also important to note that our experiment looks at relative changes of the same protein over time, which we expect to be relatively small in the whole cell lysate. We previously documented proteins that change in abundance in whole cell lysates throughout meiosis[8]. In this study, we found that relatively few proteins significantly change in abundance.
Our aim in the current study was to understand how the relative composition of the kinetochore changes and for this, we believe that a direct comparison to Dsn1, a central kinetochore protein which we immunoprecipitated is the most appropriate normalisation.
(5) Despite the large amount of potentially valuable data generated, the manuscript focuses mainly on results that reinforce previously established observations (e.g., premature SAC silencing in meiosis I by PP1, changes in kinetochore composition, etc.). The discussion would benefit from a deeper analysis of novel findings that underscore the broader significance of this study.
We strongly agree with this point and we will re-frame the discussion to focus on the novel findings, as also raised by the other reviewers.
Finally, minor concerns are:
(1) Meiotic progression in SynSAC strains lacking Mad1, Mad2 or Mad3 is severely affected (Fig. 1D and Supp. Fig. 1), making it difficult to assess whether, as the authors state, the metaphase delays depend on the canonical SAC cascade. In addition, as a general note, graphs displaying meiotic time courses could be improved for clarity (e.g., thinner data lines, addition of axis gridlines and external tick marks, etc.).
We will generate the data to include a checkpoint mutant +/- ABA for direct comparison. We will take steps to improve the clarity of presentation of the meiotic timecourse graphs, though our experience is that uncluttered graphs make it easier to compare trends.
(2) Spore viability following SynSAC induction in meiosis was used as an indicator that this experimental approach does not disrupt kinetochore function and chromosome segregation. However, this is an indirect measure. Direct monitoring of genome distribution using GFP-tagged chromosomes would have provided more robust evidence. Notably, the SynSAC mad3Δ mutant shows a slight viability defect, which might reflect chromosome segregation defects that are more pronounced in the absence of a functional SAC.
Spore viability is a much more sensitive way of analysing segregation defects that GFP-labelled chromosomes. This is because GFP labelling allows only a single chromosome to be followed. On the other hand, if any of the 16 chromosomes mis-segregate in a given meiosis this would result in one or more aneuploid spores in the tetrad, which are typically inviable. The fact that spore viability is not significantly different from wild type in this analysis indicates that there are no major chromosome segregation defects in these strains, and we therefore do not plan to do this experiment.
(3) It is surprising that, although SAC activity is proposed to be weaker in metaphase I, the levels of CPC/SAC proteins seem to be higher at this stage of meiosis than in metaphase II or mitotic metaphase (Fig. 4A-B).
We agree, this is surprising and we will point this out in the revised discussion. We speculate that the challenge in biorienting homologs which are held together by chiasmata, rather than back-to-back kinetochores results in a greater requirement for error correction in meiosis I. Interestingly, the data with the RASA mutant also point to increased PP1 activity in meiosis I, and we additionally observed increased levels of PP1 (Glc7 and Fin1) on meiotic kinetochores, consistent with the idea that cycles of error correction and silencing are elevated in meiosis I.
(4) Although a more detailed exploration of kinetochore composition or phosphorylation changes is beyond the scope of the manuscript, some key observations could have been validated experimentally (e.g., enrichment of proteins at kinetochores, phosphorylation events that were identified as specific or enriched at a certain meiotic stage, etc.).
We agree that this is beyond the scope of the current study but will form the start of future projects from our group, and hopefully others.
(5) Several typographical errors should be corrected (e.g., "Knetochores" in Fig. 4 legend, "250uM ABA" in Supp. Fig. 1 legend, etc.)
Thank you for pointing these out, they have been corrected.
Reviewer #3 (Significance):
Koch et al. describe a novel methodology, SynSAC, to synchronize budding yeast cells in metaphase I or metaphase II during meiosis, as well and in mitotic metaphase, thereby enabling differential analyses among these cell division stages. Their approach builds on prior strategies originally developed in fission yeast and human cells models to induce a synthetic spindle assembly checkpoint (SAC) arrest by conditionally forcing the heterodimerization of two SAC proteins upon addition of abscisic acid (ABA). The results from this manuscript are of special relevance for researchers studying meiosis and using Saccharomyces cerevisiae as a model. Moreover, the differential analysis of the composition and phosphorylation of kinetochores from meiotic metaphase I and metaphase II adds interest for the broader meiosis research community. Finally, regarding my expertise, I am a researcher specialized in the regulation of cell division.
Description of the revisions that have already been incorporated in the transferred manuscript
We have only corrected minor typos as detailed above.
Description of analyses that authors prefer not to carry out
The revisions we plan are detailed above. There are just two revisions we believe are either unnecessary or beyond the scope, both minor concerns of Reviewer #3. For clarity we have reproduced them, along with our justification below. In the latter case, the reviewer also acknowledged that further work in this direction is beyond the scope of the current study.
(2) Spore viability following SynSAC induction in meiosis was used as an indicator that this experimental approach does not disrupt kinetochore function and chromosome segregation. However, this is an indirect measure. Direct monitoring of genome distribution using GFP-tagged chromosomes would have provided more robust evidence. Notably, the SynSAC mad3Δ mutant shows a slight viability defect, which might reflect chromosome segregation defects that are more pronounced in the absence of a functional SAC.
Spore viability is a much more sensitive way of analysing segregation defects that GFP-labelled chromosomes. This is because GFP labelling allows only a single chromosome to be followed. On the other hand, if any of the 16 chromosomes mis-segregate in a given meiosis this would result in one or more aneuploid spores in the tetrad, which are typically inviable. The fact that spore viability is not significantly different from wild type in this analysis indicates that there are no major chromosome segregation defects in these strains, and we therefore do not plan to do this experiment.
(4) Although a more detailed exploration of kinetochore composition or phosphorylation changes is beyond the scope of the manuscript, some key observations could have been validated experimentally (e.g., enrichment of proteins at kinetochores, phosphorylation events that were identified as specific or enriched at a certain meiotic stage, etc.).
We agree that this is beyond the scope of the current study but will form the start of future projects from our group, and hopefully others.
(1) Salah, S.M., and Nasmyth, K. (2000). Destruction of the securin Pds1p occurs at the onset of anaphase during both meiotic divisions in yeast. Chromosoma 109, 27–34.
(2) Matos, J., Lipp, J.J., Bogdanova, A., Guillot, S., Okaz, E., Junqueira, M., Shevchenko, A., and Zachariae, W. (2008). Dbf4-dependent CDC7 kinase links DNA replication to the segregation of homologous chromosomes in meiosis I. Cell 135, 662–678.
(3) Marston, A.L.A.L., Lee, B.H.B.H., and Amon, A. (2003). The Cdc14 phosphatase and the FEAR network control meiotic spindle disassembly and chromosome segregation. Developmental cell 4, 711–726. https://doi.org/10.1016/S1534-5807(03)00130-8.
(4) Attner, M.A., and Amon, A. (2012). Control of the mitotic exit network during meiosis. Molecular Biology of the Cell 23, 3122–3132. https://doi.org/10.1091/mbc.E12-03-0235.
(5) Pablo-Hernando, M.E., Arnaiz-Pita, Y., Nakanishi, H., Dawson, D., del Rey, F., Neiman, A.M., and de Aldana, C.R.V. (2007). Cdc15 Is Required for Spore Morphogenesis Independently of Cdc14 in Saccharomyces cerevisiae. Genetics 177, 281–293. https://doi.org/10.1534/genetics.107.076133.
(6) El Jailani, S., Cladière, D., Nikalayevich, E., Touati, S.A., Chesnokova, V., Melmed, S., Buffin, E., and Wassmann, K. (2025). Eliminating separase inhibition reveals absence of robust cohesin protection in oocyte metaphase II. EMBO J 44, 5187–5214. https://doi.org/10.1038/s44318-025-00522-0.
(7) Rosenberg, J.S., Cross, F.R., and Funabiki, H. (2011). KNL1/Spc105 Recruits PP1 to Silence the Spindle Assembly Checkpoint. Current Biology 21, 942–947. https://doi.org/10.1016/j.cub.2011.04.011.
(8) Koch, L.B., Spanos, C., Kelly, V., Ly, T., and Marston, A.L. (2024). Rewiring of the phosphoproteome executes two meiotic divisions in budding yeast. EMBO J 43, 1351–1383. https://doi.org/10.1038/s44318-024-00059-8.
Author response:
The following is the authors’ response to the original reviews.
Public Reviews:
Reviewer #1 (Public review)
(1) It might be good to further discuss potential molecular mechanisms for increasing the TF off rate (what happens at the mechanistic level).
This is now expanded in the Discussion
(2) To improve readability, it would be good to make consistent font sizes on all figures to make sure that the smallest font sizes are readable.
We have normalised figure text as much as is feasible.
(3) upDARs and downDARs - these abbreviations are defined in the figure legend but not in the main text.
We have removed references to these terms from the text and included a definition in the figure legend.
(4) Figure 3B - the on-figure legend is a bit unclear; the text legend does not mention the meaning of "DEG".
We have removed this panel as it was confusing and did not demonstrate any robust conclusion.
(5) The values of apparent dissociation rates shown in Figure 5 are a bit different from values previously reported in literature (e.g., see Okamoto et al., 20203, PMC10505915). Perhaps the authors could comment on this. Also, it would be helpful to add the actual equation that was used for the curve fitting to determine these values to the Methods section.
We have included an explanation of the curve fitting equation in the Methods as suggested.
The apparent dissociation rate observed is a sum of multiple rates of decay – true dissociation rate (k<sub>off</sub>), signal loss caused by photobleaching k<sub>pb</sub>, and signal loss caused by defocusing/tracking error (k<sub>tl</sub>).
k<sub>off</sub><sup>app</sup> = k<sub>off</sub>+ k<sub>pb</sub> + k<sub>tl</sub>
We are making conclusions about relative changes in k<sub>off</sub><sup>app</sup> upon CHD4 depletion, not about the absolute magnitude of true in k<sub>off</sub> or TF residence times.Our conclusions extend to true in k<sub>off</sub> on the assumption that k<sub>pb</sub> and k<sub>tl</sub> are equal across all samples imaged due to identical experimental conditions and analysis. k<sub>pb</sub> and k<sub>tl</sub> vary hugely across experimental set-ups, especially with different laser powers, so other k<sub>off</sub> or k<sub>off</sub><sup>app</sup> values reported in the literature would be expected to differ from ours. Time-lapse experiments or independent determination of k<sub>pb</sub> (and k<sub>tl</sub>) would be required to make any statements about absolute values of k<sub>off</sub>
(6) Regarding the discussion about the functionality of low-affinity sites/low accessibility regions, the authors may wish to mention the recent debates on this (https://www.nature.com/articles/s41586-025-08916-0; https://www.biorxiv.org/content/10.1101/2025.10.12.681120v1).
We have now included a discussion of this point and referenced both papers.
(7) It may be worth expanding figure legends a bit, because the definitions of some of the terms mentioned on the figures are not very easy to find in the text.
We have endeavoured to define all relevant terms in the figure legends.
Reviewer #2 (Public review):
(1) Figure 2 shows heat maps of RNA-seq results following a time course of CHD4 depletion (0, 1, 2 hours...). Usually, the red/blue colour scale is used to visualise differential expression (fold-difference). Here, genes are coloured in red or blue even at the 0-hour time point. This confused me initially until I discovered that instead of folddifference, a z-score is plotted. I do not quite understand what it means when a gene that is coloured blue at the 0-hour time point changes to red at a later time point. Does this always represent an upregulation? I think this figure requires a better explanation.
The heatmap displays z-scores, meaning expression for each gene has been centred and scaled across the entire time course. As a result, time zero is not a true baseline, it simply shows whether the gene’s expression at that moment is above or below its own mean. A transition from blue to red therefore indicates that the gene increases relative to its overall average, which typically corresponds to upregulation, but it doesn’t directly represent fold-change from the 0-hour time point. We have now included a brief explanation of this in the figure legend to make this point clear.
(2) Figure 5D: NANOG, SOX2 binding at the KLF4 locus. The authors state that the enhancers 68, 57, and 55 show a gain in NANOG and SOX2 enrichment "from 30 minutes of CHD4 depletion". This is not obvious to me from looking at the figure. I can see an increase in signal from "WT" (I am assuming this corresponds to the 0 hours time point) to "30m", but then the signals seem to go down again towards the 4h time point. Can this be quantified? Can the authors discuss why TF binding seems to increase only temporarily (if this is the case)?
We have edited the text to more accurately reflect what is going on in the screen shot. We have also replaced “WT” with “0” as this more accurately reflects the status of these cells.
(3) There is no real discussion of HOW CHD4/NuRD counteracts TF binding (i.e. by what molecular mechanism). I understand that the data does not really inform us on this. Still, I believe it would be worthwhile for the authors to discuss some ideas, e.g., local nucleosome sliding vs. a direct (ATP-dependent?) action on the TF itself.
We now include more speculation on this point in the Discussion.
Reviewer #3 (Public review):
The main weakness can be summarised as relating to the fact that authors interpret all rapid changes following CHD4 degradation as being a direct effect of the loss of CHD4 activity. The possibility that rapid indirect effects arise does not appear to have been given sufficient consideration. This is especially pertinent where effects are reported at sites where CHD4 occupancy is initially low.
We acknowledge that we cannot definitively say any effect is a direct consequence of CHD4 depletion and have mitigated statements in the Results and Discussion.
Reviewing Editor Comments:
I am pleased to say all three experts had very complementary and complimentary comments on your paper - congratulations. Reviewer 3 does suggest toning down a few interpretations, which I suggest would help focus the manuscript on its greater strengths. I encourage a quick revision to this point, which will not go back to reviewers, before you request a version of record. I would also like to take this opportunity to thank all three reviewers for excellent feedback on this paper.
As advised we have mitigated the points raised by the reviewers.
Reviewer #2 (Recommendations for the authors):
p9, top: The sentence starting with "Genes increasing in expression after four hours...." is very difficult to understand and should be rephrased or broken up.
We agree. This has been completely re-written.
Reviewer #3 (Recommendations for the authors):
Sites of increased chromatin accessibility emerge more slowly than sites of lost chromatin accessibility. Figure 1D, a little increase in accessibility at 30min, but a more noticeable decrease at 30min. The sites of increased accessibility also have lower absolute accessibility than observed at locations where accessibility is lost. This raises the possibility that the sites of increased accessibility represent rapid but indirect changes occurring following loss of CHD4. Consistent with this, enrichment for CHD4 and MDB3 by CUT and TAG is far higher at sites of decreased accessibility. The low level of CHD4 occupancy observed at sites where accessibility increases may not be relevant to the reason these sites are affected. Such small enrichments can be observed when aligning to other genomic features. The authors interpret their findings as indicating that low occupancy of CHD4 exerts a long-lasting repressive effect at these locations. This is one possible explanation; however, an alternative is that these effects are indirect. Perhaps driven by the very large increase in TF binding that is observed following CHD4 degradation and which appears to occur at many locations regardless of whether CHD4 is present.
The reviewer is right to point out that we don’t know what is direct and what is indirect. All we know is that changes happen very rapidly upon CHD4 depletion. The changes in standard ATAC-seq signal appear greater at the sites showing decreased accessibility than those increasing, however the starting points are very different: a small increase from very low accessibility will likely be a higher fold change than a more visible decrease from very high accessibility (Fig. 1D). In contrast, Figure 6 shows a more visible increase in Tn5 integrations at sites increasing in accessibility at 30 minutes than the change in sites decreasing in accessibility at 30 minutes. We therefore disagree that the sites increasing in accessibility are more likely to be indirect targets. In further support of this, there is a rapid increase in MNase resistance at these sites upon MBD3 reintroduction (Fig. 6I), possibly indicating a direct impact of NuRD on these sites.
Substantial changes in Nanog and SOX2 binding are observed across the time course. These changes are very large, with 43k or 78k additional sites detected. How is this possible? Does the amount of these TF's present in cells change? The argument that transient occupancy of CHD4 acts to prevent TF's binding to what is likely to be many 100's of thousands of sites (if the data for Nanog and SOX2 are representative of other transcription factors such as KLF4) seems unlikely.
The large number of different sites identified gaining TF binding is likely to be a reflection of the number of cells being analysed: within the 10<sup>5</sup>-10<sup>6</sup> cells used for a Cut&Run experiment we detect many sites gaining TF binding. In individual cells we agree it would be unlikely for that many sites to become bound at the same time. We detect no changes in the amounts of Nanog or Sox2 in our cells across 4 hour CHD4 depletion time course. However, we maintain that low frequency interactions of CHD4 with a site can counteract low frequency TF binding and prevent it from stimulating opening of a cryptic enhancer.
While increased TF binding is observed at sites of gained accessibility, the changes in TF occupancy at the lost sites do not progress continuously across the time course. In addition, the changes in occupancy are small in comparison to those observed at the gained sites. The text comments on an increase in SOX2 and Nanog occupancy at 30 min, but there is either no change or a loss by 4 hours. It's difficult to know what to conclude from this.
At sites losing accessibility the enrichment of both Nanog and Sox2 increases at 30 minutes. We suspect this is due to the loss of CHD4’s TF-removal activity. Thereafter the two TFs show different trends: Nanog enrichment then decreases again, probably due to the decrease in accessibility at these sites. Sox2, by contrast, does not change very much, possibly due to its higher pioneering ability. It is true that the amounts of change are very small here, however Cut&Run was performed in triplicate and the summary graphs are plotted with standard error of the mean (which is often too small to see), demonstrating that the detected changes are highly significant. (We neglected to refer to the SEM in our figure legends: this has now been corrected.) At sites where CHD4 maintains chromatin compaction, the amount of transcription factor binding goes from zero or nearly zero to some finite number, hence the fold change is very large. In contrast the changes at sites losing accessibility starts from high enrichment so fold changes are much smaller.
Changes in the diffusive motion of tagged TF's are measured. The data is presented as an average of measurements of individual TF's. What might be anticipated is that subpopulations of TF's would exhibit distinct behaviours. At many locations, occupancy of these TF's are presumably unchanged. At 1 hour, many new sites are occupied, and this would represent a subpopulation with high residence. A small population of TF's would be subject to distinct effects at the sites where accessibility reduces at the onehour time point. The analysis presented fails to distinguish populations of TF's exhibiting altered mobility consistent with the proportion of the TF's showing altered binding.
We agree that there are likely subpopulations of TFs exhibiting distinct binding behaviours, and our modality of imaging captures this, but to distinguish subpopulations within this would require a lot more data.
However, there is no reason to believe that the TF binding at the new sites being occupied at 1 hr would have a difference in residence time to those sites already stably bound by TFs in the wildtype, i.e. that they would exhibit a different limitation to their residence time once bound compared to those sites. We do capture more stably bound trajectories per cell, but that’s not what we’re reporting on - it’s the dissociation rate of those that have already bound in a stable manner at sites where TF occupancy is detected also by ChIP.
The analysis of transcription shown in Figure 2 indicates that high-quality data has been obtained, showing progressive changes to transcription. The linkage of the differentially expressed genes to chromatin changes shown in Figure 3 is difficult to interpret. The curves showing the distance distribution for increased or decreased DARs are quite similar for up- and down-regulated genes. The frequency density for gained sites is slightly higher, but not as much higher as would be expected, given these sites are c6fold more abundant than the sites with lost accessibility. The data presented do not provide a compelling link between the CHD4-induced chromatin changes and changes to transcription; the authors should consider revising to accommodate this. It is possible that much of the transcriptional response even at early time points is indirect. This is not unprecedented. For example, degradation of SOX2, a transcriptional activator, results in both repression and activation of similar numbers of genes https://pmc.ncbi.nlm.nih.gov/articles/PMC10577566/
We agree that these figures do not provide a compelling link between the observed chromatin changes and gene expression changes. That 50K increased sites are, on average, located farther away from misregulated genes than are the 8K decreasing sites highlights that this is rarely going to be a case of direct derepression of a silenced gene, but rather distal sites could act as enhancers to spuriously activate transcription. This would certainly be a rare event, but could explain the low-level transcriptional noise seen in NuRD mutants. We have edited the wording to make this clearer.
The model presented in Figure 7 includes distinct roles at sites that become more or less accessible following inactivation of CHD4. This is perplexing as it implies that the same enzymes perform opposing functions at some of the different sites where they are bound.
Our point is that it does the same thing at both kinds of sites, but the nature of the sites means that the consequences of CHD4 activity will be different. We have tried to make this clear in the text.
At active sites, it is clear that CHD4 is bound prior to activation of the degron and that chromatin accessibility is reduced following depletion. Changes in TF occupancy are complex, perhaps reflecting slow diffusion from less accessible chromatin and a global increase in the abundance of some pluripotency transcription factors such as SOX2 and Nanog that are competent for DNA binding. The link between sites of reduced accessibility and transcription is less clear.
At the inactive sites, the increase in accessibility could be driven by transcription factor binding. There is very little CHD4 present at these sites prior to activation of the degron, and TF binding may induce chromatin opening, which could be considered a rapid but indirect effect of the CHD4 degron. The link to transcription is not clear from the data presented, but it would be anticipated that in some cases it would drive activation.
We acknowledge these points and have indicated this possibility in the Results and the Discussion.
No Analysis is performed to identify binding sequences enriched at the locations of decreased accessibility. This could potentially define transcription factors involved in CHD4 recruitment or that cause CHD4 to function differently in different contexts.
HOMER analyses failed to provide any unique insights. The sites going down are highly accessible in ES cells: they have TF binding sites that one would expect in ES cells. The increasing sites show an enrichment for G-rich sequences, which reflects the binding preference of CHD4.
Thünen-Institut könnten bis 2030 rund 300.000 Hektar landwirtschaftlicher Fläche
In den letzten Jahrzehnten hat Deutschland kontinuierlich Landwirtschaftsfläche verloren, im Durchschnitt mehr als 50 Hektar pro Tag – oder 70 Fußballfelder. Im Gegenzug nahmen Siedlungs- und Verkehrsflächen sowie Waldgebiete zu. Auch wenn dies die Nahrungsversorgung des Landes nicht akut gefährdet, so ist Landwirtschaftsfläche eine kostbare und schützenswerte Ressource. Gerade in Mitteleuropa sind die Flächen fruchtbarer und ertragreicher als in den meisten anderen Regionen der Welt. Daher trägt auch Deutschland eine globale Verantwortung für den Schutz fruchtbarer Ackerflächen zur Nahrungsproduktion und sollte eine Vorreiterrolle in der nachhaltigen Bodennutzung einnehmen.
In einer jetzt erschienenen Studie hat das Thünen-Institut geschätzt, wie viel Landwirtschaftsfläche bis 2030 für andere Nutzungszwecke in Anspruch genommen wird, wenn die aktuellen Planungen und Strategien Realität werden. https://www.thuenen.de/de/newsroom/detail/landwirtschaftliche-boeden-sorgsam-mit-der-wertvollen-ressource-umgehen
Author response:
Point-by-point description of the revisions:
Reviewer #1 (Evidence, reproducibility and clarity):
Summary
In this article, the authors used the synthetic TALE DNA binding proteins, tagged with YFP, which were designed to target five specific repeat elements in Trypanosoma brucei genome, including centromere and telomeres-associated repeats and those of a transposon element. This is in order to detect and identified, using YFP-pulldown, specific proteins that bind to these repetitive sequences in T. brucei chromatin. Validation of the approach was done using a TALE protein designed to target the telomere repeat (TelR-TALE) that detected many of the proteins that were previously implicated with telomeric functions. A TALE protein designed to target the 70 bp repeats that reside adjacent to the VSG genes (70R-TALE) detected proteins that function in DNA repair and the protein designed to target the 177 bp repeat arrays (177R-TALE) identified kinetochore proteins associated T. brucei mega base chromosomes, as well as in intermediate and mini-chromosomes, which imply that kinetochore assembly and segregation mechanisms are similar in all T. brucei chromosome.
Major comments:
Are the key conclusions convincing?
The authors reported that they have successfully used TALE-based affinity selection of proteinassociated with repetitive sequences in the T. brucei genome. They claimed that this study has provided new information regarding the relevance of the repetitive region in the genome to chromosome integrity, telomere biology, chromosomal segregation and immune evasion strategies. These conclusions are based on high-quality research, and it is, basically, merits publication, provided that some major concerns, raised below, will be addressed before acceptance for publication.
(1) The authors used TALE-YFP approach to examine the proteome associated with five different repetitive regions of the T. brucei genome and confirmed the binding of TALE-YFP with Chip-seq analyses. Ultimately, they got the list of proteins that bound to synthetic proteins, by affinity purification and LS-MS analysis and concluded that these proteins bind to different repetitive regions of the genome. There are two control proteins, one is TRF-YFP and the other KKT2-YFP, used to confirm the interactions. However, there are no experiment that confirms that the analysis gives some insight into the role of any putative or new protein in telomere biology, VSG gene regulation or chromosomal segregation. The proteins, which have already been reported by other studies, are mentioned. Although the author discovered many proteins in these repetitive regions, their role is yet unknown. It is recommended to take one or more of the new putative proteins from the repetitive elements and show whether or not they (1) bind directly to the specific repetitive sequence (e.g., by EMSA); (2) it is recommended that the authors will knockdown of one or a small sample of the new discovered proteins, which may shed light on their function at the repetitive region, as a proof of concept.
The main request from Referee 1 is for individual evaluation of protein-DNA interaction for a few candidates identified in our TALE-YFP affinity purifications, particularly using EMSA to identify binding to the DNA repeats used for the TALE selection. In our opinion, such an approach would not actually provide the validation anticipated by the reviewer. The power of TALE-YFP affinity selection is that it enriches for protein complexes that associate with the chromatin that coats the target DNA repetitive elements rather than only identifying individual proteins or components of a complex that directly bind to DNA assembled in chromatin.
The referee suggests we express recombinant proteins and perform EMSA for selected candidates, but many of the identified proteins are unlikely to directly bind to DNA – they are more likely to associate with a combination of features present in DNA and/or chromatin (e.g. specific histone variants or histone post-translational modifications). Of course, a positive result would provide some validation but only IF the tested protein can bind DNA in isolation – thus, a negative result would be uninformative.
In fact, our finding that KKT proteins are enriched using the 177R-TALE (minichromosome repeat sequence) identifies components of the trypanosome kinetochore known (KKT2) or predicted (KKT3) to directly bind DNA (Marciano et al., 2021; PMID: 34081090), and likewise the TelR-TALE identifies the TRF component that is known to directly associate with telomeric (TTAGGG)n repeats (Reis et al 2018; PMID: 29385523). This provides reassurance on the specificity of the selection, as does the lack of cross selectivity between different TALEs used (see later point 3 below). The enrichment of the respective DNA repeats quantitated in Figure 2B (originally Figure S1) also provides strong evidence for TALE selectivity.
It is very likely that most of the components enriched on the repetitive elements targeted by our TALE-YFP proteins do not bind repetitive DNA directly. The TRF telomere binding protein is an exception – but it is the only obvious DNA binding protein amongst the many proteins identified as being enriched in our TelR-TALE-YFP and TRF-YFP affinity selections.
The referee also suggests that follow up experiments using knockdown of the identified proteins found to be enriched on repetitive DNA elements would be informative. In our opinion, this manuscript presents the development of a new methodology previously not applied to trypanosomes, and referee 2 highlights the value of this methodological development which will be relevant for a large community of kinetoplastid researchers. In-depth follow-up analyses would be beyond the scope of this current study but of course will be pursued in future. To be meaningful such knockdown analyses would need to be comprehensive in terms of their phenotypic characterisation (e.g. quantitative effects on chromosome biology and cell cycle progression, rates and mechanism of recombination underlying antigenic variation, etc) – simple RNAi knockdowns would provide information on fitness but little more. This information is already publicly available from genome-wide RNAi screens (www.tritrypDB.org), with further information on protein location available from the genome-wide protein localisation resource (Tryptag.org). Hence basic information is available on all targets selected by the TALEs after RNAi knock down but in-depth follow-up functional analysis of several proteins would require specific targeted assays beyond the scope of this study.
(2) NonR-TALE-YFP does not have a binding site in the genome, but YFP protein should still be expressed by T. brucei clones with NLS. The authors have to explain why there is no signal detected in the nucleus, while a prominent signal was detected near kDNA (see Fig.2). Why is the expression of YFP in NonR-TALE almost not shown compared to other TALE clones?
The NonR-TALE-YFP immunolocalisation signal indeed is apparently located close to the kDNA and away from the nucleus. We are not sure why this is so, but the construct is sequence validated and correct. However, we note that artefactual localisation of proteins fused to a globular eGFP tag, compared to a short linear epitope V5 tag, near to the kinetoplast has been previously reported (Pyrih et al, 2023; PMID: 37669165).
The expression of NonR-TALE-YFP is shown in Supplementary Fig. S2 in comparison to other TALE proteins. Although it is evident that NonR-TALE-YFP is expressed at lower levels than other TALEs (the different TALEs have different expression levels), it is likely that in each case the TALE proteins would be in relative excess.
It is possible that the absence of a target sequence for the NonR-TALE-YFP in the nucleus affects its stability and cellular location. Understanding these differences is tangential to the aim of this study.
However, importantly, NonR-TALE-YFP is not the only control for used for specificity in our affinity purifications. Instead, the lack of cross-selection of the same proteins by different TALEs (e.g. TelR-TALE-YFP, 177R-TALE-YFP) and the lack of enrichment of any proteins of interest by the well expressed ingiR-TALE-YFP or 147R-TALE-YFP proteins each provide strong evidence for the specificity of the selection using TALEs, as does the enrichment of similar protein sets following affinity purification of the TelR-TALE-YFP and TRF-YFP proteins which both bind telomeric (TTAGGG)n repeats. Moreover, control affinity purifications to assess background were performed using cells that completely lack an expressed YFP protein which further support specificity (Figure 6).
We have added text to highlight these important points in the revised manuscript:
Page 8:
“However, the expression level of NonR-TALE-YFP was lower than other TALE-YFP proteins; this may relate to the lack of DNA binding sites for NonR-TALE-YFP in the nucleus.”
Page 8:
“NonR-TALE-YFP displayed a diffuse nuclear and cytoplasmic signal; unexpectedly the cytoplasmic signal appeared to be in the vicinity the kDNA of the kinetoplast (mitochrondria). We note that artefactual localisation of some proteins fused to an eGFP tag has previously been observed in T. brucei (Pyrih et al, 2023).”
Page 10:
Moreover, a similar set of enriched proteins was identified in TelR-TALE-YFP affinity purifications whether compared with cells expressing no YFP fusion protein (No-YFP), the NonR-TALE-YFP or the ingiR-TALE-YFP as controls (Fig. S7B, S8A; Tables S3, S4). Thus, the most enriched proteins are specific to TelR-TALE-YFP-associated chromatin rather than to the TALE-YFP synthetic protein module or other chromatin.
(3) As a proof of concept, the author showed that the TALE method determined the same interacting partners enrichment in TelR-TALE as compared to TRF-YFP. And they show the same interacting partners for other TALE proteins, whether compared with WT cells or with the NonR-TALE parasites. It may be because NonR-TALE parasites have almost no (or very little) YFP expression (see Fig. S3) as compared to other TALE clones and the TRF-YFP clone. To address this concern, there should be a control included, with proper YFP expression.
See response to point 2, but we reiterate that the ingi-TALE -YFP and 147R-TALE-YFP proteins are well expressed (western original Fig. S3 now Fig. S2) but few proteins are detected as being enriched or correspond to those enriched in TelR-TALE-YFP or TRF-YFP affinity purifications (see Fig. S9). Therefore, the ingi-TALE -YFP and 147R-TALE-YFP proteins provide good additional negative controls for specificity as requested. To further reassure the referee we have also included additional volcano plots which compare TelR-TALE-YFP, 70R-TALE-YFP or 177R-TALE-YFP to the ingiR-TALE-YFP affinity selection (new Figure S8). As with No-YFP or NonR-TALE-YFP controls, the use of ingiR-TALE-YFP as a negative control demonstrates that known telomere associated proteins are enriched in TelR-TALE-YFP affinity purification, RPA subunits enriched with 70R-TALE-YFP and Kinetochore KKT poroteins enriched with 177RTALE-YFP. These analyses demonstrate specificity in the proteins enriched following affinity purification of our different TALE-YFPs and provide support to strengthen our original findings.
We now refer to use of No-YFP, NonR-TALE-YFP, and ingiR-TALE -YFP as controls for comparison to TelR-TALE-YFP, 70R-TALE-YFP or 177R-TALE-YFP in several places:
Page10:
“Moreover, a similar set of enriched proteins was identified in TelR-TALE-YFP affinity purifications whether compared with cells expressing no YFP fusion protein (No-YFP), the NonR-TALE-YFP or the ingiR-TALE-YFP as controls (Fig. S7B, S8A; Tables S3, S4).”
Page 11:
“Thus, the nuclear ingiR-TALE-YFP provides an additional chromatin-associated negative control for affinity purifications with the TelR-TALE-YFP, 70R-TALE-YFP and 177R-TALE-YFP proteins (Fig. S8).”
“Proteins identified as being enriched with 70R-TALE-YFP (Figure 6D) were similar in comparisons with either the No-YFP, NonR-TALE-YFP or ingiR-TALE-YFP as negative controls.”
Top Page 12:
“The same kinetochore proteins were enriched regardless of whether the 177R-TALE proteomics data was compared with No-YFP, NonR-TALE or ingiR-TALE-YFP controls.”
Discussion Page 13:
“Regardless, the 147R-TALE and ingiR-TALE proteins were well expressed in T. brucei cells, but their affinity selection did not significantly enrich for any relevant proteins. Thus, 147R-TALE and ingiR-TALE provide reassurance for the overall specificity for proteins enriched TelR-TALE, 70R-TALE and 177R-TALE affinity purifications.”
(4) After the artificial expression of repetitive sequence binding five-TALE proteins, the question is if there is any competition for the TALE proteins with the corresponding endogenous proteins? Is there any effect on parasite survival or health, compared to the control after the expression of these five TALEs YFP protein? It is recommended to add parasite growth curves, for all the TALE proteins expressing cultures.
Growth curves for cells expressing TelR-TALE-YFP, 177R-TALE-YFP and ingiR-TALE-YFP are now included (New Fig S3A). No deficit in growth was evident while passaging 70R-TALE-YFP, 147R-TALE-YFP, NonR-TALE-YFP cell lines (indeed they grew slightly better than controls).
The following text has been added page 8:
“Cell lines expressing representative TALE-YFP proteins displayed no fitness deficit (Fig. S3A).”
(5) Since the experiments were performed using whole-cell extracts without prior nuclear fractionation, the authors should consider the possibility that some identified proteins may have originated from compartments other than the nucleus. Specifically, the detection of certain binding proteins might reflect sequence homology (or partial homology) between mitochondrial DNA (maxicircles and minicircles) and repetitive regions in the nuclear genome. Additionally, the lack of subcellular separation raises the concern that cytoplasmic proteins could have been co-purified due to whole cell lysis, making it challenging to discern whether the observed proteome truly represents the nuclear interactome.
In our experimental design, we confirmed bioinformatically that the repeat sequences targeted were not represented elsewhere in the nuclear or mitochondrial genome (kDNA). The absence of subcellular fractionation could result in some cytoplasmic protein selection, but this is unlikely since each TALE targets a specific DNA sequence but is otherwise identical such that cross-selection of the same contaminating protein set would be anticipated if there was significant non-specific binding. We have previously successfully affinity selected 15 chromatin modifiers and identified associated proteins without major issues concerning cytoplasmic protein contamination (Staneva et al 2021 and 2022; PMID: 34407985 and 36169304). Of course, the possibility that some proteins are contaminants will need to be borne in mind in any future follow-up analysis of proteins of interest that we identified as being enriched on specific types of repetitive element in T. brucei. Proteins that are also detected in negative control, or negative affinity selections such as No-YFP, NoR-YFP, IngiR-TALE or 147R-TALE must be disregarded.
(6) Should the authors qualify some of their claims as preliminary or speculative, or remove them altogether?
As mentioned earlier, the author claimed that this study has provided new information concerning telomere biology, chromosomal segregation mechanisms, and immune evasion strategies. But there are no experiments that provides a role for any unknown or known protein in these processes. Thus, it is suggested to select one or two proteins of choice from the list and validate their direct binding to repetitive region(s), and their role in that region of interaction.
As highlighted in response to point 1 the suggested validation and follow up experiments may well not be informative and are beyond the scope of the methodological development presented in this manuscript. Referee 2 describes the study in its current form as “a significant conceptual and technical advancement” and “This approach enhances our understanding of chromatin organization in these regions and provides a foundation for investigating the functional roles of associated proteins in parasite biology.”
The Referee’s phrase ‘validate their direct binding to repetitive region(s)’ here may also mean to test if any of the additional proteins that we identified as being enriched with a specific TALE protein actually display enrichment over the repeat regions when examined by an orthogonal method. A key unexpected finding was that kinetochore proteins including KKT2 are enriched in our affinity purifications of the 177R-TALE-YFP that targets 177bp repeats (Figure 6F). By conducting ChIP-seq for the kinetochore specific protein KKT2 using YFP-KKT2 we confirmed that KKT2 is indeed enriched on 177bp repeat DNA but not flanking DNA (Figure 7). Moreover, several known telomere-associated proteins are detected in our affinity selections of TelRTALE-YFP (Figure 6B, FigS6; see also Reis et al, 2018 Nuc. Acids Res. PMID: 29385523; Weisert et al, 2024 Sci. Reports PMID: 39681615).
Would additional experiments be essential to support the claims of the paper? Request additional experiments only where necessary for the paper as it is, and do not ask authors to open new lines of experimentation.
The answer for this question depends on what the authors want to present as the achievements of the present study. If the achievement of the paper was is the creation of a new tool for discovering new proteins, associated with the repeat regions, I recommend that they add a proof for direct interactions between a sample the newly discovered proteins and the relevant repeats, as a proof of concept discussed above, However, if the authors like to claim that the study achieved new functional insights for these interactions they will have to expand the study, as mentioned above, to support the proof of concept.
See our response to point 1 and the point we labelled ‘6’ above.
Are the suggested experiments realistic in terms of time and resources? It would help if you could add an estimated cost and time investment for substantial experiments.
I think that they are realistic. If the authors decided to check the capacity of a small sample of proteins (which was unknown before as a repetitive region binding proteins) to interacts directly with the repeated sequence, it will substantially add of the study (e.g., by EMSA; estimated time: 1 months). If the authors will decide to check the also the function of one of at least one such a newly detected proteins (e.g., by KD), I estimate the will take 3-6 months.
As highlighted previously the proposed EMSA experiment may well be uninformative for protein complex components identified in our study or for isolated proteins that directly bind DNA in the context of a complex and chromatin. RNAi knockdown data and cell location data (as well as developmental expression and orthology data) is already available through tritrypDB.org and trtyptag.org
Are the data and the methods presented in such a way that they can be reproduced? Yes
Are the experiments adequately replicated, and statistical analysis adequate?
The authors did not mention replicates. There is no statistical analysis mentioned.
The figure legends indicate that all volcano plots of TALE affinity selections were derived from three biological replicates. Cutoffs used for significance: P < 0.05 (Student's t-test).
For ChiP-seq two biological replicates were analysed for each cell line expressing the specific YFP tagged protein of interest (TALE or KKT2). This is now stated in the relevant figure legends – apologies for this oversight. The resulting data are available for scrutiny at GEO: GSE295698.
Minor comments:
Specific experimental issues that are easily addressable.
The following suggestions can be incorporated:
(1) Page 18, in the material method section author mentioned four drugs: Blasticidine, Phleomycin and G418, and hygromycin. It is recommended to mention the purpose of using these selective drugs for the parasite. If clonal selection has been done, then it should also be mentioned.
We erroneously added information on several drugs used for selection in our labaoratory. In fact all TALE-YFP construct carry the Bleomycin resistance genes which we select for using Phleomycin. Also, clones were derived by limiting dilution immediately after transfection. We have amended the text accordingly:
Page 17/18:
“Cell cultures were maintained below 3 x 10⁶ cells/ml. Pleomycin 2.5 µg/ml was used to select transformants containing the TALE construct BleoR gene.”
“Electroporated bloodstream cells were added to 30 ml HMI-9 medium and two 10-fold serial dilutions were performed in order to isolate clonal Pleomycin resistant populations from the transfection. 1 ml of transfected cells were plated per well on 24-well plates (1 plate per serial dilution) and incubated at 37°C and 5% CO2 for a minimum of 6 h before adding 1 ml media containing 2X concentration Pleomycin (5 µg/ml) per well.”
(2) In the method section the authors mentioned that there is only one site for binding of NonR-TALE in the parasite genome. But in Fig. 1C, the authors showed zero binding site. So, there is one binding site for NonR-TALE-YFP in the genome or zero?
We thank the reviewer for pointing out this discrepancy. We have checked the latest Tb427v12 genome assembly for predicted NonR-TALE binding sites and there are no exact matches. We have corrected the text accordingly.
Page 7:
“A control NonR-TALE protein was also designed which was predicted to have no target sequence in the T. brucei genome.”
Page 17:
“A control NonR-TALE predicted to have no recognised target in the T. brucei geneome was designed as follows: BLAST searches were used to identify exact matches in the TREU927 reference genome. Candidate sequences with one or more match were discarded.”
(3) The authors used two different anti-GFP antibodies, one from Roche and the other from Thermo Fisher. Why were two different antibodies used for the same protein?
We have found that only some anti-GFP antibodies are effective for affinity selection of associated proteins, whereas others are better suited for immunolocalisation. The respective suppliers’ antibodies were optimised for each application.
(4) Page 6: in the introduction, the authors give the number of total VSG genes as 2,634. Is it known how many of them are pseudogenes?
This value corresponds to the number reported by Consentino et al. 2021 (PMID: 34541528) for subtelomeric VSGs, which is similar to the value reported by Muller et al 2018 (PMID: 30333624) (2486), both in the same strain of trypanosomes as used by us. Based on the earlier analysis by Cross et al (PMID: 24992042), 80% of the identified VSGs in their study (2584) are pseudogenes. This approximates to the estimation by Consentino of 346/2634 (13%) being fully functional VSG genes at subtelomeres, or 17% when considering VSGs at all genomic locations (433/2872).
(5) I found several typos throughout the manuscript.
Thank you for raising this, we have read through the manuscipt several times and hopefully corrected all outstanding typos.
(6) Fig. 1C: Table: below TOTAL 2nd line: the number should be 1838 (rather than 1828)
Corrected- thank you.
- Are prior studies referenced appropriately? Yes
- Are the text and figures clear and accurate? Yes
- Do you have suggestions that would help the authors improve the presentation of their data and conclusions? Suggested above
Reviewer #1 (Significance):
Describe the nature and significance of the advance (e.g., conceptual, technical, clinical) for the field:
This study represents a significant conceptual and technical advancement by employing a synthetic TALE DNA-binding protein tagged with YFP to selectively identify proteins associated with five distinct repetitive regions of T. brucei chromatin. To the best of my knowledge, it is the first report to utilize TALE-YFP for affinity-based isolation of protein complexes bound to repetitive genomic sequences in T. brucei. This approach enhances our understanding of chromatin organization in these regions and provides a foundation for investigating the functional roles of associated proteins in parasite biology. Importantly, any essential or unique interacting partners identified could serve as potential targets for therapeutic intervention.
- Place the work in the context of the existing literature (provide references, where appropriate). I agree with the information that has already described in the submitted manuscript, regarding its potential addition of the data resulted and the technology established to the study of VSGs expression, kinetochore mechanism and telomere biology.
- State what audience might be interested in and influenced by the reported findings. These findings will be of particular interest to researchers studying the molecular biology of kinetoplastid parasites and other unicellular organisms, as well as scientists investigating chromatin structure and the functional roles of repetitive genomic elements in higher eukaryotes.
- (1) Define your field of expertise with a few keywords to help the authors contextualize your point of view. Protein-DNA interactions/ chromatin/ DNA replication/ Trypanosomes
- (2) Indicate if there are any parts of the paper that you do not have sufficient expertise to evaluate. None
Reviewer #2 (Evidence, reproducibility and clarity):
Summary
Carloni et al. comprehensively analyze which proteins bind repetitive genomic elements in Trypanosoma brucei. For this, they perform mass spectrometry on custom-designed, tagged programmable DNA-binding proteins. After extensively verifying their programmable DNA-binding proteins (using bioinformatic analysis to infer target sites, microscopy to measure localization, ChIP-seq to identify binding sites), they present, among others, two major findings: 1) 14 of the 25 known T. brucei kinetochore proteins are enriched at 177bp repeats. As T. brucei's 177bp repeatcontaining intermediate-sized and mini-chromosomes lack centromere repeats but are stable over mitosis, Carloni et al. use their data to hypothesize that a 'rudimentary' kinetochore assembles at the 177bp repeats of these chromosomes to segregate them. 2) 70bp repeats are enriched with the Replication Protein A complex, which, notably, is required for homologous recombination. Homologous recombination is the pathway used for recombination-based antigenic variation of the 70bp-repeat-adjacent variant surface glycoproteins.
Major Comments
None. The experiments are well-controlled, claims well-supported, and methods clearly described. Conclusions are convincing.
Thank you for these positive comments.
Minor Comments
(1) Fig. 2 - I couldn't find an uncropped version showing multiple cells. If it exists, it should be linked in the legend or main text; Otherwise, this should be added to the supplement.
The images presented represent reproducible analyses, and independently verified by two of the authors. Although wider field of view images do not provide the resolution to be informative on cell location, as requested we have provided uncropped images in new Fig. S4 for all the cell lines shown in Figure 2A.
In addition, we have included as supplementary images (Fig. S3B) additional images of TelRTALE-YFP, 177R-TALE-YFP and ingiR-TALE YFP localisation to provide additional support their observed locations presented in Figure 1. The set of cells and images presented in Figure 2A and in Fig S3B were prepared and obtained by a different authors, independently and reproducibly validating the location of the tagged protein.
(2) I think Suppl. Fig. 1 is very valuable, as it is a quantification and summary of the ChIP-seq data. I think the authors could consider making this a panel of a main figure. For the main figure, I think the plot could be trimmed down to only show the background and the relevant repeat for each TALE protein, leaving out the non-target repeats. (This relates to minor comment 6.) Also, I believe, it was not explained how background enrichment was calculated.
We are grateful for the reviewer’s positive view of original Fig. S1 and appreciate the suggestion. We have now moved these analysis to part B of main Figure 2 in the revised manuscript – now Figure 2B. We have also provided additional details in the Methods section on the approaches used to assess background enrichment.
Page 19:
“Background enrichment calculation
The genome was divided into 50 bp sliding windows, and each window was annotated based on overlapping genomic features, including CIR147, 177 bp repeats, 70 bp repeats, and telomeric (TTAGGG)n repeats. Windows that did not overlap with any of these annotated repeat elements were defined as "background" regions and used to establish the baseline ChIP-seq signal. Enrichment for each window was calculated using bamCompare, as log₂(IP/Input). To adjust for background signal amongst all samples, enrichment values for each sample were further normalized against the corresponding No-YFP ChIP-seq dataset.”
Note: While revising the manuscript we also noticed that the script had a nomalization error. We have therefore included a corrected version of these analyses as Figure 2B (old Fig. S1)
(3) Generally, I would plot enrichment on a log2 axis. This concerns several figures with ChIP-seq data.
Our ChIP-seq enrichment is calculated by bamCompare. The resulting enrichment values are indeed log2 (IP/Input). We have made this clear in the updated figures/legends.
(4) Fig. 4C - The violin plots are very hard to interpret, as the plots are very narrow compared to the line thickness, making it hard to judge the actual volume. For example, in Centromere 5, YFP-KKT2 is less enriched than 147R-TALE over most of the centromere with some peaks of much higher enrichment (as visible in panel B), however, in panel C, it is very hard to see this same information. I'm sure there is some way to present this better, either using a different type of plot or by improving the spacing of the existing plot.
We thank the reviewer for this suggestion; we have elected to provide a Split-Violin plot instead. This improves the presentation of the data for each centromere. The original violin plot in Figure 4C has been replaced with this Split-Violin plot (still Figure 4C).
(5) Fig. 6 - The panels are missing an x-axis label (although it is obvious from the plot what is displayed).
Maybe the "WT NO-YFP vs" part that is repeated in all the plot titles could be removed from the title and only be part of the x-axis label?
In fact, to save space the X axis was labelled inside each volcano plot but we neglected to indicate that values are a log2 scale indicating enrichment. This has been rectified – see Figure 6, and Fig. S7, S8 and S9.
(6) Fig. 7 - I would like to have a quantification for the examples shown here. In fact, such a quantification already exists in Suppl. Figure 1. I think the relevant plots of that quantification (YFPKKT2 over 177bp-repeats and centromere-repeats) with some control could be included in Fig. 7 as panel C. This opportunity could be used to show enrichment separated out for intermediate-sized, mini-, and megabase-chromosomes. (relates to minor comment 2 & 8)
The CIR147 sequence is found exclusively on megabase-sized chromosomes, while the 177 bp repeats are located on intermediate- and mini-sized chromosomes. Due to limitations in the current genome assembly, it is not possible to reliably classify all chromosomes into intermediate- or mini- sized categories based on their length. Therefore, original Supplementary Fig. S1 presented the YFP-KKT2 enrichment over CIR147 and 177 bp repeats as a representative comparison between megabase chromosomes and the remaining chromosomes (corrected version now presented as main Figure 2B). Additionally, to allow direct comparison of YFP-KKT2 enrichment on CIR147 and 177 bp repeats we have included a new plot in Figure 7C which shows the relative enrichment of YFP-KKT2 on these two repeat types.
We have added the following text , page 12:
“Taking into account the relative to the number of CIR147 and 177 bp repeats in the current T.brucei genome (Cosentino et al., 2021; Rabuffo et al., 2024), comparative analyses demonstrated that YFP-KKT2 is enriched on both CIR147 and 177 bp repeats (Figure 7C).”
(7) Suppl. Fig. 8 A - I believe there is a mistake here: KKT5 occurs twice in the plot, the one in the overlap region should be KKT1-4 instead, correct?
Thanks for spotting this. It has been corrected
(8) The way that the authors mapped ChIP-seq data is potentially problematic when analyzing the same repeat type in different regions of the genome. The authors assigned reads that had multiple equally good mapping positions to one of these mapping positions, randomly.
This is perfectly fine when analysing repeats by their type, independent of their position on the genome, which is what the authors did for the main conclusions of the work.
However, several figures show the same type of repeat at different positions in the genome. Here, the authors risk that enrichment in one region of the genome 'spills' over to all other regions with the same sequence. Particularly, where they show YFP-KKT2 enrichment over intermediate- and mini-chromosomes (Fig. 7) due to the spillover, one cannot be sure to have found KKT2 in both regions.
Instead, the authors could analyze only uniquely mapping reads / read-pairs where at least one mate is uniquely mapping. I realize that with this strict filtering, data will be much more sparse. Hence, I would suggest keeping the original plots and adding one more quantification where the enrichment over the whole region (e.g., all 177bp repeats on intermediate-/mini-chromosomes) is plotted using the unique reads (this could even be supplementary). This also applies to Fig. 4 B & C.
We thank the reviewer for their thoughtful comments. Repetitive sequences are indeed challenging to analyze accurately, particularly in the context of short read ChIP-seq data. In our study, we aimed to address YFP-KKT2 enrichment not only over CIR147 repeats but also on 177 bp repeats, using both ChIP-seq and proteomics using synthetic TALE proteins targeted to the different repeat types. We appreciate the referees suggestion to consider uniquely mapped reads, however, in the updated genome assembly, the 177 bp repeats are frequently immediately followed by long stretches of 70 bp repeats which can span several kilobases. The size and repetitive nature of these regions exceeds the resolution limits of ChIP-seq. It is therefore difficult to precisely quantify enrichment across all chromosomes.
Additionally, the repeat sequences are highly similar, and relying solely on uniquely mapped reads would result in the exclusion of most reads originating from these regions, significantly underestimating the relative signals. To address this, we used Bowtie2 with settings that allow multi-mapping, assigning reads randomly among equivalent mapping positions, but ensuring each read is counted only once. This approach is designed to evenly distribute signal across all repetitive regions and preserve a meaningful average.
Single molecule methods such as DiMeLo (Altemose et al. 2022; PMID: 35396487) will need to be developed for T. brucei to allow more accurate and chromosome specific mapping of kinetochore or telomere protein occupancy at repeat-unique sequence boundaries on individual chromosomes.
Reviewer #2 (Significance):
This work is of high significance for chromosome/centromere biology, parasitology, and the study of antigenic variation. For chromosome/centromere biology, the conceptual advancement of different types of kinetochores for different chromosomes is a novelty, as far as I know. It would certainly be interesting to apply this study as a technical blueprint for other organisms with minichromosomes or chromosomes without known centromeric repeats. I can imagine a broad range of labs studying other organisms with comparable chromosomes to take note of and build on this study. For parasitology and the study of antigenic variation, it is crucial to know how intermediate- and mini-chromosomes are stable through cell division, as these chromosomes harbor a large portion of the antigenic repertoire. Moreover, this study also found a novel link between the homologous repair pathway and variant surface glycoproteins, via the 70bp repeats. How and at which stages during the process, 70bp repeats are involved in antigenic variation is an unresolved, and very actively studied, question in the field. Of course, apart from the basic biological research audience, insights into antigenic variation always have the potential for clinical implications, as T. brucei causes sleeping sickness in humans and nagana in cattle. Due to antigenic variation, T. brucei infections can be chronic.
Thank you for supporting the novelty and broad interest of our manuscript
My field of expertise / Point of view:
I'm a computer scientist by training and am now a postdoctoral bioinformatician in a molecular parasitology laboratory. The laboratory is working on antigenic variation in T. brucei. The focus of my work is on analyzing sequencing data (such as ChIP-seq data) and algorithmically improving bioinformatic tools.
Loops
The use of loops and conditionals in social media bots highlights a major ethical challenge regarding scale and context. While a human can manually block a few trolls, a bot using a loop can automatically block hundreds of users in seconds based on a simple conditional like an iphone or android tag. This demonstrates how automation doesn't just make tasks easier but changes the power dynamics of online interaction by allowing a single user to exert massive influence without manual effort.
info@utrechtinc.nl
can we add an email tag here and phone tag for the number? - html
Reflection questions
It is striking how specific design features like the location tag ('Hillingdon, London') transformed a digital post into a real-world manhunt. This case proves that platform features are never neutral; by automatically attaching metadata, Twitter provided the tools necessary for users to track Sacco’s flight in real-time, blurring the line between online discourse and physical safety.
Author response:
The following is the authors’ response to the original reviews.
eLife assessment
This useful study reports that the exogenous expression of the microRNA miR-195 can partially compensate in early B cell development for the loss of EBF1, one of the key transcription factors in B cells. While this finding will be of interest to those studying lymphocyte development, the evidence, particularly with regard to the molecular mechanisms that underpin the effect of miR-195, is currently incomplete.
Public Reviews:
Reviewer #1 (Public review):
Summary:
Here, the authors are proposing a role for miR-196, a microRNA that has been shown to bind and enhance the degradation of mRNA targets in the regulation of cell processes, and has a novel role in allowing the emergence of CD19+ cells in cells in which Ebf1, a critical B-cell transcription factor, has been genetically removed.
Strengths:
That over-expression of mR-195 can allow the emergence of CD19+ cells missing Ebf1 is somewhat novel.
Their data does perhaps support to a degree the emergence of a transcriptional network that may bypass the absence of Ebf1, including the FOXO1 transcription factor, but this data is not strong or definitive.
Weaknesses:
It is unclear whether this observation is in fact physiological. When the authors analyse a knockout model of miR-195, there is not much of a change in the B-cell phenotype. Their findings may therefore be an artefact of an overexpression system.
The authors have provided insufficient data to allow a thorough appraisal of the stepwise molecular changes that could account for their observed phenotype.
Reviewer #2 (Public review):
Summary:
The authors investigate miRNA miR-195 in the context of B-cell development. They demonstrate that ectopic expression of miR-195 in hematopoietic progenitor cells can, to a considerable extent, override the consequences of deletion of Ebf1, a central Blineage defining transcription factor, in vitro and upon short-term transplantation into immunodeficient mice in vivo. In addition, the authors demonstrate that the reverse experiment, genetic deletion of miR-195, has virtually no effect on B-cell development. Mechanistically, the authors identify Foxo1 phosphorylation as one pathway partially contributing to the rescue effect of miR-195. An additional analysis of epigenetics by ATACseq adds potential additional factors that might also contribute to the effect of ectopic expression of miR-195.
Strengths:
The authors employ a robust assay system, Ebf1-KO HPC, to test for B-lineage promoting factors. The manuscript overall takes on an interesting perspective rarely employed for the analysis of miRNA by overexpressing the miRNA of interest. Ideally, this approach may reveal, if not the physiological function of this miRNA, the role of distinct pathways in developmental processes.
Weaknesses:
At the same time, this approach constitutes a major weakness: It does not reveal information on the physiological role of miR-195. In fact, the authors themselves demonstrate in their KO approach, that miR-195 has virtually no role in B-cell development, as has been demonstrated already in 2020 by Hutter and colleagues. While the authors cite this paper, unfortunately, they do so in a different context, hence omitting that their findings are not original.
Conceptually, the authors stress that a predominant function of miRNA (in contrast to transcription factors, as the authors suggest) lies in fine-tuning. However, there appears to be a misconception. Misregulation of fine-tuning of gene expression may result in substantial biological effects, especially in developmental processes. The authors want to highlight that miR-195 is somewhat of an exception in that regard, but this is clearly not the case. In addition to miR-150, as referenced by the authors, also the miR-17-92 or miR-221/222 families play a significant role in B-cell development, their absence resulting in stage-specific developmental blocks, and other miRNAs, such as miR-155, miR-142, miR-181, and miR-223 are critical regulators of leukocyte development and function. Thus, while in many instances a single miRNA moderately affects gene expression at the level of an individual target, quite frequently targets converge in common pathways, hence controlling critical biological processes.
The paper has some methodological weaknesses as well: For the most part, it lacks thorough statistical analysis, and only representative FACS plots are provided. Many bar graphs are based on heavy normalization making the T-tests employed inapplicable. No details are provided regarding the statistical analysis of microarrays. Generation of the miR-195-KO mice is insufficiently described and no validation of deletion is provided. Important controls are missing as well, the most important one being a direct rescue of Ebf1-KO cells by re-expression of Ebf1. This control is critical to quantify the extent of override of Ebf1-deficiency elicited by miR-195 and should essentially be included in all experiments. A quantitative comparison is essential to support the authors' main conclusion highlighted in the title of the manuscript. As the manuscript currently stands, only negative controls are provided, which, given the profound role of Ebf1, are insufficient, because many experiments, such as assessment of V(D)J recombination, IgM surface expression, or class-switch recombination, are completely negative in controls. In addition, the authors should also perform long-term reconstitution experiments. While it is somewhat surprising that the authors obtained splenic IgM+ B cells after just 10 days, these experiments would be certainly much more informative after longer periods of time. Using "classical" mixed bone marrow chimeras using a combination of B-cell defective (such as mb1/mb1) bone marrow and reconstituted Ebf1-KO progenitors would permit much more refined analyses.
With regard to mechanism, the authors show that the Foxo1 phosphorylation pathway accounts for the rescue of CD19 expression, but not for other factors, as mentioned in the discussion. The authors then resort to epigenetics analysis, but their rationale remains somewhat vague. It remains unclear how miR-195 is linked to epigenetic changes.
Reviewer #3 (Public review):
Summary:
In this study, Miyatake et al. present the interesting finding that ectopic expression of miR-195 in EBF1-deficient hematopoietic progenitor cells can partially rescue their developmental block and allow B cells to progress to a B220+ CD19+ cells stage. Notably, this is accompanied by an upregulation of B-cell-specific genes and, correspondingly, a downregulation of T, myeloid, and NK lineage-related genes, suggesting that miR-195 expression is at least in part equivalent to EBF1 activity in orchestrating the complex gene regulatory network underlying B cell development. Strengthening this point, ATAC sequencing of miR-195-expressing EBF1-deficient B220+CD19+ cells and a comparison of these data to public datasets of EBF1-deficient and -proficient cells suggest that miR-195 indirectly regulates gene expression and chromatin accessibility of some, but not all regions regulated by EBF1.
Mechanistically, the authors identify a subset of potential target genes of miR-195 involved in MAPK and PI3K signaling. Dampening of these pathways has previously been demonstrated to activate FOXO1, a key transcription factor for early B cells downstream of EBF1. Accordingly, the authors hypothesize that miR-195 exerts its function through FOXO1. Supporting this claim, also exogenous FOXO1 expression is able to promote the development of EBF1-deficient cells to the B220+CD19+ stage and thus recapitulates the miR-195 phenotype.
Strengths:
The strength of the presented study is the detailed assessment of the altered chromatin accessibility in response to ectopic miR-195 expression. This provides insight into how miR-195 impacts the gene regulatory network that governs B-cell development and allows the formation of mechanistic hypotheses.
Weaknesses:
The key weakness of this study is that its findings are based on the artificial and ectopic expression of a miRNA out of its normal context, which in my opinion strongly limits the biological relevance of the presented work.
While the authors performed qPCRs for miR-195 on different B cell populations and show that its relative expression peaks in early B cells, it remains unclear whether the absolute miR-195 expression is sufficiently high to have any meaningful biological activity. In fact, other miRNA expression data from immune cells (e.g. DOI
10.1182/blood-2010-10-316034 and DOI 10.1016/j.immuni.2010.05.009) suggest that miR-195 is only weakly, if at all, expressed in the hematopoietic system.
The authors support their finding by a CRISPR-derived miR-195 knockout mouse model which displays mild, but significant differences in the hematopoietic stem cell compartment and in B cell development. However, they fail to acknowledge and discuss a lymphocyte-specific miR-195 knockout mouse that does not show any B cell defects in the bone marrow or spleen and thus contradicts the authors' findings (DOI
10.1111/febs.15493). Of note, B-1 B cells in particular have been shown to be elevated upon loss of miR-15-16-1 and/or miR-15b-16-2, which contradicts the data presented here for loss of the family member miR-195.
A second weakness is that some claims by the authors appear overstated or at least not fully backed up by the presented data. In particular, the findings that miR-195expressing cells can undergo VDJ recombination, express the pre-BCR/BCR and class switch needs to be strengthened. It would be beneficial to include additional controls to these experiments, e.g. a RAG-deficient mouse as a reference/negative control for the ddPCR and the surface IgM staining, and cells deficient in class switching for the IgG1 flow cytometric staining.
Moreover, the manuscript would be strengthened by a more thorough investigation of the hypothesis that miR-195 promotes the stabilization and activity of FOXO1, e.g. by comparing the authors' ATACseq data to the FOXO1 signature.
Recommendations for the authors:
Reviewer #1 (Recommendations for the authors):
Miyatake et al., present a manuscript that explores the role of miR-195 in B cell development.
Their data suggests a role for this microRNA:
Using an Ebf1 fetal liver knockout of B-cell differentiation that a small population of CD19 expressing with some evidence of V(D)J recombination capable of class switch can be derived by transduction of miR-195.
In the emergent CD19+ Ebf1-/- cells, the authors provide some evidence that Mapk and Akt3 may be miR-195 targets that are downregulated allowing FOXO1 transcription factor pathway may be involved in the emergent CD19+ cells arising from miR-195 transduction.
Perhaps less compelling data is provided with regards to a role for miR-195 in normal Bcell development through analysis of a miR-195 knockout model.
While there are some interesting preliminary data presented for a role for miR-195 in the context of Ebf1-/- cells, there are some questions I think the authors could consider.
Comments:
(1-1) It is difficult to ascertain the potential role of miR-195 transduction in allowing the emergence of CD19+ cells from the data provided. miR-195 has been generally shown to destabilize mRNA transcripts by 3' UTR binding that targets mRNA transcripts for degradation. The effect of transduction of miR-195 would therefore be expected to be related to the degradation of factors opposing aspects of B-lineage specification or maintenance. I would be particularly interested in transcriptional or epigenetic regulators that may be modified in this way, at an mRNA as well as protein level.
We appreciate the reviewerʼs thoughtful comments and agree that miRNAs often exert their effects through the degradation or translational repression of mRNAs encoding regulatory factors. In our study, we attempted to address this point by combining predictive analysis (using TargetScan and starBase) with luciferase reporter assays and qPCR to validate several potential targets of miR-195, including Mapk3 and Akt3. We acknowledge that this is not a comprehensive mechanistic analysis. We agree that a broader and systematic identification of direct targets of miR-195, particularly those involved in transcriptional and epigenetic regulation, would further clarify the mechanisms involved. However, due to limitations in resources and time, we are currently unable to perform global proteomic or ChIP-based validations. Nevertheless, our ATAC-seq and microarray data indicate that miR-195 overexpression leads to increased accessibility and expression of several key B-lineage transcription factors (Pax5, Runx1, Irf8), suggesting that miR-195 indirectly activates transcriptional programs relevant to B cell commitment. We have now clarified this limitation in the revised Discussion section (lines 505‒524), and we emphasize that our current findings represent the potential of miR-195 rather than its physiological role. We hope that this clarification addresses the concern.
(1-2) While I acknowledge the authors have undertaken TargetScan and starBase analysis to try and predict miR-195 interactions, they do not provide a comprehensive list of putative targets that can be referenced against their cDNA data. Though they postulate Mapk3 and Akt3 as putative miR-195 targets and assay these in luciferase reporter systems (Figure 4), these were not clearly differentially regulated in the microarray data they provided (Figure 1E) as being downregulated on miR-195 transduction in Ebf1-/- cells.
We thank the reviewer for pointing out the need for a more comprehensive list of predicted miR-195 targets. In response, we have now included a supplementary table 4 (human) and 5 (mouse) listing all putative miR-195 targets predicted by TargetScan and starBase. As noted, Mapk3 expression was indeed downregulated upon miR-195 transduction, consistent with our luciferase reporter and qPCR results. For Akt3, we observed variability in the microarray data depending on the probe used, resulting in inconsistent expression levels. We acknowledge this and have added a clarification in the revised manuscript (lines 335‒339), noting that the regulation of Akt3 by miR-195 is potentially probe-dependent and may require further validation. We hope this clarification resolves the concern.
(1-3) The authors should provide a more comprehensive analysis of transcriptional changes induced by miR-195 Ebf1-/- specifically in the preproB cell stage of development in Ebf1-/- and miR-195 Ebf1-/- cells. The differentially expressed gene list should be provided as a supplemental file. The gene expression data should be provided for the different B-cell differentiation stages, eg. Ebf1-/- preproB cells, and Ebf1-/- miR-195 preproB cells, CD19+ cells and more differentiated subsets induced by miR-195 transduction.
We appreciate the reviewerʼs suggestion to provide a more comprehensive transcriptomic analysis at different B-cell differentiation stages. Unfortunately, due to the limited availability of cells and technical constraints, we were unable to perform RNA-seq on miR-195 transduced Ebf1<sup>−/−</sup> pre-pro-B or CD19+ cells. However, to address this point, we referenced publicly available RNA-seq data (GEO accession: GSE92434), which includes transcriptomic profiles of Ebf1<sup>−/−</sup> pro-B cells and wild-type controls. By comparing our microarray data from miR-195 transduced Ebf1<sup>−/−</sup> cells with this dataset, we found partial restoration of expression for several key B-lineage genes, such as Pax5, Runx1, and Irf8, which are normally downregulated in the absence of EBF1. This comparison supports the notion that miR-195 partially reactivates the transcriptional network essential for B cell development. We have added this interpretation to the Discussion section (lines 528‒533).
(1-4) More replicates (at least 3 of each genotype) are required for their Western Blots for FOXO1 and pFOXO1 (Fig 4C, D). Western blots should also be provided for other known B-lineage transcriptional regulators such as PAX5 and ERG.
We thank the reviewer for these valuable suggestions. In response, we have now quantified and added the relative band intensities of FOXO1 and pFOXO1 from three independent experiments in the revised Figure 4C, and we include statistical analysis to support the reproducibility of these results. Additionally, as requested, we performed western blotting for PAX5 and ERG using the same samples. The results showed no significant change in these protein levels between miR-195-transduced and control Ebf1<sup>−/−</sup> cells, consistent with the modest upregulation observed in our microarray data. We have included the PAX5 and ERG western blot images in Supplementary Figure S3 and have revised the text in the Results section (lines 351‒35)
(1-5) The authors have not shown a transcriptional binding by ChIPseq or other methods such as cut and tag/ cut and run for FOXO1 binding to B-lineage genes in their Ebf1-/- miR-195 CD19+ cells to be able to definitively show this TF is critical for the emergence of the C19+ cell phenotype by demonstrating direct binding to "upregulated" genes cis-regulatory regions in the Ebf1-/- miR-195 CD19+ cells
We appreciate the reviewerʼs suggestion regarding the use of ChIP-seq or related methods to demonstrate direct FOXO1 binding to cis-regulatory regions of B-lineage genes in Ebf1<sup>−/−</sup> miR-195 CD19⁺ cells. We agree that such data would provide definitive evidence of FOXO1's direct involvement in promoting the B cell-like transcriptional program. However, due to current technical limitations, including the scarcity of CD19⁺ cells derived from Ebf1<sup>−/−</sup> miR-195 transduction and the requirement for large cell numbers in ChIP-seq or CUT&RUN protocols, we were unable to perform these assays in this study. Nevertheless, our current data provide multiple lines of indirect evidence supporting the involvement of FOXO1:
miR-195 transduction leads to reduced phosphorylation and increased accumulation of FOXO1 protein (Fig. 4C).
Overexpression of FOXO1 in Ebf1<sup>−/−</sup> HPCs partially recapitulates the miR-195 phenotype (Fig. 4D).
ATAC-seq data show increased chromatin accessibility at known FOXO1 target gene loci (e.g., Pax5, Runx1, Irf8) in miR-195-induced CD19⁺ cells, many of which overlap with FOXO1 motifs(Fig.5)
These observations collectively suggest that FOXO1 activity is functionally important for the emergence of CD19⁺ cells, even though direct binding has not been confirmed. We have added this limitation to the Discussion (lines 531‒537), and we note that future studies using FOXO1 CUT&RUN in this system would be valuable to further define the underlying mechanism.
(1-6) The authors have not shown significant upregulation of expression of other critical B-cell regulatory transcription factors in their Ebf1-/- miR-195 CD19+ cells that could account for the emergence of these cells such as Pax5 or Erg. The legend in Figure 1E suggests for example the change in expression of Pax5 is modest if anything at best as no LogFC or western blot data is presented.
We thank the reviewer for raising this point. In our microarray analysis (Figure 1D, original Figure 1E), we observed that both Pax5 and Erg mRNA levels were upregulated in Ebf1<sup>−/−</sup> cells upon miR-195 transduction. Specifically, Pax5 showed an increase of approximately log₂FC 1.2, and Erg was also consistently elevated across biological replicates. These changes, although modest, were statistically significant and consistent with the upregulation of other B-lineage-associated transcription factors, such as Runx1 and Irf8. We agree that the magnitude of Pax5 upregulation is not as high as typically seen during full B cell commitment, and therefore may not have been immediately apparent in Figure 1D (original Figure 1E). To clarify this point, we have now revised the text in the Results section (lines 170‒174) to highlight the observed changes in Pax5 and Erg expression. We believe that the upregulation of these transcription factors, together with increased FOXO1 activity and changes in chromatin accessibility (Figure 5), contributes to the partial reactivation of the B cell gene regulatory network in the absence of EBF1.
(1-7) Which V(D)J transcripts have been produced? A more detailed analysis other than ddPCR is required to help understand the emergence of this population that can presumably proceed through the preBCR and BCR checkpoints.
We appreciate the reviewerʼs interest in understanding the nature of the V(D)J rearrangements in Ebf1<sup>−/−</sup> miR-195 CD19⁺ cells. As noted, our current data rely on droplet digital PCR (ddPCR), which was used to detect rearranged VH-JH segments in the bone marrow of engrafted mice. While this approach does not allow for detailed mapping of specific V, D, or J gene usage, it provides a sensitive and quantitative measure of V(D)J recombination activity. The detection of rearranged VH-JH fragments in miR-195-transduced Ebf1<sup>−/−</sup> cells suggests that at least partial recombination of the immunoglobulin heavy chain locus is occurring̶an essential checkpoint for progression past the pro-B cell stage. Given the lack of such rearrangements in control-transduced Ebf1<sup>−/−</sup> cells, we interpret this as evidence that miR-195 enables cells to initiate the recombination process. We acknowledge the limitations of ddPCR and agree that a more detailed analysis using VDJ-seq or singlecell RNA-seq would be valuable in determining the diversity and completeness of the V(D)J transcripts produced. This is a direction we intend to pursue in future work. We have added this limitation to the Discussion section (lines 538‒543).
(1-8) The authors reveal that the Foxo1 transduced Ebf1-/- cells (Fig. 4D) do not persist in vitro or be detected via transplant assay (line 256) and therefore does not represent a truly "rescued" B cell, suggesting that CD19+ cells Ebf1-/- miR-195 transduced cells have more B-cell potential. Further characterisation is therefore warranted of this cell population. For instance, can these cells be induced to undergo myeloid differentiation in myeloid cytokine conditions? What other B-lineage transcriptional regulators are expressed in this cell population that could account for VDJ recombination and expression of a B-lineage transcriptional program (see comments 1, 3, and 5) that allow transition through preBCR and BCR checkpoints as well as undergo class switching?
We thank the reviewer for this insightful comment. We agree that the persistence and lineage potential of the CD19⁺ cells emerging from Ebf1<sup>−/−</sup> miR-195-transduced progenitors deserve further characterization. Although we were unable to perform additional lineage re-direction assays, our current data provide several lines of evidence suggesting that these cells are stably committed toward the B-lineage:
Gene expression profiling revealed upregulation of multiple B cell transcriptional regulators, including Pax5, Runx1, and Irf8.
ATAC-seq analysis showed increased chromatin accessibility at B cell‒specific loci and enrichment of motifs bound by key B-lineage factors such as FOXO1 and E2A.
The cells express surface IgM and undergo class switch recombination to IgG1 upon stimulation, indicating successful transition through the pre-BCR and BCR checkpoints and acquisition of mature B cell functions.
Importantly, no upregulation of myeloid- or T-lineage genes was detected in the microarray analysis, arguing against multipotency at this stage.We acknowledge that functional tests for lineage plasticity under altered cytokine conditions would provide important insights and plan to address this question in future studies. This limitation has now been noted in the revised Discussion (lines 544‒550).
(1-9) In the original Ebf1-/- miR-195 CD19+ experiments, a wild-type control should be provided for each experiment.
We appreciate the reviewerʼs suggestion to include wild-type controls in all experiments. While we did not include wild-type samples side-by-side in every assay, we carefully designed our experiments to include biologically appropriate and informative comparisons. For example, in the bone marrow transplantation experiments (Figure 2), Ebf1<sup>−/−</sup> cells transduced with empty vector served as negative controls, clearly lacking CD19 expression, V(D)J recombination, IgM surface expression, and class switch capability. This allowed us to specifically assess the gain-of-function effects of miR-195 in the EBF1-deficient background. In several analyses̶such as the ATAC-seq and microarray comparisons̶we did incorporate or refer to existing wild-type datasets (e.g., GSE92434), providing context for the extent of recovery toward a WT-like profile. We agree, however, that including parallel WT controls across all experimental platforms would enhance interpretability.
(1-10) For ATACseq data, a comparison between Ebf1-/- preproB cells and Ebf1-/- miR-195 CD19+ cells should be undertaken.
We thank the reviewer for this important point. As suggested, we have performed a direct comparison of chromatin accessibility between Ebf1<sub>−/−</sub> pre-pro-B‒like cells (CD19<sub>-</sub>, control transduction) and Ebf1<sub>−/−</sub> miR-195‒transduced CD19⁺ cells. This comparison is shown in green in Figure 5B and represents the ATAC-seq peaks differentially accessible between these two populations.
(1-11) I cannot agree with the authors with some of their statements such as Line 242 - "therefore miR-195 considered to have similar function with EBF1 to some extent" - how can this be the case when miR-195 is a miRNA and EBF1 is a transcription factor with pioneering transcriptional activity? Surely the effects of miR-195 must be secondary.
We thank the reviewer for pointing out the inappropriateness of comparing miR-195 to EBF1 in terms of functional similarity. We agree that miR-195, as a microRNA, operates through post-transcriptional regulation and does not possess the pioneering transcriptional activity characteristic of EBF1. To avoid confusion or overstatement, we have removed the sentence in line 242 ("therefore miR-195 is considered to have similar function with EBF1 to some extent").
(1-12) It is unclear whether this observation is in fact physiological. When the authors analyse a knockout model of miR-195, there is not much of a change in the B-cell phenotype. Their findings may therefore be an artefact of an overexpression system. The authors should comment on this observation in their discussion.
We thank the reviewer for this important observation. We agree that the mild phenotype observed in our miR-195 knockout mice suggests that miR-195 is not essential for B cell development under steady-state physiological conditions. Accordingly, we do not claim a physiological requirement for miR-195. Rather, our study demonstrates that miR-195 possesses the potential to activate a B-lineage program in the absence of EBF1 when ectopically expressed. This functional potential̶rather than its endogenous necessity̶ is the main focus of our work. We have now clarified this distinction in the revised Discussion section (lines 551‒560), and we emphasize that our findings highlight an alternative regulatory pathway that can be artificially engaged under specific conditions.
(1-13) I recommend the authors check spelling and grammar throughout their manuscript.
We thank the reviewer for the suggestion. In response, we have carefully reviewed the manuscript for spelling, grammar, and clarity. Minor corrections have been made throughout the text to improve readability and ensure consistency. We hope that the revised version addresses any language-related concerns. In addition, the manuscript has been reviewed by professional editing service to improve the language quality.
(1-14) In general, I recommend more comprehensive primary data be presented in the manuscript or supplementary files to add value to their submission.
We thank the reviewer for this helpful suggestion. In response, we have revised the manuscript and supplementary materials to include additional primary data wherever possible. The bar graphs have been updated to include individual data points to show variability and replicate information. Uncropped western blot images are now provided in Supplementary Figure S2. We hope these additions provide greater transparency and value to the manuscript.
Reviewer #2 (Recommendations for the authors):
I have a number of suggestions with regard to inclusion of details and controls:
(2-1) The authors need to provide more details on in vitro differentiation, especially culture times.
Thank you for your comment. The culture conditions for in vitro differentiation of Ebf1<sup>−/−</sup> hematopoietic progenitor cells are described in the Methods section (lines 648‒ 649) under “Culture of lineage-negative (Lin‒) cells from the fetal liver.” As stated, cells were cultured more than 7 days under the specified conditions.
(2-2) In Figure 1E, the authors need to provide information on statistics (FDR or similar).
I thank the reviewer for the suggestion. In Figure 1D (Original Figure 1E) (the microarray analysis), only two biological replicates were available for each condition (n = 2 per group). Due to this limited sample size, we did not perform statistical testing, as the power would be insufficient to produce reliable p-values or adjusted FDRs. Instead, we focused on genes with consistent and biologically meaningful changes in expression, and presented representative examples based on fold change values.
(2-3) For in vivo experiments (Figure 2) the authors should comment on their use of two different recipient mouse strains despite very low n numbers. As described above, classical mixed BM chimeras would be much more informative. In these experiments, the authors should also show the formation of other lymphoid lineages. This would answer the question of whether miR-195 redirects cells to the B lineage. Most importantly, absolute numbers need to be provided, especially in conjunction with Ebf1 rescue as described above.
We thank the reviewer for the thoughtful and detailed suggestions regarding our in vivo experiments. Regarding the use of different recipient mouse strains, our initial intention was to perform the transplantations in BRG mice; however, due to facility restrictions and animal husbandry considerations, we had to switch to NOG mice. All in vivo experiments were performed with n = 3 per group, in accordance with ethical guidelines and efforts to minimize animal use while still ensuring reproducibility. With respect to the suggestion of mixed bone marrow chimeras, we agree that this approach can provide valuable information on lineage competitiveness. However, in our system, miR-195 confers only a very limited B cell developmental potential in Ebf1<sup>−/−</sup> progenitors. In such a setting, the inclusion of wild-type competitor cells would overwhelmingly dominate the B cell compartment, likely masking any measurable effect of miR-195. Therefore, we opted to assess the gain-of-function potential of miR-195 in a noncompetitive setting. Regarding the assessment of other lymphoid lineages, we focused our analysis on the emergence of B-lineage cells, as the frequency of CD19⁺ cells induced by miR-195 is quite low. Given this low efficiency, we consider it unlikely that miR-195 significantly alters the development of non-B lineages, and thus did not observe substantial lineage diversion effects. Our aim was not to demonstrate lineage redirection, but rather to show that miR-195 can confer partial B cell potential in the absence of EBF1.
Finally, we acknowledge the importance of presenting absolute cell numbers. However, the cell number collected from the mice were so few that we did not get the reliable results, we described it in the manuscript. (lines 498-501)
(2-4) The statistics in Figure 3 are inadequate. No S.D. is provided for WT. How then was normalization performed? Student's T-test cannot be applied to ratios.
We thank the reviewer for highlighting the need for more appropriate statistical analysis. Due to considerable inter-batch variability in absolute measurements, we normalized the KO values to their paired WT counterparts from the same experimental batch. Specifically, for each replicate, we calculated the KO/WT ratio to control for batch-specific variation. We then applied a one-sample t-test (against a null hypothesis of ratio = 1) to determine statistical significance. We have now revised the figure to show individual ratio values for each replicate and updated the legend and Methods to clearly explain the statistical approach. We hope this addresses the concern and improves the clarity and rigor of the analysis.
(2-5) In Figure 4A, the authors should comment on the strong repression of the Akt3UTR.
We appreciate the reviewerʼs observation regarding the strong repression observed with the Akt3 3'UTR construct. Indeed, we also noted that luciferase activity was markedly reduced in the presence of the Akt3 3'UTR, even in cells transduced with a control vector. We hypothesize that the Akt3 3'UTR contains strong post-transcriptional regulatory elements̶such as AU-rich elements or binding sites for endogenous miRNAs or RNA-binding proteins̶which may suppress mRNA stability or translation independent of miR-195. Alternatively, the secondary structure or length of the UTR may inherently reduce luciferase expression. We have added this limitation to the Discussion section (lines 561‒569).
(2-6) The Western blot in Figure 4C is of insufficient quality. The authors need to provide unspliced versions of the bands including markers.
We thank the reviewer for this important comment. In response, we have included the unprocessed, full-length Western blot images corresponding to Figure 4C as Fig. S2. This provides a transparent view of the original data and addresses the concern about image cropping.
(2-7) The ATACseq experiment in Figure 5 is difficult to comprehend. A simpler design including Ebf1 rescue controls would clearly improve this part.
We thank the reviewer for this valuable feedback. We agree that the original presentation of the ATAC-seq data may have been difficult to interpret. To address this, we have included a clear interpretation of the overlapping regions in the revised figure legend (lines 1018-1022). We hope this improves the clarity of the data and facilitates understanding of the chromatin changes mediated by EBF1 and miR-195.
(2-8) The miR-195 KO mouse lacks validation (RT-PCR, genomic PCR) as well as a clear description of the deleted region and whether miR-497 is affected. In addition, the genetic background and number of backcrosses for the removal of potential off-target effects need to be mentioned.
We thank the reviewer for this important comment. The miR-195 knockout mouse was generated via CRISPR/Cas9, and Sanger sequencing confirmed a 628 bp deletion on chromosome 11 (GRCm38/mm10 chr11:70,234,425‒70,235,103). This deletion includes the entire miR-497 locus and part of the miR-195 precursor sequence. Although we do not show PCR gel images, the deletion was validated by sequencing, and the results are now clearly described in the revised Methods section (lines 607619). All transgenic mice in this study were backcrossed to the C57BL/6 background for at least eight generations.
(2-9) The manuscript requires extensive editing for language.
We appreciate the reviewerʼs comment. The manuscript has now been revised and professionally edited for language by a native English-speaking editor. We believe clarity and readability have been significantly improved.
Reviewer #3 (Recommendations for the authors):
(3-1) What is the expression level of miR-195 after viral overexpression? In Figure 4B, the authors show a 2.5-fold increase, but this appears very low for the experimental system (expression through the MDH1 retroviral construct) and the observed repressive effects (e.g. Figure 4A and B).
We thank the reviewer for this insightful comment. We agree that the apparent ~2.5fold increase in miR-195 levels (Figure 4B) may seem modest in the context of retroviral overexpression and the associated functional effects. However, due to the high sequence similarity within the miR-15/16/195/497 family, it is technically challenging to measure mature miR-195 levels with complete specificity. The baseline signal observed in control samples likely reflects cross-reactivity with endogenous miRNAs such as miR-497 or miR-16, which share similar seed sequences. Therefore, the reported fold-change may underestimate the true level of ectopic miR-195 expression. Despite this, we observed robust repression of validated targets (e.g., Mapk3, Akt3) in both qPCR and luciferase assays, indicating that functionally effective levels of miR-195 were achieved. We have now clarified this limitation and interpretation in the revised Results sections (lines 332‒335).
(3-2) In alignment with the transparency of the data, I would encourage the authors to display the individual data points for all bar graphs.
We thank the reviewer for this helpful suggestion. In the revised manuscript, we have updated bar graphs to include individual data points to increase transparency and allow better visualization of data variability. In the ddPCR experiments, we provided the raw data in Fig. S1 for full transparency. In Fig. 1A, we have confirmed miR-195 expression profiles using the deposit data which the reviewer suggested, but miR-195 expression was very lower than we expected. We also performed scRNA-seq using hematopoietic lineage cells in 8-week-old C57BL/6 mice, but we could not get the reproducibility of miR-195 expression profiles. Therefore, we determined that this is an artifact caused by the miR-195 probe used for qPCR, and deleted Fig. 1A.
(3-3) The references appear to be compromised. For example, the authors state that "The Ebf1−/+ mouse was originally generated by R. Grosschedl (39)" (line 297), but this is not the respective paper. Likewise, the knockout mouse was generated "based on the CRISPR/Cas9 system established by C. Gurumurthy (40)" (line 299), but he/she is not involved in the referenced study.
We thank the reviewer for pointing out the discrepancies in the reference citations. Upon revising the Methods section to integrate it with the main text, the reference numbering became misaligned. We have corrected the reference in the revised manuscript, and we thank the reviewer for bringing this to our attention.
(3-4) Given that the miRNA Taqman assays the authors used here have difficulties to discriminate closely related miRNAs such as e.g. miR-16 (highly expressed in the hematopoietic system) and miR-195, I would suggest that the authors test their qPCR in an appropriate setup, e.g. in their knockout mouse model. In this context, did the authors use another small RNA as a reference for the qPCR analysis? In the methods, only GAPDH is mentioned, but in my opinion, another RNA that uses the same stemloop-based cDNA synthesis protocol would be better suited.
We thank the reviewer for this valuable and technically insightful comment.
As correctly pointed out, TaqMan-based qPCR assays for miRNAs such as miR-195 can show cross-reactivity with closely related family members, particularly miR-16, which is abundantly expressed in hematopoietic cells. Indeed, due to this limitation, we do not treat the qPCR results shown in the original Figures 1A and 4B as definitive quantification of miR-195 expression. Rather, these data are used to provide a suggestion and a rough estimate of overexpression efficiency, while our core functional analyses rely on phenotypic and molecular outcomes such as target gene repression and lineage emergence. With this in mind, although we acknowledge that a small RNA reference based on the same stem-loop cDNA synthesis would offer a more compatible normalization in principle, the inherent variability and lack of absolute specificity in such assays also limits their interpretive value. Therefore, we used GAPDH as a normalization control for consistency with other qPCR analyses in the manuscript. We have now clarified this rationale and limitation in the revised Methods sections (lines 712‒716), and we thank the reviewer again for highlighting this important technical consideration.
(3-5) The Western blot data used to support the hypothesis that FOXO1 phosphorylation is reduced upon overexpression of miR-195 are not convincing. The authors should not crop everything but the band.
We thank the reviewer for the helpful comment. In response, we have now provided the full-length, uncropped Western blot images corresponding to Figure 4C, including both total FOXO1 and phospho-FOXO1 blots. These images are included in Fig. S2.
Note: This response was posted by the corresponding author to Review Commons. The content has not been altered except for formatting.
Learn more at Review Commons
Manuscript number: RC-2025-02932
Corresponding author(s): Amit Tzur
[Please use this template only if the submitted manuscript should be considered by the affiliate journal as a full revision in response to the points raised by the reviewers.
If you wish to submit a preliminary revision with a revision plan, please use our "Revision Plan" template. It is important to use the appropriate template to clearly inform the editors of your intentions.]
We thank all Referees for their insightful comments and thoughtful review of our manuscript.
This section is mandatory. *Please insert a point-by-point reply describing the revisions that were already carried out and included in the transferred manuscript. *
__! Original comments by Reviewers #1-3 are in gray. __
Reviewer #1 (Evidence, reproducibility and clarity (Required)):
The study highlights a dephosphorylation switch mediated by PP2A as a critical mechanism for coupling E2F7/8 degradation to mitotic exit and G1 phase. The study is clear and experiments are well conducted with appropriate controls
I have some concerns highlighted below:
Point 1. In this sentence: This intricate network of feedback mechanisms ensures the orderly progression of the cell cycle. What feedback mechanism are the authors referring to?
Thank you for pointing this out. We aimed for a general comment. The original line was replaced with: “The intricate network of (de)phosphorylation and (de)ubiquitination events in cycling cells establishes feedback mechanisms that ensure orderly cell cycle progression.”
Point 2. Characterization of disorder in the N-terminal segments of E2F7 and E2F8
What does it mean disorder in this title?
“Disorder” is a structural biology term for describing an unstructured (floppy) region in a protein. We suggest the following title in hope to improve clarity: “The N-terminal segments of E2F7 and E2F8 are intrinsically unstructured”
Point 3. In the paragraph on the untimely degradation of E2F8 the authors keep referring to APC/C Cdc20, however the degradation is triggered by the Ken box which is specifically recognised by APC/C Cdh1. Can it be due to another ligase not APC/C?
In our anaphase-like system, Cdh1 cannot associate with the APC/C due to persistently high Cdk1 activity, maintained by the presence of non-degradable Cyclin B1. While the KEN-box is classically recognized as a Cdh1-specific motif, previous studies have also clearly demonstrated that APC/C-Cdc20 can mediate the degradation of KEN-box substrates. For example, BubR1 interacts with Cdc20 via two KEN-box motifs (PMIDs: 25383541, 27939943 and 17406666). Nek2A is targeted for degradation by the APC/C in mitotic egg extracts lacking Cdh1, in a manner that depends on both D-box and KEN-box motifs (PMID: 11742988). CENP-F degradation in Cdh1-null cells has been shown to be dependent on both Cdc20 and a KEN-motif (PMID: 20053638). Thus, the most simple explanation for our results is that degradation is KEN box dependent and controlled by Cdc20.
Regarding alternative E3 ligases, KEN-box mutant variants of non-phosphorylatable E2F8 remained stable in APC/CCdc20-active extracts, suggesting that this degradation is indeed APC/C-specific.
Please also see our response to Reviewer #3, Point 3.
Point 4. The assays to detect dephosphorylation are rather indirect so it is difficult to establish whether phosphorylation of CDK1 and dephosphorylation by PP2A on the fragments is direct.
First, the phosphorylation sites analyzed in this study conform to the full and most canonical Cdk1 consensus motif: S/TPxK/R. While recognizing that other kinases are proline directed as well, the cell cycle dependent manner of this control, and presence of a similar CDK-dependent mechanism for Cdc6, points us towards considering the role of CDKs.
Second, consistent with the direct role of CDK1 in this regulation, NMR experiments demonstrate conformational shifts of recombinant E2F8 following incubation with Cdk1–Cyclin B1 (not included in manuscript, but shown here for reviewer consideration); see Figure below. We have not yet established equivalent biochemical systems for PP2A.
Figure legend: NMR-based monitoring of E2F7 (a-c) and E2F8 (d-f) phosphorylation by Cdk1.
a(d). 15N,1H-HSQC spectrum of E2F7(E2F8) prior to addition of Cdk1. Threonine residues of interest, T45 (T20) conforming to the consensus sequence (followed by a proline), and T84 (T60) lacking the signature sequence are annotated. b(e). Strips from the 3D-HNCACB spectrum used for assigning E2F7(E2F8) residues. Black (green) peaks indicate a correlation with the 13Cα (13Cβ) of the same and previous residues. The chemical shifts assigned to T45 (T20) and T84 (T60) match the expected values for K44(K19) and P83(P59), thereby confirming the assignment. c(f). Top, overlay of subspectra before adding Cdk1 (black) and after 16 h of activity (red) at 298 K. Bottom, change in intensities of the T45/T84 in E2F7 and T20/T60 in E2F8 showing how NMR monitors phosphorylation and distinguishes between various threonine residues.
Third, PP2A is likely the principal phosphatase counteracting Cdk1-mediated phosphorylation during mitotic exit, targeting numerous APC/C substrates (PMID: 31494926). In light of our findings and the extensive literature, it is therefore reasonable to propose that E2F7 and E2F8 may also be direct PP2A targets.
Fourth, we cannot fully exclude the possibility that dephosphorylation of E2F7 and E2F8 by PP2A occurs indirectly. Nevertheless, indirect studies of PP2A substrate identification in the literature often rely on similar genetic perturbations, chemical inhibition, cell-free systems (coupled with immunodepletion, inhibitory peptides/proteins, and small-molecule inhibitors), and phosphoproteomics. Moreover, more direct assays are not without caveats, as they lack the cellular stoichiometric context, an important limitation for relatively promiscuous enzymes such as phosphatases.
Importantly, repeated attempts (conventional [Co-IP] and less conventional [affinity microfluidics]) to detect interactions between PP2A and E2F7 and E2F8 were unsuccessful. This result was unfortunate but not surprising, given that transient substrate–phosphatase interactions are often challenging to capture experimentally.
Given our evidence showing the regulation of E2F7 and E2F8 degradation in a manner that depends on Cdk1 and PP2A, the title of the manuscript remains appropriate: "Cdk1 and PP2A constitute a molecular switch controlling orderly degradation of atypical E2Fs.”
Please also see our response to Reviewer #3 Point 1.
Point 5. Although there seems to be a control by phosphorylation and dephosphorylation (which could be indirect), it is difficult to establish the functional consequences of this observation. The authors propose a feedback mechanism which regulates the temporal activation inactivation of E2F7/8 however, there are no evidence in support of this.
The components being studied here have been extensively characterized, as have the direct and indirect interactions that connect them and ensure orderly cell cycle progression. For example: i) The E2F1–E2F7/8 transcriptional circuitry functions as a negative feedback loop; ii) Cdk1 and PP2A counteract one another’s activity; iii) E2F1 promotes the disassembly of APC/CCdh1; iv) E2F7 and E2F8 are APC/C substrates with cell cycle-relevant degradation patterns; and v) Loss of Cdh1 leads to premature S-phase entry.
Our study brings these components together into a coherent regulatory module operating in cycling cells, revealed through cell-free biochemistry and newly developed methodologies with broad applicability to signaling research. We believe that advancing mechanistic understanding at this level of central regulators is impactful. And notably, this is a model, which we expect others in the field to test. We stand behind the result of each individual experiment and based on those findings are proposing a feedback circuit.
To address your suggestion, we incorporated phenotypic analyses (see Figure on the next page). Although modest and variable due to transient overexpression, these data align with the mechanistic model proposed in our study.
In Panel a, overexpression of E2F7 or E2F8 reduces E2F1 and its target Plk1, consistent with the established negative feedback within the E2F1–E2F7/8 transcriptional circuitry. A broader impact on cell cycle progression was also evident: G1-phase cells increased and S-phase cells decreased (Panel b), hinting at a delayed G1–S transition when E2F1, an essential driver of S-phase and mitotic entry, is downregulated by excess E2F7 or E2F8.
We next examined the effects of hyper- vs. hypo-phosphorylation–mimicking mutants of E2F7 and E2F8 on E2F1 and Plk1 (Panels c and d). Both raw data (top) and quantification (bottom) are shown. Despite ectopic overexpression, our experimental conditions highlighted the diffenrential outcome of the two phospho-mutant variants. Speificially, E2F1 and Plk1 levels were consistently higher upon expression of non-phosphorylatable variants of E2F7 (T45A/T68A) and E2F8 (T45D/T68D) relative to their phophomimetic counterparts (T45D/T68D; T20D/T44D). These findings suggest that E2F1 downregulation is more pronounced when E2F7/E2F8 are hyper-phosphorylated at Cdk1-regulated sites that control their half-lives. Furthermore, the proportion of S-phase cells was consistently lower for the phospho-mimicking mutants compared with the non-phosphorylatable variants, with complementary, though less pronounced, shifts in G1-phase cells (Panel e).
Figure legend: Evidence for cell cycle control linked to Cdk1–PP2A regulation of the E2F1–E2F7/E2F8 axis.
a) Immunoblot analysis showing reduced E2F1 and its target protein Plk1 upon E2F7/E2F8 overexpression. Antibodies used for immunoblotting (IB) are indicated. b) Cell cycle phase distribution after E2F7/E2F8 overexpression, based on DNA content. Left: representative histograms. Right: quantification of G1- and S-phase cells. Means (x) with individual biological replicates (color-coded; N = 4) are shown. c,d) Top: E2F1 and Plk1 protein levels in cells expressing phosphomimetic (TT-DD) or non-phosphorylatable (TT-AA) E2F7 (c) or E2F8 (d) variants. Antibodies used are indicated (*distorted signal excluded). Bottom: quantification relative to loading controls. Means (x) with individual values (N = 3/4) are shown. e) Cell cycle phase distribution following expression of E2F7/E2F8 phospho-mutant variants. Means (x) with individual values (N = 4) are shown. All experiments were performed in HEK293T cells. Cells were fixed 40–44 h post-transfection. DNA content was assessed using propidium iodide (PI). Mutation sites: T45/T68 (E2F7); T20/T44 (E2F8. Statistical significance was determined by two-tailed Student’s t-test; P-values are indicated.
Taken together, these results support a model in which Cdk1-site (de)phosphorylation modulates the stability of E2F7 and E2F8, thereby shaping E2F1 output and influencing cell cycle preogresion.
Point 6. Reviewer #1 (Significance (Required)):
The study is a good and well conducted work to understand the mechanisms regulating degradation of E2F7/8 by APC/C. This is crucial to establish coordinated cell cycle progression. While the hypothesis that disruption of this mechanism is likely responsible for altered cell cycle progression, there are no evidence this is just a back up pathway, whose functional significance could be limited to lack of APC/C Cdh1 activity. These experiments are rather difficult but the authors could comment on the limitation of the study and emphasise the hypothetical alterations which could result from the alterations of the described feedback loop
We thank Reviewer #1 for this comment. Accordingly, we have expanded the discussion to further elaborate on the potential molecular outcomes and limitations of our study.
Reviewer #2 (Evidence, reproducibility, and clarity (Required)):
Summary: The authors provide strong biochemical evidence that the regulation of E2F7 and E2F8 by APC is affected by CDK1 phosphorylation and potentially by PP2A dependent dephosphorylation. The authors use both full length and N-terminal fragments of E2F8 in cell-free systems to monitor protein stability during mitotic exit. The detailed investigation of the critical residues in the N-terminal domain of E2F8 (T20/T44) is well supported by the combination of biochemical and cell biology approaches.
We thank Reviewer #2 for their encouraging feedback.
Point 1. Major: It is unclear how critical the APC-dependent destruction of E2F7 and E2F8 is for cell cycle progression or other cellular processes. Prior studies have reported that Cyclin F regulation of E2F7 is critical for DNA repair and G2-phase progression. This study would be improved if the authors could provide a cellular phenotype caused by the lack of APC dependent regulation of E2F8 and/or E2F7.
We thank Reviewers #2 and #1 for this comment, which prompted substantial revisions. Below, we reiterate our response to Reviewer #1.
The molecular components examined in this study are well established in the literature. Key principles include: (i) the reciprocal regulation between E2F1 and its repressors, E2F7 and E2F8, which forms a transcriptional feedback loop; (ii) the opposing activities of Cdk1 and PP2A; (iii) the capacity of E2F1 to attenuate APC/CCdh1 activity; (iv) the fact that E2F7 and E2F8 are APC/C substrates with defined cell cycle–dependent degradation patterns; and (v) the requirement for Cdh1 to prevent premature S-phase entry.
Our study integrates these elements into a unified framework operating in proliferating cells. This framework is supported by biochemical reconstitution experiments and newly developed methodological tools, which we anticipate will be broadly applicable for dissecting signaling pathways. We view this type of mechanistic synthesis as valuable for the field. Importantly, we do not present this as a definitive model, but rather as a testable regulatory circuit constructed from robust individual findings.
In response to your request, we incorporated additional phenotypic analyses (see Figure, next page). Although modest and variable due to transient overexpression, the results are consistent with the regulatory architecture we propose.
In panel a, elevating E2F7 or E2F8 levels reduces E2F1 and its downstream target Plk1, consistent with the established inhibitory feedback exerted by E2F7 and E2F8 on E2F1. Additionally, we observed an increase in G1-phase cells and a decrease in S-phase cells (Panel b), hinting at a delayed G1–S transition when E2F1, a key transcriptional engine of S- and M-phase entry, is downregulated by excess E2F7 or E2F8.
Figure legend: Evidence for cell cycle control linked to Cdk1–PP2A regulation of the E2F1–E2F7/E2F8 axis.
a) Immunoblot analysis showing reduced E2F1 and its target protein Plk1 upon E2F7/E2F8 overexpression. Antibodies used for immunoblotting (IB) are indicated. b) Cell cycle phase distribution after E2F7/E2F8 overexpression, based on DNA content. Left: representative histograms. Right: quantification of G1- and S-phase cells. Means (x) with individual biological replicates (color-coded; N = 4) are shown. c,d) Top: E2F1 and Plk1 protein levels in cells expressing phosphomimetic (TT-DD) or non-phosphorylatable (TT-AA) E2F7 (c) or E2F8 (d) variants. Antibodies used are indicated (*distorted signal excluded). Bottom: quantification relative to loading controls. Means (x) with individual values (N = 3/4) are shown. e) Cell cycle phase distribution following expression of E2F7/E2F8 phospho-mutant variants. Means (x) with individual values (N = 4) are shown. All experiments were performed in HEK293T cells. Cells were fixed 40–44 h post-transfection. DNA content was assessed using propidium iodide (PI). Mutation sites: T45/T68 (E2F7); T20/T44 (E2F8. Statistical significance was determined by two-tailed Student’s t-test; P-values are indicated.
We next examined how phospho-regulation of E2F7 and E2F8 influences cell cycle control by comparing the effects of phospho-mimetic and non-phosphorylatable variants on E2F1 levels and cell cycle distribution (panels c and d). Both the raw data and the corresponding quantitative analyses are presented. Despite exogenous overexpression, we identified conditions that distinguish the behaviors of the two mutant classes. Cells expressing the phospho-mimetic variants consistently exhibited lower E2F1 and Plk1 levels than those expressing the non-phosphorylatable forms. This pattern supports a model in which phosphorylation of key Cdk1 sites in E2F7 and E2F8 elevates their stability, thereby enhancing their ability to suppress E2F1. Panel e extends these observations to cell cycle behavior: compared with the non-phosphorylatable variants, The phospho-mimetic forms of E2F7 and E2F8 consistently lower the proportion of S-phase cells, accompanied by corresponding shifts in the G1 population.
The central aim of this manuscript is to define how the Cdk1–PP2A axis is integrated into the APC/C–E2F1 regulatory network controlling cell cycle progression. Collectively, our findings support a model in which Cdk1/PP2A-dependent (de)phosphorylation modulates the stability of E2F7 and E2F8, thereby fine-tuning E2F1 activity and cell cycle progression.
Point 2. Minor: All optional: It would have been interesting to see the T20A/T44A/KM in the live cell experiment (Figure 3F).
This is an excellent point. Following Reviewer #2’s request, we generated a stable cell line expressing a KEN-box mutant variant of E2F8-T20A/T44A (N80 fragment). The figure below demonstrates the impact of the KEN-box mutation on the dynamics of N80-E2F8-T20A/T44A in HeLa cells. Together, our data from both cellular and cell-free systems show that the temporal dynamics of both wild-type and non-phosphorylatable variants of E2F8 depends on the KEN degron. Please note that due to differences in the flow cytometer settings used for acquiring the original measurements and those newly generated at the Reviewer’s request, the numeric data for N80-E2F8-T20A/T44A-KEN mutant will not be integrated into the original plots shown in the original Figure 3c–e in the manuscript.
Figure legend: Dynamics of mutant variants of N80-E2F8-EGFP in HeLa cells.
Top: Bivariate plots showing DNA content (DAPI) vs. EGFP fluorescence, with G1/G1-S phases and G2/M phases highlighted (black and gray frames, respectively). Bottom: Histograms showing EGFP signal distributions within these cell cycle phases. Blue arrows highlight subpopulations of G2/M cells with relatively low EGFP levels. The data was generated by flow cytometry.
Point 3. Figure 4C-D - include the corresponding blots for the WT E2F7.
This is a good point, which we previously overlooked. The requested data will be integrated in the revised manuscript.
Point 4. It is unclear how selective or potent the PP2A inhibitors are that are used in Figure 5. Is it possible to include known targets of PP2A (positive controls for PP2A inhibition) in the analysis performed in Figure 5?
Thank you for this helpful suggestion. Following Reviewer #2’s comment, we performed gel-shift assays of Cdc20 and C-terminal fragment of KIF4 (Residues: 732-1232), both known targets of PP2A (PMIDs: 26811472; 27453045). See data below.
__Figure legend: PP2A inhibitor LB-100 block protein dephosphorylation in G1-like extracts. __
Time-dependent gel shifts of mitotically phosphorylated Cdc20 and the C-terminal fragment of KIF4 (residues 732–1232) following incubation in G1 extracts supplemented with LB-100 or okadaic acid (OA; positive control). Substrates (IVT, 35S-labeled) were resolved by PhosTag SDS–PAGE and autoradiography.
Point 5. Is the APC still active in LB-100 or OA treated conditions? Is it possible to demonstrate the APC is active using known substrates in this assay (e.g., Securin (Cdc20) and Geminin (Cdh1) or similar).
This is an excellent point and we should have clarified this previously. Importantly, treatment with 250 µM LB-100 does not abolish APC/C-mediated degradation (otherwise, the assay would not be viable), but it does attenuate degradation kinetics. This is reflected by the prolonged half-lives of Securin and Geminin relative to mock-treated extracts (see below). Consistently, we noted in the manuscript: “Although APC/C-mediated degradation is also affected, it remains efficient, allowing us to measure relative half-lives of APC/C targets that cannot undergo PP2A-mediated dephosphorylation.” Following this comment, and one by Reviewer #3, these data will be included in the revised manuscript.
__Figure legend: APC/C-specific activity in cell extracts treated with LB-100. __
Time-dependent degradation of EGFP–Geminin (N-terminal fragment of 110 amino acids) and Securin in extracts supplemented with LB-100 and/or UbcH10 (recombinant). A control reaction contained dominant-negative (DN) UbcH10. Proteins (IVT, 35S-labeled) were resolved by SDS-PAGE and autoradiography.
Reviewer #2 (Significance (Required)): Advance: A detailed analysis is provided for the critical N-terminal residues in E2F7 and E2F8 that when phosphorylated are capable of restricting APC destruction. The work builds on prior work that had identified the APC regulation of E2F7 and E2F8.
Point 6. Audience: The manuscript would certainly appeal to a broad basic research audience that is interested in the regulation of APC substrates and/or E2F axis control via E2F7 & E2F8. The study could have a broader interest if the destruction of E2F7 or E2F8 could be shown to be biologically relevant (e.g., critical for cell fate decision G1 vs G0, G1 length, timely S-phase onset, or expression of E2F1 target genes in the subsequent cell cycle).
To clarify, we subdivided Reviewers’ comments into separate points. Reviewer #2’s Points 1 and 6 address essentially the same issue; our detailed response is therefore provided under Point 1. We again thank Reviewer #2 for raising this concern, which led to substantial revisions to both the manuscript text and the supporting data.
We thank Reviewer #2 for their constructive comments and criticism.
Reviewer #3 (Evidence, reproducibility and clarity (Required)):
This manuscript presents a well-structured study on the regulatory interplay between Cdk and Phosphatase in controlling the degradation of atypical E2Fs, E2F7 and E2F8. The work is relevant in the field of cell cycle regulation and provides new mechanistic insights into how phosphorylation and dephosphorylation govern APC/C-mediated degradation. The use of complementary cell-based and in vitro approaches strengthens the study, and the findings have significant implications for understanding the timing of transcriptional regulation in cell cycle progression.
Point 1. However, several points in this paper require further clarification for it to have a meaningful impact on the research community. The characterization of the phosphatase is unclear to me. The use of OA is necessary to guide the research, but it is not precise enough to rule out PP1 and then identify which PP2A is involved - PP2A-B55 or PP2A-B56. To clarify this, the regulatory subunits should either be eliminated or inhibited using the inhibitors developed by Jakob Nilsson's team.
We are grateful for this comment, which prompted an extensive series of experiments that have undoubtedly strengthened our manuscript.
First, we wish to clarify that LB-100, unlike okadaic acid (OA), is not considered a PP1 inhibitor.
Second, we have conducted a large set of experiments to address this important question of the strict identity of the phosphatase involved in the dephosphorylation of atypical E2Fs.
I. We initially attempted to immunodeplete the catalytic subunit of PP2A (α) from G1 extracts as a means to validate PP2A-dependent dephosphorylation. In retrospect, this was a naïve approach given the protein’s high abundance; although immunoprecipitation was successful, immunodepletion was inefficient, preventing us from using this strategy (see Panel a in the figure below). As an alternative, we incubated immunopurified PP2A-Cα with mitotic phosphorylated E2F7 and E2F8 fragments (illustrated in Panel b). A time-dependent gel-shift assay demonstrated enhanced dephosphorylation in the presence of immunopurified PP2A-Cα (Panel c) compared to immunopurified Plk1 (control reaction), suggesting that mitotically phosphorylated E2F7 and E2F8 are targeted by PP2A.
Figure legend: Immunopurified PP2A-Cα facilitates dephosphorylation of E2F7 and E2F8 in cell extracts. a) Inefficient immunodepletion (ID) of the catalytic subunit α of PP2A (PP2A-Cα) from cell extracts despite three rounds of immunopurification, as detected by immunoblotting (IB) with anti-PP2A-Cα and anti-BIP (loading control; LC) antibodies (BD bioscience, Cat#: 610555; Cell Signaling Technology, Cat#: 3177). Briefly, G1 cell extracts were diluted to ~10 mg/mL in a final volume of 65 μL. Anti-PP2A-Cα antibodies (3 μg) were coupled to protein G magnetic DynabeadsTM (15 μL; Novex, Cat#: 10004D) for 20 min at 20 °C. For each depletion round, antibody-coupled beads were incubated with cell extracts for 15 min at 20 °C. Cell extracts and beads were sampled after each step to assess immunodepletion and immunopurification (IP) efficiency. Equivalent immunopurification steps are shown for Plk1 (bottom). b) Schematic of the dephosphorylation assay using mitotically phosphorylated in vitro translated (IVT) targets and immuno-purified PP2A-Cα/Plk1. c) Dephosphorylation of mitotically phosphorylated E2F7 and E2F8 fragments, detected by electrophoretic mobility shifts in Phos-Tag SDS-PAGE. Immunopurified Plk1 was used for control reactions (antibodies: Santa Cruz Biotechnology: Cat#: SC-17783). *Image was altered to improve visualization of mobility shifts.
II. Next, we used pan-B55-specific antibodies for immunodepletion of all B55-type subunits. This approach was unsuccessful despite five rounds of immunopurification (see Panel a in the figure below). Both suboptimal binding and the high abundance of endogenous B55 subunits likely contributed to this outcome. Thus, dephosphorylation in B55-depleted extracts could not be tested.
Figure legend: PP2A-B55 facilitates dephosphorylation of E2F7 and E2F8 fragments.
a) __Immunodepletion (ID) of B55 subunits in G1 extracts is inefficient despite five rounds of immunopurification; assessed by immunoblotting (IB) using anti-pan-B55 and anti-Cdk1 (loading control; LC) antibodies (see previous figure for more details). Cell extracts and beads were sampled after each round to monitor immunodepletion and immunopurification efficiency. b) Schematic of a dephospho-rylation assay using immuno-purified B55 subunits. __c) __Dephosphorylation of mitotically phosphorylated E2F7 and E2F8 fragments by immuno-purified B55. Control reactions performed with immuno-purified Plk1. d) __Schematic of a dephosphorylation assay performed in G1 cell extracts supplemented with B55-interacting (B55i) or control peptides (see peptide sequence on next page). RO-3306 was added to limit Cdk1 activity. __e) __Dephosphorylation of E2F7 and E2F8 fragments (mitotically phosphorylated) in G1 extracts supplemented with B55-interacting/control peptides. __f) __Schematic of the dephosphorylation assay using in vitro–translated B55/B56 subunits (unlabeled). __g) __Dephosphorylation of mitotically phosphorylated E2F7 (top) and E2F8 (bottom) fragments in reticulocyte lysate containing B55/B56 subunits. Dephosphorylation was assessed by electrophoretic mobility shifts in Phos-Tag SDS-PAGE. Panels marked with an asterisk were adjusted to improve visualization of gel-shifts. Arrowheads denote distinct, time-dependent mobility-shifted forms of E2F7 and E2F8 fragments. Antibodies used: anti-pan-B55 (ProteinTech, Cat#: 13123-1-AP); anti-Plk1 (Santa Cruz Biotechnology, Cat#: SC-17783); anti-Cdk1 (Santa Cruz Biotechnology, Cat#: SC-53217). Dynabeads™ (Novex, Cat#: 10004D) were used for immunopurification.
As with PP2A-Cα, we incubated immunoprecipitated B55 subunits with mitotically phosphorylated E2F7 and E2F8 fragments (illustrated in Panel b). The results were less definitive compared to PP2A-Cα; nevertheless, they demonstrated accelerated dephosphorylation in the presence of immunopurified B55 subunits (Panel c) relative to Plk1 (control). These results hint at B55-mediated dephosphorylation of E2F7 and E2F8.
III. Given that PP2A-B55 could be immunodepleted satisfactorily, despite successful immunoprecipitation, we ordered the B55-specific peptide and corresponding control peptide reported recently by Jakob Nilsson’s team as PP2A-B55 inhibitors (see below).
Figure legend: Adapted from Kruse, T., et al., 2024; ____Science Advances. Figure 3, Panel B. ____PMID: 39356758.
Despite our long-anticipated wait for these peptides to arrive, this line of experimentation proved disappointing. We wish to elaborate:
The study by Kruse et al. (PMID: 39356758) is an elegant integration of classical enzymology, performed at the highest level, with structural insight into the conserved PP2A-B55 binding pocket that governs substrate specificity. Their work identified a consensus peptide that binds PP2A-B55 specifically with nanomolar affinity.
Kruse et al. provide compelling evidence for a direct and specific interaction between their reported B55 inhibitor (B55i) and PP2A-B55. Their data show that the engineered inhibitor disrupts the binding of helical elements that underlie substrate recognition by PP2A-B55.
However, we could not find direct evidence of PP2A-B55 enzymatic inhibition by the B55i peptide; for example, a B55-specific in vitro dephosphorylation assay demonstrating sensitivity to B55i in a dose-dependent manner. To the best of our understanding, the sole functional consequence described by Kruse et al. was the delay in mitotic exit observed upon expression of YFP-tagged B55i peptides in cells. However, this approach is indirect, given the long interval between cell manipulation and analysis and the complexity of mitotic exit. Furthermore, we assumed that the requested reagents had been validated in cell-free extracts; however, Kruse et al. do not report any experiments performed in these systems. We, in fact, became uncertain whether we had correctly understood Reviewer #3’s request to use these reagents and therefore sought clarification from the Editor.
In vitro, Kruse et al. reported nanomolar binding affinities for B55i (Figure S14). In our cell extracts, however, we required concentrations of approximately 250 μM to detect an effect on dephosphorylation, evident as altered electrophoretic mobility of both E2F7 and E2F8 (Panel e). At this concentration, the peptide also caused nonspecific effects, rendering the extracts highly viscous (‘gooey’), at times preventing part of the reaction mixture from passing through a 10 μL pipette tip.
The gel-shift assays shown in Panel e (Page 16) do demonstrate delayed dephosphorylation in extracts treated with the B55i peptide relative to the control peptide. Nevertheless, we prefer to exclude these data because the peptide concentrations required for the assay compromised extract integrity. Moreover, we believe that the PP2A-B55–specific peptide described by Nilsson et al. requires additional validation before it can be considered a reliable functional inhibitor in cell-free systems or in vivo. Accordingly, we are unable to directly address the experiments as suggested.
IV. In the final set of experiments (Page 16, Panels f and g), we supplemented dephosphorylation reactions with in vitro–translated B55/B56 subunits (illustrated in Panel f). Although the expected concentration of in vitro–translated proteins in reticulocyte lysate is relatively low (100–400 nM), we reasoned that supplementing the reactions with excess of regulatory B subunits (non-radioactive) could still promote dephosphorylation in a differential manner that reflects the B55/B56 preference of E2F7 and E2F8.
We cloned and in vitro expressed all nine B55/B56 regulatory subunits. While the exact amount of each subunit introduced into the reaction cannot be precisely determined, their expression levels were reasonably uniform (see figure below).
__Figure legend: Expression of B55/B56 subunits in reticulocyte lysate. __B55/B56 subunits were cloned into the pCS2 vector and expressed in reticulocyte lysate supplemented with ³⁵S-Methionin. Proteins were resolved by SDS–PAGE and autoradiography.
Returning to Panel g (Page 16), B55 subunits facilitated the accumulation of lower–electrophoretic mobility forms of both E2F7 and E2F8 fragments to the greatest extent. This is evident from the distinct lower–mobility species that emerge over time (marked by arrowheads) and the smear intensity corresponding to the buildup of dephosphorylated forms. Among the tested subunits, B55β exerted the strongest effect on both substrates, suggesting that mitotically phosphorylated E2F7 and E2F8 display a heightened preference for the PP2A-B55β holoenzyme. Control reactions with reticulocyte lysate are also shown.
Taken together, our original and newly added data indicate that PP2A, specifically PP2A-B55, counteracts Cdk1-dependent phosphorylation during mitotic exit. Importantly, cell cycle regulators such as Cdc20 can be targeted by both PP2A-B55 and PP2A-B56 holoenzymes. Thus, while we are confident in concluding that mitotically phosphorylated E2F7 and E2F8 are targeted by PP2A-B55, we cannot rule out the possibility of functional interactions between E2F7/E2F8 and PP2A-B56.
V. Last, but certainly not least, we used AlphaFold 3 to model interactions between the N-terminal fragments of E2F7 and E2F8 and the PP2A regulatory subunits. To clarify: for us, AlphaFold 3 remains very much a computational “black box,” and although this may sound like an overstatement, we did not anticipate obtaining meaningful or interpretable output.
According to the AlphaFold 3 developer guidelines, the Interface Predicted Template Modeling (IPTM) score is the primary confidence metric for protein–protein interaction predictions. IPTM values above 0.8 indicate high-confidence predictions, whereas values below 0.6 likely reflect failed interaction predictions. In our models, none of the predicted interactions exceeded 0.6 (see figure below). Nevertheless, for both E2F7 and E2F8 fragments, IPTM scores were consistently higher for B55 subunits than for B56 subunits, with B55β yielding the highest scores (each interaction was modeled five times).
__Figure legend: AlphaFold 3 predicts preferential interactions between E2F7 and E2F8 and PP2A-B55β. __Protein–protein interaction predictions between N-terminal fragments of E2F7 and E2F8 and B55/B56 regulatory subunits of PP2A were generated using AlphaFold 3 (AF3). The plot shows IPTM scores from five models per protein pair.
Even if one assumes a scenario in which AlphaFold 3 scores are inaccurate or effectively random, such non-specific behavior would not be expected to produce: (i) a reproducible preference of two distinct substrates for B55β and B55γ, in that order (the modeled fragments of E2F7 and E2F8 share The ability of AlphaFold 3, and specifically the IPTM metric, to predict bona fide PP2A B55/B56–substrate interactions remains unvalidated. Accordingly, we do not rely on these predictions as experimental evidence. Nonetheless, in retrospect, the IPTM scores for the E2F7 and E2F8 fragments proved, unexpectedly, to be highly informative. While we are not the first to explore AlphaFold in the context of PP2A phosphatases (e.g., Kruse et al.), at this early stage of AlphaFold 3 these observations are compelling and may ultimately have implications for PP2A-mediated signaling that extend well beyond the cell-cycle field.
Point 2. It would also be valuable for this study to investigate the mechanisms underlying this regulation. In particular, is it exclusive to E2F7-8 or could other substrates contribute to the generalisation of this regulatory process?
Assuming Reviewer #3 is referring to the cell cycle mechanism regulating E2F7 and E2F8 half-life via conditional degrons, we wish to clarify that the temporal dynamics of APC/C targets regulated by dephosphorylation has been demonstrated previously. Examples include KIFC1, CDC6, and Aurora A (PMIDs: 24510915; 16153703; 12208850, respectively).
Point 3. The observation that Cdc20 may target E2F8 is interesting but needs to be further clarified to ensure that weak Cdh1 activity does not contribute to this degradation. Elimination of Cdc20 would be necessary to support the authors' conclusion.
We gratefully acknowledge this input. The newly implemented experiment and corresponding findings are presented on the next page. The immunodepletion (ID) procedure (Panel a) achieved >60% reduction of Cdc20 and Plk1 in mitotic extracts (Panel b), as confirmed by immunoblotting (IB). Plk1-depleted extracts were used to validate extract-specific activity after successive rounds of immunodepletion at 20°C. Bead-bound Cdc20 and Plk1 were also analyzed by IB for validation (Panel b, right).
As expected, the phospho-mimetic E2F8 fragment (T20D/T44D) remained stable in Plk1- and Cdc20-depleted mitotic extracts, serving as negative control (Panel c). In contrast, degradation of the non-phosphorylatable variant (T20A/T44A), as well as the APC/CCdc20 substrate Securin (positive control), was strongly hampered in Cdc20-depleted extracts compared to Plk1-depleted extracts. These results confirm that the untimely degradation of the non-phosphorylatable E2F8 in mitotic extracts is Cdc20-dependent.
Figure legend: Untimely degradation of the non-phosphorylatable E2F8 in mitotic extracts is Cdc20-dependent.____a) Schematic of the immunodepletion (ID) protocol; additional technical details are provided below. b) Plk1 (top) and Cdc20 (bottom) levels in NDB mitotic extracts before and after three rounds of immunodepletion, as detected by immunoblotting (IB). Plk1 and Cdc20 levels were normalized to Tubulin and Cdk1, respectively. Both normalized and raw values are presented as percentages. Immunoprecipitation (IP) efficiency is shown on the right. c) Degradation profiles of phospho-mutant E2F8 variants and Securin (positive control) in NDB mitotic extracts depleted of Plk1 (control) or Cdc20.
__ ---__
Point 4. This study focuses on two proteins of the E2F family. These two proteins share similar domains, phosphorylation sites and a KEN box. However, their sensitivity to APC is different. What might explain this difference? Are there any inhibitory sequences for E2F7? Or why is the KEN box functional in E2F8 but not in E2F7?
This is an excellent question. Here are our thoughts: The processivity of polyubiquitination by the APC/C varies between substrates in ways that influence degradation rate and timing (PMID: 16413484). Although E2F7 and E2F8 are related, their sequence identity is below
50%, and their C-terminal domains differ substantially (see below) [FIGURE]. These structural differences likely contribute to differences in APC/C-mediated processivity and, consequently, to variations in protein half-lives. Additionally, E2F8 contains two functional KEN-boxes involved in its degradation, whereas E2F7 has only one. This may increase the kon rate of E2F8 for the APC/C, further enhancing its recognition and ubiquitination. Furthermore, re-examining the study by de Bruin and Westendorp (PMID: 26882548, Figure 2f; copied below), we note that the dynamic of inducibly expressed EGFP-tagged E2F7 in cells exiting mitosis is milder compared to E2F8 (see the black lines in both charts). This, as well as the oversensitivity of E2F7 degradation to Cdh1 downregulation accord with E2F7 being less potent substrate of APC/CCdh1.
Figure legend: Adapted from Boekhout et al., 2016; ____EMBO Reports. Figure 2, Panel F. ____PMID: 26882548.
The stability of the E2F7 fragment in cells and extracts was unexpected. We initially hypothesized that the unique N-terminal tail of E2F7 masks the KEN-box, functioning as an inhibitory sequence. However, removal of this region did not restore degradation (original manuscript; Figure 1e). Furthermore, extending the fragment by 20 additional residues failed to confer degradation (original manuscript; Figure S2). These observations suggest that E2F7 may require a distal or modular docking site for APC/C recognition. We did not pursue this question further.
Point 5. An additional element that could strengthen this work would be referencing the study by Catherine Lindon: J Cell Biol, 2004 Jan 19;164(2):233-241. doi: 10.1083/jcb.200309035. In Figure 1 of this article, there is a degradation kinetics analysis of APC/C complex substrates such as Aurora-A/B, Plk1, cyclin B1, and Cdc20. This could help position the degradation of E2F7/8 relative to known APC/C targets. This can be achieved by synchronizing cells with nocodazole and then removing the drug to allow cells to progress and complete mitosis.
This is an interesting point and one we should have clarified better previously. The temporal dynamics of E2F8 in synchronized HeLa S3 cells, relative to three known APC/C substrates, were reported in our previous study (PMID: 31995441; Figure 1a, copied on the right). Specifically, protein levels were measured for Cyclin B1, Securin, and Kifc1. Unlike Cyclin B1 and Securin, which are targeted by both APC/CCdc20 and APC/CCdh1, Kifc1 is degraded exclusively by APC/CCdh1. Cells were released from a thymidine–nocodazole block.
Following Reviewer #3’s comment, we re-blotted the original HeLa S3 synchronous extracts. The new data [FIGURE] can be incorporated into the revised manuscript if requested.
Point 6. Minor points: Does phosphorylation of E2F7-8 proteins alter their NMR profile? This could help understand how phosphorylation/dephosphorylation affects their sensitivity to the APC/C complex.
Excellent suggestion. Indeed, we had originally aimed to include a more extensive set of NMR data in this manuscript. Our goal was to monitor E2F7 and E2F8 fragments in cell extracts and assess structural changes induced by phosphorylation and dephosphorylation during mitosis and mitotic exit. However, purifying the E2F7 fragment proved more challenging than anticipated. In addition, the extract-to-substrate ratio requires further optimization: Substrate concentrations must be high enough for reliable NMR detection, but below levels that would saturate the enzymatic activity in the extracts.
That said, the short answer to the reviewer’s question is Yes: NMR profiles of E2F7 and E2F8 fragment do change following incubation with recombinant Cdk1–Cyclin B1 (see next page). If possible, we wish to exclude these NMR data from the manuscript.
Point 7. Do these substrates bind to the APC/C complex before degradation? Does E2F7 bind better than E2F8?
We were unable to detect interactions between endogenous E2F7 and E2F8 and the APC/C complex. In general, detecting endogenous E2F8, and especially E2F7, by immunoblotting proved challenging, making co-immunoprecipitation (Co-IP) even more difficult.
Figure legend: NMR-based monitoring of E2F7 (a-c) and E2F8 (d-f) phosphorylation by Cdk1.
a(d). 15N,1H-HSQC spectrum of E2F7(E2F8) prior to addition of Cdk1. Threonine residues of interest, T45 (T20) conforming to the consensus sequence (followed by a proline), and T84 (T60) lacking the signature sequence are annotated. b(e). Strips from the 3D-HNCACB spectrum used for assigning E2F7(E2F8) residues. Black (green) peaks indicate a correlation with the 13Cα (13Cβ) of the same and previous residues. The chemical shifts assigned to T45 (T20) and T84 (T60) match the expected values for K44(K19) and P83(P59), thereby confirming the assignment. c(f). Top, overlay of subspectra before adding Cdk1 (black) and after 16 h of activity (red) at 298 K. Bottom, change in intensities of the T45/T84 in E2F7 and T20/T60 in E2F8 showing how NMR monitors phosphorylation and distinguishes between various threonine residues.
However, interactions between EGFP-tagged E2F7 snd E2F8 and Cdh1 have been demonstrated previously (PMID: 26882548, Figure 2e). In contrast, only the N-terminal fragment of E2F8, but not the corresponding fragment of E2F7, was found to bind Cdh1 (see figure on the right). This observation is consistent with the stability of the E2F7 fragment in APC/C-active extracts.
__Figure legend: N-terminal fragment of E2F8 but not E2F7 binds Cdh1. __
Co-Immunoprecipitation (IP) was performed in HEK293 cells transfected with EGFP-tagged E2F7/E2F8 fragments, using GFP-Trap® (Chromotek, Cat#: GTMA-20). Antibodies used for immunoblotting: ant-GFP (Santa Cruz Biotechnology: Cat#: SC-9996); anti-Cdh1 (Sigma-Aldrich, Cat#: MABT1323).
Point 8. Why do the authors state that 250 µM of LB-100 has little effect on APC/C activity?
We thank Reviewers #2 and 3 for raising this point. As shown in the manuscript, treatment with 250 µM LB-100 does not abolish APC/C-mediated degradation (otherwise, the assay would not be viable). However, it does attenuate degradation kinetics, as reflected by the prolonged half-lives of Securin and Geminin (see figure below).
__Figure legend: APC/C-specific activity in cell extracts treated with LB-100. __
Time-dependent degradation of EGFP–Geminin (N-terminal fragment of 110 amino acids) and Securin in extracts supplemented with LB-100 and/or UbcH10 (recombinant). A control reaction contained dominant-negative (DN) UbcH10. Proteins (IVT, 35S-labeled) were resolved by SDS-PAGE and autoradiography.
Point 9. How can E2F8 be a substrate for both the SCF and APC/C complexes? (If I understood correctly.)
This can happen because they are degraded by different E3 at different times during the cell cycle. To clarify further, certain proteins can be targeted by both the APC/C and SCF complexes, reflecting distinct regulatory needs. A classic example is CDC25A, as shown by M. Pagano and A. Hershko in 2002 (PMID: 12234927). Additional examples include the APC/C inhibitor EMI1 (PMIDs: 12791267 [SCF] and 29875408 [APC/C]).
Reviewer #3 (Significance (Required)): This manuscript presents a well-structured study on the regulatory interplay between Cdk and Phosphatase in controlling the degradation of atypical E2Fs, E2F7 and E2F8. The work is relevant in the field of cell cycle regulation and provides new mechanistic insights into how phosphorylation and dephosphorylation govern APC/C-mediated degradation. The use of complementary cell-based and in vitro approaches strengthens the study, and the findings have significant implications for understanding the timing of transcriptional regulation in cell cycle progression.
We wish to thank Reviewer #3 for their positive and encouraging view of our work.
Open accessTips and Tools29 January 2021 Share on Sharing Notes Is Encouraged: Annotating and Cocreating with Hypothes.is and Google DocsAuthors: Carlos C. Goller ccgoller@ncsu.edu, Micah Vandegrift, Will Cross, Davida S. SmythAuthors Info & Affiliationshttps://doi.org/10.1128/jmbe.v22i1.2135 101,598MetricsTotal Citations10Total Downloads1,598View all metrics CitePDF/EPUBContents JMBE Volume 22, Number 130 April 2021ABSTRACTINTRODUCTIONPROCEDURECONCLUSIONACKNOWLEDGMENTSSupplemental MaterialREFERENCESInformation & ContributorsMetrics & CitationsReferencesFiguresTablesMediaShareABSTRACTEffectively analyzing literature can be challenging for those unfamiliar with studies from rapidly evolving research fields. Previous studies have shown that incorporating primary literature promotes scientific literacy and critical thinking skills. We’ve used collaborative note-taking and annotation of peer-reviewed articles to increase student engagement with course content and primary literature. Participants annotate articles using the web-annotation tool Hypothes.is and have access to comments from their peers. Groups are then assigned to summarize the annotations and findings, posting a synthesis for the course’s Hypothes.is group. In parallel, students contribute to common notes. The instructor generates a weekly video discussing the student notes. The goal of these activities is to foster an environment of open annotation and co-creation of knowledge to aid in studying for deeper learning. Compiled notes can be used to create an open educational resource (OER). The OER provides an entry point for future students and the public. Based on the evaluation of annotations, notes, and assessments, we conclude that these activities encourage student engagement and achievement of learning outcomes while raising awareness of the importance of open and collaborative practices.INTRODUCTIONReading primary literature can be challenging for those unfamiliar with terminology or methodology (1–3). Often, students highlight long passages or read over unfamiliar jargon without fully comprehending the significance and details of a study. Several approaches have been described to promote the critical reading and analysis of primary literature (4–9). While these methods provide structure, students often read and analyze in isolation, as the methods do not facilitate virtual and open peer collaboration. Additionally, note-taking is a skill that is not commonly taught or emphasized in science courses (10). To create an inclusive and empowering environment of cocreation of knowledge, we’ve infused an upper-division metagenomics course with activities to reduce the anxiety of reading primary literature and note-taking and promote collective and collaborative constructivism.Many tools are available that allow collaborative work on electronic documents. Google Docs, Sheets, and Slides can be used to enable participants to contribute. There are also resources to annotate web pages. One such tool often used in the humanities is Hypothes.is (11–14); it is free, open source, and easy to use in classroom settings, including online courses. Initiatives such as Science in the Classroom (https://www.scienceintheclassroom.org/) have led to studies highlighting the use of annotation as a pedagogical tool (15–17).Student collaborative notes and summaries can be used to create an Open Educational Resource (OER). Furthermore, student-created OERs can foster a sense of ownership as class participants work toward creating a common resource that will serve them and a wider audience beyond the course (18).PROCEDUREWe introduced the use of Hypothes.is and collaborative notes in the fall of 2019 in an 8-week upper-division undergraduate and graduate student Metagenomics course (19). The course has weekly lectures of 1 hour 50 minutes and 5-hour labs with a course-based research project that relies heavily on the assigned readings. There were 15 students enrolled in the course: 4 undergraduates and 11 graduate students. The study was approved by the NCSU IRB (#20309).Students annotate articles using Hypothes.is (https://web.hypothes.is/) and have access to all comments. Hypothes. is a free open-source software package that allows users to highlight and annotate websites and text. Students are required to submit at least 10 meaningful annotations before the in-class discussion (see Appendix 1). A week after the discussion, groups of three or four students assigned to summarize the article post a brief synopsis on the class’s Hypothes.is group (Fig. 1 and Appendix 1).FIGURE 1.FIGURE 1. “Sharing Notes is Encouraged” workflow. Students annotate and cocreate notes to produce an OER for studying and future course participants. Students use Hypothes.is to annotate primary literature as homework assignments, following set guidelines (for details see Appendix 1), and groups are tasked with creating shared summaries for the class to view within a Hypothes.is group. Students contribute to shared notes both during and outside of the class session. The instructor then uses the notes to produce weekly recaps to provide feedback and encouragement. Student contributions are then compiled to create a final OER, containing all notes and annotations generated over the course of the semester in a publicly viewable dynamic resource (for a sample OER, go to go.nscu.edu/bitmetagenomics) and click on “Meta Book”). PB, Pressbooks.For collective notes, students have access to a Google Doc with the learning outcomes for each class session. Students are encouraged to contribute by providing definitions, examples, and links to additional resources. Notes are not graded but are lightly edited by the instructor for accuracy. Peers can provide constructive feedback and correct, remedy, or amend misconceptions and inaccuracies. Each week the instructor generates a video reviewing the notes and administers individual quizzes based on the content of the class notes.Students are informed that, with their consent, their notes and annotations can be used to create an OER that would benefit them and others beyond the course. An example of a student-generated OER is available at go.ncsu.edu/bitmetagenomics.Materials and preparationInstructors create a private course Hypothes.is “group” and share the link with students via their Learning Management System (LMS) or e-mail. Students require free Hypothes.is accounts. If using the Google Chrome browser, there is a useful Hypothes.is extension. Helpful tutorials for using Hypothes.is in education can be found on the website: https://web.hypothes.is/education/. If Google Docs are to be used for shared class notes, the instructor needs to make the document editable by participants. The creation of a short link that is easy to remember may be helpful. The instructor should provide guidelines for annotation (types of annotations including asking questions, clarifying or linking to resources, and examples of tags used by others), expectations for the number of individual annotations, and grading rubrics (Appendix 1). Frequently presenting or projecting the progress of the class notes encourages participation. The instructor can read and discuss the class notes in a short (6- to 15-min) weekly screencast video posted on an unlisted YouTube playlist (e.g., https://go.ncsu.edu/metanotes19).Students that contribute to class notes can produce a final web-based Pressbooks OER. Pressbooks is an affordable ($20 to $100/eBook) and easy-to-use online eBook creation platform used by universities and the OER community [e.g., Granite State College OERs (https://granite.pressbooks.pub/) and BC Open Textbooks (https://opentextbc.ca/pressbooks/)].Modifications and extensionsThe Hypothes.is annotation and group summaries assignment has been adapted for other lab-based courses. For example, for an undergraduate and graduate student 8-week Yeast Metabolic Engineering lab module (20), we have modified the assignment guidelines to allow students to complete the minimum number of meaningful annotations after the in-person discussion of articles. This extension resulted in several participants returning to the papers weeks later to provide additional information. Guidelines can be modified to increase the minimum number of annotations, have students ask and respond to each other, find related studies, or alter the due dates (e.g., until after in-class discussion). The rubric for group summaries can be modified for different course learning outcomes (e.g., data analysis). An example of an annotated paper can be shared with students; for example, a microbiome study from Science in the Classroom can help students learn to annotate using different tags/elements (https://www.scienceintheclassroom.org/research-papers/whats-normal-scoop-poop).Instructors can choose to encourage all participants to contribute to class notes by making the assignment credit-bearing. Instead of weekly screencast videos, alternatives include an audio file, podcast, or e-mail announcement. Other OER platforms exist, and some faculty may decide to use WordPress or GoogleSites to create publicly accessible sites to publish the collective contributions of participants. Data privacy and consent cannot be overlooked: talk to your students about posting their names on publicly facing sites, after asking for their consent in writing. Instructors are encouraged to contact other faculty to collaborate on topic-specific OERs.CONCLUSIONStudents annotate and produce summaries and collaborative notes following the guidelines. Analysis of the annotations and quiz grades suggests that participants are engaging with the articles (Fig. 2) and able to summarize the findings of the studies (Appendix 2). Annotations of student-selected papers by groups indicate students continue to use rich annotations. Participants contribute to a Google Doc and view weekly video summaries.FIGURE 2.FIGURE 2. Students annotated assigned papers frequently and began using descriptive “tags.” (A) Students used the Hypothes.is tool to annotate reading assignments and tag keywords or phrases. Some students responded to other comments and included links and other resources. (B) All students’ (n = 15) annotated readings.We note that, while students unfamiliar with Hypothes.is require a demonstration, having seen the demonstration, participants are capable of providing productive comments about the studies. For all the articles we’ve included as reading, students have contributed definitions, links to additional resources, and even responses to questions posed by peers. We advise that instructors highlight the benefits of collaborative annotation and critical note-taking. Our study demonstrates the impact of creating a scholarly community to promote learning and how it can encourage participation and ownership of an OER project. Our implementation demonstrated that all students made annotations and contributed their thoughts and ideas to the shared notes document. These efforts helped constitute a student-derived OER that could serve not only these students beyond the course but others as well.ACKNOWLEDGMENTSThe NCSU OPEN Incubator Program (summer 2019) provided training and inspired us to use Hypothes.is in this course and beyond. We are grateful for funding from the National Science Foundation (NSF) and to the PALM network for providing mentorship and access to active learning resources. The NCSU Biotechnology Program (BIT) provided the resources to offer the Metagenomics and Yeast Metabolic Engineering courses in which these activities were implemented. C.C.G. is also supported by an NIH Innovative Program to Enhance Research Training (IPERT) grant, “Molecular Biotechnology Laboratory Education Modules (MBLEMs)” 1R25GM130528-01A1. We thank the students in the fall 2019 BIT 477/577 Metagenomics course for their patience, commitment, feedback, and energy. This study has been reviewed by the Institutional Review Board at North Carolina State University and approved under protocol number #20309. We do not have any conflicts of interest to declare.Supplemental MaterialFile (jmbe00006-21_supp_1_seq2.pdf)Download1000.11 KBASM does not own the copyrights to Supplemental Material that may be linked to, or accessed through, an article. The authors have granted ASM a non-exclusive, world-wide license to publish the Supplemental Material files. Please contact the corresponding author directly for reuse.REFERENCES1.Rawlings JS. 2019. Primary literature in the undergraduate immunology curriculum: strategies, challenges, and opportunities. Front Immunol 10:1857.Go to CitationViewPubMedWeb of ScienceGoogle Scholar2.Nelms AA, Segura-Totten M. 2019. Expert–novice comparison reveals pedagogical implications for students’ analysis of primary literature. CBE Life Sci Educ 18:ar56.Go to CitationViewPubMedWeb of ScienceGoogle Scholar3.Abdullah C, Parris J, Lie R, Guzdar A, Tour E. 2015. Critical analysis of primary literature in a master’s-level class: effects on self-efficacy and science-process skills. CBE Life Sci Educ 14:ar34.Go to CitationViewPubMedWeb of ScienceGoogle Scholar4.Liao MK. 2017. A simple activity to enhance the learning experience of reading primary literature. J Microbiol Biol Educ 18.Go to CitationViewPubMedGoogle Scholar5.Hoskins SG, Lopatto D, Stevens LM. 2011. The C.R.E.A.T.E. approach to primary literature shifts undergraduates’ self-assessed ability to read and analyze journal articles, attitudes about science, and epistemological beliefs. CBE Life Sci Educ 10:368–378.Go to CitationViewPubMedWeb of ScienceGoogle Scholar6.Gottesman AJ, Hoskins SG. 2013. CREATE cornerstone: introduction to scientific thinking, a new course for stem-interested freshmen demystifies scientific thinking through analysis of scientific literature. CBE Life Sci Educ 12:59–72.Go to CitationViewPubMedWeb of ScienceGoogle Scholar7.Carmichael JS, Allison LA. 2019. Using “research boxes” to enhance understanding of primary literature and the process of science. J Microbiol Biol Educ 20(2).Go to CitationViewPubMedGoogle Scholar8.Round JE, Campbell AM. 2013. Figure facts: encouraging undergraduates to take a data-centered approach to reading primary literature. CBE Life Sci Educ 12:39–46.Go to CitationViewPubMedWeb of ScienceGoogle Scholar9.Lo SM, Luu TB, Tran J. 2020. A modified CREATE intervention improves student cognitive and affective outcomes in an upper-division genetics course. J Microbiol Biol Educ 21(1).Go to CitationViewPubMedGoogle Scholar10.Morehead K, Dunlosky J, Rawson KA, Blasiman R, Hollis RB. 2019. Note-taking habits of 21st-century college students: implications for student learning, memory, and achievement. Memory 27:807–819.Go to CitationViewPubMedWeb of ScienceGoogle Scholar11.Kennedy M. 2016. Open annotation and close reading the Victorian text: using hypothes.is with students. J Vic Cult 21:550–558.Go to CitationViewGoogle Scholar12.Shrout AH. 2016. Hypothes.is. J Am Hist 103:870–871.Go to CitationViewGoogle Scholar13.Perkel JM. 2015. Annotating the scholarly web. Nat News 528:153.Go to CitationViewWeb of ScienceGoogle Scholar14.Kalir JH, Dean J. 2018. Web annotation as conversation and interruption. Media Pract Educ 19:18–29.Go to CitationViewGoogle Scholar15.Kararo M, McCartney M. 2019. Annotated primary scientific literature: a pedagogical tool for undergraduate courses. PLOS Biol 17:e3000103.Go to CitationView Updates PubMedWeb of ScienceGoogle Scholar16.Miller K, Zyto S, Karger D, Yoo J, Mazur E. 2016. Analysis of student engagement in an online annotation system in the context of a flipped introductory physics class. Phys Rev Phys Educ Res 12:e020143.Go to CitationViewGoogle Scholar17.Sahota M, Leung B, Dowdell S, Velan GM. 2016. Learning pathology using collaborative vs. individual annotation of whole slide images: a mixed methods trial. BMC Med Educ 16:311.Go to CitationViewPubMedWeb of ScienceGoogle Scholar18.Yaeger J, Wolfe T. 2018. Creating the ripple effect: applying student-generated OER to increase engagement in distance education and enhance the OER community. Digital Universities 1/2.Go to CitationGoogle Scholar19.Goller CC, Ott LE. 2020. Evolution of an 8-week upper-division metagenomics course: diagramming a learning path from observational to quantitative microbiome analysis. Biochem Mol Biol Educ 48:391–403.Go to CitationViewPubMedWeb of ScienceGoogle Scholar20.Gordy CL, Goller CC. 2020. Using metabolic engineering to connect molecular biology techniques to societal challenges. Front Microbiol.Go to CitationViewPubMedWeb of ScienceGoogle ScholarInformation & ContributorsInformationContributorsInformationPublished In Journal of Microbiology & Biology EducationVolume 22 • Number 1 • 30 April 2021eLocator: 10.1128/jmbe.v22i1.2135PubMed: 33584941Copyright© 2021 Goller et al. This is an open-access article distributed under the terms of the Creative Commons Attribution-NonCommercial-NoDerivatives 4.0 International license.HistoryReceived: 12 April 2020Accepted: 28 November 2020Published online: 29 January 2021TopicsAnnotation Tools and PipelinesGenome AnnotationGenome Assembly and AnnotationMicrobial GenomicsMicrobial Physiology and GeneticsMicrobiome ResearchDownload PDFContributorsExpand AllAuthorsCarlos C. Goller ccgoller@ncsu.eduDepartment of Biological Sciences and Biotechnology Program (BIT), North Carolina State University, Raleigh, NC 27695View all articles by this authorMicah VandegriftNC State University Libraries, Raleigh, NC 27695View all articles by this authorWill CrossNC State University Libraries, Raleigh, NC 27695View all articles by this authorDavida S. SmythEugene Lang College of Liberal Arts at The New School, New York City, NY 10011View all articles by this authorMetrics & CitationsMetricsCitationsMetrics Article MetricsView all metricsDownloadsCitationsNo data available.0204060Jan 2022Jan 2023Jan 2024Jan 20251,59810TotalFirst 90 Days6 Months12 MonthsTotal number of downloads and citations Note: For recently published articles, the TOTAL download count will appear as zero until a new month starts. There is a 3- to 4-day delay in article usage, so article usage will not appear immediately after publication. Citation counts come from the Crossref Cited by service. 11030Smart Citations11030Citing PublicationsSupportingMentioningContrastingView CitationsSee how this article has been cited at scite.aiscite shows how a scientific paper has been cited by providing the context of the citation, a classification describing whether it supports, mentions, or contrasts the cited claim, and a label indicating in which section the citation was made. Citations Citation text copied Copy Goller CC, Vandegrift M, Cross W, Smyth DS. 2021. Sharing Notes Is Encouraged: Annotating and Cocreating with Hypothes.is and Google Docs. J Microbiol Biol Educ. 22:10.1128/jmbe.v22i1.2135. https://doi.org/10.1128/jmbe.v22i1.2135 If you have the appropriate software installed, you can download article citation data to the citation manager of your choice. For an editable text file, please select Medlars format which will download as a .txt file. Simply select your manager software from the list below and click Download. Format RIS (ProCite, Reference Manager)EndNoteBibTexMedlarsRefWorks Direct import $(".js__slcInclude").on("change", function(e){ if ($(this).val() == 'refworks') $('#direct').prop("checked", false); $('#direct').prop("disabled", ($(this).val() == 'refworks')); }); View OptionsFiguresOpen all in viewerFIGURE 1. “Sharing Notes is Encouraged” workflow. Students annotate and cocreate notes to produce an OER for studying and future course participants. Students use Hypothes.is to annotate primary literature as homework assignments, following set guidelines (for details see Appendix 1), and groups are tasked with creating shared summaries for the class to view within a Hypothes.is group. Students contribute to shared notes both during and outside of the class session. The instructor then uses the notes to produce weekly recaps to provide feedback and encouragement. Student contributions are then compiled to create a final OER, containing all notes and annotations generated over the course of the semester in a publicly viewable dynamic resource (for a sample OER, go to go.nscu.edu/bitmetagenomics) and click on “Meta Book”). PB, Pressbooks.Go to FigureOpen in ViewerFIGURE 2. Students annotated assigned papers frequently and began using descriptive “tags.” (A) Students used the Hypothes.is tool to annotate reading assignments and tag keywords or phrases. Some students responded to other comments and included links and other resources. (B) All students’ (n = 15) annotated readings.Go to FigureOpen in ViewerTablesMediaShareShareShare the article linkhttps://journals.asm.org/doi/10.1128/jmbe.v22i1.2135Copy LinkCopied!Copying failed.Share with emailEmail a colleagueShare on social mediaFacebookX (formerly Twitter)LinkedInWeChatBlueskyReferencesReferencesREFERENCES1.Rawlings JS. 2019. Primary literature in the undergraduate immunology curriculum: strategies, challenges, and opportunities. Front Immunol 10:1857.Go to CitationViewPubMedWeb of ScienceGoogle Scholar2.Nelms AA, Segura-Totten M. 2019. Expert–novice comparison reveals pedagogical implications for students’ analysis of primary literature. CBE Life Sci Educ 18:ar56.Go to CitationViewPubMedWeb of ScienceGoogle Scholar3.Abdullah C, Parris J, Lie R, Guzdar A, Tour E. 2015. Critical analysis of primary literature in a master’s-level class: effects on self-efficacy and science-process skills. CBE Life Sci Educ 14:ar34.Go to CitationViewPubMedWeb of ScienceGoogle Scholar4.Liao MK. 2017. A simple activity to enhance the learning experience of reading primary literature. J Microbiol Biol Educ 18.Go to CitationViewPubMedGoogle Scholar5.Hoskins SG, Lopatto D, Stevens LM. 2011. The C.R.E.A.T.E. approach to primary literature shifts undergraduates’ self-assessed ability to read and analyze journal articles, attitudes about science, and epistemological beliefs. CBE Life Sci Educ 10:368–378.Go to CitationViewPubMedWeb of ScienceGoogle Scholar6.Gottesman AJ, Hoskins SG. 2013. CREATE cornerstone: introduction to scientific thinking, a new course for stem-interested freshmen demystifies scientific thinking through analysis of scientific literature. CBE Life Sci Educ 12:59–72.Go to CitationViewPubMedWeb of ScienceGoogle Scholar7.Carmichael JS, Allison LA. 2019. Using “research boxes” to enhance understanding of primary literature and the process of science. J Microbiol Biol Educ 20(2).Go to CitationViewPubMedGoogle Scholar8.Round JE, Campbell AM. 2013. Figure facts: encouraging undergraduates to take a data-centered approach to reading primary literature. CBE Life Sci Educ 12:39–46.Go to CitationViewPubMedWeb of ScienceGoogle Scholar9.Lo SM, Luu TB, Tran J. 2020. A modified CREATE intervention improves student cognitive and affective outcomes in an upper-division genetics course. J Microbiol Biol Educ 21(1).Go to CitationViewPubMedGoogle Scholar10.Morehead K, Dunlosky J, Rawson KA, Blasiman R, Hollis RB. 2019. Note-taking habits of 21st-century college students: implications for student learning, memory, and achievement. Memory 27:807–819.Go to CitationViewPubMedWeb of ScienceGoogle Scholar11.Kennedy M. 2016. Open annotation and close reading the Victorian text: using hypothes.is with students. J Vic Cult 21:550–558.Go to CitationViewGoogle Scholar12.Shrout AH. 2016. Hypothes.is. J Am Hist 103:870–871.Go to CitationViewGoogle Scholar13.Perkel JM. 2015. Annotating the scholarly web. Nat News 528:153.Go to CitationViewWeb of ScienceGoogle Scholar14.Kalir JH, Dean J. 2018. Web annotation as conversation and interruption. Media Pract Educ 19:18–29.Go to CitationViewGoogle Scholar15.Kararo M, McCartney M. 2019. Annotated primary scientific literature: a pedagogical tool for undergraduate courses. PLOS Biol 17:e3000103.Go to CitationView Updates PubMedWeb of ScienceGoogle Scholar16.Miller K, Zyto S, Karger D, Yoo J, Mazur E. 2016. Analysis of student engagement in an online annotation system in the context of a flipped introductory physics class. Phys Rev Phys Educ Res 12:e020143.Go to CitationViewGoogle Scholar17.Sahota M, Leung B, Dowdell S, Velan GM. 2016. Learning pathology using collaborative vs. individual annotation of whole slide images: a mixed methods trial. BMC Med Educ 16:311.Go to CitationViewPubMedWeb of ScienceGoogle Scholar18.Yaeger J, Wolfe T. 2018. Creating the ripple effect: applying student-generated OER to increase engagement in distance education and enhance the OER community. Digital Universities 1/2.Go to CitationGoogle Scholar19.Goller CC, Ott LE. 2020. Evolution of an 8-week upper-division metagenomics course: diagramming a learning path from observational to quantitative microbiome analysis. Biochem Mol Biol Educ 48:391–403.Go to CitationViewPubMedWeb of ScienceGoogle Scholar20.Gordy CL, Goller CC. 2020. Using metabolic engineering to connect molecular biology techniques to societal challenges. Front Microbiol.Go to CitationViewPubMedWeb of ScienceGoogle Scholar Advertisement
Reviewer #1 (Public review):
Summary:
This study aims to explore how different forms of "fragile nucleosomes" facilitate RNA Polymerase II (Pol II) transcription along gene bodies in human cells. The authors propose that pan-acetylated, pan-phosphorylated, tailless, and combined acetylated/phosphorylated nucleosomes represent distinct fragile states that enable efficient transcription elongation. Using CUT&Tag-seq, RNA-seq, and DRB inhibition assays in HEK293T cells, they report a genome-wide correlation between histone pan-acetylation/phosphorylation and active Pol II occupancy, concluding that these modifications are essential for Pol II elongation.
Strengths:
(1) The manuscript tackles an important and long-standing question about how Pol II overcomes nucleosomal barriers during transcription.
(2) The use of genome-wide CUT&Tag-seq for multiple histone marks (H3K9ac, H4K12ac, H3S10ph, H4S1ph) alongside active Pol II mapping provides a valuable dataset for the community.
(3) The integration of inhibition (DRB) and recovery experiments offers insight into the coupling between Pol II activity and chromatin modifications.
(4) The concept of "fragile nucleosomes" as a unifying framework is potentially appealing and could stimulate further mechanistic studies.
Weaknesses:
(1) Misrepresentation of prior literature
The introduction incorrectly describes findings from Bintu et al., 2012. The cited work demonstrated that pan-acetylated or tailless nucleosomes reduce the nucleosomal barrier for Pol II passage, rather than showing no improvement. This misstatement undermines the rationale for the current study and should be corrected to accurately reflect prior evidence.
(2) Incorrect statement regarding hexasome fragility
The authors claim that hexasome nucleosomes "are not fragile," citing older in vitro work. However, recent studies clearly showed that hexasomes exist in cells (e.g., PMID 35597239) and that they markedly reduce the barrier to Pol II (e.g., PMID 40412388). These studies need to be acknowledged and discussed.
(3) Inaccurate mechanistic interpretation of DRB
The Results section states that DRB causes a "complete shutdown of transcription initiation (Ser5-CTD phosphorylation)." DRB is primarily a CDK9 inhibitor that blocks Pol II release from promoter-proximal pausing. While recent work (PMID: 40315851) suggests that CDK9 can contribute to CTD Ser5/Ser2 di-phosphorylation, the manuscript's claim of initiation shutdown by DRB should be revised to better align with the literature. The data in Figure 4A indicate that 1 µM DRB fully inhibits Pol II activity, yet much higher concentrations (10-100×) are needed to alter H3K9ac and H4K12ac levels. The authors should address this discrepancy by discussing the differential sensitivities of CTD phosphorylation versus histone modification turnover.
(4) Insufficient resolution of genome-wide correlations
Figure 1 presents only low-resolution maps, which are insufficient to determine whether pan-acetylation and pan-phosphorylation correlate with Pol II at promoters or gene bodies. The authors should provide normalized metagene plots (from TSS to TTS) across different subgroups to visualize modification patterns at higher resolution. In addition, the genome-wide distribution of another histone PTM with a different localization pattern should be included as a negative control.
(5) Conceptual framing
The manuscript frequently extrapolates correlative genome-wide data to mechanistic conclusions (e.g., that pan-acetylation/phosphorylation "generate" fragile nucleosomes). Without direct biochemical or structural evidence. Such causality statements should be toned down.
Author response:
Public Reviews:
Reviewer #1 (Public review):
Summary:
This study aims to explore how different forms of "fragile nucleosomes" facilitate RNA Polymerase II (Pol II) transcription along gene bodies in human cells. The authors propose that pan-acetylated, pan-phosphorylated, tailless, and combined acetylated/phosphorylated nucleosomes represent distinct fragile states that enable eFicient transcription elongation. Using CUT&Tagseq, RNA-seq, and DRB inhibition assays in HEK293T cells, they report a genome-wide correlation between histone pan-acetylation/phosphorylation and active Pol II occupancy, concluding that these modifications are essential for Pol II elongation.
Strengths:
(1) The manuscript tackles an important and long-standing question about how Pol II overcomes nucleosomal barriers during transcription.
(2) The use of genome-wide CUT&Tag-seq for multiple histone marks (H3K9ac, H4K12ac, H3S10ph, H4S1ph) alongside active Pol II mapping provides a valuable dataset for the community.
(3) The integration of inhibition (DRB) and recovery experiments oFers insight into the coupling between Pol II activity and chromatin modifications.
(4) The concept of "fragile nucleosomes" as a unifying framework is potentially appealing and could stimulate further mechanistic studies.
Really appreciate the positive or affirmative comments from the reviewer.
Weaknesses:
(1) Misrepresentation of prior literature
The introduction incorrectly describes findings from Bintu et al., 2012. The cited work demonstrated that pan-acetylated or tailless nucleosomes reduce the nucleosomal barrier for Pol II passage, rather than showing no improvement. This misstatement undermines the rationale for the current study and should be corrected to accurately reflect prior evidence.
What we said is according to the original report in the publication (Bintu et al., Cell, 2012). Here is the citation from the report:
Page 739,(Bintu, L. et al., Cell, 2012)(PMID: 23141536)
“Overall transcription through tailless and acetylated nucleosomes is slightly faster than through unmodified nucleosomes (Figure 1C), with crossing times that are generally under 1 min (39.5 ± 5.7 and 45.3 ± 7.6 s, respectively). Both the removal and acetylation of the tails increase eFiciency of NPS passage:71% for tailless nucleosomes and 63% for acetylated nucleosomes (Figures 1C and S1), in agreement with results obtained using bulk assays of transcription (Ujva´ ri et al., 2008).”
We will cite this original sentence in our revision.
(2) Incorrect statement regarding hexasome fragility
The authors claim that hexasome nucleosomes "are not fragile," citing older in vitro work. However, recent studies clearly showed that hexasomes exist in cells (e.g., PMID 35597239) and that they markedly reduce the barrier to Pol II (e.g., PMID 40412388). These studies need to be acknowledged and discussed.
“hexasome” was introduced in the transcription field four decades ago. Later, several groups claimed that “hexasome” is fragile and could be generated in transcription elongation of Pol II. However, their original definition was based on the detection of ~100 bps DNA fragments (MNase resistant) in vivo by Micrococcal nuclease sequencing (MNase-seq), which is the right length to wrap up one hexasome histone subunit (two H3/4 and one H2A/2B) to form the sub-nucleosome of a hexasome. As we should all agree that acetylation or phosphorylation of the tails of histone nucleosomes will lead to the compromised interaction between DNA and histone subunits, which could lead to the intact naïve nucleosome being fragile and easy to disassemble, and easy to access by MNase. Fragile nucleosomes lead to better accessibility of MNase to DNA that wraps around the histone octamer, producing shorter DNA fragments (~100 bps instead of ~140 bps). In this regard, we believe that these ~100 bps fragments are the products of fragile nucleosomes (fragile nucleosome --> hexasome), instead of the other way around (hexasome --> fragile).
Actually, two early reports from Dr. David J. Clark’s group from NIH raised questions about the existence of hexasomes in vivo (PMID: 28157509) (PMID: 25348398).
From the report of PMID:35597239, depletion of INO80 leads to the reduction of “hexasome” for a group of genes, and the distribution of both “nucleosomes” and “hexasomes” with the gene bodies gets fuzzier (less signal to noise). In a recent theoretical model (PMID: 41425263), the corresponding PI found that chromatin remodelers could act as drivers of histone modification complexes to carry out different modifications along gene bodies. The PI found that INO80 could drive NuA3 (a H3 acetyltransferase) to carry out pan-acetylation of H3 and possibly H2B as well in the later runs of transcription of Pol II for a group of genes (SAGA-dependent). It suggests that the depletion of INO80 will affect (reduce) the pan-acetylation of nucleosomes, which leads to the drop of pan-acetylated fragile nucleosomes, subsequently the drop of “hexasomes”. This explains why depletion of INO80 leads to the fuzzier results of either nucleosomes or “hexasomes” in PMID: 35597239. The result of PMID: 35597239 could be a strong piece of evidence to support the model proposed by the corresponding PI (PMID: 41425263).
From a recent report: PMID:40412388, the authors claimed that FACT could bind to nucleosomes to generate “hexasomes”, which are fragile for Pol II to overcome the resistance of nucleosomes. It was well established that FACT enhances the processivity of Pol II in vivo via its chaperonin property. However, the exact working mechanism of FACT still remains ambiguous. A report from Dr. Cramer’s group showed that FACT enhances the elongation of regular genes but works just opposite for pausing-regulated genes (PMID: 38810649). An excellent review by Drs. Tim Formosa and Fred Winston showed that FACT is not required for the survival of a group of differentiated cells (PMID: 33104782), suggesting that FACT is not always required for transcription. It is quite tricky to generate naïve hexasomes in vitro according to early reports from the late Dr. Widom’s group. Most importantly, the new data (the speed of Pol II, the best one on bare DNA is ~27 bps/s) from the report of PMID: 40412388, which is much slower than the speed of Pol II in vivo: ~2.5 kbs/min or ~40 bps/s. From our recovering experiments (Fig. 4C, as mentioned by reviewer #3), in 20 minutes (the period between 10 minutes and 30 minutes, due to the property of CUT-&TAG-seq, of which Pol II still active after cells are collected, there is a big delay of complete stop of Pol II during the procedure of CUT&TAG experiments, so the first period of time does not actually reflect the speed of Pol II, which is ~5 kb/min), all Pol IIs move at a uniform speed of ~2.5 kbs/min in vivo. Interestingly, a recent report from Dr. Shixin Liu’s group (PMID: 41310264) showed that adding SPT4/5 to the transcription system with bare DNA (in vitro), the speed of Pol II reaches ~2.5kbs/min, exactly the same one as we derived in vivo. Similar to the original report (PMID: 23141536), the current report of PMID:40412388 does not mimic the conditions in vivo exactly.
There is an urgent need for a revisit of the current definition of “hexasome”, which is claimed to be fragile and could be generated during the elongation of Pol II in vivo. MNase is an enzyme that only works when the substrate is accessible. In inactive regions of the genome, due to the tight packing of chromatin, MNase is not accessible to individual nucleosomes within the bodies of a gene or upstream of promoters, which is why we only see phased/spacing or clear distribution of nucleosomes at the transcription start sites, but it becomes fuzzy downstream or upstream of promoters. On the other hand, for fragile nucleosomes, the accessibility to MNase should increase dramatically, which leads to the ~100 bps fragments. Based on the uniform rate (2.5 kbs/min) of Pol II for all genes derived from human 293T cells and the similar rate (2.5 kbs/min) of Pol II on bare DNA in vitro, it is unlikely for Pol II to pause in the middle of nucleosomes to generate “hexasomes” to continue during elongation along gene bodies. Similar to RNAPs in bacterial (no nucleosomes) and Archaea (tailless nucleosomes), there should be no resistance when Pol IIs transcribe along all fragile nucleosomes within gene bodies in all eukaryotes, as we characterized in this manuscript.
(3) Inaccurate mechanistic interpretation of DRB
The Results section states that DRB causes a "complete shutdown of transcription initiation (Ser5-CTD phosphorylation)." DRB is primarily a CDK9 inhibitor that blocks Pol II release from promoter-proximal pausing. While recent work (PMID: 40315851) suggests that CDK9 can contribute to CTD Ser5/Ser2 di-phosphorylation, the manuscript's claim of initiation shutdown by DRB should be revised to better align with the literature. The data in Figure 4A indicate that 1 M DRB fully inhibits Pol II activity, yet much higher concentrations (10-100 ) are needed to alter H3K9ac and H4K12ac levels. The authors should address this discrepancy by discussing the differential sensitivities of CTD phosphorylation versus histone modification turnover.
Yes, it was reported that DRB is also an inhibitor of CDK9. However, if the reviewer agrees with us and the current view in the field, the phosphorylation of Ser5-CTD of Pol II is the initiation of transcription for all Pol II-regulated genes in eukaryotes. CDK9 is only required to work on the already phosphorylated Ser5-CTD of Pol II to release the paused Pol II, which only happens in metazoans. From a series of works by us and others: CDK9 is unique in metazoans, required only for the pausing-regulated genes but not for regular genes. We found that CDK9 works on initiated Pol II (Ser5-CTD phosphorylated Pol II) and generates a unique phosphorylation pattern on CTD of Pol II (Ser2ph-Ser2ph-Ser5ph-CTD of Pol II), which is required to recruit JMJD5 (via CID domain) to generate a tailless nucleosome at +1 from TSS to release paused Pol II (PMID: 32747552). Interestingly, the report from Dr. Jesper Svejstrup’s group (PMID: 40315851) showed that CDK9 could generate a unique phosphorylation pattern (Ser2ph-Ser5ph-CTD of Pol II), which is not responsive to the popular 3E10 antibody that recognizes the single Ser2phCTD of Pol II. This interesting result is consistent with our early report showing the unique phosphorylation pattern (Ser2ph-Ser2ph-Ser5ph-CTD of Pol II) is specifically generated by CDK9 in animals, which is not recognized by 3E10 either (PMID: 32747552). Actually, an early report from Dr. Dick Eick’s group (PMID: 26799765) showed the difference in the phosphorylation pattern of the CTD of Pol II between animal cells and yeast cells. We have characterized how CDK9 is released from 7SK snRNP and recruited onto paused Pol II via the coupling of JMJD6 and BRD4 (PMID: 32048991), which was published on eLIFE. It is well established that CDK9 works after CDK7 or CDK8. From our PRO-seq data (Fig. 3) and CUT&TAG-seq data of active Pol II (Fig. 4), adding DRB completely shuts down all genes via inhibiting the initiation of Pol II (generation of Ser5ph-CTD of Pol II). Due to the uniqueness of CDK9 only in metazoans, it is not required for the activation of CDK12 or CDK13 (they are orthologs of CTK1 in yeast), as we demonstrated recently (PMID: 41377501). Instead, we found that CDK11/10 acts as the ortholog of Bur1 kinase from yeast, is essential for the phosphorylation of Spt5, the link of CTD of Pol II, and CDK12 (PMID: 41377501).
(4) Insufficient resolution of genome-wide correlations
Figure 1 presents only low-resolution maps, which are Insufficient o determine whether pan-acetylation and pan-phosphorylation correlate with Pol II at promoters or gene bodies. The authors should provide normalized metagene plots (from TSS to TTS) across different subgroups to visualize modification patterns at higher resolution. In addition, the genome-wide distribution of another histone PTM with a diFerent localization pattern should be included as a negative control.
A popular view in the field is that the majority of genomes are inactive since they do not contain coding RNAs, which are responsible for ~20,000 protein candidates characterized in animals. However, our genomewide characterization using the four histone modification marks, active Pol II, and RNA-seq, shows a different story. Figure 1 shows that most of the human genome of HEK293T is active in producing not only protein-coding RNAs but also non-coding RNAs (the majority of them). We believe that Figure 1 could change our current view of the activity of the entire genome, and should be of great interest to general readers as well as researchers on genomics. Furthermore, it is a basis for Figure 2, which is a zoom-in of Figure 1.
(5) Conceptual framing
The manuscript frequently extrapolates correlative genome-wide data to mechanistic conclusions (e.g., that pan-acetylation/phosphorylation "generate" fragile nucleosomes). Without direct biochemical or structural evidence. Such causality statements should be toned down.
The reviewer is right, we should tone down the strong sentences. However, we believe that our data is strong enough to derive the general conclusion. The reviewer may agree with us that the entire field of transcription and epigenetics has been stagnant in recent decades, but there is an urgent need for fresh ideas to change the current situation. Our novel discoveries, for sure, additional supporting data are needed, should open up a brand new avenue for people to explore. We believe that a new era of transcription will emerge based on our novel discoveries. We hope that this manuscript will attract more people to these topics. As Reviewer #3 pointed out, this story establishes the connection between transcription and epigenetics in the field.
Reviewer #2 (Public review):
Summary:
In this manuscript, the authors use various genomics approaches to examine nucleosome acetylation, phosphorylation, and PolII-CTD phosphorylation marks. The results are synthesized into a hypothesis that 'fragile' nucleosomes are associated with active regions of PolII transcription.
Strengths:
The manuscript contains a lot of genome-wide analyses of histone acetylation, histone phosphorylation, and PolII-CTD phosphorylation.
Weaknesses:
This reviewer's main research expertise is in the in vitro study of transcription and its regulation in purified, reconstituted systems.
Actually, the pioneering work of the establishment of in vitro transcription assays at Dr. Robert Roeder’s group led to numerous groundbreaking discoveries in the transcription field. The contributions of in vitro work in the transcription field are the key for us to explore the complexity of transcription in eukaryotes in the early times and remain important currently.
I am not an expert at the genomics approaches and their interpretation, and overall, I had a very hard time understanding and interpreting the data that are presented in this manuscript. I believe this is due to a problem with the manuscript, in that the presentation of the data is not explained in a way that's understandable and interpretable to a non-expert.
Thanks for your suggestions. You are right, we have problems expressing our ideas clearly in this manuscript, which could confuse. We will make modifications accordingly per your suggestions.
For example:
(1) Figure 1 shows genome-wide distributions of H3K9ac, H4K12ac, Ser2phPolII, mRNA, H3S10ph, and H4S1ph, but does not demonstrate correlations/coupling - it is not clear from these data that pan-acetylation and pan-phosphorylation are coupled with Pol II transcription.
Figure 1 shows the overall distribution of the four major histone modifications, active Pol II, and mRNA genome-wide in human HEK293T cells. It tells general readers that the entire genome is quite active and far more than people predicted that most of the genome is inactive, since just a small portion of the genome expresses coding RNAs (~20,000 in animals). Figure 1 shows that the majority of the genome is active and expresses not only coded mRNA but also non-coding RNAs. After all, it is the basis of Figure 2, which is a zoom-in of Figure 1. However, it is beyond the scope of this manuscript to discuss the non-coding RNAs.
(2) Figure 2 - It's not clear to me what Figure 2 is supposed to be showing.
(A) Needs better explanation - what is the meaning of the labels at the top of the gel lanes?
Figure 2 is a zoom-in for the individual gene, which shows how histone modifications are coupled with Pol II activity on the individual gene. We will give a more detailed explanation of the figure per the reviewer’s suggestions.
(B) This reviewer is not familiar with this technique, its visualization, or its interpretation - more explanation is needed. What is the meaning of the quantitation graphs shown at the top? How were these calculated (what is on the y-axis)?
Good suggestions, we will do some modifications.
(3) To my knowledge, the initial observation of DRB eFects on RNA synthesis also concluded that DRB inhibited initiation of RNA chains (pmid:982026) - this needs to be acknowledged.
Thanks for the reference, which is the first report to show the DRB inhibits initiation of Pol II in vivo. We will cite it in the revision.
(4) Again, Figures 4B, 4C, 5, and 6 are very difficult to understand - what is shown in these heat maps, and what is shown in the quantitation graphs on top?
Thanks for the suggestions, we will give a more detailed description of the Figures.
Reviewer #3 (Public review):
Summary:
Li et al. investigated the prevalence of acetylated and phosphorylated histones (using H3K9ac, H4K12ac, H3S10ph & H4S1ph as representative examples) across the gene body of human HEK293T cells, as well as mapping elongating Pol II and mRNA. They found that histone acetylation and phosphorylation were dominant in gene bodies of actively transcribing genes. Genes with acetylation/phosphorylation restricted to the promoter region were also observed. Furthermore, they investigated and reported a correlation between histone modifications and Pol II activity, finding that inhibition of Pol II activity reduced acetylation/phosphorylation levels, while resuming Pol II activity restored them. The authors then proposed a model in which panacetylation or pan-phosphorylation of histones generates fragile nucleosomes; the first round of transcription is accompanied by panacetylation, while subsequent rounds are accompanied by panphosphorylation.
Strengths:
This study addresses a highly significant problem in gene regulation. The author provided riveting evidence that certain histone acetylation and/or phosphorylation within the gene body is correlated with Pol II transcription. The author furthermore made a compelling case that such transcriptionally correlated histone modification is dynamic and can be regulated by Pol II activity. This work has provided a clearer view of the connection between epigenetics and Pol II transcription.
Thanks for the insightful comments, which are exactly what we want to present in this manuscript.
Weaknesses:
The title of the manuscript, "Fragile nucleosomes are essential for RNA Polymerase II to transcribe in eukaryotes", suggests that fragile nucleosomes lead to transcription. While this study shows a correlation between histone modifications in gene bodies and transcription elongation, a causal relationship between the two has not been demonstrated.
Thanks for the suggestions. What we want to express is that the generation of fragile nucleosomes precedes transcription, or, more specifically, transcription elongation. The corresponding PI wrote a hypothetical model on how pan-acetylation is generated by the coupling of chromatin remodelers and acetyltransferase complexes along gene bodies, in which chromatin remodelers act as drivers to carry acetyltransferases along gene bodies to generate pan-acetylation of nucleosomes (PMID: 41425263). We have a series of work to show how “tailless nucleosomes” at +1 from transcription start sites are generated to release paused Pol II in metazoans (PMID: 28847961) (PMID: 29459673) (PMID: 32747552) (PMID: 32048991). We still do not know how pan-phosphorylation along gene bodies is generated. It should be one of the focuses of our future research.
You can use any NFC card (like a hotel key card, which the author doesn't, but I do, usually return on check-out, it seems) to connect it to an iPhone shortcut. Tap the card and it triggers some action, response or workflow.
Says people use it for playlists and lights too. I don't really buy his examples though. You either have to have an NFC in a fixed location (the 'lights' example I believe therefore), or on the move you'd have to dig out the 'right' NFC from someplace (your already full wallet?) then tap it to the phone. That creates actually _more _ friction. 'I stuck a tag on my desk for ....' something specific like he suggests (a list of articles on AI from past 24h) leads to a range of tags on your desk, like when Amazon suggested you have a bunch of tags, one for each product, to build your shopping list. Didn't happen.
R0:
Review Comments to the Author
Please use the space provided to explain your answers to the questions above. You may also include additional comments for the author, including concerns about dual publication, research ethics, or publication ethics. (Please upload your review as an attachment if it exceeds 20,000 characters)
Reviewer #1: Full Title:
Manuscript full title does not match with the short title. Full title reads "Climate change, livelihoods, gender and violence in Rukiga, Uganda: intersections and pathways". While short tile reads "Climate Change and Gender Based Violence". 'gender based violence' may not necessarily mean the same as 'gender and violence'. Authors should consider revising the wording in the full time if they meant gender based violence.
Abstract:
Inconsistency in FGD size, harmonize to consistent range across the manuscript. Author said "Between April and July 2021, we conducted 28 focus group discussions (FGDs), comprising 6-8 participants each (line 29-30" and in methods author said "From 20 April 2021- 02 July 2021 five focus group discussions (FGDs) were conducted in each community (28 in total) each consisting of four to six participants (lines 135-136)".
clarify the CBV emergent theme. You said "This study, though not originally intended to focus on GBV, examines how it interconnects with poverty, shifting gender roles, alcoholism, environmental stress, and family planning dynamics." (lines 26-28). Consider adding a statement signalling GBV emerged inductively during data colletion and/or analysis.
Methods: Revise the methods section to ensure the study can be reprodcible, and signal reliability of findings.
What study design did you use? not clear
Author said participants were " purposively selected... with the help of community leaders" (lines 140-141). Clearly elaborate the eligibility criteria and how the gatekeepers' influence was mitigated, and proper justification why 28 FGDs and 40 KIIs were sufficient. Talk about saturation, was maximum variation considered? and how?
Results:
Tag all quotes with data source (FGD or KII), sex, age to evidence diversity across the groups.
Make sure all quotes are in clear quotations marks (lines 220-222). fix that for the entire results section and be consistent.
Authors said "When describing their experiences and perceptions of poverty and its associated consequences including poor diets, sickness, and lack of ability to pay for healthcare and transport to medical facilities, most respondents explicitly identified poverty as a direct cause of GBV:" (lines 311-314). Revise the wording on participants' perceptions to avoid implying causality from qualitative data. Check the entire document for this including the abstract lines 36 to 41.
Ethics: Include ethical committee name that gave ethical clearance for the study, also include the reference number and date.
describe safeguardings and referral procedures followed in the study if any.
Conclusion: The concept for this paper is timely and relevant. However several important elements require revision before the manuscript can meet PLOS Global Public Health Standards. Work on the clarity and consistency of the methods (study design was not clearly mentioned, there are several qualitative designs one can use, e.g. phenomenology, case study, etc. what design did you use?). PLOS Global Public Health guidelines on data sharing require that you provide some de-identified data, nevertheless authors stated that they would share data and the justification for that leaves much to be desired.
Reviewer #2: 1. Kindly mention the methodological orientation adopted for the study? 2. Discrepancy between number of participants in FGD mentioned in abstract and methods – (6 – 8 in abstract and 4 – 6 participants in methods)…Kindly make it uniform 3. Additional context on domestic violence and related statistics can be added in study setting 4. Details on steps taken to ensure internal validity/rigor to be mentioned – member checking, reflexivity 5. Give details of the parent project briefly 6. Any conceptual model/framework adopted to guide data generation/analysis? 7. What efforts were taken to address/refer victims of GBV once disclosed? 8. Socio - demographic details of the respondents could be added for better interpretation 9. Key themes are restated multiple times; Many dimensions of GBV (more details on each typology, coping strategies, prevention, etc) not elicited
Reviewer #3: Overall Comments The paper takes a qualitative approach to “examine locally held perceptions of the relationships between climate and livelihood-related stressors and changing dynamcis, including the risk of Rukiga district. Climate change remains a global threat, with many countries and communities within Africa, ill prepared to adapt and mitigate the consequences. The paper is an attempt to paint a picture of climate-related impacts, particularly how gender-based violence, a persistent public health, socioeconomic and development issue is shaped by and influencing social, economic and environmental stressors.
In its current form, the paper need to be strengthened to get it to be sufficiently robust for publication in PLOS Global Public Health. The paper needs to be strengthened in at least three ways:
1) Overall, the paper needs to better contextualise their goal. Authors state in line 115 to 117, that their purpose is to understand locally held perceptions of the relationship between climate and livelihood-related stressors, and in several other sections, indicate make clear that, their original intention was not GBV, but undertook a thematic analysis on the latter. This can be confusing making it difficult for readers to follow. Authors need to clarify their focus – if it is on GBV, they may consider better contextualising their paper, especially in the introduction.
As part of contextualising, authors may consider highlighting the initial primary research focus – this helps to provide context for readers to begin to appreciate how and why GBV took center-stage during the analysis. In doing so, it also provides an opportunity for authors to properly situate their contributions to the literature.
Other minor issues include: • Authors make claims about projected exponential increase (line 51-52) and yet, do not support with any data. Similarly, authors may want to consider revising the sentence, as it appears redundant.
• In line 55-57, it argued “Uganda’s vulnerability to climate change and climate-sensitive disasters is extremely high – it is not immediately clear to readers what this means. By which benchmark or metric are authors assessing Uganda’s vulnerability. Authors may consider revising to ensure clarity (also see lines 108-110 for punctuation issues).
• Lastly, the study takes place in Rukiga District – it would be helpful if authors provided some additional background context. Will the results be different, if the study was conducted in a different district rather than Rukiga? Basically, some discussions of the rationale and/or choice of the selected district is be useful.
2) Overall, authors need to improve their methods by revising and clarifying, some of the sections. For example, under study setting (line 128-130), it is not clear if the concluding sentence is provided additional context for the prior statement. Authors may want to revise for clarity purpose.
I. Reconcile the number of participants for FGDs – in the abstract, authors indicate 6-8 people form a FDG and in line 136, it says “…each consisting of four to six participants,…”. II. For both FGD and KII, it is useful to indicate and/or describe the demographic/characteristics of the people participating in the study (Perhaps, authors could outline their demographics by sex and age, and any other stratifier in the results section in a tabular format. How were participants selected, especially among the FGD participants? III. On ethics statement, although the data emanates from key informants and community members, authors do not indicate whether they sought ethnical approval for their study. If ethics was obtained, it is useful to indicate so. IV. Regarding data collection, lines 172 to 173, authors indicate that “discrepancies in the coding were re-examined…”. It useful to explain how the independent assessor resolved discrepancies and reached consensus. V. In the data collection section (line 155 to 157), authors indicate that they “undertook a specific analysis of what participants said about GBV”. However, in the results, it is often not clear, the specific thematic issues or results arising from this analysis. Related to this and linked to the analysis, it is not clear to readers how the two main clusters (line 188 to 191) link to GBV. While lines 193 to 212, describe nature of GBV, for the most parts (for example, line 213 to 308), it is difficult to follow how GBV is an interconnector in the results being discussed. At times, it difficult to see, where the analysis departs from its original intended goal. Were the issues around climate change and environment among others emergent from the data?
3) Overall, the results section outlines some very interesting insights. However, I do feel this section can be deepened. In many instances, the narratives are often not immediately supported by the relevant quotes, linking to GBV. • In line 230 – 323, authors reflect that the disruption to livelihoods leading to family instabilities and conflict, demonstrate how GBV is triggered. This assumption is challenging to sustain, considering that “unrest in families” and not having “peace in a home” do not necessarily connote GBV. Similar reflections are presented at line 306 (“...they both resort to quarrels…”), lines 316 to 320 (…start quarrelling and fighting…”) and (“…you fight with the woman”). • Although authors indicate these are “euphemisms for GBV” (line 208) that participants use – without critical analysis, we risk painting a picture that may not be correct. For example, will readers be correct to assume, that in Ugandan context, such referencs always mean GBV?. To avoid readers assuming without appropriate understanding of context, authors may consider, making explicit any additional nunaces related to the quotations or contexts for this pharses, to clarify and make the links to GBV much clearer.
Minor • Line 199 – please clarify how and why unintended pregnancies is considered a form of GBV • Line 208 to 209 – revise sentence – it is not clear what authors mean by throughout their experiences and perceptions • Line 211 – “GBV was raised during the discussions of a wide range of factors” – perhaps, useful to outline the contexts which GBV was raised
Author response:
The following is the authors’ response to the original reviews.
Public Reviews:
Reviewer #1 (Public Review):
Summary:
Zhou and colleagues developed a computational model of replay that heavily builds on cognitive models of memory in context (e.g., the context-maintenance and retrieval model), which have been successfully used to explain memory phenomena in the past. Their model produces results that mirror previous empirical findings in rodents and offers a new computational framework for thinking about replay.
Strengths:
The model is compelling and seems to explain a number of findings from the rodent literature. It is commendable that the authors implement commonly used algorithms from wakefulness to model sleep/rest, thereby linking wake and sleep phenomena in a parsimonious way. Additionally, the manuscript's comprehensive perspective on replay, bridging humans and non-human animals, enhanced its theoretical contribution.
Weaknesses:
This reviewer is not a computational neuroscientist by training, so some comments may stem from misunderstandings. I hope the authors would see those instances as opportunities to clarify their findings for broader audiences.
(1) The model predicts that temporally close items will be co-reactivated, yet evidence from humans suggests that temporal context doesn't guide sleep benefits (instead, semantic connections seem to be of more importance; Liu and Ranganath 2021, Schechtman et al 2023). Could these findings be reconciled with the model or is this a limitation of the current framework?
We appreciate the encouragement to discuss this connection. Our framework can accommodate semantic associations as determinants of sleep-dependent consolidation, which can in principle outweigh temporal associations. Indeed, prior models in this lineage have extensively simulated how semantic associations support encoding and retrieval alongside temporal associations. It would therefore be straightforward to extend our model to simulate how semantic associations guide sleep benefits, and to compare their contribution against that conferred by temporal associations across different experimental paradigms. In the revised manuscript, we have added a discussion of how our framework may simulate the role of semantic associations in sleep-dependent consolidation.
“Several recent studies have argued for dominance of semantic associations over temporal associations in the process of human sleep-dependent consolidation (Schechtman et al., 2023; Liu and Ranganath 2021; Sherman et al., 2025), with one study observing no role at all for temporal associations (Schechtman et al., 2023). At first glance, these findings appear in tension with our model, where temporal associations drive offline consolidation. Indeed, prior models have accounted for these findings by suppressing temporal context during sleep (Liu and Ranganath 2024; Sherman et al., 2025). However, earlier models in the CMR lineage have successfully captured the joint contributions of semantic and temporal associations to encoding and retrieval (Polyn et al., 2009), and these processes could extend naturally to offline replay. In a paradigm where semantic associations are especially salient during awake learning, the model could weight these associations more and account for greater co-reactivation and sleep-dependent memory benefits for semantically related than temporally related items. Consistent with this idea, Schechtman et al. (2023) speculated that their null temporal effects likely reflected the task’s emphasis on semantic associations. When temporal associations are more salient and task-relevant, sleep-related benefits for temporally contiguous items are more likely to emerge (e.g., Drosopoulos et al., 2007; King et al., 2017).”
The reviewer’s comment points to fruitful directions for future work that could employ our framework to dissect the relative contributions of semantic and temporal associations to memory consolidation.
(2) During replay, the model is set so that the next reactivated item is sampled without replacement (i.e., the model cannot get "stuck" on a single item). I'm not sure what the biological backing behind this is and why the brain can't reactivate the same item consistently.
Furthermore, I'm afraid that such a rule may artificially generate sequential reactivation of items regardless of wake training. Could the authors explain this better or show that this isn't the case?
We appreciate the opportunity to clarify this aspect of the model. We first note that this mechanism has long been a fundamental component of this class of models (Howard & Kahana 2002). Many classic memory models (Brown et al., 2000; Burgess & Hitch, 1991; Lewandowsky & Murdock 1989) incorporate response suppression, in which activated items are temporarily inhibited. The simplest implementation, which we use here, removes activated items from the pool of candidate items. Alternative implementations achieve this through transient inhibition, often conceptualized as neuronal fatigue (Burgess & Hitch, 1991; Grossberg 1978). Our model adopts a similar perspective, interpreting this mechanism as mimicking a brief refractory period that renders reactivated neurons unlikely to fire again within a short physiological event such as a sharp-wave ripple. Importantly, this approach does not generate spurious sequences. Instead, the model’s ability to preserve the structure of wake experience during replay depends entirely on the learned associations between items (without these associations, item order would be random). Similar assumptions are also common in models of replay. For example, reinforcement learning models of replay incorporate mechanisms such as inhibition to prevent repeated reactivations (e.g., Diekmann & Cheng, 2023) or prioritize reactivation based on ranking to limit items to a single replay (e.g., Mattar & Daw, 2018). We now discuss these points in the section titled “A context model of memory replay”
“This mechanism of sampling without replacement, akin to response suppression in established context memory models (Howard & Kahana 2002), could be implemented by neuronal fatigue or refractory dynamics (Burgess & Hitch, 1991; Grossberg 1978). Non-repetition during reactivation is also a common assumption in replay models that regulate reactivation through inhibition or prioritization (Diekmann & Cheng 2023; Mattar & Daw 2018; Singh et al., 2022).”
(3) If I understand correctly, there are two ways in which novelty (i.e., less exposure) is accounted for in the model. The first and more talked about is the suppression mechanism (lines 639-646). The second is a change in learning rates (lines 593-595). It's unclear to me why both procedures are needed, how they differ, and whether these are two different mechanisms that the model implements. Also, since the authors controlled the extent to which each item was experienced during wakefulness, it's not entirely clear to me which of the simulations manipulated novelty on an individual item level, as described in lines 593-595 (if any).
We agree that these mechanisms and their relationships would benefit from clarification. As noted, novelty influences learning through two distinct mechanisms. First, the suppression mechanism is essential for capturing the inverse relationship between the amount of wake experience and the frequency of replay, as observed in several studies. This mechanism ensures that items with high wake activity are less likely to dominate replay. Second, the decrease in learning rates with repetition is crucial for preserving the stochasticity of replay. Without this mechanism, the model would increase weights linearly, leading to an exponential increase in the probability of successive wake items being reactivated back-to-back due to the use of a softmax choice rule. This would result in deterministic replay patterns, which are inconsistent with experimental observations.
We have revised the Methods section to explicitly distinguish these two mechanisms:
“This experience-dependent suppression mechanism is distinct from the reduction of learning rates through repetition; it does not modulate the update of memory associations but exclusively governs which items are most likely to initiate replay.”
We have also clarified our rationale for including a learning rate reduction mechanism:
“The reduction in learning rates with repetition is important for maintaining a degree of stochasticity in the model’s replay during task repetition, since linearly increasing weights would, through the softmax choice rule, exponentially amplify differences in item reactivation probabilities, sharply reducing variability in replay.”
Finally, we now specify exactly where the learning-rate reduction applied, namely in simulations where sequences are repeated across multiple sessions:
“In this simulation, the learning rates progressively decrease across sessions, as described above.“
As to the first mechanism - experience-based suppression - I find it challenging to think of a biological mechanism that would achieve this and is selectively activated immediately before sleep (somehow anticipating its onset). In fact, the prominent synaptic homeostasis hypothesis suggests that such suppression, at least on a synaptic level, is exactly what sleep itself does (i.e., prune or weaken synapses that were enhanced due to learning during the day). This begs the question of whether certain sleep stages (or ultradian cycles) may be involved in pruning, whereas others leverage its results for reactivation (e.g., a sequential hypothesis; Rasch & Born, 2013). That could be a compelling synthesis of this literature. Regardless of whether the authors agree, I believe that this point is a major caveat to the current model. It is addressed in the discussion, but perhaps it would be beneficial to explicitly state to what extent the results rely on the assumption of a pre-sleep suppression mechanism.
We appreciate the reviewer raising this important point. Unlike the mechanism proposed by the synaptic homeostasis hypothesis, the suppression mechanism in our model does not suppress items based on synapse strength, nor does it modify synaptic weights. Instead, it determines the level of suppression for each item based on activity during awake experience. The brain could implement such a mechanism by tagging each item according to its activity level during wakefulness. During subsequent consolidation, the initial reactivation of an item during replay would reflect this tag, influencing how easily it can be reactivated.
A related hypothesis has been proposed in recent work, suggesting that replay avoids recently active trajectories due to spike frequency adaptation in neurons (Mallory et al., 2024). Similarly, the suppression mechanism in our model is critical for explaining the observed negative relationship between the amount of recent wake experience and the degree of replay.
We discuss the biological plausibility of this mechanism and its relationship with existing models in the Introduction. In the section titled “The influence of experience”, we have added the following:
“Our model implements an activity‑dependent suppression mechanism that, at the onset of each offline replay event, assigns each item a selection probability inversely proportional to its activation during preceding wakefulness. The brain could implement this by tagging each memory trace in proportion to its recent activation; during consolidation, that tag would then regulate starting replay probability, making highly active items less likely to be reactivated. A recent paper found that replay avoids recently traversed trajectories through awake spike‑frequency adaptation (Mallory et al., 2025), which could implement this kind of mechanism. In our simulations, this suppression is essential for capturing the inverse relationship between replay frequency and prior experience. Note that, unlike the synaptic homeostasis hypothesis (Tononi & Cirelli 2006), which proposes that the brain globally downscales synaptic weights during sleep, this mechanism leaves synaptic weights unchanged and instead biases the selection process during replay.”
(4) As the manuscript mentions, the only difference between sleep and wake in the model is the initial conditions (a0). This is an obvious simplification, especially given the last author's recent models discussing the very different roles of REM vs NREM. Could the authors suggest how different sleep stages may relate to the model or how it could be developed to interact with other successful models such as the ones the last author has developed (e.g., C-HORSE)?
We appreciate the encouragement to comment on the roles of different sleep stages in the manuscript, especially since, as noted, the lab is very interested in this and has explored it in other work. We chose to focus on NREM in this work because the vast majority of electrophysiological studies of sleep replay have identified these events during NREM. In addition, our lab’s theory of the role of REM (Singh et al., 2022, PNAS) is that it is a time for the neocortex to replay remote memories, in complement to the more recent memories replayed during NREM. The experiments we simulate all involve recent memories. Indeed, our view is that part of the reason that there is so little data on REM replay may be that experimenters are almost always looking for traces of recent memories (for good practical and technical reasons).
Regarding the simplicity of the distinction between simulated wake and sleep replay, we view it as an asset of the model that it can account for many of the different characteristics of awake and NREM replay with very simple assumptions about differences in the initial conditions. There are of course many other differences between the states that could be relevant to the impact of replay, but the current target empirical data did not necessitate us taking those into account. This allows us to argue that differences in initial conditions should play a substantial role in an account of the differences between wake and sleep replay.
We have added discussion of these ideas and how they might be incorporated into future versions of the model in the Discussion section:
“Our current simulations have focused on NREM, since the vast majority of electrophysiological studies of sleep replay have identified replay events in this stage. We have proposed in other work that replay during REM sleep may provide a complementary role to NREM sleep, allowing neocortical areas to reinstate remote, already-consolidated memories that need to be integrated with the memories that were recently encoded in the hippocampus and replayed during NREM (Singh et al., 2022). An extension of our model could undertake this kind of continual learning setup, where the student but not teacher network retains remote memories, and the driver of replay alternates between hippocampus (NREM) and cortex (REM) over the course of a night of simulated sleep. Other differences between stages of sleep and between sleep and wake states are likely to become important for a full account of how replay impacts memory. Our current model parsimoniously explains a range of differences between awake and sleep replay by assuming simple differences in initial conditions, but we expect many more characteristics of these states (e.g., neural activity levels, oscillatory profiles, neurotransmitter levels, etc.) will be useful to incorporate in the future.”
Finally, I wonder how the model would explain findings (including the authors') showing a preference for reactivation of weaker memories. The literature seems to suggest that it isn't just a matter of novelty or exposure, but encoding strength. Can the model explain this? Or would it require additional assumptions or some mechanism for selective endogenous reactivation during sleep and rest?
We appreciate the encouragement to discuss this, as we do think the model could explain findings showing a preference for reactivation of weaker memories, as in Schapiro et al. (2018). In our framework, memory strength is reflected in the magnitude of each memory’s associated synaptic weights, so that stronger memories yield higher retrieved‑context activity during wake encoding than weaker ones. Because the model’s suppression mechanism reduces an item’s replay probability in proportion to its retrieved‑context activity, items with larger weights (strong memories) are more heavily suppressed at the onset of replay, while those with smaller weights (weaker memories) receive less suppression. When items have matched reward exposure, this dynamic would bias offline replay toward weaker memories, therefore preferentially reactivating weak memories.
In the section titled “The influence of experience”, we updated a sentence to discuss this idea more explicitly:
“Such a suppression mechanism may be adaptive, allowing replay to benefit not only the most recently or strongly encoded items but also to provide opportunities for the consolidation of weaker or older memories, consistent with empirical evidence (e.g., Schapiro et al. 2018; Yu et al., 2024).”
(5) Lines 186-200 - Perhaps I'm misunderstanding, but wouldn't it be trivial that an external cue at the end-item of Figure 7a would result in backward replay, simply because there is no potential for forward replay for sequences starting at the last item (there simply aren't any subsequent items)? The opposite is true, of course, for the first-item replay, which can't go backward. More generally, my understanding of the literature on forward vs backward replay is that neither is linked to the rodent's location. Both commonly happen at a resting station that is further away from the track. It seems as though the model's result may not hold if replay occurs away from the track (i.e. if a0 would be equal for both pre- and post-run).
In studies where animals run back and forth on a linear track, replay events are decoded separately for left and right runs, identifying both forward and reverse sequences for each direction, for example using direction-specific place cell sequence templates. Accordingly, in our simulation of, e.g., Ambrose et al. (2016), we use two independent sequences, one for left runs and one for right runs (an approach that has been taken in prior replay modeling work). Crucially, our model assumes a context reset between running episodes, preventing the final item of one traversal from acquiring contextual associations with the first item of the next. As a result, learning in the two sequences remains independent, and when an external cue is presented at the track’s end, replay predominantly unfolds in the backward direction, only occasionally producing forward segments when the cue briefly reactivates an earlier sequence item before proceeding forward.
We added a note to the section titled “The context-dependency of memory replay” to clarify this:
“In our model, these patterns are identical to those in our simulation of Ambrose et al. (2016), which uses two independent sequences to mimic the two run directions. This is because the drifting context resets before each run sequence is encoded, with the pause between runs acting as an event boundary that prevents the final item of one traversal from associating with the first item of the next, thereby keeping learning in each direction independent.”
To our knowledge, no study has observed a similar asymmetry when animals are fully removed from the track, although both types of replay can be observed when animals are away from the track. For example, Gupta et al. (2010) demonstrated that when animals replay trajectories far from their current location, the ratio of forward vs. backward replay appears more balanced. We now highlight this result in the manuscript and explain how it aligns with the predictions of our model:
“For example, in tasks where the goal is positioned in the middle of an arm rather than at its end, CMR-replay predicts a more balanced ratio of forward and reverse replay, whereas the EVB model still predicts a dominance of reverse replay due to backward gain propagation from the reward. This contrast aligns with empirical findings showing that when the goal is located in the middle of an arm, replay events are more evenly split between forward and reverse directions (Gupta et al., 2010), whereas placing the goal at the end of a track produces a stronger bias toward reverse replay (Diba & Buzsaki 2007).”
Although no studies, to our knowledge, have observed a context-dependent asymmetry between forward and backward replay when the animal is away from the track, our model does posit conditions under which it could. Specifically, it predicts that deliberation on a specific memory, such as during planning, could generate an internal context input that biases replay: actively recalling the first item of a sequence may favor forward replay, while thinking about the last item may promote backward replay, even when the individual is physically distant from the track.
We now discuss this prediction in the section titled “The context-dependency of memory replay”:
“Our model also predicts that deliberation on a specific memory, such as during planning, could serve to elicit an internal context cue that biases replay: actively recalling the first item of a sequence may favor forward replay, while thinking about the last item may promote backward replay, even when the individual is physically distant from the track. While not explored here, this mechanism presents a potential avenue for future modeling and empirical work.”
(6) The manuscript describes a study by Bendor & Wilson (2012) and tightly mimics their results. However, notably, that study did not find triggered replay immediately following sound presentation, but rather a general bias toward reactivation of the cued sequence over longer stretches of time. In other words, it seems that the model's results don't fully mirror the empirical results. One idea that came to mind is that perhaps it is the R/L context - not the first R/L item - that is cued in this study. This is in line with other TMR studies showing what may be seen as contextual reactivation. If the authors think that such a simulation may better mirror the empirical results, I encourage them to try. If not, however, this limitation should be discussed.
Although our model predicts that replay is triggered immediately by the sound cue, it also predicts a sustained bias toward the cued sequence. Replay in our model unfolds across the rest phase as multiple successive events, so the bias observed in our sleep simulations indeed reflects a prolonged preference for the cued sequence.
We now discuss this issue, acknowledging the discrepancy:
“Bendor and Wilson (2012) found that sound cues during sleep did not trigger immediate replay, but instead biased reactivation toward the cued sequence over an extended period of time. While the model does exhibit some replay triggered immediately by the cue, it also captures the sustained bias toward the cued sequence over an extended period.”
Second, within this framework, context is modeled as a weighted average of the features associated with items. As a result, cueing the model with the first R/L item produces qualitatively similar outcomes as cueing it with a more extended R/L cue that incorporates features of additional items. This is because both approaches ultimately use context features unique to the two sides.
(7) There is some discussion about replay's benefit to memory. One point of interest could be whether this benefit changes between wake and sleep. Relatedly, it would be interesting to see whether the proportion of forward replay, backward replay, or both correlated with memory benefits. I encourage the authors to extend the section on the function of replay and explore these questions.
We thank the reviewer for this suggestion. Regarding differences in the contribution of wake and sleep to memory, our current simulations predict that compared to rest in the task environment, sleep is less biased toward initiating replay at specific items, leading to a more uniform benefit across all memories. Regarding the contributions of forward and backward replay, our model predicts that both strengthen bidirectional associations between items and contexts, benefiting memory in qualitatively similar ways. Furthermore, we suggest that the offline learning captured by our teacher-student simulations reflects consolidation processes that are specific to sleep.
We have expanded the section titled “The influence of experience” to discuss these predictions of the model:
“The results outlined above arise from the model's assumption that replay strengthens bidirectional associations between items and contexts to benefit memory. This assumption leads to several predictions about differences across replay types. First, the model predicts that sleep yields different memory benefits compared to rest in the task environment: Sleep is less biased toward initiating replay at specific items, resulting in a more uniform benefit across all memories. Second, the model predicts that forward and backward replay contribute to memory in qualitatively similar ways but tend to benefit different memories. This divergence arises because forward and backward replay exhibit distinct item preferences, with backward replay being more likely to include rewarded items, thereby preferentially benefiting those memories.”
We also updated the “The function of replay” section to include our teacher-student speculation:
“We speculate that the offline learning observed in these simulations corresponds to consolidation processes that operate specifically during sleep, when hippocampal-neocortical dynamics are especially tightly coupled (Klinzing et al., 2019).”
(8) Replay has been mostly studied in rodents, with few exceptions, whereas CMR and similar models have mostly been used in humans. Although replay is considered a good model of episodic memory, it is still limited due to limited findings of sequential replay in humans and its reliance on very structured and inherently autocorrelated items (i.e., place fields). I'm wondering if the authors could speak to the implications of those limitations on the generalizability of their model. Relatedly, I wonder if the model could or does lead to generalization to some extent in a way that would align with the complementary learning systems framework.
We appreciate these insightful comments. Traditionally, replay studies have focused on spatial tasks with autocorrelated item representations (e.g., place fields). However, an increasing number of human studies have demonstrated sequential replay using stimuli with distinct, unrelated representations. Our model is designed to accommodate both scenarios. In our current simulations, we employ orthogonal item representations while leveraging a shared, temporally autocorrelated context to link successive items. We anticipate that incorporating autocorrelated item representations would further enhance sequence memory by increasing the similarity between successive contexts. Overall, we believe that the model generalizes across a broad range of experimental settings, regardless of the degree of autocorrelation between items. Moreover, the underlying framework has been successfully applied to explain sequential memory in both spatial domains, explaining place cell firing properties (e.g., Howard et al., 2004), and in non-spatial domains, such as free recall experiments where items are arbitrarily related.
In the section titled “A context model of memory replay”, we added this comment to address this point:
“Its contiguity bias stems from its use of shared, temporally autocorrelated context to link successive items, despite the orthogonal nature of individual item representations. This bias would be even stronger if items had overlapping representations, as observed in place fields.”
Since CMR-replay learns distributed context representations where overlap across context vectors captures associative structure, and replay helps strengthen that overlap, this could indeed be viewed as consonant with complementary learning systems integration processes.
Reviewer #2 (Public Review):
This manuscript proposes a model of replay that focuses on the relation between an item and its context, without considering the value of the item. The model simulates awake learning, awake replay, and sleep replay, and demonstrates parallels between memory phenomenon driven by encoding strength, replay of sequence learning, and activation of nearest neighbor to infer causality. There is some discussion of the importance of suppression/inhibition to reduce activation of only dominant memories to be replayed, potentially boosting memories that are weakly encoded. Very nice replications of several key replay findings including the effect of reward and remote replay, demonstrating the equally salient cue of context for offline memory consolidation.
I have no suggestions for the main body of the study, including methods and simulations, as the work is comprehensive, transparent, and well-described. However, I would like to understand how the CMRreplay model fits with the current understanding of the importance of excitation vs inhibition, remembering vs forgetting, activation vs deactivation, strengthening vs elimination of synapses, and even NREM vs REM as Schapiro has modeled. There seems to be a strong association with the efforts of the model to instantiate a memory as well as how that reinstantiation changes across time. But that is not all this is to consolidation. The specific roles of different brain states and how they might change replay is also an important consideration.
We are gratified that the reviewer appreciated the work, and we agree that the paper would benefit from comment on the connections to these other features of consolidation.
Excitation vs. inhibition: CMR-replay does not model variations in the excitation-inhibition balance across brain states (as in other models, e.g., Chenkov et al., 2017), since it does not include inhibitory connections. However, we posit that the experience-dependent suppression mechanism in the model might, in the brain, involve inhibitory processes. Supporting this idea, studies have observed increased inhibition with task repetition (Berners-Lee et al., 2022). We hypothesize that such mechanisms may underlie the observed inverse relationship between task experience and replay frequency in many studies. We discuss this in the section titled “A context model of memory replay”:
“The proposal that a suppression mechanism plays a role in replay aligns with models that regulate place cell reactivation via inhibition (Malerba et al., 2016) and with empirical observations of increased hippocampal inhibitory interneuron activity with experience (Berners-Lee et al., 2022). Our model assumes the presence of such inhibitory mechanisms but does not explicitly model them.”
Remembering/forgetting, activation/deactivation, and strengthening/elimination of synapses: The model does not simulate synaptic weight reduction or pruning, so it does not forget memories through the weakening of associated weights. However, forgetting can occur when a memory is replayed less frequently than others, leading to reduced activation of that memory compared to its competitors during context-driven retrieval. In the Discussion section, we acknowledge that a biologically implausible aspect of our model is that it implements only synaptic strengthening:
“Aspects of the model, such as its lack of regulation of the cumulative positive weight changes that can accrue through repeated replay, are biologically implausible (as biological learning results in both increases and decreases in synaptic weights) and limit the ability to engage with certain forms of low level neural data (e.g., changes in spine density over sleep periods; de Vivo et al., 2017; Maret et al., 2011). It will be useful for future work to explore model variants with more elements of biological plausibility.” Different brain states and NREM vs REM: Reviewer 1 also raised this important issue (see above). We have added the following thoughts on differences between these states and the relationship to our prior work to the Discussion section:
“Our current simulations have focused on NREM, since the vast majority of electrophysiological studies of sleep replay have identified replay events in this stage. We have proposed in other work that replay during REM sleep may provide a complementary role to NREM sleep, allowing neocortical areas to reinstate remote, already-consolidated memories that need to be integrated with the memories that were recently encoded in the hippocampus and replayed during NREM (Singh et al., 2022). An extension of our model could undertake this kind of continual learning setup, where the student but not teacher network retains remote memories, and the driver of replay alternates between hippocampus (NREM) and cortex (REM) over the course of a night of simulated sleep. Other differences between stages of sleep and between sleep and wake states are likely to become important for a full account of how replay impacts memory. Our current model parsimoniously explains a range of differences between awake and sleep replay by assuming simple differences in initial conditions, but we expect many more characteristics of these states (e.g., neural activity levels, oscillatory profiles, neurotransmitter levels, etc.) will be useful to incorporate in the future.”
We hope these points clarify the model’s scope and its potential for future extensions.
Do the authors suggest that these replay systems are more universal to offline processes beyond episodic memory? What about procedural memories and working memory?
We thank the reviewer for raising this important question. We have clarified in the manuscript:
“We focus on the model as a formulation of hippocampal replay, capturing how the hippocampus may replay past experiences through simple and interpretable mechanisms.”
With respect to other forms of memory, we now note that:
“This motor memory simulation using a model of hippocampal replay is consistent with evidence that hippocampal replay can contribute to consolidating memories that are not hippocampally dependent at encoding (Schapiro et al., 2019; Sawangjit et al., 2018). It is possible that replay in other, more domain-specific areas could also contribute (Eichenlaub et al., 2020).”
Though this is not a biophysical model per se, can the authors speak to the neuromodulatory milieus that give rise to the different types of replay?
Our work aligns with the perspective proposed by Hasselmo (1999), which suggests that waking and sleep states differ in the degree to which hippocampal activity is driven by external inputs. Specifically, high acetylcholine levels during waking bias activity to flow into the hippocampus, while low acetylcholine levels during sleep allow hippocampal activity to influence other brain regions. Consistent with this view, our model posits that wake replay is more biased toward items associated with the current resting location due to the presence of external input during waking states. In the Discussion section, we have added a comment on this point:
“Our view aligns with the theory proposed by Hasselmo (1999), which suggests that the degree of hippocampal activity driven by external inputs differs between waking and sleep states: High acetylcholine levels during wakefulness bias activity into the hippocampus, while low acetylcholine levels during slow-wave sleep allow hippocampal activity to influence other brain regions.”
Reviewer #3 (Public Review):
In this manuscript, Zhou et al. present a computational model of memory replay. Their model (CMR-replay) draws from temporal context models of human memory (e.g., TCM, CMR) and claims replay may be another instance of a context-guided memory process. During awake learning, CMR replay (like its predecessors) encodes items alongside a drifting mental context that maintains a recency-weighted history of recently encoded contexts/items. In this way, the presently encoded item becomes associated with other recently learned items via their shared context representation - giving rise to typical effects in recall such as primacy, recency, and contiguity. Unlike its predecessors, CMR-replay has built-in replay periods. These replay periods are designed to approximate sleep or wakeful quiescence, in which an item is spontaneously reactivated, causing a subsequent cascade of item-context reactivations that further update the model's item-context associations.
Using this model of replay, Zhou et al. were able to reproduce a variety of empirical findings in the replay literature: e.g., greater forward replay at the beginning of a track and more backward replay at the end; more replay for rewarded events; the occurrence of remote replay; reduced replay for repeated items, etc. Furthermore, the model diverges considerably (in implementation and predictions) from other prominent models of replay that, instead, emphasize replay as a way of predicting value from a reinforcement learning framing (i.e., EVB, expected value backup).
Overall, I found the manuscript clear and easy to follow, despite not being a computational modeller myself. (Which is pretty commendable, I'd say). The model also was effective at capturing several important empirical results from the replay literature while relying on a concise set of mechanisms - which will have implications for subsequent theory-building in the field.
With respect to weaknesses, additional details for some of the methods and results would help the readers better evaluate the data presented here (e.g., explicitly defining how the various 'proportion of replay' DVs were calculated).
For example, for many of the simulations, the y-axis scale differs from the empirical data despite using comparable units, like the proportion of replay events (e.g., Figures 1B and C). Presumably, this was done to emphasize the similarity between the empirical and model data. But, as a reader, I often found myself doing the mental manipulation myself anyway to better evaluate how the model compared to the empirical data. Please consider using comparable y-axis ranges across empirical and simulated data wherever possible.
We appreciate this point. As in many replay modeling studies, our primary goal is to provide a qualitative fit that demonstrates the general direction of differences between our model and empirical data, without engaging in detailed parameter fitting for a precise quantitative fit. Still, we agree that where possible, it is useful to better match the axes. We have updated figures 2B and 2C so that the y-axis scales are more directly comparable between the empirical and simulated data.
In a similar vein to the above point, while the DVs in the simulations/empirical data made intuitive sense, I wasn't always sure precisely how they were calculated. Consider the "proportion of replay" in Figure 1A. In the Methods (perhaps under Task Simulations), it should specify exactly how this proportion was calculated (e.g., proportions of all replay events, both forwards and backwards, combining across all simulations from Pre- and Post-run rest periods). In many of the examples, the proportions seem to possibly sum to 1 (e.g., Figure 1A), but in other cases, this doesn't seem to be true (e.g., Figure 3A). More clarity here is critical to help readers evaluate these data. Furthermore, sometimes the labels themselves are not the most informative. For example, in Figure 1A, the y-axis is "Proportion of replay" and in 1C it is the "Proportion of events". I presumed those were the same thing - the proportion of replay events - but it would be best if the axis labels were consistent across figures in this manuscript when they reflect the same DV.
We appreciate these useful suggestions. We have revised the Methods section to explain in detail how DVs are calculated for each simulation. The revisions clarify the differences between related measures, such as those shown in Figures 1A and 1C, so that readers can more easily see how the DVs are defined and interpreted in each case.
Reviewer #4/Reviewing Editor (Public Review):
Summary:
With their 'CMR-replay' model, Zhou et al. demonstrate that the use of spontaneous neural cascades in a context-maintenance and retrieval (CMR) model significantly expands the range of captured memory phenomena.
Strengths:
The proposed model compellingly outperforms its CMR predecessor and, thus, makes important strides towards understanding the empirical memory literature, as well as highlighting a cognitive function of replay.
Weaknesses:
Competing accounts of replay are acknowledged but there are no formal comparisons and only CMR-replay predictions are visualized. Indeed, other than the CMR model, only one alternative account is given serious consideration: A variant of the 'Dyna-replay' architecture, originally developed in the machine learning literature (Sutton, 1990; Moore & Atkeson, 1993) and modified by Mattar et al (2018) such that previously experienced event-sequences get replayed based on their relevance to future gain. Mattar et al acknowledged that a realistic Dyna-replay mechanism would require a learned representation of transitions between perceptual and motor events, i.e., a 'cognitive map'. While Zhou et al. note that the CMR-replay model might provide such a complementary mechanism, they emphasize that their account captures replay characteristics that Dyna-replay does not (though it is unclear to what extent the reverse is also true).
We thank the reviewer for these thoughtful comments and appreciate the opportunity to clarify our approach. Our goal in this work is to contrast two dominant perspectives in replay research: replay as a mechanism for learning reward predictions and replay as a process for memory consolidation. These models were chosen as representatives of their classes of models because they use simple and interpretable mechanisms that can simulate a wide range of replay phenomena, making them ideal for contrasting these two perspectives.
Although we implemented CMR-replay as a straightforward example of the memory-focused view, we believe the proposed mechanisms could be extended to other architectures, such as recurrent neural networks, to produce similar results. We now discuss this possibility in the revised manuscript (see below). However, given our primary goal of providing a broad and qualitative contrast of these two broad perspectives, we decided not to undertake simulations with additional individual models for this paper.
Regarding the Mattar & Daw model, it is true that a mechanistic implementation would require a mechanism that avoids precomputing priorities before replay. However, the "need" component of their model already incorporates learned expectations of transitions between actions and events. Thus, the model's limitations are not due to the absence of a cognitive map.
In contrast, while CMR-replay also accumulates memory associations that reflect experienced transitions among events, it generates several qualitatively distinct predictions compared to the Mattar & Daw model. As we note in the manuscript, these distinctions make CMR-replay a contrasting rather than complementary perspective.
Another important consideration, however, is how CMR replay compares to alternative mechanistic accounts of cognitive maps. For example, Recurrent Neural Networks are adept at detecting spatial and temporal dependencies in sequential input; these networks are being increasingly used to capture psychological and neuroscientific data (e.g., Zhang et al, 2020; Spoerer et al, 2020), including hippocampal replay specifically (Haga & Fukai, 2018). Another relevant framework is provided by Associative Learning Theory, in which bidirectional associations between static and transient stimulus elements are commonly used to explain contextual and cue-based phenomena, including associative retrieval of absent events (McLaren et al, 1989; Harris, 2006; Kokkola et al, 2019). Without proper integration with these modeling approaches, it is difficult to gauge the innovation and significance of CMR-replay, particularly since the model is applied post hoc to the relatively narrow domain of rodent maze navigation.
First, we would like to clarify our principal aim in this work is to characterize the nature of replay, rather than to model cognitive maps per se. Accordingly, CMR‑replay is not designed to simulate head‐direction signals, perform path integration, or explain the spatial firing properties of neurons during navigation. Instead, it focuses squarely on sequential replay phenomena, simulating classic rodent maze reactivation studies and human sequence‐learning tasks. These simulations span a broad array of replay experimental paradigms to ensure extensive coverage of the replay findings reported across the literature. As such, the contribution of this work is in explaining the mechanisms and functional roles of replay, and demonstrating that a model that employs simple and interpretable memory mechanisms not only explains replay phenomena traditionally interpreted through a value-based lens but also accounts for findings not addressed by other memory-focused models.
As the reviewer notes, CMR-replay shares features with other memory-focused models. However, to our knowledge, none of these related approaches have yet captured the full suite of empirical replay phenomena, suggesting the combination of mechanisms employed in CMR-replay is essential for explaining these phenomena. In the Discussion section, we now discuss the similarities between CMR-replay and related memory models and the possibility of integrating these approaches:
“Our theory builds on a lineage of memory-focused models, demonstrating the power of this perspective in explaining phenomena that have often been attributed to the optimization of value-based predictions. In this work, we focus on CMR-replay, which exemplifies the memory-centric approach through a set of simple and interpretable mechanisms that we believe are broadly applicable across memory domains. Elements of CMR-replay share similarities with other models that adopt a memory-focused perspective. The model learns distributed context representations whose overlaps encodes associations among items, echoing associative learning theories in which overlapping patterns capture stimulus similarity and learned associations (McLaren & Mackintosh 2002). Context evolves through bidirectional interactions between items and their contextual representations, mirroring the dynamics found in recurrent neural networks (Haga & Futai 2018; Levenstein et al., 2024). However, these related approaches have not been shown to account for the present set of replay findings and lack mechanisms—such as reward-modulated encoding and experience-dependent suppression—that our simulations suggest are essential for capturing these phenomena. While not explored here, we believe these mechanisms could be integrated into architectures like recurrent neural networks (Levenstein et al., 2024) to support a broader range of replay dynamics.”
Recommendations For The Authors
Reviewer #1 (Recommendations For The Authors):
(1) Lines 94-96: These lines may be better positioned earlier in the paragraph.
We now introduce these lines earlier in the paragraph.
(2) Line 103 - It's unclear to me what is meant by the statement that "the current context contains contexts associated with previous items". I understand why a slowly drifting context will coincide and therefore link with multiple items that progress rapidly in time, so multiple items will be linked to the same context and each item will be linked to multiple contexts. Is that the idea conveyed here or am I missing something? I'm similarly confused by line 129, which mentions that a context is updated by incorporating other items' contexts. How could a context contain other contexts?
In the model, each item has an associated context that can be retrieved via Mfc. This is true even before learning, since Mfc is initialized as an identity matrix. During learning and replay, we have a drifting context c that is updated each time an item is presented. At each timestep, the model first retrieves the current item’s associated context cf by Mfc, and incorporates it into c. Equation #2 in the Methods section illustrates this procedure in detail. Because of this procedure, the drifting context c is a weighted sum of past items’ associated contexts.
We recognize that these descriptions can be confusing. We have updated the Results section to better distinguish the drifting context from items’ associated context. For example, we note that:
“We represent the drifting context during learning and replay with c and an item's associated context with cf.”
We have also updated our description of the context drift procedure to distinguish these two quantities:
“During awake encoding of a sequence of items, for each item f, the model retrieves its associated context cf via Mfc. The drifting context c incorporates the item's associated context cf and downweights its representation of previous items' associated contexts (Figure 1c). Thus, the context layer maintains a recency weighted sum of past and present items' associated contexts.”
(3) Figure 1b and 1d - please clarify which axis in the association matrices represents the item and the context.
We have added labels to show what the axes represent in Figure 1.
(4) The terms "experience" and "item" are used interchangeably and it may be best to stick to one term.
We now use the term “item” wherever we describe the model results.
(5) The manuscript describes Figure 6 ahead of earlier figures - the authors may want to reorder their figures to improve readability.
We appreciate this suggestion. We decided to keep the current figure organization since it allows us to group results into different themes and avoid redundancy.
(6) Lines 662-664 are repeated with a different ending, this is likely an error.
We have fixed this error.
Reviewer #3 (Recommendations For The Authors):
Below, I have outlined some additional points that came to mind in reviewing the manuscript - in no particular order.
(1) Figure 1: I found the ordering of panels a bit confusing in this figure, as the reading direction changes a couple of times in going from A to F. Would perhaps putting panel C in the bottom left corner and then D at the top right, with E and F below (also on the right) work?
We agree that this improves the figure. We have restructured the ordering of panels in this figure.
(2) Simulation 1: When reading the intro/results for the first simulation (Figure 2a; Diba & Buszaki, 2007; "When animals traverse a linear track...", page 6, line 186). It wasn't clear to me why pre-run rest would have any forward replay, particularly if pre-run implied that the animal had no experience with the track yet. But in the Methods this becomes clearer, as the model encodes the track eight times prior to the rest periods. Making this explicit in the text would make it easier to follow. Also, was there any reason why specifically eight sessions of awake learning, in particular, were used?
We now make more explicit that the animals have experience with the track before pre-run rest recording:
“Animals first acquire experience with a linear track by traversing it to collect a reward. Then, during the pre-run rest recording, forward replay predominates.”
We included eight sessions of awake learning to match with the number of sessions in Shin et al. (2017), since this simulation attempts to explain data from that study. After each repetition, the model engages in rest. We have revised the Methods section to indicate the motivation for this choice:
“In the simulation that examines context-dependent forward and backward replay through experience (Figs. 2a and 5a), CMR-replay encodes an input sequence shown in Fig. 7a, which simulates a linear track run with no ambiguity in the direction of inputs, over eight awake learning sessions (as in Shin et al. 2019)”
(3) Frequency of remote replay events: In the simulation based on Gupta et al, how frequently overall does remote replay occur? In the main text, the authors mention the mean frequency with which shortcut replay occurs (i.e., the mean proportion of replay events that contain a shortcut sequence = 0.0046), which was helpful. But, it also made me wonder about the likelihood of remote replay events. I would imagine that remote replay events are infrequent as well - given that it is considerably more likely to replay sequences from the local track, given the recency-weighted mental context. Reporting the above mean proportion for remote and local replay events would be helpful context for the reader.
In Figure 4c, we report the proportion of remote replay in the two experimental conditions of Gupta et al. that we simulate.
(4) Point of clarification re: backwards replay: Is backwards replay less likely to occur than forward replay overall because of the forward asymmetry associated with these models? For example, for a backwards replay event to occur, the context would need to drift backwards at least five times in a row, in spite of a higher probability of moving one step forward at each of those steps. Am I getting that right?
The reviewer’s interpretation is correct: CMR-replay is more likely to produce forward than backward replay in sleep because of its forward asymmetry. We note that this forward asymmetry leads to high likelihood of forward replay in the section titled “The context-dependency of memory replay”:
“As with prior retrieved context models (Howard & Kahana 2002; Polyn et al., 2009), CMR-replay encodes stronger forward than backward associations. This asymmetry exists because, during the first encoding of a sequence, an item's associated context contributes only to its ensuing items' encoding contexts. Therefore, after encoding, bringing back an item's associated context is more likely to reactivate its ensuing than preceding items, leading to forward asymmetric replay (Fig. 6d left).”
(5) On terminating a replay period: "At any t, the replay period ends with a probability of 0.1 or if a task-irrelevant item is reactivated." (Figure 1 caption; see also pg 18, line 635). How was the 0.1 decided upon? Also, could you please add some detail as to what a 'task-irrelevant item' would be? From what I understood, the model only learns sequences that represent the points in a track - wouldn't all the points in the track be task-relevant?
This value was arbitrarily chosen as a small value that allows probabilistic stopping. It was not motivated by prior modeling or a systematic search. We have added: “At each timestep, the replay period ends either with a stop probability of 0.1 or if a task-irrelevant item becomes reactivated. (The choice of the value 0.1 was arbitrary; future work could explore the implications of varying this parameter).”
In addition, we now explain in the paper that task irrelevant items “do not appear as inputs during awake encoding, but compete with task-relevant items for reactivation during replay, simulating the idea that other experiences likely compete with current experiences during periods of retrieval and reactivation.”
(6) Minor typos:
Turn all instances of "nonlocal" into "non-local", or vice versa
"For rest at the end of a run, cexternal is the context associated with the final item in the sequence. For rest at the end of a run, cexternal is the context associated with the start item." (pg 20, line 663) - I believe this is a typo and that the second sentence should begin with "For rest at the START of a run".
We have updated the manuscript to correct these typos.
(7) Code availability: I may have missed it, but it doesn't seem like the code is currently available for these simulations. Including the commented code in a public repository (Github, OSF) would be very useful in this case.
We now include a Github link to our simulation code: https://github.com/schapirolab/CMR-replay.
example, choosing one’s Pokémon Go avatar in such a way as to match one’sself-perception of a gendered, racialized, or ethnic body i n terms of avail-able discourses of categorization—alternatively, of c ourse, to provide acounterplay and reflexively choose against the grain (Willson 2015, 20).
If you play defensively, or a support role, or alone; if you have an effeminate name tag, skin, or cosmetics... you may be a target, through chat, for instance (but hackers could also track your IP in other ways).
Author response:
The following is the authors’ response to the previous reviews
Public Reviews:
Reviewer #1 (Public review):
Summary:
The manuscript by Raices et al., provides some novel insights into the role and interactions between SPO-11 accessory proteins in C. elegans. The authors propose a model of meiotic DSBs regulation, critical to our understanding of DSB formation and ultimately crossover regulation and accurate chromosome segregation. The work also emphasizes the commonalities and species-specific aspects of DSB regulation.
Strengths:
This study capitalizes on the strengths of the C. elegans system to uncover genetic interactions between a lSPO-11 accessory proteins. In combination with physical interactions, the authors synthesize their findings into a model, which will serve as the basis for future work, to determine mechanisms of DSB regulation.
Weaknesses:
The methodology, although standard, still lacks some rigor, especially with the IPs.
Reviewer #2 (Public review):
Summary:
Meiotic recombination initiates with the formation of DNA double-strand break (DSB) formation, catalyzed by the conserved topoisomerase-like enzyme Spo11. Spo11 requires accessory factors that are poorly conserved across eukaryotes. Previous genetic studies have identified several proteins required for DSB formation in C. elegans to varying degrees; however, how these proteins interact with each other to recruit the DSB-forming machinery to chromosome axes remains unclear.
In this study, Raices et al. characterized the biochemical and genetic interactions among proteins that are known to promote DSB formation during C. elegans meiosis. The authors examined pairwise interactions using yeast two-hybrid (Y2H) and co-immunoprecipitation and revealed an interaction between a chromatin-associated protein HIM-17 and a transcription factor XND-1. They further confirmed the previously known interaction between DSB-1 and SPO-11 and showed that DSB-1 also interacts with a nematodespecific HIM-5, which is essential for DSB formation on the X chromosome. They also assessed genetic interactions among these proteins, categorizing them into four epistasis groups by comparing phenotypes in double vs. single mutants. Combining these results, the authors proposed a model of how these proteins interact with chromatin loops and are recruited to chromosome axes, offering insights into the process in C. elegans compared to other organisms.
Weaknesses:
This work relies heavily on Y2H, which is notorious for having high rates of false positives and false negatives. Although the interactions between HIM-17 and XND-1 and between DSB-1 and HIM-5 were validated by co-IP, the significance of these interactions was not tested in vivo. Cataloging Y2H and genetic interactions does not yield much more insight. The model proposed in Figure 4 is also highly speculative.
Reviewer #3 (Public review):
The goal of this work is to understand the regulation of double-strand break formation during meiosis in C. elegans. The authors have analyzed physical and genetic interactions among a subset of factors that have been previously implicated in DSB formation or the number of timing of DSBs: CEP-1, DSB-1, DSB-2, DSB-3, HIM-5, HIM-17, MRE-11, REC-1, PARG-1, and XND-1.
The 10 proteins that are analyzed here include a diverse set of factors with different functions, based on prior analyses in many published studies. The term "Spo11 accessory factors" has been used in the meiosis literature to describe proteins that directly promote Spo11 cleavage activity, rather than factors that are important for the expression of meiotic proteins or that influence the genome-wide distribution or timing of DSBs. Based on this definition, the known SPO-11 accessory factors in C. elegans include DSB-1, DSB2, DSB-3, and the MRN complex (at least MRE-11 and RAD-50). These are all homologs of proteins that have been studied biochemically and structurally in other organisms. DSB-1 & DSB-2 are homologs of Rec114, while DSB-3 is a homolog of Mei4. Biochemical and structural studies have shown that Rec114 and Mei4 directly modulate Spo11 activity by recruiting Spo11 to chromatin and promoting its dimerization, which is essential for cleavage. The other factors analyzed in this study affect the timing, distribution, or number of RAD-51 foci, but they likely do so indirectly. As elaborated below, XND-1 and HIM-17 are transcription factors that modulate the expression of other meiotic genes, and their role in DSB formation is parsimoniously explained by this regulatory activity. The roles of HIM-5 and REC-1 remain unclear; the reported localization of HIM-5 to autosomes is consistent with a role in transcription (the autosomes are transcriptionally active in the germline, while the X chromosome is largely silent), but its loss-of-function phenotypes are much more limited than those of HIM-17 and XND-1, so it may play a more direct role in DSB formation. The roles of CEP-1 (a Rad53 homolog) and PARG-1 are also ambiguous, but their homologs in other organisms contribute to DNA repair rather than DSB formation.
We appreciate the reviewer’s clarification. However, the definition of Spo11 accessory factors varies across the literature. Only Keeney and colleagues define these as proteins that physically associate with and activate Spo11 to catalyze DSB formation (Keeney, Lange & Mohibullah, 2014; Lam & Keeney, 2015). In contrast, other authors have used the term more broadly to refer to proteins that promote or regulate Spo11-dependent DSB formation, without necessarily implying a direct interaction with Spo11 (e.g., Panizza et al., 2011; Robert et al., 2016; Stanzione et al., 2016; Li et al., 2021; Lange et al., 2016). Thus, our usage of the term follows this broader functional definition.
An additional significant limitation of the study, as stated in my initial review, is that much of the analysis here relies on cytological visualization of RAD-51 foci as a proxy for DSBs. RAD-51 associates transiently with DSB sites as they undergo repair and is thus limited in its ability to reveal details about the timing or abundance of DSBs since its loading and removal involve additional steps that may be influenced by the factors being analyzed.
We agree with the reviewer that counting RAD-51 foci provides only an indirect measure of SPO-11–dependent DSBs, as RAD-51 marks sites of repair rather than the breaks themselves. However, we would like to clarify that our current study does not rely on RAD51 foci quantification for any of the analyses or conclusions presented. None of the figures or datasets in this manuscript are based on RAD-51 cytology. Instead, our conclusions are drawn from genetic interactions, biochemical assays, and protein–protein interaction analyses.
The paper focuses extensively on HIM-5, which was previously shown through genetic and cytological analysis to be important for breaks on the X chromosome. The revised manuscript still claims that "HIM-5 mediates interactions with the different accessory factors sub-groups, providing insights into how components on the DNA loops may interact with the chromosome axis." The weak interactions between HIM-5 and DSB-1/2 detected in the Y2H assay do not convincingly support such a role. The idea that HIM-5 directly promotes break formation is also inconsistent with genetic data showing that him5 mutants lack breaks on the X chromosomes, while HIM-5 has been shown to be is enriched on autosomes. Additionally, as noted in my comment to the authors, the localization data for HIM-5 shown in this paper are discordant with prior studies; this discrepancy should be addressed experimentally.
We appreciate the reviewer’s concerns regarding the interpretation of HIM-5 function. The weak Y2H interactions between HIM-5 and DSB-1 are not interpreted as direct biochemical evidence of a strong physical interaction, but rather as a potential point of regulatory connection between these pathways. Importantly, these Y2H data are further supported by co-immunoprecipitation experiments, genetic interactions, and the observed mislocalization of HIM-5 in the absence of DSB-1. Together, these complementary results strengthen our conclusion that HIM-5 functionally associates with DSB-promoting complexes.
Regarding HIM-5 localization, the pattern we observe using both anti-GFP staining of the eaIs4 transgene (Phim-5::him-5::GFP) and anti-HA staining of the HIM-5::HA strain is consistent with that reported by McClendon et al. (2016), who validated the same eaIs4 transgene. Although the pattern difers slightly from Meneely et al. (2012), that used a HIM5 antibody that is no longer functional and that has been discontinued by the commercial source. In this prior study, a weak signal was detected in the mitotic region and late pachytene, but stronger signal was seen in early to mid-pachytene. Our imaging— optimized for low background and stable signal—similarly shows robust HIM-5 localization in early and mid-pachytene, supporting the reliability of our GFP and HA-tagged analyses.
The recent analysis of DSB formation in C. elegans males (Engebrecht et al; PloS Genetics; PMID: 41124211) shows that in absence of him-5 there is a significant reduction of CO designation (measured as COSA-1 foci) on autosomes. This study strongly supports a direct and general role for HIM-5 in crossover formation— on both autosomes and on the hermaphrodite X.
This paper describes REC-1 and HIM-5 as paralogs, based on prior analysis in a paper that included some of the same authors (Chung et al., 2015; DOI 10.1101/gad.266056.115). In my initial review I mentioned that this earlier conclusion was likely incorrect and should not be propagated uncritically here. Since the authors have rebutted this comment rather than amending it, I feel it is important to explain my concerns about the conclusions of previous study. Chung et al. found a small region of potential homology between the C. elegans rec-1 and him-5 genes and also reported that him-5; rec-1 double mutants have more severe defects than either single mutant, indicative of a stronger reduction in DSBs. Based on these observations and an additional argument based on microsynteny, they concluded that these two genes arose through recent duplication and divergence. However, as they noted, genes resembling rec-1 are absent from all other Caenorhabditis species, even those most closely related to C. elegans. The hypothesis that two genes are paralogs that arose through duplication and divergence is thus based on their presence in a single species, in the absence of extensive homology or evidence for conserved molecular function. Further, the hypothesis that gene duplication and divergence has given rise to two paralogs that share no evident structural similarity or common interaction partners in the few million years since C. elegans diverged from its closest known relatives is implausible. In contrast, DSB-1 and DSB-2 are both homologs of Rec114 that clearly arose through duplication and divergence within the Caenorhabditis lineage, but much earlier than the proposed split between REC-1 and HIM-5. Two genes that can be unambiguously identified as dsb-1 and dsb-2 are present in genomes throughout the Elegans supergroup and absent in the Angaria supergroup, placing the duplication event at around 18-30 MYA, yet DSB-1 and DSB-2 share much greater similarity in their amino acid sequence, predicted structure, and function than HIM-5 and REC-1. Further, Raices place HIM-5 and REC-1 in different functional complexes (Figure 3B).
We respectfully disagree with the reviewer’s characterization of the relationship between HIM-5 and REC-1. Our use of the term “paralog” follows the conclusions of Chung et al. (2015), a peer-reviewed study that provided both sequence and microsynteny evidence supporting this relationship. While we acknowledge that the degree of sequence conservation is limited, the evolutionary scenario proposed by Chung et al. remains the only published framework addressing this question. Further the degree of homology between either HIM-5 or REC-1 and the ancestral locus are similar to that observed for DSB-1 and DSB-2 with REC-114 (Hinman et al., 2021). We therefore retain the use of the term “paralog” in reference to these genes. Importantly, our conclusions regarding their distinct molecular and functional roles are independent of this classification.
The authors acknowledge that HIM-17 is a transcription factor that regulates many meiotic genes. Like HIM-17, XND-1 is cytologically enriched along the autosomes in germline nuclei, suggestive of a role in transcription. The Reinke lab performed ChIP-seq in a strain expressing an XND-1::GFP fusion protein and showed that it binds to promoter regions, many of which overlap with the HIM-17-regulated promoters characterized by the Ahringer lab (doi: 10.1126/sciadv.abo4082). Work from the Yanowitz lab has shown that XND-1 influences the transcription of many other genes involved in meiosis (doi: 10.1534/g3.116.035725) and work from the Colaiacovo lab has shown that XND-1 regulates the expression of CRA-1 (doi: 10.1371/journal.pgen.1005029). Additionally, loss of HIM-17 or XND-1 causes pleiotropic phenotypes, consistent with a broad role in gene regulation. Collectively, these data indicate that XND-1 and HIM-17 are transcription factors that are important for the proper expression of many germline-expressed genes. Thus, as stated above, the roles of HIM-17 and XND-1 in DSB formation, as well as their effects on histone modification, are parsimoniously explained by their regulation of the expression of factors that contribute more directly to DSB formation and chromatin modification. I feel strongly that transcription factors should not be described as "SPO-11 accessory factors."
The ChIP analysis of XND-1 binding sites (using the XND-1::GFP transgene we provided to the Reinke lab) was performed, and Table S3 in the Ahringer paper suggests it is found at germline promoters, although the analysis is not actually provided. We completely agree that at least a subset of XND-1 functions is explained by its regulation of transcriptional targets (as we previously showed for HIM-5). However, like the MES proteins, a subset of which are also autosomal and impact X chromosome gene expression, XND-1 could also be directly regulating chromatin architecture which could have profound effects on DSB formation. As stated in our prior comments, precedent for the involvement of a chromatin factor in DSB formation is provided by yeast Spp1.
Recommendations for the authors:
Editor comments:
As you can see, the reviewers have additional comments, and the authors can include revisions to address those points prior to publicizing 'a version of record' (e.g. hatching rate assay mentioned by reviewer #1). This type of study, trying to catalog interactions of many factors, inevitably has loose ends, but in my opinion, it does not reduce the value of the study, as long as statements are not misleading. I suggest that the authors address issues by making changes to the main text. After the next round of adjustments by authors, I feel that it will be ready for a version of record, based on the spirit of the current eLife publication model.
Reviewer #1 (Recommendations for the authors):
I still have concerns about the HIM-17 IP and immunoblot probing with XND-1 antibodies. While the newly provided whole extract immunoblot clearly shows a XND-1 specific band that goes away in the mutant extracts, there is additional bands that are recognized - the pattern looks different than in the input in Figure 1B. Additionally, there is still a band of the corresponding size in the IPs from extracts not containing the tagged allele of HIM-17, calling into question whether XND-1 is specifically pulled down.
The authors did not include the hatching rate as pointed out in the original reviews. In the rebuttal:
"Great question. I guess we need to do this while back out for review. If anyone has suggestions of what to say here. Clearly we overlooked this point but do have the strain."
We thank the reviewer for this suggestion. We had intended to include a hatching analysis; however, during the course of this work we discovered that our him-17 stock had acquired an additional linked mutation(s) that altered its phenotype and led to inconsistent results. This strain was used to rederive the him-17; eaIs4 double mutant after our original did not survive freeze/thaw. Given the abnormal behavior observed in this line, we concluded that proceeding with the hatching assays could yield unreliable data. We are currently reestablishing a verified him-17 strain, but in the interest of accuracy and reproducibility, we have restricted our analysis in this manuscript to validated datasets derived from confirmed strains.
Reviewer #2 (Recommendations for the authors):
The authors have addressed most of the previous concerns and substantially improved the manuscript. The new data demonstrate that HIM-5 localization depends on DSB-1, and together with the Y2H and Co-PI results, strengthen the link between HIM-5 and the DSBforming machinery in C. elegans. The remaining points are outlined below:
Specific comments:
The font size of texts and labels in the Figure is very small and is hardly legible. Please enlarge them and make them clearly visible (Fig 1A, 1B, 2A, 2B, 2C, 2D, 2E, 3A, 3B, 3C, 3D, 3F)
Done
Although the authors have addressed the specificity of the XND-1 antibody, it remains unclear whether the boxed band is specific to the him-17::3xHA IP, since the same band appears in the control IP, albeit with lower intensity (Fig 1B). Is the ~100 kDa band in the him-17::3xHA IP a modified form XND-1? While antibody specificity was previously demonstrated by IF using xnd-1 mutants, it would be ideal to confirm this on a western blot as well.
A Western Blot performed using whole cell extracts and probed with the anti- XND-1 antibody has been provided in the revised version of the manuscript (Fig. S1A). This confirms that the antibody specifically recognizes XND-1 protein. We believe that the ~100 kDa band mentioned by the reviewer is likely to be a non-specific cross reaction band detected by the antibody, since an identical band of the same mW was also detected in xnd-1 null mutants (Fig. S1A).
Regarding the IP negative controls, we are firmly convinced the boxed band to be specific, and the fact that a (very) low intensity band is also found in the negative control should not infringe the validity of the HIM-17-XND-1 specific interaction. There is a constellation of similar examples present across the literature, as it is widely acknowledged amongst biochemists that some proteins may “stick” to the beads due their intrinsic biochemical properties despite usage of highly stringent IP buffers. However, the high level of enrichment detected in the IP (as also underlined by the reviewer) corroborates that XND-1 specifically immunoprecipitates with HIM-17 despite a low, non-specific binding to the HA beads is present. If interaction between XND-1 and HIM-17 was non-specific, we logically would have found the band in the IP and the band in the negative control to be of very similar intensity, which is clearly not the case.
Although co-IP assays are generally considered not a strictly quantitative assay, we want to emphasize that a comparable amount of nuclear extract was employed in both samples as also evidenced by the inputs, in which it is also possible to see that if anything, slightly less nuclear extracts were employed in the him-17::3xHA; him-5::GFP::3xFLAG vs. the him5::GFP::3xFLAG negative control, corroborating the above mentioned points.
Lastly, it is crucial to mention that mass spectrometry analyses performed on HIM17::3xHA pulldowns show XND-1 as a highly enriched interacting protein (Blazickova et al.; 2025 Nature Comms.), which strongly supports our co-IP results.
The subheading "HIM-5 is the essential factor for meiotic breaks in the X chromosome" does not accurately represent the work described in the Results or in Figure 1. I disagree with the authors' response to the earlier criticism. The issue is not merely semantic. The data do not demonstrate that HIM-5 is required for DSB formation on the X chromosome - this conclusion can only be inferred. What Figure 1 shows is that XND-1 and HIM-17 interact, and that pie-1p-driven HIM-5 expression can partially rescue meiotic defects of him-17 mutants. This supports the conclusion that him-5 is a target of HIM-17/XND-1 in promoting CO formation on the X chromosome. However, the data provide no direct evidence for the claim stated in the subheading. I strongly encourage authors to revise the subheading to more accurately represent the findings presented in the paper.
After considering the reviewer’s comments, we have revised the subheading to more accurately describe our findings.
In Fig1C, please fix the typo in the last row - "pie1p::him5-::GFP" to "pie-1p::him- 5::GFP".
Done
In Fig 2C, "p" is missing from the label on the right for Phim-5::him-5::GFP.
Done
In Fig 3I, bring the labels (DSB-1/2/3) at the lower right to the front.
Done
In Concluding Remarks, please fix the typo "frequently".
Done
Reviewer #3 (Recommendations for the authors):
The experiments that analyze HIM-5 in dsb-1 mutants should be repeated using antibodies against the endogenous HIM-5 antibody, and localization of the HIM-5::HA and HIM-5::GFP proteins should be compared directly to antibody staining. This work uses an epitopetagged protein and a GFP-tagged protein to analyze the localization of HIM-5, while prior work (Meneely et al., 2012) used an antibody against the endogenous protein. In Figures 2 and S4 of this paper, neither HIM-5::HA nor HIM-5::GFP appears to localize strongly to chromatin, and autosomal enrichment of HIM-5, as previously reported for the endogenous protein based on antibody staining, is not evident. Moreover, HIM-5::GFP and HIM-5::HA look different from each other, and neither resembles the low-resolution images shown in Figure 6 in Meneely et al 2012, which showed nuclear staining throughout the germline, including in the mitotic zone, and also in somatic sheath cells. Given the differences in localization between the tagged transgenes and the endogenous protein, it is important to analyze the behavior of the endogenous, untagged protein. A minor issue: a wild-type control should also be shown for HIM-5::HA in Figure S4.
Wild type control added to figure S4
Evidence that XND-1 and HIM-17 form a complex is weak; it is supported by the Y2H and co-IP data but opposed by functional analysis or localization. The diversity of proteins found in the Co-IP of HIM-17::GFP (Table S2) indicate that these interactions are unlikely to be specific. The independent localization of these proteins to chromatin is clear evidence that they do not form an obligate complex; additionally, they have been found to regulate distinct (although overlapping) sets of genes. The predicted structure generated by Alphafold3 has very low confidence and should not be taken as evidence for an interaction.The newly added argument about the lack of apparently overlap between HIM-17 and XND1 due to the distance between the HA tag on HIM-17 and XND-1 is flawed and should be removed - the extended C-terminus in the predicted AlphaFold3 C-terminus of HIM-17 has been interpreted as if it were a structured domain. Moreover, the predicted distance of 180 Å (18 nm) is comparable to the distance between a fluorophore on a secondary antibody and the epitope recognized by the primary antibody (~20-25 nm) and is far below than the resolution limit of light microscopy.
We appreciate the reviewer’s thoughtful comment. The evidence supporting a physical interaction between XND-1 and HIM-17 is not only shown by our co-IP experiments, but it has also been recently shown in an independent study where MS analyses were conducted on HIM-17::3xHA pull downs to identify novel HIM-17 interactors (Blazickova et al.; 2025 Nature Comms). As shown in the data provided in this study, also under these experimental settings XND-1 was identified as a highly enriched putative HIM-17 interactor. We do acknowledge that their chromatin localization patterns are distinct and they regulate overlapping but not identical sets of genes, however, it is worth noting that protein–protein interactions in meiosis are often transient or context-dependent, and may not necessarily result in co-localization detectable by microscopy. In line with this, in the same work cited above, a similar situation for BRA-2 and HIM-17 was reported, as they were shown to interact biochemically despite the absence of overlapping staining patterns.
Minor issues:
The images shown in Panel D in Figure 1 seem to have very different resolutions; the HTP3/HIM-17 colocalization image is particularly blurry/low-resolution and should be replaced. The contrast between blue and green cannot be seen clearly; colors with stronger contrast should be used, and grayscale images should also be shown for individual channels. High-resolution images should probably be included for all of the factors analyzed here to facilitate comparisons.
Create a note
Create a note @Jeremy_Dow hypothes.is
Note: This response was posted by the corresponding author to Review Commons. The content has not been altered except for formatting.
Learn more at Review Commons
Reviewer #1 (Evidence, reproducibility and clarity (Required)):
*The authors have a longstanding focus and reputation on single cell sequencing technology development and application. In this current study, the authors developed a novel single-cell multi-omic assay termed "T-ChIC" so that to jointly profile the histone modifications along with the full-length transcriptome from the same single cells, analyzed the dynamic relationship between chromatin state and gene expression during zebrafish development and cell fate determination. In general, the assay works well, the data look convincing and conclusions are beneficial to the community. *
Thank you for your positive feedback.
*There are several single-cell methodologies all claim to co-profile chromatin modifications and gene expression from the same individual cell, such as CoTECH, Paired-tag and others. Although T-ChIC employs pA-Mnase and IVT to obtain these modalities from single cells which are different, could the author provide some direct comparisons among all these technologies to see whether T-ChIC outperforms? *
In a separate technical manuscript describing the application of T-ChIC in mouse cells (Zeller, Blotenburg et al 2024, bioRxiv, 2024.05. 09.593364), we have provided a direct comparison of data quality between T-ChIC and other single-cell methods for chromatin-RNA co-profiling (Please refer to Fig. 1C,D and Fig. S1D, E, of the preprint). We show that compared to other methods, T-ChIC is able to better preserve the expected biological relationship between the histone modifications and gene expression in single cells.
*In current study, T-ChIC profiled H3K27me3 and H3K4me1 modifications, these data look great. How about other histone modifications (eg H3K9me3 and H3K36me3) and transcription factors? *
While we haven't profiled these other modifications using T-ChIC in Zebrafish, we have previously published high quality data on these histone modifications using the sortChIC method, on which T-ChIC is based (Zeller, Yeung et al 2023). In our comparison, we find that histone modification profiles between T-ChIC and sortChIC are very similar (Fig. S1C in Zeller, Blotenburg et al 2024). Therefore the method is expected to work as well for the other histone marks.
*T-ChIC can detect full length transcription from the same single cells, but in FigS3, the authors still used other published single cell transcriptomics to annotate the cell types, this seems unnecessary? *
We used the published scRNA-seq dataset with a larger number of cells to homogenize our cell type labels with these datasets, but we also cross-referenced our cluster-specific marker genes with ZFIN and homogenized the cell type labels with ZFIN ontology. This way our annotation is in line with previous datasets but not biased by it. Due the relatively smaller size of our data, we didn't expect to identify unique, rare cell types, but our full-length total RNA assay helps us identify non-coding RNAs such as miRNA previously undetected in scRNA assays, which we have now highlighted in new figure S1c .
*Throughout the manuscript, the authors found some interesting dynamics between chromatin state and gene expression during embryogenesis, independent approaches should be used to validate these findings, such as IHC staining or RNA ISH? *
We appreciate that the ISH staining could be useful to validate the expression pattern of genes identified in this study. But to validate the relationships between the histone marks and gene expression, we need to combine these stainings with functional genomics experiments, such as PRC2-related knockouts. Due to their complexity, such experiments are beyond the scope of this manuscript (see also reply to reviewer #3, comment #4 for details).
*In Fig2 and FigS4, the authors showed H3K27me3 cis spreading during development, this looks really interesting. Is this zebrafish specific? H3K27me3 ChIP-seq or CutTag data from mouse and/or human embryos should be reanalyzed and used to compare. The authors could speculate some possible mechanisms to explain this spreading pattern? *
Thanks for the suggestion. In this revision, we have reanalysed a dataset of mouse ChIP-seq of H3K27me3 during mouse embryonic development by Xiang et al (Nature Genetics 2019) and find similar evidence of spreading of H3K27me3 signal from their pre-marked promoter regions at E5.5 epiblast upon differentiation (new Figure S4i). This observation, combined with the fact that the mechanism of pre-marking of promoters by PRC1-PRC2 interaction seems to be conserved between the two species (see (Hickey et al., 2022), (Mei et al., 2021) & (Chen et al., 2021)), suggests that the dynamics of H3K27me3 pattern establishment is conserved across vertebrates. But we think a high-resolution profiling via a method like T-ChIC would be more useful to demonstrate the dynamics of signal spreading during mouse embryonic development in the future. We have discussed this further in our revised manuscript.
Reviewer #1 (Significance (Required)):
*The authors have a longstanding focus and reputation on single cell sequencing technology development and application. In this current study, the authors developed a novel single-cell multi-omic assay termed "T-ChIC" so that to jointly profile the histone modifications along with the full-length transcriptome from the same single cells, analyzed the dynamic relationship between chromatin state and gene expression during zebrafish development and cell fate determination. In general, the assay works well, the data look convincing and conclusions are beneficial to the community. *
Thank you very much for your supportive remarks.
Reviewer #2 (Evidence, reproducibility and clarity (Required)):
*Joint analysis of multiple modalities in single cells will provide a comprehensive view of cell fate states. In this manuscript, Bhardwaj et al developed a single-cell multi-omics assay, T-ChIC, to simultaneously capture histone modifications and full-length transcriptome and applied the method on early embryos of zebrafish. The authors observed a decoupled relationship between the chromatin modifications and gene expression at early developmental stages. The correlation becomes stronger as development proceeds, as genes are silenced by the cis-spreading of the repressive marker H3k27me3. Overall, the work is well performed, and the results are meaningful and interesting to readers in the epigenomic and embryonic development fields. There are some concerns before the manuscript is considered for publication. *
We thank the reviewer for appreciating the quality of our study.
*Major concerns: *
- A major point of this study is to understand embryo development, especially gastrulation, with the power of scMulti-Omics assay. However, the current analysis didn't focus on deciphering the biology of gastrulation, i.e., lineage-specific pioneer factors that help to reform the chromatin landscape. The majority of the data analysis is based on the temporal dimension, but not the cell-type-specific dimension, which reduces the value of the single-cell assay. *
We focused on the lineage-specific transcription factor activity during gastrulation in Figure 4 and S8 of the manuscript and discovered several interesting regulators active at this stage. During our analysis of the temporal dimension for the rest of the manuscript, we also classified the cells by their germ layer and "latent" developmental time by taking the full advantage of the single-cell nature of our data. Additionally, we have now added the cell-type-specific H3K27-demethylation results for 24hpf in response to your comment below. We hope that these results, together with our openly available dataset would demonstrate the advantage of the single-cell aspect of our dataset.
- *The cis-spreading of H3K27me3 with developmental time is interesting. Considering H3k27me3 could mark bivalent regions, especially in pluripotent cells, there must be some regions that have lost H3k27me3 signals during development. Therefore, it's confusing that the authors didn't find these regions (30% spreading, 70% stable). The authors should explain and discuss this issue. *
Indeed we see that ~30% of the bins enriched in the pluripotent stage spread, while 70% do not seem to spread. In line with earlier observations(Hickey et al., 2022; Vastenhouw et al., 2010), we find that H3K27me3 is almost absent in the zygote and is still being accumulated until 24hpf and beyond. Therefore the majority of the sites in the genome still seem to be in the process of gaining H3K27me3 until 24hpf, explaining why we see mostly "spreading" and "stable" states. Considering most of these sites are at promoters and show signs of bivalency, we think that these sites are marked for activation or silencing at later stages. We have discussed this in the manuscript ("discussion"). However, in response to this and earlier comment, we went back and searched for genes that show H3K27-demethylation in the most mature cell types (at 24 hpf) in our data, and found a subset of genes that show K27 demethylation after acquiring them earlier. Interestingly, most of the top genes in this list are well-known as developmentally important for their corresponding cell types. We have added this new result and discussed it further in the manuscript (Fig. 2d,e, , Supplementary table 3).
*Minors: *
- The authors cited two scMulti-omics studies in the introduction, but there have been lots of single-cell multi-omics studies published recently. The authors should cite and consider them. *
We have cited more single-cell chromatin and multiome studies focussed on early embryogenesis in the introduction now.
*2. T-ChIC seems to have been presented in a previous paper (ref 15). Therefore, Fig. 1a is unnecessary to show. *
Figure 1a. shows a summary of our Zebrafish TChIC workflow, which contains the unique sample multiplexing and sorting strategy to reduce batch effects, which was not applied in the original TChIC workflow. We have now clarified this in "Results".
- *It's better to show the percentage of cell numbers (30% vs 70%) for each heatmap in Figure 2C. *
We have added the numbers to the corresponding legends.
- *Please double-check the citation of Fig. S4C, which may not relate to the conclusion of signal differences between lineages. *
The citation seems to be correct (Fig. S4C supplements Fig. 2C, but shows mesodermal lineage cells) but the description of the legend was a bit misleading. We have clarified this now.
*5. Figure 4C has not been cited or mentioned in the main text. Please check. *
Thanks for pointing it out. We have cited it in Results now.
Reviewer #2 (Significance (Required)):
*Strengths: This work utilized a new single-cell multi-omics method and generated abundant epigenomics and transcriptomics datasets for cells covering multiple key developmental stages of zebrafish. *
*Limitations: The data analysis was superficial and mainly focused on the correspondence between the two modalities. The discussion of developmental biology was limited. *
*Advance: The zebrafish single-cell datasets are valuable. The T-ChIC method is new and interesting. *
*The audience will be specialized and from basic research fields, such as developmental biology, epigenomics, bioinformatics, etc. *
*I'm more specialized in the direction of single-cell epigenomics, gene regulation, 3D genomics, etc. *
Thank you for your remarks.
Reviewer #3 (Evidence, reproducibility and clarity (Required)):
*This manuscript introduces T‑ChIC, a single‑cell multi‑omics workflow that jointly profiles full‑length transcripts and histone modifications (H3K27me3 and H3K4me1) and applies it to early zebrafish embryos (4-24 hpf). The study convincingly demonstrates that chromatin-transcription coupling strengthens during gastrulation and somitogenesis, that promoter‑anchored H3K27me3 spreads in cis to enforce developmental gene silencing, and that integrating TF chromatin status with expression can predict lineage‑specific activators and repressors. *
*Major concerns *
- *Independent biological replicates are absent, so the authors should process at least one additional clutch of embryos for key stages (e.g., 6 hpf and 12 hpf) with T‑ChIC and demonstrate that the resulting data match the current dataset. *
Thanks for pointing this out. We had, in fact, performed T-ChIC experiments in four rounds of biological replicates (independent clutch of embryos) and merged the data to create our resource. Although not all timepoints were profiled in each replicate, two timepoints (10 and 24hpf) are present in all four, and the celltype composition of these replicates from these 2 timepoints are very similar. We have added new plots in figure S2f and added (new) supplementary table (#1) to highlight the presence of biological replicates.
2. *The TF‑activity regression model uses an arbitrary R² {greater than or equal to} 0.6 threshold; cross‑validated R² distributions, permutation‑based FDR control, and effect‑size confidence intervals are needed to justify this cut‑off. *
Thank you for this suggestion. We did use 10-fold cross validation during training and obtained the R2 values of TF motifs from the independent test set as an unbiased estimate. However, the cutoff of R2 > 0.6 to select the TFs for classification was indeed arbitrary. In the revised version, we now report the FDR-adjusted p-values for these R2 estimates based on permutation tests, and select TFs with a cutoff of padj supplementary table #4 to include the p-values for all tested TFs. However, we see that our arbitrary cutoff of 0.6 was in fact, too stringent, and we can classify many more TFs based on the FDR cutoffs. We also updated our reported numbers in Fig. 4c to reflect this. Moreover, supplementary table #4 contains the complete list of TFs used in the analysis to allow others to choose their own cutoff.
3. *Predicted TF functions lack empirical support, making it essential to test representative activators (e.g., Tbx16) and repressors (e.g., Zbtb16a) via CRISPRi or morpholino knock‑down and to measure target‑gene expression and H3K4me1 changes. *
We agree that independent validation of the functions of our predicted TFs on target gene activity would be important. During this revision, we analysed recently published scRNA-seq data of Saunders et al. (2023) (Saunders et al., 2023), which includes CRISPR-mediated F0 knockouts of a couple of our predicted TFs, but the scRNAseq was performed at later stages (24hpf onward) compared to our H3K4me1 analysis (which was 4-12 hpf). Therefore, we saw off-target genes being affected in lineages where these TFs are clearly not expressed (attached Fig 1). We therefore didn't include these results in the manuscript. In future, we aim to systematically test the TFs predicted in our study with CRISPRi or similar experiments.
4. *The study does not prove that H3K27me3 spreading causes silencing; embryos treated with an Ezh2 inhibitor or prc2 mutants should be re‑profiled by T‑ChIC to show loss of spreading along with gene re‑expression. *
We appreciate the suggestion that indeed PRC2-disruption followed by T-ChIC or other forms of validation would be needed to confirm whether the H3K27me3 spreading is indeed causally linked to the silencing of the identified target genes. But performing this validation is complicated because of multiple reasons: 1) due to the EZH2 contribution from maternal RNA and the contradicting effects of various EZH2 zygotic mutations (depending on where the mutation occurs), the only properly validated PRC2-related mutant seems to be the maternal-zygotic mutant MZezh2, which requires germ cell transplantation (see Rougeot et al. 2019 (Rougeot et al., 2019)) , and San et al. 2019 (San et al., 2019) for details). The use of inhibitors have been described in other studies (den Broeder et al., 2020; Huang et al., 2021), but they do not show a validation of the H3K27me3 loss or a similar phenotype as the MZezh2 mutants, and can present unwanted side effects and toxicity at a high dose, affecting gene expression results. Moreover, in an attempt to validate, we performed our own trials with the EZH2 inhibitor (GSK123) and saw that this time window might be too short to see the effect within 24hpf (attached Fig. 2). Therefore, this validation is a more complex endeavor beyond the scope of this study. Nevertheless, our further analysis of H3K27me3 de-methylation on developmentally important genes (new Fig. 2e-f, Sup. table 3) adds more confidence that the polycomb repression plays an important role, and provides enough ground for future follow up studies.
*Minor concerns *
- *Repressive chromatin coverage is limited, so profiling an additional silencing mark such as H3K9me3 or DNA methylation would clarify cooperation with H3K27me3 during development. *
We agree that H3K27me3 alone would not be sufficient to fully understand the repressive chromatin state. Extension to other chromatin marks and DNA methylation would be the focus of our follow up works.
*2. Computational transparency is incomplete; a supplementary table listing all trimming, mapping, and peak‑calling parameters (cutadapt, STAR/hisat2, MACS2, histoneHMM, etc.) should be provided. *
As mentioned in the manuscript, we provide an open-source pre-processing pipeline "scChICflow" to perform all these steps (github.com/bhardwaj-lab/scChICflow). We have now also provided the configuration files on our zenodo repository (see below), which can simply be plugged into this pipeline together with the fastq files from GEO to obtain the processed dataset that we describe in the manuscript. Additionally, we have also clarified the peak calling and post-processing steps in the manuscript now.
*3. Data‑ and code‑availability statements lack detail; the exact GEO accession release date, loom‑file contents, and a DOI‑tagged Zenodo archive of analysis scripts should be added. *
We have now publicly released the .h5ad files with raw counts, normalized counts, and complete gene and cell-level metadata, along with signal tracks (bigwigs) and peaks on GEO. Additionally, we now also released the source datasets and notebooks (.Rmarkdown format) on Zenodo that can be used to replicate the figures in the manuscript, and updated our statements on "Data and code availability".
*4. Minor editorial issues remain, such as replacing "critical" with "crucial" in the Abstract, adding software version numbers to figure legends, and correcting the SAMtools reference. *
Thank you for spotting them. We have fixed these issues.
Reviewer #3 (Significance (Required)):
The method is technically innovative and the biological insights are valuable; however, several issues-mainly concerning experimental design, statistical rigor, and functional validation-must be addressed to solidify the conclusions.
Thank you for your comments. We hope to have addressed your concerns in this revised version of our manuscript.
Note: This preprint has been reviewed by subject experts for Review Commons. Content has not been altered except for formatting.
Learn more at Review Commons
The authors have a longstanding focus and reputation on single cell sequencing technology development and application. In this current study, the authors developed a novel single-cell multi-omic assay termed "T-ChIC" so that to jointly profile the histone modifications along with the full-length transcriptome from the same single cells, analyzed the dynamic relationship between chromatin state and gene expression during zebrafish development and cell fate determination. In general, the assay works well, the data look convincing and conclusions are beneficial to the community.
There are several single-cell methodologies all claim to co-profile chromatin modifications and gene expression from the same individual cell, such as CoTECH, Paired-tag and others. Although T-ChIC employs pA-Mnase and IVT to obtain these modalities from single cells which are different, could the author provide some direct comparisons among all these technologies to see whether T-ChIC outperforms?
In current study, T-ChIC profiled H3K27me3 and H3K4me1 modifications, these data look great. How about other histone modifications (eg H3K9me3 and H3K36me3) and transcription factors?
T-ChIC can detect full length transcription from the same single cells, but in FigS3, the authors still used other published single cell transcriptomics to annotate the cell types, this seems unnecessary?
Throughout the manuscript, the authors found some interesting dynamics between chromatin state and gene expression during embryogenesis, independent approaches should be used to validate these findings, such as IHC staining or RNA ISH?
In Fig2 and FigS4, the authors showed H3K27me3 cis spreading during development, this looks really interesting. Is this zebrafish specific? H3K27me3 ChIP-seq or CutTag data from mouse and/or human embryos should be reanalyzed and used to compare. The authors could speculate some possible mechanisms to explain this spreading pattern?
The authors have a longstanding focus and reputation on single cell sequencing technology development and application. In this current study, the authors developed a novel single-cell multi-omic assay termed "T-ChIC" so that to jointly profile the histone modifications along with the full-length transcriptome from the same single cells, analyzed the dynamic relationship between chromatin state and gene expression during zebrafish development and cell fate determination. In general, the assay works well, the data look convincing and conclusions are beneficial to the community.
Reviewer #2 (Public review):
Summary:
The main finding of this work is that microbiota impacts lifespan though regulating the expression of a gut hormone (Tk) which in turn acts on its receptor expressed on neurons. This conclusion is robust and based on a number of experimental observations, carefully using techniques in fly genetics and physiology: 1) microbiota regulates Tk expression, 2) lifespan reduction by microbiota is absent when Tk is knocked down in gut (specifically in the EEs), 3) Tk knockdown extends lifespan and this is recapitulated by knockdown of a Tk receptor in neurons. These key conclusions are very convincing. Additional data are presented detailing the relationship between Tk and insulin/IGF signalling and Akh in this context. These are two other important endocrine signalling pathways in flies. The presentation and analysis of the data are excellent.
There are only a few experiments or edits that I would suggest as important to confirm or refine the conclusions of this manuscript. These are:
(1) When comparing the effects of microbiota (or single bacterial species) in different genetic backgrounds or experimental conditions, I think it would be good to show that the bacterial levels are not impacted by the other intervention(s). For example, the lifespan results observed in Figure 2A are consistent with Tk acting downstream of the microbes but also with Tk RNAi having an impact on the microbiota itself. I think this simple, additional control could be done for a few key experiments. Similarly, the authors could compare the two bacterial species to see if the differences in their effects come from different ability to colonise the flies.
(2) The effect of Tk RNAi on TAG is opposite in CR and Ax or CR and Ap flies, and the knockdown shows an effect in either case (Figure 2E, Figure 3D). Why is this? Better clarification is required.
(3) With respect to insulin signalling, all the experiments bar one indicate that insulin is mediating the effects of Tk. The one experiment that does not is using dilpGS to knock down TkR99D. Is it possible that this driver is simply not resulting in an efficient KD of the receptor? I would be inclined to check this, but as a minimum I would be a bit more cautious with the interpretation of these data.
(4) Is it possible to perform at least one lifespan repeat with the other Tk RNAi line mentioned? This would further clarify that there are no off-target effects that can account for the phenotypes.
There are a few other experiments that I could suggest as I think they could enrich the current manuscript, but I do not believe they are essential for publication:
(5) The manuscript could be extended with a little more biochemical/cell biology analysis. For example, is it possible to look at Tk protein levels, Tk levels in circulation, or even TkR receptor activation or activation of its downstream signalling pathways? Comparing Ax and CR or Ap and CR one would expect to find differences consistent with the model proposed. This would add depth to the genetic analysis already conducted. Similarly, for insulin signalling - would it be possible to use some readout of the pathway activity and compare between Ax and CR or Ap and CR?
(6) The authors use a pan-acetyl-K antibody but are specifically interested in acetylated histones. Would it be possible to use antibodies for acetylated histones? This would have the added benefit that one can confirm the changes are not in the levels of histones themselves.
(7) I think the presentation of the results could be tightened a bit, with fewer sections and one figure per section.
Significance:
The main contribution of this manuscript is the identification of a mechanism that links the microbiota to lifespan. This is very exciting and topical for several reasons:
(1) The microbiota is very important for overall health but it is still unclear how. Studying the interaction between microbiota and health is an emerging, growing field, and one that has attracted a lot of interest, but one that is often lacking in mechanistic insight. Identifying mechanisms provides opportunities for therapies. The main impact of this study comes from using the fruit fly to identify a mechanism.
(2) It is very interesting that the authors focus on an endocrine mechanism, especially with the clear clinical relevance of gut hormones to human health recently demonstrated with new, effective therapies (e.g. Wegovy).
(3) Tk is emerging as an important fly hormone and this study adds a new and interesting dimension by placing TK between microbiota and lifespan.
I think the manuscript will be of great interest to researchers in ageing, human and animal physiology and in gut endocrinology and gut function.
Author response:
(1) General Statements
The goal of our study was to mechanistically connect microbiota to host longevity. We have done so using a combination of genetic and physiological experiments, which outline a role for a neuroendocrine relay mediated by the intestinal neuropeptide Tachykinin, and its receptor TkR99D in neurons. We also show a requirement for these genes in metabolic and healthspan effects of microbiota.
The referees' comments suggest they find the data novel and technically sound. We have added data in response to numerous points, which we feel enhance the manuscript further, and we have clarified text as requested. Reviewer #3 identified an error in Figure 4, which we have rectified. We felt that some specific experiments suggested in review would not add significant further depth, as we articulate below.
Altogether our reviewers appear to agree that our manuscript makes a significant contribution to both the microbiome and ageing fields, using a large number of experiments to mechanistically outline the role(s) of various pathways and tissues. We thank the reviewers for their positive contributions to the publication process.
(2) Description of the planned revisions
Reviewer #2:
Not…essential for publication…is it possible to look at Tk protein levels?
We have acquired a small amount of anti-TK antibody and we will attempt to immunostain guts associated with A. pomorum and L. brevis. We are also attempting the equivalent experiment in mouse colon reared with/without a defined microbiota. These experiments are ongoing, but we note that the referee feels that the manuscript is a publishable unit whether these stainings succeed or not.
(3) Description of the revisions that have already been incorporated in the transferred manuscript
Reviewer #1:
Can the authors state in the figure legends the numbers of flies used for each lifespan and whether replicates have been done?
We have incorporated the requested information into legends for lifespan experiments.
Do the interventions shorten lifespan relative to the axenic cohort? Or do they prevent lifespan extension by axenic conditions? Both statements are valid, and the authors need to be consistent in which one they use to avoid confusing the reader.
We read these statements differently. The only experiment in which a genetic intervention prevented lifespan extension by axenic conditions is neuronal TkR86C knockdown (Figure 6B-C). Otherwise, microbiota shortened lifespan relative to axenic conditions, and genetic knockdowns extend blocked this effect (e.g. see lines 131-133). We have ensured that the framing is consistent throughout, with text edited at lines 198-199, 298-299, 311-312, 345-347, 407-408, 424-425, 450, 497-503.
TkRNAi consistently reduces lipid levels in axenic flies (Figs 2E, 3D), essentially phenocopying the loss of lipid stores seen in control conventionally reared (CR) flies relative to control axenic. This suggests that the previously reported role of Tk in lipid storage - demonstrated through increased lipid levels in TkRNAi flies (Song et al (2014) Cell Rep 9(1): 40) - is dependent on the microbiota. In the absence of the microbiota TkRNAi reduces lipid levels. The lack of acknowledgement of this in the text is confusing
We have added text at lines 219-222 to address this point. We agree that this effect is hard to interpret biologically, since expressing RNAi in axenics has no additional effect on Tk expression (Figure S7). Consequently we can only interpret this unexpected effect as a possible off-target effect of RU feeding on TAG, specific to axenic flies. However, this possibility does not void our conclusion, because an off-target dimunition of TAG cannot explain why CR flies accumulate TAG following Tk<sup>RNAi</sup> induction. We hope that our added text clarifies.
I have struggled to follow the authors logic in ablating the IPCs and feel a clear statement on what they expected the outcome to be would help the reader.
We have added the requested statement at lines 423-424, explaining that we expected the IPC ablation to render flies constitutively long-lived and non-responsive to A pomorum.
Can the authors clarify their logic in concluding a role for insulin signalling, and qualify this conclusion with appropriate consideration of alternative hypotheses?
We have added our logic at lines 449-454. In brief, we conclude involvement for insulin signalling because FoxO mutant lifespan does not respond to Tk<sup>RNAi</sup>, and diminishes the lifespan-shortening effect of A. pomorum. However, we cannot state that the effects are direct because we do not have data that mechanistically connects Tk/TkR99D signalling directly in insulin-producing cells. The current evidence is most consistent with insulin signalling priming responses to microbiota/Tk/TkR99D, as per the newly-added text.
Typographical errors
We have remedied the highlighted errors, at lines 128-140.
Reviewer #2:
it would be good to show that the bacterial levels are not impacted [by TkRNAi]
We have quantified CFUs in CR flies upon ubiquitous TkRNAi (Figure S5), finding that the RNAi does not affect bacterial load. New text at lines 138-139 articulates this point.
The effect of Tk RNAi on TAG is opposite in CR and Ax or CR and Ap flies, and the knockdown shows an effect in either case (Figure 2E, Figure 3D). Why is this?
As per response to Reviewer #1, we have added text at lines 219-222 to address this point.
Is it possible to perform at least one lifespan repeat with the other Tk RNAi line mentioned?
We have added another experiment showing longevity upon knockdown in conventional flies, using an independent TkRNAi line (Figure S3).
Reviewer #3:
In Line243, the manuscript states that the reporter activity was not increased in the posterior midgut. However, based on the presented results in Fig4E, there is seemingly not apparent regional specificity. A more detailed explanation is necessary.
We thank the reviewer sincerely for their keen eye, which has highlighted an error in the previous version of the figure. In revisiting this figure we have noticed, to our dismay, that the figures for GFP quantification were actually re-plots of the figures for (ac)K quantification. This error led to the discrepancy between statistics and graphics, which thankfully the reviewer noticed. We have revised the figure to remedy our error, and the statistics now match the boxplots and results text.
Fig1C uses Adh for normalization. Given the high variability of the result, the authors should (1) check whether Adh expression levels changed via bacterial association
We selected Adh on the basis of our RNAseq analysis, which showed it was not different between AX and CV guts, whereas many commonly-used “housekeeping” genes were. We have now added a plot to demonstrate (Figure S2).
The statement in Line 82 that EEs express 14 peptide hormones should be supported with an appropriate reference
We have added the requested reference (Hung et al, 2020) at line 86.
(4) Description of analyses that authors prefer not to carry out
Reviewer #1:
I'd encourage the authors to provide lifespan plots that enable comparison between all conditions
We have avoided this approach because the number of survival curves that would need to be presented on the same axis (e.g. 16 for Figure 5) is not legible. However we have ensured that axes on faceted plots are equivalent and with grid lines for comparison. Moreover, our approach using statistical coefficients (EMMs) enables direct quantitative comparison of the differences among conditions.
Reviewer #2:
Is it possible that this driver is simply not resulting in an efficient KD of the receptor? I would be inclined to check this
This comment relates to Figure 7G. We do see an effect of the knockdown in this experiment, so we believe that the knockdown is effective. However the direction of response is not consistent with our hypothesis so the experiment is not informative about the role of these cells. We therefore feel there is little to be gained by testing efficacy of knockdown, which would also be technically challenging because the cells are a small population in a larger tissue which expresses the same transcripts elsewhere (i.e. necessitating FISH).
Would it be possible to use antibodies for acetylated histones?
The comment relates to Figure 4C-E. The proposed studies would be a significant amount of work because, to our knowledge, the specific histone marks which drive activation in TK+ cells remain unknown. On the other hand, we do not see how this information would enrich the present story, rather such experiments would appear to be the beginning of something new. We therefore agree with Reviewer #1 (in cross-commenting) that this additional work is not justified.
Reviewer #3:
Tk+ EEC activity should be assessed directly, rather than relying solely on transcript levels. Approaches such as CaLexA or GCaMP could be used.
We agree with reviewers 1-2 (in cross-commenting) that this proposal is non-trivial and not justified by the additional insight that would be gained. As described above, we are attempting to immunostain Tk, which if successful will provide a third line of evidence for regulation of Tk+ cells. However we note that we already have the strongest possible evidence for a role of these cells via genetic analysis (Figure 5).
While the difficulty of maintaining lifelong axenic conditions is understandable, it may still be feasible to assess the induction of Tk (ie. Tk transcription or EE activity upregulation) by the microbiome on males.
As the reviewer recognises, maintaining axenic experiments for months on end is not trivial. Given the tendency for males either to simply mirror female responses to lifespan-extending interventions, or to not respond at all, we made the decision in our work to only study females. We have instead emphasised in the manuscript that results are from female flies.
TkR86C, in addition to TkR99D, may be involved in the A. pomorum-lifespan interaction. Consider revising the title to refer more generally to the "tachykinin receptor" rather than only TkR99D.
We disagree with this interpretation: the results do not show that TkR86C-RNAi recapitulates the effect of enteric Tk-RNAi. A potentially interesting interaction is apparent, but the data do not support a causal role for TkR86C. A causal role is supported only for TkR99D, knockdown of which recapitulates the longevity of axenic flies and Tk<sup>RNAi</sup> flies_._ Therefore we feel that our current title is therefore justified by the data, and a more generic version would misrepresent our findings.
The difference between "aging" and "lifespan" should also be addressed.
The smurf phenotype is a well-established metric of healthspan. Moreover, lifespan is the leading aggregate measure of ageing. We therefore feel that the use of “ageing” in the title is appropriate.
If feasible, assessing foxo activation would add mechanistic depth. This could be done by monitoring foxo nuclear localization or measuring the expression levels of downstream target genes.
Foxo nuclear localisation has already been shown in axenic flies (Shin et al, 2011). We have added text and citation at lines 401-402.
Note: This response was posted by the corresponding author to Review Commons. The content has not been altered except for formatting.
Learn more at Review Commons
The PDF version of point-by-point response includes figures (I, II, III,... IX) that are not included in the manuscript nor in this post but serve to illustrate and clarify our replies to the reviewers' comments.
Dear Editor,
Many thanks for forwarding the comments from reviewers #1-#4 regarding our manuscript (Preprint #RC-2025-03087144), entitled "HIV-1 Envelope glycoprotein modulates CXCR4 clustering and dynamics on the T cell membrane", by Quijada-Freire A. et al.
We have carefully reviewed all reviewer comments and prepared our specific, detailed responses. Alongside this, we have created a revised version of the manuscript to post them on BioRxiv, and we are pleased to announce that we will transfer this new version to an affiliate journal for consideration.
Reviewer #1
Thank you very much for considering that our manuscript evaluates an important question and that the reagents used are well prepared and characterized. We also much appreciate that you consider the information generated as potentially useful for those studying HIV infection processes and strategies to prevent infection.
- While a single particle tracking routine was applied to the data, it's not clear how the signal from a single GFP was defined and if movement during the 100 ms acquisition time impacts this. My concern would be that the routine is tracking fluctuations, and these are related to single particle dynamics, it appears from the movies that the density or the GFP tagged receptors in the cells is too high to allow clear tracking of single molecules. SPT with GFP is very difficult due to bleaching and relatively low quantum yield. Current efforts in this direction that are more successful include using SNAP tags with very photostable organic fluorophores. The data likely does mean something is happening with the receptor, but they need to be more conservative about the interpretation. *
Some of the paradoxical effects might be better understood through deeper analysis of the SPT data, particularly investigation of active transport and more detailed analysis of "immobile" objects. Comments on early figures illustrate how this could be approached. This would require selecting acquisitions where the GFP density is low enough for SPT and performing a more detailed analysis, but this may be difficult to do with GFP.
When the authors discuss clusters of 3, how do they calibrate the value of GFP and the impact of diffusion on the measurement. One way to approach this might be single molecules measurements of dilute samples on glass vs in a supported lipid bilayer to map the streams of true immobility to diffusion at >1 µm2/sec.
We fully understand the reviewer's apprehensions regarding the application of these high-end biophysical techniques, in particular the associated complexity of the data analysis. We provide below extensive explanations on our methodology, which we hope will satisfactorily address all of the reviewer's concerns.
We would first like to emphasize that the experimental conditions and the quantitative analysis used in our current experiments are similar to the established protocols and methodologies applied by our group previously (Martinez-Muñoz et al. Mol. Cell, 2018; García-Cuesta et al. PNAS, 2022; Gardeta et al. Frontiers in Immunol., 2022; García-Cuesta et al.eLife, 2024; Gardeta et al. Cell. Commun. Signal., 2025) and by others (Calebiro et al. PNAS, 2013; Jaqaman et al. Cell,2011; Mattila et al. Immunity, 2013; Torreno-Pina et al. PNAS, 2014; Torreno-Pina et al. PNAS, 2016).
As SPT (single-particle tracking) experiments require low-expressing conditions in order to follow individual trajectories (Manzo & García-Parajo Rep. Prog. Phys., 2015), we transiently transfected Jurkat CD4+ cells with CXCR4-AcGFP or CXCR4R334X-AcGFP. At 24 h post-transfection, cells expressing low CXCR4-AcGFP levels were selected by a MoFlo Astrios Cell Sorter (Beckman-Coulter) to ensure optimal conditions for SPT. Using Dako Qifikit (DakoCytomation), we quantified the number of CXCR4 receptors and found ∼8,500 - 22,000 CXCR4-AcGFP receptors/cell, which correspond to a particle density ∼2 - 4.5 particles/mm2 (Figure I, only for review purposes) and are similar to the expression levels found in primary human lymphocytes.
These cells were resuspended in RPMI supplemented with 2% FBS, NaPyr and L-glutamine and plated on 96-well plates for at least 2 h. Cells were centrifuged and resuspended in a buffer with HBSS, 25 mM HEPES, 2% FBS (pH 7.3) and plated on glass-bottomed microwell dishes (MatTek Corp.) coated with fibronectin (FN) (Sigma-Aldrich, 20 mg/ml, 1 h, 37{degree sign}C). To observe the effect of the ligand, we coated dishes with FN + CXCL12; FN + X4-gp120 or FN + VLPs, as described in material and methods; cells were incubated (20 min, 37{degree sign}C, 5% CO2) before image acquisition.
For SPT measurements, we use a total internal reflection fluorescence (TIRF) microscope (Leica AM TIRF inverted) equipped with an EM-CCD camera (Andor DU 885-CS0-#10-VP), a 100x oil-immersion objective (HCX PL APO 100x/1.46 NA) and a 488-nm diode laser. The microscope was equipped with incubator and temperature control units; experiments were performed at 37{degree sign}C with 5% CO2. To minimize photobleaching effects before image acquisition, cells were located and focused using the bright field, and a fine focus adjustment in TIRF mode was made at 5% laser power, an intensity insufficient for single-particle detection that ensures negligible photobleaching. Image sequences of individual particles (500 frames) were acquired at 49% laser power with a frame rate of 10 Hz (100 ms/frame). The penetration depth of the evanescent field used was 90 nm.
We performed automatic tracking of individual particles using a very well established and common algorithm first described by Jaqaman (Jaqaman et al. Nat. Methods, 2008). Nevertheless, we would stress that we implemented this algorithm in a supervised fashion, i.e., we visually inspect each individual trajectory reconstruction in a separate window. Indeed, this algorithm is not able to quantify merging or splitting events.
We follow each individual fluorescence spot frame-by-frame using a three-by-three matrix around the centroid position of the spot, as it diffuses on the cell membrane. To minimize the effect of photon fluctuations, we averaged the intensity over 20 frames. Nevertheless, to assure the reviewer that most of the single molecule traces last for at least 50 frames (i.e., 5 seconds), we provide the following data and arguments. We currently measure the photobleaching times from individual CD86-AcGFP spots exclusively having one single photobleaching step to guarantee that we are looking at individual CD86-AcGFP molecules. The distribution of the photobleaching times is shown below (Figure II, only for review purposes). Fitting of the distribution to a single exponential decay renders a t0 value of ~5 s. Thus, with 20 frames averaging, we are essentially measuring the whole population of monomers in our experiments. As the survival time of a molecule before photobleaching will strongly depend on the excitation conditions, we used low excitation conditions (2 mW laser power, which corresponds to an excitation power density of ~0.015 kW/cm2 considering the illumination region) and longer integration times (100 ms/frame) to increase the signal-to-background for single GFP detection while minimizing photobleaching.
To infer the stoichiometry of receptor complexes, we also perform single-step photobleaching analysis of the TIRF trajectories to establish the existence of different populations of monomers, dimers, trimers and nanoclusters and extract their percentage. Some representative trajectories of CXCR4-AcGFP with the number of steps detected are shown in new Supplementary Figure 1.
The emitted fluorescence (arbitrary units, a.u.) of each spot in the cells is quantified and normalized to the intensity emitted by monomeric CD86-AcGFP spots that strictly showed a single photobleaching step (Dorsch et al. Nat. Methods,2009). We have preferred to use CD86-AcGFP in cells rather than AcGFP on glass to exclude any potential effect on the different photodynamics exhibited by AcGFP when bound directly to glass. We have also previously shown pharmacological controls to exclude CXCL12-mediated receptor clustering due to internalization processes (Martinez-Muñoz et al. Mol. Cell, 2018) that, together with the evaluation of single photobleaching steps and intensity histograms, allow us to exclude the presence of vesicles in our data. Thus, the dimers, trimers and nanoclusters found in our data do correspond to CXCR4 molecules on the cell surface. Finally, distribution of monomeric particle intensities, obtained from the photobleaching analysis, was analyzed by Gaussian fitting, rendering a mean value of 980 {plus minus} 86 a.u. This value was then used as the monomer reference to estimate the number of receptors per particle in both cases, CXCR4-AcGFP and CXCR4R334X-AcGFP (new Supplementary Figure 1).
- I understand that the CXCL12 or gp120 are attached to the substrate with fibronectin for adhesion. I'm less clear how how that VLPs are integrated. Were these added to cells already attached to FN?*
For TIRF-M experiments, cells were adhered to glass-bottomed microwell dishes coated with fibronectin, fibronectin + CXCL12, fibronectin + X4-gp120, or fibronectin + VLPs. As for CXCL12 and X4-gp120, the VLPs were attached to fibronectin taking advantage of electrostatic interactions. To clarify the integration of the VLPs in these assays, we have stained the microwell dishes coated with fibronectin and those coated with fibronectin + VLPs with wheat germ agglutinin (WGA) coupled to Alexa647 (Figure III, only for review purposes) and evaluated the staining by confocal microscopy. These results indicate the presence of carbohydrates on the VLPs and are, therefore, indicative of the presence of VLPs on the fibronectin layer.
Moreover, it is important to remark that the effect of the VLPs on CXCR4 behavior at the cell surface observed by TIRF-M confirmed that the VLPs remained attached to the substrate during the experiment.
- Fig 1A- The classification of particle tracks into mobile and immobile is overly simplistic description that goes back to bulk FRAP measurements and it not really applicable to single molecule tracking data, where it's rare to see anything that is immobile and alive. An alternative classification strategy uses sub-diffusion, normal diffusion and active diffusion (or active transport) to descriptions and particles can transition between these classes over the tracking period. Fig 1B- this data might be better displayed as histograms showing distributions within the different movement classes.*
In agreement with the reviewer's commentary, the majority of the particles detected in our TIRF-M experiments were indeed mobile. However, we also detected a variable, and biologically appreciable, percentage of immobile particles depending on the experimental condition analyzed (Figure 1A in the main manuscript). To establish a stringent threshold for identifying these immobile particles under our specific experimental conditions, we used purified monomeric AcGFP proteins immobilized on glass coverslips. Our analysis demonstrated that 95% of these immobilized proteins showed a diffusion coefficient £0.0015 mm2/s; consequently, this value was established as the cutoff to distinguish immobile from mobile trajectories. While the observation of truly immobile entities in a dynamic, living system is rare, the presence of these particles under our conditions is biologically significant. For instance, the detection of large, immobile receptor nanoclusters at the plasma membrane is entirely consistent with facilitating key cellular processes, such as enabling the robust signaling cascade triggered by ligand binding or promoting the crucial events required for efficient viral entry into the cells.
Regarding the mobile receptors (defined as those with D1-4 values exceeding 0.0015 mm2/s), we observed distinct diffusion profiles derived from mean square displacement (MSD) plots (Figure V) (Manzo & García-Parajo Rep. Prog. Phys., 2015), which were further classified based on motion, using the moment scaling spectrum (MSS) (Ewers et al. PNAS, 2005). Under all experimental conditions, the majority of mobile particles, ∼85%, showed confined diffusion: for example under basal conditions, without ligand addition, ∼90% of mobile particles showed confined diffusion, ∼8.5% showed Brownian-free diffusion and ∼1.5% exhibited directed motion (new Supplementary Figure 5A in the main manuscript). These data have been also included in the revised manuscript to show, in detail, the dynamic parameters of CXCR4.
Due to the space constraints, it is very difficult to include all the figures generated. However, to ensure comprehensive assessment and transparency (for the purpose of this review), we have included below representative plots of the MSD values as a function of time from individual trajectories, showing different types of motion obtained in our experiments (Figure IV, only for review purposes).
- Fig 1C,D- It would be helpful to see a plot of D vs MSI at a single particle level. In comparing C and D I'm surprised there is not a larger difference between CXCL12 and X4-gp120. It would also be very important to see the behaviour of X4-gp120 on the CXCR4 deficient Jurkat that would provide a picture of CD4 diffusion. The CXCR4 nanoclustering related to the X4-gp120 could be dominated by CD4 behaviour.*
As previously described, all analyses were performed under SPT conditions (see previous response to point 1 in this reply). Figure 1C details the percentage of oligomers (>3 receptors/particle) calibrated using Jurkat CD4+ cells electroporated with monomeric CD86-AcGFP (Dorsch et al. Nat. Methods, 2009). The monomer value was determined by analyzing photobleaching steps as described in our previous response to point 1.
In our experiments, we observed a trend towards a higher number of oligomers upon activation with CXCL12 compared with X4-gp120. This trend was further supported by measurements of Mean Spot Intensity. However, the values are also influenced by the number of larger spots, which represents a minor fraction of the total spots detected.
The differences between the effect triggered by CXCL12 or X4-gp120 might also be attributed to a combination of factors related to differences in ligand concentration, their structure, and even to the technical requirements of TIRF-M. Both ligands are in contact with the substrate (fibronectin) and the specific nature of this interaction may differ between both ligands and influence their accessibility to CXCR4. Moreover, the requirement of the prior binding of gp120 to CD4 before CXCR4 engagement, in contrast to the direct binding of CXCL12 to CXCR4, might also contribute to the differences observed.
We previously reported that CXCL12-mediated CXCR4 dynamics are modulated by CD4 co-expression (Martinez-Muñoz et al. Mol. Cell, 2018). We have now detected the formation of CD4 heterodimers with both CXCR4 and CXCR4R334X, and found that these conformations are influenced by gp120-VLPs. In the present manuscript, we did not focus on CD4 clustering as it has been extensively characterized previously (Barrero-Villar et al. J. Cell Sci., 2009; Jiménez-Baranda et al. Nat. Cell. Biol., 2007; Yuan et al. Viruses, 2021). Regarding the investigation of the effects of X4-gp120 on CXCR4-deficient Jurkat cells, which would provide a picture of CD4 diffusion, we would note that a previous report has already addressed this issue using single-molecule super-resolution imaging, and revealed that CD4 molecules on the cell membrane are predominantly found as individual molecules or small clusters of up to 4 molecules, and that the size and number of these clusters increases upon virus binding or gp120 activation (Yuan et al. Viruses, 2021).
- Fig S1D- This data is really interesting. However, if both the CD4 and the gp120 have his tags they need to be careful as poly-His tags can bind weakly to cells and increasing valency could generate some background. So, they should make the control is fair here. Ideally, using non-his tagged person of sCD4 and gp120 would be needed ideal or they need a His-tagged Fab binding to gp120 that doesn't induce CXCR4 binding.*
New Supplementary Figure 2D shows that X4-gp120 does not bind Daudi cells (these cells do not express CD4) in the absence of soluble CD4. While the reviewer is correct to state that both proteins contain a Histidine Tag, cell binding is only detected if X4-gp120 binds sCD4. Nonetheless, we have included in the revised Supplementary Figure 2D a control showing the negative binding of sCD4 to Daudi cells in the absence of X4-gp120. Altogether, these results confirm that only sCD4/X4-gp120 complexes bind these cells.
- Fig S4- Panel D needs a scale bar. I can't figure out what I'm being shown without this.*
Apologies. A scale bar has been included in this panel (new Supplementary Figure 6D).
Reviewer #2
- This study is well described in both the main text and figures. Introduction provides adequate background and cites the literature appropriately. Materials and Methods are detailed. Authors are careful in their interpretations, statistical comparisons, and include necessary controls in each experiment. The Discussion presents a reasonable interpretation of the results. Overall, there are no major weaknesses with this manuscript.*
We very much appreciate the positive comments of the reviewer regarding the broad interest and strength of our work.
- NL4-3deltaIN and immature HIV virions are found to have less associated gp120 relative to wild-type particles. It is not obvious why this is the case for the deltaIN particles or genetically immature particles. Can the authors provide possible explanations? (A prior paper was cited, Chojnacki et al Science, 2012 but can the current authors provide their own interpretation.)*
Our conclusion from the data is actually exactly the opposite. As shown in Figure 2D, the gp120 staining intensity was higher for NL4-3DIN particles (1,786 a.u.) than for gp120-VLPs (1,223 a.u.), indicating lower expression of Env proteins in the latter. Furthermore, analysis of gp120 intensity per particle (Figure 2E) confirmed that gp120-VLPs contained fewer gp120 molecules per particle than NL4-3DIN virions. These levels were comparable with, or even lower than, those observed in primary HIV-1 viruses (Zhu et al. Nature, 2006). This reduction was a direct consequence of the method used to generate the VLPs, as our goal was to produce viral particles with minimal gp120 content to prevent artifacts in receptor clustering that might occur using high levels of Env proteins in the VLPs to activate the receptors.
This misunderstanding may arise from the fact that we also compared Gag condensation and Env distribution on the surface of gp120-VLPs with those observed in genetically immature particles and integrase-defective NL4-3ΔIN virions, which served as controls. STED microscopy data revealed differences in Env distribution between gp120-VLPs and NL4-3ΔIN virions, supporting the classification of gp120-VLPs as mature particles (Figure 2 A,B).
Reviewer #3
We thank the reviewer for considering that our work offers new insights into the spatial organization of receptors during HIV-1 entry and infection and that the manuscript is well written, and the findings significant.
- For mechanistic basis of gp120-CXCR4 versus CXCL12-CXCR4 differences. Provide additional structural or biochemical evidence to support the claim that gp120 stabilises a distinct CXCR4 conformation compared to CXCL12. If feasible, include molecular modelling, mutagenesis, or cross-linking experiments to corroborate the proposed conformational differences.*
We appreciate the opportunity to clarify this point. The specific claim that gp120 stabilizes a conformation of CXCR4 that is distinct from the CXCL12-bound state was not explicitly stated in our manuscript, although we agree that our data strongly support this possibility. It is important to consider that CXCL12 binds directly to CXCR4, whereas gp120 requires prior sequential binding to CD4, and its subsequent interaction is with a CXCR4 molecule that is already forming part of the CD4/CXCR4 complex, as demonstrated by our FRET experiments and supported by previous studies (Zaitseva et al. J. Leuk. Biol., 2005; Busillo & Benovic Biochim. Biophys. Acta, 2007; Martínez-Muñoz et al. PNAS, 2014). This difference makes it inherently complex to compare the conformational changes induced by gp120 and CXCL12 on CXCR4.
However, our findings show that both stimuli induce oligomerization of CXCR4, a phenomenon not observed when mutant CXCR4R334X was exposed to the chemokine CXCL12 (García-Cuesta et al. PNAS, 2022).
FRET analysis revealed distinct FRET50 values for CD4/CXCR4 (2.713) and CD4/CXCR4R334X (0.399) complexes, suggesting different conformations for each complex. Consistent with previous reports (Balabanian et al. Blood, 2005; Zmajkovicova et al. Front. Immunol., 2024; García-Cuesta et al. PNAS, 2022), the molecular mechanisms activated by CXCL12 are distinct when comparing CXCR4 with CXCR4R334X. For instance, CXCL12 induces internalization of CXCR4, but not of mutant CXCR4R334X. Conversely, X4-gp120 triggers approximately 25% internalization of both receptors. Similarly, CXCL12 does not promote CD4 internalization in cells co-expressing CXCR4 or CXCR4R334X, whereas X4-gp120 does, although CD4 internalization was significantly higher in cells co-expressing CXCR4.
These findings suggest that CD4 influences the conformation and the oligomerization state of both co-receptors. To further support this hypothesis, we have conducted new in silico molecular modeling of CD4 in complex with either CXCR4 or its mutant CXCR4R334X using AlphaFold 3.0 (Abramson et al. Nature, 2024). The server was provided with both sequences, and the interaction between the two molecules for each protein was requested. It produced a number of solutions, which were then analyzed using the software ChimeraX 1.10 (Meng et al. Protein Sci., 2023). CXCR4 and its mutant, CXCR4R334X bound to CD4, were superposed using one of the CD4 molecules from each complex, with the aim of comparing the spatial positioning of CD4 molecules when interacting with CXCR4.
As illustrated in Figure V (only for review purposes), the superposition of the CD4/CXCR4 complexes was complete. However, when CD4/CXCR4 complexes were superimposed with CD4/CXCR4R334X complexes using the same CD4 molecule as a reference, indicated by an arrow in the figure, a clear structural deviation became evident. The main structural difference detected was the positioning of the CD4 transmembrane domains when interacting with either the wild-type or mutant CXCR4. While in complexes with CXCR4, the angle formed by the lines connecting residues E416 at the C-terminus end of CD4 with N196 in CXCR4 was 12{degree sign}, for the CXCR4R334X complex, this angle increased to 24{degree sign}, resulting in a distinct orientation of the CD4 extracellular domain (Figure VI, only for review purposes).
To further analyze the models obtained, we employed PDBsum software (Laskowski & Thornton Protein Sci., 2021) to predict the CD4/CXCR4 interface residues. Data indicated that at least 50% of the interaction residues differed when the CD4/CXCR4 interaction surface was compared with that of the CD4/CXCR4R334X complex (Figure VII, only for review purposes). It is important to note that while some hydrogen bonds were present in both complex models, others were exclusive to one of them. For instance, whereas Cys394(CD4)-Tyr139 and Lys299(CD4)-Glu272 were present in both CD4/CXCR4 and CD4/CXCR4R334X complexes, the pairs Asn337(CD4)-Ser27(CXCR4R334X) and Lys325(CD4)-Asp26(CXCR4R334X) were only found in CD4/CXCR4R334X complexes.
These findings, which are consistent with our FRET results, suggest distinct interaction surfaces between CD4 and the two chemokine receptors. Overall, these results are compatible with differences in the spatial conformation adopted by these complexes.
- For Empty VLP effects on CXCR4 dynamics: Explore potential causes for the observed effects of Env-deficient VLPs. It's valuable to include additional controls such as particles from non-producer cells, lipid composition analysis, or blocking experiments to assess nonspecific interactions. *
As VLPs are complex entities, we thought that the relevant results should be obtained comparing the effects of Env(-) VLPs with gp120-VLPs. Therefore, we would first remark that regardless of the effect of Env(-) VLPs on CXCR4 dynamics, the most evident finding in this study is the strong effect of gp120-VLPs compared with control Env(-) VLPs. Nevertheless, regarding the effect of the Env(-) VLPs compared with medium, we propose several hypotheses. As several virions can be tethered to the cell surface via glycosaminoglycans (GAGs), we hypothesized that VLPs-GAGs interactions might indirectly influence the dynamics of CXCR4 and CXCR4R334X at the plasma membrane. Additionally, membrane fluidity is essential for receptor dynamics, therefore VLPs interactions with proteins, lipids or any other component of the cell membrane could also alter receptor behavior. It is well known that lipid rafts participate in the interaction of different viruses with target cells (Nayak & Hu Subcell. Biochem., 2004; Manes et al. Nat. Rev. Immunol., 2003; Rioethmullwer et al. Biochim. Biophys. Acta, 2006) and both the lipid composition and the presence of co-expressed proteins modulate ligand-mediated receptor oligomerization (Gardeta et al. Frontiers in Immunol., 2022; Gardeta et al. Cell. Commun. Signal., 2025). We have thus performed Raster Image Correlation Spectroscopy (RICS) analysis to assess membrane fluidity through membrane diffusion measurements on cells treated with Env(-) VLPs.
Jurkat cells were labeled with Di-4-ANEPPDHG and seeded on FN and on FN + VLPs prior to analysis by RICS on confocal microscopy. The results indicated no significant differences in membrane diffusion under the treatment tested, thereby discarding an effect of VLPs on overall membrane fluidity (Figure VIII, only for review purposes).
Nonetheless, these results do not rule out other non-specific interactions of Env(-) VLPs with membrane proteins that could affect receptor dynamics. For instance, it has been reported that C-type lectin DC-SIGN acts as an efficient docking site for HIV-1 (Cambi et al. J. Cell. Biol., 2004; Wu & KewalRamani Nat. Rev. Immunol., 2006). However, a detailed investigation of these possible mechanisms is beyond the scope of this manuscript.
- For Direct link between clustering and infection efficiency - Test whether disruption of CXCR4 clustering (e.g., using actin cytoskeleton inhibitors, membrane lipid perturbants, or clustering-deficient mutants) alters HIV-1 fusion or infection efficiency*.
Designing experiments using tools that disrupt receptor clustering by interacting with the receptors themselves is difficult and challenging, as these tools bind the receptor and can therefore alter parameters such as its conformation and/or its distribution at the cell membrane, as well as affect some cellular processes such as HIV-1 attachment and cell entry. Moreover, effects on actin polymerization or lipids dynamics can affect not only receptor clustering but also impact on other molecular mechanisms essential for efficient infection.
Many previous reports have, nonetheless, indirectly correlated receptor clustering with cell infection efficiency. Cholesterol plays a key role in the entry of several viruses. Its depletion in primary cells and cell lines has been shown to confer strong resistance to HIV-1-mediated syncytium formation and infection by both CXCR4- and CCR5-tropic viruses (Liao et al. AIDS Res. Hum. Retrovisruses, 2021). Moderate cholesterol depletion also reduces CXCL12-induced CXCR4 oligomerization and alters receptor dynamics (Gardeta et al. Cell. Commun. Signal., 2025). By restricting the lateral diffusion of CD4, sphingomyelinase treatment inhibits HIV-1 fusion (Finnegan et al. J. Virol., 2007). Depletion of sphingomyelins also disrupts CXCL12-mediated CXCR4 oligomerization and its lateral diffusion (Gardeta et al. Front Immunol., 2022). Additional reports highlight the role of actin polymerization at the viral entry site, which facilitates clustering of HIV-1 receptors, a crucial step for membrane fusion (Serrano et al. Biol. Cell., 2023). Blockade of actin dynamics by Latrunculin A treatment, a drug that sequesters actin monomers and prevents its polymerization, blocks CXCL12-induced CXCR4 dynamics and oligomerization (Martínez-Muñoz et al. Mol. Cell, 2018).
Altogether, these findings strongly support our hypothesis of a direct link between CXCR4 clustering and the efficiency of HIV-1 infection.
- CD4/CXCR4 co-endocytosis hypothesis - Support the proposed model with direct evidence from live-cell imaging or co-localization experiments during viral entry. Clarification is needed on whether internalization is simultaneous or sequential for CD4 and CXCR4.*
When referring to endocytosis of CD4 and CXCR4, we only hypothesized that HIV-1 might promote the internalization of both receptors either sequentially or simultaneously. The hypothesis was based in several findings:
1) Previous studies have suggested that HIV-1 glycoproteins can reduce CD4 and CXCR4 levels during HIV-1 entry (Choi et al. Virol. J., 2008; Geleziunas et al. FASEB J, 1994; Hubert et al. Eur. J. Immunol., 1995).
2) Receptor endocytosis has been proposed as a mechanism for HIV-1 entry (Daecke et al. J. Virol., 2005; Aggarwal et al.Traffick, 2017; Miyauchi et al. Cell, 2009; Carter et al. Virology, 2011).
3) Our data from cells activated with X4-gp120 demonstrated internalization of CD4 and chemokine receptors, which correlated with HIV-1 infection in PBMCs from WHIM patients and healthy donors.
4) CD4 and CXCR4 have been shown to co-localize in lipid rafts during HIV-1 infection (Manes et al. EMBO Rep., 2000; Popik et al. J. Virol., 2002)
5) Our FRET data demonstrated that CD4 and CXCR4 form heterocomplexes and that FRET efficiency increased after gp120-VLPs treatment.
We agree with the reviewer that further experiments are required to test this hypothesis, however, we believe that this is beyond the scope of the current manuscript.
Minor Comments:
- The conclusions rely solely on the HXB2 X4-tropic Env. It would strengthen the study to assess whether other X4 or dual-tropic strains induce similar receptor clustering and dynamics.*
The primary goal of our current study was to investigate the dynamics of the co-receptor CXCR4 during HIV-1 infection, motivated by previous reports showing CD4 oligomerization upon HIV-1 binding and gp120 stimulation (Yuan et al.Viruses, 2021). We initially used a recombinant X4-gp120, a soluble protein that does not fully replicate the functional properties of the native HIV-1 Env. Previous studies have shown that Env consists of gp120 trimers, which redistribute and cluster on the surface of virions following proteolytic Gag cleavage during maturation (Chojnacki et al. Nat. Commun., 2017). An important consideration in receptor oligomerization studies is the concentration of recombinant gp120 used, as it does not accurately reflect the low number of Env trimers present on native HIV-1 particles (Hart et al. J. Histochem. Cytochem., 1993; Zhu et al. Nature, 2006). To address these limitations, we generated virus-like particles (VLPs) containing low levels of X4-gp120 and repeated the dynamic analysis of CXCR4. The use of primary HIV-1 isolates was limited, in this project, to confirm that PBMCs from both healthy donors and WHIM patients were equally susceptible to infection. This result using a primary HIV-1 virus supports the conclusion drawn from our in vitroapproaches. We thus believe that although the use of other X4- and dual-tropic strains may complement and reinforce the analysis, it is far beyond the scope of the current manuscript.
- Given the observed clustering effects, it would be valuable to explore whether gp120-induced rearrangements alter epitope exposure to broadly neutralizing antibodies like 17b or 3BNC117. This would help connect the mechanistic insights to therapeutic relevance.*
As 3BNC117, VRC01 and b12 are broadly neutralizing mAbs that recognize conformational epitopes on gp120 (Li et al. J. Virol., 2011; Mata-Fink et al. J. Mol. Biol., 2013), they will struggle to bind the gp120/CD4/CXCR4 complex and therefore may not be ideal for detecting changes within the CD4/CXCR4 complex. The experiment suggested by the reviewer is thus challenging but also very complex. It would require evaluating antibody binding in two experimental conditions, in the absence and in the presence of oligomers. However, our data indicate that receptor oligomerization is promoted by X4-gp120 binding, and the selected antibodies are neutralizing mAbs, so they should block or hinder the binding of gp120 and, consequently, receptor oligomerization. An alternative approach would be to study the neutralizing capacity of these mAbs on cells expressing CD4/CXCR4 or CD4/CXCR4R334X complexes. Variations in their neutralizing activity could be then extrapolated to distinct gp120 conformations, which in turn may reflect differences between CD4/CXCR4 and CD4/CXCR4R334X complexes.
We thus assessed the ability of the VRC01 and b12, anti-gp120 mAbs, which were available in our laboratory, to neutralize gp120 binding on cells expressing CD4/CXCR4 or CD4/CXCR4R334X. Specifically, increasing concentrations of each antibody were preincubated (60 min, 37ºC) with a fixed amount of X4-gp120 (0.05 mg/ml). The resulting complexes were then incubated with Jurkat cells expressing CD4/CXCR4 or CD4/CXCR4R334X (30 min, 37ºC) and, finally, their binding was analyzed by flow cytometry. Although we did not observe statistically significant differences in the neutralization capacity of b12 or VRC01 for the binding of X4-gp120 depending on the presence of CXCR4 or CXCR4334X, we observed a trend for greater concentrations of both mAbs to neutralize X4-gp120 binding in Jurkat CD4/CXCR4 cells than in Jurkat CD4/CXCR4R334X cells (Figure IX, only for review purposes).
These slight alterations in the neutralizing capacity of b12 and VRC01 mAbs may thus suggest minimal differences in the conformations of gp120 depending of the coreceptor used. We also detected that X4-gp120 and VLPs expressing gp120, which require initial binding to CD4 to engage the chemokine receptor, stabilized oligomers of both CXCR4 and CXCR4R334X, but FRET data indicated distinct FRET50 values between the partners, (2.713) for CD4/CXCR4 and (0.399) for CD4/CXCR4R334X (Figure 5A,B in the main manuscript). Moreover, we also detected significantly more CD4 internalization mediated by X4-gp120 in cells co-expressing CD4 and CXCR4 than in those co-expressing CD4 and CXCR4R334X (Figure 6 in the main manuscript). Overall these latter data and those included in Figures V, VI and VII of this reply, indicate distinct conformations within each receptor complexes.
- TIRF imaging limits analysis to the cell substrate interface. It would be useful to clarify whether CXCR4 receptor clustering occurs elsewhere, such as at immunological synapses or during cell-to-cell contact.*
In recent years, chemokine receptor oligomerization has gained significant research interest due to its role in modulating the ability of cells to sense chemoattractant gradients. This molecular organization is now recognized as a critical factor in governing directed cell migration (Martínez-Muñoz et al. Mol. Cell, 2018; García-Cuesta et al. PNAS, 2022, Hauser et al.Immunity, 2016). In addition, advanced imaging techniques such as single-molecule and super-resolution microscopy have been used to investigate the spatial distribution and dynamic behaviour of CXCR4 within the immunological synapse in T cells (Felce et al. Front. Cell Dev. Biol., 2020). Building on these findings, we are currently conducting a project focused on characterizing CXCR4 clustering specifically within this specialized cellular region.
- In LVP experiments, it would be useful to report transduction efficiency (% GFP+ cells) alongside MSI data to relate VLP infectivity with receptor clustering functionally.*
These experiments were designed to validate the functional integrity of the gp120 conformation on the LVPs, confirming their suitability for subsequent TIRF microscopy. Our objective was to establish a robust experimental tool rather than to perform a high-throughput quantification of transduction efficiency. It is for that reason that these experiments were included in new Supplementary Figure S6, which also contains the complete characterization of gp120-VLPs and LVPs. In such experimental conditions, quantifying the percentage of GFP-positive cells relative to the total number of cells plated in each well is very difficult. However, in line with the reviewer's commentary and as we used the same number of cells in each experimental condition, we have included, in the revised manuscript, a complementary graph illustrating the GFP intensity (arbitrary units) detected in all the wells analyzed (new Supplementary Fig. 6E).
- To ensure that differences in fusion events (Figure 7B) are attributable to target cell receptor properties, consider confirming that effector cells express similar levels of HIV-1 Env. Quantifying gp120 expression by flow cytometry or western blot would rule out the confounding effects of variable Env surface density.*
In these assays (Figure 7B), we used the same effector cells (cells expressing X4-gp120) in both experimental conditions, ensuring that any observed differences should be attributable solely to the target cells, either JKCD4X4 or JKCD4X4R334X. For this reason, in Figure 7A we included only the binding of X4-gp120 to the target cells which demonstrated similar levels of the receptors expressed by the cells.
- HIV-mediated receptor downregulation may occur more slowly than ligand-induced internalization. Including a 24-hour time point would help assess whether gp120 induces delayed CD4 or CXCR4 loss beyond the early effects shown and to better capture potential delayed downregulation induced by gp120.*
The reviewer suggests using a 24-hour time point to facilitate detection of receptor internalization. However, such an extended incubation time may introduce some confounding factors, including receptor degradation, recycling and even de novo synthesis, which could affect the interpretation of the results. Under our experimental conditions, we observed that CXCL12 did not trigger CD4 internalization whereas X4-gp120 did. Interestingly, CD4 internalization depended on the co-receptor expressed by the cells.
- Increase label font size in microscopy panels for improved readability.*
Of course; the font size of these panels has been increased in the revised version.
- Consider adding more references on ligand-induced co-endocytosis of CD4 and chemokine receptors during HIV-1 entry.*
We have added more references to support this hypothesis (Toyoda et al. J. Virol., 2015; Venzke et al. J. Virol., 2006; Gobeil et al J. Virol., 2013).
- For Statistical analysis. Biological replicates are adequate, and statistical tests are generally appropriate. For transparency, report n values, exact p-values, and the statistical test used in every figure legend and discussed in the results.*
Thank you for highlighting the importance of transparency in statistical reporting. We confirm that the n values for all experiments have been included in the figure legends. The statistical tests used for each analysis are also clearly indicated in the figure legends, and the interpretation of these results is discussed in detail in the Results section. Furthermore, the Methods section specifies the tests applied and the thresholds for significance, ensuring full transparency regarding our analytical approach.
In accordance with established conventions in the field, we have utilized categorical significance indicators (e.g., n.s., *, **, ***) within our figures to enhance readability and focus on biological trends. This approach is widely adopted in high-impact literature to prevent visual clutter. However, to ensure full transparency and reproducibility, we have ensured that the underlying statistical tests and thresholds are clearly defined in the respective figure legends and Methods section.
Reviewer #4
We thank the reviewer for considering that this work is presented in a clear fashion, and the main findings are properly highlighted, and for remarking that the paper is of interest to the retrovirology community and possibly to the broader virology community.
We also agree on the interest that X4-gp120 clusters CXCR4R334X suggests a different binding mechanism for X4-gp120 from that of the natural ligand CXCL12, an aspect that we are now evaluating. These data also indicate that WHIM patients can be infected by HIV-1 similarly to healthy people.
- The observation that "empty VLPs" reduce CXCR4 diffusivity is potentially interesting. However, it is not supported by the data owing to insufficient controls. The authors correctly discuss the limitations of that observation in the Discussion section (lines 702-704). However, they overinterpret the observation in the Results section (lines 509-512), suggesting non-specific interactions between empty VLPs, CD4 and CXCR4. I suggest either removing the sentence from the Results section or replacing it with a sentence similar to the one in the Discussion section.*
In accordance with the reviewer`s suggestion, the sentence in the result section has been replaced with one similar to that found in the discussion section. In addition, we have performed Raster Image Correlation Spectroscopy (RICS) analysis using the Di-4-ANEPPDHQ lipid probe to assess membrane fluidity by means of membrane diffusion, and compared the results with those of cells treated with Env(-) VLPs. The results indicated that VLPs did not modulate membrane fluidity (Figure VIII in this reply). Nonetheless, these results do not rule out other potential non-specific interactions of the Env(-) VLPs with other components of the cell membrane that might affect receptor dynamics (see our response to point 2 of reviewer #3 p. 14-15 of this reply).
- In the case of the WHIM mutant CXCR4-R334X, the addition of "empty VLPs" did not cause a significant change in the diffusivity of CXCR4-R334X (Figure 4B). This result is in contrast with the addition of empty VLPs to WT CXCR4. However, the authors neither mention nor comment on that result in the results section. Please mention the result in the paper and comment on it in relation to the addition of empty VLPs to WT CXCR4.*
We would remark that the main observation in these experiments should focus on the effect of gp120-VLPs, and the results indicates that gp120-VLPs promoted clustering of CXCR4 and of CXCR4R334X and reduced their diffusion at the cell membrane. The Env(- ) VLPs were included as a negative control in the experiments, to compare the data with those obtained using gp120-VLPs. However, once we observed some residual effect of the Env(-) VLPs, we decided to give a potential explanation, formulated as a hypothesis, that the Env(-) VLPs modulated membrane fluidity. We have now performed a RICS analysis using Di-4-ANEPPDHQ as a lipid probe (Figure IX only for review purposes). The results suggest that Env(-) VLPs do not modulate cell membrane fluidity, although we do not rule out other potential interactions with membrane proteins that might alter receptor dynamics. We appreciate the reviewer's observation and agree that this result can be noted. However, since the main purpose of Figure 4B is to show that gp120-VLPs modulate the dynamics of CXCR4R334X rather than to remark that the Env(-) VLPs also have some effects, we consider that a detailed discussion of this specific aspect would detract from the central finding and may dilute the primary narrative of the study.
Minor comments
It would be helpful for the reader to combine thematically or experimentally linked figures, e.g., Figures 3 and 4.*
Figures 3 and 4 are very similar. Please unify the colours in them and the order of the panels (e.g. Figure 3 panel A shows diffusivity of CXCR4, while Figure 4 panel A shows MSI of CXCR4-R334X).*
While we considered consolidating Figures 3 and 4, we believe that maintaining them as separate entities enhances conceptual clarity. Since Figure 3 establishes the baseline dynamics for wild-type CXCR4 and Figure 4 details the distinct behavior of the CXCR4R334X mutant, keeping them separate allows the reader to fully appreciate the specificities of each system before making a cross-comparison.
- Some parts of the Discussion section could be shortened, moved to the Introduction (e.g.,lines 648-651), or entirely removed (e.g.,lines 633-635 about GPCRs).*
In accordance, the Discussion section has been reorganized and shortened to improve clarity.
- I suggest renaming "empty VLPs" to "Env(−) VLPs" (or similar). The name empty VLPs can mislead the reader into thinking that these are empty vesicles.*
The term empty VLPs has been renamed to Env(−) VLPs throughout the manuscript to more accurately reflect their composition. Many thanks for this suggestion.
- Line 492 - please rephrase "...lower expression of Env..." to "...lower expression of Env or its incorporation into the VLPs...".*
The sentence has been rephrased
Line 527 - The data on CXCL12 modulating CXCR4-R334X dynamics and clustering are not present in Figure 4 (or any other Figure). Please add them or rephrase the sentence with an appropriate reference. Make clear which results are yours.*
Line 532 - Do the data in the paper really support a model in which CXCL12 binds to CXCR4-R334X? If not, please rephrase with an appropriate reference.*
Previous studies support the association of CXCL12 with CXCR4R334X (Balabanian et al. Blood, 2005; Hernandez et al. Nat Genet., 2003; Busillo & Benovic Biochim. Biophys. Acta, 2007). In fact, this receptor has been characterized as a gain-of-function variant for this ligand (McDermott et al. J. Cell. Mol. Med., 2011). The revised manuscript now includes these bibliographic references to support this commentary. In any case, our previous data indicate that CXCL12 binding does not affect CXCR4R334X dynamics (García-Cuesta et al. PNAS, 2022).
- Line 695 - "...lipid rafts during HIV-1 (missing word?) and their ability to..." During what?*
Many thanks for catching this mistake. The sentence now reads: "Although direct evidence for the internalization of CD4 and CXCR4 as complexes is lacking, their co-localization in lipid rafts during HIV-1 infection (97-99) and their ability to form heterocomplexes (22) strongly suggest they could be endocytosed together."
Eine Person wird vom belarussischen Geheimdienst KGB verhört und muss dabei ihr Handy abgeben. Am nächsten Tag meldet das Antivirensystem des Smartphones eine verdächtige App. Die Person löscht sie, aber ahnt nicht, dass sie eine weitere Spionage-App auf ihrem Gerät hat. Diese App hat Zugriff auf Mikrofon und Kamera; sie ermöglicht es, in verschlüsselten Messengern, SMS und E-Mails mitzulesen, Telefonate mitzuhören und aufzuzeichnen sowie den Standort zu überwachen. Man kann sogar das gesamte Smartphone aus der Ferne löschen, wenn man will. Die Kontrolle über diese App hat: der belarussische Geheimdienst.
Well duh. Anytime you need to release your device(s) to whatever authority it's compromised. Everywhere. The journalists in this case seem unaware of opsec need
Reviewer #3 (Public review):
Summary:
In this study, Kito et al follow up on previous work that identified Drosophila GCL as a mitotic substrate recognition subunit of a CUL3-RING ubiquitin ligase (CRL3) complex. Here they identified mutants of the human ortholog of GCL, GMCL1, that disrupt the interaction with CUL3 (GMCL1E142K) and that lack the substrate interaction domain (GMCL1 BBO). Immunoprecipitation followed by mass spectrometry identified 9 proteins that interacted with wild type FLAG-GMCL1 but not GMCL1 EK or GMCL1 BBO. These proteins included 53BP1, which plays a well characterized role in double strand break repair but also functions in a USP28-p53-53BP1 "mitotic stopwatch" complex that arrests the cell cycle after a substantially prolonged mitosis. Consistent with the IP-MS results, FLAG-GMCL1 immunoprecipitated 53BP1. Depletion of GMCL1 during mitotic arrest increased protein levels of 53BP1, and this could be rescued by wild type GMCL1 but not the E142K mutant or a R433A mutant that failed to immunoprecipitate 53BP1. Using a publicly available dataset, the authors identified a relatively small subset of cell lines with high levels of GMCL1 mRNA that were resistant to the taxanes paclitaxel, cabazitaxel, and/or docetaxel. This type of analysis is confounded by the fact that paclitaxel and other microtubule poisons accumulate to substantially different levels in various cell lines (PMID: 8105478, PMID: 10198049) so careful follow up experiments are required to validate results. The correlation between increased GMCL1 mRNA and taxane resistance was not observed in lung cancer cell lines. The authors propose this was because nearly half of lung cancers harbor p53 mutations, and lung cancer cell lines with wild type but not mutant p53 showed the correlation between increased GMCL1 mRNA and taxane resistance. However, the other cancer cell types in which they report increased GMCL1 expression correlates with taxane sensitivity also have high rates of p53 mutation. Furthermore, p53 status does not predict taxane response in patients (PMID: 10951339, PMID: 8826941, PMID: 10955790). The authors then depleted GMCL1 and reported that it increased apoptosis in two cell lines with wild type p53 (MCF7 and U2OS) due to activation of the mitotic stopwatch. This is surprising because the mitotic stopwatch paper cited (PMID: 38547292) reported that U2OS cells have an inactive stopwatch. Though it can be partially restored by treatment with an inhibitor of WIP1, the stopwatch was reported to be substantially impaired in U2OS cells, in contrast to what is reported here. Additionally, activation of the stopwatch results in cell cycle arrest rather than apoptosis in most cell types, including MCF7. Beyond this, it has recently been shown that the level of taxanes and other microtubule poisons achieved in patient tumors is too low to induce mitotic arrest (PMID: 24670687, PMID: 34516829, PMID: 37883329). Physiologically relevant concentrations are achieved with approximately 5-10 nM paclitaxel, rather than the 100 nM used here. The findings here demonstrating that GMCL1 mediates chromatin localization of 53BP1 during mitotic arrest are solid and of interest to cell biologists, but it is unlikely that these findings are relevant to paclitaxel response in patients.
Strengths:
This study identified 53BP1 as a target of CRL3GMCL1-mediated degradation during mitotic arrest. AlphaFold3 predictions of the binding interface followed by mutational analysis identified mutants of each protein (GMCL1 R433A and 53BP1 IEDI1422-1425AAAA) that disrupted their interaction. Knock-in of a FLAG tag into the C-terminus of GMCL1 in HCT116 cells followed by FLAG immunoprecipitation confirmed that endogenous GMCL1 interacts with endogenous CUL3 and 53BP1 during mitotic arrest.
Weaknesses:
The clinical relevance of the study is overinterpreted. The authors have not taken relevant data about the clinical mechanism of taxanes into account. Supraphysiologic doses of microtubule poisons cause mitotic arrest and can activate the mitotic stopwatch. However, in physiologic concentrations of clinically useful microtubule poisons, cells proceed though mitosis and divide their chromosomes on mitotic spindles that are at least transiently multipolar. Though these low concentrations may result in a brief mitotic delay, it is substantially shorter than the arrest caused by high concentrations of microtubule poisons, and the one mimicked here by 16 hours of 0.4 mg/mL nocodazole or 48 hours of 100 nM paclitaxel. Resistance to mitotic arrest occurs through different mechanisms than resistance to multipolar spindles, raising concerns about the relevance of prolonged mitosis to paclitaxel response in cancer. Nocodazole is a microtubule poison that is not used clinically and does not induce multipolar spindles, so a similar apoptotic response to both drugs increases concern about a lack of physiological relevance. Moreover, clinical response to paclitaxel does not correlate with p53 status (PMID: 10951339, PMID: 8826941, PMID: 10955790). No evidence is presented that GMCL1 affects cellular response to clinically relevant doses of paclitaxel.
Comments on revisions:
(1) The claim that GMCL1 modulates paclitaxel sensitivity in cancer should be toned down. Inaccurate statements based on an outdated understanding of the anti-cancer mechanism of paclitaxel should be removed (eg lines 42-44: "In cancers that are resistant to paclitaxel, a microtubule-targeting agent, cells bypass mitotic surveillance activation, allowing unchecked proliferation...", lines 73-75: "Proper mitotic arrest is critical for the efficacy of microtubule-targeting therapies...", lines 78-79: "This resistance is frequently associated with loss of MSP activity, for example due to defective p53 signaling". As cited in the public review, p53 status does not correlate with paclitaxel response in cancer.)
(2) Perform timelapse experiments +/- GMCL1 siRNA in the absence of drug and in the presence of low, physiologically relevant concentrations of paclitaxel (5-10 nM), as well as supraphysiologic concentrations (100 nM) and correlate mitotic duration with cell cycle arrest. Test if co-depletion of 53BP1 with GMCL1 rescues cell cycle arrest after a substantially prolonged mitosis. Perform these experiments in a cell line with an intact mitotic stopwatch.
Author response:
The following is the authors’ response to the original reviews.
Public Reviews:
Reviewer #1(Public review):
In this manuscript, Pagano and colleagues test the idea that the protein GMCL1 functions as a substrate receptor for a Cullin RING 3 E3 ubiquitin ligase (CUL3) complex. Using a pulldown approach, they identify GMCL1 binding proteins, including the DNA damage scaffolding protein 53BP1. They then focus on the idea that GMCL1 recruits 53BP1 for CUL3-dependent ubiquitination, triggering subsequent proteasomal degradation of ubiquitinated 53BP1.
In addition to its DNA damage signalling function, in mitosis, 53BP1 is reported to form a stopwatch complex with the deubiquitinating enzyme USP28 and the transcription factor p53 (PMID: 38547292). These 53BP1-stopwatch complexes generated in mitosis are inherited by G1 daughter cells and help promote p53-dependent cell cycle arrest independent from DNA damage (PMID: 38547292). Several studies show that knockout of 53BP1 overcomes G1 cell cycle arrest after mitotic delays caused by anti-mitotic drugs or centrosome ablation (PMID: 27432897, 27432896). In this model, it is crucial that 53BP1 remains stable in mitosis and more stopwatch complex is formed after delayed mitosis.
Major concerns:
Pagano and coworkers suggest that 53BP1 levels can sometimes be suppressed in mitosis if the cells overexpress GMCL1. They carry out a bioinformatic analysis of available public data for p53 wild-type cancer cell lines resistant to the anti-mitotic drug paclitaxel and related compounds. Stratifying GMCL1 into low and high expression groups reveals a weak (p = 0.05 or ns) correlation with sensitivity to taxanes. It is unclear on what basis the authors claim paclitaxel-resistant and p53 wild-type cancer cell lines bypass the mitotic surveillance/timer pathway. They have not tested this. Figure 3 is a correlation assembled from public databases but has no experimental tests. Figure 4 looks at proliferation but not cell cycle progression or the length of mitosis. The main conclusions relating to cell cycle progression and specifically the link to mitotic delays are therefore not supported by experimental data. There is no imaging of the cell cycle or cell fate after mitotic delays, or analysis of where the cells arrest in the cell cycle. Most of the cell lines used have been reported to lack a functional mitotic surveillance pathway in the recent work by Meitinger. To support these conclusions, the stability of endogenous 53BP1 under different conditions in cells known to have a functional mitotic surveillance pathway needs to be examined. A key suggestion in the work is that the level of GMCL1 expression correlates with resistance to taxanes. For the mitotic surveillance pathway, the type of drug (nocodazole, taxol, etc) used to induce a delay isn't thought to be relevant, only the length of the delay. Do GMCL1-overexpressing cells show resistance to anti-mitotics in general?
We thank the reviewer for this insightful comment. We propose that GMCL1 promotes CUL3-dependent ubiquitination of 53BP1 during prolonged mitotic arrest, thereby facilitating its proteasome-dependent degradation. To evaluate the potential clinical relevance of this mechanism, we stratified cancer cell lines based on GMCL1 mRNA expression using publicly available datasets from DepMap (PMID: 39468210). We observed correlations between GMCL1 expression levels and taxane sensitivity that appear to reflect specific cancer type-drug combinations. To experimentally evaluate this correlation and obtain mechanistic insights, we performed knockdown experiments in hTERT-RPE1 cells, which are known to possess an intact mitotic surveillance pathway. Silencing of GMCL1 alone inhibited cell proliferation and induced apoptosis, while co-depletion of either TP53BP1 or USP28 significantly rescued these effects. These results suggest that GMCL1 modulates the stability of 53BP1 and therefore the availability of the 53BP1-USP28-p53 ternary complex in cells with a functional mitotic surveillance pathway (MSP) (new Figure 5I,J) directly linking GMCL1 to the regulation of the MSP complex. Moreover, to further support our mechanism, we assessed the effect of GMCL1 levels on cell cycle progression. Briefly, following nocodazole synchronization and release, we treated cells with EdU and performed FACS analyses at different times. Knockdown of GMCL1 alone led to a delayed cell cycle progression, but co-depletion of either TP53BP1 or USP28 restored this phenotype (new Figure 3A and new Supplementary Figure 3A-C). These results are consistent with our proliferation data and suggest that the observed effects of GMCL1 are specific to mitotic exit. Finally, overexpression of GMCL1 accelerates cell cycle progression (as assessed by FACS analyses) upon release from prolonged mitotic arrest (new Figure 3B and new Supplementary Figure 3D-E).
Importantly, if GMCL1 specifically degrades 53BP1 during prolonged mitotic arrests, the authors should show what happens during normal cell divisions without any delays or drug treatments. How much 53BP1 is destroyed in mitosis under those conditions? Does 53BP1 destruction depend on the length of mitosis, drug treatment, or does 53BP1 get degraded every mitosis regardless of length? Testing the contribution of key mitotic E3 ligase activities on mitotic 53BP1 stability, such as the anaphase-promoting complex/cyclosome (APC/C) is important in this regard. One previous study reported an analysis of putative APC/C KEN-box degron motifs in 53BP1 and concluded these play a role in 53BP1 stability in anaphase (PMID: 28228263).
Physiological mitosis under unperturbed conditions is typically brief (approximately 30 minutes), making protein quantification during this window challenging. Despite this, we tried by synchronizing cells using RO-3306 and releasing them into drug-free medium to assess GMCL1 dynamics during normal mitosis. Under these conditions, GMCL1 expression was similar to that in asynchronous cells and higher than the levels upon extended mitosis. However, when we attempted to measure the half-life of proteins using cycloheximide, most cells died, likely due to the toxic effect of cycloheximide in cells subjected to co-treatment with RO-3306 or nocodazole. This is the same reasons why in Figure 2C, we assessed 53BP1 in daughter cells rather than mitotic cells.
There is no direct test of the proposed mechanism, and it is therefore unclear if 53BP1 is ubiquitinated by a GMCL1-CUL3 ligase in cells, and how efficient this process would be at different cell cycle stages. A key issue is the lack of experimental data explaining why the proposed mechanism would be restricted to mitosis. Indirect effects, such as loss of 53BP1 from the chromatin fraction during M phase upon GMCL1 overexpression, do not necessarily mean that 53BP1 is degraded. PLK1-dependent chromatin-cytoplasmic shuttling of 53BP1 during mitotic delays has been described previously (PMID: 38547292, 37888778). These papers are cited in the text, but the main conclusions of those papers on 53BP1 incorporation into a stopwatch complex during mitotic delays have been ignored. Are the authors sure that 53BP1 is destroyed in mitosis and not simply re-localised between chromatin and non-chromatin fractions? At the very least, these reported findings should be discussed in the text.
To examine whether GMCL1 promotes 53BP1 ubiquitination in cells, we expressed in cells Trypsin-Resistant Tandem Ubiquitin-Binding Entity (TR-TUBE), a protein that binds polyubiquitin chains. Abundant, endogenous ubiquitinated 53BP1 co-precipitated with TR-TUBE constructs only when wild-type GMCL1 but not the E142K GMCL1 mutant, was expressed (new Figure 2D). The PLK1-dependent incorporation of 53BP1 into the stopwatch complex and the chromatin-cytoplasmic shuttling of 53BP1 during mitotic delays is now discussed in the text. That said, compared to parental cells, 53BP1 levels in the chromatin fraction are high in two different GMCL1 KO clones in M phase arrested cells (Figure 2A-B). This increase does not correspond to a decrease in the 53BP1 soluble fraction (Figure 2A and new Supplementary Figure 2D), suggesting decreased 53BP1 is not due to re-localization. The increased half-life of 53BP1 in daughter cells (Figure 2C), also supports this hypothesis.
The authors use a variety of cancer cell line models throughout their study, most of which have been reported to lack a functional mitotic surveillance pathway. U2OS and HCT116 cells do not respond normally to mitotic delays, despite being annotated as p53 WT. Other studies have used p53 wild-type hTERT RPE-1 cells to study the mitotic surveillance pathway. If the model is correct, then over-expressing GMCL1 in hTERT-RPE1 cells should suppress cell cycle arrest after mitotic delays, and GMCL1 KO should make the cells more sensitive to delays. These experiments are needed to provide an adequate test of the proposed model.
We greatly appreciate the reviewer’s suggestion regarding overexpression of GMCL1 in hTERT-RPE1 cells. To address this, we generated stable RPE1 cells expressing V5-tagged GMCL1 and conducted EdU incorporation assays following nocodazole synchronization and release. Overexpression of GMCL1 enhanced cell cycle progression compared to control cells (new Figure 3B and new Supplementary Figure 3D-E) after mitotic arrest, consistent with our model. We, therefore, propose that GMCL1 controls 53BP1 stability to suppress p53-dependent cell cycle arrest.
We also want to point out that while some papers suggest that HCT116 and U2OS cells do not have an intact mitotic surveillance pathway, others have shown that the MSP is indeed functioning in HCT116 cells and can be triggered with variable efficiency in U2OS cells (PMID: 38547292). This is likely due to high heterogeneity and extensive clonal diversity of cancer cell lines grown in different labs. Please see examples in PMIDs: 3620713, 30089904, and 30778230. In particular, PMID: 30089904 shows that this heterogeneity correlates with considerably different drug responses.
To conclude, while the authors propose a potentially interesting model on how GMCL1 overexpression could regulate 53BP1 stability to limit p53-dependent cell cycle arrest, it is unclear what triggers this pathway or when it is relevant. 53BP1 is known to function in DNA damage signalling, and GMCL1 might be relevant in that context. The manuscript contains the initial description of GMCL1-53BP1 interaction but lacks a proper analysis of the function of this interaction and is therefore a preliminary report.
We hope that the new experiments, along with the clarifications provided in this response letter and revised manuscript, offer the reviewer increased confidence in the robustness and validity of our proposed model.
Reviewer #2 (Public review):
This study investigates the role of GMCL1 in regulating the mitotic surveillance pathway (MSP), a protective mechanism that activates p53 following prolonged mitosis. The authors identify a physical interaction between 53BP1 and GMCL1, but not with GMCL2. They propose that the ubiquitin ligase complex CRL3-GMCL1 targets 53BP1 for degradation during mitosis, thereby preventing the formation of the "mitotic stopwatch" complex (53BP1-USP28-p53) and subsequent p53 activation. The authors show that high GMCL1 expression correlates with resistance to paclitaxel in cancer cell lines that express wild-type p53. Importantly, loss of GMCL1 restores paclitaxel sensitivity in these cells, but not in p53-deficient lines. They propose that GMCL1 overexpression enables cancer cells to bypass MSP-mediated p53 activation, promoting survival despite mitotic stress. Targeting GMCL1 may thus represent a therapeutic strategy to re-sensitize resistant tumors to taxane-based chemotherapy.
Strengths:
This manuscript presents potentially interesting observations. The major strength of this article is the identification of GMCL1 as a 53BP1 interaction partner. The authors identified relevant domains and showed that GMCL1 controls 53BP1 stability. The authors further show a potentially interesting link between GMCL1 status and sensitivity to Taxol.
Weaknesses:
However, the manuscript is significantly weakened by unsubstantiated mechanistic claims, overreliance on a non-functional model system (U2OS), and overinterpretation of correlative data. To support the conclusions of the manuscript, the authors must show that the GMCL1-dependent sensitivity to Taxol depends on the mitotic surveillance pathway.
To demonstrate that GMCL1-dependent taxane sensitivity is mediated through the mitotic surveillance pathway (MSP), we now performed experiments using hTERT-RPE1 (RPE1) cells, a widely used, non-transformed cell line known to possess a functional MSP. We compared RPE1 cells with knockdown of GMCL1 alone to those with simultaneous knockdown of GMCL1 and either TP53BP1 or USP28. Upon paclitaxel (Taxol) treatment, cells with GMCL1 knockdown exhibited suppressed proliferation and increased apoptosis. Notably, these phenotypes were rescued by co-depletion of TP53BP1 or USP28 (new Figure 5I,J). These results support the notion that GMCL1 contributes to MSP activity, at least in part, through its regulation of 53BP1.
To further strengthen our mechanistic experiments, we assessed the effect of GMCL1 levels on cell cycle progression. Following nocodazole synchronization and release, we treated cells with EdU and performed FACS analyses at different times. Knockdown of GMCL1 alone led to a delay in cell cycle progression, but co-depletion of either TP53BP1 or USP28 alleviate this phenotype (new Figure 3A and new Supplementary Figure 3A, B). These results are consistent with our proliferation data.
Reviewer #3 (Public review):
Summary:
In this study, Kito et al follow up on previous work that identified Drosophila GCL as a mitotic substrate recognition subunit of a CUL3-RING ubiquitin ligase (CRL3) complex.
Here they characterize mutants of the human ortholog of GCL, GMCL1, that disrupt the interaction with CUL3 (GMCL1E142K) and that lack the substrate interaction domain (GMCL1 BBO). Immunoprecipitation followed by mass spectrometry identified 9 proteins that interacted with wild-type FLAG-GMCL1 and GMCL1 EK but not GMCL1 BBO. These proteins included 53BP1, which plays a well-characterized role in double-strand break repair but also functions in a USP28-p53-53BP1 "mitotic stopwatch" complex that arrests the cell cycle after a substantially prolonged mitosis. Consistent with the IP-MS results, FLAG-GMCL1 immunoprecipitated 53BP1. Depletion of GMCL1 during mitotic arrest increased protein levels of 53BP1, and this could be rescued by wild-type GMCL1 but not the E142K mutant or a R433A mutant that failed to immunoprecipitate 53BP1.
Using a publicly available dataset, the authors identified a relatively small subset of cell lines with high levels of GMCL1 mRNA that were resistant to the taxanes paclitaxel, cabazitaxel, and docetaxel. This type of analysis is confounded by the fact that paclitaxel and other microtubule poisons accumulate to substantially different levels in various cell lines (DOI: 10.1073/pnas.90.20.9552 , DOI: 10.1091/mbc.10.4.947 ), so careful follow-up experiments are required to validate results. The correlation between increased GMCL1 mRNA and taxane resistance was not observed in lung cancer cell lines. The authors propose this was because nearly half of lung cancers harbor p53 mutations, and lung cancer cell lines with wild-type but not mutant p53 showed the correlation between increased GMCL1 mRNA and taxane resistance. However, the other cancer cell types in which they report increased GMCL1 expression correlates with taxane sensitivity also have high rates of p53 mutation. Furthermore, p53 status does not predict taxane response in patients (DOI: 10.1002/1097-0142(20000815)89:4<769::aid-cncr8>3.0.co;2-6 , DOI: 10.1002/(SICI)1097-0142(19960915)78:6<1203::AID-CNCR6>3.0.CO;2-A , PMID: 10955790).
The authors then depleted GMCL1 and reported that it increased apoptosis in two cell lines with wild-type p53 (MCF7 and U2OS) due to activation of the mitotic stopwatch. This is surprising because the mitotic stopwatch paper they cite (DOI: 10.1126/science.add9528 ) reported that U2OS cells have an inactive stopwatch and that activation of the stopwatch results in cell cycle arrest rather than apoptosis in most cell types, including MCF7. Beyond this, it has recently been shown that the level of taxanes and other microtubule poisons achieved in patient tumors is too low to induce mitotic arrest (DOI: 10.1126/scitranslmed.3007965 , DOI: 10.1126/scitranslmed.abd4811 , DOI: 10.1371/journal.pbio.3002339 ), raising concerns about the relevance of prolonged mitosis to paclitaxel response in cancer. The findings here demonstrating that GMCL1 mediates degradation of 53BP1 during mitotic arrest are solid and of interest to cell biologists, but it is unclear that these findings are relevant to paclitaxel response in patients.
Strengths:
This study identified 53BP1 as a target of CRL3GMCL1-mediated degradation during mitotic arrest. AlphaFold3 predictions of the binding interface, followed by mutational analysis, identified mutants of each protein (GMCL1 R433A and 53BP1 IEDI1422-1425AAAA) that disrupted their interaction. Knock-in of a FLAG tag into the C-terminus of GMCL1 in HCT116 cells, followed by FLAG immunoprecipitation, confirmed that endogenous GMCL1 interacts with endogenous CUL3 and 53BP1 during mitotic arrest.
Weaknesses:
The clinical relevance of the study is overinterpreted. The authors have not taken relevant data about the clinical mechanism of taxanes into account. Supraphysiologic doses of microtubule poisons cause mitotic arrest and can activate the mitotic stopwatch. However, in physiologic concentrations of clinically useful microtubule poisons, cells proceed through mitosis and divide their chromosomes on mitotic spindles that are at least transiently multipolar. Though these low concentrations may result in a brief mitotic delay, it is substantially shorter than the arrest caused by high concentrations of microtubule poisons, and the one mimicked here by 16 hours of 0.4 mg/mL nocodazole, which is not used clinically and does not induce multipolar spindles. Resistance to mitotic arrest occurs through different mechanisms than resistance to multipolar spindles. No evidence is presented in the current version of the manuscript that GMCL1 affects cellular response to clinically relevant doses of paclitaxel.
We agree that it would be an overstatement to claim that GMCL1 and p53 regulates paclitaxel sensitivity in cancer patients in a clinical context. The correlations we observed were based on publicly available cancer cell lines from datasets catalogued in CCLE and DepMap, which do not fully account for clinical heterogeneity and patient-specific factors. In response to this important point, we have revised the text accordingly.
In the experiments shown in former Figure 4A-H (now Figure 5A-H) and in those shown in the new Figure 5I-J, we used 100 nM paclitaxel to test the hypothesis that low GMCL1 levels sensitizes cancer cells in a p53-dependent manner. Here, paclitaxel was chosen to mimic the conditions reported in the PRISM dataset (PMID: 32613204), which compiles the proliferation inhibitory activity of 4,518 compounds tested across 578 cancer cell lines. Consistent with our cell cycle findings, the paclitaxel sensitivity caused by GMCL1 depletion was reverted by silencing 53BP1 or USP28 (new Figure 5I-J), again supporting the involvement of the stopwatch complex. We are unsure about how to model the “physiologic concentrations of clinically useful microtubule poisons” in cell-based studies. A recent review notes that “The time above a threshold paclitaxel plasma concentration (0.05 mmol/L) is important for the efficacy and toxicity of the drug” (PMID: 28612269). Two other reviews mention that the clinically relevant concentration of paclitaxel is considered to be plasma levels between 0.05–0.1 μmol/L (approximately 50–100 nM) and that in clinical dosing, typical patient plasma concentrations after paclitaxel infusion range from 80–280 nM, with corresponding intratumoral concentrations between 1.1–9.0 μM, due to drug accumulation in tumor tissue (PMIDs: 24670687 and 29703818). We have now emphasized in the revised text the rationale for using 100 nM paclitaxel in our experiments.
Recommendations for the authors:
Reviewer #1 (Recommendations for the authors):
General comments on the Figures:
(1) Western blots lack molecular weight markers on most panels and are often over-exposed and over-contrasted, rendering them hard to interpret.
We have now included molecular weight markers in all Western blot panels. We have also reprocessed the images to avoid overexposure and excessive contrast, ensuring that the bands are clearly visible and interpretable.
(2) Input and IP samples do not show percentage loading, so it is hard to interpret relative enrichments.
In the revised figures, we have indicated what % of the input was loaded.
(3) The authors change between cell line models for their experiments, and this is not clear in the figures. These are important details for interpreting the data, as many of the cell lines used are not functional for the mitotic surveillance pathway.
In the revised manuscript, we have clearly indicated the specific cell lines used in each experiment in the figure legends. Additionally, to address concerns regarding the mitotic surveillance pathway, we have included new experiments using hTERT-RPE1 cells, which have been reported to possess a functional mitotic surveillance pathway (MSP) (Figure 4I-J).
(4) No n-numbers are provided in the figure legends. Are the Western blots provided done once, or are they reproducible? Many of the blots would benefit from quantification and presentation via graphs to test for reproducible changes to 53BP1 levels under the different conditions.
As now indicated in the methods section, we have conducted each Western blot no less than three times, yielding results that exhibit a high degree of reproducibility. A representative Western blot has been selected for each figure. We did not include densiometric quantification of immunoblots, given that the semi-quantitative nature of this technique would lead to an overinterpretation of our data; unfortunately, this is a limitation of the technique. In fact, eLife and other similar scientific journals do not adhere to the practice of quantifying Western blots. One exception to this norm is for protein half-life studies, which is done to measure the kinetics of decay rates and their internal comparisons. Accordingly, the experiments in Figure 2C were quantified.
(5) Graphs displayed in the supplementary figures are blacked out, and individual data points cannot be visualised. All graphs should have individual data points clearly visible.
We revised the quantified graphs and replaced them with scatter plots to clearly display individual data points, showing sample distribution.
Additional experiments with specific comments on Figures:
(1) Figure 1C-D: the relative amount of 53BP1 co-precipitating with FLAG-tagged GMCL1 WT appears very different between the two experiments. If the idea is that MLN4924 (Cullin neddylation inhibitor) makes the interaction easier to capture, then this should be explained in the text, and ideally shown on the same gel/blot -/+ MLN4924.
We now present the samples treated with and without MLN4924 on the same gel/blot to allow direct comparison (new Figure 1D) and clarified this point in the text.
(2) Figure 1E: The figure legend states that GMCL1 was immunoprecipitated, but the Figure looks as though FLAG-tagged 53BP1 was the bait protein being immunoprecipitated? Can the authors clarify?
We thank the reviewer for pointing out the discrepancy between the figure and the figure legend in Figure 1E. The immunoprecipitation was indeed performed using FLAG-tagged 53BP1, and we have now rectified the figure legend accordingly.
(3) Figure 1F: Rather than parental cell lysate, the better control would be to IP FLAG from another FLAG-tagged expressing cell line, to rule out non-specific binding with the FLAG tag at the non-overexpressed level.
Figure 1F shows interaction at the endogenous level. The specificity of binding with overexpressed proteins is shown in Figures 1C and 1D.
The USP28 blot is over-exposed and makes it hard to see any changes in electrophoretic mobility - it looks as though there is a change between the parental and the KI cell line? It is surprising that USP28 would co-IP with GMCL1 (presumably because USP28 is bound to 53BP1) if the function of GMCL1-53BP1 interaction is to promote 53BP1 degradation. Can the authors reconcile this? Crucially, if the authors claim that the 53BP1-GMCL1 interaction is specific to prolonged mitosis, then this experiment should be repeated and performed with asynchronous, normal-length mitosis, and prolonged mitosis conditions. This is vital for supporting the claim that this interaction only occurs during prolonged mitoses and does not occur in every mitosis regardless of length.
This is a good point. Unfortunately, many of the protein-protein interactions occur post lysis. Therefore, we could not observe differences in asynchronous vs. mitotic cells.
(4) Figure S1F: Label on blot should be CUL3 not CUI3.
We thank the reviewer for pointing this out and we have corrected the typo.
(5) Figure 2A: The authors suggest an increase in chromatin-bound 53BP1 in GMCL1 KO U2OS cells, specifically in M phase. Again, is this time in mitosis dependent, or would this be evident in every mitosis, regardless of length? Such an experiment would benefit from repetition and quantification to test whether the observed effect is reproducibly consistent. If the authors' model is correct, simply treating U2OS WT mitotic cells with MG132 during the mitotic arrest and performing the same fractionation should bring 53BP1 levels up to that seen in GMCL1 KO cells under the same conditions.
The reviewer’s suggestion to assess 53BP1 accumulation in wild-type U2OS cells treated with MG132 during mitotic arrest is indeed highly relevant. However, treatment with MG132 during prolonged mitosis consistently led to significant cell death, making it technically challenging to evaluate 53BP1 levels under these conditions.
(6) Figure 2B: The authors restore GMCL1 expression in the KO U2OS cells using WT and 2 distinct mutant cDNAs. However, the expression of these constructs is not equivalent, and thus their effects cannot be directly compared. It is also surprising that GMCL1 is much higher in M phase samples in this experiment (shouldn't it be destroyed?), when no such behaviour has been observed in the other figures.
There is no evidence in our study or others that GMCL1 should be destroyed in M phase. We show that the R433A mutant is expressed at a level very similar to the WT protein, yet it doesn’t promote the degradation of 53BP1. It is true that the E142K is expressed less in mitotic cells whereas is the most expressed in asynchronous cells. For some reason, this mutant has an inverse behavior compared to the WT, limiting the interpretation of this result. We now mention this in the text.
(7) Figure 2C: The CHX experiment would benefit from inclusion of a control protein known to have a short half-life (e.g. c-myc, p53). Is GMCL1 known to have a relatively short half-life? It looks as though GMCL1 disappears after 1 h CHX treatment (although hard to definitively tell in the absence of molecular weight markers). 53BP1 appears to continue declining in the absence of GMCL1, which is surprising if p53BP1 degradation requires GMCL1. How can the authors reconcile this?
As a control for the CHX chase experiments, we included p21, whose protein levels decreased in a CHX-dependent. GMCL1 itself also appeared to undergo degradation upon CHX treatment, but it doesn’t disappear completely.
(8) Supplemental Figure 2:
Transcription is largely inhibited in M phase, so the p53 target gene transcripts present in M phase are inherited from the preceding G2 phase. The qPCR's thus need a reference sample to compare against. I.e., was p21/PUMA/NOXA mRNA already low in G2 in the GMCL1 KO + WT cells before they entered mitosis? Or is the mRNA stability affected during M phase specifically? Is this effect on the mRNA dependent on the time in mitosis?
It is well established that transcription is not entirely shut down during mitosis, particularly for a subset of genes involved in cell cycle regulation. For example, p21, PUMA, NOXA, and p53 mRNAs have been shown to remain actively transcribed during mitosis (see Table S5 in PMID: 28912132). However, we currently lack direct evidence that p53 activation during mitosis, specifically through the mitotic surveillance pathway, drives the transcription of p21, PUMA, or NOXA mRNAs during M phase. In the absence of such mechanistic data, we opted to exclude these analyses from the final figures.
Panel B: blots are too over-exposed to see differences in p53 stability under the different conditions. Mitotic samples should be included to show how these differ from the G1 samples.
The background of all blot images has been adjusted to ensure clarity and consistency.
Panel D: The authors show no significant difference in the cell cycle profiles of the GMCL1 KO and reconstituted cells compared to parental U2OS cells. This should also be performed in the G1 daughter cells following a prolonged mitosis, to test the effect of the different GMCL1 constructs on G1 cell cycle arrest. U2OS cells have been reported not to have a functional mitotic surveillance pathway (Meitinger et al, Science, 2024), so U2OS cells are perhaps not a good model for testing this.
We performed cell cycle profiling using EdU incorporation in hTERT-RPE1 cells, which possess a functional MSP, to evaluate cell cycle progression in daughter cells following prolonged mitosis. We observed that GMCL1 knockdown alone leads to G1-phase arrest. In contrast, co-depletion of GMCL1 with either 53BP1 or USP28 bypasses this arrest, indicating that GMCL1 regulates cell cycle progression in an MSP-dependent manner. Please see also the answer to the public review above.
(9) Figure 3:
The authors show expression data for GMCL1 in the different cancer cell lines. This should be validated for a subset of cancer cell lines at the GMCL1 protein level, and cross-correlated to their MSP/mitotic timer status. Does GMCL1 depletion or knockout in p53 wild-type cancer cell lines overexpressing GMCL1 protein restore mitotic surveillance function?
We were unable to assess GMCL1 protein levels using publicly available proteomics datasets, as GMCL1 expression was not detected. In p53 wild-type hTERT-RPE1 cells, GMCL1 knockdown impaired the mitotic surveillance pathway, as evidenced by G1-phase arrest following prolonged mitosis (new Figure 3A and new Supplementary Figure 3A, B). This arrest was rescued by co-depletion of either TP53BP1 or USP28, indicating that GMCL1 acts upstream of the MSP.
(10) Figure 4:
The authors show siRNA experiments depleting GMCL1 and testing the effects of GMCL1 loss on cell viability and apoptosis induction. This is performed in different cell line backgrounds. However, there is no demonstration that any of the observed effects are due to a lack of GMCL1 activity on 53BP1. These experiments need to be repeated in 53BP1 co-depleted cells to test for rescue. Without this, the interpretation is purely correlative.
We assessed the effects of GMCL1 knockdown, alone or in combination with TP53BP1 or USP28 knockdown, on cell viability and apoptosis in hTERT-RPE1 cells using siRNA. Knockdown of GMCL1 alone led to a significant reduction in cell viability and an increase in apoptosis. However, co-depletion of GMCL1 with either TP53BP1 or USP28 restored both cell viability and apoptosis levels to those observed in control cells (new Figure 5I,J).
(11) Text comments:
Line 257: HeLa cells supress p53 through the E6 viral protein and are not "mutant" for p53.
The authors should cite early work by Uetake and Sluder describing the effects of spindle poisons on the mitotic surveillance pathway.
We appreciate the reviewer’s comments – We have now made the necessary corrections.
Reviewer #2 (Recommendations for the authors):
Major Points:
(1) Unsubstantiated Mechanistic Claims:
In Figures 3 and 4, the authors show correlations between GMCL1 expression and sensitivity to Taxol. However, they fail to demonstrate that the mitotic stopwatch is mechanistically involved. To support this conclusion, the authors must test whether deletion of 53BP1, USP28, or disruption of their interaction rescues Taxol sensitivity in GMCL1-depleted cells. Since 53BP1 also plays a role in DNA damage response, such rescue experiments are necessary to distinguish between mitotic surveillance-specific and broader stress-response effects. Deletion of USP28 would be particularly informative.
We sought to experimentally determine whether GMCL1 is involved in regulating the mitotic stopwatch. Knockdown of GMCL1 alone resulted in reduced cell proliferation and increased apoptosis. In contrast, co-depletion of GMCL1 with either TP53BP1 or USP28 restored both proliferation and apoptosis levels to those observed in control cells (new Figure 5I, J). To further strengthen our mechanistic experiments, we assessed the effect of GMCL1 levels on cell cycle progression. We conducted EdU incorporation assays following nocodazole synchronization and release. Knockdown of GMCL1 alone led to a delay in G1 progression, whereas co-depletion of either TP53BP1 or USP28 rescued normal cell cycle progression (new Figure 3A and new Supplementary Figure 3A, B). These results are consistent with our proliferation data and suggest that GMCL1 functions upstream of the ternary complex, likely by regulating 53BP1 protein levels.
(2) Model System Limitations (U2OS Cells):
The use of U2OS cells is highly problematic for investigating the mitotic surveillance pathway. U2OS cells lack a functional mitotic stopwatch and do not arrest following prolonged mitosis in a 53BP1/USP28-dependent manner (PMID: 38547292). Therefore, conclusions drawn from this model system about the function of the mitotic surveillance pathway are not substantiated. Key experiments should be repeated in a cell line with an intact pathway, such as RPE1.
We now performed all key experiments also hTERT-RPE1 cells (see above). We also would like to point out that while some papers suggest that HCT116 and U2OS cells do not have an intact mitotic surveillance pathway, others have showed that the MSP is indeed functioning in HCT116 cells and can be triggered with variable efficiency in U2OS cells (PMID: 38547292). This is likely due to high heterogeneity and extensive clonal diversity of cancer cell lines grown in different labs. Please see examples in PMIDs: 3620713, 30089904, and 30778230. In particular, PMID: 30089904 shows that this heterogeneity correlates with considerably different drug responses.
(3) Misinterpretation of p53 Activity Timing:
The manuscript states that "GMCL1 KO cells led to decreased mRNA levels of p21 and NOXA during mitosis" (line 194). However, it is well established that the mitotic surveillance pathway activates p53 in the G1 phase following prolonged mitosis-not during mitosis itself (PMID: 38547292). Therefore, the observed changes in mRNA levels during mitosis are unlikely to be relevant to this pathway.
We currently lack direct evidence that p53 activated during mitosis through the mitotic surveillance pathway directly influences the transcription of p21, PUMA, or NOXA mRNAs during M phase. Therefore, we have chosen to exclude these data from the final figures.
(4) Incorrect Interpretation of 53BP1 Chromatin Binding:
The authors claim that 53BP1 remains associated with chromatin during mitosis, which contradicts established literature. It is known that 53BP1 is released from chromatin during mitosis via mitosis-specific phosphorylation (PMID: 24703952), and this is supported by more recent findings (PMID: 38547292). A likely explanation for the discrepancy may be contamination of mitotic fractions with interphase cells. The chromatin fraction data in Figure 2C must be interpreted with caution.
Our method to synchronize in M phase is rather stringent (see Supplementary Figure 3D as an example). The literature indicates that the bulk of 53BP1 is released from chromatin during mitosis. Yet, even in the two publications mentioned by the reviewer, there is a difference in the observable amount of 53BP1 bound to chromatin (compare Figure 2B in PMID: 38547292 and Figure 5A in PMID: 24703952). The difference is likely due to the different biochemical approaches used to purify chromatin bound proteins (salt and detergent concentrations, sonication, etc.). Using our fractionation approach, we can reliably separate the soluble fraction (containing also the nucleoplasmic fraction) and chromatin associated proteins as indicated by the controls such as a-Tubulin and Histon H3. We have now mentioned these limitations when comparing different fractionation methods in our discussion section.
(5) Inadequate Citation of Foundational Literature:
The literature on the mitotic surveillance pathway is relatively limited, and it is essential that the authors provide a comprehensive and accurate account of its development. The foundational work by the Sluder lab (PMID: 20832310), demonstrating a p53-dependent arrest following prolonged mitosis, must be cited. Furthermore, the three key 2016 papers (PMID: 27432896, 27432897, 27432896) that identified the involvement of USP28 and 53BP1 in this pathway are critical and should be cited as the basis of the mitotic surveillance pathway.
In contrast, the manuscript currently emphasizes publications that either contribute minimally or have been contradicted by prior and subsequent work. For example: PMID: 31699974, which proposes Ser15 phosphorylation of p53 as critical, has been contradicted by multiple groups (e.g., Holland, Oegema, and Tsou labs).
PMID: 37888778, which suggests that 53BP1 must be released from kinetochores, is inconsistent with findings that indicate kinetochore localization is not relevant.
The authors should thoroughly revise the Introduction to reflect what this reviewer would describe as a more accurate and scholarly approach to the literature.
We have substantially revised both the Introduction and Discussion sections to incorporate important references kindly suggested by the reviewer.
Minor Points:
(1) Overexposed Western Blots:
The Western blots throughout the manuscript are heavily overexposed and saturated, obscuring differences in protein levels and hindering data interpretation. The authors should provide properly exposed blots with quantification where appropriate.
We have provided Western blot images with appropriate exposure levels and included quantification where appropriate (i.e., to measure the kinetics of decay rates as in Figure 2C). For all the other immunoblots, we did not include densiometric quantification, given that the semi-quantitative nature of this technique would lead to overinterpretation of our data. This is, unfortunately, a limitation of the technique. In fact, eLife and other similar scientific journals do not adhere to the practice of quantifying Western blot analyses.
(2) Missing information in the graphs in Figure 2C and 4; S2? How many repeats? What are the asterisks?
Panels referenced above have been repeated several times, and further details are now provided in the figure legends.
Reviewer #3 (Recommendations for the authors):
(1) The claim that GMCL1 modulates paclitaxel sensitivity in cancer should be toned down
.
We agree that it would be an overstatement to claim that GMCL1 regulates paclitaxel sensitivity in cancer patients in a clinical context. The correlations we observed were based on publicly available, cell line–based datasets, which do not fully account for clinical heterogeneity and patient-specific factors. In response to this important point, we have revised our statements and corresponding text accordingly. We now placed greater emphasis on our molecular and cell biology studies.
(2) Additional experiments in low, physiologically relevant concentrations of paclitaxel would be interesting. It is possible that these concentrations activate the mitotic stopwatch in a portion of cells, in addition to inducing cell death due to chromosome loss, activation of an immune response, and chromothripsis. Results should be interpreted in the context of this complexity.
Please see the response to the public review.
(3) It would be helpful to show that CUL3 interacts with 53BP1 only in the presence of GMCL1.
We show that the binding of 53BP1 to GMCL1 is independent of the ability of GMCL1 to bind CUL3 (Figure 1C, D). The binding between 53BP1 and CUL3 is difficult to detect (Figure 1F) likely because it’s not direct but mediated by GMCL1.
(4) The GMCL1 "KO" lines appear to still express a low level of GMCL1 (Figure 2A), which should be acknowledged
We have included the GMCL1 mRNA expression data, as measured by RT-PCR, in Supplementary Figure 1G, demonstrating that GMCL1 expression was undetectable under the tested conditions.
(5) Additional description of the methods is warranted. This is particularly true for the database analysis that forms the basis for the claim that GMCL1 overexpression causes resistance to paclitaxel and other taxanes presented in Figure 3, the methodology used to obtain M-phase cells, and the concentration and duration of taxol treatment.
We have now extensively revised the Methods section.
(6) "Taxol" and "paclitaxel" are used interchangeably throughout the manuscript. Consistency would be preferable.
We have revised the manuscript to maintain consistency in the use of the terms “Taxol” and “paclitaxel” and now refer to “paclitaxel” when discussing that individual compound; “taxanes” when referring collectively to cabazitaxel, docetaxel and paclitaxel; and “Taxol” has been removed entirely to avoid redundancy or confusion.
(7) It is unclear why it is claimed that GMCL1 interacts "specifically" with 53BP1 (line 176) since multiple interactors were identified in the IP-MS study
We meant that the GMCL1 R433A mutant loses its ability to bind 53BP1, suggesting that the GMCL1-53BP1 interaction is not an artifact. We have now clarified the text.
(8) The bottom row in Figure S3 is misleading. Paclitaxel is not uniformly effective in every tumor of any given type, and so resistance occurs in every cancer type.
We fully agree that cancer is highly heterogeneous and that paclitaxel efficacy varies across tumors, even within the same histological subtype. Our intension was not to suggest uniform sensitivity/resistance, but rather to provide a high-level overview using aggregated data. We acknowledge that this coarse-grained representation may unintentionally imply overly generalized conclusions. To avoid potential misinterpretation, we have removed the corresponding panel in the revised paper.
Wherever you sell, GFS connects your channels to fast, reliable parcel delivery — all in one place.
Remove the H tag
Note: This response was posted by the corresponding author to Review Commons. The content has not been altered except for formatting.
Learn more at Review Commons
In this study, we mechanistically define a new molecular interaction linking two of the cell's major morphological regulatory pathways-the Rho GTPase and Hippo signaling networks. These two major signaling pathways are both required for life across huge swaths of the tree of life. They are required for the dynamic organization and reorganization of proteins, lipids, and genetic material that occurs in essential cellular processes such as division, motility and differentiation. For decades these pathways have been almost exclusively studied independently, however, they are known to act in concert in cancer to drive cytoskeletal remodeling and morphological changes that promote proliferation and metastasis. However, mechanistic insight into how they are coordinated is lacking.
Our data reveal a mechanistic model where coordination is mediated by the RhoA GTPase-activating protein ARHGAP18, which forms molecular interactions with both the tumor suppressor Merlin (NF2) and the transcriptional co-regulator YAP (YAP1). Using a combination of state-of-the-art super-resolution microscopy (STORM, SORA-confocal) in cultured human cells, biochemical pulldown assays with purified proteins, and analyses of tissue-derived samples, we characterize ARHGAP18's function from the molecular to the tissue level in both native and cancer model systems.
Together, these findings establish a previously unrecognized molecular connection between the RhoA and Hippo pathways and culminate in a working model that integrates our current results with prior work from our group and decades of prior studies. This model provides a new conceptual framework for understanding how RhoA and Hippo signaling are coordinated to regulate cell morphology and tumor progression in human cells.
In this substantially revised manuscript, we have addressed all comments from the expert reviewers described point-by-point below. A shared major comment from the reviewers was the request for direct evidence of the proposed mechanistic model. To address these constructive comments, we've added new experiments, new quantification, new text, new control data, and have added two expert authors, adding super-resolution mouse tissue imaging data for the endogenous study of ARHGAP18 in its native condition. We believe that these additions greatly enhance the manuscript and collectively address the overall message from the reviewer's collective comments.
Reviewer #1 (Evidence, reproducibility and clarity (Required)):
This manuscript describes a dual mechanism by which ARHGAP18 regulates the actin cytoskeleton. The authors propose that in addition to the known role for ARHGAP18 in regulating Rho GTPases, it also affects the cytoskeleton through regulation of the Hippo pathway transcriptional regulator YAP. ARHGAP18 knockout Jeg3 cells are were generated and show a clear loss of basal stress fiber like F-actin bundles. The authors further characterize the effects of ARHGAP18 knockout and overexpression. It is also discovered that ARHGAP18 binds to the Hippo pathway regulator Merlin and to YAP. Ultimately it is concluded that ARHGAP18 regulates the F-actin cytoskeleton through dual regulation of RHO GTPases and of YAP. While the phenotype of the ARHGAP18 knockout and the association of ARHGAP18 with Merlin and YAP is interesting, I found the authors conclusion that these phenotypes are due to ARHGAP18 regulation of both RHO and YAP to be based on largely correlative evidence and sometimes lacking in controls or tests for significance. In addition the authors often make overly strong conclusions based on the experimental evidence. In some instances, the rationale for how the experimental results support the conclusion is insufficiently articulated, making evaluation challenging. In general although the authors have some interesting observations, more definitive experiments with proper controls and statistical tests for significance and reproducibility are needed to justify their overall conclusions.
*We appreciate the reviewers' constructive comments and have added substantial new data and quantifications to address their concerns. We have focused these new data on directly testing the proposed mechanisms, adding controls, and performing quantitative analysis with statistical testing. Additionally, we have edited our language to make our rationale clearer and to present our conclusions as a more moderate assessment of our experimental results. Below we respond to the specific comments made by the reviewer, followed by a list of additional editorial changes we've made based on the reviewer's overarching comments on clarity and rationale. *
Specific Comments
1) The authors make a big point about the effects of ARHGAP18 on myosin light chain phosphorylation. However, this result is not quantified and tested for statistical significance and reproducibility.
*We thank the reviewer for their comments on our western blotting quantification, which in the original submission version had quantification of RhoA downstream signaling of pCofilin/ Cofilin and pLIMK/ LIMK. We had withheld the pMLC and MLC quantification as the result was previously published with quantification, reproducibility, and statistical significance by our group in our prior manuscript on ARHGAP18 published in Elife in 2024 (Fig. 4E of *
https://doi.org/10.7554/eLife.83526 ). However, these prior results lacked the new overexpression data. We recognize the need to add these data to this manuscript as requested by the reviewer.
*To address the reviewer's comment, we have added quantification of pMLC/MLC (Fig. 1F) *
2) Along similar lines in Figure 2C they state that overexpression of ARHGAP18 causes cells to invade over the top of their neighbors. This might be true and interesting, but only a single cell is shown and there is no quantification or controls for simply overexpressing something in that cell. The authors also conclude from this image that the overexpression phenotype is independent of its GAP activity on Rho. It is not clear how this conclusion is made based on the data. It would seem like a more definitive experiment would be to see if a similar phenotype was induced by an ARHGAP18 mutant deficient in GAP activity.
Based on the reviewer's comment, we recognize the qualitative statements made in Figure 2C (now Figure 3) should've been made more quantitative. We have added the control of Jeg 3 WT cells expressed with empty vector flag to show that WT cells do not invade over the top of each other (Fig. 3F). Additionally, we have added the quantification found in Fig. 3E, which shows the % invasive/ non-invasive cells between WT and ARHGAP18 overexpression cells. We have clarified our conclusions to make clear that these data do not directly test if the invasive phenotype derives from a Rho-independent mechanism. The text now states the following conclusion alongside others, which can be seen in our tracked changes:
"These data support the conclusion that ARHGAP18 acts to regulate basal and junctional actin. However, it was not clear whether this activity occurred through a Rho-independent or a Rho-dependent mechanism."
We have added new data of cells expressing an ARHGAP18 mutant deficient in GAP activity, which is explained in detail in the following response below.
3) In Figure 3 the authors compare gene expression profiles of ARHGAP18 knockout cells to wild-type cells. They see lots of differences in focal adhesion and cytoskeletal proteins and conclude that this supports their conclusion that ARHGAP18 is not just acting through RHO. The rationale for this in not clear. In addition, they observe changes in expression profiles consistent with changes in YAP activity. They conclude that the effects are direct. This very well might be true. However RHO is a potent regulator of YAP activity and the results seem quite consistent with ARHGAP18 acting through RHO to affect YAP.
We thank the reviewer for their comment and believe the revised manuscript now presents direct evidence to support the conclusions made through the editing text and the incorporation of new data.
First, the reviewer highlighted that we were not clear in our rationale and explanation of the conclusions made from our RNAseq data in the new Figure 4 (Previously Figure 3). We agree with the reviewer that the RNAseq data alone is not sufficient rationale for the conclusion that ARHGAP18 is acting through YAP directly. In the revised manuscript, the conclusion is now made based on the combination of our multi-faceted investigation of the relationship between ARHGAP18 and YAP (most importantly, new Figure 5). It's important for us to argue that our RNAseq analysis is much more robust and specific than simply reporting a descriptive assay seeing lots of differences in cytoskeletal proteins. We recruited an outside RNAseq expert collaborator; Dr. Yongho Bae, to perform state-of-the-art IPA analysis and a grueling manual curation of the top hit genes to identify the predominant signaling pathways linking the loss of ARHGAP18 to known YAP translational products. We've provided a supplemental table listing each citation supporting the identified YAP pathway associations from this manual curation. We also have added a new discussion paragraph on RNAseq data to clarify our specific RNAseq data results and analysis. In the revised manuscript, we have moderated our language in the results text regarding the RNAseq data to reflect the reviewer's suggestion:
"Our RNAseq data alone could not independently confirm if the alterations to transcriptional signaling and expression of actin cytoskeleton proteins were through a Rho-dependent or Rho-independent mechanism."
*
*
Second, in this comment and the above, the reviewer highlights the need for a new experiment to directly test the Rho Independent effects of ARHGAP18, which we now provide in the new Figure 5. In this new data, we've applied an experimental design suggested by reviewer 2 regarding the same concern. In short, we've produced and expressed a point mutant variant ARHGAP18(R365A), which abolishes the Rho GAP activity while maintaining the remainder of the protein intact. This construct allows us to directly test the effects of ARHGAP18 independent from its RhoA GAP activity. We find that the GAP-deficient ARHGAP18 is able to fully rescue basal focal adhesions, indicating that the basal actin phenotype is at least in part regulated through a Rho-independent mechanism.
*
*
*We believe the revised manuscript, when taken in totality, provides the definitive proof requested by the reviewer. Specifically, the combination of Figure 5, where we show new data using the ARHGAP18(R365A) variant, and the result that ARHGAP18 forms a stable complex with YAP (Fig. 6G) or Merlin (Fig.6A), is supportive of direct Rho-independent molecular interactions between YAP, Merlin, and ARHGAP18. *
4) In Figure 4A showing Merlin binding to ARHGAP18 there is no control for the amount of Merlin sticking to the column as was done in Figure 4F for binding experiments with YAP. This makes it difficult to determine the significance of the observed binding.
We have performed the requested control experiment and added the results to Figure 6A.
5) The images in Figure 4C showing YAP being maintained in the nucleus more in ARHGAP18 knockout cells compared to wild-type. However the images only show a few cells and YAP localization can be highly variable depending on where you look in a field. Images with more cells and some sort of quantification would bolster this result.
We have provided quantification (Figure 6D) of what was originally Figure 4C (now Figure 6C).
Reviewer #1 (Significance (Required)):
While the phenotype of the ARHGAP18 knockout and the association of ARHGAP18 with Merlin and YAP is interesting, I found the authors conclusion that these phenotypes are due to ARHGAP18 regulation of both RHO and YAP to be based on largely correlative evidence and sometimes lacking in controls or tests for significance. In addition the authors often make overly strong conclusions based on the experimental evidence. In some instances, the rationale for how the experimental results support the conclusion is insufficiently articulated, making evaluation challenging. In general although the authors have some interesting observations, more definitive experiments with proper controls and statistical tests for significance and reproducibility are needed to justify their overall conclusions.
In the above comments, we detail the specific definitive experiments, proper controls, and statistical tests for significance, requested by the reviewer, which we believe greatly strengthen our manuscript.
Reviewer #2 (Evidence, reproducibility and clarity (Required)):
This manuscript investigates the Rho effector, ARHGAP18 in Jegs cells, a trophoblastic cell line. It presents a number of new pieces of data, which increase our understanding of the importance of this GAP on cell function and explains at a molecular level previous results of other workers in the field. ARHGAP18 was originally given the name "conundrum' and continues to stand apart from the majority of other GAP proteins and their functions. Hence the data here is significant and of high standard.
The data is clear, and the images are of high quality and extremely impressive in their resolution. It is significant and adds a further layer to our understanding of the regulation of cell migration, particularly in the formation and resolution of microvilli.
We appreciate the reviewer's comments and supportive insights.
The data is based on the use of the cell line Jeg3. Even the authors previous publication in eLife is based only on this cell line. They need to show the conclusions are general and not specific to this line of cells. As an extension of this, is the ARHGAP18 function shown here only in transformed cells? Does the same mechanisms operate in normal cells, which respond to activation to proliferate or migrate?
- *
In endothelial cells, Lovelace et al 2017 showed localization to microtubules and that depletion of ARHGAP18 resulted in microtubule instability. The authors may like to comment on the differences. Is this a cell type difference or RhoA versus RhoC difference?
In our previous publication (Lombardo Elife), we validated the finding that ARHGAP18 forms a complex with microtubules, as we detected tubulin in the ARHGAP18 pulldown experiment (Figure 1- Source Data). However, our data indicate that in Jeg3 cells ARHGAP18 does not localize to the same microtubule associated spheres observed in the Lovelace publication. We now comment on the shared conclusions and differences between this manuscript and the Lovelace et al 2017 in the discussion section.
"In endothelial cells, ARHGAP18 has been reported to localize microtubules and plays a role in maintaining proper microtubule stability (Lovelace et al., 2017). In our epithelial cell culture models and WT mouse intestine, we have been unable to detect ARHGAP18 at microtubules suggesting ARHGAP18 may have additional functions is various cell types."
On pages 7,9 they conclude that MLC and basal and junctional actin are regulated through a GAP independent mechanism. The best way to show this is with overexpression of a GAP mutant.
We appreciate the reviewer's insight and have produced and expressed a GAP mutant, ARHGAP18(R365A), in our cells, directly testing our conclusion that ARHGAP18 has a GAP-independent function. These data are now presented in revised Figure 5 and explained further in response to reviewer #1.
There is a huge amount of data presented in Figure 3, but their 2 genes which they focus on, LOP1 and CORO1A, are discussed but no actual data presented in support.
We now validate the CORO1A by qPCR in Figure 4J.
- *
Reviewer #2 (Significance (Required)):
The data is significant and adds a further layer to our understanding of the regulation of cell migration, particularly in the formation and resolution of microvilli. This manuscript will be of significance to an basic science audience in the field of RhoGTPases and cell migration.
Reviewer #3 (Evidence, reproducibility and clarity (Required)):
The study by Murray et al explores the effects of ARHGAP18 on the actin cytoskeleton, Rho effector kinases, non-muscle myosin, and transcription. Using super resolution microscopy, they show that in ARHGAP18 KO cells there is a mixed and unexpected cytoskeleton phenotype where myosin phosphorylation appears to be increased, but actin is disorganised with reduced stress fibres, diminished focal adhesions and augmented invasiveness. They conclude that the underlying mechanisms are likely independent from RhoA. Next, they perform RNAseq using the KO cells and identify an array of dysregulated genes, including those that play crucial roles in microvilli (related to previously published findings). Analysis of the data identify gene expression changes that are relevant for altered focal adhesion (integrins). Further analysis reveals that a large cohort of the dysregulated genes are YAP targets. They then show that in ARHGAP18 KO cells YAP nuclear localization, as detected by immunostaining, is augmented; and demonstrate that immobilized ARHGAP18 protein can bind the Hippo regulator merlin as well as YAP itself.
Major comments:
1, The premise of the study (that ARHGAP18 is a RhoA effector or may acts independently of RhoA) remains not proven.
We have added new evidence of direct RhoA independent activity for ARHGAP18 described in the above comments. Specifically, we've added data using a RhoA-GAP dead variant of ARHGAP18 in Figure 5, which we believe addresses this comment.
At several places (including in the title) the authors refer to ARHGAP18 as a Rho effector, which would suggest that it is downstream form Rho, but the basis for this is not clear. In fact, their own previous study suggested that ARHGAP is a RhoA regulator, rather than an effector. In general, the connection of the described effects to RhoA remains unclear, and not addressed in this study. The authors seem to go back and forth in their conclusions regarding the connection between ARHGAP18 and RhoA. For example, the first section of results is finished by stating (line 194): "These data support the conclusion that ARHGAP18 acts to regulate basal and junctional actin through Rho-independent mechanism". But the next section starts by stating (line 198): "We hypothesized that the invasive and cytoskeletal phenotypes observed at the basal surface of cells devoid of ARHGAP18 may be a result of changes in regulation at the transcriptional level either directly through RhoA signaling or through an additional mechanism specific to ARHGAP18". The paper would be strengthened by adding data that show whether the effects are indeed downstream, from RhoA or RhoA independent. If there is no sufficient demonstration that ARHGAP18 is downstream of RhoA and is an effector, this needs to be stated explicitly, and the wording should be changed.
*We now provide new data in Figure 5, which directly tests the RhoA independent functions of ARHGAP18 as recommended by the reviewer. Our understanding of the term effector is 'a molecule that activates, controls, or inactivates a process or action.' Based on this understanding, we used the term to convey ARHGAP18's functional role within the feedback loop, rather than to imply that it acts exclusively downstream. *
We seek to clarify our perspective with the reviewer's assertion that we go "back and forth" as to if ARHGAP18 functions in a Rho Dependent or Rho Independent manner. It was our intent to propose a model where ARHGAP 18 acts in two separate circuits that regulate cell signaling. The first circuit involves ARHGAP18's canonical RhoA GAP activity, which involves ERMs and LOK/SLK, and is limited to the apical plasma membrane. This first signaling circuit was characterized in our prior Elife manuscript (Lombardo et al., 2024) and in an earlier JCB manuscript (Zaman and Lombardo et al., 2021). In this newly revised manuscript, we provide a partial mechanistic characterization of the second circuit, which we freely admit is much more complex and will likely require additional study to fully characterize.
As both circuits operate as signaling feedback loops, we find the terms 'upstream' and 'downstream' to be of limited value, and we attempt to avoid their use when possible. We retain their use only when referring to the Hippo and ROCK signaling cascades, where these designations are well established. We suggest that the conceptual inconsistencies of Conundrum/ARHGAP18 may have arisen from the tendency to view it in strictly binary terms as upstream or downstream. Here, we propose a third possibility that ARHGAP18 functions as both, participating in a negative feedback loop.
*We have edited and added data testing if the effects are Rho independent and discussion text in response to the reviewer's comments and clarify the molecular function of ARHGAP18.
"Additionally, focal adhesions and basal actin bundles are restored to WT levels when the ARHGAP18(R365A) GAP-ablated mutant is expressed in ARHGAP18 KO cells (Fig. 5A, B). These results represent the strongest argument that ARHGAP18 functions in additional pathways to RhoA/C alone. Our data suggests that at least one of the alternative pathways is through ARHGAP18's interaction with YAP and Merlin. From these data we conclude that ARHGAP18 has important functions in both RhoA signaling through both its GAP activity and in Hippo signaling through its GAP independent binding partners. "*
*
*
The study is descriptive and contains a series of observations that are not connected. Because of this, the study's conclusions are not well supported, and key mechanistic insight is limited. The study feels like a set of separate observations, that remain incompletely worked out and have some preliminary feel to them. The model in the last figure also seems to contain hypotheses based on the observations, several of which remains to be proven.
*We present our revised manuscript, in which we've more clearly outlined our rationale and conclusions, as detailed in the above responses, to emphasize the overall connectivity of the study. We have also updated the title of Figure 7 to read "__Theoretical __Model of ARHGAP18's coordination of RhoA and Hippo signaling pathways in Human epithelial cells." To make it clear that we are presenting a working model, which has elements that will require additional investigation. Throughout the manuscript, we highlight the unknown elements that remain to be tested or other outstanding questions. Thus, we do not aim to characterize this complex signaling coordination completely. Instead, this manuscript represents the 3rd iteration in our systematic advances to describe this entirely new signaling pathway. We agree that, despite three separate manuscripts (this one included) to date, this work represents an early stage in understanding the system, many additional studies will be needed to characterize this signaling system fully. Figure 7 is presented as a working model that results from a thoughtful combination of our collective data and that of other researchers, derived from numerous species across decades of study. We firmly believe that proposing such integrative models is valuable for advancing the field. We also recognize the importance of clearly indicating which aspects remain hypothetical. We now explicitly note in several places within the discussion which components of the model will require further validation and experimental confirmation. For example, regarding our theoretical mechanism in Figure 7 we state: *
"Validation of the direct mechanism by which YAP/TAZ transcriptional changes drive basal actin changes in ARHGAP18 KO cells will require further investigation based on predictions from RNAseq results."
Addressing any possible connection between key effects of ARHGAP18 KO (changes in actin, focal adhesion, integrins, Yap and merlin binding) could strengthen the manuscript. One such specific question is the whether the changes in integrin expression (RNAseq) are indeed connected to the actin alterations and reduction ion focal adhesions (Fig 1). Staining for these integrins to show they are indeed altered, and/or manipulating any of them to reproduce changes could provide and exciting addition.
*We attempted to stain cells for Integrins by purchasing three separate antibodies. However, despite extensive optimization and careful selection of the specific integrins using our RNAseq results we were unable to get any of these antibodies to work in any cell type or condition. We believe that there is a technical challenge to staining for integrins due to their transmembrane and extracellular components, which we were unable to overcome. As an attempt to address the reviewers comment, we alternatively stained cells for paxillin which directly binds the cytoplasmic tails of integrins (Fig. 3&5). *
Some of the experimental findings are not convincing or lack controls. Fig 1: some of the western blots are not convincing or poor quality. [...] On the same figure, the quality of LIM kinase blots is poor. [...] The signal is weak, and the blot does not appear to support the quantification. The last condition (expression of flag-ARHGAP18) results in a large drop in pLIMK and pcofilin on the blot, which is not reflected by the graph. Addition of *a better blot and the use of strong positive or negative control would boost confidence in these data. *
In response to this and other reviewers' comments, we have added new western data and quantification to Figure 1. We now focus on MLC/pMLC data as we believe these data highlight the potential Rho-independent mechanism of ARHGAP18, and we were able to greatly improve the quality of the blots through careful optimization. We hope the reviewer finds these blots and quantifications (Fig. 1E and F) more convincing.
*We note that phospho-specific Western blotting presents considerably greater technical challenges than conventional blotting. We believe that the appearance of an attractive looking blot does not always correlate to quality or reproducibility and have focused on taking extraordinarily careful steps in the blotting of our phospho-specific antibodies, which at times comes at the cost of the blot's attractiveness in appearance. For example, all phospho-specific antibodies are run using two color fluorescent markers to blot against both the total protein and the phospho-protein on the same blot. This approach often leads to blots that have reduced signal to noise compared to chemiluminescent Westerns. Additionally, we use phospho-specific blocking buffer reagents which do not contain phosphate-based buffers or agents that attract non-specific phospho-staining signals. These blocking buffers are not as effective as non-fat milk in pbs at blocking the background signal, however, they are ultimately cleaner for phospho-specific primary antibodies. We use carefully optimized protocols, from cell treatment to lysis, transfer, and antibody incubation, including methods developed by laboratories where the corresponding author of the manuscript was trained. Nonetheless, despite these efforts, we have now removed the LIMK and cofilin data because we deemed them unnecessary for the main conclusions of this manuscript and were unable to improve their quality to satisfy the reviewer. *
The changes in pMLC on the western blots are very small, and for any conclusion, these studies require quantification. Further, the expression levels of Flag-ARHGAP18 needs to be shown to support the statement that the protein is expressed, and indeed overexpressed under these conditions (vs just re-expressed).
In continuation of the above comment, we have made significant effort to improve the quality of our pMLC western blots and now provide quantification in Figure 1. We also now provide the Flag-ARHGAP18 signal as requested by the reviewer.
Fig 4: the differences in YAP nuclear localization under the various conditions are not well visible. Quantitation of nuclear/cytosolic signal ratio should be provided. Please provide a rationale and more context for using serum starvation and re-addition. What is the expected effect? Serum removal and addition is referred to as nutrient removal and re-addition, but this is inaccurate, as it does not equal nutrient removal, since serum contains a variety of other important components, e.g. growth factors too.
We have provided new quantification of the nuclear/cytosolic signal ratio in Figure 6D. We have explained our rational for the study through the following new text:
"Merlin is activated and localized to junctions upon signaling, promoting growth and proliferation; among these signals is the availability of growth factors and other components of serum (Bretscher et al., 2002). We hypothesized that since ARHGAP18 formed a complex with Merlin that ARHGAP18's localization may localize to junctions under conditions which promote Merlin activation."
We have altered our use of "nutrient removal" to "serum removal"
The binding between ARHGAP18 and merlin is interesting, but a key limitation is the use of expressed proteins. Can the binding be shown for the endogenous proteins (IP, colocalization). Another important unaddressed question is the relevance of this binding, and the relation of this to altered YAP nuclear localization.
*Our data in Fig. 6G shows binding of a resin bound human ARHGAP18 to endogenous YAP from human cells as suggested by the reviewer. In Fig. 6A, we have selected to use GFP-Merlin as Merlin shares approximately 60% sequence identity with Ezrin, Radixin, and Moesin (ERMs). Their similarity is such that Merlin was named for Moesin-Ezrin-Radixin-Like Protein. In our experience, nearly all Merlin or ERM antibodies have some cross-contaminating signal. Thus, a major concern is that if we were to blot for endogenous Merlin in the pull-down experiment, we may see a band that could in fact be ERMs. To avoid this, we tagged Merlin with GFP to ensure that the product pulled down by ARHGAP18 was Merlin, not an ERM. Regarding the ARHGAP18-resin bound column, our homemade ARHGAP18 antibody is polyclonal. We have extensive experience in pulldown assays and have found that the binding of a polyclonal antibody to the bait protein can produce less accurate results, as the binding site for the antibody is unknown and can sterically hinder attachment of target proteins like Merlin. In our experience, attachment to a flag-tag, which is expressed after a flexible linker at the N- or C-terminus, allows us to overcome this limitation, which we've used in this manuscript. *
Minor comments:
Introduction line 99: "When localized to the nucleus, YAP/TAZ promotes the activation of cytoskeletal transcription factors associated with cell proliferation and actin polymerization" Please clarify what you mean by this statement, that is inaccurate in its present for. Did you mean effects on transcription factors that control cytoskeletal proteins, or do you mean that Yap/Taz affect these proteins? Please also provide reference for this.
We've altered the sentence as suggested by the reviewer, which now reads the following:
"When localized to the nucleus, YAP/TAZ promotes transcriptional changes associated with cell proliferation and actin polymerization."
*The full mechanism for how YAP/TAZ promotes proliferation and actin polymerization is a currently debated issue. We do not think introducing the various current proposed models is required for this manuscript, and we simply intend to convey that when in the nucleus, YAP/TAZ promotes transcriptional changes that drive actin polymerization and cell proliferation. *
-What is the cell confluence in these experiments? For epithelial cells confluence affects actin structure. Please comment on similarity of confluency across experimental conditions?
All cellular experiments are paired where WT and ARHGAP18 KO cells are plated at the same time under identical conditions. For imaging, we plate all cells onto glass coverslips in a 6 well dish so that each condition is literally in the same cell culture plate and gets identical treatment. In our prior Elife paper studying ARHGAP18, we characterized that ARHGAP18 KO cells and WT cells divide at a similar rate and have similar proliferation characteristics. The epithelial cell cultures are maintained for experiments around 70-80% confluency. For the focal adhesion staining experiments, the confluency is slightly lower, between 50-60% to capture the focal adhesions towards the leading edge. We have added the following new text to further describe these methods: "Cell cultures for experiments were maintained at 70%-80% confluency. For focal adhesion experiments, the cell cultures were maintained at 50%-60% confluency."
-Fig 2 legend: please indicate that the protein detected was non-muscle myosin heavy chain (distinct from the light chain detected in Fig 1).
- *
We have altered original Figure 2 (new Figure 3) legend.
-Line 339-340: please check the syntax of this sentence -Western blot quantification: the comparison of experiments with samples run on different gels/blots requires careful normalization and experimental consistency. Please describe how this was achieved.
We have added the following new text to further describe these methods:
"For blots which required quantification of antibodies that were only rabbit primaries (e.g., pMLC/MLC antibodies listed above), samples were loaded onto a single gel and transferred onto a single membrane at the same time. After transfer, the membrane was cut in half and subsequent steps were done in parallel. All quantified blots were checked for equal loading using either anti-tubulin as a housekeeping protein or total protein as detected by Coomassie staining"
Reviewer #3 (Significance (Required)):
Rho signalling is a central regulator of an array of normal and pathological cell functions, and our understanding of the context dependent regulation of this key pathway remains very incomplete. Therefore, new knowledge on the role of specific regulators, such as ARHGAP18, is of interest to a very broad range of researchers. A further exciting aspect of this protein, that despite indications by many studies that it acts as a GAP (inhibitor) for Rho proteins, there are findings in the literature that suggest that its manipulation can affect actin in unexpected (opposite) manner. These point to possible Rho-independent roles, and warranted further in-depth exploration.
One of the strength of the study is that it explores possible roles of ARHGAP18 beyond RhoA and describes some new and interesting observations, which advance our knowledge. The authors use some excellent tools (e.g. ARHGAP KO cells and re-expression) and approaches (e.g. super resolution microscopy to analyze actin changes, RNAseq and bioinformatics to find genes that may be downstream from ARHGAP18). A key limitation of the study however, is that it is not clear whether the observed findings are indeed independent from RhoA. Further limitation is that potential causal relationships between the described findings are not studied, and therefore the findings are in some cases overinterpreted, and limited mechanistic insights are provided. In some cases the exclusive use of expressed proteins is also a limitation. Finally, some of the experiments also need improvement.
Reviewer expertise: RhoA signalling, guanine nucleotide exchange factors, epithelial biology, cell migration, intercellular junctions.
In the above comments, we detail the new experimental data addressing reviewer 3's listed key limitations. We've added new data using the Rho GAP deficient ARHGAP18(R365A) variant which allows for the direct characterization of ARHGAP18's Rho independent activity. We have introduced new data in WT cells studying endogenous proteins to address the limitations from expressed proteins. Finally, we have moderated our language to address overinterpretation. Collectively, we believe that our revised manuscript addresses the constructive reviewer's comments.
Author response:
The following is the authors’ response to the original reviews.
Reviewer #1(Public review):
Summary:
In this study, the authors aim to understand how Rhino, a chromatin protein essential for small RNA production in fruit flies, is initially recruited to specific regions of the genome. They propose that asymmetric arginine methylation of histones, particularly mediated by the enzyme DART4, plays a key role in defining the first genomic sites of Rhino localization. Using a combination of inducible expression systems, chromatin immunoprecipitation, and genetic knockdowns, the authors identify a new class of Rhinobound loci, termed DART4 clusters, that may represent nascent or transitional piRNA clusters.
Strengths:
One of the main strengths of this work lies in its comprehensive use of genomic data to reveal a correlation between ADMA histones and Rhino enrichment at the border of known piRNA clusters. The use of both cultured cells and ovaries adds robustness to this observation. The knockdown of DART4 supports a role for H3R17me2a in shaping Rhino binding at a subset of genomic regions.
Weaknesses:
However, Rhino binding at, and piRNA production from, canonical piRNA clusters appears largely unaffected by DART4 depletion, and spreading of Rhino from ADMArich boundaries was not directly demonstrated. Therefore, while the correlation is clearly documented, further investigation would be needed to determine the functional requirement of these histone marks in piRNA cluster specification.
The study identify piRNA cluster-like regions called DART4 clusters. While the model proposes that DART4 clusters represent evolutionary precursors of mature piRNA clusters, the functional output of these clusters remains limited. Additional experiments could help clarify whether low-level piRNA production from these loci is sufficient to guide Piwi-dependent silencing.
In summary, the authors present a well-executed study that raises intriguing hypotheses about the early chromatin context of piRNA cluster formation. The work will be of interest to researchers studying genome regulation, small RNA pathways, and the chromatin mechanisms of transposon control. It provides useful resources and new candidate loci for follow-up studies, while also highlighting the need for further functional validation to fully support the proposed model.
We sincerely thank Reviewer #1 for the thoughtful and constructive summary of our work. We appreciate the reviewer’s recognition that our study provides a comprehensive analysis of the relationship between ADMA-histones and Rhino localization, and that it raises intriguing hypotheses about the early chromatin context of piRNA cluster formation.
We fully agree with the reviewer that our data primarily demonstrate correlation between ADMA-histones and Rhino localization, rather than direct causation. In response, we have carefully revised the text throughout the manuscript to avoid overstatements implying causality (details provided below).
We also acknowledge the reviewer’s important point that the functional requirement of ADMA-histones for piRNA clusters specification remains to be further established. We have now added the discussion about our experimental limitations (page 18).
Overall, we have revised the manuscript to present our findings more cautiously and transparently, emphasizing that our data reveal a correlation between ADMA-histone marks and the initial localization of Rhino, rather than proving a direct mechanistic requirement. We thank the reviewer again for highlighting these important distinctions.
Reviewer #2 (Public review):
This study seeks to understand how the Rhino factor knows how to localize to specific transposon loci and to specific piRNA clusters to direct the correct formation of specialized heterochromatin that promotes piRNA biogenesis in the fly germline. In particular, these dual-strand piRNA clusters with names like 42AB, 38C, 80F, and 102F generate the bulk of ovarian piRNAs in the nurse cells of the fly ovary, but the evolutionary significance of these dual-strand piRNA clusters remains mysterious since triple null mutants of these dual-strand piRNA clusters still allows fly ovaries to develop and remain fertile. Nevertheless, mutants of Rhino and its interactors Deadlock, Cutoff, Kipferl and Moonshiner, etc, causes more piRNA loss beyond these dual-strand clusters and exhibit the phenotype of major female infertility, so the impact of proper assembly of Rhino, the RDC, Kipferl etc onto proper piRNA chromatin is an important and interesting biological question that is not fully understood.
This study tries to first test ectopic expression of Rhino via engineering a Dox-inducible Rhino transgene in the OSC line that only expresses the primary Piwi pathway that reflects the natural single pathway expression the follicle cells and is quite distinct from the nurse cell germline piRNA pathway that is promoted by Rhino, Moonshiner, etc. The authors present some compelling evidence that this ectopic Rhino expression in OSCs may reveal how Rhino can initiate de novo binding via ADMA histone marks, a feat that would be much more challenging to demonstrate in the germline where this epigenetic naïve state cannot be modeled since germ cell collapse would likely ensue. In the OSC, the authors have tested the knockdown of four of the 11 known Drosophila PRMTs (DARTs), and comparing to ectopic Rhino foci that they observe in HP1a knockdown (KD), they conclude DART1 and DART4 are the prime factors to study further in looking for disruption of ADMA histone marks. The authors also test KD of DART8 and CG17726 in OSCs, but in the fly, the authors only test Germ Line KD of DART4 only, they do not explain why these other DARTs are not tested in GLKD, the UAS-RNAi resources in Drosophila strain repositories should be very complete and have reagents for these knockdowns to be accessible.
The authors only characterize some particular ADMA marks of H3R17me2a as showing strong decrease after DART4 GLKD, and then they see some small subset of piRNA clusters go down in piRNA production as shown in Figure 6B and Figure 6F and Supplementary Figure 7. This small subset of DART4-dependent piRNA clusters does lose Rhino and Kipferl recruitment, which is an interesting result.
However, the biggest issue with this study is the mystery that the set of the most prominent dual-strand piRNA clusters. 42AB, 38C, 80F, and 102F, are the prime genomic loci subjected to Rhino regulation, and they do not show any change in piRNA production in the GLKD of DART4. The authors bury this surprising negative result in Supplementary Figure 5E, but this is also evident in no decrease (actually an n.s. increase) in Rhino association in Figure 5D. Since these main piRNA clusters involve the RDC, Kipferl, Moonshiner, etc, and it does not change in ADMA status and piRNA loss after DART4 GLKD, this poses a problem with the model in Figure 7C. In this study, there is only a GLKD of DART4 and no GLKD of the other DARTs in fly ovaries.
One way the authors rationalize this peculiar exception is the argument that DART4 is only acting on evolutionarily "young" piRNA clusters like the bx, CG14629, and CG31612, but the lack of any change on the majority of other piRNA clusters in Figure 6F leaves upon the unsatisfying concern that there is much functional redundancy remaining with other DARTs not being tested by GLKD in the fly that would have a bigger impact on the other main dual-strand piRNA clusters being regulated by Rhino and ADMA-histone marks.
Also, the current data does not provide convincing enough support for the model Figure 7C and the paper title of ADMA-histones being the key determinant in the fly ovary for Rhino recognition of the dual-strand piRNA clusters. Although much of this study's data is well constructed and presented, there remains a large gap that no other DARTs were tested in GLKD that would show a big loss of piRNAs from the main dual-strand piRNA clusters of 42AB, 38C, 80F, and 102F, where Rhino has prominent spreading in these regions.
As the manuscript currently stands, I do not think the authors present enough data to conclude that "ADMA-histones [As a Major new histone mark class] does play a crucial role in the initial recognition of dual-strand piRNA cluster regions by Rhino" because the data here mainly just show a small subset of evolutionarily young piRNA clusters have a strong effect from GLKD of DART4. The authors could extensively revise the study to be much more specific in the title and conclusion that they have uncovered this very unique niche of a small subset of DART4-dependent piRNA clusters, but this niche finding may dampen the impact and significance of this study since other major dual-strand piRNA clusters do not change during DART4 GLKD, and the authors do not show data GLKD of any other DARTs. The niche finding of just a small subset of DART-4-dependent piRNA clusters might make another specialized genetics forum a more appropriate venue.
We are deeply grateful to Reviewer #2 for the detailed and insightful review that carefully situates our study in the broader context of Rhino-mediated piRNA cluster regulation. We appreciate the reviewer’s recognition that our inducible Rhino expression system in OSCs provides a valuable model to explore de novo Rhino recruitment under a simplified chromatin environment.
At the same time, we agree that the current data mainly support a role for DART4 in regulating a subset of evolutionarily young piRNA clusters, and do not demonstrate a requirement for ADMA-histones at the major dual-strand piRNA clusters such as 42AB or 38C. We have therefore revised the title and main conclusions to more accurately reflect the scope of our findings.
We agree with the reviewer that functional redundancy among DARTs may explain why major dual-strand piRNA clusters are unaffected by DART4 GLKD. Indeed, we have tried DART1 GLKD in the germline, which shows collapse of Rhino foci in OSCs.For DART1 GLKD, two approaches were possible:
(1) Crossing the BDSC UAS-RNAi line (ID: 36891) with nos-GAL4.
(2) Crossing the VDRC UAS-RNAi line (ID: 110391) with nos-GAL4 and UAS-Dcr2.
The first approach was not feasible because the UAS-RNAi line always arrived as dead on arrival (DOA) and could not be maintained in our laboratory. The second approach did not yield effective and stable knockdown (as follows).
DART8 and CG17726 did not alter Rhino foci in OSC knockdown experiments; therefore, we did not attempt germline knockdown (GLKD) of these DARTs in the ovary. We agree with the reviewer’s opinion that there are piRNA source loci where Rhino localization depends on DART1, and that simultaneous depletion of multiple DARTs may indeed reveal additional positive results because ADMA-histones such as H3R8me2a may be completely eliminated by the knockdown of multiple DARTs. At the same time, we note that many evolutionarily conserved piRNA clusters show a loss of ADMA accumulation compared with evolutionarily young piRNA clusters, with levels that are comparable to the background input in ChIP-seq reads. Therefore, conserved clusters such as 42AB and 38C may no longer be regulated by ADMA. Even if multiple DARTs function redundantly to regulate ADMA, it may be difficult to disrupt Rhino localization at such conserved piRNA clusters by depletion of DARTs. While disruption of Rhino localization at conserved clusters like 42AB and 38C may be challenging, we cannot exclude the possibility that DART depletion affects Rhino binding at less conserved piRNA clusters, where ADMA modification remains detectable. We added clarifications in the Discussion to acknowledge the potential redundancy with other DARTs and to note that further knockdown experiments in the germline will be necessary to test this model comprehensively (page 18).
We appreciate the reviewer’s critical feedback, which has helped us refine the message and strengthen the interpretative balance of the paper.
Reviewer #1 (Recommendations for the authors):
In multiple places, the link between ADMA histones and Rhino recruitment is presented in terms that imply causality. Please revise these statements to reflect that, in most cases, the evidence supports correlation rather than direct functional necessity. Similarly, statements suggesting that ADMA histones promote Rhino spreading should be revised unless supported by direct evidence.
We sincerely thank the reviewer for the insightful comments. We recognize that these suggestions are crucial for improving the manuscript, and we have revised it accordingly to address the concerns. The specific revisions we made are detailed below.
(1) Page 1, line 14: The original sentence “in establishing the sites” was changed to “may establish the potential sites.”
(2) Page 4, lines 11-12: The original sentence “genomic regions where Rhino binds at the ends and propagates in the areas in a DART4-dependent manner, but not stably anchored” was changed to “genomic regions that have ADMA-histones at their ends and exhibit broad Rhino spreading across their internal regions in a DART4dependent manner”
(3) Page4, lines 12-15: The original sentence “Kipferl is present at the regions but not sufficient to stabilize Rhino-genomic binding after Rhino propagates.” was changed to “In contrast to authentic piRNA clusters, Kipferl was lost together with Rhino upon DART4 depletion in these regions, suggesting that Kipferl by itself is not sufficient to stabilize Rhino binding; rather, their localization depends on DART4.”
(4) Page4, lines17-18: The original sentence “are considered to be primitive clusters” was changed to “might be nascent dual-strand piRNA source loci”.
(5) Page 8, line 7: The original sentence “Involvement of ADMA-histones in the genomic localization of Rhino was implicated.” was changed to “Correlation of ADMA-histones in the genomic localization of Rhino was implicated.”
(6) Page 8, lines 19-21: The original sentence “These results suggest that ADMAhistones, together with H3K9me3, contribute significantly and specifically to the recruitment of Rhino to the ends of dual-strand clusters in OSCs.” was changed to “These results raise the possibility that ADMA-histones, together with H3K9me3, may contribute specifically to the recruitment of Rhino to the ends of dual-strand clusters in OSCs.”
(7) Page 10, lines 11-13: The original sentence “These results suggest that DART1 and DART4 are involved in Rhino recruitment at distinct genomic sites through the decreases in ADMA-histones in each of their KD conditions (H4R3me2a and H3R17me2a, respectively).” was changed to ”These results suggest that DART1 and DART4 could contribute to Rhino recruitment at distinct genomic sites through the decreases in ADMA-histones in each of their KD conditions (H4R3me2a and H3R17me2a, respectively).”
(8) Page 13, line 2: The original sentence “Genomic regions where Rhino spreads in a DART4-dependent manner, but not stably anchored, produce some piRNAs“ was changed to “Genomic regions where Rhino binds broadly in a DART4-dependent manner, but not stably anchored, produce some piRNAs”
(9) Page 13, lines 21-22: The original sentence “These results support the hypothesis that ADMA-histones are involved in the genomic binding of Rhino both before and after Rhino spreading, resulting in stable genome binding.” was changed to “These results raise the possibility that a subset of Rhino localized to genomic regions correlating with ADMA-histones may serve as origins of spreading.”
(10) Page 16, lines 6-8: The original sentence “In this study, we took advantage of cultured OSCs for our analysis and found that chromatin marks (i.e., ADMA-histones) play a crucial role in the loading of Rhino onto the genome.” was changed to “In this study, we took advantage of cultured OSCs for our analysis and found that chromatin marks (i.e., bivalent nucleosomes containing H3K9me3 and ADMA-histones) appear to contribute to the initial loading of Rhino onto the genome.”
(11) Page16, line 12: The original sentence “We propose that the process of piRNA cluster formation begins with the initial loading of Rhino onto bivalent nucleosomes containing H3K9me3 and ADMA-histones (Fig. 7C). In OSCs, the absence of Kipferl and other necessary factors means that Rhino loading into the genome does not proceed to the next step.” was removed.
Major points
(1) Clarify the limited colocalization between Rhino and H3K9me3 in OSCs. The observation that FLAG-Rhino foci show minimal overlap with H3K9me3 in OSCs appears inconsistent with the proposed model by the authors in the discussion, in which Rhino is initially recruited to bivalent nucleosomes bearing both H3K9me3 and ADMA marks. This discrepancy should be addressed.
We thank the reviewer’s insightful comments. Indeed, ChIP-seq shows that Rhino partially overlaps with H3K9me3 (Fig. 1F), but immunofluorescence did not reveal any detectable overlap (Fig. 1A). We interpret this discrepancy as arising from the fact that immunofluorescence primarily visualizes H3K9me3 foci that are localized as broad domains in the genome, such as those at centromeres, pericentromeres, or telomeres (named chromocenters), whereas the sharp and interspersed H3K9me3 signals along chromosome arms are difficult to detect by immunofluorescence. We now have these explanations in the revised text (page 6).
(2) Please indicate whether the FLAG-Rhino used in OSCs has been tested for functionality in vivo-for example, by rescuing Rhino mutant phenotypes. This is particularly relevant given that no spreading is observed with this construct.
We thank the reviewer for raising this important point. We have not directly tested the functionality of FLAG-Rhino construct used in OSCs in living Drosophila fly; i.e., it has not been used to rescue Rhino mutant phenotypes in flies. We acknowledge that FLAGRhino has not previously been expressed in OSCs, and that its localization pattern in OSCs differs from that observed in ovaries, where Rhino is endogenously expressed. However, several lines of evidence suggest that the addition of the N-terminal FLAG tag is unlikely to compromise Rhino function
(1) In previous studies, N-terminally tagged Rhino (e.g., 3xFLAG-V5-Precision-GFPRhino) was expressed in a living Drosophila ovary and was shown to localize properly to piRNA clusters, indicating that the tag does not prevent Rhino from binding its genomic targets (Baumgartner et al., 2022; eLife. Fig. 3 supplement 1G).
(2) In Drosophila S2 cells, FLAG-tagged tandem Rhino chromodomains construct was shown to bind H3K9me3/H3K27me3 bivalent chromatin, demonstrating that the FLAG tag does not impair this fundamental chromatin interaction (Akkouche et al., 2025; Nat Struct Mol Biol. Fig. 4b).
(3) GFP-tagged Rhino has been demonstrated to rescue the transposon derepression phenotype of Rhino mutant flies, further supporting that the addition of tags does not abolish its in vivo function. (Parhad et al., 2017; Dev Cell. Fig.1D).
Therefore, we interpret the partial localization of FLAG-Rhino in OSCs as reflecting the specific chromatin environment and regulatory context of OSCs rather than functional impairment due to the FLAG tag.
(3) Given the low levels of piRNA production and the absence of measurable effects on transposon expression or fertility upon DART4 knockdown, the rationale for classifying these regions as piRNA clusters should be clearly stated. Additional experiments could help clarify whether low-level piRNA production from these loci is sufficient to guide Piwidependent silencing. The authors should also consider and discuss the possibility that some of these differences may reflect background-specific genomic variation rather than DART4-dependent regulation per see.
We thank the reviewer for the insightful comments. As noted, DART4 knockdown did not measurably affect transposon expression or fertility. piRNAs generated from DART4associated clusters associate with Piwi but are insufficient for target repression. Although loss of DART4 largely eliminated piRNAs from these clusters, the cluster-derived transcripts themselves were unchanged. To clarify this point, we now refer to these regions as DART4-dependent piRNA-source loci (DART4 piSLs) in the revised text. We also acknowledge that some observed differences may reflect strain-specific genomic variation and have added this caveat on page 16.
(4) The authors should describe the genomic context of DART4 clusters in more detail. Specifically, it would be helpful to indicate whether these regions overlap with known transposable elements, gene bodies, or intergenic regions, and to report the typical size range of the clusters. Are any of the piRNAs produced from these clusters predicted to target known transcripts?
We thank the reviewer’s insightful comments. The overlap of DART4 piSL with transposable elements, gene bodies, and intergenic regions is shown in the right panel of Supplementary Fig. 6E (denoted as “Rhino reduced regions in DART4 GLKD” in the figure). The typical size range of these clusters is presented in Supplementary Fig. 6G. The annotation of piRNA reads derived from these piSL is shown in the right panel of Supplementary Fig. 6F, indicating that most of them appear to target host genes. The specific genes and transposons matched by the piRNAs produced from DART4 piSL are listed in Supplementary Table 8.
(5) While correlations between Rhino and ADMA histone marks (especially H3R8me2a,H3R17me2a, H4R3me2a) are robust, many ADMA-enriched regions do not recruit Rhino. Please discuss this observation and consider the possible involvement of additional factors.
We thank the reviewer’s insightful comments. As pointed out, not all ADMA-enriched regions recruit Rhino; rather, Rhino is recruited only at sites where ADMAs overlap with H3K9me3. Furthermore, the combination of H3K9me3 and ADMAs alone does not fully account for the specificity of Rhino recruitment, suggesting the involvement of additional co-factors (for example, other ADMA marks such as H3R42me2a, or chromatininteracting proteins). In addition, since histone modifications—including arginine methylation—have the possibility that they are secondary consequences of modifications on other proteins rather than primary regulatory events, it is possible that DART1/4 contribute to Rhino recruitment not only through histone methylation but also via arginine methylation of non-histone chromatin-interacting factors. However, methylation of HP1a does not appear to be involved (Supplementary Fig. 3G). We have added new sentences about these points in the Discussion section (page 18).
(6) The manuscript states that Kipferl is present at DART4 clusters but does not stabilize Rhino binding. Please specify which experimental results support this conclusion and explain.
We apologize for the lack of clarity regarding Kipferl data. Supplementary Fig. 7A and 7B show that Kipferl localizes at major DART4 piSL. This Kipferl localization is lost together with Rhino upon DART4 GLKD, indicating that Rhino localization at DART4 piSL depends on DART4 rather than on Kipferl. From these results, we infer that, unlike at authentic piRNA clusters, Kipferl may not be sufficient to stabilize the association of Rhino with the genome at DART4 piSL. We have added this interpretation on page 14.
Minor points
(1) Figure 1D: Please specify which piRNA clusters are included in the metaplot - all clusters, or only the major producers?
We thank the reviewer for the question. The metaplot was not generated from a predefined list of “all” piRNA clusters or only the “major producers.” Instead, it was constructed from Rhino ChIP–seq peaks (“Rhino domains”) that are ≥1.5 kb in length.These Rhino domains mainly correspond to the subregions within major dual-strand clusters (e.g., 42AB, 38C) as well as additional clusters such as 80F, 102F, and eyeless, among others. We have provided the full list of domains and their corresponding piRNA clusters (with genomic coordinates) in Supplementary Table 9 and added the additional explanation in Fig. 1d legend.
(2) Supplemental Figure 5E is referred to as 5D in the main text.
We corrected the figure citations on pages 11-12: the reference to Supplementary Fig. 5E has been changed to 5D, and the reference to Supplementary Fig. 5F has been changed to 5E.
(3) Supplemental Figure 7C: The color legend does not match the pie chart, which may confuse readers.
We thank the reviewer for the helpful comment. We are afraid we were not entirely sure what specific aspect of the legend was confusing, but to avoid any possible misunderstanding, we revised Supplemental Fig. 7C so that the color boxes in the legend now exactly match the corresponding colors in the pie chart. We hope this modification improves clarity.
(4) Since the manuscript focuses on the roles of DART1 and DART4, including their expression profiles in OSCs and ovaries would help contextualize the observed phenotypes. Please consider adding this information if available.
We thank the reviewer for the suggestion. We have now included a scatter plot comparing RNA-seq expression in OSCs and ovaries (Supplementary Fig. 3H). In these datasets, DART1 is strongly expressed in both tissues, whereas DART4 shows no detectable reads. Notably, ref. 28 reports strong expression of both DART1 and DART4 in ovaries by western blot and northern blot. In our own qPCR analysis in OSCs, DART4 expression is about 3% of DART1, which, although low, may still be sufficient for functional roles such as modification of H3R17me2a (Fig. 3C, Supplementary Fig. 3F and 3I). We have added these new data and additional explanation in the revised manuscript (page 11).
(5) Several of the genome browser snapshots, particularly scale and genome coordinates, are difficult to read.
We apologize for the difficulty in reading several of the genome browser snapshots in the original submission. We have re-generated the relevant figures using IGV, which provides clearer visualization of scale and genome coordinates. The previous images have been replaced with the improved versions in the revised manuscript.
Reviewer #2 (Recommendations for the authors):
(1) The authors need to elaborate on what this sentence means, as it is very unclear what they are describing about Rhino residency: "The results show that Rhino in OSCs tends to reside in the genome where Rhino binds locally in the ovary (Fig. 1C)."
We apologize for the lack of clarity in the original sentence. The text has been revised as follows:
”Rhino expressed in OSCs bound predominantly to genomic sites exhibiting sharp and interspersed Rhino localization patterns in the ovary, while showing little localization within broad Rhino domains, including major piRNA clusters.”
In addition, to clarify the behavior of Rhino at broad domains, we have added the phrase “the terminal regions of broad domains, such as major piRNA clusters” to the subsequent sentence.
(2) The red correlation line is very confusing in Figure 5F. What sort of line does this mean in this scatter plot?
We apologize for the lack of clarity regarding the red line in Fig. 5F. The red line represents the least-squares linear regression fit to the data points, calculated using the lm() function in R, and was added with abline() to illustrate the correlation between ctrl GLKD and DART4 GLKD values. In the revised figure, we have clarified this in the legend by specifying that it is a regression line.
(3) There is no confirmation of the successful knockdown of the various DARTs in the OSCs.
We thank the reviewer for the comment. The knockdown efficiency of the various DARTs in OSCs was confirmed by RT–qPCR. The data are now shown in Supplementary Fig. 3J.
(4) What is the purpose of an unnumbered "Method Figure" in the supplementary data file? Why not just give it a number and mention it properly in the text?
We thank the reviewer for the suggestion. We have now assigned a number to the previously unnumbered "Method Figure" and have included it as Supplementary Fig. 9.
The figure is now properly cited in the Methods section.
(5) For Figure 5A, those fly strain numbers in the labels are better reserved in the Methods, and a more appropriate label is to describe the GAL4 driver and the UAS-RNAi construct by their conventional names.
We thank the reviewer for the suggestion. The labels in Fig. 5A have been updated to use the conventional names of the GAL4 drivers and UAS-RNAi constructs. Specifically, they now read Ctrl GLKD (nos-GAL4 > UAS-emp) and DART4 GLKD (nos-GAL4 > UASDART4). The original fly strain numbers are listed in the Methods section.
eLife Assessment
Amyotrophic lateral sclerosis (ALS) affects nerve cells in the brain and spinal cord. The authors' approach to use genetic code expansion to tag two ALS proteins associated with stress granules has value and should be useful in the ALS field. Parts of the work are well done, but there are concerns that the evidence is incomplete overall, and additional controls would strengthen the study.
Reviewer #1 (Public review):
Summary:
The authors utilize genetic code expansion to tag TDP-43 and G3BP1, and evaluate this protein tagging system (ANAP) compared to antibodies, and evaluate protein trafficking and stress granule formation in response to stress with sodium arsenite treatment. They find similar staining to antibodies in HeLa cells, mouse embryonic stem cells, and primary mouse cortical neurons. This is a useful study that demonstrates the utility of ANAP tagging to evaluate ALS proteins.
Strengths:
Rescue of cell survival by ANAP-tagged TDP-43 is compelling
Weaknesses:
While the ANAP-tagged proteins had similar distributions to antibody staining, there were some discrepancies that may be more explained by the technique than by novel findings, as the authors suggested. The inclusion of additional controls to evaluate this would be helpful.
The tag does not have to be a plain identifier. You can use any expression with precedence greater than 16, which includes property access, function call, new expression, or even another tagged template literal.
einde
The mutant lines generated in this study had different responses in the culture media tested, suggesting that the carbon source available in the culture medium has an effect on TAG production
Because these mutants were generated via random mutagenesis, it's difficult to interpret phenotypic variability of each mutant's lipid metabolism in the context of their varied genetic backgrounds. It may be worth showing lipid-productivity data in mutants that have similar levels of starch content to wild-type to show a clear baseline for interpretation.
Note: This response was posted by the corresponding author to Review Commons. The content has not been altered except for formatting.
Learn more at Review Commons
Reviewer #1 (Evidence, reproducibility and clarity (Required)):
Summary The manuscript by Aarts et al. explores the role of GRHL2 as a regulator of the progesterone receptor (PR) in breast cancer cells. The authors show that GRHL2 and PR interact in a hormone-independent manner and based on genomic analyses, propose that they co-regulate target genes via chromatin looping. To support this model, the study integrates both newly generated and previously published datasets, including ChIP-seq, CUT&RUN, RNA-seq, and chromatin interaction assays, in breast cancer cell models (T47DS and T47D).
Major comments: R1.1 Novelty of GRHL2 in steroid receptor biology The role of GRHL2 as a co-regulator of steroid hormone receptors has previously been described for ER (J Endocr Soc. 2021;5(Suppl 1):A819) and AR (Cancer Res. 2017;77:3417-3430). In the ER study, the authors also employed a GRHL2 ΔTAD T47D cell model. Therefore, while this manuscript extends GRHL2 involvement to PR, the contribution appears incremental rather than conceptual.
We are fully aware of the previously described role of GRHL2 as a co-regulator of steroid hormone receptors, particularly ER and AR. As acknowledged in our introduction (lines 104-108), we explicitly state: "Grainyhead-like 2 (GRHL2) has recently emerged as a potential pioneer factor in hormone receptor-positive cancers, including breast cancer21. However, nearly all studies to date have focused on GRHL2 in the context of ER and estrogen signaling, leaving its role in PR- and progesterone-mediated regulation unexplored22-26".
As for the specific publications that the reviewer refers to: The first refers to an abstract from an annual meeting of the Endocrine Society. As we have been unable to assess the original data underpinning the abstract - including the mentioned GRHL2 DTAD model - we prefer not to cite this particular reference. We do cite other work by the same authors (Reese et al. 2022, our ref. 25). We also cite the AR study mentioned by the reviewer (our ref. 55) in our discussion. As such, we think we do give credit to prior work done in this area.
By characterizing GRHL2 as a co-regulator of the progesterone receptor (PR), we expand on the current understanding of GRHL2 as a common transcriptional regulator within the broader context of steroid hormone receptor biology. Given that ER and PR are frequently co-expressed and active within the same breast cancer cells, our findings raise the important possibility that GRHL2 may actively coordinate or modulate the balance between ER- and PR-driven transcriptional programs, as postulated in the discussion paragraph.
Importantly, we also functionally link PR/GRHL2-bound enhancers to their target genes (Fig5), providing novel insights into the downstream regulatory networks influenced by this interaction. These results not only offer a deeper mechanistic understanding of PR signaling in breast cancer but also lay the groundwork for future comparative analyses between GRHL2's role in ER-, AR-, and PR-mediated gene regulation.
As such, we respectfully suggest that our work offers more than an incremental advance in our knowledge and understanding of GRHL2 and steroid hormone receptor biology.
R1.2 Mechanistic depth The study provides limited mechanistic insight into how GRHL2 functions as a PR co-regulator. Key mechanistic questions remain unaddressed, such as whether GRHL2 modulates PR activation, the sequential recruitment of co-activators/co-repressors, engages chromatin remodelers, or alters PR DNA-binding dynamics. Incorporating these analyses would considerably strengthen the mechanistic conclusions.
Although our RNA-seq data demonstrate that GRHL2 modulates the expression of PR target genes, and our CUT&RUN experiments show that GRHL2 chromatin binding is reshaped upon R5020 exposure, we acknowledge that we have not further dissected the molecular mechanisms by which GRHL2 functions as a PR co-regulator.
We did consider several follow-up experiments to address this, including PR CUT&RUN in GRHL2 knockdown cells, CUT&RUN for known co-activators such as KMT2C/D and P300, as well as functional studies involving GRHL2 TAD and DBD mutants. However, due to technical and logistical challenges, we were unable to carry out these experiments within the timeframe of this study.
That said, we fully recognize that such approaches would provide deeper mechanistic insight into the interplay between PR and GRHL2. We have therefore explicitly acknowledged this limitation in our limitations of the study section (line 502-507) and mention this as an important avenue for future investigation.
R1.3 Definition of GRHL2-PR regulatory regions (Figure 2) The 6,335 loci defined as GRHL2-PR co-regulatory regions are derived from a PR ChIP-seq performed in the presence of hormone and a GRHL2 ChIP-seq performed in its absence. This approach raises doubts about whether GRHL2 and PR actually co-occupy these regions under ligand stimulation. GRHL2 ChIP-seq experiments in both hormone-treated and untreated conditions are necessary to provide stronger support for this conclusion.
Although bulk ChIP-seq cannot definitively demonstrate simultaneous binding of PR and GRHL2 at the same genomic regions, we agree that the ChIP-seq experiments we present do not provide a definitive answer on if GRHL2 and PR co-occupy these regions under ligand stimulation. As a first step to address this, we performed CUT&RUN experiments for both GRHL2 and PR under untreated and R5020-treated conditions. These experiments revealed a subset of overlapping PR and GRHL2 binding sites (approximately {plus minus}5% of the identified PR peaks under ligand stimulation).
We specifically chose CUT&RUN to minimize artifacts from crosslinking and sonication, thereby reducing background and enabling the mapping of high-confidence direct DNA-binding events: Given that a fraction of GRHL2 physically interacts with PR (Fig1D), it is possible that ChIP-seq detects indirect binding of GRHL2 at PR-bound sites and vice versa. CUT&RUN, by contrast, allows us to identify direct binding sites with higher confidence.
Nonetheless, although outside the scope of the current manuscript, we agree that a dedicated GRHL2 ChIP with and without ligand stimulation would provide additional insight, and we have accordingly added this suggestion to the discussion (line 502-507).
R1.4 Cell model considerations The manuscript relies heavily on the T47DS subclone, which expresses markedly higher PR levels than parental T47D cells (Aarts et al., J Mammary Gland Biol Neoplasia 2023; Kalkhoven et al., Int J Cancer 1995). This raises concerns about physiological relevance. Key findings, including co-IP and qPCR-ChIP experiments, should be validated in additional breast cancer models such as parental T47D, BT474, and MCF-7 cells to generalize the conclusions. Furthermore, data obtained from T47D (PR ChIP-seq, HiChIP, CTCF and Rad21 ChIP-seq) and T47DS (RNA-seq, CUT&RUN) are combined along the manuscript. Given the substantial differences in PR expression between these cell lines, this approach is problematic and should be reconsidered.
We agree that physiological relevance is important to consider. Here, all existing model systems have some limitations. In our experience, it is technically challenging to robustly measure gene expression changes in parental T47D cells (or MCF7 cells, for that matter) in response to progesterone stimulation (Aarts et al., J Mammary Gland Biol Neoplasia 2023). As we set out to integrate PR and GRHL2 binding to downstream target gene induction, we therefore opted for the most progesterone responsive model system (T47DS cells). We agree that observations made in T47D and T47DS cells should not be overinterpreted and require further validation. We have now explicitly acknowledged this and added it to the discussion (line 507-509).
As for the reviewer's suggestion to use MCF7 cells: apart from its suboptimal PR-responsiveness, this cell line is also known to harbor GRHL2 amplification, resulting in elevated GRHL2 levels (Reese et al., Endocrinology2019). By that line of reasoning, the use of MCF7 cells would also introduce concerns about physiological relevance. That being said, and as noted in the discussion (line 390-391), the study by Mohammed et al. which identified GRHL2 as a PR interactor using RIME, was performed in both MCF7 and T47D cells. This further supports the notion that the PR-GRHL2 interaction is not limited to a single cell line.
R1.5 CUT&RUN vs ChIP-seq data The CUT&RUN experiments identify fewer than 10% of the PR binding sites reported in the ChIP-seq datasets. This discrepancy likely results from methodological differences (e.g., absence of crosslinking, potential loss of weaker binding events). The overlap of only 158 sites between PR and GRHL2 under hormone treatment (Figure 3B) provides limited support for the proposed model and should be interpreted with greater caution.
We acknowledge the discrepancy between the number of binding sites between ChIP-seq and CUT&RUN. Indeed, methodological differences likely contribute to the differences in PR binding sites reported between the ChIP-seq and CUT&RUN datasets. As the reviewer correctly notes, the absence of crosslinking and sonication in CUT&RUN reduces detection of weaker binding events. However, it also reduces the detection of indirect binding events which could increase the reported number of peaks in ChIPseq data (e.g. the common presence of "shadow peaks").
As also discussed in our response to R1.3, we deliberately chose the CUT&RUN approach to enable the identification of high-confidence direct DNA-binding events. Since GRHL2 physically interacts with PR, ChIP-seq could potentially capture indirect binding of GRHL2 at PR-bound sites, and vice versa. By contrast, CUT&RUN primarily captures direct DNA-protein interactions, offering a more specific binding profile. Thus, while the number of CUT&RUN binding sites is much smaller than previously reported by ChIP-seq, we are confident that they represent true, direct binding events.
We would also like to emphasize that the model presented in figure 6 does not represent a generic or random gene, but rather a specific gene that is co-regulated by both GRHL2 and PR. In this specific case, regulation is proposed to occur via looping interactions from either individual TF-bound sites (e.g., PR-only or GRHL2-only) or shared GRHL2/PR sites. We do not propose that only shared sites are functionally relevant, nor do we assume that GRHL2 and PR must both be directly bound to DNA at these shared sites. Therefore, overlapping sites identified by ChIP-seq-potentially reflecting indirect binding events-could indeed be missed by CUT&RUN, yet still contribute to gene regulation. To clarify this, we have revised the main text (line 331-334) and the legend of Figure 6 to explicitly state that the model refers to a gene with established co-regulation by both GRHL2 and PR.
R1.6 Gene expression analyses (Figure 4) The RNA-seq analysis after 24 hours of hormone treatment likely captures indirect or secondary effects rather than the direct PR-GRHL2 regulatory program. Including earlier time points (e.g., 4-hour induction) in the analysis would better capture primary transcriptional responses. The criteria used to define PR-GRHL2 co-regulated genes are not convincing and may not reflect the regulatory interactions proposed in the model. Strong basal expression changes in GRHL2-depleted cells suggest that much of the transcriptional response is PR-independent, conflicting with the model (Figure 6). A more straightforward approach would be to define hormone-regulated genes in shControl cells and then examine their response in GRHL2-depleted cells. Finally, integrating chromatin accessibility and histone modification datasets (e.g., ATAC-seq, H3K27ac ChIP-seq) would help establish whether PR-GRHL2-bound regions correspond to active enhancers, providing stronger functional support for the proposed regulatory model.
We thank the reviewer for pointing this out. We now recognize that our criteria for selecting PR/GRHL2 co-regulated genes were not clearly described. To address this, we have revised our approach as per the reviewer's suggestion: we first identified early and sustained PR target genes based on their response at 4 and 24 hours of induction and subsequently overlaid this list with the gene expression changes observed in GRHL2-depleted cells. This revised approach reduced the amount of PR-responsive, GRHL2 regulated target genes from 549 to 298 (46% reduction). We consequently updated all following analyses, resulting in revised figures 4 and 5 and supplementary figures 2,3 and 4. As a result of this revised approach, the number of genes that are transcriptionally regulated by GRHL2 and PR (RNAseq data) that also harbor a PR loop anchor at or near their TSS after 30 minutes of progesterone stimulation (PR HiChIP data) dropped from 114 to 79 (30% reduction). We thank the reviewer for suggesting this more straightforward approach and want to emphasize that our overall conclusions remain unaltered.
As above in our response to R1.3, we want to emphasize that the model presented in figure 6 does not depict a generic or randomly chosen gene, but a gene that is specifically co-regulated by both GRHL2 and PR. We also want to emphasize that the majority of GRHL2's transcriptional activity is PR-independent. This is consistent with the limited fraction of GRHL2 that co-immunoprecipitated with PR (Figure 1D), and with the well-established roles of GRHL2 beyond steroid receptor signaling. In fact, the overall importance of GRHL2 for cell viability in T47D(S) cells is underscored by our inability to generate a full knockout (multiple failed attempts of CRISPR/Cas mediated GRHL2 deletion in T47D(S) and MCF7 cells), and by the strong selection we observed against high-level GRHL2 knockdown using shRNA.
As for the reviewer's suggestion to assess whether GRHL2/PR co-bound regions correspond to active enhancers by integrating H3K27ac and ATAC-seq data: We have re-analyzed publicly available H3K27ac and ATAC-seq datasets from T47D cells (references 42 and 43). These analyses are now added to figure 2 (F and G). The H3K27Ac profile suggests that GRHL2-PR overlapping sites indeed correspond to more active enhancers (Figure 2F), with a proposed role for GRHL2 since siGRHL2 affects the accessibility of these sites (Figure 2G).
Minor comments Page 19: The statement that "PR and GRHL2 trigger extensive chromatin reorganization" is not experimentally supported. ATAC-seq would be an appropriate method to test this directly.
We agree with the reviewer and have removed this sentence, as it does not contribute meaningfully to the flow of the manuscript.
Prior literature on GRHL2 as a steroid receptor co-regulator should be discussed more thoroughly.
We now added additional literature on GRHL2 as a steroid hormone receptor co-regulator in the discussion (line 397-401) and we cite the papers suggested by R1 in R1.1 (references 25 and 54).
Reviewer #1 (Significance (Required)):
The identification of novel PR co-regulators is an important objective, as the mechanistic basis of PR signaling in breast cancer remains incompletely understood. The main strength of this study lies in highlighting GRHL2 as a factor influencing PR genomic binding and transcriptional regulation, thereby expanding the repertoire of regulators implicated in PR biology.
That said, the novelty is limited, given the established roles of GRHL2 in ER and AR regulation. Mechanistic insight is underdeveloped, and the reliance on an engineered T47DS model with supra-physiological PR levels reduces the general impact. Without validation in physiologically relevant breast cancer models and clearer separation of direct versus indirect effects, the overall advance remains modest.
The manuscript will be of interest to a specialized audience in the fields of nuclear receptor signaling, breast cancer genomics, and transcriptional regulation. Broader appeal, including translational or clinical relevance, is limited in its current form.
We have addressed all of these points in our response above and agree that with our implemented changes, this study should reach (and appeal to) an audience interested in transcriptional regulation, chromatin biology, hormone receptor signaling and breast cancer.
Reviewer #2 (Evidence, reproducibility and clarity (Required)):
The authors present a study investigating the role of GRHL2 in hormone receptor signaling. Previous research has primarily focused on GRHL2 interaction with estrogen receptor (ER) and androgen receptor (AR). In breast cancer, GRHL2 has been extensively studied in relation to ER, while its potential involvement with the progesterone receptor (PR) remains largely unexplored. This is the rationale of this study to investigate the relation between PR and GRHL2. The authors demonstrate an interaction between GRHL2 and PR and further explore this relationship at the level of genomic binding sites. They also perform GRHL2 knockdown experiments to identify target genes and link these transcriptional changes back to GRHL2-PR chromatin occupancy. However, several conceptual and technical aspects of the study require clarification to fully support the authors' conclusions.
R2.1 Given the high sequence similarity among GRHL family members, this raises questions about the specificity of the antibody used for GRHL2 RIME. The authors should address whether the antibody cross-reacts with GRHL1 or GRHL3. For example, GRHL1 shows a higher log fold change than GRHL2 in the RIME data.
Indeed, GRHL1, GRHL2, and GRHL3 are structurally related. They share a similar domain organization and are all {plus minus}70kDa in size. Sequence similarity is primarily confined to the DNA-binding domain, with GRHL2 and GRHL3 showing 81% similarity in this region, and GRHL1 showing 63% similarity to GRHL2/3 (Ming, Nucleic Acids Res 2018).
The antibody used, sourced from the Human Protein Atlas, is widely used in the field. It targets an epitope within the transactivation domain (TAD) of GRHL2-a region with relatively low sequence similarity to the corresponding domains in GRHL1 and GRHL3.
We assessed the specificity of the antibody using western blotting (Supplementary Figure 2A) in T47DS wild-type and GRHL2 knockdown cells. As expected, GRHL2 protein levels were reduced in the knockdown cells providing convincing evidence that the antibody recognizes GRHL2. The remaining signal in shGRHL2 knockdown cells could either be due to remaining GRHL2 protein or due to the antibody detecting GRHL1/3. Furthermore, the observed high log-fold enrichment of GRHL1 in our RIME may reflect known heterodimer formation between GRHL1 and GRHL2, rather dan antibody cross-reactivity. As such, we cannot formally rule out cross-reactivity and have mentioned this in the limitations section (line 497-501).
R2.2 In addition, in RIME experiments, one would typically expect the bait protein to be among the most highly enriched proteins compared to control samples. If this is not the case, it raises questions about the efficiency of the pulldown, antibody specificity, or potential technical issues. The authors should comment on the enrichment level of the bait protein in their data to reassure readers about the quality of the experiment.
We agree with the reviewer that this information is crucial for assessing the quality of the experiment. We have therefore added the enrichment levels (log₂ fold change of IgG control over pulldown) to the methods section (line 592).
As the reviewer notes, GRHL2 was not among the top enriched proteins in our dataset. This is due to unexpectedly high background binding of GRHL2 to the IgG control antibody/beads, for which we currently have no explanation. As a result, although we detected many unique GRHL2 peptides, observed high sequence coverage (>70%), and GRHL2 ranked among the highest in both iBAQ and LFQ values, its relative enrichment was reduced due to the elevated background. During our RIME optimization, Coomassie blue staining of input and IP samples revealed a band at the expected molecular weight of GRHL2 in the pull down samples that was absent in the IgG control (see figure 1 for the reviewer below, 4 right lanes), supporting the conclusion that GRHL2 is specifically enriched in our GRHL2 RIME samples. Combined with enrichment of some of the expected interacting proteins (e.g. KMT2C and KMT2D), we are convinced that the experiment of sufficient quality to support our conclusions.
Figure 1 for reviewer: Coomassie blue staining of input and IP GRHL2 and IgG RIME samples. NT = non-treated, T = treated.
R2.3 The authors report log2 fold changes calculated using iBAQ values for the bait versus IgG control pulldown. While iBAQ provides an estimate of protein abundance within samples, it is not specifically designed for quantitative comparison between samples without appropriate normalization. It would be helpful to clarify the normalization strategy applied and consider using LFQ intensities.
We understand the reviewer's concern. Due to the high background observed in the IgG control sample (see R2.2), the LFQ-based normalization did not accurately reflect the enrichment of GRHL2, which was clearly supported by other parameters such as the number of unique peptides (see rebuttal Table 1). After discussions with our Mass Spectrometry facility, we decided to consider the iBAQ values-which reflect the absolute protein abundance within each sample-as a valid and informative measure of enrichment. In the context of elevated background levels, iBAQ provides an alternative and reliable metric for assessing protein enrichment and was therefore used for our interactor analysis.
Unique peptides
IBAQ GRHL2
IBAQ IgG
LFQ GRHL2
LFQ IgG
GRHL2
52
1753400.00
155355.67
5948666.67
3085700.00
GRHL1
23
56988.33
199.03
334373.33
847.23
*Table 1. Unique peptide, IBAQ and LFQ values of the GRHL2 and IgG pulldowns for GRHL2 and GRHL1 *
R2.4 Other studies have reported PR RIME, which could be a valuable source to investigate whether GRHL proteins were detected.
We thank the reviewer for pointing this out. We are aware of the PR RIME, generated by Mohammed et al., which we refer to in the discussion (lines 390-391). This study indeed identified GRHL2 as a PR-interacting protein in MCF7 and T47D cells. Although they do not mention this interaction in the text, the interaction is clearly indicated in one of the figures from their paper, which supports our findings. To our knowledge, no other PR RIME datasets in MCF7 or T47D cells have been published to date.
R2.5 In line 137, the term "protein score" is mentioned. Could the authors please clarify what this means and how it was calculated.
We agree that this point was not clearly explained in the original text. The scores presented reflect the MaxQuant protein identification confidence, specifically the sum of peptide-level scores (from Andromeda), which indicates the relative confidence in protein detection. We have now added this clarification to line 137 and to the legend of Figure 1.
R2.6 In line 140-141. The fact that GRHL2 interacts with chromatin remodelers does not by itself prove that GRHL2 acts as a pioneer factor or chromatin modulator. Demonstrating pioneer function typically requires direct evidence of chromatin opening or binding to closed chromatin regions (e.g., ATAC-seq, nucleosome occupancy assays). I recommend revising this statement or providing supporting evidence.
We agree that the fact that GRHL2 interacts with chromatin remodelers does not by itself prove that GRHL2 acts as a pioneer factor or chromatin modulator. However, a previous study (Jacobs et al, Nature genetics, 2018) has shown directly that the GRHL family members (including GRHL2) have pioneering function and regulate the accessibility of enhancers. We adapted line 140-141 to state this more clearly. In addition, our newly added data in Figure 2G also support the fact that GRHL2 has a role in regulating chromatin accessibility in T47D cells.
R2.7 The pulldown Western blot lacks an IgG control in panel D.
This is correct. As the co-IP in Figure 1D served as a validation of the RIME and was specifically aimed at determining the effect of hormone treatment on the observed PR/GRHL2 interaction, we did not perform this control given the scale of the experiment. However, during RIME optimization, we performed GRHL2 staining of the IgG controls by western blot, shown in figure 2 for the reviewer below. As stated above, some background GRHL2 signal was observed in the IgG samples, but a clear enrichment is seen in the GRHL2 IP.
Taken together, we believe that the well-controlled RIME, combined with the co-IP presented, provides strong evidence that the observed signal reflects a genuine GRHL-PR interaction.
Figure 2 for reviewer: WB of input and IP GRHL2 and IgG RIME samples stained for GRHL2. NT = non-treated, T = treated
R2.8 Depending on the journal and target audience, it may be helpful to briefly explain what R5020 is at its first mention (line 146).
Thank you. We have adapted this accordingly.
R2.9 The authors state that three technical replicates were performed for each experimental condition. It would be helpful to clarify the expected level of overlap between biological replicates of RIME experiments. This clarification is necessary, especially given the focus on uniquely enriched proteins in untreated versus treated cells, and the observation that some identified proteins in specific conditions are not chromatin-associated. Replicates or validations would strengthen the findings.
We use the term technical rather than biological replicates because for cell lines, defining true biological replicates is challenging, as most variability arises from experimental rather than biological differences. To introduce some variation, we split our T47DS cells into three parallel dishes 5 days prior to starting the treatment. We purposely did this, to minimize to minimize the likelihood that proteins identified as uniquely enriched are artifacts. Each of the three technical replicates comes from one of these three parallel splits (so equal passage numbers but propagated in parallel dishes for 5 days before the start of the experiment).
To generate the three technical replicates for our RIME, we plated cells from the parallel grown splits. Treatments for the three replicates were performed per replicate. Samples were crosslinked, harvested and lysed for subsequent RIME analysis, the three replicates were processed in parallel, for technical and logistical reasons. To clarify the experimental setup, we have updated the methods section accordingly (lines 566-568).
As for the detection of non-chromatin-associated proteins: We cannot rule out that these are artifacts, as they may arise from residual cytosolic lysate during nuclear extraction. Alternatively, they could reflect a more dynamic subcellular localization of these proteins than currently annotated or appreciated.
R2.10 The volcano plot for the RIME experiment appears to show three distinct clusters of proteins on the right, which is unusual for this type of analysis. The presence of these apparent groupings may suggest an artifact from the data processing, such as imputation. Can the authors clarify the origin of these groupings? If it is due to imputation or missing values, I recommend applying a stricter threshold, such as requiring detection in all three replicates (3/3) to improve the robustness of the enrichment analysis and increase confidence in the identified interactors.
We thank the reviewer for pointing this out. As suggested, we re-evaluated the imputation and applied a stricter threshold, requiring detection in all three replicates. Indeed, the separate clusters were due to missing values, therefore we now revised the imputation method by imputing values based on the normal distribution. Using this revised analysis, we identify 2352 GRHL2 interactors instead of 1140, but the number of interacting proteins annotated as transcription factors or chromatin-associated/modifying proteins was still 103. Figure 1B, 1E, and Supplementary Figure 4A have been updated accordingly. We also revised the methods section to reflect this change. We think this suggestion has improved our analysis of the data and we thank the reviewer for pointing this out.
R2.11 The statement that "PR and GRHL2 frequently overlap" may be overstated given that only ~700 overlapping sites are reported (cut&run).
We have replaced "frequently overlap" by "can overlap" (line 229-230).
R2.12 The model in Figure 6 suggests limited chromatin occupancy of PR and GRHL2 in hormone-depleted conditions, consistent with the known requirement of ligand for stable PR-DNA binding. However, Figure 1 shows no major difference in GRHL2-PR interaction between untreated and hormone-treated cells. This raises questions about where and how this interaction occurs in the absence of hormone. Since PR binding to chromatin is typically minimal without ligand, can the authors clarify this given that RIME data reflect chromatin-bound interactions.
Indeed, the model in figure 6 suggests limited chromatin occupancy of PR and GRHL2 under hormone-depleted conditions. It is, however, important to note that the locus shown represents a gene regulated by both PR and GRHL2 - and not just any gene. We recognize that this was not sufficiently clear in the original version, and we have now clarified this in both the main text (line 331-334) and the figure legend.
We propose that PR and GRHL2 bind or become enriched at enhancer sites associated with their target genes upon ligand stimulation. This is consistent with the known requirement of ligand for stable PR-DNA binding and with our observation that PR/GRHL2 overlapping peaks are detected only in the ligand-treated condition of the CUT&RUN experiment. Given the broader role of GRHL2, it also binds chromatin independently of progesterone and the progesterone receptor, which is why we included-but did not focus on-GRHL2-only binding events in our model.
We would also like to clarify that, although RIME includes a nuclear enrichment step that enriches for chromatin-associated proteins, the pulldown is performed on nuclear lysates. Therefore, it captures both chromatin-bound protein complexes and freely soluble nuclear complexes, which unfortunately cannot be distinguished. GRHL2 is well established as a nuclear protein (Zeng et al., Cancers 2024; Riethdorf et al., International Journal of Cancer 2015), and although PR is classically described as translocating to the nucleus upon hormone stimulation, several studies-including our own-have shown that PR is continuously present in the nucleus (Aarts et al., J Mammary Gland Biol Neoplasia 2023; Frigo et al., Essays Biochem. 2021).
We therefore propose that PR and GRHL2 may already interact in the nucleus without directly binding to chromatin. Given our observation that GRHL2 binding sites on the chromatin are redistributed upon R5020 mediated signaling activation, we hypothesize that such pre-formed PR-GRHL2 nuclear complexes may assist the rapid recruitment of GRHL2 to progesterone-responsive chromatin regions.
We have expanded the discussion to include a dedicated section addressing this point (line 376-388).
R2.13 It would be of interest to assess the overlap between the proteins identified in the RIME experiment and the motif analysis results.
In the discussion section of our original manuscript, we highlighted some overlapping proteins in the RIME and motif analysis, including STAT6 and FOXA1. However, we had not yet systematically analyzed overlap in both analyses. To address this, we now compared all enriched motifs (so not only the top 5 as displayed in our figures) under GRHL2, PR, and GRHL2/PR shared sites from both the CUT&RUN and ChIP-seq datasets with the proteins identified as GRHL2 interactors in our RIME. Although we identified numerous GRHL2-associated proteins, relatively few of them were transcription factors whose binding motifs were also enriched under GRHL2 peaks.
In our revised manuscript we have added a section in the discussion highlighting our systematic overlap of the results of our RIME experiment and the motif enrichment of the ChIP-seq and CUT&RUN analysis (line 415-436).
R2.14 The authors chose CUT&RUN to assess chromatin binding of PR and GRHL2. Given that RIME is also based on chromatin immunoprecipitation - ChIP protocol, it would be helpful to clarify why CUT&RUN was selected over ChIP-seq for the DNA-binding assays. What is the overlap with published data?
As also mentioned in our response to R1.3 and R1.5, we deliberately chose the CUT&RUN approach to minimize artifacts introduced by crosslinking and sonication, thereby reducing background and allowing the identification of high-confidence, direct DNA-binding events. Since GRHL2 physically interacts with PR, ChIP-seq could potentially capture indirect binding of GRHL2 at PR-bound sites (and vice versa). In contrast, CUT&RUN primarily detects direct DNA-protein interactions, providing a more specific and accurate binding profile. Additionally, CUT&RUN serves as an independent validation method for data obtained using ChIP-like protocols.
Since CUT&RUN, similar to ChIP, can show limited reproducibility (Nordin et al., Nucleic Acids Research, 2024), and to our knowledge few PR CUT&RUN and no GRHL2 CUT&RUN datasets are currently available, it is challenging to directly compare our data with published datasets. Nevertheless, studies performing PR or ER CUT&RUN (Gillis et al., Cancer Research, 2024; Reese et al., Molecular and Cellular Biology, 2022) report a comparable number of peaks-in the same range of thousands-as observed in our data. This suggests that a single CUT&RUN experiment in general may detect fewer events than a single ChIP-seq experiment, but that the peaks that are found are likely to reflect direct binding events.
Reviewer #2 (Significance (Required)):
General Assessment: This study investigates the role of the transcription factor GRHL2 in modulating PR function, using RIME and CUT&RUN to explore protein-protein and protein-chromatin interactions. GRHL2 have been implicated in epithelial biology and transcriptional regulation and interaction with steroid hormone receptors has been reported. This study extends the field by showing a functional link between GRHL2 and PR, which has implications for understanding hormone-dependent gene regulation.
The research will primarily interest a specialized audience in transcriptional regulation, chromatin biology, and hormone receptor signaling.
Key words for this reviewer: chromatin biology, transcription factor function, epigenomics, and proteomics.
We agree that with our implemented changes, this study should reach (and appeal to) an audience interested in transcriptional regulation, chromatin biology, hormone receptor signaling and breast cancer.
Reviewer #3 (Evidence, reproducibility and clarity (Required)):
This study explores the important transcriptional coordination role of Grainyhead-like 2 (GRHL2) on the transcriptional regulatory function of progesterone receptor (PR). In this paper, the authors start with their recruitment characteristics, take into account their regulatory effects on downstream genes and their effects on the occurrence and development of breast cancer, and further clarify the coordination between them in three-dimensional space. The interaction between GRHL2 and PR, and the subsequent important influence on the co-regulated genes by GRHL2 and PR are analyzed. The overall framework of this study is mainly by RNA seq and CUT-TAG analysis, the molecular mechanism underlying the association between GRHL2 and PR and regulation function of two proteins in breast cancer is not clearly clarified. Some details need to be further improved:
Major comments: R3.1 For Fig.1D, the molecular weight of each protein should be marked in the diagram, and the expression of GRHL2 in the input group should be supplemented.
We apologize for not including molecular weights in our initial submission. We are not entirely clear what the reviewer means with their statement that "the expression of GRHL2 in the input group should be supplemented". The blot depicted in Figure 1D shows both the input signal and the IP. For the reviewer's information, the full Western blot is depicted below.
Figure 3 for reviewer: Full WBs of input and IP GRHL2 samples stained for GRHL2 or PR. NT = non-treated, T = treated
R3.2 In Fig.2B and Fig 5C, it should be describe well whether GRHL2 recruitment is in the absence or presence of R5020? How about the co-occupancy of PR and GRHL2 region, Promoter or enhancer region? It would be better to show histone marks such as H3K27ac and H3K4me1 to annotate the enhancer region.
As also stated in our response to R1.3, we acknowledge that the ChIP-seq experiments cannot definitively determine whether GRHL2 and PR co-occupy genomic regions under ligand-stimulated conditions, since the GRHL2 dataset was generated in the absence of progesterone stimulation (as indicated in lines 167-169). To clarify this, we have now specified this detail in the legend of figure 2 by noting "untreated GRHL2 ChIP." To directly assess GRHL2 chromatin binding under progesterone-stimulated conditions, we performed CUT&RUN experiments for both GRHL2 and PR under untreated and R5020-treated conditions. These experiments revealed a subset of overlapping PR and GRHL2 binding sites (approximately 5% of all identified PR peaks.
In our original manuscript, we performed genomic annotation of the GRHL2, PR, and GRHL2/PR overlapping peaks (Figure 2E) and found that most of these sites were located in intergenic regions, where enhancers are typically found, with ~20% located in promoter regions. We appreciate the reviewer's suggestion to further overlap the ChIP-seq peaks with histone marks such as H3K27ac and H3K4me1. We have now incorporated publicly available ATAC-seq and H3K27ac ChIP datasets in our revised manuscript (as also suggested by Reviewer 1) and find that shared GRHL2/PR sites are indeed located in active enhancer regions marked by H3K27ac (see Figure 2F). Additionally, as expected, we find that GRHL2/PR overlapping sites are enriched at open chromatin (Figure 2G).
R3.3 What is the biological function analysis by KEGG or GO analysis for the overlapping genes from VN plots of RNA-seq with CUT-TAG peaks. The genes co-regulated by GRH2L and PR are further determined.
For us, it is not entirely clear what reviewer 3 is asking here, but we can explain the following: as it is challenging to integrate HiChIP with CUT&RUN, due to the fundamentally different nature of the two techniques, we chose not to directly assign genes to CUT&RUN peaks. However, we did carefully link the GRHL2, PR, and GRHL2/PR ChIP-seq peaks to their target genes by integrating chromatin looping data from a PR HiChIP analysis. The result from this analysis is depicted in Figure 4B.
As suggested by this reviewer, we also performed a GO-term analysis on the 79 genes that are regulated by both GRHL2 and PR (we now have 79 genes after the re-analysis as suggested in R1.6). The corresponding results are provided for the reviewer in figure 3 of this rebuttal (below). As this additional analysis does not provide further biological insight beyond what is already presented in Figure 4C, we decided to not include this figure in the manuscript.
Figure 4 for reviewer: GO-term analysis on the 79 GRHL2-PR co-regulated genes that are transcriptionally regulated by GRHL2 and PR and that also harbor a PR HiChIP loop anchor at or near their TSS
R3.4 Western blotting should be performed to determine the protein levels of downstream genes co-regulated genes by GRH2L and PR in the absence or presence of R5020.
We agree that determining the response of co-regulated is important. Therefore, in Figure 4D, we present three representative examples of genes that are directly co-regulated by GRHL2 and PR-specifically, genes that are differentially expressed after 4 hours of R5020 exposure. Although protein levels of the targets are of functional importance, GRHL2 and PR are of transcription factors whose immediate effects are primarily exerted at the level of gene transcription. Therefore, in our opinion, changes in mRNA abundance provide the most direct and mechanistically relevant readout of their regulatory activity.
R3.5 The author mentioned that this study positions that GRHL2 acts as a crucial modulator of steroid hormone receptor function, while the authors do not provide the evidences that how does GRHL2 regulate PR-mediated transactivation, and how about these two proteins subcellular distribution in breast cancer cells.
We agree that while our RNA-seq data demonstrate that GRHL2 modulates the expression of PR target genes, and our CUT&RUN experiments show that GRHL2 chromatin binding is reshaped upon R5020 exposure, we have not yet further dissected the molecular mechanism by which GRHL2 functions as a PR co-regulator.
As also mentioned in our response to R1.2, we did consider several follow-up experiments to address this, including PR CUT&RUN in GRHL2 knockdown cells, CUT&RUN for known co-activators such as KMT2C/D and P300, as well as functional studies involving GRHL2 TAD and DBD mutants. However, due to technical and logistical challenges, we were unable to carry out these experiments within the timeframe of this study.
That said, we fully recognize that such approaches would provide deeper mechanistic insight into the interplay between PR and GRHL2. We have therefore explicitly acknowledged this limitation in our limitations of the study section (lines 502-507) and consider it an important avenue for future investigation.
Regarding the subcellular distribution in breast cancer cells: As also mentioned in our response to R2.12, GRHL2 is well established as a nuclear protein (Zeng et al., Cancers 2024; Riethdorf et al., International Journal of Cancer 2015), and although PR is classically described as translocating to the nucleus upon hormone stimulation, several studies-including our own-have shown that PR is continuously present in the nucleus (Aarts et al., J Mammary Gland Biol Neoplasia 2023; Frigo et al., Essays Biochem. 2021). Thus, both proteins mostly reside in the nucleus in breast (cancer) cells both in the absence and presence of hormone stimulation, but dynamic subcellular shuttling is likely to occur.
Minor comments: Please describe in more detail the relationship between PR and GRHL2 binding independent of the hormone in the discussion section.
As also mentioned in our response to R2.12, we have expanded the discussion to include a dedicated section addressing this point (lines 376-388).
Reviewer #3 (Significance (Required)):
Advance: Compare the study to existing published knowledge, it fills a gap. The authors provide RNA seq and CUT-TAG sequence analysis to show the recruitment of GRHL2 and PR and the co-regulated genes in the absence or presence of progesterone.
Audience: breast surgery will be interested, and the audiences will cover clinical and basic research.
My expertise is focused on the epigenetic modulation of steroid hormone receptors in the related cancers, such as breast cancer, prostate cancer, and endometrial carcinoma.
We agree that with our implemented changes, this study should reach (and appeal to) an audience interested in transcriptional regulation, chromatin biology, hormone receptor signaling and breast cancer.
Note: This preprint has been reviewed by subject experts for Review Commons. Content has not been altered except for formatting.
Learn more at Review Commons
This study explores the important transcriptional coordination role of Grainyhead-like 2 (GRHL2) on the transcriptional regulatory function of progesterone receptor (PR). In this paper, the authors start with their recruitment characteristics, take into account their regulatory effects on downstream genes and their effects on the occurrence and development of breast cancer, and further clarify the coordination between them in three-dimensional space. The interaction between GRHL2 and PR, and the subsequent important influence on the co-regulated genes by GRHL2 and PR are analyzed. The overall framework of this study is mainly by RNA seq and CUT-TAG analysis, the molecular mechanism underlying the association between GRHL2 and PR and regulation function of two proteins in breast cancer is not clearly clarified. Some details need to be further improved:
Major comments:
Minor comments:
Please describe in more detail the relationship between PR and GRHL2 binding independent of the hormone in the discussion section.
Advance: Compare the study to existing published knowledge, it fills a gap. The authors provide RNA seq and CUT-TAG sequence analysis to show the recruitment of GRHL2 and PR and the co-regulated genes in the absence or presence of progesterone.
Audience: breast surgery will be interested, and the audiences will cover clinical and basic research.
My expertise is focused on the epigenetic modulation of steroid hormone receptors in the related cancers, such as breast cancer, prostate cancer, and endometrial carcinoma.
Women’s rights have improved over the years, but continued progress is not guaranteed. In a time of escalating conflicts, rising authoritarianism and devastating climate change impacts, women face many issues related to education, work, healthcare, legal rights, violence and much more. By understanding these issues, the world can work together to achieve gender equality, stronger human rights protections and safety for all people. In this article, we’ll explore 20 of the most important issues affecting women and girls today.
Colleagues, I invite you to use this space to collaboratively annotate the module introduction and summary. Please highlight areas that are clear or engaging, note any points that may need clarification or stronger alignment with learning outcomes, and add suggestions for improvement. You are welcome to tag your comments (e.g., clarity, engagement, alignment, accessibility) and build on each other’s observations. Your insights and feedback will contribute to improving instructional clarity, learner support, and the overall quality of the module. Thank you for engaging in this shared learning process.
Colleagues, I invite you to use this space to collaboratively annotate the module introduction and summary. Please highlight areas that are clear or engaging, note any points that may need clarification or stronger alignment with learning outcomes, and add suggestions for improvement. You are welcome to tag your comments (e.g., clarity, engagement, alignment, accessibility) and build on each other’s observations. Your insights and feedback will contribute to improving instructional clarity, learner support, and the overall quality of the module. Thank you for engaging in this shared learning process.
personally archive @gyuri https://bafybeicid7zd2l56yipy5nxra2qttovqqjh46x3cqu4qsmlhfevsku5lcq.ipfs.dweb.link?filename=Release%20v0.47.0%20%C2%B7%20ipfs_ipfs-desktop%20%C2%B7%20GitHub%20(30_11_2025%2012%EF%BC%9A29%EF%BC%9A13).html
and annotated it with https://hypothes.is
and the self-hosted archved page snarfed with single File has been instantly available!
A real Milestone

Good place 4 west coast rap lovers
hiphop, download, usa,
Note: This preprint has been reviewed by subject experts for Review Commons. Content has not been altered except for formatting.
Learn more at Review Commons
In this manuscript Saunders and colleagues benchmark the brightness, folding speed and photostability of a variety of red (8 versions) and green fluorescent proteins (9 versions), which have been widely used for in vivo imaging. They fused each protein to histone2Av, cloned the fusion into attP constructs and inserted them in the Drosophila genome at the same genetic location. Thus, expression levels can be compared. Nuclei at embryonic cycle 14 were imaged, segmented and fluorescence was quantified. At this early stage the maturation kinetics of the fluorophore can particularly influence its fluorescence intensity.
Additionally, stage 15-16 embryos were imaged at the dorsal side to quantify brightness. As the histone promoter is active in all cells, the fluorescence in the nuclei of all cell types can be quantified. Brightness differences between the different proteins vary a bit between both experiments, likely taking folding versus brightness into account. Generally, sfGFP, mEGFP, mEmerald as well as mStrawberry and mScarlet are the brightest. Next, developmental movies were recorded starting at gastrulation to estimate the folding rates of the different proteins. No large differences of the relative fluorescence increase over time were reported. To estimate photostability, embryos were imaged ventrally shortly before the onset of gastrulation for 2 or 4 hours with high laser intensity and the fluorescence intensity was recorded. Consistent with data in the literature, StayGold is the most photostable green protein, although it is not the brightest from the start, likely to also slower folding. From the red proteins mRFP and mCherry are good choices for long-term imaging.
In summary, these results do not bring huge surprises but are still valuable for future choice of protein tagging for imaging. Best green proteins are mEGFP, mNeonGreen, mStayGold with differences in brightness vs stability. For red, no protein is the clear winner, mScarlet-I is good in folding and brightness but others are better for photostability.
Major comments:
Minor comments:
Experiments are well performed and the finding are useful to guide the future choice of fluorophores in Drosophila and possibly other model organisms. Results are not very surprising, as the major finding that StayGold is photostable (but not the brightest) is not entirely new but still reassuring. It is particularly nice to have the differences confirmed by well controlled side-by-side measurements in Drosophila. This will likely guide many Drosophila researchers to tag their favourite protein with StayGold in the future.
Below is a complete list of the AttributeRuler pipes available to you from spaCy and the Matchers. 1.3.1.1. Attribute Rulers
This is confusing: AttributeRuler is a pipe like all the others listed under "Attribute Rulers", and the plural "Attribute Rulers" does not make any sense here. Correct: "Below is a complete list of the standard pipes and matchers from spaCy (a matcher "just" finds patterns and does not tag or manipulate data in the same way as pipes)." 1.3.1.1 Standard Pipes - AttributeRuler - DependencyParser - etc.
tag
“Tag” means a small piece or fragment.
Welcome to my Lab Notebook - Reloaded Welcome to my lab notebook, version 3.0. My original open lab notebooks began on the wiki platform OpenWetWare, moved to a personally hosted Wordpress platform, and now run on a Jekyll-powered platform (site-config), but the basic idea remains the same. For completeness, earlier entries from both platforms have been migrated here. Quoting from my original introduction to the Wordpress notebook: Disclaimer: Not a Blog Welcome to my open lab notebook. This is the active, permanent record of my scientific research, standing in place of the traditional paper bound lab notebook. The notebook is primarily a tool for me to do science, not communicate it. I write my entries with the hope that they are intelligible to my future self; and maybe my collaborators and experts in my field. Only the occasional entry will be written for a more general audience. […] In these pages you will find not only thoughts and ideas, but references to the literature I read, the codes or manuscripts I write, derivations I scribble and graphs I create and mistakes I make. Why an open notebook? Is it working? My original introduction to the notebook from November 2010 dodged this question by suggesting the exercise was merely an experiment to see if any of the purported benefits or supposed risks were well-founded. Nearly three years in, can I draw any conclusions from this open notebook experiment? In that time, the notebook has seen six projects go from conception to publication, and a seventh founder on a null result (see #tribolium). Several more projects continue to unfold. I have often worked on several projects simultaneously, and some projects branch off while others merge, making it difficult to capture all the posts associated with a single paper into a single tag or category. Of course not all ideas make it into the paper, but they remain captured in the notebook. I often return to my earlier posts for my own reference, and frequently pass links to particular entries to collaborators or other colleagues. On occasion I have pointed reviewers of my papers to certain entries discussing why we did y instead of x, and so forth. Both close colleagues and researchers I’ve never met have emailed me to follow up on something they had read in my notebook. This evidence suggests that the practice of open notebook science can faciliate both the performance and dissemination of research while remaining compatible and even synergistic with academic publishing. I am both proud and nervous to know of a half dozen other researchers who have credited me for inspiring them to adopt open or partially open lab notebooks online. I am particularly grateful for the examples, interactions, and ideas from established practitioners of open notebook science in other fields. My collaborators have been largely been somewhere between favorable and agnostic towards the idea, with the occasional request for delayed or off-line notes. More often gaps arise from my own lapses in writing (or at least being intelligible), though the automated records from Github in particular, as well as Flickr (image log), Mendeley (reading log), and Twitter and the like help make up for some of the gaps. The Integrated Notebook becomes the Knitted Notebook In creating my wordpress lab notebook, I put forward the idea of an “Integrated Lab Notebook”, a somewhat convoluted scheme in which I would describe my ideas and analyses in Wordpress posts, embed figures from Flickr, and link them to code on Github. Knitr simplified all that. I can now write code, analysis, figures, equations, citations, etc, into a single Rmarkdown format and track it’s evolution through git version control. The knitr markdown format goes smoothly on Github, the lab notebook, and even into generating pdf or word documents for publication, never seperating the code from the results. For details, see “writing reproducibly in the open with knitr.” Navigating the Open Notebook You can page through the notebook chronologically just like any paper notebook using the “Next” and “Previous” buttons on the sidebar. The notebook also leverages all of the standard features of a blog: the ability to search, browse the archives by date, browse by tag or browse by category. follow the RSS feed add and share comments in Disqus I use categories as the electronic equivalent of separate paper notebooks, dividing out my ecological research projects, evolutionary research topics, my teaching notebook, and a few others. As such, each entry is (usually) made into exactly one category. I use tags for more flexible topics, usually refecting particular projects or methods, and entries can have zero or multiple tags. It can be difficult to get the big picture of a project by merely flipping through entries. The chronological flow of a notebook is a poor fit to the very nonlinear nature of research. Reproducing particular results frequently requires additional information (also data and software) that are not part of the daily entries. Github repositories have been the perfect answer to these challenges. (The real notebook is Github) My Github repositories offer a kind of inverted version of the lab notebook, grouped by project (tag) rather than chronology. Each of my research projects is now is given it’s own public Github repository. I work primarily in R because it is widely used by ecologists and statisicians, and has a strong emphasis on reproducible research. The “R package” structure turns out to be brilliantly designed for research projects, which specifies particular files for essential metadata (title, description, authors, software dependencies, etc), data, documentation, and source code (see my workflow for details). Rather than have each analysis described in full in my notebook, they live as seperate knitr markdown files in the inst/examples directory of the R package, where their history can be browsed on Github, complete with their commit logs. Long or frequently used blocks of code are written into functions with proper documentation in the package source-code directory /R, keeping the analysis files cleaner and consistent. The issues tracker connected to each Github repository provides a rich TO DO list for the project. Progress on any issue often takes the form of subsequent commits of a particular analysis file, and that commit log can automatically be appended to the issue. The social lab notebook When scripting analyses or writing papers, pretty much everything can be captured on Github. I have recently added a short script to Jekyll which will pull the relevant commit logs into that day’s post automatically. Other activities fit less neatly into this mold (reading, math, notes from seminars and conferences), so these things get traditional notebook entries. I’m exploring automated integration for other activities, such as pulling my current reading from Mendeley or my recent discussions from Twitter into the notebook as well. For now, feed for each of these appear at the top of my notebook homepage, with links to the associated sites.
This emphasis on reproducibility matters to history too. It suggests I should keep detailed logs: where I got a manuscript image, how I interpreted marginalia, what uncertainties remain. That way future readers or researchers can trace my reasoning or redo steps themselves.
Alapadat egyedi adatok csoport
Egészítsük ki: Company form - Társasági forma Group member - Csoport tag (checkbox) Language - Nyelv Subcustodian - Letétkezelő neve Date of ben.ownership declaration - Haszonhúzói nyilatkozat
question
You and 7 others reacted
especially helpful if you're self-hosting a lot of files on a regular home internet connection.
self-hosting is now practical!
Announces content at a steady pace
instead of bursts that could slow down your internet
Before, this would silently break your node's connectivity, forcing you to restart IPFS Desktop manually.
anther great advance.
Congratulation
🙏🙏🙏🙏🙏🙏 🎈🎈🎈🎈🎈🎈
Your Node Stays Reachable After Router Restarts

share a link right after the upload finishes and it will just work.
I did notice this.
Just in the nick of time
Well worth the nearly decade long wait!
This is a total Game Changer
⚡ Share Files Instantly
Previously, after adding files to IPFS Dsktop, it could take 30+ seconds before friends could find and download them. Now, when you add files or folders, they become discoverable on the network almost immediately (typically under a second).
<, >, &
Deze kan je niet gebruiken:
Begin v een tag Einde v tag & staat vaak in een link
alt
Verplicht tag
src
Verplicht tag
Note: This response was posted by the corresponding author to Review Commons. The content has not been altered except for formatting.
Learn more at Review Commons
Manuscript number: RC -2025-03175
Corresponding author(s): Gernot Längst
[Please use this template only if the submitted manuscript should be considered by the affiliate journal as a full revision in response to the points raised by the reviewers.
If you wish to submit a preliminary revision with a revision plan, please use our "Revision Plan" template. It is important to use the appropriate template to clearly inform the editors of your intentions.]
This section is optional. Insert here any general statements you wish to make about the goal of the study or about the reviews.
This section is mandatory. *Please insert a point-by-point reply describing the revisions that were already carried out and included in the transferred manuscript. *
We thank the reviewers for their efforts and detailed evaluation of our manuscript. We think that the comments of the reviewers allowed us to significantly improve the manuscript.
With best regards
The authors of the manuscript
Reviewer #1 (Evidence, reproducibility and clarity (Required)):
Summary: Holzinger et al. present a new automated pipeline, nucDetective, designed to provide accurate nucleosome positioning, fuzziness, and regularity from MNase-seq data. The pipeline is structured around two main workflows-Profiler and Inspector-and can also be applied to time-series datasets. To demonstrate its utility, the authors re-analyzed a Plasmodium falciparum MNase-seq time-series dataset (Kensche et al., 2016), aiming to show that nucDetective can reliably characterize nucleosomes in challenging AT-rich genomes. By integrating additional datasets (ATAC-seq, RNA-seq, ChIP-seq), they argue that the nucleosome positioning results from their pipeline have biological relevance.
Major Comments:
Despite being a useful pipeline, the authors draw conclusions directly from the pipeline's output without integrating necessary quality controls. Some claims either contradict existing literature or rely on misinterpretation or insufficient statistical support. In some instances, the pipeline output does not align with known aspects of Plasmodium biology. I outline below the key concerns and suggested improvements to strengthen the manuscript and validate the pipeline:
Clarification of +1 Nucleosome Positioning in P. falciparum The authors should acknowledge that +1 nucleosomes have been previously reported in P. falciparum. For example, Kensche et al. (2016) used MNase-seq to map ~2,278 TSSs (based on enriched 5′-end RNA data) and found that the +1 nucleosome is positioned directly over the TSS in most genes:
"Analysis of 2278 start sites uncovered positioning of a +1 nucleosome right over the TSS in almost all analysed regions" (Figure 3A).
They also described a nucleosome-depleted region (NDR) upstream of the TSS, which varies in size, while the +1 nucleosome frequently overlaps the TSS. The authors should nuance their claims accordingly. Nevertheless, I do agree that the +1 positioning in P. falciparum may be fuzzier as compared to yeast or mammals. Moreover, the correlation between +1 nucleosome occupancy and gene expression is often weak and that several genes show similar nucleosome profiles regardless of expression level. This raises my question: did the authors observe any of these patterns in their new data?
We appreciate the reviewer’s insightful comment and agree that +1 nucleosomes and nucleosome depleted promoter regions have been previously reported in P. falciparum, notably by the Bartfai and Le Roch groups, including Kensche et al. (PMID: 26578577). Our study advances this understanding by providing, for the first time, a comprehensive view of the entirety of a canonical eukaryotic promoter architecture in P. falciparum—encompassing the NDR, the well-positioned +1 nucleosome, and the downstream phased nucleosome array. This downstream nucleosome array structure has not been characterized before, as prior studies noted a “lack of downstream nucleosomal arrays” (PMID: 26578577) or “relatively random” nucleosome organization within gene bodies (PMID: 24885191). We have revised the manuscript to more clearly acknowledge previous work and highlight our contributions. The changes we applied in the manuscript are highlighted in yellow and shown as well below.
In the Abstract L26-L230: Contrary to the current view of irregular chromatin, we demonstrate for the first time regular phased nucleosome arrays downstream of TSSs, which, together with the established +1 nucleosome and upstream nucleosome-depleted region, reveal a complete canonical eukaryotic promoter architecture in Pf.
Introduction L156-L159: For example, we identify a phased nucleosome array downstream of the TSS. Together with a well-positioned +1 nucleosome and an upstream nucleosome-free region. These findings support a promoter architecture in Pf that resembles classical eukaryotic promoters (Bunnik et al. 2014, Kensche et al. 2016).
Results L181-L183: These new Pf nucleosome maps reveal a nucleosome organisation at transcription start sites (TSS) reminiscent of the general eukaryotic chromatin structure, featuring a reported well-positioned +1 nucleosome , an upstream nucleosome-free region (NFR, Bunnik et al. 2014, Kensche et al. 2016), and shown for the first time in Pf, a phased nucleosome array downstream of the TSS.
Discussion L414-L419: Previous analyses of Pf chromatin have identified +1 nucleosomes and NFRs (Bunnik et al 2014, Kensche et al. 2016). Here we extend this understanding by demonstrating phased nucleosome array structures throughout the genome. This finding provides evidence for a spatial regulation of nucleosome positioning in Pf, challenging the notion that nucleosome positioning is relatively random in gene bodies (Bunnik et al. 2014, Kensche et al. 2016). Consequently our results contribute to the understanding that Pf exhibits a typical eukaryotic chromatin structure, including well-defined nucleosome positioning at the TSS and regularly spaced nucleosome arrays (Schones et al. 2008; Yuan et al. 2005).
Regarding the reviewer’s question on +1 nucleosome dynamics. Our data agrees with the reviewer and other studies (e.g. PMID: 31694866), that the +1 nucleosome position is robust and does not correlate with gene expression strength. In the manuscript we show that dynamic nucleosomes are preferentially detected at the –1 nucleosome position (Figure 2C). In line with that we show that the +1 nucleosome position does not markedly change during transcription initiation of a subset of late transcribed genes (Figure 5A). However, we observe an opening of the NDR and within the gene body increased fuzziness and decreased nucleosome array regularity (Figure S4A). To illustrate the relationship between the +1 nucleosome positioning and expression strength, we have included a heatmap showing nucleosome occupancy at the TSS, ordered according to expression strength (NEW Figure S4C):
We included a sentence describing the relationship of +1 nucleosome position with gene expression in L257-L258: Furthermore, the +1 nucleosome positioning is unaffected by the strength of gene expression (Figure S2C).
__ Lack of Quality Control in the Pipeline __
The authors claim (lines 152-153) that QC is performed at every stage, but this is not supported by the implementation. On the GitHub page (GitHub - uschwartz/nucDetective), QC steps are only marked at the Profiler stage using standard tools (FastQC, MultiQC). The Inspector stage, which is crucial for validating nucleosome detection, lacks QC entirely. The authors should implement additional steps to assess the quality of nucleosome calls. For example, how are false positives managed? ROC curves should be used to evaluate true positive vs. false positive rates when defining dynamic nucleosomes. How sequencing biases are adressed?
The workflow overview chart on GitHub was not properly color coded. Therefore, we changed the graphics and highlighted the QC steps in the overview charts accordingly:
Based on our long standing expertise of analysing MNase-seq data (PMID: 38959309, PMID: 37641864, PMID: 30496478, PMID: 25608606), the best quality metrics to assess the performance of the challenging MNase experiment are the fragment size distributions revealing the typical nucleosomal DNA lengths and the TSS plots showing a positioned +1 nucleosome and regularly phased nucleosome arrays downstream of the +1 nucleosome. Additionally, visual inspection of the nucleosome profiles in a genome browser is advisable. We make those quality metrics easily available in the nucDetective Profiler workflow (Insertsize Histogram, TSS plot and provide nucleosome profile bigwig files). Furthermore, the PC and correlation analysis based on the nucleosome occupancy in the inspector workflow allows to evaluate replicate reproducibility or integrity of time series data, as shown for data evaluated in this manuscript.
The inspector workflow uses the well-established DANPOS toolkit to call nucleosome positions. Based on our experience, this step is particularly robust and well-established in the DANPOS toolkit (PMID: 23193179), so there is no need to reinvent it. Nevertheless, appropriate pre-processing of the data as done in the nucDetective pipeline is crucial to obtain highly resolved nucleosome positions. Using the final nucleosome profiles (bigwig) and the nucleosome reference positions (bed) as output of the Inspector workflow allows visual inspection of the called nucleosomes in a genome viewer. Furthermore, to avoid using false positive nucleosome positions for dynamic nucleosome analysis, we take only the 20% best positioned nucleosomes of each sample, as determined by the fuzziness score.
We understand the value of a gold standard of dynamic nucleosomes to test performance using ROC curves. However, we are not aware that such a gold standard exists in the nucleosome analysis field, especially not when using multi-sample settings, such as time series data. One alternative would be to use simulated data; however, this has several limitations:
Poor Model Fidelity and Hidden Assumptions: The authenticity of simulated data is bounded by the fidelity of the underlying models. If those models are inaccurate or make untested assumptions, the generated data may not reflect real experimental or clinical scenarios. This can mask software shortcomings or bias validation toward specific, perhaps irrelevant, scenarios. Therefore, we decided to validate the performance of the pipeline in the biological context of the analyzed data:
PCA analysis of the individual nucleosome features shows a cyclic structure as expected for the IDC (Fig. 1D-G).
We included a paragraph describing the limitations to the discussion (L447-457):
Depending on the degree of MNase digestion, preferentially nucleosomes from GC rich regions are revealed in MNase-seq experiments (Schwartz et al. 2019). However, no sequence or gDNA normalisation step was included in the nucDetective pipeline. To identify dynamic nucleosomes, comparisons are performed between the same nucleosome positions at the same genomic sites across multiple samples. Hence, the sequence context is constant and does not confound the analysis. Introducing a sequence normalization step might even distort and bias the results. Nevertheless, it is highly advisable to use low MNase concentrations in chromatin digestions to reduce the sequence bias in nucleosome extractions. This turned out to be a crucial condition to obtain a homogenous nucleosome distribution in the AT-rich intergenic regions of eukaryotic genomes and especially in the AT-rich genome of Pf (Schwartz et al. 2019, Kensche et al. 2016).
__ Use of Mono-nucleosomes Only __
The authors re-analyze the Kensche et al. (2016) dataset using only mono-nucleosomes and claim improved nucleosome profiles, including identification of tandem arrays previously unreported in P. falciparum. Two key issues arise: 1. Is the apparent improvement due simply to focusing on mono-nucleosomes (as implied in lines 342-346)?
The default setting in nucDetective is to use fragment sizes of 140 – 200 bp, which corresponds to the main mono-nucleosome fraction in standard MNase-seq experiments. However, the correct selection of fragment sizes may vary depending on the organism and the variations in MNase-seq protocols. Therefore, the pipeline offers the option of changing the cutoff parameter (--minLen; --maxLen), accordingly. Kensche et al thoroughly tested and established the best parameters for the data set. We agree with their selected parameters and used the same cutoffs (75-175 bp) in this manuscript. For this particular data set, the fragment size selection is not the reason why we obtain a better resolution. MNase-seq analysis is a multistep process which is optimized in the nucDetective pipeline. Differences in the analysis to Kensche et al are at the pre-processing stage and alignment step:
Kensche et al. : “Paired-end reads were clipped to 72 bp and all data was mapped with BWA sample (Version 0.6.2-r126)”
nucDetective:
This is achieved using MNase-seq optimized alignment settings, and proper selection of the fragment sizes corresponding to mono-nucleosomal DNA to obtain high resolution nucleosome profiles.
How does the pipeline perform with di- or tri-nucleosomes, which are also biologically relevant (Kensche et al., 2016 and others)? Furthermore, the limitation to mono-nucleosomes is only mentioned in the methods, not in the results or discussion, which could mislead readers.
The pipeline is optimized for mono-nucleosome analysis. However, the cutoffs for fragment size selection can be adjusted to analyse other fragment populations in MNase-seq data (--minLen; --maxLen). For example we know from previous studies that the settings in the pipeline could be used for sub-nucleosome analysis as well (PMID: 38959309). Di- or Tri-nucleosome analysis we have not explicitly tested. However, in a previous study (PMID: 30496478) we observed that the inherited MNase sequence bias is more pronounced in di-nucleosomes, which are preferentially isolated from GC-rich regions. This is in line with the depletion of di-nucleosomes in AT-rich intergenic regions in Pf, as was already described by Kensche et al.
Changes to the manuscript text: We included a paragraph describing the limitations to the discussion (L428-434):
The nucDetective pipeline has been optimized for the analysis of mono-nucleosomes. However, the selection of fragment sizes can be adjusted manually, enabling the pipeline to be used for other nucleosome categories. The pipeline is suitable to map and annotate sub-nucleosomal particles (
__ Reference Nucleosome Numbers __
The authors identify 49,999 reference nucleosome positions. How does this compare to previous analyses of similar datasets? This should be explicitly addressed.
We thank the reviewer for this suggestion. In order to put our results in perspective, it is important to distinguish between reference nucleosome positions (what we reported in the manuscript) and all detectable nucleosomes. The reference positions are our attempt to build a set of nucleosome positions with strong evidence, allowing confident further analysis across timepoints. The selection of a well positioned subset of nucleosomes for downstream analysis has been done previously (PMID: 26578577) and the merging algorithm we used across timepoints is also used by DANPOS to decide if a MNase-Seq peak is a new nucleosome position or belongs to an existing position (PMID: 23193179).
To be able to address the reviewer suggestion we prepared and added a table to the supplementary data, including the total number of all nucleosomes detected by our pipeline at each timepoint. We adjusted the results to the following (L223-226):
“The pipeline identified a total of 127370 ± 1151 (mean ± SD) nucleosomes at each timepoint (Supplementary Data X). To exclude false positive positions in our analysis, we conservatively selected 49,999 reference nucleosome positions, representing sites with a well-positioned nucleosome at least at one time point (see Methods). Among these 1192 nucleosomes exhibited […]”
Several groups reported nucleosome positioning data for P. falciparum (PMID: 20015349, PMID: 20054063, PMID: 24885191, PMID: 26578577), however only Ponts et al (2010) reported resolved numbers (~45000-90000 nucleosomes depending in development stage) and Bunnik et al reported ~ 75000 nucleosomes in a graph. Although we do not know the reason of why the other studies did not include specific numbers, we speculate that the data quality did not allow them to confidently report a number. In fact, nucleosomal reads are severely depleted in AT-rich intergenic regions in the Ponts and Bunnik datasets. In contrast, Kensche et al (and our analysis) shows that nucleosomes can be identified throughout the genome of Pf. Therefore, the nucleosome numbers reported by Ponts et al and Bunnik et al are very likely underestimated.
We included the following text in the discussion, addressing previously published datasets (L404 – 405):
“For example, our pipeline was able to identify a total of ~127,000 nucleosomes per timepoint (=5.4 per kb) in range with observed nucleosome densities in other eukaryotes (typically 5 to 6 per kb). From these, we extracted 49,999 reference nucleosome positions with strong positioning evidence across all timepoints, which we used to characterize nucleosome dynamics of Pf longitudinally. Previous studies of P. falciparum chromatin organization, did not report a total number of nucleosomes (Westenberger et al. 2009, Kensche et al. 2016), or estimated approximately ~45000-90000 nucleosomes across the genome at different developmental stages (Bunnik et al. 2014, Ponts et al. 2010). However, this value likely represents an underestimation due to the depletion of nucleosomal reads in AT-rich intergenic regions observed in their datasets.”
__ Figure 1B and Nucleosome Spacing __
The authors claim that Figure 1B shows developmental stage-specific variation in nucleosome spacing. However, only T35 shows a visible upstream change at position 0. In A4, A6, and A8 (Figure S4), no major change is apparent. Statistical tests are needed to validate whether the observed differences are significant and should be described in the figure legends and main text.
We would like to thank the reviewer for bringing this issue to our attention. We apologize for an error we made, wrongly labelling the figure numbers. The differences in nucleosome spacing across time are visible in Figure 1C. Figure 1B shows the precise array structure of the Pf nucleosomes, when centered on the +1 nucleosome, and is mentioned before. The mistake is now corrected.
In Figure 1C the mean NRL and 95% confidence interval are depicted, allowing a visual assessment of data significance (non-overlapping 95% CI-Intervals correspond to p Taken together we corrected this mistake and edited the text as follows (L194 – 199):
“With this +1 nucleosome annotation, regularly spaced nucleosome arrays downstream of the TSS were detected, revealing a precise nucleosome organization in Pf (Figure 1B). Due to the high resolution maps of nucleosomes we can now observe significantvariations in nucleosome spacing depending on the developmental stage (Figure 1C, ANOVA on bootstrapped values (3 per timepoint) F₇,₇₂ = 35.10, p
__ Genome-wide Occupancy Claims __
The claim that nucleosomes are "evenly distributed throughout the genome" (Figure S2A) is questionable. Chromosomes 3 and 11 show strong peaks mid-chromosome, and chromosome 14 shows little to no signal at the ends. This should be discussed. Subtelomeric regions, such as those containing var genes, are known to have unique chromatin features. For instance, Lopez-Rubio et al. (2009) show that subtelomeric regions are enriched for H3K9me3 and HP1, correlating with gene silencing. Should these regions not display different nucleosome distributions? Do you expect the Plasmodium genome (or any genome) to have uniform nucleosome distribution?
On global scale (> 10 kb) we would expect a homogenous distribution of nucleosomes genome wide, regardless of euchromatin or heterochromatin. We have shown this in a previous study for human cells (PMID: 30496478), which was later confirmed for drosophila melongaster (PMID: 31519205,PMID: 30496478) and yeast (PMID: 39587299).
However, Figure S2A shows the distribution of the dynamic nucleosome features during the IDC, called with our pipeline. We agree with the reviewer, that there are a few exceptions of the uniform distribution, which we address now in the manuscript.
Furthermore, we agree with the reviewer that the H3K9me3 / HP1 subtelomeric regions are special. Those regions are depleted of dynamic nucleosomes in the IDC as shown in Fig. 2D and now mentioned in L280 - L282.
We included an additional genome browser snapshot in Supplemental Figure S2B and changed the text accordingly (L245-249):
We observed a few exceptions to the even distribution of the nucleosomes in the center of chromosome 3, 11 and 12, where nucleosome occupancy changes accumulated at centromeric regions (Figure S2B). Furthermore, the ends of the chromosomes are rather depleted of dynamic nucleosome features.
Genome browser snapshot illustrating accumulation of nucleosome occupancy changes at a centromeric site. Centered nucleosome coverage tracks (T5-T40 colored coverage tracks), nucleosomes occupancy changes (yellow bar) and annotated centromers (grey bar) taken from (Hoeijmakers et al., 2012)
Dependence on DANPOS
The authors criticize the DANPOS pipeline for its limitations but use it extensively within nucDetective. This contradiction confuses the reader. Is nucDetective an original pipeline, or a wrapper built on existing tools?
One unique feature of the nucDetective pipeline is to identify dynamic nucleosomes (occupancy, fuzziness, regularity, shifts) in complex experimental designs, such as time series data (Inspector workflow). To our knowledge, there is no other tool for MNase-seq data which allows multi-condition/time-series comparisons (PMID: 35061087). For example, DANPOS allows only pair-wise comparisons, which cannot be used for time-series data. For the analysis of dynamic nucleosome features we require nucleosome profiles and positions at high resolution. For this purpose, several tools do already exist (PMID: 35061087). However, researchers without experience in MNase-seq analysis often find the plethora of available tools overwhelming, which makes it challenging to select the most appropriate ones. Here we share our experience and provide the user an automated workflow (Profiler), which builds on existing tools.
In summary the Profiler workflow is a wrapper built on existing tools and the Inspector workflow is partly a wrapper (uses DANPOS to normalize nucleosome profiles and call nucleosome positions) and implements our original algorithm to detect dynamic nucleosome features in multiple conditions / time-series data.
__ Control Data Usage __
The authors should clarify whether gDNA controls were used throughout the analysis, as done in Kensche et al. (2016). Currently, this is mentioned only in the figure legend for Figure 5, not in the methods or results.
We used the gDNA normalisation to optimize the visualization of the nucleosome depleted region upstream of the TSS in Fig 5A. Otherwise, we did not normalize the data by the gDNA control. The reason is the same as we did not include sequence normalization in the pipeline (see comment above)
We included a paragraph describing the limitations to the discussion (L447-457):
Depending on the degree of MNase digestion, preferentially nucleosomes from GC rich regions are revealed in MNase-seq experiments (Schwartz et al. 2019). However, no sequence or gDNA normalisation step was included in the nucDetective pipeline. To identify dynamic nucleosomes, comparisons are performed between the same nucleosome positions at the same genomic sites across multiple samples. Hence, the sequence context is constant and does not confound the analysis. Introducing a sequence normalization step might even distort and bias the results. Nevertheless, it is highly advisable to use low MNase concentrations in chromatin digestions to reduce the sequence bias in nucleosome extractions. This turned out to be a crucial condition to obtain a homogenous nucleosome distribution in the AT-rich intergenic regions of eukaryotic genomes and especially in the AT-rich genome of Pf (Schwartz et al. 2019, Kensche et al. 2016).
We added following statement to the methods part: Additionally, the TSS profile shown in Figure 5A was normalized by the gDNA control for better NDR visualization.
__ Lack of Statistical Power for Time-Series Analyses __
Although the pipeline is presented as suitable for time-series data, it lacks statistical tools to determine whether differences in nucleosome positioning or fuzziness are significant across conditions. Visual interpretation alone is insufficient. Statistical support is essential for any differential analysis.
We understand the value of statistical support in such an analysis. However, in biology we often face the limitations in terms of the appropriate sample sizes needed to accurately estimate the variance parameters required for statistical modeling. As MNase-seq experiments require a large amount of input material and high sequencing depth, the number of samples in most experiments is low, often with only two replicates (PMID: 23193179). Therefore, we decided that the nucDetective pipeline should be rather handled as a screening method to identify nucleosome features with high variance across all conditions. This prevents misuse of p-values. A common misinterpretation we observed is the use of non-significant p-values to conclude that no biological change exists, despite inadequate statistical power to detect such changes. We included a paragraph in the limitations section discussing the limitations of statistical analysis of MNase-Seq data.
Changes to the manuscript text: We included a paragraph describing the limitations to the discussion (L435-446).
As MNase-seq experiments require a large amount of input material and high sequencing depths, most published MNase-seq experiments do not provide the appropriate sample sizes required to accurately estimate the variance parameters necessary for statistical modelling (Chen et al. 2013). Therefore, dynamic nucleosomes are not identified through statistical testing but rather by ranking nucleosome features according to their variance across all samples and applying a variance threshold to distinguish them. This concept is well established to identify super-enhancers (Whyte et al. 2013). In this study we set the variance cutoff to a slope of 3, resulting in a high data confidence. However, other data sets might require further adjustment of the variance cutoff, depending on data quality or sequencing depth. The nucDetective identification of dynamic nucleosomes can be seen as a screening approach to provide a holistic overview of nucleosome dynamics in the system, which provides a basis for further research.
Reproducibility of Methods
The Methods section is not sufficient to reproduce the results. The GitHub repository lacks the necessary code to generate the paper's figures and focuses on an exemplary yeast dataset. The authors should either: o Update the repository with relevant scripts and examples, o Clearly state the repository's purpose, or o Remove the link entirely. Readers must understand that nucDetective is dedicated to assessing nucleosome fuzziness, occupancy, shift, and regularity dynamics-not downstream analyses presented in the paper.
We thank the reviewer for this helpful comment. In addition to the main nucDetective repository, a second GitHub link is provided in the Data Availability section, which contains the scripts used to generate the figures presented in the paper. This separation was intentional to distinguish the general-purpose nucDetective tool from the project-specific analyses performed for this study. We acknowledge that this may not have been sufficiently clear.
To have all resources available at a single citable permanent location we included a link to the corresponding Zenodo repository (https://doi.org/10.5281/zenodo.16779899) in the Data and materials availability statement.
The Zenodo repository contains:
Code (scripts.zip) and annotation of Plasmodium falciparum (Annotation.zip) to reproduce the nucDetective v1.1 (nucDetective-1.1.zip) analysis as done in the research manuscript entitled "Deciphering chromatin architecture and dynamics in Plasmodium falciparum using the nucDetective pipeline".
The folder "output_nucDetective" conains the complete output of the nucDetective analysis pipeline as generated by the "01_nucDetective_profiler.sh" and "02_nucDetective_inspector.sh" scripts.
Nucleosome coverage tracks, annotation of nucleosome positions and dynamic nucleosomes are deposited additonally in the folder "Pf_nucleosome_annotation_of_nucDetective".
To make this clearer we added following text to Material and Methods in ”The nucDetective pipeline” section:
Changes in the manuscript text (L518-519):
The code, software and annotations used to run the nucDetective pipeline along with the output have been deposited on Zenodo (https://doi.org/10.5281/zenodo.16779899).
__ Supplementary Tables __
Including supplementary tables showing pipeline outputs (e.g., nucleosome scores, heatmaps, TSS extraction) would help readers understand the input-output structure and support figure interpretations.
See comments above.
We included a link to the corresponding Zenodo repository (https://doi.org/10.5281/zenodo.16779899) in the Data and materials availability statement.
The repository contains:
Code (scripts.zip) and annotation of Plasmodium falciparum (Annotation.zip) to reproduce the nucDetective v1.1 (nucDetective-1.1.zip) analysis as done in the research manuscript entitled "Deciphering chromatin architecture and dynamics in Plasmodium falciparum using the nucDetective pipeline".
The folder "output_nucDetective" conains the complete output of the nucDetective analysis pipeline as generated by the "01_nucDetective_profiler.sh" and "02_nucDetective_inspector.sh" scripts.
Minor Comments:
The authors should moderate claims such as "no studies have reported a well-positioned +1 nucleosome" in P. falciparum, as this contradicts existing literature. Similarly, avoid statements like "poorly understood chromatin architecture of Pf," which undervalue extensive prior work (e.g., discovery of histone lactylation in Plasmodium, Merrick et al., 2023).
We would like to clarify that we neither wrote that ““no studies have reported a well-positioned +1 nucleosome”” in P. falciparum nor did we intend to imply such thing. However, we acknowledge that our original wording may have been unclear. To address this, we have revised the manuscript to explicitly acknowledge prior studies on chromatin organization and highlight our contribution.
In the Abstract L26-L30: Contrary to the current view of irregular chromatin, we demonstrate for the first time regular phased nucleosome arrays downstream of TSSs, which, together with the established +1 nucleosome and upstream nucleosome-depleted region, reveal a complete canonical eukaryotic promoter architecture in Pf.
Introduction L156-L159: For example, we identify a phased nucleosome array downstream of the TSS. Together with a well-positioned +1 nucleosome and an upstream nucleosome-free region. These findings support a promoter architecture in Pf that resembles classical eukaryotic promoters (Bunnik et al. 2014, Kensche et al. 2016).
Results L180-L183: These new Pf nucleosome maps reveal a nucleosome organisation at transcription start sites (TSS) reminiscent of the general eukaryotic chromatin structure, featuring a reported well-positioned +1 nucleosome , an upstream nucleosome-free region (NFR, Bunnik et al. 2014, Kensche et al. 2016), and shown for the first time in Pf, a phased nucleosome array downstream of the TSS.
Discussion L412-L421: Previous analyses of Pf chromatin have identified +1 nucleosomes and NFRs (Bunnik et al 2014, Kensche et al. 2016). Here we extend this understanding by demonstrating phased nucleosome array structures throughout the genome. This finding provides evidence for a spatial regulation of nucleosome positioning in Pf, challenging the notion that nucleosome positioning is relatively random in gene bodies (Bunnik et al. 2014, Kensche et al. 2016). Consequently our results contribute to the understanding that Pf exhibits a typical eukaryotic chromatin structure, including well-defined nucleosome positioning at the TSS and regularly spaced nucleosome arrays (Schones et al. 2008; Yuan et al. 2005).
The phrase “poorly understood chromatin architecture” has been modified to “underexplored chromatin architecture” in order to more accurately reflect the potential for further analyses and contributions to the field, while avoiding any potential misinterpretation of an attempt to undervalue previous work.
Track labels in figures (e.g., Figure 5B) are too small to be legible.
We made the labels bigger.
Several figures (e.g., Figure 5B, S4B) lack statistical significance tests. Are the differences marked with stars statistically significant or just visually different?
We added statistics to S4B.
Differences in 5B were identified by visual inspection. To clarify this, we exchanged the asterisks to arrows in Fig.5B and changed the text in the legend:
Arrows mark descriptive visual differences in nucleosome occupancy.
Figure S3 includes a small black line on top of the table. Is this an accidental crop?
We checked the figure carefully; however, the black line does not appear in our PDF viewer or on the printed paper
The authors should state the weaknesses and limitations of this pipeline.
We added a limitation section in discussion, see comments above
Reviewer #1 (Significance (Required)):
The proposed pipeline is useful and timely. It can benefit research groups willing to analyse MNase-Seq data of complex genomes such as P. falciparum. The tool requires users to have extensive experience in coding as the authors didn't include any clear and explicit codes on how to start processing the data from raw files. Nevertheless, there are multiple tool that can detect nucleosome occupancy and that are not cited by the authors not mention. I have included for the authors a link where a large list of tools for analysis of nucleosome positioning experiments tools/pipelines were developed for (Software to analyse nucleosome positioning experiments - Gene Regulation - Teif Lab). I think it would be useful for the authors to direct the reference this.
We appreciate the reviewer’s valuable suggestion. We included a citation to the comprehensive database of nucleosome analysis tools curated by the Teif lab (Shtumpf et al., 2022). We chose to reference only selected tools in addition to this resource rather than listing all individual tools to maintain clarity and avoid overloading the manuscript with numerous citations.
Despite valid, I still believe that controlling their pipeline by filtering out false positives and including more QC steps at the Inspector stage is strongly needed. That would boost the significance of this pipeline.
We thank the reviewer for the assessment of our study and for recognizing that our MNase-seq analysis pipeline nucDetective can be a useful tool for the chromatin community utilizing MNase-Seq in complex settings.
Reviewer #2 (Evidence, reproducibility and clarity (Required)):
In this manuscript, Holzinger and colleagues have developed a new pipeline to assess chromatin organization in linear space and time. They used this pipeline to reevaluate nucleosome organization in the malaria parasite, P. falciparum. Their analysis revealed typical arrangement of nucleosomes around the transcriptional start site. Furthermore, it further strengthened and refined the connection between specific nucleosome dynamics and epigenetic marks, transcription factor binding sites or transcriptional activity.
Major comments
- I am wondering what is the main selling point of this manuscript is. If it is the development of the nucDetective pipeline, perhaps it would be best to first benchmark it and directly compare it to existing tools on a dataset where nucleosome fussiness, shifting and regularity has been analyzed before. If on the other hand, new insights into Plasmodium chromatin biology is the primary target validation of some of the novel findings would be advantageous (e.g. refinement of TSS positions, relevance of novel motifs, etc).
NucDetective presents a novel pipeline to identify dynamic nucleosome properties within different datasets, like time series or developmental stages, as analysed for the erythrocytic cycle in this manuscript. As such kind of a pipeline, allowing direct comparisons, does not exist for MNase-Seq data, we used the existing analysis and high quality dataset of Kensche et al., to visualize the strong improvements of this kind of analysis. Accordingly, we combined the pipeline development and the reasearch of chromatin structure analysis, being able to showcase the utility of this new pipeline.
- The authors identify a strong positioning of +1 nucleosome by searching for a positioned nucleosomes in the vicinity of the assigned TSS. Given the ill-defined nature of TSSs, this approach sounds logic at first glance. However, given the rather broad search space from -100 till +300bp, I am wondering whether it is a sort of "self-fulfilling prophecy". Conversely, it would be good to validate that this approach indeed helps to refine TSS positions.
We thank the reviewer for raising this important point. We would like to clarify that we do not claim to redefine or precisely determine TSS positions in our study. Instead, we use annotated TSS coordinates as a reference to identify nucleosomes that correspond to the +1 nucleosome, based on their proximity to the TSS.
We selected the search window from -100 to +300 bp to account for known variability in Pf TSS annotation. For example, dominant transcription start sites identified by 5'UTR-seq tag clusters can differ by several hundred base pairs within a single time point (Chappell et al., 2020). The broad window thus allows us to capture the principal nucleosome positions near a TSS, even when the TSS itself is imprecise or heterogeneous. Based on the TSS centered plots (Figure 2C and Figure S1B), we reasoned that a window of -100 to +300 is sufficient to capture the majority of the +1 nucleosomes, which would have been missed by using smaller window sizes. This strategy aligns with well-established conventions in yeast chromatin biology, where the +1 nucleosome is defined relative to the TSS (Jiang and Pugh, 2009; Zhang et al. 2011) and commonly used as an anchor point to visualize downstream phased nucleosome arrays and upstream nucleosome-depleted regions (Rossi et al., 2021; Oberbeckmann et al., 2019; Krietenstein et al., 2016 and many more). Accordingly, our approach leverages these accepted standards to interpret nucleosome positioning without re-defining TSS annotations.
- Figure 1C: I am wondering how should the reader interpret the changes in nucleosomal repeat length changes throughout the cycle. Is linker DNA on average 10 nucleotides shorter at T30 compared to T5 timepoint? If so how could such "dramatic reorganization" be achieved at the molecular level in absence of a known linker DNA-binding protein. More importantly is this observation supported by additional evidence (e.g. dinucleosomal fragment length) or could it be due to slightly different digestion of the chromatin at the different stages or other technical variables?
We thank the reviewer for this insightful question regarding the interpretation of NRL changes across the cell cycle. The reviewer is right in her or his interpretation – linker DNA is on average ~10 bp shorter at T30 than at T5.
To address concerns about additional evidence and potential MNase digestion variability, we now analyzed MNase-seq fragment sizes by shifting mononucleosome peaks of each time point to the canonical 147 bp length, to correct for MNase digestion differences. After this normalisation, dinucleosome fragment length distributions revealed the shortest linker lengths at T30 and T35, whereas T5 and T10 showed longer DNA linkers. These results confirm our previous NRL measurements based on mononucleosomal read distances while controlling for MNase digestion bias.
The molecular basis of this reorganization, is still unclear. While linker histone H1 is considered absent in Plasmodium falciparum, presence of an uncharacterized linker DNA–binding protein or alternative factors fulfilling a similar role can not be excluded (Gill et al. 2010). However, H1 absence across all developmental stages, fails to explain stage-specific chromatin changes. We hypothesize that Apicomplexans evolved specialized chromatin remodelers to compensate for the missing H1, which may also drive the dynamic NRL changes observed. The low NRL coincides with high transcriptional activity in Pf during trophozoite stage is consistent with previous reports linking elevated transcription to reduced NRL in other eukaryotes (Baldi et al. 2018). In addition, the schizont stage involves multiple rounds of DNA replication requiring large histone supplies being produced during that time. It may well be that a high level of histone synthesis and DNA amplification, results in a short time period with increased nucleosome density and shorter NRL, until the system reaches again equilibrium (Beshnova et al. 2014). Although speculative we suggest a model wherein increased transcription promotes elevated nucleosome turnover and re-assembly by specialized remodeling enzymes, combined with high abundance of histones, resulting in higher nucleosome density and decreased NRL. Unfortunately, absolute quantification of nucleosome levels from this MNase-seq dataset is not possible without spike-in controls, which makes it infeasible to test the hypothesis with the available data set (Chen et al. 2016).
Minor comments
- I am wondering whether fuzziness and occupancy changes are truly independent categories. I am asking as both could lead to reduction of the signal at the nucleosome dyad and because they show markedly similar distribution in relation to the TSS and associate with identical epigenetic features (Figure 2B-D). Figure 2A indicates minimal overlap between them, but this could be due to the fact that the criteria to define these subtypes is defined such to place nucleosomes to one or the other category, but at the end they represent two flavors of the same thing.
Indeed, changes in occupancy and fuzziness can appear related because both features may reduce signal intensity at the nucleosome dyad and both are connected to “poor nucleosome positioning”. However, their definitions and measurements are clearly distinct and technically independent. Occupancy reflects the peak height at the nucleosome dyad, while fuzziness quantifies the spread of reads around the peak, measured as the standard deviation of read positions within each nucleosome peak (Jiang and Pugh, 2009; Chen et al., 2013). Although a reduction in occupancy can contribute to increased fuzziness by diminishing the dyad axis signal, fuzziness primarily arises from increased variability in the flanking regions around the nucleosome position center. While this distinction is established in the field, it is also often confused by the concept of well (high occupancy, low fuzziness) and poorly (high fuzziness, low occupancy) positioned nucleosomes, where both of these features are considered.
- Do the authors detect spatial relationship between fuzzy and repositioned/evicted nucleosomes at the level of individual nucleosomes pairs. With other words, can fuzziness be the consequence of repositioning/eviction of the neighboring nucleosome?
In Figure 2A we analyse the spatial overlap of all features to each other. The analysis clearly shows that fuzziness, occupancy changes and position changes occur mostly at distinct spatial sites (overlaps between 3 and 10%, Fig. 2A). Therefore, we suggest that the features correspond to independent processes. Likewise, we do observe an overlap between occupancy and ATAC-seq peaks, but not nucleosome positioning shifts, clearly discriminating different processes.
- Figure 4: enrichment values and measure of statistical significance for the different motifs are missing. Also have there been any other motifs identified.
This information is present in Supplemental Figure S3. Here we show the top 3 hits in each cluster. In the figure legend of Figure 4 we reference to Fig. S3:
L1054 –1055:
“Additional enriched motifs along with the significance of motif enrichment and the fraction of motifs at the respective nucleosome positions are shown in Figure S3”
- The M&M would benefit from some more details, e.g. settings in the piepline, or which fragment sizes were used to map the MNase-seq data?
We included a link to the corresponding Zenodo repository (https://doi.org/10.5281/zenodo.16779899) in the Data and materials availability statement.
The repository contains:
Code (scripts.zip) and annotation of Plasmodium falciparum (Annotation.zip) to reproduce the nucDetective v1.1 (nucDetective-1.1.zip) analysis as done in the research manuscript entitled "Deciphering chromatin architecture and dynamics in Plasmodium falciparum using the nucDetective pipeline".
The folder "output_nucDetective" conains the complete output of the nucDetective analysis pipeline as generated by the "01_nucDetective_profiler.sh" and "02_nucDetective_inspector.sh" scripts.
Nucleosome coverage tracks, annotation of nucleosome positions and dynamic nucleosomes are deposited additonally in the folder "Pf_nucleosome_annotation_of_nucDetective".
To make this clearer we added following text to Material and Methods in ”The nucDetective pipeline” section:
Changes in the manuscript (L518-519):
The code, software and annotations used to run the nucDetective pipeline along with the output have been deposited on Zenodo (https://doi.org/10.5281/zenodo.16779899).
which fragment sizes were used to map the MNase-seq data?
The default setting in nucDetective is to use fragment sizes of 140 – 200 bp, which corresponds to the main mono-nucleosome fraction in standard MNase-seq experiments. However, the correct selection of fragment sizes may vary depending on the organism and the variations in MNase-seq protocols. Therefore, the pipeline offers the option of changing the cutoff parameter (--minLen; --maxLen), accordingly. Kensche et al thoroughly tested the best selection of the fragment sizes for the data set, which is used in this manuscript. We agree with their selection and used the same cutoffs (75-175 bp).
This is stated in line 535-536:
The fragments are further filtered to mono-nucleosome sized fragments (here we used 75 – 175 bp)
We changed the text:
The fragments are further filtered to mono-nucleosome sized fragments (default setting 140-200 bp; changed in this study to 75 – 175 bp)
We highlighted other parameters used in this study in the material and methods part.
Reviewer #2 (Significance (Required)):
Overall, the manuscript is well written and findings are clearly and elegantly presented. The manuscript describes a new pipeline to map and analyze MNase-seq data across different stages or conditions, though the broader applicability of the pipeline and advancements over existing tools could be better demonstrated. Importantly, the manuscript make use of this pipeline to provide a refined and likely more accurate view on (the dynamics of) nucleosome positioning over the AT-rich genome of P. falciparum. While these observations make sense they remain rather descriptive/associative and lack further experimental validation. Overall, this manuscript could be interest to both researchers working on chromatin biology and Plasmodium gene-regulation.
We thank the reviewer for the assessment of our study and for recognizing that the results of our MNase-seq analysis pipeline nucDetective contribute to a better understanding of Pf chromatin biology.
Reviewer #3 (Evidence, reproducibility and clarity (Required)):
The manuscript "Deciphering chromatin architecture and dynamics in Plasmodium 2 falciparum using the nucDetective pipeline" describes computational analysis of previously published data of P falciparum chromatin. This work corrects the prevailing view that this parasitic organism has an unusually disorganized chromatin organization, which had been attributed to its high genomic AT content, lack of histone H1, and ancient derivation. The authors show that instead P falciparum has a very typical chromatin organization. Part of the refinement is due to aligning data on +1 nucleosome positions instead of TSSs, which have been poorly mapped. The computational tools corral some useful features, for querying epigenomic structure that make visualization straightforward, especially for fuzzy nucleosomes.
Reviewer #3 (Significance (Required)):
As a computational package this is a nice presentation of fairly central questions. The assessment and display of fuzzy nucleosomes is a nice feature.
We thank the reviewer for the assessment of our study and are pleased that the reviewer acknowledges the value and usability of our pipeline.
Remove the h tag
Note: This response was posted by the corresponding author to Review Commons. The content has not been altered except for formatting.
Learn more at Review Commons
Reviewer #1 (Evidence, reproducibility and clarity (Required)):
These authors have developed a method to induce MI or MII arrest. While this was previously possible in MI, the advantage of the method presented here is it works for MII, and chemically inducible because it is based on a system that is sensitive to the addition of ABA. Depending on when the ABA is added, they achieve a MI or MII delay. The ABA promotes dimerizing fragments of Mps1 and Spc105 that can't bind their chromosomal sites. The evidence that the MI arrest is weaker than the MII arrest is convincing and consistent with published data and indicating the SAC in MI is less robust than MII or mitosis. The authors use this system to find evidence that the weak MI arrest is associated with PP1 binding to Spc105. This is a nice use of the system.
The remainder of the paper uses the SynSAC system to isolate populations enriched for MI or MII stages and conduct proteomics. This shows a powerful use of the system but more work is needed to validate these results, particularly in normal cells.
Overall the most significant aspect of this paper is the technical achievement, which is validated by the other experiments. They have developed a system and generated some proteomics data that maybe useful to others when analyzing kinetochore composition at each division. Overall, I have only a few minor suggestions.
We appreciate the reviewers’ support of our study.
1) In wild-type - Pds1 levels are high during M1 and A1, but low in MII. Can the authors comment on this? In line 217, what is meant by "slightly attenuated? Can the authors comment on how anaphase occurs in presence of high Pds1? There is even a low but significant level in MII.
The higher levels of Pds1 in meiosis I compared to meiosis II has been observed previously using immunofluorescence and live imaging1–3. Although the reasons are not completely clear, we speculate that there is insufficient time between the two divisions to re-accumulate Pds1 prior to separase re-activation.
We agree “slightly attenuated” was confusing and we have re-worded this sentence to read “Addition ABA at the time of prophase release resulted in Pds1securin stabilisation throughout the time course, consistent with delays in both metaphase I and II”.
We do not believe that either anaphase I or II occur in the presence of high Pds1. Western blotting represents the amount of Pds1 in the population of cells at a given time point. The time between meiosis I and II is very short even when treated with ABA. For example, in Figure 2B, spindle morphology counts show that the anaphase I peak is around 40% at its maxima (105 min) and around 40% of cells are in either metaphase I or metaphase II, and will be Pds1 positive. In contrast, due to the better efficiency of meiosis II, anaphase II hardly occurs at all in these conditions, since anaphase II spindles (and the second nuclear division) are observed at very low frequency (maximum 10%) from 165 minutes onwards. Instead, metaphase II spindles partially or fully breakdown, without undergoing anaphase extension. Taking Pds1 levels from the western blot and the spindle data together leads to the conclusion that at the end of the time-course, these cells are biochemically in metaphase II, but unable to maintain a robust spindle. Spindle collapse is also observed in other situations where meiotic exit fails, and potentially reflects an uncoupling of the cell cycle from the programme governing gamete differentiation3–5. We will explain this point in a revised version while referring to representative images that from evidence for this, as also requested by the reviewer below.
2) The figures with data characterizing the system are mostly graphs showing time course of MI and MII. There is no cytology, which is a little surprising since the stage is determined by spindle morphology. It would help to see sample sizes (ie. In the Figure legends) and also representative images. It would also be nice to see images comparing the same stage in the SynSAC cells versus normal cells. Are there any differences in the morphology of the spindles or chromosomes when in the SynSAC system?
This is an excellent suggestion and will also help clarify the point above. We will provide images of cells at the different stages. For each timepoint, 100 cells were scored. We have already included this information in the figure legends
3) A possible criticism of this system could be that the SAC signal promoting arrest is not coming from the kinetochore. Are there any possible consequences of this? In vertebrate cells, the RZZ complex streams off the kinetochore. Yeast don't have RZZ but this is an example of something that is SAC dependent and happens at the kinetochore. Can the authors discuss possible limitations such as this? Does the inhibition of the APC effect the native kinetochores? This could be good or bad. A bad possibility is that the cell is behaving as if it is in MII, but the kinetochores have made their microtubule attachments and behave as if in anaphase.
In our view, the fact that SynSAC does not come from kinetochores is a major advantage as this allows the study of the kinetochore in an unperturbed state. It is also important to note that the canonical checkpoint components are all still present in the SynSAC strains, and perturbations in kinetochore-microtubule interactions would be expected to mount a kinetochore-driven checkpoint response as normal. Indeed, it would be interesting in future work to understand how disrupting kinetochore-microtubule attachments alters kinetochore composition (presumably checkpoint proteins will be recruited) and phosphorylation but this is beyond the scope of this work. In terms of the state at which we are arresting cells – this is a true metaphase because cohesion has not been lost but kinetochore-microtubule attachments have been established. This is evident from the enrichment of microtubule regulators but not checkpoint proteins in the kinetochore purifications from metaphase I and II. While this state is expected to occur only transiently in yeast, since the establishment of proper kinetochore-microtubule attachments triggers anaphase onset, the ability to capture this properly bioriented state will be extremely informative for future studies. We appreciate the reviewers’ insight in highlighting these interesting discussion points which we will include in a revised version.
Reviewer #1 (Significance (Required)):
These authors have developed a method to induce MI or MII arrest. While this was previously possible in MI, the advantage of the method presented here is it works for MII, and chemically inducible because it is based on a system that is sensitive to the addition of ABA. Depending on when the ABA is added, they achieve a MI or MII delay. The ABA promotes dimerizing fragments of Mps1 and Spc105 that can't bind their chromosomal sites. The evidence that the MI arrest is weaker than the MII arrest is convincing and consistent with published data and indicating the SAC in MI is less robust than MII or mitosis. The authors use this system to find evidence that the weak MI arrest is associated with PP1 binding to Spc105. This is a nice use of the system.
The remainder of the paper uses the SynSAC system to isolate populations enriched for MI or MII stages and conduct proteomics. This shows a powerful use of the system but more work is needed to validate these results, particularly in normal cells.
Overall the most significant aspect of this paper is the technical achievement, which is validated by the other experiments. They have developed a system and generated some proteomics data that maybe useful to others when analyzing kinetochore composition at each division.
We appreciate the reviewer’s enthusiasm for our work.
Reviewer #2 (Evidence, reproducibility and clarity (Required)):
The manuscript submitted by Koch et al. describes a novel approach to collect budding yeast cells in metaphase I or metaphase II by synthetically activating the spinde checkpoint (SAC). The arrest is transient and reversible. This synchronization strategy will be extremely useful for studying meiosis I and meiosis II, and compare the two divisions. The authors characterized this so-named syncSACapproach and could confirm previous observations that the SAC arrest is less efficient in meiosis I than in meiosis II. They found that downregulation of the SAC response through PP1 phosphatase is stronger in meiosis I than in meiosis II. The authors then went on to purify kinetochore-associated proteins from metaphase I and II extracts for proteome and phosphoproteome analysis. Their data will be of significant interest to the cell cycle community (they compared their datasets also to kinetochores purified from cells arrested in prophase I and -with SynSAC in mitosis).
I have only a couple of minor comments:
1) I would add the Suppl Figure 1A to main Figure 1A. What is really exciting here is the arrest in metaphase II, so I don't understand why the authors characterize metaphase I in the main figure, but not metaphase II. But this is only a suggestion.
This is a good suggestion, we will do this in our full revision.
2) Line 197, the authors state: ...SyncSACinduced a more pronounced delay in metaphase II than in metaphase I. However, line 229 and 240 the auhtors talk about a "longer delay in metaphase Thank you for pointing this out, this is indeed a typo and we have corrected it.
3) The authors describe striking differences for both protein abundance and phosphorylation for key kinetochore associated proteins. I found one very interesting protein that seems to be very abundant and phosphorylated in metaphase I but not metaphase II, namely Sgo1. Do the authors think that Sgo1 is not required in metaphase II anymore? (Top hit in suppl Fig 8D).
This is indeed an interesting observation, which we plan to investigate as part of another study in the future. Indeed, data from mouse indicates that shugoshin-dependent cohesin deprotection is already absent in meiosis II in mouse oocytes6, though whether this is also true in yeast is not known. Furthermore, this does not rule out other functions of Sgo1 in meiosis II (for example promoting biorientation). We will include this point in the discussion.
Reviewer #2 (Significance (Required)):
The technique described here will be of great interest to the cell cycle community. Furthermore, the authors provide data sets on purified kinetochores of different meiotic stages and compare them to mitosis. This paper will thus be highly cited, for the technique, and also for the application of the technique.
Reviewer #3 (Evidence, reproducibility and clarity (Required)):
In their manuscript, Koch et al. describe a novel strategy to synchronize cells of the budding yeast Saccharomyces cerevisiae in metaphase I and metaphase II, thereby facilitating comparative analyses between these meiotic stages. This approach, termed SynSAC, adapts a method previously developed in fission yeast and human cells that enables the ectopic induction of a synthetic spindle assembly checkpoint (SAC) arrest by conditionally forcing the heterodimerization of two SAC components upon addition of the plant hormone abscisic acid (ABA). This is a valuable tool, which has the advantage that induces SAC-dependent inhibition of the anaphase promoting complex without perturbing kinetochores. Furthermore, since the same strategy and yeast strain can be also used to induce a metaphase arrest during mitosis, the methodology developed by Koch et al. enables comparative analyses between mitotic and meiotic cell divisions. To validate their strategy, the authors purified kinetochores from meiotic metaphase I and metaphase II, as well as from mitotic metaphase, and compared their protein composition and phosphorylation profiles. The results are presented clearly and in an organized manner.
We are grateful to the reviewer for their support.
Despite the relevance of both the methodology and the comparative analyses, several main issues should be addressed: 1.- In contrast to the strong metaphase arrest induced by ABA addition in mitosis (Supp. Fig. 2), the SynSAC strategy only promotes a delay in metaphase I and metaphase II as cells progress through meiosis. This delay extends the duration of both meiotic stages, but does not markedly increase the percentage of metaphase I or II cells in the population at a given timepoint of the meiotic time course (Fig. 1C). Therefore, although SynSAC broadens the time window for sample collection, it does not substantially improve differential analyses between stages compared with a standard NDT80 prophase block synchronization experiment. Could a higher ABA concentration or repeated hormone addition improve the tightness of the meiotic metaphase arrest?
For many purposes the enrichment and extended time for sample collection is sufficient, as we demonstrate here. However, as pointed out by the reviewer below, the system can be improved by use of the 4A-RASA mutations to provide a stronger arrest (see our response below). We did not experiment with higher ABA concentrations or repeated addition since the very robust arrest achieved with the 4A-RASA mutant deemed this unnecessary.
2.- Unlike the standard SynSAC strategy, introducing mutations that prevent PP1 binding to the SynSAC construct considerably extended the duration of the meiotic metaphase arrests. In particular, mutating PP1 binding sites in both the RVxF (RASA) and the SILK (4A) motifs of the Spc105(1-455)-PYL construct caused a strong metaphase I arrest that persisted until the end of the meiotic time course (Fig. 3A). This stronger and more prolonged 4A-RASA SynSAC arrest would directly address the issue raised above. It is unclear why the authors did not emphasize more this improved system. Indeed, the 4A-RASA SynSAC approach could be presented as the optimal strategy to induce a conditional metaphase arrest in budding yeast meiosis, since it not only adapts but also improves the original methods designed for fission yeast and human cells. Along the same lines, it is surprising that the authors did not exploit the stronger arrest achieved with the 4A-RASA mutant to compare kinetochore composition at meiotic metaphase I and II.
We agree that the 4A-RASA mutant is the best tool to use for the arrest and going forward this will be our approach. We collected the proteomics data and the data on the SynSAC mutant variants concurrently, so we did not know about the improved arrest at the time the proteomics experiment was done. Because very good arrest was already achieved with the unmutated SynSAC construct, we could not justify repeating the proteomics experiment which is a large amount of work using significant resources. However, we will highlight the potential of the 4A-RASA mutant more prominently in our full revision.
3.- The results shown in Supp. Fig. 4C are intriguing and merit further discussion. Mitotic growth in ABA suggest that the RASA mutation silences the SynSAC effect, yet this was not observed for the 4A or the double 4A-RASA mutants. Notably, in contrast to mitosis, the SynSAC 4A-RASA mutation leads to a more pronounced metaphase I meiotic delay (Fig. 3A). It is also noteworthy that the RVAF mutation partially restores mitotic growth in ABA. This observation supports, as previously demonstrated in human cells, that Aurora B-mediated phosphorylation of S77 within the RVSF motif is important to prevent PP1 binding to Spc105 in budding yeast as well.
We agree these are intriguing findings that highlight key differences as to the wiring of the spindle checkpoint in meiosis and mitosis and potential for future studies, however, currently we can only speculate as to the underlying cause. The effect of the RASA mutation in mitosis is unexpected and unexplained. However, the fact that the 4A-RASA mutation causes a stronger delay in meiosis I compared to mitosis can be explained by a greater prominence of PP1 phosphatase in meiosis. Indeed, our data (Figure 4A) show that the PP1 phosphatase Glc7 and its regulatory subunit Fin1 are highly enriched on kinetochores at all meiotic stages compared to mitosis.
We agree that the improved growth of the RVAF mutant is intriguing and points to a role of Aurora B-mediated phosphorylation, though previous work has not supported such a role 7.
We will include a discussion of these important points in a revised version.
4.- To demonstrate the applicability of the SynSAC approach, the authors immunoprecipitated the kinetochore protein Dsn1 from cells arrested at different meiotic or mitotic stages, and compared kinetochore composition using data independent acquisition (DIA) mass spectrometry. Quantification and comparative analyses of total and kinetochore protein levels were conducted in parallel for cells expressing either FLAG-tagged or untagged Dsn1 (Supp. Fig. 7A-B). To better detect potential changes, protein abundances were next scaled to Dsn1 levels in each sample (Supp. Fig. 7C-D). However, it is not clear why the authors did not normalize protein abundance in the immunoprecipitations from tagged samples at each stage to the corresponding untagged control, instead of performing a separate analysis. This would be particularly relevant given the high sensitivity of DIA mass spectrometry, which enabled quantification of thousands of proteins. Furthermore, the authors compared protein abundances in tagged-samples from mitotic metaphase and meiotic prophase, metaphase I and metaphase II (Supp. Fig. 7E-F). If protein amounts in each case were not normalized to the untagged controls, as inferred from the text (lines 333 to 338), the observed differences could simply reflect global changes in protein expression at different stages rather than specific differences in protein association to kinetochores.
While we agree with the reviewer that at first glance, normalising to no tag makes the most sense, in practice there is very low background signal in the no tag sample which means that any random fluctuations have a big impact on the final fold change. This approach therefore introduces artefacts into the data rather than improving normalisation.
To provide reassurance that our kinetochore immunoprecipitations are specific, and that the background (no tag) signal is indeed very low, we will provide a new supplemental figure showing the volcanos comparing kinetochore purifications at each stage with their corresponding no tag control. These volcano plots show very clearly that the major enriched proteins are kinetochore proteins and associated factors, in all cases.
It is also important to note that our experiment looks at relative changes of the same protein over time, which we expect to be relatively small in the whole cell lysate. We previously documented proteins that change in abundance in whole cell lysates throughout meiosis8. In this study, we found that relatively few proteins significantly change in abundance, supporting this view.
Our aim in the current study was to understand how the relative composition of the kinetochore changes and for this, we believe that a direct comparison to Dsn1, a central kinetochore protein which we immunoprecipitated is the most appropriate normalisation.
5.- Despite the large amount of potentially valuable data generated, the manuscript focuses mainly on results that reinforce previously established observations (e.g., premature SAC silencing in meiosis I by PP1, changes in kinetochore composition, etc.). The discussion would benefit from a deeper analysis of novel findings that underscore the broader significance of this study.
We strongly agree with this point and we will re-frame the discussion to focus on the novel findings, as also raised by the other reviewers.
Finally, minor concerns are: 1.- Meiotic progression in SynSAC strains lacking Mad1, Mad2 or Mad3 is severely affected (Fig. 1D and Supp. Fig. 1), making it difficult to assess whether, as the authors state, the metaphase delays depend on the canonical SAC cascade. In addition, as a general note, graphs displaying meiotic time courses could be improved for clarity (e.g., thinner data lines, addition of axis gridlines and external tick marks, etc.).
We will generate the data to include a checkpoint mutant +/- ABA for direct comparison. We will take steps to improve the clarity of presentation of the meiotic timecourse graphs, though our experience is that uncluttered graphs make it easier to compare trends.
2.- Spore viability following SynSAC induction in meiosis was used as an indicator that this experimental approach does not disrupt kinetochore function and chromosome segregation. However, this is an indirect measure. Direct monitoring of genome distribution using GFP-tagged chromosomes would have provided more robust evidence. Notably, the SynSAC mad3Δ mutant shows a slight viability defect, which might reflect chromosome segregation defects that are more pronounced in the absence of a functional SAC.
Spore viability is a much more sensitive way of analysing segregation defects that GFP-labelled chromosomes. This is because GFP labelling allows only a single chromosome to be followed. On the other hand, if any of the 16 chromosomes mis-segregate in a given meiosis this would result in one or more aneuploid spores in the tetrad, which are typically inviable. The fact that spore viability is not significantly different from wild type in this analysis indicates that there are no major chromosome segregation defects in these strains, and we therefore do not plan to do this experiment.
3.- It is surprising that, although SAC activity is proposed to be weaker in metaphase I, the levels of CPC/SAC proteins seem to be higher at this stage of meiosis than in metaphase II or mitotic metaphase (Fig. 4A-B).
We agree, this is surprising and we will point this out in the revised discussion. We speculate that the challenge in biorienting homologs which are held together by chiasmata, rather than back-to-back kinetochores results in a greater requirement for error correction in meiosis I. Interestingly, the data with the RASA mutant also point to increased PP1 activity in meiosis I, and we additionally observed increased levels of PP1 (Glc7 and Fin1) on meiotic kinetochores, consistent with the idea that cycles of error correction and silencing are elevated in meiosis I.
4.- Although a more detailed exploration of kinetochore composition or phosphorylation changes is beyond the scope of the manuscript, some key observations could have been validated experimentally (e.g., enrichment of proteins at kinetochores, phosphorylation events that were identified as specific or enriched at a certain meiotic stage, etc.).
We agree that this is beyond the scope of the current study but will form the start of future projects from our group, and hopefully others.
5.- Several typographical errors should be corrected (e.g., "Knetochores" in Fig. 4 legend, "250uM ABA" in Supp. Fig. 1 legend, etc.)
Thank you for pointing these out, they have been corrected.
Reviewer #3 (Significance (Required)):
Koch et al. describe a novel methodology, SynSAC, to synchronize budding yeast cells in metaphase I or metaphase II during meiosis, as well and in mitotic metaphase, thereby enabling differential analyses among these cell division stages. Their approach builds on prior strategies originally developed in fission yeast and human cells models to induce a synthetic spindle assembly checkpoint (SAC) arrest by conditionally forcing the heterodimerization of two SAC proteins upon addition of abscisic acid (ABA). The results from this manuscript are of special relevance for researchers studying meiosis and using Saccharomyces cerevisiae as a model. Moreover, the differential analysis of the composition and phosphorylation of kinetochores from meiotic metaphase I and metaphase II adds interest for the broader meiosis research community. Finally, regarding my expertise, I am a researcher specialized in the regulation of cell division.
Note: This response was posted by the corresponding author to Review Commons. The content has not been altered except for formatting.
Learn more at Review Commons
Reviewer #1
Evidence, reproducibility and clarity
This paper addresses a very interesting problem of non-centrosomal microtubule organization in developing Drosophila oocytes. Using genetics and imaging experiments, the authors reveal an interplay between the activity of kinesin-1, together with its essential cofactor Ensconsin, and microtubule organization at the cell cortex by the spectraplakin Shot, minus-end binding protein Patronin and Ninein, a protein implicated in microtubule minus end anchoring. The authors demonstrate that the loss of Ensconsin affects the cortical accumulation non-centrosomal microtubule organizing center (ncMTOC) proteins, microtubule length and vesicle motility in the oocyte, and show that this phenotype can be rescued by constitutively active kinesin-1 mutant, but not by Ensconsin mutants deficient in microtubule or kinesin binding. The functional connection between Ensconsin, kinesin-1 and ncMTOCs is further supported by a rescue experiment with Shot overexpression. Genetics and imaging experiments further implicate Ninein in the same pathway. These data are a clear strength of the paper; they represent a very interesting and useful addition to the field.
The weaknesses of the study are two-fold. First, the paper seems to lack a clear molecular model, uniting the observed phenomenology with the molecular functions of the studied proteins. Most importantly, it is not clear how kinesin-based plus-end directed transport contributes to cortical localization of ncMTOCs and regulation of microtubule length.
Second, not all conclusions and interpretations in the paper are supported by the presented data.
We thank the reviewer for recognizing the impact of this work. In response to the insightful suggestions, we performed extensive new experiments that establish a well-supported cellular and molecular model (Figure 7). The discussion has been restructured to directly link each conclusion to its corresponding experimental evidence, significantly strengthening the manuscript.
Below is a list of specific comments, outlining the concerns, in the order of appearance in the paper/figures.
Figure 1. The statement: "Ens loading on MTs in NCs and their subsequent transport by Dynein toward ring canals promotes the spatial enrichment of the Khc activator Ens in the oocyte" is not supported by data. The authors do not demonstrate that Ens is actually transported from the nurse cells to the oocyte while being attached to microtubules. They do show that the intensity of Ensconsin correlates with the intensity of microtubules, that the distribution of Ensconsin depends on its affinity to microtubules and that an Ensconsin pool locally photoactivated in a nurse cell can redistribute to the oocyte (and throughout the nurse cell) by what seems to be diffusion. The provided images suggest that Ensconsin passively diffuses into the oocyte and accumulates there because of higher microtubule density, which depends on dynein. To prove that Ensconsin is indeed transported by dynein in the microtubule-bound form, one would need to measure the residence time of Ensconsin on microtubules and demonstrate that it is longer than the time needed to transport microtubules by dynein into the oocyte; ideally, one would like to see movement of individual microtubules labelled with photoconverted Ensconsin from a nurse cell into the oocyte. Since microtubules are not enriched in the oocyte of the dynein mutant, analysis of Ensconsin intensity in this mutant is not informative and does not reveal the mechanism of Ensconsin accumulation.
As noted by Reviewer 3, the directional movement of microtubules traveling at ~140 nm/s from nurse cells toward the oocyte through Ring Canals was previously reported using a tagged Ens-MT binding domain reporter line by Lu et al. (2022). We have therefore added the citation of this crucial work in the novel version of the manuscript (lane 155-157) and removed the photo-conversion panel.
Critically, however, our study provides mechanistic insight that was missing from this earlier work: this mechanism is also crucial to enrich MAPs in the oocyte. The fact that Dynein mutants fail to enrich Ensconsin is a crucial piece of evidence: it supports a model of Ensconsin-loaded MT transport (Figure 1D-1F).
Figure 2. According to the abstract, this figure shows that Ensconsin is "maintained at the oocyte cortex by Ninein". However, the figure doesn't seem to prove it - it shows that oocyte enrichment of Ensonsin is partially dependent on Ninein, but this applies to the whole cell and not just to the cell cortex. Furthermore, it is not clear whether Ninein mutation affects microtubule density, which in turn would affect Ensconsin enrichment, and therefore, it is not clear whether the effect of Ninein loss on Ensconsin distribution is direct or indirect.
Ninein plays a critical role in Ensconsin enrichment and microtubule organization in the oocyte (new Figure 2, Figure 3, Figure S3). Quantification of total Tubulin signal shows no difference between control and Nin mutant oocytes (new Figure S3 panels A, B). We found decreased Ens enrichment in the oocyte, and Ens localization on MTs and to the cell cortex (Figure 2E, 2F, and Figure S3C and S3D).
Novel quantitative analyses of microtubule orientation at the anterior cortex, where MTs are normally preferentially oriented toward the posterior pole (Parton et al. 2011), demonstrate that Nin mutants exhibit randomized MT orientation compared to wild-type oocytes (new Figure 3C-3E).These findings establish that Ninein (although not essential) favors Ensconsin localization on MTs, Ens enrichment in the oocyte, ncMTOC cortical localization, and more robust MT orientation toward the posterior cortex. It also suggests that Ens levels in the oocyte acts as a rheostat to control Khc activation.
The observation that the aggregates formed by overexpressed Ninein accumulate other proteins, including Ensconsin, supports, though does not prove their interactions. Furthermore, there is absolutely no proof that Ninein aggregates are "ncMTOCs". Unless the authors demonstrate that these aggregates nucleate or anchor microtubules (for example, by detailed imaging of microtubules and EB1 comets), the text and labels in the figure would need to be altered.
We have modified the manuscript, we now refer to an accumulation of these components in large puncta, rather than aggregates, consistent with previous observations (Rosen et al., 2000). We acknowledge in the revised version that these puncta recruit Shot, Patronin and Ens without mentioning direct interaction (lane 218).
Importantly, we conducted a more detailed characterization of these Ninein/Shot/Patronin/Ens-containing puncta in a novel Figure S4. To rigorously assess their nucleation capacity, we analyzed Eb1-GFP-labeled MT comets, a robust readout of MT nucleation (Parton et al., 2011, Nashchekin et al., 2016). While few Eb1-positive comets occasionally emanate from these structures, confirming their identity as putative ncMTOCs, these puncta function as surprisingly weak nucleation centers (new Figure S4 E, Video S1) and, their presence does not alter overall MT architecture (new Figure S4 F). Moreover, these puncta disappear over time, are barely visible at stage 10B, they do not impair oocyte development or fertility (Figure S4 G and Table 1).
Minor comment: Note that a "ratio" (Figure 2C) is just a ratio, and should not be expressed in arbitrary units.
We have amended this point in all the figures.
Figure 3B: immunoprecipitation results cannot be interpreted because the immunoprecipitated proteins (GFP, Ens-GFP, Shot-YFP) are not shown. It is also not clear that this biochemical experiment is useful. If the authors would like to suggest that Ensconsin directly binds to Patronin, the interaction would need to be properly mapped at the protein domain level.
This is a good point: the GFP and Ens-GFP immunoprecipitated proteins are now much clearly identified on the blots and in the figure legend (new Figure 4G). Shot-YFP IP, was used as a positive control but is difficult to be detected by Western blot due to its large size (>106 Da) using conventional acrylamide gels (Nashchekin et al., 2016).
We now explicitly state that immunoprecipitations were performed at 4°C, where microtubules are fully depolymerized, thereby excluding undirect microtubule-mediated interactions. We agree with this reviewer: we cannot formally rule out interactions through bridging by other protein components. This is stated in the revised manuscript (lane 238-239).
One of the major phenotypes observed by the authors in Ens mutant is the loss of long microtubules. The authors make strong conclusions about the independence of this phenotype from the parameters of microtubule plus-end growth, but in fact, the quality of their data does not allow to make such a conclusion, because they only measured the number of EB1 comets and their growth rate but not the catastrophe, rescue or pausing frequency."Note that kinesin-1 has been implicated in promoting microtubule damage and rescue (doi: 10.1016/j.devcel.2021).In the absence of such measurements, one cannot conclude whether short microtubules arise through defects in the minus-end, plus-end or microtubule shaft regulation pathways.
We thank the reviewer for raising this important point. Our data demonstrate that microtubule (MT) nucleation and polymerization rates remain unaffected under Khc RNAi and ens mutant conditions, indicating that MT dynamics alterations must arise through alternative mechanisms.
As the reviewer suggested, recent studies on Kinesin activity and MT network regulation are indeed highly relevant. Two key studies from the Verhey and Aumeier laboratories examined Kinesin-1 gain-of-function conditions and revealed that constitutively active Kinesin-1 induces MT lattice damage (Budaitis et al., 2022). While damaged MTs can undergo self-repair, Aumeier and colleagues demonstrated that GTP-tubulin incorporation generates "rescue shafts" that promote MT rescue events (Andreu-Carbo et al., 2022). Extrapolating from these findings, loss of Kinesin-1 activity could plausibly reduce rescue shaft formation, thereby decreasing MT rescue frequency and stability. Although this hypothesis is challenging to test directly in our system, it provides a mechanistic framework for the observed reduction in MT number and stability.
Additionally, the reviewer highlighted the role of Khc in transporting the dynactin complex, an anti-catastrophe factor, to MT plus ends (Nieuwburg et al., 2017), which could further contribute to MT stabilization. This crucial reference is now incorporated into the revised Discussion.
Importantly, our work also demonstrates the contribution of Ens/Khc to ncMTOC targeting to the cell cortex. Our new quantitative analyses of MT organization (new Figure 5 B) reveal a defective anteroposterior orientation of cortical MTs in mutant conditions, pointing to a critical role for cortical ncMTOCs in organizing the MT network.
Taken together, we propose that the observed MT reduction and disorganization result from multiple interconnected mechanisms: (1) reduced rescue shaft formation affecting MT stability; (2) impaired transport of anti-catastrophe factors to MT plus ends; and (3) loss of cortical ncMTOCs, which are essential for minus-end MT stabilization and network organization. The Discussion has been revised to reflect this integrated model in a dedicated paragraph (“A possible regulation of MT dynamics in the oocyte at both plus end minus MT ends by Ens and Khc” lane 415-432).
It is important to note in that a spectraplakin, like Shot, can potentially affect different pathways, particularly when overexpressed.
We agree that Shot harbors multiple functional domains and acts as a key organizer of both actin and microtubule cytoskeletons. Overexpression of such a cytoskeletal cross-linker could indeed perturb both networks, making interpretation of Ens phenotype rescue challenging due to potential indirect effects.
To address this concern, we selected an appropriate Shot isoform for our rescue experiments that displayed similar localization to “endogenous” Shot-YFP (a genomic construct harboring shot regulatory sequences) and importantly that was not overexpressed.
Elevated expression of the Shot.L(A) isoform (see Western Blot Figure S8 A), considered as the wild-type form with two CH1 and CH2 actin-binding motifs (Lee and Kolodziej, 2002), showed abnormal localization such as strong binding to the microtubules in nurse cells and oocyte confirming the risk of gain-of-function artifacts and inappropriate conclusions (Figure S8 B, arrows).
By contrast, our rescue experiments using the Shot.L(C) isoform (that only harbors the CH2 motif) provide strong evidence against such artifacts for three reasons. First, Shot-L(C) is expressed at slightly lower levels than a Shot-YFP genomic construct (not overexpressed), and at much lower levels than Shot-L(A), despite using the same driver (Figure S8 A). Second, Shot-L(C) localization in the oocyte is similar to that of endogenous Shot-YFP, concentrating at the cell cortex (Figure S8 B, compare lower and top panels). Taken together, these controls rather suggest our rescue with the Shot-L(C) is specific.
Note that this Shot-L(C) isoform is sufficient to complement the absence of the shot gene in other cell contexts (Lee and Kolodziej, 2002).
Unjustified conclusions should be removed: the authors do not provide sufficient data to conclude that "ens and Khc oocytes MT organizational defects are caused by decreased ncMTOC cortical anchoring", because the actual cortical microtubule anchoring was not measured.
This is a valid point. We acknowledge that we did not directly measure microtubule anchoring in this study. In response, we have revised the discussion to more accurately reflect our observations. Throughout the manuscript, we now refer to "cortical microtubule organization" rather than "cortical microtubule anchoring," which better aligns with the data presented.
Minor comment: Microtubule growth velocity must be expressed in units of length per time, to enable evaluating the quality of the data, and not as a normalized value.
This is now amended in the revised version (modified Figure S7).
A significant part of the Discussion is dedicated to the potential role of Ensconsin in cortical microtubule anchoring and potential transport of ncMTOCs by kinesin. It is obviously fine that the authors discuss different theories, but it would be very helpful if the authors would first state what has been directly measured and established by their data, and what are the putative, currently speculative explanations of these data.
We have carefully considered the reviewer's constructive comments and are confident that this revised version fully addresses their concerns.
First, we have substantially strengthened the connection between the Results and Discussion sections, ensuring that our interpretations are more directly anchored in the experimental data. This restructuring significantly improves the overall clarity and logical flow of the manuscript.
Second, we have added a new comprehensive figure presenting a molecular-scale model of Kinesin-1 activation upon release of autoinhibition by Ensconsin (new Figure 7D). Critically, this figure also illustrates our proposed positive feedback loop mechanism: Khc-dependent cytoplasmic advection promotes cortical recruitment of additional ncMTOCs, which generates new cortical microtubules and further accelerates cytoplasmic transport (Figure 7 A-C). This self-amplifying cycle provides a mechanistic framework consistent with emerging evidence that cytoplasmic flows are essential for efficient intracellular transport in both insect and mammalian oocytes.
Minor comment: The writing and particularly the grammar need to be significantly improved throughout, which should be very easy with current language tools. Examples: "ncMTOCs recruitment" should be "ncMTOC recruitment"; "Vesicles speed" should be "Vesicle speed", "Nin oocytes harbored a WT growth,"- unclear what this means, etc. Many paragraphs are very long and difficult to read. Making shorter paragraphs would make the authors' line of thought more accessible to the reader.
We have amended and shortened the manuscript according to this reviewer feed-back. We have specifically built more focused paragraphs to facilitates the reading.
Significance
This paper represents significant advance in understanding non-centrosomal microtubule organization in general and in developing Drosophila oocytes in particular by connecting the microtubule minus-end regulation pathway to the Kinesin-1 and Ensconsin/MAP7-dependent transport. The genetics and imaging data are of good quality, are appropriately presented and quantified. These are clear strengths of the study which will make it interesting to researchers studying the cytoskeleton, microtubule-associated proteins and motors, and fly development.
The weaknesses of this study are due to the lack of clarity of the overall molecular model, which would limit the impact of the study on the field. Some interpretations are not sufficiently supported by data, but this can be solved by more precise and careful writing, without extensive additional experimentation.
We thank the reviewer for raising these important concerns regarding clarity and data interpretation. We have thoroughly revised the manuscript to address these issues on multiple fronts. First, we have substantially rewritten key sections to ensure that our conclusions are clearly articulated and directly supported by the data. Second, we have performed several new experiments that now allow us to propose a robust mechanistic model, presented in new figures. These additions significantly strengthen the manuscript and directly address the reviewer's concerns.
My expertise is cell biology and biochemistry of the microtubule cytoskeleton, including both microtubule-associated proteins and microtubule motors.
Reviewer #2
Evidence, reproducibility and clarity
In this manuscript, Berisha et al. investigate how microtubule (MT) organization is spatially regulated during Drosophila oogenesis. The authors identify a mechanism in which the Kinesin-1 activator Ensconsin/MAP7 is transported by dynein and anchored at the oocyte cortex via Ninein, enabling localized activation of Kinesin-1. Disruption of this pathway impairs ncMTOC recruitment and MT anchoring at the cortex. The authors combine genetic manipulation with high-resolution microscopy and use three key readouts to assess MT organization during mid-to-late oogenesis: cortical MT formation, localization of posterior determinants, and ooplasmic streaming. Notably, Kinesin-1, in concert with its activator Ens/MAP7, contributes to organizing the microtubule network it travels along. Overall, the study presents interesting findings, though we have several concerns we would like the authors to address. Ensconsin enrichment in the oocyte 1. Enrichment in the oocyte • Ensconsin is a MAP that binds MTs. Given that microtubule density in the oocyte significantly exceeds that in the nurse cells, its enrichment may passively reflect this difference. To assess whether the enrichment is specific, could the authors express a non-Drosophila MAP (e.g., mammalian MAP1B) to determine whether it also preferentially localizes to the oocyte?
To address this point, we performed a new series of experiments analyzing the enrichment of other Drosophila and non-Drosophila MAPs, including Jupiter-GFP, Eb1-GFP, and bovine Tau-GFP, all widely used markers of the microtubule cytoskeleton in flies (see new Figure S2). Our results reveal that Jupiter-GFP, Eb1-GFP, and bovine Tau-GFP all exhibit significantly weaker enrichment in the oocyte compared to Ens-GFP. Khc-GFP also shows lower enrichment. These findings indicate that MAP enrichment in the oocyte is MAP-dependent, rather than solely reflecting microtubule density or organization. Of note, we cannot exclude that microtubule post-translational modifications contribute to differential MAP binding between nurse cells and the oocyte, but this remains a question for future investigation.
The ability of ens-wt and ens-LowMT to induce tubulin polymerization according to the light scattering data (Fig. S1J) is minimal and does not reflect dramatic differences in localization. The authors should verify that, in all cases, the polymerization product in their in vitro assays is microtubules rather than other light-scattering aggregates. What is the control in these experiments? If it is just purified tubulin, it should not form polymers at physiological concentrations.
The critical concentration Cr for microtubule self-assembly in classical BRB80 buffer found by us and others is around 20 µM (see Fig. 2c in Weiss et al., 2010). Here, microtubules were assembled at 40 µM tubulin concentration, i.e., largely above the Cr. As stated in the materials and methods section, we systematically induced cooling at 4°C after assembly to assess the presence of aggregates, since those do not fall apart upon cooling. The decrease in optical density upon cooling is a direct control that the initial increase in DO is due to the formation of microtubules. Finally, aggregation and polymerization curves are widely different, the former displaying an exponential shape and the latter a sigmoid assembly phase (see Fig. 3A and 3B in Weiss et al., 2010).
Photoconversion caveatsMAPs are known to dynamically associate and dissociate from microtubules. Therefore, interpretation of the Ens photoconversion data should be made with caution. The expanding red signal from the nurse cells to the oocyte may reflect a any combination of dynein-mediated MT transport and passive diffusion of unbound Ensconsin. Notably, photoconversion of a soluble protein in the nurse cells would also result in a gradual increase in red signal in the oocyte, independent of active transport. We encourage the authors to more thoroughly discuss these caveats. It may also help to present the green and red channels side by side rather than as merged images, to allow readers to assess signal movement and spatial patterns better.
This is a valid point that mirrors the comment of Reviewers 1 and 3. The directional movement of microtubules traveling at ~140 nm/s from nurse cells toward the oocyte via the ring canals was previously reported by Lu et al. (2022) with excellent spatial resolution. Notably, this MT transport was measured using a fusion protein containing the Ens MT-binding domain. We now cite this relevant study in our revised manuscript and have removed this redundant panel in Figure 1.
Reduction of Shot at the anterior cortex• Shot is known to bind strongly to F-actin, and in the Drosophila ovary, its localization typically correlates more closely with F-actin structures than with microtubules, despite being an MT-actin crosslinker. Therefore, the observed reduction of cortical Shot in ens, nin mutants, and Khc-RNAi oocytes is unexpected. It would be important to determine whether cortical F-actin is also disrupted in these conditions, which should be straightforward to assess via phalloidin staining.
As requested by the reviewer, we performed actin staining experiments, which are now presented in a new Figure S5. These data demonstrate that the cortical actin network remains intact in all mutant backgrounds analyzed, ruling out any indirect effect of actin cytoskeleton disruption on the observed phenotypes.
MTs are barely visible in Fig. 3A, which is meant to demonstrate Ens-GFP colocalization with tubulin. Higher-quality images are needed.
The revised version now provides significantly improved images to show the different components examined. Our data show that Ens and Ninein localize at the cell cortex where they co-localize with Shot and Patronin (Figure 2 A-C). In addition, novel images show that Ens extends along microtubules (new Figure 4 A).
MT gradient in stage 9 oocytesIn ens-/-, nin-/-, and Khc-RNAi oocytes, is there any global defect in the stage 9 microtubule gradient? This information would help clarify the extent to which cortical localization defects reflect broader disruptions in microtubule polarity.
We now provide quantitative analysis of microtubule (MT) array organization in novel figures (Figure 3D and Figure 5B). Our data reveal that both Khc RNAi and ens mutant oocytes exhibit severe disruption of MT orientation toward the posterior (new Figure 5B). Importantly, this defect is significantly less pronounced in Nin-/- oocytes, which retain residual ncMTOCs at the cortex (new Figure 3D). This differential phenotype supports our model that cortical ncMTOCs are critical for maintaining proper MT orientation toward the posterior side of the oocyte.
Role of Ninein in cortical anchoringThe requirement for Ninein in cortical anchorage is the least convincing aspect of the manuscript and somewhat disrupts the narrative flow. First, it is unclear whether Ninein exhibits the same oocyte-enriched localization pattern as Ensconsin. Is Ninein detectable in nurse cells? Second, the Ninein antibody signal appears concentrated in a small area of the anterior-lateral oocyte cortex (Fig. 2A), yet Ninein loss leads to reduced Shot signal along a much larger portion of the anterior cortex (Fig. 2F)-a spatial mismatch that weakens the proposed functional relationship. Third, Ninein overexpression results in cortical aggregates that co-localize with Shot, Patronin, and Ensconsin. Are these aggregates functional ncMTOCs? Do microtubules emanate from these foci?
We now provide a more comprehensive analysis of Ninein localization. Similar to Ensconsin (Ens), endogenous Ninein is enriched in the oocyte during the early stages of oocyte development but is also detected in NCs (see modified Figure 2 A and Lasko et al., 2016). Improved imaging of Ninein further shows that the protein partially co-localizes with Ens, and ncMTOCs at the anterior cortex and with Ens-bound MTs (Figure 2B, 2C).
Importantly, loss of Ninein (Nin) only partially reduces the enrichment of Ens in the oocyte (Figure 2E). Both Ens and Kinesin heavy chain (Khc) remain partially functional and continue to target non-centrosomal microtubule-organizing centers (ncMTOCs) to the cortex (Figure 3A). In Nin-/- mutants, a subset of long cortical microtubules (MTs) is present, thereby generating cytoplasmic streaming, although less efficiently than under wild-type (WT) conditions (Figure 3F and 3G). As a non-essential gene, we envisage Ninein as a facilitator of MT organization during oocyte development.
Finally, our new analyses demonstrate that large puncta containing Ninein, Shot, Patronin, and despite their size, appear to be relatively weak nucleation centers (revised Figure S4 E and Video 1). In addition, their presence does not bias overall MT architecture (Figure S4 F) nor impair oocyte development and fertility (Figure S4 G and Table 1).
Inconsistency of Khc^MutEns rescueThe Khc^MutEns variant partially rescues cortical MT formation and restores a slow but measurable cytoplasmic flow yet it fails to rescue Staufen localization (Fig. 5). This raises questions about the consistency and completeness of the rescue. Could the authors clarify this discrepancy or propose a mechanistic rationale?
This is a good point. The cytoplasmic flows (the consequence of cargo transport by Khc on MTs) generated by a constitutively active KhcMutEns in an ens mutant condition, are less efficient than those driven by Khc activated by Ens in a control condition (Figure 6C). The rescued flow is probably not efficient enough to completely rescue the Staufen localization at stage 10.
Additionally, this KhcMutEns variant rescues the viability of embryos from Khc27 mutant germline clones oocytes but not from ens mutants (Table1). One hypothesis is that Ens harbors additional functions beyond Khc activation.
This incomplete rescue of Ens by an active Khc variant could also be the consequence of the “paradox of co-dependence”: Kinesin-1 also transport the antagonizing motor Dynein that promotes cargo transport in opposite directions (Hancock et al., 2016). The phenotype of a gain of function variant is therefore complex to interpret. Consistent with this, both KhcMutEns-GFP and KhcDhinge2 two active Khc only rescues partially centrosome transport in ens mutant Neural Stem Cells (Figure S10).
Minor points: 1. The pUbi-attB-Khc-GFP vector was used to generate the Khc^MutEns transgenic line, presumably under control of the ubiquitous ubi promoter. Could the authors specify which attP landing site was used? Additionally, are the transgenic flies viable and fertile, given that Kinesin-1 is hyperactive in this construct?
All transgenic constructs were integrated at defined genomic landing sites to ensure controlled expression levels. Specifically, both GFP-tagged KhcWT and KhcMutEns were inserted at the VK05 (attP9A) site using PhiC31-mediated integration. Full details of the landing sites are provided in the Materials and Methods section. Both transgenic flies are homozygous lethal and the transgenes are maintained over TM6B balancers.
On page 11 (Discussion, section titled "A dual Ensconsin oocyte enrichment mechanism achieves spatial relief of Khc inhibition"), the statement "many mutations in Kif5A are causal of human diseases" would benefit from a brief clarification. Since not all readers may be familiar with kinesin gene nomenclature, please indicate that KIF5A is one of the three human homologs of Kinesin heavy chain.
We clarified this point in the revised version (lane 465-466).
On page 16 (Materials and Methods, "Immunofluorescence in fly ovaries"), the sentence "Ovaries were mounted on a slide with ProlonGold medium with DAPI (Invitrogen)" should be corrected to "ProLong Gold."
This is corrected.
Significance
This study shows that enrichment of MAP7/ensconsin in the oocyte is the mechanism of kinesin-1 activation there and is important for cytoplasmic streaming and localization non-centrosomal microtubule-organizing centers to the oocyte cortex
We thank the reviewers for the accurate review of our manuscript and their positive feed-back.
Reviewer #3
Evidence, reproducibility and clarity
The manuscript of Berisha et al., investigates the role of Ensconsin (Ens), Kinesin-1 and Ninein in organisation of microtubules (MT) in Drosophila oocyte. At stage 9 oocytes Kinesin-1 transports oskar mRNA, a posterior determinant, along MT that are organised by ncMTOCs. At stage 10b, Kinesin-1 induces cytoplasmic advection to mix the contents of the oocyte. Ensconsin/Map7 is a MT associated protein (MAP) that uses its MT-binding domain (MBD) and kinesin binding domain (KBD) to recruit Kinesin-1 to the microtubules and to stimulate the motility of MT-bound Kinesin-1. Using various new Ens transgenes, the authors demonstrate the requirement of Ens MBD and Ninein in Ens localisation to the oocyte where Ens activates Kinesin-1 using its KBD. The authors also claim that Ens, Kinesin-1 and Ninein are required for the accumulation of ncMTOCs at the oocyte cortex and argue that the detachment of the ncMTOCs from the cortex accounts for the reduced localisation of oskar mRNA at stage 9 and the lack of cytoplasmic streaming at stage 10b. Although the manuscript contains several interesting observations, the authors' conclusions are not sufficiently supported by their data. The structure function analysis of Ensconsin (Ens) is potentially publishable, but the conclusions on ncMTOC anchoring and cytoplasmic streaming not convincing.
We are grateful that the regulation of Khc activity by MAP7 was well received by all reviewers. While our study focuses on Drosophila oogenesis, we believe this mechanism may have broader implications for understanding kinesin regulation across biological systems.
For the novel function of the MAP7/Khc complex in organizing its own microtubule networks through ncMTOC recruitment, we have carefully considered the reviewers' constructive recommendations. We now provide additional experimental evidence supporting a model of flux self-amplification in which ncMTOC recruitment plays a key role. It is well established that cytoplasmic flows are essential for posterior localization of cell fate determinants at stage 10B. Slow flows have also been described at earlier oogenesis stages by the groups of Saxton and St Johnston. Building on these early publications and our new experiments, we propose that these flows are essential to promote a positive feedback loop that reinforces ncMTOC recruitment and MT organization (Figure 7).
1) The main conclusion of the manuscript is that "MT advection failure in Khc and ens in late oogenesis stems from defective cortical ncMTOCs recruitment". This completely overlooks the abundant evidence that Kinesin-1 directly drives cytoplasmic streaming by transporting vesicles and microtubules along microtubules, which then move the cytoplasm by advection (Palacios et al., 2002; Serbus et al, 2005; Lu et al, 2016). Since Kinesin-1 generates the flows, one cannot conclude that the effect of khc and ens mutants on cortical ncMTOC positioning has any direct effect on these flows, which do not occur in these mutants.
We regret the lack of clarity of the first version of the manuscript and some missing references. We propose a model in which the Kinesin-1- dependent slow flows (described by Serbus/Saxton and Palacios/StJohnston) play a central role in amplifying ncMTOC anchoring and cortical MT network formation (see model in the new Figure 7).
2) The authors claim that streaming phenotypes of ens and khs mutants are due to a decrease in microtubule length caused by the defective localisation of ncMTOCs. In addition to the problem raised above, However, I am not convinced that they can make accurate measurements of microtubule length from confocal images like those shown in Figure 4. Firstly, they are measuring the length of bundles of microtubules and cannot resolve individual microtubules. This problem is compounded by the fact that the microtubules do not align into parallel bundles in the mutants. This will make the "microtubules" appear shorter in the mutants. In addition, the alignment of the microtubules in wild-type allows one to choose images in which the microtubule lie in the imaging plane, whereas the more disorganized arrangement of the microtubules in the mutants means that most microtubules will cross the imaging plane, which precludes accurate measurements of their length.
As mentioned by Reviewer 4, we have been transparent with the methodology, and the limitations that were fully described in the material and methods section.
Cortical microtubules in oocytes are highly dynamic and move rapidly, making it technically impossible to capture their entire length using standard Z-stack acquisitions. We therefore adopted a compromise approach: measuring microtubules within a single focal plane positioned just below the oocyte cortex. This strategy is consistent with established methods in the field, such as those used by Parton et al. (2011) to track microtubule plus-end directionality. To avoid overinterpretation, we explicitly refer to these measurements as "minimum detectable MT length," acknowledging that microtubules may extend beyond the focal plane, particularly at stage 10, where long, tortuous bundles frequently exit the plane of focus. These methodological considerations and potential biases are clearly described in the Materials and Methods section and the text now mentions the possible disorganization of the MT network in the mutant conditions (lane 272-273).
In this revised version, we now provide complementary analyses of MT network organization.Beyond length measurements (and the mentioned limitations), we also quantified microtubule network orientation at stage 9, assessing whether cortical microtubules are preferentially oriented toward the posterior axis as observed in controls (revised Figure 3D and Figure 5B). While this analysis is also subject to the same technical limitations, it reveals a clear biological difference: microtubules exhibit posterior-biased orientation in control oocytes similar to a previous study (Parton et al., 2011) but adopt a randomized orientation in Nin-/-, ens, and Khc RNAi-depleted oocytes (revised Figure 3D and Figure 5B).
Taken together, these complementary approaches, despite their technical constraints, provide convergent evidence for the role of the Khc/Ens complex in organizing cortical microtubule networks during oogenesis.
3) "To investigate whether the presence of these short microtubules in ens and Khc RNAi oocytes is due to defects in microtubule anchoring or is also associated with a decrease in microtubule polymerization at their plus ends, we quantified the velocity and number of EB1comets, which label growing microtubule plus ends (Figure S3)." I do not understand how the anchoring or not of microtubule minus ends to the cortex determines how far their plus ends grow, and these measurements fall short of showing that plus end growth is unaffected. It has already been shown that the Kinesin-1-dependent transport of Dynactin to growing microtubule plus ends increases the length of microtubules in the oocyte because Dynactin acts as an anti-catastrophe factor at the plus ends. Thus, khc mutants should have shorter microtubules independently of any effects on ncMTOC anchoring. The measurements of EB1 comet speed and frequency in FigS2 will not detect this change and are not relevant for their claims about microtubule length. Furthermore, the authors measured EB1 comets at stage 9 (where they did not observe short MT) rather than at stage 10b. The authors' argument would be better supported if they performed the measurements at stage 10b.
We thank the reviewer for raising this important point. The short microtubule (MT) length observed at stage 10B could indeed result from limited plus-end growth. Unfortunately, we were unable to test this hypothesis directly: strong endogenous yolk autofluorescence at this stage prevented reliable detection of Eb1-GFP comets, precluding velocity measurements.
At least during stage 9, our data demonstrate that MT nucleation and polymerization rates are not reduced in both KhcRNAi and ens mutant conditions, indicating that the observed MT alterations must arise through alternative mechanisms.
In the discussion, we propose the following interconnected explanations, supported by recent literature and the reviewers’ suggestions:
1- Reduced MT rescue events. Two seminal studies from the Verhey and Aumeier laboratories have shown that constitutively active Kinesin-1 induces MT lattice damage (Budaitis et al., 2022), which can be repaired through GTP-tubulin incorporation into "rescue shafts" that promote MT rescue (Andreu-Carbo et al., 2022). Extrapolating from these findings, loss of Kinesin-1 activity could plausibly reduce rescue shaft formation, thereby decreasing MT stability. While challenging to test directly in our system, this mechanism provides a plausible framework for the observed phenotype.
2- Impaired transport of stabilizing factors. As that reviewer astutely points out, Khc transports the dynactin complex, an anti-catastrophe factor, to MT plus ends (Nieuwburg et al., 2017). Loss of this transport could further compromise MT plus end stability. We now discuss this important mechanism in the revised manuscript.
3- Loss of cortical ncMTOCs. Critically, our new quantitative analyses (revised Figure 3 and Figure 5) also reveal defective anteroposterior orientation of cortical MTs in mutant conditions. These experiments suggest that Ens/Khc-mediated localization of ncMTOCs to the cortex is essential for proper MT network organization, and possibly minus-end stabilization as suggested in several studies (Feng et al., 2019, Goodwin and Vale, 2011, Nashchekin et al., 2016).
Altogether, we now propose an integrated model in which MT reduction and disorganization may result from multiple complementary mechanisms operating downstream of Kinesin-1/Ensconsin loss. While some aspects remain difficult to test directly in our in vivo system, the convergence of our data with recent mechanistic studies provides an interesting conceptual framework. The Discussion has been revised to reflect this comprehensive view in a dedicated paragraph (“A possible regulation of MT dynamics in the oocyte at both plus end minus MT ends by Ens and Khc” lane 415-432).
4) The Shot overexpression experiments presented in Fig.3 E-F, Fig.4D and TableS1 are very confusing. Originally , the authors used Shot-GFP overexpression at stage 9 to show that there is a decrease of ncMTOCs at the cortex in ens mutants (Fig.3 E-F) and speculated that this caused the defects in MT length and cytoplasmic advection at stage 10B. However the authors later state on page 8 that : "Shot overexpression (Shot OE) was sufficient to rescue the presence of long cortical MTs and ooplasmic advection in most ens oocytes (9/14), resembling the patterns observed in controls (Figures 4B right panel and 4D). Moreover, while ens females were fully sterile, overexpression of Shot was sufficient to restore that loss of fertility (Table S1)". Is this the same UAS Shot-GFP and VP16 Gal4 used in both experiments? If so, this contradictions puts the authors conclusions in question.
This is an important point that requires clarification regarding our experimental design.
The Shot-YFP construct is a genomic insertion on chromosome 3. The ens mutation is also located on chromosome 3 and we were unable to recombine this transgene with the ens mutant for live quantification of cortical Shot. To circumvent this technical limitation, we used a UAS-Shot.L(C)-GFP transgenic construct driven by a maternal driver, expressed in both wild-type (control) and ens mutant oocytes. We validated that the expression level and subcellular localization of UAS-Shot.L(C)-GFP were comparable to those of the genomic Shot-YFP (new Figure S8 A and B).
From these experiments, we drew two key conclusions. First, cortical Shot.L(C)-GFP is less abundant in ens mutant oocytes compared to wild-type (the quantification has been removed from this version). Second, despite this reduced cortical accumulation, Shot.L(C)-GFP expression partially rescues ooplasmic flows and microtubule streaming in stage 10B ens mutant oocytes, and restores fertility to ens mutant females.
5) The authors based they conclusions about the involvement of Ens, Kinesin-1 and Ninein in ncMTOC anchoring on the decrease in cortical fluorescence intensity of Shot-YFP and Patronin-YFP in the corresponding mutant backgrounds. However, there is a large variation in average Shot-YFP intensity between control oocytes in different experiments. In Fig. 2F-G the average level of Shot-YFP in the control sis 130 AU while in Fig.3 G-H it is only 55 AU. This makes me worry about reliability of such measurements and the conclusions drawn from them.
To clarify this point, we have harmonized the method used to quantify the Shot-YFP signals in Figure 4E with the methodology used in Figure 3B, based on the original images. The levels are not strictly identical (Control Figure 2 B: 132.7+/-36.2 versus Control Figure 4 E: 164.0+/- 37.7). These differences are usual when experiments are performed at several-month intervals and by different users.
6) The decrease in the intensity of Shot-YFP and Patronin-YFP cortical fluorescence in ens mutant oocytes could be because of problems with ncMTOC anchoring or with ncMTOCs formation. The authors should find a way to distinguish between these two possibilities. The authors could express Ens-Mut (described in Sung et al 2008), which localises at the oocyte posterior and test whether it recruits Shot/Patronin ncMTOCs to the posterior.
We tried to obtain the fly stocks described in the 2008 paper by contacting former members of Pernille Rørth's laboratory. Unfortunately, we learned that the lab no longer exists and that all reagents, including the requested stocks, were either discarded or lost over time. To our knowledge, these materials are no longer available from any source. We regret that this limitation prevented us from performing the straightforward experiments suggested by the reviewer using these specific tools.
7) According to the Materials and Methods, the Shot-GFP used in Fig.3 E-F and Fig.4 was the BDSC line 29042. This is Shot L(C), a full-length version of Shot missing the CH1 actin-binding domain that is crucial for Shot anchoring to the cortex. If the authors indeed used this version of Shot-GFP, the interpretation of the above experiments is very difficult.
The Shot.L(C) isoform lacks the CH1 domain but retains the CH2 actin-binding motif. Truncated proteins with this domain and fused to GST retains a weak ability to bind actin in vitro. Importantly, the function of this isoform is context-dependent: it cannot rescue shot loss-of-function in neuron morphogenesis but fully restores Shot-dependent tracheal cell remodeling (Lee and Kolodziej, 2002).
In our experiments, when the Shot.L(C) isoform was expressed under the control of a maternal driver, its localization to the oocyte cortex was comparable to that of the genomic Shot-YFP construct (new Figure S8). This demonstrates unambiguously that the CH1 domain is dispensable for Shot cortical localization in oocytes, and that CH2-mediated actin binding is sufficient for this localization. Of note, a recent study showed that actin network are not equivalent highlighting the need for specific Shot isoforms harboring specialized actin-binding domain (Nashchekin et al., 2024).
We note that the expression level of Shot.L(C)-GFP in the oocyte appeared slightly lower than that of Shot-YFP (expressed under endogenous Shot regulatory sequences), as assessed by Western blot (Figure S8 A).
Critically, Shot.L(C)-GFP expression was substantially lower than that of Shot.L(A)-GFP (that harbored both the CH1 and CH2 domain). Shot.L(A)-GFP was overexpressed (Figure 8 A) and ectopically localized on MTs in both nurse cells and the ooplasm (Figure S8 B middle panel and arrow). These observations are in agreement that the Shot.L(C)-GFP rescue experiment was performed at near-physiological expression levels, strengthening the validity of our conclusions.
8) Page 6 "converted in NCs, in a region adjacent to the ring canals, Dendra-Ens-labeled MTs were found in the oocyte compartment indicating they are able to travel from NC toward the oocyte through ring canals". I have difficulty seeing the translocation of MT through the ring canals. Perhaps it would be more obvious with a movie/picture showing only one channel. Considering that f Dendra-Ens appears in the oocyte much faster than MT transport through ring canals (140nm/s, Lu et al 2022), the authors are most probably observing the translocation of free Ens rather than Ens bound to MT. The authors should also mention that Ens movement from the NC to the oocyte has been shown before with Ens MBD in Lu et al 2022 with better resolution.
We fully agree on the caveat mentioned by this reviewer: we may observe the translocation of free Dendra-Ensconsin. The experiment, was removed and replaced by referring to the work of the Gelfand lab. The movement of MTs that travel at ~140 nm/s between nurse cells toward the oocyte through the Ring Canals was reported before by Lu et al. (2022) with a very good resolution. Notably, this directional directed movement of MTs was measured using a fusion protein encompassing Ens MT-binding domain. We decided to remove this inclusive experiment and rather refer to this relevant study.
9) Page 6: The co-localization of Ninein with Ens and Shot at the oocyte cortex (Figure 2A). I have difficulty seeing this co-localisation. Perhaps it would be more obvious in merged images of only two channels and with higher resolution images
10) "a pool of the Ens-GFP co-localized with Ch-Patronin at cortical ncMTOCs at the anterior cortex (Figure 3A)". I also have difficulty seeing this.
We have performed new high-resolution acquisitions that provide clearer and more convincing evidence for the localization cortical distribution of these proteins (revised Figure 2A-2C and Figure 4A). These improved images demonstrate that Ens, Ninein, Shot, and Patronin partially colocalize at cortical ncMTOCs, as initially proposed. Importantly, the new data also reveal a spatial distinction: while Ens localizes along microtubules extending from these cortical sites, Ninein appears confined to small cytoplasmic puncta adjacent but also present on cortical microtubules.
11) "Ninein co-localizes with Ens at the oocyte cortex and partially along cortical microtubules, contributing to the maintenance of high Ens protein levels in the oocyte and its proper cortical targeting". I could not find any data showing the involvement of Ninein in the cortical targeting of Ens.
We found decreased Ens localization to MTs and to the cell cortex region (new Figure S3 A-B).
12) "our MT network analyses reveal the presence of numerous short MTs cytoplasmic clustered in an anterior pattern." "This low cortical recruitment of ncMTOCs is consistent with poor MT anchoring and their cytoplasmic accumulation." I could not find any data showing that short cortical MT observed at stage 10b in ens mutant and Khc RNAi were cytoplasmic and poorly anchored.
The sentence was removed from the revised manuscript.
13) "The egg chamber consists of interconnected cells where Dynein and Khc activities are spatially separated. Dynein facilitates transport from NCs to the oocyte, while Khc mediates both transport and advection within the oocyte." Dynein is involved in various activities in the oocyte. It anchors the oocyte nucleus and transports bcd and grk mRNA to mention a few.
The text was amended to reflect Dynein involvement in transport activities in the oocyte, with the appropriate references (lane 105-107).
14) The cartoons in Fig.2H and 3I exaggerate the effect of Ninein and Ens on cortical ncMTOCs. According to the corresponding graphs, there is a 20 and 50% decrease in each case.
New cartoons (now revised Figure 3E and 4F), are amended to reflect the ncMTOC values but also MT orientation (Figure 3E).
Significance
Given the important concerns raised, the significance of the findings is difficult to assess at this stage.
We sincerely thank the reviewer for their thorough evaluation of our manuscript. We have carefully addressed their concerns through substantial new experiments and analyses. We hope that the revised manuscript, in its current form, now provides the clarifications and additional evidence requested, and that our responses demonstrate the significance of our findings.
Reviewer #4 (Evidence, reproducibility and clarity (Required)):
Summary: This manuscript presents an investigation into the molecular mechanisms governing spatial activation of Kinesin-1 motor protein during Drosophila oogenesis, revealing a regulatory network that controls microtubule organization and cytoplasmic transport. The authors demonstrate that Ensconsin, a MAP7 family protein and Kinesin-1 activator, is spatially enriched in the oocyte through a dual mechanism involving Dynein-mediated transport from nurse cells and cortical maintenance by Ninein. This spatial enrichment of Ens is crucial for locally relieving Kinesin-1 auto-inhibition. The Ens/Khc complex promotes cortical recruitment of non-centrosomal microtubule organizing centers (ncMTOCs), which are essential for anchoring microtubules at the cortex, enabling the formation of long, parallel microtubule streams or "twisters" that drive cytoplasmic advection during late oogenesis. This work establishes a paradigm where motor protein activation is spatially controlled through targeted localization of regulatory cofactors, with the activated motor then participating in building its own transport infrastructure through ncMTOC recruitment and microtubule network organization.
There's a lot to like about this paper! The data are generally lovely and nicely presented. The authors also use a combination of experimental approaches, combining genetics, live and fixed imaging, and protein biochemistry.
We thank the reviewer for this enthusiastic and supportive review, which helped us further strengthen the manuscript.
Concerns: Page 6: "to assay if elevation of Ninein levels was able to mis-regulate Ens localization, we overexpressed a tagged Ninein-RFP protein in the oocyte. At stage 9 the overexpressed Ninein accumulated at the anterior cortex of the oocyte and also generated large cortical aggregates able to recruit high levels of Ens (Figures 2D and 2H)... The examination of Ninein/Ens cortical aggregates obtained after Ninein overexpression showed that these aggregates were also able to recruit high levels of Patronin and Shot (Figures 2E and 2H)." Firstly, I'm not crazy about the use of "overexpressed" here, since there isn't normally any Ninein-RFP in the oocyte. In these experiments it has been therefore expressed, not overexpressed. Secondly, I don't understand what the reader is supposed to make of these data. Expression of a protein carrying a large fluorescent tag leads to large aggregates (they don't look cortical to me) that include multiple proteins - in fact, all the proteins examined. I don't understand this to be evidence of anything in particular, except that Ninein-RFP causes the accumulation of big multi-protein aggregates. While I can understand what the authors were trying to do here, I think that these data are inconclusive and should be de-emphasized.
We have revised the manuscript by replacing overexpressed with expressed (lanes 211 and 212). In addition, we now provide new localization data in both cortical (new Figure S4 A, top) and medial focal planes (new Figure S4 A, bottom), demonstrating that Ninein puncta (the word used in Rosen et al, 2019), rather than aggregates are located cortically. We also show that live IRP-labelled MTs do not colocalize with Ninein-RFP puncta. In light of the new experiments and the comments from the other reviewers, the corresponding text has been revised and de-emphasized accordingly.
Page 7: "Co-immunoprecipitations experiments revealed that Patronin was associated with Shot-YFP, as shown previously (Nashchekin et al., 2016), but also with EnsWT-GFP, indicating that Ens, Shot and Patronin are present in the same complex (Figure 3B)." I do not agree that association between Ens-GFP and Patronin indicates that Ens is in the same complex as Shot and Patronin. It is also very possible that there are two (or more) distinct protein complexes. This conclusion could therefore be softened. Instead of "indicating" I suggest "suggesting the possibility."
We have toned down this conclusion and indicated “suggesting the possibility” (lane 238-239).
Page 7: "During stage 9, the average subcortical MT length, taken at one focal plane in live oocytes (see methods)..." I appreciate that the authors have been careful to describe how they measured MT length, as this is a major point for interpretation. I think the reader would benefit from an explanation of why they decided to measure in only one focal plane and how that decision could impact the results.
We appreciate this helpful suggestion. Cortical microtubules are indeed highly dynamic and extend in multiple directions, including along the Z-axis. Moreover, their diameter is extremely small (approximately 25 nm), making it technically challenging to accurately measure their full length with high resolution using our Zeiss Airyscan confocal microscope (over several, microns): the acquisition of Z-stacks is relatively slow and therefore not well suited to capturing the rapid dynamics of these microtubules. Consequently, our length measurements represent a compromise and most likely underestimate the actual lengths of microtubules growing outside the focal plane. We note that other groups have encountered similar technical limitations (Parton et al., 2011).
Page 7: "... the MTs exhibited an orthogonal orientation relative to the anterior cortex (Figures 4A left panels, 4C and 4E)." This phenotype might not be obvious to readers. Can it be quantified?
We have now analyzed the orientation of microtubules (MTs) along the dorso-ventral axis. Our analysis shows that ens, Khc RNAi oocytes (new Figure 5B), and, to a lesser extent, Nin mutant oocytes (new Figure 3D), display a more random MT orientation compared to wild-type (WT) oocytes. In WT oocytes, MTs are predominantly oriented toward the posterior pole, consistent with previous findings (Parton et al., 2011).
Page 8: "Altogether, the analyses of Ens and Khc defective oocytes suggested that MT organization defects during late oogenesis (stage 10B) were caused by an initial failure of ncMTOCs to reach the cell cortex. Therefore, we hypothesized that overexpression of the ncMTOC component Shot could restore certain aspects of microtubule cortical organization in ens-deficient oocytes. Indeed, Shot overexpression (Shot OE) was sufficient to rescue the presence of long cortical MTs and ooplasmic advection in most ens oocytes (9/14)..." The data are clear, but the explanation is not. Can the authors please explain why adding in more of an ncMTOC component (Shot) rescues a defect of ncMTOC cortical localization?
We propose that cytoplasmic ncMTOCs can bind the cell cortex via the Shot subunit that is so far the only component that harbors actin-binding motifs. Therefore, we propose that elevating cytoplasmic Shot increase the possibility of Shot to encounter the cortex by diffusion when flows are absent. This is now explained lane 282-285.
I'm grateful to the authors for their inclusion of helpful diagrams, as in Figures 1G and 2H. I think the manuscript might benefit from one more of these at the end, illustrating the ultimate model.
We have carefully considered and followed the reviewer’s suggestions. In response, we have included a new figure illustrating our proposed model: the recruitment of ncMTOCs to the cell cortex through low Khc-mediated flows at stage 9 enhances cortical microtubule density, which in turn promotes self-amplifying flows (new Figure 7, panels A to C). Note that this Figure also depicts activation of Khc by loss of auto-inhibition (Figure 7, panel D).
I'm sorry to say that the language could use quite a bit of polishing. There are missing and extraneous commas. There is also regular confusion between the use of plural and singular nouns. Some early instances include:
- Page 3: thought instead of "thoughted."
- Page 5: "A previous studies have revealed"
- Page 5: "A significantly loss"
- Page 6: "troughs ring canals" should be "through ring canals"
- Page 7: lives stage 9 oocytes
- Page 7: As ens and Khc RNAi oocytes exhibits
- Page 7: we examined in details
- Page 7: This average MT length was similar in Khc RNAi and ens mutant oocyte..
We apologize for errors. We made the appropriate corrections of the manuscript.
Reviewer #4 (Significance (Required)):
This work makes a nice conceptual advance by showing that motor activation controls its own transport infrastructure, a paradigm that could extend to other systems requiring spatially regulated transport.
We thank the reviewers for their evaluation of the manuscript and helpful comments.
Note: This preprint has been reviewed by subject experts for Review Commons. Content has not been altered except for formatting.
Learn more at Review Commons
Summary: This manuscript presents an investigation into the molecular mechanisms governing spatial activation of Kinesin-1 motor protein during Drosophila oogenesis, revealing a regulatory network that controls microtubule organization and cytoplasmic transport. The authors demonstrate that Ensconsin, a MAP7 family protein and Kinesin-1 activator, is spatially enriched in the oocyte through a dual mechanism involving Dynein-mediated transport from nurse cells and cortical maintenance by Ninein. This spatial enrichment of Ens is crucial for locally relieving Kinesin-1 auto-inhibition. The Ens/Khc complex promotes cortical recruitment of non-centrosomal microtubule organizing centers (ncMTOCs), which are essential for anchoring microtubules at the cortex, enabling the formation of long, parallel microtubule streams or "twisters" that drive cytoplasmic advection during late oogenesis. This work establishes a paradigm where motor protein activation is spatially controlled through targeted localization of regulatory cofactors, with the activated motor then participating in building its own transport infrastructure through ncMTOC recruitment and microtubule network organization.
There's a lot to like about this paper! The data are generally lovely and nicely presented. The authors also use a combination of experimental approaches, combining genetics, live and fixed imaging, and protein biochemistry.
Concerns:
Page 6: "to assay if elevation of Ninein levels was able to mis-regulate Ens localization, we overexpressed a tagged Ninein-RFP protein in the oocyte. At stage 9 the overexpressed Ninein accumulated at the anterior cortex of the oocyte and also generated large cortical aggregates able to recruit high levels of Ens (Figures 2D and 2H)... The examination of Ninein/Ens cortical aggregates obtained after Ninein overexpression showed that these aggregates were also able to recruit high levels of Patronin and Shot (Figures 2E and 2H)." Firstly, I'm not crazy about the use of "overexpressed" here, since there isn't normally any Ninein-RFP in the oocyte. In these experiments it has been therefore expressed, not overexpressed. Secondly, I don't understand what the reader is supposed to make of these data. Expression of a protein carrying a large fluorescent tag leads to large aggregates (they don't look cortical to me) that include multiple proteins - in fact, all the proteins examined. I don't understand this to be evidence of anything in particular, except that Ninein-RFP causes the accumulation of big multi-protein aggregates. While I can understand what the authors were trying to do here, I think that these data are inconclusive and should be de-emphasized.
Page 7: "Co-immunoprecipitations experiments revealed that Patronin was associated with Shot-YFP, as shown previously (Nashchekin et al., 2016), but also with EnsWT-GFP, indicating that Ens, Shot and Patronin are present in the same complex (Figure 3B)." I do not agree that association between Ens-GFP and Patronin indicates that Ens is in the same complex as Shot and Patronin. It is also very possible that there are two (or more) distinct protein complexes. This conclusion could therefore be softened. Instead of "indicating" I suggest "suggesting the possibility."
Page 7: "During stage 9, the average subcortical MT length, taken at one focal plane in live oocytes (see methods)..." I appreciate that the authors have been careful to describe how they measured MT length, as this is a major point for interpretation. I think the reader would benefit from an explanation of why they decided to measure in only one focal plane and how that decision could impact the results.
Page 7: "... the MTs exhibited an orthogonal orientation relative to the anterior cortex (Figures 4A left panels, 4C and 4E)." This phenotype might not be obvious to readers. Can it be quantified?
Page 8: "Altogether, the analyses of Ens and Khc defective oocytes suggested that MT organization defects during late oogenesis (stage 10B) were caused by an initial failure of ncMTOCs to reach the cell cortex. Therefore, we hypothesized that overexpression of the ncMTOC component Shot could restore certain aspects of microtubule cortical organization in ens-deficient oocytes. Indeed, Shot overexpression (Shot OE) was sufficient to rescue the presence of long cortical MTs and ooplasmic advection in most ens oocytes (9/14)..." The data are clear, but the explanation is not. Can the authors please explain why adding in more of an ncMTOC component (Shot) rescues a defect of ncMTOC cortical localization?
I'm grateful to the authors for their inclusion of helpful diagrams, as in Figures 1G and 2H. I think the manuscript might benefit from one more of these at the end, illustrating the ultimate model.
I'm sorry to say that the language could use quite a bit of polishing. There are missing and extraneous commas. There is also regular confusion between the use of plural and singular nouns. Some early instances include:
This work makes a nice conceptual advance by showing that motor activation controls its own transport infrastructure, a paradigm that could extend to other systems requiring spatially regulated transport.
Author response:
The following is the authors’ response to the original reviews.
Reviewer #1 (Public Review):
Strengths:
The work uses a simple and straightforward approach to address the question at hand: is dynein a processive motor in cells? Using a combination of TIRF and spinning disc confocal microscopy, the authors provide a clear and unambiguous answer to this question.
Thank you for the recognition of the strength of our work
Weaknesses:
My only significant concern (which is quite minor) is that the authors focus their analysis on dynein movement in cells treated with docetaxol, which could potentially affect the observed behavior. However, this is likely necessary, as without it, motility would not have been observed due to the 'messiness' of dynein localization in a typical cell (e.g., plus end-tracking in addition to cargo transport).
You are exactly correct that this treatment was required to provided us a clear view of motile dynein and p50 puncta. One concern about the treatment that we had noted in our original submission was that the docetaxel derivative SiR tubulin could increase microtubule detyrosination, which has been implicated in affecting the initiation of dynein-dynactin motility but not motility rates (doi: 10.15252/embj.201593071). In response to a comment from reviewer 2 we investigated whether there was a significant increase in alpha-tubulin detyrosination in our treatment conditions and found that there was not. We have removed the discussion of this possibility from the revised version. Please also see response to comments raised by reviewer 2.
Reviewer 1 (Recommendations for the authors):
Major points:
(1) The authors measured kinesin-1-GFP intensities in a different cell line (drosophila S2 cells) than what was used for the DHC and p50 measurements (HeLa cells). It is unclear if this provides a fair comparison given the cells provide different environments for the GFP. Although the differences may in fact be trivial, without somehow showing this is indeed a fair comparison, it should at least be noted as a caveat when interpreting relative intensity differences. Alternatively, the authors could compare DHC and p50 intensities to those measured from HeLa cells treated with taxol.
Thank you for this suggestion. We conducted new rounds of imaging with the DHCEGFP and p50-EGFP clones in conjunction with HeLa cells transiently expressing the human kinesin-1-EGFP and now present the datasets from the new experiments. Importantly, our new data was entirely consistent with the prior analyses as there was not a significant difference between the kinesin-1-EGFP dimer intensities and the DHC-EGFP puncta intensities and there was a statistically significant difference in the intensity of p50 puncta, which were approximately half the intensity of the kinesin-1 and DHC. We have moved the old data comparing the intensities in S2 cells expressing kinesin-1-EGFP to Figure 3 - figure supplement 2 A-D and the new HeLa cell data is now shown in Figure 3 D-G.
(2) Given the low number of observations (41-100 puncta), I think a scatter plot showing all data points would offer readers a more transparent means of viewing the single-molecule data presented in Figures 3A, B, C, and G. I also didn't see 'n' values for plots shown in Figure 3.
The box and whisker plots have now been replaced with scatter plots showing all data points. The accompanying ‘n’ values have been included in the figure 3 legend as well as the histograms in figures 1 and 2 that are represented in the comparative scatter plots.
(3) Given the authors have produced a body of work that challenges conclusions from another pre-print (Tirumala et al., 2022 bioRxiv) - specifically, that dynein is not processive in cells - I think it would be useful to include a short discussion about how their work challenges theirs. For example, one significant difference between the two experimental systems that may account for the different observations could simply be that the authors of the Tirumala study used a mouse DHC (in HeLa cells), which may not have the ability to assemble into active and processive dynein-dynactin-adaptor complexes.
Thank you for pointing this out! At the time we submitted our manuscript we were conflicted about citing a pre-print that had not been peer reviewed simply to point out the discrepancy. If we had done so at that time we would have proposed the exact potential technical issue that you have proposed here. However, at the time we felt it would be better for these issues to be addressed through the review process. Needless to say, we agree with your interpretation and now that the work is published (Tirumala et al. JCB, 2024) it is entirely appropriate to add a discussion on Tirumala et al. where contradictory observations were reported.
The following statement has been added to the manuscript:
“In contrast, a separate study (Tirumala et al., 2024) reported that dynein is not highly processive, typically exhibiting runs of very short duration (~0.6 s) in HeLa cells. A notable technical difference that may account for this discrepancy is that our study visualizes endogenously tagged human DHC, whereas Tirumala et al. characterized over-expressed mouse DHC in HeLa cells. Over-expression of the DHC may result in an imbalance of the subunits that comprise the active motor complex, leading to inactive, or less active complexes. Similarly, mouse DHC may not have the ability to efficiently assemble into active and processive dynein-dynactin-adaptor complexes to the same extent as human DHC.”
Minor points:
(1) "Specifically, the adaptor BICD2 recruited a single dynein to dynactin while BICDR1 and HOOK3 supported assembly of a "double dynein" complex." It would be more accurate to say that dynein-dynactin complexes assembled with Bicd2 "tend to favor single dynein, and the Bicdr1 and Hook3 tend to favor two dyneins" since even Bicd2 can support assembly of 2 dynein-1 dynactin complexes (see Urnavicius et al, Nature 2018).
Thank you, the manuscript has been edited to reflect this point.
(2) "Human HeLa cells were engineered using CRISPR/Cas9 to insert a cassette encoding FKBP and EGFP tags in the frame at the 3' end of the dynein heavy chain (DYNC1H1) gene (SF1)." It is unclear to what "SF1" is referring.
SF1 is supplementary figure 1, which we have now clarified as being Figure 1 – figure supplement 1A.
(3) "The SiR-Tubulin-treated cells were subjected to two-color TIRFM to determine if the DHC puncta exhibited motility and; indeed, puncta were observed streaming along MTs..." This sentence is strangely punctuated (the ";" is likely a typo?).
Thank you for pointing this out, the typo has been corrected and the sentence now reads:
“The SiR-Tubulin-treated cells were subjected to two-color TIRFM and DHC-EGFP puncta were clearly observed streaming on Sir-Tubulin labeled MTs, which was especially evident on MTs that were pinned between the nucleus and the plasma membrane (Video 3)”
(4) I am unfamiliar with the "MK" acronym shown above the molecular weight ladders in Figure 3H and I. Did the authors mean to use "MW" for molecular weight?
We intended this to mean MW and the typo has been corrected.
(5) "This suggests that the cargos, which we presume motile dynein-dynactin puncta are bound to, any kinesins..." This sentence is confusing as written. Did the authors mean "and kinesins"?
Agreed. We have changed this sentence to now read:
“The velocity and low switching frequency of motile puncta suggest that any kinesin motors associated with cargos being transported by the dynein-dynactin visualized here are inactive and/or cannot effectively bind the MT lattice during dynein-dynactin-mediated transport in interphase HeLa cells.”
Reviewer 2 (Recommendations for the authors):
(1) I am confused as to why the authors introduced an FKBP tag to the DHC and no explanation is given. Is it possible this tag induces artificial dimerization of the DHC?
FKBP was tagged to DHC for potential knock sideways experiments. Since the current cell line does not express the FKBP counterpart FRB, having FKBP alone in the cell line would not lead to artificial dimerization of DHC.
(2) The authors use a high concentration of SiR-tubulin (1uM) before washing it out. However, they observe strong effects on MT dynamics. The manufacturer states that concentrations below 100nM don't affect MT dynamics, so I am wondering why the authors are using such a high amount that leads to cellular phenotypes.
We would like to note that in our hands even 100 nM SiR-tubulin impacted MT dynamics if it was incubated for enough time to get a bright signal for imaging, which makes sense since drugs like docetaxel and taxol become enriched in cells over time. Thus, it was a trade-off between the extent/brightness of labeling and the effects on MT dynamics. We opted for shorter incubation with a higher concentration of Sir-Tubulin to achieve rapid MT labeling and efficient suppression of plus-end MT polymerization. This approach proved useful for our needs since the loss of the tip-tacking pool of DHC provided a clearer view of the motile population of MT-associated DHC.
(3) The individual channels should be labeled in the supplemental movies.
They have now been labelled.
(4) I would like to see example images and kymographs of the GFP-Kinesin-1 control used for fluorescent intensity analysis. Further, the authors use the mean of the intensity distribution, but I wonder why they don't fit the distribution to a Gaussian instead, as that seems more common in the field to me. Do the data fit well to a Gaussian distribution?
Example images and kymographs of the kinesin-1-EGFP control HeLa cells used for the updated fluorescent intensity analysis have been now added to the manuscript in Figure 3 - figure supplement 1. The kinesin-1-EGFP transiently expressed in HeLa cells exhibited a slower mean velocity and run length than the endogenously tagged HeLa dynein-dynactin. Regarding the distribution, we applied 6 normality tests to the new datasets acquired with DHC and p50 in comparison to human kinesin-EGFP in HeLa cells. While we are confident concluding that the data for p50 was normally distributed (p > 0.05 in 6/6), it was more difficult to reach conclusions about the normality of the datasets for kinesin-1 (p > 0.05 in 4/6) and DHC (p > 0.5 in 1/6). We have decided to report the data as scatter plots (per the suggestion in major point 1 by reviewer 1) in the new Figure 3G since it could be misleading to fit a non-normal distribution with a single Gaussian. We note that the likely non-normal distribution of the DHC data (since it “passed” only 1/6 normality tests) could reflect the presence of other populations (e.g. 1 DHC-EGFP in a motile puncta), but we could also not confidently conclude this since attempting to fit the data with a double Gaussian did not pass statistical muster. Indeed, as stated in the text, on lines 197-198 we do not exclude that the range of DHC intensities measured here may include sub-populations of complexes containing a single dynein dimer with one DHC-EGFP molecule.
Ultimately, we feel the safest conclusion is that there was not a statically significant difference between the DHC and kinesin-1 dimers (p = 0.32) but there was a statistically significant difference between both the DHC and kinesin-1 dimers compared to the p50 (p values < 0.001), which was ~50% the intensity of DHC and kinesin-1. Altogether this leads us to the fairly conservative conclusion that DHC puncta contain at least one dimer while the p50 puncta likely contain a single p50-EGFP molecule.
(5) The authors suggest the microtubules in the cells treated with SiR-tubulin may be more detyrosinated due to the treatment. Why don't they measure this using well-characterized antibodies that distinguish tyrosinated/detyrosinated microtubules in cells treated or not with SiR-tubulin?
At your suggestion, we carried out the experiment and found that under our labeling conditions there was not a notable difference in microtubule detyrosination between DMSO- and SiR-Tubulin-treated cells. Thus, we have removed this caveat from the revised manuscript.
(6) "While we were unable to assess the relative expression levels of tagged versus untagged DHC for technical reasons." Please describe the technical reasons for the inability to measure DHC expression levels for the reader.
We made several attempts to quantify the relative amounts of untagged and tagged protein by Western blotting. The high molecular weight of DHC (~500kDa) makes it difficult to resolve it on a conventional mini gel. We attempted running a gradient mini gel (4%-15%), and doing a western blot; however, we were still unable to detect DHC. To troubleshoot, the experiments were repeated with different dilutions of a commercially available antibody and varying concentrations of cell lysate; however, we were unable to obtain a satisfactory result.
We hold the view that even if it had it worked it would have been difficult to detect a relatively small difference between the untagged (MW = 500kDa) and tagged DHC (MW = 527kDa) by western blot. We have added language to this effect in the revised manuscript.
Reviewer #3 (Public Review):
(1). CRISPR-edited HeLa clones:
(i) The authors indicate that both the DHC-EGFP and p50-EGFP lines are heterozygous and that the level of DHC-EGFP was not measured due to technical difficulties. However, quantification of the relative amounts of untagged and tagged DHC needs to be performed - either using Western blot, immunofluorescence or qPCR comparing the parent cell line and the cell lines used in this work.
See response to reviewer 2 above.
(ii) The localization of DHC predominantly at the plus tips (Fig. 1A) is at odds with other work where endogenous or close-to-endogenous levels of DHC were visualized in HeLa cells and other non-polarized cells like HEK293, A-431 and U-251MG (e.g.: OpenCell (https://opencell.czbiohub.org/target/CID001880), Human Protein Atlas ), https://www.biorxiv.org/content/10.1101/2021.04.05.438428v3). The authors should perform immunofluorescence of DHC in the parental cells and DHC-EGFP cells to confirm there are no expression artifacts in the latter. Additionally, a comparison of the colocalization of DHC with EB1 in the parental and DHC-EGFP and p50-EGFP lines would be good to confirm MT plus-tip localisation of DHC in both lines.
The microtubule (MT) plus-tip localization of DHC was already observed in the 1990s, as evidenced by publications such as (PMID:10212138) and (PMID:12119357), which were further confirmed by Kobayashi and Murayama in 2009 (PMID:19915671). We hold the view that further investigation into this localization is not worthwhile since the tip-tracking behavior of DHC-dynactin has been long-established in the field.
(iii) It would also be useful to see entire fields of view of cells expressing DHC-EGFP and p50EGFP (e.g. in Spinning Disk microscopy) to understand if there is heterogeneity in expression. Similarly, it would be useful to report the relative levels of expression of EGFP (by measuring the total intensity of EGFP fluorescence per cell) in those cells employed for the analysis in the manuscript.
Representative images of fields have been added as Figure 1 - figure supplement 1B and Figure 2 – figure supplement 1 in the revised manuscript. We did not see drastic cell-tocell variation of expression within the clonal cell lines.
(iv) Given that the authors suspect there is differential gene regulation in their CRISPR-edited lines, it cannot be concluded that the DHC-EGFP and p50-EGFP punctae tracked are functional and not piggybacking on untagged proteins. The authors could use the FKBP part of the FKBPEGFP tag to perform knock-sideways of the DHC and p50 to the plasma membrane and confirm abrogation of dynein activity by visualizing known dynein targets such as the Golgi (Golgi should disperse following recruitment of EGFP-tagged DHC-EGFP or p50-EGFP to the PM), or EGF (movement towards the cell center should cease).
Despite trying different concentrations and extensive troubleshooting, we were not able to replicate the reported observations of Ciliobrevin D or Dynarrestin during mitosis. We would like to emphasize that the velocity (1.2 μm/s) of dynein-dynactin complexes that we measured in HeLa cells was comparable to those measured in iNeurons by Fellows et al. (PMID: 38407313) and for unopposed dynein under in vitro conditions.
(2) TIFRM and analysis:
(i) What was the rationale for using TIRFM given its limitation of visualization at/near the plasma membrane? Are the authors confident they are in TIRF mode and not HILO, which would fit with the representative images shown in the manuscript?
To avoid overcrowding, it was important to image the MT tracks that that were pinned between the nucleus and the plasma membrane. It is unclear to us why the reviewer feels that true TIRFM could not be used to visualize the movement of dynein-dynactin on this population of MTs since the plasma membrane is ~ 3-5 nm and a MT is ~25-27 nm all of which would fall well within the 100-200 nm excitable range of the evanescent wave produced by TIRF. While we feel TIRF can effectively visualize dynein-dynactin motility in cells, we have mentioned the possibility that some imaging may be HILO microscopy in the materials and methods.
(ii) At what depth are the authors imaging DHC-EGFP and p50-EGFP?
The imaging depth of traditional TIRFM is limited to around 100-200 nm. In adherent interphase HeLa cells the nucleus is in very close proximity (nanometer not micron scale) to the plasma membrane with some cytoskeletal filaments (actin) and microtubules positioned between the plasma membrane and the nuclear membrane. The fact that we were often visualizing MTs positioned between the nucleus and the membrane makes us confident that we were imaging at a depth (100 - 200nm) consistent with TIRFM.
(iii) The authors rely on manual inspection of tracks before analyzing them in kymographs - this is not rigorous and is prone to bias. They should instead track the molecules using single particle tracking tools (eg. TrackMate/uTrack), and use these traces to then quantify the displacement, velocity, and run-time.
Although automated single particle tracking tools offer several benefits, including reduced human effort, and scalability for large datasets, they often rely on specialized training datasets and do not generalize well to every dataset. The authors contend that under complex cellular environments human intervention is often necessary to achieve a reliable dataset. Considering the nature of our data we felt it was necessary to manually process the time-lapses.
(iv) It is unclear how the tracks that were eventually used in the quantification were chosen. Are they representative of the kind of movements seen? Kymographs of dynein movement along an entire MT/cell needs to be shown and all punctae that appear on MTs need to be tracked, and their movement quantified.
Considering the densely populated environment of a cell, it will be nearly impossible to quantity all the datasets. We selected tracks for quantification, focusing on areas where MTs were pinned between the nucleus and plasma membrane where we could track the movement of a single dynein molecule and where the surroundings were relatively less crowded.
(v) What is the directionality of the moving punctae?
In our experience, cells rarely organized their MTs in the textbook radial MT array meaning that one could not confidently conclude that “inward” movements were minus-end directed. Microtubule polarity was also not able to be determined for the MTs positioned between the plasma membrane and the nucleus on which many of the puncta we quantified were moving. It was clear that motile puncta moving on the same MT moved in the same direction with the exception of rare and brief directional switching events. What was more common than directional switching on the same MT were motile puncta exhibiting changes in direction at sharp (sometimes perpendicular) angles indicative of MT track switching, which is a well-characterized behavior of dynein-dynactin (See DOI: 10.1529/biophysj.107.120014).
(vi) Since all the quantification was performed on SiR tubulin-treated cells, it is unclear if the behavior of dynein observed here reflects the behavior of dynein in untreated cells. Analysis of untreated cells is required.
It was important to quantify SiR tubulin-treated cells because SiR-Tubulin is a docetaxel derivative, and its addition suppressed plus-end MT polymerization resulting in a significant reduction in the DHC tip-tracking population and a clearer view of the motile population of MT-associated DHC puncta. Otherwise, it was challenging to reliably identify motile puncta given the abundance of DHC tip-tracking populations in untreated cells.
(3) Estimation of stoichiometry of DHC and p50
Given that the punctae of DHC-EGFP and p50 seemingly bleach on MT before the end of the movie, the authors should use photobleaching to estimate the number of molecules in their punctae, either by simple counting the number of bleaching steps or by measuring single-step sizes and estimating the number of molecules from the intensity of punctae in the first frame.
Comparing the fluorescence intensity of a known molecule (in our case a kinesin-1EGFP dimer) to calculate the numbers of an unknown protein molecule (in our case Dynein or p50) is a widely accepted technique in the field. For example, refer to PMID: 29899040. To accurately estimate the stoichiometry of DHC and p50 and address the concerns raised by other reviewers, we expressed the human kinesin-EGFP in HeLa cells and analyzed the datasets from new experiments. We did not observe any significant differences between our old and new datasets.
(4) Discussion of prior literature
Recent work visualizing the behavior of dyneins in HeLa cells (DOI: 10.1101/2021.04.05.438428), which shows results that do not align with observations in this manuscript, has not been discussed. These contradictory findings need to be discussed, and a more objective assessment of the literature in general needs to be undertaken.
Adam of Damerham King Arthur and Glastonbury (18th April)
Again, another good source for Arthur, this time gives context for the second source and the reburial of arthur
Author Response:
Reviewer #1 (Public Review):
The manuscript by Chakraborty focuses on methods to direct dsDNA to specific cell types within an intact multicellular organism, with the ultimate goal of targeting DNA-based nanodevices, often as biosensors within endosomes and lysosomes. Taking advantage of the endogenous SID-2 dsRNA receptor expressed in C. elegans intestinal cells, the authors show that dsDNA conjugated to dsRNA can be taken into the intestinal endosomal system via feeding and apical endocytosis, while dsDNA alone is not an efficient endocytic cargo from the gut lumen. Since most cells do not express a dsRNA receptor, the authors sought to develop a more generalizable approach. Via phage display screening they identified a novel camelid antibody 9E that recognizes a short specific DNA sequence that can be included at the 3' end of synthesized dsDNAs. The authors then showed that this antibody can direct binding, and in some cases endocytosis, of such DNAs when 9E was expressed as a fusion with transmembrane protein SNB-1. This approach was successful in targeting microinjected dsDNA pan-neuronally when expressed via the snb-1 promoter, and to specific neuronal subsets when expressed via other promoters. Endocytosed dsDNA appeared in puncta moving in neuronal processes, suggesting entry into endosomes. Plasma membrane targeting appeared feasible using 9E fusion to ODR-2.
The major strength of the paper is in the identification and testing of the 9E camelid antibody as part of a generalizable dsDNA targeting system. This aspect of the paper will likely be of wide interest and potentially high impact, since it could be applied in any intact animal system subject to transgene expression. A weakness of the paper is the choice of "nanodevice". It was not clear what utility was present in the DNAs used, such as D38, that made them "devices", aside from their fluorescent tag that allowed tracking their localization.
We used a DNA nanodevice, denoted pHlava-9E, that uses pHrodo as a pH-sensitive dye. pHlava-9E is designed to provide a digital output of compartmentalization i.e., its pH profile is such that even if it is internalized into a mildly acidic vesicle, the pH readout is as high as one would observe with a lysosome. This gives an unambiguous readout of surface-immobilized probe to endocytosed probe.
Another potential weakness is that the delivered DNA is limited to the cell surface or the lumen of endomembrane compartments without access to the cytoplasm or nucleus. In general the data appeared to be of high quality and was well controlled, supporting the authors conclusions.
We completely agree that we cannot target DNA nanodevices to sub-cellular locations such as the cytoplasm or the nucleus with this strategy. However, we do not see this as a “weakness”, but rather, as a limitation of the current capabilities of DNA nanotechnology. It must be mentioned that though fluorescent proteins were first described in 1962, it was 30 years before others targeted them to the endoplasmic reticulum (1992) or the nucleus (1993)(Brini et al., 1993; Kendall et al., 1992). Probe technologies undergo stage-wise improvements/expansions. We have therefore added a small section in the conclusions section outlining the future challenges in sub-cellular targeting of DNA-nanodevices.
Reviewer #2 (Public Review):
The authors demonstrate the tissue-specific and cell-specific targeting of double-stranded DNA (dsDNA) using C. elegans as a model host animal. The authors focused on two distinct tissues and delivery routes: feeding dsDNA to target a class of organelles within intestinal cells, and injecting dsDNA to target presynaptic endocytic structures in neurons. To achieve efficient intestinal targeting, the authors leveraged dsRNA uptake via endogenous intestinal SID-2 receptors by fusing dsRNA to a fluorophore-labeled dsDNA probe. In contrast, neuronal endosome/synaptic vesicle (SV) targeting was achieved by designing a nanobody that specifically binds a short dsDNA motif fused to the fluorophore-labeled dsDNA probe. Combining dsDNA probe injection with nanobody neuronal expression (fused to a neuronal vSNARE to achieve synaptic targeting), the authors demonstrated that the injected dsDNA could be taken up by a variety of distinct neuronal subtypes.
Strengths:
While nanodevices built on dsDNA platforms have been shown to be taken up by scavenger receptors in C. elegans (including previous work from several of these authors), this strategy will not work in many tissue types lacking these receptors. The authors successfully circumvented this limitation using distinct strategies for two cell types in the worm, thereby providing a more general approach for future efforts. The approaches are creative, and the nanobody development in particular allows for endocytic delivery in any cell type. The authors exploited quantitative imaging approaches to examine the subcellular targeting of dsDNA probes in living animals and manipulated endogenous receptors to demonstrate the mechanism of dsRNA-based dsDNA uptake in intestinal cells.
Weaknesses:
To validate successful delivery of a functional nanodevice, one would ideally demonstrate the function of a particular nanodevice in at least one of the examples provided in this work. The authors have successfully used a variety of custom-designed dsDNA probes in living worms in numerous past studies, so this would not be a technical hurdle. In the current study, the reader has no means of assessing whether the dsDNA is intact and functional within its intracellular compartment.
We now demonstrate the use of a functional nanodevice to detect pH profiles of a given microenvironment. This functional nanodevice contains two fluorescent reporter dyes, each attached to one of the strands of a DNA duplex. In order to obtain pH readouts, the device integrity is essential for ratiometric sensing.
Coelomocytes are cells known for their scavenging and degradative lysosomal machinery. Previous studies of the stability of variously structured DNA nanodevices in coelomocytes, have shown that DNA devices based on 38 bp DNA duplexes have a half life of >8 hours in actively scavenging cells such as coelomocytes (Chakraborty et al., 2017; Surana et al., 2013) Given that our sensing in the gut as well as in the neuron are performed in <1 hour post feeding or injection, pHlava-9E is >97% intact.
Another minor weakness is the lack of a quantitative assessment of colocalization in intestinal cells or neurons in an otherwise nicely quantitative study. Since characterization of the targeting described here is an essential part of evaluating the method, a stronger demonstration of colocalization would significantly buttress the authors' claims.
We have now quantified colocalization in each cellular system. Please see Figure R1 below (Figure 1 Supplementary figure 1 and Figure 4 Supplementary figure 2 of the revised manuscript).
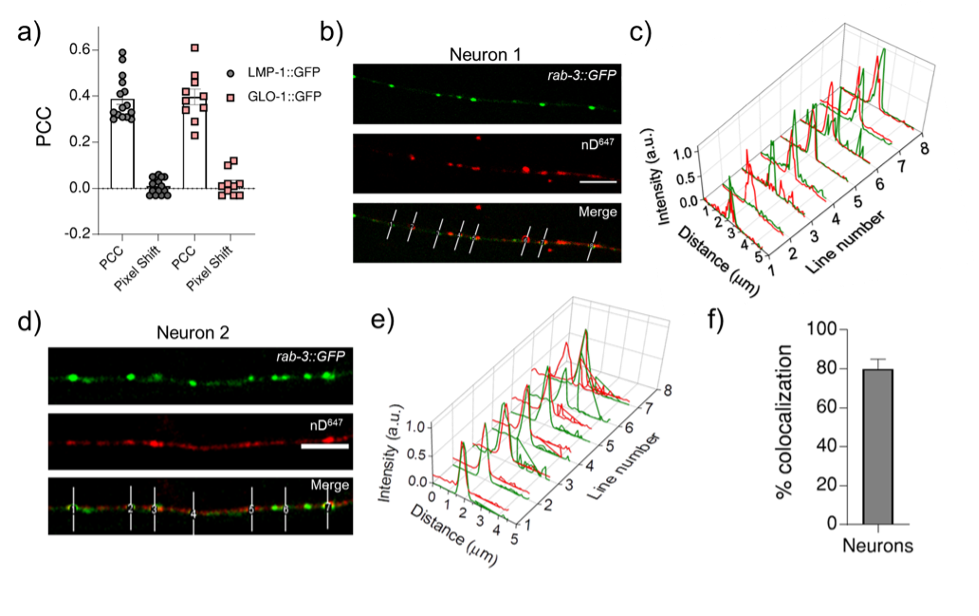
Figure R1: a) Pearson’s correlation coefficient (PCC) calculated for the colocalization between R50D38 (red) and lysosomal markers LMP-1 or GLO-1 (green) in the indicated transgenic worms. b) & d) Representative images of nanodevice nD647 uptake (red) in transgenics expressing both prab-3::gfp::rab-3 (green) and psnb-1:snb-1::9E c - e) Normalized line intensity profiles across the indicated lines in b and d; f) Percentage colocalization of nD647 (red) with RAB3:GFP (green). Error bar represents the standard deviation between two data sets.
While somewhat incomplete, this study represents a step forward in the development of a general targeting approach amenable to nanodevice delivery in animal models.
Author Response
Summary: A major tenet of plant pathogen effector biology has been that effectors from very different pathogens converge on a small number of host targets with central roles in plant immunity. The current work reports that effectors from two very different pathogens, an insect and an oomycete, interact with the same plant protein, SIZ1, previously shown to have a role in plant immunity. Unfortunately, apart from some technical concerns regarding the strength of the data that the effectors and SIZ1 interact in plants, a major limitation of the work is that it is not demonstrated that the effectors alter SIZ1 activity in a meaningful way, nor that SIZ1 is specifically required for action of the effects.
We thank the editor and reviewers for their time to review our manuscript and their helpful and constructive comments. The reviews have helped us focus our attention on additional experiments to test the hypothesis that effectors Mp64 (from an aphid) and CRN83-152 (from an oomycete) indeed alter SIZ1 activity or function. We have revised our manuscript and added the following data:
1) Mp64, but not CRN83-152, stabilizes SIZ1 in planta. (Figure 1 in the revised manuscript).
2) AtSIZ1 ectopic expression in Nicotiana benthamiana triggers cell death from 3-4 days after agroinfiltration. Interestingly CRN83-152_6D10 (a mutant of CRN83-152 that has no cell death activity), but not Mp64, enhances the cell death triggered by AtSIZ1 (Figure 2 in the revised manuscript).
For 1) we have added the following panel to Figure 1 as well as three biological replicates of the stabilisation assays in the Supplementary data (Fig S3):
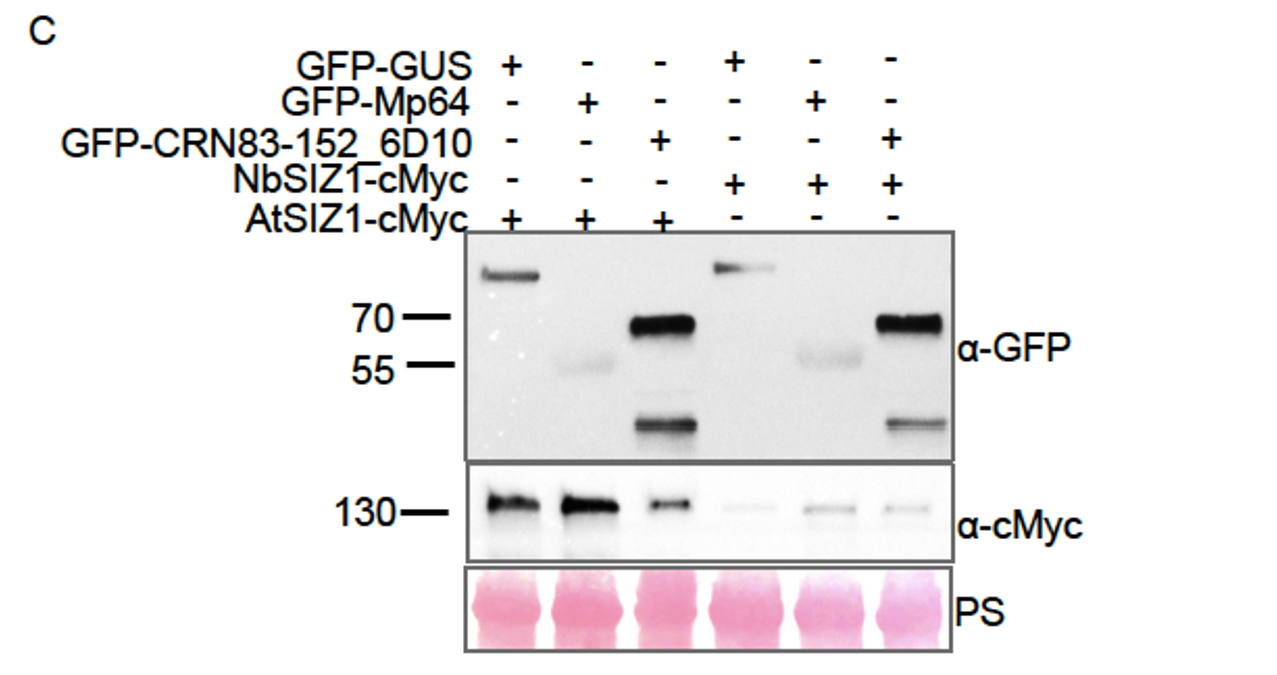
Figure 1 panel C. Stabilisation of SIZ1 by Mp64. Western blot analyses of protein extracts from agroinfiltrated leaves expressing combinations of GFP-GUS, GFP Mp64 and GFP-CRN83_152_6D10 with AtSIZ1-myc or NbSIZ1-myc. Protein size markers are indicated in kD, and equal protein amounts upon transfer is shown upon ponceau staining (PS) of membranes. Blot is representative of three biological replicates , which are all shown in supplementary Fig. S3. The selected panels shown here are cropped from Rep 1 in supplementary Fig. S3.
For 2) we have added the folllowing new figure (Fig. 2 in the revised manuscript):
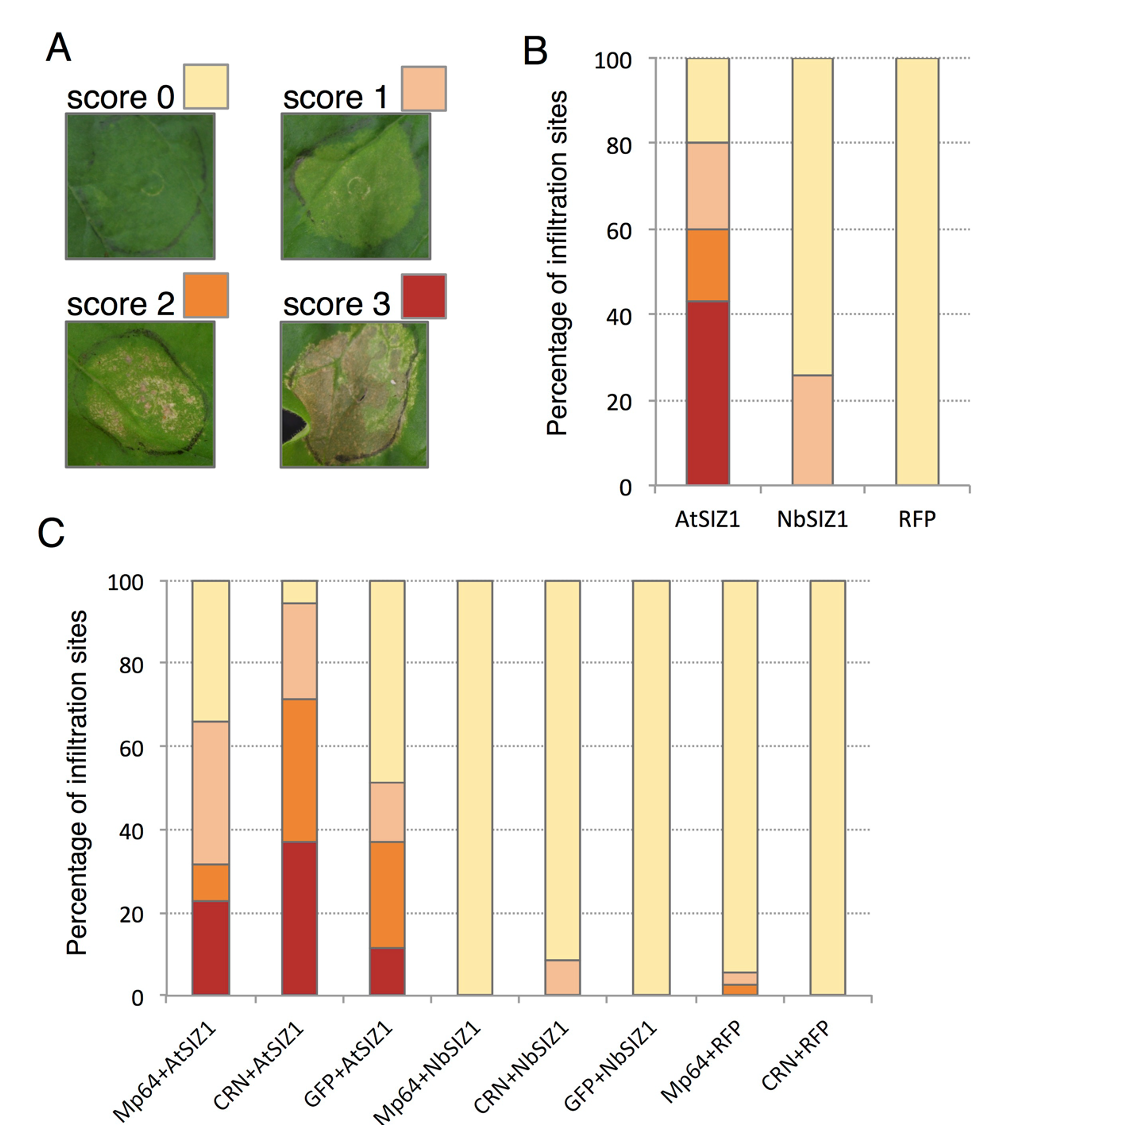
Fig. 2. SIZ1-triggered cell death in N. benthamiana is enhanced by CRN83_152_6D10 but not Mp64. (A) Scoring overview of infiltration sites for SIZ1 triggered cell death. Infiltration site were scored for no symptoms (score 0), chlorosis with localized cell death (score 1), less than 50% of the site showing visible cell death (score 2), more than 50% of the site showing cell death (score 3). (B) Bar graph showing the proportions of infiltration sites showing different levels of cell death upon expression of AtSIZ1, NbSIZ1 (both with a C-terminal RFP tag) and an RFP control. Graph represents data from a combination of 3 biological replicates of 11-12 infiltration sites per experiment (n=35). (C) Bar graph showing the proportions of infiltration sites showing different levels of cell death upon expression of SIZ1 (with C-terminal RFP tag) either alone or in combination with aphid effector Mp64 or Phytophthora capsica effector CRN83_152_6D10 (both effectors with GFP tag), or a GFP control. Graph represent data from a combination of 3 biological replicates of 11-12 infiltration sites per experiment (n=35).
Our new data provide further evidence that SIZ1 function is affected by effectors Mp64 (aphid) and CRN83-152 (oomycete), and that SIZ1 likely is a vital virulence target. Our latest results also provide further support for distinct effector activities towards SIZ1 and its variants in other species. SIZ1 is a key immune regulator to biotic stresses (aphids, oomycetes, bacteria and nematodes), on which distinct virulence strategies seem to converge. The mechanism(s) underlying the stabilisation of SIZ1 by Mp64 is yet unclear. However, we hypothesize that increased stability of SIZ1, which functions as an E3 SUMO ligase, leads to increased SUMOylation activity towards its substrates. We surmise that SIZ1 complex formation with other key regulators of plant immunity may underpin these changes. Whether the cell death, triggered by AtSIZ1 upon transient expression in Nicotiana benthamiana, is linked to E3 SUMO ligase activity remains to be investigated. Expression of AtSIZ1 in a plant species other than Arabidopsis may lead to mistargeting of substrates, and subsequent activation of cell death. Dissecting the mechanistic basis of SIZ1 targeting by distinct pathogens and pests will be an important next step in addressing these hypotheses towards understanding plant immunity.
Reviewer #1:
In this manuscript, the authors suggest that SIZ1, an E3 SUMO ligase, is the target of both an aphid effector (Mp64 form M. persicae) and an oomycete effector (CRN83_152 from Phytophthora capsica), based on interaction between SIZ1 and the two effectors in yeast, co-IP from plant cells and colocalization in the nucleus of plant cells. To support their proposal, the authors investigate the effects of SIZ1 inactivation on resistance to aphids and oomycetes in Arabidopsis and N. benthamiana. Surprisingly, resistance is enhanced, which would suggest that the two effectors increase SIZ1 activity.
Unfortunately, not only do we not learn how the effectors might alter SIZ1 activity, there is also no formal demonstration that the effects of the effectors are mediated by SIZ1, such as investigating the effects of Mp64 overexpression in a siz1 mutant. We note, however, that even this experiment might not be entirely conclusive, since SIZ1 is known to regulate many processes, including immunity. Specifically, siz1 mutants present autoimmune phenotype, and general activation of immunity might be sufficient to attenuate the enhanced aphid susceptibility seen in Mp64 overexpressers.
To demonstrate unambiguously that SIZ1 is a bona fide target of Mp64 and CRN83_152 would require assays that demonstrate either enhanced SIZ1 accumulation or altered SIZ1 activity in the presence of Mp64 and CRN83_152.
The enhanced resistance upon knock-down/out of SIZ1 suggests pathogen and pest susceptibility requires SIZ1. We hypothesize that the effectors either enhance SIZ1 activity or that the effectors alter SIZ1 specificity towards substrates rather than enzyme activity itself. To investigate how effectors coopt SIZ1 function would require a comprehensive set of approaches and will be part of our future work. While we agree that this aspect requires further investigation, we think the proposed experiments go beyond the scope of this study.
After receiving reviewer comments, including on the quality of Figure 1, which shows western blots of co-immunoprecipitation experiments, we re-analyzed independent replicates of effector-SIZ1 coexpression/ co-immunoprecipitation experiments. The reviewer rightly pointed out that in the presence of Mp64, SIZ1 protein levels increase when compared to samples in which either the vector control or CRN83-152_6D10 are co-infiltrated. Through carefully designed experiments, we can now affirm that Mp64 co-expression leads to increased SIZ1 protein levels (Figure 1C and Supplementary Figure S3, revised manuscript). Our results offer both an explanation of different SIZ1 levels in the input samples (original submission, Figure 1A/B) as well as tantalizing new clues to the nature of distinct effector activities.
Besides, we were able to confirm a previous preliminary finding not included in the original submission that ectopic expression of AtSIZ1 in Nicotiana benthamiana triggers cell death (3/4 days after infiltration) and that CRN83-152_6D10 (which itself does not trigger cell death) enhances this phenotype.
We have considered overexpression of Mp64 in the siz1 mutant, but share the view that the outcome of such experiments will be far from conclusive.
In summary, we have added new data that further support that SIZ1 is a bonafide target of Mp64 and CRN83-152 (i.e. increased accumulation of SIZ1 in the presence of Mp64, and enhanced SIZ cell death activation in the presence of CRN83-152_6D10).
Reviewer #2:
The study provides evidence that an aphid effector Mp64 and a Phytophthora capsici effector CRN83_152 can both interact with the SIZ1 E3 SUMO-ligase. The authors further show that overexpression of Mp64 in Arabidopsis can enhance susceptibility to aphids and that a loss-of-function mutation in Arabidopsis SIZ1 or silencing of SIZ1 in N. benthamiana plants lead to increased resistance to aphids and P. capsici. On siz1 plants the aphids show altered feeding patterns on phloem, suggestive of increased phloem resistance. While the finding is potentially interesting, the experiments are preliminary and the main conclusions are not supported by the data.
Specific comments:
The suggestion that SIZ1 is a virulence target is an overstatement. Preferable would be knockouts of effector genes in the aphid or oomycete, but even with transgenic overexpression approaches, there are no direct data that the biological function of the effectors requires SIZ1. For example, is SIZ1 required for the enhanced susceptibility to aphid infestation seen when Mp64 is overexpressed? Or does overexpression of SIZ1 enhance Mp64-mediated susceptibility?
What do the effectors do to SIZ1? Do they alter SUMO-ligase activity? Or are perhaps the effectors SUMOylated by SIZ1, changing effector activity?
We agree that having effector gene knock-outs in aphids and oomycetes would be ideal for dissecting effector mediated targeting of SIZ1. Unfortunately, there is no gene knock-out system established in Myzus persicae (our aphid of interest), and CAS9 mediated knock-out of genes in Phytophthora capsici has not been successful in our lab as yet, despite published reports. Moreover, repeated attempts to silence Mp64, other effector and non-effector coding genes, in aphids (both in planta and in vitro) have not been successful thus far, in our hands. As detailed in our response to Reviewer 1, we considered the use of transgenic approaches not appropriate as data interpretation would become muddied by the strong immunity phenotype seen in the siz1-2 mutant.
As stated before, we hypothesize that the effectors either enhance SIZ1 activity or alter SIZ1 substrate specificity. Mp64-induced accumulation of SIZ1 could form the basis of an increase in overall SIZ1 activity. This hypothesis, however, requires testing. The same applies to the enhanced SIZ1 cell death activation in the presence of CRN83-152_6D10.
Whilst our new data support our hypothesis that effectors Mp64 and CRN83-152 affect SIZ1 function, how exactly these effectors trigger susceptibility, requires significant work. Given the substantial effort needed and the research questions involved, we argue that findings emanating from such experiments warrant standalone publication.
While stable transgenic Mp64 overexpressing lines in Arabidopsis showed increased susceptibility to aphids, transient overexpression of Mp64 in N. benthamiana plants did not affect P. capsici susceptibility. The authors conclude that while the aphid and P. capsici effectors both target SIZ1, their activities are distinct. However, not only is it difficult to compare transient expression experiments in N. benthamiana with stable transgenic Arabidopsis plants, but without knowing whether Mp64 has the same effects on SIZ1 in both systems, to claim a difference in activities remains speculative.
We agree that we cannot compare effector activities between different plant species. We carefully considered every statement regarding results obtained on SIZ1 in Arabidopsis and Nicotiana benthamiana. We can, however, compare activities of the two effectors when expressed side by side in the same plant species. In our original submission, we show that expression of CRN83 152 but not Mp64 in Nicotiana benthamiana enhances susceptibility to Phytophthora capsici. In our revised manuscript, we present new data showing distinct effector activities towards SIZ1 with regards to 1) enhanced SIZ1 stability and 2) enhanced SIZ1 triggered cell death. These findings raise questions as to how enhanced SIZ1 stability and cell death activation is relevant to immunity. We aim to address these critical questions by addressing the mechanistic basis of effector-SIZ1 interactions.
The authors emphasize that the increased resistance to aphids and P. capsici in siz1 mutants or SIZ1 silenced plants are independent of SA. This seems to contradict the evidence from the NahG experiments. In Fig. 5B, the effects of siz1 are suppressed by NahG, indicating that the resistance seen in siz1 plants is completely dependent on SA. In Fig 5A, the effects of siz1 are not completely suppressed by NahG, but greatly attenuated. It has been shown before that SIZ1 acts only partly through SNC1, and the results from the double mutant analyses might simply indicate redundancy, also for the combinations with eds1 and pad4 mutants.
We emphasized that siz1-2 increased resistance to aphids is independent of SA, which is supported by our data (Figure 5A). Still, we did not conclude that the same applies to increased resistance to Phytophthora capsici (Figure 5B). In contrast, the siz1-2 enhanced resistance to P. capsici appears entirely dependent on SA levels, with the level of infection on the siz1-2/NahG mutants even slightly higher than on the NahG line and Col-0 plants. We exercise caution in the interpretation of this data given the significant impact SA signalling appears to have on Phytophthora capsici infection.
The reviewer commented on the potential for functional redundancy in the siz1-2 double mutants. Unfortunately, we are unsure what redundancy s/he is referring to. SNC1, EDS1, and PAD4 all are components required for immunity, and their removal from the immune signalling network (using the mutations in the lines we used here) impairs immunity to various plant pathogens. The siz1-2 snc1-11, siz1-2 eds1-2, and siz1-2 pad4-1 double mutants have similar levels of susceptibility to the bacterial pathogen Pseudomonas syringae when compared to the corresponding snc1-11, eds1-2 and pad4-1 controls (at 22oC). These previous observations indicate that siz1 enhanced resistance is dependent on these signalling components (Hammoudi et al., 2018, Plos Genetics).
In contrast to this, we observed a strong siz1 enhanced resistance phenotype in the absence of snc1- 11, eds1 2 and pad4-1. Notably, the siz1-2 snc1-11 mutant does not appear immuno-compromised when compared to siz1-2 in fecundity assays, indicating that the siz1-2 phenotype is independent of SNC1. In our view, these data suggest that signalling components/pathways other than those mediated by SNC1, EDS1, and PAD4 are involved. We consider this to be an exciting finding as our data points to an as of yet unknown SIZ1-dependent signalling pathway that governs immunity to aphids.
How do NahG or Mp64 overexpression affect aphid phloem ingestion? Is it the opposite of the behavior on siz1 mutants?
We have not performed further EPG experiments on additional transgenic lines used in the aphid assay. These experiments are quite challenging and time consuming. Moreover, accommodating an experimental set-up that allows us to compare multiple lines at the same time is not straightforward. Considering that NahG did not affect aphid performance (Figure 5A), we do not expect to see an effect on phloem ingestion.
Reviewer #1:
Hutchings et al. report an updated cryo-electron tomography study of the yeast COP-II coat assembled around model membranes. The improved overall resolution and additional compositional states enabled the authors to identify new domains and interfaces--including what the authors hypothesize is a previously overlooked structural role for the SEC31 C-Terminal Domain (CTD). By perturbing a subset of these new features with mutants, the authors uncover some functional consequences pertaining to the flexibility or stability of COP-II assemblies.
Overall, the structural and functional work appears reliable, but certain questions and comments should be addressed prior to publication. However, this reviewer failed to appreciate the conceptual advance that warrants publication in a general biology journal like eLIFE. Rather, this study provides a valuable refinement of our understanding of COP-II that I believe is better suited to a more specialized, structure-focused journal.
We agree that in our original submission our description of the experimental setup, indeed similar to previous work, did not fully capture the novel findings of this paper. Rather than being simply a higher resolution structure of the COPII coat, in fact we have discovered new interactions in the COPII assembly network, and we have probed their functional roles, significantly changing our understanding of the mechanisms of COPII-mediated membrane curvature. In the revised submission we have included additional genetic data that further illuminate this mechanism, and have rewritten the text to better communicate the novel aspects of our work.
Our combination of structural, functional and genetic analyses goes beyond refining our textbook understanding of the COPII coat as a simple ‘adaptor and cage’, but rather it provides a completely new picture of how dynamic regulation of assembly and disassembly of a complex network leads to membrane remodelling.
These new insights have important implications for how coat assembly provides structural force to bend a membrane but is still able to adapt to distinct morphologies. These questions are at the forefront of protein secretion, where there is debate about how different types of carriers might be generated that can accommodate cargoes of different size.
Major Comments: 1) The authors belabor what this reviewer thinks is an unimportant comparison between the yeast reconstruction of the outer coat vertex with prior work on the human outer coat vertex. Considering the modest resolution of both the yeast and human reconstructions, the transformative changes in cryo-EM camera technology since the publication of the human complex, and the differences in sample preparation (inclusion of the membrane, cylindrical versus spherical assemblies, presence of inner coat components), I did not find this comparison informative. The speculations about a changing interface over evolutionary time are unwarranted and would require a detailed comparison of co-evolutionary changes at this interface. The simpler explanation is that this is a flexible vertex, observed at low resolution in both studies, plus the samples are very different.
We do agree that our proposal that the vertex interface changes over evolutionary time is speculative and we have removed this discussion. We agree that a co-evolutionary analysis will be enlightening here, but is beyond the scope of the current work.
We respectfully disagree with the reviewer’s interpretation that the difference between the two vertices is due to low resolution. The interfaces are clearly different, and the resolutions of the reconstructions are sufficient to state this. The reviewer’s suggestion that the difference in vertex orientation might be simply attributable to differences in sample, such as inclusion of the membrane, cylindrical versus spherical morphology, or presence of inner coat components were ruled out in our original submission: we resolved yeast vertices on spherical vesicles (in addition to those on tubes) and on membrane-less cages. These analyses clearly showed that neither the presence of a membrane, nor the change in geometry (tubular vs. spherical) affect vertex interactions. These experiments are presented in Supplementary Fig 4 (Supplementary Fig. 3 in the original version). Similarly, we discount that differences might be due to the presence or absence of inner coat components, since membrane-less cages were previously solved in both conditions and are no different in terms of their vertex structure (Stagg et al. Nature 2006 and Cell 2008).
We believe it is important to report on the differences between the two vertex structures. Nevertheless, we have shifted our emphasis on the functional aspects of vertex formation and moved the comparison between the two vertices to the supplement.
2) As one of the major take home messages of the paper, the presentation and discussion of the modeling and assignment of the SEC31-CTD could be clarified. First, it isn't clear from the figures or the movies if the connectivity makes sense. Where is the C-terminal end of the alpha-solenoid compared to this new domain? Can the authors plausibly account for the connectivity in terms of primary sequence? Please also include a side-by-side comparison of the SRA1 structure and the CTD homology model, along with some explanation of the quality of the model as measured by Modeller. Finally, even if the new density is the CTD, it isn't clear from the structure how this sub-stoichiometric and apparently flexible interaction enhances stability. Hence, when the authors wrote "when the [CTD] truncated form was the sole copy of Sec31 in yeast, cells were not viable, indicating that the novel interaction we detect is essential for COPII coat function." Maybe, but could this statement be a leap to far? Is it the putative interaction essential, or is the CTD itself essential for reasons that remain to be fully determined?
The CTD is separated from the C-terminus of the alpha solenoid domain by an extended domain (~350 amino acids) that is predicted to be disordered, and contains the PPP motifs and catalytic fragment that contact the inner coat. This is depicted in cartoon form in Figures 3A and 7, and discussed at length in the text. This arrangement explains why no connectivity is seen, or expected. We could highlight the C-terminus of the alpha-solenoid domain to emphasize where the disordered region should emerge from the rod, but connectivity of the disordered domain to the CTD could arise from multiple positions, including from an adjacent rod.
The reviewer’s point about the essentiality of the CTD being independent of its interaction with the Sec31 rod, is an important one. The basis for our model that the CTD enhances stability or rigidity of the coat is the yeast phenotype of Sec31-deltaCTD, which resembles that of a sec13 null. Both mutants are lethal, but rescued by deletion of emp24, which leads to more easily deformable membranes (Čopič et al. Science 2012). We agree that even if this model is true, the interaction of the CTD with Sec31 that our new structure reveals is not proven to drive rigidity or essentiality. We have tempered this hypothesis and added alternative possibilities to the discussion.
We have included the SRA1 structure in Supplementary Fig 5, as requested, and the model z-score in the Methods. The Z-score, as calculated by the proSA-web server is -6.07 (see figure below, black dot), and falls in line with experimentally determined structures including that of the template (PDB 2mgx, z-score = -5.38).
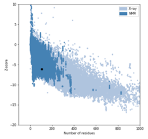
3) Are extra rods discussed in Fig. 4 are a curiosity of unclear functional significance? This reviewer is concerned that these extra rods could be an in vitro stoichiometry problem, rather than a functional property of COP-II.
This is an important point, that, as we state in the paper, cannot be answered at the moment: the resolution is too low to identify the residues involved in the interaction. Therefore we are hampered in our ability to assess the physiological importance of this interaction. We still believe the ‘extra’ rods are an important observation, as they clearly show that another mode of outer coat interaction, different from what was reported before, is possible.
The concern that interactions visualised in vitro might not be physiologically relevant is broadly applicable to structural biology approaches. However, our experimental approach uses samples that result from active membrane remodelling under near-physiological conditions, and we therefore expect these to be less prone to artefacts than most in vitro reconstitution approaches, where proteins are used at high concentrations and in high salt buffer conditions.
4) The clashsccore for the PDB is quite high--and I am dubious about the reliability of refining sidechain positions with maps at this resolution. In addition to the Ramchandran stats, I would like to see the Ramachandran plot as well as, for any residue-level claims, the density surrounding the modeled side chain (e.g. S742).
The clashscore is 13.2, which, according to molprobity, is in the 57th percentile for all structures and in the 97th for structures of similar resolutions. We would argue therefore that the clashscore is rather low. In fact, the model was refined from crystal structures previously obtained by other groups, which had worse clashscore (17), despite being at higher resolution. Our refinement has therefore improved the clashscore. During refinement we have chosen restraint levels appropriate to the resolution of our map (Afonine et al., Acta Cryst D 2018)
The Ramachandran plot is copied here and could be included in a supplemental figure if required. We make only one residue-level claim (S742), the density for which is indeed not visible at our resolution. We claim that S742 is close to the Sec23-23 interface, and do not propose any specific interactions. Nevertheless we have removed reference to S742 from the manuscript. We included this specific information because of the potential importance of this residue as a site of phosphorylation, thereby putting this interface in broader context for the general eLife reader.
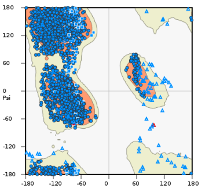
Minor Comments:
1) The authors wrote "To assess the relative positioning of the two coat layers, we analysed the localisation of inner coat subunits with respect to each outer coat vertex: for each aligned vertex particle, we superimposed the positions of all inner coat particles at close range, obtaining the average distribution of neighbouring inner coat subunits. From this 'neighbour plot' we did not detect any pattern, indicating random relative positions. This is consistent with a flexible linkage between the two layers that allows adaptation of the two lattices to different curvatures (Supplementary Fig 1E)." I do not understand this claim, since the pattern both looks far from random and the interactions depend on molecular interactions that are not random. Please clarify.
We apologize for the confusion: the pattern of each of the two coats are not random. Our sentence refers to the positions of inner and outer coats relative to each other. The two lattices have different parameters and the two layers are linked by flexible linkers (the 350 amino acids referred to above). We have now clarified the sentence.
2) Related to major point #1, the author wrote "We manually picked vertices and performed carefully controlled alignments." I do now know what it means to carefully control alignments, and fear this suggests human model bias.
We used different starting references for the alignments, with the precise aim to avoid model bias. For both vesicle and cage vertex datasets, we have aligned the subtomograms against either the vertex obtained from tubules, or the vertex from previously published membrane-less cages. In all cases, we retrieved a structure that resembles the one on tubules, suggesting that the vertex arrangement we observe isn’t simply the result of reference bias. This procedure is depicted in Supplementary Fig 4 (Supplementary Fig. 3 in the original manuscript), but we have now clarified it also in the methods section.
3) Why do some experiments use EDTA? I may be confused, but I was surprised to see the budding reaction employed 1mM GMPPNP, and 2.5mM EDTA (but no Magnesium?). Also, for the budding reaction, please replace or expand upon the "the 10% GUV (v/v)" with a mass or molar lipid-to-protein ratio.
We regret the confusion. As stated in the methods, all our budding reactions are performed in the presence of EDTA and Magnesium, which is present in the buffer (at 1.2 mM). The reason is to facilitate nucleotide exchange, as reported and validated in Bacia et al., Scientific Reports 2011.
Lipids in GUV preparations are difficult to quantify. We report the stock concentrations used, but in each preparation the amount of dry lipid that forms GUVs might be different, as is the concentration of GUVs after hydration. However since we analyse reactions where COPII proteins have bound and remodelled individual GUVs, we do not believe the protein/lipid ratio influences our structures.
4) Please cite the AnchorMap procedure.
We cite the SerialEM software, and are not aware of other citations specifically for the anchor map procedure.
5) Please edit for typos (focussing, functionl, others)
Done
Reviewer #2:
The manuscript describes new cryo-EM, biochemistry, and genetic data on the structure and function of the COPII coat. Several new discoveries are reported including the discovery of an extra density near the dimerization region of Sec13/31, and "extra rods" of Sec13/31 that also bind near the dimerization region. Additionally, they showed new interactions between the Sec31 C-terminal unstructured region and Sec23 that appear to bridge multiple Sec23 molecules. Finally, they increased the resolution of the Sec23/24 region of their structure compared to their previous studies and were able to resolve a previously unresolved L-loop in Sec23 that makes contact with Sar1. Most of their structural observations were nicely backed up with biochemical and genetic experiments which give confidence in their structural observations. Overall the paper is well-written and the conclusions justified.
However, this is the third iteration of structure determination of the COPII coat on membrane with essentially the same preparation and methods. Each time, there has been an incremental increase in resolution and new discoveries, but the impact of the present study is deemed to be modest. The science is good, but it may be more appropriate for a more specialized journal. Areas of specific concern are described below.
As described above, we respectfully disagree with this interpretation of the advance made by the current work. This work improves on previous work in many aspects. The resolution of the outer coat increases from over 40A to 10-12A, allowing visualisation of features that were not previously resolved, including a novel vertex arrangement, the Sec31 CTD, and the outer coat ‘extra rods’. An improved map of the inner coat also allows us to resolve the Sec23 ‘L-loop’. We would argue that these are not just extra details, but correspond to a suite of novel interactions that expand our understanding of the complex COPII assembly network. Moreover, we include biochemical and genetic experiments that not only back up our structural observations but bring new insights into COPII function. As pointed out in response to reviewer 1, we believe our work contributes a significant conceptual advance, and have modified the manuscript to convey this more effectively.
1) The abstract is vague and should be re-written with a better description of the work.
We have modified the abstract to specifically outline what we have done and the major new discoveries of this paper.
2) Line 166 - "Surprisingly, this mutant was capable of tubulating GUVs". This experiment gets to one of the fundamental unknown questions in COPII vesiculation. It is not clear what components are driving the membrane remodeling and at what stages during vesicle formation. Isn't it possible that the tubulation activity the authors observe in vitro is not being driven at all by Sec13/31 but rather Sec23/24-Sar1? Their Sec31ΔCTD data supports this idea because it lacks a clear ordered outer coat despite making tubules. An interesting experiment would be to see if tubules form in the absence of all of Sec13/31 except the disordered domain of Sec31 that the authors suggest crosslinks adjacent Sec23/24s.
This is an astute observation, and we agree with the reviewer that the source of membrane deformation is not fully understood. We favour the model that budding is driven significantly by the Sec23-24 array. To further support this, we have performed a new experiment, where we expressed Sec31ΔN in yeast cells lacking Emp24, which have more deformable membranes and are tolerant to the otherwise lethal deletion of Sec13. While Sec31ΔN in a wild type background did not support cell viability, this was rescued in a Δemp24 yeast strain, strongly supporting the hypothesis that a major contributor to membrane remodelling is the inner coat, with the outer coat becoming necessary to overcome membrane bending resistance that ensues from the presence of cargo. We now include these results in Figure 1.
However, we must also take into account the results presented in Fig. 6, where we show that weakening the Sec23-24 interface still leads to budding, but only if Sec13-31 is fully functional, and that in this case budding leads to connected pseudo-spherical vesicles rather than tubes. When Sec13-31 assembly is also impaired, tubes appear unstructured. We believe this strongly supports our conclusions that both inner and outer coat interactions are fundamental for membrane remodelling, and it is the interplay between the two that determines membrane morphology (i.e. tubes vs. spheres).
To dissect the roles of inner and outer coats even further, we have done the experiment that the reviewer suggests: we expressed Sec31768-1114, but the protein was not well-behaved and co-purified with chaperones. We believe the disordered domain aggregates when not scaffolded by the structured elements of the rod. Nonetheless, we used this fragment in a budding reaction, and could not see any budding. We did not include this experiment as it was inconclusive: the lack of functionality of the purified Sec31 fragment could be attributed to the inability of the disordered region to bind its inner coat partner in the absence of the scaffolding Sec13-31 rod. As an alternative approach, we have used a version of Sec31 that lacks the CTD, and harbours a His tag at the N-terminus (known from previous studies to partially disrupt vertex assembly). We think this construct is more likely to be near native, since both modifications on their own lead to functional protein. We could detect no tubulation with this construct by negative stain, while both control constructs (Sec31ΔCTD and Nhis-Sec31) gave tubulation. This suggests that the cross-linking function of Sec31 is not sufficient to tubulate GUV membranes, but some degree of functional outer coat organisation (either mediated by N- or C-terminal interactions) is needed. It is also possible that the lack of outer coat organisation might lead to less efficient recruitment to the inner coat and cross-linking activity. We have added this new observation to the manuscript.
3) Line 191 - "Inspecting cryo-tomograms of these tubules revealed no lozenge pattern for the outer 192 coat" - this phrasing is vague. The reviewer thinks that what they mean is that there is a lack of order for the Sec13/31 layer. Please clarify.
The reviewer is correct, we have changed the sentence.
4) Line 198 - "unambiguously confirming this density corresponds to 199 the CTD." This only confirms that it is the CTD if that were the only change and the Sec13/31 lattice still formed. Another possibility is that it is density from other Sec13/31 that only appears when the lattice is formed such as the "extra rods". One possibility is that the density is from the extra rods. The reviewer agrees that their interpretation is indeed the most likely, but it is not unambiguous. The authors should consider cross-linking mass spectrometry.
We have removed the word ‘unambiguously’, and changed to ‘confirming that this density most likely corresponds to the CTD’. Nonetheless, we believe that our interpretation is correct: the extra rods bind to a different position, and themselves also show the CTD appendage. In this experiment, the lack of the CTD was the only biochemical change.
5) In the Sec31ΔCTD section, the authors should comment on why ΔCTD is so deleterious to oligomer organization in yeast when cages form so abundantly in preparations of human Sec13/31 ΔC (Paraan et al 2018).
We have added a comment to address this. “Interestingly, human Sec31 proteins lacking the CTD assemble in cages, indicating that either the vertex is more stable for human proteins and sufficient for assembly, or that the CTD is important in the context of membrane budding but not for cage formation in high salt conditions.”
6) The data is good for the existence of the "extra rods", but significance and importance of them is not clear. How can these extra densities be distinguished from packing artifacts due to imperfections in the helical symmetry.
Please also see our response to point 3 from reviewer 1. Regarding the specific concern that artefacts might be a consequence of imperfection in the helical symmetry, we would argue such imperfections are indeed expected in physiological conditions, and to a much higher extent. For this reason interactions seen in the context of helical imperfections are likely to be relevant. In fact, in normal GTP hydrolysis conditions, we expect long tubes would not be able to form, and the outer coat to be present on a wide range of continuously changing membrane curvatures. We think that the ability of the coat to form many interactions when the symmetry is imperfect might be exactly what confers the coat its flexibility and adaptability.
7) Figure 5 is very hard to interpret and should be redone. Panels B and C are particularly hard to interpret.
We have made a new figure where we think clarity is improved.
8) The features present in Sec23/24 structure do not reflect the reported resolution of 4.7 Å. It seems that the resolution is overestimated.
We report an average resolution of 4.6 Å. In most of our map we can clearly distinguish beta strands, follow the twist of alpha helices and see bulky side chains. These features typically become visible at 4.5-5A resolution. We agree that some areas are worse than 4.6 Å, as typically expected for such a flexible assembly, but we believe that the average resolution value reported is accurate. We obtained the same resolution estimate using different software including relion, phenix and dynamo, so that is really the best value we can provide. To further convince ourselves that we have the resolution we claim, we sampled EM maps from the EMDB with the same stated resolution (we just took the 7 most recent ones which had an associated atomic model), and visualised their features at arbitrary positions. For both beta strands and alpha helices, we do not feel our map looks any worse than the others we have examined. We include a figure here.
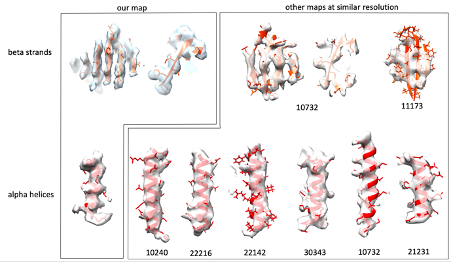
9) Lines 315/316 - "We have combined cryo-tomography with biochemical and genetic assays to obtain a complete picture of the assembled COPII coat at unprecedented resolution (Fig. 7)"
10) Figure 7. is a schematic model/picture the authors should reference a different figure or rephrase the sentence.
We now refer to Fig 7 in a more appropriate place.
Reviewer #3:
The manuscript by Hutchings et al. describes several previously uncharacterised molecular interactions in the coats of COP-II vesicles by using a reconstituted coats of yeast COPI-II. They have improved the resolution of the inner coat to 4.7A by tomography and subtomogram averaging, revealing detailed interactions, including those made by the so-called L-loop not observed before. Analysis of the outer layer also led to new interesting discoveries. The sec 31 CTD was assigned in the map by comparing the WT and deletion mutant STA-generated density maps. It seems to stabilise the COP-II coats and further evidence from yeast deletion mutants and microsome budding reconstitution experiments suggests that this stabilisation is required in vitro. Furthermore, COP-II rods that cover the membrane tubules in right-handed manner revealed sometimes an extra rod, which is not part of the canonical lattice, bound to them. The binding mode of these extra rods (which I refer to here a Y-shape) is different from the canonical two-fold symmetric vertex (X-shape). When the same binding mode is utilized on both sides of the extra rod (Y-Y) the rod seems to simply insert in the canonical lattice. However, when the Y-binding mode is utilized on one side of the rod and the X-binding mode on the other side, this leads to bridging different lattices together. This potentially contributes to increased flexibility in the outer coat, which maybe be required to adopt different membrane curvatures and shapes with different cargos. These observations build a picture where stabilising elements in both COP-II layers contribute to functional cargo transport. The paper makes significant novel findings that are described well. Technically the paper is excellent and the figures nicely support the text. I have only minor suggestions that I think would improve the text and figure.
We thank the reviewer for helpful suggestions which we agree improve the manuscript.
Minor Comments:
L 108: "We collected .... tomograms". While the meaning is clear to a specialist, this may sound somewhat odd to a generic reader. Perhaps you could say "We acquired cryo-EM data of COP-II induced tubules as tilt series that were subsequently used to reconstruct 3D tomograms of the tubules."
We have changed this as suggested
L 114: "we developed an unbiased, localisation-based approach". What is the part that was developed here? It seems that the inner layer particle coordinates where simply shifted to get starting points in the outer layer. Developing an approach sounds more substantial than this. Also, it's unclear what is unbiased about this approach. The whole point is that it's biased to certain regions (which is a good thing as it incorporates prior knowledge on the location of the structures).
We have modified the sentence to “To target the sparser outer coat lattice for STA, we used the refined coordinates of the inner coat to locate the outer coat tetrameric vertices”, and explain the approach in detail in the methods.
L 124: "The outer coat vertex was refined to a resolution of approximately ~12 A, revealing unprecedented detail of the molecular interactions between Sec31 molecules (Supplementary Fig 2A)". The map alone does not reveal molecular interactions; the main understanding comes from fitting of X-ray structures to the low-resolution map. Also "unprecedented detail" itself is somewhat problematic as the map of Noble et al (2013) of the Sec31 vertex is also at nominal resolution of 12 A. Furthermore, Supplementary Fig 2A does not reveal this "unprecedented detail", it shows the resolution estimation by FSC. To clarify, these points you could say: "Fitting of the Sec31 atomic model to our reconstruction vertex at 12-A resolution (Supplementary Fig 2A) revealed the molecular interactions between different copies of Sec31 in the membrane-assembled coat.
We have changed the sentence as suggested.
L 150: Can the authors exclude the possibility that the difference is due to differences in data processing? E.g. how the maps amplitudes have been adjusted?
Yes, we can exclude this scenario by measuring distances between vertices in the right and left handed direction. These measurements are only compatible with our vertex arrangement, and cannot be explained by the big deviation from 4-fold symmetry seen in the membrane-less cage vertices.
L 172: "that wrap tubules either in a left- or right-handed manner". Don't they do always both on each tubule? Now this sentence could be interpreted to mean that some tubules have a left-handed coat and some a right-handed coat.
We have changed this sentence to clarify. “Outer coat vertices are connected by Sec13-31 rods that wrap tubules both in a left- and right-handed manner.”
L276: "The difference map" hasn't been introduced earlier but is referred to here as if it has been.
We now introduce the difference map.
L299: Can "Secondary structure predictions" denote a protein region "highly prone to protein binding"?
Yes, this is done through DISOPRED3, a feature include in the PSIPRED server we used for our predictions. The reference is: Jones D.T., Cozzetto D. DISOPRED3: precise disordered region predictions with annotated protein-binding activity Bioinformatics. 2015; 31:857–863. We have now added this reference to the manuscript.
L316: It's true that the detail in the map of the inner coat is unprecedented and the model presented in Figure 7 is partially based on that. But here "unprecedented resolution" sounds strange as this sentence refers to a schematic model and not a map.
We have changed this by moving the reference to Fig 7 to a more appropriate place
L325: "have 'compacted' during evolution" -> remove. It's enough to say it's more compact in humans and less compact in yeast as there could have been different adaptations in different organisms at this interface.
We have changed as requested. See also our response to reviewer 1, point 1.
L327: What's exactly meant by "sequence diversity or variability at this density".
We have now clarified: “Since multiple charge clusters in yeast Sec31 may contribute to this interaction interface (Stancheva et al., 2020), the low resolution could be explained by the fact that the density is an average of different sequences.”
L606-607: The description of this custom data processing approach is difficult to follow. Why is in-plane flip needed and how is it used here?
Initially particles are picked ignoring tube directionality (as this cannot be assessed easily from the tomograms due to the pseudo-twofold symmetry of the Sec23/24/Sar1 trimer). So the in plane rotation of inner coat subunit could be near 0 or 180°. For each tube, both angles are sampled (in-plane flip). Most tubes result in the majority of particles being assigned one of the two orientations (which is then assumed as the tube directionality). Particles that do not conform are removed, and rare tubes where directionality cannot be determined are also removed. We have re-written the description to clarify these points: “Initial alignments were conducted on a tube-by-tube basis using the Dynamo in-plane flip setting to search in-plane rotation angles 180° apart. This allowed to assign directionality to each tube, and particles that were not conforming to it were discarded by using the Dynamo dtgrep_direction command in custom MATLAB scripts”
L627: "Z" here refers to the coordinate system of aligned particles not that of the original tomogram. Perhaps just say "shifted 8 pixels further away from the membrane".
Changed as requested.
L642-643: How can the "left-handed" and "right-handed" rods be separated here? These terms refer to the long-range organisation of the rods in the lattice it's not clear how they were separated in the early alignments.
They are separated by picking only one subset using the dynamo sub-boxing feature. This extracts boxes from the tomogram which are in set positions and orientation relative to the average of previously aligned subtomograms. From the average vertex structure, we sub-box rods at 4 different positions that correspond to the centre of the rods, and the 2-fold symmetric pairs are combined into the same dataset. We have clarified this in the text: “The refined positions of vertices were used to extract two distinct datasets of left and right-handed rods respectively using the dynamo sub-boxing feature.”
Figure 2B. It's difficult to see the difference between dark and light pink colours.
We have changed colours to enhance the difference.
Figure 3C. These panels report the relative frequency of neighbouring vertices at each position; "intensity" does not seem to be the right measure for this. You could say that the colour bar indicates the "relative frequency of neighbouring vertices at each position" and add detail how the values were scaled between 0 and 1. The same applies to SFigure 1E.
Changed as requested.
Figure 4. The COP-II rods themselves are relatively straight, and they are not left-handed or right-handed. Here, more accurate would be "architecture of COPII rods organised in a left-handed manner". (In the text the authors may of course define and then use this shorter expression if they so wish.) Panel 4B top panel could have the title "left-handed" and the lower panel should have the title "right-handed" (for consistency and clarity).
We have now defined left- and right-handed rods in the text, and have changed the figure and panel titles as requested.
Reviewer #2 (Public review):
The authors addressed the question how mitochondrial proteins that are dually localized or only to a minor fraction localized to mitochondria can be visualized. For this they used an established and previously published method called BiG split-GFP, in which GFP strands 1-10 are encoded in the mitochondrial DNA and fused the GFP11 strand C-terminally to the yeast ORFs using the C-SWAT library. The generated library was imaged under different growth and stress conditions and yielded positive mitochondrial localization for approximately 400 proteins. The strength of this method is the detection of proteins that are dually localized with only a minor fraction within mitochondria, which was so far has hampered due to strong fluorescent signals from other cellular localizations. The weakness of this method is that due to the localization of the GFP1-10 in the mitochondrial matrix, only matrix proteins and IM protein with their C-termini facing the matrix can be detected. In addition, The C-terminal GFP11 might impact on assembly of proteins into multimeric complexes or interfere with biogenesis trapping the tagged protein in an unproductive transport intermediate. Taken these limitations into consideration, the authors provide a new library that can help in identification of eclipsed protein distribution within mitochondria, thus further increasing our knowledge on the complete mitochondrial proteome. The approach of global tagging of the yeast genome is the logical consequence after the successful establishment of the BiG split-GFP for mitochondria. The authors also propose that their approach can be applied to investigate the topology of inner membrane proteins, however, for this the inherent issue remains that even the small GFP11 tag can impact on protein biogenesis and topology. Thus, the approach will not overcome the need to assess protein topology via biochemical approaches detecting endogenous untagged proteins.
Comments on revisions:
The first sentence of the abstract should be changed as the statement that "The majority of the mitochondrial proteins (...) often lack clear targeting signals" is in particular for the here analysed IM and matrix protein not correct: Several N-proteomics analysis have defined N-terminal cleavable targeting signals in great detail.
Also the statement in the title that the assay illuminates protein targeting routes should be reconsidered as experimental evidence for this statement is still scarce.
Reviewer #3 (Public review):
Summary:
Here, Bykov et al move the bi-genomic split-GFP system they previously established to the genome-wide level in order to obtain a more comprehensive list of mitochondrial matrix and inner membrane proteins. In this very elegant split-GFP system, the longer GFP fragment, GFP1-10, is encoded in the mitochondrial genome and the shorter one, GFP11, is C-terminally attached to every protein encoded in the genome of yeast Saccharomyces cerevisiae. GFP fluorescence can therefore only be reconstituted if the C-terminus of the protein is present in the mitochondrial matrix, either as part of a soluble protein, a peripheral membrane protein or an integral inner membrane protein. The system, combined with high-throughput fluorescence microscopy of yeast cells grown under six different conditions, enabled the authors to visualize ca. 400 mitochondrial proteins, 50 of which were not visualised before and 8 of which were not shown to be mitochondrial before. The system appears to be particularly well suited for analysis of dually localized proteins and could potentially be used to study sorting pathways of mitochondrial inner membrane proteins.
Strengths:
Many fluorescence-based genome-wide screen were previously performed in yeast and were central to revealing the subcellular location of a large fraction of yeast proteome. Nonetheless, these screens also showed that tagging with full-length fluorescent proteins (FP) can affect both the function and targeting of proteins. The strength of the system used in the current manuscript is that the shorter tag is beneficial for detection of a number of proteins whose targeting and/or function is affected by tagging with full length FPs.
Furthermore, the system used here can nicely detect mitochondrial pools of dually localized proteins. It is especially useful when these pools are minor and their signals are therefore easily masked by the strong signals coming from the major, nonmitochondrial pools of the proteins.
Weaknesses:
My only concern is that the biological significance of the screen performed appears limited. The dataset obtained is largely in agreement with several previous proteomic screens but it is, unfortunately, not more comprehensive than them, rather the opposite. For proteins that were identified inside mitochondria for the first time here or were identified in an unexpected location within the organelle, it remains unclear whether these localizations represent some minor, missorted pools of proteins or are indeed functionally important fractions and/or productive translocation intermediates. The authors also allude to several potential applications of the system but do little to explore any of these directions.
Comments on revisions:
The revised version of the manuscript submitted by Bykov et al addresses the comments and concerns raised by the Reviewers. It is a pity that the verification of the newly obtained data and its further biological exploration is apparently more challenging than perhaps anticipated.
Author response:
The following is the authors’ response to the original reviews.
Reviewer #1 (Public Review):
Summary:
The study conducted by the Schuldiner's group advances the understanding of mitochondrial biology through the utilization of their bi-genomic (BiG) split-GFP assay, which they had previously developed and reported. This research endeavors to consolidate the catalog of matrix and inner membrane mitochondrial proteins. In their approach, a genetic framework was employed wherein a GFP fragment (GFP1-10) is encoded within the mitochondrial genome. Subsequently, a collection of strains was created, with each strain expressing a distinct protein tagged with the GFP11 fragment. The reconstitution of GFP fluorescence occurs upon the import of the protein under examination into the mitochondria.
We are grateful for the positive evaluation. We would like to clarify that the bi-genomic (BiG) split-GFP assay was developed by the labs of H. Becker and Roza Kucharzyk by highly laborious construction of the strain with mtDNA-encoded GFP<sub>1-10</sub> (Bader et al, 2020).
Strengths:
Notably, this assay was executed under six distinct conditions, facilitating the visualization of approximately 400 mitochondrial proteins. Remarkably, 50 proteins were conclusively assigned to mitochondria for the first time through this methodology. The strains developed and the extensive dataset generated in this study serve as a valuable resource for the comprehensive study of mitochondrial biology. Specifically, it provides a list of 50 "eclipsed" proteins whose role in mitochondria remains to be characterized.
Weaknesses:
The work could include some functional studies of at least one of the newly identified 50 proteins.
In response to this we have expanded the characterization of phenotypic effects resulting from changing the targeting signal and expression levels of the dually localized Gpp1 protein and expanded the data in Fig. 3, panels H and I.
Reviewer #2 (Public Review):
The authors addressed the question of how mitochondrial proteins that are dually localized or only to a minor fraction localized to mitochondria can be visualized on the whole genome scale. For this, they used an established and previously published method called BiG split-GFP, in which GFP strands 1-10 are encoded in the mitochondrial DNA and fused the GFP11 strand C-terminally to the yeast ORFs using the C-SWAT library. The generated library was imaged under different growth and stress conditions and yielded positive mitochondrial localization for approximately 400 proteins. The strength of this method is the detection of proteins that are dually localized with only a minor fraction within mitochondria, which so far has hampered their visualization due to strong fluorescent signals from other cellular localizations. The weakness of this method is that due to the localization of the GFP1-10 in the mitochondrial matrix, only matrix proteins and IM proteins with their C-termini facing the matrix can be detected. Also, proteins that are assembled into multimeric complexes (which will be the case for probably a high number of matrix and inner membrane-localized proteins) resulting in the C-terminal GFP11 being buried are likely not detected as positive hits in this approach. Taking these limitations into consideration, the authors provide a new library that can help in the identification of eclipsed protein distribution within mitochondria, thus further increasing our knowledge of the complete mitochondrial proteome. The approach of global tagging of the yeast genome is the logical consequence after the successful establishment of the BiG split-GFP for mitochondria. The authors also propose that their approach can be applied to investigate the topology of inner membrane proteins, however, for this, the inherent issue remains that it cannot be excluded that even the small GFP11 tag can impact on protein biogenesis and topology. Thus, the approach will not overcome the need to assess protein topology analysis via biochemical approaches on endogenous untagged proteins.
Reviewer #3 (Public Review):
Summary:
Here, Bykov et al move the bi-genomic split-GFP system they previously established to the genomewide level in order to obtain a more comprehensive list of mitochondrial matrix and inner membrane proteins. In this very elegant split-GFP system, the longer GFP fragment, GFP1-10, is encoded in the mitochondrial genome and the shorter one, GFP11, is C-terminally attached to every protein encoded in the genome of yeast Saccharomyces cerevisiae. GFP fluorescence can therefore only be reconstituted if the C-terminus of the protein is present in the mitochondrial matrix, either as part of a soluble protein, a peripheral membrane protein, or an integral inner membrane protein. The system, combined with high-throughput fluorescence microscopy of yeast cells grown under six different conditions, enabled the authors to visualize ca. 400 mitochondrial proteins, 50 of which were not visualised before and 8 of which were not shown to be mitochondrial before. The system appears to be particularly well suited for analysis of dually localized proteins and could potentially be used to study sorting pathways of mitochondrial inner membrane proteins.
Strengths:
Many fluorescence-based genome-wide screens were previously performed in yeast and were central to revealing the subcellular location of a large fraction of yeast proteome. Nonetheless, these screens also showed that tagging with full-length fluorescent proteins (FP) can affect both the function and targeting of proteins. The strength of the system used in the current manuscript is that the shorter tag is beneficial for the detection of a number of proteins whose targeting and/or function is affected by tagging with full-length FPs.
Furthermore, the system used here can nicely detect mitochondrial pools of dually localized proteins. It is especially useful when these pools are minor and their signals are therefore easily masked by the strong signals coming from the major, nonmitochondrial pools of the proteins.
Weaknesses:
My only concern is that the biological significance of the screen performed appears limited. The dataset obtained is largely in agreement with several previous proteomic screens but it is, unfortunately, not more comprehensive than them, rather the opposite. For proteins that were identified inside mitochondria for the first time here or were identified in an unexpected location within the organelle, it remains unclear whether these localizations represent some minor, missorted pools of proteins or are indeed functionally important fractions and/or productive translocation intermediates. The authors also allude to several potential applications of the system but do little to explore any of these directions.
We agree with the reviewer that a single method may not be used for the construction of the complete protein inventory of an organelle or its sub-compartment. We suggest that the value of our assay is in providing a complementary view to the existing data and approaches. For example, we confirm the matrix localization of several proteins that were only found in the two proteomic data and never verified before (Vögtle et al, 2017; Morgenstern et al, 2017). Given that proteomics is a very sensitive technique and false positives are hard to completely exclude, our complementary verification is valuable.
Reviewer #1 (Recommendations for the authors):
In my opinion, the manuscript can be published as it is, and I would expect that future work will advance the functional properties of the newly found mitochondrial proteins.
We thank the reviewer for their positive evaluation
Reviewer #2 (Recommendations for the authors)
(1) Due to the localization of the GFP1-10 in the matrix, only matrix and IM proteins with C-termini facing the matrix can be detected, this should be added e.g. in the heading of the first results part and discussed earlier in the manuscript. In addition, the limitation that assembly into protein complexes will likely preclude detection of matrix and IM proteins needs to be discussed.
To address the first point, we edited the title of the first section to only mention the visualization of the matrix-facing proteome and remove the words “inner membrane”. We also clarified early in the Results section that we only consider the matrix-facing C-termini by extending the sentence early in the results section “To compare our findings with published data, we created a unified list of 395 proteins that are observed with high confidence using our assay indicating that their C-terminus is positioned in the matrix (Fig. 2 – figure supplement 1B-D, Table S1).” (P. 6 Lines 1-3). Concluding the comparison with the earlier proteomic studies we also added the sentence “Many proteins are missing because their C-termini are facing the IMS” (P.8 Line 2).
To address the second point concerning the possible interference of the complex assembly and protein detection by our assay, we conducted an additional analysis. The analysis takes advantage of the protein complexes with known structures where we could estimate if the C-terminus with the GFP<sub>11</sub> tag would be available for GFP1-10 binding. We added the additional figure (Figure 3 – figure supplement 2) and following text in the Results section (P.7 Lines 22-34):
“To examine the influence of protein complex assembly on the performance of the BiG Mito-Split assay we analyzed the published structures of the mitoribosome and ATP synthase (Desai et al, 2017; Srivastava et al, 2018; Guo et al, 2017) and classified all proteins as either having C-termini in, or out of, the complex. There was no difference between the “in” and “out” groups in the percentage observed in the BiG Mito-Split collection (Fig. 3 – figure supplement 2A) suggesting that the majority of the GFP11tagged proteins have a chance to interact with GFP1-10 before (or instead of) assembling into the complex. PCR and western blot verification of eight strains with the tagged complex subunits for which we observed no signal showed that mitoribosomal proteins were incorrectly tagged or not expressed, and the ATP synthase subunits Atp7, Atp19, and Atp20 were expressed (Fig. 3 – Supplement 2B). Atp19 and Atp20 have their C-termini most likely oriented towards the IMS (Guo et al, 2017) while Atp7 is completely in the matrix and may be the one example of a subunit whose assembly into a complex prevents its detection by the BiG Mito-Split assay.”
We also consider related points on the interference of the tag and the influence of protein essentiality in the replies to points 3) and 12) of these reviews.
(2) The imaging data is of high quality, but the manuscript would greatly benefit from additional analysis to support the claims or hypothesis brought forward by the authors. The idea that the nonmitochondrial proteins are imported due to their high sequence similarity to MTS could be easily addressed at least for some of these proteins via import studies, as also suggested by the authors.
The idea that non-mitochondrial proteins may be imported into mitochondria due to occasional sequence similarity was recently demonstrated experimentally by (Oborská-Oplová et al, 2025). We incorporate this information in the Discussion section as follows (P. 14 Lines 10-16):
“It was also recently shown that the r-protein uS5 (encoded by RPS2 in yeast) has a latent MTS that is masked by a special mitochondrial avoidance segment (MAS) preceding it (Oborská-Oplová et al, 2025). The removal of the MAS leads to import of uS5 into mitochondria killing the cells. The case of uS5 is an example of occasional similarity between an r-protein and an MTS caused by similar requirements of positive charges for rRNA binding and mitochondrial import. It remains unclear if other r-proteins have a MAS and if there are other mechanisms that protect mitochondria from translocation of cytosolic proteins.”
We also conducted additional analysis to substantiate the claim that ribosomal (r)-proteins are similar in their physico-chemical properties to MTS-containing mitochondrial proteins. For this we chose not to use prediction algorithms like TartgetP and MitoFates that were already trained on the same dataset of yeast proteins to discriminate cytosolic and mitochondrial localization. Instead, we extended the analysis earlier made by (Woellhaf et al, 2014) and calculated several different properties such as charge, hydrophobicity, hydrophobic moment and amino acid content for mitochondrial MTS-containing proteins, cytosolic non-ribosomal proteins, and r-proteins. The analysis showed striking similarity of r-proteins and mitochondrial proteins. We incorporate a new Figure 3 – figure supplement 3 and the following text in the Results section (P. 8 Lines14-22):
“Five out of eight proteins are components of the cytosolic ribosome (r-proteins). In agreement with previous reports (Woellhaf et al, 2014) we find that their unique properties, such as charge, hydrophobicity and amino acid content, are indeed more similar to mitochondrial proteins than to cytosolic ones (Fig. 3 – figure supplement 3). Additional experiments with heterologous protein expression and in vitro import will be required to confirm the mitochondrial import and targeting mechanisms of these eight non-mitochondrial proteins. The data highlights that out of hundreds of very abundant proteins with high prediction scores only few are actually imported and highlights the importance of the mechanisms that help to avoid translocation of wrong proteins (Oborská-Oplová et al, 2025).”
To further prove the possibility of r-protein import into mitochondria we aimed to clone the r-proteins identified in this work for cell-free expression and import into purified mitochondria. Despite the large effort, we have succeeded in cloning and efficiently expressing only Rpl23a (Author response image 1 A). Rpl23a indeed forms proteinase-protected fractions in a membrane potential-dependent manner when incubated with mitochondria. The inverse import dynamics of Rpl23a could be either indicative of quick degradation inside mitochondria or of background signal during the import experiments (Author response image 1.A). To address the r-protein degradation possibility, we measured how does GFP signal change in the BiG Mito-Split diploid collection strains after blocking cytosolic translation with cycloheximide (CHX). For this we selected Mrpl12a, that had one of the highest signals. We did not detect any drop in fluorescence signal for Rpl12a and the control protein Mrpl6 (Author response image 1 B). This might indicate the lack of degradation, or the degradation of the whole protein except GFP<sub>11</sub> that remains connected to GFP<sub>1-10</sub>. Due to time constrains we could not perform all experiments for the whole set of potentially imported r-proteins. Since more experiments are required to clearly show the mechanisms of mitochondrial r-protein import, degradation, and toxicity, or possible moonlighting functions (such as import into mitochondria derived from pim1∆ strain, degradation assays, fractionations, and analyses with antibodies for native proteins) we decided not to include this new data into the manuscript itself.
Author response image 1.
The import of r-proteins into mitochondria and their stability. (A) Rpl23 was synthesized in vitro (Input), radiolabeled, and imported into mitochondria isolated from BY4741 strain as described before (Peleh et al, 2015); the import was performed for 5,10, or 15 minutes and mitochondria were treated with proteinase K (PK) to degrade nonimported proteins; some reactions were treated with the mix of valinomycin, antimycin, and oligomycin (VAO) to dissipate mitochondrial membrane potential; the proteins were visualized by SDS-PAGE and autoradiography (B) The strains from the diploid BiG Mito-Split collection were grown in YPD to mid-logarithmic growth phase, then CHX was added to block translation and cell aliquots were taken from the culture and analyzed by fluorescence microscopy at the indicated time points. Scale bar is 5 µm.
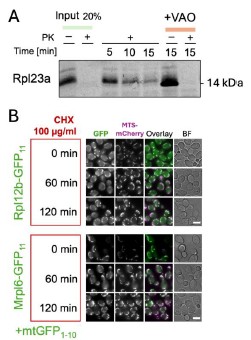
(3) The claim that the approach can be used to assess the topology of inner membrane proteins is problematic as the C-terminal tag can alter the biogenesis pathway of the protein or impact on the translocation dynamics (in particular as the imaging method applied here does not allow for analysis of dynamics). The hypothesis that the biogenesis route can be monitored is therefore far-reaching. To strengthen the hypothesis the authors should assess if the C-terminal GFP11 influences protein solubility by assessing protein aggregation of e.g. Rip1.
We agree with the reviewer that the tag and assembly of GFP<sub>1-10/11</sub> can further complicate the assessment of topology of the IM proteins that already have complex biogenesis routes (lateral transfer, conservative, and a Rip1-specific Bcs1 pathway). To emphasize that the assessment of the steady state topology needs to be backed up by additional biochemical approaches, we edited the beginning of the corresponding Results sections as follows (P. 11 Lines 2-6):
“Studying membrane protein biogenesis requires an accurate way to determine topology in vivo. The mitochondrial IM is one of the most protein-rich membranes in the cell supporting a wide variety of TMD topologies with complex biogenesis pathways. We aimed to find out if our BiG Mito-Split collection can accurately visualize the steady-state localization of membrane protein C-termini protruding into the matrix or trap protein transport intermediates” (inserted text is underlined).
The collection that we studied by microscopy is diploid and contains one WT copy of each 3xGFP<sub>11</sub>tagged gene. To assess the influence of the tag on the protein function we performed growth assays with haploid strains which have one 3xGFP<sub>11</sub>-tagged gene copy and no GFP<sub>1-10</sub>. We find that Rip13xGFP<sub>11</sub> displays slower growth on glycerol at 30˚C and even slower at 37˚C while tagged Qcr8, Qcr9, and Qcr10 grow normally (Author response image 2 A). Based on the growth assays and microscopy it is not possible to conclude whether the “Qcr” proteins’ biogenesis is affected by the tag. It may be that laterally sorted proteins are functional with the tag and constitute the majority while only a small portion is translocated into the matrix, trapped and visualized with GFP<sub>1-10</sub>. In case of Rip1 it was shown that C-terminal tag can affect its interaction with the chaperone Mzm1 and promote Rip1 aggregation (Cui et al, 2012). The extent of Rip1 function disruption can be different and depends on the tag. We hypothesize that our split-assay may trap the pre-translocation intermediate of Rip1 and can be helpful to study its interactors. To test this, we performed anti-GFP immune-precipitation (IP) using GFP-Trap beads (Author response image 2 B).
Author response image 2.
The influence of 3x-GFP11 on the function and processing of the inner membrane proteins. (A) Drop dilution assays with haploid strains from C-SWAT 3xGFP<Sub>11</sub> library on fermentative (YPD) and respiratory (YPGlycerol) media at different temperatures. (B) Immuno-precipitation with GFP-Trap agarose was performed on haploid strain that has only Rip1-3xGFP<sub>11</sub> and on the diploid strain derived from this haploid mated with BiG Mito-Split strain containing mtGFP<sub>1-10</sub> and WT untagged Rip1 using the lysis (1% TX-100) and washing protocols provided by the manufacturer; the total (T) and eluted with the Laemmli buffer (IP) samples were analyzed by immunoblotting with polyclonal rabbit antibodies against GFP (only visualizes GFP<Sub>11</sub> in these samples) and Rip1 (visualizes both tagged and WT Rip1). Polyclonal home-made rabbit antisera for GFP and Rip1 were kindly provided by Johannes Herrmann (Kaiserslautern) and Thomas Becker (Bonn); the antisera were diluted 1:500 for decorating the membranes.
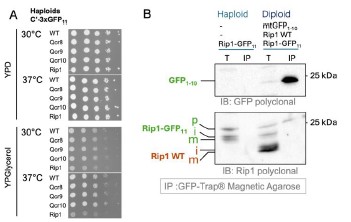
We find that the haploid strain with Rip1-3xGFP<sub>11</sub> contains not only mature (m) and intermediate (i) forms but also an additional higher Mw band that we interpreted as precursor that was not cleaved by MPP. WT Rip1 in the diploid added two more lower Mw bands: (m) and (i) forms of the untagged Rip1. IP successfully enriched GFP<sub>1-10</sub> fragment as visualized by anti-GFP staining. Interestingly only the highest Mw Rip1-3xGFP<sub>11</sub> band was also enriched when anti-Rip1 antibodies were used to analyze the samples. This suggests that Rip1 precursor gets completely imported and interacts with GFP<sub>1-10</sub> and can be pulled down. It is however not processed. Processed Rip1 is not interacting with GFP<sub>1-10</sub>. Based on the literature we expect all Rip1 in the matrix to be cleaved by MPP including the one interacting with GFP. Due to this discrepancy, we did not include this data in the manuscript. This is however clear that the assay may be useful to analyze biogenesis intermediates of the IM and matrix proteins. To emphasize this, we added information on the C-terminal tagging of Rip1 in the Results section (P. 11 Lines 18-20):
“It was shown that a C-terminal tag on Rip1 can prevent its interaction with the chaperone Mzm1 and promote aggregation in the matrix (Cui et al, 2012). It is also possible that our assay visualizes this trapped biogenesis intermediate.”
We also added a note on biogenesis intermediates in the Discussion (P. 14 Line 36 onwards):
“It is possible that the proteins with C-termini that are translocated into the IMS from the matrix side can be trapped by the interaction with GFP<sub>1-10</sub>. In that case, our assay can be a useful tool to study these pre-translocation intermediates.”
(4) The hypothesis that the method can reveal new substrates for Bcs1 is interesting, and it would strongly increase the relevance for the scientific community if this would be directly tested, e.g. by deleting BCS1 and testing if more IM proteins are then detected by interaction with the matrix GFP110.
we attempted to move the BiG Mito-Split assay into haploid strains where BCS1 and other factors can be deleted, however, this was not successful. Since this was a big effort (We cloned 10 potential substrate proteins but none of them were expressed) we decided not to pursue this further.
(5) The screening of six different growth conditions reflects the strength of the high-throughput imaging readout. However, the interpretation of the data and additional follow-up on this is rather short and would be a nice addition to the present manuscript. In addition, one wonders, what was the rationale behind these six conditions (e.g. DTT treatment)? The direct metabolic shift from fermentation to respiration to boost mitochondrial biogenesis would be a highly interesting condition and the authors should consider adding this in the present manuscript.
we agree with the reviewer that the analysis of different conditions is a strength of this work. However, we did not reveal any clear protein groups with strong conditional import and thus it was hard to select a follow-up candidate. The selection of conditions was partially driven by the technical possibilities: the media change is challenging on the robotic system; heat shock conditions make microscope autofocus unstable; library strain growth on synthetic respiratory media is very slow and the media cannot be substituted with rich media due to its autofluorescence. However, the usage of the spinning disc confocal microscope allowed us to screen directly in synthetic oleate media which has a lot of background on widefield systems due to oil micelles. We extended the explanation of condition choice as follows (P. 4 Line 34 onwards):
“The diploid BiG Mito-Split collection was imaged in six conditions representing various carbon sources and a diversity of stressors the cells can adapt to: logarithmic growth on glucose as a control carbon source and oleic acid as a poorly studied carbon source; post-diauxic (stationary) phase after growth on glucose where mitochondria, are more active and inorganic phosphate (Pi) depletion that was recently described to enhance mitochondrial membrane potential (Ouyang et al, 2024); as stress conditions we chose growth on glucose in the presence of 1 mM dithiothreitol (DTT) that might interfere with the disulfide relay system in the IMS, and nitrogen starvation as a condition that may boost biosynthetic functions of mitochondria. DTT and nitrogen starvation were earlier used for a screen with the regular C’-GFP collection (Breker et al, 2013). Another important consideration for selecting the conditions was the technical feasibility to implement them on automated screening setups.”
Reviewer #3 (Recommendations for the authors )
(6) This is a very elegant and clearly written study. As mentioned above, my only concern is that the biological significance of the obtained data, at this stage, is rather limited. It would have been nice if the authors explored one of the potential applications of the system they propose. For example, it should be relatively easy to analyze whether Cox26, Qcr8, Qcr9, or Qcr10 are new substrates of Bsc1, as the authors speculate.
we thank the reviewer for their positive feedback. We addressed the biological application of the screen by including new data on metabolite concentrations in the strains where Gpp1 N-terminus was mutated leading to loss of the mitochondrial form. We added panels H and I to Figure 4, the new Supplementary Table S2 and appended the description of these results at the end of the third Results subsection (P. 10 Lines 19-35). Our data now show a role for the mitochondrial fraction of Gpp1 which adds mechanistic insight into this dually localized protein.
We also were interested in the applications of our system to the study of mitochondrial import. However, the study of Cox26, Qcr8, Qcr9, and Qcr10 was not successful (also related to point 4, Reviewer #2). We thus decided to investigate the import mechanisms of the poorly studied dually localized proteins Arc1, Fol3, and Hom6 (related to Figure 4 of the original manuscript). To this end, we expressed these proteins in vitro, radiolabeled, and performed import assays with purified mitochondria. Arc1 was not imported, Fol3 and Hom6 gave inconclusive results (Author response image 3). Since it is known that even some genuine fully or dually localized mitochondrial proteins such as Fum1 cannot be imported in vitro post-translationally (Knox et al, 1998), we cannot draw conclusions from these experiments and left them out of the revised manuscript. Additional investigation is required to clarify if there exist special cytosolic mechanisms for the import of these proteins that were not reconstituted in vitro such as co-translational import.
Author response image 3.
In vitro import of poorly studies dually localized proteins. Arc1, Fol3, and Hom6 were cloned into pGEM4 plasmid, synthesized in vitro (Input), radiolabeled, and imported into mitochondria isolated from BY4741 strain as described before (Peleh et al, 2015); the import was performed for 5,10, or 15 minutes and mitochondria were treated with proteinase K (PK) to degrade non-imported proteins; some reactions were treated with the mix of valinomycin, antimycin, and oligomycin (VAO) to dissipate mitochondrial membrane potential. The proteins were separated by SDS-PAGE and visualized by autoradiography.
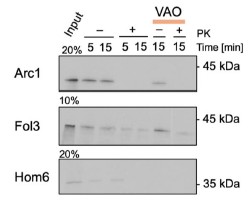
Minor comments:
(7) It is unclear why the authors used the six growth conditions they used, and why for example a nonfermentable medium was not included at all.
we address this shortcoming in the reply to the previous point 5 (Reviewer #2).
(8) Page 2, line 17 - "Its" should be corrected to "its".
Changed
(9) Page 2, line 25 to the end of the paragraph - the authors refer to the TIM complex when actually the TIM23 complex is probably meant. Also, it would be clearer if the TIM22 complex was introduced as well, especially in the context of the sentence stating that "the IM is a major protein delivery destination in mitochondria".
This was corrected.
(10) Page 5, line 35 - "who´s" should be corrected to "whose".
This was corrected.
(11) Page 9, line 5 - "," after Gpp1 should probably be "and".
This was corrected.
(12) Page 11 - the authors discuss in several places the possible effects of tags and how they may interfere with "expression, stability and targeting of proteins". Protein function may also be dramatically affected by tags - a quick look into the dataset shows that several mitochondrial matrix and inner membrane proteins that are essential for cell viability were not identified in the screen, likely because their function is impaired.
we agree with the reviewer that the influence of tags needs to be carefully evaluated. This is not always possible in the context of whole genomic screens. Sometimes, yeast collections (and proteomic datasets) can miss well-known mitochondrial residents without a clear reason. To address this important point we conducted an additional analysis to look specifically at the essential proteins. We indeed found that several of the mitochondrial proteins that are essential for viability were absent from the collection at the start, but for those present, their essentiality did not impact the likelihood to be detected in our assay. To describe the analysis we added the following text and a Fig. 3 – figure supplement 2. Results now read (P.7 Lines 8-21):
“Next, we checked the two categories of proteins likely to give biased results in high-throughput screens of tagged collections: proteins essential for viability, and molecular complex subunits. To look at the first category we split the proteomic dataset of soluble matrix proteins (Vögtle et al. 2017) into essential and non-essential ones according to the annotations in the Saccharomyces Genome Database (SGD) (Wong et al, 2023). We found that there was no significant difference in the proportion of detected proteins in both groups (17 and 20 % accordingly), despite essential proteins being less represented in the initial library (Fig. 3 – figure supplement 2A). From the three essential proteins of the (Vögtle et al. 2017) dataset for which the strains present in our library but showed no signal, two were nucleoporins Nup57 and Nup116, and one was a genuine mitochondrial protein Ssc1. Polymerase chain reaction (PCR) and western blot verification showed that the Ssc1 strain was incorrect (Fig. 3 – figure supplement 2B). We conclude that essential proteins are more likely to be absent or improperly tagged in the original C’-SWAT collection, but the essentiality does not affect the results of the BiG Mito-Split assay.”
Discussion (P. 13 Lines 23-26):
“We did not find that protein complex components or essential proteins are more likely to be falsenegatives. However, some essential proteins were absent from the collection to start with (Fig. 3 – figure supplement 2A). Thus, a small tag allows visualization of even complex proteins.”
From our data it is difficult to estimate the effect of tagging on protein function. We also addressed the effect of tagging Rip1 as well as performed growth assays on the tagged small “Qcr proteins” in the reply to point 3 (Reviewer #2). It is also difficult to estimate the effect of GFP<sub>1-10</sub> and <sub>11</sub> complex assembly on protein function since the presence of functional, unassembled GFP<sub>11</sub> tagged pool cannot be ruled out in our assay.
Other changes
Figure and table numbers changed after new data additions.
A sentence added in the abstract to highlight the additional experiments on Gpp1 function: “We use structure-function analysis to characterize the dually localized protein Gpp1, revealing an upstream start codon that generates a mitochondrial targeting signal and explore its unique function.”
The reference to the PCR verification (Fig. 3 – Supplement 2B) of correct tagging of Ycr102c was added to the Results section (P.8 Line 6), western blot verification added on.
Added the Key Resources Table at the beginning of the Methods section.
Small grammar edits, see tracked changes.
References:
Bader G, Enkler L, Araiso Y, Hemmerle M, Binko K, Baranowska E, De Craene J-O, Ruer-Laventie J, Pieters J, Tribouillard-Tanvier D, et al (2020) Assigning mitochondrial localization of dual localized proteins using a yeast Bi-Genomic Mitochondrial-Split-GFP. eLife 9: e56649
Cui T-Z, Smith PM, Fox JL, Khalimonchuk O & Winge DR (2012) Late-Stage Maturation of the Rieske Fe/S Protein: Mzm1 Stabilizes Rip1 but Does Not Facilitate Its Translocation by the AAA ATPase Bcs1. Mol Cell Biol 32: 4400–4409
Desai N, Brown A, Amunts A & Ramakrishnan V (2017) The structure of the yeast mitochondrial ribosome. Science 355: 528–531
Guo H, Bueler SA & Rubinstein JL (2017) Atomic model for the dimeric FO region of mitochondrial ATP synthase. Science 358: 936–940
Knox C, Sass E, Neupert W & Pines O (1998) Import into Mitochondria, Folding and Retrograde Movement of Fumarase in Yeast. J Biol Chem 273: 25587–25593
Morgenstern M, Stiller SB, Lübbert P, Peikert CD, Dannenmaier S, Drepper F, Weill U, Höß P, Feuerstein R, Gebert M, et al (2017) Definition of a High-Confidence Mitochondrial Proteome at Quantitative Scale. Cell Rep 19: 2836–2852
Oborská-Oplová M, Geiger AG, Michel E, Klingauf-Nerurkar P, Dennerlein S, Bykov YS, Amodeo S, Schneider A, Schuldiner M, Rehling P, et al (2025) An avoidance segment resolves a lethal nuclear–mitochondrial targeting conflict during ribosome assembly. Nat Cell Biol 27: 336–346
Peleh V, Ramesh A & Herrmann JM (2015) Import of Proteins into Isolated Yeast Mitochondria. In Membrane Trafficking: Second Edition, Tang BL (ed) pp 37–50. New York, NY: Springer
Srivastava AP, Luo M, Zhou W, Symersky J, Bai D, Chambers MG, Faraldo-Gómez JD, Liao M & Mueller DM (2018) High-resolution cryo-EM analysis of the yeast ATP synthase in a lipid membrane. Science 360: eaas9699
Vögtle F-N, Burkhart JM, Gonczarowska-Jorge H, Kücükköse C, Taskin AA, Kopczynski D, Ahrends R, Mossmann D, Sickmann A, Zahedi RP, et al (2017) Landscape of submitochondrial protein distribution. Nat Commun 8: 290
Woellhaf MW, Hansen KG, Garth C & Herrmann JM (2014) Import of ribosomal proteins into yeast mitochondria. Biochem Cell Biol 92: 489–498
Author Response:
Reviewer #1 (Public Review):
In this manuscript, the authors challenge the long-standing conclusion that Orco and IR-dependent olfactory receptor neurons are segregated into subtypes such that Orco and IR expression do not overlap. First, the authors generate new knock-in lines to tag the endogenous loci with an expression reporter system, QF/QUAS. They then compare the observed expression of these knock-ins with the widely used system of enhancer transgenes of the same receptors, namely Orco, IR8a, IR25a, and IR76b. Surprisingly, they observe an expansion of the expression of the individual knock-in reporters as compared to the transgenic reporters in more chemosensory neurons targeting more glomeruli per receptor type than previously reported. They verify the expression of the knock-in reporters with antibody staining, in situ hybridization and by mining RNA sequencing data.
Finally, they address the question of physiological relevance of such co-expression of receptor systems by combining optogenetic activation with single sensillum recordings and mutant analysis. Their data suggests that IR25a activation can modulate Orco-dependent signaling and activation of olfactory sensory neurons.
The paper is well written and easy to follow. The data are well presented and very convincing due in part to the combination of complementary methods used to test the same point. Thus, the finding that co-receptors are more broadly and overlappingly expressed than previously thought is very convincing and invites speculation of how this might be relevant for the animal and chemosensory processing in general. In addition, the new method to make knock-ins and the generated knock-ins themselves will be of interest to the fly community.
We thank the reviewer for their enthusiasm and support of our work!
The last part of the manuscript, although perhaps the most interesting, is the least developed compared to the other parts. In particular, the following points could be addressed:
- It would be good to see a few more traces and not just the quantifications. For instance, the trace of ethyl acetate in Fig. 6C, and penthyl acetate for 6G.
Thank you for the suggestion. We have added a new figure supplement (Figure 6-Figure Supplement 3) with additional example traces for all odorants from Figure 6 for which we found a statistically significant difference between the two genotypes (Ir25a versus wildtype).
- In Fig. 4D, the authors show the non-retinal fed control, which is great. An additional genetic control fed with retinal would have been nice.
For these experiments, we followed a standard practice in Drosophila optogenetics to test the same experimental genotype in the presence or absence of the essential cofactor all-trans-retinal. This controls for potential effects from the genetic background. It is possible our description of these experiments was unclear (as also suggested by comments from Reviewer 2). As such, we have clarified our experimental design for the optogenetic experiments in the revised manuscript:
Modified text: “No light-induced responses were found in control flies, which had the same genotype as experimental flies but were not fed all-trans retinal (-ATR), a necessary co-factor for channelrhodopsin function (see Methods).” and “Bottom trace is control animal, which has the same genotype as the experimental animal but was not fed the required all-trans retinal cofactor (-ATR).”
Figure 4-Figure Supplement 1 legend: “In all optogenetic experiments, control animals have the same genotypes as the corresponding experimental animals but have not been fed all-trans retinal.”
Methods: “For all optogenetic experiments, the control flies were of the same genotype as experimental flies but had not been fed all-trans retinal.”
- It appears that mostly IR25a is strongly co-expressed with other co-receptors. The provided experiments suggest a possible modulation between IR25a and Orco-dependent neuronal activity. However, what does this mean? How could this be relevant? And moreover, is this a feature of Drosophila melanogaster after many generations in laboratories?
We share this reviewer’s excitement regarding the numerous questions our work now raises. While testing additional functional ramifications of chemosensory co-receptor expression is beyond the scope of this work (but will undoubtedly be the focus of future studies), we did expand on what this might mean in the revised Discussion section of the revised manuscript. Previously, we had raised the hypothesis that chemoreceptor co-expression could be an evolutionary relic of Ir25a expression in all chemoreceptor neurons , or a biological mechanism to broaden the response profile of an olfactory neuron without sacrificing its ability to respond to specific odors. We now extend our discussion to raise additional possible ramifications. For example, we suggest that modulating Ir25a coexpression could alter the electrical properties of a neuron, making it more (or possibly less) sensitive to Orco-dependent responses. We also suggest that Ir25a coexpression might be an evolutionary mechanism to allow olfactory neurons to adjust their response activities. That is, that most Orco-positive olfactory neurons are already primed to be able to express a functional Ir receptor if one were to be expressed. Such co-expression in some olfactory neurons might present an evolutionary advantage by ensuring olfactory responses to a complex but crucial biologically relevant odor, like human odors to some mosquitoes.
Reviewer #2 (Public Review):
In the present study, the authors: 1) generated knock-in lines for Orco, Ir8a, Ir25a, and IR7ba, and examined their expression, with a main focus on the adult olfactory organs. 2) confirmed the expression of these receptors using antibody staining. 3) examined the innervation patterns of these knock-in lines in the nervous system. 4) identified a glomerulus, VM6, that is divided into three subdivisions. 5) examined olfactory responses of neurons co-expressing Orco and Ir25a
The results of the first four sets of experiments are well presented and support the conclusions, but the results of the last set of experiments (the electrophysiology part) need some details. Please find my detailed comments below.
We thank the reviewer for their support of our work and appreciating the importance of our findings. In the revised manuscript, we now provide the additional experimental details for the electrophysiology work as requested.
Major points
Line 167-171: I wonder if the authors also compared the Orco-T2A-QF2 knock-in with antibody staining of the antenna.
We did perform whole-mount anti-Orco antibody staining on Orco-T2A-QF2 > GFP antennae (example image below). We saw broad overlap between Orco+ and GFP+ cells, similar to the palps. However, we did not include these results since quantification of these tissues is challenging for the following reasons:
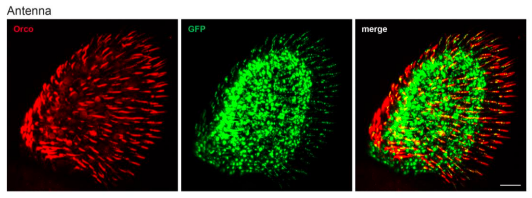
*Co-staining of anti-Orco and GFP in Orco-T2A-QF2 > 10xQUAS-6xGFP antenna *
Lines 316-319 (Figure 4D): It would be better if the authors compare the responses of Ir25a>CsChrimson to those of Orco>CsChrimson.
The goal of the optogenetic experiments was to provide experimental support for Ir25a expression in Orco+ neurons in an approach independent to previous methods. Our main question was whether we could activate what was previously considered Orco-only olfactory neurons using the Ir25a knock-in. These experiments were not designed to determine if this optogenetic activation recapitulated the normal activity of these neurons. For these reasons, we did not attempt the optogenetic experiments with Orco>CsChrimson flies.
Line 324-326: Why the authors tested control flies not fed all-trans retinal? They should test Ir25a-T2A-QF2>QUAS-CsChrimson not fed all-trans retinal as a control.
We apologize for the confusion. The “control” flies we used were indeed Ir25a-T2AQF2>QUAS-CsChrimson flies not fed all-trans retinal as suggested by the reviewer. This detail was in the methods, yet likely was not clear. We have amended the main text in multiple locations to state the full genotype of the control fly more clearly:
Modified text: “No light-induced responses were found in control flies, which had the same genotype as experimental flies but were not fed all-trans retinal (-ATR), a necessary co-factor for channelrhodopsin function (see Methods).” and “Bottom trace is control animal, which has the same genotype as the experimental animal but was not fed the required all-trans retinal cofactor (-ATR).”
Figure 4-Figure Supplement 1 legend: “In all optogenetic experiments, control animals have the same genotypes as the corresponding experimental animals but have not been fed all-trans retinal.”
Methods: “For all optogenetic experiments, the control flies were of the same genotype as experimental flies but had not been fed all-trans retinal.”
Line 478-500: I wonder if the observed differences between the wildtype and Ir25a2 mutant lines are due to differences in the genetic background between both lines. Did the authors backcross Ir25a2 mutant line with the used wildtype for at least five generations?
Yes, the mutants are outcrossed into the same genetic background as the wildtypes for at least five generations. Please see Methods, revised manuscript: “Ir25a2 and Orco2 mutant fly lines were outcrossed into the w1118 wildtype genetic background for at least 5 generations.”
Line 1602-1603: Does the identification of ab3 sensilla using fluorescent-guided SSR apply for ab3 sensilla in Orco mutant flies. How does this ab3 fluorescent-guided SSR work?
In fluorescence guided SSR (fgSSR; Lin and Potter, PloS One, 2015), the ab3 sensilla is GFPlabelled (genotype: Or22a-Gal4>UAS-mCD8:GFP), which allows this sensilla to be specifically identified under a microscope and targeted for SSR recordings. We generated fly stocks for fgSSR identification of ab3 in all three genetic backgrounds (wildtype, Orco mutant, Ir25a mutant).
These three genotypes are described in the methods:
“Full genotypes for ab3 fgSSR were:
Pin/CyO; Or22a-Gal4,15XUAS-IVS-mcd8GFP/TM6B (wildtype),
Ir25a2; Or22a-Gal4,15XUAS-IVS-mcd8GFP/TM6B (Ir25a2 mutant),
Or22a-Gal4/10XUAS-IVS-mcd8GFP (attp40); Orco2 (Orco2 mutant).”
Line 1602-1604: There is no mention of how the authors identified ab9 sensilla.
Information on the identification of ab9 sensilla is under the optogenetics section of the methods: “Identification of ab9 sensilla was assisted by fluorescence-guided Single Sensillum Recording (fgSSR) (Lin and Potter, 2015) using Or67b-Gal4 (BDSC #9995) recombined with 15XUAS-IVS-mCD8::GFP (BDSC #32193).”
Line 1648: what are the set of odorants that were used to identify the different coeloconic sensilla?
We have added the specific odorants used for sensillar identification for coeloconic SSR in the Methods. The protocol and odorants used were:
*2,3-butanedione (BUT), 1,4-diaminobutane (DIA), Ammonia (AM), hexanol (HEX), phenethylamine (PHEN), and propanal (PROP) to distinguish coeloconic sensilla:
o Wildtype flies: Strong DIA and BUT responses identify ac2 and rule out ac4. Absence of strong AM response rules out ac1, absence of HEX response rules out ac3, absence of PHEN response further rules out ac4.
o Ir25a mutant flies (amine responses lost, so cannot use PHEN and DIA as diagnostics): Strong BUT response and moderate PROP response identify ac2 and rule out ac4. Absence of strong AM response rules out ac1, absence of HEX response rules out ac3. Ac4 is further ruled out anatomically based on sensillar location compared to ac2.
Revised text: “Different classes of coeloconic sensilla were identified by their known location on the antenna and confirmed with their responses to a small panel of diagnostic odorants: in wildtype flies, ac2 sensilla were identified by their strong responses to 1,4-diaminobutane and 2,3-butanedione. The absence of a strong response to ammonia was used to rule out ac1 sensilla, the absence of a hexanol response was used to rule out ac3 sensilla, and the absence of a phenethylamine response was used to rule out ac4 sensilla. In Ir25a mutant flies in which amine responses were largely abolished, ac2 and ac4 sensilla were distinguished based on anatomical location, as well as the strong response of ac2 to 2,3-butanedione and the moderate response to propanal (both absent in ac4). Ac1 and ac3 sensilla were excluded similarly in the mutant and wildtype flies. No more than 4 sensilla per fly were recorded. Each sensillum was tested with multiple odorants, with a rest time of at least 10s between applications.
Enabling annotation of iframed content
In what ways do you think you’ve participated in any crowdsourcing online? What do you think a social media company’s responsibility is for the crowd actions taken by users on its platform? Do you think there are ways a social media platform can encourage good crowdsourcing and discourage bad crowdsourcing?
I've definitely taken part in crowdsourcing without even realizing it - like helping tag videos, report spam, or add info to online maps. I think social media companies should take some responsibility for what their users do, especially when harmful content spreads because of their design. Platforms could do more to guide people toward helpful actions, like fact-checking or supporting good causes, instead of just chasing clicks and treads.
Author response:
Reviewer #1 (Public Review):
In this paper, Tompary & Davachi present work looking at how memories become integrated over time in the brain, and relating those mechanisms to responses on a priming task as a behavioral measure of memory linkage. They find that remotely but not recently formed memories are behaviorally linked and that this is associated with a change in the neural representation in mPFC. They also find that the same behavioral outcomes are associated with the increased coupling of the posterior hippocampus with category-sensitive parts of the neocortex (LOC) during a post-learning rest period-again only for remotely learned information. There was also correspondence in rest connectivity (posterior hippocampus-LOC) and representational change (mPFC) such that for remote memories specifically, the initial post-learning connectivity enhancement during rest related to longer-term mPFC representational change.
This work has many strengths. The topic of this paper is very interesting, and the data provide a really nice package in terms of providing a mechanistic account of how memories become integrated over a delay. The paper is also exceptionally well-written and a pleasure to read. There are two studies, including one large behavioral study, and the findings replicate in the smaller fMRI sample. I do however have two fairly substantive concerns about the analytic approach, where more data will be required before we can know whether the interpretations are an appropriate reflection of the findings. These and other concerns are described below.
Thank you for the positive comments! We are proud of this work, and we feel that the paper is greatly strengthened by the revisions we made in response to your feedback. Please see below for specific changes that we’ve made.
1) One major concern relates to the lack of a pre-encoding baseline scan prior to recent learning.
a) First, I think it would be helpful if the authors could clarify why there was no pre-learning rest scan dedicated to the recent condition. Was this simply a feasibility consideration, or were there theoretical reasons why this would be less "clean"? Including this information in the paper would be helpful for context. Apologies if I missed this detail in the paper.
This is a great point and something that we struggled with when developing this experiment. We considered several factors when deciding whether to include a pre-learning baseline on day two. First, the day 2 scan session was longer than that of day 1 because it included the recognition priming and explicit memory tasks, and the addition of a baseline scan would have made the length of the session longer than a typical scan session – about 2 hours in the scanner in total – and we were concerned that participant engagement would be difficult to sustain across a longer session. Second, we anticipated that the pre-learning scan would not have been a ‘clean’ measure of baseline processing, but rather would include signal related to post-learning processing of the day 1 sequences, as multi-variate reactivation of learned stimuli have been observed in rest scans collected 24-hours after learning (Schlichting & Preston, 2014). We have added these considerations to the Discussion (page 39, lines 1047-1070).
b) Second, I was hoping the authors could speak to what they think is reflected in the post-encoding "recent" scan. Is it possible that these data could also reflect the processing of the remote memories? I think, though am not positive, that the authors may be alluding to this in the penultimate paragraph of the discussion (p. 33) when noting the LOC-mPFC connectivity findings. Could there be the reinstatement of the old memories due to being back in the same experimental context and so forth? I wonder the extent to which the authors think the data from this scan can be reflected as strictly reflecting recent memories, particularly given it is relative to the pre-encoding baseline from before the remote memories, as well (and therefore in theory could reflect both the remote + recent). (I should also acknowledge that, if it is the case that the authors think there might be some remote memory processing during the recent learning session in general, a pre-learning rest scan might not have been "clean" either, in that it could have reflected some processing of the remote memories-i.e., perhaps a clean pre-learning scan for the recent learning session related to point 1a is simply not possible.)
We propose that theoretically, the post-learning recent scan could indeed reflect mixture of remote and recent sequences. This is one of the drawbacks of splitting encoding into two sessions rather than combining encoding into one session and splitting retrieval into an immediate and delayed session; any rest scans that are collected on Day 2 may have signal that relates to processing of the Day 1 remote sequences, which is why we decided against the pre-learning baseline for Day 2, as you had noted.
You are correct that we alluded to in our original submission when discussing the LOC-mPFC coupling result, and we have taken steps to discuss this more explicitly. In Brief, we find greater LOC-mPFC connectivity only after recent learning relative to the pre-learning baseline, and cortical-cortical connectivity could be indicative of processing memories that already have undergone some consolidation (Takashima et al., 2009; Smith et al., 2010). From another vantage point, the mPFC representation of Day 1 learning may have led to increased connectivity with LOC on Day 2 due to Day 1 learning beginning to resemble consolidated prior knowledge (van Kesteren et al., 2010). While this effect is consistent with prior literature and theory, it's unclear why we would find evidence of processing of the remote memories and not the recent memories. Furthermore, the change in LOC-mPFC connectivity in this scan did not correlate with memory behaviors from either learning session, which could be because signal from this scan reflects a mix of processing of the two different learning sessions. With these ideas in mind, we have fleshed out the discussion of the post-encoding ‘recent’ scan in the Discussion (page 38-39, lines 1039-1044).
c) Third, I am thinking about how both of the above issues might relate to the authors' findings, and would love to see more added to the paper to address this point. Specifically, I assume there are fluctuations in baseline connectivity profile across days within a person, such that the pre-learning connectivity on day 1 might be different from on day 2. Given that, and the lack of a pre-learning connectivity measure on day 2, it would logically follow that the measure of connectivity change from pre- to post-learning is going to be cleaner for the remote memories. In other words, could the lack of connectivity change observed for the recent scan simply be due to the lack of a within-day baseline? Given that otherwise, the post-learning rest should be the same in that it is an immediate reflection of how connectivity changes as a function of learning (depending on whether the authors think that the "recent" scan is actually reflecting "recent + remote"), it seems odd that they both don't show the same corresponding increase in connectivity-which makes me think it may be a baseline difference. I am not sure if this is what the authors are implying when they talk about how day 1 is most similar to prior investigation on p. 20, but if so it might be helpful to state that directly.
We agree that it is puzzling that we don’t see that hippocampal-LOC connectivity does not also increase after recent learning, equivalently to what we see after remote learning. However, the fact that there is an increase from baseline rest to post-recent rest in mPFC – LOC connectivity suggests that it’s not an issue with baseline, but rather that the post-recent learning scan is reflecting processing of the remote memories (although as a caveat, there is no relationship with priming).
On what is now page 23, we were referring to the notion that the Day 1 procedure (baseline rest, learning, post-learning rest) is the most straightforward replication of past work that finds a relationship between hippocampal-cortical coupling and later memory. In contrast, the Day 2 learning and rest scan are less ‘clean’ of a replication in that they are taking place in the shadow of Day 1 learning. We have clarified this in the Results (page 23, lines 597-598).
d) Fourth and very related to my point 1c, I wonder if the lack of correlations for the recent scan with behavior is interpretable, or if it might just be that this is a noisy measure due to imperfect baseline correction. Do the authors have any data or logic they might be able to provide that could speak to these points? One thing that comes to mind is seeing whether the raw post-learning connectivity values (separately for both recent and remote) show the same pattern as the different scores. However, the authors may come up with other clever ways to address this point. If not, it might be worth acknowledging this interpretive challenge in the Discussion.
We thought of three different approaches that could help us to understand whether the lack of correlations in between coupling and behavior in the recent scan was due to noise. First, we correlated recognition priming with raw hippocampal-LOC coupling separately for pre- and post-learning scans, as in Author response image 1:
Author response image 1.
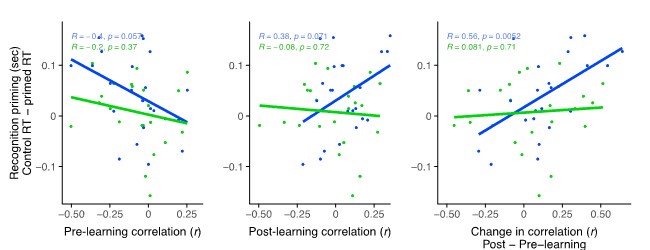
Note that the post-learning chart depicts the relationship between post-remote coupling and remote priming and between post-recent coupling and recent priming (middle). Essentially, post-recent learning coupling did not relate to priming of recently learned sequences (middle; green) while there remains a trend for a relationship between post-remote coupling and priming for remotely learned sequences (middle; blue). However, the significant relationship between coupling and priming that we reported in the paper (right, blue) is driven both by the initial negative relationship that is observed in the pre-learning scan and the positive relationship in the post-remote learning scan. This highlights the importance of using a change score, as there may be spurious initial relationships between connectivity profiles and to-be-learned information that would then mask any learning- and consolidation-related changes.
We also reasoned that if comparisons between the post-recent learning scan and the baseline scan are noisier than between the post-remote learning and baseline scan, there may be differences in the variance of the change scores across participants, such that changes in coupling from baseline to post-recent rest may be more variable than coupling from baseline to post-remote rest. We conducted F-tests to compare the variance of the change in these two hippocampal-LO correlations and found no reliable difference (ratio of difference: F(22, 22) = 0.811, p = .63).
Finally, we explored whether hippocampal-LOC coupling is more stable across participants if compared across two rest scans within the same imaging session (baseline and post-remote) versus across two scans across two separate sessions (baseline and post-recent). Interestingly, coupling was not reliably correlated across scans in either case (baseline/post-remote: r = 0.03, p = 0.89 Baseline/post-recent: r = 0.07, p = .74).
Finally, we evaluated whether hippocampal-LOC coupling was correlated across different rest scans (see Author response image 2). We reasoned that if such coupling was more correlated across baseline and post-remote scans relative to baseline and post-recent scans, that would indicate a within-session stability of participants’ connectivity profiles. At the same time, less correlation of coupling across baseline and post-recent scans would be an indication of a noisier change measure as the measure would additionally include a change in individuals’ connectivity profile over time. We found that there was no difference in the correlation of hipp-LO coupling is across sessions, and the correlation was not reliably significant for either session (baseline/post-remote: r = 0.03, p = 0.89; baseline/post-recent: r = 0.07, p = .74; difference: Steiger’s t = 0.12, p = 0.9).
Author response image 2.
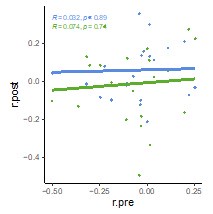
We have included the raw correlations with priming (page 25, lines 654-661, Supplemental Figure 6) as well as text describing the comparison of variances (page 25, lines 642-653). We did not add the comparison of hippocampal-LOC coupling across scans to the current manuscript, as an evaluation of stability of such coupling in the context of learning and reactivation seems out of scope of the current focus of the experiment, but we find this result to be worthy of follow-up in future work.
In summary, further analysis of our data did not reveal any indication that a comparison of rest connectivity across scan sessions inserted noise into the change score between baseline and post-recent learning scans. However, these analyses cannot fully rule that possibility out, and the current analyses do not provide concrete evidence that the post-recent learning scan comprises signals that are a mixture of processing of recent and remote sequences. We discuss these drawbacks in the Discussion (page 39, lines 1047-1070).
2) My second major concern is how the authors have operationalized integration and differentiation. The pattern similarity analysis uses an overall correspondence between the neural similarity and a predicted model as the main metric. In the predicted model, C items that are indirectly associated are more similar to one another than they are C items that are entirely unrelated. The authors are then looking at a change in correspondence (correlation) between the neural data and that prediction model from pre- to post-learning. However, a change in the degree of correspondence with the predicted matrix could be driven by either the unrelated items becoming less similar or the related ones becoming more similar (or both!). Since the interpretation in the paper focuses on change to indirectly related C items, it would be important to report those values directly. For instance, as evidence of differentiation, it would be important to show that there is a greater decrease in similarity for indirectly associated C items than it is for unrelated C items (or even a smaller increase) from pre to post, or that C items that are indirectly related are less similar than are unrelated C items post but not pre-learning. Performing this analysis would confirm that the pattern of results matches the authors' interpretation. This would also impact the interpretation of the subsequent analyses that involve the neural integration measures (e.g., correlation analyses like those on p. 16, which may or may not be driven by increased similarity among overlapping C pairs). I should add that given the specificity to the remote learning in mPFC versus recent in LOC and anterior hippocampus, it is clearly the case that something interesting is going on. However, I think we need more data to understand fully what that "something" is.
We recognize the importance of understanding whether model fits (and changes to them) are driven by similarity of overlapping pairs or non-overlapping pairs. We have modified all figures that visualize model fits to the neural integration model to separately show fits for pre- and post-learning (Figure 3 for mPFC, Supp. Figure 5 for LOC, Supp. Figure 9 for AB similarity in anterior hippocampus & LOC). We have additionally added supplemental figures to show the complete breakdown of similarity each region in a 2 (pre/post) x 2 (overlapping/non-overlapping sequence) x 2 (recent/remote) chart. We decided against including only these latter charts rather than the model fits since the model fits strike a good balance between information and readability. We have also modified text in various sections to focus on these new results.
In brief, the decrease in model fit for mPFC for the remote sequences was driven primarily by a decrease in similarity for the overlapping C items and not the non-overlapping ones (Supplementary Figure 3, page 18, lines 468-472).
Interestingly, in LOC, all C items grew more similar after learning, regardless of their overlap or learning session, but the increase in model fit for C items in the recent condition was driven by a larger increase in similarity for overlapping pairs relative to non-overlapping ones (Supp. Figure 5, page 21, lines 533-536).
We also visualized AB similarity in the anterior hippocampus and LOC in a similar fashion (Supplementary Figure 9).
We have also edited the Methods sections with updated details of these analyses (page 52, lines 1392-1397). We think that including these results considerably strengthen our claims and we are pleased to have them included.
3) The priming task occurred before the post-learning exposure phase and could have impacted the representations. More consideration of this in the paper would be useful. Most critically, since the priming task involves seeing the related C items back-to-back, it would be important to consider whether this experience could have conceivably impacted the neural integration indices. I believe it never would have been the case that unrelated C items were presented sequentially during the priming task, i.e., that related C items always appeared together in this task. I think again the specificity of the remote condition is key and perhaps the authors can leverage this to support their interpretation. Can the authors consider this possibility in the Discussion?
It's true that only C items from the same sequence were presented back-to-back during the priming task, and that this presentation may interfere with observations from the post-learning exposure scan that followed it. We agree that it is worth considering this caveat and have added language in the Discussion (page 40, lines 1071-1086). When designing the study, we reasoned that it was more important for the behavioral priming task to come before the exposure scans, as all items were shown only once in that task, whereas they were shown 4-5 times in a random order in the post-learning exposure phase. Because of this difference in presentation times, and because behavioral priming findings tend to be very sensitive, we concluded that it was more important to protect the priming task from the exposure scan instead of the reverse.
We reasoned, however, that the additional presentation of the C items in the recognition priming task would not substantially override the sequence learning, as C items were each presented 16 times in their sequence (ABC1 and ABC2 16 times each). Furthermore, as this reviewer suggests, the order of C items during recognition was the same for recent and remote conditions, so the fact that we find a selective change in neural representation for the remote condition and don’t also see that change for the recent condition is additional assurance that the recognition priming order did not substantially impact the representations.
4) For the priming task, based on the Figure 2A caption it seems as though every sequence contributes to both the control and primed conditions, but (I believe) this means that the control transition always happens first (and they are always back-to-back). Is this a concern? If RTs are changing over time (getting faster), it would be helpful to know whether the priming effects hold after controlling for trial numbers. I do not think this is a big issue because if it were, you would not expect to see the specificity of the remotely learned information. However, it would be helpful to know given the order of these conditions has to be fixed in their design.
This is a correct understanding of the trial orders in the recognition priming task. We chose to involve the baseline items in the control condition to boost power – this way, priming of each sequence could be tested, while only presenting each item once in this task, as repetition in the recognition phase would have further facilitated response times and potentially masked any priming effects. We agree that accounting for trial order would be useful here, so we ran a mixed-effects linear model to examine responses times both as a function of trial number and of priming condition (primed/control). While there is indeed a large effect of trial number such that participants got faster over time, the priming effect originally observed in the remote condition still holds at the same time. We now report this analysis in the Results section (page 14, lines 337-349 for Expt 1 and pages 14-15, lines 360-362 for Expt 2).
5) The authors should be cautious about the general conclusion that memories with overlapping temporal regularities become neurally integrated - given their findings in MPFC are more consistent with overall differentiation (though as noted above, I think we need more data on this to know for sure what is going on).
We realize this conclusion was overly simplistic and, in several places, have revised the general conclusions to be more specific about the nuanced similarity findings.
6) It would be worth stating a few more details and perhaps providing additional logic or justification in the main text about the pre- and post-exposure phases were set up and why. How many times each object was presented pre and post, and how the sequencing was determined (were any constraints put in place e.g., such that C1 and C2 did not appear close in time?). What was the cover task (I think this is important to the interpretation & so belongs in the main paper)? Were there considerations involving the fact that this is a different sequence of the same objects the participants would later be learning - e.g., interference, etc.?
These details can be found in the Methods section (pages 50-51, lines 1337-1353) and we’ve added a new summary of that section in the Results (page 17, lines 424- 425 and 432-435). In brief, a visual hash tag appeared on a small subset of images and participants pressed a button when this occurred, and C1 and C2 objects were presented in separate scans (as were A and B objects) to minimize inflated neural similarity due to temporal proximity.
Reviewer #2 (Public Review):
The manuscript by Tompary & Davachi presents results from two experiments, one behavior only and one fMRI plus behavior. They examine the important question of how to separate object memories (C1 and C2) that are never experienced together in time and become linked by shared predictive cues in a sequence (A followed by B followed by one of the C items). The authors developed an implicit priming task that provides a novel behavioral metric for such integration. They find significant C1-C2 priming for sequences that were learned 24h prior to the test, but not for recently learned sequences, suggesting that associative links between the two originally separate memories emerge over an extended period of consolidation. The fMRI study relates this behavioral integration effect to two neural metrics: pattern similarity changes in the medial prefrontal cortex (mPFC) as a measure of neural integration, and changes in hippocampal-LOC connectivity as a measure of post-learning consolidation. While fMRI patterns in mPFC overall show differentiation rather than integration (i.e., C1-C2 representational distances become larger), the authors find a robust correlation such that increasing pattern similarity in mPFC relates to stronger integration in the priming test, and this relationship is again specific to remote memories. Moreover, connectivity between the posterior hippocampus and LOC during post-learning rest is positively related to the behavioral integration effect as well as the mPFC neural similarity index, again specifically for remote memories. Overall, this is a coherent set of findings with interesting theoretical implications for consolidation theories, which will be of broad interest to the memory, learning, and predictive coding communities.
Strengths:
1) The implicit associative priming task designed for this study provides a promising new tool for assessing the formation of mnemonic links that influence behavior without explicit retrieval demands. The authors find an interesting dissociation between this implicit measure of memory integration and more commonly used explicit inference measures: a priming effect on the implicit task only evolved after a 24h consolidation period, while the ability to explicitly link the two critical object memories is present immediately after learning. While speculative at this point, these two measures thus appear to tap into neocortical and hippocampal learning processes, respectively, and this potential dissociation will be of interest to future studies investigating time-dependent integration processes in memory.
2) The experimental task is well designed for isolating pre- vs post-learning changes in neural similarity and connectivity, including important controls of baseline neural similarity and connectivity.
3) The main claim of a consolidation-dependent effect is supported by a coherent set of findings that relate behavioral integration to neural changes. The specificity of the effects on remote memories makes the results particularly interesting and compelling.
4) The authors are transparent about unexpected results, for example, the finding that overall similarity in mPFC is consistent with a differentiation rather than an integration model.
Thank you for the positive comments!
Weaknesses:
1) The sequence learning and recognition priming tasks are cleverly designed to isolate the effects of interest while controlling for potential order effects. However, due to the complex nature of the task, it is difficult for the reader to infer all the transition probabilities between item types and how they may influence the behavioral priming results. For example, baseline items (BL) are interspersed between repeated sequences during learning, and thus presumably can only occur before an A item or after a C item. This seems to create non-random predictive relationships such that C is often followed by BL, and BL by A items. If this relationship is reversed during the recognition priming task, where the sequence is always BL-C1-C2, this violation of expectations might slow down reaction times and deflate the baseline measure. It would be helpful if the manuscript explicitly reported transition probabilities for each relevant item type in the priming task relative to the sequence learning task and discussed how a match vs mismatch may influence the observed priming effects.
We have added a table of transition probabilities across the learning, recognition priming, and exposure scans (now Table 1, page 48). We have also included some additional description of the change in transition probabilities across different tasks in the Methods section. Specifically, if participants are indeed learning item types and rules about their order, then both the control and the primed conditions would violate that order. Since C1 and C2 items never appeared together, viewing C1 would give rise to an expectation of seeing a BL item, which would also be violated. This suggests that our priming effects are driven by sequence-specific relationships rather than learning of the probabilities of different item types. We’ve added this consideration to the Methods section (page 45, lines 1212-1221).
Another critical point to consider (and that the transition probabilities do not reflect) is that during learning, while C is followed either by A or BL, they are followed by different A or BL items. In contrast, a given A is always followed by the same B object, which is always followed by one of two C objects. While the order of item types is semi-predictable, the order of objects (specific items) themselves are not. This can be seen in the response times during learning, such that response times for A and BL items are always slower than for B and C items. We have explained this nuance in the figure text for Table 1.
2) The choice of what regions of interest to include in the different sets of analyses could be better motivated. For example, even though briefly discussed in the intro, it remains unclear why the posterior but not the anterior hippocampus is of interest for the connectivity analyses, and why the main target is LOC, not mPFC, given past results including from this group (Tompary & Davachi, 2017). Moreover, for readers not familiar with this literature, it would help if references were provided to suggest that a predictable > unpredictable contrast is well suited for functionally defining mPFC, as done in the present study.
We have clarified our reasoning for each of these choices throughout the manuscript and believe that our logic is now much more transparent. For an expanded reasoning of why we were motivated to look at posterior and not anterior hippocampus, see pages 6-7, lines 135-159, and our response to R2. In brief, past research focusing on post-encoding connectivity with the hippocampus suggests that posterior aspect is more likely to couple with category-selective cortex after learning neutral, non-rewarded objects much like the stimuli used in the present study.
We also clarify our reasoning for LOC over mPFC. While theoretically, mPFC is thought to be a candidate region for coupling with the hippocampus during consolidation, the bulk of empirical work to date has revealed post-encoding connectivity between the hippocampus and category-selective cortex in the ventral and occipital lobes (page 6, lines 123-134).
As for the use of the predictable > unpredictable contrast for functionally defining cortical regions, we reasoned that cortical regions that were sensitive to the temporal regularities generated by the sequences may be further involved in their offline consolidation and long-term storage (Danker & Anderson, 2010; Davachi & Danker, 2013; McClelland et al., 1995). We have added this justification to the Methods section (page 18, lines 454-460).
3) Relatedly, multiple comparison corrections should be applied in the fMRI integration and connectivity analyses whenever the same contrast is performed on multiple regions in an exploratory manner.
We now correct for multiple comparisons using Bonferroni correction, and this correction depends on the number of regions in which each analysis is conducted. Please see page 55, lines 1483-1490, in the Methods section for details of each analysis.
Reviewer #3 (Public Review):
The authors of this manuscript sought to illuminate a link between a behavioral measure of integration and neural markers of cortical integration associated with systems consolidation (post-encoding connectivity, change in representational neural overlap). To that aim, participants incidentally encoded sequences of objects in the fMRI scanner. Unbeknownst to participants, the first two objects of the presented ABC triplet sequences overlapped for a given pair of sequences. This allowed the authors to probe the integration of unique C objects that were never directly presented in the same sequence, but which shared the same preceding A and B objects. They encoded one set of objects on Day 1 (remote condition), another set of objects 24 hours later (recent condition) and tested implicit and explicit memory for the learned sequences on Day 2. They additionally collected baseline and post-encoding resting-state scans. As their measure of behavioral integration, the authors examined reaction time during an Old/New judgement task for C objects depending on if they were preceded by a C object from an overlapping sequence (primed condition) versus a baseline object. They found faster reaction times for the primed objects compared to the control condition for remote but not recently learned objects, suggesting that the C objects from overlapping sequences became integrated over time. They then examined pattern similarity in a priori ROIs as a measure of neural integration and found that participants showing evidence of integration of C objects from overlapping sequences in the medial prefrontal cortex for remotely learned objects also showed a stronger implicit priming effect between those C objects over time. When they examined the change in connectivity between their ROIs after encoding, they also found that connectivity between the posterior hippocampus and lateral occipital cortex correlated with larger priming effects for remotely learned objects, and that lateral occipital connectivity with the medial prefrontal cortex was related to neural integration of remote objects from overlapping sequences.
The authors aim to provide evidence of a relationship between behavioral and neural measures of integration with consolidation is interesting, important, and difficult to achieve given the longitudinal nature of studies required to answer this question. Strengths of this study include a creative behavioral task, and solid modelling approaches for fMRI data with careful control for several known confounds such as bold activation on pattern analysis results, motion, and physiological noise. The authors replicate their behavioral observations across two separate experiments, one of which included a large sample size, and found similar results that speak to the reliability of the observed behavioral phenomenon. In addition, they document several correlations between neural measures and task performance, lending functional significance to their neural findings.
Thank you for this positive assessment of our study!
However, this study is not without notable weaknesses that limit the strength of the manuscript. The authors report a behavioral priming effect suggestive of integration of remote but not recent memories, leading to the interpretation that the priming effect emerges with consolidation. However, they did not observe a reliable interaction between the priming condition and learning session (recent/remote) on reaction times, meaning that the priming effect for remote memories was not reliably greater than that observed for recent. In addition, the emergence of a priming effect for remote memories does not appear to be due to faster reaction times for primed targets over time (the condition of interest), but rather, slower reaction times for control items in the remote condition compared to recent. These issues limit the strength of the claim that the priming effect observed is due to C items of interest being integrated in a consolidation-dependent manner.
We acknowledge that the lack of a day by condition interaction in the behavioral priming effect should discussed and now discuss this data in a more nuanced manner. While it’s true that the priming effect emerges due to a slowing of the control items over time, this slowing is consistent with classic time-dependent effects demonstrating slower response times for more delayed memories. The fact that the response times in the primed condition does not show this slowing can be interpreted as a protection against this slowing that would otherwise occur. Please see page 29, lines 758-766, for this added discussion.
Similarly, the interactions between neural variables of interest and learning session needed to strongly show a significant consolidation-related effect in the brain were sometimes tenuous. There was no reliable difference in neural representational pattern analysis fit to a model of neural integration between the short and long delays in the medial prefrontal cortex or lateral occipital cortex, nor was the posterior hippocampus-lateral occipital cortex post-encoding connectivity correlation with subsequent priming significantly different for recent and remote memories. While the relationship between integration model fit in the medial prefrontal cortex and subsequent priming (which was significantly different from that occurring for recent memories) was one of the stronger findings of the paper in favor of a consolidation-related effect on behavior, is it possible that lack of a behavioral priming effect for recent memories due to possible issues with the control condition could mask a correlation between neural and behavioral integration in the recent memory condition?
While we acknowledge that lack of a statistically reliable interaction between neural measures and behavioral priming in many cases, we are heartened by the reliable difference in the relationship between mPFC similarity and priming over time, which was our main planned prediction. In addition to adding caveats in the discussion about the neural measures and behavioral findings in the recent condition (see our response to R1.1 and R1.4 for more details), we have added language throughout the manuscript noting the need to interpret these data with caution.
These limitations are especially notable when one considers that priming does not classically require a period of prolonged consolidation to occur, and prominent models of systems consolidation rather pertain to explicit memory. While the authors have provided evidence that neural integration in the medial prefrontal cortex, as well as post-encoding coupling between the lateral occipital cortex and posterior hippocampus, are related to faster reaction times for primed objects of overlapping sequences compared to their control condition, more work is needed to verify that the observed findings indeed reflect consolidation dependent integration as proposed.
We agree that more work is needed to provide converging evidence for these novel findings. However, we wish to counter the notion that systems consolidation models are relevant only for explicit memories. Although models of systems consolidation often mention transformations from episodic to semantic memory, the critical mechanisms that define the models involve changes in the neural ensembles of a memory that is initially laid down in the hippocampus and is taught to cortex over time. This transformation of neural traces is not specific to explicit/declarative forms of memory. For example, implicit statistical learning initially depends on intact hippocampal function (Schapiro et al., 2014) and improves over consolidation (Durrant et al., 2011, 2013; Kóbor et al., 2017).
Second, while there are many classical findings of priming during or immediately after learning, there are several instances of priming used to measure consolidation-related changes to newly learned information. For instance, priming has been used as a measure of lexical integration, demonstrating that new word learning benefits from a night of sleep (Wang et al., 2017; Gaskell et al., 2019) or a 1-week delay (Tamminen & Gaskell, 2013). The issue is not whether priming can occur immediately, it is whether priming increases with a delay.
Finally, it is helpful to think about models of memory systems that divide memory representations not by their explicit/implicit nature, but along other important dimensions such as their neural bases, their flexibility vs rigidity, and their capacity for rapid vs slow learning (Henke, 2010). Considering this evidence, we suggest that systems consolidation models are most useful when considering how transformations in the underlying neural memory representation affects its behavioral expression, rather than focusing on the extent that the memory representation is explicit or implicit.
With all this said, we have added text to the discussion reminding the reader that there was no statistically significant difference in priming as a function of the delay (page 29, lines 764 - 766). However, we are encouraged by the fact that the relationship between priming and mPFC neural similarity was significantly stronger for remotely learned objects relative to recently learned ones, as this is directly in line with systems consolidation theories.
References
Abolghasem, Z., Teng, T. H.-T., Nexha, E., Zhu, C., Jean, C. S., Castrillon, M., Che, E., Di Nallo, E. V., & Schlichting, M. L. (2023). Learning strategy differentially impacts memory connections in children and adults. Developmental Science, 26(4), e13371. https://doi.org/10.1111/desc.13371
Dobbins, I. G., Schnyer, D. M., Verfaellie, M., & Schacter, D. L. (2004). Cortical activity reductions during repetition priming can result from rapid response learning. Nature, 428(6980), 316–319. https://doi.org/10.1038/nature02400
Durrant, S. J., Cairney, S. A., & Lewis, P. A. (2013). Overnight consolidation aids the transfer of statistical knowledge from the medial temporal lobe to the striatum. Cerebral Cortex, 23(10), 2467–2478. https://doi.org/10.1093/cercor/bhs244
Durrant, S. J., Taylor, C., Cairney, S., & Lewis, P. A. (2011). Sleep-dependent consolidation of statistical learning. Neuropsychologia, 49(5), 1322–1331. https://doi.org/10.1016/j.neuropsychologia.2011.02.015
Gaskell, M. G., Cairney, S. A., & Rodd, J. M. (2019). Contextual priming of word meanings is stabilized over sleep. Cognition, 182, 109–126. https://doi.org/10.1016/j.cognition.2018.09.007
Henke, K. (2010). A model for memory systems based on processing modes rather than consciousness. Nature Reviews Neuroscience, 11(7), 523–532. https://doi.org/10.1038/nrn2850
Kóbor, A., Janacsek, K., Takács, Á., & Nemeth, D. (2017). Statistical learning leads to persistent memory: Evidence for one-year consolidation. Scientific Reports, 7(1), 760. https://doi.org/10.1038/s41598-017-00807-3
Kuhl, B. A., & Chun, M. M. (2014). Successful remembering elicits event-specific activity patterns in lateral parietal cortex. The Journal of Neuroscience, 34(23), 8051–8060. https://doi.org/10.1523/JNEUROSCI.4328-13.2014
Richter, F. R., Chanales, A. J. H., & Kuhl, B. A. (2016). Predicting the integration of overlapping memories by decoding mnemonic processing states during learning. NeuroImage, 124, Part A, 323–335. https://doi.org/10.1016/j.neuroimage.2015.08.051
Schapiro, A. C., Gregory, E., Landau, B., McCloskey, M., & Turk-Browne, N. B. (2014). The necessity of the medial-temporal lobe for statistical learning. Journal of Cognitive Neuroscience, 1–12. https://doi.org/10.1162/jocn_a_00578
Schlichting, M. L., & Preston, A. R. (2014). Memory reactivation during rest supports upcoming learning of related content. Proceedings of the National Academy of Sciences, 111(44), 15845–15850. https://doi.org/10.1073/pnas.1404396111
Smith, J. F., Alexander, G. E., Chen, K., Husain, F. T., Kim, J., Pajor, N., & Horwitz, B. (2010). Imaging systems level consolidation of novel associate memories: A longitudinal neuroimaging study. NeuroImage, 50(2), 826–836. https://doi.org/10.1016/j.neuroimage.2009.11.053
Takashima, A., Nieuwenhuis, I. L. C., Jensen, O., Talamini, L. M., Rijpkema, M., & Fernández, G. (2009). Shift from hippocampal to neocortical centered retrieval network with consolidation. The Journal of Neuroscience, 29(32), 10087–10093. https://doi.org/10.1523/JNEUROSCI.0799-09.2009
Tamminen, J., & Gaskell, M. G. (2013). Novel word integration in the mental lexicon: Evidence from unmasked and masked semantic priming. The Quarterly Journal of Experimental Psychology, 66(5), 1001–1025. https://doi.org/10.1080/17470218.2012.724694
van Kesteren, M. T. R. van, Fernández, G., Norris, D. G., & Hermans, E. J. (2010). Persistent schema-dependent hippocampal-neocortical connectivity during memory encoding and postencoding rest in humans. Proceedings of the National Academy of Sciences, 107(16), 7550–7555. https://doi.org/10.1073/pnas.0914892107
Wang, H.-C., Savage, G., Gaskell, M. G., Paulin, T., Robidoux, S., & Castles, A. (2017). Bedding down new words: Sleep promotes the emergence of lexical competition in visual word recognition. Psychonomic Bulletin & Review, 24(4), 1186–1193. https://doi.org/10.3758/s13423-016-1182-7
Author Response:
Reviewer #3:
The authors modified a previously reported hybrid cytochrome bcc-aa3 supercomplex, consisting of bcc from M. tuberculosis and aa3 from M. smegmatis, (Kim et al 2015) by appending an affinity tag facilitating purification. The cryo-EM experiments are based on the authors' earlier work (Gong et al. 2018) on the structure of the bcc-aa3 supercomplex from M. smegmatis. The authors then determine the structure of the bcc part alone and in complex with Q203 and TB47.
The manuscript is well written and the obtained results are presented in a concise, clear-cut manner. In general, the data support the conclusions drawn.
We thank the reviewer for this evaluation.
To this reviewer, the following points are unclear:
- The purified enzyme elutes from the gel filtration column as one peak, but there seems to be no information given on the subunit composition and the enzymatic activity of the purified hybrid cytochrome bcc-aa3 supercomplex.
See answers to Question 1 from the major Essential Revisions and Question 1 from the minor Essential Revisions.
"We have now shown that the purified chimeric supercomplex is a functional assembly with a (mean ± s.d., n = 4), in agreement with the previous study that shows M. tuberculosis CIII can functionally complement native M. smegmatis CIII and maintain the growth of M. smegmatis (Kim et al., 2015). The in vitro inhibitions of this enzyme by Q203 and TB47 was determined by means of an DMNQH2/oxygen oxidoreductase activity assay. In the assay, 500 nM Q203 or TB47 was chosen, which is close to the median inhibitory concentration (IC50) obtained from the menadiol-induced oxygen consumption in our previous study (Gong et al., 2018). After addition of Q203 and TB47, the values of turnover number of the hybrid supercomplex are reduced to 5.8 +/- 2.4 e-s-1 (Figure 4-figure supplement 4) and 5.1 +/- 2.9 e-s-1 (Figure 5-figure supplement 4) respectively, from 23.3 +/- 2.4 e-s-1. We have incorporated this new data into the text (lines 90-93, 187-189, 206-209)."
"The subunit composition of the purified enzyme has now been provided in Figure 2-figure supplement 1."
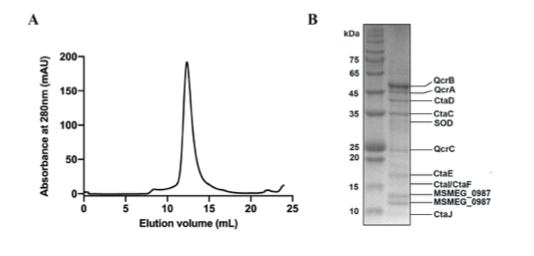
- It is unclear what is the conclusion of the structure comparison (Fig 6) is regarding the affinity of Q203 for M. smegmatis.
The structural comparison indicates that Q203 should have a similar binding mechanism and a similar effect on the activity of cytochrome bcc from M. smegmatis and M. tuberculosis. This is in good agreement with previous antimycobacterial activity data and inhibition data for the bcc complexes from M. smegmatis and M. tuberculosis (Gong et al., 2018; Lu et al., 2018a). These have now been incorporated into the revised manuscript (line 223-227).
Author Response
Reviewer #1 (Public Review):
The manuscript by Royall et al. builds on previous work in the mouse that indicates that neural progenitor cells (NPCs) undergo asymmetric inheritance of centrosomes and provides evidence that a similar process occurs in human NPCs, which was previously unknown.
The authors use hESC-derived forebrain organoids and develop a novel recombination tag-induced genetic tool to birthdate and track the segregation of centrosomes in NPCs over multiple divisions. The thoughtful experiments yield data that are concise and well-controlled, and the data support the asymmetric segregation of centrosomes in NPCs. These data indicate that at least apical NPCs in humans undergo asymmetric centrosome inheritance. The authors attempt to disrupt the process and present some data that there may be differences in cell fate, but this conclusion would be better supported by a better assessment of the fate of these different NPCs (e.g. NPCs versus new neurons) and would support the conclusion that younger centriole is inherited by new neurons.
We thank the reviewer for their supportive comments (“…thoughtful experiments yield data that are concise and well-controlled…”).
Reviewer #2 (Public Review):
Royall et al. examine the asymmetric inheritance of centrosomes during human brain development. In agreement with previous studies in mice, their data suggest that the older centrosome is inherited by the self-renewing daughter cell, whereas the younger centrosome is inherited by the differentiating daughter cell. The key importance of this study is to show that this phenomenon takes place during human brain development, which the authors achieved by utilizing forebrain organoids as a model system and applying the recombination-induced tag exchange (RITE) technology to birthdate and track the centrosomes.
Overall, the study is well executed and brings new insights of general interest for cell and developmental biology with particular relevance to developmental neurobiology. The Discussion is excellent, it brings this study into the context of previous work and proposes very appealing suggestions on the evolutionary relevance and underlying mechanisms of the asymmetric inheritance of centrosomes. The main weakness of the study is that it tackles asymmetric inheritance only using fixed organoid samples. Although the authors developed a reasonable mode to assign the clonal relationships in their images, this study would be much stronger if the authors could apply time-lapse microscopy to show the asymmetric inheritance of centrosomes.
We thank the reviewer for their constructive and supportive comments (“…the study is well executed and brings new insights of general interest for cell and developmental biology with particular relevance to developmental neurobiology….”). We understand the request for clonal data or dynamic analyses in organoids (e.g., using time-lapse microscopy). We also agree that such data would certainly strengthen our findings. However, as outlined above (please refer to point #1 of the editorial summary), this is unfortunately currently not feasible. However, we have explicitly discussed this shortcoming in our revised manuscript and why future experiments (with advanced methodology) will have to do these experiments.
Reviewer #3 (Public Review):
In this manuscript, the authors report that human cortical radial glia asymmetrically segregates newly produced or old centrosomes after mitosis, depending on the fate of the daughter cell, similar to what was previously demonstrated for mouse neocortical radial glia (Wang et al. 2009). To do this, the authors develop a novel centrosome labelling strategy in human ESCs that allows recombination-dependent switching of tagged fluorescent reporters from old to newly produced centrosome protein, centriolin. The authors then generate human cortical organoids from these hESCs to show that radial glia in the ventricular zone retains older centrosomes whereas differentiated cells, i.e. neurons, inherit the newly produced centrosome after mitosis. The authors then knock down a critical regulator of asymmetric centrosome inheritance called Ninein, which leads to a randomization of this process, similar to what was observed in mouse cortical radial glia.
A major strength of the study is the combined use of the centrosome labelling strategy with human cortical organoids to address an important biological question in human tissue. This study is similarly presented as the one performed in mice (Wang et al. 2009) and the existence of the asymmetric inheritance mechanism of centrosomes in another species grants strength to the main claim proposed by the authors. It is a well-written, concise article, and the experiments are well-designed. The authors achieve the aims they set out in the beginning, and this is one of the perfect examples of the right use of human cortical organoids to study an important phenomenon. However, there are some key controls that would elevate the main conclusions considerably.
We thank the reviewer for their overall support of our findings (“..authors achieve the aims they set out in the beginning, and this is one of the perfect examples of the right use of human cortical organoids to study an important phenomenon…”). We also understand the reviewer’s request for additional experiments/controls that “…would elevate the main conclusions considerably.”
1) The lack of clonal resolution or timelapse imaging makes it hard to assess whether the inheritance of centrosomes occurs as the authors claim. The authors show that there is an increase in newly made non-ventricular centrosomes at a population level but without labelling clones and demonstrating that a new or old centrosome is inherited asymmetrically in a dividing radial glia would grant additional credence to the central conclusion of the paper. These experiments will put away any doubt about the existence of this mechanism in human radial glia, especially if it is demonstrated using timelapse imaging. Additionally, knowing the proportions of symmetric vs asymmetrically dividing cells generating old/new centrosomes will provide important insights pertinent to the conclusions of the paper. Alternatively, the authors could soften their conclusions, especially for Fig 2.
We understand the reviewer’s request. As outlined above (please refer to point #1 of the editorial summary), we had tried previously to add data using single cell timelapse imaging. However, due to the size and therefore weakness of the fluorescent signal we had failed despite extensive efforts. According to the reviewer’s suggestion we have now explicitly discussed this shortcoming and softened our conclusions.
2) Some critical controls are missing. In Fig. 1B, there is a green dot that does not colocalize with Pericentrin. This is worrying and providing rigorous quantifications of the number of green and tdTom dots with Pericentrin would be very helpful to validate the labelling strategy. Quantifications would put these doubts to rest. Additionally, an example pericentrin staining with the GFP/TdTom signal in figure 4 would also give confidence to the reader. For figure 4, having a control for the retroviral infection is important. Although the authors show a convincing phenotype, the effect might be underestimated due to the incomplete infection of all the analyzed cells.
We have included more rigorous quantifications in our revised manuscript.
For Figure 1: There are indeed some green speckles that might be misinterpreted as a green centrosome. However, the speckles are usually smaller and by applying a strict size requirement we exclude speckles. To check whether the classifier might interpret any speckles as centrosomes, we manually checked 60 green “dots” that were annotated as centrosome. From these images all green spots detected as centrosome co-localized with Pericentrin signal (Images shown in Author response image 1).
For Figure 4: as we are comparing cells that were either infected with a retrovirus expressing scrambled or Ninein-targeting shRNA we compare cells that experienced a similar treatment. Besides that, only cells infected with the virus express Cre-ERT2 whereby only the centrosomes of targeted cells were analyzed. Accordingly, we only compare cells expressing scrambled or Ninein-targeting shRNA, all surrounding “wt” cells are not considered.
Author response image 1.
Pictures used to test the classifier. Each of the green “dots” recognized by the classifier as a Centriolin-NeonGreen-containing centrosome (green) co-localized with Pericentrin signal (white).
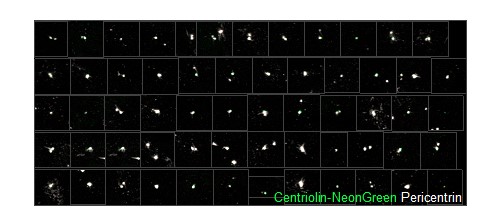
3) It would be helpful if the authors expand on the presence of old centrosomes in apical radial glia vs outer radial glia. Currently, in figure 3, the authors only focus on Sox2+ cells but this could be complemented with the inclusion of markers for outer radial glia and whether older centrosomes are also inherited by oRGCs. This would have important implications on whether symmetric/asymmetric division influences the segregation of new/old centrosomes.
That is an interesting question and we do agree that additional analyses, stratified by ventricular vs. oRGCs would be interesting. However, at the time points analysed there are only very few oRGCs present (if any) in human ESC-derived organoids (Qian et al., Cell, 2016). However, we have now added this point for future experiments to our discussion.
Author Response:
Reviewer #1 (Public Review):
The physical principles underlying oligomerization of GPCRs are not well understood. Here, authors focused on oligomerization of A2AR. They found that oligomerization of A2AR is mediated by the intrinsically disordered, extramembraneous C-terminal tail. Using experiment and MD simulation, they mapped the regions that are responsible for oligomerization and dissected the driving forces in oligomerization.
This is a nice piece of work that applies fundamental physical principles to the understanding of an important biological problem. It is a significant finding that oligomerization of A2AR is mediated by multiple weak interactions that are "tunable" by environmental factors. It is also interesting that solute-induced, solvent-mediated "depletion interactions" can be a key driving force in membrane protein-protein interactions.
Although this work is potentially a significant contribution to the fields of GPCRs and molecular biophysics of membrane proteins in general, there are several concerns that would need to be implemented to strengthen the conclusions.
1) How reasonably would the results obtained in the micellar environment be translated into the phenomenon in the cell membranes?
1a) Here authors measured oligomerization of A2AR in detergent micelles, not in the bilayer or cellular context. Although the cell membranes would provide another layer of complexity, the hydrophobic properties and electrostatics of the negatively charged membrane surface may cooperate or compete with the interactions mediated by the C-terminal tail, especially if the oligomerization is mediated by multiple weak interactions.
The translatability of properties of membrane proteins in detergent micelles to the cellular context is a valid concern. However, this shortcoming applies to all biophysical studies of membrane proteins in non-native environments. Even for membrane proteins reconstituted in liposomes, the question arises whether the artificial lipid composition that differs from that in the human plasma membrane would alter protein properties, especially as surface charges and cholesterol content can impact membrane protein dynamics, association, and stability. In that sense, this question cannot be answered satisfyingly, especially for GPCRs that are notoriously difficult to isolate. However, we can offer some perspectives. The propensity for membrane proteins to associate and oligomerize, if anything, is greater in lipid bilayers compared to that in detergent micelles, while detergent micelles can effectively solubilize membrane protein monomers (Popot and Engelman, Biochem 1990, 29 (17), 4031–4037). Hence, the findings that A2AR readily oligomerizes in detergent micelles and that the degree of oligomerization can be systematically tuned by the C-terminal length of A2AR in the same micellar system suggest that inter-A2AR interactions are modulating receptor oligomerization; we speculate that A2AR oligomers will be present or be enhanced in the lipid bilayer environment. In fact, in the cellular context, it has been shown that A2AR assembles into homodimers at the cell surface in transfected HEK293 cells (Canals et al, J Neurochem 2004, 88, 726–734) and into higher- order oligomers at the plasma membrane in Cath.A differentiated neuronal cells (Vidi et al, FEBS Lett 2008, 582, 3985–3990). Furthermore, C-terminally truncated A2AR has been demonstrated to show no protein aggregation or clustering on the cell surface, a process otherwise observed in the WT form (Burgueno et al, J Biol Chem 2003, 278 (39), 37545–37552). These results provide the research community with a valid starting point to discover factors that control oligomerization of A2AR in the cellular context.
1b) Related to the point above (1a), I wonder if MD simulation could provide an insight into the role of the lipid bilayer in the inter- or intra-molecular interactions involving the tail. Although the neutral POPC bilayer was employed in the simulation, the tail-membrane interaction may affect oligomerization since the tail is intrinsically disordered and possess a significant portion of nonpolar residues (Fig. S4).
The reviewer brings up a valid point about the ability for MD simulations to provide insights into the role of membrane-protein interactions. In response to the reviewer, we performed additional analysis focusing on the interactions of the C-terminus with the lipid bilayer. Overall, as the C-terminus is extended, there is a decrease in its interaction with the cytoplasmic leaflet of the membrane (left figure below). More specifically, we find that the C-terminal segment associated with helix 8 (residues 291 to 314) interacts tightly with the membrane, while the rest of the C-terminus (an intrinsically disordered segment) more weakly interacts with the membrane, regardless of truncation (right figure below). As the C-terminus is extended, the inherent conformational flexibility leads to a decrease in the interactions between the protein and the bilayer. We also observe that shorter stretches of the disordered segment do have the ability to interact more closely with the membrane. While these portions include charged residues that can participate in formation of the dimer interface, no general trends are observed. We therefore cannot draw any conclusions regarding the role of C-terminal-membrane interactions on the dimerization of A2AR. What we do know is that the MD simulations presented here should be considered a model study that reveals that the charged and disordered C-terminus of A2AR can account for oligomerization via multiple and weak inter-protomer contacts.
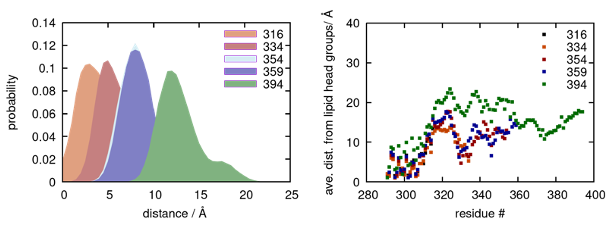
MD simulations showing (Left) average distance of all C-terminal residues and (right) average per-residue distance from the cytoplasmic membrane of the lipid bilayer.
2) Ensuring that the oligomer distributions are thermodynamic products.
Since authors interpret the SEC results on the basis of thermodynamic concepts (driving forces, depletion interactions, etc.), it would be important to verify that the distribution of different oligomeric states is the outcome of the thermodynamic control. There is a possibility that the distribution is the outcome of the "kinetic trapping" during detergent solubilization.
This is an important question. As we have shown in the manuscript, the A2AR dimer level was found to be reduced in the presence of TCEP (Figure 2B), suggesting that disulfide linkages have a role in facilitating A2AR oligomerization. However, disulfide cross-linking reaction cannot be the sole driving force of A2AR oligomerization because (1) a significant population of A2AR dimer remained resistant to TCEP (Figure 2B), (2) A2AR oligomer levels decreased progressively with the shortening of the C-terminus (Figure 3), and (3) A2AR oligomerization is driven by depletion interactions enhanced with increasing ionic strength (Figure 5).
To answer whether A2AR oligomer is a thermodynamic or kinetic product, we tested the stability and reversibility of the A2AR monomer and dimer/oligomer population. We used SEC to separate these populations of both the A2AR-WT and A2AR-Q372ΔC variants, then performed a second round of SEC to observe their repopulation, if any. The results are summarized in the figure below, which we will include in the revised manuscript as Figure 5-figure supplement 1.
We find that the SEC-separated monomers repopulate measurably into dimer/oligomer, with the total oligomer level after redistribution comparable with that of the initial samples for both A2AR WT (initial: 2.87; redistributed: 1.60) and A2AR-Q372ΔC (initial: 1.49; redistributed: 1.40) (Figure 5-figure supplement 1A). This observation indicates that A2AR oligomer is a thermodynamic product with a lower free energy compared with that of the monomer. This is consistent with the results we have shown in the manuscript that the oligomer levels of A2AR-WT are consistent (1.34–2.87; Table S1) and that A2AR oligomerization can be modulated with ionic strengths via depletion interactions (Figure 5).
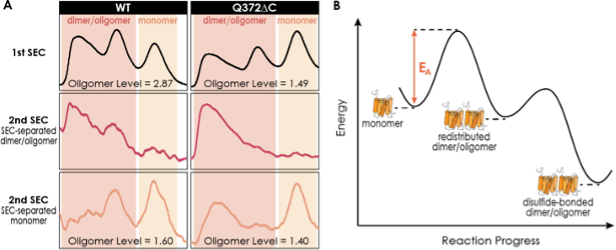
Figure S5. The dimer/oligomerization of A2AR is a thermodynamic process where the dimer and HMW oligomer once formed are kinetically trapped. (A) SEC chromatograms of the consecutive rounds of SEC performed on A2AR-WT and Q372ΔC. The first rounds of SEC are to separate the dimer/oligomer population and the monomer population, while the second rounds of SEC are performed on these SEC-separated populations to assess their stability and reversibility. The total oligomer level is expressed relative to the monomeric population in arbitrary units. (B) Energy diagram depicting A2AR oligomerization progress. The monomer needs to overcome an activation barrier (EA), driven by depletion interactions, to form the dimer/oligomer. Once formed, the dimer/oligomer populations are kinetically trapped by disulfide linkages.
Interestingly, the SEC-separated dimer/oligomer populations do not repopulate to form monomers (Figure 5-figure supplement 1). This observation is, again, consistent with a published study of ours on A2AR dimers (Schonenbach et al, FEBS Lett 2016, 590, 3295–3306). This observation furthermore indicates that once the oligomers are formed, some are kinetically trapped and thus cannot redistribute into monomers.
We believe that disulfide linkages are likely candidates that kinetically stabilize A2AR oligomers, as demonstrated by their redistribution into monomers only in the presence of a reducing agent (Figure 2B). Taken together, we suggest that A2AR oligomerization is a thermodynamic process (Figure 5-figure supplement 1B), with the monomer overcoming the activation energy (EA) by depletion interactions to repopulate into dimer/oligomer with a slightly lower free energy (given that we see a distribution between the two). Once formed, the redistributed dimer/oligomer populations can be kinetically stabilized by disulfide linkages.
3) The claim that the C-terminal tail is engaged in "cooperative" interactions is too qualitative (p. 11 line 274, p.12 line 279 and p.18 line 426).
This claim seems derived from Fig. 3b and Figs. 4b-c. However, the gradual decrease in the dimer level and the number of interactions may indicate that different parts in the C-terminal tail contribute to dimerization additively rather than cooperatively. The large decrease in the number of interactions may stem from the large decrease in the length (395 to 354). Probably, a more quantitative measure would be the number of interactions (H-bonds/salt bridges) normalized to the tail length upon successive truncation. Even in that case, the polar/charged residues would not be uniformly distributed along the primary sequence, making the quantitative argument of cooperativity challenging.
The request to clarify our basis to refer to a cooperative interaction is well taken. Figure 4B and 4C show that the truncation of one part of the C-terminus (segment 335–394) leads to a reduction in contacts of a different part (segment 291–334) of A2AR. Therefore, we conclude that the binding interactions that occur in segment 291–334 are altered by the interactions exerted by the segment 335–394. This characteristic is consistent with allosteric interactions. We believe that characterizing these interactions as “cooperative” is possible but is not fully justified in this work. We also agree with the comment that quantifying the role and segments involved in contacts would be challenging. The manuscript has been amended to use the term “allosteric” in place of “cooperative”.
4) On the compactness and conformation of the C-terminal tail:
Although the C-terminal tail is known as "intrinsically disordered", the results seem to indicate that its conformation is rather compact (or collapsed) with a number of intra- and intermolecular polar interactions (Fig. 4) and buried nonpolar residues (Fig. 6), which are subject to depletion interactions (Fig. 5). This raises a question if the tail indeed "intrinsically disordered" as is known. Recent folding studies on IDPs (Riback et al. Science 2017, 358, 238-; Best, Curr Opin Struct Biol 2020, 60, 27-) suggest that IDPs are partially expanded or expanded rather than collapsed.
We agree that our results seem to suggest that the conformation of the C-terminus could be partially compact. However, by stating that the C-terminus on average is an intrinsically disordered region (IDR), we do not exclude the possibility of partially structured regions, or greater compactness than that of an excluded volume polymer. IDR or IDP should refer to all proteins or protein regions that do not adopt a unique structure. By that standard, we know that the C-terminus of A2AR falls into that category according to our experiments and MD simulation, as well as the literature. In isolation, the majority the C-terminus is indeed an IDR, as has been demonstrated not only by simulations but also by experimental data. In fact, the C-terminus exhibits partial alpha-helical structure, and transiently populates beta-sheet conformations, depending on its state and buffer conditions (Piirainen et al, Biophys J 2015, 108 (4), 903–917). The literature studies suggest that A2AR’s C-terminus may adopt a greater level of compactness when interactions are formed between the C-terminus and the rest of the A2AR oligomer.
Reviewer #2 (Public Review):
The authors expressed A2A receptor as wild type and modified with truncations/mutations at the C-terminus. The receptor was solubilized in detergent solution, purified via a C-terminal deca-His tag and the fraction of ligand binding-competent receptor separated by an affinity column. Receptor oligomerization was studied by size exclusion chromatography on the purified receptor solubilized in a DDM/CHAPS/CHS detergent solution. It was observed that truncation greatly reduces the tendency of A2A to form dimers and oligomers. Mechanistic insights into interactions that facilitate oligomerization were obtained by molecular simulations and the study of aggregation behavior of peptide sequences representing the C-terminus of A2A. It is concluded that a multitude of interactions including disulfide linkages, hydrogen bonds electrostatic- and depletion interactions contribute to aggregation of the receptor.
The general conclusions appear to be correct and the paper is well written. This is a study of protein association in detergent solution. It is conceivable that observations are relevant for A2A receptors in cell membranes as well. However, extrapolation of mechanisms observed on receptor in detergent micelles to receptor in membranes should proceed with caution. In particular, the spatial arrangement of oligomerized receptor molecules in micelles may differ from arrangement in lipid bilayers. The lipid matrix may have a profound influence on oligomerization.
The ultimate question to answer is how oligomerization alters receptor function. This will have to be addressed in a future study.
We could not agree more. We address the concern regarding the translatability of properties of membrane proteins in detergent micelles to the cellular context in our response to Reviewer 1. In short, we believe the general propensity for A2AR to form dimers/oligomers and the role of the C-terminus will hold in the cellular context. However, even if it does not, given that biophysical structure-function studies of GPCRs are conducted in detergent micelles and other artificial environments, it is critical to understand the role of the C-terminus in the oligomerization of reconstituted A2AR in detergent micelles. How oligomerization alters receptor function is a question that is always on our mind and should be the the focus of future studies. Indeed, it has been demonstrated that truncation of the A2AR C-terminus significantly reduces receptor association with Gαs and cAMP production in cellular assays (Koretz et al, Biophys J 2021, https://doi.org/10.1016/j.bpj.2021.02.032). The results presented in this manuscript, which have demonstrated the impact of C-terminal truncation on A2AR oligomerization, will offer critical understanding for such study of the functional consequences of A2AR oligomerization.
Reviewer #3 (Public Review):
The work of Nguyen et al. demonstrates the relevant role of the C-terminus of A2AR for its homo-oligomerization. A previous work (Schonenbach et al. 2016) found that a point mutation of C394 in the C-terminus (C394S) reduces homo-oligomerization. Following this direction, more mutants were generated, the C-terminus was also truncated at different levels, and, using size-exclusion chromatography (SEC), the oligomerization levels of A2AR variants were assessed. Overall, these experiments support the role of the C-terminus in the oligomerization process. MD studies were performed and the non-covalent interactions were monitored. To 'identify the types of non-covalent interaction(s)', A2AR variants were also analysed modulating the ionic strength from 0.15 to 0.95 M. The C-terminus peptides were investigated to assess their interaction in absence of the TM domain.
The SEC results on the A2AR variants strongly support the main conclusion of the paper, but some passages and methodologies are less convincing. The different results obtained for dimerization and oligomerization are low discussed. The MD simulations are performed on models that are not accurately described - structural information currently available may compromise the quality of the model and the validity of the results (i.e., applying MD simulations to low-resolution models may not be appropriate for the goal of this analysis, moreover the formation of disulfide bonds cannot be simulated but this can affect the conformation and consequently the interactions to be monitored). Although the C-terminus is suggested as 'a driving factor for the oligomerization', the TM domain is indeed involved in the process and if and how it will be affected by modulating the solvent ionic strength should be discussed.
We thank the reviewer for the overall positive assessment and critical input. We will respond to the comments as followed.
The qualitative trend for dimerization is consistent with that for oligomerization, as demonstrated in Figs. 2A, 3B, and 5. For example, a reduction in both dimerization and oligomerization was observed upon C394X mutations (Figure 2A), as well as upon systematic truncations (Figure 3B), while very similar trends were seen for the change in the dimer and oligomer levels of all four constructs upon variation of ionic strength (Figure 5).
We agree that the experimental observation and MD simulation only incompletely describe the state of the A2AR dimer/oligomer. For example, we discover the impact of ERR:AAA mutations of the C-terminus (Figure 3C) on oligomer formation, but do not know whether this segment interacts with the TM domain or C-terminus of the neighboring A2AR. MD simulations suggest that the inter-protomer interface certainly involves inter-C-termini contact. We also mention that the A2AR oligomeric interfaces could be asymmetric, suggesting that the C-terminus can interact with other parts of the receptor, including the TM domain. However, we do not have evidence that the TM domain directly interact with each other to stabilize A2AR oligomers, and thus cannot discuss the effect of the solvent ionic strength on how the TM domain contributes to A2AR oligomerization. We minimize such discussion in our manuscript because we have incomplete insights. What we can say is that multiple and weak inter-protomer interactions that contribute to the dimer and oligomer interface formation prominently involve the C-terminus. Ultimately, the structure of the A2AR dimer/oligomer needs to be solved to answer the reviewer’s question fully.
With respect to the validity of our model, we restricted ourselves to using the best-available X-ray crystal structure for A2AR. Since this structure (PDB 5G53) does not include the entire C-terminus, we resorted to using homology modeling software (i.e., MODELLER) to predict the structures of the C-terminus. In our model, the first segment of the C-terminus consisting of residues 291 to 314 were modeled as a helical segment parallel to the cytoplasmic membrane surface while the rest of the C-terminus was modeled as intrinsically disordered. MODELLER is much more accurate in structural predictions for segments less than 20 residues. This limitation necessitated that we run an equilibrium MD simulation for 2 µs to obtain a well-equilibrated structure that possesses a more viable starting conformation. We have included this detailed description of our model in lines 641–650. To validate our models of all potential variants of A2AR, we calculated the RMSD and RMSF for each truncated variant. Our results clearly show that the transmembrane helical bundle is very stable, as expected, and that the C-terminus is more flexible (see figure below). This flexibility is somewhat consistent for lengths up to 359 residues, with a more noticeable increase in flexibility for the 394-residue variant of A2AR.
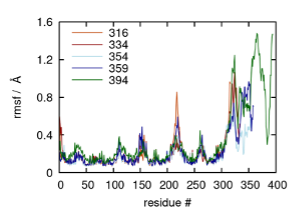
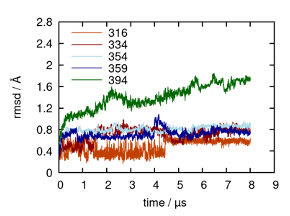
Root mean square fluctuation (RMSF) from sample trajectories of truncated variants modeled from the crystal structure of the adenosine A2AR bound to an engineered G protein (PDB ID 5G53), and the root mean square deviation (RMSD) of the C-terminus of each variant starting from residue 291.
Author Response
Reviewer #3 (Public Review):
1) Validation of reagents: The authors generated a pY1230 Afadin antibody claiming that (page 6) "this new antibody is specific to tyrosine phosphorylated Afadin, and that pY1230 is targeted for dephosphorylation by PTPRK, in a D2-domain dependent manner". The WB in Fig 1B shows a lot of background, two main bands are visible which both diminish in intensity in ICT WT pervanadate-treated MCF10A cell lysates. The claim that the developed peptide antibody is selective for pY1230 in Afadin would need to be substantiated, for instance by pull down studies analysed by pY-MS to substantiate a claim of antibody specificity for this site. However, for the current study it would be sufficient to demonstrate that pY1230 is indeed the dephosphorylated site. I suggest therefore including a site directed mutant (Y1230F) that would confirm dephosphorylation at this site and the ability of the antibody recognizing the phosphorylation state at this position.
We would like this antibody to be a useful and freely accessible tool in the field and have taken on board the request for additional validation. To this end we have significantly expanded Supplementary Figure 2 (now Figure 1 - figure supplement 2) and included a dedicated section of the results as follows: 1. We have now included information about all of the Afadin antibodies used in this study, since Afadin(BD) appears to be sensitive to phosphorylation (Figure 1 - figure supplement 2A). 2. We have demonstrated that the Afadin pY1230 antibody detects an upregulated band in PTPRK KO MCF10A cells, consistent with our previous tyrosine phosphoproteomics (Figure 1 - figure supplement 2B). This indicates that the antibody can be used to detect endogenous Afadin phosphorylation. 3. We have included two new knock down experiments demonstrating the recognition of Afadin by our antibody (Figure 1 - figure supplement 2C). There appear to be two Afadin isoforms recognised in HEK293T cells by both the BD and pY1230 antibody, consistent with previous reports (Umeda et al. MBoC, 2015). We have highlighted these in the figure. 4. We have performed mutagenesis to demonstrate the specificity of the antibody. We tagged Afadin with a fluorescent protein tag, reasoning that it would cause a shift in molecular weight that could be resolved by SDS PAGE, as is the case. We noted that the phosphopeptide used spans an additional tyrosine, Y1226, which has been detected as phosphorylated (although to a much lower extent than Y1230) on Phosphosite plus. The data clearly show that Afadin cannot be phosphorylated when Y1230 is mutated to a phenylalanine (compared to CIP control), indicating that this is the predominant site recognised by the antibody. In addition, the endogenous pervanadate-stimulated signal is completely abolished by CIP treatment (Figure 1 - figure supplement 2D). 5. We have included densitometric quantification of the dephosphorylation assay shown in Figure 1B, which was part of a time course and shows preferential dephosphorylation by the PTPRK ICD compared to the PTPRK D1. The signal stops declining with time, which could indicate antibody background, or an inaccessible pool of Afadin-pY1230 (Figure 1 - figure supplement 2E). 6. To further demonstrate that this site is modulated by PTPRK in post-confluent cells, we have used doxycycline (dox)-inducible cell lines generated in Fearnley et al, 2019. Upon treatment with 500 ng/ml Dox for 48 hours PTPRK is induced to lower levels than wildtype, however, normalized quantification of the Afadin pY1230 against the Afadin (CST) signal clearly indicates downregulation by PTPRK WT, but not the catalytically inactive mutant (Figure 1 - figure supplement 2F and 2G). Together these data strengthen our assertion that this antibody recognises endogenously phosphorylated Afadin at site Y1230, which is modulated in vitro and in cells by PTPRK phosphatase activity. For clarity, we have highlighted and annotated the relevant bands in figures. We have also included identifiers for each Afadin total antibody was used in particular experiments.
2) The authors claim that a short, 63-residue predicted coiled coil (CC) region, is both necessary and sufficient for binding to the PTPRK-ICD. The region is predicted to have alpha-helical structure and as a consequence, a helical structure has been used in the docking model. Considering that the authors recombinantly expressed this region in bacteria, it would be experimentally simple confirming the alpha-helical structure of the segment by CD or NMR spectroscopy.
To clarify, the helical structure in the docking model was independently predicted by several sequence and structural analysis programmes including AlphaFold2, RobettaFold, NetSurfP and as annotated in Uniprot (as a coiled coil). We did not stipulate prior to the AF2 prediction that it was helical. Isolated short peptides frequently adopt helical structure, therefore prediction of a helix within the context of the full Afadin sequence is, in our opinion, stronger evidence than CD of an isolated fragment.
3) Only two mutants have been introduced into PTPRK-ICD to map the Afadin interaction site. One of the mutations changes a possibly structurally important residues (glycine) into a histidine. Even though this residue is present in PTPRM, it does not exclude that the D2 domain no longer functionally folds. Also the second mutation represents a large change in chemical properties and the other 2 predicted residues have not been investigated.
The residues that were selected for mutation are all localised to the protein surface and therefore are unlikely to be involved in stable folding of PTPRK. In support of the correct folding of the mutated PTPRK, we include in Figure 1 below SEC elution traces for wild-type and mutant D2 showing that they elute as single symmetric peaks at the same elution volume as the WT protein. This is consistent with them having a similar shape and size, and not being aggregated or unfolded.
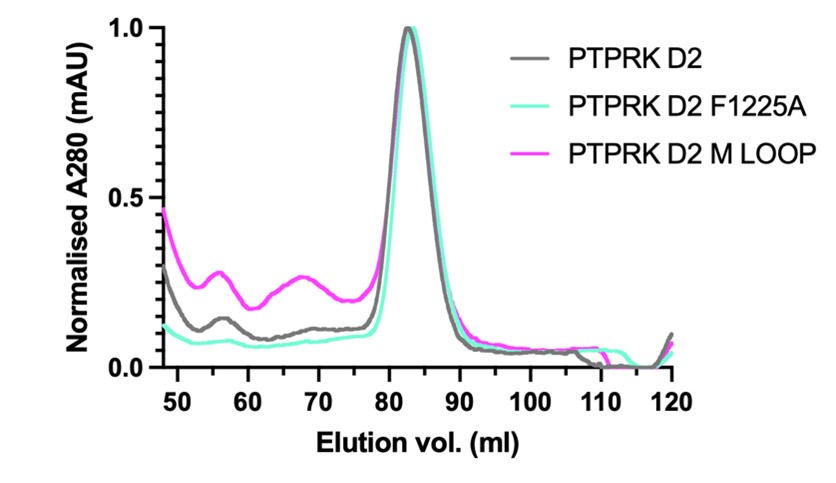
Figure 1. PTPRK-D2 wild-type and mutant preparative SEC elution profiles. A280nm has been normalised to help illustrate that the different proteins elute at the same volume. The main peak from these samples was used for binding assays in the main paper.
Furthermore, the yield for the double mutant was very high (4 mg of pure protein from a 2 L culture, see A280 value in graph below), whereas poorly folded proteins tend to have significantly reduced yields. This protein was also very stable over time whereas unfolded proteins tend to degrade during or following purification.
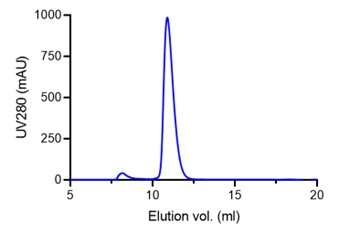
Figure 2. Analytical SEC elution profile for the PTPRK-D2 DM construct showing the very high yield consistent with a well-folded, stable protein.
Finally, we have carried out thermal melt curves of the WT and mutant PTPRK D2 domains showing that they all possess melting temperatures between 39.3°C and 41.7°C, supporting that they are all equivalently folded. We include these data as an additional Supplementary Figure (Figure 4 - figure supplement 3) in the paper.
4) The interface on the Afadin substrate has not been investigated apart from deleting the entire CC or a central charge cluster. Based on the docking model the authors must have identified key positions of this interaction that could be mutated to confirm the proposed interaction site.
We have now made and tested several additional mutations within both the Afadin-CC and PTPRK-D2 domains to further validate the AF2 predicted model of the complex.
For Afadin-CC we introduced several single and double mutations along the helix including residues predicted to be in the interface and residues distal from the interface. These mutations and the pulldown with PTPRK are described in the text and are included as additional panels to a modified Figure 3. All mutations have the expected effect on the interaction based on the predicted complex structure. To help illustrate the positions of these mutations we have also included a figure of the interface with the residues highlighted.
For the PTPRK-D2 we have also introduced two new mutations, one buried in the interface (F1225A) and one on the edge of the interface encompassing a loop that is different in PTPRM (labelled the M-loop). GST-Afadin WT protein was bound to GSH beads and tested for their ability to pulldown WT and mutated PTPRK. These new mutations (illustrated in the new Figure 4 – figure supplement 2) further support the model prediction. F1225A almost completely abolishes binding as predicted, while the M-loop retains binding. These mutations and their effects are now described in the main text and the pull-down data, including controls and retesting of the original DM mutant, are included as panel H in a newly modified Figure 4 focussed solely on the PTPRK interface.
5) A minor point is that ITC experiments have not been run long enough to determine the baseline of interaction heats. In addition, as large and polar proteins were used in this experiment, a blank titration would be required to rule out that dilution heats effect the determined affinities.
All control experiments including buffer into buffer, Afadin into buffer and buffer into PTPRK were carried out at the same time as the main binding experiment and are shown below overlaid with the binding curve. These demonstrate the very small dilution heats consistent with excellent buffer matching of the samples.
We were able to obtain excellent fits to the titration curves by fitting 1:1 binding with a calculated linear baseline (see Figure 2B,D). Very similar results were obtained by fitting to the sum (‘composite’) of fitted linear baselines obtained for the three control experiments for each titration.
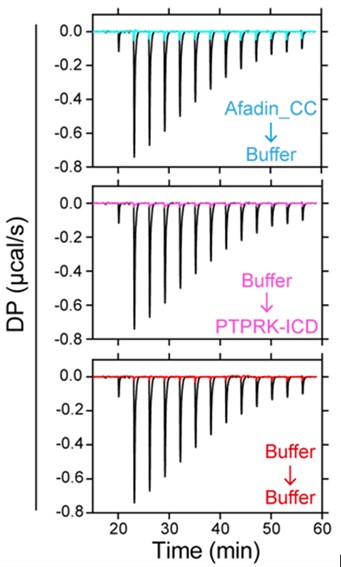
Author Response
Reviewer #1 (Public Review):
The authors start the study with an interesting clinical observation, found in a small subset of prostate cancers: FOXP2-CPED1 fusion. They describe how this fusion results in enhanced FOXP2 protein levels, and further describe how FOXP2 increases anchorageindependent growth in vitro, and results in pre-malignant lesions in vivo. Intrinsically, this is an interesting observation. However, the mechanistic insights are relatively limited as it stands, and the main issues are described below.
Main issues:
1) While the study starts off with the FOXP2 fusion, the vast majority of the paper is actually about enhanced FOXP2 expression in tumorigenesis. Wouldn't it be more logical to remove the FOXP2 fusion data? These data seem quite interesting and novel but they are underdeveloped within the current manuscript design, which is a shame for such an exciting novel finding. Along the same lines, for a study that centres on the prostate lineage, it's not clear why the oncogenic potential of FOXP2 in mouse 3T3 fibroblasts was tested.
We thank the reviewer very much for the comment. We followed the suggestion and added a set of data regarding the newly identified FOXP2 fusion in Figure 1 to make our manuscript more informative. We tested the oncogenic potential of FOXP2 in NIH3T3 fibroblasts because NIH3T3 cells are a widely used model to demonstrate the presence of transformed oncogenes2,3. In our study, we observed that when NIH3T3 cells acquired the exogenous FOXP2 gene, the cells lost the characteristic contact inhibition response, continued to proliferate and eventually formed clonal colonies. Please refer to "Answer to Essential Revisions #1 from the Editors” for details.
2) While the FOXP2 data are compelling and convincing, it is not clear yet whether this effect is specific, or if FOXP2 is e.g. universally relevant for cell viability. Targeting FOXP2 by siRNA/shRNA in a non-transformed cell line would address this issue.
We appreciate these helpful comments. Please refer to the "Answer to Essential Revisions #1 from the Editors” for details.
3) Unfortunately, not a single chemical inhibitor is truly 100% specific. Therefore, the Foretinib and MK2206 experiments should be confirmed using shRNAs/KOs targeting MEK and AKT. With the inclusion of such data, the authors would make a very compelling argument that indeed MEK/AKT signalling is driving the phenotype.
We thank the reviewer for highlighting this point and we agree with the reviewer’s point that no chemical inhibitor is 100% specific. In this study, we used chemical inhibitors to provide further supportive data indicating that FOXP2 confers oncogenic effects by activating MET signaling. We characterized a FOXP2-binding fragment located in MET and HGF in LNCaP prostate cancer cells by utilizing the CUT&Tag method. We also found that MET restoration partially reversed oncogenic phenotypes in FOXP2-KD prostate cancer cells. All these data consistently supported that FOXP2 activates MET signaling in prostate cancer. Please refer to the "Answer to Essential Revisions #2 from the Editors” and to the "Answer to Essential Revisions #7 from the Editors” for details.
4) With the FOXP2-CPED1 fusion being more stable as compared to wild-type transcripts, wouldn't one expect the fusion to have a more severe phenotype? This is a very exciting aspect of the start of the study, but it is not explored further in the manuscript. The authors would ideally elaborate on why the effects of the FOXP2-CPED1 fusion seem comparable to the FOXP2 wildtype, in their studies.
We thank the reviewer very much for the comment. We had quantified the number of colonies of FOXP2- and FOXP2-CPED1-overexpressing cells, and we found that both wildtype FOXP2 and FOXP2-CPED1 had a comparable putative functional influence on the transformation of human prostate epithelial cells RWPE-1 and mouse primary fibroblasts NIH3T3 (P = 0.69, by Fisher’s exact test for RWPE-1; P = 0.23, by Fisher’s exact test for NIH3T3). We added the corresponding description to the Results section in Line 487 on Page 22 in the tracked changes version of the revised manuscript. Please refer to the "Answer to Essential Revisions #5 from the Editors” for details.
5) The authors claim that FOXP2 functions as an oncogene, but the most-severe phenotype that is observed in vivo, is PIN lesions, not tumors. While this is an exciting observation, it is not the full story of an oncogene. Can the authors justifiably claim that FOXP2 is an oncogene, based on these results?
We appreciate the comment, and we made the corresponding revision in the revised manuscript. Please refer to the "Answer to Essential Revisions #3 from the Editors” for details.
6) The clinical and phenotypic observations are exciting and relevant. The mechanistic insights of the study are quite limited in the current stage. How does FOXP2 give its phenotype, and result in increased MET phosphorylation? The association is there, but it is unclear how this happens.
We appreciate this valuable suggestion. In the current study, we used the CUT&Tag method to explore how FOXP2 activated MET signaling in LNCaP prostate cancer cells, and we identified potential FOXP2-binding fragments in MET and HGF. Therefore, we proposed that FOXP2 activates MET signaling in prostate cancer through its binding to MET and METassociated gene. Please refer to the "Answer to Essential Revisions #2 from the Editors” for details.
Reviewer #2 (Public Review):
1) The manuscript entitled "FOXP2 confers oncogenic effects in prostate cancer through activating MET signalling" by Zhu et al describes the identification of a novel FOXP2CPED1 gene fusion in 2 out of 100 primary prostate cancers. A byproduct of this gene fusion is the increased expression of FOXP2, which has been shown to be increased in prostate cancer relative to benign tissue. These data nominated FOXP2 as a potential oncogene. Accordingly, overexpression of FOXP2 in nontransformed mouse fibroblast NIH-3T3 and human prostate RWPE-1 cells induced transforming capabilities in both cell models. Mechanistically, convincing data were provided that indicate that FOXP2 promotes the expression and/or activity of the receptor tyrosine kinase MET, which has previously been shown to have oncogenic functions in prostate cancer. Notably, the authors create a new genetically engineered mouse model in which FOXP2 is overexpressed in the prostatic luminal epithelial cells. Overexpression of FOXP2 was sufficient to promote the development of prostatic intraepithelial neoplasia (PIN) a suspected precursor to prostate adenocarcinoma and activate MET signaling.
Strengths:
This study makes a convincing case for FOXP2 as 1) a promoter of prostate cancer initiation and 2) an upstream regulator of pro-cancer MET signaling. This was done using both overexpression and knockdown models in cell lines and corroborated in new genetically engineered mouse models (GEMMs) of FOXP2 or FOXP2-CPED1 overexpression in prostate luminal epithelial cells as well as publicly available clinical cohort data.
Major strengths of the study are the demonstration that FOXP2 or FOXP2-CPED1 overexpression transforms RWPE-1 cells to now grow in soft agar (hallmark of malignant transformation) and the creation of new genetically engineered mouse models (GEMMs) of FOXP2 or FOXP2-CPED1 overexpression in prostate luminal epithelial cells. In both mouse models, FOXP2 overexpression increased the incidence of PIN lesions, which are thought to be a precursor to prostate cancer. While FOXP2 alone was not sufficient to cause prostate cancer in mice, it is acknowledged that single gene alterations causing prostate cancer in mice are rare. Future studies will undoubtedly want to cross these GEMMs with established, relatively benign models of prostate cancer such as Hi-Myc or Pb-Pten mice to see if FOXP2 accelerates cancer progression (beyond the scope of this study).
We appreciate these positive comments from the reviewer. We agree with the suggestion from the reviewer that it is worth exploring whether FOXP2 is able to cooperate with a known disease driver to accelerate the progression of prostate cancer. Therefore, we are going to cross Pb-FOXP2 transgenic mice with Pb-Pten KO mice to assess if FOXP2 is able to accelerate malignant progression.
2) Weaknesses: It is unclear why the authors decided to use mouse fibroblast NIH3T3 cells for their transformation studies. In this regard, it appears likely that FOXP2 could function as an oncogene across diverse cell types. Given the focus on prostate cancer, it would have been preferable to corroborate the RWPE-1 data with another prostate cell model and test FOXP2's transforming ability in RWPE-1 xenograft models. To that end, there is no direct evidence that FOXP2 can cause cancer in vivo. The GEMM data, while compelling, only shows that FOXP2 can promote PIN in mice and the lone xenograft model chosen was for fibroblast NIH-3T3 cells.
To determine the oncogenic activity of FOXP2 and the FOXP2-CPDE1 fusion, we initially used mouse primary fibroblast NIH3T3 for transformation experiments, because NIH3T3 cells are a widely used cell model to discover novel oncogenes2,3,10,11. Subsequently, we observed that overexpression of FOXP2 and its fusion variant drove RWPE-1 cells to lose the characteristic contact inhibition response, led to their anchorage-independent growth in vitro, and promoted PIN in the transgenic mice. During preparation of the revised manuscript, we tested the transformation ability of FOXP2 and FOXP2-CPED1 in RWPE1 xenograft models. We subcutaneously injected 2 × 10⁶ RWPE-1 cells into the flanks of NOD-SCID mice. The NODSCID mice were divided into five groups (n = 5 mice in each group): control, FOXP2overexpressing (two stable cell lines) and FOXP2-CPED1- overexpressing (two cell lines) groups. The experiment lasted for 4 months. We observed that no RWPE-1 cell-injected mice developed tumor masses. We propose that FOXP2 and its fusion alone are not sufficient to generate the microenvironment suitable for RWPE-1-xenograft growth. Collectively, our data suggest that FOXP2 has oncogenic potential in prostate cancer, but is not sufficient to act alone as an oncogene.
3) There is a limited mechanism of action. While the authors provide correlative data suggesting that FOXP2 could increase the expression of MET signaling components, it is not clear how FOXP2 controls MET levels. It would be of interest to search for and validate the importance of potential FOXP2 binding sites in or around MET and the genes of METassociated proteins. At a minimum, it should be confirmed whether MET is a primary or secondary target of FOXP2. The authors should also report on what happened to the 4-gene MET signature in the FOXP2 knockdown cell models. It would be equally significant to test if overexpression of MET can rescue the anti-growth effects of FOXP2 knockdown in prostate cancer cells (positive or negative results would be informative).
We appreciate all the valuable comments. As suggested, we performed corresponding experiments, please refer to the " Answers to Essential Revisions #2 from the Editors”, to the "Answer to Essential Revisions #6 from the Editors”, and to the "Answer to Essential Revisions #7 from the Editors” for details.
Reviewer #3 (Public Review):
1) In this manuscript, the authors present data supporting FOXP2 as an oncogene in PCa. They show that FOXP2 is overexpressed in PCa patient tissue and is necessary and sufficient for PCa transformation/tumorigenesis depending on the model system. Overexpression and knock-down of FOXP2 lead to an increase/decrease in MET/PI3K/AKT transcripts and signaling and sensitizes cells to PI3K/AKT inhibition.
Key strengths of the paper include multiple endpoints and model systems, an over-expression and knock-down approach to address sufficiency and necessity, a new mouse knock-in model, analysis of primary PCa patient tumors, and benchmarking finding against publicly available data. The central discovery that FOXP2 is an oncogene in PCa will be of interest to the field. However, there are several critically unanswered questions.
1) No data are presented for how FOXP2 regulates MET signaling. ChIP would easily address if it is direct regulation of MET and analysis of FOXP2 ChIP-seq could provide insights.
2) Beyond the 2 fusions in the 100 PCa patient cohort it is unclear how FOXP2 is overexpressed in PCa. In the discussion and in FS5 some data are presented indicating amplification and CNAs, however, these are not directly linked to FOXP2 expression.
3) There are some hints that full-length FOXP2 and the FOXP2-CPED1 function differently. In SF2E the size/number of colonies between full-length FOXP2 and fusion are different. If the assay was run for the same length of time, then it indicates different biologies of the overexpressed FOXP2 and FOXP2-CPED1 fusion. Additionally, in F3E the sensitization is different depending on the transgene.
We appreciate these valuable comments and constructive remarks. As suggested, we performed the CUT&Tag experiments to detect the binding of FOXP2 to MET, and to examine the association of CNAs of FOXP2 with its expression. Please refer to the " Answer to Essential Revisions #2 from the Editors" and the " Answer to Essential Revisions #4 from the Editors" for details. We also added detailed information to show the resemblance observed between FOXP2 fusion- and wild-type FOXP2-overexpressing cells. We added the corresponding description to the Results section in Line 487 on Page 22 in the tracked changes version of the revised manuscript. Please refer to the “Answer to Essential Revisions #5 from the Editors” for details.
2) The relationship between FOXP2 and AR is not explored, which is important given 1) the critical role of the AR in PCa; and 2) the existing relationship between the AR and FOXP2 and other FOX gene members.
We thank the reviewer very much for highlighting this point. We agree that it is important to examine the relationship between FOXP2 and AR. We therefore analyzed the expression dataset of 255 primary prostate tumors from TCGA and observed that the expression of FOXP2 was significantly correlated with the expression of AR (Spearman's ρ = 0.48, P < 0.001) (Figure 1. a). Next, we observed that both FOXP2- and FOXP2-CPED1overexpressing 293T cells had a higher AR protein abundance than control cells (Figure 1. b). In addition, shRNA-mediated FOXP2 knockdown in LNCaP cells resulted in a decreased AR protein level compared to that in control cells (Figure 1. c). However, we analyzed our CUT&Tag data and observed no binding of FOXP2 to AR (Figure 1. d). Our data suggest that FOXP2 might be associated with AR expression.
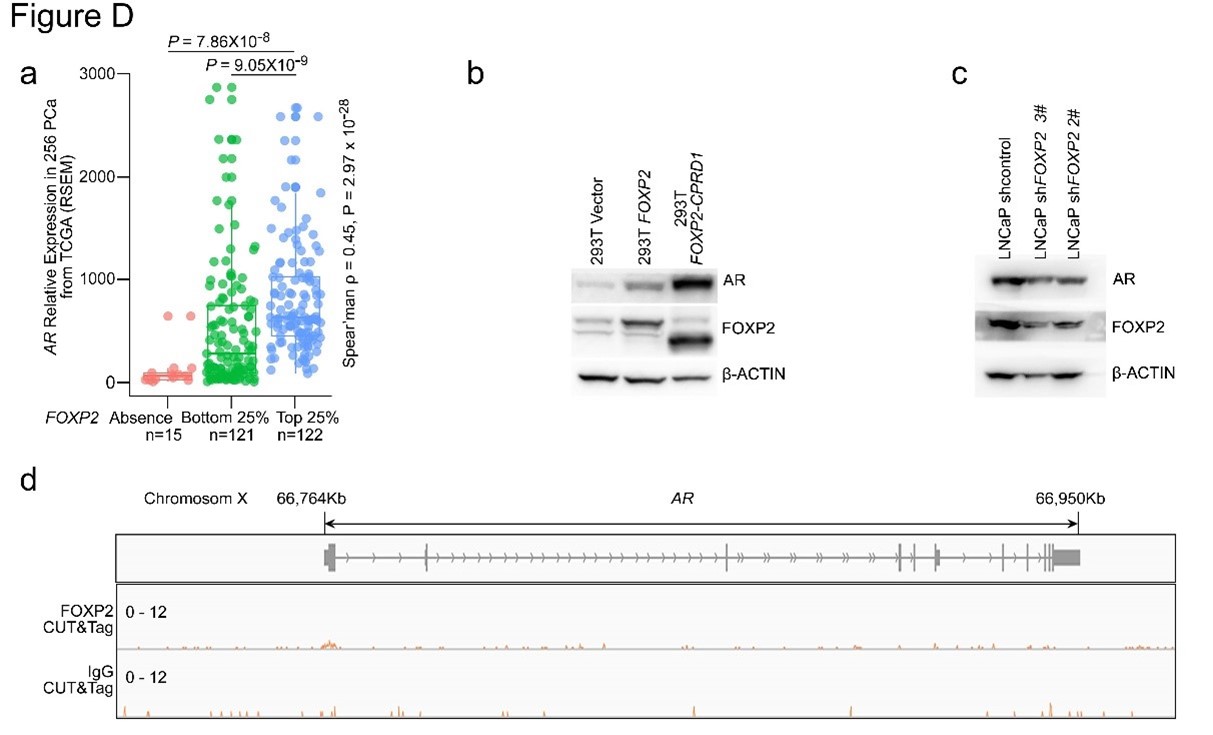
Figure 1. a. AR expression in a human prostate cancer dataset (TCGA, Prostate Adenocarcinoma, Provisional; n = 493) classified by FOXP2 expression level (bottom 25%, low expression, n = 120; top 25%, high expression, n = 120; negative expression, n = 15). P values were calculated by the MannWhitney U test. The correlation between FOXP2 and AR expression was evaluated by determining the Spearman's rank correlation coefficient. b. Immunoblot analysis of the expression levels of AR in 293T cells with overexpression of FOXP2 or FOXP2-CPED1. c. Immunoblot analysis of the expression levels of AR in LNCaP cells with stable expression of the scrambled vector or FOXP2 shRNA. d. CUT&Tag analysis of FOXP2 association with the promoter of AR. Representative track of FOXP2 at the AR gene locus is shown.
Reference
Author Response
Reviewer #1 (Public Review):
In one of the most creative eDNA studies I have had the pleasure to review, the authors have taken advantage of an existing program several decades old to address whether insect declines are indeed occurring - an active area of discussion and debate within ecology. Here, they extracted arthropod environmental DNA (eDNA) from pulverized leaf samples collected from different tree species across different habitats. Their aim was to assess the arthropod community composition within the canopies of these trees during the time of collection to assess whether arthropod richness, diversity, and biomass were declining. By utilizing these leaf samples, the greatest shortcoming of assessing arthropod declines - the lack of historical data to compare to - was overcome, and strong timeseries evidence can now be used to inform the discussion. Through their use of eDNA metabarcoding, they were able to determine that richness was not declining, but there was evidence of beta diversity loss due to biotic homogenization occurring across different habitats. Furthermore, their application of qPCR to assess changes in eDNA copy number temporally and associate those changes with changes to arthropod biomass provided support to the argument that arthropod biomass is indeed declining. Taken together, these data add substantial weight to the current discussion regarding how arthropods are being affected in the Anthropocene.
Thank you very much for the positive assessment of our work.
I find the conclusions of the paper to be sound and mostly defensible, though there are some issues to take note of that may undermine these findings.
Firstly, I saw no explanation of the requisite controls for such an experiment. An experiment of this scale should have detailed explanations of the field/equipment controls, extraction controls, and PCR controls to ensure there are no contamination issues that would otherwise undermine the entirety of the study. At one point in the manuscript the presence of controls is mentioned just once, so I surmise they must exist. Trusting such results needs to be taken with caution until such evidence is clearly outlined. Furthermore, the plate layout which includes these controls would help assess the extent of tag-jumping, should the plate plan proposed in Taberlet et al., 2018 be adopted.
Second, without the presence of adequate controls, filtering schemes would be unable to determine whether there were contaminants and also be unable to remove them. This would also prevent samples from being filtered out should there be excessive levels of contamination present. Without such information, it makes it difficult to fully trust the data as presented.
Finally, there is insufficient detail regarding the decontamination procedures of equipment used to prepare the samples (e.g., the cryomil). Without clear explanations of the steps the authors took to ensure samples were handled and prepared correctly, there is yet more concern that there may be unseen problems with the dataset.
We are well aware of the potential issues and consequences of contamination in our work. However, we are also confident that our field and laboratory procedures adequately rule out these issues. We agree with the reviewer that we should expand more on our reasoning. Hence, we have now significantly expanded the Methods section outlining controls and sample purity, particularly under “Tree samples of the German Environmental Specimen Bank – Standardized time series samples stored at ultra-low temperatures” (lines 303-304), “Test for DNA carryover in the cryomill” (lines 448-464) and “Statistical analysis” (lines 570-575).
We ran negative control extractions as well as negative control PCRs with all samples. These controls were sequenced along with all samples and used to explore the effect of experimental contamination. With the exception of a few reads of abundant taxa, these controls were mostly clean. We report this in more detail now in the Methods under “Sequence analysis” (lines 570-575). This suggests that our data are free of experimental contamination or tag jumping issues.
We have also expanded on the avoidance of contamination in our field sampling protocols. The ESB has been set up for monitoring even the tiniest trace amounts of chemicals. Carryover between samples would render the samples useless. Hence, highly clean and standardized protocols are implemented. All samples are only collected with sterilized equipment under sterile conditions. Each piece of equipment is thoroughly decontaminated before sampling.
The cryomill is another potential source of cross-contamination. The mill is disassembled after each sample and thoroughly cleaned. Milled samples have already been tested for chemical carryover, and none was found. We have now added an additional analysis to rule out DNA carryover. We received the milling schedule of samples for the past years. Assuming samples get contaminated by carryover between milling runs, two consecutive samples should show signatures of this carryover. We tested this for singletaxon carryover as well as community-wide beta diversity, but did not find any signal of contamination. This gives us confidence that our samples are very pure. The results of this test are now reported in the manuscript (Suppl. Fig 12 & Suppl. Table 3).
Reviewer #2 (Public Review):
Krehenwinkel et al. investigated the long-term temporal dynamics of arthropod communities using environmental DNA (eDNA) remained in archived leave samples. The authors first developed a method to recover arthropod eDNA from archived leave samples and carefully tested whether the developed method could reasonably reveal the dynamics of arthropod communities where the leave samples originated. Then, using the eDNA method, the authors analyzed 30-year-long well-archived tree leaf samples in Germany and reconstructed the long-term temporal dynamics of arthropod communities associated with the tree species. The reconstructed time series includes several thousand arthropod species belonging to 23 orders, and the authors found interesting patterns in the time series. Contrary to some previous studies, the authors did not find widespread temporal α-diversity (OTU richness and haplotype diversity) declines. Instead, β-diversity among study sites gradually decreased, suggesting that the arthropod communities are more spatially homogenized in recent years. Overall, the authors suggested that the temporal dynamics of arthropod communities may be complex and involve changes in α- and β-diversity and demonstrated the usefulness of their unique eDNA-based approach.
Strengths:
The authors' idea that using eDNA remained in archived leave samples is unique and potentially applicable to other systems. For example, different types of specimens archived in museums may be utilized for reconstructing long-term community dynamics of other organisms, which would be beneficial for understanding and predicting ecosystem dynamics.
A great strength of this work is that the authors very carefully tested their method. For example, the authors tested the effects of powdered leaves input weights, sampling methods, storing methods, PCR primers, and days from last precipitation to sampling on the eDNA metabarcoding results. The results showed that the tested variables did not significantly impact the eDNA metabarcoding results, which convinced me that the proposed method reasonably recovers arthropod eDNA from the archived leaf samples. Furthermore, the authors developed a method that can separately quantify 18S DNA copy numbers of arthropods and plants, which enables the estimations of relative arthropod eDNA copy numbers. While most eDNA studies provide relative abundance only, the DNA copy numbers measured in this study provide valuable information on arthropod community dynamics.
Overall, the authors' idea is excellent, and I believe that the developed eDNA methodology reasonably reconstructed the long-term temporal dynamics of the target organisms, which are major strengths of this study.
Thank you very much for the positive assessment of our work.
Weaknesses:
Although this work has major strengths in the eDNA experimental part, there are concerns in DNA sequence processing and statistical analyses.
Statistical methods to analyze the temporal trend are too simplistic. The methods used in the study did not consider possible autocorrelation and other structures that the eDNA time series might have. It is well known that the applications of simple linear models to time series with autocorrelation structure incorrectly detect a "significant" temporal trend. For example, a linear model can often detect a significant trend even in a random walk time series.
We have now reanalyzed our data controlling for autocorrelation and for non-linear changes of abundance and recover no change to our results. We have added this information to the manuscript under “Statistical analysis” (lines 629-644).
Also, there are some issues regarding the DNA sequence analysis and the subsequent use of the results. For example, read abundance was used in the statistical model, but the read abundance cannot be a proxy for species abundance/biomass. Because the total 18S DNA copy numbers of arthropods were quantified in the study, multiplying the sequence-based relative abundance by the total 18S DNA copy numbers may produce a better proxy of the abundance of arthropods, and the use of such a better proxy would be more appropriate here. In addition, a coverage-based rarefaction enables a more rigorous comparison of diversity (OTU diversity or haplotype diversity) than the readbased rarefaction does.
We did not use read abundance as a proxy for abundance, but used our qPCR approach to measure relative copy number of arthropods. While there are biases to this (see our explanations above), the assay proved very reliable and robust. We thus believe it should indeed provide a rough estimate of biomass. As biomass is very commonly discussed in insect decline (in fact the first study on insect decline entirely relies on biomass; Hallmann et al. 2017), we feel it is important go include a proxy for this as well. However, we also discuss the alternative option that a turnover of diversity is affecting the measured biomass. A pattern of abundance loss for common species has been described in other works on insect decline.
We liked the reviewer’s suggestion to use copy number information to perform abundance-informed rarefaction. We have done this now and added an additional analysis rarefying by copy number/biomass. A parallel analysis using this newly rarefied table was done for the total diversity as well as single species abundance change. Details can be found in the Methods and Results section of the manuscript. However, the result essentially remains the same. Even abundance-informed rarefaction does not lead to a pattern of loss of species richness over time (see “Statistical analysis”).
The overall results are supporting a scenario of no overall loss of species richness over time, but a loss of abundance for common species. And we indeed see the pattern of declining abundance for once-common species in our data, for example the loss of the Green Silver-Line moth, once a very common species in beech canopy (Suppl. Fig. 10). We have added details on this to the Discussion (lines 254-260).
These points may significantly impact the conclusions of this work.
Reviewer #3 (Public Review):
The aim of Weber and colleagues' study was to generate arthropod environmental DNA extracted from a unique 30-year time series of deep-frozen leaf material sampled at 24 German sites, that represent four different land use types. Using this dataset, they explore how the arthropod community has changed through time in these sites, using both conventional metabarcoding to reconstruct the OTUs present, and a new qPCR assay developed to estimate the overall arthropod diversity on the collected material. Overall their results show that while no clear changes in alpha diversity are found, the βdiversity dropped significantly over time in many sites, most notable in the beech forests. Overall I believe their data supports these findings, and thus their conclusion that diversity is becoming homogenized through time is valid.
Thank you for the positive assessment.
While overall I do not doubt the general findings, I have a number of comments. Firstly while I agree this is a very nice study on a unique dataset - other temporal datasets of insects that were used for eDNA studies do exist, and perhaps it would be relevant to put the findings into context (or even the study design) of other work that has been done on such datasets. One example that jumps to my mind is Thomsen et al. 2015 https://besjournals.onlinelibrary.wiley.com/doi/full/10.1111/1365-2656.12452 but I am sure there are others.
We have expanded the introduction and discussion on this citing this among other studies now (lines 71-72, 276-278).
From a technical point of view, the conclusions of course rely on several assumptions, including (1) that the biomass assay is effective and (2) that the reconstructed levels of OTU diversity are accurate,
With regards to biomass although it is stated in the manuscript that "Relative eDNA copy number should be a predictor for relative biomass ", this is in fact only true if one assumes a number of things, e.g. there is a similar copy number of 18s rDNA per species, similar numbers of mtDNA per cell, a similar number of cells per individual species etc. In this regard, on the positive side, it is gratifying to see that the authors perform a validation assay on 7 mock controls, and these seem to indicate the assay works well. Given how critical this is, I recommend discussing the details of this a bit more, and why the authors are convinced the assay is effective in the main text so that the reader is able to fully decide if they are in agreement. However perhaps on the negative side, I am concerned about the strategy taken to perform the qPCR may have not been ideal. Specifically, the assay is based on nested PCR, where the authors first perform a 15cycle amplification, this product is purified, then put into a subsequent qPCR. Given how both PCR is notorious for introducing amplification biases in general (especially when performed on low levels of DNA), and the fact that nested PCRs are notoriously contamination prone - this approach seems to be asking for trouble. This raises the question - why not just do the qPCR directly on the extracts (one can still dilute the plant DNA 100x prior to qPCR if needed). Further, given the qPCRs were run in triplicate I think the full data (Ct values) for this should be released (as opposed to just stating in the paper that the average values were used). In this way, the readers will be able to judge how replicable the assay was - something I think is critical given how noisy the patterns in Fig S10 seem to be.
We agree with this point, and this is why we do not want to overstate the decline in copy number. This is an additional source of data next to genetic and species diversity. We have added to our discussion of turnover as another potential driver of copy number change (lines 257-260). We have also added text addressing the robustness of the mock community assay (lines 138-141).
However, we are confident of the reliability and robustness of our qPCR assay for the detection of relative arthropod copy number. We performed several validations and optimizations before using the assay. We have added additional details to the manuscript on this (see “Detection of relative arthropod DNA copy number using quantitative PCR”, lines 548-556). We got the idea for the nested qPCR from a study (Tran et al.) showing its high accuracy and reproducibility. We show that our assay has a very high replicability using triplicates of each qPCR, which we will now include in the supplementary data on Dryad. The SD of Ct values is very low (~ 0.1 on average). NTC were run with all qPCRs to rule out contamination as an issue in the experiments. We also find a very high efficiency of the assay. At dilutions far outside the observed copy number in our actual leaf data, we still find the assay to be accurate. We found very comparable abundance changes across our highly taxonomically diverse mock communities. This also suggests that abundance changes are a more likely explanation than simple turnover for the observed drop in copy number. A biomass loss for common species is well in line with recent reports on insect decline. We can also rely on several other mock community studies (Krehenwinkel et al. 2017 & 2019) where we used read abundance of 18S and found it to be a relatively good predictor of relative biomass.
The pattern in Fig. S10 is not really noisy. It just reflects typical population fluctuations for arthropods. Most arthropod taxa undergo very pronounced temporal abundance fluctuations between years.
Next, with regards to the observation that the results reveal an overall decrease in arthropod biomass over time: The authors suggest one alternate to their theory, that the dropping DNA copy number may reflect taxonomic turnover of species with different eDNA shedding rates. Could there be another potential explanation - simply be that leaves are getting denser/larger? Can this be ruled out in some way, e.g. via data on leaf mass through time for these trees? (From this dataset or indeed any other place).
This is a very good point. However, we can rule out this hypothesis, as the ESB performs intensive biometric data analysis. The average leaf weight and water content have not significantly changed in our sites. We have addressed this in the Methods section (see ”Tree samples of the German Environmental Specimen Bank – Standardized time series samples stored at ultra-low temperatures”, lines 308-311).
With regards to estimates of OTU/zOTU diversity. The authors state in the manuscript that zOTUs represent individual haplotypes, thus genetic variation within species. This is only true if they do not represent PCR and/or sequencing errors. Perhaps therefore they would be able to elaborate (for the non-computational/eDNA specialist reader) on why their sequence processing methods rule out this possibility? One very good bit of evidence would be that identical haplotypes for the individual species are found in the replicate PCRs. Or even between different extractions at single locations/timepoints.
We have repeated the analysis of genetic variation with much more stringent filtering criteria (see “Statistical analysis”, lines 611-615). Among other filtering steps, this also includes the use of only those zOTUs that occur in both technical replicates, as suggested by the reviewer. Another reason to make us believe we are dealing with true haplotypic variation here is that haplotypes show geographic variation. E.g., some haplotypes are more abundant in some sites than in others. NUMTS would consistently show a simple correlation in their abundance with the most abundant true haplotype.
With regards to the bigger picture, one thing I found very interesting from a technical point of view is that the authors explored how modifying the mass of plant material used in the extraction affects the overall results, and basically find that using more than 200mg provides no real advantage. In this regard, I draw the authors and readers attention to an excellent paper by Mata et al. (https://onlinelibrary.wiley.com/doi/full/10.1111/mec.14779) - where these authors compare the effect of increasing the amount of bat faeces used in a bat diet metabarcoding study, on the OTUs generated. Essentially Mata and colleagues report that as the amount of faeces increases, the rare taxa (e.g. those found at a low level in a single faeces) get lost - they are simply diluted out by the common taxa (e.g those in all faeces). In contrast, increasing biological replicates (in their case more individual faecal samples) increased diversity. I think these results are relevant in the context of the experiment described in this new manuscript, as they seem to show similar results - there is no benefit of considerably increasing the amount of leaf tissue used. And if so, this seems to point to a general principal of relevance to the design of metabarcoding studies, thus of likely wide interest.
Thank you for this interesting study, which we were not aware of before. The cryomilling is an extremely efficient approach to equally disperse even traces of chemicals in a sample. This has been established for trace chemicals early during the operation of the ESB, but also seems to hold true for eDNA in the samples. We have recently done more replication experiments from different ESB samples (different terrestrial and marine samples for different taxonomic groups) and find that replication of extraction does not provide much more benefit than replication of PCR. Even after 2 replicates, diversity approaches saturation. This can be seen in the plot below, which shows recovered eDNA diversity for different ESB samples and different taxonomic groups from 1-4 replicates. A single extract of a small volume contains DNA from nearly all taxa in the community. Rare taxa can be enriched with more PCR replicates.
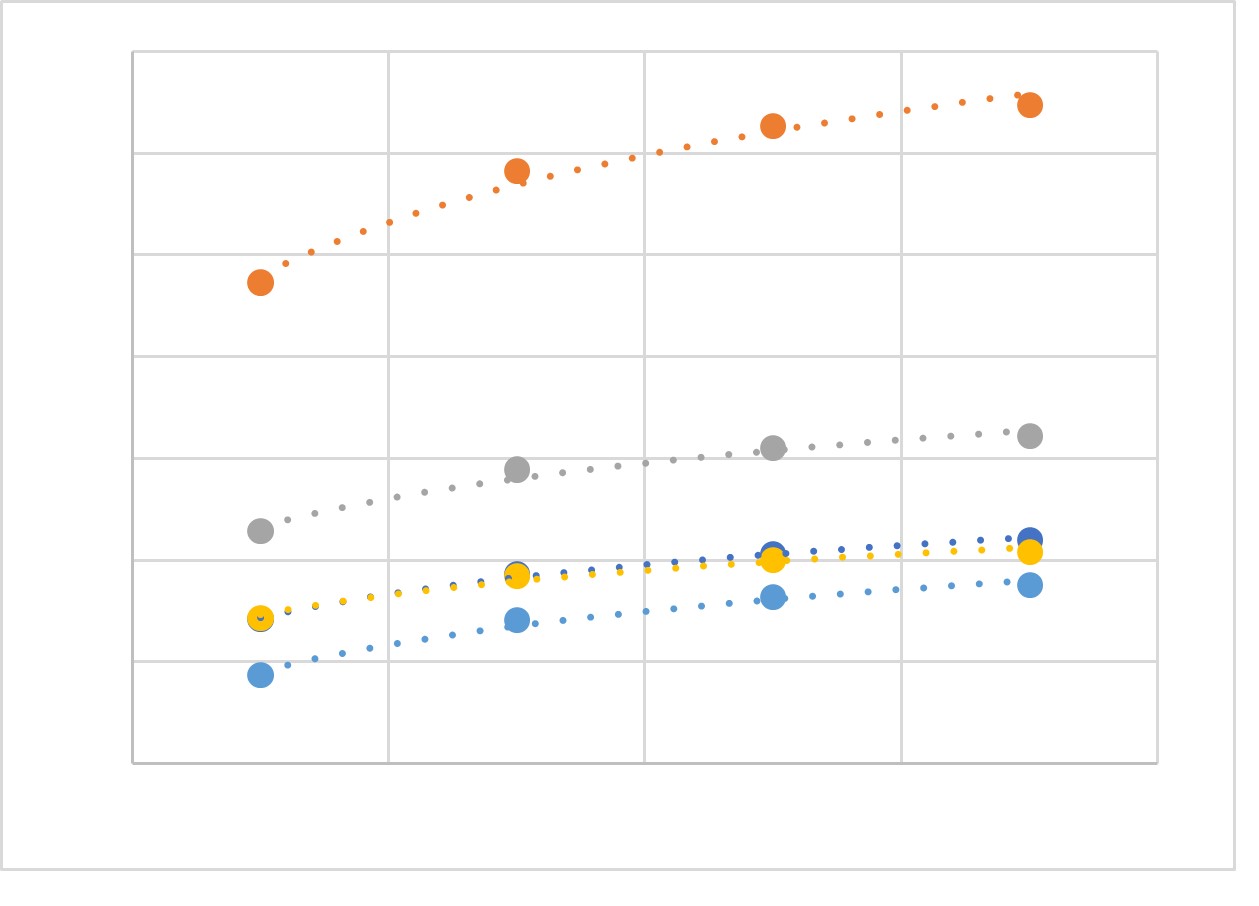
Author Response
Reviewer #2 (Public Review):
The manuscript by Ma et al, "Two RNA-binding proteins mediate the sorting of miR223 from mitochondria into exosomes" examines the contribution of two RNA-binding proteins on the exosomal loading of miR223. The authors conclude that YBX1 and YBAP1 work in tandem to traffic and load miR223 into the exosome. The manuscript is interesting and potentially impactful. It proposes the following scenario regarding the exosomal loading of miR223: (1) YBAP1 sequesters miR223 in the mitochondria, (2) YBAP1 then transfers miR223 to YBX1, and (3) YBX1 then delivers miR223 into the early endosome for eventual secretion within an exosome. While the authors propose plausible explanations for this phenomenon, they do not specifically test them and no mechanism by which miR223 is shuttled between YBAP1 and YBX1, and the exosome is shown. Thus, the paper is missing critical mechanistic experiments that could have readily tested the speculative conclusions that it makes.
Comments:
1) The major limitation of this paper is that it fails to explore the mechanism of any of the major changes it describes. For example, the authors propose that miR223 shuttles from mitochondrially localized YBAP1 to P-body-associated YBX1 to the exosome. This needs to be tested directly and could be easily addressed by showing a transfer of miR223 from YBAP1 to YBX1 to the exosome.
Testing this idea using fluorescently labeled miR223 would indeed be an ideal experiment. However, miRNA imaging presents challenges. As reviewer 1 pointed out, and we have now confirmed, the atto-647 dye itself localizes to mitochondria. We will continue our efforts to identify a suitable fluorescent label for miR223in order to be in a position to evaluate the temporal relationship between mitochondrial and endosomal miR223.
2) If YBAP1 retains miR223 in mitochondria, what is the trigger for YBAP1 to release it and pass it off to YBX1? The authors speculate in their discussion that sequestration of mito-miR223 plays a "role in some structural or regulatory process, perhaps essential for mitochondrial homeostasis, controlled by the selective extraction of unwanted miRNA into RNA granules and further by secretion in exosomes...". This is readily testable by altering mitochondria dynamics and/or integrity.
A previous study has reported that YBAP1 can be released from mitochondria to the cytosol during HSV-1 infection (Song et al., 2021). However, due to restrictions, we are unable to conduct experiments using HSV to verify this condition. We attempted to induce mitochondrial stress by using different concentrations of CCCP, but we did not observe the release of YBAP1 from mitochondria after CCCP treatment. We speculate that not all mitochondrial stress conditions can trigger YBAP1 release. Investigating the mechanism of mito-miR223 release from mitochondria is one of our interests that we aim to explore in future studies.
3) Much of the miRNA RT-PCR analysis is presented as a ratio of exosomal/cellular. This particular analysis assumes that cellular miRNA is unaffected by treatments. For example, Figure 1a shows that the presence of exosomal miR223 is significantly reduced when YBX1 is knocked out. This analysis does not consider the possibility that YBX1-KO alters (up or down-regulates) intracellular miR223 levels. Should that be the case, the ratiometric analysis is greatly skewed by intracellular miRNA changes. It would be better to not only show the intracellular levels of the miRs but also normalize the miRNA levels to the total amount of RNA isolated or an irrelevant/unchanged miRNA.
Our previous publications demonstrated that miR223 levels are increased in YBX1-KO cells and decreased in exosomes derived from YBX1 KO cells. However, no significant changes were observed in miR190 levels (Liu et al., 2021; Shurtleff et al., 2016). The repeated data has been included in Figure 1a.
For the analysis of other miRNAs by RT-PCR, we assessed changes in intracellular and exosomal miRNA levels in the corresponding figures. In the qPCR analysis, miRNA levels were normalized to the total amount of RNA.
4) In figure 1, the authors show that in YBX1-KO cells, miR223 levels are decreased in the exosome. They further suggest this is because YBX1 binds with high affinity to miR223. This binding is compared to miR190 which the authors state is not enriched in the exosome. However, no data showing that miR190 is not present in the exosome is shown. A figure showing the amount of cellular and exosomal miR223 and 190 should be shown together on the same graph.
In previous publications we demonstrated that miR190 is not localized in exosomes and not significantly changed in YBX1 knockout (KO) cells and exosomes derived from YBX1 KO cells (Liu et al., 2021; Shurtleff et al., 2016). The repeated data has been included in Figure 1a.
5) Figure 2 Supplement 1 - As to determine the nucleotides responsible for interacting with YBX1, the authors made several mutations within the miR223 sequence. However, no explanation is given regarding the mutant sequences used or what the ratios mean. Mutant sequences need to be included. How do the authors conclude that UCAGU is important when the locations of the mutations are unclear? Also, the interpretation of this data would benefit from a binding affinity curve as shown in Fig 2C.
The ratio is of labeled miR223/unlabeled miR223 (wt and mutant). All mutant sequences of miR223 have been included in Figure 2 supplement 1.
6) While the binding of miR223mut to YBX1 is reduced, there is still significant binding. Does this mean that the 5nt binding motif is not exact? Do the authors know if there are multiple nucleotide possibilities at these positions that could facilitate binding? Perhaps confirming binding "in vivo" via RIP assay would further solidify the UCAGU motif as critical for binding to YBX1.
The binding affinity of miR223mut with YBX1 is reduced approximately 27-fold compared to miR223. We speculate that the secondary structure of miR223 may contribute to the interaction with YBX1.
Our EMSA data, in vitro packaging data, and exosome analysis reinforce the conclusion that UCAGU is critical for YBX1 binding. These findings suggest that the presence of the UCAGU motif in miR223 is crucial for its interaction with YBX1 and subsequent sorting into exosomes.
7) Figures 2g, h - It would be nice to show that miR190mut also packages in the cell-free system. This would confirm that the sequence is responsible. Also, to confirm that the sorting of miR223 is YBX1-dependent, a cell-free reaction using cytosol and membranes from YBX1 KO cells is needed.
Although we have not performed the suggested experiment, we purified exosomes from cells overexpressing miR190sort and observed an increase in the enrichment of miR190sort in exosomes compared to miR190. This finding confirmed that the UCAGU motif facilitates miRNA sorting into exosomes.
Regarding the in vitro packaging assay, our previously published paper demonstrated that cytosol from YBX1 knockout (KO) cells significantly reduces the protection of miR223 from RNase digestion. We concluded that the sorting of miR223 into exosomes is dependent on YBX1 (Shurtleff et al., 2016).
8) In Figure 3a, the authors show that miR223 is mitochondrially localized. Does the sequence of miR223 (WT or Mut) matter for localization? Does it matter for shuttling between YBAP1 and YBX1?
The localization of miR223mut has not been tested in our current study. We plan to conduct these experiments in the future.
9) Supplement 3c - Is it strange that miR190 is not localized to any particular compartment? Is miR190 present ubiquitously and equally among all intracellular compartments?
Most mature miRNAs are predominantly localized in the cytoplasm. Although there is no specific subcellular localization reported for miR190 in the literature, our experimental findings indicate a relatively high expression of miR190 in 293T cells. It is likely that most of miR190 is localized in the cytosol. However, it is also possible that a small fraction of miR190 may associate with a membrane, which could explain its distribution in various subcellular structures. Importantly, we did not observe enrichment of miR190 in the mitochondria or exosomes.
10) Figure 3h - Why would the miR223 levels increase if you remove mitochondria? Does CCCP also cause miR223 upregulation? I would have thought miR223 would just be mis-localized to the cytosol.
We report that the levels of cytoplasmic miR223 increase following the removal of mitochondria using CCCP treatment. While we cannot rule out the possibility that upregulation of miR223 is directly caused by CCCP treatment, we suggest that miR223 becomes mis-localized to the cytosol upon mitochondrial removal. Our data suggests that mitochondria contribute to the secretion of miR223 into exosomes. When mitochondria are removed by mitophagy, cytosolic miR223 is not efficiently secreted, which provides an alternative explanation for the observed increase in miR223 level after mitochondrial removal.
11) Figure 3i - What is the meaning of "Urd" in the figure label? This isn't mentioned anywhere.
“Urd” represents Uridine. Uridine is now spelled out in figure 3i. The absence of mitochondria can impact the function of the mitochondrial enzyme dihydroorotate dehydrogenase, which plays a role in pyrimidine synthesis. To address this issue, one approach is to supplement the cell culture medium with Urd. A previous study demonstrated that primary fibroblasts showed positive responses when Urd was added to the cell culture medium, resulting in improved cell viability for extended periods of time (Correia-Melo et al., 2017).
12) Figure 3j - The data is presented as a ratio of EV/cell. Again, this inaccurately represents the amount of miR223 in the EV. This issue is apparent when looking at Figures 3h and 3j. In 3h, CCCP causes an upregulation of intracellular miR223. As such, the presumed decrease in EV miR233 after CCCP (3j) could be an artifact due to increased levels of intracellular miR223. Both intracellular and EV levels of miRs need to be shown.
Both the intracellular and exosomal levels of miR223 have been included in Figure 3j.
13) In Figure 4, the authors show that when overexpressed, YBX1 will pulldown YBAP1. Can the authors comment as to why none of the earlier purifications show this finding (Figure 1 for example)? Even more curious is that when YBAP1 is purified, YBX1 does not co-purify (Figure 4 supplement 1a, b).
In Figure 4a-b, human YBX1 fused with a Strep II tag was purified from 293T cells using Strep-Tactin® Sepharose® resin in a one-step purification process. Our data has shown that YBAP1 is expressed in 293T cells.
In Figure 1 and Figure 4 Supplement 1a, human YBX1 or YBAP1 fused with His and MBP tags were purified from insect cells using a three-step purification process involving Ni-NTA His-Pur resin, amylose resin, and Superdex-200 gel filtration chromatography.
One possibility is that human YBX1 or YBAP1 may not interact well with insect YBAP1 or YBX1, which could result in separate tagged forms of YBX1 or YBAP1 isolated from insect cells.
Another possibility is that the expression levels of insect YBAP1 and YBX1 may be too low. Consequently, tagged forms YBX1 or YBAP1 expressed in insect cells may copurify with partners not readily detected by Coomassie blue stain. However, in Figure 4 Supplement 1b, human YBX1 fused with His and MBP tags was co-expressed with non-tagged human YBAP1, and both bands of YBX1 and YBAP1 were visible on the Coomassie blue gel after purification using Ni-NTA His-Pur resin, amylose resin, and Superdex-200 gel filtration chromatography.
14) Figure 4f, g - The text associated with these figures is very confusing, as is the labeling for the input. Also, what is "miR223 Fold change" in this regard? Seeing as your IgG should not have IP'd anything, normalizing to IgG can amplify noise. As such, RIP assays are typically presented as % input or fold enrichment.
The RIP assay results have been calculated and presented as a % input in Figure 4g.
15) Figure 4h - The authors show binding between miR223 and YBAP1 however it is not clear how significant this binding is. There is more than a 30-fold difference in binding affinity between miR223 and YBX1 than between miR223 and YBAP1. Even more, when comparing the EMSAs and fraction bound from figures 1 and 2 to those of Figure 4h, the binding between miR223 and YBAP1 more closely resembles that of miR190 and YBX1, which the authors state is a non-binder of YBX1. The authors will need to reconcile these discrepancies.
We agree that the binding of YBAP and YBX1 differ quite significantly in the affinity of their interaction with miR223. It is difficult to draw conclusions from a comparison of the affinities of YBX1 for miR190 and YBAP1 for miR223. Nonetheless, a quantitative difference in the interaction of YBAP1 with miR223 and miR190 is apparent (Fig. 4 h, I, j) and we observed no enrichment miR190 in isolated mitochondria (Fig. 3 supplement 1a) whereas YBAP1 selectively IP’d miR223 from isolated mitochondria (Fig. 4 f and g).
16) Can the authors present the Kd values for EMSA data?
The Kd values for the EMSA data have been added to the respective figures.
17) Figure 5 - Does YBAP1-KO affect mitochondrial protein integrity or numbers?
We generated stable cell lines expressing 3xHA-GFP-OMP25 in both 293T WT and YBAP1-KO cells, but we did not observe any alterations in mitochondrial morphology (Author response image 1).
Author response image 1.
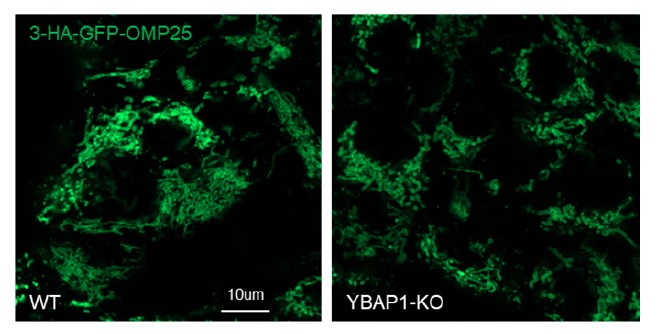
Additionally, we performed a comparison of different mitochondrial markers using immunoblot in 293T WT cells and YBAP1-KO cells and did not observe any changes in these markers (data has been included in Figure 5b.).
18) Figure 6a - Are the authors using YBAP1 as their mitochondrial marker? Please include TOM20 and/or 22.
In Figure 4c and 4e, our data clearly demonstrate that the majority of YBAP1 is localized in the mitochondria.
To further validate this localization, we performed immunofluorescence staining using antibodies against endogenous Tom20 and YBX1. The immunofluorescence images document YBX1 associated with mitochondria (Author response image 2 and new Fig 6a.).
Author response image 2.
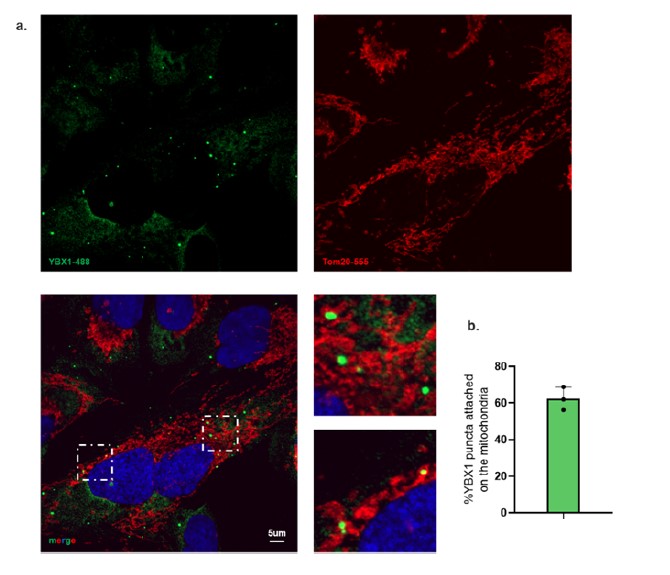
19) Figure 6b - Rab5 is an early endosome marker and may not fully represent the organelles that become MVBs. Co-localization at this point does not suggest that associating proteins will be present in the exosome, and it is possible that the authors are looking at the precursor of a recycling endosome. Even more, exosome loading does not occur at the early endosome, but instead at the MVB. Perhaps looking at markers of the late endosome such as Rab7 or ideally markers of the MVB such as M6P or CD63 would help draw an association between YBX1, YBAP1, and the exosome. Also, If the authors want to make the claim that interactions at the early endosome leads to secretion as an exosome, the authors should show that isolated EVs from Rab5Q79L-expressing cells contain miR223.
We have previously used overexpressed Rab5(Q79L) to monitor the localization of exosomal content, specifically CD63 and YBX1, in enlarged endosomes (Liu et al. 2021, Fig. 4A, B). These endosomes exhibit a mixture of early and late endocytic markers, including CD63. (Wegner et al., 2010). Hence, the presence of Rab5(Q79L)-positive enlarged endosomes does not solely indicate early endosomes.
20) The mentioning of P-bodies is interesting but at no time is an association addressed. This is therefore an overly speculative conclusion. Either show an association or leave this out of the manuscript.
In a previous paper we demonstrated that YBX1 puncta colocalize with P-body markers EDC4, Dcp1 and DDX6 (Liu et al., 2021).
21) In lines 55-58, the authors make the comment "However, many of these studies used sedimentation at ~100,000 g to collect EVs, which may also collect RNP particles not enclosed within membranes which complicates the interpretation of these data." Do RNPs not dissolve when secreted? Can the authors give a reference for this statement?
In a previous paper, we demonstrated that the RNP Ago2 does not dissolve in the conditioned medium and is not in vesicles but sediments to the bottom of a density gradient (Temoche-Diaz et al., 2019).
Author Response
Reviewer #1 (Public Review):
High resolution mechanistic studies would be instrumental in driving the development of Cas7-11 based biotechnology applications. This work is unfortunately overshadowed by a recent Cell publication (PMID: 35643083) describing the same Cas7-11 RNA-protein complex. However, given the tremendous interest in these systems, it is my opinion that this independent study will still be well cited, if presented well. The authors obviously have been trying to establish a unique angle for their story, by probing deeper into the mechanism of crRNA processing and target RNA cleavage. The study is carried out rigorously. The current version of the manuscript appears to have been rushed out. It would benefit from clarification and text polishing.
We thank the reviewer for the positive and helpful comments that have made the manuscript more impactful.
To summarize the revisions, we have resolved the metal-dependence issue, updated the maps in both main and supplementary figures that support the model, re-organized the labels for clarity, and added the comparison between our and Kato et al.’ structures.
In addition, we describe a new result with an isolated C7L.1 fragment that retains the processing and crRNA binding activities.
Reviewer #2 (Public Review):
In this manuscript, Gowswami et al. solved a cryo-EM structure of Desulfonema ishimotonii Cas7-11 (DiCas7-11) bound to a guiding CRISPR RNA (crRNA) and target RNA. Cas7-11 is of interest due to its unusual architecture as a single polypeptide, in contrast to other type III CRISPR-Cas effectors that are composed of several different protein subunits. The authors have obtained a high-quality cryo-EM map at 2.82 angstrom resolution, allowing them to build a structural model for the protein, crRNA and target RNA. The authors used the structure to clearly identify a catalytic histidine residue in the Cas7-11 Cas7.1 domain that is important for crRNA processing activity. The authors also investigated the effects of metal ions and crRNAtarget base pairing on target RNA cleavage. Finally, the authors used their structure to guide engineering of a compact version of Cas7-11 in which an insertion domain that is disordered in the cryo-EM map was removed. This compact Cas7-11 appears to have comparable cleavage activity to the full-length protein.
The cryo-EM map presented in this manuscript is generally of high quality and the manuscript is very well illustrated. However, some of the map interpretation requires clarification (outlined below). This structure will be valuable as there is significant interest in DiCas7-11 for biotechnology. Indeed, the authors have begun to engineer the protein based on observations from the structure. Although characterization of this engineered Cas7-11 is limited in this study and similar engineering was also performed in a recently published paper (PMID 35643083), this proof-of-principle experiment demonstrates the importance of having such structural information.
The biochemistry experiments presented in the study identify an important residue for crRNA processing, and suggest that target RNA cleavage is not fully metal-ion dependent. Most of these conclusions are based on straightforward structure-function experiments. However, some results related to target RNA cleavage are difficult to interpret as presented. Overall, while the cryo-EM data presented in this work is of high quality, both the structural model and the biochemical results require further clarification as outlined below.
We thank the reviewer for the positive and helpful comments that have made the manuscript more impactful.
To summarize the revisions, we have resolved the metal-dependence issue, updated the maps in both main and supplementary figures that support the model, re-organized the labels for clarity, and added the comparison between our and Kato et al.’ structures.
In addition, we describe a new result with an isolated C7L.1 fragment that retains the processing and crRNA binding activities.
- The DiCas7-11 structure bound to target RNA was also recently reported by Kato et al. (PMID 35643083). The authors have not cited this work or compared the two structures. While the structures are likely quite similar, it is notable that the structure reported in the current paper is for the wild-type protein and the sample was prepared under reactive conditions, resulting in a partially cleaved target. Kato et al. used a catalytically dead version of Cas7-11 in which the target RNA should remain fully intact. Are there differences in the Cas7-11 structure observed in the presence of a partially cleaved target RNA in comparison to the Kato et al. structure? Such a comparison is appropriate given the similarities between the two reports. A figure comparing the two structures could be included in the manuscript.
We have added a paragraph on page 12 that describe the differences in preparation of the two complexes and their structures. We observed minor differences in the overall protein structure (r.m.s.d. 0.918 Å for 8114 atoms) but did observe quite different interactions between the protein and the first 5’-tag nucleotide (U(-15) vs. G(-15)) due to the different constructs in pre-crRNA, which suggests an importance of U(-15) in forming the processing-competent active site. We added Figure 2-figure supplementary 3 that illustrates the similarities and the differences.
2.The cryo-EM density map is of high quality, but some of the structural model is not fully supported by the experimental data (e.g. protein loops from the alphafold model were not removed despite lack of cryo-EM density). Most importantly, there is little density for the target RNA beyond the site 1 cleavage site, suggesting that the RNA was cleaved and the product was released. However, this region of the RNA was included in the structural model. It is unclear what density this region of the target RNA model was based on. Further discussion of the interpretation of the partially cleaved target RNA is necessary. Were 3D classes observed in various states of RNA cleavage and with varied density for the product RNAs?
We should have made it clear in the Method that multiple maps were used in building the structure but only submitted the post-processed map to reviewers. When using the Relion 4.0’s local resolution estimation-generated map, we observed sufficient density for some of the regions the reviewer is referring to. For instance, the site 1 cleavage density does support the model for the two nucleotides beyond site 1 cleavage site (see the revised Figure 1 & Figure 1- figure supplement 3).
However, there are protein loops that remain lack of convincing density. These include 134141 and 1316-1329 that are now removed from the final coordinate.
The “partially cleaved target RNA” phrase is a result of weak density for nucleotides downstream of site 1 (+2 and +3) but clear density flanking site 2. This feature indicates that cleavage likely had taken place at site 1 but not site 2 in most of the particles went into the reconstruction. To further clarify this phrase, we added “The PFS region plus the first base paired nucleotide (+1*) are not observed.” on page 4 and better indicate which nucleotides are or are not built in our model in Figure 1.
- The authors argue that site 1 cleavage of target RNA is independent of metal ions. This is a potentially interesting result, but it is difficult to determine whether it is supported by the evidence provided in the manuscript. The Methods section only describes a buffer containing 10 mM MgCl2, but does not describe conditions containing EDTA. How much EDTA was added and was MgCl2 omitted from these samples? In addition, it is unclear whether the site 1 product is visible in Figures 2d and 3d. To my eye, the products that are present in the EDTA conditions on these gels migrated slightly slower than the typical site 1 product. This may suggest an alternate cleavage site or chemistry (e.g. cyclic phosphate is maintained following cleavage). Further experimental details and potentially additional experiments are required to fully support the conclusion that site 1 cleavage may be metal independent.
As we pointed out in response to Reviewer 1’s #8 comment, this conclusion may have been a result of using an older batch of DiCas7-11 that contains degraded fragments.
As shown in the attached figure below, “batch Y” was an older prep from our in-house clone and “batch X” is a newer prep from the Addgene purchased clone (gel on right), and they consistently produce metal-independent (batch Y) or metal-dependent (batch X) cleavage (gel on left). It is possible that the degraded fragments in batch Y carry a metal-independent cleavage activity that is absent in the more pure batch X.
We further performed mass spectrometry analysis of two of the degraded fragments from batch Y (indicated by arrows below) and discovered that these are indeed part of DiCas7-11. We, however, cannot rationalize, without more experimental evidence, why these fragments might have generated metal-independent cleavage at site 1. Therefore, we simply updated all our cleavage results from the new and cleaner prep (batch X) (For instance, Figure 3c). As a result, all references to “metal-independence” were removed.
With regard to the nature of cleaved products, we found both sites could be inhibited by specific 2’-deoxy modifications, consistent with the previous observation that Type III systems generate a 2’, 3’-cyclic product in spite of the metal dependence (for instance, see Hale, C. R., Zhao, P., Olson, S., Duff, M. O., Graveley, B. R., Wells, L., ... & Terns, M. P. (2009). RNA-guided RNA cleavage by a CRISPR RNA-Cas protein complex. Cell, 139(5), 945-956.)
We added this rationale based on the new results and believe that these characterizations are now thorough and conclusive
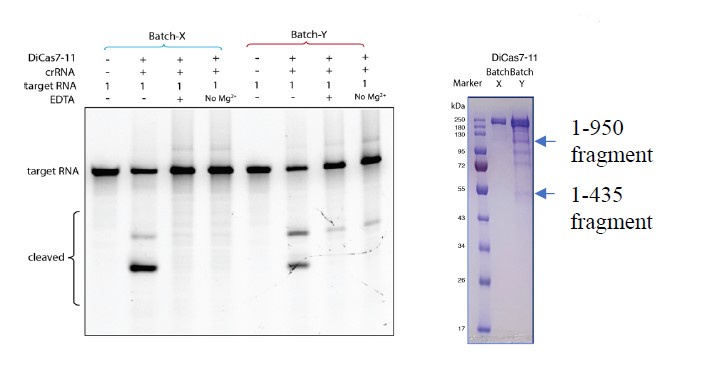
- The authors performed an experiment investigating the importance of crRNA-target base pairing on cleavage activity (Figure 3e). However, negative controls for the RNA targets in the absence of crRNA and Cas7-11 were not included in this experiment, making it impossible to determine which bands on the gel correspond to substrates and which correspond to products. This result is therefore not interpretable by the reader and does not support the conclusions drawn by the authors.
Our original gel image (below) does contain these controls but we did not include them for the figure due to space considerations (we should have included it as a supplementary figure). We have now completely updated Figure 3e with much better quality and controls. Both the older and the updated experiments show the same results.
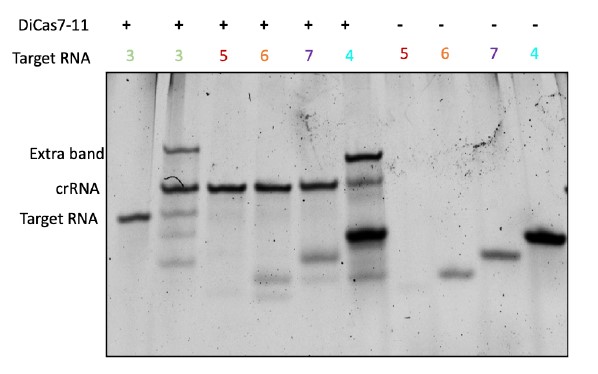
Original gel for Figure 3e containing controls.
Author Response
Reviewer #1 (Public Review):
The work by Yijun Zhang and Zhimin He at al. analyzes the role of HDAC3 within DC subsets. Using an inducible ERT2-cre mouse model they observe the dependency of pDCs but not cDCs on HDAC3. The requirement of this histone modifier appears to be early during development around the CLP stage. Tamoxifen treated mice lack almost all pDCs besides lymphoid progenitors. Through bulk RNA seq experiment the authors identify multiple DC specific target gens within the remaining pDCs and further using Cut and Tag technology they validate some of the identified targets of HDAC3. Collectively the study is well executed and shows the requirement of HDAC3 on pDCs but not cDCs, in line with the recent findings of a lymphoid origin of pDC.
1) While the authors provide extensive data on the requirement of HDAC3 within progenitors, the high expression of HDAC3 in mature pDCs may underly a functional requirement. Have you tested INF production in CD11c cre pDCs? Are there transcriptional differences between pDCs from HDAC CD11c cre and WT mice?
We greatly appreciate the reviewer’s point. We have confirmed that Hdac3 can be efficiently deleted in pDCs of Hdac3fl/fl-CD11c Cre mice (Figure 5-figure supplement 1 in revised manuscript). Furthermore, in those Hdac3fl/fl-CD11c Cre mice, we have observed significantly decreased expression of key cytokines (Ifna, Ifnb, and Ifnl) by pDCs upon activation by CpG ODN (shown in Author response image 1). Therefore, HDAC3 is also required for proper pDC function. However, we have yet to conduct RNA-seq analysis comparing pDCs from HDAC CD11c cre and WT mice.
Author response image 1.
Cytokine expression in Hdac3 deficient pDCs upon activation
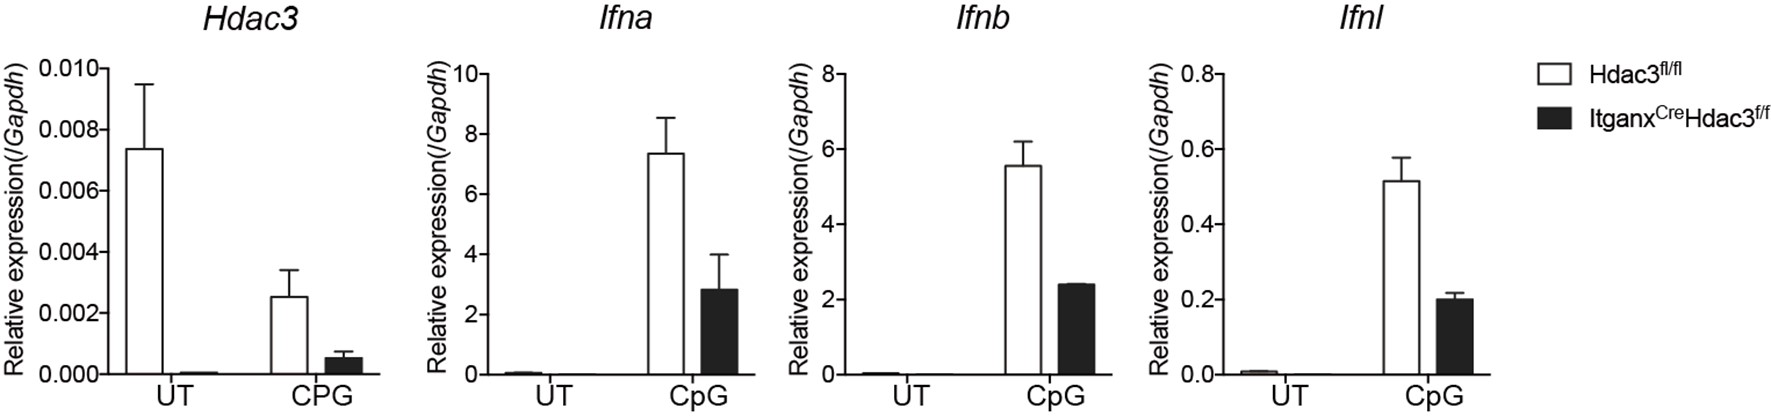
2) A more detailed characterization of the progenitor compartment that is compromised following depletion would be important, as also suggested in the specific points.
We thank the reviewer for this constructive suggestion. We have performed thorough analysis of the phenotype of hematopoietic stem cells and progenitor cells at various developmental stages in the bone marrow of Hdac3 deficient mice, based on the gating strategy from the recommended reference. Briefly, we analyzed the subpopulations of progenitors based on the description in the published report by "Pietras et al. 2015", namely MPP2, MPP3 and MPP4, using the same gating strategy for hematopoietic stem/progenitor cells. As shown in Author response image 2 and Author response image 3, we found that the number of LSK cells was increased in Hdac3 deficient mice, especially the subpopulations of MPP2 and MPP3, whereas no significant changes in MPP4. In contrast, the numbers of LT-HSC, ST-HSC and CLP were all dramatically decreased. This result has been optimized and added as Figure 3A in revised manuscript. The relevant description has been added and underlined in the revised manuscript Page 6 Line 164-168.
Author response image 2.
Gating strategy for hematopoietic stem/progenitor cells in bone marrow.
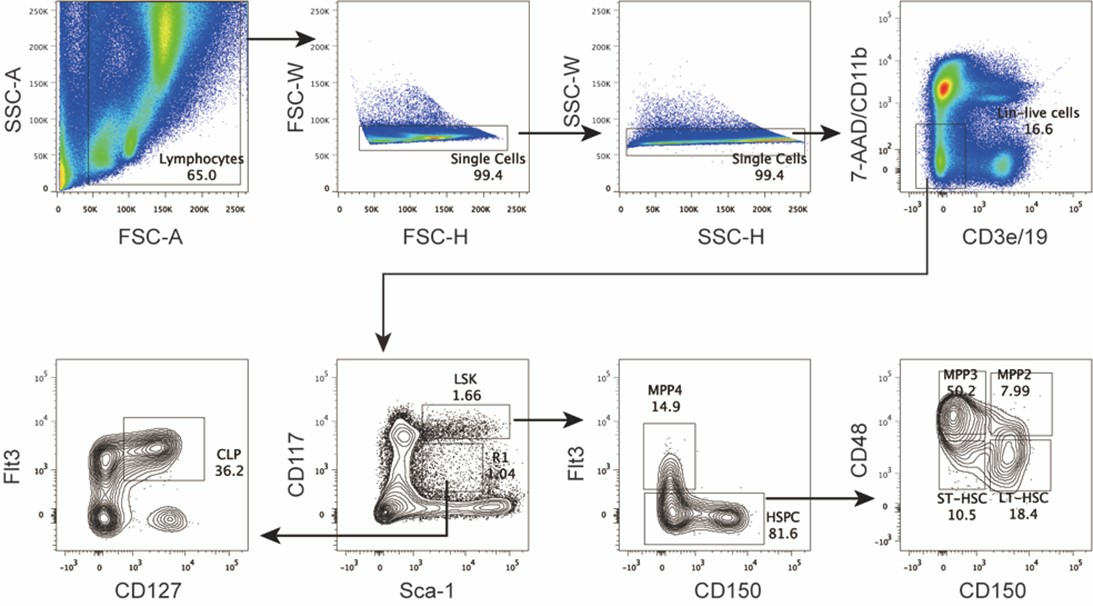
Author response image 3.
Hematopoietic stem/progenitor cells in Hdac3 deficient mice
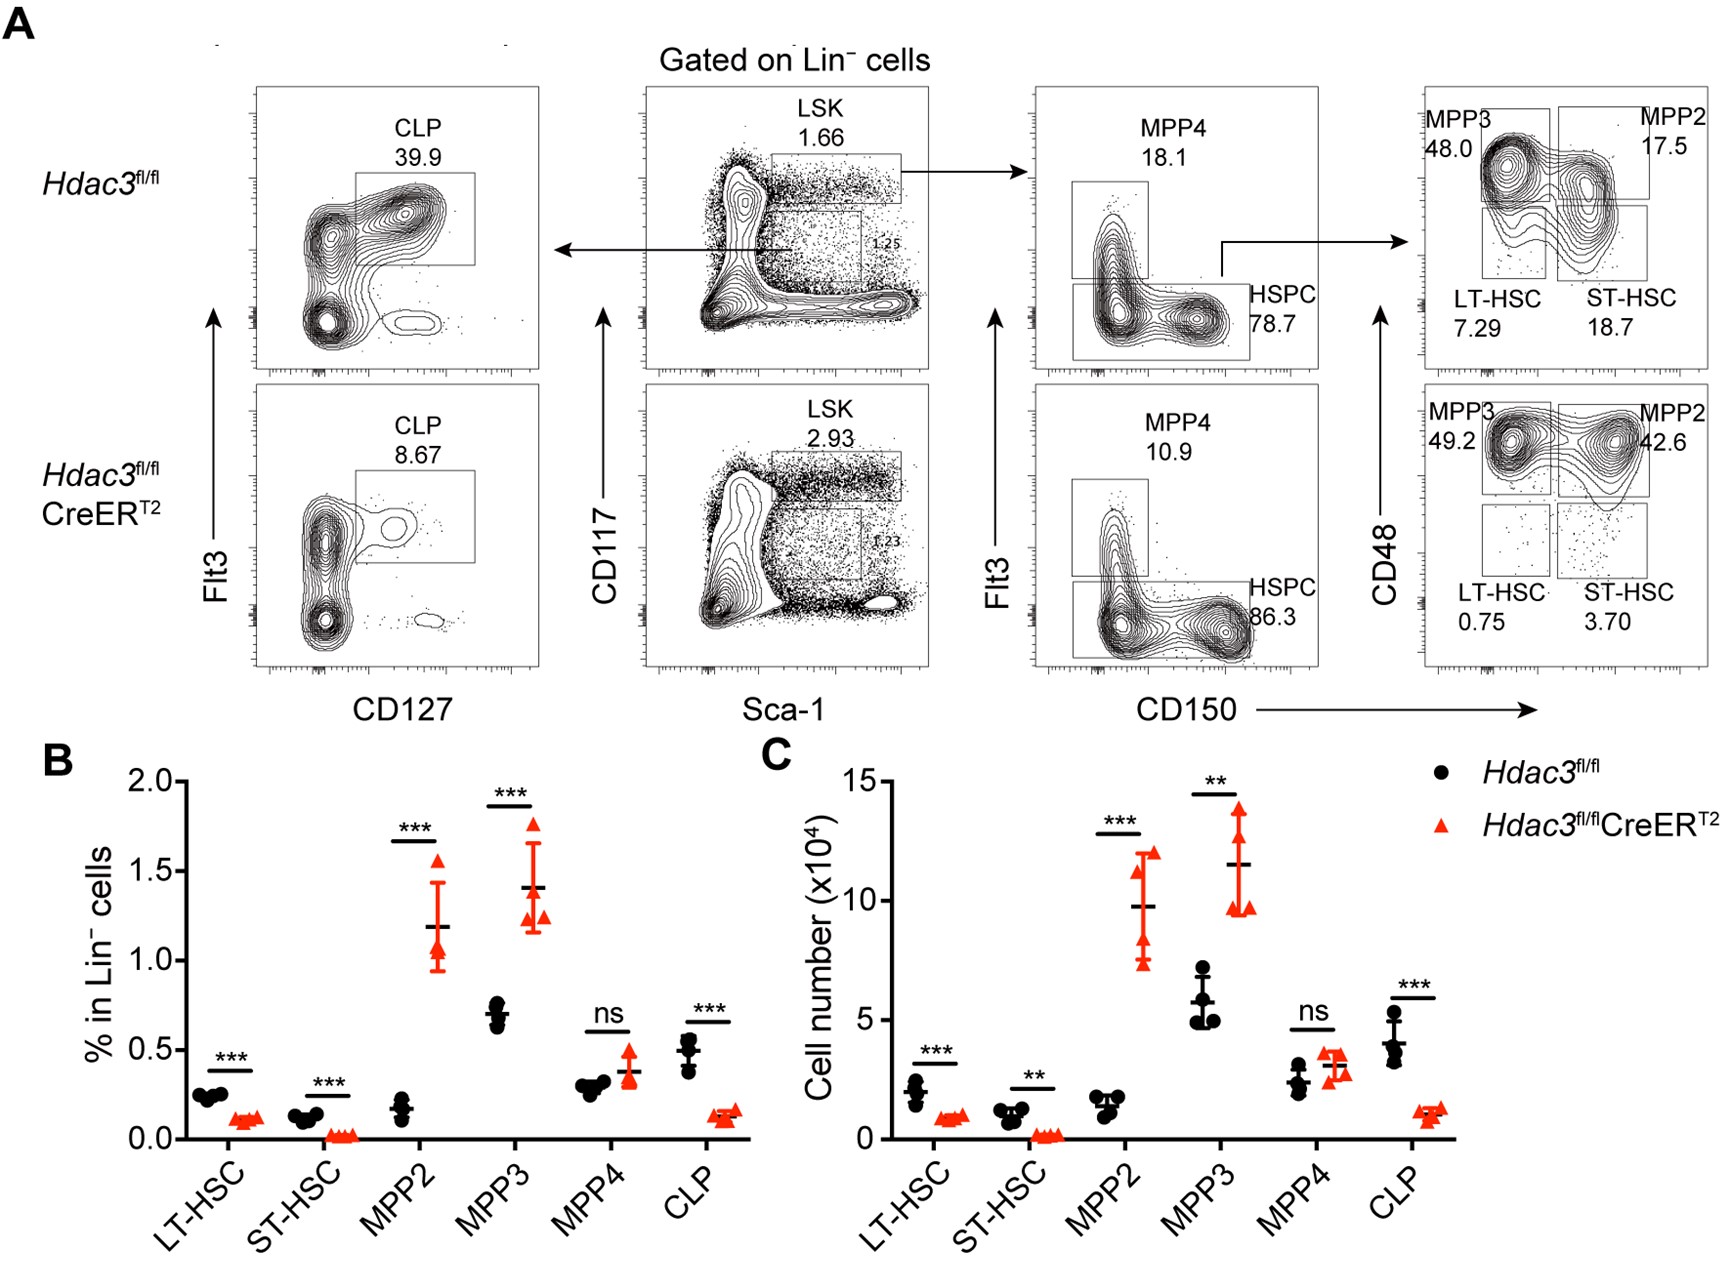
Reviewer #2 (Public Review):
In this article Zhang et al. report that the Histone Deacetylase-3 (HDAC3) is highly expressed in mouse pDC and that pDC development is severely affected both in vivo and in vitro when using mice harbouring conditional deletion of HDAC3. However, pDC numbers are not affected in Hdac3fl/fl Itgax-Cre mice, indicating that HDCA3 is dispensable in CD11c+ late stages of pDC differentiation. Indeed, the authors provide wide experimental evidence for a role of HDAC3 in early precursors of pDC development, by combining adoptive transfer, gene expression profiling and in vitro differentiation experiments. Mechanistically, the authors have demonstrated that HDAC3 activity represses the expression of several transcription factors promoting cDC1 development, thus allowing the expression of genes involved in pDC development. In conclusion, these findings reveals HDAC3 as a key epigenetic regulator of the expression of the transcription factors required for pDC vs cDC1 developmental fate.
These results are novel and very promising. However, supplementary information and eventual further investigations are required to improve the clarity and the robustness of this article.
Major points
1) The gating strategy adopted to identify pDC in the BM and in the spleen should be entirely described and shown, at least as a Supplementary Figure. For the BM the authors indicate in the M & M section that they negatively selected cells for CD8a and B220, but both markers are actually expressed by differentiated pDC. However, in the Figures 1 and 2 pDC has been shown to be gated on CD19- CD11b- CD11c+. What is the precise protocol followed for pDC gating in the different organs and experiments?
We apologize for not clearly describing the protocols used in this study. Please see the detailed gating strategy for pDC in bone marrow, and for pDC and cDC in spleen (Figure 4 and Figure 5). These information are now added to Figure1−figure supplement 3, The relevant description has been underlined in Page 5 Line 113-116, in revised manuscript.
We would like to clarify that in our study, we used two different panels of antibody cocktails, one for bone marrow Lin- cells, including mAbs to CD2/CD3/TER-119/Ly6G/B220/CD11b/CD8/CD19; the other for DC enrichment, including mAbs to CD3/CD90/TER-119/Ly6G/CD19. We included B220 in the Lineage cocktails to deplete B cells and pDCs, in order to enrich for the progenitor cells from bone marrow. However, when enriching for the pDC and cDC, B220 or CD8a were not included in the cocktail to avoid depletion of pDC and cDC1 subsets . For the flow cytometry analysis of pDCs, we gated pDCs as the CD19−CD11b−CD11c+B220+SiglecH+ population in both bone marrow and spleen. The relevant description has been underlined in the revised manuscript Page 16 Line 431-434.
2) pDC identified in the BM as SiglecH+ B220+ can actually contain DC precursors, that can express these markers, too. This could explain why the impact of HDAC3 deletion appears stronger in the spleen than in the BM (Figures 1A and 2A). Along the same line, I think that it would important to show the phenotype of pDC in control vs HDAC3-deleted mice for the different pDC markers used (SiglecH, B220, Bst2) and I would suggest to include also Ly6D, taking also in account the results obtained in Figures 4 and 7. Finally, as HDCA3 deletion induces downregulation of CD8a in cDC1 and pDC express CD8a, it would important to analyse the expression of this marker on control vs HDAC3-deleted pDC.
We agree with the reviewer’s points. In the revised manuscript, we incorporated major surface markers, including Siglec H, B220, Ly6D, and PDCA-1, all of which consistently demonstrated a substantial decrease in the pDC population in Hdac3 deficient mice. Moreover, we did notice that Ly6D+ pDCs showed higher degree of decrease in Hdac3 deficient mice. Additionally, percentage and number of both CD8+ pDC and CD8- pDC were decreased in Hdac3 deficient mice (Author response image 4). These results are shown in Figure1−figure supplement 4 of the revised manuscript. The relevant description has been added and underlined in the revised manuscript Page 5 Line 121-125.
Author response image 4.
Bone marrow pDCs in Hdac3 deficient mice revealed by multiple surface markers
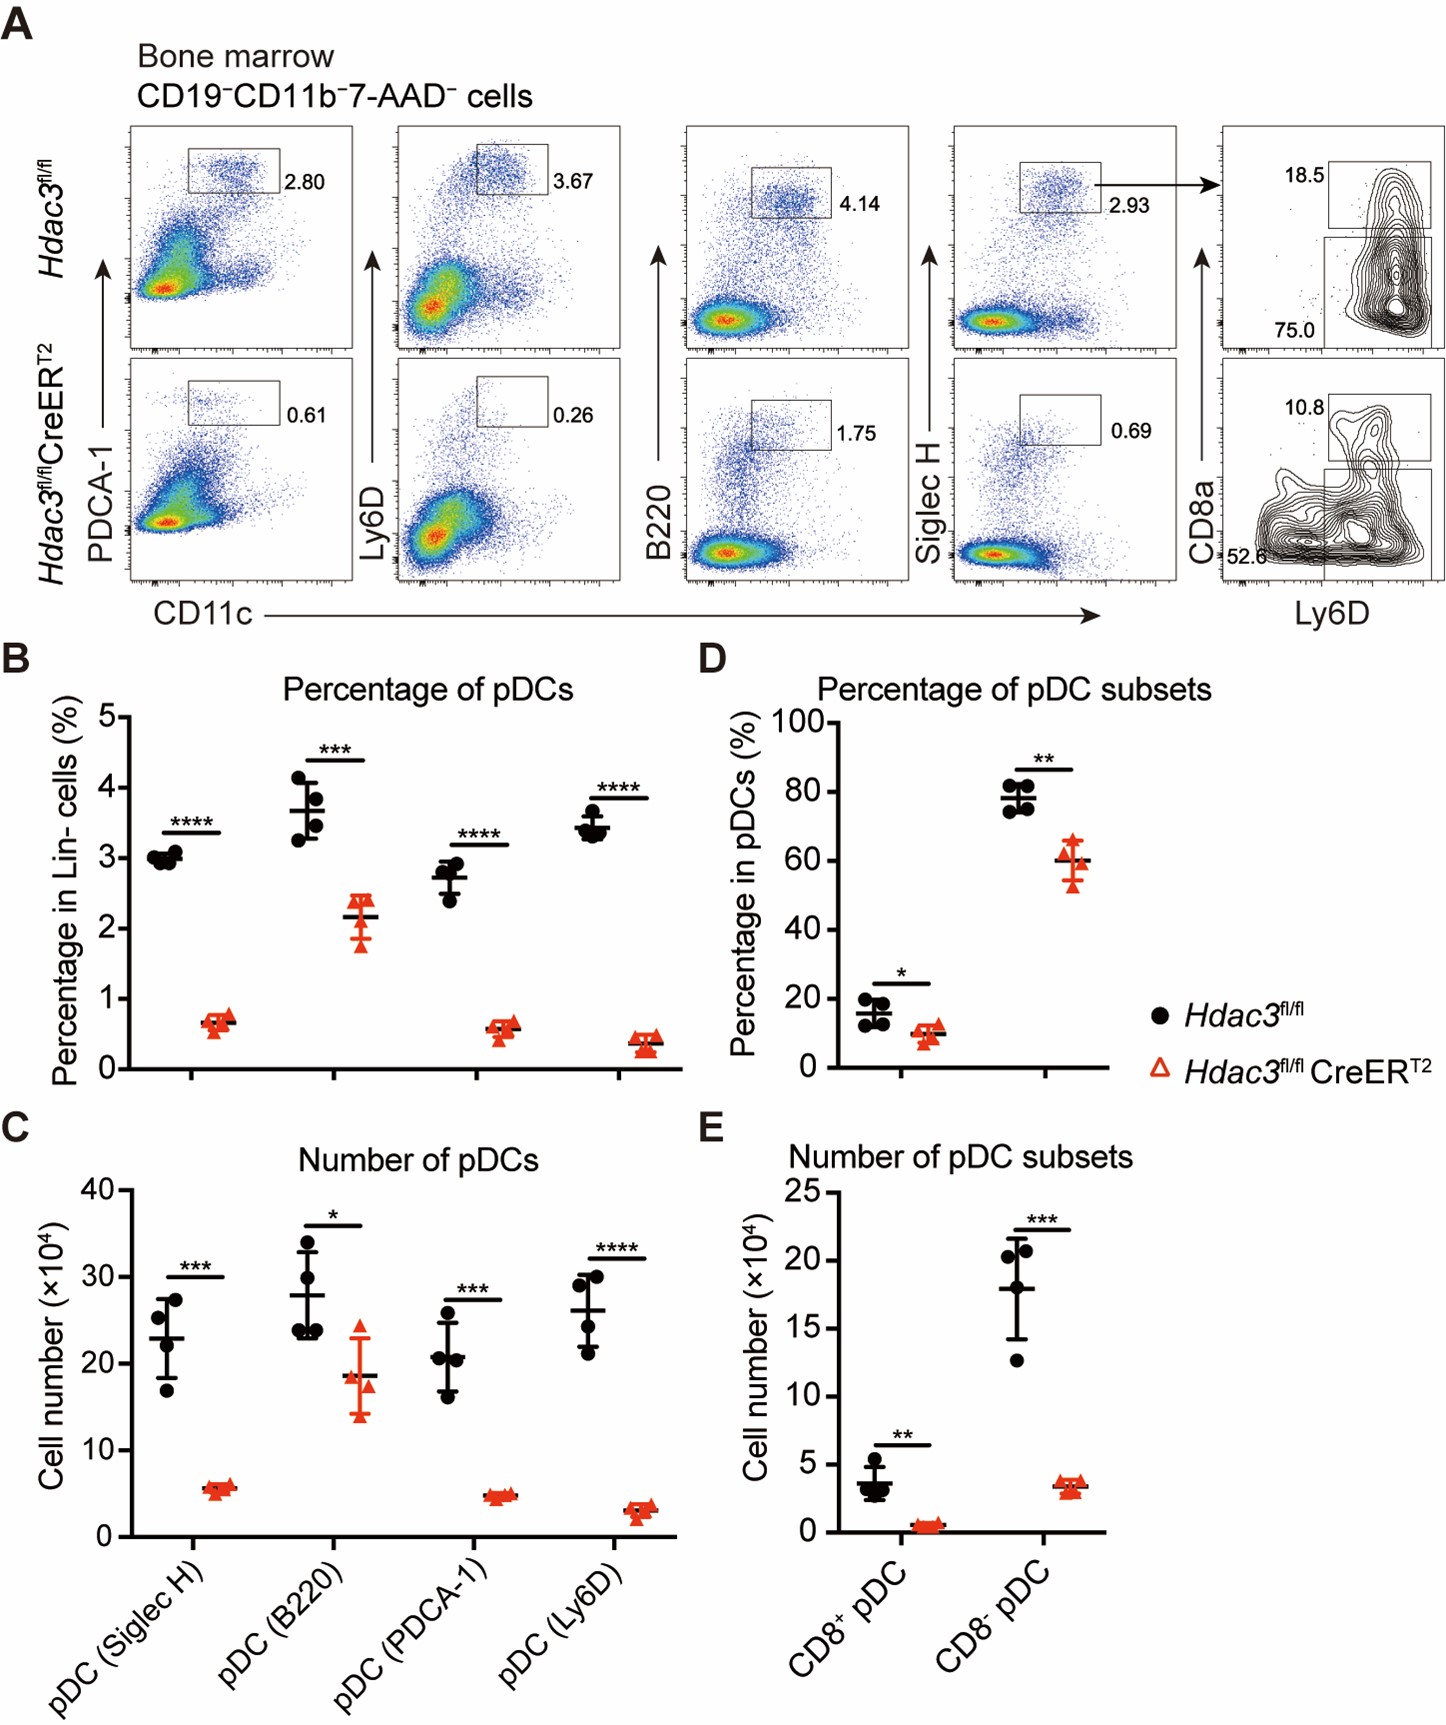
3) How do the authors explain that in the absence of HDAC3 cDC2 development increased in vivo in chimeric mice, but reduced in vitro (Figures 2B and 2E)?
As shown in the response to the Minor point 5 of Reviewer#1. Briefly, we suggested that the variabilities maybe explained by the timing of anaysis after HDAC3 deletion. In Figure 2C, we analyzed cells from the recipients one week after the final tamoxifen treatment and observed no significant change in the percentage of cDC2 when further pooled all the experiment data. In Figure 2E, where tamoxifen was administered at Day 0 in Flt3L-mediated DC differentiation in vitro, the DC subsets generated were then analyzed at different time points. We observed no significant changes in cDCs and cDC2 at Day 5, but decreases in the percentage of cDC2 were observed at Day 7 and Day 9. This suggested that the cDC subsets at Day 5 might have originated from progenitors at a later stage, while those at Day 7 and Day 9 might originate form the earlier progenitors. Therefore, based on these in vitro and in vivo experiments, we believe that the variation in the cDC2 phenotype might be attributed to the progenitors at different stages that generated these cDCs.
4) More generally, as reported also by authors (line 207), the reconstitution with HDAC3-deleted cells is poorly efficient. Although cDC seem not to be impacted, are other lymphoid or myeloid cells affected? This should be expected as HDAC3 regulates T and B development, as well as macrophage function. This should be important to know, although this does not call into question the results shown, as obtained in a competitive context.
In this study, we found no significant influence on T cells, mature B cells or NK cells, but immature B cells were significantly decreased, in Hdac3-ERT2-Cre mice after tamoxifen treatment (Figure 6). However, in the bone marrow chimera experiments, the numbers of major lymphoid cells were decreased due to the impaired reconstitution capacity of Hdac3 deficient progenitors. Consistent with our finding, it has been reported that HDAC3 was required for T cell and B cell generation, in HDAC3-VavCre mice (Summers et al., 2013), and was necessary for T cell maturation (Hsu et al., 2015). Moreover, HDAC3 is also required for the expression of inflammatory genes in macrophages upon activation (Chen et al., 2012; Nguyen et al., 2020).
5) What are the precise gating strategies used to identify the different hematopoietic precursors in the Figure 4 ? In particular, is there any lineage exclusion performed?
We apologize for not describing the experimental procedures clearly. In this study we enriched the lineage negative (Lin−) cells from the bone marrow using a Lineage-depleting antibody cocktail including mAbs to CD2/CD3/TER-119/Ly6G/B220/CD11b/CD8/CD19. We also provide the gating strategy implemented for sorting LSK and CDP populations from the Lin− cells in the bone marrow (Author response image 5), shown in the Figure 3A and Figure4−figure supplement 1 of revised manuscript.
Author response image 5.
Gating strategy for LSK, CD115+ CDP and CD115− CDP in bone marrow
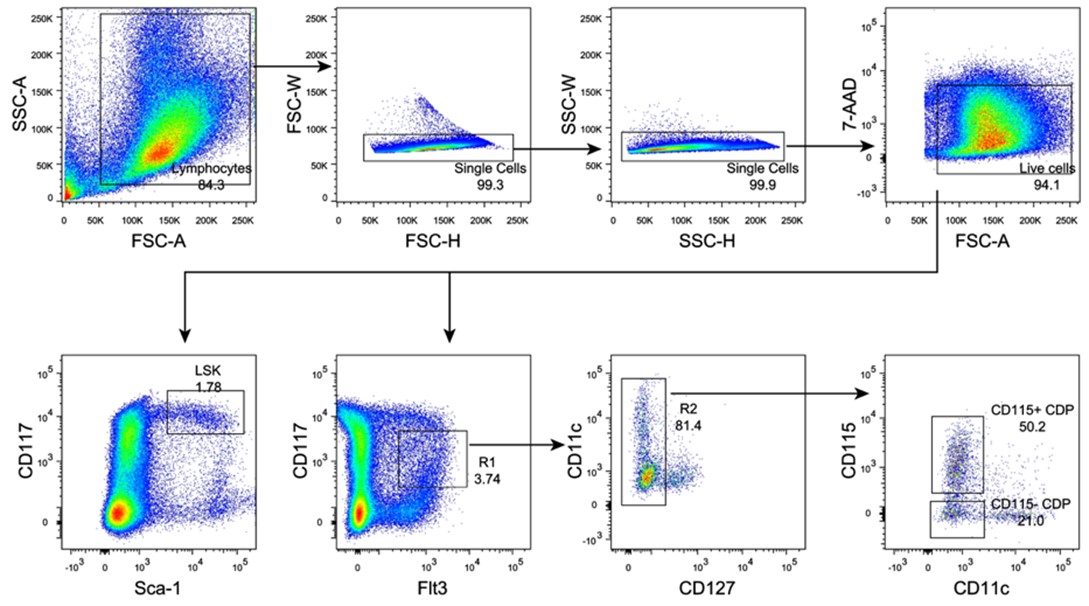
6) Moreover, what is the SiglecH+ CD11c- population appearing in the spleen of mice reconstituted with HDAC3-deleted CDP, in Fig 4D?
We also noticed the appearance of a SiglecH+CD11c− cell population in the spleen of recipient mice reconstituted with HDAC3-deficient CD115−CDPs, while the presence of this population was not as significant in the HDAC3-Ctrl group, as shown in Figure 4D. We speculate that this SiglecH+CD11c− cell population might represent some cells at a differentiation stage earlier than pre-DCs. Alternatively, the relatively increased percentage of this population derived from HDAC3-deficient CD115−CDP might be due to the substantially decreased total numbers of DCs. This could be clarified by further analysis using additional cell surface markers.
7) Finally, in Fig 4H, how do the authors explain that Hdac3fl/fl express Il7r, while they are supposed to be sorted CD127- cells?
This is indeed an interesting question. In this study, we confirmed that CD115−CDPs were isolated from the surface CD127− cell population for RNA-seq analysis, and the purity of the sorted cells were checked (Author response image 6), as shown in Figure4−figure supplement 1 in revised manuscript.
The possible explanation for the expression of Il7r mRNA in some HDAC3fl/fl CD115−CDPs, as revealed in Figure 4H by RNA-seq analysis, could be due to a very low level of cell surface expression of CD127, these cells therefore could not be efficiently excluded by sorting for surface CD127- cells.
Author response image 6.
CD115−CDPs sorting from Hdac3-Ctrl and Hdac3-KO mice
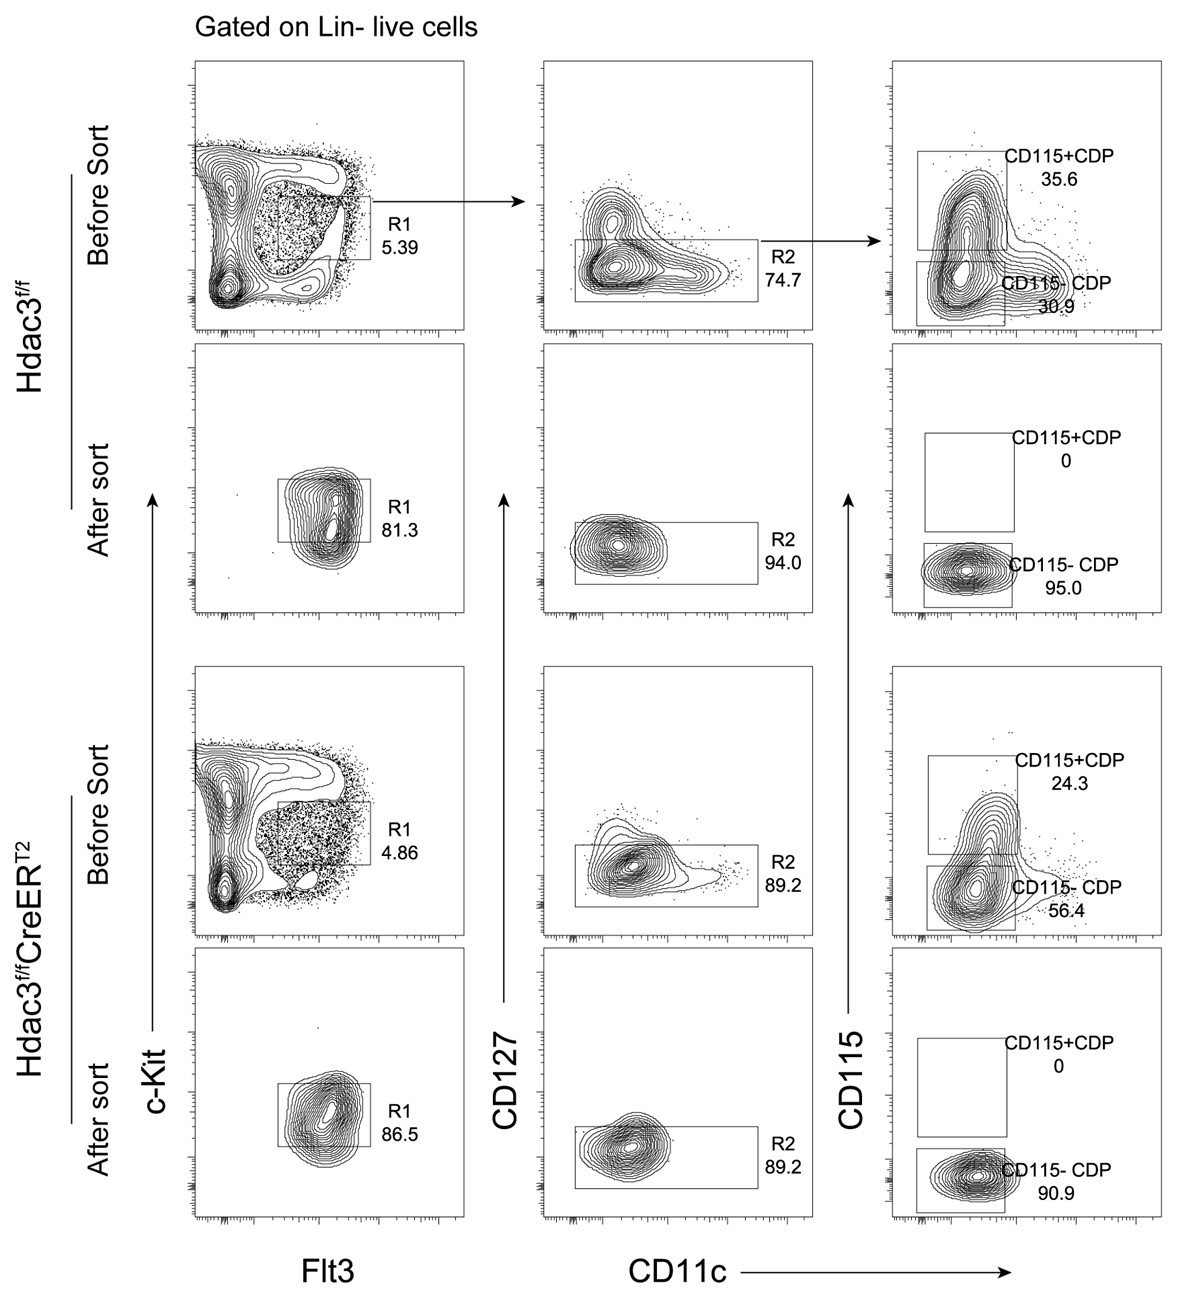
8) What is known about the expression of HDAC3 in the different hematopoietic precursors analysed in this study? This information is available only for a few of them in Supplementary Figure 1. If not yet studied, they should be addressed.
We conducted additional analysis to address the expression of Hdac3 in various hematopoietic progenitor cells at different stages, based on the RNA-seq analyis. The data revealed a relatively consistent level of Hdac3 expression in progenitor populations, including HSC, MMP4, CLP, CDP and BM pDCs (Author response image 7). That suggests that HDAC3 may play an important role in the regulation of hematopoiesis at multiple stages. This information is now added in Figure1−figure supplement 1B of revised manuscript.
Author response image 7.
Hdac3 expression in hematopoietic progenitor cells
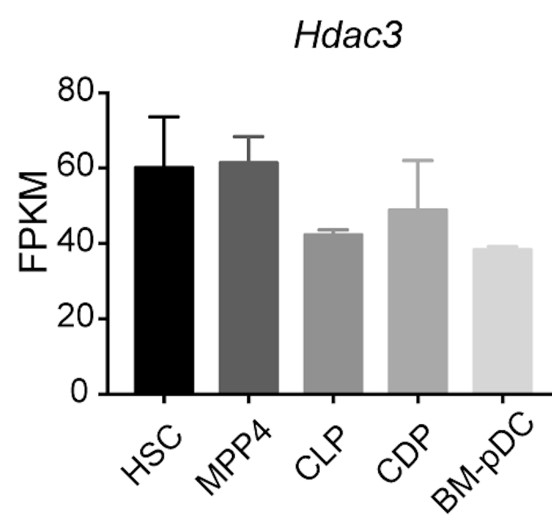
9) It would be highly informative to extend CUT and Tag studies to Irf8 and Tcf4, if this is technically feasible.
We totally agree with the reviewer. We have indeed attempted using CUT and Tag study to compare the binding sites of IRF8 and TCF4 in wild-type and Hdac3-deficient pDCs. However, it proved that this is technically unfeasible to get reliable results due to the limited number of cells we could obtain from the HDAC3 deficient mice. We are committed to explore alternative approaches or technologies in future studies to address this issue.
Author Response
Reviewer #1 (Public Review):
The manuscript by Lujan and colleagues describes a series of cellular phenotypes associated with the depletion of TANGO2, a poorly characterized gene product but relevant to neurological and muscular disorders. The authors report that TANGO2 associates with membrane-bound organelles, mainly mitochondria, impacting in lipid metabolism and the accumulation of reactive-oxygen species. Based on these observations the authors speculate that TANGO2 function in Acyl-CoA metabolism.
The observations are generally convincing and most of the conclusions appear logical. While the function of TANGO2 remains unclear, the finding that it interferes with lipid metabolism is novel and important. This observation was not developed to a great extent and based on the data presented, the link between TANGO2 and acyl-CoA, as proposed by the authors, appears rather speculative.
We thank you for your advice and now include additional data that lends support to the role of TANGO2 in lipid metabolism. We have changed the title accordingly.
1) The data with overexpressed TANGO2 looks convincing but I wonder if the authors analyzed the localization of endogenous TANGO2 by immunofluorescence using the antibody described in Figure S2. The idea that TANGO2 localizes to membrane contact sites between mitochondria and the ER and LDs would also be strengthened by experiments including multiple organelle markers.
We agree that most of the data on TANGO2 localization are based on the overexpression of the protein. As suggested by the reviewer and despite the lack of commercial antibodies for immunofluorescence-based evaluation, see the following chart, we tested the commercial antibody described in Figure 2 on HepG2 and U2OS cells. Moreover, we used Förster resonance energy transfer (FRET) technology to analyze the proximity of TANGO2 and Tom20, a specific outer mitochondrial membrane protein. In addition, we visualized cells expressing tagged TANGO2 and tagged VAP-B, an integral ER protein in the mitochondria-associated membranes (doi:10.1093/hmg/ddr559) or tagged TANGO2 and tagged GPAT4-Hairpin, an integral LD protein (doi:10.1016/j.devcel.2013.01.013). These data strengthen our proposal and are presented in the revised manuscript.
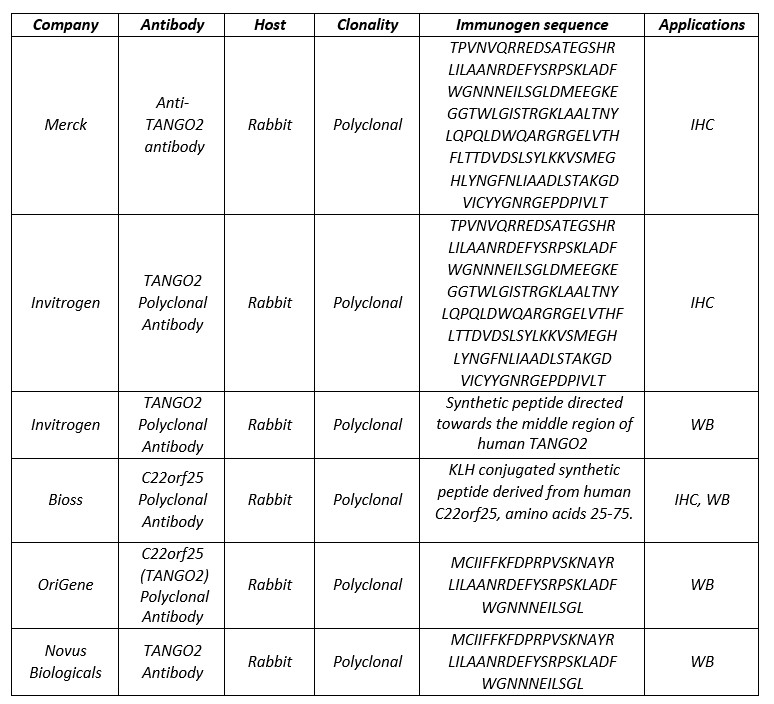
As suggested by the reviewer, we have also visualized two additional cell lines (HepG2 and U2OS) with the anti-TANGO2( from Novus Biologicals) that have been used for western blot (see chart above). As shown in the following figure, the commercial antibody shows a lot of staining in addition to mitochondria, especially in U2OS cells, where it also appears to label the nucleus.
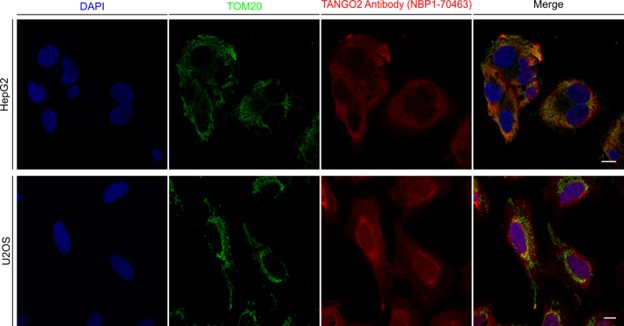
2) The changes in LD size in TANGO2-depleted cells are very interesting and consistent with the role of TANGO2 in lipid metabolism. From the lipidomics analysis, it seems that the relative levels of the main neutral lipids in TANGO2-depleted cells remain unaltered (TAG) or even decrease (CE). Therefore, it would be interesting to explore further the increase in LD size for example analyze/display the absolute levels of neutral lipids in the various conditions.
We agree with the reviewer and now present the absolute levels of lipids of interest in the various conditions of the lipidomics analyses (Figure S 3).
3) Most of the lipidomics changes in TANGO2-depleted cells are observed in lipid species present in very low amounts while the relative abundance of major phospholipids (PC, PE PI) remains mostly unchanged. It would be good to also display the absolute levels of the various lipids analyzed. This is an important point to clarify as it would be unlikely that these major phospholipids are unaffected by an overall defect in Acyl-CoA metabolism, as proposed by the authors.
As stated above, we have now included the absolute levels of lipids of interest in the various conditions of the lipidomics analyses (Figure S 3).
Author Response
Reviewer #3: (Public Review):
In this ms Li et al. examine the molecular interaction of Rabphilin 3A with the SNARE complex protein SNAP25 and its potential impact in SNARE complex assembly and dense core vesicle fusion.
Overall the literature of rabphilin as a major rab3/27effector on synaptic function has been quite enigmatic. After its cloning and initial biochemical analysis, rather little new has been found about rabphilin, in particular since loss of function analysis has shown rather little synaptic phenotypes (Schluter 1999, Deak 2006), arguing against that rabphilin plays a crucial role in synaptic function.
While the interaction of rabphilin to SNAP25 via its bottom part of the C2 domain has been already described biochemically and structurally in the Deak et al. 2006, and others, the authors make significant efforts to further map the interactions between SNAP25 and rabphilin and indeed identified additional binding motifs in the first 10 amino acids of SNAP25 that appear critical for the rabphilin interaction.
Using KD-rescue experiments for SNAP25, in TIRF based imaging analysis of labeled dense core vesicles showed that the N-terminus of SN25 is absolutely essential for SV membrane proximity and release. Similar, somewhat weaker phenotypes were observed when binding deficient rabphilin mutants were overexpressed in PC12 cells coexpressing WT rabphilin. The loss of function phenotypes in the SN25 and rabphilin interaction mutants made the authors to claim that rabphilin-SN25 interactions are critical for docking and exocytosis. The role of these interaction sites were subsequently tested in SNARE assembly assays, which were largely supportive of rabphilin accelerating SNARE assembly in a SN25 -terminal dependent way.
Regarding the impact of this work, the transition of synaptic vesicles to form fusion competent trans-SNARE complex is very critical in our understanding of regulated vesicle exocytosis, and the authors put forward an attractive model forward in which rabphilin aids in catalyzing the SNARE complex assembly by controlling SNAP25 a-helicalicity of the SNARE motif. This would provide here a similar regulatory mechanism as put forward for the other two SNARE proteins via their interactions with Munc18 and intersection, respectively.
We thank the reviewer #3 for the summary of the paper and for the praise of our work. The point-to-point replies are as follow:
While discovery of the novel interaction site of rabphilin with the N-Terminus of SNAP25 is interesting, I have issues with the functional experiments. The key reliance of the paper is whether it provides convincing data on the functional role of the interactions, given the history of loss of function phenotypes for Rabphilin. First, the authors use PC12 cells and dense core vesicle docking and fusion assays. Primary neurons, where rabphilin function has been tested before, has unfortunately not been utilized, reducing the impact of docking and fusion phenotype.
We have discussed these questions as mentioned in our response to Essential Revisions 3 and added this corresponding passage to the Discussion section (pp.18-19, lines 407-427).
In particular the loss of function phenotype in figure 3 of the n-terminally deleted SNAP25 in docking and fusion is profound, and at a similar level than the complete loss of the SNARE protein itself. This is of concern as this is in stark contrast to the phenotype of rabphilin loss in mammalian neurons where the phenotype of SNAP25 loss is very severe while rabphilin loss has almost no effect on secretion. This would argue that the N-terminal of SNAPP25 has other critical functions besides interacting with rabphilin. In addition, it could argue that the n-Terminal SNAP25 deletion mutant may be made in the cell (as indicated from the western blot) but may not be properly trafficked to the site of release
To test whether the N-peptide deletion mutant of SN25 can properly target to the plasma membrane, we overexpressed the SN25 FL or SN25 (11–206) with C-terminal EGFP-tag in PC12 cells and monitored the localization of SN25 FL-EGFP and SN25 (11–206)-EGFP near the plasma membrane by TIRF microscopy. We observed that the average fluorescence intensity of SN25 (11–206)-EGFP showed no significant difference with SN25 FL-EGFP as below, suggesting that the N-peptide deletion mutant may not influence the trafficking of SN25 to plasma membrane.
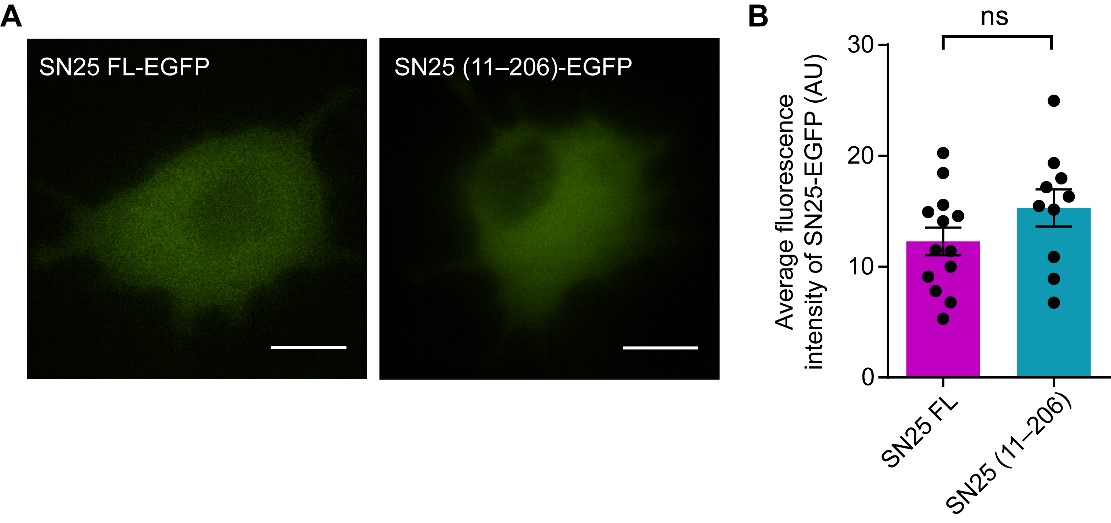
(A) TIRF imaging assay to monitor the localization of SN25-EGFP near the plasma membrane. Overexpression of SN25 FL-EGFP (left) and SN25 (11–206)-EGFP (right) using pEGFP-N3 vector in PC12 cells. Scale bars, 10 μm. (B) Quantification of the average fluorescence intensity of SN25-EGFP near the plasma membrane in (A). Data are presented as mean ± SEM (n ≥ 10 cells in each). Statistical significance and P values were determined by Student’s t-test. ns, not significant.
Author Response
Reviewer #1 (Public Review):
In this manuscript, Abdellatef et al. describe the reconstitution of axonemal bending using polymerized microtubules (MTs), purified outer-arm dyneins, and synthesized DNA origami. Specifically, the authors purified axonemal dyneins from Chlamydomonas flagella and combined the purified motors with MTs polymerized from purified brain tubulin. Using electron microscopy, the authors demonstrate that patches of dynein motors of the same orientation at both MT ends (i.e., with their tails bound to the same MT) result in pairs of MTs of parallel alignment, while groups of dynein motors of opposite orientation at both MT ends (i.e., with the tails of the dynein motors of both groups bound to different MTs) result in pairs of MTs with anti-parallel alignment. The authors then show that the dynein motors can slide MTs apart following photolysis of caged ATP, and using optical tweezers, demonstrate active force generation of up to ~30 pN. Finally, the authors show that pairs of anti-parallel MTs exhibit bidirectional motion on the scale of ~50-100 nm when both MTs are cross-linked using DNA origami. The findings should be of interest for the cytoskeletal cell and biophysics communities.
We thank the reviewer for these comments.
We might be misunderstanding this reviewer’s comment, but the complexes with both parallel and anti-parallel MTs had dynein molecules with their tails bound to two different MTs in most cases, as illustrated in Fig.2 – suppl.1. The two groups of dyneins produce opposing forces in a complex with parallel MTs, and majority of our complexes had parallel arrangement of the MTs. To clarify the point, we have modified the Abstract:
“Electron microscopy (EM) showed pairs of parallel MTs crossbridged by patches of regularly arranged dynein molecules bound in two different orientations depending on which of the MTs their tails bind to. The oppositely oriented dyneins are expected to produce opposing forces when the pair of MTs have the same polarity.”
Reviewer #2 (Public Review):
Motile cilia generate rhythmic beating or rotational motion to drive cells or produce extracellular fluid flow. Cilia is made of nine microtubule doublets forming a spoke-like structure and it is known that dynein motor proteins, which connects adjacent microtubule doublet, are the driving force of ciliary motion. However the molecular mechanism to generate motion is still unclear. The authors proved that a pair of microtubules stably linked by DNA-origami and driven by outer dynein arms (ODA) causes beating motion. They employed in vitro motility assay and negative stain TEM to characterize this complex. They demonstrated stable linking of microtubules and ODAs anchored on the both microtubules are essential for oscillatory motion and bending of the microtubules.
Strength
This is an interesting work, addressing an important question in the motile cilia community: what is the minimum system to generate a beating motion? It is an established fact that dynein power stroke on the microtubule doublet is the driving force of the beating motion. It was also known that the radial spoke and the central pair are essential for ciliary motion under the physiological condition, but cilia without radial spokes and the central pair can beat under some special conditions (Yagi and Kamiya, 2000). Therefore in the mechanistic point of view, they are not prerequisite. It is generally thought that fixed connection between adjacent microtubules by nexin converts sliding motion of dyneins to bending, but it was never experimentally investigated. Here the authors successfully enabled a simple system of nexin-like inter-microtubule linkage using DNA origami technique to generate oscillatory and beating motions. This enables an interesting system where ODAs form groups, anchored on two microtubules, orienting oppositely and therefore cause tag-of-war type force generation. The authors demonstrated this system under constraints by DNA origami generates oscillatory and beating motions.
The authors carefully coordinated the experiments to demonstrate oscillations using optical tweezers and sophisticated data analysis (Fourier analysis and a step-finding algorithm). They also proved, using negative stain EM, that this system contains two groups of ODAs forming arrays with opposite polarity on the parallel microtubules. The manuscript is carefully organized with impressive movies. Geometrical and motility analyses of individual ODAs used for statistics are provided in the supplementary source files. They appropriately cited similar past works from Kamiya and Shingyoji groups (they employed systems closer to the physiological axoneme to reproduce beating) and clarify the differences from this study.
We thank the reviewer for these comments.
Weakness
The authors claim this system mimics two pairs of doublets at the opposite sites from 9+2 cilia structure by having two groups of ODAs between two microtubules facing opposite directions within the pair. It is not exactly the case. In the real axoneme, ODA makes continuous array along the entire length of doublets, which means at any point there are ODAs facing opposite directions. In their system, opposite ODAs cannot exist at the same point (therefore the scheme of Dynein-MT complex of Fig.1B is slightly misleading).
Actually, opposite ODAs can exist at the same point in our system as well, and previous work using much higher concentration of dyneins (e.g, Oda et al., J. Cell biol., 2007) showed two continuous arrays of dynein molecules between a pair of microtubules. To observe the structures of individual dynein molecules we used low concentrations of dynein and searched for the areas where dynein could be observed without superposition, but there were some areas where opposite dyneins existed at the same point.
We realize that we did not clearly explain this issue, so we have revised the text accordingly.
In the 1st paragraph of Results: “In the dynein-MT complexes prepared with high concentrations of dynein, a pair of MTs in bundles are crossbridged by two continuous arrays of dynein, so that superposition of two rows of dynein molecules is observed in EM images (Haimo et al., 1979; Oda et al., 2007). On the other hand, when a low concentration of the dynein preparation (6.25–12.5 µg/ml (corresponding to ~3-6 nM outer-arm dynein)) was mixed with 20-25 µg/ml MTs (200-250 nM tubulin dimers), the MTs were only partially decorated with dynein, so that we were able to observe single layers of crossbridges without superposition in many regions.” Legend of Fig. 1(C): “Note that the geometry of dyneins in the dynein-MT complex shown in (B) mimics that of a combination of the dyneins on two opposite sides of the axoneme (cyan boxes), although the dynein arrays in (B) are not continuous.”
If they want to project their result to the ciliary beating model, more insight/explanation would be necessary. For example, arrays of dyneins at certain positions within the long array along one doublet are activated and generate force, while dyneins at different positions are activated on another doublet at the opposite site of the axoneme. This makes the distribution of dyneins and their orientations similar to the system described in this work. Such a localized activation, shown in physiological cilia by Ishikawa and Nicastro groups, may require other regulatory proteins.
We agree that the distributions of activated dyneins in 3D are extremely important in understanding ciliary beating, and that other regulatory proteins would be required to coordinate activation in different places in an axoneme. However, the main goal of this manuscript is to show the minimal components for oscillatory movements, and we feel that discussing the distributions of activated dyneins along the length of the MTs would be too complicated and beyond the scope of this study.
They attempted to reveal conformational change of ODAs induced by power stroke using negative stain EM images, which is less convincing compared to the past cryo-ET works (Ishikawa, Nicastro, Pigino groups) and negative stain EM of sea urchin outer dyneins (Hirose group), where the tail and head parts were clearly defined from the 3D map or 2D averages of two-dynein ODAs. Probably three heavy chains and associated proteins hinder detailed visualization of the tail structure. Because of this, Fig.2C is not clear enough to prove conformational change of ODA. This reviewer imagines refined subaverage (probably with larger datasets) is necessary.
As the reviewer suggests, one of the reasons for less clear averaged images compared to the past images of sea urchin ODA is the three-headed structure of Chlamydomonas ODA. Another and perhaps the bigger reason is the difficulty of obtaining clear images of dynein molecules bound between 2 MTs by negative stain EM: the stain accumulates between MTs that are ~25 nm in diameter and obscures the features of smaller structures. We used cryo-EM with uranyl acetate staining instead of negative staining for the images of sea urchin ODA-MT complexes we previously published (Ueno et al., 2008) in order to visualize dynein stalks. We agree with the reviewer that future work with larger datasets and by cryo-ET is necessary for revealing structural differences.
That having been said, we did not mean to prove structural changes, but rather intended to show that our observation suggests structural changes and thus this system is useful for analyzing structural changes in future. In the revised manuscript, we have extensively modified the parts of the paper discussing structural changes (Please see our response to the next comment).
It is not clear, from the inset of Fig.2 supplement3, how to define the end of the tail for the length measurement, which is the basis for the authors to claim conformational change (Line263-265). The appearance of the tail would be altered, seen from even slightly different view angles. Comparison with 2D projection from apo- and nucleotide-bound 3-headed ODA structures from EM databank will help.
We agree with the reviewer that difference in the viewing angle affects the apparent length of a dynein molecule, although the 2 MTs crossbridged by dyneins lie on the carbon membrane and thus the variation in the viewing angle is expected to be relatively small. To examine how much the apparent length is affected by the view angle, we calculated 2D-projected images of the cryo-ET structures of Chlamydomonas axoneme (emd_1696 and emd_1697; Movassagh et al., 2010) with different view angles, and measured the apparent length of the dynein molecule using the same method we used for our negative-stain images (Author response image 1). As shown in the plot, the effect of view angles on the apparent lengths is smaller than the difference between the two nucleotide states in the range of 40 degrees measured here. Thus, we think that the length difference shown in Fig.2-suppl.4 reflects a real structural difference between no-ATP and ATP states. In addition, it would be reasonable to think that distributions of the view angles in the negative stain images are similar for both absence and presence of ATP, again supporting the conclusion.
Nevertheless, since we agree with the reviewer that we cannot measure the precise length of the molecule using these 2D images, we have revised the corresponding parts of the manuscript, adding description about the effect of view angles on the measured length in the manuscript.
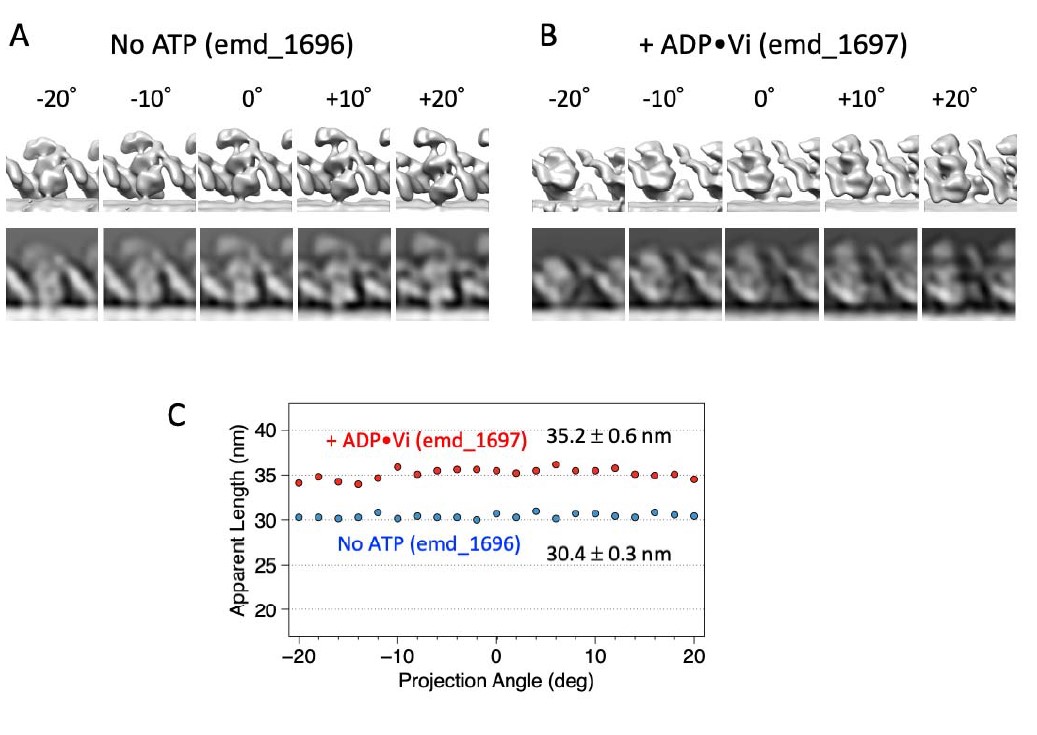
Author response image 1. Effects of viewing angles on apparent length. (A) and (B) 2D-projected images of cryo-electron tomograms of Chlamydomonas outer arm dynein in an axoneme (Movassagh et al., 2010) viewed from different angles. (C) apparent length of the dynein molecule measured in 2D-projected images.
In this manuscript, we discuss two structural changes: 1) a difference in the dynein length between no-nucleotide and +ATP states (Fig.2-suppl.4), and 2) possible structural differences in the arrangement of the dynein heads (Fig.2-suppl.3). Although we realize that extensive analysis using cryo-ET is necessary for revealing the second structural change, we attempted to compare the structures of oppositely oriented dyneins, hoping that it would lead to future research. In the revised manuscript, we have added 2D projection images of emd_1696 and emd_1697 in Fig.2-suppl.3, so that the readers can compare them with our negative stain images. We had an impression that some of our 2D images in the presence of ATP resembled the cryo-ET structure with ADP.Vi, whereas some others appeared to be closer to the no-nucleotide cryo-ET structure. We have also attempted to calculate cross-correlations, but difficulties in removing the effect of MTs sometimes overlapped with a part of dynein, adjusting the magnifications and contrast of different images prevented us from obtaining reliable results.
To address this and the previous comments, we have extensively modified the section titled ‘Structures of dynein in the dynein-MT-DNA-origami complex’.
In Fig.5B (where the oscillation occurs), the microtubule was once driven >150nm unidirectionally and went back to the original position, before oscillation starts. Is it always the case that relatively long unidirectional motion and return precede oscillation? In Fig.7B, where the authors claim no oscillation happened, only one unidirectional motion was shown. Did oscillation not happen after MT returned to the original position?
Long unidirectional movement of ~150 nm was sometimes observed, but not necessarily before the start of oscillation. For example, in Figure 5 – figure supplement 1A, oscillation started soon after the UV flash, and then unidirectional movement occurred.
With the dynein-MT complex in which dyneins are unidirectionally aligned (Fig.7B, Fig.7-suppl.2), the MTs kept moving and escaped from the trap or just stopped moving probably due to depletion of ATP, so we did not see a MT returning to the original position.
Line284-290: More characterization of bending motion will be necessary (and should be possible). How high frequency is it? Do they confirm that other systems (either without DNA-origami or without ODAs arraying oppositely) cannot generate repetitive beating?
The frequencies of the bending motions measured from the movies in Fig.8 and Fig.8-suppl.1 were 0.6 – 1 Hz, and the motions were rather irregular. Even if there were complexes bending at high frequencies, it would not have been possible to detect them due to the low time resolution of these fluorescence microscopy experiments (~0.1 s). Future studies at a higher time resolution will be necessary for further characterization of bending motions.
To observe bending motions, the dynein-MT complex should be fixed to the glass or a bead at one part of the complex while the other end is free in solution. With the dynein-MT-DNA-origami complexes, we looked for such complexes and found some showing bending motions as in Fig. 8. To answer the reviewer’s question asking if we saw repetitive bending in other systems, we checked the movies of the complexes without DNA-origami or without ODAs arraying oppositely but did not notice any repetitive bending motions. However, future studies using the system with a higher temporal resolution and perhaps with an improved method for attaching the complex would be necessary in these cases as well.
Author Response
eLife assessment:
This study addresses whether the composition of the microbiota influences the intestinal colonization of encapsulated vs unencapsulated Bacteroides thetaiotaomicron, a resident micro-organism of the colon. This is an important question because factors determining the colonization of gut bacteria remain a critical barrier in translating microbiome research into new bacterial cell-based therapies. To answer the question, the authors develop an innovative method to quantify B. theta population bottlenecks during intestinal colonization in the setting of different microbiota. Their main finding that the colonization defect of an acapsular mutant is dependent on the composition of the microbiota is valuable and this observation suggests that interactions between gut bacteria explains why the mutant has a colonization defect. The evidence supporting this claim is currently insufficient. Additionally, some of the analyses and claims are compromised because the authors do not fully explain their data and the number of animals is sometimes very small.
Thank you for this frank evaluation. Based on the Reviewers’ comments, the points raised have been addressed by improving the writing (apologies for insufficient clarity), and by the addition of data that to a large extent already existed or could be rapidly generated. In particularly the following data has been added:
Increase to n>=7 for all fecal time-course experiments
Microbiota composition analysis for all mouse lines used
Data elucidating mechanisms of SPF microbiome/ host immune mechanisms restriction of acapsular B. theta
Short- versus long-term recolonization of germ-free mice with a complete SPF microbiota and assessment of the effect on B. theta colonization probability.
Challenge of B. theta monocolonized mice with avirulent Salmonella to disentangle effects of the host inflammatory response from other potential explanations of the observations.
Details of all inocula used
Resequencing of all barcoded strains
Additionally, we have improved the clarity of the text, particularly the methods section describing mathematical modeling in the main text. Major changes in the text and particularly those replying to reviewers comment have been highlighted here and in the manuscript.
Reviewer #1 (Public Review):
The study addresses an important question - how the composition of the microbiota influences the intestinal colonization of encapsulated vs unencapsulated B. theta, an important commensal organism. To answer the question, the authors develop a refurbished WITS with extended mathematical modeling to quantify B. theta population bottlenecks during intestinal colonization in the setting of different microbiota. Interestingly, they show that the colonization defect of an acapsular mutant is dependent on the composition of the microbiota, suggesting (but not proving) that interactions between gut bacteria, rather than with host immune mechanisms, explains why the mutant has a colonization defect. However, it is fairly difficult to evaluate some of the claims because experimental details are not easy to find and the number of animals is very small. Furthermore, some of the analyses and claims are compromised because the authors do not fully explain their data; for example, leaving out the zero values in Fig. 3 and not integrating the effect of bottlenecks into the resulting model, undermines the claim that the acapsular mutant has a longer in vivo lag phase.
We thank the reviewer for taking time to give this details critique of our work, and apologies that the experimental details were insufficiently explained. This criticism is well taken. Exact inoculum details for experiment are now present in each figure (or as a supplement when multiple inocula are included). Exact microbiome composition analysis for OligoMM12, LCM and SPF microbiota is now included in Figure 2 – Figure supplement 1.
Of course, the models could be expanded to include more factors, but I think this comment is rather based on the data being insufficiently clearly explained by us. There are no “zero values missing” from Fig. 3 – this is visible in the submitted raw data table (excel file Source Data 1), but the points are fully overlapped in the graph shown and therefore not easily discernable from one another. Time-points where no CFU were recovered were plotted at a detection limit of CFU (50 CFU/g) and are included in the curve-fitting. However, on re-examination we noticed that the curve fit was carried out on the raw-data and not the log-normalized data which resulted in over-weighting of the higher values. Re-fitting this data does not change the conclusions but provides a better fit. These experiments have now been repeated such that we now have >=7 animals in each group. This new data is presented in Fig. 3C and D and Fig. 3 Supplement 2.
Limitations:
1) The experiments do not allow clear separation of effects derived from the microbiota composition and those that occur secondary to host development without a microbiota or with a different microbiota. Furthermore, the measured bottlenecks are very similar in LCM and Oligo mice, even though these microbiotas differ in complexity. Oligo-MM12 was originally developed and described to confer resistance to Salmonella colonization, suggesting that it should tighten the bottleneck. Overall, an add-back experiment demonstrating that conventionalizing germ-free mice imparts a similar bottleneck to SPF would strengthen the conclusions.
These are excellent suggestions and have been followed. Additional data is now presented in Figure 2 – figure supplement 8 showing short, versus long-term recolonization of germ-free mice with an SPF microbiota and recovering very similar values of beta, to our standard SPF mouse colony. These data demonstrate a larger total niche size for B. theta at 2 days post-colonization which normalizes by 2 weeks post-colonization. Independent of this, the colonization probability, is already equivalent to that observed in our SPF colony at day 2 post-colonization. Therefore, the mechanisms causing early clonal loss are very rapidly established on colonization of a germ-free mouse with an SPF microbiota. We have additionally demonstrated that SPF mice do not have detectable intestinal antibody titers specific for acapsular B. theta. (Figure 2 – figure supplement 7), such that this is unlikely to be part of the reason why acapsular B. theta struggles to colonize at all in the context of an SPF microbiota. Experiments were also carried to detect bacteriophage capable of inducing lysis of B. theta and acapsular B. theta from SPF mouse cecal content (Figure 2 – figure supplement 7). No lytic phage plaques were observed. However, plaque assays are not sensitive for detection of weakly lytic phage, or phage that may require expression of surface structures that are not induced in vitro. We can therefore conclude that the restrictive activity of the SPF microbiota is a) reconstituted very fast in germ-free mice, b) is very likely not related to the activity of intestinal IgA and c) cannot be attributed to a high abundance of strongly lytic bacteriophage. The simplest explanation is that a large fraction of the restriction is due to metabolic competition with a complex microbiota, but we cannot formally exclude other factors such as antimicrobial peptides or changes in intestinal physiology.
2) It is often difficult to evaluate results because important parameters are not always given. Dose is a critical variable in bottleneck experiments, but it is not clear if total dose changes in Figure 2 or just the WITS dose? Total dose as well as n0 should be depicted in all figures.
We apologized for the lack of clarity in the figures. Have added panels depicting the exact inoculum for each figure legend (or a supplementary figure where many inocula were used). Additionally, the methods section describing how barcoded CFU were calculated has been rewritten and is hopefully now clearer.
3) This is in part a methods paper but the method is not described clearly in the results, with important bits only found in a very difficult supplement. Is there a difference between colonization probability (beta) and inoculum size at which tags start to disappear? Can there be some culture-based validation of "colonization probability" as explained in the mathematics? Can the authors contrast the advantages/disadvantages of this system with other methods (e.g. sequencing-based approaches)? It seems like the numerator in the colonization probability equation has a very limited range (from 0.18-1.8), potentially limiting the sensitivity of this approach.
We apologized for the lack of clarity in the methods. This criticism is well taken, and we have re-written large sections of the methods in the main text to include all relevant detail currently buried in the extensive supplement.
On the question of the colonization probability and the inoculum size, we kept the inoculum size at 107 CFU/ mouse in all experiments (except those in Fig.4, where this is explicitly stated); only changing the fraction of spiked barcoded strains. We verified the accuracy of our barcode recovery rate by serial dilution over 5 logs (new figure added: Figure 1 – figure supplement 1). “The CFU of barcoded strains in the inoculum at which tags start to disappear” is by definition closely related to the colonization probability, as this value (n0) appears in the calculation. Note that this is not the total inoculum size – this is (unless otherwise stated in Fig. 4) kept constant at 107 CFU by diluting the barcoded B. theta with untagged B. theta. Again, this is now better explained in all figure legends and the main text.
We have added an experiment using peak-to-trough ratios in metagenomic sequencing to estimate the B. theta growth rate. This could be usefully employed for wildtype B. theta at a relatively early timepoint post-colonization where growth was rapid. However, this is a metagenomics-based technique that requires the examined strain to be present at an abundance of over 0.1-1% for accurate quantification such that we could not analyze the acapsular B. theta strain in cecum content at the same timepoint. These data have been added (Figure 3 – figure supplement 3). Note that the information gleaned from these techniques is different. PTR reveals relative growth rates at a specific time (if your strain is abundant enough), whereas neutral tagging reveals average population values over quite large time-windows. We believe that both approaches are valuable. A few sentences comparing the approaches have been added to the discussion.
The actual numerator is the fraction of lost tags, which is obtained from the total number of tags used across the experiment (number of mice times the number of tags lost) over the total number of tags (number of mice times the number of tags used). Very low tag recovery (less than one per mouse) starts to stray into very noisy data, while close to zero loss is also associated with a low-information-to-noise ratio. Therefore, the size of this numerator is necessarily constrained by us setting up the experiments to have close to optimal information recovery from the WITS abundance. Robustness of these analyses is provided by the high “n” of between 10 and 17 mice per group.
4) Figure 3 and the associated model is confusing and does not support the idea that a longer lag-phase contributes to the fitness defect of acapsular B.theta in competitive colonization. Figure 3B clearly indicates that in competition acapsular B. theta experiences a restrictive bottleneck, i.e., in competition, less of the initial B. theta population is contributed by the acapsular inoculum. There is no need to appeal to lag-phase defects to explain the role of the capsule in vivo. The model in Figure 3D should depict the acapsular population with less cells after the bottleneck. In fact, the data in Figure 3E-F can be explained by the tighter bottleneck experienced by the acapsular mutant resulting in a smaller acapsular founding population. This idea can be seen in the data: the acapsular mutant shedding actually dips in the first 12-hours. This cannot be discerned in Figure 3E because mice with zero shedding were excluded from the analysis, leaving the data (and conclusion) of this experiment to be extrapolated from a single mouse.
We of course completely agree that this would be a correct conclusion if only the competitive colonization data is taken into account. However, we are also trying to understand the mechanisms at play generating this bottleneck and have investigated a range of hypotheses to explain the results, taking into account all of our data.
Hypothesis 1) Competition is due to increased killing prior to reaching the cecum and commencing growth: Note that the probability of colonization for single B. theta clones is very similar for OligoMM12 mouse single-colonization by the wildtype and acapsular strains. For this hypothesis to be the reason for outcompetition of the acapsular strain, it would be necessary that the presence of wildtype would increase the killing of acapsular B. theta in the stomach or small intestine. The bacteria are at low density at this stage and stomach acid/small intestinal secretions should be similar in all animals. Therefore, this explanation seems highly unlikely
Hypothesis 2) Competition between wildtype and acapsular B. theta occurs at the point of niche competition before commencing growth in the cecum (similar to the proposal of the reviewer). It is possible that the wildtype strain has a competitive advantage in colonizing physical niches (for example proximity to bacteria producing colicins). On the basis of the data, we cannot exclude this hypothesis completely and it is challenging to measure directly. However, from our in vivo growth-curve data we observe a similar delay in CFU arrival in the feces for acapsular B. theta on single colonization as in competition, suggesting that the presence of wildtype (i.e., initial niche competition) is not the cause of this delay. Rather it is an intrinsic property of the acapsular strain in vivo,
Hypothesis 3) Competition between wildtype and acapsular B. theta is mainly attributable to differences in growth kinetics in the gut lumen. To investigate growth kinetics, we carried our time-courses of fecal collection from OligoMM12 mice single-colonized with wildtype or acapsular B. theta, i.e., in a situation where we observe identical colonization probabilities for the two strains. These date, shown now in Figure 3 C and D and Figure 3 – figure supplement 2, show that also without competition, the CFU of acapsular B. theta appear later and with a lower net growth rate than the wildtype. As these single-colonizations do not show a measurable difference between the colonization probability for the two strains, it is not likely that the delayed appearance of acapsular B. theta in feces is due to increased killing (this would be clearly visible in the barcode loss for the single-colonizations). Rather the simplest explanation for this observation is a bona fide lag phase before growth commences in the cecum. Interestingly, using only the lower net growth rate (assumed to be a similar growth rate but increased clearance rate) produces a good fit for our data on both competitive index and colonization probability in competition (Figure 3, figure supplement 5). This is slightly improved by adding in the observed lag-phase (Figure 3). It is very difficult to experimentally manipulate the lag phase in order to directly test how much of an effect this has on our hypothesis and the contribution is therefore carefully described in the new text.
Please note that all data was plotted and used in fitting in Fig 3E, but “zero-shedding” is plotted at a detection limit and overlayed, making it look like only one point was present when in fact several were used. This was clear in the submitted raw data tables. To sure-up these observations we have repeated all time-courses and now have n>=7 mice per group.
5) The conclusions from Figure 4 rely on assumptions not well-supported by the data. In the high fat diet experiment, a lower dose of WITS is required to conclude that the diet has no effect. Furthermore, the authors conclude that Salmonella restricts the B. theta population by causing inflammation, but do not demonstrate inflammation at their timepoint or disprove that the Salmonella population could cause the same effect in the absence of inflammation (through non-inflammatory direct or indirect interactions).
We of course agree that we would expect to see some loss of B. theta in HFD. However, for these experiments the inoculum was ~109 CFUs/100μL dose of untagged strain spiked with approximately 30 CFU of each tagged strain. Decreasing the number of each WITS below 30 CFU leads to very high variation in the starting inocula from mouse-to-mouse which massively complicates the analysis. To clarify this point, we have added in a detection-limit calculation showing that the neutral tagging technique is not very sensitive to population contractions of less than 10-fold, which is likely in line with what would be expected for a high-fat diet feeding in monocolonized mice for a short time-span.
This is a very good observation regarding our Salmonella infection data. We have now added the fecal lipocalin 2 values, as well as a group infected with a ssaV/invG double mutant of S. Typhimurium that does not cause clinical grade inflammation (“avirulent”). This shows 1) that the attenuated S. Typhimurium is causing intestinal inflammation in B. theta colonized mice and 2) that a major fraction of the population bottleneck can be attributed to inflammation. Interestingly, we do observe a slight bottleneck in the group infected with avirulent Salmonella which could be attributable either to direct toxicity/competition of Salmonella with B. theta or to mildly increased intestinal inflammation caused by this strain. As we cannot distinguish these effects, this is carefully discussed in the manuscript.
6) Several of the experiments rely on very few mice/groups.
We have increased the n to over 5 per group in all experiments (most critically those shown in Fig 3, Supplement 5). See figure legends for specific number of mice per experiment.
Reviewer #2 (Public Review):
The goal of this study was to understand population bottlenecks during colonization in the context of different microbial communities. Capsular polysaccharide mutants, diet, and enteric infection were also used paired to short-term monitoring of overall colonization and the levels of specific strains. The major strength of this study is the innovative approach and the significance of the overall research area.
The first major limitation is the lack of clear and novel insight into the biology of B. theta or other gut bacterial species. The title is provocative, but the experiments as is do not definitively show that the microbiota controls the relative fitness of acapsular and wild-type strains or provide any mechanistic insights into why that would be the case. The data on diet and infection seem preliminary. Furthermore, many of the experiments conflict with prior literature (i.e., lack of fitness difference between acapsular and wild-type strain and lack of impact of diet) but satisfying explanations are not provided for the lack of reproducibility.
In line with suggestions from Reviewer 1, the paper has undergone quite extensive re-writing to better explain the data presented and its consequences. Additionally, we now explicitly comment on apparent discrepancies between our reported data and the literature – for example the colonization defect of acapsular B. theta is only published for competitive colonizations, where we also observe a fitness defect so there is no actual conflict. Additionally, we have calculated detection limits for the effect of high-fat diet and demonstrate that a 10-fold reduction in the effective population size would not be robustly detected with the neutral tagging technique such that we are probably just underpowered to detect small effects, and we believe it is important to point out the numerical limits of the technique we present here. Additionally for the Figure 4 experiments, we have added data on colonization/competition with an avirulent Salmonella challenge giving some mechanistic data on the role of inflammation in the B. theta bottleneck.
Another major limitation is the lack of data on the various background gut microbiotas used. eLife is a journal for a broad readership. As such, describing what microbes are in LCM, OligoMM, or SPF groups is important. The authors seem to assume that the gut microbiota will reflect prior studies without measuring it themselves.
All gnotobiotic lines are bred as gnotobiotic colonies in our isolator facility. This is now better explained in the methods section. Additionally, 16S sequencing of all microbiotas used in the paper has been added as Figure 2 – figure supplement 1.
I also did not follow the logic of concluding that any differences between SPF and the two other groups are due to microbial diversity, which is presumably just one of many differences. For example, the authors acknowledge that host immunity may be distinct. It is essential to profile the gut microbiota by 16S rRNA amplicon sequencing in all these experiments and to design experiments that more explicitly test the diversity hypotheses vs. alternatives like differences in the membership of each community or other host phenotypes.
This is an important point. We have carried out a number of experiments to potentially address some issues here.
1) We carried out B. theta colonization experiments in germ-free mice that had been colonized by gavage of SPF feces either 1 day prior to colonization of 2 weeks prior to colonization. While the shorter pre-colonization allowed B. theta to colonize to a higher population density in the cecum, the colonization probability was already reduced to levels observed in our SPF colony in the short pre-colonization. Therefore, the factors limiting B. theta establishment in the cecum are already established 1-2 days post-colonization with an SPF microbiota (Figure 2 - figure supplement 8). 2) We checked for the presence of secretory IgA capable of binding to the surface of live B. theta, compared to a positive control of a mouse orally vaccinated against B. theta. (Fig. 2, Supplement 7) and could find no evidence of specific IgA targeting B. theta in the intestinal lavages of our SPF mouse colony. 3) We isolated bacteriophage from the intestine of SPF mice and used this to infect lawns of B. theta wildtype and acapsular in vitro. We could not detect and plaque-forming phage coming from the intestine of SPF mice (Figure 2 – figure supplement 7).
We can therefore exclude strongly lytic phage and host IgA as dominant driving mechanisms restricting B. theta colonization. It remains possible that rapidly upregulated host factors such as antimicrobial peptide secretion could play a role, but metabolic competition from the microbiota is also a very strong candidate hypothesis. The text regarding these experiments has been slightly rewritten to point out that colonization probability inversely correlates with microbiota complexity, and the mechanisms involved may involve both direct microbe-microbe interactions as well as host factors.
Given the prior work on the importance of capsule for phage, I was surprised that no efforts are taken to monitor phage levels in these experiments. Could B. theta phage be present in SPF mice, explaining the results? Alternatively, is the mucus layer distinct? Both could be readily monitored using established molecular/imaging methods.
See above: no plaque-forming phage could be recovered from the SPF mouse cecum content. The main replicative site that we have studied here, in mice, is the cecum which does not have true mucus layers in the same way as the distal colon and is upstream of the colon so is unlikely to be affected by colon geography. Rather mucus is well mixed with the cecum content and may behave as a dispersed nutrient source. There is for sure a higher availability of mucus in the gnotobiotic mice due to less competition for mucus degradation by other strains. However, this would be challenging to directly link to the B. theta colonization phenotype as Muc2-deficient mice develop intestinal inflammation.
The conclusion that the acapsular strain loses out due to a difference of lag phase seems highly speculative. More work would be needed to ensure that there is no difference in the initial bottleneck; for example, by monitoring the level of this strain in the proximal gut immediately after oral gavage.
This is an excellent suggestion and has been carried out. At 8h post-colonization with a high inoculum (allowing easy detection) there were identical low levels of B. theta in the upper and lower small intestine, but more B. theta wildtype than B. theta acapsular in the cecum and colon, consistent with commencement of growth for B. theta wildtype but not the acapsular strain at this timepoint. We have additionally repeated the single-colonization time-courses using our standard inoculum and can clearly see the delayed detection of acapsular B. theta in feces even in the single-colonization state when no increased bottleneck is observed. This can only be reasonably explained by a bona fide lag-phase extension for acapsular B. theta in vivo. These data also reveal and decreased net growth rate of acapsular B. theta. Interestingly, our model can be quite well-fitted to the data obtained both for competitive index and for colonization probability using only the difference in net growth rate. Adding the (clearly observed) extended lag-phase generates a model that is still consistent with our observations.
Another major limitation of this paper is the reliance on short timepoints (2-3 days post colonization). Data for B. theta levels over 2 weeks or longer is essential to put these values in context. For example, I was surprised that B. theta could invade the gut microbiota of SPF mice at all and wonder if the early time points reflect transient colonization.
It should be noted that “SPF” defines microbiota only on missing pathogens and not on absolute composition. Therefore, the rather efficient B. theta colonization in our SPF colony is likely due to a permissive composition and this is likely to be not at all reproducible between different SPF colonies (a major confounder in reproducibility of mouse experiments between institutions. In contrast the gnotobiotic colonies are highly reproducible). We do consistently see colonization of our SPF colony by wildtype B. theta out to at least 10 days post-inoculation (latest time-point tested) at similar loads to the ones observed in this work, indicating that this is not just transient “flow-through” colonization. Data included below:
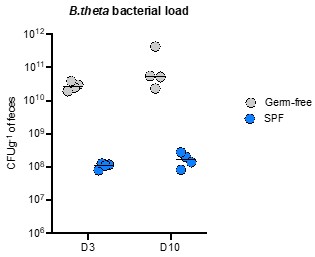
For this paper we were very specifically quantifying the early stages of colonization, also because the longer we run the experiments for, the more confounding features of our “neutrality” assumptions appear (e.g., host immunity selecting for evolved/phase-varied clones, within-host evolution of individual clones etc.). For this reason, we have used timepoints of a maximum of 2-3 days.
Finally, the number of mice/group is very low, especially given the novelty of these types of studies and uncertainty about reproducibility. Key experiments should be replicated at least once, ideally with more than n=3/group.
For all barcode quantification experiments we have between 10 and 17 mice per group. Experiments for the in vivo time-courses of colonization have been expanded to an “n” of at least 7 per group.
Author Response:
Reviewer #1:
Zappia et al investigate the function of E2F transcriptional activity in the development of Drosophila, with the aim of understanding which targets the E2F/Dp transcription factors control to facilitate development. They follow up two of their previous papers (PMID 29233476, 26823289) that showed that the critical functions of Dp for viability during development reside in the muscle and the fat body. They use Dp mutants, and tissue-targetted RNAi against Dp to deplete both activating and repressive E2F functions, focussing primarily on functions in larval muscle and fat body. They characterize changes in gene expression by proteomic profiling, bypassing the typical RNAseq experiments, and characterize Dp loss phenotypes in muscle, fat body, and the whole body. Their analysis revealed a consistent, striking effect on carbohydrate metabolism gene products. Using metabolite profiling, they found that these effects extended to carbohydrate metabolism itself. Considering that most of the literature on E2F/Dp targets is focused on the cell cycle, this paper conveys a new discovery of considerable interest. The analysis is very good, and the data provided supports the authors' conclusions quite definitively. One interesting phenotype they show is low levels of glycolytic intermediates and circulating trehalose, which is traced to loss of Dp in the fat body. Strikingly, this phenotype and the resulting lethality during the pupal stage (metamorphosis) could be rescued by increasing dietary sugar. Overall the paper is quite interesting. It's main limitation in my opinion is a lack of mechanistic insight at the gene regulation level. This is due to the authors' choice to profile protein, rather than mRNA effects, and their omission of any DNA binding (chromatin profiling) experiments that could define direct E2F1/ or E2F2/Dp targets.
We appreciate the reviewer’s comment. Based on previously published chromatin profiling data for E2F/Dp and Rbf in thoracic muscles (Zappia et al 2019, Cell Reports 26, 702–719) we discovered that both Dp and Rbf are enriched upstream the transcription start site of both cell cycle genes and metabolic genes (Figure 5 in Zappia et al 2019, Cell Reports 26, 702–719). Thus, our data is consistent with the idea that the E2F/Rbf is binding to the canonical target genes in addition to a new set of target genes encoding proteins involved in carbohydrate metabolism. We think that E2F takes on a new role, and rather than being re-targeted away from cell cycle genes. We agree that the mechanistic insight would be relevant to further explore.
Reviewer #2:
The study sets out to answer what are the tissue specific mechanisms in fat and muscle regulated by the transcription factor E2F are central to organismal function. The study also tries to address which of these roles of E2F are cell intrinsic and which of these mechanisms are systemic. The authors look into the mechanisms of E2F/Dp through knockdown experiments in both the fat body* (see weakness) and muscle of drosophila. They identify that muscle E2F contributes to fat body development but fat body KD of E2F does not affect muscle function. To then dissect the cause of adult lethality in flies, the authors proteomic and metabolomic profiling of fat and muscle to gain insights. While in the muscle, the cause seems to be an as of yet undetermined systemic change , the authors do conclude that adult lethality in fat body specific Dp knockdown is the result of decrease trehalose in the hemolymph and defects in lipid production in these flies. The authors then test this model by presenting fat body specific Dp knockdown flies with high sugar diet and showing adult survival is rescued. This study concurs with and adds to the emerging idea from human studies that E2F/Dp is critical for more than just its role in the cell-cycle and functions as a metabolic regulator in a tissue-specific manner. This study will be of interest to scientists studying inter-organ communication between muscle and fat.
The conclusions of this paper are partially supported by data. The weaknesses can be mitigated by specific experiments and will likely bolster conclusions.
1) This study relies heavily on the tissue specificity of the Gal4 drivers to study fat-muscle communication by E2F. The authors have convincingly confirmed that the cg-Gal4 driver is never turned on in the muscle and vice versa for Dmef2-Gal4. However, the cg-Gal4 driver itself is capable of turning on expression in the fat body cells and is also highly expressed in hemocytes (macrophage-like cells in flies). In fact, cg-Gal4 is used in numerous studies e.g.:https://www.ncbi.nlm.nih.gov/pmc/articles/PMC4125153/ to study the hemocytes and fat in combination. Hence, it is difficult to assess what contribution hemocytes provide to the conclusions for fat-muscle communication. To mitigate this, the authors could test whether Lpp-Gal4>Dp-RNAi (Lpp-Gal4 drives expression exclusively in fat body in all stages) or use ppl-Gal4 (which is expressed in the fat, gut, and brain) but is a weaker driver than cg. It would be good if they could replicate their findings in a subset of experiments performed in Figure 1-4.
This is indeed an important point. We apologize for previously not including this information. Reference is now on page 7.
Another fat body driver, specifically expressed in fat body and not in hemocytes, as cg-GAL4, was tested in previous work (Guarner et al Dev Cell 2017). The driver FB-GAL4 (FBti0013267), and more specifically the stock yw; P{w[+mW.hs]=GawB}FB P{w[+m*] UAS-GFP 1010T2}#2; P{w[+mC]=tubP-GAL80[ts]}2, was used to induce the loss of Dp in fat body in a time-controlled manner using tubGAL80ts. The phenotype induced in larval fat body of FB>DpRNAi,gal80TS recapitulates findings related to DNA damage response characterized in both Dp -/- and CG>Dp- RNAi (see Figure 5A-B, Guarner et al Dev Cell 2017). The activation of DNA damage response upon the loss of Dp was thoroughly studied in Guarner et al Dev Cell 2017. The appearance of binucleates in cg>DpRNAi is presumably the result of the abnormal transcription of multiple G2/M regulators in cells that have been able to repair DNA damage and to resume S-phase (see discussion in Guarner et al Dev Cell 2017). More details regarding the fully characterized DNA damage response phenotype were added on page 6 & 7 of manuscript.
Additionally, r4-GAL4 was also used to drive Dp-RNAi specifically to fat body. But since this driver is weaker than cg-GAL4, the occurrence of binucleated cells in r4>DpRNAi fat body was mild (see Figure R1 below).
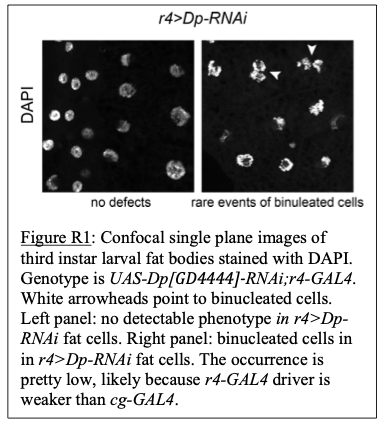
As suggested by the reviewer, Lpp-GAL4 was used to knock down the expression of Dp specifically in fat body. All animals Lpp>DpRNAi died at pupa stage. New viability data were included in Figure 1-figure supplement 1. Also, larval fat body were dissected and stained with phalloidin and DAPI to visualize overall tissue structure. Binucleated cells were present in Lpp>DpRNAi fat body but not in the control Lpp>mCherry-RNAi (Figure 2-figure supplement 1B). These results were added to manuscript on page 7.
Furthermore, Dp expression was knockdowned using a hemocyte-specific driver, hml-GAL4. No defects were detected in animal viability (data not shown).
Thus, overall, we conclude that hemocytes do not seem to contribute to the formation of binucleated-cells in cg>Dp-RNAi fat body.
Finally, since no major phenotype was found in muscles when E2F was inactivated in fat body (please see point 3 for more details), we consider that the inactivation E2F in both fat body and hemocytes did not alter the overall muscle morphology. Thus, exploring the contribution of cg>Dp-RNAi hemocytes in muscles would not be very informative.
2) The authors perform a proteomics analysis on both fat body and muscle of control or the respective tissue specific knockdown of Dp. However, the authors denote technical limitations to procuring enough third instar larval muscle to perform proteomics and instead use thoracic muscles of the pharate pupa. While the technical limitations are understandable, this does raise a concern of comparing fat body and muscle proteomics at two distinct stages of fly development and likely contributes to differences seen in the proteomics data. This may impact the conclusions of this paper. It would be important to note this caveat of not being able to compare across these different developmental stage datasets.
We appreciate the suggestion of the reviewer. This caveat was noted and included in the manuscript. Please see page 11.
3) The authors show that the E2F signaling in the muscle controls whether binucleate fat body nuclei appear. In other words, is the endocycling process in fat body affected if muscle E2F function is impaired. However, they conclude that imparing E2F function in fat does not affect muscle. While muscle organization seems fine, it does appear that nuclear levels of Dp are higher in muscles during fat specific knock-down of Dp (Figure 1A, column 2 row 3, for cg>Dp-RNAi). Also there is an increase in muscle area when fat body E2F function is impaired. This change is also reflected in the quantification of DLM area in Figure 1B. But the authors don't say much about elevated Dp levels in muscle or increased DLM area of Fat specific Dp KD. Would the authors not expect Dp staining in muscle to be normal and similar to mCherry-RNAi control in Cg>dpRNAi? The authors could consider discussing and contextualizing this as opposed to making a broad statement regarding muscle function all being normal. Perhaps muscle function may be different, perhaps better when E2F function in fat is impaired.
The overall muscle structure was examined in animals staged at third instar larva (Figure 1A-B). No defects were detected in muscle size between cg>Dp-RNAi animals and controls. In addition, the expression of Dp was not altered in cg>Dp-RNAi muscles compared to control muscles. The best developmental stage to compare the muscle structure between Mef2>Dp-RNAi and cg>Dp-RNAi animals is actually third instar larva, prior to their lethality at pupa stage (Figure 1- figure supplement 1).
Based on the reviewer’s comment, we set up a new experiment to further analyze the phenotype at pharate stage. However, when we repeated this experiment, we did not recover cg>Dp-RNAi pharate, even though 2/3 of Mef2>Dp-RNAi animals survived up to late pupal stage. We think that this is likely due to the change in fly food provider. Since most cg>DpRNAi animals die at early pupal stage (>75% animals, Figure 1-figure supplement 1), pharate is not a good representative developmental stage to examine phenotypes. Therefore, panels were removed.
Text was revised accordingly (page 6).
4) In lines 376-380, the authors make the argument that muscle-specific knockdown can impair the ability of the fat body to regulate storage, but evidence for this is not robust. While the authors refer to a decrease in lipid droplet size in figure S4E this is not a statistically significant decrease. In order to make this case, the authors would want to consider performing a triglyceride (TAG) assay, which is routinely performed in flies.
Our conclusions were revised and adjusted to match our data. The paragraph was reworded to highlight the outcome of the triglyceride assay, which was previously done. We realized the reference to Figure 6H that shows the triglyceride (TAG) assay was missing on page 17. Please see page 17 and page 21 of discussion.
Author Response
The following is the authors’ response to the original reviews.
eLife assessment
This important paper exploits new cryo-EM tomography tools to examine the state of chromatin in situ. The experimental work is meticulously performed and convincing, with a vast amount of data collected. The main findings are interpreted by the authors to suggest that the majority of yeast nucleosomes lack a stable octameric conformation. Despite the possibly controversial nature of this report, it is our hope that such work will spark thought-provoking debate, and further the development of exciting new tools that can interrogate native chromatin shape and associated function in vivo.
We thank the Editors and Reviewers for their thoughtful and helpful comments. We also appreciate the extraordinary amount of effort needed to assess both the lengthy manuscript and the previous reviews. Below, we provide our point-by-point response in bold blue font. Nearly all comments have been addressed in the revised manuscript. For a subset of comments that would require us to speculate, we have taken a conservative approach because we either lack key information or technical expertise: Instead of adding the speculative replies to the main text, we think it is better to leave them in the rebuttal for posterity. Readers will thereby have access to our speculation and know that we did not feel confident enough to include these thoughts in the Version of Record.
Reviewer #1 (Public Review):
This manuscript by Tan et al is using cryo-electron tomography to investigate the structure of yeast nucleosomes both ex vivo (nuclear lysates) and in situ (lamellae and cryosections). The sheer number of experiments and results are astounding and comparable with an entire PhD thesis. However, as is always the case, it is hard to prove that something is not there. In this case, canonical nucleosomes. In their path to find the nucleosomes, the authors also stumble over new insights into nucleosome arrangement that indicates that the positions of the histones is more flexible than previously believed.
Please note that canonical nucleosomes are there in wild-type cells in situ, albeit rarer than what’s expected based on our HeLa cell analysis and especially the total number of yeast nucleosomes (canonical plus non-canonical). The negative result (absence of any canonical nucleosome classes in situ) was found in the histone-GFP mutants.
Major strengths and weaknesses:
Personally, I am not ready to agree with their conclusion that heterogenous non-canonical nucleosomes predominate in yeast cells, but this reviewer is not an expert in the field of nucleosomes and can't judge how well these results fit into previous results in the field. As a technological expert though, I think the authors have done everything possible to test that hypothesis with today's available methods. One can debate whether it is necessary to have 35 supplementary figures, but after working through them all, I see that the nature of the argument needs all that support, precisely because it is so hard to show what is not there. The massive amount of work that has gone into this manuscript and the state-of-the art nature of the technology should be warmly commended. I also think the authors have done a really great job with including all their results to the benefit of the scientific community. Yet, I am left with some questions and comments:
Could the nucleosomes change into other shapes that were predetermined in situ? Could the authors expand on if there was a structure or two that was more common than the others of the classes they found? Or would this not have been found because of the template matching and later reference particle used?
Our best guess (speculation) is that one of the class averages that is smaller than the canonical nucleosome contains one or more non-canonical nucleosome classes. However, we do not feel confident enough to single out any of these classes precisely because we do not yet know if they arise from one non-canonical nucleosome structure or from multiple – and therefore mis-classified – non-canonical nucleosome structures (potentially with other non-nucleosome complexes mixed in). We feel it is better to leave this discussion out of the manuscript, or risk sending the community on wild goose chases.
Our template-matching workflow uses a low-enough cross-correlation threshold that any nucleosome-sized particle (plus minus a few nanometers) would be picked, which is why the number of hits is so large. So unless the noncanonical nucleosomes quadrupled in size or lost most of their histones, they should be grouped with one or more of the other 99 class averages (WT cells) or any of the 100 class averages (cells with GFP-tagged histones). As to whether the later reference particle could have prevented us from detecting one of the non-canonical nucleosome structures, we are unable to tell because we’d really have to know what an in situ non-canonical nucleosome looks like first.
Could it simply be that the yeast nucleoplasm is differently structured than that of HeLa cells and it was harder to find nucleosomes by template matching in these cells? The authors argue against crowding in the discussion, but maybe it is just a nucleoplasm texture that side-tracks the programs?
Presumably, the nucleoplasmic “side-tracking” texture would come from some molecules in the yeast nucleus. These molecules would be too small to visualize as discrete particles in the tomographic slices, but they would contribute textures that can be “seen” by the programs – in particular RELION, which does the discrimination between structural states. We are not sure what types of density textures would side-track RELION’s classification routines.
The title of the paper is not well reflected in the main figures. The title of Figure 2 says "Canonical nucleosomes are rare in wild-type cells", but that is not shown/quantified in that figure. Rare is comparison to what? I suggest adding a comparative view from the HeLa cells, like the text does in lines 195-199. A measure of nucleosomes detected per volume nucleoplasm would also facilitate a comparison.
Figure 2’s title is indeed unclear and does not align with the paper’s title and key conclusion. The rarity here is relative to the expected number of nucleosomes (canonical plus non-canonical). We have changed the title to:
“Canonical nucleosomes are a minority of the expected total in wild-type cells”.
We would prefer to leave the reference to HeLa cells to the main text instead of as a figure panel because the comparison is not straightforward for a graphical presentation. Instead, we now report the total number of nucleosomes estimated for this particular yeast tomogram (~7,600) versus the number of canonical nucleosomes classified (297; 594 if we assume we missed half of them). This information is in the revised figure legend:
“In this tomogram, we estimate there are ~7,600 nucleosomes (see Methods on how the calculation is done), of which 297 are canonical structures. Accounting for the missing disc views, we estimate there are ~594 canonical nucleosomes in this cryolamella (< 8% the expected number of nucleosomes).”
If the cell contains mostly non-canonical nucleosomes, are they really non-canonical? Maybe a change of language is required once this is somewhat sure (say, after line 303).
This is an interesting semantic and philosophical point. From the yeast cell’s “perspective”, the canonical nucleosome structure would be the form that is in the majority. That being said, we do not know if there is one structure that is the majority. From the chromatin field’s point of view, the canonical nucleosome is the form that is most commonly seen in all the historical – and most contemporary – literature, namely something that resembles the crystal structure of Luger et al, 1997. Given these two lines of thinking, we added the following clarification as lines 312 – 316:
“At present, we do not know what the non-canonical nucleosome structures are, meaning that we cannot even determine if one non-canonical structure is the majority. Until we know the non-canonical nucleosomes’ structures, we will use the term non-canonical to describe all the nucleosomes that do not have the canonical (crystal) structure.”
The authors could explain more why they sometimes use conventional the 2D followed by 3D classification approach and sometimes "direct 3-D classification". Why, for example, do they do 2D followed by 3D in Figure S5A? This Figure could be considered a regular figure since it shows the main message of the paper.
Since the classification of subtomograms in situ is still a work in progress, we felt it would be better to show one instance of 2-D classification for lysates and one for lamellae. While it is true that we could have presented direct 3-D classification for the entire paper, we anticipate that readers will be interested to see what the in situ 2-D class averages look like.
The main message is that there are canonical nucleosomes in situ (at least in wild-type cells), but they are a minority. Therefore, the conventional classification for Figure S5A should not be a main figure because it does not show any canonical nucleosome class averages in situ.
Figure 1: Why is there a gap in the middle of the nucleosome in panel B? The authors write that this is a higher resolution structure (18Å), but in the even higher resolution crystallography structure (3Å resolution), there is no gap in the middle.
There is a lower concentration of amino acids at the middle in the disc view; unfortunately, the space-filling model in Figure 1A hides this feature. The gap exists in experimental cryo-EM density maps. See Author response image 1 for an example (pubmed.ncbi.nlm.nih.gov/29626188). The size of the gap depends on the contour level and probably the contrast mechanism, as the gap is less visible in the VPP subtomogram averages. To clarify this confusing phenomenon, we added the following lines to the figure legend:
“The gap in the disc view of the nuclear-lysate-based average is due to the lower concentration of amino acids there, which is not visible in panel A due to space-filling rendering. This gap’s visibility may also depend on the contrast mechanism because it is not visible in the VPP averages.”
Author response image 1.
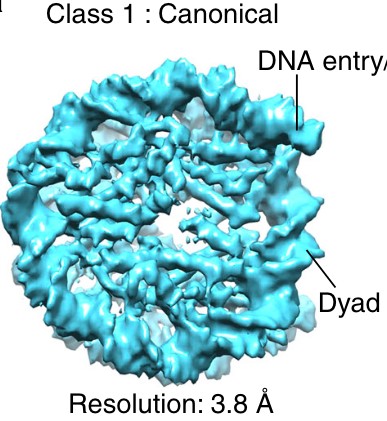
Reviewer #2 (Public Review):
Nucleosome structures inside cells remain unclear. Tan et al. tackled this problem using cryo-ET and 3-D classification analysis of yeast cells. The authors found that the fraction of canonical nucleosomes in the cell could be less than 10% of total nucleosomes. The finding is consistent with the unstable property of yeast nucleosomes and the high proportion of the actively transcribed yeast genome. The authors made an important point in understanding chromatin structure in situ. Overall, the paper is well-written and informative to the chromatin/chromosome field.
We thank Reviewer 2 for their positive assessment.
Reviewer #3 (Public Review):
Several labs in the 1970s published fundamental work revealing that almost all eukaryotes organize their DNA into repeating units called nucleosomes, which form the chromatin fiber. Decades of elegant biochemical and structural work indicated a primarily octameric organization of the nucleosome with 2 copies of each histone H2A, H2B, H3 and H4, wrapping 147bp of DNA in a left handed toroid, to which linker histone would bind.
This was true for most species studied (except, yeast lack linker histone) and was recapitulated in stunning detail by in vitro reconstitutions by salt dialysis or chaperone-mediated assembly of nucleosomes. Thus, these landmark studies set the stage for an exploding number of papers on the topic of chromatin in the past 45 years.
An emerging counterpoint to the prevailing idea of static particles is that nucleosomes are much more dynamic and can undergo spontaneous transformation. Such dynamics could arise from intrinsic instability due to DNA structural deformation, specific histone variants or their mutations, post-translational histone modifications which weaken the main contacts, protein partners, and predominantly, from active processes like ATP-dependent chromatin remodeling, transcription, repair and replication.
This paper is important because it tests this idea whole-scale, applying novel cryo-EM tomography tools to examine the state of chromatin in yeast lysates or cryo-sections. The experimental work is meticulously performed, with vast amount of data collected. The main findings are interpreted by the authors to suggest that majority of yeast nucleosomes lack a stable octameric conformation. The findings are not surprising in that alternative conformations of nucleosomes might exist in vivo, but rather in the sheer scale of such particles reported, relative to the traditional form expected from decades of biochemical, biophysical and structural data. Thus, it is likely that this work will be perceived as controversial. Nonetheless, we believe these kinds of tools represent an important advance for in situ analysis of chromatin. We also think the field should have the opportunity to carefully evaluate the data and assess whether the claims are supported, or consider what additional experiments could be done to further test the conceptual claims made. It is our hope that such work will spark thought-provoking debate in a collegial fashion, and lead to the development of exciting new tools which can interrogate native chromatin shape in vivo. Most importantly, it will be critical to assess biological implications associated with more dynamic - or static forms- of nucleosomes, the associated chromatin fiber, and its three-dimensional organization, for nuclear or mitotic function.
Thank you for putting our work in the context of the field’s trajectory. We hope our EMPIAR entry, which includes all the raw data used in this paper, will be useful for the community. As more labs (hopefully) upload their raw data and as image-processing continues to advance, the field will be able to revisit the question of non-canonical nucleosomes in budding yeast and other organisms.
Reviewer #1 (Recommendations For The Authors):
The manuscript sometimes reads like a part of a series rather than a stand-alone paper. Be sure to spell out what needs to be known from previous work to read this article. The introduction is very EM-technique focused but could do with more nucleosome information.
We have added a new paragraph that discusses the sources of structural variability to better prepare readers, as lines 50 – 59:
“In the context of chromatin, nucleosomes are not discrete particles because sequential nucleosomes are connected by short stretches of linker DNA. Variation in linker DNA structure is a source of chromatin conformational heterogeneity (Collepardo-Guevara and Schlick, 2014). Recent cryo-EM studies show that nucleosomes can deviate from the canonical form in vitro, primarily in the structure of DNA near the entry/exit site (Bilokapic et al., 2018; Fukushima et al., 2022; Sato et al., 2021; Zhou et al., 2021). In addition to DNA structural variability, nucleosomes in vitro have small changes in histone conformations (Bilokapic et al., 2018). Larger-scale variations of DNA and histone structure are not compatible with high-resolution analysis and may have been missed in single-particle cryo-EM studies.”
Line 165-6 "did not reveal a nucleosome class average in..". Add "canonical", since it otherwise suggests there were no nucleosomes.
Thank you for catching this error. Corrected.
Lines 177-182: Why are the disc views missed by the classification analysis? They should be there in the sample, as you say.
We suspect that RELION 3 is misclassifying the disc-view canonical nucleosomes into the other classes. The RELION developers suspect that view-dependent misclassification arises from RELION 3’s 3-D CTF model. RELION 4 is reported to be less biased by the particles’ views. We have started testing RELION 4 but do not have anything concrete to report yet.
Line 222: a GFP tag.
Fixed.
Line 382: "Note that the percentage .." I can't follow this sentence. Why would you need to know how many chromosome's worth of nucleosomes you are looking at to say the percentage of non-canonical nucleosomes?
Thank you for noticing this confusing wording. The sentence has been both simplified and clarified as follows in lines 396 – 398:
“Note that the percentage of canonical nucleosomes in lysates cannot be accurately estimated because we cannot determine how many nucleosomes in total are in each field of view.”
Line 397: "We're not implying that..." Please add a sentence clearly stating what you DO mean with mobility for H2A/H2B.
We have added the following clarifying sentence in lines 412 – 413:
“We mean that H2A-H2B is attached to the rest of the nucleosome and can have small differences in orientation.”
Line 428: repeated message from line 424. "in this figure, the blurring implies.."
Redundant phrase removed.
Line 439: "on a HeLa cell" - a single cell in the whole study?
Yes, that study was done on a single cell.
A general comment is that the authors could help the reader more by developing the figures and making them more pedagogical, a list of suggestions can be found below.
Thank you for the suggestions. We have applied all of them to the specific figure callouts and to the other figures that could use similar clarification.
Figure 2: Help the reader by avoiding abbreviations in the figure legend. VPP tomographic slice - spell out "Volta Phase Plate". Same with the term "remapped" (panel B) what does that mean?
We spelled out Volta phase plate in full and explained “remapped” the additional figure legend text:
“the class averages were oriented and positioned in the locations of their contributing subtomograms”.
Supplementary figures:
Figure S3: It is unclear what you mean with "two types of BY4741 nucleosomes". You then say that the canonical nucleosomes are shaded blue. So what color is then the non-canonical? All the greys? Some of them look just like random stuff, not nucleosomes.
“Two types” is a typo and has been removed and “nucleosomes” has been replaced with “candidate nucleosome template-matching hits” to accurately reflect the particles used in classification.
Figure S6: Top left says "3 tomograms (defocus)". I wonder if you meant to add the defocus range here. I have understood it like this is the same data as shown in Figure S5, which makes me wonder if this top cartoon should not be on top of that figure too (or exclusively there).
To make Figures S6 (and S5) clearer, we have copied the top cartoon from Figure S6 to S5.
Note that we corrected a typo for these figures (and the Table S7): the number of template-matched candidate nucleosomes should be 93,204, not 62,428.
The description in the parentheses (defocus) is shorthand for defocus phase contrast and was not intended to also display a defocus range. All of the revised figure legends now report the meaning of both this shorthand and of the Volta phase plate (VPP).
To help readers see the relationship between these two figures, we added the following clarifying text to the Figure S5 and S6 legends, respectively:
“This workflow uses the same template-matched candidate nucleosomes as in Figure S6; see below.”
“This workflow uses the same template-matched candidate nucleosomes as in Figure S5.”
Figure S7: In the first panel, it is unclear why the featureless cylinder is shown as it is not used as a reference here. Rather, it could be put throughout where it was used and then put the simulated EM-map alone here. If left in, it should be stated in the legend that it was not used here.
It would indeed be much clearer to show the featureless cylinder in all the other figures and leave the simulated nucleosome in this control figure. All figures are now updated. The figure legend was also updated as follows:
“(A) A simulated EM map from a crystal structure of the nucleosome was used as the template-matching and 3-D classification reference.”
Figure S18: Why are there classes where the GFP density is missing? Mention something about this in the figure legend.
We have appended the following speculations to explain the “missing” GFP densities:
“Some of the class averages are “missing” one or both expected GFP densities. The possible explanations include mobility of a subpopulation of GFPs or H2A-GFPs, incorrectly folded GFPs, or substitution of H2A for the variant histone H2A.Z.”
Reviewer #2 (Recommendations For The Authors):
My specific (rather minor) comments are the following:
1) Abstract:
yeast -> budding yeast.
All three instances in the abstract have been replaced with “budding yeast”.
It would be better to clarify what ex vivo means here.
We have appended “(in nuclear lysates)” to explain the meaning of ex vivo.
2) Some subtitles are unclear.
e.g., "in wild-type lysates" -> "wild-type yeast lysates"
Thank you for this suggestion. All unclear instances of subtitles and sample descriptions throughout the text have been corrected.
3) Page 6, Line 113. "...which detects more canonical nucleosomes." A similar thing was already mentioned in the same paragraph and seems redundant.
Thank you for noticing this redundant statement, which is now deleted.
4) Page 25, Line 525. "However, crowding is an unlikely explanation..." Please note that many macromolecules (proteins, RNAs, polysaccharides, etc.) were lost during the nuclei isolation process.
This is a good point. We have rewritten this paragraph to separate the discussion on technical versus biological effects of crowding, in lines 538 – 546:
“Another hypothesis for the low numbers of detected canonical nucleosomes is that the nucleoplasm is too crowded, making the image processing infeasible. However, crowding is an unlikely technical limitation because we were able to detect canonical nucleosome class averages in our most-crowded nuclear lysates, which are so crowded that most nucleosomes are butted against others (Figures S15 and S16). Crowding may instead have biological contributions to the different subtomogram-analysis outcomes in cell nuclei and nuclear lysates. For example, the crowding from other nuclear constituents (proteins, RNAs, polysaccharides, etc.) may contribute to in situ nucleosome structure, but is lost during nucleus isolation.”
5) Page 7, Line 126. "The subtomogram average..." Is there any explanation for this?
Presumably, the longer linker DNA length corresponds to the ordered portion of the ~22 bp linker between consecutive nucleosomes, given the ~168 bp nucleosome repeat length. We have appended the following explanation as the concluding sentence, lines 137 – 140:
“Because the nucleosome-repeat length of budding yeast chromatin is ~168 bp (Brogaard et al., 2012), this extra length of DNA may come from an ordered portion of the ~22 bp linker between adjacent nucleosomes.”
6) "Histone GFP-tagging strategy" subsection:
Since this subsection is a bit off the mainstream of the paper, it can be shortened and merged into the next one.
We have merged the “Histone GFP-tagging strategy” and “GFP is detectable on nucleosome subtomogram averages ex vivo” subsections and shortened the text as much as possible. The new subsection is entitled “Histone GFP-tagging and visualization ex vivo”
7) Page 16, Line 329. "Because all attempts to make H3- or H4-GFP "sole source" strains failed..." Is there a possible explanation here? Cytotoxic effect because of steric hindrance of nucleosomes?
Yes, it is possible that the GFP tag is interfering with the nucleosomes interactions with its numerous partners. It is also possible that the histone-GFP fusions do not import and/or assemble efficiently enough to support a bare-minimum number of functional nucleosomes. Given that the phenotypic consequences of fusion tags is an underexplored topic and that we don’t have any data on the (dead) transformants, we would prefer to leave out the speculation about the cause of death in the attempted creation of “sole source” strains.
This release make p2p http requests much more reliable. It also removes all remaining client side usage of bitswap,
that's a game change
Note: This preprint has been reviewed by subject experts for Review Commons. Content has not been altered except for formatting.
Learn more at Review Commons
Summary:
The manuscript by Dufour et al. is a follow-up on the groups' previous publication that introduced the photo-inducible Cre recombinase, LiCre. In the present work, the authors further characterize the properties and kinetics of their optogenetic switch. Initially, the authors show that light affects only LiCre-mediated recombination itself and not DNA binding. Following these observations, they measure and mathematically model LiCre kinetics demonstrating high efficiency in vivo and a surprising temperature sensitivity. Finally, Dufour et al. evaluate several mutations that affect the LOV photo-cycle and provide recommendation for LiCre applications. The study thoroughly investigates various aspects of the function of LiCre, confirming some previously known characteristics (i.e. temperature-dependence of Cre activity and functionality of LOV-based optogenetic tools in yeast without co-factor supplementation), while providing new LiCre-specific insights (kinetics, light-independent DNA binding). Please note that the reviewer is no expert in mathematical modeling and cannot fully judge the methodological details of the models. While I have some concerns as listed below, I believe study should be well-suited for publication after a revision.
Major comments:
Minor comments:
General assessment and advance:
The present study provides a large set of experiments and analyses characterizing the optogenetic LiCre recombinase. In general, the study is well conceived and executed. Although some of my concerns listed above affect key aspects of the study, they should be straightforward to address. The manuscript is a follow-up study providing a more detailed characterization of an optogenetic tool previously developed by the same authors. Its novelty is therefore somewhat limited. While the study provides a rich body of additional data, many of the findings merely confirmed aspects that were to be expected based on the two proteins LiCre is built of (temperature-dependent activity of Cre, optogenetics in yeast w/o the need of co-factor supplementation, weaker DNA-affinity of the Cre fusion protein as compared to wildtype Cre). New insights are provided by the facts that (i) light only controls recombination but not DNA binding and (ii) light activation of only some protomers within the LiCre heptamer is likely to be sufficient to activate recombination. The former aspect is, however, not entirely evident from the results as described above.
Audience:
The study will be of interest for researchers focusing on inducible DNA recombination and especially relevant to those who plan to work with LiCre and can now rely on a more detailed and extended characterization compared to the original LiCre publication.
Reviewer #2 (Public review):
Summary:
The role of PRC2 in post neural crest induction was not well understood. This work developed an elegant mouse genetic system to conditionally deplete EED upon SOX10 activation. Substantial developmental defects were identified for craniofacial and bone development. The authors also performed extensive single-cell RNA sequencing to analyze differentiation gene expression changes upon conditional EED disruption.
Strengths:
(1) Elegant genetic system to ablate EED post neural crest induction.
(2) Single-cell RNA-seq analysis is extremely suitable for studying the cell type specific gene expression changes in developmental systems.
Original Weaknesses:
(1) Although this study is well designed and contains state-of-art single cell RNA-seq analysis, it lacks the mechanistic depth in the EED/PRC2-mediated epigenetic repression. This is largely because no epigenomic data was shown.
(2) The mouse model of conditional loss of EZH2 in neural crest has been previously reported, as the authors pointed out in the discussion. What is novelty in this study to disrupt EED? Perhaps a more detailed comparison of the two mouse models would be beneficial.
(3) The presentation of the single-cell RNA-seq data may need improvement. The complexity of the many cell types blurs the importance of which cell types are affected the most by EED disruption.
(4) While it's easy to identify PRC2/EED target genes using published epigenomic data, it would be nice to tease out the direct versus indirect effects in the gene expression changes (e.g Fig. 4e)
Comments on latest version:
The authors have addressed weaknesses 2 and 3 of my previous comment very well. For weaknesses 1 and 4, the authors have added a main Fig 5 and its associated supplemental materials, which definitely strengthen the mechanistic depth of the story. However, I think the audience would appreciate if the following questions/points could be further addressed regarding the Cut&Tag data (mostly related to main Figure 5):
(1) The authors described that Sox10-Cre would be expressed at E8.75, and in theory, EED-FL would be ablated soon after that. Why would E16.5 exhibit a much smaller loss in H3K27me3 compared to E12.5? Shouldn't a prolong loss of EED lead to even worse consequence?
(2) The gene expression change at E12.5 upon loss of EED (shown in Fig. 4h) seems to be massive, including many PRC2-target genes. However, the H3K27me3 alteration seems to be mild even at E12.5. Does this infer a PRC2 or H3K27 methylation - independent role of EED? To address this, I suggest the authors re-consider addressing my previously commented weakness #4 regarding the RNA-seq versus Cut&Tag change correlation. For example, a gene scatter plot with X-axis of RNA-seq changes versus Y-axis of H3K27me3 level changes.
(3) The CUT&Tag experiments seem to contain replicates according to the figure legend, but no statistical analysis was presented including the new supplemental tables. Also, for Fig. 5c-d, instead of showing the MRR in individual conditions, I think the audience would really want to know the differential MRR between Fl/WT and Fl/Fl. In other words, how many genes/ MRR have statistically lower H3K27me3 level upon EED loss.
Author response:
The following is the authors’ response to the original reviews.
Reviewer #1 (Public review):
Epigenetic regulation complex (PRC2) is essential for neural crest specification, and its misregulation has been shown to cause severe craniofacial defects. This study shows that Eed, a core PRC2 component, is critical for craniofacial osteoblast differentiation and mesenchymal proliferation after neural crest induction. Using mouse genetics and single-cell RNA sequencing, the researcher found that conditional knockout of Eed leads to significant craniofacial hypoplasia, impaired osteogenesis, and reduced proliferation of mesenchymal cells in post-migratory neural crest populations.
Overall, the study is superficial and descriptive. No in-depth mechanism was analyzed and the phenotype analysis is not comprehensive.
We thank the reviewer for sharing their expertise and for taking the time to provide helpful suggestions to improve our study. We are gratified that the striking phenotypes we report from Eed loss in post-migratory neural crest craniofacial tissues were appreciated. The breadth and depth of our phenotyping techniques, including skeletal staining, micro-CT, echocardiogram, immunofluorescence, histology, and primary craniofacial cell culture provide comprehensive data in support our hypothesis that PRC2 is required for epigenetic control of craniofacial osteoblast differentiation. To provide mechanistic data in support of this hypothesis, we have now performed CUT&Tag H3K27me3 chromatin profiling on nuclei harvested from E12.5 or E16.5 Sox10-Cre Eed<sup>Fl/WT</sup> and Sox10-Cre Eed<sup>Fl/Fl</sup> craniofacial tissue. These new data, which are presented in Fig. 5, Supplementary Fig. 9, and Supplementary Tables 7-10 of our revised manuscript, validate our hypothesis that epigenetic regulation of chromatin architecture downstream of PRC2 activity underlies craniofacial osteoblast differentiation. In particular, we now show that Eed-dependent H3K27me3 methylation is associated with correct temporal expression of transcription factors that are necessary for craniofacial differentiation and patterning, such as including Msx1, Pitx1, Pax7, which were initially nominated by single-cell RNA sequencing of E12.5 Sox10-Cre Eed<sup>Fl/WT</sup> and Sox10-Cre Eed<sup>Fl/Fl</sup> craniofacial tissues in Fig. 4, Supplementary Fig. 5-7, and Supplementary Tables 1-6.
Reviewer #2 (Public review):
Summary:
The role of PRC2 in post-neural crest induction was not well understood. This work developed an elegant mouse genetic system to conditionally deplete EED upon SOX10 activation. Substantial developmental defects were identified for craniofacial and bone development. The authors also performed extensive single-cell RNA sequencing to analyze differentiation gene expression changes upon conditional EED disruption.
Strengths:
(1) Elegant genetic system to ablate EED post neural crest induction.
(2) Single-cell RNA-seq analysis is extremely suitable for studying the cell type-specific gene expression changes in developmental systems.
We thank the reviewer for their generous and helpful comments on our study. We are happy that our mouse genetic and single-cell RNA sequencing approaches were appropriate in pairing the craniofacial phenotypes we report with distinct gene expression changes in post-migratory neural crest tissues upon Eed deletion.
Weaknesses:
(1) Although this study is well designed and contains state-of-the-art single-cell RNA-seq analysis, it lacks the mechanistic depth in the EED/PRC2-mediated epigenetic repression. This is largely because no epigenomic data was shown.
Thank you for this suggestion. As described in response to Reviewer #1, we have now performed CUT&Tag H3K27me3 chromatin profiling on nuclei harvested from E12.5 or E16.5 Sox10-Cre Eed<sup>Fl/WT</sup> and Sox10-Cre Eed<sup>Fl/Fl</sup> craniofacial tissues to provide mechanistic epigenomic data in support of our hypothesis that hat PRC2 is required for craniofacial osteoblast differentiation. These new data, which are presented in Fig. 5, Supplementary Fig. 9, and Supplementary Tables 7-10 of our revised manuscript, integrate genome-wide and targeted metaplot visualizations across genotypes with in-depth analyses of methylation rich regions and genes associated with methylation rich loci. Broadly, these new data reveal that changes in H3K27me3 occupancy correlate with gene expression changes from single-cell RNA sequencing of E12.5 Sox10-Cre Eed<sup>Fl/WT</sup> and Sox10-Cre Eed<sup>Fl/Fl</sup> craniofacial tissues in Fig. 4, Supplementary Fig. 5-7, and Supplementary Tables 1-6.
(2) The mouse model of conditional loss of EZH2 in neural crest has been previously reported, as the authors pointed out in the discussion. What is novel in this study to disrupt EED? Perhaps a more detailed comparison of the two mouse models would be beneficial.
We acknowledge and cite the study the reviewer has indicated (Schwarz et al. Development 2014) in our initial and revised manuscripts. This elegant investigation uses Wnt1-Cre to delete Ezh2 and reports a phenotype similar to the one we observed with Sox10-Cre deletion of Eed, but our study adds depth to the understanding of PRC2’s vital role in neural crest development by ablating Eed, which has a unique function in the PRC2 complex by binding to H3K27me3 and allosterically activating Ezh2. In this sense, our study sheds light on whether phenotypes arising from deletion of Eed, the PRC2 “reader”, differ from phenotypes arising from deletion of Ezh2, the PRC2 “writer”, in neural crest derived tissues. Moreover, we provide the first single-cell RNA sequencing and epigenomic investigations of craniofacial phenotypes arising from PRC2 activity in the developing neural crest. Due to limitations associated with the Wnt1-Cre transgene (Lewis et al. Developmental Biology 2013), which targets pre-migratory neural crest cells, our investigations used Sox10Cre, which targets the migratory neural crest and is completely recombined by E10.5. We have included a detailed comparison of these mouse models in the Discussion section of our revised manuscript, and we thank the reviewer for this thoughtful suggestion.
(3) The presentation of the single-cell RNA-seq data may need improvement. The complexity of the many cell types blurs the importance of which cell types are affected the most by EED disruption.
We thank the reviewer for the opportunity to improve the presentation of our single-cell RNA sequencing data. In response, we have added Supplementary Fig. 8 to our revised manuscript, which shows the cell clusters most affected by EED disruption in UMAP space across genotypes. Because we wanted to capture the fill diversity of cell types underlying the phenotypes we report, we did not sort Sox10+ cells (via FACS, for example) from craniofacial tissues before single-cell RNA sequencing. Our resulting single-cell RNA sequencing data are therefore inclusive of a diversity of cell types in UMAP space, and the prevalence of many of these cell types was unaffected by epigenetic disruption of neural crest derived tissues. The prevalence of the cell clusters that are most affected across genotypes and which are most relevant to our analyses of the developing neural crest are shown in Fig. 4c (and now also in Supplementary Fig. 8), including C0 (differentiating osteoblasts), C4 (mesenchymal stem cells), C5 (mesenchymal stem cells), and C7 (proliferating mesenchymal stem cells). Marker genes and pseudobulked differential expression analyses across these clusters are shown in Fig. 4d and Fig. 4e-h, respectively.
(4) While it's easy to identify PRC2/EED target genes using published epigenomic data, it would be nice to tease out the direct versus indirect effects in the gene expression changes (e.g Figure 4e).
We agree with the reviewer that the single-cell RNA sequencing data in our initial submission do not provide insight into direct versus indirect changes in gene expression downstream of PRC2. In contrast, the CUT&Tag chromatin profiling data that we have generated for this revision provides mechanistic insight into H3K27me3 occupancy and direct effects on gene expression resulting from PRC2 inactivation in our mouse models.
REVIEWING EDITOR COMMENTS
The following are recommended as essential revisions
(1) The study is overall superficial and primarily descriptive, lacking in-depth mechanistic analysis and comprehensive phenotype evaluation.
Please see responses to Reviewer #1 and Reviewer #2 (weaknesses 1 and 4) above.
(2) The authors did not investigate the temporal and spatial expression of Eed during cranial neural crest development, which is crucial for explaining the observed phenotypes.
The temporal and spatial expression of Eed during embryogenesis is well studied. Eed is ubiquitously expressed starting at E5.5, peaks at E9.5, and is downregulated but maintained at a high basal expression level through E18.5 (Schumacher et al. Nature 1996). Although comprehensive analysis of Eed expression in neural crest tissues has not been reported (to our knowledge), Eed physically and functionally interacts with Ezh2 (Sewalt et al. Mol Cell Biol 1998), which is enriched at a diversity of timepoints throughout all developing craniofacial tissues (Schwarz et al. Development 2014). In our study, we confirmed enrichment of Eed expression in craniofacial tissues throughout development using QPCR, and have provided a more detailed description of these published and new findings in the Discussion section of our revised manuscript.
(3) There is no apoptosis analysis provided for any of the samples.
We evaluated the presence of apoptotic cells in E12.5 craniofacial sections using immunofluorescence for Cleaved Caspase 3 in Supplementary Fig. 3d. Although we found a modest increase in the labeling index of apoptotic cells, there was insufficient evidence to conclude that apoptosis is a substantial factor in craniofacial hypoplasia resulting from Eed loss in post-migratory neural crest craniofacial tissues. We have clarified these findings in the Results and Discussion sections of our revised manuscript.
(4) As Eed is a core component of the PRC2 complex, were any other components altered in the Eed cKO mutant? How does Eed regulation influence osteogenic differentiation and proliferation through known pathways?
We thank the editors for this thoughtful inquiry. Although we did not specifically investigate expression or stability of other PRC2 components in Eed conditional mutants, and little is known about how Eed regulates osteogenic differentiation or proliferation through any pathway, our single-cell RNA sequencing data presented in Fig. 4, Supplementary Fig. 5-7, and Supplementary Tables 1-6 provide a significant conceptual advance with mechanistic implications for understanding bone development downstream of Eed and do not reveal any alterations in the expression of other PRC2 components across genotypes. We have clarified these important details in the Discussion section of our revised manuscript.
(5) The authors may compare the Eed cKO phenotype with that of the previous EZH2 cKO mouse model since both Eed and EZH2 are essential subunits of PRC2.
Please see responses to editorial comment 2 above and the last paragraph of the Discussion section of our revised manuscript for comparisons between Eed and Ezh2 knockout phenotypes.
Note: This response was posted by the corresponding author to Review Commons. The content has not been altered except for formatting.
Learn more at Review Commons
Response to referee comments: ____RC-2025-03008
Reviewer #1 (Evidence, reproducibility and clarity (Required)):
Summary In this article, the authors used the synthetic TALE DNA binding proteins, tagged with YFP, which were designed to target five specific repeat elements in Trypanosoma brucei genome, including centromere and telomeres-associated repeats and those of a transposon element. This is in order to detect and identified, using YFP-pulldown, specific proteins that bind to these repetitive sequences in T. brucei chromatin. Validation of the approach was done using a TALE protein designed to target the telomere repeat (TelR-TALE) that detected many of the proteins that were previously implicated with telomeric functions. A TALE protein designed to target the 70 bp repeats that reside adjacent to the VSG genes (70R-TALE) detected proteins that function in DNA repair and the protein designed to target the 177 bp repeat arrays (177R-TALE) identified kinetochore proteins associated T. brucei mega base chromosomes, as well as in intermediate and mini-chromosomes, which imply that kinetochore assembly and segregation mechanisms are similar in all T. brucei chromosome.
Major comments: Are the key conclusions convincing? The authors reported that they have successfully used TALE-based affinity selection of protein-associated with repetitive sequences in the T. brucei genome. They claimed that this study has provided new information regarding the relevance of the repetitive region in the genome to chromosome integrity, telomere biology, chromosomal segregation and immune evasion strategies. These conclusions are based on high-quality research, and it is, basically, merits publication, provided that some major concerns, raised below, will be addressed before acceptance for publication. 1. The authors used TALE-YFP approach to examine the proteome associated with five different repetitive regions of the T. brucei genome and confirmed the binding of TALE-YFP with Chip-seq analyses. Ultimately, they got the list of proteins that bound to synthetic proteins, by affinity purification and LS-MS analysis and concluded that these proteins bind to different repetitive regions of the genome. There are two control proteins, one is TRF-YFP and the other KKT2-YFP, used to confirm the interactions. However, there are no experiment that confirms that the analysis gives some insight into the role of any putative or new protein in telomere biology, VSG gene regulation or chromosomal segregation. The proteins, which have already been reported by other studies, are mentioned. Although the author discovered many proteins in these repetitive regions, their role is yet unknown. It is recommended to take one or more of the new putative proteins from the repetitive elements and show whether or not they (1) bind directly to the specific repetitive sequence (e.g., by EMSA); (2) it is recommended that the authors will knockdown of one or a small sample of the new discovered proteins, which may shed light on their function at the repetitive region, as a proof of concept.
Response
The main request from Referee 1 is for individual evaluation of protein-DNA interaction for a few candidates identified in our TALE-YFP affinity purifications, particularly using EMSA to identify binding to the DNA repeats used for the TALE selection. In our opinion, such an approach would not actually provide the validation anticipated by the reviewer. The power of TALE-YFP affinity selection is that it enriches for protein complexes that associate with the chromatin that coats the target DNA repetitive elements rather than only identifying individual proteins or components of a complex that directly bind to DNA assembled in chromatin.
The referee suggests we express recombinant proteins and perform EMSA for selected candidates, but many of the identified proteins are unlikely to directly bind to DNA - they are more likely to associate with a combination of features present in DNA and/or chromatin (e.g. specific histone variants or histone post-translational modifications). Of course, a positive result would provide some validation but only IF the tested protein can bind DNA in isolation - thus, a negative result would be uninformative.
In fact, our finding that KKT proteins are enriched using the 177R-TALE (minichromosome repeat sequence) identifies components of the trypanosome kinetochore known (KKT2) or predicted (KKT3) to directly bind DNA (Marciano et al., 2021; PMID: 34081090), and likewise the TelR-TALE identifies the TRF component that is known to directly associate with telomeric (TTAGGG)n repeats (Reis et al 2018; PMID: 29385523). This provides reassurance on the specificity of the selection, as does the lack of cross selectivity between different TALEs used (see later point 3 below). The enrichment of the respective DNA repeats quantitated in Figure 2B (originally Figure S1) also provides strong evidence for TALE selectivity.
It is very likely that most of the components enriched on the repetitive elements targeted by our TALE-YFP proteins do not bind repetitive DNA directly. The TRF telomere binding protein is an exception - but it is the only obvious DNA binding protein amongst the many proteins identified as being enriched in our TelR-TALE-YFP and TRF-YFP affinity selections.
The referee also suggests that follow up experiments using knockdown of the identified proteins found to be enriched on repetitive DNA elements would be informative. In our opinion, this manuscript presents the development of a new methodology previously not applied to trypanosomes, and referee 2 highlights the value of this methodological development which will be relevant for a large community of kinetoplastid researchers. In-depth follow-up analyses would be beyond the scope of this current study but of course will be pursued in future. To be meaningful such knockdown analyses would need to be comprehensive in terms of their phenotypic characterisation (e.g. quantitative effects on chromosome biology and cell cycle progression, rates and mechanism of recombination underlying antigenic variation, etc) - simple RNAi knockdowns would provide information on fitness but little more. This information is already publicly available from genome-wide RNAi screens (www.tritrypDB.org), with further information on protein location available from the genome-wide protein localisation resource (Tryptag.org). Hence basic information is available on all targets selected by the TALEs after RNAi knock down but in-depth follow-up functional analysis of several proteins would require specific targeted assays beyond the scope of this study.
NonR-TALE-YFP does not have a binding site in the genome, but YFP protein should still be expressed by T. brucei clones with NLS. The authors have to explain why there is no signal detected in the nucleus, while a prominent signal was detected near kDNA (see Fig.2). Why is the expression of YFP in NonR-TALE almost not shown compared to other TALE clones?
Response
The NonR-TALE-YFP immunolocalisation signal indeed is apparently located close to the kDNA and away from the nucleus. We are not sure why this is so, but the construct is sequence validated and correct. However, we note that artefactual localisation of proteins fused to a globular eGFP tag, compared to a short linear epitope V5 tag, near to the kinetoplast has been previously reported (Pyrih et al, 2023; PMID: 37669165),
The expression of NonR-TALE-YFP is shown in Supplementary Fig. S2 in comparison to other TALE proteins. Although it is evident that NonR-TALE-YFP is expressed at lower levels than other TALEs (the different TALEs have different expression levels), it is likely that in each case the TALE proteins would be in relative excess.
It is possible that the absence of a target sequence for the NonR-TALE-YFP in the nucleus affects its stability and cellular location. Understanding these differences is tangential to the aim of this study.
However, importantly, NonR-TALE-YFP is not the only control for used for specificity in our affinity purifications. Instead, the lack of cross-selection of the same proteins by different TALEs (e.g. TelR-TALE-YFP, 177R-TALE-YFP) and the lack of enrichment of any proteins of interest by the well expressed ingiR-TALE-YFP or 147R-TALE-YFP proteins each provide strong evidence for the specificity of the selection using TALEs, as does the enrichment of similar protein sets following affinity purification of the TelR-TALE-YFP and TRF-YFP proteins which both bind telomeric (TTAGGG)n repeats. Moreover, control affinity purifications to assess background were performed using cells that completely lack an expressed YFP protein which further support specificity (Figure 6).
We have added text to highlight these important points in the revised manuscript:
Page 8:
"However, the expression level of NonR-TALE-YFP was lower than other TALE-YFP proteins; this may relate to the lack of DNA binding sites for NonR-TALE-YFP in the nucleus."
Page 8:
"NonR-TALE-YFP displayed a diffuse nuclear and cytoplasmic signal; unexpectedly the cytoplasmic signal appeared to be in the vicinity the kDNA of the kinetoplast (mitochrondria). We note that artefactual localisation of some proteins fused to an eGFP tag has previously been observed in T. brucei (Pyrih et al, 2023)."
Page 10:
Moreover, a similar set of enriched proteins was identified in TelR-TALE-YFP affinity purifications whether compared with cells expressing no YFP fusion protein (No-YFP), the NonR-TALE-YFP or the ingiR-TALE-YFP as controls (Fig. S7B, S8A; Tables S3, S4). Thus, the most enriched proteins are specific to TelR-TALE-YFP-associated chromatin rather than to the TALE-YFP synthetic protein module or other chromatin.
As a proof of concept, the author showed that the TALE method determined the same interacting partners enrichment in TelR-TALE as compared to TRF-YFP. And they show the same interacting partners for other TALE proteins, whether compared with WT cells or with the NonR-TALE parasites. It may be because NonR-TALE parasites have almost no (or very little) YFP expression (see Fig. S3) as compared to other TALE clones and the TRF-YFP clone. To address this concern, there should be a control included, with proper YFP expression.
Response
See response to point 2, but we reiterate that the ingi-TALE -YFP and 147R-TALE-YFP proteins are well expressed (western original Fig. S3 now Fig. S2) but few proteins are detected as being enriched or correspond to those enriched in TelR-TALE-YFP or TRF-YFP affinity purifications (see Fig. S9). Therefore, the ingi-TALE -YFP and 147R-TALE-YFP proteins provide good additional negative controls for specificity as requested. To further reassure the referee we have also included additional volcano plots which compare TelR-TALE-YFP, 70R-TALE-YFP or 177R-TALE-YFP to the ingiR-TALE-YFP affinity selection (new Figure S8). As with No-YFP or NonR-TALE-YFP controls, the use of ingiR-TALE-YFP as a negative control demonstrates that known telomere associated proteins are enriched in TelR-TALE-YFP affinity purification, RPA subunits enriched with 70R-TALE-YFP and Kinetochore KKT poroteins enriched with 177R-TALE-YFP. These analyses demonstrate specificity in the proteins enriched following affinity purification of our different TALE-YFPs and provide support to strengthen our original findings.
We now refer to use of No-YFP, NonR-TALE-YFP, and ingiR-TALE -YFP as controls for comparison to TelR-TALE-YFP, 70R-TALE-YFP or 177R-TALE-YFP in several places:
Page10:
"Moreover, a similar set of enriched proteins was identified in TelR-TALE-YFP affinity purifications whether compared with cells expressing no YFP fusion protein (No-YFP), the NonR-TALE-YFP or the ingiR-TALE-YFP as controls (Fig. S7B, S8A; Tables S3, S4)."
Page 11:
"Thus, the nuclear ingiR-TALE-YFP provides an additional chromatin-associated negative control for affinity purifications with the TelR-TALE-YFP, 70R-TALE-YFP and 177R-TALE-YFP proteins (Fig. S8)."
"Proteins identified as being enriched with 70R-TALE-YFP (Figure 6D) were similar in comparisons with either the No-YFP, NonR-TALE-YFP or ingiR-TALE-YFP as negative controls."
Top Page 12:
"The same kinetochore proteins were enriched regardless of whether the 177R-TALE proteomics data was compared with No-YFP, NonR-TALE or ingiR-TALE-YFP controls."
Discussion Page 13:
"Regardless, the 147R-TALE and ingiR-TALE proteins were well expressed in T. brucei cells, but their affinity selection did not significantly enrich for any relevant proteins. Thus, 147R-TALE and ingiR-TALE provide reassurance for the overall specificity for proteins enriched TelR-TALE, 70R-TALE and 177R-TALE affinity purifications."
After the artificial expression of repetitive sequence binding five-TALE proteins, the question is if there is any competition for the TALE proteins with the corresponding endogenous proteins? Is there any effect on parasite survival or health, compared to the control after the expression of these five TALEs YFP protein? It is recommended to add parasite growth curves, for all the TALE-proteins expressing cultures.
Response
Growth curves for cells expressing TelR-TALE-YFP, 177R-TALE-YFP and ingiR-TALE-YFP are now included (New Fig S3A). No deficit in growth was evident while passaging 70R-TALE-YFP, 147R-TALE-YFP, NonR-TALE-YFP cell lines (indeed they grew slightly better than controls).
The following text has been added page 8:
"Cell lines expressing representative TALE-YFP proteins displayed no fitness deficit (Fig. S3A)."
Since the experiments were performed using whole-cell extracts without prior nuclear fractionation, the authors should consider the possibility that some identified proteins may have originated from compartments other than the nucleus. Specifically, the detection of certain binding proteins might reflect sequence homology (or partial homology) between mitochondrial DNA (maxicircles and minicircles) and repetitive regions in the nuclear genome. Additionally, the lack of subcellular separation raises the concern that cytoplasmic proteins could have been co-purified due to whole cell lysis, making it challenging to discern whether the observed proteome truly represents the nuclear interactome.
Response
In our experimental design, we confirmed bioinformatically that the repeat sequences targeted were not represented elsewhere in the nuclear or mitochondrial genome (kDNA). The absence of subcellular fractionation could result in some cytoplasmic protein selection, but this is unlikely since each TALE targets a specific DNA sequence but is otherwise identical such that cross-selection of the same contaminating protein set would be anticipated if there was significant non-specific binding. We have previously successfully affinity selected 15 chromatin modifiers and identified associated proteins without major issues concerning cytoplasmic protein contamination (Staneva et al 2021 and 2022; PMID: 34407985 and 36169304). Of course, the possibility that some proteins are contaminants will need to be borne in mind in any future follow-up analysis of proteins of interest that we identified as being enriched on specific types of repetitive element in T. brucei. Proteins that are also detected in negative control, or negative affinity selections such as No-YFP, NoR-YFP, IngiR-TALE or 147R-TALE must be disregarded.
'6'. Should the authors qualify some of their claims as preliminary or speculative, or remove them altogether? As mentioned earlier, the author claimed that this study has provided new information concerning telomere biology, chromosomal segregation mechanisms, and immune evasion strategies. But there are no experiments that provides a role for any unknown or known protein in these processes. Thus, it is suggested to select one or two proteins of choice from the list and validate their direct binding to repetitive region(s), and their role in that region of interaction.
Response
As highlighted in response to point 1 the suggested validation and follow up experiments may well not be informative and are beyond the scope of the methodological development presented in this manuscript. Referee 2 describes the study in its current form as "a significant conceptual and technical advancement" and "This approach enhances our understanding of chromatin organization in these regions and provides a foundation for investigating the functional roles of associated proteins in parasite biology."
The Referee's phrase 'validate their direct binding to repetitive region(s)' here may also mean to test if any of the additional proteins that we identified as being enriched with a specific TALE protein actually display enrichment over the repeat regions when examined by an orthogonal method. A key unexpected finding was that kinetochore proteins including KKT2 are enriched in our affinity purifications of the 177R-TALE-YFP that targets 177bp repeats (Figure 6F). By conducting ChIP-seq for the kinetochore specific protein KKT2 using YFP-KKT2 we confirmed that KKT2 is indeed enriched on 177bp repeat DNA but not flanking DNA (Figure 7). Moreover, several known telomere-associated proteins are detected in our affinity selections of TelR-TALE-YFP (Figure 6B, FigS6; see also Reis et al, 2018 Nuc. Acids Res. PMID: 29385523; Weisert et al, 2024 Sci. Reports PMID: 39681615).
Would additional experiments be essential to support the claims of the paper? Request additional experiments only where necessary for the paper as it is, and do not ask authors to open new lines of experimentation. The answer for this question depends on what the authors want to present as the achievements of the present study. If the achievement of the paper was is the creation of a new tool for discovering new proteins, associated with the repeat regions, I recommend that they add a proof for direct interactions between a sample the newly discovered proteins and the relevant repeats, as a proof of concept discussed above, However, if the authors like to claim that the study achieved new functional insights for these interactions they will have to expand the study, as mentioned above, to support the proof of concept.
Response
See our response to point 1 and the point we labelled '6' above.
Are the suggested experiments realistic in terms of time and resources? It would help if you could add an estimated cost and time investment for substantial experiments. I think that they are realistic. If the authors decided to check the capacity of a small sample of proteins (which was unknown before as a repetitive region binding proteins) to interacts directly with the repeated sequence, it will substantially add of the study (e.g., by EMSA; estimated time: 1 months). If the authors will decide to check the also the function of one of at least one such a newly detected proteins (e.g., by KD), I estimate the will take 3-6 months.
Response
As highlighted previously the proposed EMSA experiment may well be uninformative for protein complex components identified in our study or for isolated proteins that directly bind DNA in the context of a complex and chromatin. RNAi knockdown data and cell location data (as well as developmental expression and orthology data) is already available through tritrypDB.org and trtyptag.org
Are the data and the methods presented in such a way that they can be reproduced? Yes
Are the experiments adequately replicated, and statistical analysis adequate? The authors did not mention replicates. There is no statistical analysis mentioned.
Response
The figure legends indicate that all volcano plots of TALE affinity selections were derived from three biological replicates. Cutoffs used for significance: PFor ChiP-seq two biological replicates were analysed for each cell line expressing the specific YFP tagged protein of interest (TALE or KKT2). This is now stated in the relevant figure legends - apologies for this oversight. The resulting data are available for scrutiny at GEO: GSE295698.
Minor comments: -Specific experimental issues that are easily addressable. The following suggestions can be incorporated: 1. Page 18, in the material method section author mentioned four drugs: Blasticidine, Phleomycin and G418, and hygromycin. It is recommended to mention the purpose of using these selective drugs for the parasite. If clonal selection has been done, then it should also be mentioned.
Response
We erroneously added information on several drugs used for selection in our labaoratory. In fact all TALE-YFP construct carry the Bleomycin resistance genes which we select for using Phleomycin. Also, clones were derived by limiting dilution immediately after transfection.
We have amended the text accordingly:
Page 17/18:
"Cell cultures were maintained below 3 x 10⁶ cells/ml. Pleomycin 2.5 mg/ml was used to select transformants containing the TALE construct BleoR gene."
"Electroporated bloodstream cells were added to 30 ml HMI-9 medium and two 10-fold serial dilutions were performed in order to isolate clonal Pleomycin resistant populations from the transfection. 1 ml of transfected cells were plated per well on 24-well plates (1 plate per serial dilution) and incubated at 37{degree sign}C and 5% CO2 for a minimum of 6 h before adding 1 ml media containing 2X concentration Pleomycin (5 mg/ml) per well."
In the method section the authors mentioned that there is only one site for binding of NonR-TALE in the parasite genome. But in Fig. 1C, the authors showed zero binding site. So, there is one binding site for NonR-TALE-YFP in the genome or zero?
Response
We thank the reviewer for pointing out this discrepancy. We have checked the latest Tb427v12 genome assembly for predicted NonR-TALE binding sites and there are no exact matches. We have corrected the text accordingly.
Page 7:
"A control NonR-TALE protein was also designed which was predicted to have no target sequence in the T. bruceigenome."
Page 17:
"A control NonR-TALE predicted to have no recognised target in the T. brucei geneome was designed as follows: BLAST searches were used to identify exact matches in the TREU927 reference genome. Candidate sequences with one or more match were discarded."
The authors used two different anti-GFP antibodies, one from Roche and the other from Thermo Fisher. Why were two different antibodies used for the same protein?
Response
We have found that only some anti-GFP antibodies are effective for affinity selection of associated proteins, whereas others are better suited for immunolocalisation. The respective suppliers' antibodies were optimised for each application.
Page 6: in the introduction, the authors give the number of total VSG genes as 2,634. Is it known how many of them are pseudogenes?
Response
This value corresponds to the number reported by Consentino et al. 2021 (PMID: 34541528) for subtelomeric VSGs, which is similar to the value reported by Muller et al 2018 (PMID: 30333624) (2486), both in the same strain of trypanosomes as used by us. Based on the earlier analysis by Cross et al (PMID: 24992042), 80% of the identified VSGs in their study (2584) are pseudogenes. This approximates to the estimation by Consentino of 346/2634 (13%) being fully functional VSG genes at subtelomeres, or 17% when considering VSGs at all genomic locations (433/2872).
I found several typos throughout the manuscript.
Response
Thank you for raising this, we have read through the manuscipt several times and hopefully corrected all outstanding typos.
Fig. 1C: Table: below TOTAL 2nd line: the number should be 1838 (rather than 1828)
Corrected- thank you.
Are prior studies referenced appropriately? Yes
Are the text and figures clear and accurate? Yes
Do you have suggestions that would help the authors improve the presentation of their data and conclusions? Suggested above
Reviewer #1 (Significance (Required)):
Describe the nature and significance of the advance (e.g., conceptual, technical, clinical) for the field: This study represents a significant conceptual and technical advancement by employing a synthetic TALE DNA-binding protein tagged with YFP to selectively identify proteins associated with five distinct repetitive regions of T. brucei chromatin. To the best of my knowledge, it is the first report to utilize TALE-YFP for affinity-based isolation of protein complexes bound to repetitive genomic sequences in T. brucei. This approach enhances our understanding of chromatin organization in these regions and provides a foundation for investigating the functional roles of associated proteins in parasite biology. Importantly, any essential or unique interacting partners identified could serve as potential targets for therapeutic intervention.
Place the work in the context of the existing literature (provide references, where appropriate). I agree with the information that has already described in the submitted manuscript, regarding its potential addition of the data resulted and the technology established to the study of VSGs expression, kinetochore mechanism and telomere biology.
State what audience might be interested in and influenced by the reported findings. These findings will be of particular interest to researchers studying the molecular biology of kinetoplastid parasites and other unicellular organisms, as well as scientists investigating chromatin structure and the functional roles of repetitive genomic elements in higher eukaryotes.
1Define your field of expertise with a few keywords to help the authors contextualize your point of view. 2Indicate if there are any parts of the paper that you do not have sufficient expertise to evaluate. (1) Protein-DNA interactions/ chromatin/ DNA replication/ Trypanosomes (2) None
Reviewer #2 (Evidence, reproducibility and clarity (Required)):
Summary
Carloni et al. comprehensively analyze which proteins bind repetitive genomic elements in Trypanosoma brucei. For this, they perform mass spectrometry on custom-designed, tagged programmable DNA-binding proteins. After extensively verifying their programmable DNA-binding proteins (using bioinformatic analysis to infer target sites, microscopy to measure localization, ChIP-seq to identify binding sites), they present, among others, two major findings: 1) 14 of the 25 known T. brucei kinetochore proteins are enriched at 177bp repeats. As T. brucei's 177bp repeat-containing intermediate-sized and mini-chromosomes lack centromere repeats but are stable over mitosis, Carloni et al. use their data to hypothesize that a 'rudimentary' kinetochore assembles at the 177bp repeats of these chromosomes to segregate them. 2) 70bp repeats are enriched with the Replication Protein A complex, which, notably, is required for homologous recombination. Homologous recombination is the pathway used for recombination-based antigenic variation of the 70bp-repeat-adjacent variant surface glycoproteins.
Major Comments
None. The experiments are well-controlled, claims well-supported, and methods clearly described. Conclusions are convincing.
Response Thank you for these positive comments.
Minor Comments
1) Fig. 2 - I couldn't find an uncropped version showing multiple cells. If it exists, it should be linked in the legend or main text; Otherwise, this should be added to the supplement.
Response
The images presented represent reproducible analyses, and independently verified by two of the authors. Although wider field of view images do not provide the resolution to be informative on cell location, as requested we have provided uncropped images in new Fig. S4 for all the cell lines shown in Figure 2A.
In addition, we have included as supplementary images (Fig. S3B) additional images of TelR-TALE-YFP, 177R-TALE-YFP and ingiR-TALE YFP localisation to provide additional support their observed locations presented in Figure 1. The set of cells and images presented in Figure 2A and in Fig S3B were prepared and obtained by a different authors, independently and reproducibly validating the location of the tagged protein.
2) I think Suppl. Fig. 1 is very valuable, as it is a quantification and summary of the ChIP-seq data. I think the authors could consider making this a panel of a main figure. For the main figure, I think the plot could be trimmed down to only show the background and the relevant repeat for each TALE protein, leaving out the non-target repeats. (This relates to minor comment 6.) Also, I believe, it was not explained how background enrichment was calculated.
Response
We are grateful for the reviewer's positive view of original Fig. S1 and appreciate the suggestion. We have now moved these analysis to part B of main Figure 2 in the revised manuscript - now Figure 2B. We have also provided additional details in the Methods section on the approaches used to assess background enrichment.
Page 19:
Background enrichment calculation
The genome was divided into 50 bp sliding windows, and each window was annotated based on overlapping genomic features, including CIR147, 177 bp repeats, 70 bp repeats, and telomeric (TTAGGG)n repeats. Windows that did not overlap with any of these annotated repeat elements were defined as "background" regions and used to establish the baseline ChIP-seq signal. Enrichment for each window was calculated using bamCompare, as log₂(IP/Input). To adjust for background signal amongst all samples, enrichment values for each sample were further normalized against the corresponding No-YFP ChIP-seq dataset.
Note: While revising the manuscript we also noticed that the script had a nomalization error. We have therefore included a corrected version of these analyses as Figure 2B (old Fig. S1)
3) Generally, I would plot enrichment on a log2 axis. This concerns several figures with ChIP-seq data.
Response
Our ChIP-seq enrichment is calculated by bamCompare. The resulting enrichment values are indeed log2 (IP/Input). We have made this clear in the updated figures/legends.
4) Fig. 4C - The violin plots are very hard to interpret, as the plots are very narrow compared to the line thickness, making it hard to judge the actual volume. For example, in Centromere 5, YFP-KKT2 is less enriched than 147R-TALE over most of the centromere with some peaks of much higher enrichment (as visible in panel B), however, in panel C, it is very hard to see this same information. I'm sure there is some way to present this better, either using a different type of plot or by improving the spacing of the existing plot.
Response
We thank the reviewer for this suggestion; we have elected to provide a Split-Violin plot instead. This improves the presentation of the data for each centromere. The original violin plot in Figure 4C has been replaced with this Split-Violin plot (still Figure 4C).
5) Fig. 6 - The panels are missing an x-axis label (although it is obvious from the plot what is displayed). Maybe the "WT NO-YFP vs" part that is repeated in all the plot titles could be removed from the title and only be part of the x-axis label?
Response
In fact, to save space the X axis was labelled inside each volcano plot but we neglected to indicate that values are a log2 scale indicating enrichment. This has been rectified - see Figure 6, and Fig. S7, S8 and S9.
6) Fig. 7 - I would like to have a quantification for the examples shown here. In fact, such a quantification already exists in Suppl. Figure 1. I think the relevant plots of that quantification (YFP-KKT2 over 177bp-repeats and centromere-repeats) with some control could be included in Fig. 7 as panel C. This opportunity could be used to show enrichment separated out for intermediate-sized, mini-, and megabase-chromosomes. (relates to minor comment 2 & 8)
Response
The CIR147 sequence is found exclusively on megabase-sized chromosomes, while the 177 bp repeats are located on intermediate- and mini-sized chromosomes. Due to limitations in the current genome assembly, it is not possible to reliably classify all chromosomes into intermediate- or mini- sized categories based on their length. Therefore, original Supplementary Fig. S1 presented the YFP-KKT2 enrichment over CIR147 and 177 bp repeats as a representative comparison between megabase chromosomes and the remaining chromosomes (corrected version now presented as main Figure 2B). Additionally, to allow direct comparison of YFP-KKT2 enrichment on CIR147 and 177 bp repeats we have included a new plot in Figure 7C which shows the relative enrichment of YFP-KKT2 on these two repeat types.
We have added the following text , page 12:
"Taking into account the relative to the number of CIR147 and 177 bp repeats in the current T.brucei genome (Cosentino et al., 2021; Rabuffo et al., 2024), comparative analyses demonstrated that YFP-KKT2 is enriched on both CIR147 and 177 bp repeats (Figure 7C)."
7) Suppl. Fig. 8 A - I believe there is a mistake here: KKT5 occurs twice in the plot, the one in the overlap region should be KKT1-4 instead, correct?
Response
Thanks for spotting this. It has been corrected
8) The way that the authors mapped ChIP-seq data is potentially problematic when analyzing the same repeat type in different regions of the genome. The authors assigned reads that had multiple equally good mapping positions to one of these mapping positions, randomly. This is perfectly fine when analysing repeats by their type, independent of their position on the genome, which is what the authors did for the main conclusions of the work. However, several figures show the same type of repeat at different positions in the genome. Here, the authors risk that enrichment in one region of the genome 'spills' over to all other regions with the same sequence. Particularly, where they show YFP-KKT2 enrichment over intermediate- and mini-chromosomes (Fig. 7) due to the spillover, one cannot be sure to have found KKT2 in both regions. Instead, the authors could analyze only uniquely mapping reads / read-pairs where at least one mate is uniquely mapping. I realize that with this strict filtering, data will be much more sparse. Hence, I would suggest keeping the original plots and adding one more quantification where the enrichment over the whole region (e.g., all 177bp repeats on intermediate-/mini-chromosomes) is plotted using the unique reads (this could even be supplementary). This also applies to Fig. 4 B & C.
Response
We thank the reviewer for their thoughtful comments. Repetitive sequences are indeed challenging to analyze accurately, particularly in the context of short read ChIP-seq data. In our study, we aimed to address YFP-KKT2 enrichment not only over CIR147 repeats but also on 177 bp repeats, using both ChIP-seq and proteomics using synthetic TALE proteins targeted to the different repeat types. We appreciate the referees suggestion to consider uniquely mapped reads, however, in the updated genome assembly, the 177 bp repeats are frequently immediately followed by long stretches of 70 bp repeats which can span several kilobases. The size and repetitive nature of these regions exceeds the resolution limits of ChIP-seq. It is therefore difficult to precisely quantify enrichment across all chromosomes.
Additionally, the repeat sequences are highly similar, and relying solely on uniquely mapped reads would result in the exclusion of most reads originating from these regions, significantly underestimating the relative signals. To address this, we used Bowtie2 with settings that allow multi-mapping, assigning reads randomly among equivalent mapping positions, but ensuring each read is counted only once. This approach is designed to evenly distribute signal across all repetitive regions and preserve a meaningful average.
Single molecule methods such as DiMeLo (Altemose et al. 2022; PMID: 35396487) will need to be developed for T. brucei to allow more accurate and chromosome specific mapping of kinetochore or telomere protein occupancy at repeat-unique sequence boundaries on individual chromosomes.
Reviewer #2 (Significance (Required)):
This work is of high significance for chromosome/centromere biology, parasitology, and the study of antigenic variation. For chromosome/centromere biology, the conceptual advancement of different types of kinetochores for different chromosomes is a novelty, as far as I know. It would certainly be interesting to apply this study as a technical blueprint for other organisms with mini-chromosomes or chromosomes without known centromeric repeats. I can imagine a broad range of labs studying other organisms with comparable chromosomes to take note of and build on this study. For parasitology and the study of antigenic variation, it is crucial to know how intermediate- and mini-chromosomes are stable through cell division, as these chromosomes harbor a large portion of the antigenic repertoire. Moreover, this study also found a novel link between the homologous repair pathway and variant surface glycoproteins, via the 70bp repeats. How and at which stages during the process, 70bp repeats are involved in antigenic variation is an unresolved, and very actively studied, question in the field. Of course, apart from the basic biological research audience, insights into antigenic variation always have the potential for clinical implications, as T. brucei causes sleeping sickness in humans and nagana in cattle. Due to antigenic variation, T. brucei infections can be chronic.
Response
Thank you for supporting the novelty and broad interest of our manuscript
My field of expertise / Point of view:
I'm a computer scientist by training and am now a postdoctoral bioinformatician in a molecular parasitology laboratory. The laboratory is working on antigenic variation in T. brucei. The focus of my work is on analyzing sequencing data (such as ChIP-seq data) and algorithmically improving bioinformatic tools.
iter(match, namespaces=None)
iter(tag=None) が正しいような気がします。
https://docs.python.org/ja/3/library/xml.etree.elementtree.html#xml.etree.ElementTree.Element.iter
Except where otherwise noted, content on this site is licensed under a Creative Commons Attribution 4.0 International license. Icons by Font Awesome.
CC logo and icons into Unicode

Note: This response was posted by the corresponding author to Review Commons. The content has not been altered except for formatting.
Learn more at Review Commons
__Reviewer #1 __
Major comments
The results have been added as new supplementary Figure 1 as following:
Our new metabolomics data also revealed substantial reductions in the aspartate/glutamate ratio in Aralar 1 knockdown cells, serving as a metabolomic signature of impaired MASh function and reduced exchange of these amino acids between the cytosol and mitochondria. Given that the MASh is a major mechanism for exporting cytosolic reducing equivalents into the mitochondria under high metabolic demand, its loss would be expected to impact redox homeostasis, particularly under adrenergic stimulation when glycolytic flux and lipolytic activity are elevated (PMID: 40540398).
Importantly, although our redox surrogate marker did not detect alterations, this may be explained by activation of compensatory pathways, most notably the glycerol phosphate shuttle (GPSh), which is highly expressed and active in brown adipocytes. Indirect support for this compensation comes from data shown in figure 4I showing reduced glycerol release in Aralar 1 KD cells upon norepinephrine stimulation and blocked lipolysis. This suggests a redirection of glycolytically derived G3P away from release and toward enhanced cycling within the GPSh, supporting cytosolic NAD⁺ regeneration via mitochondrial FAD-dependent G3PDH and cytosolic NAD⁺-dependent G3PDH activity. This is consistent with studies documenting that the combined action of MASh and GPSh maintains NAD redox homeostasis in brown adipocytes especially during non-thermogenic conditions (PMID: 168075; PMID: 40540398; PMID: 37647199). We have included a discussion about this possibility at page 9, third paragraph as follows:
*“Previous studies have shown that BAT exhibits high activity of mitochondrial FAD-dependent glycerol-3-phosphate dehydrogenase (mG3PDH), which functions as an electron sink to sustain low cytosolic NADH levels essential for continuous glycolytic flux [11]. Accordingly, suppression of the MASh, either genetically or pharmacologically, is likely to induce a compensatory upregulation of the GPSh. This adaptation would enhance G3P turnover, contributing to the maintenance of cytosolic NAD redox balance. Moreover, the increased flux through the GPSh could favor fatty acid esterification and triglyceride synthesis or re-esterification, consistent with our findings in Ogc and/or Aralar 1 KD cells, where (i) triglyceride content rises (Fig. 3), (ii) overall respiratory rates remain largely unaltered (Figs. 2D–G), and (iii) glycerol release declines significantly (Fig. 4I). Notably, the decrease in glycerol release persists even when lipolysis is blocked by ATGlistatin, suggesting that the available G3P pool is rerouted from dephosphorylation and extracellular release toward oxidation to DHAP by mG3PDH to regenerate cytosolic NAD+ under MASh-deficient conditions. We propose that interference with the MASh does not directly impact lipolysis but instead alters the cellular balance between DHAP and G3P owing to enhanced activity of the GPSh. This metabolic shift would favor the esterification of G3P with free fatty acids, thereby promoting triglyceride synthesis. These results support the notion that, even during adrenergic stimulation—when long-chain unsaturated fatty acids and their CoA esters strongly inhibit mG3PDH activity [11]—the residual flux through the glycerophosphate shuttle remains critical for sustaining cytosolic NAD redox equilibrium [11,19,32].” *
At the mechanistic level, adrenergic stimulation in brown adipocytes activates robust lipolysis and thermogenic gene programs, generating high NADH that must be efficiently reoxidized to sustain flux through glycolysis and lipolysis-linked pathways. Our findings are consistent with a model in which the loss of MASh does not prevent cytosolic NAD⁺ regeneration or lipolytic flux during acute adrenergic stimulation, due to compensatory upregulation of the GPSh, as suggested by the glycerol release changes. Thus, while MASh normally acts as a conduit for NADH export and aspartate/glutamate exchange, in its absence, the GPSh maintains cytosolic redox balance, thereby sustaining glycolytic and lipolytic capacity.
We agree that future studies should employ direct measurements of cytosolic NAD⁺/NADH ratios (e.g., genetically-encoded redox sensors) during adrenergic stimulation and specific pharmacological inhibition of both shuttles to dissect these relationships in greater detail. We sincerely appreciate the reviewer's input, which has prompted us to clarify the indirect but robust evidence supporting a role for compensatory redox shuttle activity in preserving brown adipocyte lipolysis in the setting of MASh impairment.
We have further added a new paragraph in the discussion section (page 10)::
*“Mechanistically, the connection between the MASh and lipolysis appears to involve regulation of the cytosolic NAD⁺/NADH redox balance. MASh activity facilitates the regeneration of NAD⁺ from NADH in the cytosol, primarily through the reduction of oxaloacetate to malate by cytosolic malate dehydrogenase (Fig. 1G-H). Despite the theoretical expectation that reductions in MASh activity would disturb redox homeostasis, our metabolomic data show that the lactate/pyruvate ratio remains unchanged under conditions of MASh impairment, indicating that the overall cytosolic NAD⁺/NADH ratio is maintained (Figure S1A-C). While direct measurements of cytosolic NAD⁺/NADH were not performed, the preserved lactate/pyruvate ratio in Aralar 1 KD cells under basal conditions strongly suggests redox stability, likely due to compensatory activity by alternative mitochondrial shuttles or metabolic adaptations that maintain NAD redox homeostasis despite MASh impairment [18,33]. *
Previous evidence indicates that BAT exhibits high activity of mitochondrial FAD-dependent glycerol-3-phosphate dehydrogenase (G3PDH), which acts as an electron sink to sustain low cytosolic NADH levels critical for glycolysis [34]. In this sense, it is conceivable that genetic or pharmacological suppression of MASh triggers compensatory enhancement of the G3P shuttle, increasing G3P availability and facilitating the maintenance of cytosolic NAD redox balance. This adaptation could also promote fatty acid esterification and triglyceride synthesis or re-esterification, aligning with our observations that in Ogc and/or Aralar 1 KD cells: (i) triglyceride levels increase (Fig. 3); (ii) overall respiratory rates are preserved (Figs. 2D–G); and (iii) glycerol release is significantly reduced (Fig 4I).”
__ The absence of in vivo analysis of lipid-droplet size in MASh loss-of-function models is a major concern. In vitro results could be confounded by differences in differentiation stage between groups. Please document equivalent adipogenesis across groups (e.g., Pparg/Cebpa/Plin1/Fabp4 expression).__
Answer 2) We thank the reviewer for the thoughtful and constructive comment regarding potential confounding by differences in differentiation stage, and for highlighting the importance of documenting equivalence between experimental groups. We appreciate the opportunity to clarify and provide additional assurance on this point.
As detailed in our manuscript, we have performed qPCR analysis of multiple well-established markers of brown adipocyte differentiation, including Ucp1, Elovl3, Prdm16, Pparg, Cebpa, Plin1, and Fabp4, in both scramble, aralar1 KD, and Ogc KD cells (see Fig. S1A and accompanying text). Our results show no apparent effect of these genetic interventions on overall differentiation, as the expression levels of these key markers were consistently unaltered across groups. Furthermore, adenoviral-mediated knockdown of Ogc achieved an approximate 80% reduction in Ogc mRNA (see Fig. S1B), yet most differentiation markers remained unaffected. We did observe significant increases in Atgl, Pgc1α, and Tfam mRNA levels, which may indicate a degree of pathway reprogramming without affecting the general differentiation profile. We propose that interference with the MASh does not directly impact lipolysis but instead alters the cellular balance between DHAP and G3P owing to enhanced activity of the GPSh. This metabolic shift would favor the esterification of G3P with free fatty acids, thereby promoting triglyceride synthesis.
Additional experimental support for equivalent differentiation can be drawn from our respirometry data presented in Figures 2E and 2G. These figures demonstrate that respiratory rates upon norepinephrine stimulation, which is a sensitive indicator of brown adipocyte thermogenic capacity, were essentially identical in scramble, aralar1 KD, and Ogc KD cells. Since norepinephrine-stimulated respiration requires both functional mitochondria and the full differentiation of brown adipocytes, these results strongly support the conclusion that silencing either MASh component does not impair the fundamental ability of cells to undergo brown adipocyte differentiation or achieve functional thermogenic competence.
This is consistent with published findings showing that norepinephrine triggers robust respiration and thermogenic activation only in fully differentiated and functional brown adipocytes, making such measurements a widely accepted proxy for differentiation status and mitochondrial integrity. Thus, the equivalent respiratory responses observed in all groups further validate that differentiation was not compromised by the genetic interventions.
We hope this clarifies that equivalent adipogenesis was carefully documented and that any observed phenotypes are unlikely to be attributable to differences in differentiation stages. Thank you again for your rigorous assessment and for helping to ensure the robustness of our study.
__ Please include rescue experiments (add-back OGC1 and Aralar) to rule out siRNA/shRNA off-target effects and verify that the phenotype stems from MASh loss of function.__
Answer 3) We thank the reviewer for this important suggestion regarding the inclusion of rescue experiments with add-back of Ogc and Aralar to definitively exclude off-target effects of the siRNA/shRNA-mediated knockdowns.
We would like to kindly point out that although we did not perform add-back rescue experiments directly, the consistency of phenotypes observed across two independent genetic interventions—aralar 1 KD and Ogc KD—strongly argues against off-target effects being responsible for the observed metabolic and functional alterations. Specifically, both knockdowns yielded remarkably similar phenotypes in multiple assays, including respirometry analyses, mitochondrial morphology, lipid droplet homeostasis, and lipid metabolism, supporting the conclusion that these effects stem from MASh loss of function rather than nonspecific silencing.
Furthermore, our new supplementary data (new Supplementary Figure 1A-F) reveals a significant reduction in the aspartate/glutamate ratio in Aralar 1 KD cells, a compelling functional readout for MASh impairment. This molecular evidence corroborates that our genetic interventions effectively disrupted MASh activity as intended.
We sincerely appreciate the reviewer’s thorough evaluation and understand the importance of rescue experiments. While recognizing their value, we believe the convergent genetic, metabolic, and functional evidence presented across two different MASh components provides strong and consistent support that the phenotypes observed are due to specific loss of MASh function.
__ Please expand on physiological significance: What is the importance of MASh regulation of BAT lipolysis in long-term adaptive thermogenesis?__
Answer 4) This is a very interesting aspect, and we have included a new paragraph in the discussion section (page 14) to address it as follows:
“Our results, supported by recent literature, strongly indicate that the malate–aspartate shuttle (MASh) plays a key role in facilitating fatty acid–dependent thermogenesis in brown adipocytes. Specifically, BAT-targeted overexpression of GOT1 has been shown to enhance β-oxidation and support acute cold-induced thermogenesis (PMID: 40540398). Interestingly, genetic ablation of GOT1—and thus MASh inhibition—preserves cold-induced thermogenesis by promoting a metabolic shift from fatty acid to glucose oxidation. Our findings corroborate and extend these observations by demonstrating that MASh impairment sustains overall respiratory activity in norepinephrine-stimulated brown adipocytes (Figures 2D–2G), while concurrently impairing lipolysis and resulting in an accumulation of small lipid droplets (Figures 3 and 4). Collectively, these data suggest that MASh not only modulates substrate preference towards fatty acid oxidation but also facilitates lipolysis, an essential upstream step that enables lipid oxidation and supports thermogenic heat production.”
Minor comments
__ In Fig. 2 legend line: "Adevirus-mediated" → Adenovirus-mediated; "OCAR" → OCR.__
Answer 2) Corrected
__ For lipolysis imaging, you already show Forskolin/Atglistatin/Etomoxir controls; add a vehicle-only time course overlay in the main figure (currently in text/legend) to aid visual comparison.__
Answer 3) We thank the reviewer for pointing this out. To improve clarity, we have updated the labeling in Figures 3 and 4: “basal” now clearly refers to the unstimulated/untreated condition, and the previously labeled “UT” condition has been clarified as “untransduced.” These changes make the figure legends and data presentation more consistent and easier to interpret.
__ Ensure consistent gene symbols (Atgl/Pnpla2), and protein capitalization.__
Answer 4) Corrected.
__Reviewer #2 __
Major points:
We would like to point out that mitochondrial morphology was quantified based on mitochondrial area rather than fluorescence intensity. To create an accurate binary map of mitochondria, we used a low threshold, which allowed us to include even weakly stained mitochondria and thereby detect them independently of their membrane potential. In all imaged cells, TMRE signal was sufficient to reliably identify mitochondrial pixels. Moreover, these images were acquired using a confocal microscope, where the risk of pixel expansion due to higher fluorescence intensity is minimized. Lastly, given that overall mitochondrial oxygen consumption in these cells remains largely intact, we do not expect a substantial loss of membrane potential, although minor effects cannot be entirely excluded.
We opted to use TMRE for imaging Ogc KD cells because the scramble control for these shRNA viruses carries an mKate fluorescent tag, which overlaps with the MTDR signal. Since accurate assessment of transduction efficiency relied on detecting mKate, MTDR could not be used in these experiments. Importantly, we only compare mitochondrial morphology within the same staining condition and do not draw conclusions across cells stained with different dyes.
To ensure transparency, we have added a new section at the discussion (page 17, 2nd paragraph) highlighting the potential influence of ΔΨm-dependent dyes on morphological measurements as follows:
“It is also important to note that mitochondrial morphology was quantified using MTDR in Aralar 1 KD cells and TMRE in Ogc KD cells due to experimental constraints (see Methods). TMRE is a membrane potential–dependent dye, which could potentially influence morphology measurements. To minimize this risk, we used confocal microscopy, which reduces the likelihood of pixel expansion due to higher fluorescence intensity, and set thresholds to detect even weakly stained mitochondria. Nonetheless, we cannot fully exclude the possibility that the differences in morphology observed between Aralar 1 and Ogc KD are influenced by the use of different dyes; however, statistical comparisons were never performed across samples stained with different dyes.”
Also, we have expanded the Methods section (page 22, 2nd paragraph) to include a rationale for using these dyes and describe the analysis protocol as following:
“TMRE was used for Ogc KD cells because the scramble control for the shRNA viruses carries an mKate fluorescent tag, which overlaps with MTDR fluorescence, preventing its use. MTDR was used for Aralar KD cells. Image Analysis was performed in FIJI (ImageJ, NIH). For the quantification of mitochondrial morphology and area, images stained with TMRE or MTDR were analyzed. Thresholds were adjusted to ensure that even weakly stained mitochondria were detected and included in the analysis. Only the mitochondrial area was evaluated, independent of fluorescence intensity.”
Minor points:
“In mammalian cells, cytosolic NAD⁺ is regenerated through lactate dehydrogenase (LDH), the glycerol-3-phosphate shuttle (GPSh), or the malate-aspartate shuttle (MASh). In BAT, however, lactate production rises only slightly with adrenergic activation and most lactate is oxidized via the TCA cycle, suggesting that LDH primarily consumes NAD⁺ rather than regenerating it [PMID: 30456392; PMID: 37337122; PMID: 30456392; PMID: 37802078; PMID: 40982723]. Consequently, mitochondrial redox shuttles become critical for sustaining cytosolic NAD⁺ supply”.
We have also provided additional references to support this new section at the introduction.
__ In Fig. 1A and B-D, there are inconsistencies and duplications in the abbreviation labels. Please check and revise accordingly. __
Answer 2) We thank the reviewer for this comment. We would like to clarify that Figure 1A is a schematic overview of the system, while Figures 1B–D show protein expression in specific contexts: whole BAT (B), whole liver (C), and BAT mitochondria (D). In Figures 1B and 1C, all components are shown because both cytosolic (MDH1 and GOT1) and mitochondrial proteins (MDH2, GOT2, Aralar 1 and 2 and OGC) are present. In contrast, Figure 1D shows only mitochondrial components (OGC, Aralar1, MDH2, and GOT2). Although Aralar2 is a mitochondrial protein, it was not detected in this study (Forner et al., 2009). Similarly, cytosolic components such as MDH1 and GOT1 are not shown in Figure 1D because they are absent in the mitochondrial fraction. We have revised the figure legend to make these distinctions clearer.
__ In Fig. S1, the number of n indicated does not match the number of data points shown. Please clarify whether these represent technical replicates or biological replicates, and provide a detailed description of the statistical methods used throughout the manuscript.__
Answer 3) We thank the reviewer for catching this and allowing us to correct our mistakes. In the revised version, we have corrected the figure legend of Supplementary Figure 1 so that the number of n matches the data points shown.
__ Please provide details on the normalization strategy used in the BODIPY-C12/BODIPY-493 staining analysis, such as whether fluorescence intensity was quantified as mean or integrated values, and whether the analysis was normalized to lipid droplet area, cell number, or baseline. Since lipolytic stimulation can reduce droplet size and increase droplet number, these factors may bias the results. __
Answer 4) We thank the reviewer for this important comment and apologize for the lack of detail regarding this analysis. The analysis of BODIPY-C12 and BODIPY-493 was performed by quantifying the mean fluorescence intensity of BODIPY-C12 detected within a mask generated from the BODIPY-493 signal. This approach allowed us to define all lipid droplets and measure the release of previously esterified C12. To account for variability across samples, the data were normalized to each sample’s individual baseline at time point 0 and expressed as fold change relative to this baseline. In the revised manuscript we have included this description in the Methods section (page 18, last paragraph) for clarity and reproducibility, as following:
“Lipid Droplet area was defined based on Bodipy 493/503 signal, which was used to generate a mask identifying all lipid droplets. Within this mask, the mean fluorescence intensity of BODIPY C12 was quantified over time to monitor the release of previously esterified C12. To account for variability between samples, data were normalized to each sample’s individual baseline at time point 0 and expressed as fold change relative to this baseline.”
__ The manuscript notes that the unexpected result in Fig. 3K-M in parallel with increased Atgl mRNA expression might be because it does not reflect protein levels or enzymatic activity. To strengthen this point, it is recommended to include data on ATGL and phosphorylation ATGL. __
Answer 5) We thank the reviewer for this constructive comment. We have clarified these aspects in the revised Results and Discussion sections to reflect this interpretation more accurately as follows:
“Notably, Atgl mRNA measurement in our study was primarily used as a marker of brown adipocyte differentiation, rather than as a direct indicator of ATGL protein abundance or enzymatic activity. We detected increased Atgl expression only in Ogc KD cells (Fig. S1H), but not in Aralar 1 KD cells (Fig. S1G). This likely does not reflect a major difference in differentiation status, as other brown adipocyte markers and norepinephrine-stimulated respiration were comparable between scramble and knockdown cells (Fig. 2D-G and 2N-O and S1G-H). Although lipolysis was not evaluated in Ogc KD cells, in Aralar 1 KD cells basal lipolysis remained unchanged (Fig. 4D-E and 4G-I), whereas norepinephrine-stimulated lipolysis was delayed or partially inhibited. Notably, the enhanced fatty acid esterification observed in Ogc KD cells despite elevated Atgl expression is not contradictory, since in brown adipocytes lipolysis and re-esterification occur concurrently to sustain high lipid turnover [34].
__ Red-on-black is not a great color code for IMFs, how about black-and-white? __
Answer 6) We have changed color text for white on figures 2H and K as suggested.
__Reviewer #3 __
Major points;
Furthermore, strategies used to downregulate MAS components produce only a partial reduction in mRNA levels, about 70 %, but its outcome on protein levels has not been determined. and the remaining protein level could be sufficient to maintain shuttle activity. Therefore, the effect of silencing at protein level should be analyzed, because as authors also point out on page 16; "mRNA levels may not reflect actual protein levels or activity".
Answer 2) We thank the reviewer for this important point. Our knockdowns resulted in ~70–80% reduction in mRNA levels. While not complete, this represents a substantial decrease and is sufficient to produce strong functional effects. At the time the experiments were performed, we did not have access to suitable antibodies, and the available antibodies did not provide reliable signals in our samples, which is why we used qPCR to estimate knockdown efficiency. Importantly, we observed clear phenotypic changes in both knockdowns (Aralar and OGC), and both showed very similar phenotypes. This suggests that the level of knockdown was sufficient to significantly impair MAS activity. In the revised version we added new data which further validated the functional impact of Aralar KD (given that this protein has an alternative isoform, as pointed out by the reviewer). We performed metabolomics experiments measuring aspartate and glutamate levels. Our new data shows that the aspartate-to-glutamate ratio is significantly reduced in Aralar KD cells. This ratio serves as a proxy for glutamate catabolism, and the observed decrease suggests reduced glutamate catabolism, likely due to impaired MAS activity. Therefore, the reduced whole-cell aspartate/glutamate ratio serves as a metabolic signature of MAS impairment, consistent with Aralar KD. These data indicate that Aralar is sufficiently downregulated to produce a functional effect, supporting our conclusion that MAS activity is impaired. The results have been added as new supplementary Figure 1 as follows:
__ In the case of aspartate/glutamate carriers (AGCs) the role of citrin/slc25a13, the second AGC paralog, should also be analyzed. This AGC isoform is discarded based on proteomic data from brown adipose tissue, but, as it is shown in figure 1B, its levels are similar those of Aralar/slc25a12, the only AGC silenced. Besides, primary brown adipocytes differentiated for 7 days are used here, and it is possible that factors such as culture conditions or differentiation itself could alter AGC levels. Therefore, it is necessary to determine the protein levels of citrin/AGC2, and, if necessary, downregulate it together with the Aralar/AGC1 isoform. citrin/AGC2 activity may be responsible for the observed difference between the OGC and Aralar/AGC1 KD adipocytes.__
Answer 3) We thank the reviewer for this important point. We chose Aralar1 because it is the isoform predominantly expressed in brown adipose tissue (PMID: 23436904). We acknowledge, however, that compensatory increases in Citrin/AGC2 upon Aralar1 knockdown are possible. To address this, we have included new metabolomics data in the revised manuscript (added as Supplementary Figure 1), which provides additional support that downregulation of Aralar1, even if not complete, is sufficient to cause a metabolic change reflected by a reduced aspartate/glutamate ratio in these cells. This functional change supports that the knockdown of Aralar1 alone is sufficient to study its role in brown adipocytes, although minor compensation by Citrin/AGC2 cannot be entirely excluded.
To address this explicitly, we have added a paragraph to the discussion (page 13, 2nd paragraph) highlighting the potential for partial compensation by Citrin/AGC2 and explaining why the observed metabolic effects are still attributable to Aralar 1 knockdown, as follows:
“Phenotypes observed in Aralar 1 KD cells closely resemble those in Ogc KD cells, particularly in terms of lipid metabolism alterations and energy expenditure. The main difference lies in mitochondrial morphology, which is altered in Ogc KD cells but remains unchanged in Aralar 1-silenced cells (Fig. 2J,M). Unlike Ogc, which lacks an alternative isoform, Aralar 1 has a paralog Aralar 2 (Citrin, or SLC25A13) that may partially compensate for its loss. This potential compensation might explain the preservation of mitochondrial morphology in Aralar 1 KD cells. Nonetheless, our metabolomics data demonstrate that downregulation of Aralar 1 alone significantly reduces the aspartate/glutamate ratio (Fig. S1D-F). Since this ratio reflects glutamate catabolism, its decrease indicates impaired malate-aspartate shuttle activity and reduced glutamate catabolism. Therefore, although compensation by Aralar 2 cannot be entirely excluded, Aralar 1 KD alone suffices to cause substantial impairment of malate-aspartate shuttle function”.
__ OGC and Aralar/AGC1 silencing is associated with the accumulation of smaller lipid droplets and impaired norepinephrine-induced lipolysis, but no mechanistical evidence is provided. The authors discuss a role for AMPK signaling associated with the redox unbalance generated by MAS disfunction but neither of them is proven.__
Answer 4) We thank the reviewer for this insightful question, which was also raised by Reviewer 1 (see Reviewer 1, Question 1 above). Here, we aim to clarify the mechanistic basis by which MASh may regulate lipolysis in BAT in a complementary and refined manner.
Our new data directly addresses this issue by examining cytosolic redox status through the lactate/pyruvate ratio, a well-established indicator of NAD⁺/NADH balance. Under basal conditions, Aralar 1 KD cells showed no change in this ratio compared to controls, indicating preserved cytosolic NAD⁺ regeneration despite reduced MASh activity. This observation is consistent with previous studies demonstrating the resilience of cellular redox homeostasis through overlapping NAD⁺-regenerating systems (PMID: 40540398; PMID: 37647199). The new results are shown in Supplementary Figure 1.
At the same time, we detected a marked decrease in the aspartate/glutamate ratio in Aralar 1 KD cells, confirming impaired MASh function and reduced amino acid exchange between cytosol and mitochondria. The lack of redox imbalance likely reflects compensatory mechanisms, most notably the GPSh, which is highly active in brown adipocytes. Supporting this view, Aralar 1 KD cells displayed significantly reduced glycerol release upon norepinephrine stimulation (Fig. 4I), suggesting enhanced metabolic cycling of G3P through mitochondrial and cytosolic G3PDH, thereby sustaining NAD⁺ regeneration and redox equilibrium.
We therefore propose that, although MASh normally facilitates NADH export and aspartate/glutamate exchange, its loss activates GPSh-mediated compensation that preserves cytosolic NAD⁺/NADH balance and maintains lipolytic flux during adrenergic stimulation. These findings refine our mechanistic understanding of how redox shuttle interplay supports glycolytic and lipolytic processes in BAT. Future studies employing NAD⁺/NADH sensors and simultaneous blockade of both shuttles will be essential to dissect these compensatory mechanisms in greater detail.
Minor points;
__ In figure 4, only data from Aralar KD cells in relation to norepinephrine-stimulated lipolysis are shown. What happens when OGC is silenced? __
Answer 2) This is a very interesting and relevant question. We did not perform the norepinephrine-stimulated lipolysis experiments in Ogc-silenced cells, since in most of the other experiments presented in the manuscript Ogc and Aralar 1 silencing converged to very similar, if not identical, phenotypes. Based on these consistent overlaps, we anticipate that Ogc KD would likely lead to comparable effects on lipolysis as observed in Aralar 1 KD cells. Nonetheless, we fully agree that direct assessment of lipolysis upon Ogc KD would strengthen this conclusion, and we consider this an important aspect for future studies.
__ Nomenclature used for mitochondrial carriers is confusing. Please do not use OGC1 as there is only one isoform. Furthermore, different names for OGC are used in the manuscript; oxoglutarate carrier, malate-ketoglutarate carrier or OGC1/SLC25A11. In the case of citrin/AGC2, Aralar2 is used and is a uncommon designation.__
Answer 3) We corrected all OGC naming in the revised manuscript. We also changed “aralar 2” for “citrin” since this was more commonly used in the literature.
__ Some panels of figures 3 and 4 should be improved. Panels 3J, 3L and 4G are difficult to see. In panel 3J please clarify UT line from untreated/NE, are they not transduced? No equivalents conditions are assayed in Aralar KD and OGC KO cells.__
Answer 4) We thank the reviewer for giving us the opportunity to improve this figure and apologize for the confusing labeling. In the revised version, we have clarified the labels in panels 3J, 3L, and 4G to improve visibility, and we have added descriptions of all abbreviations to the figure legends, accordingly.
Author response:
The following is the authors’ response to the original reviews.
Reviewer #1 (Public review):
The manuscript by Bru et al. focuses on the role of vacuoles as a phosphate buffering system for yeast cells. The authors describe here the crosstalk between the vacuole and the cytosol using a combination of in vitro analyses of vacuoles and in vivo assays. They show that the luminal polyphosphatases of the vacuole can hydrolyse polyphosphates to generate inorganic phosphate, yet they are inhibited by high
concentrations. This balances the synthesis of polyphosphates against the inorganic phosphate pool. Their data further show that the Pho91 transporter provides a valve for the cytosol as it gets activated by a decline in inositol pyrophosphate levels. The authors thus demonstrate how the vacuole functions as a phosphate buffering system to maintain a constant cytosolic inorganic phosphate pool.
This is a very consistent and well-written manuscript with a number of convincing experiments, where the authors use isolated vacuoles and cellular read-out systems to demonstrate the interplay of polyphosphate synthesis, hydrolysis, and release. The beauty of this system the authors present is the clear correlation between product inhibition and the role of Pho91 as a valve to release Pi to the cytosol to replenish the cytosolic pool. I find the paper overall an excellent fit and only have a few issues, including:
(1) Figure 3: The authors use in their assays 1 mM ZnCl2 or 1mM MgCl2. Is this concentration in the range of the vacuolar luminal ion concentration? Did they also test the effect of Ca2+, as this ion is also highly concentrated in the lumen?
The concentrations inside vacuoles reach those values. However, given that polyP can chelate divalent metal ions, what would matter are the concentrations of free Zn<sup>2+</sup> or Mg<sup>2+</sup> inside the organelle. These are not known. This is not critical since we use those two conditions only as a convenient tool to differentiate Ppn1 and Ppn2 activity in vitro. In our initial characterisation of Ppn2 (10.1242/jcs.201061), we had also tested Mn, Co, Ca, Ni, Cu. Only Zn and Co supported activity. Ca did not. Andreeva et al. (10.1016/j.biochi.2019.06.001) reached similar conclusions and extended our results.
(2) Regarding the concentration of 30 mM K-PI, did the authors also use higher and lower concentrations? I agree that there is inhibition by 30 mM, but they cannot derive conclusions on the luminal concentration if they use just one in their assay. A titration is necessary here.
The concentration of 30 mM was not chosen arbitrarily. It is the luminal P<sup>i</sup> concentration that the vacuoles reached through polyP synthesis and hydrolysis when they entered a plateau of luminal P<sup>i</sup>. We consider this as an upper limit because polyP kept increasing which luminal P<sup>i</sup> did not. Thus, there is no physiological motivation for trying higher values. We have nevertheless added a titration to the revised version (new Fig. 3A).
(3) What are the consequences on vacuole morphology if the cells lack Pho91?
We had not observed significant abnormalities during a screen of the genome-wide deletion collection of yeast (10.1371/journal.pone.0054160), nor in other experiments with pho91 mutants, which we have not included in this manuscript due to a lack of effect.
(4) Discussion: The authors do not refer to the effect of calcium, even though I would expect that the levels of the counterion should affect the phosphate metabolism. I would appreciate it if they would extend their discussion accordingly.
The situation is much more complex because Ca2+ is not the only counterion. Major pools of counterions (up to hundreds of mM) are constituted by vacuolar lysine, arginine, polyamines, Mg, Zn etc. Their interplay with polyP is probably complex and worth to be treated in a dedicated project. If we wanted to limit the discussion of this complexity not to the simple statement that it is not understood, which is not very useful, we would have to engage in a lot of speculation. We feel that this would make the discussion lose focus and not contribute concrete insights.
(5) I would appreciate a brief discussion on how phosphate sensing and control are done in human cells. Do they use a similar lysosomal buffer system?
Mammalian cells have their Pi exporter XPR1 mainly on a lysosome-like compartment (10.1016/j.celrep.2024.114316). Whether and how it functions there for Pi export from the cytosol is not entirely clear. We have addressed this situation in the revised discussion section.
Reviewer #2 (Public review):
Summary:
This manuscript presents a well-conceived and concise study that significantly advances our understanding of polyphosphate (polyP) metabolism and its role in cytosolic phosphate (Pi) homeostasis in a model unicellular eukaryote. The authors provide evidence that yeast vacuoles function as dynamic regulatory buffers for Pi homeostasis, integrating polyP synthesis, storage, and hydrolysis in response to cellular metabolic demands. The work is methodologically sound and offers valuable insights into the conserved mechanisms of phosphate regulation across eukaryotes.
Strengths:
The results demonstrate that the vacuolar transporter chaperone (VTC) complex, in conjunction with luminal polyphosphatases (Ppn1/Ppn2) and the Pi exporter Pho91, establishes a finely tuned feedback system that balances cytosolic Pi levels. Under Pi-replete conditions, inositol pyrophosphates (InsPPs) promote polyP synthesis and storage while inhibiting polyP hydrolysis, leading to vacuolar Pi accumulation.
Conversely, Pi scarcity triggers InsPP depletion, activating Pho91-mediated Pi export and polyP mobilization to sustain cytosolic phosphate levels. This regulatory circuit ensures metabolic flexibility, particularly during critical processes such as glycolysis, nucleotide synthesis, and cell cycle progression, where phosphate demand fluctuates dramatically.
From my viewpoint, one of the most important findings is the demonstration that vacuoles act as a rapidly accessible Pi reservoir, capable of switching between storage (as polyP) and release (as free Pi) in response to metabolic cues. The energetic cost of polyP synthesis-driven by ATP and the vacuolar proton gradient-highlights the evolutionary importance of this buffering system. The study also draws parallels between yeast vacuoles and acidocalcisomes in other eukaryotes, such as Trypanosoma and Chlamydomonas, suggesting a conserved role for these organelles in phosphate homeostasis.
Weaknesses:
While the manuscript is highly insightful, referring to yeast vacuoles as "acidocalcisome-like" may warrant further discussion. Canonical acidocalcisomes are structurally and chemically distinct (e.g., electrondense, in most cases spherical, and not routinely subjected to morphological changes, and enriched with specific ions), whereas yeast vacuoles have well-established roles beyond phosphate storage. A comment on this terminology could strengthen the comparative analysis and avoid potential confusion in the field.
Yeast vacuoles show all major chemical features of acidocalcisomes. They are acidified, contain high concentrations of Ca, polyP (which make them electron-dense, too), other divalent ions, such as Mg, Zn, Mn etc, and high concentrations of basic amino acids. Thus, they clearly have an acidocalcisome-like character. In addition, they have hydrolytic, lysosomelike functions and, depending on the strain background, they can be larger than acidocalcisomes described e.g. in protists. We have elaborated on this point in the introduction of the revised version.
Reviewer #3 (Public review):
Bru et al. investigated how inorganic phosphate (Pi) is buffered in cells using S. cerevisiae as a model. Pi is stored in cells in the form of polyphosphates in acidocalcisomes. In S. cerevisiae, the vacuole, which is the yeast lysosome, also fulfills the function of Pi storage organelle. Therefore, yeast is an ideal system to study Pi storage and mobilization.
They can recapitulate in their previously established system, using isolated yeast vacuoles, findings from their own and other groups. They integrate the available data and propose a working model of feedback loops to control the level of Pi on the cellular level.
This is a solid study, in which the biological significance of their findings is not entirely clear. The data analysis and statistical significance need to be improved and included, respectively. The manuscript would have benefited from rigorously testing the model, which would also have increased the impact of the study.
It is not clear to us what the reviewer would see as a more rigorous test of the model.
Reviewer #1 (Recommendations for the authors):
(1) Figure 2: Why do the authors label the blue curve in A and B as BY and in C and D as WT? Is this a different genetic background they used here? This should be specified in the legend.
No, it is the same background. The figures had been reshuffled before submission and we overlooked to replace "BY" by "WT". This has been corrected. Now we consistently use WT in all figures
(2) Figure 4 has different scaling for the two panels, which should be labeled as A and B. I am aware that the authors do this for comparison, but it is rather confusing at first glance. I recommend having them at the same scale.
We chose this representation on two separate scales because this figure shall primarily illustrate that the shift between pho91 and WT curves vanishes in the presence of IP7. We now highlight in the figure legend that the scales are different to avoid confusion.
(3) Figure 8: I would appreciate a model with normal and low Pi concentrations in comparison, as this is what the authors worked out.
We have modified the figure. It now compares Pi-rich and Pi-limited scenarios.
(4) Minor issue: Wouldn't it make more sense to show the molar concentration in the Figures rather than the nmol of Pi/ug of protein? I am aware that this would require information on the vacuole volume rather than the reaction volume, and the authors do this calculation later on.
It depends. We often chose this representation because it illustrates the price to pay (metabolic input in terms of protein that must be dedicated to this task) to sequester a certain quantity of P<sup>i</sup>. But, as we provide the corresponding P<sup>i</sup> concentration in the text, this information is accessible to the reader, too.
Reviewer #2 (Recommendations for the authors):
As stated above in the weaknesses section, while functional parallels exist, canonical acidocalcisomes are structurally and chemically distinct, typically smaller, electron-dense, and enriched with cations. Whereas yeast vacuoles are larger, multifunctional organelles with well-established roles beyond phosphate storage. Explicitly addressing these differences would strengthen the comparative framework and prevent potential confusion in interpreting the evolutionary relationships between these organelles.
We agree to some degree, which is the reason why we refer to vacuoles as acidocalcisome-like organelles. In fact, vacuoles share virtually all defining chemical traits of acidocalcisomes. They just have a second functional domain as hydrolytic, lysosome-like organelles. Given the plasticity of endo-lysosomal compartments, and acidocalcisomes belong to this group because of their biogenesis through the AP3 pathway, this is not shocking to us. But the reviewer's comment made us realize that it is better to explicitly address this point. We have added a section to the introduction to do this.
Reviewer #3 (Recommendations for the authors):
(1) Page 8: It is unclear why the authors only estimated the Pi concentration in wild-type vacuoles. This should also be done for vacuoles from other strains.
This information is inherent in Figure 2. PolyP hyperaccumulating strains show the same plateau as the wildtype, meaning that they also reach around 30 mM luminal Pi concentration, whereas vtc4 vacuoles reach only around 1/10th of that increase, indicating that they remain at 3 mM. We mention this now in the text.
(2) The attempts of the localization of Pho91 through tagging are not satisfactory. The author described different localizations for Pho91 depending on whether it was tagged on the N- or C-terminus or when Nterminally tagged and overexpressed using two strong promoters. While it is not uncommon that proteins show different localization patterns, depending on where the tag is inserted, it is possible that one of the tags would reflect the localization of the endogenous protein. There is an easy way to test this, in particular when Pho91 is endogenously tagged. pho91∆ has reported phenotypes such as abnormal vacuolar morphology or increased autophagy. They could also measure PI content in vacuoles. The authors could compare the phenotypes of the endogenously tagged strains with WT and a pho91∆ strain.
Indeed, the attempts to localise the protein through fluorescent tags are unsatisfactory, in our hands as in the hands of others. We would not have created a series of many different tagged versions (we present only a selection of these in the manuscript) if the creation of a faithful reporter for Pho91 localisation were so straightforward. Expression from the endogenous promoter yields quite low signals (which is why others have overexpressed their GFP fusion from strong promotors). But overexpression brings at least a significant part of the protein to the cell surface, where it can then function as Pi importer and suffice to restore much of the maximal Pi uptake capacity that genuine plasma membrane transporters provide and support normal growth of the cells (Wykoff & O’Shea, 2001). But the localisation pattern of Pho91-GFP, likewise overexpressed from a strong promotor, does not reflect this plasma membrane localisation (see the references that the reviewer mentioned under (3)). The published overexpressed GFP-fusions localise only to the vacuole, suggesting that even in this case the GFP tag may create an artefact. Therefore, we went through a large variety of Pho91 gene fusions, which led us to the conclusion that the protein is very sensitive to tags at both ends and that fusion proteins hence are unlikely to reliably report the correct location of the protein. Given this, we resorted to quantitative proteomics to clarify the issue. This quantitative experiment goes beyond previously published proteomics analyses that the reviewer mentions under (3), which found the protein in the vacuolar fraction but did not calculate the enrichment factors, which is crucial.
A strong phenotype of abnormal vacuolar morphology is not apparent in our cultures.
(3) Moreover, Pho91 has been identified as a component enriched in vacuolar-mitochondria contact sites (vCLAMP), and this localization was confirmed with GFP-Pho91 (PMID: 25026036). Likewise, PMID: 35175277 also detected Pho91 by mass spectrometry as a vacuolar protein and showed endogenously tagged GFP-Pho91 on the vacuole (co-staining with Vph1). The authors may request the strains from the authors of these papers and use them for their experiments. PMID: 17804816, the oldest of the three reports (from 2007) reports a GFP-Pho91 under either TEF or ADH promoter that localizes to the vacuole. They also showed that the fusion protein is functional. These and other experiments led them to conclude that Pho91 exports phosphate from the vacuolar lumen to the cytoplasma.
We have now included these references. As argued above, we have analysed also the strains from PMID17804816. The observed clear localisation of the fusion protein to vacuoles is only visible upon overexpression, not upon expression from the endogenous locus. Apparently also this construct is unlikely to report Pho91 localisation reliably (though, by chance, overexpression leads it to the correct location). Thus, we maintain our conclusion that C- or N-terminally GFP-tagged versions of Pho91 are unreliable tools for localising the protein.
(4) The impact of pho91∆ on Pho4-GFP nuclear localization is modest at best (increase from 5% of cells showing Pho4-GFP in the nucleus in WT vs 10% in pho91∆), and only somewhat stronger in ppn1∆/ppn2∆. This means 90% of pho91∆ cells do not respond, and Pho4-GFP stays cytoplasmic. It is unclear how the author can derive a meaningful conclusion from these data. Moreover, are these data really supporting the model, or do these data rather indicate that there are additional factors/pathways needed? What is the biological significance of the marginal increase from 5% to 10% of cells that would respond? What happens to the cells that cannot respond? Will they die or at least have a growth disadvantage? It would be useful to provide some functional studies.
We should have explained the nature of the assay better. The experiment exploits the fact that dividing yeast cells transiently fall into a state of Pi scarcity during S-phase. Since S-phase is less than a quarter of the cell cycle, only a small fraction of the cells transiently activates the PHO pathway. These cannot be well characterised by ensemble assays, but microscopy circumvents this background of the whole population and picks them up very clearly, allowing to quantify them. We have adapted the respective chapter in the results section to improve the description of this experiment.
(5) The quantification of the data is suboptimal, as in most assays the mean and standard error of the mean (SEM) are given. SEM is not really appropriate in these cases because it gives only the error of the mean and not of the entire data. Therefore, the standard deviation (SD) is needed, which reports on the variability of the data, and which is usually much larger than the SEM. Using the SD, would also allow the authors to do proper statistical analysis, which is missing entirely in this manuscript.
SEM also comprises the variability of the data. It is linked with the SD (SEM=SD/SQRT(n)), but SEM also considers the number of the experiments n. The main goal is to compare the means, and SEM is an appropriate and frequently used tool for this because it illustrates how well the arithmetic mean may estimate the true mean of the population. Therefore, we kept the SEM but have added tests of significance for the differences shown.
(6) Statistical testing in Figure 7 is essential as the effects are very small. Again, are these changes big enough for a biologically meaningful response? The authors should at least discuss this.
Our previous time course analyses of InsPP dynamics, performed under comparable conditions as in this study, showed that InsP8 decreases by around 50% in the first 30 min after transfer to Pi starvation (DOI: https://doi.org/10.7554/eLife.87956) and that this decline is already sufficient to trigger the PHO starvation program, as assessed by Pho4-GFP translocation into the nucleus. Thus, a 50% decrease, which is observed in ppn1 ppn2 mutants, is functionally significant. We have now also evaluated statistical significance in Fig. 7, which is given for the 50% reduction of InsP8 and 1-InsP7 in ppn1 ppn2.
Minor points:
(1) There are a number of smaller edits (use of italic or better the absence thereof, lacking information in the reference list, and some typos).
Thank you. We have corrected those.
(2) The exact n should be given in the Figure legend.
Corrected.
(3) Page 8, line 8: it would be nice to have a picture of the wild-type vacuoles and what you measured.
We now present a sample image in the new Suppl. Fig. 1.
(4) PMID: 11779791 showed already that Pho91 cannot rescue the absence of the plasma membrane Pi transporters. This study should be at least cited.
This is not quite correct. The study that the reviewer mentions showed that Pho91 supports slower growth and the authors concluded that "A synthetic lethal phenotype was observed when (all) five phosphate transporters were inactivated...". We had cited the same group and the same first author, just using their later study (Wykoff et al., 2007) that had recapitulated the results from PMID11779791 and showed in addition quite good growth of the PHO91 expressing strain on YPD (Suppl. Fig. 2). We had obtained the strains from this group. In reproducing their experiments, we noticed that the growth of Pho91 that these authors had observed is due to incomplete repression of Pho84. They had overexpressed Pho84 from a galactose inducible promotor to generate a background with a regulatable Pi transporter. This trick allowed them to conveniently manipulate the strain and reduce (but not abolish) Pho84 expression by transferring the cells from galactose to glucose for their experiments. Therefore, we chose a more rigorous plasmid shuffling strategy to test the individual P<sub>i</sub> transporter, which allows an assessment without the leaky background expression of Pho84 on glucose. In contrast to O'Shea and colleagues, we observed zero growth of a strain expressing only PHO91. We have revised the results section to make this discrepancy more evident and provide a better motivation for our experiment.
(5) It would be nice to see the actual data in Figure 6; not only a quantification.
We illustrate the phenotype of nuclear Pho4-GFP in panel A. Showing all the images necessary to appreciate the differences between the strains would require including many dozens of images into the figure, which would not be useful.
♒/ℹ️/=/🗺️/MEMEplEX/Map/index.html
Saving indy0pad created html with hypothesys embed.js script preloaded
Just download the html file
add the script tag embed.js
``` html
<script src="https://hypothes.is/embed.js" async></script>```
http://bafybeigcrsxbwkpxjgdjyhjsl675hejqzn5swdg7xktlw5w47fa6jkkc74.ipfs.dweb.link/?filename=hyperpost%3D%F0%9F%97%BA%EF%B8%8FMEMEplEX.Map.html
Note: This response was posted by the corresponding author to Review Commons. The content has not been altered except for formatting.
Learn more at Review Commons
Overall Response.
We would like to thank the reviewers for their analysis of the manuscript. From their comments it is clear that our manuscript was not. We completely rewrote the manuscript to focus on the central core question which was how does Adam13 regulates gene expression in general and TFap2a in particular leading to the expression of Calpain8 a protein required for CNC migration.
The following model will be the central line of our story. It will address all of the proteins involved and mechanistical evidences that link Adam13 to one of its proven effector target Calpain8.
- *
*Reviewer #1 (Evidence, reproducibility and clarity (Required)): **
In this manuscript, Pandey et al. show that the ADAM13 protein modulates histone modifications in cranical neural crest and that the Arid3a protein binds the Tfap2a promoter in an Adam13-dependent manner and has promoter-specific effects on transcription. Furthermore, they show that the Adam13 and human ADAM9 proteins associated with histone modifiers as well as proteins involved in RNA splicing. Although the manuscript is mostly clearly written and the figures well assembled, it reads like a couple of separate and unfinished stories.*
I believe that our story line was not clear and that the overarching questions was not well stated. We have made every effort to change this in the revised manuscript. I would like to include a figure that explains the story.
In short:
1 We knew that Adam13 could regulate gene expression in CNC via its cytoplasmic domain.
2 We also knew that this required Adam13 interaction with Arid3a and that a direct target with the transcription factor TFAP2a which in turn regulates functional targets that we had identified including the protocadherin PCNS and the protease Calpain8.
Our goal was to understand the mechanism allowing Adam13 to regulate gene expression.
3 This first part of this manuscript shows how Adam13 modulates Histone modification in vivo in the CNC globally as well as specifically on the Tfap2a promoter. This results I an Open chromatin.
4 Using Chip we show that Adam13 and Arid3a both bind to the Tfap2a promoter and that Arid3a binding to the first ATG depends on Adam13.
5 Using Luciferase reporter we show that both Adam13 and Arid3a can induce expression at the first ATG.
*They show using immunocytochemistry and qPCR that ADAM13 knockouts in CNCs afffects histone modifications. Here ChIP-seq or Cut-n-Run experiments would be more appropriate and would result in a more comprehensive understanding of the changes mediated. *
I agree but we did not have the fund and now I have nobody working in the lab to do this experiment. These are also likely to overlap with the RNAseq data that we have and would simply add more open leads. We selected to go after the only direct target that we know which is TFAP2a and focus on this gene to understand the mechanism.
We believe that the Chip PCR experiment are sufficient for this story.
*The immunohistochemistry assays should at least be verified further using western blotting or other more quantiative methods. *
Immunofluorescence and statistical analysis is a valid quantification method. Western blot of CNC explants is not trivial and requires a large amount of material. Given the small overall change we also would not expect to be able to detect the change over the noise of western blot. The Chip PCR confirms our finding in a completely independent manner.
*The authors then show that ADAM13 interacts with a number of histone modifiers such as KDM3B, KDM4B and KMT2A but strangely they do not follow up this interesting observation to map the interactions further (apart from a co-ip with KMT2A), the domains involved, the functional role of the interactions or how they mediate the changes in chromatin modifications. *
We selected KMT2a because it is expressed in the Hek293T cells. KMT2D has been shown to regulate CNC development in Xenopus and is responsible for the Kabuki syndrome in human. We used aphafold to predict interaction and found that Adam13 interact with the Set domain. In addition we see multiple Set- containing domain protein in our mass spec data. The mass spec is done on Human hek293T cells that express a subset of KMT proteins. We now include evidence that Adam13 interact with the KMT2D SET domain (new figure 5D)
The authors then show that ADAM13 affects expression of the TFAP2a gene in a promoter specific manner - affecting expression from S1 but not S2.
It is the S1 but not S3. Adam13 has no effect on S2.
- They further show that ADAM13 affects the binding of the Arid3 transcription fator to the S1-promoter but not to the S3 promoter. However, ADAM13 was present at both promoters. Absence of ADAM13 resulted in increased H3K9me2/3 and decreased H3K4me3 at the S1 promoter whereas only H3K4me3 was changed at the S2 promoter*
S3 not S2*. Unfortunately, they do not show how this is mediated or through which binding elements this takes place. Why is ADAM13 present at both promoters but only affects Arid3 binding at S1? *
We agree this is a very interesting question that could be the subject of an entire publication. Promoter deletion and mutation to identify which site are bound by and modulated by Adam13/Arid3a is not trivial.
*The authors claim that transfecting Arid3a and Adam13 together further increases expression from a reporter (Fig 4E) but this is not true as no statistical comparison is done between the singly transfected and double transfected cells. *
This is correct, there is a small increase that is not significant with both. The fact that both proteins can induce the promoter suggest but does not prove that they can have additive roles. The loss of function experiment shows that the human Arid3a expressed in Hek293T cells is important for Adam13 increases of S1. It is possible that the dose of the endogenous Arid3a is sufficient to get full activity of Adam13.* Then the authors surprisingly start investigating association of proteins with the two isoforms of TFAP2a which in the mind of this reviewer is a different question entirely. *
We agree and have removed this part of the manuscript.
*They find a number of proteins involved in splicing. And the observation that ADAM13 also interacts with splicing factors is really irrelevant in terms of the story that they are trying to tell. Transcription regulation and splicing are different processes and although both affect the final outcome, mRNA, they need to be investigated separately. The link is at least not very clear from the manuscript. Again, the effects on splicing are not further investigated through functional analysis and as presented the data presented is too open-ended and lacking in clarity. *
We agree that beside the different activities of the TFap2a isoform, the rest of the splicing regulation could be a separate study. We were interested to understand how these two isoforms could activate Calpain8 so differently this is why we looked at LC/MS/MS. We have removed this part of the story from the manuscript.*
Additional points: 1. In the abstract they propose that the ADAMs may act as extracellular sensors. This is not substantiated by the results. *
As an extracellular protein translocating into the nucleus it is a possibility that we propose, but I agree this is not investigated in this manuscript. We will modify the text.* 2. Page 5, line 16: what is referred to by 6 samples 897 proteins? Were 6 samples analyzed for each condition? The number of repeats for the mass spec analysis is not clear from the text nor are the statistical parameters used to analyse the data. This is also true for the mass spec presented in the part on TFAP2aL-S1 and Adam13 regulate splicing. Statistics and repeats are not presented. *
In general we provide biological triplicate and use the statistical function of Scaffold to identify proteins that are significantly enriched or absent in each samples.
When we specify 6 samples it means 6 independent proteins samples were analyzed and used for our statistic. We use Scafold T-test with a p value less than 0.05. Peptides were identified with 95% confidence and proteins with 99% confidence.* 3. Page 6, line 19: set domain should be SET domain. *
Yes* 4. The number of repeats in the RNA sequencing of the CNCs is not clear from the text. *
Three biological replicates (Different batch of embryos from different females).* 5. The explanation of Figure C is a bit lacking. There are two forms of TFAP2a, L and S, but only one is presented in the figure. Do both forms have the extra S1-3 exons? Also, at the top of the figure it is not clear that the boxes are part of a continuous DNA sequence. Also, it is not clear which codon is not coding. *
Xenopus laevis are pseudo tetraploid giving in most cases L and S genes in addition to the 2 alleles from being diploid. The TFAP2a gene structure is conserved between both aloalleles and is similar to the human gene. For promoter analysis and Chip PCR we chose one of the alloallele (L), given that the RNAseq data showed that both genes and variant behave the same in response to Adam13. This only becomes important in loss of function experiment in which both L and S version need to be knock down or Knock out.
* In the sashimi plot there are green and pink shaded areas. What do they denote? What exactly is lacking in the MO13 mutant - seems that a particular exon is missing suggesting skipping?*
MO13 is a morpholino that bocks the translation of Adam13 (Already characterized with >90% of the protein absent) but does not affect Adam13 mRNA expression.* 7. Page 11, line 9: „with either MbC or MbC and MO13" needs to be rephrased. *
Will do *8. Page 11, line 19: „the c-terminus of....and S3) and" should be „the C-terminus of...and S3 and". ** 9. Page 15, line 10: substrateS 10. Page 16, line 23: the sentence „increases H3K9 to the promoter of the most upstream" needs revision. 11. Page 26, line 12: Here the authors say: „for two samples two-tail unpaired". What does this mean? Statistics should not be performed on fewer than three samples. In legnd to Figure 6 it indicates that T-test was performed on two samples. 12. The discussion should be shortened and simplified. 13. Figure 1 legend. How many images were quantitated for each condition? *
At least 3 images per condition. For 3 independent experiments. (9 images per condition).* 14. Figure 2 has a strange order of panels where G is below B. 15. Figure 6 legend, line 12. „proteins that were significantly enriched in either of the 2 samples" is not very clear. What exactly does this mean?
Reviewer #1 (Significance (Required)):
If the authors follow up on either the transcription-part of the story, or the splicing part of the story, they are likely to have important results to present. However, in the present format the paper is lacking in focus as both issues are mixed together without a clear end-result. *
We have entirely changed the paper according to these comments.
*
- *
*Reviewer #2 (Evidence, reproducibility and clarity (Required)): **
Panday et al seeks to determine the function of ADAM13 in regulating histone modifications, gene expression and splicing during cranial neural crest development. Specifically, the authors tested how Adam13, a metalloprotease, could modify chromatin by interaction with Arid3a and Tfap2a and RNA splicing and gene expression. They then utilize knockouts in Xenopus and HEK293T cells followed by immunofluorescence, IPs, BioID, luciferase assays, Mass spec and RNA assays. Although there is some strong data in the BioID and luciferase experiments, the manuscript tells multiple stories, linking together too many things to make a compelling story. The result is a paper that is very difficult to read and understand the take home message. In addition, some of the conclusions are not supported by the data. This unfortunately means it is not ready for publication. However, I have added below some suggestions that would strengthen the manuscript. My comments are below: *
Clarity is clearly an issue here. The new version is entirely re-written.
Here is the take home message:
We knew that Adam13 could regulate gene expression via its cytoplasmic domain. One of the key targets was identified as Calpain8, a protein critical for CNC migration. We subsequently showed that Adam13 and Arid3a regulated Tfap2a expression which in turn regulated Calpain8.
In this manuscript we investigated 1) how Adam13 regulates TFAP2a and 2) how Tfap2a controls Calpain8 expression.
The take home message is that Adam13 bind to Histone methyl transferase and changes the histone methylation code overall in the CNC and in particular at the TFAP2a promoter. This results in more open chromatin. We further find that Adam13 binds to the Tfap2a promoter in vivo and is important for Arid3a binding to the first start. Tfap2a that include this N-terminus sequence regulates Capn8 expression.*
Major comments: 1. I think it would be better to split out the chromatin modification function from the splicing in two separate papers. While there is a connection, having it all together makes the story difficult to follow. *
Agree but I believe that the S1 vs S3 story of Tfap2a is important for the overall story. The new paper does not emphasize splicing.* 2. The immunofluorescence of H3K9me2/3, in Figure 1, 2, 3 following Adam13 knockdown is not convincing. There seems to be a strong edge effect especially in Figure 2 and 3. *
The statistical analysis shows that the results, while modest, are significant (Three independent experiments using 3 different females and 3 explants for each condition were analyzed). The edge effect observed is eliminated by the mask that we use that normalize the expression to either DAPI or Snai2. The edge effect is seen in both control and KD as well. These are further confirmed by the Chip PCR on one direct target.
Similarly the Arid3a expression in Supp Figure 1 if anything seems increased.
We have previously shown that Arid3a expression is not affected by Adam13 KD (Khedgikar et al). Our point here is simply that the difference in Tfap2a cannot be explained by a decrease in Arid3a expression. It is not a critical figure and was eliminated in the new manuscript.
*It would be better to quantify by western blot and not by fluorescent intensity since it is difficult to determine what a small change in fluorescent intensity means in vivo. *
Not all antibodies used here work by western blot and the quantity of material required for western blot is much larger than IF. Given the small overall changes and the variability observed in Western blot it is not a viable alternative.
IF is a quantitative method that has been used widely to assert increase or decrease of protein level or post translational modification. The fact that the same post translational modification that we see in cranial neural crest explants can also be seen by ChipPCR on the Tfap2a promoter confirm this observation.
*Also, it does not say in the text or the figure legend what these are, Xenopus explants of CNC? *
These are CNC explants. It is now clearly stated in the figure legend.* 3. The rationale for isolating KMT2A from the other chromatin modifiers in the dataset is not clear. *
The new manuscript is clarifying that point. Because we are using Hek293T cells in this assay, which are human embryonic kidney derived instead of Xenopus Cranial neural crest cells, we are not interested in a specific protein but rather a family of protein that can modify histones (KMT and KDM). Our rational is if Adam13 can bind to KMT2 via the SET domain, it is likely to interact with KTM2 that are expressed in the CNC. KMT2A and D are expressed in the CNC. This is why we selected KMT2a here (Hek293T). We now include 1 co-IP with the Set domain of Xenopus KMT2D (new figure 5D)
From the RNA-seq in Supp Figure 2 it is not changed as much as likely some of the others.
The new manuscript addresses this point. We did not show or expect that the loss of Adam13 would affect mRNA expression of Kmt2.
*Also, the arrow seems to indicate that it is right above the cutoff. What about other proteins with ATPase activity? That is the top hit in the Dot plot nuclear function. Would be helpful to write out Adam13 cytoplasm/nucleus here. *
We have used another set of proteomics data that does not include the cytoplasmic/nuclear extract to simplify the results. We hope that the changes make it more obvious.
Given that we are looking at Chromatin remodeling enzyme here we did not chose to investigate further in this report the ATPase. This is such a wide category that it could lead us away from the main story here.* 4. The splicing information, while interesting would be better as a different manuscript. The sashimi plot requires more explanation as written. *
We agree and think that a simple representation of the fold change of the different isoform is more obvious. It is now a minor part of figure 1 and the legend has been improved to describe the method here.
How do you tell if the interactions are changed from this?
I do not understand this question. The sashimi plot indicate the read through from the mRNA that goes from one exon to the next quantifying the specific exon usage. It can therefore be quantified and compared between different conditions.
- The authors argue there is a reduction of Tfap2a in Figure 3H but half the explant is not expressing sox9 in the Adam13 knockdown. How is this kind of experiment controlled when measure areas that don't have any fluorescence because of the nature of the explants? *
We have removed this figure as we had already shown previously by western blot that Tfap2a protein decreased in MO13 embryos. As noted on the histogram, the fluorescence is only measured in Sox9 positive cells in each explant. Three independent experiments with 3 explants for each. We also have seen a decrease by Western blot and mRNA expression (Both RNAseq and realtime PCR). In most of our explants, the vast majority of the cells are positive for Snai2 and Sox9, while those that are negative are positive for Sox3 (data not shown here). There is always less signal in the center of the explant possibly due to the penetration of antibody or interference with the signal by the cells pigment or yolk autofluorescence. Our control explants have the same effect so our quantification is valid.* 5. The use of a germ line Xenopus mutant for Adam13 is great but how were these knockouts validated? *
All of the KO were validated by sequencing, RNAseq and protein expression. These are now included in the supplemental figure 1.
*More information is required here. The Chip-qPCR has a lot of variability between the samples, especially in the H3K9me2/3. *
All ChipPCR were performed on Xenopus embryos. The variability is tested by statistical analysis and is either significant or not.
Because these are in cell lines, this should be more consistent.
They are not in cell lines but in Xenopus embryos.
- In addition, it is difficult to understand what this means for cranial neural crest cells when assaying in HEK293T cells with the luciferase assay. *
We use Luciferase assay in Hek293T cells to test if Xenopus protein can induce a specific reporter (Gain of function). We also use luciferase reporter in Xenopus to test if they can perceive the loss of a specific protein (For example Adam13).
Our result show that Adam13 or Arid3a expression in Hek293T cells can induce the TFAP2S1 reporter. * 6. The migration assay shows only an example of what it looks like to have defective migration. But it would be better to show control embryos, embryos with Adam13 knockdown and what the rescues look like so the reader can make their own conclusion.*
We can certainly include this but have published this assay in multiple publication before. The picture is a single example, the histogram shows that statistical validation.
- The argument from the section above suggests the S1 isoform is the primary one but S3 in this assay also rescues, please explain what this result means since it seems to suggest that even though these isoforms have different activity the function is similar in terms of the ability to rescue defective migration. *
The result in Hek293T cells shows that only TFAP2aS1 can induce Calpain8, while both S1 and S3 can partially rescue CNC migration in embryos lacking Adam13. The issue here is the dose of mRNA injected for each variant might be too high. Adam13 proteolytic activity is also critical, so we do not expect a complete rescue. The fact that S1 is significantly better at rescuing than S3 is relevant here. It is possible that if we were to decrease the dose of each mRNA we would find one in which S3 no longer rescues but S1 does.
* The next section again talks about yet another protein Calpain-8. Here the authors use MO13 for luciferase assays instead of HEK293 cells. The authors do not explain why they decided to switch from cells to MO.*
Calpain8 is one of the validate target of Adam13 that can rescue CNC migration (Cousin et al Dev Cell). We use the luciferase reporter corresponding to the Xenopus Capn8 reporter to show 1 in vivo that loss of Adam13 reduce its expression (Similar to the Capn8 gene). We then went in vitro using Hek293T cells for gain of function experiment that shows that only the Tfaps2S1 variant can induce it while S3 does not.
We hope that the graphical summary and the new manuscript make this clear.* 8. The experiment to IP RNA supports only the correlation that Adam9 and Adam13 bind RNA and RNA binding proteins to regulate splicing. This conclusion presented is not supported by the data presented here. While there is a sentence about why Adam9 was chosen here, it would be preferred to focus on Adam13 as the rest of the manuscript is focused on Adam13. The conclusions are generalized to all ADAMs, but ADAM13 and ADAM9 are the only ADAMs investigated in the manuscript *
This figure is no longer included. For each of the protein classes that we identify by Masspec we try to find a validation. RNA-IP is simply a validation that Adam13 and Adam9 can bind to complexes that include RNA in a cytoplasmic domain dependent fashion. The conclusion that Adam13 and possibly ADAM9 might be involved in regulating splicing is 1) that the protein associated with Adam13 are include multiple splicing factors, 2) that the RNAseq analysis shows abnormal splicing in CNC missing Adam13 and 3) that the form of TFAP2a induced by Adam13 (S1) associate significantly more with splicing factor than the S3 isoform.
We agree that the generalization to other ADAM is not demonstrated here but only suggested. We selected ADAM9 and ADAM19 because we have shown that they can each rescue Adam13 function in the CNC. Unfortunately there are no ADAM19 antibody that work by IP on the market. We have tested multiple company and multiple cell lines.
We believe that the ADAM9 experiment is critical to show that the protein associated with Adam13 are not simply the result of overexpressing a different species protein sin ADAM9 is the endogenous protein.*
Minor comments 1. The manuscript using a lot of abbreviations (PCNS, NI, MO, SH3) and lingo that are unclear to a general reader. Please define acronyms when first used, as well as be clear on which model is being used in each experiment. *
We have corrected this* 2. Similarly, the figures are not labeled such that a reader would be able to understand ie MO13 should be Adam13 knockdown etc. *
We have corrected this in the legend
- Please identify the genes on the heatmap and some highlighted genes from volcano plot from the RNA-seq.*
The volcano plot is from MS/MS not RNAseq. We have list of all of the genes and/or proteins corresponding to each figure in tables
We now have a figure from the RNAseq and a subset of genes of interest are show. *4. Why use the flag tag in Figure 5? *
We used Flag-tagged construct to only immunoprecipitated the variants and not the endogenous TFPA2a in these experiments. Also we used RFP-Flag to eliminate any protein that bound to the tag or the antibody.
This figure is no longer in the manuscript.* 5. Is the data in figure 4A-D the same as Supp. Figure 4A-D? *
These are independent biological replicates of the same experiment.* 6. Please italicize gene symbols - e.g. "key transcription factors that exemplify CNC, such as the SOX9, FOXD3, SNAI1, SNAI2, and TFAP2 family". *
We clearly have missed some, we are using italicized for gene, and regular for proteins. It might not be clear in the text when we are referring to genes and proteins. We will correct this in the rewrite. 7. Please review the manuscript for grammatical and typographical errors. * We have used all available software including Word and Grammarly. We will try to improve on the next version. **Cross-commenting**
I think the two reviewers on one the same page on this manuscript.
Reviewer #2 (Significance (Required)):
If more solid, would be a conceptual advance in role of Adam13 in mediating chromatin modification and transcription factors, adds to exiting work from this lab, good for a specialize audience, my expertise is in in neural crest development, non-mammalian modes, epigenetic regulators.*
- *
Note: This preprint has been reviewed by subject experts for Review Commons. Content has not been altered except for formatting.
Learn more at Review Commons
Panday et al seeks to determine the function of ADAM13 in regulating histone modifications, gene expression and splicing during cranial neural crest development. Specifically, the authors tested how Adam13, a metalloprotease, could modify chromatin by interaction with Arid3a and Tfap2a and RNA splicing and gene expression. They then utilize knockouts in Xenopus and HEK293T cells followed by immunofluorescence, IPs, BioID, luciferase assays, Mass spec and RNA assays. Although there is some strong data in the BioID and luciferase experiments, the manuscript tells multiple stories, linking together too many things to make a compelling story. The result is a paper that is very difficult to read and understand the take home message. In addition, some of the conclusions are not supported by the data. This unfortunately means it is not ready for publication. However, I have added below some suggestions that would strengthen the manuscript. My comments are below:
Major comments:
Minor comments
Cross-commenting
I think the two reviewers on one the same page on this manuscript.
If more solid, would be a conceptual advance in role of Adam13 in mediating chromatin modification and transcription factors, adds to exiting work from this lab, good for a specialize audience, my expertise is in in neural crest development, non-mammalian modes, epigenetic regulators
(エラー情報省略)
nitsですが、エラーの最後も提示したほうがよいように思いました。
Traceback (most recent call last):
File "<stdin>", line 1, in <module>
yaml.load('none: !!python/none null', Loader=yaml.SafeLoader)
~~~~~~~~~^^^^^^^^^^^^^^^^^^^^^^^^^^^^^^^^^^^^^^^^^^^^^^^^^^^^
(エラー情報省略)
yaml.constructor.ConstructorError: could not determine a constructor for the tag 'tag:yaml.org,2002:python/none'
in "<unicode string>", line 1, column 7:
none: !!python/none null
Author response:
The following is the authors’ response to the original reviews.
Reviewer #1 (Public review):
Overall, the conclusions of the paper are mostly supported by the data but may be overstated in some cases, and some details are also missing or not easily recognizable within the figures. The provision of additional information and analyses would be valuable to the reader and may even benefit the authors' interpretation of the data.
We thank the reviewer for the thoughtful and constructive feedback. We are pleased that the reviewer found the overall conclusions of our paper to be well supported by the data, and we appreciate the suggestions for improving figure clarity and interpretive accuracy. Below, we address each point with corresponding revisions.
The conclusion that DREADD expression gradually decreases after 1.5-2 years is only based on a select few of the subjects assessed; in Figure 2, it appears that only 3 hM4Di cases and 2 hM3Dq cases are assessed after the 2-year timepoint. The observed decline appears consistent within the hM4Di cases, but not for the hM3Dq cases (see Figure 2C: the AAV2.1-hSyn-hM3Dq-IRES-AcGFP line is increasing after 2 years.)
We agree that our interpretation should be stated more cautiously, given the limited number of cases assessed beyond the two-year timepoint. In the revised manuscript, we have clarified in the Results that the observed decline is based on a subset of animals. We have also included a text stating that while a consistent decline was observed in hM4Di-expressing monkeys, the trajectory for hM3Dq expression was more variable with at least one case showing an increased signal beyond two years.
Revised Results section:
Lines 140, “hM4Di expression levels remained stable at peak levels for approximately 1.5 years, followed by a gradual decline observed in one case after 2.5 years, and after approximately 3 years in the other two cases (Figure 2B, a and e/d, respectively). Compared with hM4Di expression, hM3Dq expression exhibited greater post-peak fluctuations. Nevertheless, it remained at ~70% of peak levels after about 1 year. This post-peak fluctuation was not significantly associated with the cumulative number of DREADD agonist injections (repeated-measures two-way ANOVA, main effect of activation times, F<sub>(1,6)</sub> = 5.745, P = 0.054). Beyond 2 years post-injection, expression declined to ~50% in one case, whereas another case showed an apparent increase (Figure 2C, c and m, respectively).”
Given that individual differences may affect expression levels, it would be helpful to see additional labels on the graphs (or in the legends) indicating which subject and which region are being represented for each line and/or data point in Figure 1C, 2B, 2C, 5A, and 5B. Alternatively, for Figures 5A and B, an accompanying table listing this information would be sufficient.
We thank the reviewer for these helpful suggestions. In response, we have revised the relevant figures (Fig. 1C, 2B, 2C, and 5) as noted in the “Recommendations for the authors”, including simplifying visual encodings and improving labeling. We have also updated Table 2 to explicitly indicate the animal ID and brain regions associated with each data point shown in the figures.
While the authors comment on several factors that may influence peak expression levels, including serotype, promoter, titer, tag, and DREADD type, they do not comment on the volume of injection. The range in volume used per region in this study is between 2 and 54 microliters, with larger volumes typically (but not always) being used for cortical regions like the OFC and dlPFC, and smaller volumes for subcortical regions like the amygdala and putamen. This may weaken the claim that there is no significant relationship between peak expression level and brain region, as volume may be considered a confounding variable. Additionally, because of the possibility that larger volumes of viral vectors may be more likely to induce an immune response, which the authors suggest as a potential influence on transgene expression, not including volume as a factor of interest seems to be an oversight.
We thank the reviewer for raising this important issue. We agree that injection volume could act as a confounding variable, particularly since larger volumes were used in only handheld cortical injections. This overlap makes it difficult to disentangle the effect of volume from those of brain region or injection method. Moreover, data points associated with these larger volumes also deviated when volume was included in the model.
To address this, we performed a separate analysis restricted to injections delivered via microinjector, where a comparable volume range was used across cases. In this subset, we included injection volume as additional factor in the model and found that volume did not significantly impact peak expression levels. Instead, the presence of co-expressed protein tags remained a significant predictor, while viral titer no longer showed a significant effect. These updated results have replaced the originals in the revised Results section and in the new Figure 5. We have also revised the Discussion to reflect these updated findings.
The authors conclude that vectors encoding co-expressed protein tags (such as HA) led to reduced peak expression levels, relative to vectors with an IRES-GFP sequence or with no such element at all. While interesting, this finding does not necessarily seem relevant for the efficacy of long-term expression and function, given that the authors show in Figures 1 and 2 that peak expression (as indicated by a change in binding potential relative to non-displaced radioligand, or ΔBPND) appears to taper off in all or most of the constructs assessed. The authors should take care to point out that the decline in peak expression should not be confused with the decline in longitudinal expression, as this is not clear in the discussion; i.e. the subheading, "Factors influencing DREADD expression," might be better written as, "Factors influencing peak DREADD expression," and subsequent wording in this section should specify that these particular data concern peak expression only.
We appreciate this important clarification. In response, we have revised the title to "Protein tags reduce peak DREADD expression levels" in the Results section and “Factors influencing peak DREADD expression levels” in the Discussion section. Additionally, we specified that our analysis focused on peak ΔBP<sub>ND</sub> values around 60 days post-injection. We have also explicitly distinguished these findings from the later-stage changes in expression seen in the longitudinal PET data in both the Results and Discussion sections.
Reviewer #1 (Recommendations for the authors):
(1) Will any of these datasets be made available to other researchers upon request?
All data used to generate the figures have been made publicly available via our GitHub repository (https://github.com/minamimoto-lab/2024-Nagai-LongitudinalPET.git). This has been stated in the "Data availability" section in the revised manuscript.
(2) Suggested modifications to figures:
a) In Figures 2B and C, the inclusion of "serotype" as a separate legend with individual shapes seems superfluous, as the serotype is also listed as part of the colour-coded vector
We agree that the serotype legend was redundant since this information is already included in the color-coded vector labels. In response, we have removed the serotype shape indicators and now represent the data using only vector-construct-based color coding for clarity in Figure 2B and C.
b) In Figures 3A and B, it would be nice to see tics (representing agonist administration) for all subjects, not just the two that are exemplified in panels C-D and F-H. Perhaps grey tics for the non-exemplified subjects could be used.
In response, we have included black and white ticks to indicate all agonist administration across all subjects in Figure 3A and B, with the type of agonist clearly specified.
c) In Figure 4C, a Nissl- stained section is said to demonstrate the absence of neuronal loss at the vector injection sites. However, if the neuronal loss is subtle or widespread, this might not be easily visualized by Nissl. I would suggest including an additional image from the same section, in a non-injected cortical area, to show there is no significant difference between the injected and non-injected region.
To better demonstrate the absence of neuronal loss at the injection site, we have included an image from the contralateral, non-injected region of the same section for comparison (Fig. 4C).
d) In Figure 5A: is it possible that the hM3Dq construct with a titer of 5×10^13 gc/ml is an outlier, relative to the other hM3Dq constructs used?
We thank the reviewer for raising this important observation. To evaluate whether the high-titer constructs represented a statistical outlier that might artifactually influence the observed trends, we performed a permutation-based outlier analysis. This assessment identified this point in question, as well as one additional case (titer 4.6 x 10e13 gc/ml, #255, L_Put), as significant outlier relative to the distribution of the dataset.
Accordingly, we excluded these two data points from the analysis. Importantly, this exclusion did not meaningfully alter the overall trend or the statistical conclusions—specifically, the significant effect of co-expressed protein tags on peak expression levels remain robust. We have updated the Methods section to describe this outlier handling and added a corresponding note in the figure legend.
Reviewer #2 (Public review):
Weaknesses
This study is a meta-analysis of several experiments performed in one lab. The good side is that it combined a large amount of data that might not have been published individually; the downside is that all things were not planned and equated, creating a lot of unexplained variances in the data. This was yet judiciously used by the authors, but one might think that planned and organized multicentric experiments would provide more information and help test more parameters, including some related to inter-individual variability, and particular genetic constructs.
We thank the reviewer for bringing this important point to our attention. We fully acknowledge that the retrospective nature of our dataset—compiled from multiple studies conducted within a single laboratory—introduces variability related to differences in injection parameters and scanning timelines. While this reflects the practical realities and constraints of long-term NHP research, we agree that more standardized and prospectively designed studies would better control such source of variances. To address this, we have added the following statement to the "Technical consideration" section in Discussion:
Lines 297, "This study included a retrospective analysis of datasets pooled from multiple studies conducted within a single laboratory, which inherently introduced variability across injection parameters and scan intervals. While such an approach reflects real-world practices in long-term NHP research, future studies, including multicenter efforts using harmonized protocols, will be valuable for systematically assessing inter-individual differences and optimizing key experimental parameters."
Reviewer #2 (Recommendations for the authors):
I just have a few minor points that might help improve the paper:
(1) Figure 1C y-axis label: should add deltaBPnd in parentheses for clarity.
We have added “ΔBP<sub>ND</sub>” to the y-axis label for clarity.
The choice of a sigmoid curve is the simplest clear fit, but it doesn't really consider the presence of the peak described in the paper. Would there be a way to fit the dynamic including fitting the peak?
We agree that using a simple sigmoid curve for modeling expression dynamics is a limitation. In response to this and a similar comment from Reviewer #3, we tested a double logistic function (as suggested) to see if it better represented the rise and decline pattern. However, as described below, the original simple sigmoid curve was a better fit for the data. We have included a discussion regarding this limitation of this analysis. See Reviewer #3 recommendations (2) for details.
The colour scheme in Figure 1C should be changed to make things clearer, and maybe use another dimension (like dotted lines) to separate hM4Di from hM3Dq.
We have improved the visual clarity of Figure 1C by modifying the color scheme to represent vector construct and using distinct line types (dashed for hM4Di and solid for hM3Dq data) to separate DREADD type.
(2) Figure 2
I don't understand how the referencing to 100 was made: was it by selecting the overall peak value or the peak value observed between 40 and 80 days? If the former then I can't see how some values are higher than the peak. If the second then it means some peak values occurred after 80 days and data are not completely re-aligned.
We thank the reviewer for the opportunity to clarify this point. The normalization was based on the peak value observed between 40–80 days post-injection, as this window typically captured the peak expression phase in our dataset (see Figure 1). However, in some long-term cases where PET scans were limited during this period—e.g., with one scan performing at day 40—it is possible that the actual peak occurred later. Therefore, instances where ΔBP<sub>ND</sub> values slightly exceeded the reference peak at later time points likely reflect this sampling limitation. We have clarified this methodological detail in the revised Results section to improve transparency.
The methods section mentions the use of CNO but this is not in the main paper which seems to state that only DCZ was used: the authors should clarify this
Although DCZ was the primary agonist used, CNO and C21 were also used in a few animals (e.g., monkeys #153, #221, and #207) for behavioral assessments. We have clarified this in the Results section and revised Figure 3 to indicate the specific agonist used for each subject. Additionally, we have updated the Methods section to clearly specify the use and dosage of DCZ, CNO, and C21, to avoid any confusion regarding the experimental design.
Reviewer #3 (Public review):
Minor weaknesses are related to a few instances of suboptimal phrasing, and some room for improvement in time course visualization and quantification. These would be easily addressed in a revision. <br /> These findings will undoubtedly have a very significant impact on the rapidly growing but still highly challenging field of primate chemogenetic manipulations. As such, the work represents an invaluable resource for the community.
We thank the reviewer for the positive assessment of our manuscript and for the constructive suggestions. We address each comment in the following point-by-point responses and have revised the manuscript accordingly.
Reviewer #3 (Recommendations for the authors):
(1) Please clarify the reasoning was, behind restricting the analysis in Figure 1 only to 7 monkeys with subcortical AAV injection?
We focused the analysis shown in Figure 1 on 7 monkeys with subcortical AAV injections who received comparative injection volumes. These data were primary part of vector test studies, allowing for repeated PET scans within 150 days post-injection. In contrast, monkeys with cortical injections—including larger volumes—were allocated to behavioral studies and therefore were not scanned as frequently during the early phase. We will clarify this rationale in the Results section.
(2) Figure 1: Not sure if a simple sigmoid is the best model for these, mostly peaking and then descending somewhat, curves. I suggest testing a more complex model, for instance, double logistic function of a type f(t) = a + b/(1+exp(-c*(t-d))) - e/(1+exp(-g*(t-h))), with the first logistic term modeling the rise to peak, and the second term for partial decline and stabilization
We appreciate the reviewer’s thoughtful suggestion to use a double logistic function to better model both the rising and declining phases of the expression curve. In response to this and similar comments from Reviewer #1, we tested the proposed model and found that, while it could capture the peak and subsequent decline, the resulting fit appeared less biologically plausible (See below). Moreover, model comparison using BIC favored the original simple sigmoid model (BIC = 61.1 vs. 62.9 for the simple and double logistic model, respectively). This information has been included in the revised figure legend for clarity.
Given these results, we retained the original simple sigmoid function in the revised manuscript, as it provides a sufficient and interpretable approximation of the early expression trajectory—particularly the peak expression-time estimation, which was the main purpose of this analysis. We have updated the Methods section to clarify our modeling and rationale as follows:
Lines 530, "To model the time course of DREADD expression, we used a single sigmoid function, referencing past in vivo fluorescent measurements (Diester et al., 2011). Curve fitting was performed using least squares minimization. For comparison, a double logistic function was also tested and evaluated using the Bayesian Information Criterion (BIC) to assess model fit."
We also acknowledge that a more detailed understanding of post-peak expression changes will require additional PET measurements, particularly between 60- and 120-days post-injection, across a larger number of animals. We have included this point in the revised Discussion to highlight the need for future work focused on finer-grained modeling of expression decline:
Lines 317, “Although we modeled the time course of DREADD expression using a single sigmoid function, PET data from several monkeys showed a modest decline following the peak. While the sigmoid model captured the early-phase dynamics and offered a reliable estimate of peak timing, additional PET scans—particularly between 60- and 120-days post-injection—will be essential to fully characterize the biological basis of the post-peak expression trajectories.”
Author response image 1.<br />
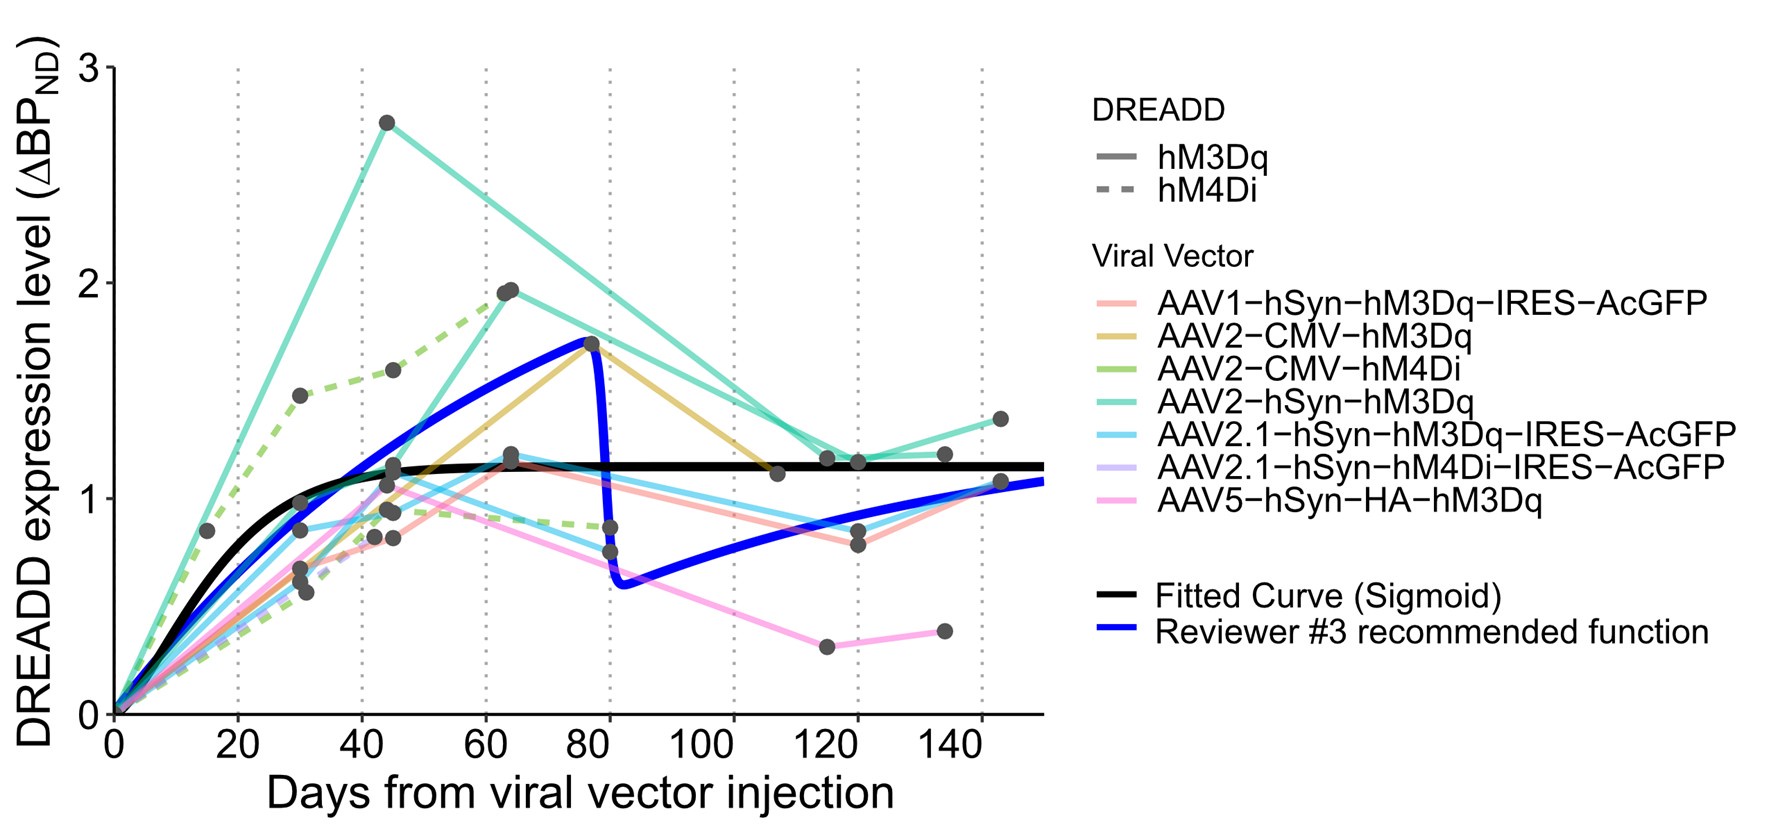
(3) Figure 2: It seems that the individual curves are for different monkeys, I counted 7 in B and 8 in C, why "across 11 monkeys"? Were there several monkeys both with hM4Diand hM3Dq? Does not look like that from Table 1. Generally, I would suggest associating specific animals from Tables 1 and 2 to the panels in Figures 1 and 2.
Some animals received multiple vector types, leading to more curves than individual subjects. We have revised the figure legends and updated Table 2 to explicitly relate each curve with the specific animal and brain region.
(4) I also propose plotting the average of (interpolated) curves across animals, to convey the main message of the figure more effectively.
We agree that plotting the mean of the interpolated expression curves would help convey the group trend. We added averaged curves to Figure 2BC.
(5) Similarly, in line 155 "We assessed data from 17 monkeys to evaluate ... Monkeys expressing hM4Di were assessed through behavioral testing (N = 11) and alterations in neuronal activity using electrophysiology (N = 2)..." - please explain how 17 is derived from 11, 2, 5 and 1. It is possible to glean from Table 1 that it is the calculation is 11 (including 2 with ephys) + 5 + 1 = 17, but it might appear as a mistake if one does not go deep into Table 1.
We have clarified in both the text and Table 1 that some monkeys (e.g., #201 and #207) underwent both behavioral and electrophysiological assessments, resulting in the overlapping counts. Specifically, the dataset includes 11 monkeys for hM4Di-related behavior testing (two of which underwent electrophysiology testing), 5 monkeys assessed for hM3Dq with FDG-PET, and 1 monkey assessed for hM3Dq with electrophysiology, totaling 19 assessments across 17 monkeys. We have revised the Results section to make this distinction more explicit to avoid confusion, as follows:
Lines 164, "Monkeys expressing hM4Di (N = 11) were assessed through behavioral testing, two of which also underwent electrophysiological assessment. Monkeys expressing hM3Dq (N = 6) were assessed for changes in glucose metabolism via [<sup>18</sup>F]FDG-PET (N = 5) or alterations in neuronal activity using electrophysiology (N = 1).”
(6) Line 473: "These stock solutions were then diluted in saline to a final volume of 0.1 ml (2.5% DMSO in saline), achieving a dose of 0.1 ml/kg and 3 mg/kg for DCZ and CNO, respectively." Please clarify: the injection volume was always 0.1 ml? then it is not clear how the dose can be 0.1 ml/kg (for a several kg monkey), and why DCZ and CNO doses are described in ml/kg vs mg/kg?
We thank the reviewer for pointing out this ambiguity. We apologize for the oversight and also acknowledge that we omitted mention of C21, which was used in a small number of cases. To address this, we have revised the “Administration of DREADD agonist” section of the Methods to clearly describe the preparation, the volume, and dosage for each agonist (DCZ, CNO, and C21) as follows:
Lines 493, “Deschloroclozapine (DCZ; HY-42110, MedChemExpress) was the primary agonist used. DCZ was first dissolved in dimethyl sulfoxide (DMSO; FUJIFILM Wako Pure Chemical Corp.) and then diluted in saline to a final volume of 1 mL, with the final DMSO concentration adjusted to 2.5% or less. DCZ was administered intramuscularly at a dose of 0.1 mg/kg for hM4Di activation, and at 1–3 µg/kg for hM3Dq activation. For behavioral testing, DCZ was injected approximately 15 min before the start of the experiment unless otherwise noted. Fresh DCZ solutions were prepared daily.
In a limited number of cases, clozapine-N-oxide (CNO; Toronto Research Chemicals) or Compound 21 (C21; Tocris) was used as an alternative DREADD agonist for some hM4Di experiments. Both compounds were dissolved in DMSO and then diluted in saline to a final volume of 2–3 mL, also maintaining DMSO concentrations below 2.5%. CNO and C21 were administered intravenously at doses of 3 mg/kg and 0.3 mg/kg, respectively.”
(7) Figure 5A: What do regression lines represent? Do they show a simple linear regression (then please report statistics such as R-squared and p-values), or is it related to the linear model described in Table 3 (but then I am not sure how separate DREADDs can be plotted if they are one of the factors)?
We thank the reviewer for the insightful question. In the original version of Figure 5A, the regression lines represented simple linear fits used to illustrate the relationship between viral titer and peak expression levels, based on our initial analysis in which titer appeared to have a significant effect without any notable interaction with other factors (such as DREADD type).
However, after conducting a more detailed analysis that incorporated injection volume as an additional factor and excluded cortical injections and statistical outliers (as suggested by Reviewer #1), viral titer was no longer found to significantly predict peak expression levels. Consequently, we revised the figure to focus on the effect of reporter tag, which remained the most consistent and robust predictor in our model.
In the updated Figure 5, we have removed the relationship between viral titer and expression level with regression lines.
Author response:
The following is the authors’ response to the original reviews.
Reviewer #1 (Recommendations for the authors):
Because many conclusions are drawn from overexpression studies and from a single cell line (HEK293), it is unclear how general these effects are. In particular, one of the main claims put forth in this manuscript is that of specificity, namely, that FZD5/8, and none of the other FZDs, are uniquely involved in this internalization and degradation. While there are examples of similar specificities, many of these examples can be attributed to a particular cellular context. Without demonstrating that this FZD5/8 specificity is observed in multiple cell lines and contexts, this point remains unconvincing and questionable. One way to address this point of criticism is to omit the word "specifically" in the title and soften the language concerning this idea throughout the manuscript.
We appreciate your valuable comments and suggestions. We have removed the word “specifically” from the title and softened the language concerning this idea throughout the manuscript. Moreover, we performed new experiments to show that Wnt3a/5a induces FZD5/8 endocytosis and degradation and that IWP-2 treatment increases the cell surface levels of FZD5/8 in cell lines other than 293A (Figure 1-Figure supplement 1 and Figure 2-Figure supplement 1). These results indicate that Wnt-induced FZD5/8 endocytosis and degradation are not cell specific.
The starting point for these studies is a survey of all 10 FZDs, V5-tagged and overexpressed in HEK293 cells. Here, the authors observed a decline in cell surface levels of only FZD5 and 8 in response to Wnt3a and Wnt5a. As illustrated in the immunoblot (Fig 1B), several FZDs were poorly expressed, including FZD1, 3, 6 and 9, which calls into question that only FZD5 and 8 were affected. Furthermore, total levels of FZD8 don't diminish appreciably, as claimed by the authors, and only FZD5 shows a subtle decline upon WNT treatment. All of these experiments are performed with overexpressed V5-tagged FZD proteins or with endogenously V5-tagged (KI) proteins, and it is possible that overexpression or tagging lead to potentially artifactual observations. Examining the effects of WNTs on FZD protein localization and levels need to be done with endogenously expressed, non-tagged FZDs. In this context, it is somewhat puzzling that the authors don't show such an experiment using the pan- and FZD5/8-specific antibodies, which they use in multiple experiments throughout the manuscript. With these available tools it should be possible to examine FZD levels at the cell surface in response to Wnt3a and Wnt5a, ideally in multiple cell lines.
We appreciate your valuable comments and suggestions. Figure 1B shows the results of the follow-up study shown in Figure 1A. As shown in Figure 1A, we used flow cytometry analysis to detect the cell surface levels of stably expressed FZDs and found that Wnt3a/5a specifically reduced the levels of FZD5/8 on the cell surface, suggesting that Wnt3a/5a induces FZD5/8 endocytosis. As shown in Figure 1B and C, we performed immunoblotting to examine whether Wnt3a/5a-induced FZD5/8 internalization resulted in FZD5/8 degradation. Notably, most FZDs exhibit two bands on immunoblots, as also suggested by other published studies, and the upper bands represent the mature form that is fully glycosylated and presented to the cell surface (see also new Figure 2L), whereas the lower bands represent the immature form. Our results clearly indicated that Wnt3a/5a treatment reduced the levels of the mature forms of both FZD5 and FZD8, although the immunoblotting signals of the mature form of FZD8 (upper bands) were relatively weak. The immunoblotting signals of the other FZDs varied, and some of them (including FZD1, -3, -6 and -9) were relatively weak; however, according to the results in Figure 1A, all of the FZDs were expressed and present on the cell surface.
Commercially available FZD5/8 antibodies, including those used in published studies, cannot detect endogenous FZD5/8 or can only recognize immature FZD5 in our hands, which is why we have to use the CRISPR-CAS9-based KI technique to introduce a V5 tag to FZD5 and FZD7. Notably, in the overexpression experiments, the V5 tag is on the amino terminus, and in the KI experiments, the V5 tag is on the carboxyl terminus of FZDs, which may minimize the potential artificial effects of the V5 tag on the immunoblotting assays.
The monoclonal antibodies used in this study, such as anti-pan-FZD, anti-FZD5/8, and anti-FZD4 antibodies, are neutralizing antibodies that can compete with Wnt ligands to bind to the FZD CRD. These antibodies have been successfully used to detect the surface levels of FZDs via flow cytometry assays. However, as the binding affinity of the Wnt-FZD CRD is comparable to the binding affinity of the antibody-FZD, we were cautious in using these antibodies to detect the cell surface levels of FZDs when the cells were treated with Wnt3a/5a CM, which contains relatively high concentrations of Wnt3a/5a. As shown in Author response image 1, Wnt3a or Wnt5a treatment dramatically reduced the endogenous cell surface level of FZD5/8, as detected by flow cytometry using the anti-FZD5/8 antibody. However, in another experiment, HEK293A cells were first incubated with cold Wnt3a or Wnt5a CM at 4°C to minimize endocytosis and then analyzed via flow cytometry using the anti-FZD5/8 antibody. The results showed that Wnt3a/5a incubation reduced the floe cytometry signals, suggesting that Wnt3a/5a binding to FZD5/8 might interfere with antibody-FZD5/8 binding, although we cannot exclude the possibility that Wnt3a/5a may induce FZD5/8 endocytosis at 4°C (Author response image 1).
Author response image 1.
(A) HEK293A cells were treated with control, Wnt3a or Wnt5a CM for 2 hours at 37°C in a humidified incubator and were analyzed via flow cytometry using the anti-FZD5/8 antibody.
(B) HEK293A cells were incubated with control, Wnt3a or Wnt5a CM for 1 h at 4°C and analyzed by flow cytometry using the anti-FZD5/8 antibody.
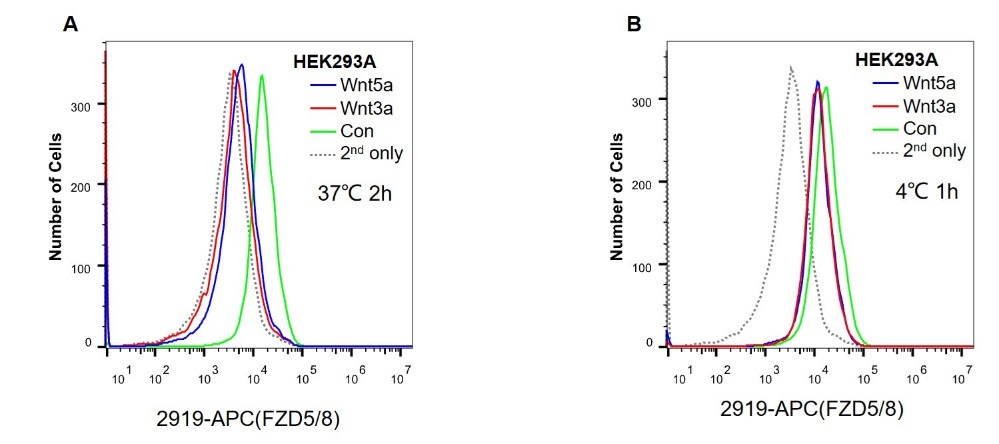
Several experiments rely on gene-edited clonal cell lines, including knockouts of FZD5/8, RNF43/ZNRF3, and DVL. Gene knockouts were confirmed by genomic DNA sequencing and, for DVL and FZD5/8, by loss of protein expression. While these KO lines are powerful tools to study gene function, there is a concern for clonal variability. Each cell line may have acquired additional changes as a result of gene editing. In addition, there may be compensatory changes in gene expression as a consequence of the loss of certain genes. For example, expression of other FZDs may increase in FZD5/8 DKO cells. To address this critique, the authors should show that re-expression of the knocked-out genes rescues the observed effect. This is done in some instances (Fig 5E, G, H) but not in other instances, such as with the DVL TKO (Fig. 3). Since the authors assert that DVL is important for FZD internalization in the absence of WNT, but not for FZD internalization in the presence of WNT, this particular rescue experiment is important. This is a potentially important finding and it should be confirmed by re-expression of DVL in the TKO line. As an alternative, conditional knockdown using Tet-inducible shRNA expression could address concerns for clonal variability.
We appreciate your valuable comments and suggestions. We re-expressed DVL2 in DVLTKO cells stably expressing V5-linker-FZD5 or V5-linker-FZD7. As shown in Figure 3G-K, re-expression of DVL2 rescued the decreased Wnt-independent endocytosis of FZD5 and FZD7 caused by DVL1/2/3 knockout.
Given the significant differences in signaling activity by Wnt3a and Wnt5a, it is somewhat surprising that all experiments shown in this manuscript do not identify distinguishing features between Wnt3a and Wnt5a. In addition, it is unclear why the authors switch between Wnt3a and Wnt5a. For example, Figures 1C, 3G-J, 4C-D only use Wnt5a. In contrast, Figures 6E and H use Wnt3a, most likely because b-catenin stabilization is examined, an effect generally not observed with Wnt5a. The choice of which Wnt is examined/used appears to be somewhat arbitrary and the authors never provide any explanations for these choices. In the end, this type of inconsistency becomes puzzling when the authors present, quite convincingly, in Figure 7, that both Wnt3a and 5a promote an interaction between FZD5/8 and RNF43 through proximity biotin labeling.
Although Wnt3a and Wnt5a are significantly different in triggering intracellular signaling pathways, both bind FZD5/8 and induce FZD5/8 endocytosis and degradation similarly. When FZD5 is stably overexpressed, Wnt5a has slightly stronger effects on inducing FZD5 endocytosis and degradation, possibly because the Wnt5a concentration may be higher than the Wnt3a concentration in our CM, which is why we used Wnt5a CM in some experiments when V5-FZD5 was overexpressed. In the revised manuscript, we used both Wnt3a and Wnt5a CM in the experiments as you suggested, as shown in Figure 1C, 3G-K and Figure 4-Figure supplement 1.
Minor Points:
Figure 3G and I: it is curious that individual cells are shown in the "0 h" samples, while the "Con 1 h" and "Wnt5a 1 h" show multiple cells with several making direct contact with each other. This is notable because the V5 staining at sites of cell-cell contact are quite distinct and variable between control and Wnt5a-treated and WT versus DVL TKO cells. Also, sub-cellular localization of FZD5 (V5 tag) puncta is quite distinct between Con and Wnt5a: puncta in Wnt5a-treated cells appear to be more plasma membrane proximal than in Con cells. These points may be easy to address by showing images of cells that are more similar with respect to cell number and density for each condition.
Thank you for your suggestions. We repeated these experiments and added Wnt3a treatment and adjusted the cell density. Images including an individual cell were selected for presentation.
Figure 5E: the following statement is confusing/misleading: "Furthermore, reintroducing ZNRF3 or RNF43 into ZRDKO cells efficiently restored the increase in cytosolic β-catenin levels, whereas the expression of RNF130 or RNF150, two structurally similar transmembrane E3 ubiquitin ligases, did not (Fig. 5E)." First, reintroduction of ZNRF3 or RNF43 restores cytosolic b-catenin levels; it does not restore the increase in b-catenin. Second, the claim that RNF130 fails to have this effect is not substantiated since it is barely expressed.
Thank you for your suggestions and comments. We reorganized the language to make the statement clearer. Notably, the expression level of RNF130 was relatively low compared with that of other E3 ligases, but RNF130 was expressed (Figure 5E darker exposure) and could reduce the cell surface levels of FZDs, as shown in Figure 5G.
Reviewer #2 (Recommendations for the authors):
(1) Given their results the authors conclude that upregulation of Frizzled on the plasma membrane is not sufficient to explain the stabilization of beta-catenin seen in the ZNRF3/RNF43 mutant cells. This interpretation is sound, and they suggest in the discussion that ZNRF3/RNF43-mediated ubiquitination could serve as a sorting signal to sort endocytosed FZD to lysosomes for degradation and that absence or inhibition of this process would promote FZD recycling. This should be relatively easy to test using surface biotinylation experiments and would considerably strengthen the manuscript.
Thank you for your valuable suggestions and comments. We performed cell surface biotinylation experiments in HEK293A FZD5KI cells, as shown in Figure 2L. The results indicated that Wnt3a or Wnt5a treatment induced the degradation of FZD5 on the cell surface, which was antagonized by cotreatment with RSPO1. We did not perform a more detailed endocytosis/recycling biotinylation experiment that requires complex reversible biotinylation and multiple washing steps because HEK293A cells are fragile in culture and not easy to handle. Furthermore, the results shown in Figure 4 indicate that knockout of ZNRF3/RNF43 or RSPO1 significantly blocked the degradation of internalized FZD5 and reduced the colocalization of internalized FZD5 with lysosomal markers, suggesting that Wnt3a/5a induced lysosomal degradation of FZD5 in the presence of ZNRF3/RNF43 and that the internalized FZD5 was most likely recycled back to the cell surface when ZNRF3/RNF43 was knocked out or inhibited by RSPO1.
(2) The authors show that the FZD5 CRD domain is required for endocytosis since a mutant FZD5 protein in which the CRD is removed does not undergo endocytosis. This is perhaps not surprising since this is the site of Wnt binding, but the authors show that a chimeric FZD5CRD-FZD4 receptor can confer Wnt-dependent endocytosis to an otherwise endocytosis incompetent FZD4 protein. Since the linker region between the CRD and the first TM differs between FZD5 and FZD4, it would be interesting to understand whether the CRD specifically or the overall arrangement (such as the spacing) is the most important determinant.
Our results in Figure 1D-H clearly show that the CRD of FZD5 specifically is both necessary and sufficient for Wnt3a/5a-induced FZD5 endocytosis, as replacing the CRD alone in FZD5 with the CRD from either FZD4 or FZD7 completely abolished Wnt-induced endocytosis, whereas replacing the CRD alone in FZD4 or FZD7 with the FZD5 CRD alone could confer Wnt-induced endocytosis.
(3) I find it surprising that only FZD5 and FZD8 appear to undergo endocytosis or be stabilized at the cell surface upon ZNRF3/RNF43 knockout. Is this consistent with previous literature? Is that a cell-specific feature? These findings should be tested in a different cell line, with possibly different relative levels of ZNRF3 and RNF43 expression.
Thank you for your comments and suggestions. Our finding that ZNRF3/RNF43 specifically regulates FZD5/8 degradation is consistent with recent published studies in which FZD5 is required for the survival of RNF43-mutant PDAC or colorectal cancer cells (Nature Medicine, 2017, PMID: 27869803) and FZD5 is required for the maintenance of intestinal stem cells (Developmental Cell, 2024, PMID: 39579768 and 39579769), and in both cases, FZDs other than FZD5/8 are also expressed but not sufficient to compensate for the function of FZD5. The mechanism by which Wnt3a/5a specifically induces FZD5/8 endocytosis and degradation is currently unknown and needs to be explored in the future. We speculate that Wnt binding to FZD5/8 may recruit another protein on the cell surface to specifically facilitate FZD5/8 endocytosis. On the other hand, we cannot exclude the possibility that Wnts other than Wnt3a/5a may induce the endocytosis and degradation of FZDs other than FZD5/8 since there are 19 Wnts and 10 FZDs in humans. Notably, several previous studies have suggested that ZNRF3/RNF43 may regulate the endocytosis and degradation of all FZDs without selectivity (such as Nature, 2012, PMID: 22575959; Nature, 2012, PMID: 22895187; Mol Cell, 2015, PMID: 25891077). However, their conclusions were drawn mostly on the basis of overexpression studies. According to the results shown in Figure 5E-H, overexpressing a membrane-tethered E3 ligase (such as ZNRF3, RNF43, RNF130, or RNF150) may nonspecifically degrade FZD proteins on the cell surface.
Furthermore, in the revised manuscript, we showed that Wnt3a/5a induced FZD5/8 endocytosis and degradation in multiple cell lines, including Huh7, U2OS, MCF7, and 769P cells (Figure 1-Figure supplement 1 and Figure 2-Figure supplement 1), suggesting that these phenomena are not specific to 293A cells.
(4) If FZD7 is not a substrate of ZNRF3/RNF43 and therefore is not ubiquitinated and degraded, how do the authors reconcile that its overexpression does not lead to elevated cytosolic beta-catenin levels in Figure 5B?
We are currently not sure of the mechanism underlying this result. Considering that most FZDs are expressed in 293A cells, we do not know how much of the mature form of overexpressed FZD7 was presented to the plasma membrane.
(5) For Figure 5B, it would be interesting if the authors could evaluate whether overexpression of FZD5 in the ZNRF3/RNF43 double knockout lines would synergize and lead to further increase in cytosolic beta-catenin levels. As control if the substrate selectivity is clear FZD7 overexpression in that line should not do anything.
Thank you for your suggestion. We performed these experiments as suggested, and the results indicated that overexpressing FZD5 further increased cytosolic beta-catenin levels in ZRDKO cells, whereas FZD7 had no effect (Figure 6D).
(6) In Figure 6G, the authors need to show cytosolic levels of beta-catenin in the absence of Wnt in all cases.
We did not add Wnt CM in this experiment. RSPO1 activity, which relies on endogenous Wnt, has been well documented in previous studies.
(7) Since the authors show that DVL is not involved in the Wnt and ZRNF3-dependent endocytosis they should repeat the proximity biotinylation experiment in figure 7 in the DVL triple KO cells. This is an important experiment since previous studies showed that DVL was required for the ZRNF3/RNF43-mediated ubiqtuonation of FZD.
Thank you for your valuable suggestions. As you suggested, we performed a proximity biotinylation experiment in DVL TKO cells, and the results showed that Wnt3a/5a could still induce the interaction of FZD5 and RNF43 in DVLTKO cells (Figure 7-figure supplement 1), suggesting that the Wnt-induced FZD5‒RNF43 interaction is DVL independent.
Author response:
The following is the authors’ response to the original reviews.
Reviewer #1 (Public Review):
Summary:
The study by Klug et al. investigated the pathway specificity of corticostriatal projections, focusing on two cortical regions. Using a G-deleted rabies system in D1-Cre and A2a-Cre mice to retrogradely deliver channelrhodopsin to cortical inputs, the authors found that M1 and MCC inputs to direct and indirect pathway spiny projection neurons (SPNs) are both partially segregated and asymmetrically overlapping. In general, corticostriatal inputs that target indirect pathway SPNs are likely to also target direct pathway SPNs, while inputs targeting direct pathway SPNs are less likely to also target indirect pathway SPNs. Such asymmetric overlap of corticostriatal inputs has important implications for how the cortex itself may determine striatal output. Indeed, the authors provide behavioral evidence that optogenetic activation of M1 or MCC cortical neurons that send axons to either direct or indirect pathway SPNs can have opposite effects on locomotion and different effects on action sequence execution. The conclusions of this study add to our understanding of how cortical activity may influence striatal output and offer important new clues about basal ganglia function.
The conceptual conclusions of the manuscript are supported by the data, but the details of the magnitude of afferent overlap and causal role of asymmetric corticostriatal inputs on behavioral outcomes were not yet fully resolved.
We appreciate the reviewer’s thoughtful understanding and acknowledgment that the conceptual conclusion of asymmetric projections from the cortex to the striatum is well supported by our data. We also recognize the importance of further elucidating the extent of afferent overlap and the causal contributions of asymmetric corticostriatal inputs to behavioral outcomes. However, we respectfully note that current technical limitations pose significant challenges to addressing these questions with high precision.
In response to the reviewer’s comments, we have now clarified the sample size, added proper analysis and elaborated on the experimental design to ensure that our conclusions are presented more transparently and are more accessible to the reader.
After virally labeling either direct pathway (D1) or indirect pathway (D2) SPNs to optogenetically tag pathway-specific cortical inputs, the authors report that a much larger number of "non-starter" D2-SPNs from D2-SPN labeled mice responded to optogenetic stimulation in slices than "non-starter" D1 SPNs from D1-SPN labeled mice did. Without knowing the relative number of D1 or D2 SPN starters used to label cortical inputs, it is difficult to interpret the exact meaning of the lower number of responsive D2-SPNs in D1 labeled mice (where only ~63% of D1-SPNs themselves respond) compared to the relatively higher number of responsive D1-SPNs (and D2-SPNs) in D2 labeled mice. While relative differences in connectivity certainly suggest that some amount of asymmetric overlap of inputs exists, differences in infection efficiency and ensuing differences in detection sensitivity in slice experiments make determining the degree of asymmetry problematic.
Thank you for highlighting this point. As it lies at the core of our manuscript, we agree that it is essential to present it clearly and convincingly. As shown by the statistics (Fig. 2B-F), non-starter D1- and D2-SPNs appear to receive fewer projections from D1-projecting cortical neurons (Input D1-record D1, 0.63; Input D1-record D2, 0.40) compared to D2-projecting cortical neurons (Input D2 - record D1, 0.73; Input D2 -record D2, 0.79).
While it is not technically feasible to quantify the number of infected cells in brain slices following electrophysiological recordings, we addressed this limitation by collecting data from multiple animals and restricting recordings to cells located within the injection sites. In Figure 2D, we used 7 mice in the D1-projecting to D1 EGFP(+) group, 8 mice in the D1-projecting to D2 EGFP(-) group, 10 mice in the D2-projecting to D2 EGFP(+) group, and 8 mice in the D2-projecting to D1 EGFP(-) group. In Figure 2G, the group sizes were as follows: 8 mice in the D1-projecting to D2 EGFP(+) group, 7 mice in the D1-projecting to D1 EGFP(-) group, 8 mice in the D2-projecting to D1 EGFP(+) group, and 10 mice in the D2-projecting to D2 EGFP(-) group. In both panels, connection ratios were compared using Fisher’s exact test. Comparisons were then made across experimental groups. Furthermore, as detailed in our Methods section (page 20, line 399-401), we assessed cortical expression levels prior to performing whole-cell recordings. Taken together, these precautions help ensure that the calculated connection ratios are unlikely to be confounded by differences in infection efficiency.
It is also unclear if retrograde labeling of D1-SPN- vs D2-SPN- targeting afferents labels the same densities of cortical neurons. This gets to the point of specificity in the behavioral experiments. If the target-based labeling strategies used to introduce channelrhodopsin into specific SPN afferents label significantly different numbers of cortical neurons, might the difference in the relative numbers of optogenetically activated cortical neurons itself lead to behavioral differences?
Thank you for bringing this concern to our attention. While optogenetic manipulation has become a widely adopted tool in functional studies of neural circuits, it remains subject to several technical limitations due to the nature of its implementation. Factors such as opsin expression efficiency, optic fiber placement, light intensity, stimulation spread, and other variables can all influence the specificity and extent of neuronal activation or inhibition. As such, rigorous experimental controls are essential when interpreting the outcomes of optogenetic experiments.
In our study, we verified both the expression of channelrhodopsin in D1- or D2-projecting cortical neurons and the placement of the optic fiber following the completion of behavioral testing. To account for variability, we compared the behavioral effects of optogenetic stimulation within the same animals, stimulated versus non-stimulated conditions, as shown in Figures 3 and 4. Moreover, Figure S3 includes important controls that rule out the possibility that the behavioral effects observed were due to direct activation of D1- or D2-SPNs in striatum or to light alone in the cortex.
An additional point worth emphasizing is that the behavioral effects observed in the open field and ICSS tests cannot be attributed to differences in the number of neurons activated. Specifically, activation of D1-projecting cortical neurons promoted locomotion in the open field, whereas activation of D2-projecting cortical neurons did not. However, in the ICSS test, activation of both D1- and D2-projecting cortical neurons reinforced lever pressing. Given that only D1-SPN activation, but not D2-SPN activation, supports ICSS behavior, these effects are unlikely to result merely from differences in the number of neurons recruited.
This rationale underlies our use of multiple behavioral paradigms to examine the functions of D1- and D2-projecting cortical neurons. By assessing behavior across distinct tasks, we aimed to approach the question from multiple angles and reduce the likelihood of spurious or confounding effects influencing our interpretation.
In general, the manuscript would also benefit from more clarity about the statistical comparisons that were made and sample sizes used to reach their conclusions.
We thank the reviewer for the valuable suggestion to improve the manuscript. In response, we have made the following changes and provided additional clarification:
(1) In Figure 2D, we used 7 mice in the D1-projecting to D1 EGFP(+) group, 8 mice in the D1-projecting to D2 EGFP(-) group, 10 mice in the D2-projecting to D2 EGFP(+) group, and 8 mice in the D2-projecting to D1 EGFP(-) group. In Figure 2G, the group sizes were as follows: 8 mice in the D1-projecting to D2 EGFP(+) group, 7 mice in the D1-projecting to D1 EGFP(-) group, 8 mice in the D2-projecting to D1 EGFP(+) group, and 10 mice in the D2-projecting to D2 EGFP(-) group. In both panels, connection ratios were compared using Fisher’s exact test.
(2) In Figure 3, we reanalyzed the data in panels O, P, R, and S using permutation tests to assess whether each individual group exhibited a significant ICSS learning effect. The figure legend has been revised accordingly as follows:
(O-P) D1-SPN (red) but not D2-SPN stimulation (black) drives ICSS behavior in both the DMS (O: D1, n = 6, permutation test, slope = 1.5060, P = 0.0378; D2, n = 5, permutation test, slope = -0.2214, P = 0.1021; one-tailed Mann Whitney test, Day 7 D1 vs. D2, P = 0.0130) and the DLS (P: D1, n = 6, permutation test, slope = 28.1429, P = 0.0082; D2, n = 5, permutation test, slope = -0.3429, P = 0.0463; one-tailed Mann Whitney test, Day 7 D1 vs. D2, P = 0.0390). *, P < 0.05. (Q) Timeline of helper virus injections, rabies-ChR2 injections and optogenetic stimulation for ICSS behavior. (R-S) Optogenetic stimulation of the cortical neurons projecting to either D1- or D2-SPNs induces ICSS behavior in both the MCC (R: MCC-D1, n = 5, permutation test, Day1-Day7, slope = 2.5857, P = 0.0034; MCC-D2, n = 5, Day2-Day7, permutation test, slope = 1.4229, P = 0.0344; no significant effect on Day7, MCC-D1 vs. MCC-D2, two-tailed Mann Whitney test, P = 0.9999) and the M1 (S: M1-D1, n = 5, permutation test, Day1-Day7, slope = 1.8214, P = 0.0259; M1-D2, n = 5, Day1-Day7, permutation test, slope = 1.8214, P = 0.0025; no significant effect on Day7, M1-D1 vs. M1-D2, two-tailed Mann Whitney test, P = 0.3810). n.s., not statistically significant.
(3) In Figure 4, we have added a comparison against a theoretical percentage change of zero to better evaluate the net effect of each manipulation. The results showed that in Figure 4D, optogenetic stimulation of D1-projecting MCC neurons significantly increased the pressing rate, whereas stimulation of D2-projecting MCC neurons did not (MCC-D1: n = 8, one-sample two-tailed t-test, t = 2.814, P = 0.0131; MCC-D2: n = 7, t = 0.8481, P = 0.4117). In contrast, in Figure 4H, optogenetic stimulation of both D1- and D2-projecting M1 neurons significantly increased the sequence press rate (M1-D1: n = 6, one-sample two-tailed Wilcoxon signed-rank test, P = 0.0046; M1-D2: n = 7, P = 0.0479).
Reviewer #2 (Public Review):
Summary:
Klug et al. use monosynaptic rabies tracing of inputs to D1- vs D2-SPNs in the striatum to study how separate populations of cortical neurons project to D1- and D2-SPNs. They use rabies to express ChR2, then patch D1-or D2-SPNs to measure synaptic input. They report that cortical neurons labeled as D1-SPN-projecting preferentially project to D1-SPNs over D2-SPNs. In contrast, cortical neurons labeled as D2-SPN-projecting project equally to D1- and D2-SPNs. They go on to conduct pathway-specific behavioral stimulation experiments. They compare direct optogenetic stimulation of D1- or D2-SPNs to stimulation of MCC inputs to DMS and M1 inputs to DLS. In three different behavioral assays (open field, intra-cranial self-stimulation, and a fixed ratio 8 task), they show that stimulating MCC or M1 cortical inputs to D1-SPNs is similar to D1-SPN stimulation, but that stimulating MCC or M1 cortical inputs to D2-SPNs does not recapitulate the effects of D2-SPN stimulation (presumably because both D1- and D2-SPNs are being activated by these cortical inputs).
Strengths:
Showing these same effects in three distinct behaviors is strong. Overall, the functional verification of the consequences of the anatomy is very nice to see. It is a good choice to patch only from mCherry-negative non-starter cells in the striatum.
Thank you for your profound understanding and appreciation of our manuscript’s design and the methodologies employed. In the realm of neuroscience, quantifying synaptic connections is a formidable challenge. While the roles of the direct and indirect pathways in motor control have long been explored, the mechanism by which upstream cortical inputs govern these pathways remains shrouded in mystery at the circuitry level.
In the ‘Go/No-Go’ model, the direct and indirect pathways operate antagonistically; in contrast, the ‘Co-activation’ model suggests that they work cooperatively to orchestrate movement. These distinct theories raise a compelling question: Do these two pathways receive inputs from the same upstream cortical neurons, or are they modulated by distinct subpopulations? Answering this question could provide vital clues as to whether these pathways collaborate or operate independently.
Previous studies have revealed both differences and similarities in the cortical inputs to direct and indirect pathways at population level. However, our investigation delves deeper to understand how a singular cortical input simultaneously drives these pathways, or might it regulate one pathway through distinct subpopulations? To address this, we employed rabies virus–mediated retrograde tracing from D1- or D2-SPNs and recorded non-starter SPNs to determine if they receive the same inputs as the starter SPNs. This approach allowed us to calculate the connection ratio and estimate the probable connection properties.
Weaknesses:
One limitation is that all inputs to SPNs are expressing ChR2, so they cannot distinguish between different cortical subregions during patching experiments. Their results could arise because the same innervation patterns are repeated in many cortical subregions or because some subregions have preferential D1-SPN input while others do not.
Thank you for raising this thoughtful concern. It is indeed not feasible to restrict ChR2 expression to a specific cortical region using the first-generation rabies-ChR2 system alone. A more refined approach would involve injecting Cre-dependent TVA and RG into the striatum of D1- or A2A-Cre mice, followed by rabies-Flp infection. Subsequently, a Flp-dependent ChR2 virus could be injected into the MCC or M1 to selectively label D1- or D2-projecting cortical neurons. This strategy would allow for more precise targeting and address many of the current limitations.
However, a significant challenge lies in the cytotoxicity associated with rabies virus infection. Neuronal health begins to deteriorate substantially around 10 days post-infection, which provides an insufficient window for robust Flp-dependent ChR2 expression. We have tested several new rabies virus variants with extended survival times (Chatterjee et al., 2018; Jin et al., 2024), but unfortunately, they did not perform effectively or suitably in the corticostriatal systems we examined.
In our experimental design, the aim is to delineate the connectivity probabilities to D1 or D2-SPNs from cortical neurons. Our hypothesis considered includes the possibility that similar innervation patterns could occur across multiple cortical subregions, or that some subregions might show preferential input to D1-SPNs while others do not, or a combination of both scenarios. This leads us to perform a series behavior test that using optogenetic activation of the D1- or D2-projecting cortical populations to see which could be the case.
In the cortical areas we examined, MCC and M1, during behavioral testing, there is consistency with our electrophysiological results. Specifically, when we stimulated the D1-projecting cortical neurons either in MCC or in M1, mice exhibited facilitated local motion in open field test, which is the same to the activation of D1 SPNs in the striatum along (MCC: Fig 3C & D vs. I; M1: Fig 3F & G vs. L). Conversely, stimulation of D2-projecting MCC or M1 cortical neurons resulted in behavioral effects that appeared to combine characteristics of both D1- and D2-SPNs activation in the striatum (MCC: Fig 3C & D vs. J; M1: Fig 3F & G vs. M). The similar results were observed in the ICSS test. Our interpretation of these results is that the activation of D1-projecting neurons in the cortex induces behavior changes akin to D1 neuron activation, while activation of D2-projecting neurons in the cortex leads to a combined effect of both D1 and D2 neuron activation. This suggests that at least some cortical regions, the ones we tested, follow the hypothesis we proposed.
There are also some caveats with respect to the efficacy of rabies tracing. Although they only patch non-starter cells in the striatum, only 63% of D1-SPNs receive input from D1-SPN-projecting cortical neurons. It's hard to say whether this is "high" or "low," but one question is how far from the starter cell region they are patching. Without this spatial indication of where the cells that are being patched are relative to the starter population, it is difficult to interpret if the cells being patched are receiving cortical inputs from the same neurons that are projecting to the starter population. Convergence of cortical inputs onto SPNs may vary with distance from the starter cell region quite dramatically, as other mapping studies of corticostriatal inputs have shown specialized local input regions can be defined based on cortical input patterns (Hintiryan et al., Nat Neurosci, 2016, Hunnicutt et al., eLife 2016, Peters et al., Nature, 2021).
This is a valid concern regarding anatomical studies. Investigating cortico-striatal connectivity at the single-cell level remains technically challenging due to current methodological limitations. At present, we rely on rabies virus-mediated trans-synaptic retrograde tracing to identify D1- or D2-projecting cortical populations. This anatomical approach is coupled with ex vivo slice electrophysiology to assess the functional connectivity between these projection-defined cortical neurons and striatal SPNs. This enables us to quantify connection ratios, for example, the proportion of D1-projecting cortical neurons that functionally synapse onto non-starter D1-SPNs.
To ensure the robustness of our conclusions, it is essential that both the starter cells and the recorded non-starter SPNs receive comparable topographical input from the cortex and other brain regions. Therefore, we carefully designed our experiments so that all recorded cells were located within the injection site, were mCherry-negative (i.e., non-starter cells), and were surrounded by ChR2-mCherry-positive neurons. This configuration ensured that the distance between recorded and starter cells did not exceed 100 µm, maintaining close anatomical proximity and thereby preserving the likelihood of shared cortical innervation within the examined circuitry.
These methodological details are also described in the section on ex vivo brain slice electrophysiology, specifically in the Methods section, lines 396–399:
“D1-SPNs (eGFP-positive in D1-eGFP mice, or eGFP-negative in D2-eGFP mice) or D2-SPNs (eGFP-positive in D2-eGFP mice, or eGFP-negative in D1-eGFP mice) that were ChR2-mCherry-negative, but in the injection site and surrounded by cells expressing ChR2-mCherry were targeted for recording.”
This experimental strategy was implemented to control for potential spatial biases and to enhance the interpretability of our connectivity measurements.
A caveat for the optogenetic behavioral experiments is that these optogenetic experiments did not include fluorophore-only controls.
Thank you for bringing this to our attention. A fluorophore-only control is indeed a valuable negative control, commonly used to rule out effects caused by light exposure independent of optogenetic manipulation. In this study, however, comparisons were made between light-on and light-off conditions within the same animal. This within-subject design, as employed in recent studies (Geddes et al., 2018; Zhu et al., 2025), is considered sufficient to isolate the effects of optogenetic manipulation.
Furthermore, as shown in Figure S3, we conducted an additional control experiment in which optogenetic stimulation was applied to M1, while ensuring that ChR2 expression was restricted to the striatum via targeted viral infection. This approach serves as a functional equivalent to the control you suggested. Importantly, we observed no effects that could be attributed solely to light exposure, further supporting the conclusion that the observed outcomes in our main experiments are due to targeted optogenetic manipulation, rather than confounding effects of illumination.
Lastly, by employing an in-animal comparison, measuring changes between stimulated and non-stimulated trials, we account for subject-specific variability and strengthen the interpretability of our findings.
Another point of confusion is that other studies (Cui et al, J Neurosci, 2021) have reported that stimulation of D1-SPNs in DLS inhibits rather than promotes movement.
Thank you for bringing the study by Cui and colleagues to our attention. While that study has generated some controversy, other independent investigations have demonstrated that activation of D1-SPNs in DLS facilitates local motion and lever-press behaviors (Dong et al., 2025; Geddes et al., 2018; Kravitz et al., 2010).
It is still worth to clarify. The differences in behavioral outcomes observed between our study and that of Cui et al. may be attributable to several methodological factors, including differences in both the stereotaxic targeting coordinates and the optical fiber specifications used for stimulation.
Specifically, in our experiments, the dorsomedial striatum (DMS) was targeted at coordinates AP +0.5 mm, ML ±1.5 mm, DV –2.2 mm, and the DLS at AP +0.5 mm, ML ±2.5 mm, DV –2.2 mm. In contrast, Cui et al. targeted the DMS at AP +0.9 mm, ML ±1.4 mm, DV –3.0 mm and the DLS at AP +0.7 mm, ML ±2.3 mm, DV –3.0 mm. These coordinates correspond to sites that are slightly more rostral and ventral compared to our own. Even subtle differences in anatomical targeting can result in activation of distinct neuronal subpopulations, which may account for the differing behavioral effects observed during optogenetic stimulation.
In addition, the optical fibers used in the two studies varied considerably. We employed fibers with a 200 µm core diameter and a numerical aperture (NA) of 0.37, whereas Cui et al. used fibers with a 250 µm core diameter and a higher NA of 0.66. The combination of a larger core and higher NA in their setup implies a broader spatial spread and deeper tissue penetration of light, likely resulting in activation of a larger neural volume. This expanded volume of stimulation may have engaged additional neural circuits not recruited in our experiments, further contributing to the divergent behavioral outcomes. Taken together, these differences in targeting and photostimulation parameters are likely key contributors to the distinct effects reported between the two studies.
Reviewer #3 (Public Review):
In the manuscript by Klug and colleagues, the investigators use a rabies virus-based methodology to explore potential differences in connectivity from cortical inputs to the dorsal striatum. They report that the connectivity from cortical inputs onto D1 and D2 MSNs differs in terms of their projections onto the opposing cell type, and use these data to infer that there are differences in cross-talk between cortical cells that project to D1 vs. D2 MSNs. Overall, this manuscript adds to the overall body of work indicating that there are differential functions of different striatal pathways which likely arise at least in part by differences in connectivity that have been difficult to resolve due to difficulty in isolating pathways within striatal connectivity and several interesting and provocative observations were reported. Several different methodologies are used, with partially convergent results, to support their main points.
However, I have significant technical concerns about the manuscript as presented that make it difficult for me to interpret the results of the experiments. My comments are below.
Major:
There is generally a large caveat to the rabies studies performed here, which is that both TVA and the ChR2-expressing rabies virus have the same fluorophore. It is thus essentially impossible to determine how many starter cells there are, what the efficiency of tracing is, and which part of the striatum is being sampled in any given experiment. This is a major caveat given the spatial topography of the cortico-striatal projections. Furthermore, the authors make a point in the introduction about previous studies not having explored absolute numbers of inputs, yet this is not at all controlled in this study. It could be that their rabies virus simply replicates better in D1-MSNs than D2-MSNs. No quantifications are done, and these possibilities do not appear to have been considered. Without a greater standardization of the rabies experiments across conditions, it is difficult to interpret the results.
We thank the reviewer for raising these questions, which merit further discussion.
Firstly, the primary aim of our study is to investigate the connectivity of the corticostriatal pathway. Given the current technical limitations, it is not feasible to trace all the striatal SPNs connected to a single cortical neuron. Therefore, we approached this from the opposite direction, starting from D1- or D2-SPNs to retrogradely label upstream cortical neurons, and then identifying their connected SPNs via functional synaptic recordings. To achieve this, we employed the only available transsynaptic retrograde method: rabies virus-mediated tracing. Because we crossed D1- or D2-GFP mice with D1- or A2A-Cre mice to identify SPN subtypes during electrophysiological recordings, the conventional rabies-GFP system could not be used to distinguish starter cells without conflicting with the GFP labeling of SPNs. To overcome this, we tagged ChR2 expression with mCherry. In this setup, we recorded from mCherry-negative D1- or D2-SPNs within the injection site and surrounded by mCherry-positive neurons. This ensures that the recorded neurons are topographically matched to the starter cell population and receive input from the same cortical regions. We acknowledge that TVA-only and ChR2-expressing cells are both mCherry-positive and therefore indistinguishable in our system. As such, mCherry-positive cells likely comprise a mixture of starter cells and TVA-only cells, representing a somewhat broader population than starter cells alone. Nevertheless, by restricting recordings to mCherry-negative SPNs within the injection site, it is ensured that our conclusions about functional connectivity remain valid and aligned with the primary objective of this study.
Secondly, if rabies virus replication were significantly more efficient in D1-SPNs than in D2-SPNs, this would likely result in a higher observed connection probability in the D1-projecting group. However, we used consistent genetic strategies across all groups: D1-SPNs were defined as GFP-positive in D1-GFP mice and GFP-negative in D2-GFP mice, with D2-SPNs defined analogously. Recordings from both D1- and D2-SPNs were performed using the same methodology and under the same injection conditions within the same animals. This internal control helps mitigate the possibility that differential rabies infection efficiency biased our results.
With these experimental safeguards in place, we found that 40% of D2-SPNs received input from D1-SPN-projecting cortical neurons, while 73% of D1-SPNs received input from D2-SPN-projecting cortical neurons. Although the ideal scenario would involve an even larger sample size to refine these estimates, the technical demands of post-rabies-infection electrophysiological recordings inherently limit throughput. Nonetheless, our approach represents the most feasible and accurate method currently available, and provides a significant advance in characterizing the functional connectivity within corticostriatal circuits.
The authors claim using a few current clamp optical stimulation experiments that the cortical cells are healthy, but this result was far from comprehensive. For example, membrane resistance, capacitance, general excitability curves, etc are not reported. In Figure S2, some of the conditions look quite different (e.g., S2B, input D2-record D2, the method used yields quite different results that the authors write off as not different). Furthermore, these experiments do not consider the likely sickness and death that occurs in starter cells, as has been reported elsewhere. The health of cells in the circuit is overall a substantial concern that alone could invalidate a large portion, if not all, of the behavioral results. This is a major confound given those neurons are thought to play critical roles in the behaviors being studied. This is a major reason why first-generation rabies viruses have not been used in combination with behavior, but this significant caveat does not appear to have been considered, and controls e.g., uninfected animals, infected with AAV helpers, etc, were not included.
We understand and appreciate the reviewer’s concern regarding the potential cytotoxicity of rabies virus infection. Indeed, this is a critical consideration when interpreting functional connectivity data. We have tested several newer rabies virus variants reported to support extended survival times (Chatterjee et al., 2018; Jin et al., 2024), but unfortunately, these variants did not perform reliably in the corticostriatal circuits we examined.
Given these limitations, we relied on the rabies virus approach originally developed by Osakada et al. (Osakada et al., 2011), which demonstrated that neurons infected with rabies virus expressing ChR2 remain both viable and functional up to at least 10 days post-infection (Fig. 3, cited below). In our own experiments, we further validated the health and viability of cortical neurons, the presynaptic partners of SPNs, particularly around day 7 post-infection.
To minimize the risk of viral toxicity, we performed ex vivo slice recordings within a conservative time window, between 4 and 8 days after infection, when the health of labeled neurons is well maintained. Moreover, the recorded SPNs were consistently mCherry-negative, indicating they were not directly infected by rabies virus, thus further reducing the likelihood of recording from compromised cells.
Taken together, these steps help ensure that our synaptic recordings reflect genuine functional connectivity, rather than artifacts of viral toxicity. We hope this clarifies the rationale behind our experimental design.
For the behavioral tests, including a naïve uninfected group and an AAV helper virus-only group as negative controls could be beneficial to isolate the specific impact of rabies virus infection. However, our primary focus is on the activation of selected presynaptic inputs to D1- or D2-SPNs by optogenetic method. Therefore, comparing stimulated versus non-stimulated trials within the same animal offers more direct and relevant results for our study objectives.
It is also important to note that the ICSS test is particularly susceptible to the potential cytotoxic effects of rabies virus, as it spans a relatively extended period, from Day 4 to Day 12 post-infection. To mitigate this issue, we focused our analysis on the first 7 days of ICSS testing, thereby keeping the behavioral observations within 10 days post-rabies injection. This approach minimizes potential confounds from rabies-induced neurotoxicity while still capturing the relevant behavioral dynamics. Accordingly, we have revised Figure 3 and updated the statistical analyses to reflect this adjustment.
The overall purity (e.g., EnvA-pseudotyping efficiency) of the RABV prep is not shown. If there was a virus that was not well EnvA-pseudotyped and thus could directly infect cortical (or other) inputs, it would degrade specificity.
We agree that anatomical specificity is crucial for accurately labeling inputs to defined SPN populations in our study. The rabies virus strain employed here has been rigorously validated for its specificity in numerous previous studies from our group and others (Aoki et al., 2019; Klug et al., 2018; Osakada et al., 2011; Smith et al., 2016; Wall et al., 2013; Wickersham et al., 2007). For example, in a recent study by Aoki et al. (Aoki et al., 2019), we tested the same rabies virus strain by co-injecting the glycoprotein-deleted rabies virus and the TVA-expressing helper virus, without glycoprotein expressing AAV, into the SNr. As shown in Figure S1 (related to Figure 2), GFP expression was restricted to starter cells within the SNr, with no evidence of transsynaptic labeling in upstream regions such as the striatum, EPN, GPe, or STN (see panels F–H). These findings provide strong evidence that the rabies virus used in our experiments is properly pseudotyped and exhibits high specificity for starter cell labeling without off-target spread.
We appreciate the reviewer’s emphasis on specificity, and we hope this clarification further supports the reliability of our anatomical tracing approach.
While most of the study focuses on the cortical inputs, in slice recordings, inputs from the thalamus are not considered, yet likely contribute to the observed results. Related to this, in in vivo optogenetic experiments, technically, if the thalamic or other inputs to the dorsal striatum project to the cortex, their method will not only target cortical neurons but also terminals of other excitatory inputs. If this cannot be ruled it, stating that the authors are able to selectively activate the cortical inputs to one or the other population should be toned down.
We agree with the reviewer that the thalamus is also a significant source of excitatory input to the striatum. However, current techniques do not allow for precise and exclusive labeling of upstream neurons in a given brain region, such as the cortex or thalamus. This technical limitation indeed makes it difficult to definitively determine whether inputs from these regions follow the same projection rules. Despite this, our findings show that stimulation of defined cortical populations, specifically, D1- or D2-projecting neurons in MCC and M1, elicits behavioral outcomes that closely mirror those observed in our ex vivo slice recordings, providing strong support for the cortical origin of the effects we observed.
In our in vivo optogenetic experiments, we acknowledge that stimulating a specific cortical region may also activate axonal terminals from rabies-infected cortical or thalamic neurons. While somatic stimulation is generally more effective than terminal stimulation, we recognize the possibility that terminals on non-rabies-traced cortical neurons could be activated through presynaptic connections. To address this, we considered the finding of a previous study (Cruikshank et al., 2010), which demonstrated that while brief optogenetic stimulation (0.05 ms) of thalamo-cortical terminals can elicit few action potentials in postsynaptic cortical neurons, sustained terminal stimulation (500 ms) also results in only transient postsynaptic firing rather than prolonged activation (Fig. 3C, cited below). This suggests that cortical neurons exhibit only short-lived responses to continuous presynaptic stimulation of thalamic origin.
In comparison, our behavioral paradigms employed prolonged optogenetic stimulation protocols- 20 Hz, 10 ms pulses for 15 s (open-field test), 1 s (ICSS), and 8 s (FR4/8)—which more closely resemble sustained stimulation conditions. Given these parameters, and the robust behavioral responses observed, it means that the effects are primarily mediated by activation of rabies-labeled, ChR2-expressing D1- or D2-projecting cortical neurons rather than indirect activation through thalamic input.
We appreciate the reviewer’s valuable comment, and we have now incorporated this point into the revised manuscript (page 13, line 265 to 275) to more clearly address the potential contribution of thalamic inputs in our experimental design.
The statements about specificity of connectivity are not well-founded. It may be that in the specific case where they are assessing outside of the area of injections, their conclusions may hold (e.g., excitatory inputs onto D2s have more inputs onto D1s than vice versa). However, how this relates to the actual site of injection is not clear. At face value, if such a connectivity exists, it would suggest that D1-MSNs receive substantially more overall excitatory inputs than D2s. It is thus possible that this observation would not hold over other spatial intervals. This was not explored and thus the conclusions are over-generalized. e.g., the distance from the area of red cells in the striatum to recordings was not quantified, what constituted a high level of cortical labeling was not quantified, etc. Without more rigorous quantification of what was being done, it is difficult to interpret the results.
We sincerely thank the reviewer for the thoughtful comments and critical insights into our interpretation of connectivity data. These concerns are valid and provide an important opportunity to clarify and reinforce our experimental design and conclusions.
Firstly, as described in our previous response, all patched neurons were carefully selected to be within the injection site and in close proximity to ChR2-mCherry-positive cells. Specifically, the estimated distance from each recorded neuron to the nearest starter cells did not exceed 100 µm. This design choice was made to minimize variability associated with spatial distance or heterogeneity in viral expression, thereby allowing for a more consistent sampling of putatively connected neurons.
Secondly, quantifying both the number of starter and input neurons would, in principle, provide a more comprehensive picture of connectivity. However, given the technical limitations of the current approach particularly when combining rabies tracing with functional recordings it is not feasible to obtain such precise cell counts. Instead, we focused on connection ratios derived from targeted electrophysiological recordings, which offer a reliable and practical means of estimating connectivity within these defined circuits.
Thirdly, regarding the potential influence of rabies-labeled neurons beyond the immediate recording site: while we acknowledge that rabies tracing labels a broad set of upstream neurons, our analysis was confined to a well-defined and localized area. The analogy we find helpful here is that of a spotlight - our recordings were restricted to the illuminated region directly under the beam, where the projection pattern is fixed and interpretable, regardless of what lies outside that area. Although we cannot fully account for all possible upstream connections, our methodology was designed to minimize variability and maintain consistency in the region of interest, which we believe supports the robustness of our conclusions in the ex vivo slice recording experiment.
We hope this additional explanation addresses the reviewer’s concerns and helps clarify the rationale of our experimental strategy.
The results in figure 3 are not well controlled. The authors show contrasting effects of optogenetic stimulation of D1-MSNs and D2-MSNs in the DMS and DLS, results which are largely consistent with the canon of basal ganglia function. However, when stimulating cortical inputs, stimulating the inputs from D1-MSNs gives the expected results (increased locomotion) while stimulating putative inputs to D2-MSNs had no effect. This is not the same as showing a decrease in locomotion - showing no effect here is not possible to interpret.
We apologize for any confusion and appreciate the opportunity to clarify this point. Our electrophysiological recordings demonstrated that D1-projecting cortical neurons preferentially innervate D1-SPNs in the striatum, whereas D2-projecting cortical neurons provide input to both D1- and D2-SPNs, without a clear preference. These synaptic connectivity patterns are further supported by our behavioral experiments: optogenetic stimulation of D1-projecting neurons in cortical areas such as MCC and M1 led to behavioral effects consistent with direct D1-SPN activation. In contrast, stimulation of D2-projecting cortical neurons produced behavioral outcomes that appeared to reflect a mixture of both D1- and D2-SPN activation.
We acknowledge that interpreting negative behavioral findings poses inherent challenges, as it is difficult to distinguish between a true lack of effect and insufficient experimental manipulation. To mitigate this, we ensured that all animals included in the analysis exhibited appropriate viral expression and correctly placed optic fibers in the targeted regions. These controls help to confirm that the observed behavioral effects - or lack thereof - are indeed due to the activation of the intended neuronal populations rather than technical artifacts such as weak expression or fiber misplacement.
As shown in Author response image 1 below, our verification of virus expression and fiber positioning confirms effective targeting in MCC and M1 of A2A-Cre mice. Therefore, we interpret the negative behavioral outcomes as meaningful consequences of specific neural circuit activation.
Author response image 1.
Confocal image from A2A-Cre mouse showing targeted optogenetic stimulation of D2-projecting cortical neurons in MCC or M1. ChR2-mCherry expression highlights D2-projecting neurons, selectively labeled via rabies-mediated tracing. Optic fiber placement is confirmed above the cortical region of interest. Image illustrates robust expression and anatomical specificity necessary for pathway-selective stimulation in behavioral assays.
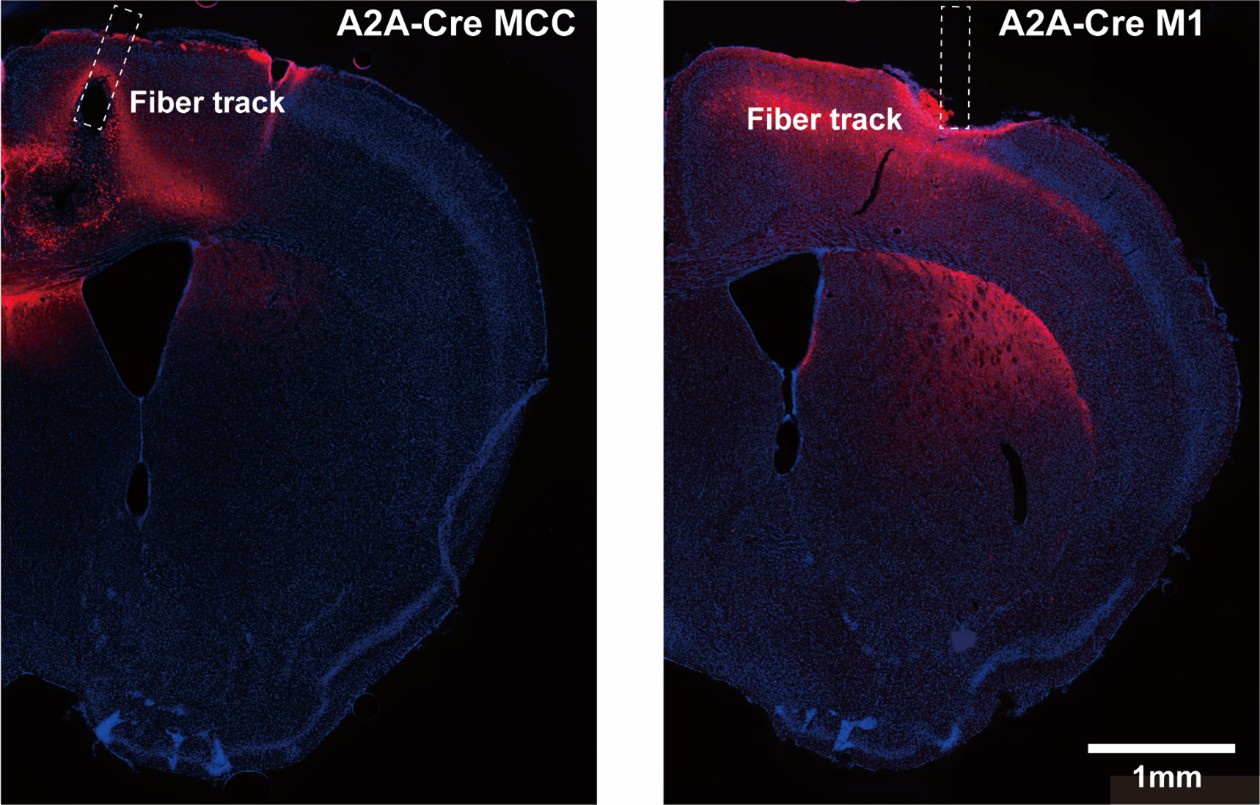
In light of their circuit model, the result showing that inputs to D2-MSNs drive ICSS is confusing. How can the authors account for the fact that these cells are not locomotor-activating, stimulation of their putative downstream cells (D2-MSNs) does not drive ICSS, yet the cortical inputs drive ICSS? Is the idea that these inputs somehow also drive D1s? If this is the case, how do D2s get activated, if all of the cortical inputs tested net activate D1s and not D2s? Same with the results in figure 4 - the inputs and putative downstream cells do not have the same effects. Given the potential caveats of differences in viral efficiency, spatial location of injections, and cellular toxicity, I cannot interpret these experiments.
We apologize for any confusion in our previous explanation. In our behavioral experiments, the primary objective was to determine whether activation of D1- or D2-projecting cortical neurons would produce behavioral outcomes distinct from those observed with pure D1 or D2 activation.
Our findings show that stimulation of D1-projecting cortical neurons produced behavioral effects closely resembling those of selective D1 activation in both open field and ICSS tests. This is consistent with our slice recording data, which revealed that D1-projecting cortical neurons exhibit a higher connection probability with D1-SPNs than with D2-SPNs.
In contrast, interpreting the effects of D2-projecting cortical neuron stimulation is inherently more nuanced. In the open field test, activation of these neurons did not significantly modulate local motion. This could reflect a balanced influence of D1 activation, which facilitates movement, and D2 activation, which suppresses it - resulting in a net neutral behavioral outcome. In the ICSS test, the absence of a strong reinforcement effect typically associated with D2 activation, combined with partial reinforcement likely due to concurrent D1 activation, suggests that stimulation of D2-projecting neurons produces a mixed behavioral signal. This outcome supports the interpretation that these neurons synapse onto both D1- and D2-SPNs, leading to a blended behavioral response that differs from selective D1 or D2 activation alone.
Together, these two behavioral assays offer complementary perspectives, providing a more complete view of how projection-specific cortical inputs influence striatal output and behavior.
In Figure 4 of the current manuscript (as cited below), we show that optogenetic activation of MCC neurons projecting to D1-SPNs facilitates sequence lever pressing, whereas activation of MCC neurons projecting to D2-SPNs does not induce significant behavioral changes. Conversely, activation of M1 neurons projecting to either D1- or D2-SPNs enhances lever pressing sequences. These observations align with our prior findings (Geddes et al., 2018; Jin et al., 2014), where we demonstrated that in the striatum, D1-SPN activation facilitates ongoing lever pressing, whereas D2-SPN activation is more involved in suppressing ongoing actions and promoting transitions between sub-sequences, shown in Fig. 4 from (Geddes et al., 2018; Jin et al., 2014) and Fig. 5K from (Jin et al., 2014) . Taken together, the facilitation of lever pressing by D1-projecting MCC and M1 neurons is consistent with their preferential connectivity to D1-SPNs and their established behavioral role.
What is particularly intriguing, though admittedly more complex, is the behavioral divergence observed upon activation of D2-SPN-projecting cortical neurons. Activation of D2-projecting MCC neurons does not alter lever pressing, possibly reflecting a counterbalancing effect from concurrent D1- and D2-SPN activation. In contrast, stimulation of D2-projecting M1 neurons facilitates lever pressing, albeit less robustly than their D1-projecting counterparts. This discrepancy may reflect regional differences in striatal targets, DMS for MCC versus DLS for M1, as also supported by our open field test results. Furthermore, our recent findings (Zhang et al., 2025) show that synaptic strength from Cg to D2-SPNs is stronger than to D1-SPNs, whereas the M1 pathway exhibits the opposite pattern. These data suggest that beyond projection ratios, synaptic strength also shapes cortico-striatal functional output. Thus, stronger D2-SPN synapses in the DMS may offset D1-SPN activation during MCC-D2 stimulation, dampening lever pressing increase. Conversely, weaker D2 synapses in the DLS may permit M1-D2 projections to facilitate behavior more readily.
In summary, the behavioral outcomes of our optogenetic manipulations support the proposed asymmetric cortico-striatal connectivity model. While the effects of D2-projecting neurons are not uniform, they reflect varying balances of D1 and D2-SPN influence, which further underscores the asymmetrical connections of cortical inputs to the striatum.
Recommendations For The Authors:
Reviewer #1 (Recommendations For The Authors):
(1) What are the sample sizes for Fig S2? Some trends that are listed as nonsignificant look like they may just be underpowered. Related to this point, S2C indicates that PPR is statistically similar in all conditions. The traces shown in Figure 2 suggest that PPR is quite different in "Input D1"- vs "Input D2" projections. If there is indeed no difference, the exemplar traces should be replaced with more representative ones to avoid confusion.
Thank you for your suggestion. The sample size reported in Figure S2 corresponds to the neurons identified as connected in Figure 2. The representative traces shown in Figure 2 were selected based on their close alignment with the amplitude statistics and are intended to reflect typical responses. Given this, it is appropriate to retain the current examples as they accurately illustrate the underlying data.
(2) Previous studies have described that SPN-SPN collateral inhibition is also asymmetric, with D2->D1 SPN connectivity stronger than the other direction. While cortical inputs to D2-SPNs may also strongly innervate D1-SPNs, it would be helpful to speculate on how collateral inhibition may further shape the biases (or lack thereof) reported here.
This would indeed be an interesting topic to explore. SPN-SPN mutual inhibition and/or interneuron inhibition may also play a role in the functional organization and output of the striatum. In the present study, we focused on the primary layer of cortico-striatal connectivity to examine how cortical neurons selectively connect to the striatal direct and indirect pathways, as these pathways have been shown to have distinct yet cooperative functions. To achieve this, we applied a GABAA receptor inhibitor to isolate only excitatory synaptic currents in SPNs, yielding the relevant results.
To investigate additional circuit organization involving SPN-SPN mutual inhibition, the current available technique would involve single-cell initiated rabies tracing. This approach would help identify the starter SPN and the upstream SPNs that provide input to the starter cell, thereby offering a clearer understanding of the local circuit.
(3) In Fig 3N-S there are no stats confirming that optogenetic stimulation does indeed increase lever pressing in each group (though it obviously looks like it does). It would be helpful to add statistics for this comparison, in addition to the between-group comparisons that are shown.
We thank the reviewer for this thoughtful suggestion. To assess whether optogenetic stimulation increases lever pressing in each group shown in Figures 3O, 3P, 3R, and 3S, we employed a permutation test (10,000 permutations). This non-parametric statistical method does not rely on assumptions about the underlying data distribution and is particularly appropriate for our analysis given the relatively small sample sizes.
Additionally, in response to Reviewer 3’s concern regarding the potential cytotoxicity of rabies virus affecting behavioral outcomes during in vivo optogenetic stimulation experiments, we focused our analysis on Days 1 through 7 of the ICSS test. This time window remains within 10 days post-rabies infection, a period during which previous studies have reported minimal cytopathic effects (Osakada et al., 2011).
Accordingly, we have updated Figure 3N-S and revised the associated statistical analyses in the figure legend as follows:
(O-P) D1-SPN (red) but not D2-SPN stimulation (black) drives ICSS behavior in both the DMS (O: D1, n = 6, permutation test, slope = 1.5060, P = 0.0378; D2, n = 5, permutation test, slope = -0.2214, P = 0.1021; one-tailed Mann Whitney test, Day 7 D1 vs. D2, P = 0.0130) and the DLS (P: D1, n = 6, permutation test, slope = 28.1429, P = 0.0082; D2, n = 5, permutation test, slope = -0.3429, P = 0.0463; one-tailed Mann Whitney test, Day 7 D1 vs. D2, P = 0.0390). *, P < 0.05. (Q) Timeline of helper virus injections, rabies-ChR2 injections and optogenetic stimulation for ICSS behavior. (R-S) Optogenetic stimulation of the cortical neurons projecting to either D1- or D2-SPNs induces ICSS behavior in both the MCC (R: MCC-D1, n = 5, permutation test, Day1-Day7, slope = 2.5857, P = 0.0034; MCC-D2, n = 5, Day2-Day7, permutation test, slope = 1.4229, P = 0.0344; no significant effect on Day7, MCC-D1 vs. MCC-D2, two-tailed Mann Whitney test, P = 0.9999) and the M1 (S: M1-D1, n = 5, permutation test, Day1-Day7, slope = 1.8214, P = 0.0259; M1-D2, n = 5, Day1-Day7, permutation test, slope = 1.8214, P = 0.0025; no significant effect on Day7, M1-D1 vs. M1-D2, two-tailed Mann Whitney test, P = 0.3810). n.s., not statistically significant.
We believe this updated analysis and additional context further strengthen the validity of our conclusions regarding the reinforcement effects.
(4) Line 206: mice were trained for "a few more days" is not a very rigorous description. It would be helpful to state the range of additional days of training.
We thank the reviewer for the suggestion. In accordance with the Methods section, we have now specified the number of days, which is 4 days, in the main text (line 207).
(5) In Fig 4D,H, the statistical comparison is relative modulation (% change) by stimulation of D1- vs D2- projecting inputs. Please show statistics comparing the effect of stimulation on lever presses for each individual condition. For example, is the effect of MCC-D2 stimulation in panel D negative or not significant?
Thank you for your suggestion. Below are the statistical results, which we have also incorporated into the figure legend for clarity. To assess the net effects of each manipulation, we compared the observed percentage changes with a theoretical value of zero.
In Figure 4D, optogenetic stimulation of D1-projecting MCC neurons significantly increased the pressing rate (MCC-D1, n = 8, one-sample two-tailed t-test, t = 2.814, P = 0.0131), whereas stimulation of D2-projecting MCC neurons did not produce a significant effect (MCC-D2, n = 7, one-sample two-tailed t-test, t = 0.8481, P = 0.4117).
In contrast, Figure 4H shows that optogenetic stimulation of both D1- and D2-projecting M1 neurons significantly increased the sequence press rate (M1-D1, n = 6, one-sample two-tailed Wilcoxon signed-rank test, P = 0.0046; M1-D2, n = 7, one-sample two-tailed Wilcoxon signed-rank test, P = 0.0479).
These analyses help clarify the distinct behavioral effects of manipulating different corticostriatal projections.
(6) Are data in Fig 1G-H from a D1- or A2a- cre mouse?
The data in Fig 1G-H are from a D1-Cre mouse.
(7) In Fig S3 it looks like there may actually be an effect of 20Hz simulation of D2-SPNs. Though it probably doesn't affect the interpretation.
As indicated by the statistics, there is a slight, but not statistically significant, decrease in local motion when 20 Hz stimulation is delivered to the motor cortex with ChR2 expression in D2-SPNs in the striatum.
Reviewer #2 (Recommendations For The Authors):
The rabies tracing is referred to on several occasions as "new" but the reference papers are from 2011, 2013, and 2018. It is unclear what is new about the system used in the paper and what new feature is relevant to the experiments that were performed. Either clarify or remove "new" terminology.
Thank you for bringing this to our attention. We have revised the relevant text accordingly at line 20 in the Abstract, line 31 in the In Brief, line 69 in the Introduction, line 83 in the Results, and line 226 in the Discussion to improve clarity and accuracy.
In Figure 2 D and G, D1 eGFP (+) and D2 eGFP(-) are plotted separately. These are the same cell type; therefore it may work best to combine that data. This could also be done for 'input to D2- Record D2' in panel D as well as 'input D1-Record D2' and 'input D2-Record D1' in panel G. Combining the information in panel D and G and comparing all 4 conditions to each other would give a better understanding of the comparison of functional connectivity between cortical neurons and D1 and D2 SPNs.
We thank the reviewer for the thoughtful suggestion. While presenting single bars for each condition (e.g., ‘input D1 - record D1’) might improve visual simplicity, it would obscure an important aspect of our experimental design. Specifically, we aimed to highlight that the comparisons between D1- and D2-projecting neurons to D1 and D2 SPNs were counterbalanced within the same animals - not just across different groups. By showing both D1-eGFP(+) and D2-eGFP(-), or vice versa, within each group and at similar proportions, we provide a more complete picture of the internal control built into our design. This format helps ensure the audience that our conclusions are not biased by group-level differences, but are supported by within-subject comparisons. Therefore, that the current presentation better could serve to communicate the rigor and balance of our experimental approach.
The findings in Figure 2 are stated as D1 projecting excitatory inputs have a higher probability of targeting D1 SPNs while D2 projecting excitatory inputs target both D1 SPNs and D2 SPNs. It may be more clear to say that some cortical neurons project specifically to D1 SPNs while other cortical neurons project to both D1 and D2 SPNs equally. A better summary diagram could also help with clarity.
Thank you for bringing this up. The data we present reflect the connection probabilities of D1- or D2-projecting cortical neurons to D1 or D2 SPNs. One possible interpretation is like the reviewer said that a subset of cortical neurons preferentially target D1 SPNs, while others exhibit more balanced projections to both D1 and D2 SPNs. However, we cannot rule out alternative explanations - for example, that some D2-projecting neurons preferentially target D2 SPNs, or that the observed differences arise from the overall proportions of D1- and D2-projecting cortical neurons connecting to each striatal subtype.
There are multiple possible patterns of connectivity that could give rise to the observed differences in connection ratios. Based on our current data, we can confidently conclude the existence of asymmetric cortico-striatal projections to the direct and indirect pathways, but the precise nature of this asymmetry will require further investigation.
Figure 4 introduces the FR8 task, but there are similar takeaways to the findings from Figure 3. Is there another justification for the FR8 task or interesting way of interpreting that data that could add richness to the manuscript?
The FR8 task is a self-initiated operant sequence task that relies on motor learning mechanisms, whereas the open field test solely assesses spontaneous locomotion. Furthermore, the sequence task enables us to dissect the functional role of specific neuronal populations in the initiation, maintenance, and termination of sequential movements through closed-loop optogenetic manipulations integrated into the task design. These methodological advantages underscore the rationale for including Figure 4 in the manuscript, as it highlights the unique insights afforded by this experimental paradigm.
I am somewhat surprised to see that D1-SPN stimulation in DLS gave the results in Figure 3 F and P, as mentioned in the public review. These contrast with some previous results (Cui et al, J Neurosci, 2021). Any explanation? Would be useful to speculate or compare parameters as this could have important implications for DLS function.
Thank you for raising this point. While Cui’s study has generated some debate, several independent investigations have consistently demonstrated that stimulation of D1-SPNs in the dorsolateral striatum (DLS) facilitates local motion and lever-press behaviors (Dong et al., 2025; Geddes et al., 2018; Kravitz et al., 2010). These findings support the functional role of D1-SPNs in promoting movement and motivated actions.
The differences in behavioral outcomes observed between our study and that of Cui et al. may stem from several methodological factors, particularly related to anatomical targeting and optical stimulation parameters.
Specifically, our experiments targeted the DMS at AP +0.5 mm, ML ±1.5 mm, DV –2.2 mm, and the DLS at AP +0.5 mm, ML ±2.5 mm, DV –2.2 mm. In contrast, Cui’s study targeted the DMS at AP +0.9 mm, ML ±1.4 mm, DV –3.0 mm, and the DLS at AP +0.7 mm, ML ±2.3 mm, DV –3.0 mm. These differences indicate that their targeting was slightly more rostral and more ventral than ours, which could have led to stimulation of distinct neuronal populations within the striatum, potentially accounting for variations in behavioral effects observed during optogenetic activation.
In addition, the optical fibers used in the two studies differed markedly. We employed optical fibers with a 200 µm core diameter and a numerical aperture (NA) of 0.37. Cui’s study used fibers with a larger core diameter (250 µm) and a higher NA (0.66), which would produce a broader spread and deeper penetration of light. This increased photostimulation volume may have recruited a more extensive network of neurons, possibly including off-target circuits, thus influencing the behavioral outcomes in a manner not seen in our more spatially constrained stimulation paradigm.
Taken together, these methodological differences, both in anatomical targeting and optical stimulation parameters, likely contribute to the discrepancies in behavioral results observed between the two studies. Our findings, consistent with other independent reports, support the role of D1-SPNs in facilitating movement and reinforcement behaviors under more controlled and localized stimulation conditions.
Reviewer #3 (Recommendations For The Authors):
Minor:
The authors repeatedly state that they are using a new rabies virus system, but the system has been in widespread use for 16 years, including in the exact circuits the authors are studying, for over a decade. I would not consider this new.
Thank you for bringing this to our attention. We have revised the relevant text accordingly at line 20 in the Abstract, line 31 in the In Brief, line 69 in the Introduction, line 83 in the Results, and line 226 in the Discussion to improve clarity and accuracy.
Figure 2G, how many mice were used for recordings?
In Fig. 2G, we used 8 mice in the D1-projecting to D2 EGFP(+) group, 7 mice in the D1-projecting to D1 EGFP(-) group, 8 mice in the D2-projecting to D1 EGFP(+) group, and 10 mice in the D2-projecting to D2 EGFP(-) group.
The amplitude of inputs was not reported in figure 2. This is important, as the strength of the connection matters. This is reported in Figure S2, but how exactly this relates to the presence or absence of connections should be made clearer.
The amplitude data presented in Figure S2 summarize all recorded currents from confirmed connections, as detailed in the Methods section. A connection is defined by the presence of a detectable and reliable postsynaptic current with an onset latency of less than 10 ms following laser stimulation.
Reference in the reply-to-review comments:
Aoki, S., Smith, J.B., Li, H., Yen, X.Y., Igarashi, M., Coulon, P., Wickens, J.R., Ruigrok, T.J.H., and Jin, X. (2019). An open cortico-basal ganglia loop allows limbic control over motor output via the nigrothalamic pathway. Elife 8, e49995.
Chatterjee, S., Sullivan, H.A., MacLennan, B.J., Xu, R., Hou, Y.Y., Lavin, T.K., Lea, N.E., Michalski, J.E., Babcock, K.R., Dietrich, S., et al. (2018). Nontoxic, double-deletion-mutant rabies viral vectors for retrograde targeting of projection neurons. Nat Neurosci 21, 638-646.
Cruikshank, S.J., Urabe, H., Nurmikko, A.V., and Connors, B.W. (2010). Pathway-Specific Feedforward Circuits between Thalamus and Neocortex Revealed by Selective Optical Stimulation of Axons. Neuron 65, 230-245.
Dong, J., Wang, L.P., Sullivan, B.T., Sun, L.X., Smith, V.M.M., Chang, L.S., Ding, J.H., Le, W.D., Gerfen, C.R., and Cai, H.B. (2025). Molecularly distinct striatonigral neuron subtypes differentially regulate locomotion. Nat Commun 16, 2710.
Geddes, C.E., Li, H., and Jin, X. (2018). Optogenetic Editing Reveals the Hierarchical Organization of Learned Action Sequences. Cell 174, 32-43.
Jin, L., Sullivan, H.A., Zhu, M., Lavin, T.K., Matsuyama, M., Fu, X., Lea, N.E., Xu, R., Hou, Y.Y., Rutigliani, L., et al. (2024). Long-term labeling and imaging of synaptically connected neuronal networks in vivo using double-deletion-mutant rabies viruses. Nat Neurosci 27, 373-383.
Jin, X., Tecuapetla, F., and Costa, R.M. (2014). Basal ganglia subcircuits distinctively encode the parsing and concatenation of action sequences. Nat Neurosci 17, 423-430.
Klug, J.R., Engelhardt, M.D., Cadman, C.N., Li, H., Smith, J.B., Ayala, S., Williams, E.W., Hoffman, H., and Jin, X. (2018). Differential inputs to striatal cholinergic and parvalbumin interneurons imply functional distinctions. Elife 7, e35657.
Kravitz, A.V., Freeze, B.S., Parker, P.R.L., Kay, K., Thwin, M.T., Deisseroth, K., and Kreitzer, A.C. (2010). Regulation of parkinsonian motor behaviours by optogenetic control of basal ganglia circuitry. Nature 466, 622-626.
Osakada, F., Mori, T., Cetin, A.H., Marshel, J.H., Virgen, B., and Callaway, E.M. (2011). New Rabies Virus Variants for Monitoring and Manipulating Activity and Gene Expression in Defined Neural Circuits. Neuron 71, 617-631.
Smith, J.B., Klug, J.R., Ross, D.L., Howard, C.D., Hollon, N.G., Ko, V.I., Hoffman, H., Callaway, E.M., Gerfen, C.R., and Jin, X. (2016). Genetic-Based Dissection Unveils the Inputs and Outputs of Striatal Patch and Matrix Compartments. Neuron 91, 1069-1084.
Wall, N.R., De La Parra, M., Callaway, E.M., and Kreitzer, A.C. (2013). Differential Innervation of Direct- and Indirect-Pathway Striatal Projection Neurons. Neuron 79, 347-360.
Wickersham, I.R., Lyon, D.C., Barnard, R.J.O., Mori, T., Finke, S., Conzelmann, K.K., Young, J.A.T., and Callaway, E.M. (2007). Monosynaptic restriction of transsynaptic tracing from single, genetically targeted neurons. Neuron 53, 639-647.
Zhang, B.B., Geddes, C.E., and Jin, X. (2025) Complementary corticostriatal circuits orchestrate action repetition and switching. Sci Adv, in press.
Zhu, Z.G., Gong, R., Rodriguez, V., Quach, K.T., Chen, X.Y., and Sternson, S.M. (2025). Hedonic eating is controlled by dopamine neurons that oppose GLP-1R satiety. Science 387, eadt0773.
Author response:
The following is the authors’ response to the original reviews.
Reviewer #1 (Public review):
Summary:
In this study, Ana Lapao et al. investigated the roles of Rab27 effector SYTL5 in cellular membrane trafficking pathways. The authors found that SYTL5 localizes to mitochondria in a Rab27A-dependent manner. They demonstrated that SYTL5-Rab27A positive vesicles containing mitochondrial material are formed under hypoxic conditions, thus they speculate that SYTL5 and Rab27A play roles in mitophagy. They also found that both SYTL5 and Rab27A are important for normal mitochondrial respiration. Cells lacking SYTL5 undergo a shift from mitochondrial oxygen consumption to glycolysis which is a common process known as the Warburg effect in cancer cells. Based on the cancer patient database, the author noticed that low SYTL5 expression is related to reduced survival for adrenocortical carcinoma patients, indicating SYTL5 could be a negative regulator of the Warburg effect and potentially tumorigenesis.
Strengths:
The authors take advantage of multiple techniques and novel methods to perform the experiments.
(1) Live-cell imaging revealed that stably inducible expression of SYTL5 co-localized with filamentous structures positive for mitochondria. This result was further confirmed by using correlative light and EM (CLEM) analysis and western blotting from purified mitochondrial fraction.
(2) In order to investigate whether SYTL5 and Rab27A are required for mitophagy in hypoxic conditions, two established mitophagy reporter U2OS cell lines were used to analyze the autophagic flux.
Weaknesses:
This study revealed a potential function of SYTL5 in mitophagy and mitochondrial metabolism. However, the mechanistic evidence that establishes the relationship between SYTL5/Rab27A and mitophagy is insufficient. The involvement of SYTL5 in ACC needs more investigation. Furthermore, images and results supporting the major conclusions need to be improved.
We thank the reviewer for their constructive comments. We agree that a complete understanding of the mechanism by which SYTL5 and Rab27A are recruited to the mitochondria and subsequently involved in mitophagy requires further investigation. Here, we have shown that SYTL5 recruitment to the mitochondria requires both its lipid-binding C2 domains and the Rab27A-binding SHD domain (Figure 1G-H). This implies a coincidence detection mechanism for mitochondrial localisation of SYTL5. Additionally, we find that mitochondrial recruitment of SYTL5 is dependent on the GTPase activity and mitochondrial localisation of Rab27A (Figure 2D-E). We also identified proteins linked to the cellular response to oxidative stress, reactive oxygen species metabolic process, regulation of mitochondrion organisation and protein insertion into mitochondrial membrane to be enriched in the SYTL5 interactome (Figure 3A and C).
However, less details regarding the mitochondrial localisation of Rab27A are understood. To investigate this, we have now performed a mass spectrometry analysis to identify the interactome of Rab27A (see Author response table 1 below,). U2OS cells with stable expression of mScarlet-Rab27A or mScarlet only, were subjected to immunoprecipitation, followed by MS analysis. Of the 32 significant Rab27A-interacting hits (compared to control), two of the hits are located in the inner mitochondrial membrane (IMM); ATP synthase F(1) complex subunit alpha (P25705), and mitochondrial very long-chain specific acyl-CoA dehydrogenase (VLCAD)(P49748). However, as these IMM proteins are not likely involved in mitochondrial recruitment of Rab27A, observed under basal conditions, we choose not to include these data in the manuscript.
It is known that other RAB proteins are recruited to the mitochondria. During parkin-mediated mitophagy, RABGEF1 (a guanine nucleotide exchange factor) is recruited through its ubiquitin-binding domain and directs mitochondrial localisation of RAB5, which subsequently leads to recruitment of RAB7 by the MON1/CCZ1 complex[1]. As already mentioned in the discussion (p. 12), ubiquitination of the Rab27A GTPase activating protein alpha (TBC1D10A) is reduced in the brain of Parkin KO mouse compared to controls[35], suggesting a possible connection of Rab27A with regulatory mechanisms that are linked with mitochondrial damage and dysfunction. While this an interesting avenue to explore, in this paper we will not follow up further on the mechanism of mitochondrial recruitment of Rab27A.
Author response table 1.
Rab27A interactome. Proteins co-immunoprecipitated with mScarlet-Rab27A vs mScarlet expressing control. The data show average of three replicates.
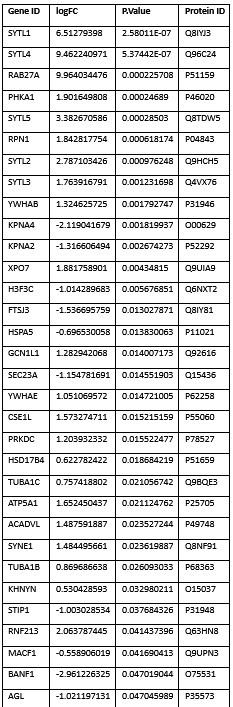
To investigate the role of SYTL5 in the context of ACC, we acquired the NCI-H295R cell line isolated from the adrenal gland of an adrenal cancer patient. The cells were cultured as recommended from ATCC using DMEM/F-12 supplemented with NuSerum and ITS +premix. It is important to note that the H295R cells were adapted to grow as an adherent monolayer from the H295 cell line which grows in suspension. However, there can still be many viable H295R cells in the media.
We attempted to conduct OCR and ECAR measurements using the Seahorse XF upon knockdown of SYTL5 and/or Rab27A in H295R cells. For these assays, it is essential that the cells be seeded in a monolayer at 70-90% confluency with no cell clusters[4]. Poor adhesion of the cells can cause inaccurate measurements by the analyser. Unfortunately, the results between the five replicates we carried out were highly inconsistent, the same knockdown produced trends in opposite directions in different replicates. This is likely due to problems with seeding the cells. Despite our best efforts to optimise seeding number, and pre-coating the plate with poly-D-lysine[5] we observed poor attachment of cells and inability to form a monolayer.
To study the localisation of SYTL5 and Rab27A in an ACC model, we transduced the H295R cells with lentiviral particles to overexpress pLVX-SV40-mScarlet-I-Rab27A and pLVX-CMV-SYTL5-EGFP-3xFLAG. Again, this proved unsuccessful after numerous attempts at optimising transduction.
These issues limited our investigation into the role of SYTL5 in ACC to the cortisol assay (Supplementary Figure 6). For this the H295R cells were an appropriate model as they are able to produce an array of adrenal cortex steroids[6] including cortisol[7]. In this assay, measurements are taken from cell culture supernatants, so the confluency of the cells does not prevent consistent results as the cortisol concentration was normalised to total protein per sample. With this assay we were able to rule out a role for SYTL5 and Rab27A in the secretion of cortisol.
Another consideration when investigating the involvement of SYTL5 in ACC, is that in general ACC cells should have a low expression of SYTL5 as is seen from the patient expression data (Figure 6B).
The reviewer also writes “Furthermore, images and results supporting the major conclusions need to be improved.”. We have tried several times, without success, to generate U2OS cells with CRISPR/Cas9-mediated C-terminal tagging of endogenous SYTL5 with mNeonGreen, using an approach that has been successfully implemented in the lab for other genes. This is likely due to a lack of suitable sgRNAs targeting the C-terminal region of SYTL5, which have a low predicted efficiency score and a large number of predicted off-target sites in the human genome including several other gene exons and introns (see Author response image 2).
We have also included new data (Supplementary Figure 4B) showing that some of the hypoxia-induced SYTL5-Rab27A-positive vesicles stain positive for the autophagy markers p62 and LC3B when inhibiting lysosomal degradation, further strengthening our data that SYTL5 and Rab27A function as positive regulators of mitophagy.
Reviewer #2 (Public review):
Summary:
The authors provide convincing evidence that Rab27 and STYL5 work together to regulate mitochondrial activity and homeostasis.
Strengths:
The development of models that allow the function to be dissected, and the rigorous approach and testing of mitochondrial activity.
Weaknesses:
There may be unknown redundancies in both pathways in which Rab27 and SYTL5 are working which could confound the interpretation of the results.
Suggestions for revision:
Given that Rab27A and SYTL5 are members of protein families it would be important to exclude any possible functional redundancies coming from Rab27B expression or one of the other SYTL family members. For Rab27 this would be straightforward to test in the assays shown in Figure 4 and Supplementary Figure 5. For SYTL5 it might be sufficient to include some discussion about this possibility.
We thank the reviewer for pointing out the potential redundancy issue for Rab27A and SYTL5. There are multiple studies demonstrating the redundancy between Rab27A and Rab27B. For example, in a study of the disease Griscelli syndrome, caused by Rab27A loss of function, expression of either Rab27A or Rab27B rescues the healthy phenotype indicating redundancy[8]. This redundancy however applies to certain function and cell types. In fact, in a study regarding hair growth, knockdown of Rab27B had the opposite effect to knockdown of Rab27A[9].
In this paper, we conducted all assays in U2OS cells, in which the expression of Rab27B is very low. Human Protein Atlas reports expression of 0.5nTPM for Rab27B, compared to 18.4nTPM for Rab27A. We also observed this low level of expression of Rab27B compared to Rab27A by qPCR in U2OS cells. Therefore, there would be very little endogenous Rab27B expression in cells depleted of Rab27A (with siRNA or KO). In line with this, Rab27B peptides were not detected in our SYTL5 interactome MS data (Table 1 in paper). Moreover, as Rab27A depletion inhibits mitochondrial recruitment of SYTL5 and mitophagy, it is not likely that Rab27B provides a functional redundancy. It is possible that Rab27B overexpression could rescue mitochondrial localisation of SYTL5 in Rab27A KO cells, but this was not tested as we do not have any evidence for a role of Rab27B in these cells. Taken together, we believe our data imply that Rab27B is very unlikely to provide any functional redundancy to Rab27A in our experiments.
For the SYTL family, all five members are Rab27 effectors, binding to Rab27 through their SHD domain. Together with Rab27, all SYTL’s have been implicated in exocytosis in different cell types. For example, SYTL1 in exocytosis of azurophilic granules from neutrophils[10], SYTL2 in secretion of glucagon granules from pancreatic α cells[11], SYTL3 in secretion of lytic granules from cytotoxic T lymphocytes[12], SYTL4 in exocytosis of dense hormone containing granules from endocrine cells[13] and SYTL5 in secretion of the RANKL cytokine from osteoblasts[14]. This indicates a potential for redundancy through their binding to Rab27 and function in vesicle secretion/trafficking. However, one study found that different Rab27 effectors have distinct functions at different stages of exocytosis[15].
Very little known about redundancy or hierarchy between these proteins. Differences in function may be due to the variation in gene expression profile across tissues for the different SYTL’s (see Author response image 1 below). SYTL5 is enriched in the brain unlike the others, suggesting possible tissue specific functions. There are also differences in the binding affinities and calcium sensitivities of the C2iA and C2B domains between the SYTL proteins[16].
Author response image 1.
GTEx Multi Gene Query for SYTL1-5
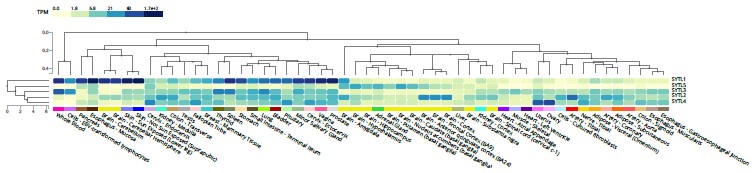
All five SYTL’s are expressed in the U2OS cell line with nTPMs according to Human Protein Atlas of SYTL1: 7.5, SYTL2: 13.4, SYTL3:14.2, SYTL4: 8.7, SYTL5: 4.8. In line with this, in the Rab27A interactome, when comparing cells overexpressing mScarlet-Rab27A with control cells, we detected all five SYTL’s as specific Rab27A-interacting proteins (see Author response table 1 above). Whereas, in the SYTL5 interactome we did not detect any other SYTL protein (table 1 in paper), confirming that they do not form a complex with SYTL5.
We have included the following text in the discussion (p. 12): “SYTL5 and Rab27A are both members of protein families, suggesting possible functional redundancies from Rab27B or one of the other SYTL isoforms. While Rab27B has a very low expression in U2OS cells, all five SYTL’s are expressed. However, when knocking out or knocking down SYTL5 and Rab27A we observe significant effects that we presume would be negated if their isoforms were providing functional redundancies. Moreover, we did not detect any other SYTL protein or Rab27B in the SYTL5 interactome, confirming that they do not form a complex with SYTL5.”
Suggestions for Discussion:
Both Rab27A and STYL5 localize to other membranes, including the endolysosomal compartments. How do the authors envisage the mechanism or cellular modifications that allow these proteins, either individually or in complex to function also to regulate mitochondrial funcYon? It would be interesYng to have some views.
We agree that it would be interesting to better understand the mechanism involved in modulation of the localisation and function of SYTL5 and Rab27A at different cellular compartments, including the mitochondria. Here, we have shown that SYTL5 recruitment to the mitochondria involves coincidence detection, as both its lipid-binding C2 domains and the Rab27A-binding SHD domain are required (Figure 1G-H). Both these domains also seem required for localisation of SYTL5 to vesicles, and we can only speculate that binding to different lipids (Figure 1F) may regulate SYTL5 localisation. Additionally, we find that mitochondrial recruitment of SYTL5 is dependent on the GTPase activity and mitochondrial localisation of Rab27A (Figure 2D-E). However, this seems also the case for vesicular recruitment of SYTL5, although a few SYTL5-Rab27A (T23N) positive vesicles were seen (Figure 2E).
To characterise the mechanisms involved in mitochondrial localisation of Rab27A, we have performed mass spectrometry analysis to identify the interactome of Rab27A (see Author response table 1 above). U2OS cells with stable expression of mScarlet-Rab27A or mScarlet only were subjected to immunoprecipitation, followed by MS analysis. Of the 32 significant Rab27A-interacting hits (compared to control), two of the hits localise in the inner mitochondrial membrane (IMM); ATP synthase F(1) complex subunit alpha (P25705), and mitochondrial very long-chain specific acyl-CoA dehydrogenase (VLCAD)(P49748). However, as these IMM proteins are not likely involved in mitochondrial recruitment of Rab27A, observed under basal conditions, we chose not to include these data in the manuscript.
It is known that other RAB proteins are recruited to the mitochondria by regulation of their GTPase activity. During parkin-mediated mitophagy, RABGEF1 (a guanine nucleotide exchange factor) is recruited through its ubiquitin-binding domain and directs mitochondrial localisation of RAB5, which subsequently leads to recruitment of RAB7 by the MON1/CCZ1 GEF complex[1]. As already mentioned in the discussion (p.12), ubiquitination of the Rab27A GTPase activating protein alpha (TBC1D10A) is reduced in the brain of Parkin KO mouse compared to controls[35], suggesting a possible connection of Rab27A with regulatory mechanisms that are linked with mitochondrial damage and dysfunction. While this an interesting avenue to explore, it is beyond the scope of this paper.
Our data suggest that SYTL5 functions as a negative regulator of the Warburg effect, the switch from OXPHOS to glycolysis. While both SYTL5 and Rab27A seem required for mitophagy of selective mitochondrial components, and their depletion leading to reduced mitochondrial respiration and ATP production, only depletion of SYTL5 caused a switch to glycolysis. The mechanisms involved are unclear, but we found several proteins linked to the cellular response to oxidative stress, reactive oxygen species metabolic process, regulation of mitochondrion organisation and protein insertion into mitochondrial membrane to be enriched in the SYTL5 interactome (Figure 3A and C).
We have addressed this comment in the discussion on p.12
Reviewer #3 (Public review):
Summary:
In the manuscript by Lapao et al., the authors uncover a role for the Rab27A effector protein SYTL5 in regulating mitochondrial function and turnover. The authors find that SYTL5 localizes to mitochondria in a Rab27A-dependent way and that loss of SYTL5 (or Rab27A) impairs lysosomal turnover of an inner mitochondrial membrane mitophagy reporter but not a matrix-based one. As the authors see no co-localization of GFP/mScarlet tagged versions of SYTL5 or Rab27A with LC3 or p62, they propose that lysosomal turnover is independent of the conventional autophagy machinery. Finally, the authors go on to show that loss of SYTL5 impacts mitochondrial respiration and ECAR and as such may influence the Warburg effect and tumorigenesis. Of relevance here, the authors go on to show that SYTL5 expression is reduced in adrenocortical carcinomas and this correlates with reduced survival rates.
Strengths:
There are clearly interesting and new findings here that will be relevant to those following mitochondrial function, the endocytic pathway, and cancer metabolism.
Weaknesses:
The data feel somewhat preliminary in that the conclusions rely on exogenously expressed proteins and reporters, which do not always align.
As the authors note there are no commercially available antibodies that recognize endogenous SYTL5, hence they have had to stably express GFP-tagged versions. However, it appears that the level of expression dictates co-localization from the examples the authors give (though it is hard to tell as there is a lack of any kind of quantitation for all the fluorescent figures). Therefore, the authors may wish to generate an antibody themselves or tag the endogenous protein using CRISPR.
We agree that the level of SYTL5 expression is likely to affect its localisation. As suggested by the reviewer, we have tried hard, without success, to generated U2OS cells with CRISPR knock-in of a mNeonGreen tag at the C-terminus of endogenous SYTL5, using an approach that has been successfully implemented in the lab for other genes. This is likely due to a lack of suitable sgRNAs targeting the C-terminal region of SYTL5, which have a low predicted efficiency score and a large number of predicted off-target sites in the human genome including several other gene exons and introns (see Author response image 2).
Author response image 2.
Overview of sgRNAs targeting the C-terminal region of SYTL5
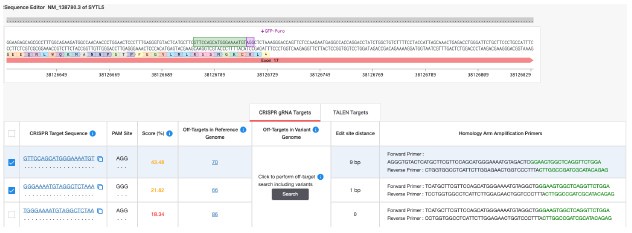
Although the SYTL5 expression level might affect its cellular localization, we also found the mitochondrial localisation of SYTL5-EGFP to be strongly increased in cells co-expressing mScarletRab27A, supporting our findings of Rab27A-mediated mitochondrial recruitment of SYTL5. We have also included new data (Supplementary Figure 4B) showing that some of the hypoxia-induced SYTL5Rab27A-positive vesicles stain positive for the autophagy markers p62 and LC3B when inhibiting lysosomal degradation, further strengthening our data that SYTL5 and Rab27A function as positive regulators of mitophagy.
In relation to quantitation, the authors found that SYTL5 localizes to multiple compartments or potentially a few compartments that are positive for multiple markers. Some quantitation here would be very useful as it might inform on function.
We find that SYTL5-EGFP localizes to mitochondria, lysosomes and the plasma membrane in U2OS cells with stable expression of SYTL5-EGFP and in SYTL5/Rab27A double knock-out cells rescued with SYTL5EGFP and mScralet-Rab27A. We also see colocalization of SYTL5-EGFP with endogenous p62, LC3 and LAMP1 upon induction of mitophagy. However, as these cell lines comprise a heterogenous pool with high variability we do not believe that quantification of the overexpressing cell lines would provide beneficial information in this scenario. As described above, we have tried several times to generate SYTL5 knock-in cells without success.
The authors find that upon hypoxia/hypoxia-like conditions that punctate structures of SYTL5 and Rab27A form that are positive for Mitotracker, and that a very specific mitophagy assay based on pSu9-Halo system is impaired by siRNA of SYTL5/Rab27A, but another, distinct mitophagy assay (Matrix EGFP-mCherry) shows no change. I think this work would strongly benefit from some measurements with endogenous mitochondrial proteins, both via immunofluorescence and western blot-based flux assays.
In addition to the western blotting for different endogenous ETC proteins showing significantly increased levels of MTCO1 in cells depleted of SYTL5 and/or Rab27A (Figure 5E-F), we have now blotted for the endogenous mitochondrial proteins, COXIV and BNIP3L, in DFP and DMOG conditions upon knockdown of SYTL5 and/or Rab27A (Figure 5G and Supplementary Figure 5A). Although there was a trend towards increased levels, we did not see any significant changes in total COXIV or BNIP3L levels when SYTL5, Rab27A or both are knocked down compared to siControl. Blotting for endogenous mitochondrial proteins is however not the optimum readout for mitophagy. A change in mitochondrial protein level does not necessarily result from mitophagy, as other factors such as mitochondrial biogenesis and changes in translation can also have an effect. Mitophagy is a dynamic process, which is why we utilise assays such as the HaloTag and mCherry-EGFP double tag as these indicate flux in the pathway. Additionally, as mitochondrial proteins have different half-lives, with many long-lived mitochondrial proteins[17], differences in turnover rates of endogenous proteins make the results more difficult to interpret.
A really interesting aspect is the apparent independence of this mitophagy pathway on the conventional autophagy machinery. However, this is only based on a lack of co-localization between p62or LC3 with LAMP1 and GFP/mScarlet tagged SYTL5/Rab27A. However, I would not expect them to greatly colocalize in lysosomes as both the p62 and LC3 will become rapidly degraded, while the eGFP and mScarlet tags are relatively resistant to lysosomal hydrolysis. -/+ a lysosome inhibitor might help here and ideally, the functional mitophagy assays should be repeated in autophagy KOs.
We thank the reviewer for this suggestion. We have now repeated the colocalisation studies in cells treated with DFP with the addition of bafilomycin A1 (BafA1) to inhibit the lysosomal V-ATPase. Indeed, we find that a few of the SYTL5/Rab27A/MitoTracker positive structures also stain positive for p62 and LC3 (Supplementary Figure 4B). As expected, the occurrence of these structures was rare, as BafA1 was only added for the last 4 hrs of the 24 hr DFP treatment. However, we cannot exclude the possibility that there are two different populations of these vesicles.
The link to tumorigenesis and cancer survival is very interesYng but it is not clear if this is due to the mitochondrially-related aspects of SYTL5 and Rab27A. For example, increased ECAR is seen in the SYTL5 KO cells but not in the Rab27A KO cells (Fig.5D), implying that mitochondrial localization of SYTL5 is not required for the ECAR effect. More work to strengthen the link between the two sections in the paper would help with future direcYons and impact with respect to future cancer treatment avenues to explore.
We agree that the role of SYTL5 in ACC requires future investigation. While we observe reduced OXPHOS levels in both SYTL5 and Rab27A KO cells (Figure 5B), glycolysis was only increased in SYTL5 KO cells (Figure 5D). We believe this indicates that Rab27A is being negatively regulated by SYTL5, as ECAR was unchanged in both the Rab27A KO and Rab27A/SYTL5 dKO cells. This suggests that Rab27A is required for the increase in ECAR when SYTL5 is depleted, therefore SYTL5 negatively regulates Rab27A. The mechanism involved is unclear, but we found several proteins linked to the cellular response to oxidative stress, reactive oxygen species metabolic process, regulation of mitochondrion organisation and protein insertion into mitochondrial membrane to be enriched in the SYTL5 interactome (Figure 3A and C).
To investigate the link to cancer further, we tested the effect of knockdown of SYTL5 and/or Rab27A on the levels of mitochondrial ROS. ROS levels were measured by flow cytometry using the MitoSOX Red dye, together with the MitoTracker Green dye to normalise ROS levels to the total mitochondria. Cells were treated with the antioxidant N-acetylcysteine (NAC)[18] as a negative control and menadione as a positive control, as menadione induces ROS production via redox cycling[19]. We must consider that there is also a lot of autofluorescence from cells that makes it impossible to get a level of ‘zero ROS’ in this experiment. We did not see a change in ROS with knockdown of SYTL5 and/or Rab27A compared to the NAC treated or siControl samples (see Author response image 3 below). The menadione samples confirm the success of the experiment as ROS accumulated in these cells. Thus, based on this, we do not believe that low SYTL5 expression would affect ROS levels in ACC tumours.
Author response image 3.
Mitochondrial ROS production normalised to total mitochondria
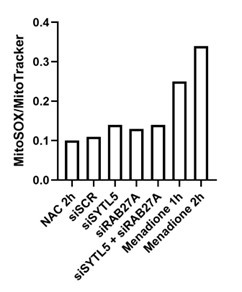
As discussed in our response to Reviewer #1, we tried hard to characterise the role of SYTL5 in the context of ACC using the NCI-H295R cell line isolated from the adrenal gland of an adrenal cancer patient. We attempted to conduct OCR and ECAR measurements using the Seahorse XF upon knockdown of SYTL5 and/or Rab27A in H295R cells without success, due to poor attachment of the cells and inability to form a monolayer. We also transduced the H295R cells with lentiviral particles to overexpress pLVX-SV40-mScarlet-I-Rab27A and pLVX-CMV-SYTL5-EGFP-3xFLAG to study the localisation of SYTL5 and Rab27A in an ACC model. Again, this proved unsuccessful after numerous attempts at optimising the transduction. These issues limited our investigation into the role of SYTL5 in ACC to the cortisol assay (Supplementary Figure 6). For this the H295R cells were an appropriate model as they are able to produce an array of adrenal cortex steroids[6] including cortisol[7] In this assay, measurements are taken from cell culture supernatants, so the confluency of the cells does not prevent consistent results as the cortisol concentration was normalised to total protein per sample. With this assay we were able to rule out a role for SYTL5 and Rab27A in the secretion of cortisol.
Another consideration when investigating the involvement of SYTL5 in ACC, is that in general ACC cells should have a low expression of SYTL5 as is seen from the patient expression data (Figure 6B).
Further studies into the link between SYTL5/Rab27A and cancer are beyond the scope of this paper as we are limited to the tools and expertise available in the lab.
References
(1) Yamano, K. et al. Endosomal Rab cycles regulate Parkin-mediated mitophagy. eLife 7 (2018). https://doi.org:10.7554/eLife.31326
(2) Carré, M. et al. Tubulin is an inherent component of mitochondrial membranes that interacts with the voltage-dependent anion channel. The Journal of biological chemistry 277, 33664-33669 (2002). https://doi.org:10.1074/jbc.M203834200
(3) Hoogerheide, D. P. et al. Structural features and lipid binding domain of tubulin on biomimetic mitochondrial membranes. Proceedings of the National Academy of Sciences 114, E3622-E3631 (2017). https://doi.org:10.1073/pnas.1619806114
(4) Plitzko, B. & Loesgen, S. Measurement of Oxygen Consumption Rate (OCR) and Extracellular Acidification Rate (ECAR) in Culture Cells for Assessment of the Energy Metabolism. Bio Protoc 8, e2850 (2018). https://doi.org:10.21769/BioProtoc2850
(5) Yavin, E. & Yavin, Z. Attachment and culture of dissociated cells from rat embryo cerebral hemispheres on polylysine-coated surface. The Journal of cell biology 62, 540-546 (1974). https://doi.org:10.1083/jcb.62.2.540
(6) Wang, T. & Rainey, W. E. Human adrenocortical carcinoma cell lines. Mol Cell Endocrinol 351, 5865 (2012). https://doi.org:10.1016/j.mce.2011.08.041
(7) Rainey, W. E. et al. Regulation of human adrenal carcinoma cell (NCI-H295) production of C19 steroids. J Clin Endocrinol Metab 77, 731-737 (1993). https://doi.org:10.1210/jcem.77.3.8396576
(8) Barral, D. C. et al. Functional redundancy of Rab27 proteins and the pathogenesis of Griscelli syndrome. J. Clin. Invest. 110, 247-257 (2002). https://doi.org:10.1172/jci15058
(9) Ku, K. E., Choi, N. & Sung, J. H. Inhibition of Rab27a and Rab27b Has Opposite Effects on the Regulation of Hair Cycle and Hair Growth. Int. J. Mol. Sci. 21 (2020). https://doi.org:10.3390/ijms21165672
(10) Johnson, J. L., Monfregola, J., Napolitano, G., Kiosses, W. B. & Catz, S. D. Vesicular trafficking through cortical actin during exocytosis is regulated by the Rab27a effector JFC1/Slp1 and the RhoA-GTPase–activating protein Gem-interacting protein. Mol. Biol. Cell 23, 1902-1916 (2012). https://doi.org:10.1091/mbc.e11-12-1001
(11) Yu, M. et al. Exophilin4/Slp2-a targets glucagon granules to the plasma membrane through unique Ca2+-inhibitory phospholipid-binding activity of the C2A domain. Mol. Biol. Cell 18, 688696 (2007). https://doi.org:10.1091/mbc.e06-10-0914
(12) Kurowska, M. et al. Terminal transport of lyXc granules to the immune synapse is mediated by the kinesin-1/Slp3/Rab27a complex. Blood 119, 3879-3889 (2012). https://doi.org:10.1182/blood-2011-09-382556
(13) Zhao, S., Torii, S., Yokota-Hashimoto, H., Takeuchi, T. & Izumi, T. Involvement of Rab27b in the regulated secretion of pituitary hormones. Endocrinology 143, 1817-1824 (2002). https://doi.org:10.1210/endo.143.5.8823
(14) Kariya, Y. et al. Rab27a and Rab27b are involved in stimulation-dependent RANKL release from secretory lysosomes in osteoblastic cells. J Bone Miner Res 26, 689-703 (2011). https://doi.org:10.1002/jbmr.268
(15) Zhao, K. et al. Functional hierarchy among different Rab27 effectors involved in secretory granule exocytosis. Elife 12 (2023). https://doi.org:10.7554/eLife.82821
(16) Izumi, T. Physiological roles of Rab27 effectors in regulated exocytosis. Endocr J 54, 649-657 (2007). https://doi.org:10.1507/endocrj.kr-78
(17) Bomba-Warczak, E. & Savas, J. N. Long-lived mitochondrial proteins and why they exist. Trends in cell biology 32, 646-654 (2022). https://doi.org:10.1016/j.tcb.2022.02.001
(18) Curtin, J. F., Donovan, M. & Cotter, T. G. Regulation and measurement of oxidative stress in apoptosis. Journal of Immunological Methods 265, 49-72 (2002). https://doi.org:https://doi.org/10.1016/S0022-1759(02)00070-4
(19) Criddle, D. N. et al. Menadione-induced Reative Oxygen Species Generation via Redox Cycling Promotes Apoptosis of Murine Pancreatic Acinar Cells. Journal of Biological Chemistry 281, 40485-40492 (2006). https://doi.org:https://doi.org/10.1074/jbc.M607704200
Author response:
The following is the authors’ response to the original reviews.
Reviewer #1 (Public Review):
Summary:
LRRK2 protein is familially linked to Parkinson's disease by the presence of several gene variants that all confer a gain-of-function effect on LRRK2 kinase activity.
The authors examine the effects of BDNF stimulation in immortalized neuron-like cells, cultured mouse primary neurons, hIPSC-derived neurons, and synaptosome preparations from the brain. They examine an LRRK2 regulatory phosphorylation residue, LRRK2 binding relationships, and measures of synaptic structure and function.
Strengths:
The study addresses an important research question: how does a PD-linked protein interact with other proteins, and contribute to responses to a well-characterized neuronal signalling pathway involved in the regulation of synaptic function and cell health?
They employ a range of good models and techniques to fairly convincingly demonstrate that BDNF stimulation alters LRRK2 phosphorylation and binding to many proteins. Some effects of BDNF stimulation appear impaired in (some of the) LRRK2 knock-out scenarios (but not all). A phosphoproteomic analysis of PD mutant Knock-in mouse brain synaptosomes is included.
We thank this Reviewer for pointing out the strengths of our work.
Weaknesses:
The data sets are disjointed, conclusions are sweeping, and not always in line with what the data is showing. Validation of 'omics' data is very light. Some inconsistencies with the major conclusions are ignored. Several of the assays employed (western blotting especially) are likely underpowered, findings key to their interpretation are addressed in only one or other of the several models employed, and supporting observations are lacking.
We appreciate the Reviewer’s overall evaluaVon. In this revised version, we have provided several novel results that strengthen the omics data and the mechanisVc experiments and make the conclusions in line with the data.
As examples to aid reader interpretation: (a) pS935 LRRK2 seems to go up at 5 minutes but goes down below pre-stimulation levels after (at times when BDNF-induced phosphorylation of other known targets remains very high). This is ignored in favour of discussion/investigation of initial increases, and the fact that BDNF does many things (which might indirectly contribute to initial but unsustained changes to pLRRK2) is not addressed.
We thank the Reviewer for raising this important point, which we agree deserves additional investigation. Although phosphorylation does decrease below pre-stimulation levels, a reduction is also observed for ERK/AKT upon sustained exposure to BDNF in our experimental paradigm (figure 1F-G). This phenomenon is well known in response to a number of extracellular stimuli and can be explained by mechanisms related to cellular negative feedback regulation, receptor desensitization (e.g. phosphorylation or internalization), or cellular adaptation. The effect on pSer935, however, is peculiar as phosphorylation goes below the unstimulated level, as pointed by the reviewer. In contrast to ERK and AKT whose phosphorylation is almost absent under unstimulated conditions (Figure 1F-G), the stoichiometry of Ser935 phosphorylation under unstimulated conditions is high. This observation is consistent with MS determination of relative abundance of pSer935 (e.g. in whole brain LRRK2 is nearly 100% phosphorylated at Ser935, see Nirujogi et al., Biochem J 2021). Thus we hypothesized that the modest increase in phosphorylation driven by BDNF likely reflects a saturation or ceiling effect, indicating that the phosphorylation level is already near its maximum under resting conditions. Prolonged BDNF stimulation would bring phosphorylation down below pre-stimulation levels, through negative feedback mechanisms (e.g. phosphatase activity) explained above. To test this hypothesis, we conducted an experiment in conditions where LRRK2 is pretreated for 90 minutes with MLi-2 inhibitor, to reduce basal phosphorylation of S935. After MLi-2 washout, we stimulated with BDNF at different time points. We used GFP-LRRK2 stable lines for this experiment, since the ceiling effect was particularly evident (Figure S1A) and this model has been used for the interactomic study. As shown below (and incorporated in Fig. S1B in the manuscript), LRRK2 responds robustly to BDNF stimulation both in terms of pSer935 and pRABs. Phosphorylation peaks at 5-15 mins, while it decreases to unstimulated levels at 60 and 180 minutes. Notably, while the peak of pSer935 at 5-15 mins is similar to the untreated condition (supporting that Ser935 is nearly saturated in unstimulated conditions), the phosphorylation of RABs during this time period exceeds unstimulated levels. These findings support the notion that, under basal conditions, RAB phosphorylation is far from saturation. The antibodies used to detect RAB phosphorylation are the following: RAB10 Abcam # ab230261 e RAB8 (pan RABs) Abcam # ab230260.
Given the robust response of RAB10 phosphorylation upon BDNF stimulation, we further investigated RAB10 phosphorylation during BDNF stimulation in naïve SH-SY5Y cells. We confirmed that the increase in pSer935 is coupled to increase in pT73-RAB10. Also in this case, RAB10 phosphorylation does not go below the unstimulated level, which aligns with the low pRAB10 stoichiometry in brain (Nirujogi et al., Biochem J 2021). This experiment adds the novel and exciting finding that BDNF stimulation increases LRRK2 kinase activity (RAB phosphorylation) in neuronal cells.
Note that new supplemental figure 1 now includes: A) a comparison of LRRK2 pS935 and total protein levels before and after RA differentiation; B) differentiated GFP-LRRK2 SH-SY5Y (unstimulated, BDNF, MLi-2, BDNF+MLi-2); C) the kinetic of BDNF response in differentiated GFP-LRRK2 SH-SY5Y.
(b) Drebrin coIP itself looks like a very strong result, as does the increase after BDNF, but this was only demonstrated with a GFP over-expression construct despite several mouse and neuron models being employed elsewhere and available for copIP of endogenous LRRK2. Also, the coIP is only demonstrated in one direction. Similarly, the decrease in drebrin levels in mice is not assessed in the other model systems, coIP wasn't done, and mRNA transcripts are not quantified (even though others were). Drebrin phosphorylation state is not examined.
We appreciate the Reviewer suggestions and provided additional experimental evidence supporting the functional relevance of LRRK2-drebrin interaction.
(1) As suggested, we performed qPCR and observed that 1 month-old KO midbrain and cortex express lower levels of Dbn1 as compared to WT brains (Figure 5G). This result is in agreement with the western blot data (Figure 5H).
(2)To further validate the physiological relevance of LRRK2-drebrin interaction we performed two experiments:
i) Western blots looking at pSer935 and pRab8 (pan Rab) in Dbn1 WT and knockout brains. As reported and quantified in Figure 2I, we observed a significant decrease in pSer935 and a trend decrease in pRab8 in Dbn1 KO brains. This finding supports the notion that Drebrin forms a complex with LRRK2 that is important for its activity, e.g. upon BDNF stimulation.
ii) Reverse co-immunoprecipitation of YFP-drebrin full-length, N-terminal domain (1-256 aa) and C-terminal domain (256-649 aa) (plasmids kindly received from Professor Phillip R. Gordon-Weeks, Worth et al., J Cell Biol, 2013) with Flag-LRRK2 co-expressed in HEK293T cells. As shown in supplementary Fig. S2C, we confirm that YFP-drebrin binds LRRK2, with the Nterminal region of drebrin appearing to be the major contributor to this interaction. This result is important as the N-terminal region contains the ADF-H (actin-depolymerising factor homology) domain and a coil-coil region known to directly bind actin (Shirao et al., J Neurochem 2017; Koganezawa et al., Mol Cell Neurosci. 2017). Interestingly, both full-length Drebrin and its truncated C-terminal construct cause the same morphological changes in Factin, indicating that Drebrin-induced morphological changes in F-actin are mediated by its N-terminal domains rather than its intrinsically disordered C-terminal region (Shirao et al., J Neurochem, 2017; Koganezawa et al., Mol Cell Neurosci. 2017). Given the role of LRRK2 in actin-cytoskeletal dynamics and its binding with multiple actin-related protein binding (Fig. 2 and Meixner et al., Mol Cell Proteomics. 2011; Parisiadou and Cai, Commun Integr Biol 2010), these results suggest the possibility that LRRK2 controls actin dynamics by competing with drebrin binding to actin and open new avenues for futures studies.
(3) To address the request for examining drebrin phosphorylation state, we decided to perform another phophoproteomic experiment, leveraging a parallel analysis incorporated in our latest manuscript (Chen et al., Mol Theraphy 2025). In this experiment, we isolated total striatal proteins from WT and G2019S KI mice and enriched the phospho-peptides. Unlike the experiment presented in Fig. 7, phosphopeptides were enriched from total striatal lysates rather than synaptosomal fractions, and phosphorylation levels were normalized to the corresponding total protein abundance. This approach was intended to avoid bias toward synaptic proteins, allowing for the analysis of a broader pool of proteins derived from a heterogeneous ensemble of cell types (neurons, glia, endothelial cells, pericytes etc.). We were pleased to find that this new experiment confirmed drebrin S339 as a differentially phosphorylated site, with a 3.7 fold higher abundance in G2019S Lrrk2 KI mice. The fact that this experiment evidenced an increased phosphorylation stoichiometry in G2019S mice rather than a decreased is likely due to the normalization of each peptide by its corresponding total protein. Gene ontology analysis of differentially phosphorylated proteins using stringent term size (<200 genes) showed post-synaptic spines and presynaptic active zones as enriched categories (Fig. 3F). A SynGO analysis confirms both pre and postsynaptic categories, with high significance for terms related to postsynaptic cytoskeleton (Fig. 3G). As pointed, this is particularly interesting as the starting material was whole striatal tissue – not synaptosomes as previously – indicating that most significant phosphorylation differences occur in synaptic compartments. This once again reinforces our hypothesis that LRRK2 has a prominent role in the synapse. Overall, we confirmed with an independent phosphoproteomic analysis that LRRK2 kinase activity influences the phosphorylation state of proteins related to synaptic function, particularly postsynaptic cytoskeleton. For clarity in data presentation, as mentioned by the Reviewers, we removed Figure 7 and incorporated this new analysis in figure 3, alongside the synaptic cluster analysis.
Altogether, three independent OMICs approaches – (i) experimental LRRK2 interactomics in neuronal cells, (ii) a literature-based LRRK2 synaptic/cytoskeletal interactor cluster, and (iii) a phospho-proteomic analysis of striatal proteins from G2019S KI mice (to model LRRK2 hyperactivity) – converge to synaptic actin-cytoskeleton as a key hub of LRRK2 neuronal function.
(c) The large differences in the CRISPR KO cells in terms of BDNF responses are not seen in the primary neurons of KO mice, suggesting that other differences between the two might be responsible, rather than the lack of LRRK2 protein.
Considering that some variability is expected for these type of cultures and across different species, any difference in response magnitude and kinetics could be attributed to the levels of TrKB and downstream components expressed by the two cell types.
We are confident that differentiated SH-SY5Y cells provide a reliable model for our study as we could translate the results obtained in SH-SY5Y cells in other models. However, to rule out the possibility that the more pronounced effect observed in SH-SY5Y KO cells as respect to Lrrk2 KO primary neurons was due to CRISPR off-target effect, we performed an off-target analysis. Specifically, we selected the first 8 putative off targets exhibiting a CDF (Cutting Frequency Determination) off-target-score >0.2.
As shown in supplemental file 1, sequence disruption was observed only in the LRRK2 ontarget site in LRRK2 KO SH-SY5Y cells, while the 8 off-target regions remained unchanged across the genotypes and relative to the reference sequence.
(d) No validation of hits in the G2019S mutant phosphoproteomics, and no other assays related to the rest of the paper/conclusions. Drebrin phosphorylation is different but unvalidated, or related to previous data sets beyond some discussion. The fact that LRRK2 binding occurs, and increases with BDNF stimulation, should be compared to its phosphorylation status and the effects of the G2019S mutation.
As illustrated in the response to point (b), we performed a new phosphoproteomics investigation – with total striatal lysates instead of striatal synaptosomes and normalization phospho-peptides over total proteins – and found that S339 phosphorylation increases when LRRK2 kinase activity increases (G2019S). To address the request of validating drebrin phosphorylation, the main limitation is that there are no available antibodies against Ser339. While we tried phos-Tag gels in striatal lysates, we could not detect any reliable and specific signal with the same drebrin antibody used for western blot (Thermo Fisher Scientific: MA120377) due to technical limitations of the phosTag method. We are confident that phosphorylation at S339 has a physiological relevance, as it was identified 67 times across multiple proteomic discovery studies and they are placed among the most frequently phosphorylated sites in drebrin (https://www.phosphosite.org/proteinAction.action?id=2675&showAllSites=true).
To infer a possible role of this phosphorylation, we looked at the predicted pathogenicity of using AlphaMissense (Cheng et al., Science 2023). included as supplementary figure (Fig. S3), aminoacid substitutions within this site are predicted not to be pathogenic, also due to the low confidence of the AlphaFold structure.
Ser339 in human drebrin is located just before the proline-rich region (PP domain) of the protein. This region is situated between the actin-binding domains and the C-terminal Homerbinding sequences and plays a role in protein-protein interactions and cytoskeletal regulation (Worth et al., J Cell Biol, 2013). Of interest, this region was previously shown to be the interaction site of adafin (ADFN), a protein involved in multiple cytoskeletal-related processes, including synapse formation and function by regulating puncta adherentia junctions, presynaptic differentiation, and cadherin complex assembly, which are essential for hippocampal excitatory synapses, spine formation, and learning and memory processes (Beaudoin, G. M., 3rd et al., J Neurosci, 2013). Of note, adafin is in the list of LRRK2 interacting proteins (https://www.ebi.ac.uk/intact/home), supporting a possible functional relevance of LRRK2-mediated drebrin phosphorylation in adafin-drebrin complex formation. This has been discussed in the discussion section.
The aim of this MS analysis in G2019S KI mice – now included in figure 3 – was to further validate the crucial role of LRRK2 kinase activity in the context of synaptic regulation, rather than to discover and characterize novel substrates. Consequently, Figure 7 has been eliminated.
Reviewer #2 (Public Review):
Taken as a whole, the data in the manuscript show that BDNF can regulate PD-associated kinase LRRK2 and that LRRK2 modifies the BDNF response. The chief strength is that the data provide a potential focal point for multiple observations across many labs. Since LRRK2 has emerged as a protein that is likely to be part of the pathology in both sporadic and LRRK2 PD, the findings will be of broad interest. At the same time, the data used to imply a causal throughline from BDNF to LRRK2 to synaptic function and actin cytoskeleton (as in the title) are mostly correlative and the presentation often extends beyond the data. This introduces unnecessary confusion. There are also many methodological details that are lacking or difficult to find. These issues can be addressed.
We appreciate the Reviewer’s positive feedback on our study. We also value the suggestion to present the data in a more streamlined and coherent way. In response, we have updated the title to better reflect our overall findings: “LRRK2 Regulates Synaptic Function through Modulation of Actin Cytoskeletal Dynamics.” Additionally, we have included several experiments that we believe enhance and unify the study.
(1) The writing/interpretation gets ahead of the data in places and this was confusing. For example, the abstract highlights prior work showing that Ser935 LRRK2 phosphorylation changes LRRK2 localization, and Figure 1 shows that BDNF rapidly increases LRRK2 phosphorylation at this site. Subsequent figures highlight effects at synapses or with synaptic proteins. So is the assumption that LRRK2 is recruited to (or away from) synapses in response to BDNF? Figure 2H shows that LRRK2-drebrin interactions are enhanced in response to BDNF in retinoic acid-treated SH-SY5Y cells, but are synapses generated in these preps? How similar are these preps to the mouse and human cortical or mouse striatal neurons discussed in other parts of the paper (would it be anticipated that BDNF act similarly?) and how valid are SHSY5Y cells as a model for identifying synaptic proteins? Is drebrin localization to synapses (or its presence in synaptosomes) modified by BDNF treatment +/- LRRK2? Or do LRRK2 levels in synaptosomes change in response to BDNF? The presentation requires re-writing to stay within the constraints of the data or additional data should be added to more completely back up the logic.
We thank the Reviewer for the thorough suggestions and comments. We have extensively revised the text to accurately reflect our findings without overinterpreting. In particular, we agree with the Reviewer that differentiated SH-SY5Y cells are not identical to primary mouse or human neurons; however both neuronal models respond to BDNF. Supporting our observations, it is known that SH-SY5Y cells respond to BDNF. In fact, a common protocol for differentiating SH-SY5Y cells involve BDNF in combination with retinoic acid (Martin et al., Front Pharmacol, 2022; Kovalevich et al., Methods in mol bio, 2013). Additionally, it has been reported that SH-SY5Y cells can form functional synapses (Martin et al., Front Pharmacol, 2022). While we are aware that BDNF, drebrin or LRRK2 can also affect non-synaptic pathways, we focused on synapses when moved to mouse models since: (i) MS and phosphoMS identified several cytoskeletal proteins enriched at the synapse, (ii) we and others have previously reported a role for LRRK2 in governing synaptic and cytoskeletal related processes; (iii) the synapse is a critical site that becomes dysfunctional in the early stages of PD. We have now clarified and adjusted the text as needed. We have also performed additional experiments to address the Reviewer’s concern:
(1) “Is the assumption that LRRK2 is recruited to (or away from) synapses in response to BDNF”? This is a very important point. There is consensus in the field that detecting endogenous LRRK2 in brain slices or in primary neurons via immunofluorescence is very challenging with the commercially available antibodies (Fernandez et al., J Parkinsons Dis, 2022). We established a method in our previous studies to detect LRRK2 biochemically in synaptosomes (Cirnaru et al., Front Mol Neurosci, 2014; Belluzzi et al., Mol Neurodegener., 2016). While these data indicate LRRK2 is present in the synaptic compartments, it would be quite challenging to apply this method to the present study. In fact, applying acute BDNF stimulation in vivo and then isolate synaptosomes is a complex experiment beyond the timeframe of the revision due to the need of mouse ethical approvals. However, this is definitely an intriguing angle to explore in the future.
(2)“Is drebrin localization to synapses (or its presence in synaptosomes) modified by BDNF treatment +/- LRRK2?” To try and address this question, we adapted a previously published assay to measure drebrin exodus from dendritic spines. During calcium entry and LTP, drebrin exits dendritic spines and accumulates in the dendritic shafts and cell body (Koganezawa et al., 2017). This facilitates the reorganization of the actin cytoskeleton (Shirao et al., 2017). Given the known role of drebrin and its interaction with LRRK2, we hypothesized that LRRK2 loss might affect drebrin relocalization during spine maturation.
To test this, we treated DIV14 primary cortical neurons from Lrrk2 WT and KO mice with BDNF for 5, 15, and 24 hours, then performed confocal imaging of drebrin localization (Author response image 1). Neurons were transfected at DIV4 with GFP (cell filler) and PSD95 (dendritic spines) for visualization, and endogenous drebrin was stained with an anti-drebrin antibody. We then measured drebrin's overlap with PSD95-positive puncta to track its localization at the spine.
In Lrrk2 WT neurons, drebrin relocalized from spines after BDNF stimulation, peaking at 15 minutes and showing higher co-localization with PSD95 at 24 hours, indicating the spine remodeling occurred. In contrast, Lrrk2 KO neurons showed no drebrin exodus. These findings support the notion that LRRK2's interaction with drebrin is important for spine remodeling via BDNF. However, additional experiments with larger sample sizes are needed, which were not feasible within the revision timeframe (here n=2 experiments with independent neuronal preparations, n=4-7 neurons analyzed per experiment). Thus, we included the relevant figure as Author response image 1 but chose not to add it in the manuscript (figure 3).
Author response image 1.
Lrrk2 affects drebrin exodus from dendritic spines. After the exposure to BDNF for different times (5 minutes, 15 minutes and 24 hours), primary neurons from Lrrk2 WT and KO mice have been transfected with GFP and PSD95 and stained for endogenous drebrin at DIV4. The amount of drebrin localizing in dentritic spines outlined by PSD95 has been assessed at DIV14. The graph shows a pronounced decrease in drebrin content in WT neurons during short time treatments and an increase after 24 hours. KO neurons present no evident variations in drebrin localization upon BDNF stimulation. Scale bar: 4 μm.<br />
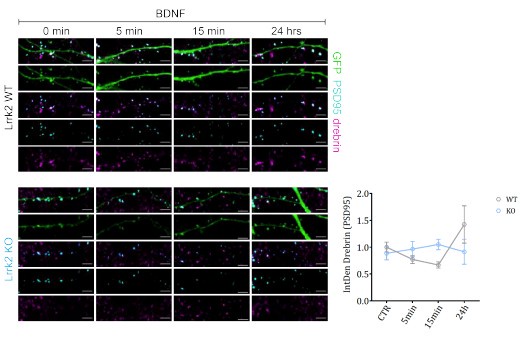
(2) The experiments make use of multiple different kinds of preps. This makes it difficult at times to follow and interpret some of the experiments, and it would be of great benefit to more assertively insert "mouse" or "human" and cell type (cortical, glutamatergic, striatal, gabaergic) etc.
We thank the Reviewer for pointing this out. We have now more clearly specified the cell type and species identity throughout the text to improve clarity and interpretation.
(3) Although BDNF induces quantitatively lower levels of ERK or Akt phosphorylation in LRRK2KO preps based on the graphs (Figure 4B, D), the western blot data in Figure 4C make clear that BDNF does not need LRRK2 to mediate either ERK or Akt activation in mouse cortical neurons and in 4A, ERK in SH-SY5Y cells. The presentation of the data in the results (and echoed in the discussion) writes of a "remarkably weaker response". The data in the blots demand more nuance. It seems that LRRK2 may potentiate a response to BDNF that in neurons is independent of LRRK2 kinase activity (as noted). This is more of a point of interpretation, but the words do not match the images.
We thank the Reviewer for pointing this out. We have rephrased our data presentation to better convey our findings. We were not surprised to find that loss of LRRK2 causes only a reduction of ERK and AKT activation upon BDNF rather than a complete loss. This is because these pathways are complex and redundant and are activated by a number of cellular effectors. The fact that LRRK2 is one among many players whose function can be compensated by other signaling molecules is also supported by the phenotype of Lrrk2 KO mice that is measurable at 1 month but disappears with adulthood (4 and 18 months) (figure 5).
Moreover, we removed the sentence “Of note, 90 mins of Lrrk2 inhibition (MLi-2) prior to BDNF stimulation did not prevent phosphorylation of Akt and Erk1/2, suggesting that LRRK2 participates in BDNF-induced phosphorylation of Akt and Erk1/2 independently from its kinase activity but dependently from its ability to be phosphorylated at Ser935 (Fig. 4C-D and Fig. 1B-C)” since the MLi-2 treatment prior to BDNF stimulation was not quantified and our new data point to an involvement of LRRK2 kinase activity upon BDNF stimulation.
(4) Figure 4F/G shows an increase in PSD95 puncta per unit length in response to BDNF in mouse cortical neurons. The data do not show spine induction/dendritic spine density/or spine morphogenesis as suggested in the accompanying text (page 8). Since the neurons are filled/express gfp, spine density could be added or spines having PSD95 puncta. However, the data as reported would be expected to reflect spine and shaft PSDs and could also include some nonsynaptic sites.
The Reviewer is right. We have rephrased the text to reflect an increase in postsynaptic density (PSD) sites, which may include both spine and shaft PSDs, as well as potential nonsynaptic sites.
(5) Experimental details are missing that are needed to fully interpret the data. There are no electron microscopy methods outside of the figure legend. And for this and most other microscopy-based data, there are few to no descriptions of what cells/sites were sampled, how many sites were sampled, and how regions/cells were chosen. For some experiments (like Figure 5D), some detail is provided in the legend (20 segments from each mouse), but it is not clear how many neurons this represents, where in the striatum these neurons reside, etc. For confocal z-stacks, how thick are the optical sections and how thick is the stack? The methods suggest that data were analyzed as collapsed projections, but they cite Imaris, which usually uses volumes, so this is confusing. The guide (sgRNA) sequences that were used should be included. There is no mention of sex as a biological variable.
We thank the Reviewer for pointing out this missing information. We have now included:
(1) EM methods (page 24)
(2) Methods for ICC and confocal microscopy now incorporates the Z-stack thickness (0.5 μm x 6 = 3 μm) on page 23.
(3) Methods for Golgi-Cox staining now incorporates the Z-stack thickness and number of neurons and segments per neuron analyzed.
(4) The sex of mice is mentioned in the material and methods (page 17): “Approximately equal numbers of males and females were used for every experiment”.
(6) For Figures 1F, G, and E, how many experimental replicates are represented by blots that are shown? Graphs/statistics could be added to the supplement. For 1C and 1I, the ANOVA p-value should be added in the legend (in addition to the post hoc value provided).
The blots relative to figure 1F,G and E are representative of several blots (at least n=5). The same redouts are part of figure 4 where quantifications are provided. We added the ANOVA p-value in the legend for figure 1C, 1I and 1K.
(7) Why choose 15 minutes of BDNF exposure for the mass spec experiments when the kinetics in Figure 1 show a peak at 5 mins?
This is an important point. We repeated the experiment in GFP-LRRK2 SH-SY5Y cells (figure S1C) and included the 15 min time point. In addition to confirming that pSer935 increases similarly at 5 and 15 minutes, we also observed an increase in RAB phosphorylation at these time points. As mentioned in our response to Reviewer’s 1, we pretreated with MLi-2 for 90 minutes in this experiment to reduce the high basal phosphorylation stoichiometry of pSer935.
(8) The schematic in Figure 6A suggests that iPSCs were plated, differentiated, and cultured until about day 70 when they were used for recordings. But the methods suggest they were differentiated and then cryopreserved at day 30, and then replated and cultured for 40 more days. Please clarify if day 70 reflects time after re-plating (30+70) or total time in culture (70). If the latter, please add some notes about re-differentiation, etc.
We thank the reviewer for providing further clarity on the iPSC methodology. In the submitted manuscript 70DIV represents the total time in vitro and the process involved a cryostorage event at 30DIV, with a thaw of the cells and a further 40 days of maturation before measurement. We have adjusted the methods in both the text and figure (new schematic) to clarify this. The cryopreservation step has been used in other iPSC methods to great effect (Drummond et al., Front Cell Dev Biol, 2020). Due to the complexity and length of the iPSC neuronal differentiation process, cryopreservation represents a useful method with which to shorten and enhance the ability to repeat experiments and reduce considerable variation between differentiations. User defined differences in culture conditions for each batch of neurons thawed can usefully be treated as a new and separate N compared to the next batch of neurons.
(9) When Figures 6B and 6C are compared it appears that mEPSC frequency may increase earlier in the LRRK2KO preps than in the WT preps since the values appear to be similar to WT + BDNF. In this light, BDNF treatment may have reached a ceiling in the LRRK2KO neurons.
We thank the reviewer for his/her comment and observations about the ceiling effects. It is indeed possible that the loss of LRRK2 and the application of BDNF could cause the same elevation in synaptic neurotransmission. In such a situation, the increased activity as a result of BDNF treatment would be masked by the increased activity observed as a result of LRRK2 KO. To better visualize the difference between WT and KO cultures and the possible ceiling effect, we merged the data in one single graph.
(10) Schematic data in Figures 5A and C and Figures 5B and E are too small to read/see the data.
We thank the Reviewer for this suggestion. We have now enlarged figure 5A and moved the graph of figure 5D in supplemental figure S5, since this analysis of spine morphology is secondary to the one shown in figure 5C.
Reviewer #1 (Recommendations For The Authors):
Please forgive any redundancy in the comments, I wanted to provide the authors with as much information as I had to explain my opinion.
Primary mouse cortical neurons at div14, 20% transient increase in S935 pLRRK2 5min after BDNF, which then declines by 30 minutes (below pre-stim levels, and maybe LRRK2 protein levels do also).
In differentiated SHSY5Y cells there is a large expected increase in pERK and pAKT that is sustained way above pre-stim for 60 minutes. There is a 50% initial increase in pLRRK2 (but the blot is not very clear and no double band in these cells), which then looks like reduced well below pre-stim by 30 & 60 minutes.
We thank the Reviewer for bring up this important point. We have extensively addressed this issue in the public review rebuttal. In essence, the phosphorylation of Ser935 is near saturation under unstimulated conditions, as evidenced by its high basal stoichiometry, whereas Rab phosphorylation is far from saturation, showing an increase upon BDNF stimulation before returning to baseline levels. This distinction highlights that while pSer935 exhibits a ceiling effect due to its near-maximal phosphorylation at rest, pRab responds dynamically to BDNF, indicating low basal phosphorylation and a significant capacity for increase. Figure 1 in the rebuttal summarizes the new data collected.
GFP-fused overexpressed LRRK2 coIPs with drebrin, and this is double following 15 min BDNF. Strong result.
We thank the Reviewer.
BDNF-induced pAKT signaling is greatly impaired, and pERK is somewhat impaired, in CRISPR LKO SHSY5Y cells. In mouse primaries, both AKT and Erk phosph is robustly increased and sustained over 60 minutes in WT and LKO. This might be initially less in LKO for Akt (hard to argue on a WB n of 3 with huge WT variability), regardless they are all roughly the same by 60 minutes and even look higher in LKO at 60. This seems like a big disconnect and suggests the impairment in the SHSy5Y cells might have more to do with the CRISPR process than the LRRK2. Were the cells sequenced for off-target CRISPR-induced modifications?
Following the Reviewer suggestion – and as discussed in the public review section - we performed an off-target analysis. Specifically, we selected the first 8 putative off targets exhibiting a CDF (Cutting Frequency Determination) off-target-score >0.2. As shown in supplemental file 1, sequence disruption was observed only in the LRRK2 on-target site in LRRK2 KO SH-SY5Y cells, while the 8 off-target regions remained unchanged across the genotypes and relative to the reference sequence.
No difference in the density of large PSD-95 puncta in dendrites of LKO primary relative to WT, and the small (10%) increase seen in WT after BDNF might be absent in LKO (it is not clear to me that this is absent in every culture rep, and the data is not highly convincing). This is also referred to as spinogenesis, which has not been quantified. Why not is confusing as they did use a GFP fill...
The Reviewer is right that spinogenesis is not the appropriate term for the process analyzed. We replaced “spinogenesis” with “morphological alternation of dendritic protrusions” or “synapse maturation” which is correlated with the number of PSD95 positive puncta (ElHusseini et al., Science, 2000) .
There is a difference in the percentage of dendritic protrusions classified as filopodia to more being classified as thin spines in LKO striatal neurons at 1 month, which is not seen at any other age, The WT filopodia seems to drop and thin spine percent rise to be similar to LKO at 4 months. This is taken as evidence for delayed maturation in LKO, but the data suggest the opposite. These authors previously published decreased spine and increased filopodia density at P15 in LKO. Now they show that filopodia density is decreased and thin spine density increased at one month. How is that shift from increased to decreased filopodia density in LKO (faster than WT from a larger initial point) evidence of impaired maturation? Again this seems accelerated?
We agree with the Reviewer that the initial interpretation was indeed confusing. To adhere closely to our data and avoid overinterpretation – as also suggested by Reviewer 2 – we revised the text and moved figure 5D to supplementary materials. In essence, our data point out to alterations in the structural properties of dendritic protrusions in young KO mice, specifically a reduction in their size (head width and neck height) and a decrease in postsynaptic density (PSD) length, as observed with TEM. These findings suggest that LRRK2 is involved in morphological processes during spine development.
Shank3 and PSD95 mRNA transcript levels were reduced in the LKO midbrain, only shank3 was reduced in the striatum and only PSD was reduced in the cortex. No changes to mRNA of BDNF-related transcripts. None of these mRNA changes protein-validated. Drebrin protein (where is drebrin mRNA?) levels are reduced in LKO at 1&4 but not clearly at 18 months (seems the most robust result but doesn't correlate with other measures, which here is basically a transient increase (1m) in thin striatal spines).
As illustrated before, we performed qPCR for Dbn1 and found that its expression is significantly reduced in the cortex and midbrain and non-significantly reduced in the striatum (1 months old mice, a different cohort as those used for the other analysis in figure 5).
24h BDNF increases the frequency of mEPSCs on hIPSC-derived cortical-like neurons, but not LKO, which is already high. There are no details of synapse number or anything for these cultures and compares 24h treatment. BDNF increases mEPSC frequency within minutes PMC3397209, and acute application while recording on cells may be much more informative (effects of BDNF directly, and no issues with cell-cell / culture variability). Calling mEPSC "spontaneous electrical activity" is not standard.
We thank the reviewer for this point. We provided information about synapse number (Bassoon/Homer colocalization) in supplementary figure S7. The lack of response of LRRK2 KO cultures in terms of mEPSC is likely due to increase release probability as the number of synapses does not change between the two genotypes.
The pattern of LRRK2 activation is very disconnected from that of BDNF signalling onto other kinases. Regarding pLRRK2, s935 is a non-autophosph site said to be required for LRRK2 enzymatic activity, that is mostly used in the field as a readout of successful LRRK2 inhibition, with some evidence that this site regulates LRRK2 subcellular localization (which might be more to do with whether or not it is p at 935 and therefor able to act as a kinase).
The authors imply BDNF is activating LRRK2, but really should have looked at other sites, such as the autophospho site 1292 and 'known' LRRK2 substrates like T73 pRab10 (or other e.g., pRab12) as evidence of LRRK2 activation. One can easily argue that the initial increase in pLRRK2 at this site is less consequential than the observation that BDNF silences LRRK2 activity based on p935 being sustained to being reduced after 5 minutes, and well below the prestim levels... not that BDNF activates LRRK2.
As described above, we have collected new data showing that BDNF stimulation increases LRRK2 kinase activity toward its physiological substrates Rab10 and Rab8 (using a panphospho-Rab antibody) (Figure 1 and Figure S1). Additionally, we have also extensively commented the ceiling effect of pS935.
BDNF does a LOT. What happens to network activity in the neural cultures with BDNF application? Should go up immediately. Would increasing neural activity (i.e., through depolarization, forskolin, disinhibition, or something else without BDNF) give a similar 20% increase in pS935 LRRK2? Can this be additive, or occluded? This would have major implications for the conclusions that BDNF and pLRRK2 are tightly linked (as the title suggests).
These are very valuable observations; however, they fall outside the scope and timeframe of this study. We agree that future research should focus on gaining a deeper mechanistic understanding of how LRRK2 regulates synaptic activity, including vesicle release probability and postsynaptic spine maturation, independently of BDNF.
Figures 1A & H "Western blot analysis revealed a rapid (5 mins) and transient increase of Ser935 phosphorylation after BDNF treatment (Fig. 1B and 1C). Of interest, BDNF failed to stimulate Ser935 phosphorylation when neurons were pretreated with the LRRK2 inhibitor MLi-2" . The first thing that stands out is that the pLRRK2 in WB is not very clear at all (although we appreciate it is 'a pig' to work with, I'd hope some replicates are clearer); besides that, the 20% increase only at 5min post-BDNF stimulation seems like a much less profound change than the reduction from base at 60 and more at 180 minutes (where total LRRK2 protein is also going down?). That the blot at 60 minutes in H is representative of a 30% reduction seems off... makes me wonder about the background subtraction in quantification (for this there is much less pLRRK2 and more total LRRK2 than at 0 or 5). LRRK2 (especially) and pLRRK2 seem very sketchy in H. Also, total LRRK2 appears to increase in the SHSY5Y cell not the neurons, and this seems even clearer in 2 H.
To better visualize the dynamics of pS935 variation relative to time=0, we presented the data as the difference between t=0 and t=x. It clearly shows that pSe935 goes below prestimulation levels, whereas pRab10 does not. The large difference in the initial stoichiometry of these two phosphorylation is extensively discussed above.
That MLi2 eliminates pLRRK2 (and seems to reduce LRRK2 protein?) isn't surprising, but a 90min pretreatment with MLi-2 should be compared to MLi-2's vehicle alone (MLi-2 is notoriously insoluble and the majority of diluents have bioactive effects like changing activity)... especially if concluding increased pLRRK2 in response to BDNF is a crucial point (when comparing against effects on other protein modifications such as pAKT). This highlights a second point... the changes to pERK and pAKT are huge following BDNF (nothing to massive quantities), whereas pLRRK2 increases are 20-50% at best. This suggests a very modest effect of BDNF on LRRK in neurons, compared to the other kinases. I worry this might be less consequential than claimed. Change in S1 is also unlikely to be significant...
These comments have been thoroughly addressed in the previous responses. Regarding fig. S1, we added an additional experiment (Figure S1C) in GFP-LRRK2 cells showing robust activation of LRRK2 (pS935, pRabs) at the timepoint of MS (15 min).
"As the yields of endogenous LRRK2 purification were insufficient for AP-MS/MS analysis, we generated polyclonal SH-SY5Y cells stably expressing GFP-LRRK2 wild-type or GFP control (Supplementary Fig. 1)" . I am concerned that much is being assumed regarding 'synaptic function' from SHSY5Y cells... also overexpressing GFP-LRRK2 and looking at its binding after BDNF isn't synaptic function.
We appreciate the reviewer’s comment. We would like to clarify that the interactors enriched upon BDNF stimulation predominantly fall into semantic categories related to the synapse and actin cytoskeleton. While this does not imply that these interactors are exclusively synaptic, it suggests that this tightly interconnected network likely plays a role in synaptic function. This interpretation is supported by several lines of evidence: (1) previous studies have demonstrated the relevance of this compartment to LRRK2 function; (2) our new phosphoproteomics data from striatal lysate highlight enrichment of synaptic categories; and (3) analysis of the latest GWAS gene list (134 genes) also indicates significant enrichment of synapse-related categories. Taken together, these findings justify further investigation into the role of LRRK2 in synaptic biology, as discussed extensively in the manuscript’s discussion section.
Figure 2A isn't alluded to in text and supplemental table 1 isn't about LRRK2 binding, but mEPSCs.
We have added Figure 2A and added supplementary .xls table 1, which refers to the excel list of genes with modulated interaction upon BDNF (uploaded in the supplemental material).
We added the extension .xls also for supplementary table 2 and 3.
Figure 2A is useless without some hits being named, and the donut plots in B add nothing beyond a statement that "35% of 'genes' (shouldn't this be proteins?) among the total 207 LRRK2 interactors were SynGO annotated" might as well [just] be the sentence in the text.
We have now included the names of the most significant hits, including cytoskeletal and translation-related proteins, as well as known LRRK2 interactors. We decided to retain the donut plots, as we believe they simplify data interpretation for the reader, reducing the need to jump back and forth between the figures and the text.
Validation of drebrin binding in 2H is great... although only one of 8 named hits; could be increased to include some of the others. A concern alludes to my previous point... there is no appreciable LRRK2 in these cells until GFP-LRRK2 is overexpressed; is this addressed in the MS? Conclusions would be much stronger if bidirectional coIP of these binding candidates were shown with endogenous (GFP-ve) LRRK2 (primaries or hIPSCs, brain tissue?)
To address the Reviewer’s concerns to the best of our abilities, we have added a blot in Supplemental figure S1A showing how the expression levels of LRRK2 increase after RA differentiation. Moreover, we have included several new data further strengthening the functional link between LRRK2 and drebrin, including qPCR of Dbn1 in one-month old Lrrk2 KO brains, western blots of Lrrk2 and Rab in Dbn1 KO brains, and co-IP with drebrin N- and Cterm domains.
Figures 3 A-C are not informative beyond the text and D could be useful if proteins were annotated.
To avoid overcrowding, proteins were annotated in A and the same network structure reported for synaptic and actin-related interactors.
Figure 4. Is this now endogenous LRRK2 in the SHSY5Y cells? Again not much LRRK2 though, and no pLRRK shown.
We confirm that these are naïve SH-SY5Y cells differentiated with RA and LRRK2 is endogenous. We did not assess pS935 in this experiment, as the primary goal was to evaluate pAKT and pERK1/2 levels. To avoid signal saturation, we loaded less total protein (30 µg instead of the 80 µg typically required to detect pS935). pS935 levels were extensively assessed in Figure 1. This experimental detail has now been added in the material and methods section (page 18).
In C (primary neurons) There is very little increase in pLRRK2 / LRRK2 at 5 mins, and any is much less profound a change than the reduction at 30 & 60 mins. I think this is interesting and may be a more substantial consequence of BDNF treatment than the small early increase. Any 5 min increase is gone by 30 and pLRRK2 is reduced after. This is a disconnect from the timing of all the other pProteins in this assay, yet pLRRK2 is supposed to be regulating the 'synaptic effects'?
The first part of the question has already been extensively addressed. Regarding the timing, one possibility is that LRRK2 is activated upstream of AKT and ERK1/2, a hypothesis supported by the reduced activation of AKT and ERK1/2 observed in LRRK2 KO cells, as discussed in the manuscript, and in MLi-2 treated cells (Author response image 2). Concerning the synaptic effects, it is well established that synaptic structural and functional plasticity occurs downstream of receptor activation and kinase signaling cascades. These changes can be mediated by both rapid mechanisms (e.g., mobilization of receptor-containing endosomes via the actin cytoskeleton) and slower processes involving gene transcription of immediate early genes (IEGs). Since structural and functional changes at the synapse generally manifest several hours after stimulation, we typically assessed synaptic activity and structure 24 hours post-stimulation.
Akt Erk1&2 both go up rapidly after BDNF in WT, although Akt seems to come down with pLRRK2. If they aren't all the same Akt is probably the most different between LKO and WT but I am very concerned about an n=3 for wb, wb is semi-quantitative at best, and many more than three replicates should be assessed, especially if the argument is that the increases are quantitively different between WT v KO (huge variability in WT makes me think if this were done 10x it would all look same). Moreover, this isn't similar to the LKO primaries "pulled pups" pooled presumably.
Despite some variability in the magnitude of the pAKT/pERK response in naïve SH-SY5Y cells, all three independent replicates consistently showed a reduced response in LRRK2 KO cells, yielding a highly significant result in the two-way ANOVA test. In contrast, the difference in response magnitude between WT and LRRK2 KO primary cultures was less pronounced, which justified repeating the experiments with n=9 replicates. We hope the Reviewer acknowledges the inherent variability often observed in western blot experiments, particularly when performed in a fully independent manner (different cultures and stimulations, independent blots).
To further strengthen the conclusion that this effect is reproducible and dependent on LRRK2 kinase activity upstream of AKT and ERK, we probed the membranes in figure 1H with pAKT/total AKT and pERK/total ERK. All things considered and consistent with our hypothesis, MLi-2 significantly reduced BDNF-mediated AKT and ERK1/2 phosphorylation levels (Author response image 2).
Author response image 2.
Western blot (same experiments as in figure 1) was performed using antibodies against phospho-Thr202/185 ERK1/2, total ERK1/2 and phospho-Ser473 AKT, total AKT protein levels Retinoic acid-differentiated SH-SY5Y cells stimulated with 100 ng/mL BDNF for 0, 5, 30, 60 mins. MLi-2 was used at 500 nM for 90 mins to inhibit LRRK2 kinase activity.
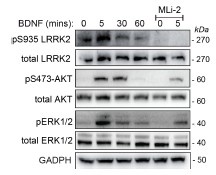
G lack of KO effect seems to be skewed from one culture in the plot (grey). The scatter makes it hard to read, perhaps display the culture mean +/- BDNF with paired bars. The fact that one replicate may be changing things is suggested by the weirdly significant treatment effect and no genotype effect. Also, these are GFP-filled cells, the dendritic masks should be shown/explained, and I'm very surprised no one counted the number (or type?) of protrusions, especially as the text describes this assay (incorrectly) as spinogenesis...
As suggested by the Reviewer we have replotted the results as bar graphs. Regarding the number of protrusions, we initially counted the number of GFP+ puncta in the WT and did not find any difference (Author response image 3). Due to our imaging setup (confocal microscopy rather than super-resolution imaging and Imaris 3D reconstruction), we were unable to perform a fine morphometric analysis. However, this was not entirely unexpected, as BDNF is known to promote both the formation and maturation of dendritic spines. Therefore, we focused on quantifying PSD95+ puncta as a readout of mature postsynaptic compartments. While we acknowledge that we cannot definitively conclude that each PSD95+ punctum is synaptically connected to a presynaptic terminal, the data do indicate an increase in the number of PSD95+ structures following BDNF stimulation.
Author response image 3.
GFP+ puncta per unit of neurite length (µm) in DIV14 WT primary neurons untreated or upon 24 hour of BDNF treatment (100 ng/ml). No significant difference were observed (n=3).
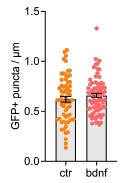
Figure 5. "Dendritic spine maturation is delayed in Lrrk2 knockout mice". The only significant change is at 1 month in KO which shows fewer filopodia and increased thin spines (50% vs wt). At 4 months the % of thin spines is increased to 60% in both... Filopodia also look like 4m in KO at 1m... How is that evidence for delayed maturation? If anything it suggests the KO spines are maturing faster. "the average neck height was 15% shorter and the average head width was 27% smaller, meaning that spines are smaller in Lrrk2 KO brains" - it seems odd to say this before saying that actually there are just MORE thin spines, the number of mature "mushroom' is same throughout, and the different percentage of thin comes from fewer filopodia. This central argument that maturation is delayed is not supported and could be backwards, at least according to this data. Similarly, the average PSD length is likely impacted by a preponderance of thin spines in KO... which if mature were fewer would make sense to say delayed KO maturation, but this isn't the case, it is the fewer filopodia (with no PSD) that change the numbers. See previous comments of the preceding manuscript.
We agree that thin spines, while often considered more immature, represent an intermediate stage in spine development. The data showing an increase in thin spines at 1 month in the KO mice, along with fewer filopodia, could suggest a faster stabilization of these spines, which might indeed be indicative of premature maturation rather than delayed maturation. This change in spine morphology may indicate that the dynamics of synaptic plasticity are affected. Regarding the PSD length, as the Reviewer pointed out, the increased presence of thin spines in KO might account for the observed changes in PSD measurements, as thin spines typically have smaller PSDs. This further reinforces the idea that the overall maturation process may be altered in the KO, but not necessarily delayed.
We rephrase the interpretation of these data, and moved figure 5D as supplemental figure S4.
"To establish whether loss of Lrrk2 in young mice causes a reduction in dendritic spines size by influencing BDNF-TrkB expression" - there is no evidence of this.
We agree and reorganized the text, removing this sentence.
Shank and PSD95 mRNA changes being shown without protein adds very little. Why is drebrin RNA not shown? Also should be several housekeeping RNAs, not one (RPL27)?
We measured Dbn1 mRNA, which shows a significant reduction in midbrain and cortex. Moreover we have now normalized the transcript levels against the geometrical means of three housekeeping genes (RPL27, actin, and GAPDH) relative abundance.
Drebrin levels being lower in KO seems to be the strongest result of the paper so far (shame no pLRRK2 or coIP of drebrin to back up the argument). DrebrinA KO mice have normal spines, what about haploinsufficient drebrin mice (LKO seem to have half derbrin, but only as youngsters?)
As extensively explained in the public review, we used Dbn1 KO mouse brains and were able to show reduced Lrrk2 activity.
Figure 6. hIPSC-derived cortical neurons. The WT 'cortical' neurons have a very low mEPSC frequency at 0.2Hz relative to KO. Is this because they are more or less mature? What is the EPSC frequency of these cells at 30 and 90 days for comparison? Also, it is very very hard to infer anything about mEPSC frequency in the absence of estimates of cell number and more importantly synapse number. Furthermore, where are the details of cell measures such as capacitance, resistance, and quality control e.g., Ra? Table s1 seems redundant here, besides suggesting that the amplitude is higher in KO at base.
We agree that the developmental trajectory of iPSC-derived neurons is critical to accurately interpreting synaptic function and plasticity. In response, we have included additional data now presented in the supplementary figure S7 and summarize key findings below:
At DIV50, both WT and LRRK2 KO neurons exhibit low basal mEPSC activity (~0.5 Hz) and no response to 24 h BDNF stimulation (50 ng/mL).
At DIV70 WT neurons show very low basal activity (~0.2 Hz), which increases ~7.5-fold upon BDNF treatment (1.5 Hz; p < 0.001), and no change in synapse number. KO neurons display elevated basal activity (~1 Hz) similar to BDNF-treated WT neurons, with no further increase upon BDNF exposure (~1.3 Hz) and no change in synapse number.
At DIV90, no significant effect of BDNF in both WT and KO, indicating a possible saturation of plastic responses. The lack of BDNF response at DIV90 may be due to endogenous BDNF production or culture-based saturation effects. While these factors warrant further investigation (e.g., ELISA, co-culture systems), they do not confound the key conclusions regarding the role of LRRK2 in synaptic development and plasticity:
LRRK2 Enables BDNF-Responsive Synaptic Plasticity. In WT neurons, BDNF induces a significant increase in neurotransmitter release (mEPSC frequency) with no reduction in synapse number. This dissociation suggests BDNF promotes presynaptic functional potentiation. KO neurons fail to show changes in either synaptic function or structure in response to BDNF, indicating that LRRK2 is required for activity-dependent remodeling.
LRRK2 Loss Accelerates Synaptic Maturation. At DIV70, KO neurons already exhibit high spontaneous synaptic activity equivalent to BDNF-stimulated WT neurons. This suggests that LRRK2 may act to suppress premature maturation and temporally gate BDNF responsiveness, aligning with the differences in maturation dynamics observed in KO mice (Figure 5).
As suggested by the reviewer we reported the measurement of resistance and capacitance for all DIV (Table 1, supplemental material). A reduction in capacitance was observed in WT neurons at DIV90, which may reflect changes in membrane complexity. However, this did not correlate with differences in synapse number and is unlikely to account for the observed differences in mEPSC frequency. To control for cell number between groups, cell count prior to plating was performed (80k/cm2; see also methods) on the non-dividing cells to keep cell number consistent.
The presence of BDNF in WT seems to make them look like LKO, in the rest of the paper the suggestion is that the LKO lack a response to BDNF. Here it looks like it could be that BDNF signalling is saturated in LKO, or they are just very different at base and lack a response.
Knowing which is important to the conclusions, and acute application (recording and BDNF wash-in) would be much more convincing.
We agree with the Reviewer’s point that saturation of BDNF could influence the interpretation of the data if it were to occur. However, it is important to note that no BDNF exists in the media in base control and KO neuronal culture conditions. This is different from other culture conditions and allows us to investigate the effects of BDNF treatment. Thus, the increased mEPSC frequency observed in KO neurons compared to WT neurons is defined only by the deletion of the gene and not by other extrinsic factors which were kept consistent between the groups. The lack of response or change in mEPSC frequency in KO is proposed to be a compensatory mechanism due to the loss of LRRK2. Of Note, LRRK2 as a “synaptic break” has already been described (Beccano-Kelly et al., Hum Mol Gen, 2015). However, a comprehensive analysis of the underlying molecular mechanisms will require future studies beyond with the scope of this paper.
"The LRRK2 kinase substrates Rabs are not present in the list of significant phosphopeptides, likely due to the low stoichiometry and/or abundance" Likely due to the fact mass spec does not get anywhere near everything.
We removed this sentence in light of the new phosphoproteomic analysis.
Figure 7 is pretty stand-alone, and not validated in any way, hard to justify its inclusion?
As extensively explained we removed figure 7 and included the new phospho-MS as part of figure. 3
Writing throughout shows a very selective and shallow use of the literature.
We extensively reviewed the citations.
"while Lrrk1 transcript in this region is relatively stable during development" The authors reference a very old paper that barely shows any LRRK1 mRNA, and no protein. Others have shown that LRRK1 is essentially not present postnatally PMC2233633. This isn't even an argument the authors need to make.
We thank the reviewer and included this more appropriate citation.
Reviewer #2 (Recommendations For The Authors):
Cyfip1 (Fig 3A) is part of the WAVE complex (page 13).
We thank the reviewer and specified it.
The discussion could be more focused.
We extensively revised the discussion to keep it more focused.
Note that we updated the GO ontology analyses to reflect the updated information present in g:Profiler.
References.
Nirujogi, R. S., Tonelli, F., Taylor, M., Lis, P., Zimprich, A., Sammler, E., & Alessi, D. R. (2021). Development of a multiplexed targeted mass spectrometry assay for LRRK2phosphorylated Rabs and Ser910/Ser935 biomarker sites. The Biochemical journal, 478(2), 299–326. https://doi.org/10.1042/BCJ20200930
Worth, D. C., Daly, C. N., Geraldo, S., Oozeer, F., & Gordon-Weeks, P. R. (2013). Drebrin contains a cryptic F-actin-bundling activity regulated by Cdk5 phosphorylation. The Journal of cell biology, 202(5), 793–806. https://doi.org/10.1083/jcb.201303005
Shirao, T., Hanamura, K., Koganezawa, N., Ishizuka, Y., Yamazaki, H., & Sekino, Y. (2017). The role of drebrin in neurons. Journal of neurochemistry, 141(6), 819–834. https://doi.org/10.1111/jnc.13988
Koganezawa, N., Hanamura, K., Sekino, Y., & Shirao, T. (2017). The role of drebrin in dendritic spines. Molecular and cellular neurosciences, 84, 85–92. https://doi.org/10.1016/j.mcn.2017.01.004
Meixner, A., Boldt, K., Van Troys, M., Askenazi, M., Gloeckner, C. J., Bauer, M., Marto, J. A., Ampe, C., Kinkl, N., & Ueffing, M. (2011). A QUICK screen for Lrrk2 interaction partners--leucine-rich repeat kinase 2 is involved in actin cytoskeleton dynamics. Molecular & cellular proteomics: MCP, 10(1), M110.001172. https://doi.org/10.1074/mcp.M110.001172
Parisiadou, L., & Cai, H. (2010). LRRK2 function on actin and microtubule dynamics in Parkinson disease. Communicative & integrative biology, 3(5), 396–400. https://doi.org/10.4161/cib.3.5.12286
Chen, C., Masotti, M., Shepard, N., Promes, V., Tombesi, G., Arango, D., Manzoni, C., Greggio, E., Hilfiker, S., Kozorovitskiy, Y., & Parisiadou, L. (2024). LRRK2 mediates haloperidol-induced changes in indirect pathway striatal projection neurons. bioRxiv : the preprint server for biology, 2024.06.06.597594. https://doi.org/10.1101/2024.06.06.597594
Cheng, J., Novati, G., Pan, J., Bycroft, C., Žemgulytė, A., Applebaum, T., Pritzel, A.,Wong, L. H., Zielinski, M., Sargeant, T., Schneider, R. G., Senior, A. W., Jumper, J., Hassabis, D., Kohli, P., & Avsec, Ž. (2023). Accurate proteome-wide missense variant effect prediction with AlphaMissense. Science (New York, N.Y.), 381(6664), eadg7492. https://doi.org/10.1126/science.adg7492
Beaudoin, G. M., 3rd, Schofield, C. M., Nuwal, T., Zang, K., Ullian, E. M., Huang, B., & Reichardt, L. F. (2012). Afadin, a Ras/Rap effector that controls cadherin function, promotes spine and excitatory synapse density in the hippocampus. The Journal of neuroscience : the official journal of the Society for Neuroscience, 32(1), 99–110. https://doi.org/10.1523/JNEUROSCI.4565-11.2012
Fernández, B., Chittoor-Vinod, V. G., Kluss, J. H., Kelly, K., Bryant, N., Nguyen, A. P. T., Bukhari, S. A., Smith, N., Lara Ordóñez, A. J., Fdez, E., Chartier-Harlin, M. C., Montine, T. J., Wilson, M. A., Moore, D. J., West, A. B., Cookson, M. R., Nichols, R. J., & Hilfiker, S. (2022). Evaluation of Current Methods to Detect Cellular Leucine-Rich Repeat Kinase 2 (LRRK2) Kinase Activity. Journal of Parkinson's disease, 12(5), 1423–1447. https://doi.org/10.3233/JPD-213128
Cirnaru, M. D., Marte, A., Belluzzi, E., Russo, I., Gabrielli, M., Longo, F., Arcuri, L., Murru, L., Bubacco, L., Matteoli, M., Fedele, E., Sala, C., Passafaro, M., Morari, M., Greggio, E., Onofri, F., & Piccoli, G. (2014). LRRK2 kinase activity regulates synaptic vesicle trafficking and neurotransmitter release through modulation of LRRK2 macromolecular complex. Frontiers in molecular neuroscience, 7, 49. https://doi.org/10.3389/fnmol.2014.00049
Belluzzi, E., Gonnelli, A., Cirnaru, M. D., Marte, A., Plotegher, N., Russo, I., Civiero, L., Cogo, S., Carrion, M. P., Franchin, C., Arrigoni, G., Beltramini, M., Bubacco, L., Onofri, F., Piccoli, G., & Greggio, E. (2016). LRRK2 phosphorylates pre-synaptic Nethylmaleimide sensitive fusion (NSF) protein enhancing its ATPase activity and SNARE complex disassembling rate. Molecular neurodegeneration, 11, 1. https://doi.org/10.1186/s13024-015-0066-z
Martin, E. R., Gandawijaya, J., & Oguro-Ando, A. (2022). A novel method for generating glutamatergic SH-SY5Y neuron-like cells utilizing B-27 supplement. Frontiers in pharmacology, 13, 943627. https://doi.org/10.3389/fphar.2022.943627
Kovalevich, J., & Langford, D. (2013). Considerations for the use of SH-SY5Y neuroblastoma cells in neurobiology. Methods in molecular biology (Clifton, N.J.), 1078, 9–21. https://doi.org/10.1007/978-1-62703-640-5_2
Drummond, N. J., Singh Dolt, K., Canham, M. A., Kilbride, P., Morris, G. J., & Kunath, T. (2020). Cryopreservation of Human Midbrain Dopaminergic Neural Progenitor Cells Poised for Neuronal Differentiation. Frontiers in cell and developmental biology, 8, 578907. https://doi.org/10.3389/fcell.2020.578907
Tao, X., Finkbeiner, S., Arnold, D. B., Shaywitz, A. J., & Greenberg, M. E. (1998). Ca2+ influx regulates BDNF transcription by a CREB family transcription factor-dependent mechanism. Neuron, 20(4), 709–726. https://doi.org/10.1016/s0896-6273(00)810107
El-Husseini, A. E., Schnell, E., Chetkovich, D. M., Nicoll, R. A., & Bredt, D. S. (2000). PSD95 involvement in maturation of excitatory synapses. Science (New York, N.Y.), 290(5495), 1364–1368.
Glebov OO, Cox S, Humphreys L, Burrone J. Neuronal activity controls transsynaptic geometry. Sci Rep. 2016 Mar 8;6:22703. doi: 10.1038/srep22703. Erratum in: Sci Rep. 2016 May 31;6:26422. doi: 10.1038/srep26422. PMID: 26951792; PMCID: PMC4782104.
Beccano-Kelly DA, Volta M, Munsie LN, Paschall SA, Tatarnikov I, Co K, Chou P, Cao LP, Bergeron S, Mitchell E, Han H, Melrose HL, Tapia L, Raymond LA, Farrer MJ, Milnerwood AJ. LRRK2 overexpression alters glutamatergic presynaptic plasticity, striatal dopamine tone, postsynaptic signal transduction, motor activity and memory. Hum Mol Genet. 2015 Mar 1;24(5):1336-49. doi: 10.1093/hmg/ddu543. Epub 2014 Oct 24. PMID: 25343991.
Author response:
The following is the authors’ response to the original reviews.
Reviewer #1 (Public Review):
Major concerns:
(1) Is the direct binding of MCAK to the microtubule cap important for its in vivo function?
a.The authors claim that their "study provides mechanistic insights into understanding the end-binding mechanism of MCAK". I respectfully disagree. My concern is that the paper offers limited insights into the physiological significance of direct end-binding for MCAK activity, even in vitro. The authors estimate that in the absence of other proteins in vitro, ~95% of MCAK molecules arrive at the tip by direct binding in the presence of ~ physiological ATP concentration (1 mM). In cells, however, the major end-binding pathway may be mediated by EB, with the direct binding pathway contributing little to none. This is a reasonable concern because the apparent dissociation constant measured by the authors shows that MCAK binding to microtubules in the presence of ATP is very weak (69 uM). This concern should be addressed by 1) calculating relative contributions of direct and EB-dependent pathways based on the affinities measured in this and other published papers and estimated intracellular concentrations. Although there are many unknowns about these interactions in cells, a modeling-based analysis may be revealing. 2) the recapitulation of these pathways using purifying proteins in vitro is also feasible. Ideally, some direct evidence should be provided, e.g. based on MCAK function-separating mutants (GDP-Pi tubulin binding vs. catalytic activity at the curled protofilaments) that contribution from the direct binding of MCAK to microtubule cap in EB presence is significant.
We thank the reviewer for the thoughtful comments.
(1) We think that the end-binding affinity of MCAK makes a significant contribution for its cellular functions. To elucidate this concept, we now use a simple model shown in Supplementary Appendix-2 (see pages 49-51, lines 1246-1316). In this model, we simplified MCAK and EB1 binding to microtubule ends by considering only these two proteins while neglecting other factors (e.g. XMAP215). Specifically, we considered two scenarios: one in which both proteins freely diffuse in the cytoplasm and another where MCAK is localized to specific cellular structures, such as the centrosome or centromere. Based on the modeling results, we argue that MCAK's functional impact at microtubule ends derives both from its intrinsic end-binding capacity and its ability to strengthen the EB1-mediated end association pathway.
(2) We agree with the reviewer that MCAK exhibiting a lower end-binding affinity (69 µM) is indeed intriguing, as one might intuitively expect a stronger affinity, e.g. in the nanomolar range. Several factors may contribute to this observation. First, this could be partly due to the in vitro system employed, which may not perfectly replicate in vivo conditions, especially when considering cellular processes quantitatively. Variations in medium composition can significantly influence the binding state. For example, reducing salt concentration leads to a marked increase in MCAK’s binding affinity (Helenius et al., 2006; Maurer et al., 2011; McHugh et al., 2019). Additionally, while numerous binding events with short durations were detected, we excluded transient interactions from our analysis to facilitate quantification. This likely leads to an underestimation of the on-rate and, consequently, the binding affinity. Moreover, to minimize the interference of purification tags (His-tag), we ensured their complete removal during protein sample preparation. Previous studies reported that retaining the His-tag of MAPs affects the binding affinity to microtubules (Maurer et al., 2011; Zhu et al., 2009). Finally, a low affinity is not necessarily unexpected. Considering the microtubule end as a receptor with multiple binding sites for MCAK, the overall binding affinity is in the nanomolar range (260 nM). This does not necessarily contradict MCAK being a microtubule dynamics regulator as only a few MCAK molecules may suffice to induce microtubule catastrophe (as discussed on page 13, lines 408-441).
(3) Ideally, we would search for mutants that specifically interfere with the binding of GDP-Pi-tubulin or the curled protofilaments. However, the mutant we tested significantly impacts the overall affinity of MCAK to microtubules (both end and lattice), making it challenging to isolate and discuss the function of MCAK with respect to the binding to GDP-Pi-tubulin alone. Additionally, we also think that the GDP-Pi-tubulin in the EB cap and the tubulin in the curved protofilaments may share structural similarities. For instance, the tubulin dimers in both states may be less compact compared to those in the lattice, which could explain why MCAK recognizes both simultaneously (Manka and Moores, 2018). However, this remains a conjecture, as there is currently no direct evidence to support it.
b. As mentioned in the Discussion, preferential MCAK binding to tubulins near the MT tip may enhance MCAK targeting of terminal tubulins AFTER the MCAK has been "delivered" to the distal cap via the EB-dependent mechanism. This is a different targeting mechanism than the direct MCAK-binding. However, the measured binding affinity between MCAK and GMPCPP tubulins is so weak (69 uM), that this effect is also unlikely to have any impact because the binding events between MCAK and microtubule should be extremely rare. Without hard evidence, the arguments for this enhancement are very speculative.
Please see our response to the comment No. 1. Additionally, we have revised our discussion to discuss the end-binding affinity of MCAK as well as its physiological relevance (please see page 13, lines 408-441; and see Supplementary Appendix-2 in pages 49-51, lines 1246-1316).
(2) The authors do not provide sufficient justification and explanation for their investigation of the effects of different nucleotides in MCAK binding affinity. A clear summary of the nucleotide-dependent function of MCAK (introduction with references to prior affinity measurements and corresponding MCAK affinities), the justifications for this investigation, and what has been learned from using different nucleotides (discussion) should be provided. My take on these results is that by far the strongest effect on microtubule wall and tip binding is achieved by adding any adenosine, whereas differences between different nucleotides are relatively minor. Was this expected? What can be learned from the apparent similarity between ATP and AMPPNP effects in some assays (Fig 1E, 4C, etc) but not others (Fig 1D,F, etc)?
We thank the reviewer for this suggestion. We have revised the manuscript accordingly, and below are the main points of our response
(1) The experiment investigating the effects of different nucleotides on MCAK binding affinity was inspired by the previous studies demonstrating that kinesin-13 interactions with microtubules are highly dependent on their adenosine-bound states. For example, kinesin-13s tightly bind microtubules and prefer to form protofilament curls or rings with tubulin in the AMPPNP state, whereas kinesin-13s are considered to move along the microtubule lattice via one-dimensional diffusion in the ADP·Pi state (Asenjo et al., 2013; Benoit et al., 2018; Friel and Howard, 2011; Helenius et al., 2006). Based on these observations, we wondered whether MCAK's adenosine-bound states might similarly affect its binding preference for growing microtubule ends. We have made the motivation clear in the revised manuscript (please see page 7, lines 199-209).
(2) Our main finding regarding the effects of nucleotides is that MCAK shows differential end-binding affinity and preference based on its nucleotide state. First, MCAK shows the greatest preference for growing microtubule ends in the ATP state, supporting the idea that diffusive MCAK (MCAK·ATP) can directly bind to growing microtubule ends. Second, MCAK·ATP also demonstrates a binding preference for GTPγS microtubules and the ends of GMPCPP microtubules. The similar trends in binding preference suggest that the affinity for GDP·Pi-tubulin and GTP-tubulin likely underpins MCAK’s preference for growing microtubule ends. To clarify these points, we have added further discussions in the manuscript (please see page 8, lines 230-233; page9, lines 258-270 and pages 13-14, lines 443-458).
(3) It is not clear why the authors decided to use these specific mutant MCAK proteins to advance their arguments about the importance of direct tip binding. Both mutants are enzymatically inactive. Both show roughly similar tip interactions, with some (minor) differences. Without a clear understanding of what these mutants represent, the provided interpretations of the corresponding results are not convincing.
We thank the reviewer for this comment. In the revised manuscript, we no longer draw conclusions about the importance of end-binding based on the mutant data. Instead, we think that the mutant data provide insights into the structural basis of the end-binding preference. Therefore, we have rewritten the results in this section to more accurately reflect these findings (please see page 10, lines 295-327).
(4) GMPCPP microtubules are used in the current study to represent normal dynamic microtubule ends, based on some published studies. However, there is no consensus in the field regarding the structure of growing vs. GMPCPP-stabilized microtubule ends, which additionally may be sensitive to specific experimental conditions (buffers, temperature, age of microtubules, etc). To strengthen the authors' argument, Taxol-stabilized microtubules should be used as a control to test if the effects are specific. Additionally, the authors should consider the possibility that stronger MCAK binding to the ends of different types of microtubules may reflect MCAK-dependent depolymerization events on a very small scale (several tubulin rows). These nano-scale changes to tubulins and the microtubule end may lead to the accumulation of small tubulin-MCAK aggregates, as is seen with other MAPs and slowly depolymerizing microtubules. These effects for MCAK may also depend on specific nucleotides, further complicating the interpretation. This possibility should be addressed because it provides a different interpretation than presented in the manuscript.
Regarding the two points raised here, our thoughts are as following
(1) The end of GMPCPP-stabilized microtubules differs from that of growing microtubules, with the most obvious known difference being the absence of the region enriched in GDP-Pi-tubulin. We consider the end of GMPCPP microtubules as an analogue of the distal tip of growing microtubules, based on two key features: (1) curled protofilaments and (2) GMPCPP-tubulin, a close analogue of GTP-tubulin. Notably, both features are present at the ends of both GMPCPP-stabilized and growing microtubules. Moreover, we agree with the suggestion to use taxol-stabilized microtubules as a control. This would eliminate the second feature (absence of GTP-tubulin), allowing us to isolate the effect of the first feature. Therefore, we conducted this experiment, and our data showed that MCAK exhibits only a mild binding preference for the ends of taxol-stabilized microtubules, which is much less pronounced than for the ends of GMPCPP microtubules. This observation supports the idea that GMPCPP-stabilized ends closely resemble the growing ends of microtubules.
(2) The reviewer suggested that stronger MCAK binding to the ends of different types of microtubules might reflect MCAK-dependent depolymerization events on a very small scale. This is an insightful possibility, which we had overlooked in the original manuscript. Fortunately, we performed the experiments at the single-molecule concentrations. Upon reviewing the raw data, we found that under ATP conditions, the binding events of MCAK were not cumulative (see Fig. X1 below) and showed no evidence of local accumulation of MCAK-tubulin aggregates.
Author response image 1.
The representative kymograph showing GFP-MCAK binding at the ends and lattice of GMPCPP microtubules in the presence of 1 mM ATP (10 nM GFP-MCAK), which corresponded to Fig. 5A. The arrow: the end-binding of MCAK. Vertical bar: 1 s; horizontal bar: 2 mm.
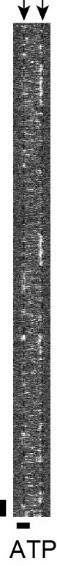
(5) It would be helpful if the authors provided microtubule polymerization rates and catastrophe frequencies for assays with dynamic microtubules and MCAK in the presence of different nucleotides. The video recordings of microtubules under these conditions are already available to the authors, so it should not be difficult to provide these quantifications. They may reveal that microtubule ends are different (or not) under the examined conditions. It would also help to increase the overall credibility of this study by providing data that are easy to compare between different labs.
We thank the reviewer for this suggestion. In the revised manuscript, we have provided data on the growth rates, which are similar across the different nucleotide states (Fig. s1). However, due to the short duration of our recordings (usually 5 minutes, but with a high frame rate, 10 fps), we did not observe many catastrophe events, which prevented us from quantifying catastrophe frequency using the current dataset. Since we measured the binding kinetics of MCAK during the growing phase of microtubules, the similar growth rates and microtubule end morphologies suggest that the microtubule ends are comparable across the different conditions.
Reviewer #1 (Recommendations For The Authors):
a. Please provide more details about how the microtubule-bound molecules were selected for analysis (include a description of scripts, selection criteria, and filters, if any). Fig 1A arrows do not provide sufficient information.
We first measured the fluorescence intensity of each binding event. A probability distribution of these intensities was then constructed and fitted with a Gaussian function. A binding event was considered to correspond to a single molecule if its intensity fell within μ±2σ of the distribution. The details of the single-molecule screening process are now provided in the revised manuscript (see page17, lines 574-583).
b. Evidence that MCAK is dimeric in solution should be provided (gel filtration results, controls for Figs1A - bleaching, or comparison with single GFP fluorophore).
In the revised manuscript, we provide the gel filtration results of purified MCAK and other proteins used in this study. The elution volume of the peak for GFP-MCAK corresponded to a molecular weight range between 120 kDa (EB1-GFP dimer) and 260 kDa (XMAP215-GFP-his6), suggesting that GFP-MCAK exists as a dimer (~220 kDa) under experimental condition (please see Fig.s1 and page 5, lines 104-105). In addition, we also measured the fluorescence intensity of both MCAK<sup>sN+M</sup> and MCAK. MCAK<sup>sN+M</sup> is a monomeric mutant that contains the neck domain and motor domain (Wang et al., 2012). The average intensity of MCAK<sup>sN+M</sup> is 196 A.U., about 65% of that of MCAK (300 A.U.). These two measurements suggest that the purified MCAK used in this study exists dimers (see Fig. s1).
c. Evidence that MCAK on microtubules represents single molecules should be provided (distribution of GFP brightness with controls - GFP imaged under identical conditions). Since assay buffers include detergent, which is not desirable, all controls should be done using the same assay conditions. The authors should rule out that their main results are detergent-sensitive.
(1) Regarding if MCAK on microtubules represent single molecules: please refer to our responses to the two points above.
(2) To rule out the effect of tween-20 (0.0001%, v/v), we performed additional control experiments. The results showed that it has no significant effect on microtubule-binding affinity of MCAK (see Figure below).
Author response image 2.
Tween-20 (0.0001%, v/v) has no significant effect on microtubule-binding affinity of MCAK. (A) The representative projection images of GFP-MCAK (5 nM) binding to taxol-stabled GDP microtubules in the presence of 1 mM AMPPNP with or without tween-20. The upper panel showed the results of the control experiments performed without MCAK. Scale bar: 5 mm. (B) Statistical quantification of the binding intensity of GFP-MCAK binding to GDP microtubules with or without tween-20 (53 microtubules from 3 assays and 70 microtubules from 3 assays, respectively). Data were presented as mean ± SEM. Statistical comparisons were performed using the two-tailed Mann-Whitney U test with Bonferroni correction, n.s., no significance.
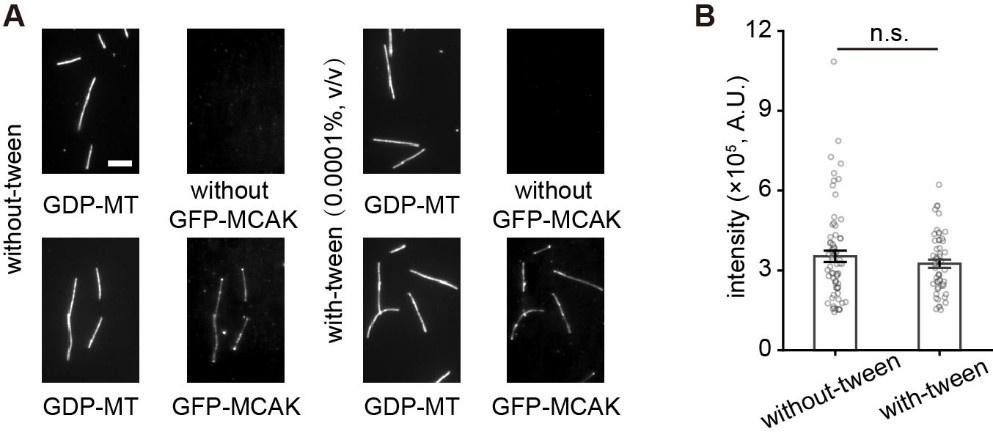
d. How did the authors plot single-molecule intensity distributions? I am confused as to why the intensity distribution for single molecules in Fig 1D and 2A looks so perfectly smooth, non-pixelated, and broader than expected for GFP wavelength. Please provide unprocessed original distributions, pixel size, and more details about how the distributions were processed.
In the revised manuscript, we provided unprocessed original data in Fig. 1B and Fig. 2A. We thank the reviewer for pointing out this problem.
e. Many quantifications are based on a limited number of microtubules and the number of molecules is not provided, starting from Fig 1D and down. Please provide detailed statistics and explain what is plotted (mean with SEM?) on each graph.
We performed a thorough inspection of the manuscript and corrected the identified issues.
f. Plots with averaged data should be supplemented with error bars and N should be provided in the legend. E.g. Fig 1C - average position of MT and peak positions.
We agree with the reviewer. In the revised manuscript, we have made the changes accordingly (e.g. Fig. 2C).
g. Detailed information should be provided about protein constructs used in this work including all tags. The use of truncated proteins or charged/bulky tags can modify protein-microtubule interactions.
We agree with the reviewer. In the revised manuscript, we provide the information of all constructs (see Fig. s1 and the related descriptions in Methods, pages 15-16, lines 476-534).
h. Line 515: We estimated that the accuracy of microtubule end tracking was ~6 nm by measuring the standard error of the distribution of the estimated error in the microtubule end position. - evidence should be provided using the conditions of this study, not the reference to the prior work by others.
i. Line 520: We estimated that the accuracy of the measured position was ~2 nm by measuring the standard error of the fitting peak location". Please provide evidence.
Point h-i: we now provide detailed descriptions of how to estimate tracking and measurement accuracy and error in our work. Please see pages 18-19, lines 626-645.
j. Kymographs in Fig 5G are barely visible. Please provide single-channel greyscale images. What are the dim molecules diffusing on this microtubule?
We have incorporated the changes suggested by the reviewer. We think that some of the dim signals may result from stochastic background noise, while others likely represent transient bindings of MCAK. The exposure time in our experiments was approximately 0.05 seconds; if the binding duration were shorter than this, the signal would be lower (i.e. the “dim” signals). It is important to note that in this study, we selected binding events lasting at least 2 consecutive frames, meaning transient binding events were not included. This point has been clarified in the Methods section (see page17, lines 573-583).
k. Please provide a methods description for Fig 6. Did the buffer include 1 mM ATP? The presence of ATP would make these conditions more physiological. ATP concentration should be stated clearly in the main text or figure legend.
The buffer contains ATP. In the revised manuscript, we have provided the methods for the experiments of microtubule dynamics assay, as well as the analysis of microtubule lifetimes and catastrophe frequency (see page 17, lines 561-572 and page 20, lines 685-690).
l. Line 104: experiment was performed in BRB80 supplemented with 50 mM KCl and 1 mM ATP, providing a nearly physiological ion strength. Please provide a reference or add your calculations in Methods.
We have provided references on page 5, lines 101-104 of our manuscript.
m. What was the MCAK concentration in Figure 4? Did the microtubule shorten under any of these conditions?
In these experiments, we used a very low concentration of MCAK and taxol-stabilized microtubules, so there’s no microtubule shortening observed here. ATP: 10 nM GFP-MCAK; AMPPNP: 1 nM GFP-MCAK; ADP: 10 nM GFP-MCAK; APO state: 0.1 nM GFP-MCAK.
Other criticism:
Text improvements are recommended in the Discussion. For example, line 348: Fourth, the loss of the binding preference.. suggests that the binding preference .. is required for the optimal .. preference.
We thank the reviewer for pointing out this. In the revised manuscript, we conducted a thorough revision and review of the text.
Reviewer #2 (Public Review):
Summary:
In this manuscript, Chen et al. investigate the localization of microtubule kinesin-13 MCAK to the microtubule ends. MCAK is a prominent microtubule depolymerase whose molecular mechanisms of action have been extensively studied by a number of labs over the last ~twenty years. Here, the authors use single-molecule approaches to investigate the precise localization of MCAK on growing microtubules and conclude that MCAK preferentially binds to a GDP-Pi-tubulin portion of the microtubule end. The conclusions are speculative and not well substantiated by the data, making the impact of the study in its current form rather limited. Specifically, greater effort should be made to define the region of MCAK binding on microtubule ends, as well as its structural characteristics. Given that MCAK has been previously shown to effectively tip-track growing microtubule ends through an established interaction with EB proteins, the physiological relevance of the present study is unclear. Finally, the manuscript does not cite or properly discuss a number of relevant literature references, the results of which should be directly compared and contrasted to those presented here.
We thank the reviewer for the comments. As these suggestions are more thoroughly expressed in the following comments for authors, we will provide the responses in the corresponding sections, as shown below.
Reviewer #2 (Recommendations For The Authors):
Significant concerns:
(1) Establishing the precise localization of MCAK wrt microtubule end is highly non-trivial. More details should be provided, including substantial supplementary data. In particular, the authors claim ~6 nm accuracy in microtubule end positioning - this should be substantiated by data showing individual overlaid microtubule end intensity profiles as well as fits with standard deviations etc. Furthermore, to conclude that MCAK binds behind XMAP215, the authors should look at the localization of the two proteins simultaneously, on the same microtubule end. Notably, EB binding profiles are well known to exponentially decay along the microtubule lattice - this is not very apparent from the presented data. If MCAK's autonomous binding pattern matches that of EB, we should be seeing an exponentially-decaying localization for MCAK as well? However, averaged MCAK signals seem to only be fitted to Gaussian. Note that the EB binding region (i.e. position and size of the EB comet) can be substantially modulated by increasing the microtubule growth rate - this can be easily accomplished by increasing tubulin concentrations or the addition of XMAP215 (e.g. see Maurer et al. Cur Bio 2014). Thus to establish that MCAK on its own binds the same region as EB, experiments that directly modulate the size and the position of this region should be added.
(1) We thank the reviewer for this comment. Regarding the accuracy in microtubule end positioning, we now provide more details, and please see pages 18-19, lines 625-645 in the revised manuscript.
(2) Regarding the relative localization of XMAP215 and MCAK, we performed additional experiments to record their colocalizations simultaneously, on the same microtubule end. Our results showed that MCAK predominantly binds behind XMAP215, with 14.5% appearing within the XMAP215’s binding region. Please see Fig. 2.D-E and lines 184-197 in the revised manuscript.
(3) Regarding the exponential decay of the EB1 signal along microtubules, we observed that the position probability distribution measured in the present study follows a Gaussian distribution, and the expected exponential decay was not apparent. Since the exponential decay is thought to result from the time delay between tubulin polymerization and GTP hydrolysis, slower polymerization is expected to reduce this latency (Maurer et al., 2014). In our experiments, the growth rate was relatively low (~0.7 mm/min), much slower than the rate observed in cells, where the comet-shaped EB1 signal is most pronounced. The previous study has shown that the exponential decay of EB1 is more pronounced at growth rates exceeding 3 mm/min in vitro (Maurer et al., 2014). Therefore, we think that the relatively slow growth may account for the observed non-exponential decay distribution of the EB1 signals. The same reason may also explain the distribution of MCAK.
(4) We agree with the reviewer’s suggestion that altering microtubule growth rate is a valid and effective approach to regulate the EB cap length. However, the conclusion that MCAK binds to the EB region is supported by three lines of evidence: (1) the localization of MCAK at the ends of microtubules, (2) new experimental data showing that MCAK binds to the proximal end of the XMAP215 site, and (3) the tendency of MCAK to bind GTPγS microtubules, similar to EB1. Based on these findings, we did not pursue additional experiments to modify the length of the EB cap.
(2) Even if MCAK indeed binds behind XMAP215, there is no evidence that this region is defined by the GDP-Pi nucleotide state; it could still be curved protofilaments. GTPyS is an analogue of GTP - to what extent GTPyS microtubules exactly mimic the GDP-Pi-tubulin state remains controversial. Furthermore, nucleotide sensing for EB is thought to be achieved through its binding at the interface of four tubulin dimers. However MCAK's binding site is distinct, and it has been shown to recognize intradimer tubulin curvature. Thus it is not clear how MCAK would sense the nucleotide state. On the other hand, there is mounting evidence that the morphology of the growing microtubule end can be highly variable, and that curved protofilaments may be protruding off the growing ends for tens of nanometers or more, previously observed both by EM as well as by fluorescence (e.g. Mcintosh, Moores, Chretien, Odde, Gardner, Akhmanova, Hancock, Zanic labs). Thus, to establish that MCAK indeed localizes along the closed lattice, EM approaches should be used.
First, we conducted additional experiments that demonstrate MCAK indeed binds behind XMAP215, supporting the conclusion that MCAK interacts with the EB cap (please see Fig. 2 in the revised manuscript). Second, our argument that MCAK preferentially binds to GDP-Pi tubulin is based on two observations: (1) the binding regions of MCAK overlap with those of EB1, and (2) MCAK preferentially binds to GTPγS microtubules, which are considered a close analogue of GDP-Pi tubulin. Third, understanding the structural basis of how MCAK senses the nucleotide state of tubulin is beyond the scope of the present study. However, inspired by the reviewer’s suggestion, we looked into the structure of the MCAK-tubulin complex. The L2 loop of MCAK makes direct contact with the interdimer interface (Trofimova et al., 2018; Wang et al., 2017), which could provide a structural basis for recognizing the changes induced by GTP hydrolysis. While this remains a hypothesis, it is certainly a promising direction for future research. Forth, we agree with the reviewer that an EM approach would be ideal for establishing that MCAK localizes along the closed lattice. However, this is not the focus of the current study. Instead, we argue that MCAK binds to the EB cap, where at least some lateral interactions are likely to have formed.
(3) The physiological relevance of the study is rather questionable: MCAK has been previously established to be able to both diffuse along the microtubule lattice (e.g. Helenius et al.) as well as hitchhike on EBs (Gouveia et al.). Given the established localization of EBs to growing microtubule ends in cells, and apparently higher affinity of MCAK for EB vs. the microtubule end itself (although direct comparisons with the literature have not been reported here), the relevance of MCAK's autonomous binding to dynamic microtubule ends is dubious.
We thank the reviewer for raising the importance of physiological relevance. Please refer to our response to the comment No.1 of reviewer 1. Briefly, we think that the end-binding affinity of MCAK makes a significant contribution for its cellular functions. To elucidate this concept, we now use a simple model shown in Supplementary Appendix-2 (see pages 49-51, lines 1246-1316). In this model, we simplified MCAK and EB1 binding to microtubule ends by considering only these two proteins while neglecting other factors (e.g. XMAP215). Specifically, we considered two scenarios: one in which both proteins freely diffuse in the cytoplasm and another where MCAK is localized to specific cellular structures, such as the centrosome or centromere. Based on the modeling results, we argue that MCAK's functional impact at microtubule ends derives both from its intrinsic end-binding capacity and its ability to strengthen the EB1-mediated end association pathway.
(4) Finally, the study seriously lacks discussion of and comparison with the existing literature on this topic. There are major omissions in citing relevant literature, such as e.g. landmark study by Kinoshita et al. Science 2001. Several findings reported here directly contradict previous findings in the literature. Direct comparison with e.g. Gouveia et al findings, Helenius et al. findings, and others need to be included. For example, Gouveia et al reported that EB is necessary for MCAK plus-end-tracking in vitro (please see Figure 1 of their manuscript). The authors should discuss how they reconcile the differences in their findings when compared to this earlier study.
We thank the reviewer for this helpful suggestion. In the revised manuscript, we have updated the text description and included comparative discussions with other relevant studies in the Discussion section. Specifically, we added comparisons with the research on XMAP215 in page 14, lines 459-472 (Barr and Gergely, 2008; Kinoshita et al., 2001; Tournebize et al., 2000). Additionally, we have compared our findings with those of Gouveia et al. and Helenius et al. regarding MCAK's preference for binding microtubule ends in page 6, lines 145-157 and page 13, 408-441, respectively (Gouveia et al., 2010; Helenius et al., 2006).
Additional specific comments:
Figure 1
Gouveia et al. (Figure 1) reported that MCAK does not autonomously preferentially localize to growing tips. Specifically, Gouveia et al. found equal association rates of MCAK to both the lattice and the tip in the presence of EB3delT, an EB3 construct that does not directly interact with MCAK. How can these findings be reconciled with the results presented here?
We are uncertain why there was no observed difference in the on-rates to the lattice and the end in the study by Gouveia et al. Even when considering only the known affinity of MCAK for curved protofilaments at the distal tip of growing microtubules, we would still expect to observe an end-binding preference. After carefully comparing the experimental conditions, we nevertheless identified some differences. First, we used a 160 nm tip size to calculate the on-rate (k<sub>on</sub>), whereas Gouveia et al. used a 450 nm tip. Using a longer tip size would naturally lead to a smaller(k<sub>on</sub>) value. Note that we chose 160 nm for several reasons: (i) a previous cryo-electron tomography study has elucidated that the sheet structures of dynamic microtubule ends have an average length of around 180 nm (Guesdon et al., 2016); (ii) Analysis of fluorescence signals at dynamic microtubule ends has demonstrated that the taper length at the microtubule end is less than 180 nm (Maurer et al., 2014); (iii) in the present study, we estimated that the length of MCAK's end-binding region is approximately 160 nm. Second, in Gouveia et al., single-molecule binding events were recorded in the presence of 75 nM EB3ΔT, which could potentially create a crowded environment at the tip, reducing MCAK binding. Third, as mentioned in our response to Reviewer 1, we took great care to minimize the interference from purification tags (e.g., His-tag) by ensuring their complete removal during protein preparation. Previous studies reported that retaining the His-tag of MAPs led to a significant increase in binding for microtubules (Maurer et al., 2011; Zhu et al., 2009). We believe that some of the factors mentioned above, or their combined effects, may account for the differences in these two observations.
1C shows the decay of tubulin signal over several hundred nm - should show individual traces? How aligned? Doesn't this long decay suggest protruding protofilaments? (E.g. Odde/Gardner work).
(1) In the revised manuscript, we now show individual traces (e.g. in Fig. 1B and Fig. 2A). The average trace for tubulin signal with standard deviation was shown in Fig. 2C.
(2) The microtubule lattice was considered as a Gaussian wall and its end as a half-Gaussian in every frame. Use the peak position of the half-Gaussian of every frame to align and average microtubule end signals, during the dwell time. The average microtubule ends' half-Gaussion peak used as a reference to measure the intensity profile of individual single-molecule binding event in every frame (see page18, lines 607-624).
(3) We think that the decay of tubulin signal results from the convolution of the tapered end structure and the point spread function. In the revised manuscript, we have updated the Figures to provide unprocessed original data in Fig. 1B and Fig. 2A.
Please show absolute numbers of measurements in 1C (rather than normalized distribution only).
In the revised manuscript, we have included the raw data for both tubulin and MCAK signals as part of the methods description. In Fig. 1, using normalized values allows for the simultaneous representation of microtubule and protein signals on a unified graph.
How do the results in 1D-G compare with the previous literature? Particularly comparison of on-rates between this study and the Gouveia et al? Assuming 1 um = 1625 dimers, it appears that in the presence of EB3, the on-rate of MCAK to the tips reported in Gouveia et al. is an order of magnitude higher than reported here in the absence of EB3 (4.3 x 10E-4 vs. 2 x 10E-5). If so, and given the robust presence of EB proteins at growing microtubule ends in cells, this would invalidate the potential physiological relevance of the current study. Note that the dwell times measured in Gouveia et al. are also longer than those measured here.
Note that in Gouveia et al, the concentration of mCherry-EB3 was 75 nM, about 187.5 times higher than that of MCAK (0.4 nM). The relative concentrations of these two proteins are not always the case in cells. Regarding the physiological relevance of the end-binding affinity of MCAK itself, please refer to our response to the point No.1 of Reviewer 1.
Notably, Helenius et al reported a diffusion constant for MCAK of 0.38 um^2/s, which is more than an order of magnitude higher than reported here. The authors should comment on this!
In the revised manuscript, we have provided an explanation for the difference in diffusion coefficient. Please see page 6, line 142-157. In short, low salt condition facilitates rapid diffusion of MCAK.
Figure 2:
This figure is critical and really depends on the analysis of the tubulin signal. Note significant variability in tubulin signal between presented examples in 2A. Also, while 2C looks qualitatively similar, there appears to be significant variability over the several hundred nm from the tip along the lattice. This is the crucial region; statistical significance testing should be presented. More detailed info, including SDs etc. is necessary.
In the revised manuscript, we have provided raw data in Fig. 1B and Fig. 2A. Additionally, we have provided statistical analysis on the tubulin signals (Fig. 2C) and performed significance test. Please see page 5, lines 111-116 and page 7, lines 179-183 for detailed descriptions.
Insights into the morphology of microtubule ends based on TIRF imaging have been previously gained in the literature, with reports of extended tip structures/protruding protofilaments (see e.g. Coombes et al. Cur Bio 2013, based on the methods of Demchouk et al. 2011). Such analysis should be performed here as well, if we are to conclude that nucleotide state alone, as opposed to the end morphology, specifies MCAK's tip localization.
We appreciate the reviewer’s suggestion and agree that it provides a valid optical microscopy-based approach for estimating microtubule end morphology. However, this method did not establish a direct correlation between microtubule end morphology and tubulin nucleotide status. Therefore, we think that refining the measurement of microtubule end morphology will not necessarily provide more information to the understanding of tubulin nucleotide status at MCAK binding sites. Based on the available data in the present study, there are two main pieces of evidence supporting the idea that MCAK can sense tubulin nucleotide status: (1) the binding regions of MCAK and EB overlap significantly, and (2) MCAK shows a clear preference for binding to GTPγS microtubules, similar to EB1 (we provide a new control to support this, Fig. s4). Of course, we do not consider this to be a perfect set of evidence. As the reviewer has pointed out here and in other suggestions, future work should aim to further distinguish the nucleotide status of tubulin in the dynamic versus non-dynamic regions at the ends of microtubules, and to investigate the structural basis by which MCAK recognizes tubulin nucleotide status.
EB comet profile should be clearly reproduced. MCAK should follow the comet profile.
Please see our 3<sup>rd</sup> response to the point 1 of this reviewer.
The conclusion that the MCAK binding region is larger than XMAP215 is not firm, based on the data presented. The authors state that 'the binding region of MCAK was longer than that of XMAP215'. What is the exact width of the region of the XMAP215 localization and how much longer is the MCAK end-binding region? Is this statistically significant?
We have revised this part in the revised manuscript (page 6, lines 167-172). The position probability distributions of MCAK and XMAP215 were significantly different (K-S test, p< 10<sup>-5</sup>), and the binding region of MCAK (FWHM=185 nm) was significantly longer than that of XMAP215 (FWHM=123 nm).
MCAK localization with AMPPNP should also be performed here. Even low concentrations of MCAK have been shown to induce microtubule catastrophe/end depolymerization. This will dramatically affect microtubule end morphology, and thus apparent positioning of MCAK at the end.
In the end positioning experiment, we used a low concentration of MCAK (1 nM). Under this condition, microtubule dynamics remained unchanged, and the morphology of the microtubule ends was comparable across different conditions (with EB1, MCAK or XMAP215). Additionally, in the revised manuscript, we present a new experiment in which we recorded the localization of both MCAK and XMAP215 on the same microtubule. The results support the conclusion regarding their relative localization: most MCAK is found at the proximal end of the XMAP215 binding region, while approximately 15% of MCAK is located within the XMAP215 binding region. Please see Fig. 2D-E and page 7, lines 184-197 for the corresponding descriptions.
Figure 3:
For clearer presentation, projections showing two microtubule lattice types on the same image (in e.g. two different colors) should be shown first without MCAK, and then with MCAK.
We thank the reviewer for this suggestion. We have adjusted the figure accordingly. Please see Fig. 4 in the revised manuscript.
Please comment on absolute intensity values - scales seem to be incredibly variable.
The fluorescence value presented here is the result of multiple images being summed. Therefore, the difference in absolute values is influenced not only by the binding affinity of MCAK in different states to microtubules, but also by the number of images used. In this analysis, we are not comparing MCAK in different states, but rather evaluating the binding ability of MCAK in the same state on different types of microtubules.
Given that the authors conclude that MCAK binding mimics that of EB, EB intensity measurements and ratios on different lattice substrates should be performed as a positive control.
We performed additional experiments with EB1, in the revised manuscript, we provide the data as a positive control (please see Fig. s4).
Figure 4:
MCAK-nucleotide dependence of GMPCPP microtubule-end binding has been previously established (see e.g. Helenius et al, others?) - what is new here? Need to discuss the literature. This would be more appropriate as a supplemental figure?
In the present study, we reproduced the GMPCPP microtubule-end binding of MCAK in the AMPPNP state, as shown in several previous reports (Desai et al., 1999; Hertzer et al., 2006). Here, we also quantified the end to lattice binding preference, and our results showed that the nucleotide state-dependence shows the same trend as the binding preference of MCAK to the growing microtubule ends. Therefore, we prefer to keep this figure in the main text (Fig. 5).
Figure 5:
Please note that both MCAK mutants show an additional two orders of magnitude lower microtubule binding on-rates when compared to wt MCAK. This makes the analysis of preferential binding substrate for these mutants dubious.
We agreed with this point. We have rewritten this part. Please see page 10, lines 295-327, in the revised manuscript.
Figure 6:
Combined effects of XMAP215 and XKCM1 (MCAK) have been previously explored in the landmark study by Kinoshita et al. Science 2001, which should be cited and discussed. Also note that Moriwaki et al. JCB 2016 explored the combined effects of XMA215 and MCAK - which should be discussed here and compared to the current results.
We agree with the reviewer. We have revised the discussion on this part. Please see page 11, lines 329-342 and page 14, lines 459-472 in the revised manuscript.
Please report quantification for growth rate and lifetime.
In the revised manuscript, we provide all these data. Please see pages 11-12, lines 343-374.
To obtain any new quantitative information on the combined effects of the two proteins, at the very minimum, the authors should perform a titration in protein concentration.
We agree with the reviewer on this point. In our pilot experiments, we performed titration experiments to determine the appropriate concentrations of MCAK and XMAP215, respectively. We selected 50 nM for XMAP215, as it clearly enhances the growth rate and exhibits a mild promoting effect on catastrophe—two key effects of XMAP215 reported in previous studies (Brouhard et al., 2008; Farmer et al., 2021). Reducing the XMAP215 concentration eliminates the catastrophe-promoting effect, while increasing it would not much enhance the growth rate. For MCAK, we chose 20 nM, as it effectively promotes catastrophe; increasing the concentration beyond this point leads to no microtubule growth, at least in the MCAK-only condition. If there’s no microtubule growth, it would be difficult to quantify the parameters of microtubule dynamics, hindering a clear comparison of the combined versus individual effects. Therefore, we think that the concentrations used in this study are appropriate and representative. In the revised manuscript, we make this point clearer (see pages 11 and lines 329-342).
Finally, the writing could be improved for overall clarity.
We thank the reviewer for pointing out this. In the revised manuscript, we conducted a thorough revision and review of the text.
Reviewer #3 (Public Review):
The authors revisit an old question of how MCAK goes to microtubule ends, partially answered by many groups over the years. The authors seem to have omitted the literature on MCAK in the past 10-15 years. The novelty is limited due to what has previously been done on the question. Previous work showed MCAK targets to microtubule plus-ends in cells through association with EB proteins and Kif18b (work from Wordeman, Medema, Walczak, Welburn, Akhmanova) but none of their work is cited.
We thank the reviewer for the suggestion. Some of the referenced work has already been cited in our manuscript, such as studies on the interaction between MCAK and EB1. However, other relevant literature had not been properly cited. In the revised manuscript, we have added further discussion on this topic in the context of existing findings. Please refer to pages 3-4, lines 68-85, and pages 13, lines 425-441.
It is not obvious in the paper that these in vitro studies only reveal microtubule end targeting, rather than plus end targeting. MCAK diffuses on the lattice to both ends and its conformation and association with the lattice and ends has also been addressed by other groups-not cited here. I want to particularly highlight the work from Friel's lab where they identified a CDK phosphomimetic mutant close to helix4 which reduces the end preference of MCAK. This residue is very close to the one mutated in this study and is highly relevant because it is a site that is phosphorylated in vivo. This study and the mutant produced here suggest a charge-based recognition of the end of microtubules.
Here the authors analyze this MCAK recognition of the lattice and microtubule ends, with different nucleotide states of MCAK and in the presence of different nucleotide states for the microtubule lattice. The main conclusion is that MCAK affinity for microtubules varies in the presence of different nucleotides (ATP and analogs) which was partially known already. How different nucleotide states of the microtubule lattice influence MCAK binding is novel. This information will be interesting to researchers working on the mechanism of motors and microtubules. However, there are some issues with some experiments. In the paper, the authors say they measure MCAK residency of growing end microtubules, but in the kymographs, the microtubules don't appear dynamic - in addition, in Figure 1A, MCAK is at microtubule ends and does not cause depolymerization. I would have expected to see depolymerization of the microtubule after MCAK targeting. The MCAK mutants are not well characterized. Do they still have ATPase activity? Are they folded? Can the authors also highlight T537 and discuss this?
Finally, a few experiments are done with MCAK and XMAP215, after the authors say they have demonstrated the binding sites overlap. The data supporting this statement were not obvious and the conclusions that the effect of the two molecules are additive would argue against competing binding sites. Overall, while there are some interesting quantitative measurements of MCAK on microtubules - in particular in relation to the nucleotide state of the microtubule lattice - the insights into end-recognition are modest and do not address or discuss how it might happen in cells. Often the number of events is not recorded. Histograms with large SEM bars are presented, so it is hard to get a good idea of data distribution and robustness. Figures lack annotations. This compromises therefore their quantifications and conclusions. The discussion was hard to follow and needs streamlining, as well as putting their work in the context of what is known from other groups who produced work on this in the past few years.
We thank the reviewer for the comments. Regarding the physiological relevance of the end-binding of MCAK itself, please refer to our response to the point No.1 of reviewer 1. Moreover, as we feel that other suggestions are more thoroughly expressed in the following comments for authors, we will provide the responses in the corresponding sections, as shown below.
Reviewer #3 (Recommendations For The Authors):
Why, on dynamic microtubules, is MCAK at microtubule plus ends and does not cause a catastrophe?
At this concentration (10 nM MCAK with 16 mM tubulin in Fig. 1; 1 nM MCAK with 12 mM tubulin in Fig. 2), MCAK has little effect on microtubule dynamics in our experiments. Using TIRFM, we were able to observe individual MCAK binding events. Based on these observations, we think that in the current experimental condition, a single binding event of MCAK is insufficient to induce microtubule catastrophe; rather, it likely requires cumulative changes resulting from multiple binding events.
Do the MCAK mutants still have ATPase activity?
The ATPase activities of MCAK<sup>K525A</sup> and MCAK<sup>V298S</sup> are both reduced to about 1/3 of the wild-type (Fig. s6).
The intensities of GFP are not all the same on the microtubule lattice (eg 1A). See blue and white arrowheads. The authors could be looking at multiple molecules of GFP-MCAK instead of single dimers. How do they account for this possibility?
In the revised manuscript, we provide the gel filtration result of the purified MCAK, and the position of the peak corresponds to ~220 kDa, demonstrating that the purified MCAK in solution is dimeric (please see Fig.s1 and page 5, lines 101-103). We measured the fluorescence intensity of each binding event. A probability distribution of these intensities was then constructed and fitted with a Gaussian function. A binding event was considered to correspond to a single molecule if its intensity fell within μ±2σ of the distribution. The details of the single-molecule screening process are provided in the revised manuscript (see page 17, lines 574-583).
In addition, we also measured the fluorescence intensity of both MCAK<sup>sN+M</sup> and MCAK. MCAK<sup>sN+M</sup> is a monomeric mutant that contains the neck domain and motor domain (Wang et al., 2012). The average intensity of MCAK<sup>sN+M</sup> is 196 A.U., about 65 % of that of MCAK (300 A.U.), suggesting that MCAK is a dimer (see Fig. s1). Moreover, we think that some of the dim signals may result from stochastic background noise, while others likely represent transient bindings of MCAK. The exposure time in our experiments was approximately 0.05 seconds; if the binding duration were shorter than this, the signal would be lower. It is important to note that in this study, we specifically selected binding events lasting at least 2 consecutive frames, meaning transient binding events were not included. This point has been clarified in the Methods section (see page 17, lines 568-569 and lines 574-583).
Could the authors provide a kymograph of an MT growing, in the presence of MCAK+AMPPNP? Can MCAK track the cap?
Under single-molecule conditions, we observed a single MCAK molecule briefly binding to the end of the microtubule. However, we did not record if MCAK at high concentrations could track microtubule ends under AMPPNP conditions.
In the experiments in Figure 6, the authors should also show the localization of MCAK and XMAP215 at microtubule plus ends in their kymographs to show the two molecules overlap.
Regarding the relative localization of XMAP215 and MCAK, we conducted additional experiments to record their colocalization simultaneously at the same microtubule end. Our results show that MCAK predominantly binds behind XMAP215, with 14.5% of MCAK binding within the XMAP215 binding region. Please see Fig. 2.D-E and page 7, lines 184-197 in the revised manuscript. However, we argue that the effects of XMAP215 and MCAK are additive, and their binding sites do not necessarily need to overlap for these effects to occur.
The authors do not report what statistical tests are done in their graphs, and one concern is over error propagation of their data. Instead of bar graphs, showing the data points would be helpful.
We have now shown all data points in the revised manuscript.
MCAK+AMPPNP accumulates at microtubule ends. Appropriate quotes from previous work should be provided.
We have made the revisions accordingly. Please see page 9, lines 273-276.
Controls are missing. An SEC profile for all purified proteins should be presented. Also, the authors need to explain if they report the dimeric or monomeric concentration of MCAK, XMAP215, etc...
We have provided the gel filtration result for all purified proteins in the revised manuscript (Fig.s1). Moreover, we now make it clear that the concentrations of MCAK and EB1 are monomeric concentration. Please see the legend for Fig. 1, line 893 in the revised manuscript.
Figure 1: the microtubules don't look dynamic at all. This is also why the authors can record MCAK at microtubule ends, because their structure is not changing.
The microtubules are dynamic, but they may appear non-dynamic due to the relatively slow growth rate and the high frame rate at which we are recording. We propose that individual binding events of MCAK induce structural changes at the nanoscopic or molecular scale, which are not detectable using TIRFM.
I recommend the authors measure the Kon and Koff for single GFP-MCAK mutant molecules and provide the information alongside their normalized and averaged binding intensities of GFP-MCAK in Fig 5. Showing data points instead of bar graphs would be better.
(1) We measured k<sub>on</sub> and dwell time for mutants at growing microtubule end. However, we did not perform single-molecule tracking for MCAK’s binding on stabilized microtubules. This is mainly because the superimposed signal on the stable microtubule already indicates the changes in the mutant's binding affinity to different microtubule structures, and moreover, the binding of the mutants is highly transient, making accurate single-molecule tracking and calculations difficult.
(2) In the revised figure, we have included the data points in all plots.
When discussing how Kinesin-13 interacts with the lattice, the authors should quote the papers that report the organization of full-length Kinesin-13 on tubulin heterodimers: Trofimova et al, 2018; McHugh et al 2019; Benoit et al, 2018. It would reinforce their model and account for the full-length protein, rather than just the motor domain.
We thank the suggestion for the reviewer. In our manuscript, we have cited papers on full-length Kinesin-13 to discuss the interaction between MCAK and microtubule end-curved structure. Additionally, we have utilized the MCAK-tubulin crystal structure (PDB ID: 5MIO) in Fig. 6, as it depicts a human MCAK, which is consistent with the protein used in our study. This structure illustrates the interaction sites between MCAK and tubulin dimer, guiding our mutation studies on specific residues. Thus, we prefer to use the structure (PDB ID: 5MIO) in Fig.6.
Figure 5A. What type of model is this? A PDB code is mentioned. Is this from an X-ray structure? If so, mention it.
We have now included the structural information in the Figure legend (see page 37, lines 1045).
Figure 5B. It is not possible to distinguish the different microtubule lattices (GTPyS, GDP, and GMPCPP). The experiment needs to be better labelled.
We thank the reviewer for this comment. We have now rearranged the figure for better clarity (see Fig. 6).
"Figure 5D: what are the statistical tests? I don't understand " The statistical comparisons were made versus the corresponding value of 848 GFP-MCAK".
We have made this point clearer in the revised manuscript (see pages 38, line 1078-1080).
What is the "EB cap"? This needs explaining.
We provide this explanation for this, please see page 4, lines 87-89 in the revised manuscript.
Work from Friel and co-workers showed MCAK T537E did not have depolymerizing activity and a reduced affinity for microtubule ends. The work of the authors should be discussed with respect to this previously published work.
We thank the reviewer for this suggestion. In the revised manuscript, we have added discussions on this (see page 10, lines 303-307).
The concentration of protein used in the assays is not always described.
We have checked throughout the manuscript and made revisions accordingly.
"Having revealed the novel binding sites of MCAK in dynamic microtubule ends " should be on "we wondered how MCAK may work ..with EB1". This is not addressed so should be removed. Instead, they can quote the work from Akhmanova's lab. Realistically this section should be rephrased as there are other plus-end targeting molecules that compete with MCAK, not just XMAP215 and EB1.
We have rephrased this section as suggested by this reviewer to be more specific. Please see page 11, lines 329-342.
What is AMPCPP?
It should be “AMPPNP”
Typos in Figure 5.
Corrected
Author response:
The following is the authors’ response to the previous reviews.
Reviewer #1:
(1) Peptides were synthesized with fluorescein isothiocyanate (FITC) and Tat tag, and then PEGylated with methoxy PEG Succinimidyl Succinate.
I have two concerns about the peptide design. First, FTIC was intended "for monitoring" (line 129), but was never used in the manuscript. Second, PEGylation targets the two lysine sidechains on the Tat, which would alter its penetration property.
(1) We conducted an analysis of the cellular trafficking of FITC-tagged peptides following their permeabilization into cells.
Author response image 1.
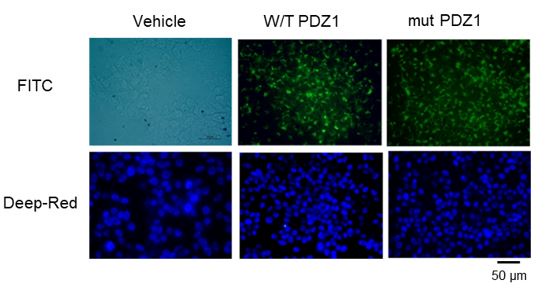
However, we did not include it in the main text because it is a basic result.
(2) As can be seen in the figure above, after pegylation and permeabilization, the cells were stained with FITC. It appears that this does not affect the ability to penetrate into the cells.
(2) "Superdex 200 increase 10/300 GL column" (line 437) was used to isolate mono/di PEGylated PDZ and separate them from the residual PEG and PDZ peptide. "m-PEG-succinimidyl succinate with an average molecular weight of 5000 Da" (lines 133 and 134).
To my knowledge, the Superdex 200 increase 10/300 GL column is not suitable and is unlikely to produce traces shown in Figure 1B.
As Superdex 200 increase 10/300 GL featrues a fractionation range of 10,000 to 600,000 Da, we used it to fractionate PEGylated products including DiPEGylated PDZ (approx. 15 kDa) and MonoPEGylated PDZ (approx. 10 kDa) from residuals (PDZ and PEG), demonstrating successful isolation of PEGylated products (Figure 1C). Considering the molecular weights of PDZ and PEG are approximately 4.1 kDa and and 5.0 kDa, respectively, the late eluting peaks from SEC were likely to represent a mixed absorbance of PDZ and PEG at 215 nm.
However, as the reviewer pointed out, it could be unreasonable to annotate peaks representing PDZ and PEG, respectively, from mixed absorbance detected in a region (11-12 min) beyond the fractionation range.
In our revised manuscript, therefore, multiple peaks in the late eluting volume (11-12 min) were labeled as 'Residuals' all together. As a reference, the revised figure 1B includes a chromatogram of pure PDZ-WT under the same analytic condition.
Therefore, we changed Fig.1B to new results.
(3) "the in vivo survival effect of LPS and PDZ co-administration was examined in mice. The pretreatment with WT PDZ peptide significantly increased survival and rescued compared to LPS only; these effects were not observed with the mut PDZ peptide (Figure 2a)." (lines 159-160).
Fig 2a is the weight curve only. The data is missing in the manuscript.
We added the survived curve into Fig. 2A.
(4) Table 1, peptide treatment on ALT and AST appears minor.
In mice treated with LPS, levels of ALT and AGT in the blood are elevated, but these levels decrease upon treatment with WT PDZ. However, the use of mut PDZ does not result in significant changes. Figure 3A shows inflammatory cells within the central vein, yet no substantial hepatotoxicity is observed during the 5-day treatment with LPS. Normally, the ranges of ALT and AGT in C57BL6 mice are 16 ~ 200 U/L and 46 ~ 221 U/L, respectively, according to UCLA Diagnostic Labs. Therefore, the values in all experiments fall within these normal ranges. In summary, a 5-day treatment with LPS induces inflammation in the liver but is too short a duration to induce hepatotoxicity, resulting in lower values.
(5) MitoTraker Green FM shouldn't produce red images in Figure 6.
We changed new results (GREEN one) into Figs 6A and B.
(6) Figure 5. Comparison of mRNA expression in PDZ-treated BEAS-2B cells. Needs a clearer and more detailed description both in the main text and figure legend. The current version is very hard to read.
We changed Fig. 5A to new one to understand much easier and added more detailed results and figure legend.
Results Section in Figure 5:
we performed RNA sequencing analysis. The results of RNA-seq analysis showed the expression pattern of 24,424 genes according to each comparison combination, of which the results showed the similarity of 51 genes overlapping in 4 gene categories and the similarity between each comparison combination (Figure 5a). As a result, compared to the control group, it was confirmed that LPS alone, WT PDZ+LPS, and mut PDZ+LPS were all upregulated above the average value in each gene, and when LPS treatment alone was compared with WT PDZ+LPS, it was confirmed that they were averaged or downregulated. When comparing LPS treatment alone and mut PDZ+LPS, it was confirmed that about half of the genes were upregulated. Regarding the similarity between comparison combinations, the comparison combination with LPS…
Figure 5 Legend Section:
Figure 5. Comparison of mRNA expression in PDZ-treated BEAS-2B cells.
BEAS-2B cells were treated with wild-type PDZ or mutant PDZ peptide for 24 h and then incubated with LPS for 2 h, after which RNA sequencing analysis was performed. (a) The heat map shows the general regulation pattern of about 51 inflammation-related genes that are differentially expressed when WT PDZ and mut PDZ are treated with LPS, an inflammatory substance. All samples are RED = upregulated and BLUE = downregulated relative to the gene average. Each row represents a gene, and the columns represent the values of the control group treated only with LPS and the WT PDZ and mut PDZ groups with LPS. This was used by converting each log value into a fold change value. All genes were adjusted to have the same mean and standard deviation, the unit of change is the standard deviation from the mean, and the color value range of each row is the same. (b) Significant genes were selected using Gene category chat (Fold change value of 2.00 and normalized data (log2) value of 4.00). The above pie chart shows the distribution of four gene categories when comparing LPS versus control, WT PDZ+LPS/LPS, and mut PDZ+LPS/LPS. The bar graph below shows RED=upregulated, GREEN=downregulated for each gene category, and shows the number of upregulated and downregulated genes in each gene category. (c) The protein-protein interaction network constructed by the STRING database differentially displays commonly occurring genes by comparing WT PDZ+LPS/LPS, mut PDZ+LPS/LPS, and LPS. These nodes represent proteins associated with inflammation, and these connecting lines denote interactions between two proteins. Different line thicknesses indicate types of evidence used in predicting the associations.
Reviewer #2:
(1) In this paper, the authors demonstrated the anti-inflammatory effect of PDZ peptide by inhibition of NF-kB signaling. Are there any results on the PDZ peptide-binding proteins (directly or indirectly) that can regulate LPS-induced inflammatory signaling pathway? Elucidation of the PDZ peptide-its binding partner protein and regulatory mechanisms will strengthen the author's hypothesis about the anti-inflammatory effects of PDZ peptide.
As mentioned in the Discussion section, we believe it is crucial to identify proteins that directly interact with PDZ and regulate it. This direct interaction can modulate intracellular signaling pathways, so we plan to express GST-PDZ and induce binding with cellular lysates, then characterize it using the LC-Mass/Mass method. We intend to further research these findings and submit them for publication.
(2) The authors presented interesting insights into the therapeutic role of the PDZ motif peptide of ZO-1. PDZ domains are protein-protein interaction modules found in a variety of species. It has been thought that many cellular and biological functions, especially those involving signal transduction complexes, are affected by PDZ-mediated interactions. What is the rationale for selecting the core sequence that regulates inflammation among the PDZ motifs of ZO-1 shown in Figure 1A?
The rationale for selecting the core sequence that regulates inflammation among the PDZ motifs of ZO-1, as shown in Figure 1A, is grounded in the specific roles these motifs play in signal transduction pathways that are crucial for inflammatory processes. PDZ domains are recognized for their ability to function as scaffolding proteins that organize signal transduction complexes, crucial for modulating cellular and biological functions. The chosen core sequence is particularly important because it is conserved across ZO-1, ZO-2, and ZO-3, indicating a fundamental role in maintaining cellular integrity and signaling pathways. This conservation suggests that the sequence’s involvement in inflammatory regulation is not only significant in ZO-1 but also reflects a broader biological function across the ZO family.
(3) In Figure 3, the authors showed the representative images of IHC, please add the quantification analysis of Iba1 expression and PAS-positive cells using Image J or other software. To help understand the figure, an indication is needed to distinguish specifically stained cells (for example, a dotted line or an arrow).
We added the semi-quantitative results into Figs. 3d,e,f.
Result section: The specific physiological mechanism by which WT PDZ peptide decreases LPS-induced systemic inflammation in mice and the signal molecules involved remain unclear. These were confirmed by a semi-quantitative analysis of Iba-1 immunoreactivity and PAS staining in liver, kidney, and lung,respectively (Figures 4d, e, and f). To examine whether WT PDZ peptide can alter LPS-induced tissue damage in the kidney, cell toxicity assay was performed (Figure 3g). LPS induced cell damage in the kidney, however, WT PDZ peptide could significantly alleviate the toxicity, but mut PDZ peptide could not. Because cytotoxicity caused by LPS is frequently due to ROS production in the kidney (Su et al., 2023; Qiongyue et al., 2022), ROS production in the mitochondria was investigated in renal mitochondria cells harvested from kidney tissue (Figure 3h)......
Figure legend section: Indicated scale bars were 20 μm. (d,e,f) Semi-quantitative analysis of each are positive for Iba-1 in liver and kidney, and positive cells of PAS in lung, respectively. (g) After the kidneys were harvested, tissue lysates were used for MTT assay. (h) After.....
(4) In Figure 6G, H, the authors confirmed the change in expression of the M2 markers by PDZ peptide using the mouse monocyte cell line Raw264.7. It would be good to add an experiment on changes in M1 and M2 markers caused by PDZ peptides in human monocyte cells (for example, THP-1).
We thank you for your comments. To determine whether PDZ peptide regulates M1/M2 polarization in human monocytes, we examined changes in M1 and M2 gene expression in THP-1 cells. As a result, wild-type PDZ significantly suppressed the expression of M1 marker genes (hlL-1β, hIL-6, hIL-8, hTNF-ɑ), while increasing the expression of M2 marker genes (hlL-4, hIL-10, hMRC-1). However, mutant PDZ did not affect M1/M2 polarization. These results suggest that PDZ peptide can suppress inflammation by regulating M1/M2 polarization of human monocyte cells. These results are for the reviewer's reference only and will not be included in the main content.
Author response image 2.
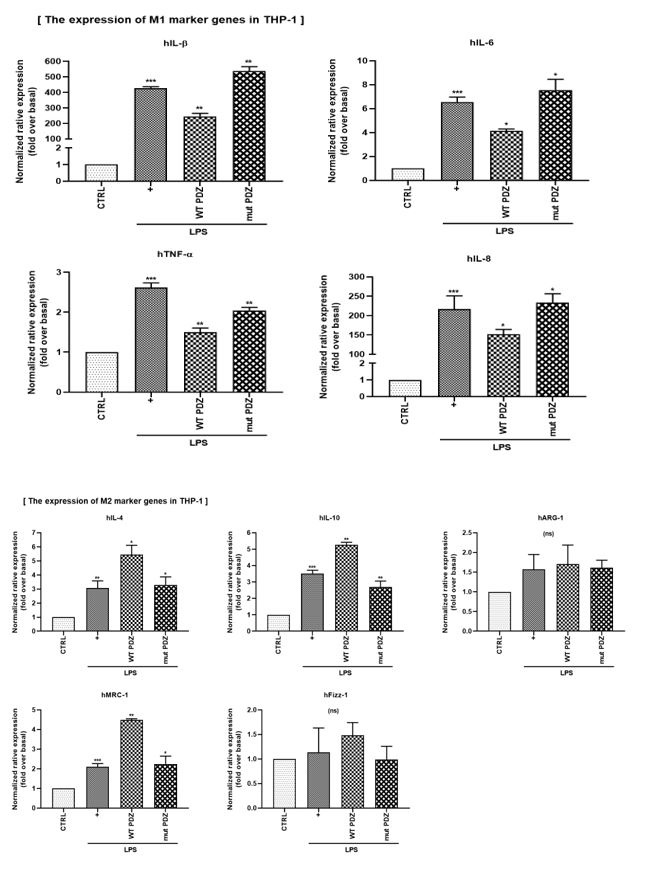
Minor point:
The use of language is appropriate, with good writing skills. Nevertheless, a thorough proofread would eliminate small mistakes such as:
• line 254, " mut PDZ+LPS/LPS (45.75%) " → " mut PDZ+LPS/LPS (47.75%) "
• line 296, " Figure 6f " → " Figure 6h "
We changed these points into the manuscript.
Author Response
The following is the authors’ response to the original reviews.
Public Reviews:
Reviewer #1 (Public Review):
Summary:
The authors develop a method to fluorescently tag peptides loaded onto dendritic cells using a two-step method with a tetracystein motif modified peptide and labelling step done on the surface of live DC using a dye with high affinity for the added motif. The results are convincing in demonstrating in vitro and in vivo T cell activation and efficient label transfer to specific T cells in vivo. The label transfer technique will be useful to identify T cells that have recognised a DC presenting a specific peptide antigen to allow the isolation of the T cell and cloning of its TCR subunits, for example. It may also be useful as a general assay for in vitro or in vivo T-DC communication that can allow the detection of genetic or chemical modulators.
Strengths:
The study includes both in vitro and in vivo analysis including flow cytometry and two-photon laser scanning microscopy. The results are convincing and the level of T cell labelling with the fluorescent pMHC is surprisingly robust and suggests that the approach is potentially revealing something about fundamental mechanisms beyond the state of the art.
Weaknesses:
The method is demonstrated only at high pMHC density and it is not clear if it can operate at at lower peptide doses where T cells normally operate. However, this doesn't limit the utility of the method for applications where the peptide of interest is known. It's not clear to me how it could be used to de-orphan known TCR and this should be explained if they want to claim this as an application. Previous methods based on biotin-streptavidin and phycoerythrin had single pMHC sensitivity, but there were limitations to the PE-based probe so the use of organic dyes could offer advantages.
We thank the reviewer for the valuable comments and suggestions. Indeed, we have shown and optimized this labeling technique for a commonly used peptide at rather high doses to provide a proof of principle for the possible use of tetracysteine tagged peptides for in vitro and in vivo studies. However, we completely agree that the studies that require different peptides and/or lower pMHC concentrations may require preliminary experiments if the use of biarsenical probes is attempted. We think it can help investigate the functional and biological properties of the peptides for TCRs deorphaned by techniques. Tetracysteine tagging of such peptides would provide a readily available antigen-specific reagent for the downstream assays and validation. Other possible uses for modified immunogenic peptides could be visualizing the dynamics of neoantigen vaccines or peptide delivery methods in vivo. For these additional uses, we recommend further optimization based on the needs of the prospective assay.
Reviewer #2 (Public Review):
Summary:
The authors here develop a novel Ovalbumin model peptide that can be labeled with a site-specific FlAsH dye to track agonist peptides both in vitro and in vivo. The utility of this tool could allow better tracking of activated polyclonal T cells particularly in novel systems. The authors have provided solid evidence that peptides are functional, capable of activating OTII T cells, and that these peptides can undergo trogocytosis by cognate T cells only.
Strengths:
-An array of in vitro and in vivo studies are used to assess peptide functionality.
-Nice use of cutting-edge intravital imaging.
-Internal controls such as non-cogate T cells to improve the robustness of the results (such as Fig 5A-D).
-One of the strengths is the direct labeling of the peptide and the potential utility in other systems.
Weaknesses:
- What is the background signal from FlAsH? The baselines for Figure 1 flow plots are all quite different. Hard to follow. What does the background signal look like without FLASH (how much fluorescence shift is unlabeled cells to No antigen+FLASH?). How much of the FlAsH in cells is actually conjugated to the peptide? In Figure 2E, it doesn't look like it's very specific to pMHC complexes. Maybe you could double-stain with Ab for MHCII. Figure 4e suggests there is no background without MHCII but I'm not fully convinced. Potentially some MassSpec for FLASH-containing peptides.
We thank the reviewer for pointing out a possible area of confusion. In fact, we have done extensive characterization of the background and found that it has varied with the batch of FlAsH, TCEP, cytometer and also due to the oxidation prone nature of the reagents. Because Figure 1 subfigures have been derived from different experiments, a combination of the factors above have likely contributed to the inconsistent background. To display the background more objectively, we have now added the No antigen+Flash background to the revised Fig 1.
It is also worthwhile noting that nonspecific Flash incorporation can be toxic at increasing doses, and live cells that display high backgrounds may undergo early apoptotic changes in vitro. However, when these cells are adoptively transferred and tracked in vivo, the compromised cells with high background possibly undergo apoptosis and get cleared by macrophages in the lymph node. The lack of clearance in vitro further contributes to different backgrounds between in vitro and in vivo, which we think is also a possible cause for the inconsistent backgrounds throughout the manuscript. Altogether, comparison of absolute signal intensities from different experiments would be misleading and the relative differences within each experiment should be relied upon. We have added further discussion about this issue.
- On the flip side, how much of the variant peptides are getting conjugated in cells? I'd like to see some quantification (HPLC or MassSpec). If it's ~10% of peptides that get labeled, this could explain the low shifts in fluorescence and the similar T cell activation to native peptides if FlasH has any deleterious effects on TCR recognition. But if it's a high rate of labeling, then it adds confidence to this system.
We agree that mass spectrometry or, more specifically tandem MS/MS, would be an excellent addition to support our claim about peptide labeling by FlAsH being reliable and non-disruptive. Therefore, we have recently undertaken a tandem MS/MS quantitation project with our collaborators. However, this would require significant time to determine the internal standard based calibration curves and to run both analytical and biological replicates. Hence, we have decided pursuing this as a follow up study and added further discussion on quantification of the FlAsH-peptide conjugates by tandem MS/MS.
- Conceptually, what is the value of labeling peptides after loading with DCs? Why not preconjugate peptides with dye, before loading, so you have a cleaner, potentially higher fluorescence signal? If there is a potential utility, I do not see it being well exploited in this paper. There are some hints in the discussion of additional use cases, but it was not clear exactly how they would work. One mention was that the dye could be added in real-time in vivo to label complexes, but I believe this was not done here. Is that feasible to show?
We have already addressed preconjugation as a possible avenue for labeling peptides. In our hands, preconjugation resulted in low FlAsH intensity overall in both the control and tetracysteine labeled peptides (Author response image 1). While we don’t have a satisfactory answer as to why the signal was blunted due to preconjugation, it could be that the tetracysteine tagged peptides attract biarsenical compounds better intracellularly. It may be due to the redox potential of the intracellular environment that limits disulfide bond formation. (PMID: 18159092)
Author response image 1.
Preconjugation yields poor FlAsH signal. Splenic DCs were pulsed with peptide then treated with FlAsH or incubated with peptide-FlAsH preconjugates. Overlaid histograms show the FlAsH intensities on DCs following the two-step labeling (left) and preconjugation (right). Data are representative of two independent experiments, each performed with three biological replicates.
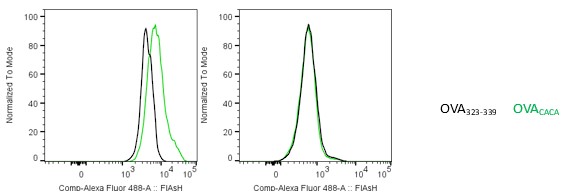
- Figure 5D-F the imaging data isn't fully convincing. For example, in 5F and 2G, the speeds for T cells with no Ag should be much higher (10-15micron/min or 0.16-0.25micron/sec). The fact that yours are much lower speeds suggests technical or biological issues, that might need to be acknowledged or use other readouts like the flow cytometry.
We thank the reviewer for drawing attention to this technical point. We would like to point out that the imaging data in fig 5 d-f was obtained from agarose embedded live lymph node sections. Briefly, the lymph nodes were removed, suspended in 2% low melting temp agarose in DMEM and cut into 200 µm sections with a vibrating microtome. Prior to imaging, tissue sections were incubated in complete RPMI medium at 37 °C for 2 h to resume cell mobility. Thus, we think the cells resuming their typical speeds ex vivo may account for slightly reduced T cell speeds overall, for both control and antigen-specific T cells (PMID: 32427565, PMID: 25083865). We have added text to prevent the ambiguity about the technique for dynamic imaging. The speeds in Figure 2g come from live imaging of DC-T cell cocultures, in which the basal cell movement could be hampered by the cell density. Additionally, glass bottom dishes have been coated with Fibronectin to facilitate DC adhesion, which may be responsible for the lower average speeds of the T cells in vitro.
Reviewer #1 (Recommendations For The Authors):
Does the reaction of ReAsH with reactive sites on the surface of DC alter them functionally? Functions have been attributed to redox chemistry at the cell surface- could this alter this chemistry?
We thank the reviewer for the insight. It is possible that the nonspecific binding of biarsenical compounds to cysteine residues, which we refer to as background throughout the manuscript, contribute to some alterations. One possible way biarsenicals affect the redox events in DCs can be via reducing glutathione levels (PMID: 32802886). Glutathione depletion is known to impair DC maturation and antigen presentation (PMID: 20733204). To avoid toxicity, we have carried out a stringent titration to optimize ReAsH and FlAsH concentrations for labeling and conducted experiments using doses that did not cause overt toxicity or altered DC function.
Have the authors compared this to a straightforward approach where the peptide is just labelled with a similar dye and incubated with the cell to load pMHC using the MHC knockout to assess specificity? Why is this that involves exposing the DC to a high concentration of TCEP, better than just labelling the peptide? The Davis lab also arrived at a two-step method with biotinylated peptide and streptavidin-PE, but I still wonder if this was really necessary as the sensitivity will always come down to the ability to wash out the reagents that are not associated with the MHC.
We agree with the reviewer that small undisruptive fluorochrome labeled peptide alternatives would greatly improve the workflow and signal to noise ratio. In fact, we have been actively searching for such alternatives since we have started working on the tetracysteine containing peptides. So far, we have tried commercially available FITC and TAMRA conjugated OVA323-339 for loading the DCs, however failed to elicit any discernible signal. We also have an ongoing study where we have been producing and testing various in-house modified OVA323-339 that contain fluorogenic properties. Unfortunately, at this moment, the ones that provided us with a crisp, bright signal for loading revealed that they have also incorporated to DC membrane in a nonspecific fashion and have been taken up by non-cognate T cells from double antigen-loaded DCs. We are actively pursuing this area of investigation and developing better optimized peptides with low/non-significant membrane incorporation.
Lastly, we would like to point out that tetracysteine tags are visible by transmission electron microscopy without FlAsH treatment. Thus, this application could add a new dimension for addressing questions about the antigen/pMHCII loading compartments in future studies. We have now added more in-depth discussion about the setbacks and advantages of using tetracysteine labeled peptides in immune system studies.
The peptide dosing at 5 µM is high compared to the likely sensitivity of the T cells. It would be helpful to titrate the system down to the EC50 for the peptide, which may be nM, and determine if the specific fluorescence signal can still be detected in the optimal conditions. This will not likely be useful in vivo, but it will be helpful to see if the labelling procedure would impact T cell responses when antigen is limited, which will be more of a test. At 5 µM it's likely the system is at a plateau and even a 10-fold reduction in potency might not impact the T cell response, but it would shift the EC50.
We thank the reviewer for the comment and suggestion. We agree that it is possible to miss minimally disruptive effects at 5 µM and titrating the native peptide vs. modified peptide down to the nM doses would provide us a clearer view. This can certainly be addressed in future studies and also with other peptides with different affinity profiles. A reason why we have chosen a relatively high dose for this study was that lowering the peptide dose had costed us the specific FlAsH signal, thus we have proceeded with the lowest possible peptide concentration.
In Fig 3b the level of background in the dsRed channel is very high after DC transfer. What cells is this associated with and does this appear be to debris? Also, I wonder where the ReAsH signal is in the experiments in general. I believe this is a red dye and it would likely be quite bright given the reduction of the FlAsH signal. Will this signal overlap with signals like dsRed and PHK-26 if the DC is also treated with this to reduce the FlAsH background?
We have already shown that ReAsH signal with DsRed can be used for cell-tracking purposes as they don’t get transferred to other cells during antigen specific interactions (Author response image 2). In fact, combining their exceptionally bright fluorescence provided us a robust signal to track the adoptively transferred DCs in the recipient mice. On the other hand, the lipophilic membrane dye PKH-26 gets transferred by trogocytosis while the remaining signal contributes to the red fluorescence for tracking DCs. Therefore, the signal that we show to be transferred from DCs to T cells only come from the lipophilic dye. To address this, we have added a sentence to elaborate on this in the results section. Regarding the reviewer’s comment on DsRed background in Figure 3b., we agree that the cells outside the gate in recipient mice seems slightly higher that of the control mice. It may suggest that the macrophages clearing up debris from apoptotic/dying DCs might contribute to the background elicited from the recipient lymph node. Nevertheless, it does not contribute to any DsRed/ReAsH signal in the antigen-specific T cells.
Author response image 2.
ReAsH and DsRed are not picked up by T cells during immune synapse. DsRed+ DCs were labeled with ReAsH, pulsed with 5 μM OVACACA, labeled with FlAsH and adoptively transferred into CD45.1 congenic mice mice (1-2 × 10⁶ cells) via footpad. Naïve e450-labeled OTII and e670-labeled polyclonal CD4+ T cells were mixed 1:1 (0.25-0.5 × 10⁶/ T cell type) and injected i.v. Popliteal lymph nodes were removed at 42 h post-transfer and analyzed by flow cytometry. Overlaid histograms show the ReAsh/DsRed, MHCII and FlAsH intensities of the T cells. Data are representative of two independent experiments with n=2 mice per group.
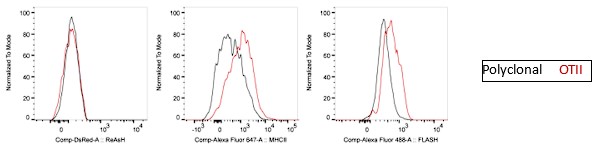
In Fig 5b there is a missing condition. If they look at Ea-specific T cells for DC with without the Ova peptide do they see no transfer of PKH-26 to the OTII T cells? Also, the FMI of the FlAsH signal transferred to the T cells seems very high compared to other experiments. Can the author estimate the number of peptides transferred (this should be possible) and would each T cell need to be collecting antigens from multiple DC? Could the debris from dead DC also contribute to this if picked up by other DC or even directly by the T cells? Maybe this could be tested by transferring DC that are killed (perhaps by sonication) prior to inoculation?
To address the reviewer’s question on the PKH-26 acquisition by T cells, Ea-T cells pick up PKH-26 from Ea+OVA double pulsed DCs, but not from the unpulsed or single OVA pulsed DCs. OTII T cells acquire PKH-26 from OVA-pulsed DCs, whereas Ea T cells don’t (as expected) and serve as an internal negative control for that condition. Regarding the reviewer’s comment on the high FlAsH signal intensity of T cells in Figure 5b, a plausible explanation can be that the T cells accumulate pMHCII through serial engagements with APCs. In fact, a comparison of the T cell FlAsH intensities 18 h and 36-48 h post-transfer demonstrate an increase (Author response image 3) and thus hints at a cumulative signal. As DCs are known to be short-lived after adoptive transfer, the debris of dying DCs along with its peptide content may indeed be passed onto macrophages, neighboring DCs and eventually back to T cells again (or for the first time, depending on the T:DC ratio that may not allow all T cells to contact with the transferred DCs within the limited time frame). We agree that the number and the quality of such contacts can be gauged using fluorescent peptides. However, we think peptides chemically conjugated to fluorochromes with optimized signal to noise profiles and with less oxidation prone nature would be more suitable for quantification purposes.
Author response image 3.
FlAsH signal acquisition by antigen specific T cells becomes more prominent at 36-48 h post-transfer. DsRed+ splenic DCs were double-pulsed with 5 μM OVACACA and 5 μM OVA-biotin and adoptively transferred into CD45.1 recipients (2 × 10⁶ cells) via footpad. Naïve e450-labeled OTII (1 × 10⁶ cells) and e670-labeled polyclonal T cells (1 × 10⁶ cells) were injected i.v. Popliteal lymph nodes were analyzed by flow cytometry at 18 h or 48 h post-transfer. Overlaid histograms show the T cell levels of OVACACA (FlAsH). Data are representative of three independent experiments with n=3 mice per time point
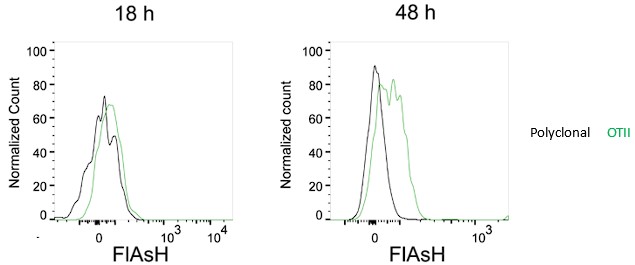
Reviewer #2 (Recommendations For The Authors):
As mentioned in weaknesses 1 & 2, more validation of how much of the FlAsH fluorescence is on agonist peptides and how much is non-specific would improve the interpretation of the data. Another option would be to preconjugate peptides but that might be a significant effort to repeat the work.
We agree that mass spectrometry would be the gold standard technique to measure the percentage of tetracysteine tagged peptide is conjugated to FlAsH in DCs. However, due to the scope of such endevour this can only be addressed as a separate follow up study. As for the preconjugation, we have tried and unfortunately failed to get it to work (Reviewer Figure 1). Therefore, we have shifted our focus to generating in-house peptide probes that are chemically conjugated to stable and bright fluorophore derivates. With that, we aim to circumvent the problems that the two-step FlAsH labeling poses.
Along those lines, do you have any way to quantify how many peptides you are detecting based on fluorescence? Being able to quantify the actual number of peptides would push the significance up.
We think two step procedure and background would pose challenges to such quantification in this study. although it would provide tremendous insight on the antigen-specific T cell- APC interactions in vivo, we think it should be performed using peptides chemically conjugated to fluorochromes with optimized signal to noise profiles.
In Figure 3D or 4 does the SA signal correlate with Flash signal on OT2 cells? Can you correlate Flash uptake with T cell activation, downstream of TCR, to validate peptide transfers?
To answer the reviewer’s question about FlAsH and SA correlation, we have revised the Figure 3d to show the correlation between OTII uptake of FlAsH, Streptavidin and MHCII. We also thank the reviewer for the suggestion on correlating FlAsH uptake with T cell activation and/or downstream of TCR activation. We have used proliferation and CD44 expressions as proxies of activation (Fig 2, 6). Nevertheless, we agree that the early events that correspond to the initiation of T-DC synapse and FlAsH uptake would be valuable to demonstrate the temporal relationship between peptide transfer and activation. Therefore, we have addressed this in the revised discussion.
Author response image 4.
FlAsH signal acquisition by antigen specific T cells is correlates with the OVA-biotin (SA) and MHCII uptake. DsRed+ splenic DCs were double-pulsed with 5 μM OVACACA and 5 μM OVA-biotin and adoptively transferred into CD45.1 recipients (2 × 10⁶ cells) via footpad. Naïve e450-labeled OTII (1 × 10⁶ cells) and e670-labeled polyclonal T cells (1 × 10⁶ cells) were injected i.v. Popliteal lymph nodes were analyzed by flow cytometry. Overlaid histograms show the T cell levels of OVACACA (FlAsH) at 48 h post-transfer. Data are representative of three independent experiments with n=3 mice.
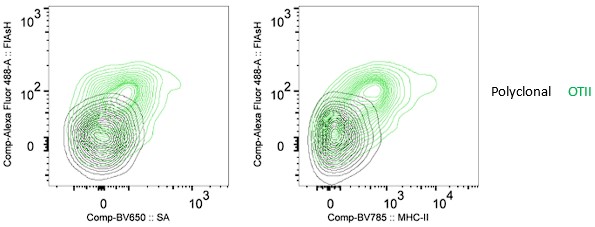
Minor:
Figure 3F, 5D, and videos: Can you color-code polyclonal T cells a different color than magenta (possibly white or yellow), as they have the same look as the overlay regions of OT2-DC interactions (Blue+red = magenta).
We apologize for the inconvenience about the color selection. We have had difficulty in assigning colors that are bright and distinct. Unfortunately, yellow and white have also been easily mixed up with the FlAsH signal inside red and blue cells respectively. We have now added yellow and white arrows to better point out the polyclonal vs. antigen specific cells in 3f and 5d.
Author response:
The following is the authors’ response to the original reviews.
Reviewer #1 (Public Review):
Summary:
The authors used structural and biophysical methods to provide insight into Parkin regulation. The breadth of data supporting their findings was impressive and generally well-orchestrated. Still, the impact of their results builds on recent structural studies and the stated impact is based on these prior works.
Strengths:
(1) After reading through the paper, the major findings are:
- RING2 and pUbl compete for binding to RING0.
- Parkin can dimerize.
- ACT plays an important role in enzyme kinetics.
(2) The use of molecular scissors in their construct represents a creative approach to examining inter-domain interactions.
(3) From my assessment, the experiments are well-conceived and executed.
We thank the reviewer for their positive remark and extremely helpful suggestions.
Weaknesses:
The manuscript, as written, is NOT for a general audience. Admittedly, I am not an expert on Parkin structure and function, but I had to do a lot of homework to try to understand the underlying rationale and impact. This reflects, I think, that the work generally represents an incremental advance on recent structural findings.
To this point, it is hard to understand the impact of this work without more information highlighting the novelty. There are several structures of Parkin in various auto-inhibited states, and it was hard to delineate how this is different.
For the sake of the general audience, we have included all the details of Parkin structures and conformations seen (Extended Fig. 1). The structures in the present study are to validate the biophysical/biochemical experiments, highlighting key findings. For example, we solved the phospho-Parkin (complex with pUb) structure after treatment with 3C protease (Fig. 2C), which washes off the pUbl-linker, as shown in Fig 2B. The structure of the pUbl-linker depleted phospho-Parkin-pUb complex showed that RING2 returned to the closed state (Fig. 2C), which is confirmation of the SEC assay in Fig. 2B. Similarly, the structure of the pUbl-linker depleted phospho-Parkin R163D/K211N-pUb complex (Fig. 3C), was done to validate the SEC data showing displacement of pUbl-linker is independent of pUbl interaction with the basic patch on RING0 (Fig. 3B). In addition, the latter structure also revealed a new donor ubiquitin binding pocket in the linker (connecting REP and RING2) region of Parkin (Fig. 9). Similarly, trans-complex structure of phospho-Parkin (Fig. 4D) was done to validate the biophysical data (Fig. 4A-C, Fig. 5A-D) showing trans-complex between phospho-Parkin and native Parkin. The latter also confirmed that the trans-complex was mediated by interactions between pUbl and the basic patch on RING0 (Fig. 4D). Furthermore, we noticed that the ACT region was disordered in the trans-complex between phospho-Parkin (1-140 + 141-382 + pUb) (Fig. 8A) which had ACT from the trans molecule, indicating ACT might be present in the cis molecule. The latter was validated from the structure of trans-complex between phospho-Parkin with cis ACT (1-76 + 77-382 + pUb) (Fig. 8C), showing the ordered ACT region. The structural finding was further validated by biochemical assays (Fig. 8 D-F, Extended Data Fig. 9C-E).
The structure of TEV-treated R0RBR (TEV) (Extended Data Fig. 4C) was done to ensure that the inclusion of TEV and treatment with TEV protease did not perturb Parkin folding, an important control for our biophysical experiments.
As noted, I appreciated the use of protease sites in the fusion protein construct. It is unclear how the loop region might affect the protein structure and function. The authors worked to demonstrate that this did not introduce artifacts, but the biological context is missing.
We thank the reviewer for appreciating the use of protease sites in the fusion protein construct. Protease sites were used to overcome the competing mode of binding that makes interactions very transient and beyond the detection limit of methods such as ITC or SEC. While these interactions are quite transient in nature, they could still be useful for the activation of various Parkin isoforms that lack either the Ubl domain or RING2 domain (Extended Data Fig. 6, Fig. 10). Also, our Parkin localization assays also suggest an important role of these interactions in the recruitment of Parkin molecules to the damaged mitochondria (Fig. 6).
While it is likely that the binding is competitive between the Ubl and RING2 domains, the data is not quantitative. Is it known whether the folding of the distinct domains is independent? Or are there interactions that alter folding? It seems plausible that conformational rearrangements may invoke an orientation of domains that would be incompatible. The biological context for the importance of this interaction was not clear to me.
This is a great point. In the revised manuscript, we have included quantitative data between phospho-Parkin and untethered ∆Ubl-Parkin (TEV) (Fig. 5B) showing similar interactions using phospho-Parkin K211N and untethered ∆Ubl-Parkin (TEV) (Fig. 4B). Folding of Ubl domain or various combinations of RING domains lacking Ubl seems okay. Also, folding of the RING2 domain on its own appears to be fine. However, human Parkin lacking the RING2 domain seems to have some folding issues, majorly due to exposure of hydrophobic pocket on RING0, also suggested by previous efforts (Gladkova et al.ref. 24, Sauve et al. ref. 29). The latter could be overcome by co-expression of RING2 lacking Parkin construct with PINK1 (Sauve et al. ref. 29) as phospho-Ubl binds on the same hydrophobic pocket on RING0 where RING2 binds. A drastic reduction in the melting temperature of phospho-Parkin (Gladkova et al.ref. 24), very likely due to exposure of hydrophobic surface between RING0 and RING2, correlates with the folding issues of RING0 exposed human Parkin constructs.
From the biological context, the competing nature between phospho-Ubl and RING2 domains could block the non-specific interaction of phosphorylated-ubiquitin-like proteins (phospho-Ub or phospho-NEDD8) with RING0 (Lenka et al. ref. 33), during Parkin activation.
(5) What is the rationale for mutating Lys211 to Asn? Were other mutations tried? Glu? Ala? Just missing the rationale. I think this may have been identified previously in the field, but not clear what this mutation represents biologically.
Lys211Asn is a Parkinson’s disease mutation; therefore, we decided to use the same mutation for biophysical studies.
I was confused about how the phospho-proteins were generated. After looking through the methods, there appear to be phosphorylation experiments, but it is unclear what the efficiency was for each protein (i.e. what % gets modified). In the text, the authors refer to phospho-Parkin (T270R, C431A), but not clear how these mutations might influence this process. I gather that these are catalytically inactive, but it is unclear to me how this is catalyzing the ubiquitination in the assay.
This is an excellent question. Because different phosphorylation statuses would affect the analysis, we ensured complete phosphorylation status using Phos-Tag SDS-PAGE, as shown below.
Author response image 1.
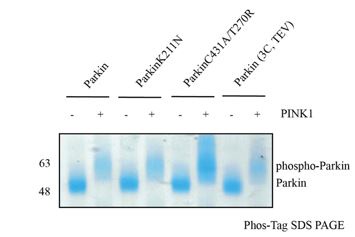
Our biophysical experiments in Fig. 5C show that trans complex formation is mediated by interactions between the basic patch (comprising K161, R163, K211) on RING0 and phospho-Ubl domain in trans. These interactions result in the displacement of RING2 (Fig. 5C). Parkin activation is mediated by displacement of RING2 and exposure of catalytic C431 on RING2. While phospho-Parkin T270R/C431A is catalytically dead, the phospho-Ubl domain of phospho-Parkin T270R/C431would bind to the basic patch on RING0 of WT-Parkin resulting in activation of WT-Parkin as shown in Fig. 5E. A schematic figure is shown below to explain the same.
Author response image 2.
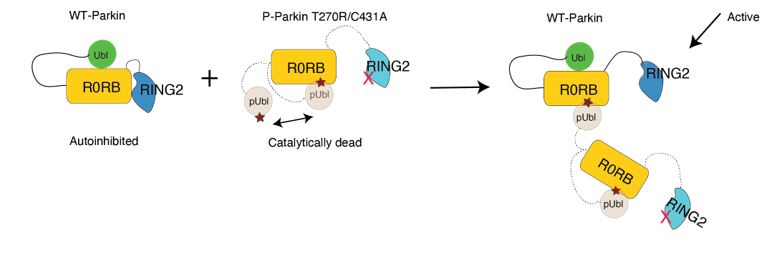
(7) The authors note that "ACT can be complemented in trans; however, it is more efficient in cis", but it is unclear whether both would be important or if the favored interaction is dominant in a biological context.
First, this is an excellent question about the biological context of ACT and needs further exploration. While due to the flexible nature of ACT, it can be complemented both in cis and trans, we can only speculate cis interactions between ACT and RING0 could be more relevant from the biological context as during protein synthesis and folding, ACT would be translated before RING2, and thus ACT would occupy the small hydrophobic patch on RING0 in cis. Unpublished data shows the replacement of the ACT region by Biogen compounds to activate Parkin (https://doi.org/10.21203/rs.3.rs-4119143/v1). The latter finding further suggests the flexibility in this region.
(8) The authors repeatedly note that this study could aid in the development of small-molecule regulators against Parkin to treat PD, but this is a long way off. And it is not clear from their manuscript how this would be achieved. As stated, this is conjecture.
As suggested by this reviewer, we have removed this point in the revised manuscript.
Reviewer #2 (Public Review):
This manuscript uses biochemistry and X-ray crystallography to further probe the molecular mechanism of Parkin regulation and activation. Using a construct that incorporates cleavage sites between different Parkin domains to increase the local concentration of specific domains (i.e., molecular scissors), the authors suggest that competitive binding between the p-Ubl and RING2 domains for the RING0 domain regulates Parkin activity. Further, they demonstrate that this competition can occur in trans, with a p-Ubl domain of one Parkin molecule binding the RING0 domain of a second monomer, thus activating the catalytic RING1 domain. In addition, they suggest that the ACT domain can similarly bind and activate Parkin in trans, albeit at a lower efficiency than that observed for p-Ubl. The authors also suggest from crystal structure analysis and some biochemical experiments that the linker region between RING2 and repressor elements interacts with the donor ubiquitin to enhance Parkin activity.<br /> Ultimately this manuscript challenges previous work suggesting that the p-Ubl domain does not bind to the Parkin core in the mechanism of Parkin activation. The use of the 'molecular scissors' approach to probe these effects is an interesting approach to probe this type of competitive binding. However, there are issues with the experimental approach manuscript that detract from the overall quality and potential impact of the work.
We thank the reviewer for their positive remark and constructive suggestions.
The competitive binding between p-Ubl and RING2 domains for the Parkin core could have been better defined using biophysical and biochemical approaches that explicitly define the relative affinities that dictate these interactions. A better understanding of these affinities could provide more insight into the relative bindings of these domains, especially as it relates to the in trans interactions.
This is an excellent point regarding the relative affinities of pUbl and RING2 for the Parkin core (lacking Ubl and RING2). While we could purify p-Ubl, we failed to purify human Parkin (lacking RING2 and phospho-Ubl). The latter folding issues were likely due to the exposure of a highly hydrophobic surface on RING0 (as shown below) in the absence of pUbl and RING2 in the R0RB construct. Also, RING2 with an exposed hydrophobic surface would be prone to folding issues, which is not suitable for affinity measurements. A drastic reduction in the melting temperature of phospho-Parkin (Gladkova et al.ref. 24) also highlights the importance of a hydrophobic surface between RING0 and RING2 on Parkin folding/stability. A separate study would be required to try these Parkin constructs from different species and ensure proper folding before using them for affinity measurements.
Author response image 3.
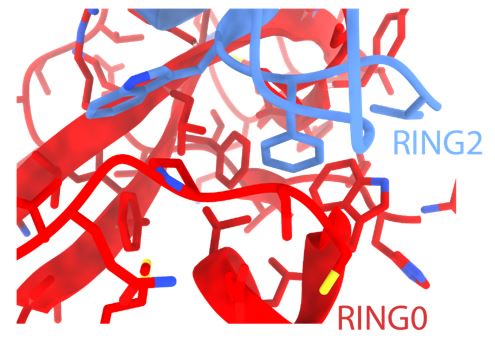
I also have concerns about the results of using molecular scissors to 'increase local concentrations' and allow for binding to be observed. These experiments are done primarily using proteolytic cleavage of different domains followed by size exclusion chromatography. ITC experiments suggest that the binding constants for these interactions are in the µM range, although these experiments are problematic as the authors indicate in the text that protein precipitation was observed during these experiments. This type of binding could easily be measured in other assays. My issue relates to the ability of a protein complex (comprising the core and cleaved domains) with a Kd of 1 µM to be maintained in an SEC experiment. The off-rates for these complexes must be exceeding slow, which doesn't really correspond to the low µM binding constants discussed in the text. How do the authors explain this? What is driving the Koff to levels sufficiently slow to prevent dissociation by SEC? Considering that the authors are challenging previous work describing the lack of binding between the p-Ubl domain and the core, these issues should be better resolved in this current manuscript. Further, it's important to have a more detailed understanding of relative affinities when considering the functional implications of this competition in the context of full-length Parkin. Similar comments could be made about the ACT experiments described in the text.
This is a great point. In the revised manuscript, we repeated ITC measurements in a different buffer system, which gave nice ITC data. In the revised manuscript, we have also performed ITC measurements using native phospho-Parkin. Phospho-Parkin and untethered ∆Ubl-Parkin (TEV) (Fig. 5B) show similar affinities as seen between phospho-Parkin K211N and untethered ∆Ubl-Parkin (TEV) (Fig. 4B). However, Kd values were consistent in the range of 1.0 ± 0.4 µM which could not address the reviewer’s point regarding slow off-rate. The crystal structure of the trans-complex of phospho-Parkin shows several hydrophobic and ionic interactions between p-Ubl and Parkin core, suggesting a strong interaction and, thus, justifying the co-elution on SEC. Additionally, ITC measurements between E2-Ub and P-Parkin-pUb show similar affinity (Kd = 0.9 ± 0.2 µM) (Kumar et al., 2015, EMBO J.), and yet they co-elute on SEC (Kumar et al., 2015, EMBO J.).
Ultimately, this work does suggest additional insights into the mechanism of Parkin activation that could contribute to the field. There is a lot of information included in this manuscript, giving it breadth, albeit at the cost of depth for the study of specific interactions. Further, I felt that the authors oversold some of their data in the text, and I'd recommend being a bit more careful when claiming an experiment 'confirms' a specific model. In many cases, there are other models that could explain similar results. For example, in Figure 1C, the authors state that their crystal structure 'confirms' that "RING2 is transiently displaced from the RING0 domain and returns to its original position after washing off the p-Ubl linker". However, it isn't clear to me that RING2 ever dissociated when prepared this way. While there are issues with the work that I feel should be further addressed with additional experiments, there are interesting mechanistic details suggested by this work that could improve our understanding of Parkin activation. However, the full impact of this work won't be fully appreciated until there is a more thorough understanding of the regulation and competitive binding between p-Ubl and RIGN2 to RORB both in cis and in trans.
We thank the reviewer for their positive comment. In the revised manuscript, we have included the reviewer’s suggestion. The conformational changes in phospho-Parkin were established from the SEC assay (Fig. 2A and Fig. 2B), which show displacement/association of phospho-Ubl or RING2 after treatment of phospho-Parkin with 3C and TEV, respectively. For crystallization, we first phosphorylated Parkin, where RING2 is displaced due to phospho-Ubl (as shown in SEC), followed by treatment with 3C protease, which led to pUbl wash-off. The Parkin core separated from phospho-Ubl on SEC was used for crystallization and structure determination in Fig. 2C, where RING2 returned to the RING0 pocket, which confirms SEC data (Fig. 2B).
Reviewer #3 (Public Review):
Summary:
In their manuscript "Additional feedforward mechanism of Parkin activation via binding of phospho-UBL and RING0 in trans", Lenka et al present data that could suggest an "in trans" model of Parkin ubiquitination activity. Parkin is an intensely studied E3 ligase implicated in mitophagy, whereby missense mutations to the PARK2 gene are known to cause autosomal recessive juvenile parkinsonism. From a mechanistic point of view, Parkin is extremely complex. Its activity is tightly controlled by several modes of auto-inhibition that must be released by queues of mitochondrial damage. While the general overview of Parkin activation has been mapped out in recent years, several details have remained murky. In particular, whether Parkin dimerizes as part of its feed-forward signaling mechanism, and whether said dimerization can facilitate ligase activation, has remained unclear. Here, Lenka et al. use various truncation mutants of Parkin in an attempt to understand the likelihood of dimerization (in support of an "in trans" model for catalysis).
Strengths:
The results are bolstered by several distinct approaches including analytical SEC with cleavable Parkin constructs, ITC interaction studies, ubiquitination assays, protein crystallography, and cellular localization studies.
We thank the reviewer for their positive remark.
Weaknesses:
As presented, however, the storyline is very confusing to follow and several lines of experimentation felt like distractions from the primary message. Furthermore, many experiments could only indirectly support the author's conclusions, and therefore the final picture of what new features can be firmly added to the model of Parkin activation and function is unclear.
We thank the reviewer for their constructive criticism, which has helped us to improve the quality of this manuscript.
Major concerns:
(1) This manuscript solves numerous crystal structures of various Parkin components to help support their idea of in trans transfer. The way these structures are presented more resemble models and it is unclear from the figures that these are new complexes solved in this work, and what new insights can be gleaned from them.
The structures in the present study are to validate the biophysical/biochemical experiments highlighting key findings. For example, we solved the phospho-Parkin (complex with pUb) structure after treatment with 3C protease (Fig. 2C), which washes off the pUbl-linker, as shown in Fig. 2B. The structure of pUbl-linker depleted phospho-Parkin-pUb complex showed that RING2 returned to the closed state (Fig. 2C), which is confirmation of the SEC assay in Fig. 2B. Similarly, the structure of the pUbl-linker depleted phospho-Parkin R163D/K211N-pUb complex (Fig. 3C), was done to validate the SEC data showing displacement of pUbl-linker is independent of pUbl interaction with the basic patch on RING0 (Fig. 3B). In addition, the latter structure also revealed a new donor ubiquitin binding pocket in the linker (connecting REP and RING2) region of Parkin (Fig. 9). Similarly, trans-complex structure of phospho-Parkin (Fig. 4D) was done to validate the biophysical data (Fig. 4A-C, Fig. 5A-D) showing trans-complex between phospho-Parkin and native Parkin. The latter also confirmed that the trans-complex was mediated by interactions between pUbl and the basic patch on RING0 (Fig. 4D). Furthermore, we noticed that the ACT region was disordered in the trans-complex between phospho-Parkin (1-140 + 141-382 + pUb) (Fig. 8A) which had ACT from the trans molecule, indicating ACT might be present in the cis molecule. The latter was validated from the structure of trans-complex between phospho-Parkin with cis ACT (1-76 + 77-382 + pUb) (Fig. 8C), showing the ordered ACT region. The structural finding was further validated by biochemical assays (Fig. 8 D-F, Extended Data Fig. 9C-E).
The structure of TEV-treated R0RBR (TEV) (Extended Data Fig. 4C) was done to ensure that the inclusion of TEV and treatment with TEV protease did not perturb Parkin folding, an important control for our biophysical experiments.
(2) There are no experiments that definitively show the in trans activation of Parkin. The binding experiments and size exclusion chromatography are a good start, but the way these experiments are performed, they'd be better suited as support for a stronger experiment showing Parkin dimerization. In addition, the rationale for an in trans activation model is not convincingly explained until the concept of Parkin isoforms is introduced in the Discussion. The authors should consider expanding this concept into other parts of the manuscript.
We thank the reviewer for appreciating the Parkin dimerization. Our biophysical data in Fig. 5C shows that Parkin dimerization is mediated by interactions between phospho-Ubl and RING0 in trans, leading to the displacement of RING2. However, Parkin K211N (on RING0) mutation perturbs interaction with phospho-Parkin and leads to loss of Parkin dimerization and loss of RING2 displacement (Fig. 5C). The interaction between pUbl and K211 pocket on RING0 leads to the displacement of RING2 resulting in Parkin activation as catalytic residue C431 on RING2 is exposed for catalysis. The biophysical experiment is further confirmed by a biochemical experiment where the addition of catalytically in-active phospho-Parkin T270R/C431A activates autoinhibited WT-Parkin in trans using the mechanism as discussed (a schematic representation also shown in Author response image 2).
We thank this reviewer regarding Parkin isoforms. In the revised manuscript, we have included Parkin isoforms in the results section, too.
(2a) For the in trans activation experiment using wt Parkin and pParkin (T270R/C431A) (Figure 3D), there needs to be a large excess of pParkin to stimulate the catalytic activity of wt Parkin. This experiment has low cellular relevance as these point mutations are unlikely to occur together to create this nonfunctional pParkin protein. In the case of pParkin activating wt Parkin (regardless of artificial point mutations inserted to study specifically the in trans activation), if there needs to be much more pParkin around to fully activate wt Parkin, isn't it just more likely that the pParkin would activate in cis?
To test phospho-Parkin as an activator of Parkin in trans, we wanted to use the catalytically inactive version of phospho-Parkin to avoid the background activity of p-Parkin. While it is true that a large excess of pParkin (T270R/C431A) is required to activate WT-Parkin in the in vitro set-up, it is not very surprising as in WT-Parkin, the unphosphorylated Ubl domain would block the E2 binding site on RING1. Also, due to interactions between pParkin (T270R/C431A) molecules, the net concentration of pParkin (T270R/C431A) as an activator would be much lower. However, the Ubl blocking E2 binding site on RING1 won’t be an issue between phospho-Parkin molecules or between Parkin isoforms (lacking Ubl domain or RING2).
(2ai) Another underlying issue with this experiment is that the authors do not consider the possibility that the increased activity observed is a result of increased "substrate" for auto-ubiquitination, as opposed to any role in catalytic activation. Have the authors considered looking at Miro as a substrate in order to control for this?
This is quite an interesting point. However, this will be only possible if Parkin is ubiquitinated in trans, as auto-ubiquitination is possible with active Parkin and not with catalytically dead (phospho-Parkin T270R, C431A) or autoinhibited (WT-Parkin). Also, in the previous version of the manuscript, where we used only phospho-Ubl as an activator of Parkin in trans, we tested Miro1 ubiquitination and auto-ubiquitination, and the results were the same (Author response image 4).
Author response image 4.
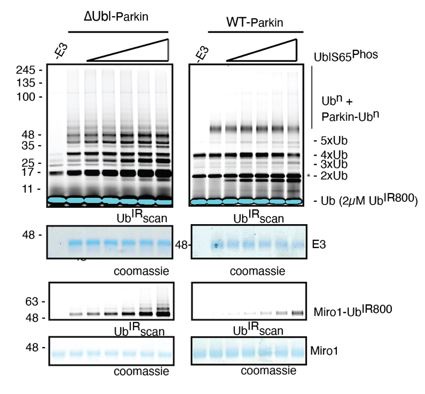
(2b) The authors mention a "higher net concentration" of the "fused domains" with RING0, and use this to justify artificially cleaving the Ubl or RING2 domains from the Parkin core. This fact should be moot. In cells, it is expected there will only be a 1:1 ratio of the Parkin core with the Ubl or RING2 domains. To date, there is no evidence suggesting multiple pUbls or multiple RING2s can bind the RING0 binding site. In fact, the authors here even show that either the RING2 or pUbl needs to be displaced to permit the binding of the other domain. That being said, there would be no "higher net concentration" because there would always be the same molar equivalents of Ubl, RING2, and the Parkin core.
We apologize for the confusion. “Higher net concentration” is with respect to fused domains versus the domain provided in trans. Due to the competing nature of the interactions between pUbl/RING2 and RING0, the interactions are too transient and beyond the detection limit of the biophysical techniques. While the domains are fused (for example, RING0-RING2 in the same polypeptide) in a polypeptide, their effective concentrations are much higher than those (for example, pUbl) provided in trans; thus, biophysical methods fail to detect the interaction. Treatment with protease solves the above issue due to the higher net concentration of the fused domain, and trans interactions can be measured using biophysical techniques. However, the nature of these interactions and conformational changes is very transient, which is also suggested by the data. Therefore, Parkin molecules will never remain associated; rather, Parkin will transiently interact and activate Parkin molecules in trans.
(2c) A larger issue remaining in terms of Parkin activation is the lack of clarity surrounding the role of the linker (77-140); particularly whether its primary role is to tether the Ubl to the cis Parkin molecule versus a role in permitting distal interactions to a trans molecule. The way the authors have conducted the experiments presented in Figure 2 limits the possible interactions that the activated pUbl could have by (a) ablating the binding site in the cis molecule with the K211N mutation; (b) further blocking the binding site in the cis molecule by keeping the RING2 domain intact. These restrictions to the cis parkin molecule effectively force the pUbl to bind in trans. A competition experiment to demonstrate the likelihood of cis or trans activation in direct comparison with each other would provide stronger evidence for trans activation.
This is an excellent point. In the revised manuscript, we have performed experiments using native phospho-Parkin (Revised Figure 5), and the results are consistent with those in Figure 2 ( Revised Figure 4), where we used the K211N mutation.
(3) A major limitation of this study is that the authors interpret structural flexibility from experiments that do not report directly on flexibility. The analytical SEC experiments report on binding affinity and more specifically off-rates. By removing the interdomain linkages, the accompanying on-rate would be drastically impacted, and thus the observations are disconnected from a native scenario. Likewise, observations from protein crystallography can be consistent with flexibility, but certainly should not be directly interpreted in this manner. Rigorous determination of linker and/or domain flexibility would require alternative methods that measure this directly.
We also agree with the reviewer that these methods do not directly capture structural flexibility. Also, rigorous determination of linker flexibility would require alternative methods that measure this directly. However, due to the complex nature of interactions and technical limitations, breaking the interdomain linkages was the best possible way to capture interactions in trans. Interestingly, all previous methods that report cis interactions between pUbl and RING0 also used a similar approach (Gladkova et al.ref. 24, Sauve et al. ref. 29).
(4) The analysis of the ACT element comes across as incomplete. The authors make a point of a competing interaction with Lys48 of the Ubl domain, but the significance of this is unclear. It is possible that this observation could be an overinterpretation of the crystal structures. Additionally, the rationale for why the ACT element should or shouldn't contribute to in trans activation of different Parkin constructs is not clear. Lastly, the conclusion that this work explains the evolutionary nature of this element in chordates is highly overstated.
We agree with the reviewer that the significance of Lys48 is unclear. We have presented this just as one of the observations from the crystal structure. As the reviewer suggested, we have removed the sentence about the evolutionary nature of this element from the revised manuscript.
(5) The analysis of the REP linker element also seems incomplete. The authors identify contacts to a neighboring pUb molecule in their crystal structure, but the connection between this interface (which could be a crystallization artifact) and their biochemical activity data is not straightforward. The analysis of flexibility within this region using crystallographic and AlphaFold modeling observations is very indirect. The authors also draw parallels with linker regions in other RBR ligases that are involved in recognizing the E2-loaded Ub. Firstly, it is not clear from the text or figures whether the "conserved" hydrophobic within the linker region is involved in these alternative Ub interfaces. And secondly, the authors appear to jump to the conclusion that the Parkin linker region also binds an E2-loaded Ub, even though their original observation from the crystal structure seems inconsistent with this. The entire analysis feels very preliminary and also comes across as tangential to the primary storyline of in trans Parkin activation.
We agree with the reviewer that crystal structure data and biochemical data are not directly linked. In the revised manuscript, we have also highlighted the conserved hydrophobic in the linker region at the ubiquitin interface (Fig. 9C and Extended Data Fig. 11A), which was somehow missed in the original manuscript. We want to add that a very similar analysis and supporting experiments identified donor ubiquitin-binding sites on the IBR and helix connecting RING1-IBR (Kumar et al., Nature Str. and Mol. Biol., 2017), which several other groups later confirmed. In the mentioned study, the Ubl domain of Parkin from the symmetry mate Parkin molecule was identified as a mimic of “donor ubiquitin” on IBR and helix connecting RING1-IBR.
In the present study, a neighboring pUb molecule in the crystal structure is identified as a donor ubiquitin mimic (Fig. 9C) by supporting biophysical/biochemical experiments. First, we show that mutation of I411A in the REP linker of Parkin perturbs Parkin interaction with E2~Ub (donor) (Fig. 9F). Another supporting experiment was performed using a Ubiquitin-VS probe assay, which is independent of E2. Assays using Ubiquitin-VS show that I411A mutation in the REP-RING2 linker perturbs Parkin charging with Ubiquitin-VS (Extended Data Fig. 11 B). Furthermore, the biophysical data showing loss of Parkin interaction with donor ubiquitin is further supported by ubiquitination assays. Mutations in the REP-RING2 linker perturb the Parkin activity (Fig. 9E), confirming biophysical data. This is further confirmed by mutations (L71A or L73A) on ubiquitin (Extended Data Fig. 11C), resulting in loss of Parkin activity. The above experiments nicely establish the role of the REP-RING2 linker in interaction with donor ubiquitin, which is consistent with other RBRs (Extended Data Fig. 11A).
While we agree with the reviewer that this appears tangential to the primary storyline in trans-Parkin activation, we decided to include this data because it could be of interest to the field.
Recommendations for the authors:
Reviewer #1 (Recommendations For The Authors):
(1) For clarity, a schematic of the domain architecture of Parkin would be helpful at the outset in the main figures. This will help with the introduction to better understand the protein organization. This is lost in the Extended Figure in my opinion.
We thank the reviewer for suggesting this, which we have included in Figure 1 of the revised manuscript.
(2) Related to the competition between the Ubl and RING2 domains, can competition be shown through another method? SPR, ITC, etc? ITC was used in other experiments, but only in the context of mutations (Lys211Asn)? Can this be done with WT sequence?
This is an excellent suggestion. In the revised Figure 5, we have performed ITC experiment using WT Parkin, and the results are consistent with what we observed using Lys211Asn Parkin.
(3) The authors also note that "the AlphaFold model shows a helical structure in the linker region of Parkin (Extended Data Figure 10C), further confirming the flexible nature of this region"... but the secondary structure would not be inherently flexible. This is confusing.
The flexibility is in terms of the conformation of this linker region observed under the open or closed state of Parkin. In the revised manuscript, we have explained this point more clearly.
(4) The manuscript needs extensive revision to improve its readability. Minor grammatical mistakes were prevalent throughout.
We thank the reviewer for pointing out this and we have corrected these in the revised manuscript.
(5) The confocal images are nice, but inset panels may help highlight the regions of interest (ROIs).
This is corrected in the revised manuscript.
(6) Trans is misspelled ("tans") towards the end of the second paragraph on page 16.
This is corrected in the revised manuscript.
(7) The schematics are helpful, but some of the lettering in Figure 2 is very small.
This is corrected in the revised manuscript.
Reviewer #3 (Recommendations For The Authors):
(1) A significant portion of the results section refers to the supplement, making the overall readability very difficult.
We accept this issue as a lot of relevant data could not be added to the main figures and thus ended up in the supplement. In the revised manuscript, we have moved some of the supplementary figures to the main figures.
(2) Interpretation of the experiments utilizing many different Parkin constructs and cleavage scenarios (particularly the SEC and crystallography experiments) is extremely difficult. The work would benefit from a layout of the Parkin model system, highlighting cleavage sites, key domain terminology, and mutations used in the study, presented together and early on in the manuscript. Using this to identify a simpler system of referencing Parkin constructs would also be a large improvement.
This is a great suggestion. We have included these points in the revised manuscript, which has improved the readability.
(3) Lines 81-83; the authors say they "demonstrate the conformational changes in Parkin during the activation process", but fail to show any actual conformational changes. Further, much of what is demonstrated in this work (in terms of crystal structures) corroborates existing literature. The authors should use caution not to overstate their original conclusions in light of the large body of work in this area.
We thank the reviewer for pointing out this. We have corrected the above statement in the revised manuscript to indicate that we meant it in the context of trans conformational changes.
(4) Line 446 and 434; there is a discrepancy about which amino acid is present at residue 409. Is this a K408 typo? The authors also present mutational work on K416, but this residue is not shown in the structure panel.
We thank the reviewer for pointing out this. In the revised manuscript, we have corrected these typos.
Author response:
The following is the authors’ response to the original reviews.
Reviewer 1:
(1) Peptides were synthesized with fluorescein isothiocyanate (FITC) and Tat tag, and then PEGylated with methoxy PEG Succinimidyl Succinate.
I have two concerns about the peptide design. First, FTIC was intended "for monitoring" (line 129), but was never used in the manuscript. Second, PEGylation targets the two lysine sidechains on the Tat, which would alter its penetration property.
We conducted an analysis of the cellular trafficking of FITC-tagged peptides following their permeabilization into cells.
Author response image 1.
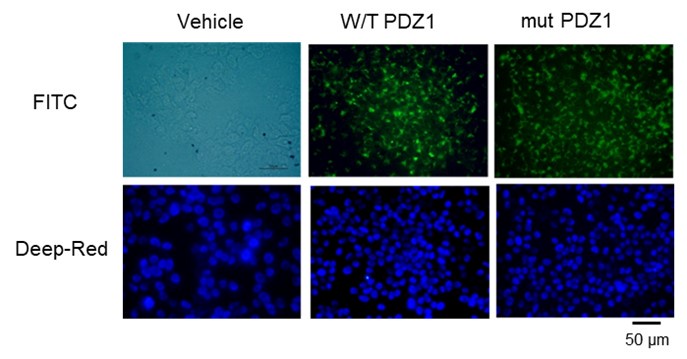
However, we did not include it in the main text because it is a basic result.
(2) As can be seen in the figure above, after pegylation and permeabilization, the cells were stained with FITC. It appears that this does not affect the ability to penetrate into the cells.
(2) "Superdex 200 increase 10/300 GL column" (line 437) was used to isolate mono/di PEGylated PDZ and separate them from the residual PEG and PDZ peptide. "m-PEG-succinimidyl succinate with an average molecular weight of 5000 Da" (lines 133 and 134).
To my knowledge, the Superdex 200 increase 10/300 GL column is not suitable and is unlikely to produce traces shown in Figure 1B.
As Superdex 200 increase 10/300 GL featrues a fractionation range of 10,000 to 600,000 Da, we used it to fractionate PEGylated products including DiPEGylated PDZ (approx. 15 kDa) and MonoPEGylated PDZ (approx. 10 kDa) from residuals (PDZ and PEG), demonstrating successful isolation of PEGylated products (Figure 1C). Considering the molecular weights of PDZ and PEG are approximately 4.1 kDa and and 5.0 kDa, respectively, the late eluting peaks from SEC were likely to represent a mixed absorbance of PDZ and PEG at 215 nm.
However, as the reviewer pointed out, it could be unreasonable to annotate peaks representing PDZ and PEG, respectively, from mixed absorbance detected in a region (11-12 min) beyond the fractionation range.
In our revised manuscript, therefore, multiple peaks in the late eluting volume (11-12 min) were labeled as 'Residuals' all together. As a reference, the revised figure 1B includes a chromatogram of pure PDZ-WT under the same analytic condition.
Therefore, we changed Fig.1B to new results as followed:
(3) "the in vivo survival effect of LPS and PDZ co-administration was examined in mice. The pretreatment with WT PDZ peptide significantly increased survival and rescued compared to LPS only; these effects were not observed with the mut PDZ peptide (Figure 2a)." (lines 159-160).
Fig 2a is the weight curve only. The data is missing in the manuscript.
We added the survived curve into Fig. 2A as followed:
(4) Table 1, peptide treatment on ALT and AST appears minor.
In mice treated with LPS, levels of ALT and AGT in the blood are elevated, but these levels decrease upon treatment with WT PDZ. However, the use of mut PDZ does not result in significant changes. Figure 3A shows inflammatory cells within the central vein, yet no substantial hepatotoxicity is observed during the 5-day treatment with LPS. Normally, the ranges of ALT and AGT in C57BL6 mice are 16 ~ 200 U/L and 46 ~ 221 U/L, respectively, according to UCLA Diagnostic Labs. Therefore, the values in all experiments fall within these normal ranges. In summary, a 5-day treatment with LPS induces inflammation in the liver but is too short a duration to induce hepatotoxicity, resulting in lower values.
(5) MitoTraker Green FM shouldn't produce red images in Figure 6.
We changed new results (GREEN one) into Figs 6A and B as followed:
(6) Figure 5. Comparison of mRNA expression in PDZ-treated BEAS-2B cells. Needs a clearer and more detailed description both in the main text and figure legend. The current version is very hard to read.
We changed Fig. 5A to new one to understand much easier and added more detailed results and figure legend as followed:
Results Section in Figure 5:
“…we performed RNA sequencing analysis. The results of RNA-seq analysis showed the expression pattern of 24,424 genes according to each comparison combination, of which the results showed the similarity of 51 genes overlapping in 4 gene categories and the similarity between each comparison combination (Figure 5a). As a result, compared to the control group, it was confirmed that LPS alone, WT PDZ+LPS, and mut PDZ+LPS were all upregulated above the average value in each gene, and when LPS treatment alone was compared with WT PDZ+LPS, it was confirmed that they were averaged or downregulated. When comparing LPS treatment alone and mut PDZ+LPS, it was confirmed that about half of the genes were upregulated. Regarding the similarity between comparison combinations, the comparison combination with LPS…”
Figure 5 Legend Section:
“Figure 5. Comparison of mRNA expression in PDZ-treated BEAS-2B cells.
BEAS-2B cells were treated with wild-type PDZ or mutant PDZ peptide for 24 h and then incubated with LPS for 2 h, after which RNA sequencing analysis was performed. (a) The heat map shows the general regulation pattern of about 51 inflammation-related genes that are differentially expressed when WT PDZ and mut PDZ are treated with LPS, an inflammatory substance. All samples are RED = upregulated and BLUE = downregulated relative to the gene average. Each row represents a gene, and the columns represent the values of the control group treated only with LPS and the WT PDZ and mut PDZ groups with LPS. This was used by converting each log value into a fold change value. All genes were adjusted to have the same mean and standard deviation, the unit of change is the standard deviation from the mean, and the color value range of each row is the same. (b) Significant genes were selected using Gene category chat (Fold change value of 2.00 and normalized data (log2) value of 4.00). The above pie chart shows the distribution of four gene categories when comparing LPS versus control, WT PDZ+LPS/LPS, and mut PDZ+LPS/LPS. The bar graph below shows RED=upregulated, GREEN=downregulated for each gene category, and shows the number of upregulated and downregulated genes in each gene category. (c) The protein-protein interaction network constructed by the STRING database differentially displays commonly occurring genes by comparing WT PDZ+LPS/LPS, mut PDZ+LPS/LPS, and LPS. These nodes represent proteins associated with inflammation, and these connecting lines denote interactions between two proteins. Different line thicknesses indicate types of evidence used in predicting the associations.”
Reviewer 2:
(1) In this paper, the authors demonstrated the anti-inflammatory effect of PDZ peptide by inhibition of NF-kB signaling. Are there any results on the PDZ peptide-binding proteins (directly or indirectly) that can regulate LPS-induced inflammatory signaling pathway? Elucidation of the PDZ peptide-its binding partner protein and regulatory mechanisms will strengthen the author's hypothesis about the anti-inflammatory effects of PDZ peptide
As mentioned in the Discussion section, we believe it is crucial to identify proteins that directly interact with PDZ and regulate it. This direct interaction can modulate intracellular signaling pathways, so we plan to express GST-PDZ and induce binding with cellular lysates, then characterize it using the LC-Mass/Mass method. We intend to further research these findings and submit them for publication.
(2) The authors presented interesting insights into the therapeutic role of the PDZ motif peptide of ZO-1. PDZ domains are protein-protein interaction modules found in a variety of species. It has been thought that many cellular and biological functions, especially those involving signal transduction complexes, are affected by PDZ-mediated interactions. What is the rationale for selecting the core sequence that regulates inflammation among the PDZ motifs of ZO-1 shown in Figure 1A?
The rationale for selecting the core sequence that regulates inflammation among the PDZ motifs of ZO-1, as shown in Figure 1A, is grounded in the specific roles these motifs play in signal transduction pathways that are crucial for inflammatory processes. PDZ domains are recognized for their ability to function as scaffolding proteins that organize signal transduction complexes, crucial for modulating cellular and biological functions. The chosen core sequence is particularly important because it is conserved across ZO-1, ZO-2, and ZO-3, indicating a fundamental role in maintaining cellular integrity and signaling pathways. This conservation suggests that the sequence’s involvement in inflammatory regulation is not only significant in ZO-1 but also reflects a broader biological function across the ZO family.
(3) In Figure 3, the authors showed the representative images of IHC, please add the quantification analysis of Iba1 expression and PAS-positive cells using Image J or other software. To help understand the figure, an indication is needed to distinguish specifically stained cells (for example, a dotted line or an arrow).
We added the semi-quantitative results into Figs. 4d,e,f as followed:
Result section: “The specific physiological mechanism by which WT PDZ peptide decreases LPS-induced systemic inflammation in mice and the signal molecules involved remain unclear. These were confirmed by a semi-quantitative analysis of Iba-1 immunoreactivity and PAS staining in liver, kidney, and lung,respectively (Figures 4d, e, and f). To examine whether WT PDZ peptide can alter LPS-induced tissue damage in the kidney, cell toxicity assay was performed (Figure 3g). LPS induced cell damage in the kidney, however, WT PDZ peptide could significantly alleviate the toxicity, but mut PDZ peptide could not. Because cytotoxicity caused by LPS is frequently due to ROS production in the kidney (Su et al., 2023; Qiongyue et al., 2022), ROS production in the mitochondria was investigated in renal mitochondria cells harvested from kidney tissue (Figure 3h)....”
Figure legend section: “Indicated scale bars were 20 μm. (d,e,f) Semi-quantitative analysis of each are positive for Iba-1 in liver and kidney, and positive cells of PAS in lung, respectively. (g) After the kidneys were harvested, tissue lysates were used for MTT assay. (h) After...”
(4) In Figure 6G, H, the authors confirmed the change in expression of the M2 markers by PDZ peptide using the mouse monocyte cell line Raw264.7. It would be good to add an experiment on changes in M1 and M2 markers caused by PDZ peptides in human monocyte cells (for example, THP-1).
We thank you for your comments. To determine whether PDZ peptide regulates M1/M2 polarization in human monocytes, we examined changes in M1 and M2 gene expression in THP-1 cells. As a result, wild-type PDZ significantly suppressed the expression of M1 marker genes (hlL-1β, hIL-6, hIL-8, hTNF-ɑ), while increasing the expression of M2 marker genes (hlL-4, hIL-10, hMRC-1). However, mutant PDZ did not affect M1/M2 polarization. These results suggest that PDZ peptide can suppress inflammation by regulating M1/M2 polarization of human monocyte cells. These results are for the reviewer's reference only and will not be included in the main content.
Author response image 2.
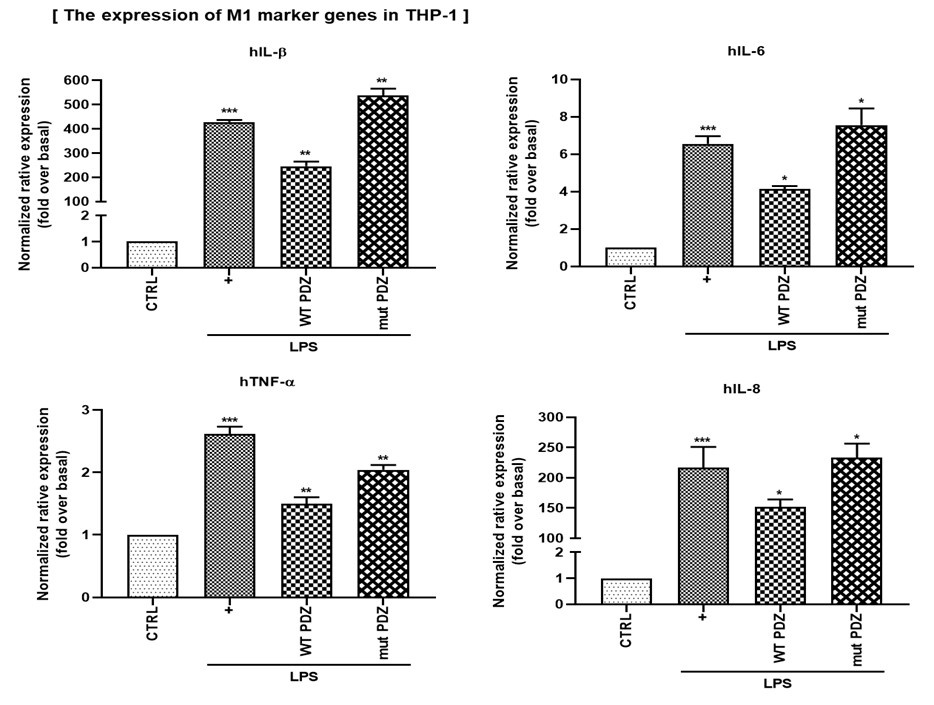
Author response image 3.
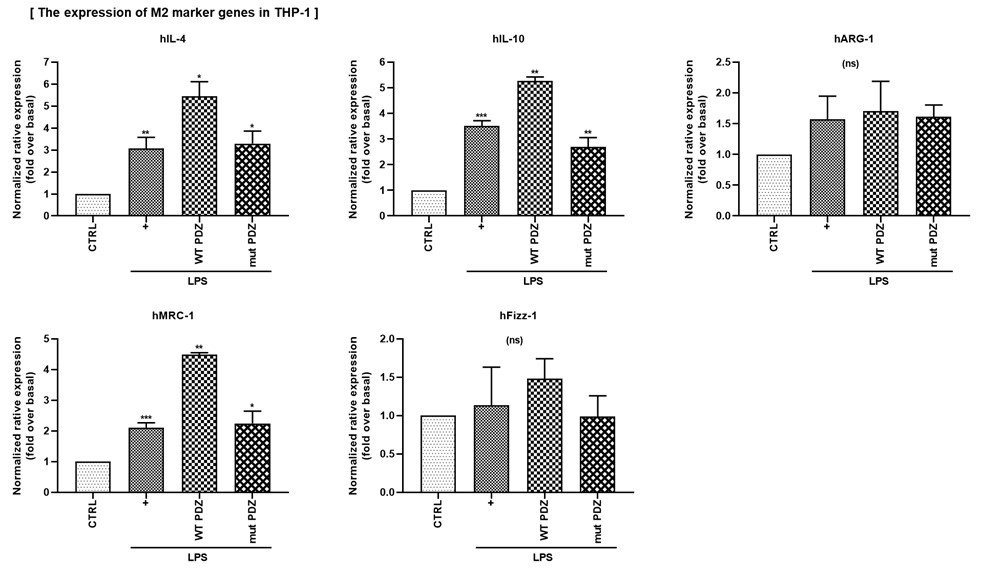
Minor point:
The use of language is appropriate, with good writing skills. Nevertheless, a thorough proofread would eliminate small mistakes such as:
- line 254, " mut PDZ+LPS/LPS (45.75%) " → " mut PDZ+LPS/LPS (47.75%) "
- line 296, " Figure 6f " → " Figure 6h "
We changed these points into the manuscript.
These may be characterised as 'cognitive artefacts': human-made physical objects that we employ as a means of assisting us in performing a cognitive task, and which are able to represent, store, retrieve, and manipulate information
The dataset i'm created is itself a "cognitive artefact". It represents the Iamata in a particular way, that means that I must show how I moved from inscription text to tags, so that readers can evaluate my choices, meaning that I should add a little "from text to tag" example for one inscription to demonstrate my tagging logic.
Much of the internet has developed a culture of copying without necessarily giving attribution to where it came from. Often, unlike with Elon Musk, this copying also involves modifying the content, recontextualizing the content to give it new meaning, or combining it with other content
Reading this section made me think about how normalized copying has become online. Platforms like TikTok, Twitter, and even meme pages thrive on remixing and reposting, but most people never think about who originally made something. Personally, I’ve shared memes and gifs without even realizing they came from artists who might want credit. I think Confucius’s idea of “li”—doing what’s proper and respectful—applies here: giving credit isn’t just a rule, it’s a way of showing respect for the creator and the community.
At the same time, I agree with Michael Wesch’s point that remixing can be a form of cultural expression and creativity, not just theft. It’s tricky, though, when remixing turns into cultural appropriation—like when certain slang or imagery from Black culture is taken and used for jokes by people outside the culture. I think the line between cultural exchange and appropriation comes down to intent and respect. If you’re sharing something to appreciate and understand, that’s exchange. But if it’s just for clout or laughs, it’s exploitation.
This section really made me rethink how I use memes and social media. I’m going to start paying more attention to where things come from—and maybe even give credit when I can, even if it’s just a tag or mention.
fusion tag
It is super helpful that you included so many tag designs already in the construct. It really adds to the usability right off the bat.
Author response:
The following is the authors’ response to the original reviews
Public Reviews:
Reviewer #1 (Public review):
Summary
Query: In this manuscript, the authors introduce Gcoupler, a Python-based computational pipeline designed to identify endogenous intracellular metabolites that function as allosteric modulators at the G protein-coupled receptor (GPCR) - Gα protein interface. Gcoupler is comprised of four modules:
I. Synthesizer - identifies protein cavities and generates synthetic ligands using LigBuilder3
II. Authenticator - classifies ligands into high-affinity binders (HABs) and low-affinity binders (LABs) based on AutoDock Vina binding energies
III. Generator - trains graph neural network (GNN) models (GCM, GCN, AFP, GAT) to predict binding affinity using synthetic ligands
IV. BioRanker - prioritizes ligands based on statistical and bioactivity data
The authors apply Gcoupler to study the Ste2p-Gpa1p interface in yeast, identifying sterols such as zymosterol (ZST) and lanosterol (LST) as modulators of GPCR signaling. Our review will focus on the computational aspects of the work. Overall, we found the Gcoupler approach interesting and potentially valuable, but we have several concerns with the methods and validation that need to be addressed prior to publication/dissemination.
We express our gratitude to Reviewer #1 for their concise summary and commendation of our work. We sincerely apologize for the lack of sufficient detail in summarizing the underlying methods employed in Gcoupler, as well as its subsequent experimental validations using yeast, human cell lines, and primary rat cardiomyocyte-based assays.
We wish to state that substantial improvements have been made in the revised manuscript, every section has been elaborated upon to enhance clarity. Please refer to the point-by-point response below and the revised manuscript.
Query: (1) The exact algorithmic advancement of the Synthesizer beyond being some type of application wrapper around LigBuilder is unclear. Is the grow-link approach mentioned in the methods already a component of LigBuilder, or is it custom? If it is custom, what does it do? Is the API for custom optimization routines new with the Synthesizer, or is this a component of LigBuilder? Is the genetic algorithm novel or already an existing software implementation? Is the cavity detection tool a component of LigBuilder or novel in some way? Is the fragment library utilized in the Synthesizer the default fragment library in LigBuilder, or has it been customized? Are there rules that dictate how molecule growth can occur? The scientific contribution of the Synthesizer is unclear. If there has not been any new methodological development, then it may be more appropriate to just refer to this part of the algorithm as an application layer for LigBuilder.
We appreciate Reviewer #1's constructive suggestion. We wish to emphasize that
(1) The LigBuilder software comprises various modules designed for distinct functions. The Synthesizer in Gcoupler strategically utilizes two of these modules: "CAVITY" for binding site detection and "BUILD" for de novo ligand design.
(2) While both modules are integral to LigBuilder, the Synthesizer plays a crucial role in enabling their targeted, automated, and context-aware application for GPCR drug discovery.
(3) The CAVITY module is a structure-based protein binding site detection program, which the Synthesizer employs for identifying ligand binding sites on the protein surface.
(4) The Synthesizer also leverages the BUILD module for constructing molecules tailored to the target protein, implementing a fragment-based design strategy using its integrated fragment library.
(5) The GROW and LINK methods represent two independent approaches encompassed within the aforementioned BUILD module.
Author response image 1.
Schematic representation of the key strategy used in the Synthesizer module of Gcoupler.
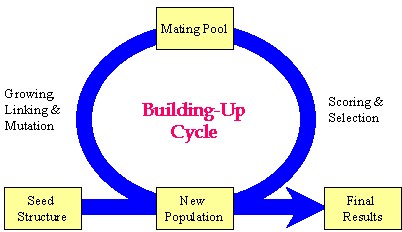
Our manuscript details the "grow-link" hybrid approach, which was implemented using a genetic algorithm through the following stages:
(1) Initial population generation based on a seed structure via the GROW method.
(2) Selection of "parent" molecules from the current population for inclusion in the mating pool using the LINK method.
(3) Transfer of "elite" molecules from the current population to the new population.
(4) Population expansion through structural manipulations (mutation, deletion, and crossover) applied to molecules within the mating pool.
Please note, the outcome of this process is not fixed, as it is highly dependent on the target cavity topology and the constraint parameters employed for population evaluation. Synthesizer customizes generational cycles and optimization parameters based on cavity-specific constraints, with the objective of either generating a specified number of compounds or comprehensively exploring chemical diversity against a given cavity topology.
While these components are integral to LigBuilder, Synthesizer's innovation lies
(1) in its programmatic integration and dynamic adjustment of these modules.
(2) Synthesizer distinguishes itself not by reinventing these algorithms, but by their automated coordination, fine-tuning, and integration within a cavity-specific framework.
(3) It dynamically modifies generation parameters according to cavity topology and druggability constraints, a capability not inherently supported by LigBuilder.
(4) This renders Synthesizer particularly valuable in practical scenarios where manual optimization is either inefficient or impractical.
In summary, Synthesizer offers researchers a streamlined interface, abstracting the technical complexities of LigBuilder and thereby enabling more accessible and reproducible ligand generation pipelines, especially for individuals with limited experience in structural or cheminformatics tools.
Query: (2) The use of AutoDock Vina binding energy scores to classify ligands into HABs and LABs is problematic. AutoDock Vina's energy function is primarily tuned for pose prediction and displays highly system-dependent affinity ranking capabilities. Moreover, the HAB/LAB thresholds of -7 kcal/mol or -8 kcal/mol lack justification. Were these arbitrarily selected cutoffs, or was benchmarking performed to identify appropriate cutoffs? It seems like these thresholds should be determined by calibrating the docking scores with experimental binding data (e.g., known binders with measured affinities) or through re-scoring molecules with a rigorous alchemical free energy approach.
We again express our gratitude to Reviewer #1 for these inquiries. We sincerely apologize for the lack of sufficient detail in the original version of the manuscript. In the revised manuscript, we have ensured the inclusion of a detailed rationale for every threshold utilized to prioritize high-affinity binders. Please refer to the comprehensive explanation below, as well as the revised manuscript, for further details.
We would like to clarify that:
(1) The Authenticator module is not solely reliant on absolute binding energy values for classification. Instead, it calculates binding energies for all generated compounds and applies a statistical decision-making layer to define HAB and LAB classes.
(2) Rather than using fixed thresholds, the module employs distribution-based methods, such as the Empirical Cumulative Distribution Function (ECDF), to assess the overall energy landscape of the compound set. We then applied multiple statistical tests to evaluate the HAB and LAB distributions and determine an optimal, data-specific cutoff that balances class sizes and minimizes overlap.
(3) This adaptive approach avoids rigid thresholds and instead ensures context-sensitive classification, with safeguards in place to maintain adequate representation of both classes for downstream model training, and in this way, the framework prioritizes robust statistical reasoning over arbitrary energy cutoffs and aims to reduce the risks associated with direct reliance on Vina scores alone.
(4) To assess the necessity and effectiveness of the Authenticator module, we conducted a benchmarking analysis where we deliberately omitted the HAB and LAB class labels, treating the compound pool as a heterogeneous, unlabeled dataset. We then performed random train-test splits using the Synthesizer-generated compounds and trained independent models.
(5) The results from this approach demonstrated notably poorer model performance, indicating that arbitrary or unstructured data partitioning does not effectively capture the underlying affinity patterns. These experiments highlight the importance of using the statistical framework within the Authenticator module to establish meaningful, data-driven thresholds for distinguishing High- and Low-Affinity Binders. The cutoff values are thus not arbitrary but emerge from a systematic benchmarking and validation process tailored to each dataset.
Please note: While calibrating docking scores with experimental binding affinities or using rigorous methods like alchemical free energy calculations can improve precision, these approaches are often computationally intensive and reliant on the availability of high-quality experimental data, a major limitation in many real-world screening scenarios.
In summary, the primary goal of Gcoupler is to enable fast, scalable, and broadly accessible screening, particularly for cases where experimental data is sparse or unavailable. Incorporating such resource-heavy methods would not only significantly increase computational overhead but also undermine the framework’s intended usability and efficiency for large-scale applications. Instead, our workflow relies on statistically robust, data-driven classification methods that balance speed, generalizability, and practical feasibility.
Query: (3) Neither the Results nor Methods sections provide information on how the GNNs were trained in this study. Details such as node features, edge attributes, standardization, pooling, activation functions, layers, dropout, etc., should all be described in detail. The training protocol should also be described, including loss functions, independent monitoring and early stopping criteria, learning rate adjustments, etc.
We again thank Reviewer #1 for this suggestion. We would like to mention that in the revised manuscript, we have added all the requested details. Please refer to the points below for more information.
(1) The Generator module of Gcoupler is designed as a flexible and automated framework that leverages multiple Graph Neural Network architectures, including Graph Convolutional Model (GCM), Graph Convolutional Network (GCN), Attentive FP, and Graph Attention Network (GAT), to build classification models based on the synthetic ligand datasets produced earlier in the pipeline.
(2) By default, Generator tests all four models using standard hyperparameters provided by the DeepChem framework (https://deepchem.io/), offering a baseline performance comparison across architectures. This includes pre-defined choices for node features, edge attributes, message-passing layers, pooling strategies, activation functions, and dropout values, ensuring reproducibility and consistency. All models are trained with binary cross-entropy loss and support default settings for early stopping, learning rate, and batch standardization where applicable.
(3) In addition, Generator supports model refinement through hyperparameter tuning and k-fold cross-validation (default: 3 folds). Users can either customize the hyperparameter grid or rely on Generator’s recommended parameter ranges to optimize model performance. This allows for robust model selection and stability assessment of tuned parameters.
(4) Finally, the trained models can be used to predict binding probabilities for user-supplied compounds, making it a comprehensive and user-adaptive tool for ligand screening.
Based on the reviewer #1 suggestion, we have now added a detailed description about the Generator module of Gcoupler, and also provided relevant citations regarding the DeepChem workflow.
Query: (4) GNN model training seems to occur on at most 500 molecules per training run? This is unclear from the manuscript. That is a very small number of training samples if true. Please clarify. How was upsampling performed? What were the HAB/LAB class distributions? In addition, it seems as though only synthetically generated molecules are used for training, and the task is to discriminate synthetic molecules based on their docking scores. Synthetic ligands generated by LigBuilder may occupy distinct chemical space, making classification trivial, particularly in the setting of a random split k-folds validation approach. In the absence of a leave-class-out validation, it is unclear if the model learns generalizable features or exploits clear chemical differences. Historically, it was inappropriate to evaluate ligand-based QSAR models on synthetic decoys such as the DUD-E sets - synthetic ligands can be much more easily distinguished by heavily parameterized ligand-based machine learning models than by physically constrained single-point docking score functions.
We thank reviewer #1 for these detailed technical queries. We would like to clarify that:
(1) The recommended minimum for the training set is 500 molecules, but users can add as many synthesized compounds as needed to thoroughly explore the chemical space related to the target cavity.
(2) Our systematic evaluation demonstrated that expanding the training set size consistently enhanced model performance, especially when compared to AutoDock docking scores. This observation underscores the framework's scalability and its ability to improve predictive accuracy with more training compounds.
(3) The Authenticator module initially categorizes all synthesized molecules into HAB and LAB classes. These labeled molecules are then utilized for training the Generator module. To tackle class imbalance, the class with fewer data points undergoes upsampling. This process aims to achieve an approximate 1:1 ratio between the two classes, thereby ensuring balanced learning during GNN model training.
(4) The Authenticator module's affinity scores are the primary determinant of the HAB/LAB class distribution, with a higher cutoff for HABs ensuring statistically significant class separation. This distribution is also indirectly shaped by the target cavity's topology and druggability, as the Synthesizer tends to produce more potent candidates for cavities with favorable binding characteristics.
(5) While it's true that synthetic ligands may occupy distinct chemical space, our benchmarking exploration for different sites on the same receptor still showed inter-cavity specificity along with intra-cavity diversity of the synthesized molecules.
(6) The utility of random k-fold validation shouldn't be dismissed outright; it provides a reasonable estimate of performance under practical settings where class boundaries are often unknown. Nonetheless, we agree that complementary validation strategies like leave-class-out could further strengthen the robustness assessment.
(7) We agree that using synthetic decoys like those from the DUD-E dataset can introduce bias in ligand-based QSAR model evaluations if not handled carefully. In our workflow, the inclusion of DUD-E compounds is entirely optional and only considered as a fallback, specifically in scenarios where the number of low-affinity binders (LABs) synthesized by the Synthesizer module is insufficient to proceed with model training.
(8) The primary approach relies on classifying generated compounds based on their derived affinity scores via the Authenticator module. However, in rare cases where this results in a heavily imbalanced dataset, DUD-E compounds are introduced not as part of the core benchmarking, but solely to maintain minimal class balance for initial model training. Even then, care is taken to interpret results with this limitation in mind. Ultimately, our framework is designed to prioritize data-driven generation of both HABs and LABs, minimizing reliance on synthetic decoys wherever possible.
Author response image 2.
Scatter plots depicting the segregation of High/Low-Affinity Metabolites (HAM/LAM) (indicated in green and red) identified using Gcoupler workflow with 100% training data. Notably, models trained on lesser training data size (25%, 50%, and 75% of HAB/LAB) severely failed to segregate HAM and LAM (along Y-axis). X-axis represents the binding affinity calculated using IC4-specific docking using AutoDock.
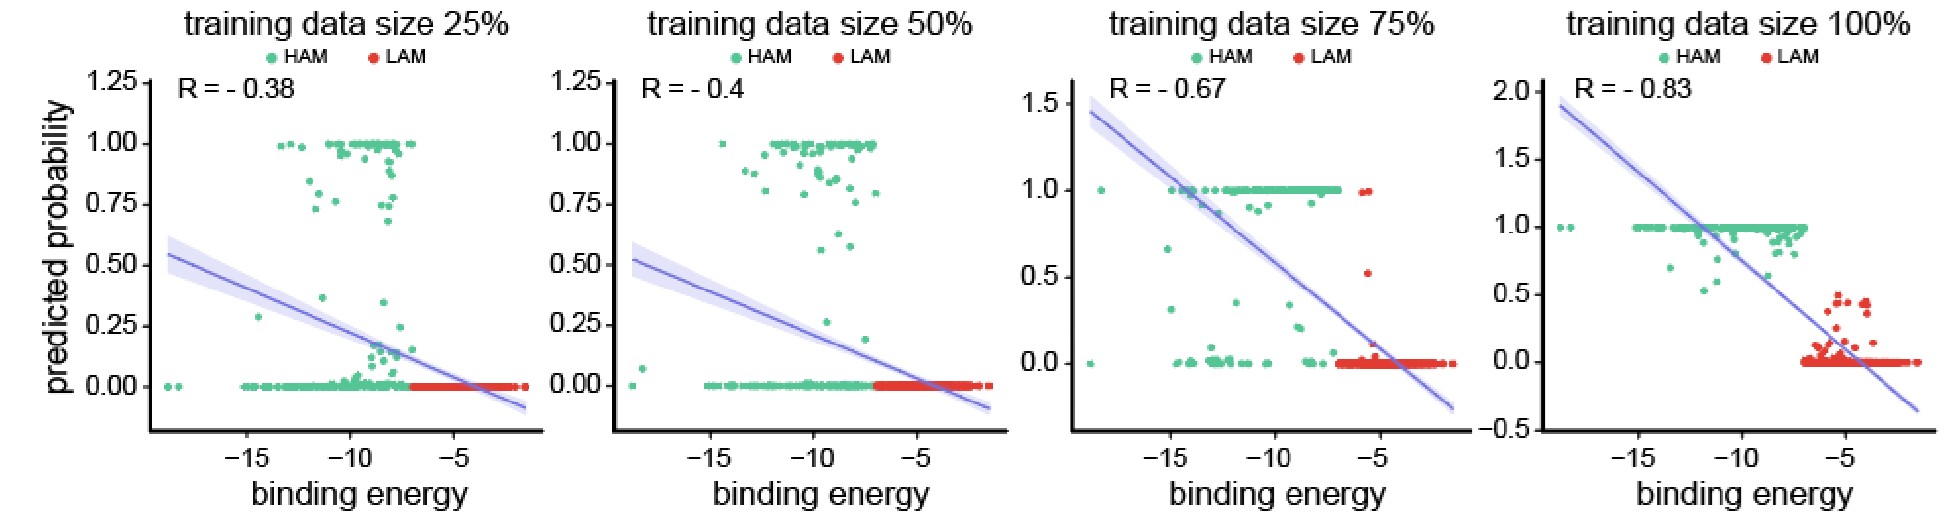
Based on the reviewer #1’s suggestion, we have now added all these technical details in the revised version of the manuscript.
Query: (5) Training QSAR models on docking scores to accelerate virtual screening is not in itself novel (see here for a nice recent example: https://www.nature.com/articles/s43588-025-00777-x), but can be highly useful to focus structure-based analysis on the most promising areas of ligand chemical space; however, we are perplexed by the motivation here. If only a few hundred or a few thousand molecules are being sampled, why not just use AutoDock Vina? The models are trained to try to discriminate molecules by AutoDock Vina score rather than experimental affinity, so it seems like we would ideally just run Vina? Perhaps we are misunderstanding the scale of the screening that was done here. Please clarify the manuscript methods to help justify the approach.
We acknowledge the effectiveness of training QSAR models on docking scores for prioritizing chemical space, as demonstrated by the referenced study (https://www.nature.com/articles/s43588-025-00777-x) on machine-learning-guided docking screen frameworks.
We would like to mention that:
(1) While such protocols often rely on extensive pre-docked datasets across numerous protein targets or utilize a highly skewed input distribution, training on as little as 1-10% of ligand-protein complexes and testing on the remainder in iterative cycles.
(2) While powerful for ultra-large libraries, this approach can introduce bias towards the limited training set and incur significant overhead in data curation, pre-computation, and infrastructure.
(3) In contrast, Gcoupler prioritizes flexibility and accessibility, especially when experimental data is scarce and large pre-docked libraries are unavailable. Instead of depending on fixed docking scores from external pipelines, Gcoupler integrates target-specific cavity detection, de novo compound generation, and model training into a self-contained, end-to-end framework. Its QSAR models are trained directly on contextually relevant compounds synthesized for a given binding site, employing a statistical classification strategy that avoids arbitrary thresholds or precomputed biases.
(4) Furthermore, Gcoupler is open-source, lightweight, and user-friendly, making it easily deployable without the need for extensive infrastructure or prior docking expertise. While not a complete replacement for full-scale docking in all use cases, Gcoupler aims to provide a streamlined and interpretable screening framework that supports both focused chemical design and broader chemical space exploration, without the computational burden associated with deep learning docking workflows.
(5) Practically, even with computational resources, manually running AutoDock Vina on millions of compounds presents challenges such as format conversion, binding site annotation, grid parameter tuning, and execution logistics, all typically requiring advanced structural bioinformatics expertise.
(6) Gcoupler's Authenticator module, however, streamlines this process. Users only need to input a list of SMILES and a receptor PDB structure, and the module automatically handles compound preparation, cavity mapping, parameter optimization, and high-throughput scoring. This automation reduces time and effort while democratizing access to structure-based screening workflows for users without specialized expertise.
Ultimately, Gcoupler's motivation is to make large-scale, structure-informed virtual screening both efficient and accessible. The model serves as a surrogate to filter and prioritize compounds before deeper docking or experimental validation, thereby accelerating targeted drug discovery.
Query: (6) The brevity of the MD simulations raises some concerns that the results may be over-interpreted. RMSD plots do not reliably compare the affinity behavior in this context because of the short timescales coupled with the dramatic topological differences between the ligands being compared; CoQ6 is long and highly flexible compared to ZST and LST. Convergence metrics, such as block averaging and time-dependent MM/GBSA energies, should be included over much longer timescales. For CoQ6, the authors may need to run multiple simulations of several microseconds, identify the longest-lived metastable states of CoQ6, and perform MM/GBSA energies for each state weighted by each state's probability.
We appreciate Reviewer #1's suggestion regarding simulation length, as it is indeed crucial for interpreting molecular dynamics (MD) outcomes. We would like to mention that:
(1) Our simulation strategy varied based on the analysis objective, ranging from short (~5 ns) runs for preliminary or receptor-only evaluations to intermediate (~100 ns) and extended (~550 ns) runs for receptor-ligand complex validation and stability assessment.
(2) Specifically, we conducted three independent 100 ns MD simulations for each receptor-metabolite complex in distinct cavities of interest. This allowed us to assess the reproducibility and persistence of binding interactions. To further support these observations, a longer 550 ns simulation was performed for the IC4 cavity, which reinforced the 100 ns findings by demonstrating sustained interaction stability over extended timescales.
(3) While we acknowledge that even longer simulations (e.g., in the microsecond range) could provide deeper insights into metastable state transitions, especially for highly flexible molecules like CoQ6, our current design balances computational feasibility with the goal of screening multiple cavities and ligands.
(4) In our current workflow, MM/GBSA binding free energies were calculated by extracting 1000 representative snapshots from the final 10 ns of each MD trajectory. These configurations were used to compute time-averaged binding energies, incorporating contributions from van der Waals, electrostatic, polar, and non-polar solvation terms. This approach offers a more reliable estimate of ligand binding affinity compared to single-point molecular docking, as it accounts for conformational flexibility and dynamic interactions within the binding cavity.
(5) Although we did not explicitly perform state-specific MM/GBSA calculations weighted by metastable state probabilities, our use of ensemble-averaged energy estimates from a thermally equilibrated segment of the trajectory captures many of the same benefits. We acknowledge, however, that a more rigorous decomposition based on metastable state analysis could offer finer resolution of binding behavior, particularly for highly flexible ligands like CoQ6, and we consider this a valuable direction for future refinement of the framework.
Reviewer #2 (Public review):
Summary:
Query: Mohanty et al. present a new deep learning method to identify intracellular allosteric modulators of GPCRs. This is an interesting field for e.g. the design of novel small molecule inhibitors of GPCR signalling. A key limitation, as mentioned by the authors, is the limited availability of data. The method presented, Gcoupler, aims to overcome these limitations, as shown by experimental validation of sterols in the inhibition of Ste2p, which has been shown to be relevant molecules in human and rat cardiac hypertrophy models. They have made their code available for download and installation, which can easily be followed to set up software on a local machine.
Strengths:
Clear GitHub repository
Extensive data on yeast systems
We sincerely thank Reviewer #2 for their thorough review, summary, and appreciation of our work. We highly value their comments and suggestions.
Weaknesses:
Query: No assay to directly determine the affinity of the compounds to the protein of interest.
We thank Reviewer #2 for raising these insightful questions. During the experimental design phase, we carefully accounted for validating the impact of metabolites in the rescue response by pheromone.
We would like to mention that we performed an array of methods to validate our hypothesis and observed similar rescue effects. These assays include:
a. Cell viability assay (FDA/PI Flourometry-based)
b. Cell growth assay
c. FUN1<sup>TM</sup>-based microscopy assessment
d. Shmoo formation assays
e. Mating assays
f. Site-directed mutagenesis-based loss of function
g. ransgenic reporter-based assay
h. MAPK signaling assessment using Western blot.
i. And via computational techniques.
Concerning the in vitro interaction studies of Ste2p and metabolites, we made significant efforts to purify Ste2p by incorporating a His tag at the N-terminal. Despite dedicated attempts over the past year, we were unsuccessful in purifying the protein, primarily due to our limited expertise in protein purification for this specific system. As a result, we opted for genetic-based interventions (e.g., point mutants), which provide a more physiological and comprehensive approach to demonstrating the interaction between Ste2p and the metabolites.
Author response image 3.
(a) Affinity purification of Ste2p from Saccharomyces cerevisiae. Western blot analysis using anti-His antibody showing the distribution of Ste2p in various fractions during the affinity purification process. The fractions include pellet, supernatant, wash buffer, and sequential elution fractions (1–4). Wild-type and ste2Δ strains served as positive and negative controls, respectively. (b) Optimization of Ste2p extraction protocol. Ponceau staining (left) and Western blot analysis using anti-His antibody (right) showing Ste2p extraction efficiency. The conditions tested include lysis buffers containing different concentrations of CHAPS detergent (0.5%, 1%) and glycerol (10%, 20%).
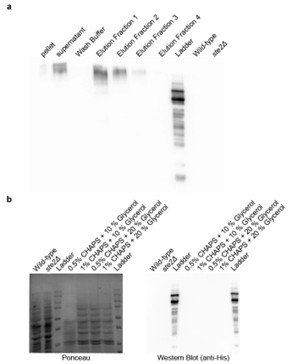
Furthermore, in addition to the clarification above, we have added the following statement in the discussion section to tone down our claims: “A critical limitation of our study is the absence of direct binding assays to validate the interaction between the metabolites and Ste2p. While our results from genetic interventions, molecular dynamics simulations, and docking studies strongly suggest that the metabolites interact with the Ste2p-Gpa1 interface, these findings remain indirect. Direct binding confirmation through techniques such as surface plasmon resonance, isothermal titration calorimetry, or co-crystallization would provide definitive evidence of this interaction. Addressing this limitation in future work would significantly strengthen our conclusions and provide deeper insights into the precise molecular mechanisms underlying the observed phenotypic effects.”
We request Reviewer #2 to kindly refer to the assays conducted on the point mutants created in this study, as these experiments offer robust evidence supporting our claims.
Query: In conclusion, the authors present an interesting new method to identify allosteric inhibitors of GPCRs, which can easily be employed by research labs. Whilst their efforts to characterize the compounds in yeast cells, in order to confirm their findings, it would be beneficial if the authors show their compounds are active in a simple binding assay.
We express our gratitude and sincere appreciation for the time and effort dedicated by Reviewer #2 in reviewing our manuscript. We are confident that our clarifications address the reviewer's concerns.
Reviewer #3 (Public review):
Summary:
Query: In this paper, the authors introduce the Gcoupler software, an open-source deep learning-based platform for structure-guided discovery of ligands targeting GPCR interfaces. Overall, this manuscript represents a field-advancing contribution at the intersection of AI-based ligand discovery and GPCR signaling regulation.
Strengths:
The paper presents a comprehensive and well-structured workflow combining cavity identification, de novo ligand generation, statistical validation, and graph neural network-based classification. Notably, the authors use Gcoupler to identify endogenous intracellular sterols as allosteric modulators of the GPCR-Gα interface in yeast, with experimental validations extending to mammalian systems. The ability to systematically explore intracellular metabolite modulation of GPCR signaling represents a novel and impactful contribution. This study significantly advances the field of GPCR biology and computational ligand discovery.
We thank and appreciate Reviewer #3 for vesting time and efforts in reviewing our manuscript and for appreciating our efforts.
Recommendations for the authors:
Reviewing Editor Comments:
We encourage the authors to address the points raised during revision to elevate the assessment from "incomplete" to "solid" or ideally "convincing." In particular, we ask the authors to improve the justification for their methodological choices and to provide greater detail and clarity regarding each computational layer of the pipeline.
We are grateful for the editors' suggestions. We have incorporated significant revisions into the manuscript, providing comprehensive technical details to prevent any misunderstandings. Furthermore, we meticulously explained every aspect of the computational workflow.
Reviewer #2 (Recommendations for the authors):
Query: Would it be possible to make the package itself pip installable?
Yes, it already exists under the testpip repository and we have now migrated it to the main pip. Please access the link from here: https://pypi.org/project/gcoupler/
Query: I am confused by the binding free energies reported in Supplementary Figure 8. Is the total DG reported that of the protein-ligand complex? If that is the case, the affinities of the ligands would be extremely high. They are also very far off from the reported -7 kcal/mol active/inactive cut-off.
We thank Reviewer #2 for this query. We would like to mention that we have provided a detailed explanation in the point-by-point response to Reviewer #2's original comment. Briefly, to clarify, the -7 kcal/mol active/inactive cutoff mentioned in the manuscript refers specifically to the docking-based binding free energies (ΔG) calculated using AutoDock or AutoDock Vina, which are used for compound classification or validation against the Gcoupler framework.
In contrast, the binding free energies reported in Supplementary Figure 8 are obtained through the MM-GBSA method, which provides a more detailed and physics-based estimate of binding affinity by incorporating solvation and enthalpic contributions. It is well-documented in the literature that MM-GBSA tends to systematically underestimate absolute binding free energies when compared to experimental values (10.2174/1568026616666161117112604; Table 1).
Author response image 4.
Scatter plot comparing the predicted binding affinity calculated by Docking and MM/GBSA methods, against experimental ΔG (10.1007/s10822-023-00499-0)
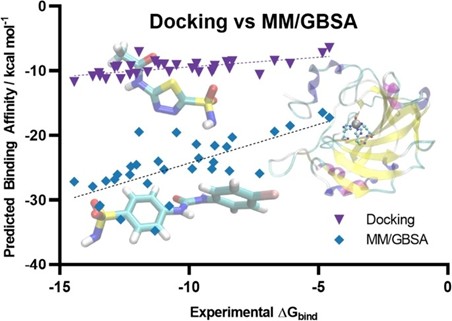
Our use of MM-GBSA is not to match experimental ΔG directly, but rather to assess relative binding preferences among ligands. Despite its limitations in predicting absolute affinities, MM-GBSA is known to perform better than docking for ranking compounds by their binding potential. In this context, an MM-GBSA energy value still reliably indicates stronger predicted binding, even if the numerical values appear extremely higher than typical experimental or docking-derived cutoffs.
Thus, the two energy values, docking-based and MM-GBSA, serve different purposes in our workflow. Docking scores are used for classification and thresholding, while MM-GBSA energies provide post hoc validation and a higher-resolution comparison of binding strength across compounds.
To corroborate their findings, can the authors include direct binding affinity assays for yeast and human Ste2p? This will help in establishing whether the observed phenotypic effects are indeed driven by binding of the metabolites.
We thank Reviewer #2 for raising these insightful questions. During the experimental design phase, we carefully accounted for validating the impact of metabolites in the rescue response by pheromone.
We would like to mention that we performed an array of methods to validate our hypothesis and observed similar rescue effects. These assays include:
a. Cell viability assay (FDA/PI Flourometry- based)
b. Cell growth assay
c. FUN1<sup>TM</sup>-based microscopy assessment
d. Shmoo formation assays
e. Mating assays
f. Site-directed mutagenesis-based loss of function
g. Transgenic reporter-based assay
h. MAPK signaling assessment using Western blot.
i. And via computational techniques.
Concerning the in vitro interaction studies of Ste2p and metabolites, we made significant efforts to purify Ste2p by incorporating a His tag at the N-terminal. Despite dedicated attempts over the past year, we were unsuccessful in purifying the protein, primarily due to our limited expertise in protein purification for this specific system. As a result, we opted for genetic-based interventions (e.g., point mutants), which provide a more physiological and comprehensive approach to demonstrating the interaction between Ste2p and the metabolites.
Furthermore, in addition to the clarification above, we have added the following statement in the discussion section to tone down our claims: “A critical limitation of our study is the absence of direct binding assays to validate the interaction between the metabolites and Ste2p. While our results from genetic interventions, molecular dynamics simulations, and docking studies strongly suggest that the metabolites interact with the Ste2p-Gpa1 interface, these findings remain indirect. Direct binding confirmation through techniques such as surface plasmon resonance, isothermal titration calorimetry, or co-crystallization would provide definitive evidence of this interaction. Addressing this limitation in future work would significantly strengthen our conclusions and provide deeper insights into the precise molecular mechanisms underlying the observed phenotypic effects.”
We request Reviewer #2 to kindly refer to the assays conducted on the point mutants created in this study, as these experiments offer robust evidence supporting our claims.
Did the authors perform expression assays to make sure the mutant proteins were similarly expressed to wt?
We thank reviewer #2 for this comment. We would like to mention that:
(1) In our mutants (S75A, T155D, L289K)-based assays, all mutants were generated using integration at the same chromosomal TRP1 locus under the GAL1 promoter and share the same C-terminal CYC1 terminator sequence used for the reconstituted wild-type (rtWT) construct, thus reducing the likelihood of strain-specific expression differences.
(2) Furthermore, all strains were grown under identical conditions using the same media, temperature, and shaking parameters. Each construct underwent the same GAL1 induction protocol in YPGR medium for identical durations, ensuring uniform transcriptional activation across all strains and minimizing culture-dependent variability in protein expression.
(3) Importantly, both the rtWT and two of the mutants (T155D, L289K) retained α-factor-induced cell death (PI and FUN1-based fluorometry and microscopy; Figure 4c-d) and MAPK activation (western blot; Figure 4e), demonstrating that the mutant proteins are expressed at levels sufficient to support signalling.
Reviewer #3 (Recommendations for the authors):
My comments that would enhance the impact of this method are:
(1) While the authors have compared the accuracy and efficiency of Gcoupler to AutoDock Vina, one of the main points of Gcoupler is the neural network module. It would be beneficial to have it evaluated against other available deep learning ligand generative modules, such as the following: 10.1186/s13321-024-00829-w, 10.1039/D1SC04444C.
Thank you for the observation. To clarify, our benchmarking of Gcoupler’s accuracy and efficiency was performed against AutoDock, not AutoDock Vina. This choice was intentional, as AutoDock is one of the most widely used classical techniques in computer-aided drug design (CADD) for obtaining high-resolution predictions of ligand binding energy, binding poses, and detailed atomic-level interactions with receptor residues. In contrast, AutoDock Vina is primarily optimized for large-scale virtual screening, offering faster results but typically with lower resolution and limited configurational detail.
Since Gcoupler is designed to balance accuracy with computational efficiency in structure-based screening, AutoDock served as a more appropriate reference point for evaluating its predictions.
We agree that benchmarking against other deep learning-based ligand generative tools is important for contextualizing Gcoupler’s capabilities. However, it's worth noting that only a few existing methods focus specifically on cavity- or pocket-driven de novo drug design using generative AI, and among them, most are either partially closed-source or limited in functionality.
While PocketCrafter (10.1186/s13321-024-00829-w) offers a structure-based generative framework, it differs from Gcoupler in several key respects. PocketCrafter requires proprietary preprocessing tools, such as the MOE QuickPrep module, to prepare protein pocket structures, limiting its accessibility and reproducibility. In addition, PocketCrafter’s pipeline stops at the generation of cavity-linked compounds and does not support any further learning from the generated data.
Similarly, DeepLigBuilder (10.1039/D1SC04444C) provides de novo ligand generation using deep learning, but the source code is not publicly available, preventing direct benchmarking or customization. Like PocketCrafter, it also lacks integrated learning modules, which limits its utility for screening large, user-defined libraries or compounds of interest.
Additionally, tools like AutoDesigner from Schrödinger, while powerful, are not publicly accessible and hence fall outside the scope of open benchmarking.
Author response table 1.
Comparison of de novo drug design tools. SBDD refers to Structure-Based Drug Design, and LBDD refers to Ligand-Based Drug Design.
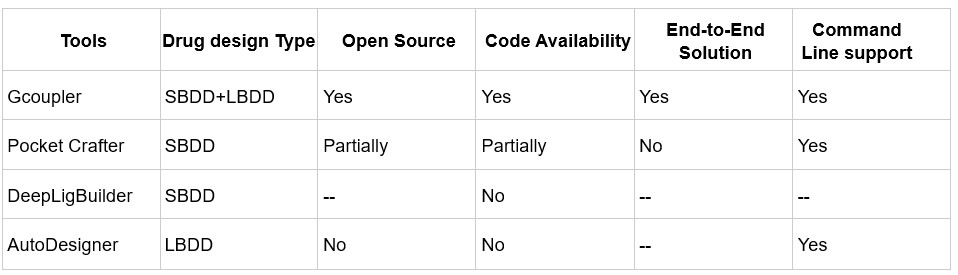
In contrast, Gcoupler is a fully open-source, end-to-end platform that integrates both Ligand-Based and Structure-Based Drug Design. It spans from cavity detection and molecule generation to automated model training using GNNs, allowing users to evaluate and prioritize candidate ligands across large chemical spaces without the need for commercial software or advanced coding expertise.
(2) In Figure 2, the authors mention that IC4 and IC5 potential binding sites are on the direct G protein coupling interface ("This led to the identification of 17 potential surface cavities on Ste2p, with two intracellular regions, IC4 and IC5, accounting for over 95% of the Ste2p-Gpa1p interface (Figure 2a-b, Supplementary Figure 4j-n)..."). Later, however, in Figure 4, when discussing which residues affect the binding of the metabolites the most, the authors didn't perform MD simulations of mutant STE2 and just Gpa1p (without metabolites present). It would be beneficial to compare the binding of G protein with and without metabolites present, as these interface mutations might be affecting the binding of G protein by itself.
Thank you for this insightful suggestion. While we did not perform in silico MD simulations of the mutant Ste2-Gpa1 complex in the absence of metabolites, we conducted experimental validation to functionally assess the impact of interface mutations. Specifically, we generated site-directed mutants (S75A, L289K, T155D) and expressed them in a ste2Δ background to isolate their effects.
As shown in the Supplementary Figure, these mutants failed to rescue cells from α-factor-induced programmed cell death (PCD) upon metabolite pre-treatment. This was confirmed through fluorometry-based viability assays, FUN1<sup>TM</sup> staining, and p-Fus3 signaling analysis, which collectively monitor MAPK pathway activation (Figure 4c–e).
Importantly, the induction of PCD in response to α-factor in these mutants demonstrates that G protein coupling is still functionally intact, indicating that the mutations do not interfere with Gpa1 binding itself. However, the absence of rescue by metabolites strongly suggests that the mutated residues play a direct role in metabolite binding at the Ste2p–Gpa1p interface, thus modulating downstream signaling.
While further MD simulations could provide structural insight into the isolated mutant receptor–G protein interaction, our experimental data supports the functional relevance of metabolite binding at the identified interface.
(3) While the experiments, performed by the authors, do support the hypothesis that metabolites regulate GPCR signaling, there are no experiments evaluating direct biophysical measurements (e.g., dissociation constants are measured only in silicon).
We thank Reviewer #3 for raising these insightful comments. We would like to mention that we performed an array of methods to validate our hypothesis and observed similar rescue effects. These assays include:
a. Cell viability assay (FDA/PI Flourometry- based)
b. Cell growth assay
c. FUN1<sup>TM</sup>-based microscopy assessment
d. Shmoo formation assays
e. Mating assays
f. Site-directed mutagenesis-based loss of function
g. Transgenic reporter-based assay
h. MAPK signaling assessment using Western blot.
i. And via computational techniques.
Concerning the direct biophysical measurements of Ste2p and metabolites, we made significant efforts to purify Ste2p by incorporating a His tag at the N-terminal, with the goal of performing Microscale Thermophoresis (MST) and Isothermal Titration Calorimetry (ITC) measurements. Despite dedicated attempts over the past year, we were unsuccessful in purifying the protein, primarily due to our limited expertise in protein purification for this specific system. As a result, we opted for genetic-based interventions (e.g., point mutants), which provide a more physiological and comprehensive approach to demonstrating the interaction between Ste2p and the metabolites.
Furthermore, in addition to the clarification above, we have added the following statement in the discussion section to tone down our claims: “A critical limitation of our study is the absence of direct binding assays to validate the interaction between the metabolites and Ste2p. While our results from genetic interventions, molecular dynamics simulations, and docking studies strongly suggest that the metabolites interact with the Ste2p-Gpa1 interface, these findings remain indirect. Direct binding confirmation through techniques such as surface plasmon resonance, isothermal titration calorimetry, or co-crystallization would provide definitive evidence of this interaction. Addressing this limitation in future work would significantly strengthen our conclusions and provide deeper insights into the precise molecular mechanisms underlying the observed phenotypic effects.”
(4) The authors do not discuss the effects of the metabolites at their physiological concentrations. Overall, this manuscript represents a field-advancing contribution at the intersection of AI-based ligand discovery and GPCR signaling regulation.
We thank reviewer #3 for this comment and for recognising the value of our work. Although direct quantification of intracellular free metabolite levels is challenging, several lines of evidence support the physiological relevance of our test concentrations.
- Genetic validation supports endogenous relevance: Our genetic screen of 53 metabolic knockout mutants showed that deletions in biosynthetic pathways for these metabolites consistently disrupted the α-factor-induced cell death, with the vast majority of strains (94.4%) resisting the α-factor-induced cell death, and notably, a subset even displayed accelerated growth in the presence of α‑factor. This suggests that endogenous levels of these metabolites normally provide some degree of protection, supporting their physiological role in GPCR regulation.
- Metabolomics confirms in vivo accumulation: Our untargeted metabolomics analysis revealed that α-factor-treated survivors consistently showed enrichment of CoQ6 and zymosterol compared to sensitive cells. This demonstrates that these metabolites naturally accumulate to protective levels during stress responses, validating their biological relevance.
Come up with at least two different theoretical sets of rules (recommendation algorithms) for what would make a “good” social media post to recommend.
A post should be shown to a user if they have designated in a list selection that those kinds of posts are something they want to see. If a video falls outside those parameters hide it from them.
Show a post to a user if it is similar to posts that they have interacted with in the past. In either subject, tag, creator, etc.
ethical discipline
here, and again below, it is "ethical disciple" not "discipline" that translates tshul khrims/ śīla. So please make the glossary entry tag the whole term "ethical discipline"
We have to remember to add Google Tag Manager and any other tags back on these pages before launch.
Author response:
The following is the authors’ response to the original reviews.
Responses to Reviewer’s Comments:
To Reviewer #2:
(1) The use of two m<sup>5</sup>C reader proteins is likely a reason for the high number of edits introduced by the DRAM-Seq method. Both ALYREF and YBX1 are ubiquitous proteins with multiple roles in RNA metabolism including splicing and mRNA export. It is reasonable to assume that both ALYREF and YBX1 bind to many mRNAs that do not contain m<sup>5</sup>C.
To substantiate the author's claim that ALYREF or YBX1 binds m<sup>5</sup>C-modified RNAs to an extent that would allow distinguishing its binding to non-modified RNAs from binding to m<sup>5</sup>Cmodified RNAs, it would be recommended to provide data on the affinity of these, supposedly proven, m<sup>5</sup>C readers to non-modified versus m<sup>5</sup>C-modified RNAs. To do so, this reviewer suggests performing experiments as described in Slama et al., 2020 (doi: 10.1016/j.ymeth.2018.10.020). However, using dot blots like in so many published studies to show modification of a specific antibody or protein binding, is insufficient as an argument because no antibody, nor protein, encounters nanograms to micrograms of a specific RNA identity in a cell. This issue remains a major caveat in all studies using so-called RNA modification reader proteins as bait for detecting RNA modifications in epitranscriptomics research. It becomes a pertinent problem if used as a platform for base editing similar to the work presented in this manuscript.
The authors have tried to address the point made by this reviewer. However, rather than performing an experiment with recombinant ALYREF-fusions and m<sup>5</sup>C-modified to unmodified RNA oligos for testing the enrichment factor of ALYREF in vitro, the authors resorted to citing two manuscripts. One manuscript is cited by everybody when it comes to ALYREF as m<sup>5</sup>C reader, however none of the experiments have been repeated by another laboratory. The other manuscript is reporting on YBX1 binding to m<sup>5</sup>C-containing RNA and mentions PARCLiP experiments with ALYREF, the details of which are nowhere to be found in doi: 10.1038/s41556-019-0361-y.
Furthermore, the authors have added RNA pull-down assays that should substitute for the requested experiments. Interestingly, Figure S1E shows that ALYREF binds equally well to unmodified and m<sup>5</sup>C-modified RNA oligos, which contradicts doi:10.1038/cr.2017.55, and supports the conclusion that wild-type ALYREF is not specific m<sup>5</sup>C binder. The necessity of including always an overexpression of ALYREF-mut in parallel DRAM experiments, makes the developed method better controlled but not easy to handle (expression differences of the plasmid-driven proteins etc.)
Thank you for pointing this out. First, we would like to correct our previous response: the binding ability of ALYREF to m<sup>5</sup>C-modified RNA was initially reported in doi: 10.1038/cr.2017.55, (and not in doi: 10.1038/s41556-019-0361-y), where it was observed through PAR-CLIP analysis that the K171 mutation weakens its binding affinity to m<sup>5</sup>C -modified RNA.
Our previous experimental approach was not optimal: the protein concentration in the INPUT group was too high, leading to overexposure in the experimental group. Additionally, we did not conduct a quantitative analysis of the results at that time. In response to your suggestion, we performed RNA pull-down experiments with YBX1 and ALYREF, rather than with the pan-DRAM protein, to better validate and reproduce the previously reported findings. Our quantitative analysis revealed that both ALYREF and YBX1 exhibit a stronger affinity for m<sup>5</sup>C -modified RNAs. Furthermore, mutating the key amino acids involved in m<sup>5</sup>C recognition significantly reduced the binding affinity of both readers. These results align with previous studies (doi: 10.1038/cr.2017.55 and doi: 10.1038/s41556-019-0361-y), confirming that ALYREF and YBX1 are specific readers of m<sup>5</sup>C -modified RNAs. However, our detection system has certain limitations. Despite mutating the critical amino acids, both readers retained a weak binding affinity for m<sup>5</sup>C, suggesting that while the mutation helps reduce false positives, it is still challenging to precisely map the distribution of m<sup>5</sup>C modifications. To address this, we plan to further investigate the protein structure and function to obtain a more accurate m<sup>5</sup>C sequencing of the transcriptome in future studies. Accordingly, we have updated our results and conclusions in lines 294-299 and discuss these limitations in lines 109114.
In addition, while the m<sup>5</sup>C assay can be performed using only the DRAM system alone, comparing it with the DRAM<sup>mut</sup> control enhances the accuracy of m<sup>5</sup>C region detection. To minimize the variations in transfection efficiency across experimental groups, it is recommended to use the same batch of transfections. This approach not only ensures more consistent results but also improve the standardization of the DRAM assay, as discussed in the section added on line 308-312.
(2) Using sodium arsenite treatment of cells as a means to change the m<sup>5</sup>C status of transcripts through the downregulation of the two major m<sup>5</sup>C writer proteins NSUN2 and NSUN6 is problematic and the conclusions from these experiments are not warranted. Sodium arsenite is a chemical that poisons every protein containing thiol groups. Not only do NSUN proteins contain cysteines but also the base editor fusion proteins. Arsenite will inactivate these proteins, hence the editing frequency will drop, as observed in the experiments shown in Figure 5, which the authors explain with fewer m<sup>5</sup>C sites to be detected by the fusion proteins.
The authors have not addressed the point made by this reviewer. Instead the authors state that they have not addressed that possibility. They claim that they have revised the results section, but this reviewer can only see the point raised in the conclusions. An experiment would have been to purify base editors via the HA tag and then perform some kind of binding/editing assay in vitro before and after arsenite treatment of cells.
We appreciate the reviewer’s insightful comment. We fully agree with the concern raised. In the original manuscript, our intention was to use sodium arsenite treatment to downregulate NSUN mediated m<sup>5</sup>C levels and subsequently decrease DRAM editing efficiency, with the aim of monitoring m<sup>5</sup>C dynamics through the DRAM system. However, as the reviewer pointed out, sodium arsenite may inactivate both NSUN proteins and the base editor fusion proteins, and any such inactivation would likely result in a reduced DRAM editing.
This confounds the interpretation of our experimental data.
As demonstrated in Author response image 1A, western blot analysis confirmed that sodium arsenite indeed decreased the expression of fusion proteins. In addition, we attempted in vitro fusion protein purificationusing multiple fusion tags (HIS, GST, HA, MBP) for DRAM fusion protein expression, but unfortunately, we were unable to obtain purified proteins. However, using the Promega TNT T7 Rapid Coupled In Vitro Transcription/Translation Kit, we successfully purified the DRAM protein (Author response image 1B). Despite this success, subsequent in vitro deamination experiments did not yield the expected mutation results (Author response image 1C), indicating that further optimization is required. This issue is further discussed in line 314-315.
Taken together, the above evidence supports that the experiment of sodium arsenite treatment was confusing and we determined to remove the corresponding results from the main text of the revised manuscript.
Author response image 1.
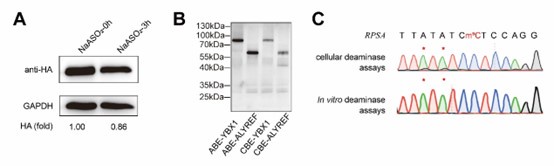
(3) The authors should move high-confidence editing site data contained in Supplementary Tables 2 and 3 into one of the main Figures to substantiate what is discussed in Figure 4A. However, the data needs to be visualized in another way then excel format. Furthermore, Supplementary Table 2 does not contain a description of the columns, while Supplementary Table 3 contains a single row with letters and numbers.
The authors have not addressed the point made by this reviewer. Figure 3F shows the screening process for DRAM-seq assays and principles for screening highconfidence genes rather than the data contained in Supplementary Tables 2 and 3 of the former version of this manuscript.
Thank you for your valuable suggestion. We have visualized the data from Supplementary Tables 2 and 3 in Figure 4A as a circlize diagram (described in lines 213-216), illustrating the distribution of mutation sites detected by the DRAM system across each chromosome. Additionally, to improve the presentation and clarity of the data, we have revised Supplementary Tables 2 and 3 by adding column descriptions, merging the DRAM-ABE and DRAM-CBE sites, and including overlapping m<sup>5</sup>C genes from previous datasets.
Responses to Reviewer’s Comments:
To Reviewer #3:
The authors have again tried to address the former concern by this reviewer who questioned the specificity of both m<sup>5</sup>C reader proteins towards modified RNA rather than unmodified RNA. The authors chose to do RNA pull down experiments which serve as a proxy for proving the specificity of ALYREF and YBX1 for m<sup>5</sup>C modified RNAs. Even though this reviewer asked for determining the enrichment factor of the reader-base editor fusion proteins (as wildtype or mutant for the identified m<sup>5</sup>C specificity motif) when presented with m<sup>5</sup>C-modified RNAs, the authors chose to use both reader proteins alone (without the fusion to an editor) as wildtype and as respective m<sup>5</sup>C-binding mutant in RNA in vitro pull-down experiments along with unmodified and m<sup>5</sup>C-modified RNA oligomers as binding substrates. The quantification of these pull-down experiments (n=2) have now been added, and are revealing that (according to SFigure 1 E and G) YBX1 enriches an RNA containing a single m<sup>5</sup>C by a factor of 1.3 over its unmodified counterpart, while ALYREF enriches by a factor of 4x. This is an acceptable approach for educated readers to question the specificity of the reader proteins, even though the quantification should be performed differently (see below).
Given that there is no specific sequence motif embedding those cytosines identified in the vicinity of the DRAM-edits (Figure 3J and K), even though it has been accepted by now that most of the m<sup>5</sup>C sites in mRNA are mediated by NSUN2 and NSUN6 proteins, which target tRNA like substrate structures with a particular sequence enrichment, one can conclude that DRAM-Seq is uncovering a huge number of false positives. This must be so not only because of the RNA bisulfite seq data that have been extensively studied by others, but also by the following calculations: Given that the m<sup>5</sup>C/C ratio in human mRNA is 0.02-0.09% (measured by mass spec) and assuming that 1/4 of the nucleotides in an average mRNA are cytosines, an mRNA of 1.000 nucleotides would contain 250 Cs. 0.02- 0.09% m<sup>5</sup>C/C would then translate into 0.05-0.225 methylated cytosines per 250 Cs in a 1000 nt mRNA. YBX1 would bind every C in such an mRNA since there is no m<sup>5</sup>C to be expected, which it could bind with 1.3 higher affinity. Even if the mRNAs would be 10.000 nt long, YBX1 would bind to half a methylated cytosine or 2.25 methylated cytosines with 1.3x higher affinity than to all the remaining cytosines (2499.5 to 2497.75 of 2.500 cytosines in 10.000 nt, respectively). These numbers indicate a 4999x to 1110x excess of cytosine over m<sup>5</sup>C in any substrate RNA, which the "reader" can bind as shown in the RNA pull-downs on unmodified RNAs. This reviewer spares the reader of this review the calculations for ALYREF specificity, which is slightly higher than YBX1. Hence, it is up to the capable reader of these calculations to follow the claim that this minor affinity difference allows the unambiguous detection of the few m<sup>5</sup>C sites in mRNA be it in the endogenous scenario of a cell or as fusion-protein with a base editor attached?
We sincerely appreciate the reviewer’s rigorous analysis. We would like to clarify that in our RNA pulldown assays, we indeed utilized the full DRAM system (reader protein fused to the base editor) to reflect the specificity of m<sup>5</sup>C recognition. As previously suggested by the reviewer, to independently validate the m<sup>5</sup>C-binding specificity of ALYREF and YBX1, we performed separate pulldown experiments with wild-type and mutant reader proteins (without the base editor fusion) using both unmodified and m<sup>5</sup>C-modified RNA substrates. This approach aligns with established methodologies in the field (doi:10.1038/cr.2017.55 and doi: 10.1038/s41556-019-0361-y). We have revised the Methods section (line 230) to explicitly describe this experimental design.
Although the m<sup>5</sup>C/C ratios in LC/MS-assayed mRNA are relatively low (ranging from 0.02% to 0.09%), as noted by the reviewer, both our data and previous studies have demonstrated that ALYREF and YBX1 preferentially bind to m<sup>5</sup>C-modified RNAs over unmodified RNAs, exhibiting 4-fold and 1.3-fold enrichment, respectively (Supplementary Figure 1E–1G). Importantly, this specificity is further enhanced in the DRAM system through two key mechanisms: first, the fusion of reader proteins to the deaminase restricts editing to regions near m<sup>5</sup>C sites, thereby minimizing off-target effects; second, background editing observed in reader-mutant or deaminase controls (e.g., DRAM<sup>mut</sup>-CBE in Figure 2D) is systematically corrected for during data analysis.
We agree that the theoretical challenge posed by the vast excess of unmodified cytosines. However, our approach includes stringent controls to alleviate this issue. Specifically, sites identified in NSUN2/NSUN6 knockout cells or reader-mutant controls are excluded (Figure 3F), which significantly reduces the number of false-positive detections. Additionally, we have observed deamination changes near high-confidence m<sup>5</sup>C methylation sites detected by RNA bisulfite sequencing, both in first-generation and high-throughput sequencing data. This observation further substantiates the validity of DRAM-Seq in accurately identifying m<sup>5</sup>C sites.
We fully acknowledge that residual false positives may persist due to the inherent limitations of reader protein specificity, as discussed in line 299-301 of our manuscript. To address this, we plan to optimize reader domains with enhanced m<sup>5</sup>C binding (e.g., through structure-guided engineering), which is also previously implemented in the discussion of the manuscript.
The reviewer supports the attempt to visualize the data. However, the usefulness of this Figure addition as a readable presentation of the data included in the supplement is up to debate.
Thank you for your kind suggestion. We understand the reviewer's concern regarding data visualization. However, due to the large volume of DRAM-seq data, it is challenging to present each mutation site and its characteristics clearly in a single figure. Therefore, we chose to categorize the data by chromosome, which not only allows for a more organized presentation of the DRAM-seq data but also facilitates comparison with other database entries. Additionally, we have updated Supplementary Tables 2 and 3 to provide comprehensive information on the mutation sites. We hope that both the reviewer and editors will understand this approach. We will, of course, continue to carefully consider the reviewer's suggestions and explore better ways to present these results in the future.
(3) A set of private Recommendations for the Authors that outline how you think the science and its presentation could be strengthened
NEW COMMENTS to TEXT:
Abstract:
"5-Methylcytosine (m<sup>5</sup>C) is one of the major post-transcriptional modifications in mRNA and is highly involved in the pathogenesis of various diseases."
In light of the increasing use of AI-based writing, and the proof that neither DeepSeek nor ChatGPT write truthfully statements if they collect metadata from scientific abstracts, this sentence is utterly misleading.
m<sup>5</sup>C is not one of the major post-transcriptional modifications in mRNA as it is only present with a m<sup>5</sup>C/C ratio of 0.02- 0.09% as measured by mass-spec. Also, if m<sup>5</sup>C is involved in the pathogenesis of various diseases, it is not through mRNA but tRNA. No single published work has shown that a single m<sup>5</sup>C on an mRNA has anything to do with disease. Every conclusion that is perpetuated by copying the false statements given in the many reviews on the subject is based on knock-out phenotypes of the involved writer proteins. This reviewer wishes that the authors would abstain from the common practice that is currently flooding any scientific field through relentless repetitions in the increasing volume of literature which perpetuate alternative facts.
We sincerely appreciate the reviewer’s insightful comments. While we acknowledge that m<sup>5</sup>C is not the most abundant post-transcriptional modification in mRNA, we believe that research into m<sup>5</sup>C modification holds considerable value. Numerous studies have highlighted its role in regulating gene expression and its potential contribution to disease progression. For example, recent publications have demonstrated that m<sup>5</sup>C modifications in mRNA can influence cancer progression, lipid metabolism, and other pathological processes (e.g., PMID: 37845385; 39013911; 39924557; 38042059; 37870216).
We fully agree with the reviewer on the importance of maintaining scientific rigor in academic writing. While m<sup>5</sup>C is not the most abundant RNA modification, we cannot simply draw a conclusion that the level of modification should be the sole criterion for assessing its biological significance. However, to avoid potential confusion, we have removed the word “major”.
COMMENTS ON FIGURE PRESENTATION:
Figure 2D:
The main text states: "DRAM-CBE induced C to U editing in the vicinity of the m<sup>5</sup>C site in AP5Z1 mRNA, with 13.6% C-to-U editing, while this effect was significantly reduced with APOBEC1 or DRAM<sup>mut</sup>-CBE (Fig.2D)." The Figure does not fit this statement. The seq trace shows a U signal of about 1/3 of that of C (about 30%), while the quantification shows 20+ percent
Thank you for your kind suggestion. Upon visual evaluation, the sequencing trace in the figure appears to suggest a mutation rate closer to 30% rather than 22%. However, relying solely on the visual interpretation of sequencing peaks is not a rigorous approach. The trace on the left represents the visualization of Sanger sequencing results using SnapGene, while the quantification on the right is derived from EditR 1.0.10 software analysis of three independent biological replicates. The C-to-U mutation rates calculated were 22.91667%, 23.23232%, and 21.05263%, respectively. To further validate this, we have included the original EditR analysis of the Sanger sequencing results for the DRAM-CBE group used in the left panel of Figure 2D (see Author response image 2). This analysis confirms an m<sup>5</sup>C fraction (%) of 22/(22+74) = 22.91667, and the sequencing trace aligns well with the mutation rate we reported in Figure 2D. In conclusion, the data and conclusions presented in Figure 2D are consistent and supported by the quantitative analysis.
Author response image 2.
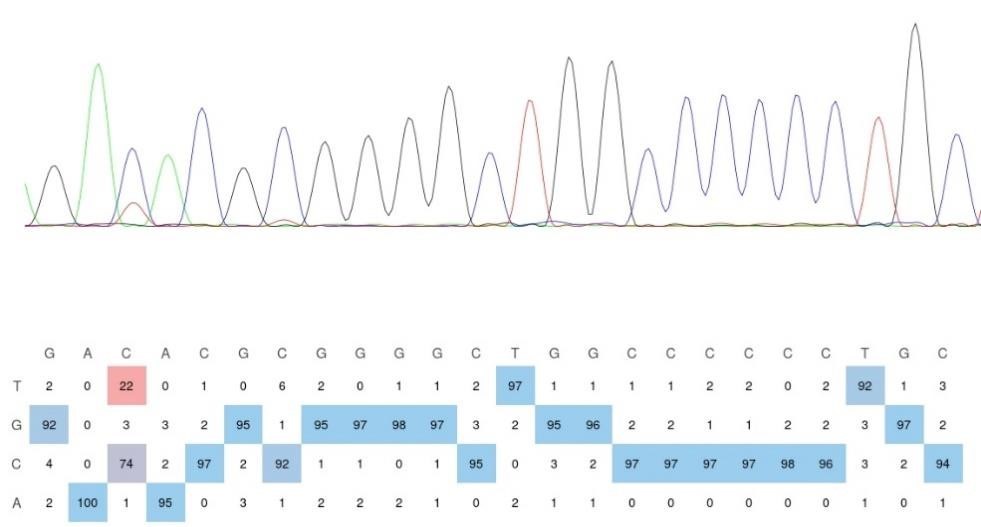
Figure 4B: shows now different numbers in Venn-diagrams than in the same depiction, formerly Figure 4A
We sincerely thank the reviewer for pointing out this issue, and we apologize for not clearly indicating the changes in the previous version of the manuscript. In response to the initial round of reviewer comments, we implemented a more stringent data filtering process (as described in Figure 3F and method section) : "For high-confidence filtering, we further adjusted the parameters of Find_edit_site.pl to include an edit ratio of 10%–60%, a requirement that the edit ratio in control samples be at least 2-fold higher than in NSUN2 or NSUN6knockout samples, and at least 4 editing events at a given site." As a result, we made minor adjustments to the Venn diagram data in Figure 4A, reducing the total number of DRAM-edited mRNAs from 11,977 to 10,835. These changes were consistently applied throughout the manuscript, and the modifications have been highlighted for clarity. Importantly, these adjustments do not affect any of the conclusions presented in the manuscript.
Figure 4B and D: while the overlap of the DRAM-Seq data with RNA bisulfite data might be 80% or 92%, it is obvious that the remaining data DRAM seq suggests a detection of additional sites of around 97% or 81.83%. It would be advised to mention this large number of additional sites as potential false positives, unless these data were normalized to the sites that can be allocated to NSUN2 and NSUN6 activity (NSUN mutant data sets could be substracted).
Thank you for pointing this out. The Venn diagrams presented in Figure 4B and D already reflect the exclusion of potential false-positive sites identified in methyltransferasedeficient datasets, as described in our experimental filtering process, and they represent the remaining sites after this stringent filtering. However, we acknowledge that YBX1 and ALYREF, while preferentially binding to m<sup>5</sup>C-modified RNA, also exhibit some affinity for unmodified RNA. Although we employed rigorous controls, including DRAM<sup>mut</sup> and deaminase groups, to minimize false positives, the possibility of residual false positives cannot be entirely ruled out. Addressing this limitation would require even more stringent filtering methods, as discussed in lines 299–301 of the manuscript. We are committed to further optimizing the DRAM system to enhance the accuracy of transcriptome-wide m<sup>5</sup>C analysis in future studies.
SFigure 1: It is clear that the wild type version of both reader proteins are robustly binding to RNA that does not contain m<sup>5</sup>C. As for the calculations of x-fold affinity loss of RNA binding using both ALYREF -mut or YBX1 -mut, this reviewer asks the authors to determine how much less the mutated versions of the proteins bind to a m<sup>5</sup>C-modified RNAs. Hence, a comparison of YBX1 versus YBX1 -mut (ALYREF versus ALYREF -mut) on the same substrate RNA with the same m<sup>5</sup>C-modified position would allow determining the contribution of the so-called modification binding pocket in the respective proteins to their RNA binding. The way the authors chose to show the data presently is misleading because what is compared is the binding of either the wild type or the mutant protein to different RNAs.
We appreciate the reviewer’s valuable feedback and apologize for any confusion caused by the presentation of our data. We would like to clarify the rationale behind our approach. The decision to present the wild-type and mutant reader proteins in separate panels, rather than together, was made in response to comments from Reviewer 2. Below, we provide a detailed explanation of our experimental design and its justification.
First, we confirmed that YBX1 and ALYREF exhibit stronger binding affinity to m<sup>5</sup>Cmodified RNA compared to unmodified RNA, establishing their role as m<sup>5</sup>C reader proteins. Next, to validate the functional significance of the DRAM<sup>mut</sup> group, we demonstrated that mutating key amino acids in the m<sup>5</sup>C-binding pocket significantly reduces the binding affinity of YBX1<sup>mut</sup> and ALYREF<sup>mut</sup> to m<sup>5</sup>C-modified RNA. This confirms that the DRAM<sup>mut</sup> group effectively minimizes false-positive results by disrupting specific m<sup>5</sup>C interactions.
Crucially, in our pull-down experiments, both the wild-type and mutant proteins (YBX1/YBX1<sup>mut</sup> and ALYREF/ALYREF<sup>mut</sup>) were incubated with the same RNA sequences. To avoid any ambiguity, we have included the specific RNA sequence information in the Methods section (lines 463–468). This ensures a assessment of the reduced binding affinity of the mutant versions relative to the wild-type proteins, even though they are presented in separate panels.
We hope this explanation clarifies our approach and demonstrates the robustness of our findings. We sincerely appreciate the reviewer’s understanding and hope this addresses their concerns.
SFigure 2C: first two panels are duplicates of the same image.
Thank you for pointing this out. We sincerely apologize for incorrectly duplicating the images. We have now updated Supplementary Figure 2C with the correct panels and have provided the original flow cytometry data for the first two images. It is important to note that, as demonstrated by the original data analysis, the EGFP-positive quantification values (59.78% and 59.74%) remain accurate. Therefore, this correction does not affect the conclusions of our study. Thank you again for bringing this to our attention.
Author response image 3.
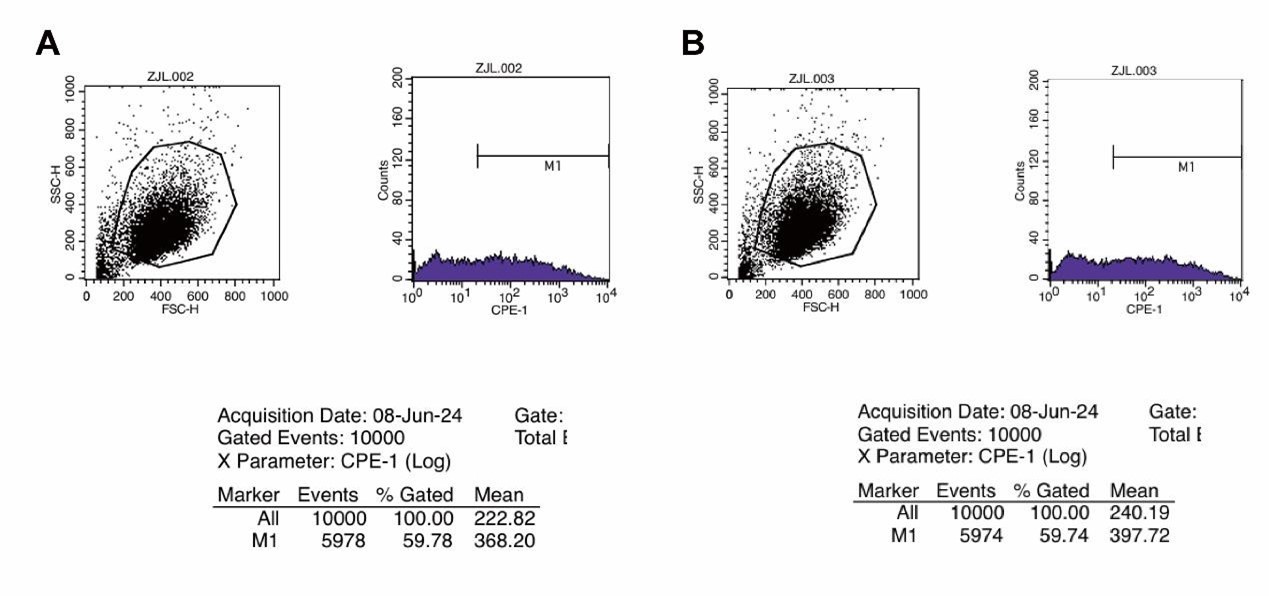
SFigure 4B: how would the PCR product for NSUN6 be indicative of a mutation? The used primers seem to amplify the wildtype sequence.
Thank you for your kind suggestion. In our NSUN6<sup>-/-</sup> cell line, the NSUN6 gene is only missing a single base pair (1bp) compared to the wildtype, which results in frame shift mutation and reduction in NSUN6 protein expression. We fully agree with the reviewer that the current PCR gel electrophoresis does not provide a clear distinction of this 1bp mutation. To better illustrate our experimental design, we have included a schematic representation of the knockout sequence in SFigure 4B. Additionally, we have provided the original sequencing data, and the corresponding details have been added to lines 151-153 of the manuscript for further clarification.
Author response image 4.
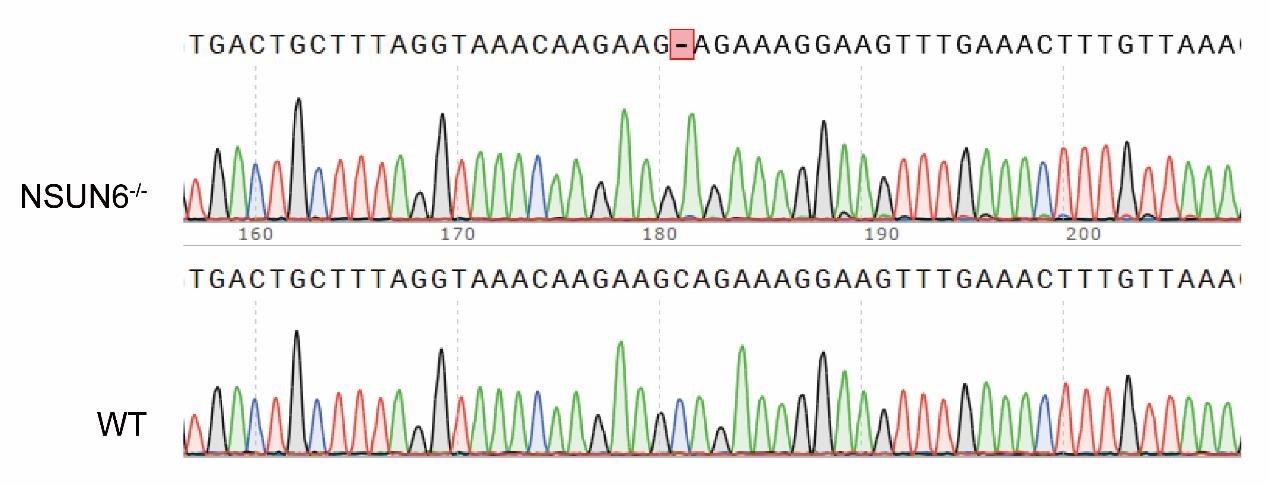
SFigure 4C: the Figure legend is insufficient to understand the subfigure.
Thank you for your valuable suggestion. To improve clarity, we have revised the figure legend for SFigure 4C, as well as the corresponding text in lines 178-179. We have additionally updated the title of SFigure 4 for better clarity. The updated SFigure 4C now demonstrates that the DRAM-edited mRNAs exhibit a high degree of overlap across the three biological replicates.
SFigure 4D: the Figure legend is insufficient to understand the subfigure.
Thank you for your kind suggestion. We have revised the figure legend to provide a clearer explanation of the subfigure. Specifically, this figure illustrates the motif analysis derived from sequences spanning 10 nucleotides upstream and downstream of DRAMedited sites mediated by loci associated with NSUN2 or NSUN6. To enhance clarity, we have also rephrased the relevant results section (lines 169-175) and the corresponding discussion (lines 304-307).
SFigure 7: There is something off with all 6 panels. This reviewer can find data points in each panel that do not show up on the other two panels even though this is a pairwise comparison of three data sets (file was sent to the Editor) Available at https://elife-rp.msubmit.net/elife-rp_files/2025/01/22/00130809/02/130809_2_attach_27_15153.pdf
Response: We thank the reviewer for pointing this out. We would like to clarify the methodology behind this analysis. In this study, we conducted pairwise comparisons of the number of DRAM-edited sites per gene across three biological replicates of DRAM-ABE or DRAM-CBE, visualized as scatterplots. Each data point in the plots corresponds to a gene, and while the same gene is represented in all three panels, its position may vary vertically or horizontally across the panels. This variation arises because the number of mutation sites typically differs between replicates, making it unlikely for a data point to occupy the exact same position in all panels. A similar analytical approach has been used in previous studies on m6A (PMID: 31548708). To address the reviewer’s concern, we have annotated the corresponding positions of the questioned data points with arrows in Author response image 5.
Author response image 5.
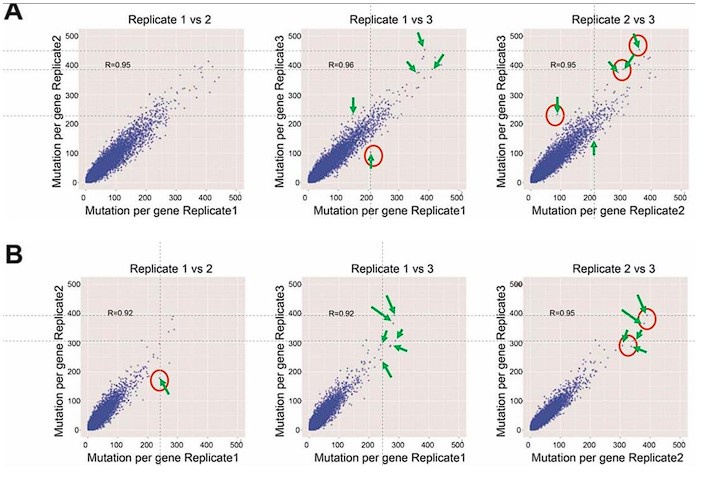
Author response:
The following is the authors’ response to the previous reviews.
Public Reviews:
Reviewer #1 (Public review):
Summary:
In their manuscript entitled 'The domesticated transposon protein L1TD1 associates with its ancestor L1 ORF1p to promote LINE-1 retrotransposition', Kavaklıoğlu and colleagues delve into the role of L1TD1, an RNA binding protein (RBP) derived from a LINE1 transposon. L1TD1 proves crucial for maintaining pluripotency in embryonic stem cells and is linked to cancer progression in germ cell tumors, yet its precise molecular function remains elusive. Here, the authors uncover an intriguing interaction between L1TD1 and its ancestral LINE-1 retrotransposon.
The authors delete the DNA methyltransferase DNMT1 in a haploid human cell line (HAP1), inducing widespread DNA hypo-methylation. This hypomethylation prompts abnormal expression of L1TD1. To scrutinize L1TD1's function in a DNMT1 knock-out setting, the authors create DNMT1/L1TD1 double knock-out cell lines (DKO). Curiously, while the loss of global DNA methylation doesn't impede proliferation, additional depletion of L1TD1 leads to DNA damage and apoptosis.
To unravel the molecular mechanism underpinning L1TD1's protective role in the absence of DNA methylation, the authors dissect L1TD1 complexes in terms of protein and RNA composition. They unveil an association with the LINE-1 transposon protein L1-ORF1 and LINE-1 transcripts, among others.
Surprisingly, the authors note fewer LINE-1 retro-transposition events in DKO cells compared to DNMT1 KO alone.
Strengths:
The authors present compelling data suggesting the interplay of a transposon-derived human RNA binding protein with its ancestral transposable element. Their findings spur interesting questions for cancer types, where LINE1 and L1TD1 are aberrantly expressed.
Weaknesses:
Suggestions for refinement:
The initial experiment, inducing global hypo-methylation by eliminating DNMT1 in HAP1 cells, is intriguing and warrants more detailed description. How many genes experience misregulation or aberrant expression? What phenotypic changes occur in these cells? Why did the authors focus on L1TD1? Providing some of this data would be helpful to understand the rationale behind the thorough analysis of L1TD1.
The finding that L1TD1/DNMT1 DKO cells exhibit increased apoptosis and DNA damage but decreased L1 retro-transposition is unexpected. Considering the DNA damage associated with retro-transposition and the DNA damage and apoptosis observed in L1TD1/DNMT1 DKO cells, one would anticipate the opposite outcome. Could it be that the observation of fewer transposition-positive colonies stems from the demise of the most transpositionpositive colonies? Further exploration of this phenomenon would be intriguing.
Reviewer #2 (Public review):
In this study, Kavaklıoğlu et al. investigated and presented evidence for a role for domesticated transposon protein L1TD1 in enabling its ancestral relative, L1 ORF1p, to retrotranspose in HAP1 human tumor cells. The authors provided insight into the molecular function of L1TD1 and shed some clarifying light on previous studies that showed somewhat contradictory outcomes surrounding L1TD1 expression. Here, L1TD1 expression was correlated with L1 activation in a hypomethylation dependent manner, due to DNMT1 deletion in HAP1 cell line. The authors then identified L1TD1 associated RNAs using RIPSeq, which display a disconnect between transcript and protein abundance (via Tandem Mass Tag multiplex mass spectrometry analysis). The one exception was for L1TD1 itself, is consistent with a model in which the RNA transcripts associated with L1TD1 are not directly regulated at the translation level. Instead, the authors found L1TD1 protein associated with L1-RNPs and this interaction is associated with increased L1 retrotransposition, at least in the contexts of HAP1 cells. Overall, these results support a model in which L1TD1 is restrained by DNA methylation, but in the absence of this repressive mark, L1TD1 is expression, and collaborates with L1 ORF1p (either directly or through interaction with L1 RNA, which remains unclear based on current results), leads to enhances L1 retrotransposition. These results establish feasibility of this relationship existing in vivo in either development or disease, or both.
Comments on revised version:
In general, the authors did an acceptable job addressing the major concerns throughout the manuscript. This revision is much clearer and has improved in terms of logical progression.
Recommendations for the authors:
Reviewer #1 (Recommendations for the authors):
The authors have addressed all my questions in the revised version of the manuscript.
Reviewer #2 (Recommendations for the authors):
Revised comments:
A few points we'd like to see addressed are our comments about the model (Figure S7C), as this is important for the readership to understand this complex finding. Please try to apply some quantification, if possible (question 8). Please do your best to tone down the direct relationship of these findings to embryology (question 11). Based on both reviewer comments, we believe addressing reviewer #1s "Suggestions for refinement" (2 points), would help us change our view of solid to convincing.
Responses to changes:
Major
(1) The study only used one knockout (KO) cell line generated by CRISPR/Cas9.
Considering the possibility of an off-target effect, I suggest the authors attempt one or both of these suggestions.
A) Generate or acquire a similar DMNT1 deletion that uses distinct sgRNAs, so that the likelihood of off-targets is negligible. A few simple experiments such as qRT-PCR would be sufficient to suggest the same phenotype.
B) Confirm the DNMT1 depletion also by siRNA/ASO KD to phenocopy the KO effect.
(2) In addition to the strategies to demonstrate reproducibility, a rescue experiment restoring DNMT1 to the KO or KD cells would be more convincing. (Partial rescue would suffice in this case, as exact endogenous expression levels may be hard to replicate).
We have undertook several approaches to study the effect of DNMT1 loss or inactivation: As described above, we have generated a conditional KO mouse with ablation of DNMT1 in the epidermis. DNMT1-deficient keratinocytes isolated from these mice show a significant increase in L1TD1 expression. In addition, treatment of primary human keratinocytes and two squamous cell carcinoma cell lines with the DNMT inhibitor aza-deoxycytidine led to upregulation of L1TD1 expression. Thus, the derepression of L1TD1 upon loss of DNMT1 expression or activity is not a clonal effect.
Also, the spectrum of RNAs identified in RIP experiments as L1TD1-associated transcripts in HAP1 DNMT1 KO cells showed a strong overlap with the RNAs isolated by a related yet different method in human embryonic stem cells. When it comes to the effect of L1TD1 on L1-1 retrotranspostion, a recent study has reported a similar effect of L1TD1 upon overexpression in HeLa cells [4].
All of these points together help to convince us that our findings with HAP1 DNMT KO are in agreement with results obtained in various other cell systems and are therefore not due to off-target effects. With that in mind, we would pursue the suggestion of Reviewer 1 to analyze the effects of DNA hypomethylation upon DNMT1 ablation.
Thank you for addressing this concern. The reference to Beck 2021 and the additional cells lines (R2: keratinocytes and R3: squamous cell carcinoma) provides sufficient evidence that this result is unlikely to be a result of clonal expansion or off targets.
Question: Was the human ES Cell RIP Experiment shown here? What is the overlap?
We refer to the recently published study by Jin et al. (PMID: 38165001). As stated in the Discussion, the majority of L1TD1-associated transcripts in HAP1 cells (69%) identified in our study were also reported as L1TD1 targets in hESCs suggesting a conserved binding affinity of this domesticated transposon protein across different cell types.
(3) As stated in the introduction, L1TD1 and ORF1p share "sequence resemblance" (Martin 2006). Is the L1TD1 antibody specific or do we see L1 ORF1p if Fig 1C were uncropped?
(6) Is it possible the L1TD1 antibody binds L1 ORF1p? This could make Figure 2D somewhat difficult to interpret. Some validation of the specificity of the L1TD1 antibody would remove this concern (see minor concern below).
This is a relevant question. We are convinced that the L1TD1 antibody does not crossreact with L1 ORF1p for the following reasons: Firstly, the antibody does not recognize L1 ORF1p (40 kDa) in the uncropped Western blot for Figure 1C (Figure R4A). Secondly, the L1TD1 antibody gives only background signals in DKO cells in the indirect immunofluorescence experiment shown in Figure 1E of the manuscript.
Thirdly, the immunogene sequence of L1TD1 that determines the specificity of the antibody was checked in the antibody data sheet from Sigma Aldrich. The corresponding epitope is not present in the L1 ORF1p sequence.
Finally, we have shown that the ORF1p antibody does not cross-react with L1TD1 (Figure R4B).
Response: Thank you for sharing these images. These full images relieve concerns about specificity. The increase of ORF1P in R4B and Main figure 3C is interesting and pointed out in the manuscript. Not for the purposes of this review, but the observation of reduced transposition despite increased ORF1P could be an interesting follow up to this study (combined with the similar UPF1 result could indicate a complex of some kind).
(4) In abstract (P2), the authors mentioned that L1TD1 works as an RNA chaperone, but in the result section (P13), they showed that L1TD1 associates with L1 ORF1p in an RNA independent manner. Those conclusions appear contradictory. Clarification or revision is required.
Our findings that both proteins bind L1 RNA, and that L1TD1 interacts with ORF1p are compatible with a scenario where L1TD1/ORF1p heteromultimers bind to L1 RNA. The additional presence of L1TD1 might thereby enhance the RNA chaperone function of ORF1p. This model is visualized now in Suppl. Figure S7C.
Response: Thank you for the model. To further clarify, do you mean that L1TD1 can bind L1 RNA, but this is not needed for the effect, however this "bonus" binding (that is enabled by heteromultimerization) appears to enhance the retrotransposition frequency? Do you think L1TD1 is binding L1 RNA in this context or simply "stabilizing" ORF1P (Trimer) RNP?
Based on our data, L1TD1 associates with L1 RNA and interacts with L1 ORF1p. Both features might contribute to the enhanced retrotransposition frequency. Interestingly, the L1TD1 protein shares with its ancestor L1 ORF1p the non-canonical RNA recognition motif and the coiled-coil motif required for the trimerization but has two copies instead of one of the C-terminal domain (CTD), a structure with RNA binding and chaperone function. We speculate that the presence of an additional CTD within the L1TD1 protein might thereby enhance the RNA binding and chaperone function of L1TD1/ORF1p heteromultimers.
(5) Figure 2C fold enrichment for L1TD1 and ARMC1 is a bit difficult to fully appreciate. A 100 to 200-fold enrichment does not seem physiological. This appears to be a "divide by zero" type of result, as the CT for these genes was likely near 40 or undetectable. Another qRT-PCR based approach (absolute quantification) would be a more revealing experiment. This is the validation of the RIP experiments and the presentation mode is specifically developed for quantification of RIP assays (Sigma Aldrich RIP-qRT-PCR: Data Analysis Calculation Shell). The unspecific binding of the transcript in the absence of L1TD1 in DNMT1/L1TD1 DKO cells is set to 1 and the value in KO cells represents the specific binding relative the unspecific binding. The calculation also corrects for potential differences in the abundance of the respective transcript in the two cell lines. This is not a physiological value but the quantification of specific binding of transcripts to L1TD1. GAPDH as negative control shows no enrichment, whereas specifically associated transcripts show strong enrichement. We have explained the details of RIPqRT-PCR evaluation in Materials and Methods (page 14) and the legend of Figure 2C in the revised manuscript.
Response: Thank you for the clarification and additional information in the manuscript.
(6) Is it possible the L1TD1 antibody binds L1 ORF1p? This could make Figure 2D somewhat difficult to interpret. Some validation of the specificity of the L1TD1 antibody would remove this concern (see minor concern below).
See response to (3).
Response: Thanks.
(7) Figure S4A and S4B: There appear to be a few unusual aspects of these figures that should be pointed out and addressed. First, there doesn't seem to be any ORF1p in the Input (if there is, the exposure is too low). Second, there might be some L1TD1 in the DKO (lane 2) and lane 3. This could be non-specific, but the size is concerning. Overexposure would help see this.
The ORF1p IP gives rise to strong ORF1p signals in the immunoprecipitated complexes even after short exposure. Under these conditions ORF1p is hardly detectable in the input. Regarding the faint band in DKO HAP1 cells, this might be due to a technical problem during Western blot loading. Therefore, the input samples were loaded again on a Western blot and analyzed for the presence of ORF1p, L1TD1 and beta-actin (as loading control) and shown as separate panel in Suppl. Figure S4A.
The enhanced image is clearer. Thanks.
S4A and S4B now appear to the S6A and S6B, is that correct? (This is due to the addition of new S1 and S2, but please verify image orders were not disturbed).
Yes, the input is shown now as a separate panel in Suppl. Figure S6A.
(8) Figure S4C: This is related to our previous concerns involving antibody cross-reactivity. Figure 3E partially addresses this, where it looks like the L1TD1 "speckles" outnumber the ORF1p puncta, but overlap with all of them. This might be consistent with the antibody crossreacting. The western blot (Figure 3C) suggests an upregulation of ORF1p by at least 23x in the DKO, but the IF image in 3E is hard to tell if this is the case (slightly more signal, but fewer foci). Can you return to the images and confirm the contrast are comparable? Can you massively overexpose the red channel in 3E to see if there is residual overlap? In Figure 3E the L1TD1 antibody gives no signal in DNMT1/L1TD1 DKO cells confirming that it does not recognize ORF1p. In agreement with the Western blot in Figure 3C the L1 ORF1p signal in Figure 3E is stronger in DKO cells. In DNMT1 KO cells the L1 ORF1p antibody does not recognize all L1TD1 speckles. This result is in agreement with the Western blot shown above in Figure R4B and indicates that the L1 ORF1p antibody does not recognize the L1TD1 protein. The contrast is comparable and after overexposure there are still L1TD1 specific speckles. This might be due to differences in abundance of the two proteins.
Response: Suggestion: Would it be possible to use a program like ImageJ to supplement the western blot observation? Qualitatively, In figure 3E, it appears that there is more signal in the DKO, but this could also be due to there being multiple cells clustered together or a particularly nicely stained region. Could you randomly sample 20-30 cells across a few experiments to see if this holds up. I am interested in whether the puncta in the KO image(s) is a very highly concentrated region and in the DKO this is more disperse. Also, the representative DKO seems to be cropped slightly wrong. (Please use puncta as a guide to make the cropping more precise)
As suggested by the reviewer we have quantified the signals of 60 KO cells and 56 DKO cells in three different IF experiments by ImageJ. We measured a 1.4-fold higher expression level of L1 ORF1p in DKO cells. However, the difference is not statistically significant. This is most probably due to the change in cell size and protein content during the cell cycle with increasing protein contents from G1 to G2. Western blot analysis provides signals of comparable protein amounts representing an average expression levels over ten thousands of cells. Nevertheless, the quantification results reflect in principle the IF pictures shown in Figure 3E but IF is probably not the best method to quantify protein amounts. We have also corrected Figure 3E.
Author response image 1.
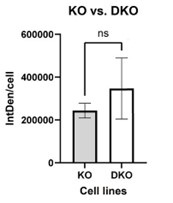
(9) The choice of ARMC1 and YY2 is unclear. What are the criteria for the selection?
ARMC1 was one of the top hits in a pilot RIP-seq experiment (IP versus input and IP versus IgG IP). In the actual RIP-seq experiment with DKO HAP1 cells instead of IgG IP as a negative control, we found ARMC1 as an enriched hit, although it was not among the top 5 hits. The results from the 2nd RIP-seq further confirmed the validity of ARMC1 as an L1TD1interacting transcript. YY2 was of potential biological relevance as an L1TD1 target due to the fact that it is a processed pseudogene originating from YY1 mRNA as a result of retrotransposition. This is mentioned on page 6 of the revised manuscript.
Response: Appreciated!
(10) (P16) L1 is the only protein-coding transposon that is active in humans. This is perhaps too generalized of a statement as written. Other examples are readily found in the literature.
Please clarify.
We will tone down this statement in the revised manuscript.
Response: Appreciated! To further clarify, the term "active" when it comes to transposable elements, has not been solidified. It can span "retrotransposition competent" to "transcripts can be recovered". There are quite a few reports of GAG transcripts and protein from various ERV/LTR subfamilies in various cells and tissues (in mouse and human at least), however whether they contribute to new insertions is actively researched.
(11) In both the abstract and last sentence in the discussion section (P17), embryogenesis is mentioned, but this is not addressed at all in the manuscript. Please refrain from implying normal biological functions based on the results of this study unless appropriate samples are used to support them.
Much of the published data on L1TD1 function are related to embryonic stem cells [3- 7].
Therefore, it is important to discuss our findings in the context of previous reports.
Response: It is well established that embryonic stem cells are not a perfect or direct proxies for the inner cell mass of embryos, as multiple reports have demonstrated transcriptomic, epigenetic, chromatin accessibility differences. The exact origin of ES cells is also considered controversial. We maintain that the distinction between embryos/embryogenesis and the results presented in the manuscript are not yet interchangeable. An important exception would be complex models of embryogenesis such as embryoids, (or synthetic/artificial embryo models that have been carefully been termed as such so as to not suggest direct implications to embryos). https://www.nature.com/articles/ncb2965
We have deleted the corresponding paragraph in the Discussion.
(12) Figure 3E: The format of Figures 1A and 3E are internally inconsistent. Please present similar data/images in a cohesive way throughout the manuscript. We show now consistent IF Figures in the revised manuscript.
Response: Thanks
Minor:
In general:
Still need checking for typos, mostly in Materials and Methods section; Please keep a consistent writing style throughout the whole manuscript. If you use L1 ORF1p, then please use L1 instead of LINE-1, or if you keep LINE-1 in your manuscript, then you should use LINE-1 ORF1p.
A lab member from the US checked again the Materials and Methods section for typos. We keep the short version L1 ORF1p.
(1) Intro:
- Is L1Td1 in mice and Humans? How "conserved" is it and does this suggest function? Murine and human L1TD1 proteins share 44% identity on the amino acid level and it was suggested that the corresponding genes were under positive selection during evolution with functions in transposon control and maintenance of pluripotency [8].
- Why HAP1? (Haploid?) The importance of this cell line is not clear.
HAP1 is a nearly haploid human cancer cell line derived from the KBM-7 chronic myelogenous leukemia (CML) cell line [9, 10]. Due to its haploidy is perfectly suited and widely used for loss-of-function screens and gene editing. After gene editing cells can be used in the nearly haploid or in the diploid state. We usually perform all experiments with diploid HAP1 cell lines. Importantly, in contrast to other human tumor cell lines, this cell line tolerates ablation of DNMT1. We have included a corresponding explanation in the revised manuscript on page 5, first paragraph.
- Global methylation status in DNMT1 KO? (Methylations near L1 insertions, for example?)
The HAP1 DNMT1 KO cell line with a 20 bp deletion in exon 4 used in our study was validated in the study by Smits et al. [11]. The authors report a significant reduction in overall DNA methylation. However, we are not aware of a DNA methylome study on this cell line. We show now data on the methylation of L1 elements in HAP1 cells and upon DNMT1 deletion in the revised manuscript in Suppl. Figure S1B.
Response: Looks great!
(2) Figure 1:
- Figure 1C. Why is LMNB used instead of Actin (Fig1D)?
We show now beta-actin as loading control in the revised manuscript.
- Figure 1G shows increased Caspase 3 in KO, while the matching sentence in the result section skips over this. It might be more accurate to mention this and suggest that the single KO has perhaps an intermediate phenotype (Figure 1F shows a slight but not significant trend).
We fully agree with the reviewer and have changed the sentence on page 6, 2nd paragraph accordingly.
- Would 96 hrs trend closer to significance? An interpretation is that L1TD1 loss could speed up this negative consequence.
We thank the reviewer for the suggestion. We have performed a time course experiment with 6 biological replicas for each time point up to 96 hours and found significant changes in the viability upon loss of DNMT1 and again significant reduction in viability upon additional loss of L1TD1 (shown in Figure 1F). These data suggest that as expected loss of DNMT1 leads to significant reduction viability and that additional ablation of L1TD1 further enhances this effect.
Response: Looks good!
- What are the "stringent conditions" used to remove non-specific binders and artifacts (negative control subtraction?)
Yes, we considered only hits from both analyses, L1TD1 IP in KO versus input and L1TD1 IP in KO versus L1TD1 IP in DKO. This is now explained in more detail in the revised manuscript on page 6, 3rd paragraph.
(3) Figure 2:
- Figure 2A is a bit too small to read when printed.
We have changed this in the revised manuscript.
- Since WT and DKO lack detectable L1TD1, would you expect any difference in RIP-Seq results between these two?
Due to the lack of DNMT1 and the resulting DNA hypomethylation, DKO cells are more similar to KO cells than WT cells with respect to the expressed transcripts.
- Legend says selected dots are in green (it appears blue to me). We have changed this in the revised manuscript.
- Would you recover L1 ORF1p and its binding partners in the KO? (Is the antibody specific in the absence of L1TD1 or can it recognize L1?) I noticed an increase in ORF1p in the KO in Figure 3C.
Thank you for the suggestion. Yes, L1 ORF1p shows slightly increased expression in the proteome analysis and we have marked the corresponding dot in the Volcano plot (Figure 3A).
- Should the figure panel reference near the (Rosspopoff & Trono) reference instead be Sup S1C as well? Otherwise, I don't think S1C is mentioned at all.
- What are the red vs. green dots in 2D? Can you highlight ERV and ALU with different colors?
We added the reference to Suppl. Figure S1C (now S3C) in the revised manuscript. In Figure 2D L1 elements are highlighted in green, ERV elements in yellow, and other associated transposon transcripts in red.
Response: Much better, thanks!
- Which L1 subfamily from Figure 2D is represented in the qRT-PCR in 2E "LINE-1"? Do the primers match a specific L1 subfamily? If so, which? We used primers specific for the human L1.2 subfamily.
- Pulling down SINE element transcripts makes some sense, as many insertions "borrow" L1 sequences for non-autonomous retro transposition, but can you speculate as to why ERVs are recovered? There should be essentially no overlap in sequence.
In the L1TD1 evolution paper [8], a potential link between L1TD1 and ERV elements was discussed:
"Alternatively, L1TD1 in sigmodonts could play a role in genome defense against another element active in these genomes. Indeed, the sigmodontine rodents have a highly active family of ERVs, the mysTR elements [46]. Expansion of this family preceded the death of L1s, but these elements are very active, with 3500 to 7000 speciesspecific insertions in the L1-extinct species examined [47]. This recent ERV amplification in Sigmodontinae contrasts with the megabats (where L1TD1 has been lost in many species); there are apparently no highly active DNA or RNA elements in megabats [48]. If L1TD1 can suppress retroelements other than L1s, this could explain why the gene is retained in sigmodontine rodents but not in megabats."
Furthermore, Jin et al. report the binding of L1TD1 to repetitive sequences in transcripts [12]. It is possible that some of these sequences are also present in ERV RNAs.
Response: Interesting, thanks for sharing
- Is S2B a screenshot? (the red underline).
No, it is a Powerpoint figure, and we have removed the red underline.
(4) Figure 3:
- Text refers to Figure 3B as a western blot. Figure 3B shows a volcano plot. This is likely 3C but would still be out of order (3A>3C>3B referencing). I think this error is repeated in the last result section.
- Figure and legends fail to mention what gene was used for ddCT method (actin, gapdh, etc.).
- In general, the supplemental legends feel underwritten and could benefit from additional explanations. (Main figures are appropriate but please double-check that all statistical tests have been mentioned correctly).
Thank you for pointing this out. We have corrected these errors in the revised manuscript.
(5) Discussion:
- Aluy connection is interesting. Is there an "Alu retrotransposition reporter assay" to test whether L1TD1 enhances this as well?
Thank you for the suggestion. There is indeed an Alu retrotransposition reporter assay reported be Dewannieux et al. [13]. The assay is based on a Neo selection marker. We have previously tested a Neo selection-based L1 retrotransposition reporter assay, but this system failed to properly work in HAP1 cells, therefore we switched to a blasticidin based L1 retrotransposition reporter assay. A corresponding blasticidin-based Alu retrotransposition reporter assay might be interesting for future studies (mentioned in the Discussion, page 11 paragraph 4 of the revised manuscript.
(6) Material and Methods :
- The number of typos in the materials and methods is too numerous to list. Instead, please refer to the next section that broadly describes the issues seen throughout the manuscript.
Writing style
(1) Keep a consistent style throughout the manuscript: for example, L1 or LINE-1 (also L1 ORF1p or LINE-1 ORF1p); per or "/"; knockout or knock-out; min or minute; 3 times or three times; media or medium. Additionally, as TE naming conventions are not uniform, it is important to maintain internal consistency so as to not accidentally establish an imprecise version.
(2) There's a period between "et al" and the comma, and "et al." should be italic.
(3) The authors should explain what the key jargon is when it is first used in the manuscript, such as "retrotransposon" and "retrotransposition".
(4) The authors should show the full spelling of some acronyms when they use it for the first time, such as RNA Immunoprecipitation (RIP).
(5) Use a space between numbers and alphabets, such as 5 μg. (6) 2.0 × 10⁵ cells, that's not an "x".
(7) Numbers in the reference section are lacking (hard to parse).
(8) In general, there are a significant number of typos in this draft which at times becomes distracting. For example, (P3) Introduction: Yet, co-option of TEs thorough (not thorough, it should be through) evolution has created so-called domesticated genes beneficial to the gene network in a wide range of organisms. Please carefully revise the entire manuscript for these minor issues that collectively erode the quality of this submission. Thank you for pointing out these mistakes. We have corrected them in the revised manuscript. A native speaker from our research group has carefully checked the paper. In summary, we have added Supplementary Figure S7C and have changed Figures 1C, 1E, 1F, 2A, 2D, 3A, 4B, S3A-D, S4B and S6A based on these comments.
Response: Thank you for taking these comments on board!
Author response:
The following is the authors’ response to the original reviews.
Public Review:
Reviewer #2 (Public Review):
Regarding reviewer #2 public review, we update here our answers to this public review with new analysis and modification done in the manuscript.
This manuscript is missing a direct phenotypic comparison of control cells to complement that of cells expressing RhoGEF2-DHPH at "low levels" (the cells that would respond to optogenetic stimulation by retracting); and cells expressing RhoGEF2-DHPH at "high levels" (the cells that would respond to optogenetic stimulation by protruding). In other words, the authors should examine cell area, the distribution of actin and myosin, etc in all three groups of cells (akin to the time zero data from figures 3 and 5, with a negative control). For example, does the basal expression meaningfully affect the PRG low-expressing cells before activation e.g. ectopic stress fibers? This need not be an optogenetic experiment, the authors could express RhoGEF2DHPH without SspB (as in Fig 4G).
Updated answer: We thank reviewer #2 for this suggestion. PRG-DHPH overexpression is known to affect the phenotype of the cell as shown in Valon et al., 2017. In our experiments, we could not identify any evidence of a particular phenotype before optogenetic activation apart from the area and spontaneous membrane speed that were already reported in our manuscript (Fig 2E and SuppFig 2). Regarding the distribution of actin and myosin, we did not observe an obvious pattern that will be predictive of the protruding/retracting phenotype. Trying to be more quantitative, we have classified (by eye, without knowing the expression level of PRG nor the future phenotype) the presence of stress fibers, the amount of cortical actin, the strength of focal adhesions, and the circularity of cells. As shown below, when these classes are binned by levels of expression of PRG (two levels below the threshold and two above) there is no clear determinant. Thus, we concluded that the main driver of the phenotype was the PRG basal expression rather than any particularity of the actin cytoskeleton/cell shape.
Author response image 1.
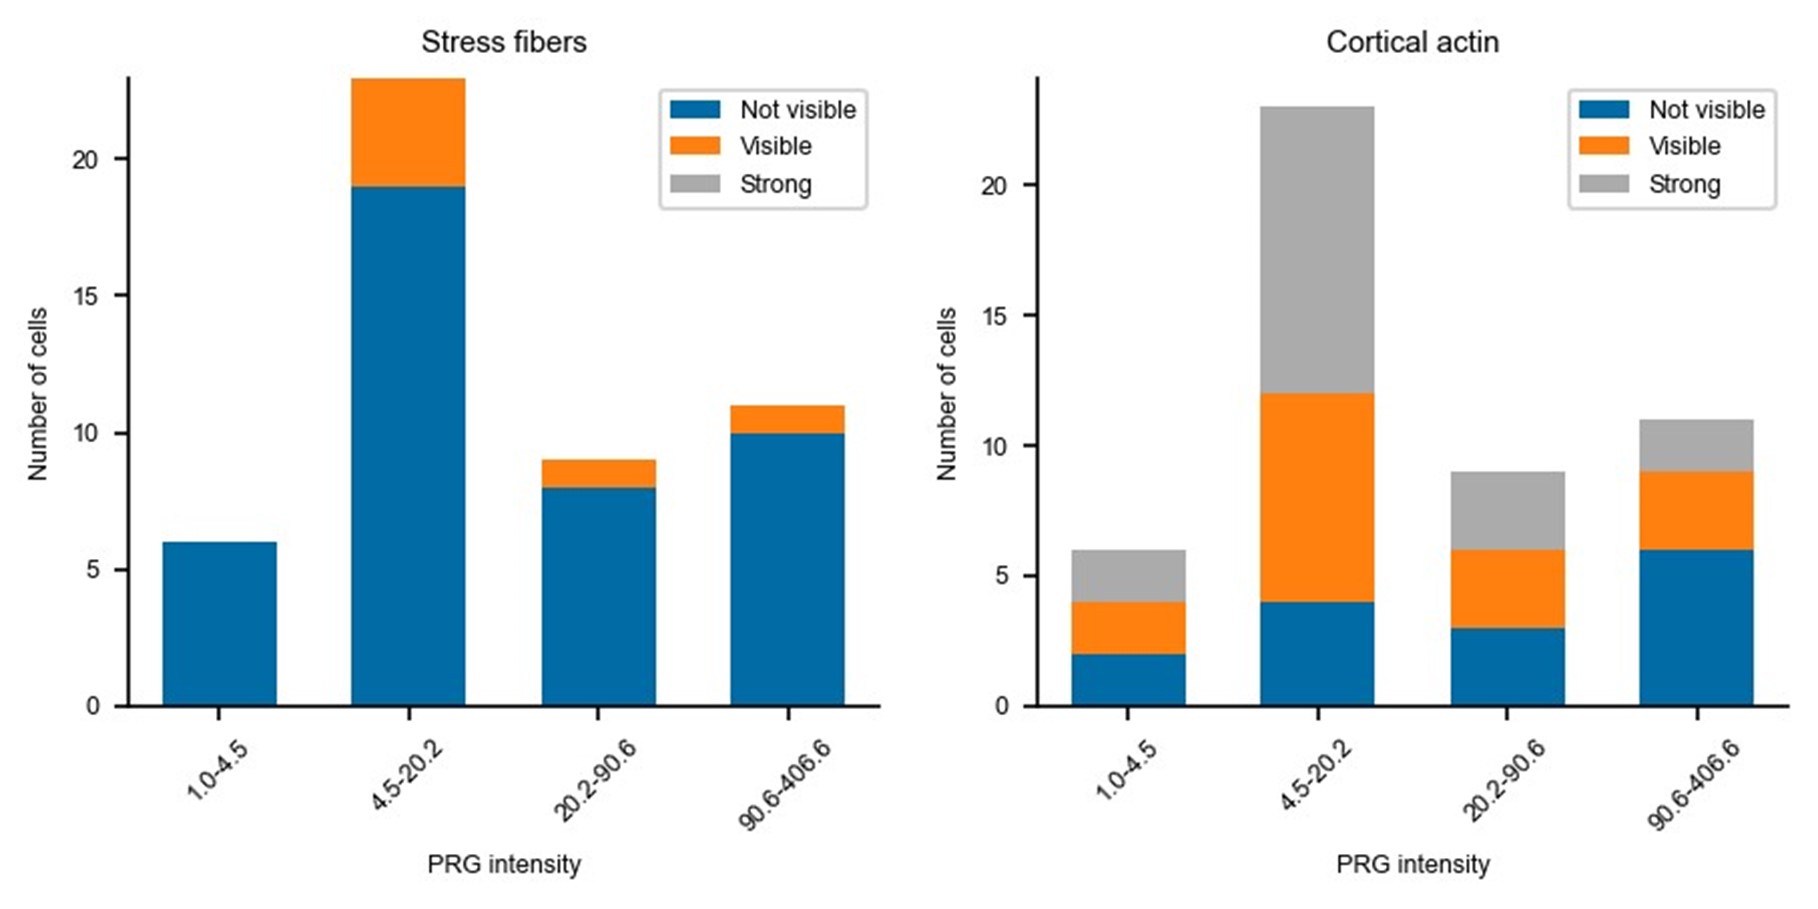
Author response image 2.
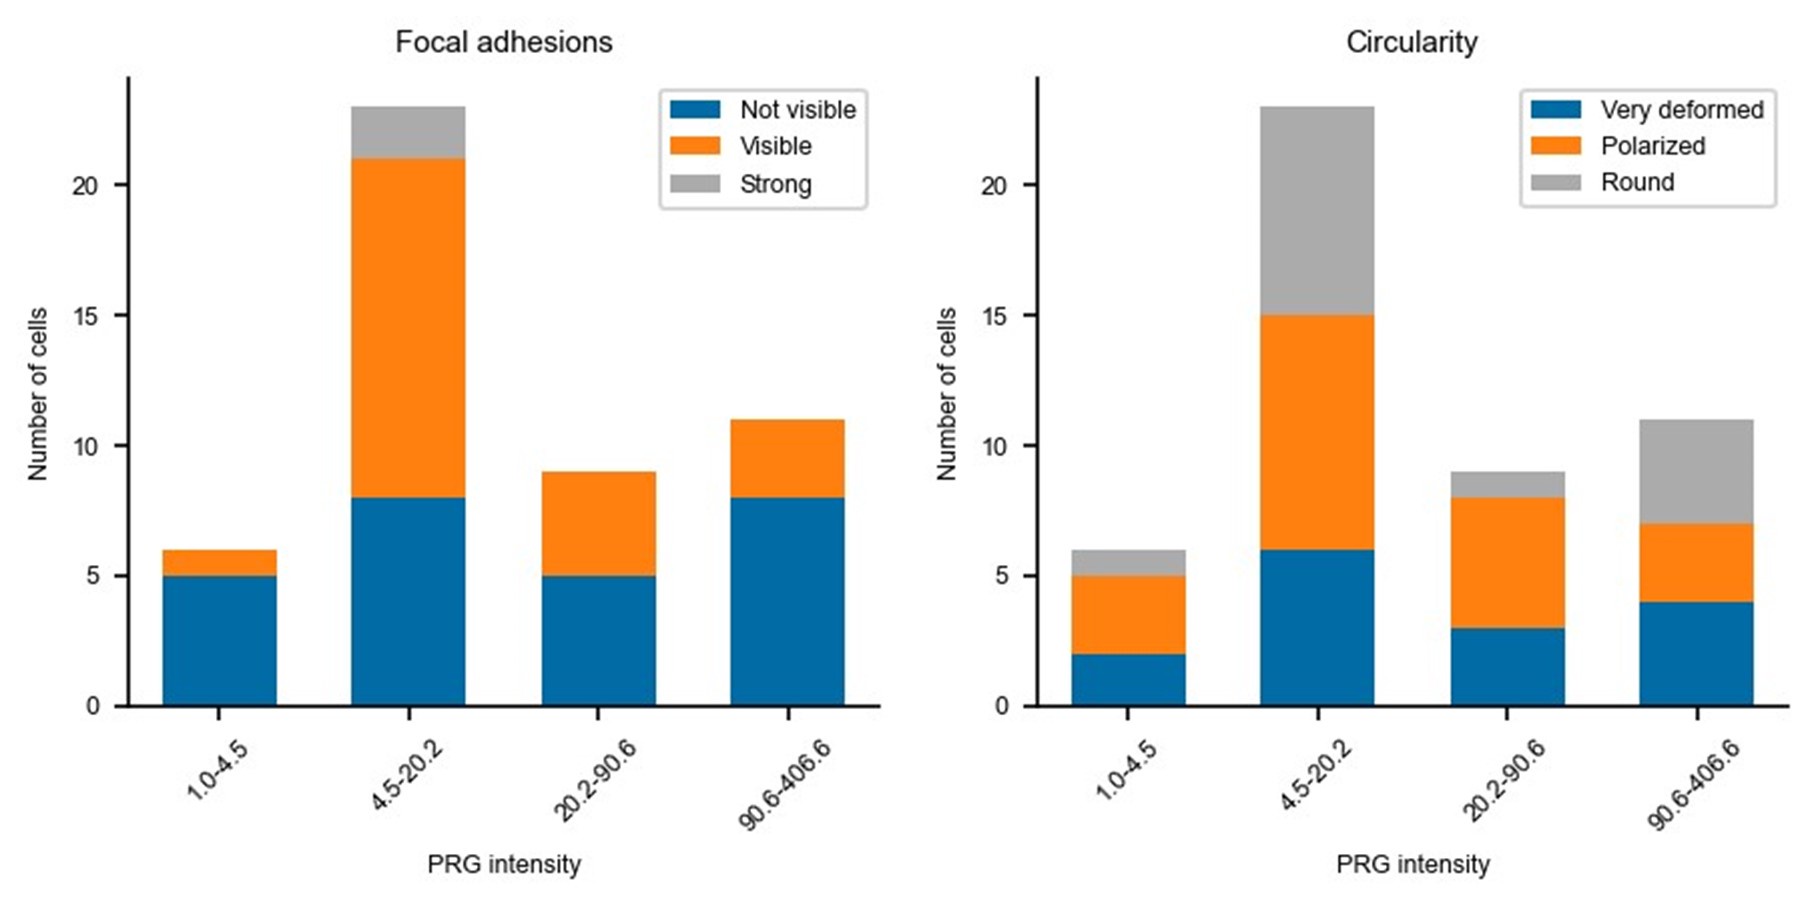
Relatedly, the authors seem to assume ("recruitment of the same DH-PH domain of PRG at the membrane, in the same cell line, which means in the same biochemical environment." supplement) that the only difference between the high and low expressors are the level of expression. Given the chronic overexpression and the fact that the capacity for this phenotypic shift is not recruitmentdependent, this is not necessarily a safe assumption. The expression of this GEF could well induce e.g. gene expression changes.
Updated answer: We agree with reviewer #2 that there could be changes in gene expression. In the next point of this supplementary note, we had specified it, by saying « that overexpression has an influence on cell state, defined as protein basal activity or concentration before activation. » We are sorry if it was not clear, and we changed this sentence in the revised manuscript (in red in the supp note).
One of the interests of the model is that it does not require any change in absolute concentrations, beside the GEF. The model is thought to be minimal and fits well and explains the data with very few parameters. We do not show that there is no change in concentration, but we show that it is not required to invoke it. We revised a sentence in the new version of the manuscript to include this point.
Additional answer: During the revision process, we have been looking for an experimental demonstration of the independence of the phenotypic switch to any change in global gene expression pattern due to the chronic overexpression of PRG. Our idea was to be in a condition of high PRG overexpression such that cells protrude upon optogenetic activation, and then acutely deplete PRG to see if cells where then retracting. To deplete PRG in a timescale that prevent any change of gene expression, we considered the recently developed CATCHFIRE (PMID: 37640938) chemical dimerizer. We designed an experiment in which the PRG DH-PH domain was expressed in fusion with a FIRE-tag and co-expressing the FIRE-mate fused to TOM20 together with the optoPRG tool. Upon incubation with the MATCH small molecule, we should be able to recruit the overexpressed PRG to the mitochondria within minutes, hereby preventing it to form a complex with active RhoA in the vicinity of the plasma membrane. Unfortunately, despite of numerous trials we never achieved the required conditions: we could not have cells with high enough expression of PRGFIRE-tag (for protrusive response) and low enough expression of optoPRG (for retraction upon PRGFIRE-tag depletion). We still think this would be a nice experiment to perform, but it will require the establishment of a stable cell line with finely tuned expression levels of the CATCHFIRE system that goes beyond the timeline of our present work.
Concerning the overall model summarizing the authors' observations, they "hypothesized that the activity of RhoA was in competition with the activity of Cdc42"; "At low concentration of the GEF, both RhoA and Cdc42 are activated by optogenetic recruitment of optoPRG, but RhoA takes over. At high GEF concentration, recruitment of optoPRG lead to both activation of Cdc42 and inhibition of already present activated RhoA, which pushes the balance towards Cdc42."
These descriptions are not precise. What is the nature of the competition between RhoA and Cdc42? Is this competition for activation by the GEFs? Is it a competition between the phenotypic output resulting from the effectors of the GEFs? Is it competition from the optogenetic probe and Rho effectors and the Rho biosensors? In all likelihood, all of these effects are involved, but the authors should more precisely explain the underlying nature of this phenotypic switch. Some of these points are clarified in the supplement, but should also be explicit in the main text.
Updated answer: We consider the competition between RhoA and Cdc42 as a competition between retraction due to the protein network triggered by RhoA (through ROCK-Myosin and mDia-bundled actin) and the protrusion triggered by Cdc42 (through PAK-Rac-ARP2/3-branched Actin). We made this point explicit in the main text.
Recommendations for the authors:
Reviewer #1 (Recommendations For The Authors):
Major
- why this is only possible for such few cells. Can the authors comment on this in the discussion? Does the model provide any hints?
As said in our answer to the public comment or reviewer #1, we think that the low number of cells being able to switch can be explained by two different reasons:
(1) First, we were looking for clear inversions of the phenotype, where we could see clear ruffles in the case of the protrusion, and clear retractions in the other case. Thus, we discarded cells that would show in-between phenotypes, because we had no quantitative parameter to compare how protrusive or retractile they were. This reduced the number of switching cells
(2) Second, we had a limitation due to the dynamic of the optogenetic dimer used here. Indeed, the control of the frequency was limited by the dynamic of unbinding of the optogenetic dimer. This dynamic of recruitment (~20s) is comparable to the dynamics of the deactivation of RhoA and Cdc42. Thus, the differences in frequency are smoothed and we could not vary enough the frequency to increase the number of switches. Thanks to the model, we can predict that increasing the unbinding rate of the optogenetic tool (shorter dimer lifetime) should allow us to increase the number of switching cells.
We have added a sentence in the discussion to make this second point explicit.
- I would encourage the authors to discuss this molecular signaling switch in the context of general design principles of switches. How generalizable is this network/mechanism? Is it exclusive to activating signaling proteins or would it work with inhibiting mechanisms? Is the competition for the same binding site between activators and effectors a common mechanism in other switches?
The most common design principle for molecular switches is the bistable switch that relies on a nonlinear activation (for example through cooperativity) with a linear deactivation. Such a design allows the switch between low and high levels. In our case, there is no need for a non-linearity since the core mechanism is a competition for the same binding site on active RhoA of the activator and the effectors. Thus, the design principle would be closer to the notion of a minimal “paradoxical component” (PMID: 23352242) that both activate and limit signal propagation, which in our case can be thought as a self-limiting mechanism to prevent uncontrolled RhoA activation by the positive feedback. Yet, as we show in our work, this core mechanism is not enough for the phenotypic switch to happen since the dual activation of RhoA and Cdc42 is ultimately required for the protrusion phenotype to take over the retracting one. Given the particularity of the switch we observed here, we do not feel comfortable to speculate on any general design principles in the main text, but we thank reviewer #1 for his/her suggestion.
- Supplementary figures - there is a discrepancy between the figures called in the text and the supplementary files, which only include SF1-4.
We apologize for this error and we made the correction.
- In the text, the authors use Supp Figure 7 to show that the phenotype could not be switched by varying the fold increase of recruitment through changing the intensity/duration of the light pulse. Aside from providing the figure, could you give an explanation or speculation of why? Does the model give any prediction as to why this could be difficult to achieve experimentally (is the range of experimentally feasible fold change of 1.1-3 too small? Also, could you clarify why the range is different than the 3 to 10-fold mentioned at the beginning of the results section?
We thank the reviewer for this question, and this difference between frequency and intensity can be indeed understood in a simple manner through the model.
All the reactions in our model were modeled as linear reactions. Thus, at any timepoint, changing the intensity of the pulse will only change proportionally the amount of the different components (amount of active RhoA, amount of sequestered RhoA, and amount of active Cdc42). This explains why we cannot change the balance between RhoA activity and Cdc42 activity only through the pulse strength. We observed the same experimentally: when we changed the intensity of the pulses, the phenotype would be smaller/stronger, but would never switch, supporting our hypothesis on the linearity of all biochemical reactions.
On the contrary, changing the frequency has an effect, for a simple reason: the dynamics of RhoA and Cdc42 activation are not the same as the dynamics of inhibition of RhoA by the PH domain (see
Figure 4). The inhibition of RhoA by the PH is almost instantaneous while the activation of RhoGTPases has a delay (sets by the deactivation parameter k_2). Intuitively, increasing the frequency will lead to sustained inhibition of RhoA, promoting the protrusion phenotype. Decreasing the frequency – with a stronger pulse to keep the same amount of recruited PRG – restricts this inhibition of RhoA to the first seconds following the activation. The delayed activation of RhoA will then take over.
We added two sentences in the manuscript to explain in greater details the difference between intensity and frequency.
Regarding the difference between the 1.3-3 fold and the 3 to 10 fold, the explanation is the following: the 3 to 10 fold referred to the cumulative amount of proteins being recruited after multiple activations (steady state amount reached after 5 minutes with one activation every 30s); while the 1.3-3 fold is what can be obtained after only one single pulse of activation.
- The transient expression achieves a large range of concentration levels which is a strength in this case. To solve the experimental difficulties associated with this, i.e. finding transfected cells at low cell density, the authors developed a software solution (Cell finder). Since this approach will be of interest for a wide range of applications, I think it would deserve a mention in the discussion part.
We thank the reviewer for his/her interest in this small software solution.
We developed the description of the tool in the Method section. The Cell finder is also available with comments on github (https://github.com/jdeseze/cellfinder) and usable for anyone using Metamorph or Micromanager imaging software.
Minor
- Can the authors describe what they mean with "cell state"? It is used multiple times in the manuscript and can be interpreted as various things.
We now explain what we mean by ‘cell state’ in the main text :
“protein basal activities and/or concentrations - which we called the cell state”
- “(from 0% to 45%, Figure 2D)", maybe add here: "compare also with Fig. 2A".
We completed the sentence as suggested, which clarifies the data for the readers.
- The sentence "Given that the phenotype switch appeared to be controlled by the amount of overexpressed optoPRG, we hypothesized that the corresponding leakiness of activity could influence the cell state prior to any activation." might be hard to understand for readers unfamiliar with optogenetic systems. I suggest adding a short sentence explaining dark-state activity/leakiness before putting the hypothesis forward.
We changed this whole beginning of the paragraph to clarify.
- Figure 2E and SF2A. I would suggest swapping these two panels as the quantification of the membrane displacement before activation seems more relevant in this context.
We thank reviewer #1 for this suggestion and we agree with it (we swapped the two panels)
- Fig. 2B is missing the white frames in the mixed panels.
We are sorry for this mistake, we changed it in the new version.
- In the text describing the experiment of Fig. 4G, it would again be helpful to define what the authors mean by cell state, or to state the expected outcome for both hypotheses before revealing the result.
We added precisions above on what we meant by cell state, which is the basal protein activities and/or concentrations prior to optogenetic activation. We added the expectation as follow:
To discriminate between these two hypotheses, we overexpressed the DH-PH domain alone in another fluorescent channel (iRFP) and recruited the mutated PH at the membrane. “If the binding to RhoA-GTP was only required to change the cell state, we would expect the same statistics than in Figure 2D, with a majority of protruding cells due to DH-PH overexpression. On the contrary, we observed a large majority of retracting phenotype even in highly expressing cells (Figure 4G), showing that the PH binding to RhoA-GTP during recruitment is a key component of the protruding phenotype.”
- Figure 4H,I: "of cells that overexpress PRG, where we only recruit the PH domain" doesn't match with the figure caption. Are these two constructs in the same cell? If not please clarify the main text.
We agree that it was not clear. Both constructs are in the same cell, and we changed the figure caption accordingly.
- "since RhoA dominates Cdc42" is this concluded from experiments (if yes, please refer to the figure) or is this known from the literature (if yes, please cite).
The assumption that RhoA dominates Cdc42 comes from the fact that we see retraction at low PRG concentration. We assumed that RhoA is responsible for the retraction phenotype. Our assumption is based on the literature (Burridge 2004 as an example of a review, confirmed by many experiments, such as the direct recruitment of RhoA to the membrane, see Berlew 2021) and is supported by our observations of immediate increase of RhoA activity at low PRG. We modified the text to clarify it is an assumption.
- Fig. 6G o left: is not intuitive, why are the number of molecules different to start with?
The number of molecules is different because they represent the active molecules: increasing the amount of PRG increases the amount of active RhoA and active Cdc42. We updated the figure to clarify this point.
o right: the y-axis label says "phenotype", maybe change it to "activity" or add a second y-axis on the right with "phenotype"?
We updated the figure following reviewer #1 suggestion.
- Discussion: "or a retraction in the same region" sounds like in the same cell. Perhaps rephrase to state retraction in a similar region?
Sorry for the confusion, we change it to be really clear: “a protrusion in the activation region when highly expressed, or a retraction in the activation region when expressed at low concentrations.”
Typos:
- "between 3 and 10 fold" without s.
- Fig. 1H, y-axis label.
- "whose spectrum overlaps" with s.
- "it first decays, and then rises" with s.
- Fig 4B and Fig 6B. Is the time in sec or min? (Maybe double-check all figures).
- "This result suggests that one could switch the phenotype in a single cell by selecting it for an intermediate expression level of the optoPRG.".
- "GEF-H1 PH domain has almost the same inhibition ability as PRG PH domain".
We corrected all these mistakes and thank the reviewer for his careful reading of the manuscript.
Reviewer #2 (Recommendations For The Authors):
Likewise, the model assumes that at high PRG GEF expression, the "reaction is happening far from saturation ..." and that "GTPases activated with strong stimuli -giving rise to strong phenotypic changes- lead to only 5% of the proteins in a GTP-state, both for RhoA and Cdc42". Given the high levels of expression (the absolute value of which is not known) this assumption is not necessarily safe to assume. The shift to Cdc42 could indeed result from the quantitative conversion of RhoA into its active state.
We agree with the reviewer that the hypothesis that RhoA is fully converted into its active state cannot be completely ruled out. However, we think that the two following points can justify our choice.
- First, we see that even in the protruding phenotype, RhoA activity is increasing upon optoPRG recruitment (Figure 3). This means that RhoA is not completely turned into its active GTP-loaded state. The biosensor intensity is rising by a factor 1.5 after 5 minutes (and continue to increase, even if not shown here). For sure, it could be explained by the relocation of RhoA to the place of activation, but it still shows that cells with high PRG expression are not completely saturated in RhoA-GTP.
- We agree that linearity (no saturation) is still an hypothesis and very difficult to rule out, because it is not only a question of absolute concentrations of GEFs and RhoA, but also a question of their reaction kinetics, which are unknow parameters in vivo. Yet, adding a saturation parameter would mean adding 3 unknown parameters (absolute concentrations of RhoA, as well as two reaction constants). The fact that there are not needed to fit the complex curves of RhoA as we do with only one parameter tends to show that the minimal ingredients representing the interaction are captured here.
The observed "inhibition of RhoA by the PH domain of the GEF at high concentrations" could result from the ability of the probe to, upon membrane recruitment, bind to active RhoA (via its PH domain) thereby outcompeting the RhoA biosensor (Figure 4A-C). This reaction is explicitly stated in the supplemental materials ("PH domain binding to RhoA-GTP is required for protruding phenotype but not sufficient, and it is acting as an inhibitor of RhoA activity."), but should be more explicit in the main text. Indeed, even when PRG DHPH is expressed at high concentrations, it does activate RhoA upon recruitment (figure 3GH). Not only might overexpression of this active RhoA-binding probe inhibit the cortical recruitment of the RhoA biosensor, but it may also inhibit the ability of active RhoA to activate its downstream effectors, such as ROCK, which could explain the decrease in myosin accumulation (figure 3D-F). It is not clear that there is a way to clearly rule this out, but it may impact the interpretation.
This hypothesis is actually what we claim in the manuscript. We think that the inhibition of RhoA by the PH domain is explained by its direct binding. We may have missed what Reviewer #2 wanted to say, but we think that we state it explicitly in the main text :
“Knowing that the PH domain of PRG triggers a positive feedback loop thanks to its binding to active RhoA 18, we hypothesized that this binding could sequester active RhoA at high optoPRG levels, thus being responsible for its inhibition.”
And also in the Discussion:
“However, this feedback loop can turn into a negative one for high levels of GEF: the direct interaction between the PH domain and RhoA-GTP prevents RhoA-GTP binding to effectors through a competition for the same binding site.”
We may have not been clear, but we think that this is what is happening: the PH domain prevents the binding to effectors and decreases RhoA activity (as was shown in Chen et al. 2010).
The X-axis in Figure 4C time is in seconds not minutes. The Y-axis in Figure 4H is unlabeled.
We are sorry for the mistake of Figure 4C. We changed the Y-axis in the Figure 4h.
Although this publication cites some of the relevant prior literature, it fails to cite some particularly relevant works. For example, the authors state, "The LARG DH domain was already used with the iLid system" and refers to a 2018 paper (ref 19), whereas that domain was first used in 2016 (PMID 27298323). Indeed, the authors used the plasmid from this 2016 paper to build their construct.
We thank the reviewer for pointing out this error, we have corrected the citation and put the seminal one in the revised version.
An analogous situation pertains to previous work that showed that an optogenetic probe containing the DH and PH domains in RhoGEF2 is somewhat toxic in vivo (table 6; PMID 33200987). Furthermore, it has previously been shown that mutation of the equivalent of F1044A and I1046E eliminates this toxicity (table 6; PMID 33200987) in vivo. This is particularly important because the Rho probe expressing RhoGEF2-DHPH is in widespread usage (76 citations in PubMed). The ability of this probe to activate Cdc42 may explain some of the phenotypic differences described resulting from the recruitment of RhoGEF2-DHPH and LARG-DH in a developmental context (PMID 29915285, 33200987).
We thank reviewer #2 for these comments, and added a small section in the discussion, for optogenetic users:
This underlines the attention that needs to be paid to the choice of specific GEF domains when using optogenetic tools. Tools using DH-PH domains of PRG have been widely used, both in mammalian cells and in Drosophila (with the orthologous gene RhoGEF2), and have been shown to be toxic in some contexts in vivo 28. Our study confirms the complex behavior of this domain which cannot be reduced to a simple RhoA activator.
Concerning the experiment shown in 4D, it would be informative to repeat this experiment in which a non-recruitable DH-PH domain of PRG is overexpressed at high levels and the DH domain of LARG is recruited. This would enable the authors to distinguish whether the protrusion response is entirely dependent on the cell state prior to activation or the combination of the cell state prior to activation and the ability of PRG DHPH to also activate Cdc42.
We thank the reviewer for his suggestion. Yet, we think that we have enough direct evidence that the protruding phenotype is due to both the cell state prior to activation and the ability of PRG DHPH to also activate Cdc42. First, we see a direct increase in Cdc42 activity following optoPRG recruitment (see Figure 6). This increase is sustained in the protruding phenotype and precedes Rac1 and RhoA activity, which shows that it is the first of these three GTPases to be activated. Moreover, we showed that inhibition of PAK by the very specific drug IPA3 is completely abolishing only the protruding phenotype, which shows that PAK, a direct effector of Cdc42 and Rac1, is required for the protruding phenotype to happen. We know also that the cell state prior to activation is defining the phenotype, thanks to the data presented in Figure 2.
We further showed in Figure 1 that LARG DH-PH domain was not able to promote protrusion. The proposed experiment would be interesting to confirm that LARG does not have the ability to activate another GTPase, even in a different cell state with overexpressed PRG. However, we are not sure it would bring any substantial findings to understand the mechanism we describe here, given the facts provided above.
Similarly, as PRG activates both Cdc42 and Rho at high levels, it would be important to determine the extent to which the acute Rho activation contributes to the observed phenotype (e.g. with Rho kinase inhibitor).
We agree with the reviewer that it would be interesting to know whether RhoA activation contributes to the observed phenotype, and we have tried such experiments.
For Rho kinase inhibitor, we tried with Y-27632 and we could never prevent the protruding phenotype to happen. However, we could not completely abolish the retracting phenotype either (even when the effect on the cells was quite strong and visible), which could be due to other effectors compensating for this inhibition. As RhoA has many other effectors, it does not tell us that RhoA is not required for protrusion.
We also tried with C3, which is a direct inhibitor of RhoA. However, it had too much impact on the basal state of the cells, making it impossible to recruit (cells were becoming round and clearly dying. As both the basal state and optogenetic activation require the activation of RhoA, it is hard to conclude out of experiments where no cell is responding.
The ability of PRG to activate Cdc42 in vivo is striking given the strong preference for RhoA over Cdc42 in vitro (2400X) (PMID 23255595). Is it possible that at these high expression levels, much of the RhoA in the cell is already activated, so that the sole effect that recruited PRG can induce is activation of Cdc42? This is related to the previous point pertaining to absolute expression levels.
As discussed before, we think that it is not only a question of absolute expression levels, but also of the affinities between the different partners. But Reviewer #2 is right, there is a competition between the activation of RhoA and Cdc42 by optoPRG, and activation of Cdc42 probably happens at higher concentration because of smaller effective affinity.
Still, we know that activation of the Cdc42 by PRG DH-PH domain is possible in vivo, as it was very clearly shown in Castillo-Kauil et al., 2020 (PMID 33023908). They show that this activation requires the linker between DH and PH domain of PRG, as well as Gαs activation, which requires a change in PRG DH-PH conformation. This conformational switch does not happen in vitro, which might explain why the affinity against Cdc42 was found to be very low.
Minor points
In both the abstract and the introduction the authors state, "we show that a single protein can trigger either protrusion or retraction when recruited to the plasma membrane, polarizing the cell in two opposite directions." However, the cells do not polarize in opposite directions, ie the cells that retract do not protrude in the direction opposite the retraction (or at least that is not shown). Rather a single protein can trigger either protrusion or retraction when recruited to the plasma membrane, depending upon expression levels.
We thank the reviewer for this remark, and we agree that we had not shown any data supporting a change in polarization. We solved this issue, by showing now in Supplementary Figure 1 the change in areas in both the activated and in the not activated region. The data clearly show that when a protrusion is happening, the cell retracts in the non-activated region. On the other hand, when the cell retracts, a protrusion happens in the other part of the cell, while the total area is staying approximately constant.
We added the following sentence to describe our new figure:
Quantification of the changes in membrane area in both the activated and non-activated part of the cell (Supp Figure 1B-C) reveals that the whole cell is moving, polarizing in one direction or the other upon optogenetic activation.
While the authors provide extensive quantitative data in this manuscript and quantify the relative differences in expression levels that result in the different phenotypes, it would be helpful to quantify the absolute levels of expression of these GEFs relative to e.g. an endogenously expressed GEF.
We agree with the reviewer comment, and we also wanted to have an idea of the absolute level of expression of GEFs present in these cells to be able to relate fluorescent intensities with absolute concentrations. We tried different methods, especially with the purified fluorescent protein, but having exact numbers is a hard task.
We ended up quantifying the amount of fluorescent protein within a stable cell line thanks to ELISA and comparing it with the mean fluorescence seen under the microscope.
We estimated that the switch concentration was around 200nM, which is 8 times more than the mean endogenous concentration according to https://opencell.czbiohub.org/, but should be reachable locally in wild type cell, or globally in mutated cancer cells.
Given the numerical data (mostly) in hand, it would be interesting to determine whether RhoGEF2 levels, cell area, the pattern of actin assembly, or some other property is most predictive of the response to PRG DHPH recruitment.
We think that the manuscript made it clear that the concentration of PRG DHPH is almost 100% predictive of the response to PRG DHPH. We believe that other phenotypes such as the cell area or the pattern of actin assembly would only be consequences of this. Interestingly, as experimentators we were absolutely not able to predict the behavior by only seeing the shape of the cell, event after hundreds of activation experiments, and we tried to find characteristics that would distinguish both populations with the data in our hands and could not find any.
There is some room for general improvement/editing of the text.
We tried our best to improve the text, following reviewers suggestions.
Author response:
The following is the authors’ response to the previous reviews.
Reviewer #2:
(1) The use of two m<sup>5</sup>C reader proteins is likely a reason for the high number of edits introduced by the DRAM-Seq method. Both ALYREF and YBX1 are ubiquitous proteins with multiple roles in RNA metabolism including splicing and mRNA export. It is reasonable to assume that both ALYREF and YBX1 bind to many mRNAs that do not contain m<sup>5</sup>C.
To substantiate the author's claim that ALYREF or YBX1 binds m<sup>5</sup>C-modified RNAs to an extent that would allow distinguishing its binding to non-modified RNAs from binding to m<sup>5</sup>C-modified RNAs, it would be recommended to provide data on the affinity of these, supposedly proven, m<sup>5</sup>C readers to non-modified versus m<sup>5</sup>C-modified RNAs. To do so, this reviewer suggests performing experiments as described in Slama et al., 2020 (doi: 10.1016/j.ymeth.2018.10.020). However, using dot blots like in so many published studies to show modification of a specific antibody or protein binding, is insufficient as an argument because no antibody, nor protein, encounters nanograms to micrograms of a specific RNA identity in a cell. This issue remains a major caveat in all studies using so-called RNA modification reader proteins as bait for detecting RNA modifications in epitranscriptomics research. It becomes a pertinent problem if used as a platform for base editing similar to the work presented in this manuscript.
The authors have tried to address the point made by this reviewer. However, rather than performing an experiment with recombinant ALYREF-fusions and m<sup>5</sup>C-modified to unmodified RNA oligos for testing the enrichment factor of ALYREF in vitro, the authors resorted to citing two manuscripts. One manuscript is cited by everybody when it comes to ALYREF as m<sup>5</sup>C reader, however none of the experiments have been repeated by another laboratory. The other manuscript is reporting on YBX1 binding to m<sup>5</sup>C-containing RNA and mentions PAR-CLiP experiments with ALYREF, the details of which are nowhere to be found in doi: 10.1038/s41556-019-0361-y.<br /> Furthermore, the authors have added RNA pull-down assays that should substitute for the requested experiments. Interestingly, Figure S1E shows that ALYREF binds equally well to unmodified and m<sup>5</sup>C-modified RNA oligos, which contradicts doi:10.1038/cr.2017.55, and supports the conclusion that wild-type ALYREF is not specific m<sup>5</sup>C binder. The necessity of including always an overexpression of ALYREF-mut in parallel DRAM experiments, makes the developed method better controlled but not easy to handle (expression differences of the plasmid-driven proteins etc.)
Thank you for pointing this out. First, we would like to correct our previous response: the binding ability of ALYREF to m<sup>5</sup>C-modified RNA was initially reported in doi: 10.1038/cr.2017.55, (and not in doi: 10.1038/s41556-019-0361-y), where it was observed through PAR-CLIP analysis that the K171 mutation weakens its binding affinity to m<sup>5</sup>C -modified RNA.
Our previous experimental approach was not optimal: the protein concentration in the INPUT group was too high, leading to overexposure in the experimental group. Additionally, we did not conduct a quantitative analysis of the results at that time. In response to your suggestion, we performed RNA pull-down experiments with YBX1 and ALYREF, rather than with the pan-DRAM protein, to better validate and reproduce the previously reported findings. Our quantitative analysis revealed that both ALYREF and YBX1 exhibit a stronger affinity for m<sup>5</sup>C -modified RNAs. Furthermore, mutating the key amino acids involved in m<sup>5</sup>C recognition significantly reduced the binding affinity of both readers. These results align with previous studies (doi: 10.1038/cr.2017.55 and doi: 10.1038/s41556-019-0361-y), confirming that ALYREF and YBX1 are specific readers of m<sup>5</sup>C -modified RNAs. However, our detection system has certain limitations. Despite mutating the critical amino acids, both readers retained a weak binding affinity for m<sup>5</sup>C, suggesting that while the mutation helps reduce false positives, it is still challenging to precisely map the distribution of m<sup>5</sup>C modifications. To address this, we plan to further investigate the protein structure and function to obtain a more accurate m<sup>5</sup>C sequencing of the transcriptome in future studies. Accordingly, we have updated our results and conclusions in lines 294-299 and discuss these limitations in lines 109-114.
In addition, while the m<sup>5</sup>C assay can be performed using only the DRAM system alone, comparing it with the DRAM<sup>mut</sup>C control enhances the accuracy of m<sup>5</sup>C region detection. To minimize the variations in transfection efficiency across experimental groups, it is recommended to use the same batch of transfections. This approach not only ensures more consistent results but also improve the standardization of the DRAM assay, as discussed in the section added on line 308-312.
(2) Using sodium arsenite treatment of cells as a means to change the m<sup>5</sup>C status of transcripts through the downregulation of the two major m<sup>5</sup>C writer proteins NSUN2 and NSUN6 is problematic and the conclusions from these experiments are not warranted. Sodium arsenite is a chemical that poisons every protein containing thiol groups. Not only do NSUN proteins contain cysteines but also the base editor fusion proteins. Arsenite will inactivate these proteins, hence the editing frequency will drop, as observed in the experiments shown in Figure 5, which the authors explain with fewer m<sup>5</sup>C sites to be detected by the fusion proteins.
The authors have not addressed the point made by this reviewer. Instead the authors state that they have not addressed that possibility. They claim that they have revised the results section, but this reviewer can only see the point raised in the conclusions. An experiment would have been to purify base editors via the HA tag and then perform some kind of binding/editing assay in vitro before and after arsenite treatment of cells.
We appreciate the reviewer’s insightful comment. We fully agree with the concern raised. In the original manuscript, our intention was to use sodium arsenite treatment to downregulate NSUN mediated m<sup>5</sup>C levels and subsequently decrease DRAM editing efficiency, with the aim of monitoring m<sup>5</sup>C dynamics through the DRAM system. However, as the reviewer pointed out, sodium arsenite may inactivate both NSUN proteins and the base editor fusion proteins, and any such inactivation would likely result in a reduced DRAM editing. This confounds the interpretation of our experimental data.
As demonstrated in Appendix A, western blot analysis confirmed that sodium arsenite indeed decreased the expression of fusion proteins. In addition, we attempted in vitro fusion protein purification using multiple fusion tags (HIS, GST, HA, MBP) for DRAM fusion protein expression, but unfortunately, we were unable to obtain purified proteins. However, using the Promega TNT T7 Rapid Coupled In Vitro Transcription/Translation Kit, we successfully purified the DRAM protein (Appendix B). Despite this success, subsequent in vitro deamination experiments did not yield the expected mutation results (Appendix C), indicating that further optimization is required. This issue is further discussed in line 314-315.
Taken together, the above evidence supports that the experiment of sodium arsenite treatment was confusing and we determined to remove the corresponding results from the main text of the revised manuscript.
Author response image 1.
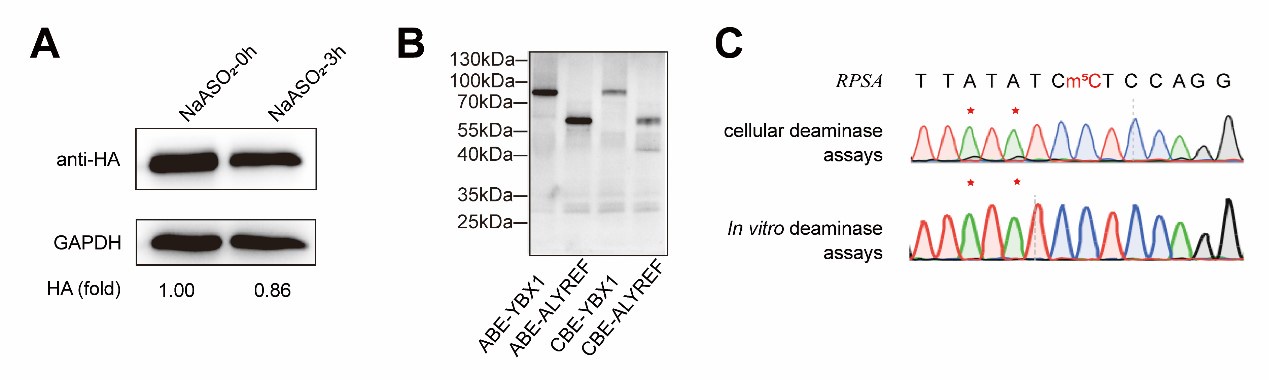
(3) The authors should move high-confidence editing site data contained in Supplementary Tables 2 and 3 into one of the main Figures to substantiate what is discussed in Figure 4A. However, the data needs to be visualized in another way then excel format. Furthermore, Supplementary Table 2 does not contain a description of the columns, while Supplementary Table 3 contains a single row with letters and numbers.
The authors have not addressed the point made by this reviewer. Figure 3F shows the screening process for DRAM-seq assays and principles for screening high-confidence genes rather than the data contained in Supplementary Tables 2 and 3 of the former version of this manuscript.
Thank you for your valuable suggestion. We have visualized the data from Supplementary Tables 2 and 3 in Figure 4A as a circlize diagram (described in lines 213-216), illustrating the distribution of mutation sites detected by the DRAM system across each chromosome. Additionally, to improve the presentation and clarity of the data, we have revised Supplementary Tables 2 and 3 by adding column descriptions, merging the DRAM-ABE and DRAM-CBE sites, and including overlapping m<sup>5</sup>C genes from previous datasets.
Author response:
The following is the authors’ response to the previous reviews.
Public Reviews:
Reviewer #2 (Public Review):
Summary:
The manuscript by Kelbert et al. presents results on the involvement of the yeast transcription factor Sfp1 in the stabilisation of transcripts whose synthesis it stimulates. Sfp1 is known to affect the synthesis of a number of important cellular transcripts, such as many of those that code for ribosomal proteins. The hypothesis that a transcription factor can remain bound to the nascent transcript and affect its cytoplasmic half-life is attractive. However, the association of Sfp1 with cytoplasmic transcripts remains to be validated, as explained in the following comments:
A two-hybrid based assay for protein-protein interactions identified Sfp1, a transcription factor known for its effects on ribosomal protein gene expression, as interacting with Rpb4, a subunit of RNA polymerase II. Classical two-hybrid experiments depend on the presence of the tested proteins in the nucleus of yeast cells, suggesting that the observed interaction occurs in the nucleus. Unfortunately, the two-hybrid method cannot determine whether the interaction is direct or mediated by nucleic acids. The revised version of the manuscript now states that the observed interaction could be indirect.
To understand to which RNA Sfp1 might bind, the authors used an N-terminally tagged fusion protein in a cross-linking and purification experiment. This method identified 264 transcripts for which the CRAC signal was considered positive and which mostly correspond to abundant mRNAs, including 74 ribosomal protein mRNAs or metabolic enzyme-abundant mRNAs such as PGK1. The authors did not provide evidence for the specificity of the observed CRAC signal, in particular what would be the background of a similar experiment performed without UV cross-linking. This is crucial, as Figure S2G shows very localized and sharp peaks for the CRAC signal, often associated with over-amplification of weak signal during sequencing library preparation.
(1) To rule out possible PCR artifacts, we used a UMI (Unique Molecular Identifier) scan. UMIs are short, random sequences added to each molecule by the 5’ adapter to uniquely tag them. After PCR amplification and alignment to the reference genome, groups of reads with identical UMIs represent only one unique original molecule. Thus, UMIs allow distinguishing between original molecules and PCR duplicates, effectively eliminating the duplicates.
(2) Looking closely at the peaks using the IGV browser, we noticed that the reads are by no means identical. Each carrying a mutation [probably due to the cross-linking] in a different position and having different length. Note that the reads are highly reproducible in two replicate.
(3) CRAC+ genes do not all fall into the category of highly transcribed genes. On the contrary, as depicted in Figure 6A (green dots), it is evident that CRAC+ genes exhibit a diverse range of Rpb3 ChIP and GRO signals. Furthermore, as illustrated in Figure 7A, when comparing CRAC+ to Q1 (the most highly transcribed genes), it becomes evident that the Rpb4/Rpb3 profile of CRAC+ genes is not a result of high transcription levels.
(4) Only a portion of the RiBi mRNAs binds Sfp1, despite similar expression of all RiBi.
(5) The CRAC+ genes represent a distinct group with many unique features. Moreover, many CRAC+ genes do not fall into the category of highly transcribed genes.
(6) The biological significance of the 262 CRAC+ mRNAs was demonstrated by various experiments; all are inconsistent with technical flaws. Some examples are:
a) Fig. 2a and B show that most reads of CRAC+ mRNA were mapped to specific location – close the pA sites.
b) Fig. 2C shows that most reads of CRAC+ mRNA were mapped to specific RNA motif.
c) Most RiBi CRAC+ promoter contain Rap1 binding sites (p= 1.9x10⁻²²), whereas the vast majority of RiBi CRAC- promoters do not contain Rap1 binding site. (Fig. 3C).
d) Fig. 4A shows that RiBi CRAC+ mRNAs become destabilized due to Sfp1 deletion, whereas RiBi CRAC- mRNAs do not. Fig. 4B shows similar results due to
e) Fig. 6B shows that the impact of Sfp1 on backtracking is substantially higher for CRAC+ than for CRAC- genes. This is most clearly visible in RiBi genes.
f) Fig. 7A shows that the Sfp1-dependent changes along the transcription units is substantially more rigorous for CRAC+ than for CRAC-.
g) Fig. S4B Shows that chromatin binding profile of Sfp1 is different for CRAC+ and CRAC- genes
In a validation experiment, the presence of several mRNAs in a purified SFP1 fraction was measured at levels that reflect the relative levels of RNA in a total RNA extract. Negative controls showing that abundant mRNAs not found in the CRAC experiment were clearly depleted from the purified fraction with Sfp1 would be crucial to assess the specificity of the observed protein-RNA interactions (to complement Fig. 2D).
GPP1, a highly expressed genes, is not to be pulled down by Sfp1 (Fig. 2D). GPP1 (alias RHR2) was included in our Table S2 as one of the 264 CRAC+ genes, having a low CRAC value. However, when we inspected GPP1 results using the IGV browser, we realized that the few reads mapped to GPP1 are actually anti-sense to GPP1 (perhaps they belong to the neighboring RPL34B genes, which is convergently transcribed to GPP1) (see Fig. 1 at the bottom of the document). Thus, GPP1 is not a CRAC+ gene and would now serve as a control. See We changed the text accordingly (see page 11 blue sentences). In light of this observation, we checked other CRAC genes and found that, except for ALG2, they all contain sense reads (some contain both sense and anti-sense reads). ALG2 and GPP1 were removed leaving 262 CRAC+ genes.
The CRAC-selected mRNAs were enriched for genes whose expression was previously shown to be upregulated upon Sfp1 overexpression (Albert et al., 2019). The presence of unspliced RPL30 pre-mRNA in the Sfp1 purification was interpreted as a sign of co-transcriptional assembly of Sfp1 into mRNA, but in the absence of valid negative controls, this hypothesis would require further experimental validation. Also, whether the fraction of mRNA bound by Sfp1 is nuclear or cytoplasmic is unclear.
Further experimental validation was provided in some of our figures (e.g., Fig. 5C, Fig. 3B).
We argue that Sfp1 binds RNA co-transcriptionally and accompanies the mRNA till its demise in the cytoplasm: Co-transcriptional binding is shown in: (I) a drop in the Sfp1 ChIP-exo signal that coincides with the position of Sfp1 binding site in the RNA (Fig. 5C), demonstrating a movement of Sfp1 from chromatin to the transcript, (II) the dependence of Sfp1 RNA-binding on the promoter (Fig. 3B) and binding of intron-containing RNA. Taken together these 3 different experiments demonstrate that Sfp1 binds Pol II transcript co-transcriptionally. Association of Sfp1 with cytoplasmic mRNAs is shown in the following experiments: (I) Figure 2D shows that Sfp1 pulled down full length RNA, strongly suggesting that these RNA are mature cytoplasmic mRNAs. (II) mRNA encoding ribosomal proteins, which belong to the CRAC+ mRNAs group are degraded by Xrn1 in the cytoplasm (Bresson et al., Mol Cell 2020). The capacity of Sfp1 to regulates this process (Fig. 4A-D) is therefore consistent with cytoplasmic activity of Sfp1. (III) The effect of Sfp1 on deadenylation (Fig. 4D), a cytoplasmic process, is also consistent with cytoplasmic activity of Sfp1.
To address the important question of whether co-transcriptional assembly of Spf1 with transcripts could alter their stability, the authors first used a reporter system in which the RPL30 transcription unit is transferred to vectors under different transcriptional contexts, as previously described by the Choder laboratory (Bregman et al. 2011). While RPL30 expressed under an ACT1 promoter was barely detectable, the highest levels of RNA were observed in the context of the native upstream RPL30 sequence when Rap1 binding sites were also present. Sfp1 showed better association with reporter mRNAs containing Rap1 binding sites in the promoter region. Removal of the Rap1 binding sites from the reporter vector also led to a drastic decrease in reporter mRNA levels. Co-purification of reporter RNA with Sfp1 was only observed when Rap1 binding sites were included in the reporter. Negative controls for all the purification experiments might be useful.
In the swapping experiment, the plasmid lacking RapBS serves as the control for the one with RapBS and vice versa (see Bregman et al., 2011). Remember, that all these contracts give rise to identical RNA. Indeed, RabBS affects both mRNA synthesis and decay, therefore the controls are not ideal. However, see next section.
More importantly, in Fig. 3B “Input” panel, one can see that the RNA level of “construct F” was higher than the level of “construct E”. Despite this difference, only the RNA encoded by construct E was detected in the IP panel. This clearly shows that the detection of the RNA was not merely a result of its expression level.
To complement the biochemical data presented in the first part of the manuscript, the authors turned to the deletion or rapid depletion of SFP1 and used labelling experiments to assess changes in the rate of synthesis, abundance and decay of mRNAs under these conditions. An important observation was that in the absence of Sfp1, mRNAs encoding ribosomal protein genes not only had a reduced synthesis rate, but also an increased degradation rate. This important observation needs careful validation,
Indeed, we do provide validations in Fig. 4C Fig. 4D Fig. S3A and during the revision we included an additional validation as Fig. S3B. Of note, we strongly suspect that GRO is among the most reliable approaches to determine half-lives (see our response in the first revision letter).
As genomic run-on experiments were used to measure half-lives, and this particular method was found to give results that correlated poorly with other measures of half-life in yeast (e.g. Chappelboim et al., 2022 for a comparison). As an additional validation, a temperature shift to 42{degree sign}C was used to show that , for specific ribosomal protein mRNA, the degradation was faster, assuming that transcription stops at that temperature. It would be important to cite and discuss the work from the Tollervey laboratory showing that a temperature shift to 42{degree sign}C leads to a strong and specific decrease in ribosomal protein mRNA levels, probably through an accelerated RNA degradation (Bresson et al., Mol Cell 2020, e.g. Fig 5E).
This was cited. Thank you.
Finally, the conclusion that mRNA deadenylation rate is altered in the absence of Sfp1, is difficult to assess from the presented results (Fig. 3D).
This type of experiment was popular in the past. The results in the literature are similar to ours (in fact, ours are nicer). Please check the papers cited in our MS and a number of papers by Roy Parker.
The effects of SFP1 on transcription were investigated by chromatin purification with Rpb3, a subunit of RNA polymerase, and the results were compared with synthesis rates determined by genomic run-on experiments. The decrease in polII presence on transcripts in the absence of SFP1 was not accompanied by a marked decrease in transcript output, suggesting an effect of Sfp1 in ensuring robust transcription and avoiding RNA polymerase backtracking. To further investigate the phenotypes associated with the depletion or absence of Sfp1, the authors examined the presence of Rpb4 along transcription units compared to Rpb3. An effect of spf1 deficiency was that this ratio, which decreased from the start of transcription towards the end of transcripts, increased slightly. To what extent this result is important for the main message of the manuscript is unclear.
Suggestions: a) please clearly indicate in the figures when they correspond to reanalyses of published results.
This was done.
b) In table S2, it would be important to mention what the results represent and what statistics were used for the selection of "positive" hits.
This was discussed in the text.
Strengths:
- Diversity of experimental approaches used.
- Validation of large-scale results with appropriate reporters.
Weaknesses:
- Lack of controls for the CRAC results and lack of negative controls for the co-purification experiments that were used to validate specific mRNA targets potentially bound by Sfp1.
- Several conclusions are derived from complex correlative analyses that fully depend on the validity of the aforementioned Sfp1-mRNA interactions.
We hope that our responses to Reviewer 2's thoughtful comments have rulled out concerns regarding the lack of controls.
Recommendations for the authors:
Reviewer #2 (Recommendations For The Authors):
Please review the text for spelling errors. While not mandatory, wig or begraph files for the CRAC results would be very useful for the readers.
Author response image 1.
A snapshot of IGV GPP1 locus showing that all the reads are anti-sense (pointing at the opposite direction of the gene (the gene arrows [white arrows over blue, at the bottom] are pointing to the right whereas the reads’ orientations are pointing to the left).
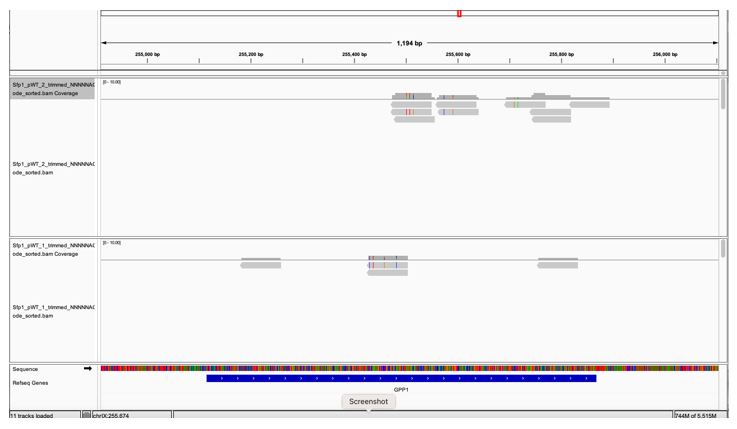
Author Response
The following is the authors’ response to the original reviews.
eLife assessment
This research advance arctile describes a valuable image analysis method to identify individual cells (neurons) within a population of fluorescently labeled cells in the nematode C. elegans. The findings are solid and the method succeeds to identify cells with high precision. The method will be valuable to the C. elegans research community.
Public Reviews:
Reviewer #1 (Public Review):
In this paper, the authors developed an image analysis pipeline to automatically identify individual neurons within a population of fluorescently tagged neurons. This application is optimized to deal with multi-cell analysis and builds on a previous software version, developed by the same team, to resolve individual neurons from whole-brain imaging stacks. Using advanced statistical approaches and several heuristics tailored for C. elegans anatomy, the method successfully identifies individual neurons with a fairly high accuracy. Thus, while specific to C. elegans, this method can become instrumental for a variety of research directions such as in-vivo single-cell gene expression analysis and calcium-based neural activity studies.
The analysis procedure depends on the availability of an accurate atlas that serves as a reference map for neural positions. Thus, when imaging a new reporter line without fair prior knowledge of the tagged cells, such an atlas may be very difficult to construct. Moreover, usage of available reference atlases, constructed based on other databases, is not very helpful (as shown by the authors in Fig 3), so for each new reporter line a de-novo atlas needs to be constructed.
We thank the reviewer for pointing out a place where we can use some clarification. While in principle that every new reporter line would need fair prior knowledge, atlases are either already available or not difficult to construct. If one can make the assumption that the anatomy of a particular line is similar to existing atlases (Yemini 2021,Nejatbakhsh 2023,Toyoshima 2020), the cell ID can be immediately performed. Even in the case that one suspects the anatomy may have changes from existing atlases (e.g. in the case of examining mutants), existing atlases can serve as a starting point to provide a draft ID, which facilitates manual annotation. Once manual annotations on ~5 animals are available as we have shown in this work (which is a manageable number in practice), this new dataset can be used to build an updated atlas that can be used for future inferences. We have added this discussion in the manuscript: “If one determines that the anatomy of a particular animal strain is substantially different from existing atlases, new atlases can be easily constructed using existing atlases as starting points.” (page 18).
I have a few comments that may help to better understand the potential of the tool to become handy.
- I wonder the degree by which strain mosaicism affects the analysis (Figs 1-4) as it was performed on a non-integrated reporter strain. As stated, for constructing the reference atlas, the authors used worms in which they could identify the complete set of tagged neurons. But how senstiive is the analysis when assaying worms with different levels of mosaicism? Are the results shown in the paper stem from animals with a full neural set expression? Could the authors add results for which the assayed worms show partial expression where only 80%, 70%, 50% of the cells population are observed, and how this will affect idenfication accuracy? This may be important as many non-integrated reporter lines show high mosaic patterns and may therefore not be suitable for using this analytic method. In that sense, could the authors describe the mosaic degree of their line used for validating the method.
We appreciate the reviewer for this comment. We want to clarify that most of the worms used in the construction of the atlas are indeed affected by mosaicism and thus do not express the full set of candidate neurons. We have added such a plot as requested (Figure 3 – figure supplement 2, copied below). Our data show that there is no correlation between the fraction of cells expressed in a worm and neuron ID correspondence. We agree with the reviewer this additional insight may be helpful; we have modified the text to include this discussion: “Note that we observed no correlation between the degree of mosaicism and neuron ID correspondence (Figure 3- figure supplement 2).” (page 10).
Author response image 1.
No correlation between the degree of mosaicism (fraction of cells expressed in the worm) and neuron ID correspondence.
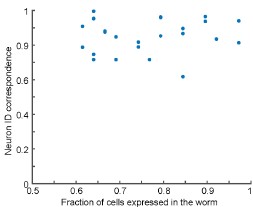
- For the gene expression analysis (Fig 5), where was the intensity of the GFP extracted from? As it has no nuclear tag, the protein should be cytoplasmic (as seen in Fig 5a), but in Fig 5c it is shown as if the region of interest to extract fluorescence was nuclear. If fluorescence was indeed extracted from the cytoplasm, then it will be helpful to include in the software and in the results description how this was done, as a huge hurdle in dissecting such multi-cell images is avoiding crossreads between adjacent/intersecting neurons.
For this work, we used nuclear-localized RFP co-expressed in the animal, and the GFP intensities were extracted from the same region RFP intensities were extracted. If cytosolic reporters are used, one would imagine a membrane label would be necessary to discern the border of the cells. We clarified our reagents and approach in the text: “The segmentation was done on the nuclear-localized mCherry signals, and GFP intensities were extracted from the same region.” (page21).
- In the same mater: In the methods, it is specified that the strain expressing GCAMP was also used in the gene expression analysis shown in Figure 5. But the calcium indicator may show transient intensities depending on spontaneous neural activity during the imaging. This will introduce a significant variability that may affect the expression correlation analysis as depicted in Figure 5.
We apologize for the error in text. The strain used in the gene expression analysis did not express GCaMP. We did not analyze GCaMP expression in figure 5. We have corrected the error in the methods.
Reviewer #2 (Public Review):
The authors succeed in generalizing the pre-alignment procedure for their cell idenfication method to allow it to work effectively on data with only small subsets of cells labeled. They convincingly show that their extension accurately identifies head angle, based on finding auto fluorescent tissue and looking for a symmetric l/r axis. They demonstrate that the method works to identify known subsets of neurons with varying accuracy depending on the nature of underlying atlas data. Their approach should be a useful one for researchers wishing to identify subsets of head neurons in C. elegans, for example in whole brain recording, and the ideas might be useful elsewhere.
The authors also strive to give some general insights on what makes a good atlas. It is interesting and valuable to see (at least for this specific set of neurons) that 5-10 ideal examples are sufficient. However, some critical details would help in understanding how far their insights generalize. I believe the set of neurons in each atlas version are matched to the known set of cells in the sparse neuronal marker, however this critical detail isn't explicitly stated anywhere I can see.
This is an important point. We have made text modifications to make it clear to the readers that for all atlases, the number of entities (candidate list) was kept consistent as listed in the methods. In the results section under “CRF_ID 2.0 for automatic cell annotation in multi-cell images,” we added the following sentence: “Note that a truncated candidate list can be used for subse-tspecific cell ID if the neuronal expression is known” (page 3). In the methods section, we added the following sentence: “For multi-cell neuron predictions on the glr-1 strain, a truncated atlas containing only the above 37 neurons was used to exclude neuron candidates that are irrelevant for prediction” (Page 20).
In addition, it is stated that some neuron positions are missing in the neuropal data and replaced with the (single) position available from the open worm atlas. It should be stated how many neurons are missing and replaced in this way (providing weaker information).
We modified the text in the result section as follows: “Eight out of 37 candidate neurons are missing in the neuroPAL atlas, which means 40% of the pairwise relationships of neurons expressing the glr-1p::NLS-mcherry transgene were not augmented with the NeuroPAL data but were assigned the default values from the OpenWorm atlas” (page 10).
It also is not explicitly stated that the putative identities for the uncertain cells (designated with Greek letters) are used to sample the neuropal data. Large numbers of openworm single positions or if uncertain cells are misidentified forcing alignment against the positions of nearby but different cells would both handicap the neuropal atlas relative to the matched florescence atlas. This is an important question since sufficient performance from an ideal neuropal atlas (subsampled) would avoid the need for building custom atlases per strain.
The putative identities are not used to sample the NeuroPAL data. They were used in the glr-1 multi-cell case to indicate low confidence in manual identification/annotation. For all steps of manual annotation and CRF_ID predictions, we used real neuron labels, and the Greek labels were used for reporting purposes only. It is true that the OpenWorm values (40% of the atlas) would be a handicap for the neuroPAL atlas. This is mainly due to the difficulty of obtaining NeuroPAL data as it requires 3-color fluorescence microscopy and significant time and labor to annotate the large set of neurons. This is one reason to take a complementary approach as we do in this paper.
Reviewer #1 (Recommendations For The Authors):
- Figure 3, there is a confusion in the legend relating to panels c-e (e.g. panel c is neuron ID accuracy but it is described per panel e in the legend.
We made the necessary changes.
- Figure 3, were statistical tests performed for panels d-e? if so, and the outcome was not significant, then it might be good to indicate this in the legend.
We have added results of statistical tests in the legend as the following sentence: “All distributions in panel d and e had a p-value of less than 0.0001 for one sample t-test against zero.” One sample t-tests were performed because what is plotted already represents each atlas’ differences to the glr-1 25 dataset atlas, we didn’t think the statistical analyses between the other atlases would add significant value.
- Figure 4, no asterisks are shown in the figure so it is possible to remove the sentence in the legend describing what the asterisk stands for.
Thank you. We made the necessary changes.
Reviewer #2 (Recommendations For The Authors):
Comparison with deep learning approaches could be more nuanced and structured, the authors (prior) approach extended here combines a specific set of comparative relationship measurements with a general optimization approach for matching based on comparative expectations. Other measurements could be used whether explicit (like neighbor expectations) or learned differences in embeddings. These alternate measurements would both need to be extensively re-calibrated for different sets of cells but might provide significant performance gains. In addition deep learning approaches don't solve the optimization part of the matching problem, so the authors approach seems to bring something strong to the table even if one is committed to learned methods (necessary I suspect for human level performance in denser cell sets than the relatively small number here). A more complete discussion of these themes might better frame the impact of the work and help readers think about the advantages and disadvantages or different methods for their own data.
We thank the reviewer for bringing up this point. We apologize perhaps not making the point clearer in the original submission. This extension of the original work (Chaudhary et al) is not changing the CRF-based framework, but only augmenting the approach with a better defined set of axes (solely because in multicell and not whole-brain datasets, the sparsity of neurons degrades the axis definition and consequently the neuron ID predictions). We are not fundamentally changing the framework, and therefore all the advantages (over registration-based approaches for example) also apply here. The other purpose of this paper is to demonstrate a couple of use-cases for gene expression analysis, which is common in studies in C. elegans (and other organisms). We hope that by showing a use-case others can see how this approach is useful for their own applications.
We have clarified these points in the paper (page 18). “The fundamental framework has not been changed from CRF_ID 1.0, and therefore the advantages of CRF_ID outlined in the original work apply for CRF_ID 2.0 as well.”
The atribution of anatomical differences to strain is interesting, but seems purely speculative, and somewhat unlikely. I would suspect the fundamentally more difficult nature of aligning N items to M>>N items in an atlas accounts for the differences in using the neuroPAL vs custom atlas here. If this is what is meant, it could be stated more clearly.
It is important to note that the same neuron candidate list (listed in methods) was used for all atlases, so there is no difference among the atlases in terms of the number of cells in the query vs. candidate list. In other words, the same values for M and for N are used regardless of the reference atlas used.
We have preliminary data indicating differences between the NeuroPAL and custom atlas. For instance, the NeuroPAL atlas scales smaller than the custom glr-1 atlas. Since direct comparisons of the different atlases are beyond the scope of this paper, we will leave the exact comparisons for future work. We suspect that the differences are from a combination of differences in anatomy and imaging conditions. While NeuroPAL atlas may not be exactly fitting for the custom dataset, it can serve as a good starting point for guesses when no custom atlases are available, as we have discussed earlier (response to Public Comments from Reviewer 1 Point 1). As explained earlier, we have added these discussions in the paper (see page 18).
I was also left wondering if the random removal of landmarks had to be adjusted in this work given it is (potentially) helping cope with not just occasional weak cells but the systematic loss of most of the cells in the atlas. If the parameters of this part of the algorithm don't influence the success for N to M>>N alignment (here when the neuroPAL or OpenWorm atlas is used) this seems interesting in itself and worth discussing. Conversely, if these parameters were opitmized for the matched atlas and used for the others, this would seem to bias performance results.
We may have failed to make this clear in the main text. As we have stated in our responses in the public review section, we do systematically limit the neuron labels in the candidate list to neurons that are known to be expressed by the promotor. The candidate list, which is kept consistent for all atlases, has more neurons than cells in the query, so it is always an N-to-M matching where M>N. We did not use landmarks, but such usage is possible and will only improve the matching.
We have attempted to clarify these points in the manuscript. In the results section under “CRF_ID 2.0 for automatic cell annotation in multi-cell images,” we added the following sentence: “Note that a truncated candidate list can be used for subset-specific cell ID if the neuronal expression is known” (page 3). In the methods section, we added the following sentence: “For multi-cell neuron predictions on the glr-1 strain, a truncated atlas containing only the above 37 neurons was used to exclude neuron candidates that are irrelevant for prediction” (Page 20).
Author response:
The following is the authors’ response to the original reviews.
New Experiments
(1) Activation-dependent dynamics of PKA with the RIα regulatory subunit, adding to the answer to Reviewers 1 and 2. To determine the dynamics of all PKA isoforms, we have added experiments that used PKA-RIα as the regulatory subunit. We found differential translocation between PKA-C (co-expressed with PKA-RIα) and PKA-RIα (Figure 1–figure supplement 3), similar to the results when PKA-RIIα or PKA-RIβ was used.
(2) PKA-C dynamics elicited by a low concentration of norepinephrine, addressing Reviewer 3’s comment. We have found that PKA-C (co-expressed with RIIα) exhibited similar translocation into dendritic spines in the presence of a 5x lowered concentration (2 μM) of norepinephrine, suggesting that the translocation occurs over a wide range of stimulus strengths (Figure 1-figure supplement 2).
Reviewer #1 (Public Review):
Summary:
This is a short self-contained study with a straightforward and interesting message. The paper focuses on settling whether PKA activation requires dissociation of the catalytic and regulatory subunits. This debate has been ongoing for ~ 30 years, with renewed interest in the question following a publication in Science, 2017 (Smith et al.). Here, Xiong et al demonstrate that fusing the R and C subunits together (in the same way as Smith et al) prevents the proper function of PKA in neurons. This provides further support for the dissociative activation model - it is imperative that researchers have clarity on this topic since it is so fundamental to building accurate models of localised cAMP signalling in all cell types. Furthermore, their experiments highlight that C subunit dissociation into spines is essential for structural LTP, which is an interesting finding in itself. They also show that preventing C subunit dissociation reduces basal AMPA receptor currents to the same extent as knocking down the C subunit. Overall, the paper will interest both cAMP researchers and scientists interested in fundamental mechanisms of synaptic regulation.
Strengths:
The experiments are technically challenging and well executed. Good use of control conditions e.g untransfected controls in Figure 4.
We thank the reviewer for their accurate summarization of the position of the study in the field and for the positive evaluation of our study.
Weaknesses:
The novelty is lessened given the same team has shown dissociation of the C subunit into dendritic spines from RIIbeta subunits localised to dendritic shafts before (Tillo et al., 2017). Nevertheless, the experiments with RII-C fusion proteins are novel and an important addition.
We thank the reviewer for noticing our earlier work. The first part of the current work is indeed an extension of previous work, as we have articulated in the manuscript. However, this extension is important because recent studies suggested that the majority of PKA-RIIβ are axonal localized. The primary PKA subtypes in the soma and dendrite are likely PKA-RIβ or PKA-RIIα. Although it is conceivable that the results from PKA-RIIβ can be extended to the other subunits, given the current debate in the field regarding PKA dissociation (or not), it remains important to conclusively demonstrate that these other regulatory subunit types also support PKA dissociation within intact cells in response to a physiological stimulant. To complete the survey for all PKA-R isoforms, we have now added data for PKA-RIα (New Experiment #1), as they are also expressed in the brain (e.g., https://www.ncbi.nlm.nih.gov/gene/5573). Additionally, as the reviewer points out, our second part is a novel addition to the literature.
Reviewer #2 (Public Review):
Summary:
PKA is a major signaling protein that has been long studied and is vital for synaptic plasticity. Here, the authors examine the mechanism of PKA activity and specifically focus on addressing the question of PKA dissociation as a major mode of its activation in dendritic spines. This would potentially allow us to determine the precise mechanisms of PKA activation and address how it maintains spatial and temporal signaling specificity.
Strengths:
The results convincingly show that PKA activity is governed by the subcellular localization in dendrites and spines and is mediated via subunit dissociation. The authors make use of organotypic hippocampal slice cultures, where they use pharmacology, glutamate uncaging, and electrophysiological recordings.
Overall, the experiments and data presented are well executed. The experiments all show that at least in the case of synaptic activity, the distribution of PKA-C to dendritic spines is necessary and sufficient for PKA-mediated functional and structural plasticity.
The authors were able to persuasively support their claim that PKA subunit dissociation is necessary for its function and localization in dendritic spines. This conclusion is important to better understand the mechanisms of PKA activity and its role in synaptic plasticity.
We thank the reviewer for their positive evaluation of our study.
Weaknesses:
While the experiments are indeed convincing and well executed, the data presented is similar to previously published work from the Zhong lab (Tillo et al., 2017, Zhong et al 2009). This reduces the novelty of the findings in terms of re-distribution of PKA subunits, which was already established. A few alternative approaches for addressing this question: targeting localization of endogenous PKA, addressing its synaptic distribution, or even impairing within intact neuronal circuits, would highly strengthen their findings. This would allow us to further substantiate the synaptic localization and re-distribution mechanism of PKA as a critical regulator of synaptic structure, function, and plasticity.
We thank the reviewer for noticing our earlier work. The first part of the current work is indeed an extension of previous work, as we have articulated in the manuscript. However, this extension is important because recent studies suggested that the majority of PKA-RIIβ are axonal localized. The primary PKA subtypes in the soma and dendrite are likely PKA-RIβ or PKA-RIIα. Although it is conceivable that the results from PKA-RIIβ can be extended to the other subunits, given the current debate in the field regarding PKA dissociation (or not), it remains important to conclusively demonstrate that these other regulatory subunit types also support PKA dissociation within intact cells in response to a physiological stimulant. To complete the survey for all PKA-R isoforms, we have now added data for PKA-RIα (New Experiment #1), as they are also expressed in the brain (e.g., https://www.ncbi.nlm.nih.gov/gene/5573). Additionally, as Reviewer 1 points out, our second part is a novel addition to the literature.
We also thank the reviewer for suggesting the experiments to examine PKA’s synaptic localization and dynamics as a key mechanism underlying synaptic structure and function. We agree that this is a very interesting topic. At the same time, we feel that this mechanistic direction is open ended at this time and beyond what we try to conclude within this manuscript: prevention of PKA dissociation in neurons affects synaptic function. Therefore, we will save the suggested direction for future studies. We hope the reviewer understand.
Reviewer #3 (Public Review):
Summary:
Xiong et al. investigated the debated mechanism of PKA activation using hippocampal CA1 neurons under pharmacological and synaptic stimulations. Examining the two PKA major isoforms in these neurons, they found that a portion of PKA-C dissociates from PKA-R and translocates into dendritic spines following norepinephrine bath application. Additionally, their use of a non-dissociable form of PKC demonstrates its essential role in structural long-term potentiation (LTP) induced by two-photon glutamate uncaging, as well as in maintaining normal synaptic transmission, as verified by electrophysiology. This study presents a valuable finding on the activation-dependent re-distribution of PKA catalytic subunits in CA1 neurons, a process vital for synaptic functionality. The robust evidence provided by the authors makes this work particularly relevant for biologists seeking to understand PKA activation and its downstream effects essential for synaptic plasticity.
Strengths:
The study is methodologically robust, particularly in the application of two-photon imaging and electrophysiology. The experiments are well-designed with effective controls and a comprehensive analysis. The credibility of the data is further enhanced by the research team's previous works in related experiments. The conclusions of this paper are mostly well supported by data. The research fills a significant gap in our understanding of PKA activation mechanisms in synaptic functioning, presenting valuable insights backed by empirical evidence.
We thank the reviewer for their positive evaluation of our study.
Weaknesses:
The physiological relevance of the findings regarding PKA dissociation is somewhat weakened by the use of norepinephrine (10 µM) in bath applications, which might not accurately reflect physiological conditions. Furthermore, the study does not address the impact of glutamate uncaging, a well-characterized physiologically relevant stimulation, on the redistribution of PKA catalytic subunits, leaving some questions unanswered.
We agreed with the Reviewer that testing under physiological conditions is critical especially given the current debate in the literature. That is why we tested PKA dynamics induced by the physiological stimulant, norepinephrine. It has been suggested that, near the release site, local norepinephrine concentrations can be as high as tens of micromolar (Courtney and Ford, 2014). Based on this study, we have chosen a mid-range concentration (10 μM). At the same time, in light of the Reviewer’s suggestion, we have now also tested PKA-RIIα dissociation at a 5x lower concentration of norepinephrine (2 μM; New Experiment #2). The activation and translocation of PKA-C is also readily detectible under this condition to a degree comparable to when 10 μM norepinephrine was used.
Regarding the suggested glutamate uncaging experiment, it is extremely challenging because of finite signal-to-noise ratios in our experiments. From our past studies, we know that activated PKA-C can diffuse three dimensionally, with a fraction as membrane-associated proteins and the other as cytosolic proteins. Although we have evidence that its membrane affinity allows it to become enriched in dendritic spines, it is not known (and is unlikely) that activated PKA-C is selectively targeted to a particular spine. Glutamate uncaging of a single spine presumably would locally activate a small number of PKA-C. It will be very difficult to trace the 3D diffusion of these small number of molecules in the presence of surrounding resting-state PKA-C molecules. Finally, we hope the reviewer agrees that, regardless of the result of the glutamate uncaging experiment, the above new experiment (New Experiment #2) already indicate that certain physiologically relevant stimuli can drive PKA-C dissociation from PKA-R and translocation to spines, supporting our conclusion.
Reviewer #2 (Recommendations For The Authors):
It was a pleasure reading your paper, and the results are well-executed and well-presented.
My main and only recommendations are two ways to further expand the scope of the findings.
First, I believe addressing the endogenous localization of PKA-C subunit before and after PKA activation would be highly important to validate these claims. Overexpression of tagged proteins often shows vastly different subcellular distribution than their endogenous counterparts. Recent technological advances with CRISPR/Cas9 gene editing (Suzuki et al Nature 2016 and Gao et al Neuron 2019 for example) which the Zhong lab recently contributed to (Zhong et al 2021 eLife) allow us to tag endogenous proteins and image them in fixed or live neurons. Any experiments targeting endogenous PKA subunits that support dissociation and synaptic localization following activation would be very informative and greatly increase the novelty and impact of their findings.
We agreed that addressing the endogenous PKA dynamics is important. However, despite recent progress, endogenous labeling using CRISPR-based methods remains challenging and requires extensive optimization. This is especially true for signaling proteins whose endogenous abundance is often low. We have tried to label PKA catalytic subunits and regulatory subunits using both the homologous recombination-based method SLENDR and our own non-homologous end joining-based method CRISPIE. We did not succeed, in part because it is very difficult to see any signal under wide-field fluorescence conditions, which makes it difficult to screen different constructs for optimizing parameters. It is also possible that, at the endogenous abundance, the label is just not bright enough to be seen. Nevertheless, for both PKA type Iβ and type IIα that we studied in this manuscript, we have correlated the measured parameters (specifically, Spine Enrichment Index or SEI) with the overexpression level (Figure 1-figure supplement 1). We found that they are not strongly correlated with the expression level under our conditions. By extrapolating to non-overexpression conditions, our conclusion remains valid.
To overcome the inability to label endogenous PKA subunits using CRISPR-based methods, we have also attempted a conditional knock-in method call ENABLED that we previously developed to label PKA-Cα. In preliminary results, we found that endogenously label PKA were very dim. However, in a subset of cells that are bright enough to be quantified, the PKA catalytic subunit indeed translocated to dendritic spines upon stimulation (see Additional Fig. 1 in the next page), corroborating our results using overexpression. These results, however, are not ready to be published because characterization of the mouse line takes time and, at this moment, the signal-to-noise ratio remains low. We hope that the reviewer can understand.
Author response image 1.
Endogeneous PKA-Cα translocate to dendritic spines upon activation.
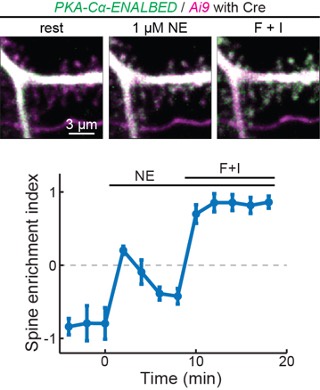
Second, experiments which would advance and validate these findings in vivo would be highly valuable. This could be achieved in a number of ways - one would be overexpression of tagged PKA versions and examining sub-cellular distribution before and after physiological activation in vivo. Another possibility is in vivo perturbation - one would speculate that disruption or tethering of PKA subunits to the dendrite would lead to cell-specific functional and structural impairments. This could be achieved in a similar manner to the in vitro experiments, with a PKA KO and replacement strategy of the tethered C-R plasmid, followed by structural or functional examination of neurons.
I would like to state that these experiments are not essential in my opinion, but any improvements in one of these directions would greatly improve and extend the impact and findings of this paper.
We thank the reviewer for the suggestion and the understanding. The suggested in vivo experiments are fascinating. However, in vivo imaging of dendritic spine morphology is already in itself challenging. The difficulty greatly increases when trying to detect partial, likely transient translocation of a signaling protein. It is also very difficult to knock down endogenous PKA while simultaneously expressing the R-C construct in a large number of cells to achieve detectable circuit or behavioral effect (and hope that compensation does not happen over weeks). We hope the reviewer agrees that these experiments would be their own project and go beyond the time and scope of the current study.
Reviewer #3 (Recommendations For The Authors):
Please elaborate on the methods used to visualize PKA-RIIα and PKA-RIβ subunits.
As suggested, we have now included additional details for visualizing PKA-Rs in the text. Specifically, we write (pg. 5): “…, as visualized using expressed PKA-R-mEGFP in separate experiments (Figs. 1A-1C).”.
Author response:
The following is the authors’ response to the original reviews.
Public Reviews:
Reviewer #1 (Public Review):
This is an interesting study investigating the mechanisms underlying membrane targeting of the NLRP3 inflammasome and reporting a key role for the palmitoylation-depalmitoylation cycle of cys130 in NRLP3. The authors identify ZDHHC3 and APT2 as the specific ZDHHC and APT/ABHD enzymes that are responsible for the s-acylation and de-acylation of NLRP3, respectively. They show that the levels of ZDHHC3 and APT2, both localized at the Golgi, control the level of palmitoylation of NLRP3. The S-acylation-mediated membrane targeting of NLRP3 cooperates with polybasic domain (PBD)-mediated PI4P-binding to target NLRP3 to the TGN under steady-state conditions and to the disassembled TGN induced by the NLRP3 activator nigericin.
However, the study has several weaknesses in its current form as outlined below.
(1) The novelty of the findings concerning cys130 palmitoylation in NLRP3 is unfortunately compromised by recent reports on the acylation of different cysteines in NLRP3 (PMID: 38092000), including palmitoylation of the very same cys130 in NLRP3 (Yu et al https://doi.org/10.1101/2023.11.07.566005), which was shown to be relevant for NLRP3 activation in cell and animal models. What remains novel and intriguing is the finding that NLRP3 activators induce an imbalance in the acylation-deacylation cycle by segregating NLRP3 in late Golgi/endosomes from de-acylating enzymes confined in the Golgi. The interesting hypothesis put forward by the authors is that the increased palmitoylation of cys130 would finally contribute to the activation of NLRP3. However, the authors should clarify the trafficking pathway of acylated-NLRP3. This pathway should, in principle, coincide with that of TGN46 which constitutively recycles from the TGN to the plasma membrane and is trapped in endosomes upon treatment with nigericin.
We think the data presented in our manuscript are consistent with the majority of S-acylated NLRP3 remaining on the Golgi via S-acylation in both untreated and nigericin treated cells. We have performed an experiment with BrefeldinA (BFA), a fungal metabolite that disassembles the Golgi without causing dissolution of early endosomes, that further supports the conclusion that NLRP3 predominantly resides on Golgi membranes pre and post activation. Treatment of cells with BFA prevents recruitment of NLRP3 to the Golgi in untreated cells and blocks the accumulation of NLRP3 on the structures seen in the perinuclear area after nigericin treatment (see new Supplementary Figure 4A-D). We do see some overlap of NLRP3 signal with TGN46 in the perinuclear area after nigericin treatment (see new Supplementary Figure 2E), however this likely represents TGN46 at the Golgi rather than endosomes given that the NLRP3 signal in this area is BFA sensitive. As with 2-BP and GFP-NLRP3C130S, GFP-NLRP3 spots also form in BFA / nigericin co-treated cells but not with untagged NLRP3. These spots also do not show any co-localisation with EEA1, suggesting that under these conditions, endosomes don’t appear to represent a secondary site of NLRP3 recruitment in the absence of an intact Golgi. However, we cannot completely rule out that some NLRP3 may recruited to endosomes at some point during its activation.
(2) To affect the S-acylation, the authors used 16 hrs treatment with 2-bromopalmitate (2BP). In Figure 1f, it is quite clear that NLRP3 in 2-BP treated cells completely redistributed in spots dispersed throughout the cells upon nigericin treatment. What is the Golgi like in those cells? In other words, does 2-BP alter/affect Golgi morphology? What about PI4P levels after 2-BP treatment? These are important missing pieces of data since both the localization of many proteins and the activity of one key PI4K in the Golgi (i.e. PI4KIIalpha) are regulated by palmitoylation.
We thank the reviewer for highlighting this point and agree that it is possible the observed loss of NLRP3 from the Golgi might be due to an adverse effect of 2-BP on Golgi morphology or PI4P levels. We have tested the effect of 2-BP on the Golgi markers GM130, p230 and TGN46. 2BP has marginal effects on Golgi morphology with cis, trans and TGN markers all present at similar levels to untreated control cells (Supplementary Figure 2B-D). We also tested the effect of 2-BP on PI4P levels using mCherry-P4M, a PI4P biosensor. Surprisingly, as noted by the reviewer, despite recruitment of PI4K2A being dependent on S-acylation, PI4P was still present on the Golgi after 2-BP treatment, suggesting that a reduction in Golgi PI4P levels does not underly loss of NLRP3 from the Golgi (Supplementary Figure 2A). The pool of PI4P still present on the Golgi following 2-BP treatment is likely generated by other PI4K enzymes that localise to the Golgi independently of S-acylation, such as PI4KIIIB. We have included this data in our manuscript as part of a new Supplementary Figure 2.
(3) The authors argue that the spots observed with NLRP-GFP result from non-specific effects mediated by the addition of the GFP tag to the NLRP3 protein. However, puncta are visible upon nigericin treatment, as a hallmark of endosomal activation. How do the authors reconcile these data? Along the same lines, the NLRP3-C130S mutant behaves similarly to wt NLRP3 upon 2-BP treatment (Figure 1h). Are those NLRP3-C130S puncta positive for endosomal markers? Are they still positive for TGN46? Are they positive for PI4P?
This is a fair point given the literature showing overlap of NLRP3 puncta formed in response to nigericin with endosomal markers and the similarity of the structures we see in terms of size and distribution to endosomes after 2BP + nigericin treatment. We have tested whether these puncta overlap with EEA1, TGN46 or PI4P (Supplementary Figure 2A, E-G). The vast majority of spots formed by GFP-NLRP3 co-treated with 2-BP and nigericin do not co-localise with EEA1, TGN46 or PI4P. This is consistent with these spots potentially being an artifact, although it has recently been shown that human NLRP3 unable to bind to the Golgi can still respond to nigericin (Mateo-Tórtola et al., 2023). These puncta might represent a conformational change cytosolic NLRP3 undergoes in response to stimulation, although our results suggest that this doesn’t appear to happen on endosomes.
(4) The authors expressed the minimal NLRP3 region to identify the domain required for NLRP3 Golgi localization. These experiments were performed in control cells. It might be informative to perform the same experiments upon nigericin treatment to investigate the ability of NLRP3 to recognize activating signals. It has been reported that PI4P increases on Golgi and endosomes upon NG treatment. Hence, all the differences between the domains may be lost or preserved. In parallel, also the timing of such recruitment upon nigericin treatment (early or late event) may be informative for the dynamics of the process and of the contribution of the single protein domains.
This is an interesting point which we thank the reviewer for highlighting. However, we think that each domain on its own is not capable of responding to nigericin as shown by the effect of mutations in helix115-125 or the PB region in the full-length NLRP3 protein. NLRP3HF, which still contains a functional PB region, isn’t capable of responding to nigericin in the same way as wild type NLRP3 (Supplementary Figure 6C-D). Similarly, mutations in the PB region of full length NLRP3 that leave helix115-125 intact show that helix115-125 is not sufficient to allow enhanced recruitment of NLRP3 to Golgi membranes after nigericin treatment (Supplementary Figure 9A). We speculate that helix115-125, the PB region and the LRR domain all need to be present to provide maximum affinity of NLRP3 for the Golgi prior to encounter with and S-acylation by ZDHHC3/7. Mutation or loss of any one of the PB region, helix115-125 or the LRR lowers NLRP3 membrane affinity, which is reflected by reduced levels of NLRP3 captured on the Golgi by S-acylation at steady state and in response to nigericin.
(5) As noted above for the chemical inhibitors (1) the authors should check the impact of altering the balance between acyl transferase and de-acylases on the Golgi organization and PI4P levels. What is the effect of overexpressing PATs on Golgi functions?
We have checked the effect of APT2 overexpression on Golgi morphology and can show that it has no noticeable effect, ruling out an impact of APT on Golgi integrity as the reason for loss of NLRP3 from the Golgi in the presence of overexpressed APT2. We have included these images as Supplementary Figure 11H-J.
It is plausible that the effects of ZDHHC3 or ZDHHC7 on enhanced recruitment of NLRP3 to the Golgi may be via an effect on PI4P levels since, as mentioned above, both enzymes are involved in recruitment of PI4K2A to the Golgi and have previously been shown to enhance levels of PI4K2A and PI4P on the Golgi when overexpressed (Kutchukian et al., 2021). However, NLRP3 mutants with most of the charge removed from the PB region, which are presumably unable to interact with PI4P or other negatively charged lipids, are still capable of being recruited to the Golgi by excess ZDHHC3. This would suggest that the effect of overexpressed ZDHHC3 on NLRP3 is largely independent of changes in PI4P levels on the Golgi and instead driven by helix115-125 and S-acylation at Cys-130. The latter point is supported by the observation that NLRP3HF and NLRP3Cys130 are insensitive to ZDHHC3 overexpression.
At the levels of HA-ZDHHC3 used in our experiments with NLRP3 (200ng pEF-Bos-HAZDHHC3 / c.a. 180,000 cells) we don’t see any adverse effect on Golgi morphology (Author response image 1), although it has been noted previously by others that higher levels of ZDHHC3 can have an impact on TGN46 (Ernst et al., 2018). ZDHHC3 overexpression surprisingly has no adverse effects on Golgi function and in fact enhances secretion from the Golgi (Ernst et al., 2018).
Author response image 1.
Overexpression of HA-ZDHHC3 does not impact Golgi morphology. A) Representative confocal micrographs of HeLaM cells transfected with 200 ng HA-ZDHHC3 fixed and stained with antibodies to STX5 or TGN46. Scale bars = 10 µm.
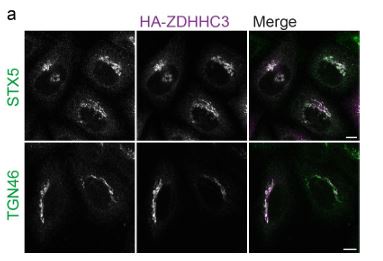
Reviewer #2 (Public Review):
Summary:
This paper examines the recruitment of the inflammasome seeding pattern recognition receptor NLRP3 to the Golgi. Previously, electrostatic interactions between the polybasic region of NLRP3 and negatively charged lipids were implicated in membrane association. The current study reports that reversible S-acylation of the conserved Cys-130 residue, in conjunction with upstream hydrophobic residues plus the polybasic region, act together to promote Golgi localization of NLRP3, although additional parts of the protein are needed for full Golgi localization. Treatment with the bacterial ionophore nigericin inhibits membrane traffic and prevents Golgi-associated thioesterases from removing the acyl chain, causing NLRP3 to become immobilized at the Golgi. This mechanism is put forth as an explanation for how NLRP3 is activated in response to nigericin.
Strengths:
The experiments are generally well presented. It seems likely that Cys-130 does indeed play a previously unappreciated role in the membrane association of NLRP3.
Weaknesses:
The interpretations about the effects of nigericin are less convincing. Specific comments follow.
(1) The experiments of Figure 4 bring into question whether Cys-130 is S-acylated. For Cys130, S-acylation was seen only upon expression of a severely truncated piece of the protein in conjunction with overexpression of ZDHHC3. How do the authors reconcile this result with the rest of the story?
Providing direct evidence of S-acylation at Cys-130 in the full-length protein proved difficult. We attempted to detect S-acylation of this residue by mass spectrometry. However, the presence of the PB region and multiple lysines / arginines directly after Cys-130 made this approach technically challenging and we were unable to convincingly detect S-acylation at Cys-130 by M/S. However, Cys-130 is clearly important for membrane recruitment as its mutation abolishes the localisation of NLRP3 to the Golgi. It is feasible that it is the hydrophobic nature of the cysteine residue itself which supports localisation to the Golgi, rather than S-acylation of Cys-130. A similar role for cysteine residues present in SNAP-25 has been reported (Greaves et al., 2009). However, the rest of our data are consistent with Cys-130 in NLRP3 being S-acylated. We also refer to another recently published study which provides additional biochemical evidence that mutation of Cys-130 impacts the overall levels of NLRP3 S-acylation (Yu et al., 2024).
(2) Nigericin seems to cause fragmentation and vesiculation of the Golgi. That effect complicates the interpretations. For example, the FRAP experiment of Figure 5 is problematic because the authors neglected to show that the FRAP recovery kinetics of nonacylated resident Golgi proteins are unaffected by nigericin. Similarly, the colocalization analysis in Figure 6 is less than persuasive when considering that nigericin significantly alters Golgi structure and could indirectly affect colocalization.
We agree that it is likely that the behaviour of other Golgi resident proteins are altered by nigericin. This is in line with a recent proteomics study showing that nigericin alters the amount of Golgi resident proteins associated with the Golgi (Hollingsworth et al., 2024) and other work demonstrating that changes in organelle pH can influence the membrane on / off rates of Rab GTPases (Maxson et al., 2023). However, Golgi levels of other peripheral membrane proteins
that associate with the Golgi through S-acylation, such as N-Ras, appear unaltered (Author response image 2.), indicating a degree of selectivity in the proteins affected. Our main point here is that NLRP3 is amongst those proteins whose behaviour on the Golgi is sensitive to nigericin and that this change in behaviour may be important to the NLRP3 activation process, although this requires further investigation and will form the basis of future studies.
The reduction in co-localisation between NLRP3 and APT2, due to alterations in Golgi organisation and trafficking, was the point we were trying to make with this figure, and we apologise if this was not clear. We think that the changes in Golgi structure and function caused by nigericin potentially affect the ability of APT2 to encounter NLRP3 and de-acylate it. We have added a new paragraph to the results section to hopefully explain this more clearly. We recognise that our results supporting this hypothesis are at present limited and we have toned down the language used in the results section to reflect the nature of these findings..
Author response image 2.
S-acylated peripheral membrane proteins show differential sensitivity to nigericin. A) Representative confocal micrographs of HeLaM cells coexpressing GFP-NRas and an untagged NLRP3 construct. Cells were left untreated or treated with 10 µM nigericin for 1 hour prior to fixation. Scale bars = 10 µm. B) Quantification of GFP-NRas or NLRP3 signal in the perinuclear region of cells treated with or without nigericin
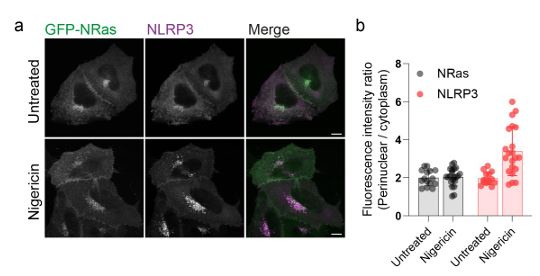
Recommendations for the authors:
Reviewer #2 (Recommendations For The Authors):
(1) Does overnight 2-BP treatment potentially have indirect effects that could prevent NLRP3 recruitment? It would be useful here to show some sort of control confirming that the cells are not broadly perturbed.
Please see our response to point (2) raised by reviewer #1 which is along similar lines.
(2) In Figure 5, "Veh" presumably is short for "Vehicle". This term should be defined in the legend.
We have now corrected this.
References
Ernst, A.M., S.A. Syed, O. Zaki, F. Bottanelli, H. Zheng, M. Hacke, Z. Xi, F. Rivera-Molina, M. Graham, A.A. Rebane, P. Bjorkholm, D. Baddeley, D. Toomre, F. Pincet, and J.E. Rothman. 2018. SPalmitoylation Sorts Membrane Cargo for Anterograde Transport in the Golgi. Dev Cell. 47:479-493 e477.
Greaves, J., G.R. Prescott, Y. Fukata, M. Fukata, C. Salaun, and L.H. Chamberlain. 2009. The hydrophobic cysteine-rich domain of SNAP25 couples with downstream residues to mediate membrane interactions and recognition by DHHC palmitoyl transferases. Mol Biol Cell. 20:1845-1854.
Hollingsworth, L.R., P. Veeraraghavan, J.A. Paulo, J.W. Harper, and I. Rauch. 2024. Spatiotemporal proteomic profiling of cellular responses to NLRP3 agonists. bioRxiv.
Kutchukian, C., O. Vivas, M. Casas, J.G. Jones, S.A. Tiscione, S. Simo, D.S. Ory, R.E. Dixon, and E.J. Dickson. 2021. NPC1 regulates the distribution of phosphatidylinositol 4-kinases at Golgi and lysosomal membranes. EMBO J. 40:e105990.
Mateo-Tórtola, M., I.V. Hochheiser, J. Grga, J.S. Mueller, M. Geyer, A.N.R. Weber, and A. TapiaAbellán. 2023. Non-decameric NLRP3 forms an MTOC-independent inflammasome. bioRxiv:2023.2007.2007.548075.
Maxson, M.E., K.K. Huynh, and S. Grinstein. 2023. Endocytosis is regulated through the pHdependent phosphorylation of Rab GTPases by Parkinson’s kinase LRRK2. bioRxiv:2023.2002.2015.528749.
Yu, T., D. Hou, J. Zhao, X. Lu, W.K. Greentree, Q. Zhao, M. Yang, D.G. Conde, M.E. Linder, and H. Lin. 2024. NLRP3 Cys126 palmitoylation by ZDHHC7 promotes inflammasome activation. Cell Rep. 43:114070.
Author Response
The following is the authors’ response to the original reviews.
We sincerely thank the reviewers for their in-depth consideration of our manuscript and their helpful reviews. Their efforts have made the paper much better. We have responded to each point. The previously provided public responses have been updated they are included after the private response for convenience.
Reviewer #1 (Recommendations For The Authors):
In general, the manuscript will benefit from copy editing and proof reading. Some obvious edits;
Page 6 line 140. Do the authors mean Cholera toxin B?
Response: We corrected this error and went through the entire paper carefully correcting for grammar and increased clarity.
- Page 8 line 173. Methylbetacyclodextrin is misspelled.
Response: Yes, corrected.
Figure 4c is missing representative traces for electrophysiology data.
Figure 4. Please check labeling ordering in figure legend as it does not match the panels in the figure.
Thank you for the correction and we apologize for the confusion in figure 4. We uploaded an incomplete figure legend, and the old panel ‘e’ was not from an experiment that was still in the figure. It was removed and the figure legends are now corrected.
- Please mention the statistical analysis used in all figure legends.
Response: Thank you for pointing out this omission, statistics have been added.
- Although the schematics in each figure helps guide readers, they are very inconsistent and sometimes confusing. For example, in Figure 5 the gating model is far-reaching without conclusive evidence, whereas in Figure 6 it is over simplified and unclear what the image is truly representing (granted that the downstream signaling mechanism and channel is not known).
Response: Figure 5d is the summary figure for the entire paper. We have made this clearer in the figure legend and we deleted the title above the figure that gave the appearance that the panel relates to swell only. It is the proposed model based on what we show in the paper and what is known about the activation mechanism of TREK-1.
Figure 6 is supposed to be simple. It is to help the reader understand that when PA is low mechanical sensitivity is high. Without the graphic, previous reviewers got confused about threshold going down and mechanosensitivity going up and how the levels of PA relate. Low PA= high sensitivity. We’ve added a downstream effector to the right side of the panel to avoid any biased to a putative downstream channel effector. The purpose of the experiment is to show PLD has a mechanosensitive phenotype in vivo.
Reviewer #2 (Recommendations For The Authors):
This manuscript outlines some really interesting findings demonstrating a mechanism by which mechanically driven alterations in molecular distributions can influence a) the activity of the PLD2 molecule and subsequently b) the activation of TREK-1 when mechanical inputs are applied to a cell or cell membrane.
The results presented here suggest that this redistribution of molecules represents a modulatory mechanism that alters either the amplitude or the sensitivity of TREK-1 mediated currents evoked by membrane stretch. While the authors do present values for the pressure required to activate 50% of channels (P50), the data presented provides incomplete evidence to conclude a shift in threshold of the currents, given that many of the current traces provided in the supplemental material do not saturate within the stimulus range, thus limiting the application of a Boltzmann fit to determine the P50. I suggest adding additional context to enable readers to better assess the limitations of this use of the Boltzmann fit to generate a P50, or alternately repeating the experiments to apply stimuli up to lytic pressures to saturate the mechanically evoked currents, enabling use of the Boltzmann function to fit the data.
Response: We thank the reviewer for pointing this out. We agree the currents did not reach saturation. Hence the term P50 could be misleading, so we have removed it from the paper. We now say “half maximal” current measured from non-saturating pressures of 0-60 mmHg. We also deleted the xPLD data in supplemental figure 3C since there is insufficient current to realistically estimate a half maximal response.
In my opinion, the conclusions presented in this manuscript would be strengthened by an assessment of the amount of TREK-1 in the plasma membrane pre and post application of shear. While the authors do present imaging data in the supplementary materials, these data are insufficiently precise to comment on expression levels in the membrane. To strengthen this conclusion the authors could conduct cell surface biotinylation assays, as a more sensitive and quantitative measure of membrane localisation of the proteins of interest.
Response: as mentioned previously, we do not have an antibody to the extracellular domain. Nonetheless to better address this concern we directly compared the levels of TREK-1, PIP2, and GM1; in xPLD2, mPLD2, enPLD2 with and without shear. The results are in supplemental figure 2. PLD2 is known to increase endocytosis1 and xPLD2 is known to block both agonist induced and constitutive endocytosis of µ-opioid receptor2. The receptor is trapped on the surface. This is true of many proteins including Rho3, ARF4, and ACE21 among others. In agreement with this mechanism, in Figure S2C,G we show that TREK increases with xPLD and the localization can clearly be seen at the plasma membrane just like in all of the other publications with xPLD overexpression. xPLD2 would be expected to inhibit the basal current but we presume the increased expression likely has compensated and there is sufficient PA and PG from other sources to allow for the basal current. It is in this state that we then conduct our ephys and monitor with a millisecond time resolution and see no activation. We are deriving conclusion from a very clear response—Figure 1b shows almost no current, even at 1-10 ms after applying pressure. There is little pressure current when we know the channel is present and capable of conducting ion (Figure 1d red bar). After shear there is a strong decrease in TREK-1 currents on the membrane in the presence of xPLD2. But it is not less than TREK-1 expression with mPLD2. And since mouse PLD2 has the highest basal current and pressure activation current. The amount of TREK-1 present is sufficient to conduct large current. To have almost no detective current would require at least a 10 fold reduction compared to mPLD2 levels before we would lack the sensitivity to see a channel open. Lasty endocytosis typically in on the order of seconds to minutes, no milliseconds.
We have shown an addition 2 independent ways that TREK-1 is on the membrane during our stretch experiments. Figure 1d shows the current immediately prior to applying pressure for wt TREK-1. When catalytically dead PLD is present (xPLD2) there is almost normal basal current. The channel is clearly present. And then in figure 1a we show within a millisecond there is no pressure current. As a control we added a functionally dead TREK-1 truncation (xTREK). Compared to xPLD2 there is clearly normal basal current. If this is not strong evidence the channel was available on the surface for mechanical activation please help us understand why. And if you think within 2.1 ms 100% of the channel is gone by endocytosis please provide some evidence that this is possible so we can reconsider.
We have TIRF super resolution imaging with ~20 nm x-y resolution and ~ 100nm z resolution and Figure 2b clearly shows the channel on the membrane. When we apply pressure in 1b, the channel is present.
Lastly, In our previous studies we showed activation of PLD2 by anesthetics was responsible for all of TREK-1’s anesthetic sensitivity and this was through PLD2 binding to the C-terminus of TREK-15. We showed this was the case by transferring anesthetic sensitivity to an anesthetic insensitive homolog TRAAK. This established conclusively the basic premise of our mechanism. Here we show the same C-terminal region and PLD2 are responsible for the mechanical current observed by TREK-1. TRAAK is already mechanosensitive so the same chimera will not work for our purposes here. But anesthetic activation and mechanical activation are dramatically different stimuli, and the fact that the role of PLD is robustly observed in both should be considered.
The authors discuss that the endogenous levels of TREK-1 and PLD2 are "well correlated: in C2C12 cells, that TREK-1 displayed little pair correlation with GM1 and that a "small amount of TREK-1 trafficked to PIP2". As such, these data suggest that the data outlined for HEK293T cells may be hampered by artefacts arising from overexpression. Can TREK-1 currents be activated by membrane stretch in these cells C2C12 cells and are they negatively impacted by the presence of xPLD2? Answering this question would provide more insight into the proposed mechanism of action of PLD2 outlined by the authors in this manuscript. If no differences are noted, the model would be called into question. It could be that there are additional cell-specific factors that further regulate this process.
Response: The low pair correlation of TREK-1 and GM1 in C2C12 cells was due to insufficient levels of cholesterol in the cell membrane to allow for robust domain formation. In Figure 4b we loaded C2C12 cells with cholesterol using the endogenous cholesterol transport protein apoE and serum (an endogenous source of cholesterol). As can be seen in Fig. 4b, the pair correlation dramatically increased (purple line). This was also true in neuronal cells (N2a) (Fig 4d, purple bar). And shear (3 dynes/cm2) caused the TREK-1 that was in the GM1 domains to leave (red bar) reversing the effect of high cholesterol. This demonstrates our proposed mechanism is working as we expect with endogenously expressed proteins.
There are many channels in C2C12 cells, it would be difficult to isolate TREK-1 currents, which is why we replicated the entire system (ephys and dSTORM) in HEK cells. Note, in figure 4c we also show that adding cholesterol inhibits TREK-1 whole cell currents in HEK293cells.
As mentioned in the public review, the behavioural experiments in D. melanogaster can not solely be attributed to a change in threshold. While there may be a change in the threshold to drive a different behaviour, the writing is insufficiently precise to make clear that conclusions cannot be drawn from these experiments regarding the functional underpinnings of this outcome. Are there changes in resting membrane potential in the mutant flys? Alterations in Nav activity? Without controlling for these alternate explanations it is difficult to see what this last piece of data adds to the manuscript, particularly given the lack of TREK-1 in this organism. At the very least, some editing of the text to more clearly indicate that these data can only be used to draw conclusions on the change in threshold for driving the behaviour not the change in threshold of the actual mechanotransduction event (i.e. conversion of the mechanical stimulus into an electrochemical signal).
Response: We agree; features other than PLDs direct mechanosensitivity are likely contributing. This was shown in figure 6g left side. We have an arrow going to ion channel and to other downstream effectors. We’ve added the putative alteration to downstream effectors to the right side of the panel. This should make it clear that we no more speculate the involvement of a channel than any of the other many potential downstream effectors. As mentioned above, the figure helps the reader coordinate low PA with increased mechanosensitivity. Without the graphic reviewers got confused that PA increased the threshold which corresponds to a decreased sensitivity to pain. Nonetheless we removed our conclusion about fly thresholds from the abstract and made clearer in the main text the lack of mechanism downstream of PLD in flies including endocytosis. Supplemental Figure S2H also helps emphasize this. .
Nav channels are interesting, and since PLD contribute to endocytosis and Nav channels are also regulated by endocytosis there is likely a PLD specific effect using Nav channels. There are many ways PA likely regulates mechanosensitive thresholds, but we feel Nav is beyond the scope of our paper. Someone else will need to do those studies. We have amended a paragraph in the conclusion which clearly states we do not know the specific mechanism at work here with the suggestions for future research to discover the role of lipid and lipid-modifying enzymes in mechanosensitive neurons.
There may be fundamental flaws in how the statistics have been conducted. The methods section indicates that all statistical testing was performed with a Student's t-test. A visual scan of many of the data sets in the figures suggests that they are not normally distributed, thus a parametric test such as a Student's t-test is not valid. The authors should assess if each data set is normally distributed, and if not, a non-parametric statistical test should be applied. I recommend assessing the robustness of the statistical analyses and adjusting as necessary.
Response: We thank the reviewer for pointing this out, indeed there is some asymmetry in Figure 6C-d. The p values with Mann Whitney were slightly improved p=0.016 and p=0.0022 for 6c and 6d respectively. For reference, the students t-test had slightly worse statistics p=0.040 and p=0.0023. The score remained the same 1 and 2 stars respectively.
The references provided for the statement regarding cascade activation of the TRPs are incredibly out of date. While it is clear that TRPV4 can be activated by a second messenger cascade downstream of osmotic swelling of cells, TRPV4 has also been shown to be activated by mechanical inputs at the cell-substrate interface, even when the second messenger cascade is inhibited. Recommend updating the references to reflect more current understanding of channel activation.
Response: We thank the reviewer for pointing this out. We have updated the references and changed the comment to “can be” instead of “are”. The reference is more general to multiple ion channel types including KCNQ4. This should avoid any perceived conflict with the cellsubstrate interface mechanism which we very much agree is a correct mechanism for TRP channels.
Minor comments re text editing etc:
The central messages of the manuscript would benefit from extensive work to increase the precision of the writing of the manuscript and the presentation of data in the figures, such textual changes alone would help address a number of the concerns outlined in this review, by clarifying some ambiguities. There are numerous errors throughout, ranging from grammatical issues, ambiguities with definitions, lack of scale bars in images, lack of labels on graph axes, lack of clarity due to the mode of presentation of sample numbers (it would be far more precise to indicate specific numbers for each sample rather than a range, which is ambiguous and confusing), unnecessary and repeat information in the methods section. Below are some examples but this list is not exhaustive.
Response: Thank you, reviewer # 1 also had many of these concerns. We have gone through the entire paper and improved the precision of the writing of the manuscript. We have also added the missing error bar to Figure 6. And axis labels have been added to the inset images. The redundancy in cell culture methods has been removed. Where a range is small and there are lots of values, the exact number of ‘n’ are graphically displayed in the dot plot for each condition.
Text:
I recommend considering how to discuss the various aspects of channel activation. A convention in the field is to use mechanical activation or mechanical gating to describe that process where the mechanical stimulus is directly coupled to the channel gating mechanism. This would be the case for the activation of TREK-1 by membrane stretch alone. The increase in activation by PLD2 activity then reflects a modulation of the mechanical activation of the channel, because the relevant gating stimulus is PA, rather than force/stretch. The sum of these events could be described as shear-evoked or mechanically-evoked, TREK-1 mediated currents (thus making it clear that the mechanical stimulus initiates the relevant cascade, but the gating stimulus may be other than direct mechanical input.) Given the interesting and compelling data offered in this manuscript regarding the sensitisation of TREK-1 dependent mechanicallyevoked currents by PLD2, an increase in the precision of the language would help convey the central message of this work.
Response; We agree there needs to be convention. We have taken the suggestion of mechanically evoked and we suggest the following definitions:
Mechanical activation of PLD2: direct force on the lipids releasing PLD2 from nonactivating lipids.
Mechanical activation/gating of TREK1: direct force from lipids from either tension or hydrophobic mismatch that opens the channel.
Mechanically evoked: a mechanical event that leads to a downstream effect. The effect is mechanically “evoked”.
Spatial patterning/biochemistry: nanoscopic changes in the association of a protein with a nanoscopic lipid cluster or compartment.
An example of where discussion of mechanical activation is ambiguous in the text is found at line 109: "channel could be mechanically activated by a movement from GM1 to PIP2 lipids." In this case, the sentence could be suggesting that the movement between lipids provides the mechanical input that activates the channel, which is not what the data suggest.
Response: Were possible we have replaced “movement” with “spatial patterning” and “association” and “dissociation” from specific lipid compartment. This better reflects the data we have in this paper. However, we do think that a movement mechanically activates the channel, GM1 lipids are thick and PIP2 lipids are thin, so movement between the lipids could activate the channel through direct lipid interaction. We will address this aspect in a future paper.
Inconsistencies with usage:
• TREK1 versus TREK-1
Response: corrected to TREK-1
• mPLD2 versus PLD2
Response: where PLD2 represents mouse this has been corrected.
• K758R versus xPLD2
Response: we replaced K758R in the methods with xPLD2.
• HEK293T versus HEK293t Response: we have changed all instances to read HEK293T.
• Drosophila melanogaster and D. melanogaster used inconsistently and in many places incorrectly
Response: we have read all to read the common name Drosophila.
Line 173: misspelled methylbetacyclodextrin
Response corrected
Line 174: degree symbol missing
Response corrected
Line 287: "the decrease in cholesterol likely evolved to further decrease the palmate order in the palmitate binding site"... no evidence, no support for this statement, falsely attributes intention to evolutionary processes .
Response: we have removed the reference to evolution at the request of the reviewer, it is not necessary. But we do wish to note that to our knowledge, all biological function is scientifically attributed to evolution. The fact that cholesterol decreases in response to shear is evidence alone that the cell evolved to do it.
Line 307: grammatical error
Response: the redundant Lipid removed.
Line 319: overinterpreted - how is the mechanosensitivy of GPCRs explained by this translocation?
Response: all G-alpha subunits of the GPCR complex are palmitoylated. We showed PLD (which has the same lipidation) is mechanically activated. If the palmitate site is disrupted for PLD2, then it is likely disrupted for every G-alpha subunit as well.
Line 582: what is the wild type referred to here?
Response: human full length with a GFP tag.
Methods:
• Sincere apologies if I missed something but I do not recall seeing any experiments using purified TREK-1 or flux assays. These details should be removed from the methods section
Response: Removed.
• There is significant duplication of detail across the methods (three separate instances of electrophysiology details) these could definitely be consolidated.
Response: Duplicates removed.
Figures:
• Figure 2- b box doesn't correspond to inset. Bottom panel should provide overview image for the cell that was assessed with shear. In bottom panel, circle outlines an empty space.
Response: We have widened the box slightly to correspond so the non shear box corresponds to the middle panel. We have also added the picture for the whole cell to Fig S2g and outlined the zoom shown in the bottom panel of Fig 2b as requested. The figure is of the top of a cell. We also added the whole cell image of a second sheared cell.
Author response image 1.
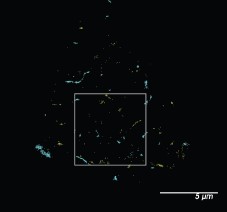
• Figure 3 b+c: inset graph lacking axis labels
Response; the inset y axis is the same as the main axis. We added “pair corr. (5nM)” and a description in the figure legend to make this clearer. The purpose of the inset is to show statistical significance at a single point. The contrast has been maximized but without zooming in points can be difficult to see.
• Figure 5: replicate numbers missing and individual data points lacking in panels b + c, no labels of curve in b + c, insets, unclear what (5 nm) refers to in insets.
Response: Thank you for pointing out these errors. The N values have been added. Similar to figure 3, the inset is a bar graph of the pair correlation data at 5 nm. A better explanation of the data has been added to the figure legend.
• Figure 6: no scale bar, no clear membrane localization evident from images presented, panel g offers virtually nothing in terms of insight
Response: We have added scale bars to figure 6b. Figure 6g is intentionally simplistic, we found that correlating decreased threshold with increased pain was confusing. A previous reviewer claimed our data was inconsistent. The graphic avoids this confusion. We also added negative effects of low PA on downstream effects to the right panel. This helps graphically show we don’t know the downstream effects.
Reviewer #3 (Recommendations For The Authors):
Minor suggestions:
- line 162, change 'heat' to 'temperature'.
Response: changed.
- in figure 1, it would be helpful to keep the unit for current density consistent among different panels. 1e is a bit confusing: isn't the point of Figure 1 that most of TREK1 activation is not caused by direct force-sensing?
Response: Yes, the point of figure 1 is to show that in a biological membrane over expressed TREK-1 is a downstream effector of PLD2 mechanosensation which is indirect. We agree the figure legend in the previous version of the paper is very confusing.
There is almost no PLD2 independent current in our over expressed system, which is represented by no ions in the conduction pathway of the channel despite there being tension on the membrane.
Purified TREK-1 is only mechanosensitive in a few select lipids, primarily crude Soy PC. It was always assumed that HEK293 and Cos cells had the correct lipids since over expressed TREK-1 responded to mechanical force in these lipids. But that does not appear to be correct, or at least only a small amount of TREK-1 is in the mechanosensitive lipids. Figure 1e graphically shows this. The arrows indicate tension, but the channel isn’t open with xPLD2 present. We added a few sentences to the discussion to further clarify.
Panels c has different units because the area of the tip was measured whereas in d the resistance of the tip was measured. They are different ways for normalizing for small differences in tip size.
- line 178, ~45 of what?
Response: Cells were fixed for ~30 sec.
- line 219 should be Figure 4f?
Response: thank you, yes Figure 4f.
Previous public reviews with minor updates.
Reviewer #1 (Public Review):
Force sensing and gating mechanisms of the mechanically activated ion channels is an area of broad interest in the field of mechanotransduction. These channels perform important biological functions by converting mechanical force into electrical signals. To understand their underlying physiological processes, it is important to determine gating mechanisms, especially those mediated by lipids. The authors in this manuscript describe a mechanism for mechanically induced activation of TREK-1 (TWIK-related K+ channel. They propose that force induced disruption of ganglioside (GM1) and cholesterol causes relocation of TREK-1 associated with phospholipase D2 (PLD2) to 4,5-bisphosphate (PIP2) clusters, where PLD2 catalytic activity produces phosphatidic acid that can activate the channel. To test their hypothesis, they use dSTORM to measure TREK-1 and PLD2 colocalization with either GM1 or PIP2. They find that shear stress decreases TREK-1/PLD2 colocalization with GM1 and relocates to cluster with PIP2. These movements are affected by TREK-1 C-terminal or PLD2 mutations suggesting that the interaction is important for channel re-location. The authors then draw a correlation to cholesterol suggesting that TREK-1 movement is cholesterol dependent. It is important to note that this is not the only method of channel activation and that one not involving PLD2 also exists. Overall, the authors conclude that force is sensed by ordered lipids and PLD2 associates with TREK-1 to selectively gate the channel. Although the proposed mechanism is solid, some concerns remain.
1) Most conclusions in the paper heavily depend on the dSTORM data. But the images provided lack resolution. This makes it difficult for the readers to assess the representative images.
Response: The images were provided are at 300 dpi. Perhaps the reviewer is referring to contrast in Figure 2? We are happy to increase the contrast or resolution.
As a side note, we feel the main conclusion of the paper, mechanical activation of TREK-1 through PLD2, depended primarily on the electrophysiology in Figure 1b-c, not the dSTORM. But both complement each other.
2) The experiments in Figure 6 are a bit puzzling. The entire premise of the paper is to establish gating mechanism of TREK-1 mediated by PLD2; however, the motivation behind using flies, which do not express TREK-1 is puzzling.
Response: The fly experiment shows that PLD mechanosensitivity is more evolutionarily conserved than TREK-1 mechanosensitivity. We have added this observation to the paper.
-Figure 6B, the image is too blown out and looks over saturated. Unclear whether the resolution in subcellular localization is obvious or not.
Response: Figure 6B is a confocal image, it is not dSTORM. There is no dSTORM in Figure 6. We have added the error bars to make this more obvious. For reference, only a few cells would fit in the field of view with dSTORM.
-Figure 6C-D, the differences in activity threshold is 1 or less than 1g. Is this physiologically relevant? How does this compare to other conditions in flies that can affect mechanosensitivity, for example?
Response: Yes, 1g is physiologically relevant. It is almost the force needed to wake a fly from sleep (1.2-3.2g). See ref 33. Murphy Nature Pro. 2017.
3) 70mOsm is a high degree of osmotic stress. How confident are the authors that a cell health is maintained under this condition and b. this does indeed induce membrane stretch? For example, does this stimulation activate TREK-1?
Response: Yes, osmotic swell activates TREK1. This was shown in ref 19 (Patel et al 1998). We agree the 70 mOsm is a high degree of stress. This needs to be stated better in the paper.
Reviewer #2 (Public Review):
This manuscript by Petersen and colleagues investigates the mechanistic underpinnings of activation of the ion channel TREK-1 by mechanical inputs (fluid shear or membrane stretch) applied to cells. Using a combination of super-resolution microticopy, pair correlation analysis and electrophysiology, the authors show that the application of shear to a cell can lead to changes in the distribution of TREK-1 and the enzyme PhospholipaseD2 (PLD2), relative to lipid domains defined by either GM1 or PIP2. The activation of TREK-1 by mechanical stimuli was shown to be sensi>zed by the presence of PLD2, but not a catalytically dead xPLD2 mutant. In addition, the activity of PLD2 is increased when the molecule is more associated with PIP2, rather than GM1 defined lipid domains. The presented data do not exclude direct mechanical activation of TREK-1, rather suggest a modulation of TREK-1 activity, increasing sensitivity to mechanical inputs, through an inherent mechanosensitivity of PLD2 activity. The authors additionally claim that PLD2 can regulate transduction thresholds in vivo using Drosophila melanogaster behavioural assays. However, this section of the manuscript overstates the experimental findings, given that it is unclear how the disruption of PLD2 is leading to behavioural changes, given the lack of a TREK-1 homologue in this organism and the lack of supporting data on molecular function in the relevant cells.
Response: We agree, the downstream effectors of PLD2 mechanosensitivity are not known in the fly. Other anionic lipids have been shown to mediate pain see ref 46 and 47. We do not wish to make any claim beyond PLD2 being an in vivo contributor to a fly’s response to mechanical force. We have removed the speculative conclusions about fly thresholds from the abstract.
That said we do believe we have established a molecular function at the cellular level. We showed PLD is robustly mechanically activated in a cultured fly cell line (BG2-c2) Figure 6a of the manuscript. And our previous publication established mechanosensation of PLD (Petersen et. al. Nature Com 2016) through mechanical disruption of the lipids. At a minimum, the experiments show PLDs mechanosensitivity is evolutionarily better conserved across species than TREK1.
This work will be of interest to the growing community of scientists investigating the myriad mechanisms that can tune mechanical sensitivity of cells, providing valuable insight into the role of functional PLD2 in sensi>zing TREK-1 activation in response to mechanical inputs, in some cellular systems.
The authors convincingly demonstrate that, post application of shear, an alteration in the distribution of TREK-1 and mPLD2 (in HEK293T cells) from being correlated with GM1 defined domains (no shear) to increased correlation with PIP2 defined membrane domains (post shear). These data were generated using super-resolution microticopy to visualise, at sub diffraction resolution, the localisation of labelled protein, compared to labelled lipids. The use of super-resolution imaging enabled the authors to visualise changes in cluster association that would not have been achievable with diffraction limited microticopy. However, the conclusion that this change in association reflects TREK-1 leaving one cluster and moving to another overinterprets these data, as the data were generated from sta>c measurements of fixed cells, rather than dynamic measurements capturing molecular movements.
When assessing molecular distribution of endogenous TREK-1 and PLD2, these molecules are described as "well correlated: in C2C12 cells" however it is challenging to assess what "well correlated" means, precisely in this context. This limitation is compounded by the conclusion that TREK-1 displayed little pair correlation with GM1 and the authors describe a "small amount of TREK-1 trafficked to PIP2". As such, these data may suggest that the findings outlined for HEK293T cells may be influenced by artefacts arising from overexpression.
The changes in TREK-1 sensitivity to mechanical activation could also reflect changes in the amount of TREK-1 in the plasma membrane. The authors suggest that the presence of a leak currently accounts for the presence of TREK-1 in the plasma membrane, however they do not account for whether there are significant changes in the membrane localisation of the channel in the presence of mPLD2 versus xPLD2. The supplementary data provide some images of fluorescently labelled TREK-1 in cells, and the authors state that truncating the c-terminus has no effect on expression at the plasma membrane, however these data provide inadequate support for this conclusion. In addition, the data reporting the P50 should be noted with caution, given the lack of saturation of the current in response to the stimulus range.
Response: We thank the reviewer for his/her concern about expression levels. We did test TREK-1 expression. mPLD decreases TREK-1 expression ~two-fold (see Author response image 2 below). We did not include the mPLD data since TREK-1 was mechanically activated with mPLD. For expression to account for the loss of TREK-1 stretch current (Figure 1b), xPLD would need to block surface expression of TREK-1 prior to stretch. The opposite was true, xPLD2 increased TREK-1 expression (see Figure S2c). Furthermore, we tested the leak current of TREK-1 at 0 mV and 0 mmHg of stretch. Basal leak current was no different with xPLD2 compared to endogenous PLD (Figure 1d; red vs grey bars respectively) suggesting TREK-1 is in the membrane and active when xPLD2 is present. If anything, the magnitude of the effect with xPLD would be larger if the expression levels were equal.
Author response image 2.
TREK expression at the plasma membrane. TREK-1 Fluorescence was measured by GFP at points along the plasma membrane. Over expression of mouse PLD2 (mPLD) decrease the amount of full-length TREK-1 (FL TREK) on the surface more than 2-fold compared to endogenously expressed PLD (enPLD) or truncated TREK (TREKtrunc) which is missing the PLD binding site in the C-terminus. Over expression of mPLD had no effect on TREKtrunc.
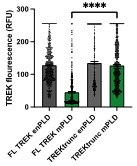
Finally, by manipulating PLD2 in D. melanogaster, the authors show changes in behaviour when larvae are exposed to either mechanical or electrical inputs. The depletion of PLD2 is concluded to lead to a reduction in activation thresholds and to suggest an in vivo role for PA lipid signaling in setting thresholds for both mechanosensitivity and pain. However, while the data provided demonstrate convincing changes in behaviour and these changes could be explained by changes in transduction thresholds, these data only provide weak support for this specific conclusion. As the authors note, there is no TREK-1 in D. melanogaster, as such the reported findings could be accounted for by other explanations, not least including potential alterations in the activation threshold of Nav channels required for action potential generation. To conclude that the outcomes were in fact mediated by changes in mechanotransduction, the authors would need to demonstrate changes in receptor potential generation, rather than deriving conclusions from changes in behaviour that could arise from alterations in resting membrane potential, receptor potential generation or the activity of the voltage gated channels required for action potential generation.
Response: We are willing to restrict the conclusion about the fly behavior as the reviewers see fit. We have shown PLD is mechanosensitivity in a fly cell line, and when we knock out PLD from a fly, the animal exhibits a mechanosensation phenotype. We tried to make it clear in the figure and in the text that we have no evidence of a particular mechanism downstream of PLD mechanosensation.
This work provides further evidence of the astounding flexibility of mechanical sensing in cells. By outlining how mechanical activation of TREK-1 can be sensitised by mechanical regulation of PLD2 activity, the authors highlight a mechanism by which TREK-1 sensitivity could be regulated under distinct physiological conditions.
Reviewer #3 (Public Review):
The manuscript "Mechanical activation of TWIK-related potassium channel by nanoscopic movement and second messenger signaling" presents a new mechanism for the activation of TREK-1 channel. The mechanism suggests that TREK1 is activated by phosphatidic acids that are produced via a mechanosensitive motion of PLD2 to PIP2-enriched domains. Overall, I found the topic interesting, but several typos and unclarities reduced the readability of the manuscript. Additionally, I have several major concerns on the interpretation of the results. Therefore, the proposed mechanism is not fully supported by the presented data. Lastly, the mechanism is based on several previous studies from the Hansen lab, however, the novelty of the current manuscript is not clearly stated. For example, in the 2nd result section, the authors stated, "fluid shear causes PLD2 to move from cholesterol dependent GM1 clusters to PIP2 clusters and this activated the enzyme". However, this is also presented as a new finding in section 3 "Mechanism of PLD2 activation by shear."
For PLD2 dependent TREK-1 activation. Overall, I found the results compelling. However, two key results are missing.
- Does HEK cells have endogenous PLD2? If so, it's hard to claim that the authors can measure PLD2-independent TREK1 activation.
Response: yes, there is endogenous PLD (enPLD). We calculated the relative expression of xPLD2 vs enPLD. xPLD2 is >10x more abundant (Fig. S3d of Pavel et al PNAS 2020, ref 14 of the current manuscript). Hence, as with anesthetic sensitivity, we expect the xPLD to out compete the endogenous PLD, which is what we see. We added the following sentence and reference : “The xPLD2 expression is >10x the endogenous PLD2 (enPLD2) and out computes the TREK-1 binding site for PLD25.”
- Does the plasma membrane trafficking of TREK1 remain the same under different conditions (PLD2 overexpression, truncation)? From Figure S2, the truncated TREK1 seem to have very poor trafficking. The change of trafficking could significantly contribute to the interpretation of the data in Figure 1.
Response: If the PLD2 binding site is removed (TREK-1trunc), yes, the trafficking to the plasma membrane is unaffected by the expression of xPLD and mPLD (Author response image 2 above). For full length TREK1 (FL-TREK-1), co-expression of mPLD decreases TREK expression (Author response image 2) and coexpression with xPLD increases TREK expression (Figure S2f). This is exactly opposite of what one would expect if surface expression accounted for the change in pressure currents. Hence, we conclude surface expression does not account for loss of TREK-1 mechanosensitivity with xPLD2. A few sentences was added to the discussion. We also performed dSTORM on the TREKtruncated using EGFP. TREK-truncated goes to PIP2 (see figure 2 of 6)
Author response image 3.
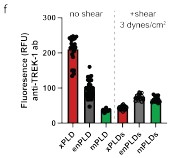
To better compare the levels of TREK-1 before and after shear, we added a supplemental figure S2f where the protein was compared simultaneously in all conditions. 15 min of shear significantly decreased TREK-1 except with mPLD2 where the levels before shear were already lowest of all the expression levels tested.
For shear-induced movement of TREK1 between nanodomains. The section is convincing, however I'm not an expert on super-resolution imaging. Also, it would be helpful to clarify whether the shear stress was maintained during fixation. If not, what is the >me gap between reduced shear and the fixed state. lastly, it's unclear why shear flow changes the level of TREK1 and PIP2.
Response: Shear was maintained during the fixing. xPLD2 blocks endocytosis, presumably endocytosis and or release of other lipid modifying enzymes affect the system. The change in TREK-1 levels appears to be directly through an interaction with PLD as TREK trunc is not affected by over expression of xPLD or mPLD.
For the mechanism of PLD2 activation by shear. I found this section not convincing. Therefore, the question of how does PLD2 sense mechanical force on the membrane is not fully addressed. Par>cularly, it's hard to imagine an acute 25% decrease cholesterol level by shear - where did the cholesterol go? Details on the measurements of free cholesterol level is unclear and additional/alternative experiments are needed to prove the reduction in cholesterol by shear.
Response: The question “how does PLD2 sense mechanical force on the membrane” we addressed and published in Nature Comm. In 2016. The title of that paper is “Kinetic disruption of lipid rafts is a mechanosensor for phospholipase D” see ref 13 Petersen et. al. PLD is a soluble protein associated to the membrane through palmitoylation. There is no transmembrane domain, which narrows the possible mechanism of its mechanosensation to disruption.
The Nature Comm. reviewer identified as “an expert in PLD signaling” wrote the following of our data and the proposed mechanism:
“This is a provocative report that identi0ies several unique properties of phospholipase D2 (PLD2). It explains in a novel way some long established observations including that the enzyme is largely regulated by substrate presentation which 0its nicely with the authors model of segregation of the two lipid raft domains (cholesterol ordered vs PIP2 containing). Although PLD has previously been reported to be involved in mechanosensory transduction processes (as cited by the authors) this is the 0irst such report associating the enzyme with this type of signaling... It presents a novel model that is internally consistent with previous literature as well as the data shown in this manuscript. It suggests a new role for PLD2 as a force transduction tied to the physical structure of lipid rafts and uses parallel methods of disrup0on to test the predic0ons of their model.”
Regarding cholesterol. We use a fluorescent cholesterol oxidase assay which we described in the methods. This is an appropriate assay for determining cholesterol levels in a cell which we use routinely. We have published in multiple journals using this method, see references 28, 30, 31. Working out the metabolic fate of cholesterol after sheer is indeed interesting but well beyond the scope of this paper. Furthermore, we indirectly confirmed our finding using dSTORM cluster analysis (Figure 3d-e). The cluster analysis shows a decrease in GM1 cluster size consistent with our previous experiments where we chemically depleted cholesterol and saw a similar decrease in cluster size (see ref 13). All the data are internally consistent, and the cholesterol assay is properly done. We see no reason to reject the data.
Importantly, there is no direct evidence for "shear thinning" of the membrane and the authors should avoid claiming shear thinning in the abstract and summary of the manuscript.
Response: We previously established a kinetic model for PLD2 activation see ref 13 (Petersen et al Nature Comm 2016). In that publication we discussed both entropy and heat as mechanisms of disruption. Here we controlled for heat which narrowed that model to entropy (i.e., shear thinning) (see Figure 3c). We provide an overall justification below. But this is a small refinement of our previous paper, and we prefer not to complicate the current paper. We believe the proper rheological term is shear thinning. The following justification, which is largely adapted from ref 13, could be added to the supplement if the reviewer wishes.
Justification: To establish shear thinning in a biological membrane, we initially used a soluble enzyme that has no transmembrane domain, phospholipase D2 (PLD2). PLD2 is a soluble enzyme and associated with the membrane by palmitate, a saturated 16 carbon lipid attached to the enzyme. In the absence of a transmembrane domain, mechanisms of mechanosensation involving hydrophobic mismatch, tension, midplane bending, and curvature can largely be excluded. Rather the mechanism appears to be a change in fluidity (i.e., kinetic in nature). GM1 domains are ordered, and the palmate forms van der Waals bonds with the GM1 lipids. The bonds must be broken for PLD to no longer associate with GM1 lipids. We established this in our 2016 paper, ref 13. In that paper we called it a kinetic effect, however we did not experimentally distinguish enthalpy (heat) vs. entropy (order). Heat is Newtonian and entropy (i.e., shear thinning) is non-Newtonian. In the current study we paid closer attention to the heat and ruled it out (see Figure 3c and methods). We could propose a mechanism based on kinetic disruption, but we know the disruption is not due to melting of the lipids (enthalpy), which leaves shear thinning (entropy) as the plausible mechanism.
The authors should also be aware that hypotonic shock is a very dirty assay for stretching the cell membrane. Ouen, there is only a transient increase in membrane tension, accompanied by many biochemical changes in the cells (including acidification, changes of concentration etc). Therefore, I would not consider this as definitive proof that PLD2 can be activated by stretching membrane.
Response: Comment noted. We trust the reviewer is correct. In 1998 osmotic shock was used to activate the channel. We only intended to show that the system is consistent with previous electrophysiologic experiments.
References cited:
1 Du G, Huang P, Liang BT, Frohman MA. Phospholipase D2 localizes to the plasma membrane and regulates angiotensin II receptor endocytosis. Mol Biol Cell 2004;15:1024–30. htps://doi.org/10.1091/mbc.E03-09-0673.
2 Koch T, Wu DF, Yang LQ, Brandenburg LO, Höllt V. Role of phospholipase D2 in the agonist-induced and constistutive endocytosis of G-protein coupled receptors. J Neurochem 2006;97:365–72. htps://doi.org/10.1111/j.1471-4159.2006.03736.x.
3 Wheeler DS, Underhill SM, Stolz DB, Murdoch GH, Thiels E, Romero G, et al. Amphetamine activates Rho GTPase signaling to mediate dopamine transporter internalization and acute behavioral effects of amphetamine. Proc Natl Acad Sci U S A 2015;112:E7138–47. htps://doi.org/10.1073/pnas.1511670112.
4 Rankovic M, Jacob L, Rankovic V, Brandenburg L-OO, Schröder H, Höllt V, et al. ADP-ribosylation factor 6 regulates mu-opioid receptor trafficking and signaling via activation of phospholipase D2. Cell Signal 2009;21:1784–93. htps://doi.org/10.1016/j.cellsig.2009.07.014.
5 Pavel MA, Petersen EN, Wang H, Lerner RA, Hansen SB. Studies on the mechanism of general anesthesia. Proc Natl Acad Sci U S A 2020;117:13757–66. htps://doi.org/10.1073/pnas.2004259117.
6 Call IM, Bois JL, Hansen SB. Super-resolution imaging of potassium channels with genetically encoded EGFP. BioRxiv 2023. htps://doi.org/10.1101/2023.10.13.561998.
Author response:
The following is the authors’ response to the original reviews.
Public Reviews:
Reviewer #1 (Public Review):
Summary:
In this study, James Lee, Lu Bai, and colleagues use a multifaceted approach to investigate the relationship between transcription factor condensate formation, transcription, and 3D gene clustering of the MET regulon in the model organism S. cerevisiae. This study represents a second clear example of inducible transcriptional condensates in budding yeast, as most evidence for transcriptional condensates arises from studies of mammalian systems. In addition, this study links the genomic location of transcriptional condensates to the potency of transcription of a reporter gene regulated by the master transcription factor contained in the condensate. The strength of evidence supporting these two conclusions is strong. Less strong is evidence supporting the claim that Met4-containing condensates mediate the clustering of genes in the MET regulon.
Strengths:
The manuscript is for the most part clearly written, with the overriding model and specific hypothesis being tested clearly explained. Figure legends are particularly well written. An additional strength of the manuscript is that most of the main conclusions are supported by the data. This includes the propensity of Met4 and Met32 to form puncta-like structures under inducing conditions, formation of Met32-containing LLPS-like droplets in vitro (within which Met4 can colocalize), colocalization of Met4-GFP with Met4-target genes under inducing conditions, enhanced transcription of a Met3pr-GFP reporter when targeted within 1.5 - 5 kb of select Met4 target genes, and most impressively, evidence that several MET genes appear to reposition under transcriptionally inducing conditions. The latter is based on a recently reported novel in vivo methylation assay, MTAC, developed by the Bai lab.
Weaknesses:
My principal concern is that the authors fail to show convincing evidence for a key conclusion, highlighted in the title, that nuclear condensates per se drive MET gene clustering. Figure 4E demonstrates that Met4 molecules, not condensates per se, are necessary for fostering distant cis and trans interactions between MET6 and three other Met4 targets under -met inducing conditions. In addition, the paper would be strengthened by discussing a recent study conducted in yeast that comes to many of the same conclusions reported here, including the role of inducible TF condensates in driving 3D genome reorganization (Chowdhary et al, Mol. Cell 2022).
Following the reviewer’s advice, we carried out MTAC with the VP near MET6 in WT Met4 and ΔIDR2.3 strains (results shown below). The conclusions are somewhat ambiguous. For long-distance interactions with MUP1, YKG9, STR3, and MET13, we indeed observe decreased MTAC signals close to background levels in the ΔIDR2.3 strain, which aligns with the model suggesting that Met4 condensation promotes clustering among Met4 targeted genes. However, we also noticed significant decreases in the local MTAC signals (HIS3 and MET6). It is possible that the changes in Met4 condensates alter the chromosomal folding near MET6, thereby affecting the local MTAC signals. Alternatively, LacI-M.CviPI (the methyltransferase) could be induced to a lesser extent in the ΔIDR2.3 strain, leading to a genome-wide decrease in MTAC signals. Due to this ambiguity, we decided not to include the following plot in the main figure.
Author response image 1.
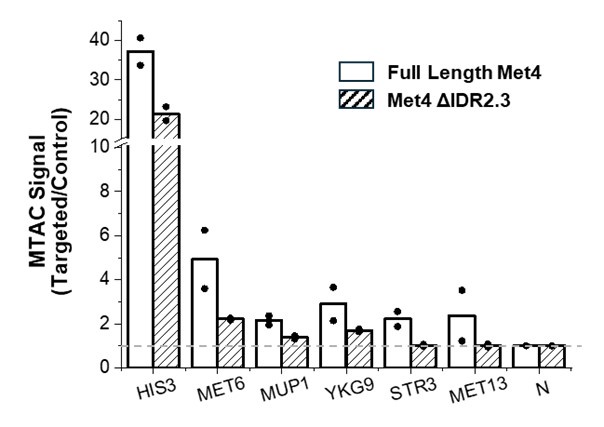
We discussed Hsf1 and added the suggested reference on page 13.
Other concerns:
(1) A central premise of the study is that the inducible formation of condensates underpins the induction of MET gene transcription and MET gene clustering. Yet, Figure 1 suggests (and the authors acknowledge) that puncta-like Met4-containing structures pre-exist in the nuclei of non-induced cells. Thus, the transcription and gene reorganization observed is due to a relatively modest increase in condensate-like structures. Are we dealing with two different types of Met4 condensates? (For example, different combinations of Met4 with its partners; Mediator- or Pol II-lacking vs. Mediator- or Pol II-containing; etc.?) At the very least, a comment to this effect is necessary.
Although Met4 can form smaller puncta in the +met condition (Figure 1A), it cannot be recruited to its target genes due to the absence of its sequence-specific binding partners, Met31 and Met32 (these two factors are actively degraded in the +met condition). Consistently, in the +met condition, Met4 shows extremely low genome-wide ChIP signals (Figure 3C). Therefore, these Met4 puncta in +met do not have organize the 3D genome or have gene regulatory functions. This discussion is added on page 12.
(2) Using an in vitro assay, the authors demonstrate that Met4 colocalizes with Met32 LLPS droplets (Figure 2F). Is the same true in vivo - that is, is Met32 required for Met4 condensation? This could be readily tested using auxin-induced degradation of Met32. Along similar lines, the claim that Met32 is required for MET gene clustering (line 250) requires auxin-induced degradation of this protein.
As the reviewer pointed out above, cells in the +met condition also show small Met4 puncta. In this condition, Met32 is essentially undetectable (Met31 level is even lower and remains undetectable even in the -met conditions). Therefore, Met4 does not strictly require the presence of Met32 in vivo (may require other factors or modifications). Met4 does not have DNA-binding activity, and therefore it cannot target and organize chromosomes on its own. Although we did not do the Met32 degradation experiment, we measured the 3D genome conformation in +met and showed that there are no detectable interactions among Met4 target genes.
(3) The authors use a single time point during -met induction (2 h) to evaluate TF clustering, transcription (mRNA abundance), and 3D restructuring. It would be informative to perform a kinetic analysis since such an analysis could reveal whether TF clustering precedes transcriptional induction or MET gene repositioning. Do the latter two phenomena occur concurrently or does one precede the other?
We appreciate the reviewer’s insightful question. It is indeed intriguing to consider whether TF clustering precedes transcriptional induction and MET gene clustering. However, as mentioned on page 12 of our manuscript, this experiment poses significant challenges. The low intensities of the Met4 and Met32 signals necessitate high excitation for imaging, which also makes them prone to photo-bleaching. Consequently, we have been unable to measure the dynamics of Met4 and Met32 puncta in vivo, let alone co-image them with DNA/RNA. Undertaking this experiment will require considerable effort, which we plan to pursue in the future.
(4) Based on the MTAC assay, MET13 does not appear to engage in trans interactions with other Met4 targets, whereas MET6 does (Figures 4C and 4E). Does this difference stem from the greater occupancy of Met4 at MET6 vs. MET13, greater association of another Met co-factor with the chromatin of MET6 vs. MET13, or something else?
We were also surprised by this result, given that MET13 emerged as one of the strongest transcriptional hotspots in our previous screen. It also exhibits one of the highest Met4 ChIP signals and is closely associated with the nuclear pore complex. Our earlier findings indicate that DNA dynamics near the VP significantly influence the MTAC signal; specifically, a VP with constrained motion is less effective at methylating interacting sites (Li et al., 2024). Therefore, it is plausible that MET13 is associated with a large Met4 condensate, which constrains the motion of nearby chromatin and diminishes MTAC efficiency.
Reviewer #2 (Public Review):
Summary:
This manuscript combines live yeast cell imaging and other genomic approaches to study how transcription factor (TF) condensates might help organize and enhance the transcription of the target genes in the methionine starvation response pathway. The authors show that the TFs in this response can form phase-separated condensates through their intrinsically disordered regions (IDRs), and mediate the spatial clustering of the related endogenous genes as well as reporter inserted near the endogenous target loci.
Strengths:
This work uses rigorous experimental approaches, such as imaging of endogenously labeled TFs, determining expression and clustering of endogenous target genes, and reporter integration near the endogenous target loci. The importance of TFs is shown by rapid degradation. Single-cell data are combined with genomic sequencing-based assays. Control loci engineered in the same way are usually included. Some of these controls are very helpful in showing the pathway-specific effect of the TF condensates in enhancing transcription.
Weaknesses:
Perhaps the biggest weakness of this work is that the role of IDR and phase separation in mediating the target gene clustering is unclear. This is an important question. TF IDRs may have many functions including mediating phase separation and binding to other transcriptional molecules (not limited to proteins and may even include RNAs). The effect of IDR deletion on reduced Fano number in cells could come from reduced binding with other molecules. This should be tested on phase separation of the purified protein after IDR deletion. Also, the authors have not shown IDR deletion affects the clustering of the target genes, so IDR deletion may affect the binding of other molecules (not the general transcription machinery) that are specifically important for target gene transcription. If the self-association of the IDR is the main driving force of the clustering and target gene transcription enhancement, can one replace this IDR with totally unrelated IDRs that have been shown to mediate phase separation in non-transcription systems and still see the gene clustering and transcription enhancement effects? This work has all the setup to test this hypothesis.
We thank the reviewer for raising this point, and we tried more in vitro and in vivo experiments with Met4 IDR deletions. See the answer to Reviewer 1 for the in vivo 3D mapping experiment.
We purified Met4-ΔIDR2 with an MBP tag, but its low yield made labeling and conducting thorough experiments challenging. At concentrations above ~10 μM, the protein tends to aggregate, while at lower concentrations, it remains diffusive in solution and does not form condensates. When we mixed purified Met4-ΔIDR2 with Met32, we observed reduced partitioning inside Met32 condensates compared to the full-length Met4. As the reviewer noted, this diminished interaction may contribute to the decreased puncta formation observed in vivo. This result is added to the manuscript on page 11 and supplementary figure 5.
The Met4 protein was tagged with MBP but Met 32 was not. MBP tag is well known to enhance protein solubility and prevent phase separation. This made the comparison of their in vitro phase behavior very different and led the authors to think that maybe Met32 is the scaffold in the co-condensates. If MBP was necessary to increase yield and solubility during expression and purification, it should be cleaved (a protease cleavage site should be engineered) to allow phase separation in vitro.
Following the reviewer’s advice, we purified Met4-TEV-MBP so that the MBP can be cleaved off. Unfortunately, concentrated Met4-TEV-MBP needs to be stored at high salt (400mM) to be soluble. When exchanged into a suitable buffer for TEV cleavage (≤200 mM NaCl), nearly all soluble protein aggregates. Attempts to digest the protein in storage buffer results in observable aggregation before significant cleavage (see below).
Author response image 2.
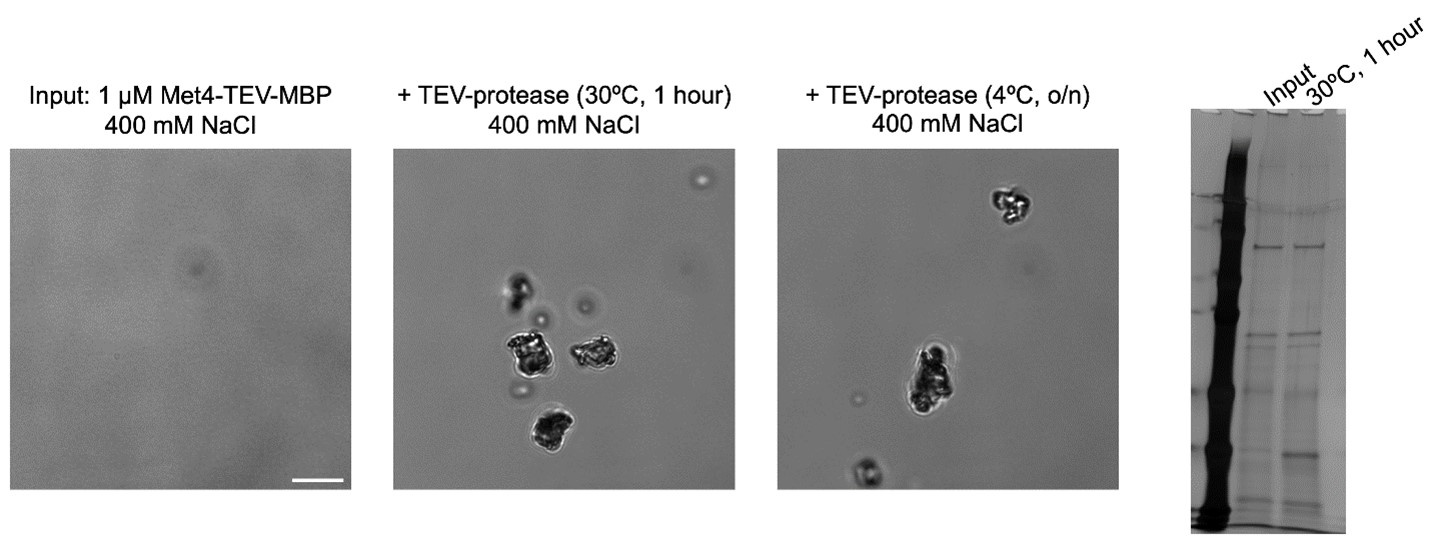
Are ATG36 and LDS2 also supposed to be induced by -met? This should be explained clearly. The signals are high at -met.
Genomic loci ATG36 and LDS2 were chosen as controls because they are not bound by Met TFs (ChIP-seq tracks) and their expressions are not induced by -met (RNA-seq data). This information is added to the manuscript on page 9. When MET3pr-GFP reporter is inserted into these loci, GFP is induced by -met (because it is driven by the MET3 promoter), but the induction level is less than the same reporter inserted into the transcriptional hotspot like MET13 and MET6 (Figure 6E, also see Du et al., Plos Genetics, 2017).
ChIP-seq data:
Author response image 3.
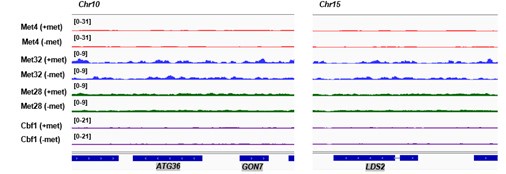
RNA-seq counts:
Author response table 1.
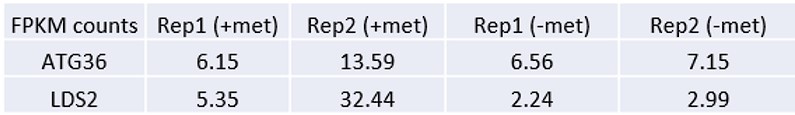
Figure 6B, the Met4-GFP seems to form condensates at all three loci without a very obvious difference, though 6C shows a difference. 6C is from only one picture each. The authors should probably quantify the signals from a large number of randomly selected pictures (cells) and do statistics.
If we understand this comment correctly, the reviewer is referring to the fact that all three loci in Figure 6B appear to show a peak in GFP intensity. This pattern emerges because these images are averaged among many cells (number of cells analyzed in 6B has been added to the Figure legends). GFP intensities near the center will always be higher because peripheral pixels are more likely to fall outside the nuclei boundaries, where Met4 signals are absent (same as in Figure 3F). Importantly, MET6 locus shows higher intensity near the center in comparison to PUT1 and ATG36, indicating its co-localization with Met4 condensates.
Reviewer #3 (Public Review):
Summary:
In this study, the authors probe the connections between clustering of the Met4/32 transcription factors (TFs), clustering of their regulatory targets, and transcriptional regulation. While there is an increasing number of studies on TF clustering in vitro and in vivo, there is an important need to probe whether clustering plays a functional role in gene expression. Another important question is whether TF clustering leads to the clustering of relevant gene targets in vivo. Here the authors provide several lines of evidence to make a compelling case that Met4/32 and their target genes cluster and that this leads to an increase in transcription of these genes in the induced state. First, they found that, in the induced state, Met4/32 forms co-localized puncta in vivo. This is supported by in vitro studies showing that these TFs can form condensates in vitro with Med32 being the driver of these condensates. They found that two target genes, MET6 and MET13 have a higher probability of being co-localized with Met4 puncta compared with non-target loci. Using a targeted DNA methylation assay, they found that MET13 and MET6 show Met4-dependent long-range interactions with other Met4-regulated loci, consistent with the clustering of at least some target genes under induced conditions. Finally, by inserting a Met4-regulated reporter gene at variable distances from MET6, they provide evidence that insertion near this gene is a modest hotspot for activity.
Weaknesses:
(1) Please provide more information on the assay for puncta formation (Figure 1). It's unclear to me from the description provided how this assay was able to quantitate the number of puncta in cells.
Due to the variation in puncta size and intensity (as illustrated in Figure 1A), counting the number of puncta would be highly subjective with arbitrary cutoffs. Therefore, we chose to calculate the CV and Fano values instead, which are unbiased measures. Proteins that form puncta will exhibit greater pixel-to-pixel variations in GFP intensity, resulting in higher CV and Fano values.
(2) How does the number of puncta in cells correspond with the number of Met-regulated genes? What are the implications of this calculation?
As previously mentioned, defining the exact number of Met4 puncta is challenging. The number of puncta does not necessarily have one-to-one correspondence to the number of Met4 target genes. Some puncta may not be associated with chromosomes, while others may interact with multiple genes.
(3) A control for chromosomal insertion of the Met-regulated reporter was a GAL4 promoter derivative reporter. However, this control promoter seems 5-10 fold more active than the Met-regulated promoter (Figure 6). It's possible that the high activity from the control promoter overcomes some other limiting step such that chromosomal location isn't important. It would be ideal if the authors used a promoter with comparable activity to the Met-reporter as a control.
We agree with the reviewer that it will be better to use another promoter with comparable activity. Indeed, this was our rationale for selecting the attenuated GAL1 promoter over the WT version; however, it still exhibited substantially higher activity than the MET3pr. Unfortunately, we do not have a promoter from a different pathway that is calibrated to match the activity level of MET3pr. Nonetheless, MET17pr has much higher activity (~3 fold) than MET3pr, and we observed similar degree of stimulus from the hotspot in comparison to the control locus for both promoters (1.5-2-fold increase in GFP expression) (Figure 6E & F). This suggests that the observed effects are more likely to depend on the activation pathway and TF identity rather than the promoter strength.
(4) It seems like transcription from a very large number of genes is altered in the Met4 IDR mutant (Figure 7F). Why is this and could this variability affect the conclusions from this experiment?
We agree with the reviewer that ΔIDR 2.3 truncation affects the expression of 2711 (P-adj <0.05) genes (1339 up,1372 down). We suspect that this is due to the decreased expression of Met4 target genes, leading to altered levels of methionine and other sulfur-containing metabolites. Such changes would have a global impact on gene expression. Importantly, despite the similar number of genes that show up vs down regulation in the ΔIDR 2.3 strain, almost all Met4 targets showed decreased expression (Fig 7F). This supports the model where Met4 condensates lead to increased expression in its target genes.
Recommendations for the authors:
Reviewer #1 (Recommendations for The Authors):
(1) The introduction contains multiple miscitations. Rather than gene clustering, most of the studies and reviews cited (e.g., lines 35-39) report interactions between genomic loci (E-E, E-P, and P-P). There are other claims not supported by the papers cited. Moreover, the authors lump together original research papers and reviews within a given group without distinguishing which is which.
We thank the reviewer for pointing this out. We reorganized the references in the introduction.
(2) One option to address the concern regarding the lack of evidence that nuclear condensates per se drive MET gene clustering is to test the impact of Met4 ΔIDR2.3 on MTAC signals.
We carried out the suggested experiment. See answer above (Reviewer #1, Question #1).
(3) Authors claim that there are significant differences between values depicted in Figures 1B and 3G. Statistical tests are necessary to show this.
Significance values were calculated in comparison to free GFP using two-tailed Student’s t-test in 1B,1C, and 3G. The corresponding figure legends are updated.
(4) How are the data in Figures 3F, G, and 6B, C generated? This is unclear from the information provided in the Figure legends and Materials and Methods.
For each cell, we projected the highest mCherry and GFP intensity at each pixel for all z positions onto a 2D plane (MIP). The MIP images were aligned with the mCherry dot at the center and averaged among all cells. To calculate the GFP intensities like in Figure 3G and 6C, a single line was drawn across the center and the GFP profile was analyzed by ImageJ. We now describe this in the corresponding figure legends, and the Materials and Methods are also updated.
(5) Typos/ unclear writing: lines 24, 58, 79, 82, 84, 96, 117, 121, 131, 142, 147, 161 (terminus, not "terminal"), 250, 325, 349, 761 (was, not "are"). For several of these: "condense" is not "condensate"; for many others: inappropriate use of "the". Supplementary Figure 1 legend: not "a single nuclei" instead "a single nucleus".
We thank the reviewer for pointing this out. We tried our best to correct grammatical errors.
(6) Define GAL1Spr (Figure 6F).
The GAL1S promoter is an attenuated GAL1 promoter that lacks two out of the four Gal4 binding site. The original paper is now cited in the manuscript on page 10.
(7) Figure 7B, C: there appears to be an inconsistency between the image and bar graph value for ΔIDR3.
The Fano values calculated in 7C are averaged among a population of cells (we added the cell numbers to the legend), while the image in 7B is an example of an individual nucleus. There is some cell-to-cell variability in how the Met4 appears. To be more representative, we chose a different image for ΔIDR3.
(8) Supplementary Tables: use descriptive titles for file names.
This is corrected.
Reviewer #2 (Recommendations For The Authors):
Minor:
Figure 4F is not cited in the text, and the color legend seems wrong for targeted and control.
Figure 4F is now cited in the text. The labels were corrected.
Author response:
The following is the authors’ response to the original reviews
Public Reviews:
Reviewer #1 (Public review):
Summary:
Mackie and colleagues compare chemosensory preferences between C. elegans and P. pacificus, and the cellular and molecular mechanisms underlying them. The nematodes have overlapping and distinct preferences for different salts. Although P. pacificus lacks the lsy-6 miRNA important for establishing asymmetry of the left/right ASE salt-sensing neurons in C. elegans, the authors find that P. pacificus ASE homologs achieve molecular (receptor expression) and functional (calcium response) asymmetry by alternative means. This work contributes an important comparison of how these two nematodes sense salts and highlights that evolution can find different ways to establish asymmetry in small nervous systems to optimize the processing of chemosensory cues in the environment.
Strengths:
The authors use clear and established methods to record the response of neurons to chemosensory cues. They were able to show clearly that ASEL/R are functionally asymmetric in P. pacificus, and combined with genetic perturbation establish a role for che-1-dependent gcy-22.3 in in the asymmetric response to NH<sub>4</sub>Cl.
Weaknesses:
The mechanism of lsy-6-independent establishment of ASEL/R asymmetry in P. pacificus remains uncharacterized.
We thank the reviewer for recognizing the novel contributions of our work in revealing the existence of alternative pathways for establishing neuronal lateral asymmetry without the lsy-6 miRNA in a divergent nematode species. We are certainly encouraged now to search for genetic factors that alter the exclusive asymmetric expression of gcy-22.3.
Reviewer #2 (Public review):
Summary:
In this manuscript, Mackie et al. investigate gustatory behavior and the neural basis of gustation in the predatory nematode Pristionchus pacificus. First, they show that the behavioral preferences of P. pacificus for gustatory cues differ from those reported for C. elegans. Next, they investigate the molecular mechanisms of salt sensing in P. pacificus. They show that although the C. elegans transcription factor gene che-1 is expressed specifically in the ASE neurons, the P. pacificus che-1 gene is expressed in the Ppa-ASE and Ppa-AFD neurons. Moreover, che-1 plays a less critical role in salt chemotaxis in P. pacificus than C. elegans. Chemogenetic silencing of Ppa-ASE and Ppa-AFD neurons results in more severe chemotaxis defects. The authors then use calcium imaging to show that both Ppa-ASE and Ppa-AFD neurons respond to salt stimuli. Calcium imaging experiments also reveal that the left and right Ppa-ASE neurons respond differently to salts, despite the fact that P. pacificus lacks lsy-6, a microRNA that is important for ASE left/right asymmetry in C. elegans. Finally, the authors show that the receptor guanylate cyclase gene Ppa-gcy-23.3 is expressed in the right Ppa-ASE neuron (Ppa-ASER) but not the left Ppa-ASE neuron (Ppa-ASEL) and is required for some of the gustatory responses of Ppa-ASER, further confirming that the Ppa-ASE neurons are asymmetric and suggesting that Ppa-GCY-23.3 is a gustatory receptor. Overall, this work provides insight into the evolution of gustation across nematode species. It illustrates how sensory neuron response properties and molecular mechanisms of cell fate determination can evolve to mediate species-specific behaviors. However, the paper would be greatly strengthened by a direct comparison of calcium responses to gustatory cues in C. elegans and P. pacificus, since the comparison currently relies entirely on published data for C. elegans, where the imaging parameters likely differ. In addition, the conclusions regarding Ppa-AFD neuron function would benefit from additional confirmation of AFD neuron identity. Finally, how prior salt exposure influences gustatory behavior and neural activity in P. pacificus is not discussed.
Strengths:
(1) This study provides exciting new insights into how gustatory behaviors and mechanisms differ in nematode species with different lifestyles and ecological niches. The results from salt chemotaxis experiments suggest that P. pacificus shows distinct gustatory preferences from C. elegans. Calcium imaging from Ppa-ASE neurons suggests that the response properties of the ASE neurons differ between the two species. In addition, an analysis of the expression and function of the transcription factor Ppa-che-1 reveals that mechanisms of ASE cell fate determination differ in C. elegans and P. pacificus, although the ASE neurons play a critical role in salt sensing in both species. Thus, the authors identify several differences in gustatory system development and function across nematode species.
(2) This is the first calcium imaging study of P. pacificus, and it offers some of the first insights into the evolution of gustatory neuron function across nematode species.
(3) This study addresses the mechanisms that lead to left/right asymmetry in nematodes. It reveals that the ASER and ASEL neurons differ in their response properties, but this asymmetry is achieved by molecular mechanisms that are at least partly distinct from those that operate in C. elegans. Notably, ASEL/R asymmetry in P. pacificus is achieved despite the lack of a P. pacificus lsy-6 homolog.
Weaknesses:
(1) The authors observe only weak attraction of C. elegans to NaCl. These results raise the question of whether the weak attraction observed is the result of the prior salt environment experienced by the worms. More generally, this study does not address how prior exposure to gustatory cues shapes gustatory responses in P. pacificus. Is salt sensing in P. pacificus subject to the same type of experience-dependent modulation as salt sensing in C. elegans?
We tested if starving animals in the presence of a certain salt will result in those animals avoiding it. However, under our experimental conditions we were unable to detect experiencedependent modulation either in P. pacificus or in C. elegans.
Author response image 1.
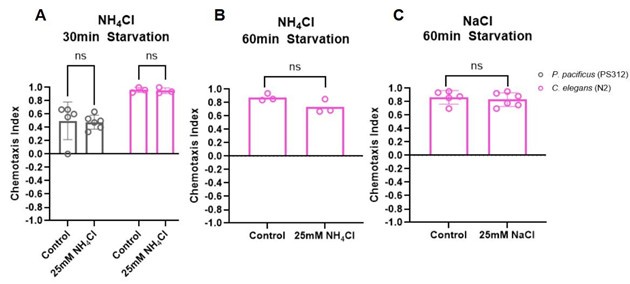
(2) A key finding of this paper is that the Ppa-CHE-1 transcription factor is expressed in the PpaAFD neurons as well as the Ppa-ASE neurons, despite the fact that Ce-CHE-1 is expressed specifically in Ce-ASE. However, additional verification of Ppa-AFD neuron identity is required. Based on the image shown in the manuscript, it is difficult to unequivocally identify the second pair of CHE-1-positive head neurons as the Ppa-AFD neurons. Ppa-AFD neuron identity could be verified by confocal imaging of the CHE-1-positive neurons, co-expression of Ppa-che1p::GFP with a likely AFD reporter, thermotaxis assays with Ppa-che-1 mutants, and/or calcium imaging from the putative Ppa-AFD neurons.
In the revised manuscript, we provide additional and, we believe, conclusive evidence for our correct identification of Ppa-AFD neuron being another CHE-1 expressing neuron. Specifically, we have constructed and characterized 2 independent reporter strains of Ppa-ttx-1, a putative homolog of the AFD terminal selector in C. elegans. There are two pairs of ttx-1p::rfp expressing amphid neurons. The anterior neuronal pair have finger-like endings that are unique for AFD neurons compared to the dendritic endings of the 11 other amphid neuron pairs (no neuron type has a wing morphology in P. pacificus). Their cell bodies are detected in the newly tagged TTX-1::ALFA strain that co-localize with the anterior pair of che-1::gfp-expressing amphid neurons (n=15, J2-Adult).
We note that the identity of the posterior pair of amphid neurons differs between the ttx-1p::rfp promoter fusion reporter and TTX-1::ALFA strains– the ttx-1p::rfp posterior amphid pair overlaps with the gcy-22.3p::gfp reporter (ASER) but the TTX-1::ALFA posterior amphid pair do not overlap with the posterior pair of che-1::gfp-expressing amphid neurons (n=15). Given that there are 4 splice forms detected by RNAseq (Transcriptome Assembly Trinity, 2016; www.pristionchus.org), this discrepancy between the Ppa-ttx-1 promoter fusion reporter and the endogenous expression of the Ppa-TTX-1 C-terminally tagged to the only splice form containing Exon 18 (ppa_stranded_DN30925_c0_g1_i5, the most 3’ exon) may be due to differential expression of different splice variants in AFD, ASE, and another unidentified amphid neuron types.
Although we also made reporter strains of two putative AFD markers, Ppa-gcy-8.1 (PPA24212)p::gfp; csuEx101 and Ppa-gcy-8.2 (PPA41407)p::gfp; csuEx100, neither reporter showed neuronal expression.
(3) Loss of Ppa-che-1 causes a less severe phenotype than loss of Ce-che-1. However, the loss of Ppa-che-1::RFP expression in ASE but not AFD raises the question of whether there might be additional start sites in the Ppa-che-1 gene downstream of the mutation sites. It would be helpful to know whether there are multiple isoforms of Ppa-che-1, and if so, whether the exon with the introduced frameshift is present in all isoforms and results in complete loss of Ppa-CHE-1 protein.
According to www.pristionchus.org (Transcriptome Assembly Trinity), there is only a single detectable splice form by RNAseq. Once we have a Ppa-AFD-specific marker, we would be able to determine how much of the AFD terminal effector identify (e.g. expression of gcy-8 paralogs) is effected by the loss of Ppa-che-1 function.
(4) The authors show that silencing Ppa-ASE has a dramatic effect on salt chemotaxis behavior. However, these data lack control with histamine-treated wild-type animals, with the result that the phenotype of Ppa-ASE-silenced animals could result from exposure to histamine dihydrochloride. This is an especially important control in the context of salt sensing, where histamine dihydrochloride could alter behavioral responses to other salts.
We have inadvertently left out this important control. Because the HisCl1 transgene is on a randomly segregating transgene array, we have scored worms with and without the transgene expressing the co-injection marker (Ppa-egl-20p::rfp, a marker in the tail) to show that the presence of the transgene is necessary for the histamine-dependent knockdown of NH<sub>4</sub>Br attraction. This control is added as Figure S2.
(5) The calcium imaging data in the paper suggest that the Ppa-ASE and Ce-ASE neurons respond differently to salt solutions. However, to make this point, a direct comparison of calcium responses in C. elegans and P. pacificus using the same calcium indicator is required. By relying on previously published C. elegans data, it is difficult to know how differences in growth conditions or imaging conditions affect ASE responses. In addition, the paper would be strengthened by additional quantitative analysis of the calcium imaging data. For example, the paper states that 25 mM NH<sub>4</sub>Cl evokes a greater response in ASEL than 250 mM NH<sub>4</sub>Cl, but a quantitative comparison of the maximum responses to the two stimuli is not shown.
We understand that side-by-side comparisons with C. elegans using the same calcium indicator would lend more credence to the differences we observed in P. pacificus versus published findings in C. elegans from the past decades, but are not currently in a position to conduct these experiments in parallel.
(6) It would be helpful to examine, or at least discuss, the other P. pacificus paralogs of Ce-gcy22. Are they expressed in Ppa-ASER? How similar are the different paralogs? Additional discussion of the Ppa-gcy-22 gene expansion in P. pacificus would be especially helpful with respect to understanding the relatively minor phenotype of the Ppa-gcy-22.3 mutants.
In P. pacificus, there are 5 gcy-22-like paralogs and 3 gcy-7-like paralogs, which together form a subclade that is clearly distinct from the 1-1 Cel-gcy-22, Cel-gcy-5, and Cel-gcy-7 orthologs in a phylogenetic tree containing all rGCs in P. pacificus, C. elegans, and C. briggssae (Hong et al, eLife, 2019). In Ortiz et al (2006 and 2009), Cel-gcy-22 stands out from other ASER-type gcy genes (gcy-1, gcy-4, gcy-5) in being located on a separate chromosome (Chr. V) as well as in having a wider range of defects in chemoattraction towards salt ions. Given that the 5 P. pacificus gcy-22-like paralogs are located on 3 separate chromosomes without clear synteny to their C. elegans counterparts, it is likely that the gcy-22 paralogs emerged from independent and repeated gene duplication events after the separation of these Caenorhabditis and Pristionchus lineages. Our reporter strains for two other P. pacificus gcy-22-like paralogs either did not exhibit expression in amphid neurons (Ppa-gcy-22.1p::GFP, ) or exhibited expression in multiple neuron types in addition to a putative ASE neuron (Ppa-gcy-22.4p::GFP). We have expanded the discussion on the other P. pacificus gcy-22 paralogs.
(7) The calcium imaging data from Ppa-ASE is quite variable. It would be helpful to discuss this variability. It would also be helpful to clarify how the ASEL and ASER neurons are being conclusively identified during calcium imaging.
For each animal, the orientation of the nose and vulva were recorded and used as a guide to determine the ventral and dorsal sides of the worm, and subsequently, the left and right sides of the worm. Accounting for the plane of focus of the neuron pairs as viewed through the microscope, it was then determined whether the imaged neuron was the worm’s left or right neuron of each pair. We added this explanation to the Methods.
(8) More information about how the animals were treated prior to calcium imaging would be helpful. In particular, were they exposed to salt solutions prior to imaging? In addition, the animals are in an M9 buffer during imaging - does this affect calcium responses in Ppa-ASE and Ppa-AFD? More information about salt exposure, and how this affects neuron responses, would be very helpful.
Prior to calcium imaging, animals were picked from their cultivation plates (using an eyelash pick to minimize bacteria transfer) and placed in loading solution (M9 buffer with 0.1% Tween20 and 1.5 mM tetramisole hydrochloride, as indicated in the Method) to immobilize the animals until they were visibly completely immobilized.
(9) In Figure 6, the authors say that Ppa-gcy-22.3::GFP expression is absent in the Ppa-che1(ot5012) mutant. However, based on the figure, it looks like there is some expression remaining. Is there a residual expression of Ppa-gcy-22.3::GFP in ASE or possibly ectopic expression in AFD? Does Ppa-che-1 regulate rGC expression in AFD? It would be helpful to address the role of Ppa-che-1 in AFD neuron differentiation.
In Figure 6C, the green signal is autofluorescence in the gut, and there is no GFP expression detected in any of the 55 che-1(-) animals we examined. We are currently developing AFDspecific rGC markers (gcy-8 homologs) to be able to examine the role of Ppa-CHE-1 in regulating AFD identity.
Recommendations for the authors:
Reviewer #1 (Recommendations for the authors):
(1) Abstract: 'how does sensory diversity prevail within this neuronal constraint?' - could be clearer as 'numerical constraint' or 'neuron number constraint'.
We have clarified this passage as ‘…constraint in neuron number’.
(2) 'Sensory neurons in the Pristionchus pacificus' - should get rid of the 'the'.
We have removed the ‘the’.
(3) Figure 2: We have had some good results with the ALFA tag using a similar approach (tagging endogenous loci using CRISPR). I'm not sure if it is a Pristionchus thing, or if it is a result of our different protocols, but our staining appears stronger with less background. We use an adaptation of the Finney-Ruvkin protocol, which includes MeOH in the primary fixation with PFA, and overcomes the cuticle barrier with some LN2 cracking, DTT, then H2O2. No collagenase. If you haven't tested it already it might be worth comparing the next time you have a need for immunostaining.
We appreciate this suggestion. Our staining protocol uses paraformaldehyde fixation. We observed consistent and clear staining in only 4 neurons in CHE-1::ALFA animals but more background signals from TTX-1::ALFA in Figure 2I-J in that could benefit from improved immunostaining protocol.
(4) Page 6: 'By crossing the che-1 reporter transgene into a che-1 mutant background (see below), we also found that che-1 autoregulates its own expression (Figure 2F), as it does in C. elegans' - it took me some effort to understand this. It might make it easier for future readers if this is explained more clearly.
We understand this confusion and have changed the wording along with a supporting table with a more detailed account of che-1p::RFP expression in both ASE and AFD neurons in wildtype and che-1(-) backgrounds in the Results.
(5) Line numbers would make it easier for reviewers to reference the text.
We have added line numbers.
(6) Page 7: is 250mM NH<sub>4</sub>Cl an ecologically relevant concentration? When does off-target/nonspecific activation of odorant receptors become an issue? Some discussion of this could help readers assess the relevance of the salt concentrations used.
This is a great question but one that is difficult to reconcile between experimental conditions that often use 2.5M salt as point-source to establish salt gradients versus ecologically relevant concentrations that are very heterogenous in salinity. Efforts to show C. elegans can tolerate similar levels of salinity between 0.20-0.30 M without adverse effects have been recorded previously (Hu et al., Analytica Chimica Acta 2015; Mah et al. Expedition 2017).
(7) It would be nice for readers to have a short orientation to the ecological relevance of the different salts - e.g. why Pristionchus has a particular taste for ammonium salts.
Pristionchus species are entomophilic and most frequently found to be associated with beetles in a necromenic manner. Insect cadavers could thus represent sources of ammonium in the soil. Additionally, ammonium salts could represent a biological signature of other nematodes that the predatory morphs of P. pacificus could interpret as prey. We have added the possible ecological relevance of ammonium salts into the Discussion.
(8) Page 11: 'multiple P. pacificus che-1p::GCaMP strains did not exhibit sufficient basal fluorescence to allow for image tracking and direct comparison'. 500ms exposure to get enough signal from RCaMP is slow, but based on the figures it still seems enough to capture things. If image tracking was the issue, then using GCaMP6s with SL2-RFP or similar in conjunction with a beam splitter enables tracking when the GCaMP signal is low. Might be an option for the future.
These are very helpful suggestions and we hope to eventually develop an improved che1p::GCaMP strain for future studies.
(9) Sometimes C. elegans genes are referred to as 'C. elegans [gene name]' and sometimes 'Cel [gene name]'. Should be consistent. Same with Pristionchus.
We have now combed through and corrected the inconsistencies in nomenclature.
(10) Pg 12 - '...supports the likelihood that AFD receives inputs, possibly neuropeptidergic, from other amphid neurons' - the neuropeptidergic part could do with some justification.
Because the AFD neurons are not exposed directly to the environment through the amphid channel like the ASE and other amphid neurons, the calcium responses to salts detected in the AFD likely originate from sensory neurons connected to the AFD. However, because there is no synaptic connection from other amphid neurons to the AFD neurons in P. pacificus (unlike in C. elegans; Hong et al, eLife, 2019), it is likely that neuropeptides connect other sensory neurons to the AFDs. To avoid unnecessary confusion, we have removed “possibly neuropeptidergic.”
(11) Pg16: the link to the Hallam lab codon adaptor has a space in the middle. Also, the paper should be cited along with the web address (Bryant and Hallam, 2021).
We have now added the proper link, plus in-text citation. https://hallemlab.shinyapps.io/Wild_Worm_Codon_Adapter/ (Bryant and Hallem, 2021)
Full citation:
Astra S Bryant, Elissa A Hallem, The Wild Worm Codon Adapter: a web tool for automated codon adaptation of transgenes for expression in non-Caenorhabditis nematodes, G3 Genes|Genomes|Genetics, Volume 11, Issue 7, July 2021, jkab146, https://doi.org/10.1093/g3journal/jkab146
Reviewer #2 (Recommendations for the authors):
(1) In Figure 1, the legend states that the population tested was "J4/L4 larvae and young adult hermaphrodites," whereas in the main text, the population was described as "adult hermaphrodites." Please clarify which ages were tested.
We have tested J4-Adult stage hermaphrodites and have made the appropriate corrections in the text.
(2) The authors state that "in contrast to C. elegans, we find that P. pacificus is only moderately and weakly attracted to NaCl and LiCl, respectively." However, this statement does not reflect the data shown in Figure 1, where there is no significant difference between C. elegans and P. pacificus - both species show at most weak attraction to NaCl.
Although there is no statistically significant difference in NaCl attraction between P. pacificus and C. elegans, NaCl attraction in P. pacificus is significantly lower than its attraction to all 3 ammonium salts when compared to C. elegans. We have rephrased this statement as relative differences in the Results and updated the Figure legend.
(3) In Figure 1, the comparisons between C. elegans and P. pacificus should be made using a two-way ANOVA rather than multiple t-tests. Also, the sample sizes should be stated (so the reader does not need to count the circles) and the error bars should be defined.
We performed the 2-way ANOVA to detect differences between C. elegans and P. pacificus for the same salt and between salts within each species. We also indicated the sample size on the figure and defined the error bars.
Significance:
For comparisons of different salt responses within the same species:
- For C. elegans, NH<sub>4</sub>Br vs NH<sub>4</sub>Cl (**p<0.01), NH<sub>4</sub>Cl vs NH<sub>4</sub>I (* p<0.05), and NH<sub>4</sub>Cl vs NaCl (* p<0.05). All other comparisons are not significant.
- For P. pacificus, all salts showed (****p<0.0001) when compared to NaAc and to NH<sub>4</sub>Ac, except for NH<sub>4</sub>Ac and NaAc compared to each other (ns). Also, NH<sub>4</sub>Cl showed (*p<0.05) and NH<sub>4</sub>I showed (***p<0.001) when compared with LiCl and NaCl. All other comparisons are not significant.
For comparisons of salt responses between different species (N2 vs PS312):
- NH<sub>4</sub>I and LiCl (*p<0.05); NaAc and NH<sub>4</sub>Ac (****p<0.0001)
(4) It might be worth doing a power analysis on the data in Figure 3B. If the data are underpowered, this might explain why there is a difference in NH<sub>4</sub>Br response with one of the null mutants but not the other.
For responses to NH<sub>4</sub>Cl, since both che-1 mutants (rather than just one) showed significant difference compared to wildtype, we conducted a power analysis based on the effect size of that difference (~1.2; large). Given this effect size, the sample size for future experiments should be 12 (ANOVA).
For responses to NH<sub>4</sub>Br and given the effect size of the difference seen between wildtype (PS312) and ot5012 (~0.8; large), the sample size for future experiments should be 18 (ANOVA) for a power value of 0.8. Therefore, it is possible that the sample size of 12 for the current experiment was too small to detect a possible difference between the ot5013 alleles and wildtype.
(5) It would be helpful to discuss why silencing Ppa-ASE might result in a switch from attractive to repulsive responses to some of the tested gustatory cues.
For similar assays using Ppa-odr-3p::HisCl1, increasing histamine concentration led to decreasing C.I. for a given odorant (myristate, a P. pacificus-specific attractant). It is likely that the amount of histamine treatment for knockdown to zero (i.e. without a valence change) will differ depending on the attractant.
(6) The statistical tests used in Figure 3 are not stated.
Figure 3 used Two-way ANOVA with Dunnett’s post hoc test. We have now added the test in the figure legend.
(7) It would be helpful to examine the responses of ASER to the full salt panel in the Ppa-gcy-22.3 vs. wild-type backgrounds.
We understand that future experiments examining neuron responses to the full salt panel for wildtype and gcy-22.3 mutants would provide further information about the salts and specific ions associated with the GCY-22.3 receptor. However, we have tested a broader range of salts (although not yet the full panel) for behavioral assays in wildtype vs gcy-22.3 mutants, which we have included as part of an added Figure 8.
(8) The controls shown in Figure S1 may not be adequate. Ideally, the same sample size would be used for the control, allowing differences between control worms and experimental worms to be quantified.
Although we had not conducted an equal number of negative controls using green light without salt stimuli due to resource constraints (6 control vs ~10-19 test), we provided individual recordings with stimuli to show that conditions we interpreted as having responses rarely showed responses resembling the negative controls. Similarly, those we interpreted as having no responses to stimuli mostly resembled the no-stimuli controls (e.g. WT to 25 mM NH<sub>4</sub>Cl, gcy22.3 mutant to 250 mM NH<sub>4</sub>Cl).
(9) An osmolarity control would be helpful for the calcium imaging experiments.
We acknowledge that future calcium imaging experiments featuring different salt concentrations could benefit from osmolarity controls.
(10) In Figure S7, more information about the microfluidic chip design is needed.
The chip design features a U-shaped worm trap to facilitate loading the worm head-first, with a tapered opening to ensure the worm fits snugly and will not slide too far forward during recording. The outer two chip channels hold buffer solution and can be switched open (ON) or closed (OFF) by the Valvebank. The inner two chip channels hold experimental solutions. The inner channel closer to the worm trap holds the control solution, and the inner channel farther from the worm trap holds the stimulant solution.
We have added an image of the chip in Figure S7 and further description in the legend.
(11) Throughout the manuscript, the discussion of the salt stimuli focuses on the salts more than the ions. More discussion of which ions are eliciting responses (both behavioral and neuronal responses) would be helpful.
In Figure 7, the gcy-22.3 defect resulted in a statistically significant reduction in response only towards NH<sub>4</sub>Cl but not towards NaCl, which suggests ASER is the primary neuron detecting NH<sub>4</sub><sup>+</sup> ions. To extend the description of the gcy-22.3 mutant defects to other ions, we have added a Figure 8: chemotaxis on various salt backgrounds. We found only a mild increase in attraction towards NH<sub>4</sub><sup>+</sup> by both gcy-22.3 mutant alleles, but wild-type in their responses toward Cl<sup>-</sup>, Na<sup>+</sup>, or I<sup>-</sup>. The switch in the direction of change between the behavioral (enhanced) and calcium imaging result (reduced) suggests the behavioral response to ammonium ions likely involves additional receptors and neurons.
Minor comments:
(1) The full species name of "C. elegans" should be written out upon first use.
We have added ‘Caenorhabditis elegans’ to its first mention.
(2) In the legend of Figure 1, "N2" should not be in italics.
We have made the correction.
(3) The "che-1" gene should be in lowercase, even when it is at the start of the sentence.
We have made the correction.
(4) Throughout the manuscript, "HisCl" should be "HisCl1."
We have made these corrections to ‘HisCl1’.
(5) Figure 3A would benefit from more context, such as the format seen in Figure 7A. It would also help to have more information in the legend (e.g., blue boxes are exons, etc.).
(6) "Since NH<sub>4</sub>I sensation is affected by silencing of che-1(+) neurons but is unaffected in che-1 mutants, ASE differentiation may be more greatly impacted by the silencing of ASE than by the loss of che-1": I don't think this is exactly what the authors mean. I would say, "ASE function may be more greatly impacted...".
We have changed ‘differentiation’ to ‘function’ in this passage.
(7) In Figure 7F-G, the AFD neurons are referred to as AFD in the figure title but AM12 in the graph. This is confusing.
Thank you for noticing this oversight. We have corrected “AM12” to “AFD”.
(8) In Figure 7, the legend suggests that comparisons within the same genotype were analyzed. I do not see these comparisons in the figure. In which cases were comparisons within the same genotype made?
Correct, we performed additional tests between ON and OFF states within the same genotypes (WT and mutant) but did not find significant differences. To avoid unnecessary confusion, we have removed this sentence.
(9) The nomenclature used for the transgenic animals is unconventional. For example, normally the calcium imaging line would be listed as csuEx93[Ppa-che-1p::optRCaMP] instead of Ppache-1p::optRCaMP(csuEx93).
We have made these corrections to the nomenclature.
(10) Figure S6 appears to come out of order. Also, it would be nice to have more of a legend for this figure. The format of the figure could also be improved for clarity.
We have corrected Figure S6 (now S8) and added more information to the legend.
(11) Methods section, Chemotaxis assays: "Most assays lasted ~3.5 hours at room temperature in line with the speed of P. pacificus without food..." It's not clear what this means. Does it take the worms 3.5 hours to crawl across the surface of the plate?
Correct, P. pacificus requires 3-4 hours to crawl across the surface of the plate, which is the standard time for chemotaxis assays for some odors and all salts. We have added this clarification to the Methods.
Author Response
The following is the authors’ response to the original reviews.
eLife assessment
This study presents potentially valuable results on glutamine-rich motifs in relation to protein expression and alternative genetic codes. The author's interpretation of the results is so far only supported by incomplete evidence, due to a lack of acknowledgment of alternative explanations, missing controls and statistical analysis and writing unclear to non experts in the field. These shortcomings could be at least partially overcome by additional experiments, thorough rewriting, or both.
We thank both the Reviewing Editor and Senior Editor for handling this manuscript.
Based on your suggestions, we have provided controls, performed statistical analysis, and rewrote our manuscript. The revised manuscript is significantly improved and more accessible to non-experts in the field.
Reviewer #1 (Public Review):
Summary
This work contains 3 sections. The first section describes how protein domains with SQ motifs can increase the abundance of a lacZ reporter in yeast. The authors call this phenomenon autonomous protein expression-enhancing activity, and this finding is well supported. The authors show evidence that this increase in protein abundance and enzymatic activity is not due to changes in plasmid copy number or mRNA abundance, and that this phenomenon is not affected by mutants in translational quality control. It was not completely clear whether the increased protein abundance is due to increased translation or to increased protein stability.
In section 2, the authors performed mutagenesis of three N-terminal domains to study how protein sequence changes protein stability and enzymatic activity of the fusions. These data are very interesting, but this section needs more interpretation. It is not clear if the effect is due to the number of S/T/Q/N amino acids or due to the number of phosphorylation sites.
In section 3, the authors undertake an extensive computational analysis of amino acid runs in 27 species. Many aspects of this section are fascinating to an expert reader. They identify regions with poly-X tracks. These data were not normalized correctly: I think that a null expectation for how often poly-X track occur should be built for each species based on the underlying prevalence of amino acids in that species. As a result, I believe that the claim is not well supported by the data.
Strengths
This work is about an interesting topic and contains stimulating bioinformatics analysis. The first two sections, where the authors investigate how S/T/Q/N abundance modulates protein expression level, is well supported by the data. The bioinformatics analysis of Q abundance in ciliate proteomes is fascinating. There are some ciliates that have repurposed stop codons to code for Q. The authors find that in these proteomes, Q-runs are greatly expanded. They offer interesting speculations on how this expansion might impact protein function.
Weakness
At this time, the manuscript is disorganized and difficult to read. An expert in the field, who will not be distracted by the disorganization, will find some very interesting results included. In particular, the order of the introduction does not match the rest of the paper.
In the first and second sections, where the authors investigate how S/T/Q/N abundance modulates protein expression levels, it is unclear if the effect is due to the number of phosphorylation sites or the number of S/T/Q/N residues.
There are three reasons why the number of phosphorylation sites in the Q-rich motifs is not relevant to their autonomous protein expression-enhancing (PEE) activities:
First, we have reported previously that phosphorylation-defective Rad51-NTD (Rad51-3SA) and wild-type Rad51-NTD exhibit similar autonomous PEE activity. Mec1/Tel1-dependent phosphorylation of Rad51-NTD antagonizes the proteasomal degradation pathway, increasing the half-life of Rad51 from ∼30 min to ≥180 min (1). (page 1, lines 11-14)
Second, in our preprint manuscript, we have already shown that phosphorylation-defective Rad53-SCD1 (Rad51-SCD1-5STA) also exhibits autonomous PEE activity similar to that of wild-type Rad53-SCD (Figure 2D, Figure 4A and Figure 4C). We have highlighted this point in our revised manuscript (page 9, lines 19-21).
Third, as revealed by the results of Figure 4, it is the percentages, and not the numbers, of S/T/Q/N residues that are correlated with the PEE activities of Q-rich motifs.
The authors also do not discuss if the N-end rule for protein stability applies to the lacZ reporter or the fusion proteins.
The autonomous PEE function of S/T/Q-rich NTDs is unlikely to be relevant to the N-end rule. The N-end rule links the in vivo half-life of a protein to the identity of its N-terminal residues. In S. cerevisiae, the N-end rule operates as part of the ubiquitin system and comprises two pathways. First, the Arg/N-end rule pathway, involving a single N-terminal amidohydrolase Nta1, mediates deamidation of N-terminal asparagine (N) and glutamine (Q) into aspartate (D) and glutamate (E), which in turn are arginylated by a single Ate1 R-transferase, generating the Arg/N degron. N-terminal R and other primary degrons are recognized by a single N-recognin Ubr1 in concert with ubiquitin-conjugating Ubc2/Rad6. Ubr1 can also recognize several other N-terminal residues, including lysine (K), histidine (H), phenylalanine (F), tryptophan (W), leucine (L) and isoleucine (I) (68-70). Second, the Ac/N-end rule pathway targets proteins containing N-terminally acetylated (Ac) residues. Prior to acetylation, the first amino acid methionine (M) is catalytically removed by Met-aminopeptidases (MetAPs), unless a residue at position 2 is non-permissive (too large) for MetAPs. If a retained N-terminal M or otherwise a valine (V), cysteine (C), alanine (A), serine (S) or threonine (T) residue is followed by residues that allow N-terminal acetylation, the proteins containing these AcN degrons are targeted for ubiquitylation and proteasome-mediated degradation by the Doa10 E3 ligase (71).
The PEE activities of these S/T/Q-rich domains are unlikely to arise from counteracting the N-end rule for two reasons. First, the first two amino acid residues of Rad51-NTD, Hop1-SCD, Rad53-SCD1, Sup35-PND, Rad51-ΔN, and LacZ-NVH are MS, ME, ME, MS, ME, and MI, respectively, where M is methionine, S is serine, E is glutamic acid and I is isoleucine. Second, Sml1-NTD behaves similarly to these N-terminal fusion tags, despite its methionine and glutamine (MQ) amino acid signature at the N-terminus. (Page 12, line 3 to page 13, line 2)
The most interesting part of the paper is an exploration of S/T/Q/N-rich regions and other repetitive AA runs in 27 proteomes, particularly ciliates. However, this analysis is missing a critical control that makes it nearly impossible to evaluate the importance of the findings. The authors find the abundance of different amino acid runs in various proteomes. They also report the background abundance of each amino acid. They do not use this background abundance to normalize the runs of amino acids to create a null expectation from each proteome. For example, it has been clear for some time (Ruff, 2017; Ruff et al., 2016) that Drosophila contains a very high background of Q's in the proteome and it is necessary to control for this background abundance when finding runs of Q's.
We apologize for not explaining sufficiently well the topic eliciting this reviewer’s concern in our preprint manuscript. In the second paragraph of page 14, we cite six references to highlight that SCDs are overrepresented in yeast and human proteins involved in several biological processes (5, 43) and that polyX prevalence differs among species (79-82).
We will cite a reference by Kiersten M. Ruff in our revised manuscript (38).
K. M. Ruff, J. B. Warner, A. Posey and P. S. Tan (2017) Polyglutamine length dependent structural properties and phase behavior of huntingtin exon1. Biophysical Journal 112, 511a.
The authors could easily address this problem with the data and analysis they have already collected. However, at this time, without this normalization, I am hesitant to trust the lists of proteins with long runs of amino acid and the ensuing GO enrichment analysis. Ruff KM. 2017. Washington University in St.
Ruff KM, Holehouse AS, Richardson MGO, Pappu RV. 2016. Proteomic and Biophysical Analysis of Polar Tracts. Biophys J 110:556a.
We thank Reviewer #1 for this helpful suggestion and now address this issue by means of a different approach described below.
Based on a previous study (43), we applied seven different thresholds to seek both short and long, as well as pure and impure, polyX strings in 20 different representative near-complete proteomes, including 4X (4/4), 5X (4/5-5/5), 6X (4/6-6/6), 7X (4/7-7/7), 8-10X (≥50%X), 11-10X (≥50%X) and ≥21X (≥50%X).
To normalize the runs of amino acids and create a null expectation from each proteome, we determined the ratios of the overall number of X residues for each of the seven polyX motifs relative to those in the entire proteome of each species, respectively. The results of four different polyX motifs are shown in our revised manuscript, i.e., polyQ (Figure 7), polyN (Figure 8), polyS (Figure 9) and polyT (Figure 10). Thus, polyX prevalence differs among species and the overall X contents of polyX motifs often but not always correlate with the X usage frequency in entire proteomes (43).
Most importantly, our results reveal that, compared to Stentor coeruleus or several non-ciliate eukaryotic organisms (e.g., Plasmodium falciparum, Caenorhabditis elegans, Danio rerio, Mus musculus and Homo sapiens), the five ciliates with reassigned TAAQ and TAGQ codons not only have higher Q usage frequencies, but also more polyQ motifs in their proteomes (Figure 7). In contrast, polyQ motifs prevail in Candida albicans, Candida tropicalis, Dictyostelium discoideum, Chlamydomonas reinhardtii, Drosophila melanogaster and Aedes aegypti, though the Q usage frequencies in their entire proteomes are not significantly higher than those of other eukaryotes (Figure 1). Due to their higher N usage frequencies, Dictyostelium discoideum, Plasmodium falciparum and Pseudocohnilembus persalinus have more polyN motifs than the other 23 eukaryotes we examined here (Figure 8). Generally speaking, all 26 eukaryotes we assessed have similar S usage frequencies and percentages of S contents in polyS motifs (Figure 9). Among these 26 eukaryotes, Dictyostelium discoideum possesses many more polyT motifs, though its T usage frequency is similar to that of the other 25 eukaryotes (Figure 10).
In conclusion, these new normalized results confirm that the reassignment of stop codons to Q indeed results in both higher Q usage frequencies and more polyQ motifs in ciliates.
Reviewer #2 (Public Review):
Summary:
This study seeks to understand the connection between protein sequence and function in disordered regions enriched in polar amino acids (specifically Q, N, S and T). While the authors suggest that specific motifs facilitate protein-enhancing activities, their findings are correlative, and the evidence is incomplete. Similarly, the authors propose that the re-assignment of stop codons to glutamine-encoding codons underlies the greater user of glutamine in a subset of ciliates, but again, the conclusions here are, at best, correlative. The authors perform extensive bioinformatic analysis, with detailed (albeit somewhat ad hoc) discussion on a number of proteins. Overall, the results presented here are interesting, but are unable to exclude competing hypotheses.
Strengths:
Following up on previous work, the authors wish to uncover a mechanism associated with poly-Q and SCD motifs explaining proposed protein expression-enhancing activities. They note that these motifs often occur IDRs and hypothesize that structural plasticity could be capitalized upon as a mechanism of diversification in evolution. To investigate this further, they employ bioinformatics to investigate the sequence features of proteomes of 27 eukaryotes. They deepen their sequence space exploration uncovering sub-phylum-specific features associated with species in which a stop-codon substitution has occurred. The authors propose this stop-codon substitution underlies an expansion of ploy-Q repeats and increased glutamine distribution.
Weaknesses:
The preprint provides extensive, detailed, and entirely unnecessary background information throughout, hampering reading and making it difficult to understand the ideas being proposed.
The introduction provides a large amount of detailed background that appears entirely irrelevant for the paper. Many places detailed discussions on specific proteins that are likely of interest to the authors occur, yet without context, this does not enhance the paper for the reader.
The paper uses many unnecessary, new, or redefined acronyms which makes reading difficult. As examples:
1) Prion forming domains (PFDs). Do the authors mean prion-like domains (PLDs), an established term with an empirical definition from the PLAAC algorithm? If yes, they should say this. If not, they must define what a prion-forming domain is formally.
The N-terminal domain (1-123 amino acids) of S. cerevisiae Sup35 was already referred to as a “prion forming domain (PFD)” in 2006 (48). Since then, PFD has also been employed as an acronym in other yeast prion papers (Cox, B.S. et al. 2007; Toombs, T. et al. 2011).
B. S. Cox, L. Byrne, M. F., Tuite, Protein Stability. Prion 1, 170-178 (2007). J. A. Toombs, N. M. Liss, K. R. Cobble, Z. Ben-Musa, E. D. Ross, [PSI+] maintenance is dependent on the composition, not primary sequence, of the oligopeptide repeat domain. PLoS One 6, e21953 (2011).
2) SCD is already an acronym in the IDP field (meaning sequence charge decoration) - the authors should avoid this as their chosen acronym for Serine(S) / threonine (T)-glutamine (Q) cluster domains. Moreover, do we really need another acronym here (we do not).
SCD was first used in 2005 as an acronym for the Serine (S)/threonine (T)-glutamine (Q) cluster domain in the DNA damage checkpoint field (4). Almost a decade later, SCD became an acronym for “sequence charge decoration” (Sawle, L. et al. 2015; Firman, T. et al. 2018).
L. Sawle and K, Ghosh, A theoretical method to compute sequence dependent configurational properties in charged polymers and proteins. J. Chem Phys. 143, 085101(2015).
T. Firman and Ghosh, K. Sequence charge decoration dictates coil-globule transition in intrinsically disordered proteins. J. Chem Phys. 148, 123305 (2018).
3) Protein expression-enhancing (PEE) - just say expression-enhancing, there is no need for an acronym here.
Thank you. Since we have shown that the addition of Q-rich motifs to LacZ affects protein expression rather than transcription, we think it is better to use the “PEE” acronym.
The results suggest autonomous protein expression-enhancing activities of regions of multiple proteins containing Q-rich and SCD motifs. Their definition of expression-enhancing activities is vague and the evidence they provide to support the claim is weak. While their previous work may support their claim with more evidence, it should be explained in more detail. The assay they choose is a fusion reporter measuring beta-galactosidase activity and tracking expression levels. Given the presented data they have shown that they can drive the expression of their reporters and that beta gal remains active, in addition to the increase in expression of fusion reporter during the stress response. They have not detailed what their control and mock treatment is, which makes complete understanding of their experimental approach difficult. Furthermore, their nuclear localization signal on the tag could be influencing the degradation kinetics or sequestering the reporter, leading to its accumulation and the appearance of enhanced expression. Their evidence refuting ubiquitin-mediated degradation does not have a convincing control.
Although this reviewer’s concern regarding our use of a nuclear localization signal on the tag is understandable, we are confident that this signal does not bias our findings for two reasons. First, the negative control LacZ-NV also possesses the same nuclear localization signal (Figure 1A, lane 2). Second, another fusion target, Rad51-ΔN, does not harbor the NVH tag (Figure 1D, lanes 3-4). Compared to wild-type Rad51, Rad51-ΔN is highly labile. In our previous study, removal of the NTD from Rad51 reduced by ~97% the protein levels of corresponding Rad51-ΔN proteins relative to wild-type (1).
Based on the experimental results, the authors then go on to perform bioinformatic analysis of SCD proteins and polyX proteins. Unfortunately, there is no clear hypothesis for what is being tested; there is a vague sense of investigating polyX/SCD regions, but I did not find the connection between the first and section compelling (especially given polar-rich regions have been shown to engage in many different functions). As such, this bioinformatic analysis largely presents as many lists of percentages without any meaningful interpretation. The bioinformatics analysis lacks any kind of rigorous statistical tests, making it difficult to evaluate the conclusions drawn. The methods section is severely lacking. Specifically, many of the methods require the reader to read many other papers. While referencing prior work is of course, important, the authors should ensure the methods in this paper provide the details needed to allow a reader to evaluate the work being presented. As it stands, this is not the case.
Thank you. As described in detail below, we have now performed rigorous statistical testing using the GofuncR package (Figure 11, Figure 12 and DS7-DS32).
Overall, my major concern with this work is that the authors make two central claims in this paper (as per the Discussion). The authors claim that Q-rich motifs enhance protein expression. The implication here is that Q-rich motif IDRs are special, but this is not tested. As such, they cannot exclude the competing hypothesis ("N-terminal disordered regions enhance expression").
In fact, “N-terminal disordered regions enhance expression” exactly summarizes our hypothesis.
On pages 12-13 and Figure 4 of our preprint manuscript, we explained our hypothesis in the paragraph entitled “The relationship between PEE function, amino acid contents, and structural flexibility”.
The authors also do not explore the possibility that this effect is in part/entirely driven by mRNA-level effects (see Verma Na Comms 2019).
As pointed out by the first reviewer, we present evidence that the increase in protein abundance and enzymatic activity is not due to changes in plasmid copy number or mRNA abundance (Figure 2), and that this phenomenon is not affected in translational quality control mutants (Figure 3).
As such, while these observations are interesting, they feel preliminary and, in my opinion, cannot be used to draw hard conclusions on how N-terminal IDR sequence features influence protein expression. This does not mean the authors are necessarily wrong, but from the data presented here, I do not believe strong conclusions can be drawn. That re-assignment of stop codons to Q increases proteome-wide Q usage. I was unable to understand what result led the authors to this conclusion.
My reading of the results is that a subset of ciliates has re-assigned UAA and UAG from the stop codon to Q. Those ciliates have more polyQ-containing proteins. However, they also have more polyN-containing proteins and proteins enriched in S/T-Q clusters. Surely if this were a stop-codon-dependent effect, we'd ONLY see an enhancement in Q-richness, not a corresponding enhancement in all polar-rich IDR frequencies? It seems the better working hypothesis is that free-floating climate proteomes are enriched in polar amino acids compared to sessile ciliates.
We thank this reviewer for raising this point, however her/his comments are not supported by the results in Figure 7.
Regardless, the absence of any kind of statistical analysis makes it hard to draw strong conclusions here.
We apologize for not explaining more clearly the results of Tables 5-7 in our preprint manuscript.
To address the concerns about our GO enrichment analysis by both reviewers, we have now performed rigorous statistical testing for SCD and polyQ protein overrepresentation using the GOfuncR package (https://bioconductor.org/packages/release/bioc/html/GOfuncR.html). GOfuncR is an R package program that conducts standard candidate vs. background enrichment analysis by means of the hypergeometric test. We then adjusted the raw p-values according to the Family-wise error rate (FWER). The same method had been applied to GO enrichment analysis of human genomes (89).
The results presented in Figure 11 and Figure 12 (DS7-DS32) support our hypothesis that Q-rich motifs prevail in proteins involved in specialized biological processes, including Saccharomyces cerevisiae RNA-mediated transposition, Candida albicans filamentous growth, peptidyl-glutamic acid modification in ciliates with reassigned stop codons (TAAQ and TAGQ), Tetrahymena thermophila xylan catabolism, Dictyostelium discoideum sexual reproduction, Plasmodium falciparum infection, as well as the nervous systems of Drosophila melanogaster, Mus musculus, and Homo sapiens (78). In contrast, peptidyl-glutamic acid modification and microtubule-based movement are not overrepresented with Q-rich proteins in Stentor coeruleus, a ciliate with standard stop codons.
Recommendations for the authors:
Please note that you control which revisions to undertake from the public reviews and recommendations for the authors.
Reviewer #1 (Recommendations For The Authors):
The order of paragraphs in the introduction was very difficult to follow. Each paragraph was clear and easy to understand, but the order of paragraphs did not make sense to this reader. The order of events in the abstract matches the order of events in the results section. However, the order of paragraphs in the introduction is completely different and this was very confusing. This disordered list of facts might make sense to an expert reader but makes it hard for a non-expert reader to understand.
Apologies. We endeavored to improve the flow of our revised manuscript to make it more readable.
The section beginning on pg 12 focused on figures 4 and 5 was very interesting and highly promising. However, it was initially hard for me to tell from the main text what the experiment was. Please add to the text an explanation of the experiment, because it is hard to figure out what was going on from the figures alone. Figure 4 is fantastic, but would be improved by adding error bars and scaling the x-axis to be the same in panels B,C,D.
Thank you for this recommendation. We have now scaled both the x-axis and y-axis equivalently in panels B, C and D of Figure 4. Error bars are too small to be included.
It is hard to tell if the key variable is the number of S/T/Q/N residues or the number of phosphosites. I think a good control would be to add a regression against the number of putative phosphosites. The sequences are well designed. I loved this part but as a reader, I need more interpretation about why it matters and how it explains the PEE.
As described above, we have shown that the number of phosphorylation sites in the Q-rich motifs is not relevant to their autonomous protein expression-enhancing (PEE) activities.
I believe that the prevalence of polyX runs is not meaningful without normalizing for the background abundance of each amino acid. The proteome-wide abundance and the assumption that amino acids occur independently can be used to form a baseline expectation for which runs are longer than expected by chance. I think Figures 6 and 7 should go into the supplement and be replaced in the main text with a figure where Figure 6 is normalized by Figure 7. For example in P. falciparum, there are many N-runs (Figure 6), but the proteome has the highest fraction of N’s (Figure 7).
Thank you for these suggestions. The three figures in our preprint manuscript (Figures 6-8) have been moved into the supplementary information (Figures S1-S3). For normalization, we have provided four new figures (Figures 7-10) in our revised manuscript.
The analysis of ciliate proteomes was fascinating. I am particularly interested in the GO enrichment for “peptidyl-glutamic acid modification” (pg 20) because these enzymes might be modifying some of Q’s in the Q-runs. I might be wrong about this idea or confused about the chemistry. Do these ciliates live in Q-rich environments? Or nitrogen rich environments?
Polymeric modifications (polymodifications) are a hallmark of C-terminal tubulin tails, whereas secondary peptide chains of glutamic acids (polyglutamylation) and glycines (polyglycylation) are catalyzed from the γ-carboxyl group of primary chain glutamic acids. It is not clear if these enzymes can modify some of the Q’s in the Q-runs.
To our knowledge, ciliates are abundant in almost every liquid water environment, i.e., oceans/seas, marine sediments, lakes, ponds, and rivers, and even soils.
I think you should include more discussion about how the codons that code for Q’s are prone to slippage during DNA replication, and thus many Q-runs are unstable and expand (e.g. Huntington’s Disease). The end of pg 24 or pg 25 would be good places.
We thank the reviewer for these comments.
PolyQ motifs have a particular length-dependent codon usage that relates to strand slippage in CAG/CTG trinucleotide repeat regions during DNA replication. In most organisms having standard genetic codons, Q is encoded by CAGQ and CAAQ. Here, we have determined and compared proteome-wide Q contents, as well as the CAGQ usage frequencies (i.e., the ratio between CAGQ and the sum of CAGQ, CAGQ, TAAQ, and TAGQ).
Our results reveal that the likelihood of forming long CAG/CTG trinucleotide repeats are higher in five eukaryotes due to their higher CAGQ usage frequencies, including Drosophila melanogaster (86.6% Q), Danio rerio (74.0% Q), Mus musculus (74.0% Q), Homo sapiens (73.5% Q), and Chlamydomonas reinhardtii (87.3% Q) (orange background, Table 2). In contrast, another five eukaryotes that possess high numbers of polyQ motifs (i.e., Dictyostelium discoideum, Candida albicans, Candida tropicalis, Plasmodium falciparum and Stentor coeruleus) (Figure 1) utilize more CAAQ (96.2%, 84.6%, 84.5%, 86.7% and 75.7%) than CAAQ (3.8%, 15.4%, 15.5%, 13.3% and 24.3%), respectively, to avoid the formation of long CAG/CTG trinucleotide repeats (green background, Table 2). Similarly, all five ciliates with reassigned stop codons (TAAQ and TAGQ) have low CAGQ usage frequencies (i.e., from 3.8% Q in Pseudocohnilembus persalinus to 12.6% Q in Oxytricha trifallax) (red font, Table 2). Accordingly, the CAG-slippage mechanism might operate more frequently in Chlamydomonas reinhardtii, Drosophila melanogaster, Danio rerio, Mus musculus and Homo sapiens than in Dictyostelium discoideum, Candida albicans, Candida tropicalis, Plasmodium falciparum, Stentor coeruleus and the five ciliates with reassigned stop codons (TAAQ and TAGQ).
Author response table 1.
Usage frequencies of TAA, TAG, TAAQ, TAGQ, CAAQ and CAGQ codons in the entire proteomes of 20 different organisms.
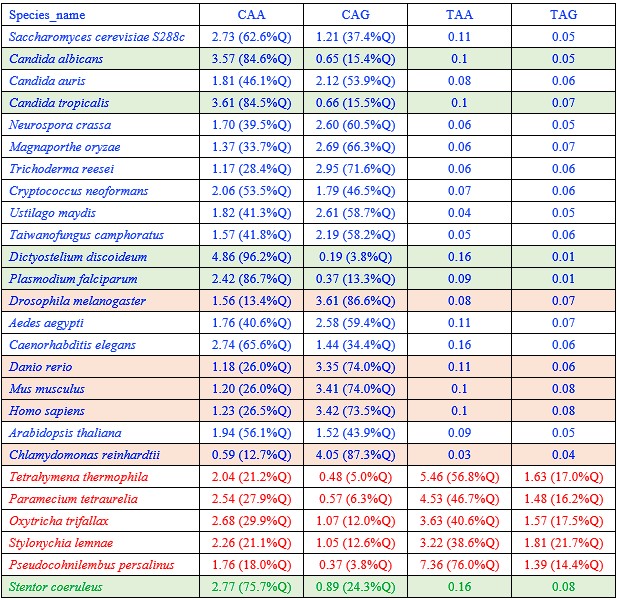
Pg 7, paragraph 2 has no direction. Please add the conclusion of the paragraph to the first sentence.
This paragraph has been moved to the “Introduction” section” of the revised manuscript.
Pg 8, I suggest only mentioning the PFDs used in the experiments. The rest are distracting.
We have addressed this concern above.
Pg 12. Please revise the "The relationship...." text to explain the experiment.
We apologize for not explaining this topic sufficiently well in our preprint manuscript.
SCDs are often structurally flexible sequences (4) or even IDRs. Using IUPred2A (https://iupred2a.elte.hu/plot_new), a web-server for identifying disordered protein regions (88), we found that Rad51-NTD (1-66 a.a.) (1), Rad53-SCD1 (1-29 a.a.) and Sup35-NPD (1-39 a.a.) are highly structurally flexible. Since a high content of serine (S), threonine (T), glutamine (Q), asparanine (N) is a common feature of IDRs (17-20), we applied alanine scanning mutagenesis approach to reduce the percentages of S, T, Q or N in Rad51-NTD, Rad53-SCD1 or Sup35-NPD, respectively. As shown in Figure 4 and Figure 5, there is a very strong positive relationship between STQ and STQN amino acid percentages and β-galactosidase activities. (Page 13, lines 5-10)
Pg 13, first full paragraph, "Futionally, IDRs..." I think this paragraph belongs in the Discussion.
This paragraph is now in the “Introduction” section (Page 5, Lines 11-15).
Pg. 15, I think the order of paragraphs should be swapped.
These paragraphs have been removed or rewritten in the “Introduction section” of our revised manuscript.
Pg 17 (and other parts) I found the lists of numbers and percentages hard to read and I think you should refer readers to the tables.
Thank you. In the revised manuscript, we have avoided using lists of numbers and percentages, unless we feel they are absolutely essential.
Pg. 19 please add more interpretation to the last paragraph. It is very cool but I need help understanding the result. Are these proteins diverging rapidly? Perhaps this is a place to include the idea of codon slippage during DNA replication.
Thank you. The new results in Table 2 indicate that the CAG-slippage mechanism is unlikely to operate in ciliates with reassigned stop codons (TAAQ and TAGQ).
Pg 24. "Based on our findings from this study, we suggest that Q-rich motifs are useful toolkits for generating novel diversity during protein evolution, including by enabling greater protein expression, protein-protein interactions, posttranslational modifications, increased solubility, and tunable stability, among other important traits." This idea needs to be cited. Keith Dunker has written extensively about this idea as have others. Perhaps also discuss why Poly Q rich regions are different from other IDRs and different from other IDRs that phase-separate.
Agreed, we have cited two of Keith Dunker’s papers in our revised manuscript (73, 74).
Minor notes:
Please define Borg genomes (pg 25).
Borgs are long extrachromosomal DNA sequences in methane-oxidizing Methanoperedens archaea, which display the potential to augment methane oxidation (101). They are now described in our revised manuscript. (Page 15, lines 12-14)
Reviewer #2 (Recommendations For The Authors):
The authors dance around disorder but never really quantify or show data. This seems like a strange blindspot.
We apologize for not explaining this topic sufficiently well in our preprint manuscript. We have endeavored to do so in our revised manuscript.
The authors claim the expression enhancement is "autonomous," but they have not ruled things out that would make it not autonomous.
Evidence of the “autonomous” nature of expression enhancement is presented in Figure 1, Figure 4, and Figure 5 of the preprint manuscript.
Recommendations for improving the writing and presentation.
The title does not recapitulate the entire body of work. The first 5 figures are not represented by the title in any way, and indeed, I have serious misgivings as to whether the conclusion stated in the title is supported by the work. I would strongly suggest the authors change the title.
Figure 2 could be supplemental.
Thank you. We think it is important to keep Figure 2 in the text.
Figures 4 and 5 are not discussed much or particularly well.
This reviewer’s opinion of Figure 4 and Figure 5 is in stark contrast to those of the first reviewer.
The introduction, while very thorough, takes away from the main findings of the paper. It is more suited to a review and not a tailored set of minimal information necessary to set up the question and findings of the paper. The question that the authors are after is also not very clear.
Thank you. The entire “Introduction” section has been extensively rewritten in the revised manuscript.
Schematics of their fusion constructs and changes to the sequence would be nice, even if supplemental.
Schematics of the fusion constructs are provided in Figure 1A.
The methods section should be substantially expanded.
The method section in the revised manuscript has been rewritten and expanded. The six Javascript programs used in this work are listed in Table S4.
The text is not always suited to the general audience and readership of eLife.
We have now rewritten parts of our manuscript to make it more accessible to the broad readership of eLife.
In some cases, section headers really don't match what is presented, or there is no evidence to back the claim.
The section headers in the revised manuscript have been corrected.
A lot of the listed results in the back half of the paper could be a supplemental table, listing %s in a paragraph (several of them in a row) is never nice
Acknowledged. In the revised manuscript, we have removed almost all sentences listing %s.
Minor corrections to the text and figures.
There is a reference to table 1 multiple times, and it seems that there is a missing table. The current table 1 does not seem to be the same table referred to in some places throughout the text.
Apologies for this mistake, which we have now corrected in our revised manuscript.
In some places its not clear where new work is and where previous work is mentioned. It would help if the authors clearly stated "In previous work...."
Acknowledged. We have corrected this oversight in our revised manuscript.
Not all strains are listed in the strain table (KO's in figure 3 are not included)
Apologies, we have now corrected Table S2, as suggested by this reviewer.
Author response table 2.
S. cerevisiae strains used in this study
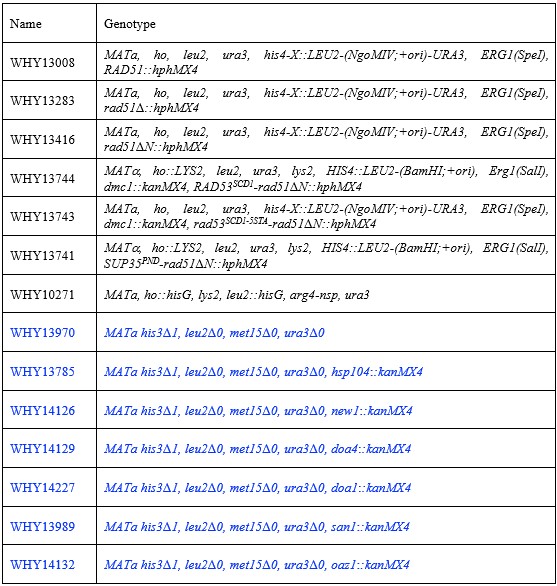
Author response:
The following is the authors’ response to the original reviews
Public Reviews:
Reviewer #1 (Public review):
Summary:
The authors set out to explore the role of upstream open reading frames (uORFs) in stabilizing protein levels during Drosophila development and evolution. By utilizing a modified ICIER model for ribosome translation simulations and conducting experimental validations in Drosophila species, the study investigates how uORFs buffer translational variability of downstream coding sequences. The findings reveal that uORFs significantly reduce translational variability, which contributes to gene expression stability across different biological contexts and evolutionary timeframes.
We thank the reviewer for carefully reading our manuscript and providing thoughtful and constructive feedback. We believe the manuscript has been significantly improved by incorporating your suggestions. Please find our detailed responses and corresponding revisions below.
Strengths:
(1) The study introduces a sophisticated adaptation of the ICIER model, enabling detailed simulation of ribosomal traffic and its implications for translation efficiency.
(2) The integration of computational predictions with empirical data through knockout experiments and translatome analysis in Drosophila provides a compelling validation of the model's predictions.
(3) By demonstrating the evolutionary conservation of uORFs' buffering effects, the study provides insights that are likely applicable to a wide range of eukaryotes.
We appreciate your positive feedback and thoughtful summary of the strengths of our study.
Weaknesses:
(1) Although the study is technically sound, it does not clearly articulate the mechanisms through which uORFs buffer translational variability. A clearer hypothesis detailing the potential molecular interactions or regulatory pathways by which uORFs influence translational stability would enhance the comprehension and impact of the findings.
Thanks for your constructive comments. In the Discussion section of our previous submission (Original Lines 470-489), we proposed that uORFs function as “molecular dams” to smooth out fluctuations in ribosomal flow toward downstream CDS regions, primarily via mechanisms involving ribosome collision and dissociation. To further address your concern, we have expanded the Discussion and included a new model figure (Fig. 9) to more clearly articulate the potential biological and mechanistic basis by which translating 80S ribosomes may induce the dissociation of 40S ribosomes. The revised section (Lines 540–557) now reads:
“Ribosome slowdown or stalling on mRNA due to rare codons [56,96-98] or nascent blocking peptides [99-102] frequently triggers ribosome collisions genome-wide [103-105]. Such collisions, especially among elongating 80S ribosomes, often activate ribosome quality control (RQC) pathways that recognize collision interfaces on the 40S subunit, leading to ribosomal subunit dissociation and degradation [106-108]. In mammals, ZNF598 specifically identifies collided ribosomes to initiate ubiquitin-dependent protein and mRNA quality control pathways [109-113]. Analogously, yeast employs Hel2-mediated ubiquitination of uS10, initiating dissociation via the RQC-trigger complex (RQT) [114]. Furthermore, the human RQT (hRQT) complex recognizes ubiquitinated ribosomes and induces subunit dissociation similarly to yeast RQT [115]. However, transient ribosome collisions can evade RQC by promoting resumed elongation through mechanical force provided by trailing ribosomes, thereby mitigating stalling [116]. Beyond 80S collisions, evidence increasingly highlights a distinct collision type involving scanning 40S subunits or pre-initiation (43S) complexes. Recently, an initiation RQC pathway (iRQC) targeting the small ribosomal subunit (40S) has been described, particularly involving collisions between scanning 43S complexes or between stalled 43S and elongating 80S ribosomes (Figure 9B) [117,118]. During iRQC, E3 ubiquitin ligase RNF10 ubiquitinates uS3 and uS5 proteins, resulting in 40S degradation [118]. This mechanism aligns closely with our ICIER model, proposing collision-driven 43S dissociation in the 5' UTRs. Future studies exploring these mechanisms in greater detail will clarify how uORFs modulate translational regulation through buffering effects.”
(2) The study could be further improved by a discussion regarding the evolutionary selection of uORFs. Specifically, it would be beneficial to explore whether uORFs are favored evolutionarily primarily for their role in reducing translation efficiency or for their capability to stabilize translation variability. Such a discussion would provide deeper insights into the evolutionary dynamics and functional significance of uORFs in genetic regulation.
Thank you for this insightful suggestion. We agree that understanding whether uORFs are evolutionarily favored for their role in translational repression or for their capacity to buffer translational variability is a compelling and unresolved question. Our study suggests that translational buffering, rather than translational repression alone, can also drive evolutionary selection favoring uORFs, although it remains challenging to empirically disentangle these functions due to their inherent linkage. We have expanded the discussion in the revised manuscript to address this point in more detail (Lines 494-513), which is reproduced as follows:
“Previous studies have shown that a significant fraction of fixed uORFs in the populations of D. melanogaster and humans were driven by positive Darwinian selection 63,67, suggesting active maintenance through adaptive evolution rather than purely neutral or deleterious processes. While uORFs have traditionally been recognized for their capacity to attenuate translation of downstream CDSs, accumulating evidence now underscores their critical role in stabilizing gene expression under fluctuating cellular and environmental conditions [43,55,56]. Whether the favored evolutionary selection of uORFs acts primarily through their role in translational repression or translational buffering remains a compelling yet unresolved question, as these two functions are inherently linked. Indeed, highly conserved uORFs tend to be translated at higher levels, resulting not only in stronger inhibition of CDS translation [34,45,67] but also in a more pronounced buffering effect, as demonstrated in this study. This buffering capacity of uORFs potentially provides selective advantages by reducing fluctuations in protein synthesis, thus minimizing gene-expression noise and enhancing cellular homeostasis. This suggests that selection may favor uORFs that contribute to translational robustness, a hypothesis supported by findings in yeast and mammals showing that uORFs are significantly enriched in stressresponse genes and control the translation of certain master regulators of stress responses [41,42,94,95]. Our study suggests that translational buffering, rather than translational repression alone, can also drive evolutionary selection favoring uORFs, although it remains challenging to empirically disentangle these functions. Future comparative genomic analyses, coupled with experimental approaches such as ribosome profiling and functional mutagenesis, will be crucial in elucidating the precise evolutionary forces driving uORF conservation and adaptation.”
Reviewer #2 (Public review):
uORFs, short open reading frames located in the 5' UTR, are pervasive in genomes. However, their roles in maintaining protein abundance are not clear. In this study, the authors propose that uORFs act as "molecular dam", limiting the fluctuation of the translation of downstream coding sequences. First, they performed in silico simulations using an improved ICIER model, and demonstrated that uORF translation reduces CDS translational variability, with buffering capacity increasing in proportion to uORF efficiency, length, and number. Next, they analzed the translatome between two related Drosophila species, revealing that genes with uORFs exhibit smaller fluctuations in translation between the two species and across different developmental stages within the same specify. Moreover, they identified that bicoid, a critical gene for Drosophila development, contains a uORF with substantial changes in translation efficiency. Deleting this uORF in Drosophila melanogaster significantly affected its gene expression, hatching rates, and survival under stress condition. Lastly, by leveraging public Ribo-seq data, the authors showed that the buffering effect of uORFs is also evident between primates and within human populations. Collectively, the study advances our understanding of how uORFs regulate the translation of downstream coding sequences at the genome-wide scale, as well as during development and evolution.
The conclusions of this paper are mostly well supported by data, but some definitions and data analysis need to be clarified and extended.
We thank the reviewer for the thoughtful and constructive review. Your summary accurately captures the key findings of our study. We have carefully addressed all your concerns in the revised manuscript, and we believe it has been significantly improved based on your valuable input.
(1) There are two definitions of translation efficiency (TE) in the manuscript: one refers to the number of 80S ribosomes that complete translation at the stop codon of a CDS within a given time interval, while the other is calculated based on Ribo-seq and mRNA-seq data (as described on Page 7, line 209). To avoid potential misunderstandings, please use distinct terms to differentiate these two definitions.
Thank you for highlighting this important point, and we apologize for the confusion. The two definitions of translation efficiency (TE) in our manuscript arise from methodological differences between simulation and experimental analyses. To clarify, in the revised manuscript, we use “translation rate” in the context of simulations to describe the number of 80S ribosomes completing translation at the CDS stop codon per unit time. We retain the conventional “translation efficiency (TE)” for Ribo-seq–based measurements.
In this revised manuscript, we have added a more detailed explanation of TE in the revised manuscript (Lines 202–206), which now reads:
“For each sample, we followed established procedures [62-66] to calculate the translational efficiency (TE) for each feature (CDS or uORF). TE serves as a proxy for the translation rate at which ribosomes translate mRNA into proteins, typically quantified by comparing the density of ribosome-protected mRNA fragment (RPF) to the mRNA abundance for that feature (see Materials and Methods).”
(2) Page 7, line 209: "The translational efficiencies (TEs) of the conserved uORFs were highly correlated between the two species across all developmental stages and tissues examined, with Spearman correlation coefficients ranging from 0.478 to 0.573 (Fig. 2A)." However, the authors did not analyze the correlation of translation efficiency of conserved CDSs between the two species, and compare this correlation to the correlation between the TEs of CDSs. These analyzes will further support the authors conclusion regarding the role of conserved uORFs in translation regulation.
In the revised manuscript, we have incorporated a comparison of translational efficiency (TE) correlations for conserved CDSs between the two species. We found that CDSs exhibit significantly higher interspecific TE correlations than uORFs, with Spearman’s rho ranging from 0.588 to 0.806. This suggests that uORFs tend to show greater variability in TE than CDSs, consistent with our model in which uORFs buffer fluctuations in downstream CDS translation. The updated results were included in the revised manuscript (Lines 223-227) as follows:
“In contrast, TE of CDSs exhibited a significantly higher correlation between the two species in the corresponding samples compared to that of uORFs, with Spearman’s rho ranging from 0.588 to 0.806 (P = 0.002, Wilcoxon signed-rank test; Figure 2A). This observation is consistent with our simulation results, which indicate that uORFs experience greater translational fluctuations than their downstream CDSs.”
(3) Page 8, line 217: "Among genes with multiple uORFs, one uORF generally emerged as dominant, displaying a higher TE than the others within the same gene (Fig. 2C)." The basis for determining dominance among uORFs is not explained and this lack of clarification undermines the interpretation of these findings.
Thank you for pointing this out. We apologize for the confusion. In our study, a “dominant” uORF is defined as the one with the highest translation efficiency (TE) among all uORFs within the same gene. This designation is based solely on TE, which we consider a key metric for uORF activity, as it directly reflects translational output and potential regulatory impact. We have revised the manuscript to clarify this definition (Lines 232–244), now stating:
“Among genes with multiple uORFs, we defined the uORF with the highest TE as the dominant uORF for that gene, as TE is one of the most relevant metrics for assessing uORF function 45,67…… These results suggest that genes with multiple uORFs tend to retain the same dominant uORF across developmental stages, indicating that the dominant uORFs may serve as the key translational regulator of the downstream CDS.”
(4) According to the simulation, the translation of uORFs should exhibit greater variability than that of CDSs. However, the authors observed significantly fewer uORFs with significant TE changes compared to CDSs. This discrepancy may be due to lower sequencing depth resulting in fewer reads mapped to uORFs. Therefore, the authors may compare this variability specifically among highly expressed genes.
Thank you for this thoughtful observation. We agree that the lower proportion of uORFs showing significant TE changes compared to CDSs, as reported in Table 1, appears inconsistent with our conclusion that uORFs exhibit greater translational variability. However, this discrepancy is largely attributable to differences in sequencing depth and feature length—uORFs are generally much shorter and more weakly expressed than CDSs, resulting in fewer mapped reads and reduced statistical power (Figure S18A).
To address this issue, we first followed your suggestion and restricted our analysis to genes with both mRNA and RPF RPKM values above the 50th percentile in D. melanogaster and D. simulans. While this filtering increased the total proportion of features with significant TE changes (due to improved read coverage), the proportion of significant uORFs still remained lower than that of CDSs (Table R1). This suggests that even among highly expressed genes, the disparity in read counts between uORFs and CDSs persists (Figure S18B), and thus the issue is not fully resolved.
To better capture biological relevance, we compared the absolute values of log2(TE changes) between D. melanogaster and D. simulans for uORFs and their corresponding CDSs. Across all samples, uORFs consistently exhibit larger TE shifts than their downstream CDSs, supporting our model that uORFs act as translational buffers (Figure 3B).
We have made relevant changes to report the new analysis in this revised manuscript. Specifically, in our original submission, we stated this observation with the sentence “The smaller number of uORFs showing significant TE changes compared to CDSs between D. melanogaster and D. simulans likely reflects their shorter length and reduced statistical power, rather than indicating that uORFs are less variable in translation than CDSs.” To make this point clearer, in the revised version (Lines 275-284), we rephrased this sentence which read as follows:
“Note that due to their shorter length and generally lower TE, uORFs had considerably lower read counts than CDSs, limiting the statistical power to detect significant interspecific TE differences for uORFs. This trend consistently holds whether analyzing all expressed uORFs (Figure S18A) or only highly expressed genes (Figure S18B). Thus, the fewer uORFs showing significant TE divergence likely reflects lower read counts and statistical sensitivity rather than reduced translational variability relative to CDSs. In fact, the absolute values of log2(fold change) of TE for uORFs between D. melanogaster and D. simulans were significantly greater than those observed for corresponding CDSs across all samples (P < 0.001, Wilcoxon signed-rank test; Figure 3B), suggesting that the magnitude of
TE changes in CDSs is generally smaller than that in uORFs, due to the buffering effect of uORF.”
Author response table 1.
Proportion of uORFs and CDSs with significant TE changes before and after selecting HEGs
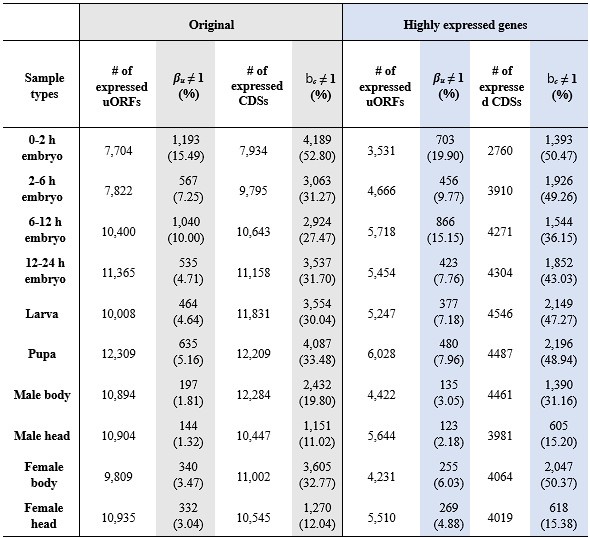
(5) If possible, the author may need to use antibodies against bicoid to test the effect of ATG deletion on bicoid expression, particularly under different developmental stages or growth conditions.
According to the authors' conclusions, the deletion mutant should exhibit greater variability in bicoid protein abundance. This experiment could provide strong support for the proposed mechanisms.
Thank you for this excellent suggestion. We fully agree that testing Bcd protein levels across developmental stages or stress conditions using antibodies would be a strong validation of our model, which predicts greater variability in Bcd protein abundance upon uORF deletion.
In fact, we attempted such experiments in both wild-type and mutant backgrounds. However, we encountered substantial difficulties in obtaining a reliable anti-Bcd antibody. Some Bcd antibodies referenced in the published literature were homemade and often shared among research groups as gifts [1-3] and some commercially available antibodies cited in previous studies are no longer supplied by vendors [4-6]. We managed to obtain a custom-made antibody from Professor Feng Liu, but unfortunately, it produced inconsistent and unsatisfactory results. Despite considerable effort—including during the COVID-19 pandemic—we were unable to identify a reagent suitable for robust and reproducible detection of Bcd protein.
As an alternative, we used sucrose gradient fractionation followed by qPCR to directly measure the translation efficiency of bicoid in vivo. We believe this approach offers a clear and quantitative readout of translational activity, and it avoids potential confounding from protein degradation, which may vary across conditions and developmental stages. Nonetheless, we recognize the value of antibody-based validation and will pursue this direction in future work if reliable antibodies become available. We have added this limitation to the revised Discussion section (Lines 563–568) as follows:
“We demonstrated that the bcd uORF represses CDS translation using sucrose gradient fractionation followed by qPCR—an approach that directly measures translation efficiency while minimizing confounding from RNA/protein degradation. However, detecting Bcd protein levels with antibodies across developmental stages or conditions in the mutants and wild-type controls would provide an even stronger validation of our model and should be explored in future studies.”
Recommendations for the authors:
Reviewer #1 (Recommendations for the authors):
(1) The authors should provide a more detailed explanation for the modifications made to the ICIER model. Specifically, an explanation of the biological or mechanistic rationale behind the ability of the 80S ribosome to cause upstream 40S ribosomes to dissociate from mRNA would help clarify this aspect of the model.
Thank you for this suggestion. In the original submission, we described our modifications to the ICIER model in the section titled “An extended ICIER model for quantifying uORF buffering in CDS translation” (Lines 88-124 of the revised manuscript).
To further clarify the biological rationale behind this mechanism, we have now included a conceptual model figure (Figure 9) illustrating mechanistically how uORF translation can buffer downstream translation within a single mRNA molecule. Additionally, we expanded the Discussion to summarize the current understanding of how collisions between translating 80S ribosomes and scanning 40S subunits may lead to dissociation, referencing known initial ribosome quality control (iRQC) pathways. These revisions provide a clearer mechanistic framework for interpreting the buffering effects modeled in our simulations. The relevant part is reproduced from Discussion (Lines 540-557) which reads as follows:
“Ribosome slowdown or stalling on mRNA due to rare codons [56,96-98] or nascent blocking peptides [99-102] frequently triggers ribosome collisions genome-wide [103-105]. Such collisions, especially among elongating 80S ribosomes, often activate ribosome quality control (RQC) pathways that recognize collision interfaces on the 40S subunit, leading to ribosomal subunit dissociation and degradation [106-108]. In mammals, ZNF598 specifically identifies collided ribosomes to initiate ubiquitin-dependent protein and mRNA quality control pathways [109-113]. Analogously, yeast employs Hel2-mediated ubiquitination of uS10, initiating dissociation via the RQC-trigger complex (RQT) [114]. Furthermore, the human RQT (hRQT) complex recognizes ubiquitinated ribosomes and induces subunit dissociation similarly to yeast RQT [115]. However, transient ribosome collisions can evade RQC by promoting resumed elongation through mechanical force provided by trailing ribosomes, thereby mitigating stalling [116]. Beyond 80S collisions, evidence increasingly highlights a distinct collision type involving scanning 40S subunits or pre-initiation (43S) complexes. Recently, an initiation RQC pathway (iRQC) targeting the small ribosomal subunit (40S) has been described, particularly involving collisions between scanning 43S complexes or between stalled 43S and elongating 80S ribosomes (Figure 9B) [117,118]. During iRQC, E3 ubiquitin ligase RNF10 ubiquitinates uS3 and uS5 proteins, resulting in 40S degradation [118]. This mechanism aligns closely with our ICIER model, proposing collision-driven 43S dissociation in the 5' UTRs. Future studies exploring these mechanisms in greater detail will clarify how uORFs modulate translational regulation through buffering effects.”
(2) The figure legend references Figure 5C; however, this figure appears to be missing from the document.
We apologize for the oversight. The missing panel previously referred to as Figure 5C has now been incorporated into the revised Figure 6A. The figure and its corresponding legend have been corrected accordingly in the updated manuscript.
Reviewer #2 (Recommendations for the authors):
This is an important study that enhances our understanding of the roles of uORFs in translational regulation. In addition to the suggestions provided in the public review, the following minor points should be addressed before publication in eLife:
(1) Page 7, line 207: "We identified 18,412 canonical uORFs shared between the two species (referred to as conserved uORFs hereafter)." The term "canonical uORFs" requires clarification. Does this refer to uORFs with specific sequence features, conservation, or another defining characteristic?
Thank you for pointing this out. We apologize for the lack of clarity. In our study, a canonical uORF is defined as an open reading frame (ORF) that initiates with a canonical AUG start codon located in the 5′ untranslated region (UTR) and terminates with a stop codon (UAA, UAG, or UGA) within the same mRNA. Conservation of uORFs is defined solely based on the presence of AUG start codons at orthologous positions in the 5′ UTR across species, regardless of differences in the stop codon.
To clarify this definition, we have revised the sentence as follows (Lines 213-219): “We focused on canonical uORFs that initiate with an ATG start codon in the 5′ UTR and terminate with a stop codon (TAA, TAG, or TGA). Because the ATG start codon is the defining feature of a canonical uORF and tends to be more conserved than its downstream sequence [67], we defined uORF conservation based on the presence of the ATG start codon in the 5′ UTR of D. melanogaster and its orthologous positions in D. simulans, regardless of differences in the stop codon. Using this criterion, we identified 18,412 canonical uORFs with conserved start codons between the two species.”
(2) Page 8, line 227: "Furthermore, the dominant uORFs showed a higher proportion of conserved uATGs than the other translated uORFs." There appears to be a typographical error. Should "other uATGs" instead read "other uORFs"?
Thank you for pointing this out. As we addressed in response to your previous concern, in this study, we defined uORF conservation primarily based on the presence of their start codon (uATG) both in D. melanogaster and the orthologous sites of D. simulans, as the start codon is the defining feature of a uORF and tends to be more conserved than the remaining sequence, as demonstrated in our previous study [7]. We used the term “conserved uATGs” to reflect this definition and believe it accurately conveys the intended meaning in this context.
(3) Page 8, line 240: "uORFs exhibited a significant positive correlation with the TE of their downstream CDSs in all samples analyzed (P < 0.001, Spearman's correlation)." A Spearman's rho of 0.11 or 0.21 may not practically represent a "significant" positive correlation. Consider rephrasing this as "a positive correlation."
Thank you for the suggestion. We have revised the sentence in the manuscript to read (Lines 257-259): “uORFs exhibited a modest, yet statistically significant, positive correlation with the TE of their downstream CDSs across all samples analyzed (P < 0.001, Spearman’s correlation).”
(4) Page 9, line 269: The analysis of interspecific TE changes between uORFs and their corresponding CDSs is a crucial piece of evidence supporting the authors' conclusions. Presenting this analysis as part of the figures, rather than in "Table 1," would improve clarity and accessibility.
Thank you for this suggestion. In Table 1, we originally presented the number of uORFs and CDSs that showed significant differences in TE between D. melanogaster and D. simulans during various developmental stages. One key point we aimed to emphasize was that, although TE changes in uORFs and their downstream CDSs are positively correlated, there is a notable difference in the magnitude of these changes. To better convey this, we have summarized the core findings of Table 1 in graphical form.
In Figure 3B of the revised version, we compared the absolute values of interspecific TE changes between CDS and uORF, showing that CDSs consistently exhibit smaller shifts than their upstream uORFs. This result further supports the translational buffering effect of uORFs on downstream CDS expression. We have included the updated results in the revised manuscript (Lines 281-284) as follows:
“In fact, the absolute values of log2(fold change) of TE for uORFs between D. melanogaster and D. simulans was significantly greater than that observed for corresponding CDSs across all samples (P < 0.001, Wilcoxon signed-rank test; Figure 3B), suggesting that the magnitude of TE changes in CDSs is generally smaller than that in uORFs, due to the buffering effect of uORF.”
(5) Page 9, line 279: The phrase "dominantly translated" needs clarification. Does it refer to Figure 2C, where one uORF is dominantly translated within a gene, or does it mean that the uORF's translation is higher than that of its corresponding CDS?
We apologize for the obscurity. The phrase "dominantly translated" means one uORF with the highest TE compared to other uORFs within a gene. We have rephrased the relevant sentence in the revised version (Lines 299-304), which now reads:
“To investigate how the conservation level and translation patterns of uORFs influence their buffering capacity on CDS translation, we categorized genes expressed in each pair of samples into three classes:
Class I, genes with conserved uORFs that are dominantly translated (i.e., exhibiting the highest TE among all uORFs within the same gene) in both Drosophila species; Class II, genes with conserved uORFs that are translated in both species but not dominantly translated in at least one; and Class III, the remaining expressed genes.”
(6) The sequencing data and analysis code should be made publicly available before publication to ensure transparency and reproducibility.
Thank you for this suggestion. As described in the Data availability section, all deepsequencing data generated in this study, including single-ended mRNA-Seq and Ribo-Seq data of 10 developmental stages and tissues of Drosophila simulans and paired-end mRNA-Seq data of 0-2 h, 26 h, 6-12 h, and 12-24 h Drosophila melanogaster embryos, were deposited in the China National Genomics Data Center Genome Sequence Archive (GSA) under accession numbers CRA003198, CRA007425, and CRA007426. The mRNA-Seq and Ribo-Seq data for the different developmental stages and tissues of Drosophila melanogaster were published in our previous paper [8] and were deposited in the Sequence Read Archive (SRA) under accession number SRP067542.
All original code has been deposited on GitHub: https://github.com/lujlab/uORF_buffer; https://github.com/lujlab/Buffer_eLife2025.
Response reference
(1) Li, X.Y., MacArthur, S., Bourgon, R., Nix, D., Pollard, D.A., Iyer, V.N., Hechmer, A., Simirenko, L., Stapleton, M., Luengo Hendriks, C.L., et al. (2008). Transcription factors bind thousands of active and inactive regions in the Drosophila blastoderm. PLoS Biol 6, e27. 10.1371/journal.pbio.0060027.
(2) Horner, V.L., Czank, A., Jang, J.K., Singh, N., Williams, B.C., Puro, J., Kubli, E., Hanes, S.D., McKim, K.S., Wolfner, M.F., and Goldberg, M.L. (2006). The Drosophila calcipressin sarah is required for several aspects of egg activation. Curr Biol 16, 1441-1446. 10.1016/j.cub.2006.06.024.
(3) Lee, K.M., Linskens, A.M., and Doe, C.Q. (2022). Hunchback activates Bicoid in Pair1 neurons to regulate synapse number and locomotor circuit function. Curr Biol 32, 2430-2441 e2433. 10.1016/j.cub.2022.04.025.
(4) Wharton, T.H., Nomie, K.J., and Wharton, R.P. (2018). No significant regulation of bicoid mRNA by Pumilio or Nanos in the early Drosophila embryo. PLoS One 13, e0194865. 10.1371/journal.pone.0194865.
(5) Wang, J., Zhang, S., Lu, H., and Xu, H. (2022). Differential regulation of alternative promoters emerges from unified kinetics of enhancer-promoter interaction. Nat Commun 13, 2714. 10.1038/s41467-022-30315-6.
(6) Xu, H., Sepulveda, L.A., Figard, L., Sokac, A.M., and Golding, I. (2015). Combining protein and mRNA quantification to decipher transcriptional regulation. Nat Methods 12, 739-742. 10.1038/nmeth.3446.
(7) Zhang, H., Wang, Y., Wu, X., Tang, X., Wu, C., and Lu, J. (2021). Determinants of genomewide distribution and evolution of uORFs in eukaryotes. Nat Commun 12, 1076. 10.1038/s41467-021-21394-y.
(8) Zhang, H., Dou, S., He, F., Luo, J., Wei, L., and Lu, J. (2018). Genome-wide maps of ribosomal occupancy provide insights into adaptive evolution and regulatory roles of uORFs during Drosophila development. PLoS Biol 16, e2003903. 10.1371/journal.pbio.2003903.
Author response:
The following is the authors’ response to the original reviews.
Reviewer #1 (Public Review):
In this study, the authors examined the role of IBTK, a substrate-binding adaptor of the CRL3 ubiquitin ligase complex, in modulating the activity of the eiF4F translation initiation complex. They find that IBTK mediates the non-degradative ubiquitination of eiF4A1, promotes cap-dependent translational initiation, nascent protein synthesis, oncogene expression, and tumor cell growth. Correspondingly, phosphorylation of IBTK by mTORC1/ S6K1 increases eIF4A1 ubiquitination and sustains oncogenic translation.
Strengths:
This study utilizes multiple biochemical, proteomic, functional, and cell biology assays to substantiate their results. Importantly, the work nominates IBTK as a unique substrate of mTORC1, and further validates eiF4A1 (a crucial subunit of the ei44F complex) as a promising therapeutic target in cancer. Since IBTK interacts broadly with multiple members of the translational initial complex - it will be interesting to examine its role in eiF2alpha-mediated ER stress as well as eiF3-mediated translation. Additionally, since IBTK exerts pro-survival effects in multiple cell types, it will be of relevance to characterize the role of IBTK in mediating increased mTORC1 mediated translation in other tumor types, thus potentially impacting their treatment with eiF4F inhibitors.
Limitations/Weaknesses:
The findings are mostly well supported by data, but some areas need clarification and could potentially be enhanced with further experiments:
(1) Since eiF4A1 appears to function downstream of IBTK1, can the effects of IBTK1 KO/KD in reducing puromycin incorporation (in Fig 3A), cap-dependent luciferase reporter activity (Fig 3G), reduced oncogene expression (Fig 4A) or 2D growth/ invasion assays (Fig 4) be overcome or bypassed by overexpressing eiF4A1? These could potentially be tested in future studies.
We appreciate the reviewer for bringing up this crucial point. As per the reviewer's suggestion, we conducted experiments where we overexpressed Myc-eIF4A1 in IBTK-KO SiHa cells. Our findings indicate that increasing levels of eIF4A1 through ectopic overexpression is unable to reverse the decrease in puromycin incorporation (Fig. S3C) and protein expression of eIF4A1 targets caused by IBTK ablation (Fig. S4E). These results clearly demonstrate that IBTK ablation-induced eIF4A1 dysfunctions cannot be rescued by simply elevating eIF4A1 protein levels. Given the above results are negative, the impacts of eIF4A1 overexpression on the 2D growth/invasion capacities of IBTK-KO cells were not further examined. We sincerely appreciate the reviewer's understanding regarding this matter.
(2) The decrease in nascent protein synthesis in puromycin incorporation assays in Figure 3A suggest that the effects of IBTK KO are comparable to and additive with silvesterol. It would be of interest to examine whether silvesterol decreases nascent protein synthesis or increases stress granules in the IBTK KO cells stably expressing IBTK as well.
We appreciate the reviewer for bringing up this crucial point. We have showed that silvestrol treatment still decreased nascent protein synthesis in IBTK-KO cells overexpressing FLAG-IBTK as well (Fig. S3B).
(3) The data presented in Figure 5 regarding the role of mTORC1 in IBTK- mediated eiF4A1 ubiquitination needs further clarification on several points:
- It is not clear if the experiments in Figure 5F with Phos-tag gels are using the FLAG-IBTK deletion mutant or the peptide containing the mTOR sites as it is mentioned on line 517, page 19 "To do so, we generated an IBTK deletion mutant (900-1150 aa) spanning the potential mTORC1-regulated phosphorylation sites" This needs further clarification.
We appreciate the reviewer for bringing up this crucial point. The IBTK deletion mutant used in Fig. 5F is FLAG-IBTK900-1150aa. We have annotated it with smaller font size in the panel (red box) in Author response image 1.
Author response image 1.
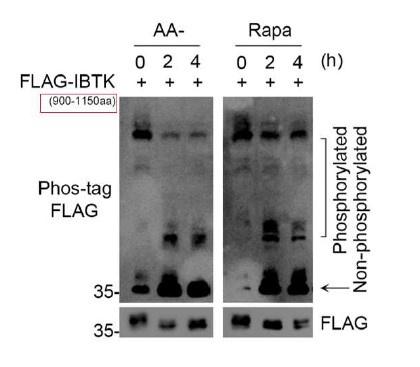
- It may be of benefit to repeat the Phos tag experiments with full-length FLAG- IBTK and/or endogenous IBTK with molecular weight markers indicating the size of migrated bands.
We appreciate the reviewer for bringing up this crucial point. We attempted to perform Phos-tag assays to detect the overexpressed full-length FLAG-IBTK or endogenous IBTK. However, we encountered difficulties in successfully transferring the full-length FLAG-IBTK or endogenous IBTK onto the nitrocellulose membrane during Phos-tag WB analysis. This is likely due to the limitations of this technique. Based on our experience, phos-tag gel is less efficient in detecting protein motility shifts with large molecular weights. As the molecular weight of IBTK protein is approximately 160 kDa, it falls within this category. Considering these technical constraints, we did not include Phos-tag assay results for full-length IBTK in our study. We sincerely appreciate the reviewer's understanding regarding this matter.
The binding of Phos-tag to phosphorylated proteins induces a mobility shift during gel electrophoresis or protein separation techniques. This shift allows for the visualization and quantification of phosphorylated proteins separately from non-phosphorylated proteins. It's important to note that these mobility shifts indicate phosphorylation status, rather than actual molecular weights. pre- stained protein markers are typically used as a reference to assess the efficiency of protein transfer onto the membrane [Ref: 1]. Considering the aforementioned reasons, we did not add molecular weights to the WB images.
Reference [1]. FUJIFILM Wako Pure Chemical Corporation, https://www.wako- chemicals.de/media/pdf/c7/5e/20/FUJIFILM-Wako_Phos-tag-R.pdf
- Additionally, torin or Lambda phosphatase treatment may be used to confirm the specificity of the band in separate experiments.
We appreciate the reviewer for bringing up this crucial point. Torin1 is a synthetic mTOR inhibitor by preventing the binding of ATP to mTOR, leading to the inactivation of both mTORC1 and mTORC2, whereas rapamycin primarily targets mTORC1 activity and may inhibit mTORC2 in certain cell types after a prolonged treatment. We have identified that the predominant mediator of IBTK phosphorylation is the mTORC1/S6K1 complex. Therefore, in this context, we think that rapamycin is sufficient to inactivate the mTORC1/S6K1 pathway. As shown in Fig. 5F, the phosphorylated IBTK900-1150aa was markedly decreased while the non-phosphorylated form was simultaneously increased in rapamycin- treated cells. As per the reviewer's suggestion, we treated FLAG-IBTK900-1150aa overexpressed cells with lambda phosphatase. As shown in Fig. 5G, lambda phosphatase treatment completely abolished the mobility shifts of phosphorylated FLAG-IBTK900-1150aa. Additionally, the lowest band displayed an abundant accumulation of the non-phosphorylated form of FLAG-IBTK900-1150aa. These findings confirm that the mobility shifts observed in WB analysis correspond to the phosphorylated forms of FLAG-IBTK900-1150aa.
- Phos-tag gels with the IBTK CRISPR KO line would also help confirm that the non-phosphorylated band is indeed IBTK.
We appreciate the reviewer for bringing up this crucial point. As we state above, we performed Phos-tag assays to detect the mobility shifts of phosphorylated FLAG-IBTK900-1150aa. Anti-FLAG antibody, but not the anti-IBTK antibody was used for WB detection. This antibody does not exhibit cross-reactivity with endogenous IBTK.
- It is unclear why the lower, phosphorylated bands seem to be increasing (rather than decreasing) with AA starvation/ Rapa in Fig 5H.
We appreciate the reviewer for bringing up this crucial point. We think the panel the reviewer mentioned is Fig. 5F. According to the principle of Phos-tag assays, proteins with higher phosphorylation levels have slower migration rates on SDS-PAGE, while proteins with lower phosphorylation levels have faster migration rates.
As shown in Author response image 2, the green box indicates the most phosphorylated forms of FLAG-IBTK900-1150aa, the red box indicates the moderately phosphorylated forms of FLAG-IBTK900-1150aa, and the yellow box indicates the non-phosphorylated forms of FLAG-IBTK900-1150aa. AA starvation or Rapamycin treatment reduced the hyperphosphorylated forms of FLAG-IBTK900-1150aa (green box), while simultaneously increasing the hypophosphorylated (red box) and non- phosphorylated (yellow box) forms of FLAG-IBTK900-1150aa. Thus, we conclude that AA starvation or Rapamycin treatment leads to a marked decrease in the phosphorylation levels of FLAG-IBTK900-1150aa.
Author response image 2.
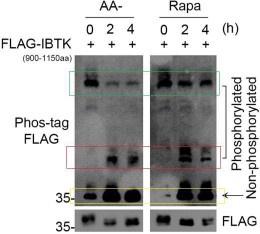
Reviewer #2 (Public Review):
Summary:
This study by Sun et al. identifies a novel role for IBTK in promoting cancer protein translation, through regulation of the translational helicase eIF4A1. Using a multifaceted approach, the authors demonstrate that IBTK interacts with and ubiquitinates eIF4A1 in a non-degradative manner, enhancing its activation downstream of mTORC1/S6K1 signaling. This represents a significant advance in elucidating the complex layers of dysregulated translational control in cancer.
Strengths:
A major strength of this work is the convincing biochemical evidence for a direct regulatory relationship between IBTK and eIF4A1. The authors utilize affinity purification and proximity labeling methods to comprehensively map the IBTK interactome, identifying eIF4A1 as a top hit. Importantly, they validate this interaction and the specificity for eIF4A1 over other eIF4 isoforms by co- immunoprecipitation in multiple cell lines. Building on this, they demonstrate that IBTK catalyzes non-degradative ubiquitination of eIF4A1 both in cells and in vitro through the E3 ligase activity of the CRL3-IBTK complex. Mapping IBTK phosphorylation sites and showing mTORC1/S6K1-dependent regulation provides mechanistic insight. The reduction in global translation and eIF4A1- dependent oncoproteins upon IBTK loss, along with clinical data linking IBTK to poor prognosis, support the functional importance.
Weaknesses:
While these data compellingly establish IBTK as a binding partner and modifier of eIF4A1, a remaining weakness is the lack of direct measurements showing IBTK regulates eIF4A1 helicase activity and translation of target mRNAs. While the effects of IBTK knockout/overexpression on bulk protein synthesis are shown, the expression of multiple eIF4A1 target oncogenes remains unchanged.
Summary:
Overall, this study significantly advances our understanding of how aberrant mTORC1/S6K1 signaling promotes cancer pathogenic translation via IBTK and eIF4A1. The proteomic, biochemical, and phosphorylation mapping approaches established here provide a blueprint for interrogating IBTK function. These data should galvanize future efforts to target the mTORC1/S6K1-IBTK-eIF4A1 axis as an avenue for cancer therapy, particularly in combination with eIF4A inhibitors.
Reviewer #1 (Recommendations For The Authors):
(1) Certain references should be provided for clarity. For e.g.,: Page 15, line 418 " The C-terminal glycine glycine (GG) amino acid residues are essential for Ub conjugation to targeted proteins".
We appreciate the reviewer for bringing up this crucial point. We have taken two fundamental review papers (PMID: 22524316, 9759494) on the ubiquitin system as references in this sentence.
(2) Please describe the properties of the ΔBTB mutant on page 15 when first describing it. What motifs does it lack and has it been described before in functional studies?
We appreciate the reviewer for bringing up this crucial point. We added a sentence to describe the properties of the ΔBTB mutant. This mutant lacks the BTB1 and BTB2 domains (deletion of aa 554–871), which have been previously demonstrated to be essential for binding to CUL3. The original reference has been added to the revised manuscript.
(3) In Figure 2G how do the authors explain the fact that co-expression of the Ub K-ALLR mutant, which is unable to form polyubiquitin chains, formed only a moderate reduction in IBTK-mediated eIF4A1 ubiquitination?
We appreciate the reviewer for bringing up this crucial point. The Ub K-ALLR mutant can indeed conjugate to substrate proteins, but it cannot form chains due to its absence of lysine residues, resulting in mono-ubiquitination. Multi- mono-ubiquitination refers to the attachment of single ubiquitin molecules to multiple lysine residues on a substrate protein. It's worth noting that a poly- ubiquitinated protein and a multi-mono-ubiquitinated protein appear strikingly similar in Western blot. Our findings demonstrated that the co-expression of the Ub K-ALL-R mutant resulted in only a modest reduction in IBTK-mediated eIF4A1 ubiquitination (Fig. 2G), and that eIF4A1 was ubiquitinated at twelve lysine residues when co-expressed with IBTK (Fig. S2F). As such, we conclude that the CRL3IBTK complex primarily catalyzes multi-mono-ubiquitination on eIF4A1. .
(4) In Figure 5, The identity of the seven sites in the IBTK 7ST A mutants should be specified.
We appreciate the reviewer for bringing up this crucial point. We have specified the seven mutation sites in the IBTK-7ST A mutant (Fig. 6A).
(5) In Figure 5, the rationale for generating antibodies only to S990/992/993, as opposed to the other mTORC1/S6K motifs should be specified.
We appreciate the reviewer for bringing up this crucial point. Upon demonstrating that IBTK can be phosphorylated—with evidence from positive Phos-tag and in vitro phosphorylation assays—we sought to directly detect changes in the phosphorylation levels using an antibody specific to IBTK phosphorylation. However, the expense of generating seven phosphorylation- specific antibodies for each site is significant. Recognizing that S990/992/993 are three adjacent sites, we deemed it appropriate to generate a single antibody to recognize the phospho-S990/992/993 epitope. Moreover, out of the seven phosphorylation sites, S992 perfectly matches the consensus motif for S6K1 phosphorylation (RXRXXS). Utilizing this antibody allowed us to observe a substantial decrease in the phosphorylation levels of these three adjacent Ser residues in IBTK following either AA deprivation or Rapamycin treatment (Fig. 5L). We have specified these points in the manuscript.
Reviewer #2 (Recommendations For The Authors):
The following suggestions would strengthen the study:
(1) Directly examine the effects of IBTK modulation (knockdown/knockout/ overexpression) on eIF4A1 helicase activity.
We appreciate the reviewer for bringing up this crucial point. We agree with the reviewer's suggestion that evaluating IBTK's influence on eIF4A1 helicase activity directly would enhance the strength of our conclusion. However, the current eIF4A1 helicase assays, as described in previous publications [Ref: 1, 2], can only be conducted using in vitro purified recombinant proteins. For instance, it is feasible to assess the varying levels of helicase activity exhibited by recombinant wild-type or mutant EIF4A1 proteins [Ref: 2]. Importantly, there is currently no reported methodology for evaluating the helicase activity of EIF4A1 in vivo, as mentioned by the reviewer in gene knockdown, knockout, or overexpression cellular contexts. Therefore, we have not performed these assays and we sincerely appreciate the reviewer's understanding in this regard. We sincerely appreciate the reviewer's understanding regarding this matter.
Reference:
[1] Chu J, Galicia-Vázquez G, Cencic R, Mills JR, Katigbak A, Porco JA, Pelletier J. CRISPR-mediated drug-target validation reveals selective pharmacological inhibition of the RNA helicase, eIF4A. Cell reports. 2016 Jun 14;15(11):2340-7.
[2] Chu J, Galicia-Vázquez G, Cencic R, Mills JR, Katigbak A, Porco JA, Pelletier J. CRISPR-mediated drug-target validation reveals selective pharmacological inhibition of the RNA helicase, eIF4A. Cell reports. 2016 Jun 14;15(11):2340-7.
(2) Justify why the expression of some but not all eIF4A1 target oncogenes is affected in IBTK-depleted/overexpressing cells. This is important if IBTK should be considered as a therapeutic target. The authors should consider which of the eIF4A1 targets are most impacted by IBTK KO. This would provide a more focused therapeutic approach in the future.
We appreciate the reviewer for bringing up this crucial point. As the reviewer has pointed out, we assessed the protein levels of ten reported eIF4A1 target genes across three cancer cell lines (Fig.4, Fig. S4A, C). We observed that IBTK depletion led to a substantial reduction in the protein levels of most eIF4A1- regulated oncogenes upon IBTK depletion, although there were some exceptions. For instance, IBTK KO in H1299 cells exerted minimal influence on the protein levels of ROCK1 (Fig. S4A). Several possible explanations might account for this observation: firstly, given that our list of eIF4A1 target genes collected from previous studies conducted using distinct cell lines, it is not unexpected for different lines to exhibit subtle differences in regulation of eIF4A1 target genes. Secondly, as a CRL3 adaptor, IBTK potentially performs other biological functions via ubiquitination of specific substrates; dysregulation of these could buffer the impact of IBTK KO on the protein expression of some eIF4A1 target genes. We added these comments to the Discussion section of the revised manuscript.
(3) Expand mTOR manipulation experiments (inhibition, Raptor knockout, activation) and evaluate impacts on IBTK phosphorylation, eIF4A1 ubiquitination, and translation.
The mTORC1 signaling pathway is constitutively active under normal culture conditions. In order to inhibit mTORC1 activation, we employed several approaches including AA starvation, Rapamycin treatment, or Raptor knockout. Our results have demonstrated that both AA starvation and rapamycin treatment led to a reduction in eIF4A1 ubiquitination (Fig. 5M). Moreover, we have included new findings in the revised manuscript, which highlight that Raptor knockout specifically decreases eIF4A1 ubiquitination (Fig. 5N). It is worth mentioning that the impacts of mTOR inhibition or activation on protein translation have been extensively investigated and documented in numerous studies. Therefore, in our study, we did not feel it necessary to examine these treatments further.
(4) Although not absolutely necessary, it would be nice to see if some of these findings are true in other cancer cell types.
We appreciate the reviewer for bringing up this crucial point. We concur with the reviewer's suggestion that including data from other cancer cell types would enhance the strength of our conclusion. While the majority of our data is derived from two cervical cancer cell lines, we have corroborated certain key findings— such as the impact of IBTK on eIF4A1 and its target gene expression—in H1299 cells (human lung cancer) (Fig. 2C, Fig. S4A, B) and in CT26 cells (murine colon adenocarcinoma) (Fig. S4C, D). Additionally, we demonstrated that IBTK promotes IFN-γ-induced PD-L1 expression and tumor immune escape in both the H1299 and CT26 cells (Fig. S6A-K).
Author response:
The following is the authors’ response to the current reviews.
Public Reviews:
Reviewer #1 (Public Review):
In the article by Dearlove et al., the authors present evidence in strong support of nucleotide ubiquitylation by DTX3L, suggesting it is a promiscuous E3 ligase with capacity to ubiquitylate ADP ribose and nucleotides. The authors include data to identify the likely site of attachment and the requirements for nucleotide modification.
While this discovery potentially reveals a whole new mechanism by which nucleotide function can be regulated in cells, there are some weaknesses that should be considered. Is there any evidence of nucleotide ubiquitylation occurring cells? It seems possible, but evidence in support of this would strengthen the manuscript. The NMR data could also be strengthened as the binding interface is not reported or mapped onto the structure/model, this seems of considerable interest given that highly related proteins do have the same activity.
The paper is for the most part well well-written and is potentially highly significant
Comments on revised version:
The revised manuscript has addressed many of the concerns raised and clarified a number of points. As a result the manuscript is improved.
The primary concern that remains is the absence of biological function for Ub-ssDNA/RNA and the inability to detect it in cells. Despite this the manuscript will be of interest to those in the ubiquitin field and will likely provoke further studies and the development of tools to better assess the cellular relevance. As a result this manuscript is important.
We agree with the reviewer’s assessment.
Minor issue:
Figure 1A - the authors have now included the constructs used but it would be more informative if the authors lined up the various constructs under the relevant domains in the full-length protein.
Figure 1 will be fixed in the Version of Record.
Reviewer #2 (Public Review):
The manuscript by Dearlove et al. entitled "DTX3L ubiquitin ligase ubiquitinates single-stranded nucleic acids" reports a novel activity of a DELTEX E3 ligase family member, DTX3L, which can conjugate ubiquitin to the 3' hydroxyl of single-stranded oligonucleotides via an ester linkage. The findings that unmodified oligonucleotides can act as substrates for direct ubiquitylation and the identification of DTX3 as the enzyme capable of performing such oligonucleotide modification are novel, intriguing, and impactful because they represent a significant expansion of our view of the ubiquitin biology. The authors perform a detailed and diligent biochemical characterization of this novel activity, and key claims made in the article are well supported by experimental data. However, the studies leave room for some healthy skepticism about the physiological significance of the unique activity of DTX3 and DTX3L described by the authors because DTX3/DTX3L can also robustly attach ubiquitin to the ADP ribose moiety of NAD or ADP-ribosylated substrates. The study could be strengthened by a more direct and quantitative comparison between ubiquitylation of unmodified oligonucleotides by DTX3/DTX3L with the ubiquitylation of ADP-ribose, the activity that DTX3 and DTX3L share with the other members of the DELTEX family.
Comment on revised version:
In my opinion, reviewers' comments are constructively addressed by the authors in the revised manuscript, which further strengthens the revised submission and makes it an important contribution to the field. Specifically, the authors perform a direct quantitative comparison of two distinct ubiquitylation substrates, unmodified oligonucleotides and fluorescently labeled NADH and report that kcat/Km is 5-fold higher for unmodified oligos compared to NADH. This observation suggests that ubiquitylation of unmodified oligos is not a minor artifactual side reaction in vitro and that unmodified oligonucleotides may very well turn out to be the physiological substrates of the enzyme. However, the true identity of the physiological substrates and the functionally relevant modification site(s) remain to be established in further studies.
We agree with the reviewer’s assessment.
The following is the authors’ response to the original reviews.
Public Reviews:
Reviewer #1 (Public Review):
In the article by Dearlove et al., the authors present evidence in strong support of nucleotide ubiquitylation by DTX3L, suggesting it is a promiscuous E3 ligase with capacity to ubiquitylate ADP ribose and nucleotides. The authors include data to identify the likely site of attachment and the requirements for nucleotide modification.
While this discovery potentially reveals a whole new mechanism by which nucleotide function can be regulated in cells, there are some weaknesses that should be considered. Is there any evidence of nucleotide ubiquitylation occurring cells? It seems possible, but evidence in support of this would strengthen the manuscript. The NMR data could also be strengthened as the binding interface is not reported or mapped onto the structure/model, this seems of considerable interest given that highly related proteins do have the same activity.
The paper is for the most part well well-written and is potentially highly significant, but it could be strengthened as follows:
(1) The authors start out by showing DTX3L binding to nucleotides and ubiquitylation of ssRNA/DNA. While ubiquitylation is subsequently dissected and ascribed to the RD domains, the binding data is not followed up. Does the RD protein alone bind to the nucleotides? Further analysis of nucleotide binding is also relevant to the Discussion where the role of the KH domains is considered, but the binding properties of these alone have not been analysed.
We thank the reviewer for the suggestion. We have tested DTX3L RD for ssDNA binding using NMR (see Figure 4A and Figure S2), which showed that DTX3L RD binds ssDNA. We have now tested the DTX3L KH domains for RNA/ssDNA binding using an FP experiment. However, the FP experiment did not show significant changes upon titrating RNA/ssDNA, suggesting that the KH domains alone are not sufficient to bind RNA/ssDNA. We have opted to put this data in the response-to-review as future investigation will be required to examine whether other regions of DTX3L cooperate with RD to bind RNA/ssDNA. We have revised the Discussion on the KH domains. We now state that “Our findings show the DTX3L DTC domain binds nucleic acids but whether the KHL domains contribute to nucleic acid binding requires further investigation.”
Author response image 1.
Fold change of fluorescence polarisation of 6-FAM-labelled ssDNA D4 upon titrating with DTX3L variants. DTX3L KH domain fragments were expressed with a N-terminal His-MBP tag to increase the molecular weight to enhance the signal.
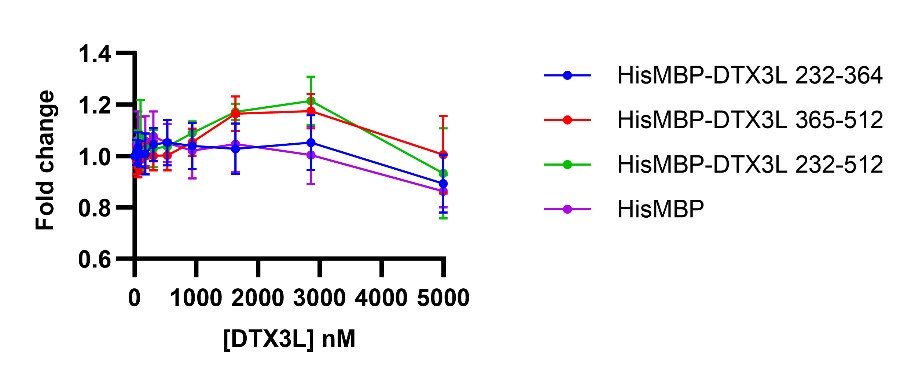
(2) With regard to the E3 ligase activity, can the authors account for the apparent decreased ubiquitylation activity of the 232-C protein in Figure 1/S1 compared to FL and RD?
We found that the 232-C protein batch used in the assay was not pure and have subsequently re-purified the protein. We have repeated the ubiquitination of ssDNA and RNA (Fig. 1H and 1I) and 232-C exhibited similar activity as WT. Furthermore, we performed autoubiquitination (Fig. S1G) and E2~Ub discharge assay (Fig. S1H) to compare the activity. 232-C was slower in autoubiquitination (Fig. S1G), but showed similar activity in the E2~Ub discharge assay as WT. These findings suggest that the RING domain in 232-C is functional and 232-C likely lacks ubiquitination site(s) present in 1-231 region necessary for autoubiquitination.
(3) Was it possible to positively identify the link between Ub and ssDNA/RNA using mass spectrometry? This would overcome issues associated with labels blocking binding rather than modification.
We have tried to use mass spectrometry to detect the linkage between Ub and ssDNA/RNA, but was unable to do so. We suspect that the oxyester linkage might be labile, posing a challenge for mass spectrometry techniques. Similarly, a recent preprint from Ahel lab, which utilises LC-MS, detects the Ub-NMP product rather than the linkage (https://www.biorxiv.org/content/10.1101/2024.04.19.590267v1.full.pdf).
(4) Furthermore, can a targeted MS approach be used to show that nucleotides are ubiquitylated in cells?
This will require future development and improvement of the MS approach, specifically the isolation of labile oxyester-linked products from cells and the optimisation of the MS detection method.
(5) Do the authors have the assignments (even partial?) for DTX3L RD? In Figure 4 it would be helpful to identify the peaks that correspond to the residues at the proposed binding site. Also do the shifts map to a defined surface or do they suggest an extended site, particularly for the ssDNA.
We only collected HSQC spectra which was insufficient for assignments. We have performed a competition experiment using ADPr and labelled ssDNA, showing that ADPr competes against the ubiquitination of ssDNA (Figure 4D). We have also provided an additional experiment showing that ssDNA with a blocked 3’-OH can compete against ubiquitination of ADPr (Figure 4E). These data, together with our NMR analysis, further strengthen the evidence that ssDNA and ADPr compete the same binding pocket in DTX3L RD. Understanding how DTX3L RD binds ssDNA/RNA is an ongoing research in the lab.
(6) Does sequence analysis help explain the specificity of activity for the family of proteins?
We have performed sequence alignment and structure comparison of DTX proteins using both RING and DTC domains (Fig. S3). These analyses showed that DTX3 and DTX3L RING domains lack a N-terminal helix and two loop insertions compared to DTX1, DTX2 and DTX4. These additions make DTX1, DTX2 and DTX4 RING domain larger than DTX3L and DTX3. It is not clear how these would influence the orientation of the recruited E2~Ub. Comparison of the DTC domain showed that DTX1, DTX2 and DTX4 contain an Ala-Arg motif, which causes a bulge at one end of DTC pocket. In the absence of Ala-Arg motif, DTC pockets of DTX3 and DTX3L contain an extended groove which might accommodate one or more of the nucleotides 5' to the targeted terminal nucleotide. It seems that both features of RING and DTC domains might attribute to the specificity of DTX3L and DTX3. We have included these comparisons in the discussion and suggested that future structural characterization is necessary to unveil the specificity.
(7) While including a summary mechanism (Figure 5I) is helpful, the schematic included does not necessarily make it easier for the reader to appreciate the key findings of the manuscript or to account for the specificity of activity observed. While this figure could be modified, it might also be helpful to highlight the range of substrates that DTX3L can modify - nucleotide, ADPr, ADPr on nucleotides etc.
We have modified this Figure to include the range of substrates.
Reviewer #2 (Public Review):
Summary:
The manuscript by Dearlove et al. entitled "DTX3L ubiquitin ligase ubiquitinates single-stranded nucleic acids" reports a novel activity of a DELTEX E3 ligase family member, DTX3L, which can conjugate ubiquitin to the 3' hydroxyl of single-stranded oligonucleotides via an ester linkage. The findings that unmodified oligonucleotides can act as substrates for direct ubiquitylation and the identification of DTX3 as the enzyme capable of performing such oligonucleotide modification are novel, intriguing, and impactful because they represent a significant expansion of our view of the ubiquitin biology. The authors perform a detailed and diligent biochemical characterization of this novel activity, and key claims made in the article are well supported by experimental data. However, the studies leave room for some healthy skepticism about the physiological significance of the unique activity of DTX3 and DTX3L described by the authors because DTX3/DTX3L can also robustly attach ubiquitin to the ADP ribose moiety of NAD or ADP-ribosylated substrates. The study could be strengthened by a more direct and quantitative comparison between ubiquitylation of unmodified oligonucleotides by DTX3/DTX3L with the ubiquitylation of ADP-ribose, the activity that DTX3 and DTX3L share with the other members of the DELTEX family.
Strengths:
The manuscript reports a novel and exciting observation that ubiquitin can be directly attached to the 3' hydroxyl of unmodified, single-stranded oligonucleotides by DTX3L. The study builds on the extensive expertise and the impactful previous studies by the Huang laboratory of the DELTEX family of E3 ubiquitin ligases. The authors perform a detailed and diligent biochemical characterization of this novel activity, and all claims made in the article are well supported by experimental data. The manuscript is clearly written and easy to read, which further elevates the overall quality of submitted work. The findings are impactful and will help illuminate multiple avenues for future follow-up investigations that may help establish how this novel biochemical activity observed in vitro may contribute to the biological function of DTX3L. The authors demonstrate that the activity is unique to the DTX3/DTX3L members of the DELTEX family and show that the enzyme requires at least two single-stranded nucleotides at the 3' end of the oligonucleotide substrate and that the adenine nucleotide is preferred in the 3' position. Most notably, the authors describe a chimeric construct containing RING domain of DTX3L fused to the DTC domain DTX2, which displays robust NAD ubiquitylation, but lacks the ability to ubiquitylate unmodified oligonucleotides. This construct will be invaluable in the future cell-based studies of DTX3L biology that may help establish the physiological relevance of 3' ubiquitylation of nucleic acids.
Weaknesses:
The main weakness of the study is in the lack of direct evidence that the ubiquitylation of unmodified oligonucleotides reported by the authors plays any role in the biological function of DTX3L. The study leaves plenty of room for natural skepticism regarding the physiological relevance of the reported activity, because, akin to other DELTEX family members, DTX3 and DTX3L can also catalyze attachment of ubiquitin to NAD, ADP ribose and ADP-ribosylated substrates. Unfortunately, the study does not offer any quantitative comparison of the two distinct activities of the enzyme, which leaves plenty of room for doubt. One is left wondering, whether ubiquitylation of unmodified oligonucleotides is just a minor and artifactual side activity owing to the high concentration of the oligonucleotide substrates and E2~Ub conjugates present in the in-vitro conditions and the somewhat lower specificity of the DTX3 and DTX3L DTC domains (compared to DTX2 and other DELTEX family members) for ADP ribose over other adenine-containing substrates such as unmodified oligonucleotides, ADP/ATP/dADP/dATP, etc. The intriguing coincidence that DTX3L, which is the only DTX protein capable of ubiquitylating unmodified oligonucleotides, is also the only family member that contains nucleic acid interacting domains in the N-terminus, is suggestive but not compelling. A recently published DTX3L study by a competing laboratory (PMID: 38000390), which is not cited in the manuscript, suggests that ADP-ribose-modified nucleic acids could be the physiologically relevant substrates of DTX3L. That competing hypothesis appears more convincing than ubiquitylation of unmodified oligonucleotides because experiments in that study demonstrate that ubiquitylation of ADP-ribosylated oligos is quite robust in comparison to ubiquitylation of unmodified oligos, which is undetectable. It is possible that the unmodified oligonucleotides in the competing study did not have adenine in the 3' position, which may explain the apparent discrepancy between the two studies. In summary, a quantitative comparison of ubiquitylation of ADP ribose vs. unmodified oligonucleotides could strengthen the study.
We thank the reviewer for the constructive feedback. We agree that evidence for the biological function is lacking. While we have tried to detect Ub-ssDNA/RNA from cells, we found that isolating and detecting labile oxyester-linked Ub-ssDNA/RNA products remain challenging due to (1) low levels of Ub-ssDNA/RNA products, (2) the presence of DUBs and nucleases that rapidly remove the products during the experiments, and (3) our lack of a suitable MS approach to detect the product. For these reasons, we feel that discovering the biological function will require future effort and expertise and is beyond the scope of our current manuscript.
In the manuscript (PMID: 38000390), the authors used PARP10 to catalyse ADP-ribosylation onto 5’-phosphorylated ssDNA/RNA. They used the following sequences which lacks 3’-adenosine, which could explain the lack of ubiquitination.
E15_5′P_RNA [Phos]GUGGCGCGGAGACUU
E15_5′P_DNA [Phos]GTGGCGCGGAGACTT
We have performed the experiment using this sequence to verify this (see Author response image 2 below). We have cited this manuscript but for some reasons, Pubmed has updated its published date from mid 2023 to Jan 2024. We have updated the Endnote in the revised manuscript.
Author response image 2.
Fluorescently detected SDS-PAGE gel of in vitro ubiquitination catalysed by DTX3L-RD in the presence ubiquitination components and 6-FAM-labelled ssDNA D4 or D31.
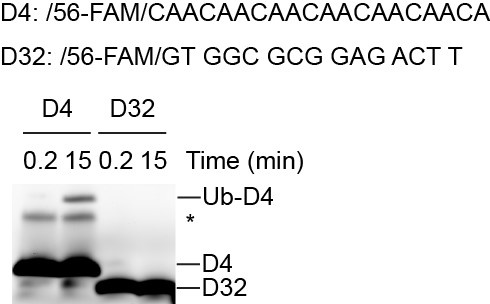
We agree that it is crucial to compare ubiquitination of oligonucleotides and ADPr by DTX3L to find its preferred substrate. We have challenged oligonucleotide ubiquitination by adding excess ADPr and found that ADPr efficiently competes with oligonucleotide (Figure 4D). We have also performed an experiment showing that ssDNA with a blocked 3’-OH can compete against ubiquitination of ADPr (Figure 4E). These data support that ADPr and ssDNA compete for the same binding site on DTX3L.
We also performed kinetic analysis of ubiquitination of fluorescently labelled ssDNA (D4) and NAD+ by DTX3L-RD (Fig. 4F and Fig. S2D–G) to assess substrate preferences. Here, we used fluorescent-labelled NAD+ (F-NAD+) in place of ADPr as labelled NAD+ is commercially available. With the known concentration of fluorescently labelled ssDNA and NAD+ as the standard, we could estimate the rate of ubiquitinated product formation across different substrate concentrations. We have included this finding in the main text “DTX3L-RD displayed _k_cat value of 0.0358 ± 0.0034 min-1 and a _K_m value of 6.56 ± 1.80 mM for Ub-D4 formation, whereas the Michaelis-Menten curve did not reach saturation for Ub-F-NAD+ formation (Fig. 4F and fig. S2, D-G). Comparison of the estimated catalytic efficiency (_k_cat/_K_m = 5457 M-1 min-1 for D4 and estimated _k_cat/_K_m = 1190 M-1 min-1 for F-NAD+; Fig. 4F) suggested that DTX3L-RD exhibited 4.5-fold higher catalytic efficiency for D4 than F-NAD+. This difference primarily results from a better _K_m value for D4 compared to F-NAD+. Although DTX3L-RD showed weak _K_m for F-NAD+, it displays a higher rate for converting F-NAD+ to Ub-F-NAD+ at higher substrate concentration (Fig. 4F). Thus, substrate concentration will play a role in determining the preference.”
Recommendations for the authors:
Reviewer #1 (Recommendations For The Authors):
Writing/technical points:
(1) The introduction is relatively complex and the last paragraph, which reviews the discoveries on the paper, is long. It may be helpful to highlight the significance and frame the experiments as what they have addressed, rather than detailing each set of experiments completed.
We have modified the last paragraph in the introduction to highlight the major discovery of our work.
(2) Line 24, Abstract. 'Its N-terminal region' is not obvious
We have changed “Its N-terminal region” to “the N-terminal region of DTX3L”.
(3) Line 44 - split sentence to emphasize E3 ligase point?
We have modified the sentence as suggested.
(4) Figures 1B and 1C could be larger - currently they are not very helpful. Also atoms (ADPr?) are shown, but not indicated in the legend or labelled on the panel.
We have enlarged Figures 1B and 1C and indicated RNA on the structure.
(5) The structure of the D2 domain of DTX3L has recently been reported (Vela-Rodriguez et al). It might be helpful to comment on this manuscript.
We have now commented on D2 domain in the results section and in the discussion.
(6) It would be helpful to indicate the DTX3L constructs used in Figure 1a.
We have included all DTX3L constructs used in Figure 1a.
(7) Interpretation of Figure 4A is difficult, the authors may wish to consider other ways to visualize the data.
We have now removed the black arrow in Figure 4A as it was confusing. Instead, we drew a black box on the cross-peak where the close-up views are shown in Figures 4B and 4C.
(8) Figure 4A. Please indicate which binding partner is highlighted by red/black arrows.
We have removed black arrow. The red arrows indicate cross-peaks which undergo chemical shift perturbation when DTX3L-RD was titrated with ssDNA or ADPr, highlighting their binding sites on DTX3L-RD overlap.
(9) Line 284 - please indicate the bulge in Figure S3.
We have indicated the bulge on Figure S3.
(10) Aspects of the discussion are speculative, given that evidence of Ub conjugated to nucleotides in cells is yet to be obtained and the functional consequences of modification are uncertain.
We understand that the discussion on the potential roles of ubiquitination of ssNAs is speculative. We have now modified it to: “Based on the known functions of the DTX3L/PARP9 complex and the findings of this study, we propose several hypotheses for future research”, so that readers will understand that these are speculative.
(11) Line 295 onwards - this paragraph discusses the role of the KH domains in nucleotide binding, but it is not clear that the authors have directly demonstrated that the KH domains bind nucleotides as all constructs used in the binding experiments in Figure 1/S1 include the RING-DTC domains.
We found that KH domains alone did not bind ssDNA or RNA. We have modified line 295. This section now reads “Typically, KH domains contain a GXXG motif within the loop between the first and second α helix (22). However, analysis of the sequence of the KHL domains in DTX3L shows these domains lack this motif. Multiple studies have shown that mutation in this motif abolishes binding to nucleic acids (23-26). Our findings show the DTX3L DTC domain binds nucleic acids but whether the KHL domains contribute to nucleic acid binding requires further investigation. Additionally, the structure of the first KHL domain was recently reported and shown to form a tetrameric assembly (20). Our analysis with DTX3L 232-C, which lacks the first KHL domain and RRM, indicate that it can still bind ssDNA and ssRNA. Despite this, a more detailed analysis will be required to determine whether oligomerization plays a role in nucleic acid binding and ubiquitination.”
Author response:
The following is the authors’ response to the original reviews
Public Reviews:
Reviewer #1 (Public review):
Contractile Injection Systems (CIS) are versatile machines that can form pores in membranes or deliver effectors. They can act extra or intracellularly. When intracellular they are positioned to face the exterior of the cell and hence should be anchored to the cell envelope. The authors previously reported the characterization of a CIS in Streptomyces coelicolor, including significant information on the architecture of the apparatus. However, how the tubular structure is attached to the envelope was not investigated. Here they provide a wealth of evidence to demonstrate that a specific gene within the CIS gene cluster, cisA, encodes a membrane protein that anchors the CIS to the envelope. More specifically, they show that:
- CisA is not required for assembly of the structure but is important for proper contraction and CIS-mediated cell death
- CisA is associated to the membrane (fluorescence microscopy, cell fractionation) through a transmembrane segment (lacZ-phoA topology fusions in E. coli)
- Structural prediction of interaction between CisA and a CIS baseplate component<br /> - In addition they provide a high-resolution model structure of the >750-polypeptide Streptomyces CIS in its extended conformation, revealing new details of this fascinating machine, notably in the baseplate and cap complexes.
All the experiments are well controlled including trans-complemented of all tested phenotypes.
One important information we miss is the oligomeric state of CisA.
Thank you for this suggestion. We now provide information on the potential oligomeric state of CisA. We performed further AlphaFold3 modelling of CisA using an increasing number of CisA protomers (1 to 8). We ran predictions for the configuration using the sequence of the well-folded C-terminal CisA domain (amino acids 285-468), which includes the transmembrane domain and the conserved domain that shares similarities to carbohydrate-degrading domains. The obtained confidence scores (mean values for pTM=0.73, ipTM=0.7, n=5) indicate that CisA can assemble into a pentamer and that this oligomerization is mediated through the interaction of the C-terminal solute-binding like superfamily domain.
We have added this information to the revised manuscript (Fig. 3b/c) and further discuss the possible implications of CisA oligomerization for its proposed mode of action.
While it would have been great to test the interaction between CisA and Cis11, to perform cryo-electron microscopy assays of detergent-extracted CIS structures to maintain the interaction with CisA, I believe that the toxicity of CisA upon overexpression or upon expression in E. coli render these studies difficult and will require a significant amount of time and optimization to be performed. It is worth mentioning that this study is of significant novelty in the CIS field because, except for Type VI secretion systems, very few membrane proteins or complexes responsible for CIS attachment have been identified and studied.
We thank this reviewer for their highly supportive and positive comments on our manuscript and we are grateful for their recognition of the novelty of our study, particularly in the context of membrane proteins and complexes involved in CIS attachment.
We agree that further experimental evidence on direct interaction between CisA and Cis11 would have strengthened our model on CisA function. However, as noted by this reviewer, this additional work is technically challenging and currently beyond the scope of this study.
Reviewer #2 (Public review):
Summary:
The overall question that is addressed in this study is how the S. coelicolor contractile injection system (CISSc) works and affects both cell viability and differentiation, which it has been implicated to do in previous work from this group and others. The CISSc system has been enigmatic in the sense that it is free-floating in the cytoplasm in an extended form and is seen in contracted conformation (i.e. after having been triggered) mainly in dead and partially lysed cells, suggesting involvement in some kind of regulated cell death. So, how do the structure and function of the CISSc system compare to those of related CIS from other bacteria, does it interact with the cytoplasmic membrane, how does it do that, and is the membrane interaction involved in the suggested role in stress-induced, regulated cell death? The authors address these questions by investigating the role of a membrane protein, CisA, that is encoded by a gene in the CIS gene cluster in S. coelicolor. Further, they analyse the structure of the assembled CISSc, purified from the cytoplasm of S. coelicolor, using single-particle cryo-electron microscopy.
Strengths:
The beautiful visualisation of the CIS system both by cryo-electron tomography of intact bacterial cells and by single-particle electron microscopy of purified CIS assemblies are clearly the strengths of the paper, both in terms of methods and results. Further, the paper provides genetic evidence that the membrane protein CisA is required for the contraction of the CISSc assemblies that are seen in partially lysed or ghost cells of the wild type. The conclusion that CisA is a transmembrane protein and the inferred membrane topology are well supported by experimental data. The cryo-EM data suggest that CisA is not a stable part of the extended form of the CISSc assemblies. These findings raise the question of what CisA does.
We thank Reviewer #2 for the overall positive evaluation of our manuscript and the constructive criticism.
Weaknesses:
The investigations of the role of CisA in function, membrane interaction, and triggering of contraction of CIS assemblies, are important parts of the paper and are highlighted in the title. However, the experimental data provided to answer these questions appear partially incomplete and not as conclusive as one would expect.
We acknowledge that some aspects of our work remain unanswered. We are currently unable to conduct additional experiments because the two leading postdoctoral researchers on this project have moved on to new positions. We currently don’t have the extra manpower with a similar skill set to pick up the project.
The stress-induced loss of viability is only monitored with one method: an in vivo assay where cytoplasmic sfGFP signal is compared to FM5-95 membrane stain. Addition of a sublethal level of nisin lead to loss of sfGFP signal in individual hyphae in the WT, but not in the cisA mutant (similarly to what was previously reported for a CIS-negative mutant). Technically, this experiment and the example images that are shown give rise to some concern. Only individual hyphal fragments are shown that do not look like healthy and growing S. coelicolor hyphae. Under the stated growth conditions, S. coelicolor strains would normally have grown as dense hyphal pellets. It is therefore surprising that only these unbranched hyphal fragments are shown in Fig. 4ab.
We thank this Reviewer for their thoughtful criticism regarding the viability assays and the data presented in Figure 4. We acknowledge the importance of ensuring that the presented images reflect the physiological state of S. coelicolor under the stated growth conditions and recognize that hyphal fragments shown in Figure 4 do not fully capture the typical morphology of S. coelicolor. As pointed out by this reviewer, S. coelicolor grows in large hyphal clumps when cultured in liquid media, making the quantification of fluorescence intensities in hyphae expressing cytoplasmic GFP or stained with the membrane dye FM5-95 particularly challenging. To improve the image analysis and quantification of GFP and FM5-95-fluorescent intensities across the three S. coelicolor strains (wildtype, cisA deletion mutant and the complemented cisA mutant), we vortexed the cell samples before imaging to break up hyphal clumps, increasing hyphal fragments. The hyphae shown in our images were selected as representative examples across three biological replicates.
Further, S. coelicolor would likely be in a stationary phase when grown 48 h in the rich medium that is stated, giving rise to concern about the physiological state of the hyphae that were used for the viability assay. It would be valuable to know whether actively growing mycelium is affected in the same way by the nisin treatment, and also whether the cell death effect could be detected by other methods.
The reasoning behind growing S. coelicolor for 48 h before performing the fluorescence-based viability assay was that we (DOI: 10.1038/s41564-023-01341-x ) and others (e.g.: DOI: 10.1038/s41467-023-37087-7 ) previously showed that the levels of CIS particles peak at the transition from vegetative to reproductive/stationary growth, thus indicating that CIS activity is highest during this growth stage. The obtained results in this manuscript are consistent with previous results, in which we showed a similar effect on the viability of wildtype versus cis-deficient S. coelicolor strains (DOI: 10.1038/s41564-023-01341-x ) using nisin, the protonophore CCCP and UV radiation. The results presented in this study and our previous study are based on biological triplicate experiments and appropriate controls. Furthermore, our results are in agreement with the findings reported in a complementary study by Vladimirov et al. (DOI: 10.1038/s41467-023-37087-7 ) that used a different approach (SYTO9/PI staining of hyphal pellets) to demonstrate that CIS-deficient mutants exhibit decreased hyphal death.
Taken together, we believe that the results obtained from our fluorescence-based viability assay provide strong experimental evidence that functional CIS mediate hyphal cell death in response to exogenous stress.
The model presented in Fig. 5 suggests that stress leads to a CisA-dependent attachment of CIS assemblies to the cytoplasmic membrane, and then triggering of contraction, leading to cell death. This model makes testable predictions that have not been challenged experimentally. Given that sublethal doses of nisin seem to trigger cell death, there appear to be possibilities to monitor whether activation of the system (via CisA?) indeed leads to at least temporally increased interaction of CIS with the membrane.
We thank this reviewer for their suggestions on how to test our model further. This is a challenging experiment because we do not know the exact dynamics of how nisin stress is perceived and transmitted to CisA and CIS particles.
In an attempt to address this point, we have performed co-immunoprecipitation experiments using S. coelicolor cells that produced CisA-FLAG as bait, and which were treated with a sub-lethal nisin concentration for 0/15/45 min. Mass spectrometry analysis of co-eluted peptides did not show the presence of CIS-associated peptides at the analyzed timepoints. While we cannot exclude the possibility that our experimental assay requires further optimization to successfully demonstrate a CisA-CIS interaction (e.g. optimization of the use of detergents to improve the solubilization of CisA from Streptomyces membrane, which is currently not an established method), an alternative and equally valid hypothesis is that the interaction between CIS particles and CisA is transient and therefore difficult to capture. We would like to mention, however, that we did detect CisA peptides in crude purifications of CIS particles from nisin-stressed cells (Supplementary Table 2, manuscript: line 301/302), supporting our proposed model that CisA can associate with CIS particles in vivo.
Further, would not the model predict that stress leads to an increased number of contracted CIS assemblies in the cytoplasm? No clear difference in length of the isolated assemblies if Fig. S7 is seen between untreated and nisin-exposed cells, and also no difference between assemblies from WT and cisA mutant hyphae.
The reviewer is correct that there is no clear difference in length in the isolated CIS particles shown in Figure S7. This is in line with our results, which show that CisA is not required for the correct assembly of CIS particles and their ability to contract in the presence and absence of nisin treatment. The purpose of Figure S7 was to support this statement. We would like to note that the particles shown in Figure S7 were purified from cell lysates using a crude sheath preparation protocol, during which CIS particles generally contract irrespective of the presence or absence of CisA. Thus, we cannot comment on whether there is an increased number of contracted CIS assemblies in the cytoplasm of nisin-exposed cells. To answer this point, we would need to acquire additional cryo-electron tomograms (cyroET) of the different strains treated with nisin. CryoET is an extremely time and labor-intensive task and given that we currently don’t know the exact dynamics of the CIS-CisA interaction following exogenous stress, we believe this experiment is beyond the scope of this work.
The interaction of CisA with the CIS assembly is critical for the model but is only supported by Alphafold modelling, predicting interaction between cytoplasmic parts of CisA and Cis11 protein in the baseplate wedge. An experimental demonstration of this interaction would have strengthened the conclusions.
We agree that direct experimental evidence of this interaction would have further strengthened the conclusions of our study, and we have extensively tried to provide additional experimental evidence. Unfortunately, because of the toxicity of cisA expression in E. coli and the possibly transient nature of the interaction under the experimental conditions used, we were unable to confirm this interaction by biochemical or biophysical techniques, such as co-purification or bacterial two-hybrid assays. Despite these technical challenges, we believe that the AlphaFold predictions provided a valuable hypothesis about the role of CisA in firing and the function of CIS particles in S. coelicolor.
The cisA mutant showed a similarly accelerated sporulation as was previously reported for CIS-negative strains, which supports the conclusion that CisA is required for function of CISSc. But the results do not add any new insights into how CIS/CisA affects the progression of the developmental life cycle and whether this effect has anything to do with the regulated cell death that is caused by CIS. The same applies to the effect on secondary metabolite production, with no further mechanistic insights added, except reporting similar effects of CIS and CisA inactivations.
Thank you for your feedback on this aspect of the manuscript. We would like to note that the main focus of this study was to provide further insight into how CIS contraction and firing are mediated in Streptomyces. We used the analysis of accelerated sporulation and secondary metabolite production as a readout to directly assess the functionality of CIS in the presence or absence of CisA and to complement the in situ cryoET data. In summary, our data significantly expand our knowledge of CIS function and firing in Streptomyces and suggest a model in which CisA plays an essential role in mediating the interaction of CIS particles with the membrane, which is required for CIS-mediated cell death. We discuss this model in more detail in the revised manuscript (Line 274-283).
We agree that we still don’t fully understand the full nature of the signals that trigger CIS contraction, but we do know that the production of CIS is an integral part of the Streptomyces multicellular life cycle as demonstrated by two independent previous studies by us and others (DOI: 10.1038/s41564-023-01341-x and DOI: 10.1038/s41467-023-37087-7 ).
We further speculate that the assembly and CisA-dependent firing of Streptomyces CIS particles could present a molecular mechanism to dismantle part of the vegetative mycelium. This form of “regulated cell death” could provide two key benefits: (1) to prevent the spread of local cellular damage to the rest of mycelium and (2) to provide additional nutrients for the rest of the mycelium to delay the terminal differentiation into spores, which in turn also affects the production of secondary metabolites.
Concluding remarks:
The work will be of interest to anyone interested in contractile injection systems, T6SS, or similar machineries, as well for people working on the biology of streptomycetes. There is also a potential impact of the work in the understanding of how such molecular machineries could have been co-opted during evolution to become a mechanism for regulated cell death. However, this latter aspect remains still poorly understood. Even though this paper adds excellent new structural insights and identifies a putative membrane anchor, it remains elusive how the Streptomyces CIS may lead to cell death. It is also unclear what the advantage would be to trigger death of hyphal compartments in response to stress, as well as how such cell death may impact (or accelerate) the developmental progression. Finally, it is inescapable to wonder whether the Streptomyces CIS could have any role in protection against phage infection.
We thank Reviewer #2 for the overall supportive assessment of our work. We will briefly discuss functional CIS's impact on Streptomyces development in the revised manuscript. We previously tested if Streptomyces could defend against phages but have not found any experimental evidence to support this idea (unpublished data). The analysis of phage defense mechanisms is an underdeveloped area in Streptomyces research, partly due to the currently limited availability of a diverse phage panel.
Reviewer #3 (Public review):
Summary:
In this work, Casu et al. have reported the characterization of a previously uncharacterized membrane protein CisA encoded in a non-canonical contractile injection system of Streptomyces coelicolor, CISSc, which is a cytosolic CISs significantly distinct from both intracellular membrane-anchored T6SSs and extracellular CISs. The authors have presented the first high-resolution structure of extended CISSc structure. It revealed important structural insights in this conformational state. To further explore how CISSc interacted with cytoplasmic membrane, they further set out to investigate CisA that was previously hypothesized to be the membrane adaptor. However, the structure revealed that it was not associated with CISSc. Using fluorescence microscope and cell fractionation assay, the authors verified that CisA is indeed a membrane-associated protein. They further determined experimentally that CisA had a cytosolic N-terminal domain and a periplasmic C-terminus. The functional analysis of cisA mutant revealed that it is not required for CISSc assembly but is essential for the contraction, as a result, the deletion significantly affects CISSc-mediated cell death upon stress, timely differentiation, as well as secondary metabolite production. Although the work did not resolve the mechanistic detail how CisA interacts with CISSc structure, it provides solid data and a strong foundation for future investigation toward understanding the mechanism of CISSc contraction, and potentially, the relation between the membrane association of CISSc, the sheath contraction and the cell death.
Strengths:
The paper is well-structured, and the conclusion of the study is supported by solid data and careful data interpretation was presented. The authors provided strong evidence on (1) the high-resolution structure of extended CISSc determined by cryo-EM, and the subsequent comparison with known eCIS structures, which sheds light on both its similarity and different features from other subtypes of eCISs in detail; (2) the topological features of CisA using fluorescence microscopic analysis, cell fractionation and PhoA-LacZα reporter assays, (3) functions of CisA in CISSc-mediated cell death and secondary metabolite production, likely via the regulation of sheath contraction.
Weaknesses:
(1) The data presented are not sufficient to provide mechanistic details of CisA-mediated CISSc contraction, as authors are not able to experimentally demonstrate the direct interaction between CisA with baseplate complex of CISSc (hypothesized to be via Cis11 by structural modeling), since they could not express cisA in E. coli due to its potential toxicity. Therefore, there is a lack of biochemical analysis of direct interaction between CisA and baseplate wedge. In addition, there is no direct evidence showing that CisA is responsible for tethering CISSc to the membrane upon stress, and the spatial and temporal relation between membrane association and contraction remains unclear. Further investigation will be needed to address these questions in future.
We thank Reviewer #3 for the supportive evaluation and constructive feedback of our study in the non-public review. We appreciate the recognition of the technical limitations of experimentally demonstrating a direct interaction between CisA and CIS baseplate complex, and we agree that further investigations in the future will hopefully provide a full mechanistic understanding of the spatiotemporal interaction of CisA and CIS particular and the subsequent CIS firing.
To further improve the manuscript, we will revise the text and clarify figures and figure legends as suggested in the non-public review.
Discussion:
Overall, the work provides a valuable contribution to our understanding on the structure of a much less understood subtype of CISs, which is unique compared to both membrane-anchored T6SSs and host-membrane targeting eCISs. Importantly, the work serves as a good foundation to further investigate how the sheath contraction works here. The work contributes to expanding our understanding of the diverse CIS superfamilies.
Thank you.
Recommendations for the authors:
Reviewer #1 (Recommendations for the authors):
- Magnification of the potential CisA-Cis11 model, with side chains at the interface, should be shown in Supplementary Figures 9/10 to help the reader appreciates the intercation between the two subunits.
Done. A zoomed-in view of the relevant side chains at the CisA-Cis11 interface has been added to Supplementary Figure 9e. For clarity, we decided not to highlight these residues in Supplementary Figure 10 because they are identical to those in Figure 9e.
- A model where CisA is positionned onto the baseplate (by merging the CisA-Cis11 model and the baseplate structure) will also be informative for the reader.
We agree that such a presentation would be helpful to visualize the proposed CisA-Cis11 interaction. However, the Cis11 residues predicted to bind CisA are buried in our cryoEM single-particle structure of the elongated Streptomyces CIS. This is not surprising, as the structure is based on a previously established non-contractile CIS mutant variant (PMCID: PMC10066040), which means we were only able to capture one specific configuration of the baseplate complex in the current work. This baseplate configuration is most likely structurally distinct from the baseplate configuration in contracted CIS particles. A similar observation was also reported for the baseplate complex of eCIS particles from Algoriphagus machipongonesis (PMCID: PMC8894135 ).
We speculate that in Streptomyces, initial non-specific contacts between CisA and cytoplasmic CIS particles induce a rearrangement of baseplate components, resulting in the exposure of the relevant Cis11 residues, which in turn facilitates a transient interaction between CisA and Cis11. This interaction then leads to additional conformational changes within the baseplate complex, triggering sheath contraction and CIS firing.
We believe that a transient binding step is a crucial part of the activation process, contributing to the dynamic nature of the system.
- Providing information on the oligomeric state of CisA will strenghten the manuscript. Authors may consider having blue-native gel analysis of CisA-3xFLAG extracted from Streptomyces or E. coli membranes, or in vivo chemical cross-linking coupled to SDS-PAGE analyses. In case these quite straightforward experiments are not possible, the authors may consider providing AF3 models of various CisA multimers.
Thank you for these suggestions. Unfortunately, we currently don’t have the capability to conduct additional experiments. However, we have performed additional AF3 modelling to explore potential different configurations of CisA. The results of these analyses suggest that CisA can assemble into a pentamer (see also Response to reviewer 1). We speculate that CisA may exist in different oligomeric states and that membrane-localized CisA monomers oligomerize into a larger protein complex in response to a cellular or extracellular (e.g. nisin) signal, which could then directly or indirectly interact with CIS particles in the cytoplasm to facilitate their recruitment to the membrane and CIS firing. Such a stress-dependent conformational change of CisA could also be a safety mechanism to prevent accidental interaction of CisA with CIS particles and CIS firing.
We now show the AF model for the predicted CisA pentamer in Figure 3b/c and discuss the potential implications of the different CisA configurations in the revised manuscript.
Reviewer #2 (Recommendations for the authors):
- The quantification of contracted versus extended CIS assemblies in the cytoplasm is only presented for the tomograms from the cisA mutant (graph in Fig. S2d). However, there are no data for the WT and complemented mutant to compare with. It would help to add such data, or at least refer to the previous quantification done for the WT in the previous paper. Further, would it be possible to illustrate the difference by measuring lengths of CIS assemblies and plot length distributions (assuming the extended ones are long and contracted are short)?
Thank you for your suggestions. We have included the results from our previous quantification of CIS assembly states observed in the WT in the revised manuscript (lines 106–110).
In the acquired tomograms of CIS particles observed in intact and dead hyphae, we consistently observed only two CIS conformations: the fully extended state (average length of 233 nm, diameter of 18 nm) and the fully contracted state (average length of 124 nm, diameter of 23 nm). We have added this information to the revised manuscript (lines 112-114).
- The Western blot in Fig. 3d, top panel, contains additional bands that are not mentioned. Are they non-specific bands? Absent in disA mutant? It would help if it was clarified in the legend what they are.
Correct, these additional bands are unspecific bands, which are also visible in the lysate and soluble fraction of wild-type sample (negative control, no FLAG-tagged protein). We have now labelled these bands in the figure and clarified the figure legend.
- Fig. S8a needs improvement. It was not possible to clearly see the stated effect of disA deletion on secondary metabolite production in these photos.
We agree and have removed figure panel S8a from the manuscript. The quantification of total actinorhodin production shown in Figure S8b convincingly shows a significantly reduction of actinorhodin production in the cisA deletion mutant compared to the wildtype and the complement mutant.
- It is not an important point, but the paragraph in lines 109-116 appears more like a re-iteration of the Introduction than Results.
We agree. We have removed the highlighted text from the Results section and added some of the information to the introduction.
- Line 206 appears to have a typo. Should it not be WT instead of WT cisA?
Correct. This is a typo which has been fixed. Thank you.
- At the end of the Discussion, it is suggested that a stepwise mechanism of recruiting CIS to the membrane and then triggering firing would prevent unwanted activation and self-inflicted death. Since both steps appear to be dependent in DisA, it would be good to more clearly spell out how such a stepwise mechanism would work and how it could prevent spontaneous and erroneous firing of the system.
Thank you for this suggestion. We have revised the text to clarify the proposed stepwise mechanism. Based on additional structural modeling, we propose that the conserved extra-cytoplasmic domain of CisA may play a role in sensing stress signals. Binding of a ‘stress-associated molecule’ could induce a conformational change in CisA, a hypothesis supported by: (1) Foldseek protein structure searches, which suggest that the conserved C-terminal CisA domain resembles substrate/solute-binding proteins, and (2) AlphaFold3 models predicting that CisA can form a pentamer via its putative substrate-binding domain. This suggests that a transition from CisA monomers to pentamers in response to stress may serve as a key checkpoint, activating CisA and facilitating the recruitment of CIS assemblies to the membrane, either directly or indirectly. Conversely, in the absence of a stress signal, CisA is likely to remain in its monomeric (resting) form, incapable of triggering CIS firing. We have revised the discussion to explain the proposed model in more detail.
We recognize that this model poses many testable hypotheses that we currently cannot test but aim to address in the future.
Reviewer #3 (Recommendations for the authors):
There are a few concerns potentially worth addressing to strengthen the study or for future investigation.
(1) It would be worth considering moving the first part of the result ('CisA is required for CISSc contraction in situ') after presenting the structure of extended CISSc, and combining it with the last part of the result section ('CisA is essential for the cellular function of CISSc'), as both parts describe the functional characterization of CisA.
We appreciate the reviewer’s suggestion but have chosen to retain the current order of the results. As this manuscript focuses on the role of CisA, we believe that first establishing a functional link between CisA and CIS contraction provides essential context and motivation for the study.
(2) Line 169: it is not clear to me if the fusion of CisA with mCherry is functional (if it complements the native CisA). Moreover, it was not shown if its localization changes under nisin stress or in the strain with non-contractile CISSc.
We have not tested if the CisA-mCherry fusion is fully functional. While we cannot exclude the possibility that the activity of this protein fusion is compromised in vivo, we believe that the described accumulation of CisA-mCherry at the membrane is accurate. This conclusion is further supported by the results obtained from protein fractionation experiments and the membrane topology assay (Figure 3).
We did not examine if the localization of CisA-mCherry changes in CIS mutant strains under nisin-stress, but this is something we will follow up on in the future.
(3) In ref 18, the previous work from the same team presented a functional fluorescent fusion of Cis2 (sheath), thus, it will be interesting to see if (i) Cis2 localization and dynamics is affected by the absence of CisA under normal and stressed conditions; (ii) if Cis2 shows any co-localization with CisA under normal and especially stressed conditions, and potentially, its timing correlation to ghost cell formation by time-lapse imaging of both fusions.
We thank this reviewer for the suggestions, and we plan to address these questions in the future.
(4) Line 261: it was hypothesized by authors that the cytosolic portion of CisA was required for interacting with Cis11. While it was not possible to verify the direct interaction at current state, a S. coelicolor mutant lacking this cytosolic domain may be of help to indirectly test the hypothesis. Moreover, it would be interesting to see if the cytosolic region alone is enough to induce the contraction upon stress (by removing the TM-C region). If so, whether it leads to cell death, or if it is insufficient to cause cell death without membrane association despite the sheath contraction. If not, it would suggest that membrane association occurs before contraction.
These are really great suggestions and if we had the manpower and resources, we would have performed these experiments. We plan to follow up on these questions in the future.
However, additional structural modelling of CisA indicates that CisA may exist in different configurations (see response to Reviewer #1 and #2), a monomeric and/or a pentameric configuration. In these structural models (revised Figure 3), CisA oligomerization is mediated by the annotated periplasmic solute-binding domain. It is conceivable that CisA oligomerization (e.g. in response to a stress signal) presents a critical checkpoint that results in a conformational change within CisA monomers that subsequently drives CisA oligomerization into a configuration primed to interact with CIS particles. We would therefore speculate that the expression of just the cytoplasmic CisA domain may not be sufficient for CIS contraction and cell death.
(5) Line 263: as it was not possible to express full-length cisA in E. coli, making it difficult to assess the interaction between CisA and Cis11, it may be worth considering expressing the cytosolic portion of CisA (ΔTM-C) instead of full-length CisA, or alternatively performing a co-immunoprecipitation assay of CisA (i.e., with an affinity tag) from S. coelicolor cultures under stressed conditions. However, I am aware that these may be beyond the scope of this work but can be considered for future investigation in general.
Thank you for your suggestions and your understanding that some of this work is beyond the scope of this work. We have performed CisA-FLAG co-immunoprecipitation experiments from S. coelicolor cultures that were treated with nisin for 0/15/45 min. However, mass spectrometry analysis of co-eluted peptides did not show the presence of CIS-associated peptides at the analysed timepoints. While we cannot exclude technical issues with our assays that resulted in an inefficient solubilization of CisA from Streptomyces membranes, an alternative hypothesis is that the interaction between CIS particles and CisA is very transient and therefore difficult to capture. We would like to mention, however, that we did detect CisA peptides in crude purifications of CIS particles from nisin-stressed cells (Supplementary Table 2, manuscript: line 301/302), supporting our proposed model that CisA can associate with CIS particles in vivo.
Minor points:
(1) I will suggest moving Supplementary Fig 2d with control quantification of WT strain and complementation strain (similar to Fig 3g from ref 18) to the main Fig 1, as the quantitative representation with better comparison without going back and forth to ref 18.
Thank you for your suggestion. Instead of moving Supplementary Fig. 2d to the main figure, we have added additional information in lines 106–110 to discuss the previous quantification of CIS assembly states in the WT, as described in our earlier work. We believe this approach allows readers to easily reference our established quantification without compromising the flow of the main figures.
(2) Line 52/785: as work of Ref 12 has recently been published DOI: 10.1126/sciadv.adp7088, the reference should be updated accordingly.
This reference has been updated. Thank you.
(3) A brief description of key differences between contracted (ref 18) and extended sheath structure will be a good addition for a broader audience.
Thank you for this suggestion. We have added more information on lines 178–180.
(4) Fig 3d: it is not clear how well the samples from different fractions were normalized in amount (volume and cell density), but there was an inconsistency in the amount of CisA-Flag in lysate, vs. soluble and membrane fractions (total protein amount combined from soluble fraction and membrane fraction together seemed to be more than in the lysate, while in theory it should be more or less equal; and the amount of WhiA from WT seemed to be less than from the CisA-Flag strain). In the method section, it was mentioned that 'The final pellet was dissolved in 1/10 of the initial volume with wash buffer (no urea). Equi-volume amounts of fractions were mixed with 2x SDS sample buffer and analyzed by immunoblotting.' But it is still not clear whether equivalent amounts (normalized to the same OD for example) were used and if we could directly compare. A brief clarification in the legend of how samples were prepared is needed.
The samples were normalized by first using the same volume of starting material (similar culture density and incubation period for each strain) and by loading equal volumes of each fraction for analysis. After fractionation, equi-volume amounts of the soluble and membrane protein fractions were mixed with 2× SDS sample buffer and subjected to immunoblotting, ensuring a consistent basis for comparison between samples. We have revised the figure legend and Material and Method sections to make this clear.
We agree that the amount of CisA-3xFLAG appears slightly lower in the “Lysate” fraction compared to the “Membrane” fraction in Figure 3d (now Fig. 3f). However, this does not affect the overall conclusion of this experiment, showing that CisA-3xFLAG is clearly enriched in the membrane fraction.
For reference, please find below the uncropped version of this Western blot image. Based on the signal of the unspecific bands, we would like to argue that equal amounts of samples obtained from the WT control strain (no FLAG epitope present) and a strain producing CisA-3xFLAG were loaded for each of the fractions. When we revisited this data, we noted that the protein size marker was wrong. This has been fixed.
Author response image 1.
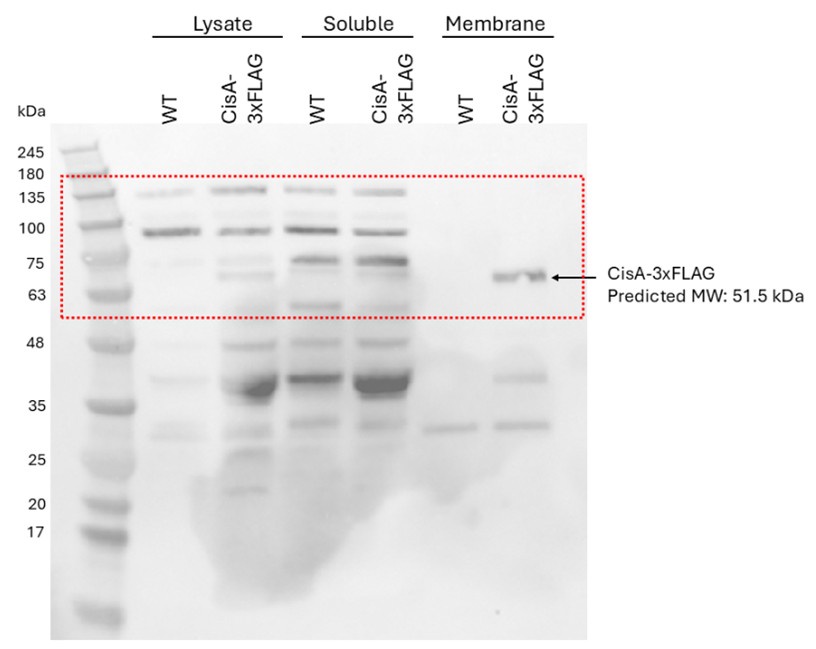
(5) Fig. 4f: statistical analysis is missing.
The missing statistical analysis has been added to this figure and figure legend.
Author Response
The following is the authors’ response to the original reviews.
eLife assessment
This study, utilizing CITE-Seq to explore CML, is considered a useful contribution to our understanding of treatment response. However, the reviewers express concern about the incomplete evidence due to the small sample size and recommend addressing these limitations. Strengthening the study with additional patient samples and validation measures would enhance its significance.
We thank the editors for the assessment of our manuscript. In view of the comments of the three reviewers, we have increased the number of CML patient samples analyzed to confirm all the major findings included in the manuscript. In total, more than 80 patient samples across different approaches have now been analyzed and incorporated in the revised manuscript.
To the best of our knowledge, this is the first single cell multiomics report in CML and differs substantially from the recent single cell omics-based reports where single modalities were measured one at a time (Krishnan et al., 2023; Patel et al., 2022). Thus, the sc-multiomic investigation of LSCs and HSCs from the same patient addresses a major gap in the field towards managing efficacy and toxicity of TKI treatment by enumerating CD26+CD35- LSCs and CD26-CD35+ HSCs burden and their ratio at diagnosis vs. 3 months of therapy. The findings suggest design of a simpler and cheaper FACS assay to simultaneously stratify CML patients for TKI efficacy as well as hematologic toxicity.
Reviewer 1:
Summary:
This manuscript by Warfvinge et al. reports the results of CITE-seq to generate singlecell multi-omics maps from BM CD34+ and CD34+CD38- cells from nine CML patients at diagnosis. Patients were retrospectively stratified by molecular response after 12 months of TKI therapy using European Leukemia Net (ELN) recommendations. They demonstrate heterogeneity of stem and progenitor cell composition at diagnosis, and show that compared to optimal responders, patients with treatment failure after 12 months of therapy demonstrate increased frequency of molecularly defined primitive cells at diagnosis. These results were validated by deconvolution of an independent previously published dataset of bulk transcriptomes from 59 CML patients. They further applied a BCR-ABL-associated gene signature to classify primitive Lin-CD34+CD38- stem cells as BCR:ABL+ and BCR:ABL-. They identified variability in the ratio of leukemic to non-leukemic primitive cells between patients, showed differences in the expression of cell surface markers, and determined that a combination of CD26 and CD35 cell surface markers could be used to prospectively isolate the two populations. The relative proportion of CD26-CD35+ (BCR:ABL-) primitive stem cells was higher in optimal responders compared to treatment failures, both at diagnosis and following 3 months of TKI therapy.
Strengths:
The studies are carefully conducted and the results are very clearly presented. The data generated will be a valuable resource for further studies. The strengths of this study are the application of single-cell multi-omics using CITE-Seq to study individual variations in stem and progenitor clusters at diagnosis that are associated with good versus poor outcomes in response to TKI treatment. These results were confirmed by deconvolution of a historical bulk RNAseq data set. Moreover, they are also consistent with a recent report from Krishnan et al. and are a useful confirmation of those results. The major new contribution of this study is the use of gene expression profiles to distinguish BCRABL+ and BCR-ABL- populations within CML primitive stem cell clusters and then applying antibody-derived tag (ADT) data to define molecularly identified BCR:ABL+ and BCR-ABL- primitive cells by expression of surface markers. This approach allowed them to show an association between the ratio of BCR-ABL+ vs BCR-ABL- primitive cells and TKI response and study dynamic changes in these populations following short-term TKI treatment.
Weaknesses:
One of the limitations of the study is the small number of samples employed, which is insufficient to make associations with outcomes with confidence. Although the authors discuss the potential heterogeneity of primitive stem, they do not directly address the heterogeneity of hematopoietic potential or response to TKI treatment in the results presented. Another limitation is that the BCR-ABL + versus BCR-ABL- status of cells was not confirmed by direct sequencing for BCR-ABL. The BCR-ABL status of cells sorted based on CD26 and CD35 was evaluated in only two samples. We also note that the surface markers identified were previously reported by the same authors using different single-cell approaches, which limits the novelty of the findings. It will be important to determine whether the GEP and surface markers identified here are able to distinguish BCR-ABL+ and BCR-ABL- primitive stem cells later in the course of TKI treatment. Finally, although the authors do describe differential gene expression between CML and normal, BCR:ABL+ and BCR:ABL-, primitive stem cells they have not as yet taken the opportunity to use these findings to address questions regarding biological mechanisms related to CML LSC that impact on TKI response and outcomes.
Reviewer #1 (Recommendations For The Authors):
Minor comment: Fig 4 legend -E and F should be C and D.
We thank the reviewer for positive assessment of our work. Here, we highlight the updates in the revised manuscript considering the feedback received.
Minor comment: Fig 4 legend -E and F should be C and D.
We have edited the revised manuscript accordingly
One of the limitations of the study is the small number of samples employed, which is insufficient to make associations with outcomes with confidence.
Although we performed CITE-seq for 9 CML patient samples at diagnosis, we extended our investigations to include additional samples (e.g., largescale deconvolution analysis of samples, Fig 3 C-E, qPCR for BCR::ABL1 status, Fig. 6A, and the ratio between CD35+ and CD26+ populations at diagnosis and during TKI therapy, Fig. 6C-D) as described in the manuscript.
In comparison to a scRNA-seq, multiomic CITE-seq involves preparation and sequencing of separate libraries corresponding to RNA and ADTs thereby being even more resource demanding limiting our capacity to process an extensive number of patient samples. To confirm our findings in a larger cohort we have therefore adopted a computational deconvolution approach, CIBERSORT to analyze a larger number of independent samples (n=59). This reflects a growing, sustainable trend to study larger number of patients in face of still prohibitively expensive but potentially insightful scomics approaches (For example, please see Zeng et al, A cellular hierarchy framework for understanding heterogeneity and predicting drug response in acute myeloid leukemia, Nature Medicine, 2022).
However, in view of the comment, we have now substantially increased the number of analyzed patients in the revised manuscript. These include increased number of patient samples to investigate the ratio between CD35 and CD26 marked populations at diagnosis, and 3 months of TKI therapy (from n=8 to n=12 with now 6 optimal responders and 5 treatment failure at diagnosis and after TKI therapy), qPCR for BCR::ABL1 expression status at diagnosis (from n=3 to n=9) , and followed up the BCR::ABL1 expression in three additional samples after TKI therapy. Moreover, we examined the CD26 and CD35 marked populations for expression of GAS2, one of our top candidate LSC signature genes in three additional samples at diagnosis and at 3m follow up. Thus, >80 patient samples across different approaches have been analyzed to strengthen all major conclusions of the study.
We emphasize that we were cautious in generalizing the observation obtained from any one approach and sought to confirm any major finding using at least one complementary method. As an example, although CITE-seq (n=9) showed altered frequency of all cell clusters between optimal and poor responders (Fig. 3B), we refrained from generalizing because our independent large-scale computational deconvolution analysis (n=59) only substantiated the altered proportion of primitive and myeloid cell clusters (Fig. 3E).
Although the authors discuss the potential heterogeneity of primitive stem, they do not directly address the heterogeneity of hematopoietic potential or response to TKI treatment in the results presented.
Thanks for noting the discussion on heterogeneity of the primitive stem cells. As described in the original manuscript, the figure 6 D-E showed a relationship between heterogeneity and TKI therapy response. The results showed that CD35+/CD26+ ratio within the HSC fraction associated with this therapy response. We have now increased the number of patient samples analyzed and present the updated results in the revised manuscript (now figure 6 C-D). These observations set the stage for assessing whether long term therapy outcome can also be influenced by heterogeneity at diagnosis.
We have shown the hematopoietic potential of HSCs marked by CD35 expression in an independent parallel study and therefore only mentioned it concisely in the current manuscript. A combination of scRNA-seq, scATAC-seq and cell surface proteomics showed CD35+ cells at the apex of healthy human hematopoiesis, containing an HSCspecific epigenetic signature and molecular program, as well as possessing self-renewal capacity and multilineage reconstitution in vivo and vitro. The preprint is available as Sommarin et al. ‘Single-cell multiomics reveals distinct cell states at the top of the human hematopoietic hierarchy’, Biorxiv; https://www.biorxiv.org/content/10.1101/2021.04.01.437998v2.full
We also note that the surface markers identified were previously reported by the same authors using different single-cell approaches, which limits the novelty of the findings.
Our current manuscript is indeed a continuation of and builds onto our previous paper (Warfvinge R et al. Blood, 2017). In contrast to our previous report which was limited to examination of only 96 genes per cell, CITE-seq allowed us to examine the molecular program of cells using unbiased global gene expression profiling. Finally, although CD26 appears, once again as a reliable marker of BCR::ABL1+ primitive cells, CD35 emerges as a novel and previously undescribed marker of BCR::ABL1- residual stem cells. A combination of CD35 and CD26 allowed us to efficiently distinguish between the two populations housed within the Lin-34+38/low stem cell immunophenotype.
Another limitation is that the BCR-ABL + versus BCR-ABL- status of cells was not confirmed by direct sequencing for BCR-ABL. The BCR-ABL status of cells sorted based on CD26 and CD35 was evaluated in only two samples
Single cell detection of fusion transcripts is challenging with low detection sensitivity in single cell RNA-seq as has been noted previously (Krishnan et al. Blood, 2023, Giustacchini et al. Nature Medicine, 2017, Rodriguez-Meira et al. Molecular Cell, 2019). However, this is likely to change with the inclusion of targetspecific probes in scRNA-seq library preparation protocols. Nonetheless, in view of the comment, we have included more patient samples (from the previous n=3 to current n=10 (including TKI treated samples) for direct assessment of BCR-ABL1 status by qPCR analysis; the updated results are included in the revised manuscript (Figure 6A).
It will be important to determine whether the GEP and surface markers identified here are able to distinguish BCR-ABL+ and BCR-ABL- primitive stem cells later in the course of TKI treatment.
We performed qPCR to check for BCR::ABL1 status, and the level of GAS2, one of the top genes expressed in CML cells within CD26+ and CD35+ cells at diagnosis and following 3 months of TKI therapy. The results showed that while CD26+ are BCR::ABL1+, the CD35+ cells are BCR::ABL1- at both time points. Moreover, the expression of LSC-specific gene, GAS2 was specific to BCR::ABL1+ CD26+ cells at both diagnosis as well as following 3 months of TKI therapy. The new results are presented in figure 6B in the revised manuscript.
Finally, although the authors do describe differential gene expression between CML and normal, BCR:ABL+ and BCR:ABL-, primitive stem cells they have not as yet taken the opportunity to use these findings to address questions regarding biological mechanisms related to CML LSC that impact on TKI response and outcomes.
We agree with the reviewer that our major focus here was to characterize the cellular heterogeneity coupled to treatment outcome and therefore we did not delve deep into the molecular mechanisms underlying TKI response. However, in response to this comment, as mentioned above, we noted that one of the top genes in BCR::ABL1 cells (Fig. 4 C; right; in red), GAS2 (Growth Specific Arrest 2) was expressed at both diagnosis and TKI therapy within CD26+ cells relative to CD35+ cells (updated figure 6B). Interestingly, GAS2 was also detected in CML LSCs in a recent scRNA-seq study (Krishnan et al. Blood, 2023) suggesting GAS2 upregulation could be a consistent molecular feature of CML cells. GAS2 has been previously noted as deregulated in CML (Janssen JJ et al. Leukemia, 2005, Radich J et al, PNAS, 2006), control of cell cycle, apoptosis, and response to Imatinib (Zhou et al. PLoS One, 2014). Future investigations are warranted to assess whether GAS2 could play a role in the outcome of long-term TKI therapy.
Reviewer 2:
Summary:
The authors use single-cell "multi-comics" to study clonal heterogeneity in chronic myeloid leukemia (CML) and its impact on treatment response and resistance. Their main results suggest 1) Cell compartments and gene expression signatures both shared in CML cells (versus normal), yet 2) some heterogeneity of multiomic mapping correlated with ELN treatment response; 3) further definition of s unique combination of CD26 and CD35 surface markers associated with gene expression defined BCR::ABL1+ LSCs and BCR::ABL1- HSCs. The manuscript is well-written, and the method and figures are clear and informative. The results fit the expanding view of cancer and its therapy as a complex Darwinian exercise of clonal heterogeneity and the selective pressures of treatments.
Strengths:
Cutting-edge technology by one of the expert groups of single-cell 'comics.
Weaknesses:
Very small sample sizes, without a validation set. The obvious main problem with the study is that an enormous amount of results and conjecture arise from a very small data set: only nine cases for the treatment response section (three in each of the ELN categories), only two normal marrows, and only two patient cases for the division kinetic studies. Thus, it is very difficult to know the "noise" in the system - the stability of clusters and gene expression and the normal variation one might expect, versus patterns that may be reproducibly study artifact, effects of gene expression from freezing-thawing, time on the bench, antibody labeling, etc. This is not so much a criticism as a statement of reality: these elegant experiments are difficult, timeconsuming, and very expensive. Thus in the Discussion, it would be helpful for the authors to just frankly lay out these limitations for the reader to consider. Also in the Discussion, it would be interesting for the authors to consider what's next: what type of validation would be needed to make these studies translatable to the clinic? Is there a clever way to use these data to design a faster/cheaper assay?
We thank the reviewer for appraisal of our manuscript. We take the opportunity to point out the updates in the revised manuscript in view of the comments.
Very small sample sizes, without a validation set. The obvious main problem with the study is that an enormous amount of results and conjecture arise from a very small data set: only nine cases for the treatment response section (three in each of the ELN categories), only two normal marrows, and only two patient cases for the division kinetic studies.
As the reviewer has noted the single cell omics experiments remain resource demanding thereby placing a limitation on the number of patients analyzed. As described above in response to the comments from reviewer 1, multiomic CITE-seq allows extraction of two modalities in comparison to a typical scRNA-seq, however, this also makes it even more limited in the number of samples processed in a sustainable way. This was one of the motivations to analyze a larger number of independent samples (n=59) while benefiting from the insights gained from CITE-seq (n=9). Furthermore, by analyzing CD34+ cells from bone marrow and peripheral blood of CML patients, including both responders and non-responders after one year of Imatinib therapy, we were able to significantly diversity the patient pool, which was lacking in our CITE-seq patient pool. As mentioned above, this reflects a growing trend to analyze larger number of patients while anchoring the analysis on prohibitively expensive but potentially insightful sc-omics approaches (For example, please see Zeng et al, A cellular hierarchy framework for understanding heterogeneity and predicting drug response in acute myeloid leukemia, Nature Medicine, 2022).
As emphasized above, we frequently sought to confirm the findings from one approach using a complementary method and independent samples. For example, although CITE-seq (n=9) showed altered frequency of all cell clusters between optimal and poor responders (Fig. 3B), we refrained from generalizing because an independent largescale computational deconvolution analysis (n=59) only substantiated the altered proportion of primitive and myeloid clusters.
In view of the comment, we have now increased the number of patients analyzed during the revision process. These include increased numbers to investigate the ratio between CD35+ and CD26+ populations at diagnosis, as well as 3 months of TKI therapy, qPCR for BCR::ABL1, and patients examined for GAS2, one of the top genes expressed in CML cells (see response to reviewer 1 for details). Altogether, >80 patient samples across different approaches were analyzed to strengthen the conclusions.
During the revision, we have analyzed cells from 8 CML patients for cell cycle using gene activity scores. This is in addition to the cell division kinetics data reported previously are now together described in the supplementary figures 9C-F.
It is very difficult to know the "noise" in the system - the stability of clusters and gene expression and the normal variation one might expect, versus patterns that may be reproducibly study artifact, effects of gene expression from freezing-thawing, time on the bench, antibody labeling, etc. This is not so much a criticism as a statement of reality: these elegant experiments are difficult, time-consuming, and very expensive. Thus in the Discussion, it would be helpful for the authors to just frankly lay out these limitations for the reader to consider.
We agree with the reviewer that sc-omics approaches can be noisy despite continuing efforts to denoise single cell datasets through both experimental and bioinformatic innovations. Therefore, we have updated the discussion as recommended by the reviewer (paragraph 5 in the discussion).
We also note that CITE-seq, in contrast to scRNA-seq alone provides dual features: surface marker/protein as well as RNA for annotating the same cluster. In our manuscript, for example, cell clusters in UMAP for normal BM; Fig 1B were described using both surface markers (Fig. 1C) and RNA (Fig. 1D) making the cluster identity robust. To further elaborate this approach, a new supplementary figure 1C shows annotations of clusters using both RNA and surface markers.
To potentially address the issue of stability of clusters and gene expression, we compared the marker genes for major clusters from nBM from this study (supplementary table 4, Warfvinge et al.) with those described recently in a scRNA-seq study by Krishnan et al. supplementary table 8, Blood, 2023 using Cell Radar, a tool that identifies and visualizes which hematopoietic cell types are enriched within a given gene set (description: https://github.com/KarlssonG/cellradar
Direct link: https://karlssong.github.io/cellradar/). To compare, we used our in-house gene list for the major clusters as well as mapped the same number of top marker genes based on log2FC from corresponding cluster from Krishnan et al. as inputs to Cell Radar. The Cell Radar plot outputs are shown below.
Author response image 1.
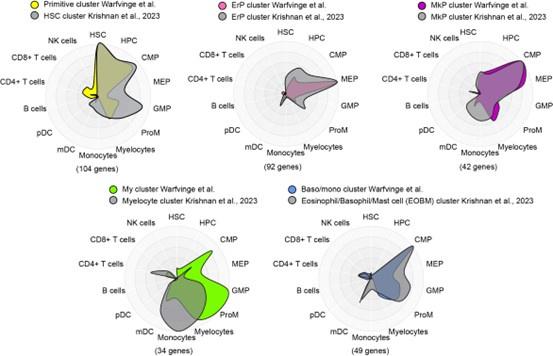
This approach showed broad similarities across clusters from this study with their counterparts from the other study suggesting the cluster identities reported here are likely to be robust. Please note these figures are for reviewer response only and not included in the final manuscript.
Also in the Discussion, it would be interesting for the authors to consider what's next: what type of validation would be needed to make these studies translatable to the clinic? Is there a clever way to use these data to design a faster/cheaper assay?
Our findings on CD26+ and CD35+ surface markers to enrich BCR::ABL1+ and BCR::ABL1- cells suggest a simpler, faster and cheaper FACS panel can possibly quantify leukemic and non-leukemic stem cells in CML patients. We anticipate that future investigations, clinical studies might examine whether CD26CD35+ cells could be plausible candidates for restoring normal hematopoiesis once the TKI therapy diminishes the leukemic load, and whether patients with low counts of CD35+ cells at diagnosis have a relatively higher chance of developing hematologic toxicity such as cytopenia during therapy.
We briefly mentioned this possibility in the discussion; however, we have now moved it to another paragraph to highlight the same. Please see paragraph 5 in the revised manuscript.
Reviewer 3:
Summary:
In this study, Warfvinge and colleagues use CITE-seq to interrogate how CML stem cells change between diagnosis and after one year of TKI therapy. This provides important insight into why some CML patients are "optimal responders" to TKI therapy while others experience treatment failure. CITE-seq in CML patients revealed several important findings. First, substantial cellular heterogeneity was observed at diagnosis, suggesting that this is a hallmark of CML. Further, patients who experienced treatment failure demonstrated increased numbers of primitive cells at diagnosis compared to optimal responders. This finding was validated in a bulk gene expression dataset from 59 CML patients, in which it was shown that the proportion of primitive cells versus lineage-primed cells correlates to treatment outcome. Even more importantly, because CITE-seq quantifies cell surface protein in addition to gene expression data, the authors were able to identify that BCR/ABL+ and BCR/ABL- CML stem cells express distinct cell surface markers (CD26+/CD35- and CD26-/CD35+, respectively). In optimal responders, BCR/ABL- CD26-/CD35+ CML stem cells were predominant, while the opposite was true in patients with treatment failure. Together, these findings represent a critical step forward for the CML field and may allow more informed development of CML therapies, as well as the ability to predict patient outcomes prior to treatment.
Strengths:
This is an important, beautifully written, well-referenced study that represents a fundamental advance in the CML field. The data are clean and compelling, demonstrating convincingly that optimal responders and patients with treatment failure display significant differences in the proportion of primitive cells at diagnosis, and the ratio of BCR-ABL+ versus negative LSCs. The finding that BCR/ABL+ versus negative LSCs display distinct surface markers is also key and will allow for a more detailed interrogation of these cell populations at a molecular level.
Weaknesses:
CITE-seq was performed in only 9 CML patient samples and 2 healthy donors. Additional samples would greatly strengthen the very interesting and notable findings.
Reviewer #3 (Recommendations For The Authors):
My only recommendation is to bolster findings with additional CML and healthy donor samples.
CITE-seq was performed in only 9 CML patient samples and 2 healthy donors. Additional samples would greatly strengthen the very interesting and notable findings.
We thank the reviewer for the positive assessment of our manuscript. As mentioned in response to comments from reviewer 1 and 2, CITE-seq remains an reource consuming single cell method potentially limiting the number of patients to be analyzed. However, during the revision process, we have increased the number of patient material analyzed for other assays; these include increased number to investigate the ratio between CD35+ and CD26+ populations at diagnosis, and 3 months of TKI therapy, qPCR for BCR::ABL1, and patients examined for GAS2, one of the top genes expressed in CML cells. Thus, >80 patient samples across different assays have been analyzed to strengthen the conclusions. (Please see comment to reviewer 1 for more details)
Author Response
The following is the authors’ response to the original reviews.
eLife assessment
This important study elucidates the molecular divergence of caspase 3 and 7 in the vertebrate lineage. Convincing biochemical and mutational data provide evidence that in humans, caspase 7 has lost the ability to cleave gasdermin E due to changes in a key residue, S234. However, the physiological relevance of the findings is incomplete and requires further experimental work.
Public Reviews:
Reviewer #1 (Public Review):
Summary
In this study, Xu et al. provide insights into the substrate divergence of CASP3 and CASP7 for GSDME cleavage and activation during vertebrate evolution vertebrates. Using biochemical assays, domain swapping, site-directed mutagenesis, and bioinformatics tools, the authors demonstrate that the human GSDME C-terminal region and the S234 residue of human CASP7 are the key determinants that impede the cleavage of human GSDME by human CASP7.
Strengths
The authors made an important contribution to the field by demonstrating how human CASP7 has functionally diverged to lose the ability to cleave GSDME and showing that reverse-mutations in CASP7 can restore GSDME cleavage. The use of multiple methods to support their conclusions strengthens the authors' findings. The unbiased mutagenesis screen performed to identify S234 in huCASP7 as the determinant of its GSDME cleavability is also a strength.
Weaknesses
While the authors utilized an in-depth experimental setup to understand the CASP7-mediated GSDME cleavage across evolution, the physiological relevance of their findings are not assessed in detail. Additional methodology information should also be provided.
Specific recommendations for the authors
(1) The authors should expand their evaluation of the physiological relevance by assessing GSDME cleavage by the human CASP7 S234N mutant in response to triggers such as etoposide or VSV, which are known to induce CASP3 to cleave GSDME (PMID: 28045099). The authors could also test whether the human CASP7 S234N mutation affects substrate preference beyond human GSDME by testing cleavage of mouse GSDME and other CASP3 and CASP7 substrates in this mutant.
(1) The physiological relevance was discussed in the revised manuscript (lines 328-340). Our study revealed the molecular mechanism underlying the divergence of CASP3- and CASP7-mediated GSDME activation in vertebrate. One of the physiological consequences is that in humans, CASP7 no longer directly participates in GSDME-mediated cell death, which enables CASP7 to be engaged in other cellular processes. Another physiological consequence is that GSDME activation is limited to CASP3 cleavage, thus restricting GSDME activity to situations more specific, such as that inducing CASP3 activation. The divergence and specialization of the physiological functions of different CASPs are consistent with and possibly conducive to the development of refined regulations of the sophisticated human GSDM pathways, which are executed by multiple GSDM members (A , B, C, D, and E), rather than by GSDME solely in teleost, such as Takifugu. More physiological consequences of CASP3/7 divergence in GSDME activation need to be explored in future studies.
With respect to the reviewer’s suggestion of assessing GSDME cleavage by the human CASP7 S234N mutant in response to triggers such as etoposide or VSV: (i) CASP7 S234N is a creation of our study, not a natural human product, hence its response to CASP7 triggers cannot happen under normal physiological conditions except in the case of application, such as medical application, which is not the aim of our study. (ii) CASP3/7 activators (such as raptinal) induced robust activation of the endogenous CASP3 (Heimer et al., Cell Death Dis. 2019;10:556) and CASP7 (Author response image 1, below) in human cells. Since CASP3 is the natural activator of GSDME, the presence of the triggers inevitably activates GSDME via CASP3. Hence, under this condition, it will be difficult to examine the effect of CASP7 S234N.
Author response image 1.
HsCASP7 activation by raptinal. HEK293T cells were transfected with the empty vector (-), or the vector expressing HsCASP7 or HsCASP7-S234N for 24 h. The cells were then treated with or without (control) 5 μM raptinal for 4 h. The cells were lysed, and the lysates were blotted with anti-CASP7 antibody.
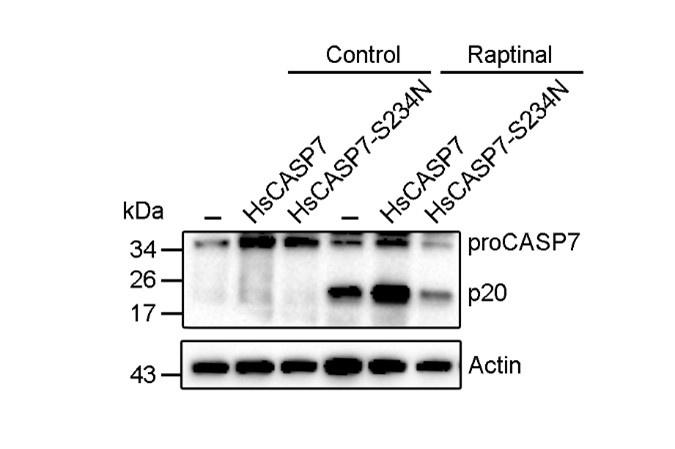
(2) As suggested by the reviewer, the cleavage of other CASP7 substrates, i.e., poly (ADP-ribose) polymerase 1 (PARP1) and gelsolin, by HsCASP7 and S234N mutant was determined. The results showed that HsCASP7 and HsCASP7-S234N exhibited similar cleavage capacities. Figure 5-figure supplement 1 and lines 212-214.
(2) It would also be interesting to examine the GSDME structure in different species to gain insight into the nature of mouse GSDME, which cannot be cleaved by either mouse or human CASP7.
Because the three-dimensional structure of GSDME is not solved, we are unable to explore the structural mechanism underlying the GSDME cleavage by caspase. Since our results showed that the C-terminal domain was essential for caspase-mediated cleavage of GSDME, it is likely that the C-terminal domain of mouse GSDME may possess some specific features that render it to resist mouse and human CASP7.
(3) The evolutionary analysis does not explain why mammalian CASP7 evolved independently to acquire an amino acid change (N234 to S234) in the substrate-binding motif. Since it is difficult to experimentally identify why a functional divergence occurs, it would be beneficial for the authors to speculate on how CASP7 may have acquired functional divergence in mammals; potentially this occurred because of functional redundancies in cell death pathways, for example.
According to the reviewer’s suggestion, a speculation was added. Lines 328-340.
(4) For the recombinant proteins produced for these analyses, it would be helpful to know whether size-exclusion chromatography was used to purify these proteins and whether these purified proteins are soluble. Additionally, the SDS-PAGE in Figure S1B and C show multiple bands for recombinant mutants of TrCASP7 and HsCASP7. Performing protein ID to confirm that the detected bands belong to the respective proteins would be beneficial.
The recombinant proteins in this study are soluble and purified by Ni-NTA affinity chromatography. Size-exclusion chromatography was not used in protein purification.
For the SDS-PAGE in Figure 4-figure supplement 1B and C (Figure S1B and C in the previous submission), the multiple bands are most likely due to the activation cleavage of the TrCASP7 and HsCASP7 variants, which can result in multiple bands, including p10 and p20. According to the reviewer’s suggestion, the cleaved p10 was verified by immunoblotting. Figure 4-figure supplement 1B and C.
(5) For Figures 3C and 4A, it would be helpful to mention what parameters or PDB files were used to attribute these secondary structural features to the proteins. In particular, in Figure 3C, residues 261-266 are displayed as a β-strand; however, the well-known α-model represents this region as a loop. Providing the parameters used for these callouts could explain this difference.
For Figure 3C, in the revised manuscript, we used the structure of mouse GSDMA3 (PDB: 5b5r) for the structural analysis of HsGSDME. As indicated by the reviewer, the region of 261-266 is a loop. The description was revised in lines 172 and 174, Figure 3C and Figure 3C legend.
For Figure 4A, the alignment of CASP7 was constructed by using Esprit (https://espript.ibcp.fr/ESPript/cgi-bin/ESPript.cgi) with human CASP7 (PDB:1k86) as the template. The description was revised in the Figure legend.
(6) Were divergent sequences selected for the sequence alignment analyses (particularly in Figure 6A)? The selection of sequences can directly influence the outcome of the amino acid residues in each position, and using diverse sequences can reduce the impact of the number of sequences on the LOGO in each phylogenetic group.
In Figure 6A, the sequences were selected without bias. For Mammalia, 45 CASP3 and 43 CASP7 were selected; for Aves, 41 CASP3 and 52 CASP7 were selected; for Reptilia, 31CASP3 and 39 CASP7 were selected; for Amphibia, 11 CASP3 and 12 CASP7 were selected; for Osteichthyes, 40 CASP3 and 43 CASP7 were selected. The sequence information was shown in Table 1 and Table 2.
(7) For clarity, it would help if the authors provided additional rationale for the selection of residues for mutagenesis, such as selecting Q276, D278, and H283 as exosite residues, when the CASP7 PDB structures (4jr2, 3ibf, and 1k86) suggest that these residues are enriched with loop elements rather than the β sheets expected to facilitate substrate recognition in exosites for caspases (PMID: 32109412). It is possible that the inability to form β-sheets around these positions might indicate the absence of an exosite in CASP7, which further supports the functional effect of the exosite mutations performed.
According to the suggestion, the rationale for the selection of residues for mutagenesis was added (lines 216-222). Unlike the exosite in HsCASP1/4, which is located in a β sheet, the Q276, D278, and H283 of HsCASP7 are located in a loop region (Figure 5-figure supplement 2), which may explain the mutation results and the absence of an exosite in HsCASP7 as suggested by the reviewer.
Reviewer #2 (Public Review):
The authors wanted to address the differential processing of GSDME by caspase 3 and 7, finding that while in humans GSDME is only processed by CASP3, Takifugu GSDME, and other mammalian can be processed by CASP3 and 7. This is due to a change in a residue in the human CAPS7 active site that abrogates GSDME cleavage. This phenomenon is present in humans and other primates, but not in other mammals such as cats or rodents. This study sheds light on the evolutionary changes inside CASP7, using sequences from different species. Although the study is somehow interesting and elegantly provides strong evidence of this observation, it lacks the physiological relevance of this finding, i.e. on human side, mouse side, and fish what are the consequences of CASP3/7 vs CASP3 cleavage of GSDME.
Our study revealed the molecular mechanism underlying the divergence of CASP3- and CASP7-mediated GSDME activation in vertebrate. One of the physiological consequences is that in humans, CASP7 no longer directly participates in GSDME-mediated cell death, which enables CASP7 to be engaged in other cellular processes. Another physiological consequence is that GSDME activation is limited to CASP3 cleavage, thus restricting GSDME activity to situations more specific, such as that inducing CASP3 activation. The divergence and specialization of the physiological functions of different CASPs are consistent with and possibly conducive to the development of refined regulations of the sophisticated human GSDM pathways, which are executed by multiple GSDM members (A , B, C, D, and E), rather than by GSDME solely in teleost, such as Takifugu. More physiological consequences of CASP3/7 divergence in GSDME activation need to be explored in future studies. Lines 328-340.
Fish also present a duplication of GSDME gene and Takifugu present GSDMEa and GSDMEb. It is not clear in the whole study if when referring to TrGSDME is the a or b. This should be stated in the text and discussed in the differential function of both GSDME in fish physiology (i.e. PMIDs: 34252476, 32111733 or 36685536).
The TrGSDME used in this study belongs to the GSDMEa lineage of teleost GSDME. The relevant information was added. Figure 1-figure supplement 1 and lines 119, 271, 274-276, 287 and 288.
Recommendations for the authors:
Reviewer #1 (Recommendations For The Authors):
(1) For the chimeric and truncated constructs, such as HsNT-TrCT, TrNT-HsCT, Hsp20-Trp10, Trp20-Hsp10, etc., the authors should provide a table denoting which amino acids were taken from each protein to create the fusion or truncation.
According to the reviewer’s suggestion, the information of the truncate/chimeric proteins was provided in Table 4.
(2) Both reviewers agree that functional physiological experiments are needed to increase the significance of the work. Specifically, the physiological relevance of these findings can be assessed by using western blotting to monitor GSDME cleavage by the human CASP7 S234N mutant compared with wild type CASP7 in response to triggers such as etoposide or VSV, which are known to induce CASP3 to cleave GSDME (PMID: 28045099).
Additionally, the authors can assess cell death in HEK293 cells, HEK293 cells transfected with TrGSDME, HEK293 cells expressing TrCASP3/7 plus TrGSDME, and TrCASP3/7 plus the D255R/D258A mutant. These cells can be stimulated, and pyroptosis can be assessed by using ELISA to measure the release of the cytoplasmic enzyme LDH as well as IL-1β and IL-18, and the percentage of cell death (PI+ positive cells) may also be assessed.
(1) With respect to the physiological relevance, please see the above reply to Reviewer 1’s comment of “Specific recommendations for the authors, 1”.
(2) As shown in our results (Fig. 2), co-expression of TrCASP3/7 and TrGSDME in HEK293T cells induced robust cell death without the need of any stimulation, as evidenced by LDH release and TrGSDME cleavage. In the revised manuscript, similar experiments were performed as suggested, and cell death was assessed by Sytox Green staining (Figure 2-figure supplement 3A and B) and immunoblot to detect the cleavage of both wild type and mutant TrGSDME (Figure 2-figure supplement 3C). The results confirmed the results of Figure 2.
Reviewer #2 (Recommendations For The Authors):
Abstract:
Although the authors try to summarize the principal results of this study, please rewrite the abstract section to make it easier to follow and to empathise the implications of their results.
We have modified the Abstract as suggested by the reviewer.
Introduction:
The authors do not mention anything about the implication of the inflammasome activation to get pyroptosis by GSDM cleave by inflammatory caspases. Please consider including this in the introduction section as they do in the discussion section.
The introduction was modified according to the reviewer’s suggestion. Lines 58-61.
From the results section the authors name the human GSDM as HsGSDM and the human CASP as HsCASP, maybe the author could use the same nomenclature in the introduction section. The same for the fish GSDM (Tr) and CASP.
According to the reviewer’s suggestion, the same nomenclature was used in the introduction.
Line 39. Remove the word necrotic.
“necrotic” was removed .
Line 42. Change channels by pores. In the manuscript, change channels by pores overall.
“channels” was replaced by “pores”.
Line 42: Include that: by these pores can be released the proinflammatory cytokines and if these pores are not solved then pyroptosis occurs. Please rephrase this statement.
According to the reviewer's suggestion, the sentence was rephrased. Lines 46-48.
Line 45. GSDMF is not an approved gene name, its official nomenclature is PJVK (Uniprot Q0ZLH3). Please use PJVK instead GSDMF.
GSDMF was changed to PJVK.
Line 103: Can the authors explain better the molecular determinant?
The sentence was revised, line 109.
Results:
Line 110: Reference for this statement. The reference for this statement was added in line 116.
Figure 1A, B: Concentration or units used of HsCASP?
The unit (1 U) of HsCASPs was added to the figure legend (line 661).
Line 113: Add Hs or Tr after CASP would be helpful to follow the story.
“CASP” was changed to “HsCASP”.
Fig 1D: Why the authors do not use the DMPD tetrapeptide (HsGSDME CASP3 cut site) in this assay? Comparing with the data obtained in Fig 3B the TrCASP3 activity is going to be very closer to that obtained for VEID o VDQQD in the CASP3 panel.
The purpose of Figure 1D was to determine the cleavage preference of TrCASPs. For this purpose, a series of commercially available CASP substrates were used, including DEVD, which is commonly used as a testing substrate for CASP3. Figure 3B was to compare the cleavage of HsCASP3/7 and TrCASP3/7 specifically against the motifs from TrGSDME (DAVD) and HsGSDME (DMPD).
Figure 1D and Figure 3B are different experiments and were performed under different conditions. In Figure 1D, CASP3 was incubated with the commercial substrates at 37 ℃ for 2 h, while in Figure 3B, CASP3/7 were incubated with non-commercial DAVD (motif from TrGSDME) and DMPD (motif from HsGSDME) at 37 ℃ for 30 min. More experimental details were added to Materials and Methods, lines 443 and 447.
Fig 1H: What is the concentration used of the inhibitors?
The concentration (20 μM) was added to the figure legend (line 669).
Does the Hs CASP3/7 fail to cleave the TrGSDME mutants (D255R and D258A)? the authors do not show this result so they cannot assume that HsCASP3/7 cleave that sequence (although this is to be expected).
The result of HsCASP3/7 cleavage of the TrGSDME mutants was added as Figure 1-figure supplement 2 and described in Results, line 133.
Line 132-133: Can the author specify where is placed the mCherry tag? In the N terminal or C terminal portion of the different engineered proteins?
The mCherry tag is attached to the C-terminus. Figure 2 legend (line 676).
Fig 2A: Although is quite clear, a column histogram showing the quantification is going to be helpful.
The expression of TrGSDME-FL, -NT and -CT was determined by Western blot, and the result was added as Figure 2-figure supplement 1.
Fig 2A, B, C: After how many hours of expression are the pictures taken? Can the authors show a Western blot showing that the expression of the different constructions is similar?
The time was added to Figure 2 legend and Materials and Methods (line 466). The expression of TrGSDME-FL, -NT and -CT was determined by Western blot, and the result was added as Figure 2-figure supplement 1.
Fig 2C: Another helpful assay can be to measure the YO-PRO or another small dye internalization, to complete the LDH data.
According the reviewer’s suggestion, in addition to LDH release, Sytox Green was also used to detect cell death. The result was added as Figure 2-figure supplement 2 and described in Results, line 146.
Fig 2C: In the figure y axe change LHD by LDH.
The word was corrected.
Fig 2D: Change HKE293T by HEK293T in the caption.
The word was corrected.
Fig 2G: Please add the concentration used with the two plasmids co-transfection. A Western blot showing CASP3/7 expression vs TrGSDME is missing. Is that assay after 24h? please specify better the methodology.
The concentration of plasmid used in co-transfection and the time post transfection were added to the Materials and Methods (lines 422 and 424). In addition, the expression of CASP3/7 was added to Figure 2I.
Fig 2 J, K: Change HKE293T by HEK293T in the figure caption. The concentration of the caspase inhibitors is missing. Depending on the concentration used, these inhibitors used could provoke toxicity on the cells by themselves.
The word was corrected in the figure caption. The inhibitor concentration (10 μM) was added to the figure legend (line 690).
Line 151: TrCASP3/7 instead of CASP3/7
CASP3/7 was changed to TrCASP3/7.
Fig 3A, 3B: Please add the units used of the HsCASP
The unit was added to the figure legends (lines 697).
Fig 3A: Can the authors add the SDS-PAGE to see the Nt terminal portion as has been done in Fig 1A? Maybe in a supplementary figure.
The SDS-PAGE was added as Figure 3-figure supplement 1.
Fig 3B: If the authors could add some data about the caspase activity using any other CASP such as CASP2, CASP1 to compare the activity data with CASP3 and CASP7 would be helpful.
The proteolytic activity of TrCASP1 was provided as Figure 3-figure supplement 2.
Fig 3C: To state this (Line 160), the authors should use another prediction software to reach a consensus with the sequences of the first analysis. In fact, what happens when GSDME is modelled 3-dimensionally by comparing it to crystalized structures such as mouse GSDMA? If the authors add an arrow indicating where the Nt terminal portion ends and where Ct portion begins would make the figure clearer.
According to the suggestions of both reviewers, in the revised manuscript, we used mouse GSDMA3 (PDB: 5b5r) for the structural analysis of HsGSDME, which showed that the 261-266 region of HsGSDME was a loop. As a result, Figure 3C was revised. Relevant change in Results: lines 172 and 174.
As suggested by the reviewer, we modelled the three-dimensional structure of HsGSDME by using SWISS-MODEL with mouse GSDMA3 as the template (Author response image 2, below).
Author response image 2.
The three-dimensional structure model of HsGSDME. (A) The structure of HsGSDME was modeled by using mouse GSDMA3 (MmGSDMA3) as the template. The N-terminal domain (1-246 aa) and the C-terminal domain (279-468 aa) of HsGSDME are shown in red and blue, respectively. (B) The superposed structure of HsGSDME (cyan) and MmGSDMA3 (purple).
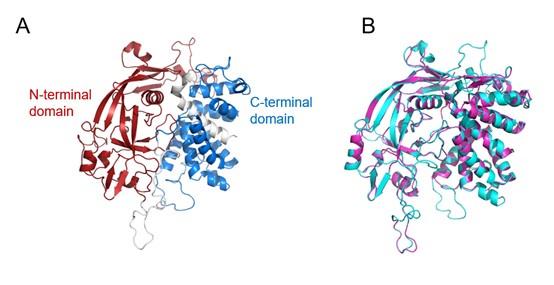
Fig 3F: if this is an immunoblotting why NT can be seen? In other Western blots only the CT is detected, why? The use of the TrGSDME mouse polyclonal needs more details (is a purify Ab, was produced for this study, what are the dilution used...)
Since the anti-TrGSDME antibody was generated using the full-length TrGSDME, it reacted with both the N-terminal and the C-terminal fragments of TrGSDME in Figure 3F. In Figure 3G, the GSDME chimera contained only TrGSDME-CT, so only the CT fragment was detected by anti-TrGSDME antibody. More information on antibody preparation and immunoblot was added to “Materials and Methods” (lines 390 and 391).
Fig 4B: Can the authors show in which amino acid the p20 finish for each CASP? (Similarly, as they have done in panel 3E)
Fig 4B was revised as suggested.
Fig 5F: With 4 units of WT CASP7 the authors show a HsGSDME Ct in the same proportion than when the S234N mutant is used (at lower concentrations). How do the authors explain this?
The result showed that the cleavage by 4U of HsCASP7 was comparable to the cleavage by 0.25U of HsCASP7-S234N, indicating that S234 mutation increased the cleavage ability of HsCASP7 by 16 folds.
Line 203: Can the authors show an alignment between this region of casp1/4 and 7? Maybe in supplementary figures.
As reported by Wang et. al (PMID: 32109412), the βIII/βIII’ sheet of CASP1/4 forms the exosite critical for GSDMD recognition. The structural comparison among HsCASP1/4/7 and the sequence alignment of HsCASP1/4 βIII/βIII’ region with its corresponding region in HsCASP7 were added as Figure 5-figure supplement 2.
Line 205: A mutation including S234N with the exosite mutations (S234+Q276W+D278E+H283S) is required to support this statement.
The sentence of “suggesting that, unlike human GSDMD, HsGSDME cleavage by CASPs probably did not involve exosite interaction” was deleted in the revised manuscript.
Fig 5I, 5J: which is the amount of HsGSDME and TrGSDME? I would place these figures in supplementary material.
The protein expression of TrGSDME/HsGSDME was shown in the figure. Fig 5I and 5J were moved to Figure 5-figure supplement 3.
Line 218: I would specify that this importance is in HUMAN CASP7 to cleavage Human GSDME.
“CASP7” and “GSDME” were changed to “HsCASP7” and “HsGSDME”, respectively.
Fig 6C: 4 units is the amount of S234N mutant needed to see an optimal HsGSDME cleavage in Fig 5F.
In Figure 6C, the cleavage efficacy of HsCASP3-N208S was apparently decreased compared to that of HsCASP3, and 4U of HsCASP3-N208S was roughly equivalent to 1U of HsCASP3 in cleavage efficacy. In Figure 5F, cleavage by 4U of HsCASP7 was comparable to the cleavage by 0.25U of HsCASP7-S234N. Together, these results confirmed the critical role of S234/N208 in HsCASP3/7 cleavage of HsGSDM.
Fig 6I: Could be the fact that the mouse GSDME has a longer Ct than human GSDME affect the interaction with CASP7? Less accessible to the cut site? Needs a positive control of mouse GSDME with mouse Caspase 3.
Although mouse GSDME (MmGSDME) (512 aa) is larger than HsGSDME (496 aa), the length of the C-terminal domain of MmGSDME (186 aa) is comparable to that of HsGSDME (190 aa).
Author response image 3.
Conserved domain analysis of mouse (upper) and human (lower) GSDME.
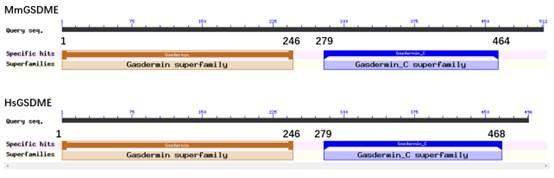
As suggested by the reviewer, the cleavage of MmGSDME by mouse caspase-3 (MmCASP3) was added as Figure 6-figure supplement 2 and described in Results, lines 258.
Material and Methods:
-Overall, concentrations or amounts used in this study regarding the active enzyme or plasmids used are missing and need to be added.
The missing concentrations of the enzymes and plasmids were added in Material and Methods (lines 421, 453, 457, and 470) or figure legends (Figure 1 and 3).
-It would be helpful if the authors label in the immunoblotting panels what is the GSDME that they are using. (Hs GSDME FL...).
As suggested, the labels were added to Figures 1A ,1B, and 3.
-Add the units of enzyme used.
The units of enzyme were added to figure legends (Figure 1A, 3A, 3D, and 3F) or Material and Methods (lines 453 and 457).
The GSDME sequence obtained for Takifugu after amplification of the RNA extracted should be shown and specified (GSDMEa or GSDMEb). From which tissue was the RNA extracted?
The details were added to Materials and Methods (lines 398 and 402).
Author Response
The following is the authors’ response to the original reviews.
Reviewer #1 (Public Review):
In this study, the authors attempt to describe alterations in gene expression, protein expression, and protein phosphorylation as a consequence of chronic adenylyl cyclase 8 overexpression in a mouse model. This model is claimed to have resilience to cardiac stress.
Major strengths of the study include 1) the large dataset generated which will have utility for further scientific inquiry for the authors and others in the field, 2) the innovative approach of using cross-analyses linking transcriptomic data to proteomic and phosphoproteomic data. One weakness is the lack of a focused question and clear relevance to human disease. These are all critical biological pathways that the authors are studying and essentially, they have compiled a database that could be surveyed to generate and test future hypotheses.
Thank you for your efforts to review our manuscript, we are delighted to learn that you found our approach to link transcriptomic, proteomic and phosphoproteome data in our analysis to be innovative. Your comment that we have not focused on a question with clear relevance to human disease is “right on point!”
During chronic pathophysiologic states e.g., chronic heart failure (CHF) in humans, AC/cAMP/PKA/Ca2+ signaling increases progressively the degree of heart failure progresses, leading to cardiac inflammation, mediated in part, by cyclic-AMP- induced up- regulation of renin-angiotensin system (RAS) signaling. Standard therapies for CHF include β-adrenoreceptor blockers and RAS inhibitors, which although effective, are suboptimal in amelioration of heart failure progression. One strategy to devise novel and better therapies for heart failure, would be to uncover the full spectrum of concentric cardio- protective adaptations that becomes activated in response to severe, chronic AC/cAMP/PKA/Ca2+ -induced cardiac stress.
We employed unbiased omics analyses, in our prior study (https://elifesciences.org/articles/80949v1) of the mouse harboring cardiac specific overexpression of adenylyl cyclase type 8 (TGAC8), and identified more than 2,000 transcripts and proteins, comprising a broad array of biological processes across multiple cellular compartments, that differed in TGAC8 left ventricle compared to WT. These bioinformatic analyses revealed that marked overexpression of AC8 engages complex, concentric adaptation "circuity" that has evolved in mammalian cells to confer resilience to stressors that threaten health or life. The main human disease category identified in these analyses was Organismal Injury and Abnormalities, suggesting that defenses against stress were activated as would be expected, in response to cardiac stress. Specific concentric signaling pathways that were enriched and activated within the TGAC8 protection circuitry included cell survival initiation, protection from apoptosis, proliferation, prevention of cardiac-myocyte hypertrophy, increased protein synthesis and quality control, increased inflammatory and immune responses, facilitation of tissue damage repair and regeneration and increased aerobic energetics. These TGAC8 stress response circuits resemble many adaptive mechanisms that occur in response to the stress of disease states and may be of biological significance to allow for proper healing in disease states such as myocardial infarction or failure of the heart. The main human cardiac diseases identified in bioinformatic analyses were multiple types cardiomyopathies, again suggesting that mechanisms that confer resilience to the stress of chronic increased AC-PKA-Ca2+ signaling are activated in the absence of heart failure in the super-performing TGAC8 heart at 3-months of age.
In the present study, we performed a comprehensive in silico analysis of transcription, translation, and post-translational patterns, seeking to discover whether the coordinated transcriptome and proteome regulation of the adaptive protective circuitry within the AC8 heart that is common to many types of cardiac disease states identified in our previous study (https://elifesciences.org/articles/80949v1) extends to the phosphoproteome.
Reviewer #2 (Public Review):
In this study, the investigators describe an unbiased phosphoproteomic analysis of cardiac-specific overexpression of adenylyl cyclase type 8 (TGAC8) mice that was then integrated with transcriptomic and proteomic data. The phosphoproteomic analysis was performed using tandem mass tag-labeling mass spectrometry of left ventricular (LV) tissue in TGAC8 and wild-type mice. The initial principal component analysis showed differences between the TGAC8 and WT groups. The integrated analysis demonstrated that many stress-response, immune, and metabolic signaling pathways were activated at transcriptional, translational, and/or post-translational levels.
The authors are to be commended for a well-conducted study with quality control steps described for the various analyses. The rationale for following up on prior transcriptomic and proteomic analyses is described. The analysis appears thorough and well-integrated with the group's prior work. Confirmational data using Western blot is provided to support their conclusions. Their findings have the potential of identifying novel pathways involved in cardiac performance and cardioprotection.
Thank you for your efforts to review our manuscript, we are delighted to learn that you found our approach to link transcriptomic, proteomic and phosphoproteome data in our analysis. We are delighted that you found our work to be well-conducted, to have been well performed, and that our analysis was thorough and well-integrated with our prior work in this arena and that are findings have the potential of identifying novel pathways involved in cardiac performance and cardioprotection.
Reviewer #1 (Recommendations For The Authors):
I humbly suggest that the authors reconsider the title, as it could be more clear as to what they are studying. Are the authors trying to highlight pathways related to cardiac resilience? Resilience might be a clearer word than "performance and protection circuitry".
Thank you for this important comment. We have revised the title accordingly: Reprogramming of cardiac phosphoproteome, proteome and transcriptome confers resilience to chronic adenylyl cyclase-driven stress.
Perhaps the text can be reviewed in detail by a copy-editor, as there are many grammatically 'awkward' elements (for example, line 56: "mammalians" instead of mammals), inappropriate colloquialisms (for example, line 73: "port-of-call"), and stylistic unevenness that make it difficult to read.
We have reviewed the text in detail, with the assistance of a copy editor, in order to identify and correct awkward elements and to search for other colloquialisms. Finally, although “stylistic unevenness” to which you refer may be difficult for us to identify during our re-edits, we have tried our best to identify and revise them.
The best-written sections are the first few paragraphs of the discussion section, which finally clarify why the TGAC8 mouse is important in understanding cardiac resilience to stress and how the present study leverages this model to disentangle the biological processes underlying the resilience. I wish this had been presented in this manner earlier in the paper, (in the abstract and introduction) so I could have had a clearer context in which to interpret the data. It would also be helpful to point out whether the TGAC8 mouse has any correlates with human disease.
Thank you for this very important comment. Well put! In addition to recasting the title to include the concept of resilience, we have revised both the abstract and introduction to feature what you consider to be important to the understanding of cardiac resilience to stress, and how the present study leverages this model to disentangle the biological processes underlying the resilience.
Reviewer #2 (Recommendations For The Authors):
- How were the cutoffs determined to distinguish between upregulated/downregulated phosphoproteins and phosphopeptides?
Thank you for this important question. We used the same criteria to distinguish differences between TGAC8 and WT for unnormalized and normalized phosphoproteins, -log10(p-value) > 1.3, and log2FoldChange <= -0.4 (down) or log2FoldChange >= 0.4 (up), as stated in the methods section, main text and figure legend. The results were consistent across all analyses and selectively verified by experiments.
- Were other models assessed for correlation between transcriptome and phosphoproteome other than a linear relationship of log2 fold change?
Thank you for this comment. In addition to a linear relationship of log2 fold change of molecule expression, we also compared protein activities, e.g., Fig 4F, and pathways enriched from different omics, e.g., Fig 3D, 5J, 6B and 6F.
- Figures 1A and 5G seem to show outliers. How many biological and technical replicates would be needed to minimize error?
Thank you for the question. Figures 1A and 5G were PCA plots which, as expected, manifested some genetic variability among the same genotypes. The PCA plots, however, are useful in determining how the identified items separated, both within and among genotypes. For bioinformatics analysis such as ours, 4-5 samples are sufficient to accomplish this, as demonstrated by separation, by genotype, of samples in PCA. Thus, in addition to discovery of true heterogeneity among the samples, our results are still able to robustly discover the true differences between the genotypes.
- Were the up/downregulated genes more likely to be lowly expressed (which would lead to larger log2 changes identified)?
In response to your query, we calculated the average expression of phosphorylation levels across all samples to observe whether they were expressed in low abundance in all samples. We also generated the MA plots, an application of a Bland–Altman plot, to create a visual representation of omics data. The MA plots in Author response image 1 illustrate that the target molecules with significantly changed phosphorylation levels did not aggregate within the very low abundance. To confirm this conclusion, we adopted two sets of cutoffs: (1) change: -log10(p-value) > 1.3, and log2FoldChange < 0 (down) or log2FoldChange > 0 (up); and (2) change_2: -log10(p-value) > 1.3, and log2FoldChange <= -0.4 (down) or log2FoldChange >= 0.4 (up).
Author response image 1.
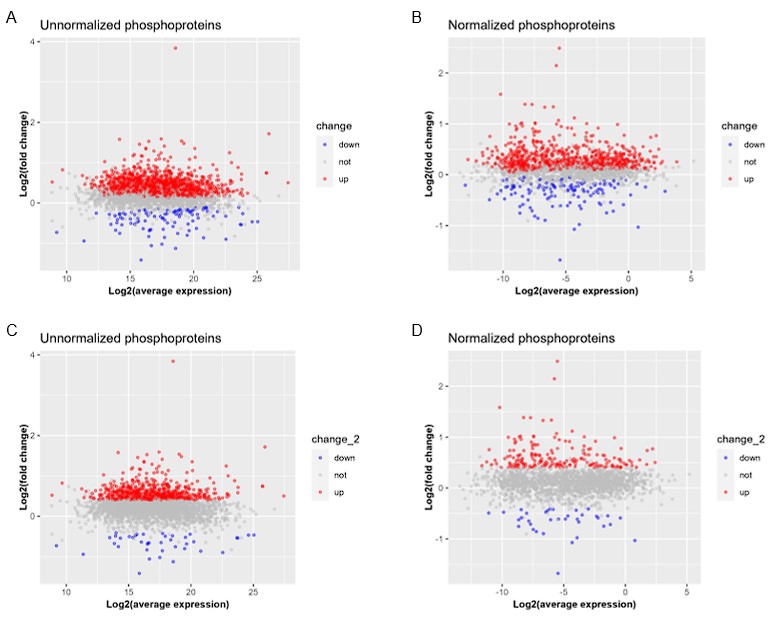
- "We verified some results through wet lab experiments" in the abstract is vague.
Thank you for the good suggestion. What we meant to indicate here was that identified genotypic differences in selected proteins, phosphoproteins and RNAs discovered in omics were verified by western blots, protein synthesis detection, proteosome activity detection, and protein soluble and insoluble fractions detection. However, we have deleted the reference to the wet lab experiments in the revised manuscript.
- There are minor syntactical errors throughout the text.
Thank you very much for the suggestion. As noted in our response, we have edited and revised those errors throughout the text.
Author response:
The following is the authors’ response to the previous reviews.
Public Reviews:
Reviewer #1 (Public Review):
Tiedje et al. investigated the transient impact of indoor residual spraying (IRS) followed by seasonal malaria chemoprevention (SMC) on the plasmodium falciparum parasite population in a high transmission setting. The parasite population was characterized by sequencing the highly variable DBL$\alpha$ tag as a proxy for var genes, a method known as varcoding. Varcoding presents a unique opportunity due to the extraordinary diversity observed as well as the extremely low overlap of repertoires between parasite strains. The authors also present a new Bayesian approach to estimating individual multiplicity of infection (MOI) from the measured DBL$\alpha$ repertoire, addressing some of the potential shortcomings of the approach that have been previously discussed. The authors also present a new epidemiological endpoint, the so-called "census population size", to evaluate the impact of interventions. This study provides a nice example of how varcoding technology can be leveraged, as well as the importance of using diverse genetic markers for characterizing populations, especially in the context of high transmission. The data are robust and clearly show the transient impact of IRS in a high transmission setting, however, some aspects of the analysis are confusing.
(1) Approaching MOI estimation with a Bayesian framework is a well-received addition to the varcoding methodology that helps to address the uncertainty associated with not knowing the true repertoire size. It's unfortunate that while the authors clearly explored the ability to estimate the population MOI distribution, they opted to use only MAP estimates. Embracing the Bayesian methodology fully would have been interesting, as the posterior distribution of population MOI could have been better explored.
We thank the reviewer for appreciating the extension of var_coding we present here. We believe the comment on maximum _a posteriori (MAP) refers to the way we obtained population-level MOI from the individual MOI estimates. We would like to note that reliance on MAP was only one of two approaches we described, although we then presented only MAP. Having calculated both, we did not observe major differences between the two, for this data set. Nonetheless, we revised the manuscript to include the result based on the mixture distribution which considers all the individual MOI distributions in the Figure supplement 6.
(2) The "census population size" endpoint has unclear utility. It is defined as the sum of MOI across measured samples, making it sensitive to the total number of samples collected and genotyped. This means that the values are not comparable outside of this study, and are only roughly comparable between strata in the context of prevalence where we understand that approximately the same number of samples were collected. In contrast, mean MOI would be insensitive to differences in sample size, why was this not explored? It's also unclear in what way this is a "census". While the sample size is certainly large, it is nowhere near a complete enumeration of the parasite population in question, as evidenced by the extremely low level of pairwise type sharing in the observed data.
We consider the quantity a census in that it is a total enumeration or count of infections in a given population sample and over a given time period. In this sense, it gives us a tangible notion of the size of the parasite population, in an ecological sense, distinct from the formal effective population size used in population genetics. Given the low overlap between var repertoires of parasites (as observed in monoclonal infections), the population size we have calculated translates to a diversity of strains or repertoires. But our focus here is in a measure of population size itself. The distinction between population size in terms of infection counts and effective population size from population genetics has been made before for pathogens (see for example Bedford et al. for the seasonal influenza virus and for the measles virus (Bedford et al., 2011)), and it is also clear in the ecological literature for non-pathogen populations (Palstra and Fraser, 2012).
We completely agree with the dependence of our quantity on sample size. We used it for comparisons across time of samples of the same depth, to describe the large population size characteristic of high transmission which persists across the IRS intervention. Of course, one would like to be able to use this quantity across studies that differ in sampling depth and the reviewer makes an insightful and useful suggestion. It is true that we can use mean MOI, and indeed there is a simple map between our population size and mean MOI (as we just need to divide or multiply by sample size, respectively) (Table supplement 7). We can go further, as with mean MOI we can presumably extrapolate to the full sample size of the host population, or to the population size of another sample in another location. What is needed for this purpose is a stable mean MOI relative to sample size. We can show that indeed in our study mean MOI is stable in that way, by subsampling to different depths our original sample (Figure supplement 8 in the revised manuscript). We now include in the revision discussion of this point, which allows an extrapolation of the census population size to the whole population of hosts in the local area.
We have also clarified the time denominator: Given the typical duration of infection, we expect our population size to be representative of a per-generation measure_._
(3) The extraordinary diversity of DBL$\alpha$ presents challenges to analyzing the data. The authors explore the variability in repertoire richness and frequency over the course of the study, noting that richness rapidly declined following IRS and later rebounded, while the frequency of rare types increased, and then later declined back to baseline levels. The authors attribute this to fundamental changes in population structure. While there may have been some changes to the population, the observed differences in richness as well as frequency before and after IRS may also be compatible with simply sampling fewer cases, and thus fewer DBL$\alpha$ sequences. The shift back to frequency and richness that is similar to pre-IRS also coincides with a similar total number of samples collected. The authors explore this to some degree with their survival analysis, demonstrating that a substantial number of rare sequences did not persist between timepoints and that rarer sequences had a higher probability of dropping out. This might also be explained by the extreme stochasticity of the highly diverse DBL$\alpha$, especially for rare sequences that are observed only once, rather than any fundamental shifts in the population structure.
We thank the reviewer raising this question which led us to consider whether the change in the number of DBLα types over the course of the study (and intervention) follows from simply sampling fewer P. falciparum cases. We interpreted this question as basically meaning that one can predict the former from the latter in a simple way, and that therefore, tracking the changes in DBLα type diversity would be unnecessary. A simple map would be for example a linear relationship (a given proportion of DBLα types lost given genomes lost), and even more trivially, a linear loss with a slope of one (same proportion). Note, however, that for such expectations, one needs to rely on some knowledge of strain structure and gene composition. In particular, we would need to assume a complete lack of overlap and no gene repeats in a given genome. We have previously shown that immune selection leads to selection for minimum overlap and distinct genes in repertoires at high transmission (see for example (He et al., 2018)) for theoretical and empirical evidence of both patterns). Also, since the size of the gene pool is very large, even random repertoires would lead to limited overlap (even though the empirical overlap is even smaller than that expected at random (Day et al., 2017)). Despite these conservators, we cannot a priori assume a pattern of complete non-overlap and distinct genes, and ignore plausible complexities introduced by the gene frequency distribution.
To examine this insightful question, we simulated the loss of a given proportion of genomes from baseline in 2012 and examined the resulting loss of DBLα types. We specifically cumulated the loss of infections in individuals until it reached a given proportion (we can do this on the basis of the estimated individual MOI values). We repeated this procedure 500 times for each proportion, as the random selection of individual infection to be removed, introduces some variation. Figure 2 below shows that the relationship is nonlinear, and that one quantity is not a simple proportion of the other. For example, the loss of half the genomes does not result in the loss of half the DBLα types.
Author response image 1.
Non-linear relationship between the loss of DBLα types and the loss of a given proportion of genomes. The graph shows that the removal of parasite genomes from the population through intervention does not lead to the loss of the same proportion of DBLα types, as the initial removal of genomes involves the loss of rare DBLα types mostly whereas common DBLα types persist until a high proportion of genomes are lost. The survey data (pink dots) used for this subsampling analysis was sampled at the end of wet/high transmission season in Oct 2012 from Bongo District from northern Ghana. We used the Bayesian formulation of the _var_coding method proposed in this work to calculate the multiplicity of infection of each isolate to further obtain the total number of genomes. The randomized surveys (black dots) were obtained based on “curveball algorithm” (Strona et al., 2014) which keep isolate lengths and type frequency distribution.
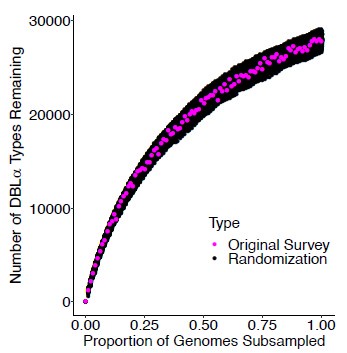
We also investigated whether the resulting pattern changed significantly if we randomized the composition of the isolates. We performed such randomization with the “curveball algorithm” (Strona et al., 2014). This algorithm randomizes the presence-absence matrix with rows corresponding to the isolates and columns, to the different DBLα types; importantly, it preserves the DBLα type frequency and the length of isolates. We generated 500 randomizations and repeated the simulated loss of genomes as above. The data presented in Figure 2 above show that the pattern is similar to that obtained for the empirical data presented in this study in Ghana. We interpret this to mean that the number of genes is so large, that the reduced overlap relative to random due to immune selection (see (Day et al., 2017)) does not play a key role in this specific pattern.
Reviewer #2 (Public Review):
In this manuscript, Tiedje and colleagues longitudinally track changes in parasite numbers across four time points as a way of assessing the effect of malaria control interventions in Ghana. Some of the study results have been reported previously, and in this publication, the authors focus on age-stratification of the results. Malaria prevalence was lower in all age groups after IRS. Follow-up with SMC, however, maintained lower parasite prevalence in the targeted age group but not the population as a whole. Additionally, they observe that diversity measures rebounds more slowly than prevalence measures. Overall, I found these results clear, convincing, and well-presented. They add to a growing literature that demonstrates the relevance of asymptomatic reservoirs. There is growing interest in developing an expanded toolkit for genomic epidemiology in malaria, and detecting changes in transmission intensity is one major application. As the authors summarize, there is no one-size-fits-all approach, and the Bayesian MOIvar estimate developed here has the potential to complement currently used methods. I find its extension to a calculation of absolute parasite numbers appealing as this could serve as both a conceptually straightforward and biologically meaningful metric. However, I am not fully convinced the current implementation will be applied meaningfully across additional studies.
(1) I find the term "census population size" problematic as the groups being analyzed (hosts grouped by age at a single time point) do not delineate distinct parasite populations. Separate parasite lineages are not moving through time within these host bins. Rather, there is a single parasite population that is stochastically divided across hosts at each time point. I find this distinction important for interpreting the results and remaining mindful that the 2,000 samples at each time point comprise a subsample of the true population. Instead of "census population size", I suggest simplifying it to "census count" or "parasite lineage count". It would be fascinating to use the obtained results to model absolute parasite numbers at the whole population level (taking into account, for instance, the age structure of the population), and I do hope this group takes that on at some point even if it remains outside the scope of this paper. Such work could enable calculations of absolute---rather than relative---fitness and help us further understand parasite distributions across hosts.
Lineages moving exclusively through a given type of host or “patch” are not a necessary requirement for enumerating the size of the total infections in such subset. It is true that what we have is a single parasite population, but we are enumerating for the season the respective size in host classes (children and adults). This is akin to enumerating subsets of a population in ecological settings where one has multiple habitat patches, with individuals able to move across patches.
Remaining mindful that the count is relative to sample size is an important point. Please see our response to comment (2) of reviewer 1, also for the choice of terminology. We prefer not to adopt “census count” as a census in our mind is a count, and we are not clear on the concept of lineage for these highly recombinant parasites. Also, census population size has been adopted already in the literature for both pathogens and non-pathogens, to make a distinction with the notion of effective population size in population genetics (see our response to reviewer 1) and is consistent with our usage as outlined in the introduction.
Thank you for the comment on an absolute number which would extrapolate to the whole host population. Please see again our response to comment (2) of reviewer 1, on how we can use mean MOI for this purpose once the sampling is sufficient for this quantity to become constant/stable with sampling effort.
(2) I'm uncertain how to contextualize the diversity results without taking into account the total number of samples analyzed in each group. Because of this, I would like a further explanation as to why the authors consider absolute parasite count more relevant than the combined MOI distribution itself (which would have sample count as a denominator). It seems to me that the "per host" component is needed to compare across age groups and time points---let alone different studies.
Again, thank you for the insightful comment. We provide this number as a separate quantity and not a distribution, although it is clearly related to the mean MOI of such distribution. It gives a tangible sense for the actual infection count (different from prevalence) from the perspective of the parasite population in the ecological sense. The “per host” notion which enables an extrapolation to any host population size for the purpose of a complete count, or for comparison with another study site, has been discussed in the above responses for reviewer 1 and now in the revision of the discussion.
(3) Thinking about the applicability of this approach to other studies, I would be interested in a larger treatment of how overlapping DBLα repertoires would impact MOIvar estimates. Is there a definable upper bound above which the method is unreliable? Alternatively, can repertoire overlap be incorporated into the MOI estimator?
This is a very good point and one we now discuss further in our revision. There is no predefined upper bound one can present a priori. Intuitively, the approach to estimate MOI would appear to breakdown as overlap moves away from extremely low values, and therefore for locations with low transmission intensity. Interestingly, we have observed that this is not the case in our paper by Labbe et al. (Labbé et al., 2023) where we used model simulations in a gradient of three transmission intensities, from high to low values. The original _var_coding method performed well across the gradient. This robustness may arise from a nonlinear and fast transition from low to high overlap that is accompanied by MOI changing rapidly from primarily multiclonal (MOI > 1) to monoclonal (MOI = 1). This matter clearly needs to be investigated further, including ways to extend the estimation to explicitly include the distribution of overlap.
Smaller comments:
- Figure 1 provides confidence intervals for the prevalence estimates, but these aren't carried through on the other plots (and Figure 5 has lost CIs for both metrics). The relationship between prevalence and diversity is one of the interesting points in this paper, and it would be helpful to have CIs for both metrics when they are directly compared.
Based on the reviewer’s advice we have revised both Figure 4 and Figure 5, to include the missing uncertainty intervals. The specific approach for each quantity is described in the corresponding caption.
Reviewer #3 (Public Review):
Summary:
The manuscript coins a term "the census population size" which they define from the diversity of malaria parasites observed in the human community. They use it to explore changes in parasite diversity in more than 2000 people in Ghana following different control interventions.
Strengths:
This is a good demonstration of how genetic information can be used to augment routinely recorded epidemiological and entomological data to understand the dynamics of malaria and how it is controlled. The genetic information does add to our understanding, though by how much is currently unclear (in this setting it says the same thing as age-stratified parasite prevalence), and its relevance moving forward will depend on the practicalities and cost of the data collection and analysis. Nevertheless, this is a great dataset with good analysis and a good attempt to understand more about what is going on in the parasite population.
Census population size is complementary to parasite prevalence where the former gives a measure of the “parasite population size”, and the latter describes the “proportion of infected hosts”. The reason we see similar trends for the “genetic information” (i.e., census population size) and “age-specific parasite prevalence” is because we identify all samples for var_coding based on the microscopy (i.e., all microscopy positive _P. falciparum isolates). But what is more relevant here is the relative percentage change in parasite prevalence and census population size following the IRS intervention. To make this point clearer in the revised manuscript we have updated Figure 4 and included additional panels plotting this percentage change from the 2012 baseline, for both census population size and prevalence (Figure 4EF). Overall, we see a greater percentage change in 2014 (and 2015), relative to the 2012 baseline, for census parasite population size vs. parasite prevalence (Figure 4EF) as a consequence of the significant changes in distributions of MOI following the IRS intervention (Figure 3). As discussed in the Results following the deployment of IRS in 2014 census population size decreased by 72.5% relative to the 2012 baseline survey (pre-IRS) whereas parasite prevalence only decreased by 54.5%.
With respect to the reviewer’s comment on “practicalities and cost”, var_coding has been used to successfully amplify _P. falciparum DNA collected as DBS that have been stored for more than 5-years from both clinical and lower density asymptomatic infection, without the additional step and added cost of sWGA ($8 to $32 USD per isolates, for costing estimates see (LaVerriere et al., 2022; Tessema et al., 2020)), which is currently required by other molecular surveillance methods (Jacob et al., 2021; LaVerriere et al., 2022; Oyola et al., 2016). _Var_coding involves a single PCR per isolate using degenerate primers, where a large number of isolates can be multiplexed into a single pool for amplicon sequencing. Thus, the overall costs for incorporating molecular surveillance with _var_coding are mainly driven by the number of PCRs/clean-ups, the number samples indexed per sequencing run, and the NGS technology used (discussed in more detail in our publication Ghansah et al. (Ghansah et al., 2023)). Previous work has shown that _var_coding can be use both locally and globally for molecular surveillance, without the need to be customized or updated, thus it can be fairly easily deployed in malaria endemic regions (Chen et al., 2011; Day et al., 2017; Rougeron et al., 2017; Ruybal-Pesántez et al., 2022, 2021; Tonkin-Hill et al., 2021).
Weaknesses:
Overall the manuscript is well-written and generally comprehensively explained. Some terms could be clarified to help the reader and I had some issues with a section of the methods and some of the more definitive statements given the evidence supporting them.
Thank you for the overall positive assessment. On addressing the “issues with a section of the methods” and “some of the more definitive statements given the evidence supporting them”, it is impossible to do so however, without an explicit indication of which methods and statements the reviewer is referring to. Hopefully, the answers to the detailed comments and questions of reviewers 1 and 2 address any methodological concerns (i.e., in the Materials and Methods and Results). To the issue of “definitive statements”, etc. we are unable to respond without further information.
Recommendations For The Authors:
Reviewer #1 (Recommendations For The Authors):
Line 273: there is a reference to a figure which supports the empirical distribution of repertoire given MOI = 1, but the figure does not appear to exist.
We now included the correct figure for the repertoire size distribution as Figure supplement 3 (previously published in Labbé et al (Labbé et al., 2023)). This figure was accidently forgotten when the manuscript was submitted for review, we thank the reviewer for bringing this to our attention.
Line 299: while this likely makes little difference, an insignificant result from a Kolmogorov-Smirnov test doesn't tell you if the distributions are the same, it only means there is not enough evidence to determine they are different (i.e. fail to reject the null). Also, what does the "mean MOI difference" column in supplementary table 3 mean?
The mean MOI difference is the difference in the mean value between the pairwise comparison of the true population-level MOI distribution, that of the population-level MOI estimates from either pooling the maximum a posteriori (MAP) estimates per individual host or the mixture distribution, or that of the population-level MOI estimates from different prior choices. This is now clarified as requested in the Table supplements 3 - 6.
Figure 4: how are the confidence intervals for the estimated number of var repertoires calculated? Also should include horizontal error bars for prevalence measures.
The confidence intervals were calculated based on a bootstrap approach. We re-sampled 10,000 replicates from the original population-level MOI distribution with replacement. Each resampled replicate is the same size as the original sample. We then derive the 95% CI based on the distribution of the mean MOI of those resampled replicates. This is now clarified as requested in the Figure 4 caption (as well as Table supplement 7 footnotes). In addition, we have also updated Figure 4AB and have included the 95% CI for all measures for clarity.
Reviewer #2 (Recommendations For The Authors):
- I would like to see a plot like Supplemental Figure 8 for the upsA DBLα repertoire size.
The upsA repertoire size for each survey and by age group has now been provided as requested in Figure supplement 5AB.
- Supplemental Table 2 is cut off in the pdf.
We have now resolved this issue so that the Table supplement 2 is no longer cut off.
Reviewer #3 (Recommendations For The Authors):
The manuscript terms the phrase "census population size". To me, the census is all about the number of individuals, not necessarily their diversity. I appreciate that there is no simple term for this, and I imagine the authors have considered many alternatives, but could it be clearer to say the "genetic census population size"? For example, I found the short title not particularly descriptive "Impact of IRS and SMC on census population size", which certainly didn't make me think of parasite diversity.
Please see our response to comment (2) of reviewer 1. We prefer not to add “genetic” to the phrase as the distinction from effective population size from population genetics is important, and the quantity we are after is an ecological one.
The authors do not currently say much about the potential biases in the genetic data and how this might influence results. It seems likely that because (i) patients with sub-microscopic parasitaemia were not sampled and (ii) because a moderate number of (likely low density) samples failed to generate genetic data, that the observed MOI is an overestimate. I'd be interested to hear the authors' thoughts about how this could be overcome or taken into account in the future.
We thank the reviewer for this this comment and agree that this is an interesting area for further consideration. However, based on research from the Day Lab that is currently under review (Tan et al. 2024, under review), the estimated MOI using the Bayesian approach is likely not an “overestimate” but rather an “underestimate”. In this research by Tan et al. (2024) isolate MOI was estimated and compared using different initial whole blood volumes (e.g., 1, 10, 50, 100 uL) for the gDNA extraction. Using _var_coding and comparing these different volumes it was found that MOI was significantly “underestimated” when small blood volumes were used for the gDNA extraction, i.e., there was a ~3-fold increase in median MOI between 1μL and 100μL blood. Ultimately these findings will allow us to make computational corrections so that more accurate estimates of MOI can be obtained from the DBS in the future.
The authors do not make much of LLIN use and for me, this can explain some of the trends. The first survey was conducted soon after a mass distribution whereas the last was done at least a year after (when fewer people would have been using the nets which are older and less effective). We have also seen a rise in pyrethroid resistance in the mosquito populations of the area which could further diminish the LLIN activity. This difference in LLIN efficacy between the first and last survey could explain similar prevalence, yet lower diversity (in Figures 4B/5). However, it also might mean that statements such as Line 478 "This is indicative of a loss of immunity during IRS which may relate to the observed loss of var richness, especially the many rare types" need to be tapered as the higher prevalence observed in this age group could be caused by lower LLIN efficacy at the time of the last survey, not loss of immunity (though both could be true).
We thank the reviewer for this question and agree that (i) LLIN usage and (ii) pyrethroid resistance are important factors to consider.
(i) Over the course of this study self-reported LLIN usage the previous night remained high across all age groups in each of the surveys (≥ 83.5%), in fact more participants reported sleeping under an LLIN in 2017 (96.8%) following the discontinuation of IRS compared to the 2012 baseline survey (89.1%). This increase in LLIN usage in 2017 is likely a result of several factors including a rebound in the local vector population making LLINs necessary again, increased community education and/or awareness on the importance of using LLINs, among others. Information on the LLINs (i.e., PermaNet 2.0, Olyset, or DawaPlus 2.0) distributed and participant reported usage the previous night has now been included in the Materials and Methods as requested by the reviewer.
(ii) As to the reviewer’s question on increased in pyrethroid resistance in Ghana over the study period, research undertaken by our entomology collaborators (Noguchi Memorial Insftute for Medical Research: Profs. S. Dadzie and M. Appawu; and Navrongo Health Research Centre: Dr. V. Asoala) has shown that pyrethroid resistance is a major problem across the country, including the Upper East Region. Preliminary studies from Bongo District (2013 - 2015), were undertaken to monitor for mutations in the voltage gated sodium channel gene that have been associated with knockdown resistance to pyrethroids and DDT in West Africa (kdr-w). Through this analysis the homozygote resistance kdr-w allele (RR) was found in 90% of An. gambiae s.s. samples tested from Bongo, providing evidence of high pyrethroid resistance in Bongo District dating back to 2013, i.e., prior to the IRS intervention (S. Dadzie, M. Appawu, personal communication). Although we do not have data in Bongo District on kdr-w from 2017 (i.e., post-IRS), we can hypothesize that pyrethroid resistance likely did not decline in the area, given the widespread deployment and use of LLINs.
Thus, given this information that (i) self-reported LLIN usage remained high in all surveys (≥ 83.5%), and that (ii) there was evidence of high pyrethroid resistance in 2013 (i.e., kdr-w (RR) _~_90%), the rebound in prevalence observed for the older age groups (i.e., adolescents and adults) in 2017 is therefore best explained by a loss of immunity.
I must confess I got a little lost with some of the Bayesian model section methods and the figure supplements. Line 272 reads "The measurement error is simply the repertoire size distribution, that is, the distribution of the number of non-upsA DBLα types sequenced given MOI = 1, which is empirically available (Figure supplement 3)." This does not appear correct as this figure is measuring kl divergence. If this is not a mistake in graph ordering please consider explaining the rationale for why this graph is being used to justify your point.
We now included the correct figure for the repertoire size distribution as Figure supplement 3 (previously published in Labbé et al (Labbé et al., 2023)). This figure was accidently forgotten when the manuscript was submitted for review, we thank the reviewer for bringing our attention to this matter. We hope that the inclusion of this Figure as well as a more detailed description of the Bayesian approach helps to makes this section in the Materials and Methods clearer for the reader.
I was somewhat surprised that the choice of prior for estimating the MOI distribution at the population level did not make much difference. To me, the negative binomial distribution makes much more sense. I was left wondering, as you are only measuring MOI in positive individuals, whether you used zero truncated Poisson and zero truncated negative binomial distributions, and if not, whether this was a cause of a lack of difference between uniform and other priors.
Thank you for the relevant question. We have indeed considered different priors and the robustness of our estimates to this choice and have now better described this in the text. We focused on individuals who had a confirmed microscopic asymptomatic P. falciparum infection for our MOI estimation, as median P. falciparum densities were overall low in this population during each survey (i.e., median ≤ 520 parasites/µL, see Table supplement 1). Thus, we used either a uniform prior excluding zero or a zero truncated negative binomial distribution when exploring the impact of priors on the final population-level MOI distribution. A uniform prior and a zero-truncated negative binomial distribution with parameters within the range typical of high-transmission endemic regions (higher mean MOI with tails around higher MOI values) produce similar MOI estimates at both the individual and population level. However, when setting the parameter range of the zero-truncated negative binomial to be of those in low transmission endemic regions where the empirical MOI distribution centers around mono-clonal infections with the majority of MOI = 1 or 2 (mean MOI » 1.5, no tail around higher MOI values), the final population-level MOI distribution does deviate more from that assuming the aforementioned prior and parameter choices. The final individual- and population-level MOI estimates are not sensitive to the specifics of the prior MOI distribution as long as this distribution captures the tail around higher MOI values with above-zero probability.
The high MOI in children <5yrs in 2017 (immediately after SMC) is very interesting. Any thoughts on how/why?
This result indicates that although the prevalence of asymptomatic P. falciparum infections remained significantly lower for the younger children targeted by SMC in 2017 compared 2012, they still carried multiclonal infections, as the reviewer has pointed out (Figure 3B). Importantly this upward shift in the MOI distributions (and median MOI) was observed in all age groups in 2017, not just the younger children, and provides evidence that transmission intensity in Bongo has rebounded in 2017, 32-months a er the discontinuation of IRS. This increase in MOI for younger children at first glance may seem to be surprising, but instead likely shows the limitations of SMC to clear and/or supress the establishment of newly acquired infections, particularly at the end of the transmission season following the final cycle of SMC (i.e., end of September 2017 in Bongo District; NMEP/GHS, personal communication) when the posttreatment prophylactic effects of SMC would have waned (Chotsiri et al., 2022).
Line 521 in the penultimate paragraph says "we have analysed only low density...." should this not be "moderate" density, as low density infections might not be detected? The density range itself is not reported in the manuscript so could be added.
In Table supplement 1 we have provided the median, including the inter-quartile range, across each survey by age group. For the revision we have now provided the density min-max range, as requested by the reviewer. Finally, we have revised the statement in the discussion so that it now reads “….we have analysed low- to moderate-density, chronic asymptomatic infections (see Table supplement 1)……”.
Data availability - From the text the full breakdown of the epidemiological survey does not appear to be available, just a summary of defined age bounds in the SI. Provision of these data (with associated covariates such as parasite density and host characteristics linked to genetic samples) would facilitate more in-depth secondary analyses.
To address this question, we have updated the “Data availability statement” section with the following statement: “All data associated with this study are available in the main text, the Supporting Information, or upon reasonable request for research purposes to the corresponding author, Prof. Karen Day (karen.day@unimelb.edu.au).”
REFERENCES
Bedford T, Cobey S, Pascual M. 2011. Strength and tempo of selection revealed in viral gene genealogies. BMC Evol Biol 11. doi:10.1186/1471-2148-11-220
Chen DS, Barry AE, Leliwa-Sytek A, Smith T-AA, Peterson I, Brown SM, Migot-Nabias F, Deloron P, Kortok MM, Marsh K, Daily JP, Ndiaye D, Sarr O, Mboup S, Day KP. 2011. A molecular epidemiological study of var gene diversity to characterize the reservoir of Plasmodium falciparum in humans in Africa. PLoS One 6:e16629. doi:10.1371/journal.pone.0016629
Chotsiri P, White NJ, Tarning J. 2022. Pharmacokinetic considerations in seasonal malaria chemoprevention. Trends Parasitol. doi:10.1016/j.pt.2022.05.003
Day KP, Artzy-Randrup Y, Tiedje KE, Rougeron V, Chen DS, Rask TS, Rorick MM, Migot-Nabias F, Deloron P, Luty AJF, Pascual M. 2017. Evidence of Strain Structure in Plasmodium falciparum Var Gene Repertoires in Children from Gabon, West Africa. PNAS 114:E4103–E4111. doi:10.1073/pnas.1613018114
Ghansah A, Tiedje KE, Argyropoulos DC, Onwona CO, Deed SL, Labbé F, Oduro AR, Koram KA, Pascual M, Day KP. 2023. Comparison of molecular surveillance methods to assess changes in the population genetics of Plasmodium falciparum in high transmission. Fron9ers in Parasitology 2:1067966. doi: 10.3389/fpara.2023.1067966
He Q, Pilosof S, Tiedje KE, Ruybal-Pesántez S, Artzy-Randrup Y, Baskerville EB, Day KP, Pascual M. 2018. Networks of genetic similarity reveal non-neutral processes shape strain structure in Plasmodium falciparum. Nat Commun 9:1817. doi:10.1038/s41467-018-04219-3
Jacob CG, Thuy-nhien N, Mayxay M, Maude RJ, Quang HH, Hongvanthong B, Park N, Goodwin S, Ringwald P, Chindavongsa K, Newton P, Ashley E. 2021. Genetic surveillance in the Greater Mekong subregion and South Asia to support malaria control and elimination. Elife 10:1–22.
Labbé F, He Q, Zhan Q, Tiedje KE, Argyropoulos DC, Tan MH, Ghansah A, Day KP, Pascual M. 2023. Neutral vs . non-neutral genetic footprints of Plasmodium falciparum multiclonal infections. PLoS Comput Biol 19:e1010816. doi:doi.org/10.1101/2022.06.27.497801
LaVerriere E, Schwabl P, Carrasquilla M, Taylor AR, Johnson ZM, Shieh M, Panchal R, Straub TJ, Kuzma R, Watson S, Buckee CO, Andrade CM, Portugal S, Crompton PD, Traore B, Rayner JC, Corredor V, James K, Cox H, Early AM, MacInnis BL, Neafsey DE. 2022. Design and implementation of multiplexed amplicon sequencing panels to serve genomic epidemiology of infectious disease: A malaria case study. Mol Ecol Resour 2285–2303. doi:10.1111/1755-0998.13622
Oyola SO, Ariani C V., Hamilton WL, Kekre M, Amenga-Etego LN, Ghansah A, Rutledge GG, Redmond S, Manske M, Jyothi D, Jacob CG, Ogo TD, Rockeg K, Newbold CI, Berriman M, Kwiatkowski DP. 2016. Whole genome sequencing of Plasmodium falciparum from dried blood spots using selecFve whole genome amplification. Malar J 15:1–12. doi:10.1186/s12936-016-1641-7
Palstra FP, Fraser DJ. 2012. Effective/census population size ratio estimation: A compendium and appraisal. Ecol Evol 2:2357–2365. doi:10.1002/ece3.329
Rougeron V, Tiedje KE, Chen DS, Rask TS, Gamboa D, Maestre A, Musset L, Legrand E, Noya O, Yalcindag E, Renaud F, Prugnolle F, Day KP. 2017. Evolutionary structure of Plasmodium falciparum major variant surface antigen genes in South America : Implications for epidemic transmission and surveillance. Ecol Evol 7:9376–9390. doi:10.1002/ece3.3425
Ruybal-Pesántez S, Sáenz FE, Deed S, Johnson EK, Larremore DB, Vera-Arias CA, Tiedje KE, Day KP. 2021. Clinical malaria incidence following an outbreak in Ecuador was predominantly associated with Plasmodium falciparum with recombinant variant antigen gene repertoires. medRxiv.
Ruybal-Pesántez S, Tiedje KE, Pilosof S, Tonkin-Hill G, He Q, Rask TS, Amenga-Etego L, Oduro AR, Koram KA, Pascual M, Day KP. 2022. Age-specific patterns of DBLa var diversity can explain why residents of high malaria transmission areas remain susceptible to Plasmodium falciparum blood stage infection throughout life. Int J Parasitol 20:721–731.
Strona G, Nappo D, Boccacci F, Fagorini S, San-Miguel-Ayanz J. 2014. A fast and unbiased procedure to randomize ecological binary matrices with fixed row and column totals. Nat Commun 5. doi:10.1038/ncomms5114
Tessema SK, Hathaway NJ, Teyssier NB, Murphy M, Chen A, Aydemir O, Duarte EM, Simone W, Colborn J, Saute F, Crawford E, Aide P, Bailey JA, Greenhouse B. 2020. Sensitive, highly multiplexed sequencing of microhaplotypes from the Plasmodium falciparum heterozygome. Journal of Infec9ous Diseases 225:1227–1237.
Tonkin-Hill G, Ruybal-Pesántez S, Tiedje KE, Rougeron V, Duffy MF, Zakeri S, Pumpaibool T, Harnyuganakorn P, Branch OH, Ruiz-Mesıa L, Rask TS, Prugnolle F, Papenfuss AT, Chan Y, Day KP. 2021. Evolutionary analyses of the major variant surface antigen-encoding genes reveal population structure of Plasmodium falciparum within and between continents. PLoS Genet 7:e1009269. doi:10.1371/journal.pgen.1009269
Author Response
The following is the authors’ response to the original reviews.
Reviewer #1 (Public Review):
The expression and localization of Foxc2 strongly suggest that its role is mainly confined to As undifferentiated spermatogonia (uSPGs). Lineage tracing demonstrated that all germ cells were derived from the FOXC2+ uSPGs. Specific ablation of the FOXC2+ uSPGs led to the depletion of all uSPG populations. Full spermatogenesis can be achieved through the transplantation of Foxc2+ uSPGs. Male germ cell-specific ablation of Foxc2 caused Sertoli-only testes in mice. CUT&Tag sequencing revealed that FOXC2 regulates the factors that inhibit the mitotic cell cycle, consistent with its potential role in maintaining a quiescent state in As spermatogonia. These data made the authors conclude that the FOXC2+ uSPG may be the true SSCs, essential for maintaining spermatogenesis. The conclusion is largely supported by the data presented, but two concerns should be addressed: 1) terminology used is confusing: primitive SSCs, primitive uSPGs, transit amplifying SSCs... 2) the GFP+ cells used for germ cell transplantation should be better controlled using THY1+ cells.
Thanks for your good comments. According to your suggestions, we have addressed your two concerns as follows:
1> Overall our work suggest that FOXC2+ SSCs are a subpopulation of SSCs in a quiescent state, thus we have replaced the term ‘primitive’ with ‘quiescent’ in the revised manuscript. In general, ‘transient amplifying SSCs’ is considered to be ‘progenitors’, thus we have replaced ‘transient amplifying SSCs’ with ‘progenitors’ in the revised manuscript.
2> The transplantation experiment was conducted using MACS-sorted THY1+, FACS sorted THY1+, and FACS-sorted GFP+ (FOXC2+) uSPGs simultaneously. To be consistent with the single-cell RNA-seq using the MACS-sorted THY1+ uSPGs, we only presented the results from MACS-sorted THY1+ and FACS-sorted GFP+ (FOXC2+) uSPGs in the previous manuscript. Following the reviewer’s suggestion, we have included the results derived from FACS sorted THY1+ uSPGs as the control. The overall conclusion is still fully supported by the more comprehensive dataset, i.e. FOXC2+ cells generated significant higher numbers of colonies than THY1+ cells after transplantation (Figure 2D, E).
Reviewer #2 (Public Review):
The authors found FOXC2 is mainly expressed in As of mouse undifferentiated spermatogonia (uSPG). About 60% of As uSPG were FOXC2+ MKI67-, indicating that FOXC2 uSPG were quiescent. Similar spermatogonia (ZBTB16+ FOXC2+ MKI67-) were also found in human testis.
The lineage tracing experiment using Foxc2iCreERT2/+;Rosa26LSL-T/G/LSL-T/G mice demonstrated that all germ cells were derived from the FOXC2+ uSPG. Furthermore, specific ablation of the FOXC2+ uSPGs using Foxc2iCreERT2/+;Rosa26LSL-DTA/+ mice resulted in the depletion of all uSPG population. In the regenerative condition created by busulfan injection, all FOXC2+ uSPG survived and began to proliferate at around 30 days after busulfan injection. The survived FOXC2+ uSPGs generated all germ cells eventually. To examine the role of FOXC2 in the adult testis, spermatogenesis of Foxc2f/-;Ddx4Cre/+ mice was analyzed. From a 2-month-old, the degenerative seminiferous tubules were increased and became Sertoli cell-only seminiferous tubules, indicating FOXC2 is required to maintain normal spermatogenesis in adult testes. To get insight into the role of FOXC2 in the uSPG, CUT&Tag sequencing was performed in sorted FOXC2+ uSPG from Foxc2iCreERT2/+;Rosa26LSL-T/G/LSL-T/G mice 3 days after TAM diet feeding. The results showed some unique biological processes, including negative regulation of the mitotic cell cycle, were enriched, suggesting the FOXC2 maintains a quiescent state in spermatogonia.
Lineage tracing experiments using transgenic mice of the TAM-inducing system was well-designed and demonstrated interesting results. Based on all data presented, the authors concluded that the FOXC2+ uSPG are primitive SSCs, an indispensable subpopulation to maintain adult spermatogenesis.
The conclusion of the mouse study is mostly supported by the data presented, but to accept some of the authors' claims needs additional information and explanation. Several terminologies define cell populations used in the paper may mislead readers.
1) "primitive spermatogonial stem cell (SSC)" is confusing. SSCs are considered the most immature subpopulation of uSPG. Thus, primitive uSPGs are likely SSCs. The naming, primitive SSCs, and transit-amplifying SSCs (Figure 7K) are weird. In general, the transit-amplifying cell is progenitor, not stem cell. In human and even mouse, there are several models for the classification of uSPG and SSCs, such as reserved stem cells and active stem cells. The area is highly controversial. The authors' definition of stem cells and progenitor cells should be clarified rigorously and should compare to existing models.
Thanks for your good comments. Considering that our results showed that FOXC2+ SSCs are in a quiescent state and that Mechanistically FOXC2 maintained the quiescent state of SSCs by promoting the expression of negative regulators of cell cycle, we have replaced ‘primitive SSCs’ with ‘quiescent SSCs’ in the revised manuscript. We agree with the reviewer that ‘transient amplifying SSCs’ is considered to be ‘progenitors’, thus we have replaced ‘transient amplifying SSCs’ with ‘progenitors’ in the revised manuscript. Further,from our point of view, the FOXC2+Ki67+ SSCs could be regarded as active stem cells, and the FOXC2+Ki67- SSCs could be regarded as reserved stem cells, although further research evidence is still needed to confirm this.
2) scRNA seq data analysis and an image of FOXC2+ ZBTB16+ MKI67- cells by fluorescent immunohistochemistry are not sufficient to conclude that they are human primitive SSCs as described in the Abstract. The identity of human SSCs is controversial. Although Adark spermatogonia are a candidate population of human SSCs, the molecular profile of the Adark spermatogonia seems to be heterogeneous. None of the molecular profiles was defined by a specific cell cycle phase. Thus, more rigorous analysis is required to demonstrate the identity of FOXC2+ ZBTB16+ MKI67- cells and Adark spermatogonia.
We agree with the reviewer that the identity of human SSCs remain elusive even though Adark population demonstrates certain characteristics of SSCs. To acknowledge this notion, we have revised our conclusion as such that only suggests FOXC2+ZBTB16+MKI67- represents a quiescent state of human SSCs.
3) FACS-sorted GFP+ cells and MACS-THY1 cells were used for functional transplantation assay to evaluate SSC activity. In general, the purity of MACS is significantly lower than that of FACS. Therefore, FACS-sorted THY1 cells must be used for the comparative analysis. As uSPGs in adult testes express THY1, the percentage of GFP+ cells in THY1+ cells determined by flow cytometry is important information to support the transplantation data.
Thanks for your good comments. According to your suggestions, we have addressed your concerns as follows:
1> The transplantation experiment was conducted using MACS-sorted THY1+, FACS sorted THY1+, and FACS-sorted GFP+ (FOXC2+) uSPGs simultaneously. To be consistent with the single-cell RNA-seq using the MACS-sorted THY1+ uSPGs, we only presented the results from MACS-sorted THY1+ and FACS-sorted GFP+ (FOXC2+) uSPGs in the previous manuscript. Following the reviewer’s suggestion, we have included the results derived from FACS sorted THY1+ uSPGs as the control. The overall conclusion is still fully supported by the more comprehensive dataset, i.e. FOXC2+ cells generated significant higher numbers of colonies than THY1+ cells after transplantation (Figure 2D, E).
2> We performed FACS analysis to determine the proportion of GFP+ cells in FACS-sorted THY1+ cells from Rosa26LSL-T/G/LSL-T/G or Foxc2iCreERT2/+;Rosa26LSL-T/G/LSL-T/G mice at day 3 post TAM induction, and the result showed that GFP+ cells account for approximately 20.9±0.21% of THY1+ cells, See Author response image 1.
Author response image 1.
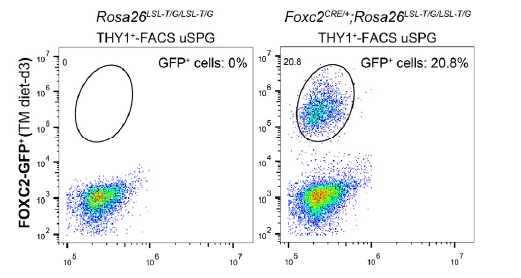
4) The lineage tracing experiments of FOXC2+-SSCs in Foxc2iCreERT2/+;Rosa26LSL-T/G/LSL-T/G showed ~95% of spermatogenic cells and 100% progeny were derived from the FOXC2+ (GFP+) spermatogonia (Figure 2I, J) at month 4 post-TAM induction, although FOXC2+ uSPG were quiescent and a very small subpopulation (~ 60% of As, ~0.03% in all cells). This means that 40% of As spermatogonia and most of Apr/Aal spermatogonia, which were FOXC2 negative, did not contribute to spermatogenesis at all eventually. This is a striking result. There is a possibility that FOXC2CRE expresses more widely in the uSPG population although immunohistochemistry could not detect them.
Thanks for your good comments. From our lineage tracing results, over 95% of the spermatogenic cells are derived from the FOXC2+ SSCs in the testes of 4-month-old mice, which means that FOXC2+ SSCs maintain a long-term stable spermatogenesis. In addition, previous studies have shown that only a portion of As spermatogonia belong to SSCs with complete self-renewal ability (PMID: 28087628, PMID: 25133429), which is consistent with our findings. Therefore, we speculate that 40% of As spermatogonia and most of Apr/Aal spermatogonia, which were FOXC2 negative, did contribute to spermatogenesis but cannot maintain a long-term spermatogenesis due to limited self-renewal ability.
5) The CUT&Tag_FOXC2 analysis on the FACS-sorted FOXC2+ showed functional enrichment in biological processes such as DNA repair and mitotic cell cycle regulation (Figure 7D). The cells sorted were induced Cre recombinase expression by TAM diet and cut the tdTomato cassette out. DNA repair process and negative regulation of the mitotic cell cycle could be induced by the Cre/lox recombination process. The cells analyzed were not FOXC2+ uSPG in a normal physiological state.
We do appreciate the reviewer’s concern on the possibility of the functions enriched in the analysis as referred might be derived from Cre/lox recombination. However, we think it is unlikely that the Cre/lox recombination process, supposed to be rather local and specific, can trigger such a systemic and robust response by the DNA damage and cell cycle regulatory pathways. The reasons are as follows: First, as far as we are aware, there has been sufficient data to support this suggested scenario. Second, we did not observe any alteration in either the SSC behaviors or spermatogenesis in general upon the TAM-induced genomic changes, suggesting the impact from the Cre/lox recombination on DNA damage or cell cycle was not significant. Third, no factors associated with the DNA repair process were revealed in the differential analysis of single-cell transcriptomes of FOXC2-WT and FOXC2-KO.
6) Wei et al (Stem Cells Dev 27, 624-636) have published that FOXC2 is expressed predominately in As and Apr spermatogonia and requires self-renewal of mouse SSCs; however, the authors did not mention this study in Introduction, but referred shortly this at the end of Discussion. Their finding should be referred to and evaluated in advance in the Introduction.
Thanks for your good comments. According to your suggestion, we have revised the introduction to refer this latest parallel work on FOXC2. We are happy to see that our discoveries are converged to the important role of FOXC2 in regulating SSCs in adult mammals.
Reviewer #3 (Public Review):
By popular single-cell RNA-seq, the authors identified FOXC2 as an undifferentiated spermatogonia-specific expressed gene. The FOXC2+-SSCs can sufficiently initiate and sustain spermatogenesis, the ablation of this subgroup results in the depletion of the uSPG pool. The authors provide further evidence to show that this gene is essential for SSCs maintenance by negatively regulating the cell cycle in adult mice, thus well-established FOXC2 as a key regulator of SSCs quiescent state.
The experiments are well-designed and conducted, the overall conclusions are convincing. This work will be of interest to stem cell and reproductive biologists.
Thanks for the positive feedback.
Reviewer #1 (Recommendations for the Authors):
The authors should address the following concerns:
1) The most primitive uSPGs should be the true SSCs. The term "primitive SSCs" is very confusing.
2) In addition to FACS-sorted GFP+ cells, FACS-sorted THY1+ cells should also be used for transplantation.
Thanks for your good comments. According to your suggestions, we have addressed your two concerns as follows:
1) Overall our work suggest that FOXC2+ SSCs are a subpopulation of SSCs in a quiescent state, thus we have replaced the term ‘primitive’ with ‘quiescent’ in the revised manuscript.
2) The transplantation experiment was conducted using MACS-sorted THY1+, FACS sorted THY1+, and FACS-sorted GFP+ (FOXC2+) uSPGs simultaneously. To be consistent with the single-cell RNA-seq using the MACS-sorted THY1+ uSPGs, we only presented the results from MACS-sorted THY1+ and FACS-sorted GFP+ (FOXC2+) uSPGs in the previous manuscript. Following the reviewer’s suggestion, we have included the results derived from FACS sorted THY1+ uSPGs as the control. The overall conclusion is still fully supported by the more comprehensive dataset, i.e. FOXC2+ cells generated significant higher numbers of colonies than THY1+ cells after transplantation (Figure 2D, E).
Reviewer #3 (Recommendations for the Authors):
The experiments are well-designed and conducted, the overall conclusions are convincing. The only concerns are the writing, especially the introduction which was not well-rationalized. Sounds the three subtypes and three models for SSCs' self-renew are irrelevant to the major points of this manuscript. I don't think you need to talk too much about the markers of SSCs. Instead, I suggest you provide more background about the quiescent or activation states of the SSCs. In addition to that, as a nuclear-localized protein, it cannot be used to flow cytometric sorting, I don't think it should be emphasized as a marker. You identified a key transcription factor for maintaining the quiescent state of the primitive SSCs, that's quite important!
Appreciate the positive feedback and constructive suggestions on the writing. We have substantially revised our manuscript to include the relevant advances and understanding from the field as well as highlight the importance of FOXC2 in regulating the quiescent state of SSCs.
Author response:
The following is the authors’ response to the original reviews.
eLife Assessment
This useful manuscript shows a set of interesting data including the first cryo-EM structures of human PIEZO1 as well as structures of disease-related mutants in complex with the regulatory subunit MDFIC, which generate different inactivation phenotypes. The molecular basis of PIEZO channel inactivation is of great interest due to its association with several pathologies. This manuscript provides some structural insights that may help to ultimately build a molecular picture of PIEZO channel inactivation. While the structures are of use and clear conformational differences can be seen in the presence of the auxiliary subunit MDFIC, the strength of the evidence supporting the conclusions of the paper, especially the proposed role for pore lipids in inactivation, is incomplete and there is a lack of data to support them.
We thank the editors and reviewers for taking the time and effort to review our manuscript. The evidence supporting the key role of pore lipids in hPIEZO1 activation is as follows. i. Compared with wild-type hPIEZO1, the hydrophobic acyl chain tails of the pore lipids retracted from the hydrophobic pore region in slower inactivating mutant hPIEZO1-A1988V (Fig. 7a-b). ii. Previous electrophysiological functional studies revealed that substituting this hydrophobic pore formed by I2447, V2450, and F2454 with a hydrophilic pore prolongs the inactivation time for both PIEZO1 and PIEZO2 channels (PMID: 30628892). iii. In the structure of the HX channelopathy mutant R2456H, the interaction between the hydrophilic phosphate group head of pore lipids and R2456 is disrupted, remodeling the blade and pore module and resulting in a significantly slow-inactivating rate. iv. The interaction between pore lipids and lipidated-MDFIC stabilizes the pore lipids to reseal the pore upon activation of the hPIEZO1-MDFIC complex.
According to previously proposed models for the role of pore lipids in mechanosensitive ion channels, such as MscS (PMID: 33568813), MS K2P (PMID: 25500157) and OSCA channels (PMID: 37402734), the pore lipids seal the channel pores in closed state and could be removed in open state by mechanical force induced membrane deformation, which obeys the force-from-lipids principle. Therefore, in our putative model, the pore lipids seal the hydrophobic pore of hPIEZO1 in the closed state. Upon activation of hPIEZO1, the pore lipids retract from the hydrophobic pore and interact with multi-lipidated MDFIC, stabilizing in the inactivation state. The mild channelopathy mutants make the pore lipids retract from the hydrophobic pore and harder to close upon activation. For the severe channelopathy mutant, the interaction between the pore lipids and R2456 is disrupted, resulting in the missing of pore lipids and significantly slow-inactivating. We fully understand the concern of the role of pore lipids in our proposed model. Therefore, we have toned down our putative model.
Public Reviews:
Reviewer #1 (Public review):
Summary:
This manuscript by Shan, Guo, Zhang, Chen et al., shows a raft of interesting data including the first cryo-EM structures of human PIEZO1. Clearly, the molecular basis of PIEZO channel inactivation is of great interest and as such this manuscript provides some valuable extra information that may help to ultimately build a molecular picture of PIEZO channel inactivation. However, the current manuscript though does not provide any compelling evidence for a detailed mechanism of PIEZO inactivation.
Strengths:
This manuscript documents the first cryo-EM structures of human PIEZO1 and the gain of function mutants associated with hereditary anaemia. It is also the first evidence showing that PIEZO1 gain of function mutants are also regulated by the auxiliary subunit MDFIC.
We thank reviewer #1 for the encouragement.
Weaknesses:
While the structures are interesting and clear differences can be seen in the presence of the auxiliary subunit MDFIC the major conclusions and central tenets of the paper, especially a role for pore lipids in inactivation, lack data to support them. The post-translational modification of PIEZOser# auxiliary subunit MDFIC is not modelled as a covalent interaction.
We fully understand the concern of the role of pore lipids in our proposed model. Therefore, we have toned down our putative model.
The lipids densities of the post-transcriptional modification of PIEZO1 auxiliary subunit MDFIC are shown below. As the lipids densities are not confident, we only use the single-chain lipids to represent them. And the lipidated MDFIC is proven by the MDFIC identification paper.
Author response image 1.
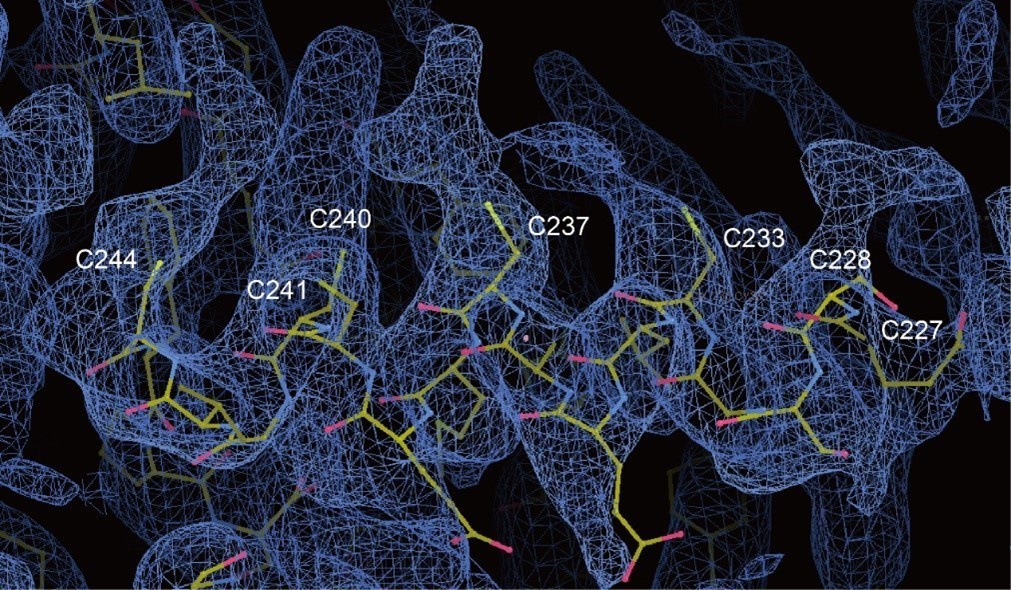
Reviewer #2 (Public review):
Summary:
Mechanically activated ion channels PIEZOs have been widely studied for their role in mechanosensory processes like touch sensation and red blood cell volume regulation. PIEZO in vivo roles are further exemplified by the presence of gain-of-function (GOF) or loss-of-function (LOF) mutations in humans that lead to disease pathologies. Hereditary xerocytosis (HX) is one such disease caused due to GOF mutation in Human PIEZO1, which are characterized by their slow inactivation kinetics, the ability of a channel to close in the presence of stimulus. But how these mutations alter PIEZO1 inactivation or even the underlying mechanisms of channel inactivation remains unknown. Recently, MDFIC (myoblast determination family inhibitor proteins) was shown to directly interact with mouse PIEZO1 as an auxiliary subunit to prolong inactivation and alter gating kinetics. Furthermore, while lipids are known to play a role in the inactivation and gating of other mechanosensitive channels, whether this mechanism is conserved in PIEZO1 is unknown. Thus, the structural basis for PIEZO1 inactivation mechanism, and whether lipids play a role in these mechanisms represent important outstanding questions in the field and have strong implications for human health and disease.
To get at these questions, Shan et al. use cryogenic electron microscopy (Cryo-EM) to investigate the molecular basis underlying differences in inactivation and gating kinetics of PIEZO1 and human disease-causing PIEZO1 mutations. Notably, the authors provide the first structure of human PIEZO1 (hPIEZO1), which will facilitate future studies in the field. They reveal that hPIEZO1 has a more flattened shape than mouse PIEZO1 (mPIEZO1) and has lipids that insert into the hydrophobic pore region. To understand how PIEZO1 GOF mutations might affect this structure and the underlying mechanistic changes, they solve structures of hPIEZO1 as well as two HXcausing mild GOF mutations (A1988V and E756del) and a severe GOF mutation (R2456H). Unable to glean too much information due to poor resolution of the mutant channels, the authors also attempt to resolve MCFIC-bound structures of the mutants. These structures show that MDFIC inserts into the pore region of hPIEZO1, similar to its interaction with mPIEZO1, and results in a more curved and contracted state than hPIEZO1 on its own. The authors use these structures to hypothesize that differences in curvature and pore lipid position underlie the differences in inactivation kinetics between wild-type hPIEZO1, hPIEZO1 GOF mutations, and hPIEZO1 in complex with MDFIC.
Strengths:
This is the first human PIEZO1 structure. Thus, these studies become the stepping stone for future investigations to better understand how disease-causing mutations affect channel gating kinetics.
We thank reviewer #2 for the positive comments.
Weaknesses:
Many of the hypotheses made in this manuscript are not substantiated with data and are extrapolated from mid-resolution structures.
We fully understand the concern of the role of pore lipids in our proposed model. Therefore, we have toned down our putative model.
Reviewer #3 (Public review):
Summary:
In this manuscript, the authors used structural biology approaches to determine the molecular mechanism underlying the inactivation of the PIEZO1 ion channel. To this end, the authors presented structures of human PIEZO1 and its slow-inactivating mutants. The authors also determined the structures of these PIEZO1 constructs in complexes with the auxiliary subunit MDFIC, which substantially slows down PIEZO1 inactivation. From these structures, the authors suggested an anti-correlation between the inactivation kinetics and the resting curvature of PIEZO1 in detergent. The authors also observed a unique feature of human PIEZO1 in which the lipid molecules plugged the channel pore. The authors proposed that these lipid molecules could stabilize human PIEZO1 in a prolonged inactivated state.
We thank reviewer #3 for the summary.
Strengths:
Notedly, this manuscript reported the first structures of a human PIEZO1 channel, its channelopathy mutants, and their complexes with MDFIC. The evidence that lipid molecules could occupy the channel pore of human PIEZO1 is solid. The authors' proposals to correlate PIEZO1 resting curvature and pore-resident lipid molecules with the inactivation kinetics are novel and interesting.
Thanks for the positive comments.
Weaknesses:
However, in my opinion, additional evidence is needed to support the authors' proposals.
(1) The authors determined the apo structure of human PIEZO1, which showed a more flattened architecture than that of the mouse PIEZO1. Functionally, the inactivation kinetics of human PIEZO1 is faster than its mouse counterpart. From this observation (and some subsequent observations such as the complex with MDFIC), the authors proposed the anti-correlation between curvature and inactivation kinetics. However, the comparison between human and mouse PIEZO1 structure might not be justified. For example, the human and mouse structures were determined in different detergent environments, and the choice of detergent could influence the resting curvature of the PIEZO structures.
We apologize for the misleading statement about the anti-correlation between curvature and inactivation kinetics of PIEZOs. We cannot conclude that the observation of curvature variation of mPIEZO1 and hPIEZO1 is related to their inactivation kinetics based on structural studies and electrophysiological assay. The difference in structural basis between mPIEZO1 and hPIEZO1 is what we want to state. To avoid this misleading, we have revised the manuscript.
For the concern about detergent, we cannot fully exclude its influence on the curvature of PIEZOs. However, previously reported structures of mPiezo1 (PDB: 7WLT, 5Z10, 6B3R) were in the different detergent environments or in lipid bilayer, but the curvature of mPiezo1 is similar as shown below. Considering the high sequence similarity between mPiezo1 and hPiezo1, we hypothesize that the curvature of both hPiezo1 and mPiezo1 may be unaffected by the detergent.
Author response image 2.
Overall structural comparison of curved mPIEZO1 in the lipid bilayer (PDB: 7WLT), mPiezo1 in CHAPS (PDB: 6B3R) and mPiezo1 in Digitonin (PDB: 5Z10).
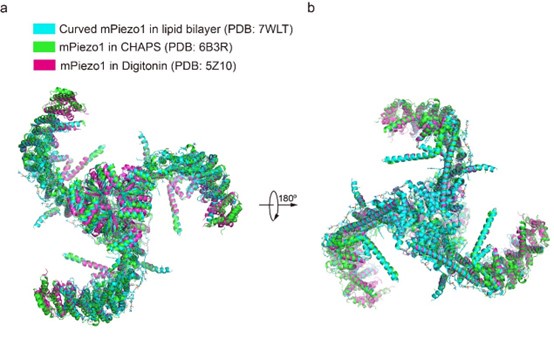
(2) Related to point 1), the 3.7 Å structure of the A1988V mutant presented by the authors showed a similar curvature as the WT but has a slower inactivating kinetics.
Based on the structural comparison between hPIEZO1 and its A1998V mutant, the retraction of pore lipids from the hydrophobic center pore in hPIEZO1-A1998V is mainly responsible for its slower inactivating kinetics.
(3) Related to point 1), the authors stated that human PIEZO1 might not share the same mechanism as mouse PIEZO1 due to its unique properties. For example, MDFIC only modifies the curvature of human PIEZO1, and lipid molecules were only observed in the pore of the human PIEZO1. Therefore, it may not be justified to draw any conclusions by comparing the structures of PIEZO1 from humans and mice.
Thanks for the constructive suggestion. To avoid this misleading, we have revised the manuscript.
(4) Related to point 1), it is well established that PIEZO1 opening is associated with a flattened structure. If the authors' proposal were true, in which a more flattened structure led to faster inactivation, we would have the following prediction: more opening is associated with faster inactivation. In this case, we would expect a pressure-dependent increase in the inactivation kinetics.
Could the authors provide such evidence, or provide other evidence along this direction?
We appreciate the reviewer’s comment. We are not claiming a relationship between the flattened structure and activation/inactivation. We only present the results of the structure of wild-type/mutant PIEZO1.
(5) In Figure S2, the authors showed representative experiments of the inactivation kinetics of PIEZO1 using whole-cell poking. However, poking experiments have high cell-to-cell variability.
The authors should also show statics of experiments obtained from multiple cells.
We have shown the statics of representative electrophysiology experiments obtained from multiple cells in Figure S2.
(6) In Figure 2 and Figure 5, when the authors show the pore diameter, it could be helpful to also show the side chain densities of the pore lining residues.
We appreciate the reviewer’s suggestion. The side chain of the pore lining restricted residues have been shown in Figure 2 and Figure 5 and the densities of pore domain have been shown in Figure S4 and S14. Interestingly, the pore lining restricted residues in mPIEZO1 and hPIEZO1 is highly conserved.
(7) The authors observed pore-plugging lipids in slow inactivating conditions such as channelopathy mutations or in complex with MDFIC. The authors propose that these lipid molecules stabilize a "deep resting state" of PIEZO1, making it harder to open and harder to inactivate once opened. This will lead to the prediction that the slow-inactivating conditions will lead to a higher activation threshold, such as the mid-point pressure in the activation curve. Is this true?
Yes, it is true. In Figure S2, the MDFIC-induced slow-inactivation conditions in hPIEZO1-MDFIC, hPIEZO1-A1988V-MDFIC, hPIEZO1-E756del-MDFIC and hPIEZO1-R2456H-MDFIC result in larger half-activation thresholds than hPIEZO1, hPIEZO1-A1988V, hPIEZO1-E756del and hPIEZO1-R2456H, respectively.
Recommendations for the authors:
Reviewer #1 (Recommendations for the authors):
I document the major issues below:
(1) Mouse vs Human inactivation
Line 21- "than the slower inactivating curved mouse PIEZO1 (mPIEZO1)."
Where is the data in this paper or any other paper that human PIEZO1 inactivates faster than mouse PIEZO1? This is central to the way the authors present the paper. In fact, the tau quoted for the hPIEZO1 of ~10 ms is similar to that often measured for mPIEZO1. The reference in the discussion for mouse vs human inactivation times is a review of mechanotransduction. Either the authors need to directly compare the tau of mP1 vs hP1 or quote the relevant primary literature if it exists.
As measured in HEK-PIKO cells transfected with mPiezo1, the inactivation time of mPiezo1 is 13 ± 1 ms (PMID: 29261642) at -80 mV.
The tau is also voltage-dependent. The tau is beyond 20 ms at -60 mV for mPIEZO1 (PMID:
20813920) and for hPIEZO1 is still around 10 ms.
(2) MDFIC-lipidation
Without seeing the PDB or EMDB I can't guarantee this but from Figure 6d it seems like the Sacylation in the distal C-terminus of MDFIC is not modelled as a covalent interaction, these lipids are covalently added to the Cys residues in S-acylation via zDHHC enzymes. This should be modelled correctly.
Thanks for this suggestion. As the lipid densities of the post-transcriptional modification of PIEZOs auxiliary subunit MDFIC are not confident, we only use the single-chain lipids to represent them.
And the lipidated MDFIC is proven by the MDFIC identification paper (PMID: 37590348).
(3) Pore lipids and inactivation
The lipids close to the pore are interesting and the density for a lipid is also seen in the mouse MDFIC-PIEZO1 complex from Zhou, Ma et al, 2023. However, there is no data provided by the authors that the lipid is functionally relevant to anything. There is not even a correlation with inactivation in Figure 7. P1+MDFIC inactivates slowest yet the lipids are present within the pore. Second, there is no evidence for what these structures are: closed, or inactivated? In fact, the Xiao lab is now interpreting the 7WLU structure as inactivated.
The evidence supporting the key role of pore lipids in hPIEZO1 activation is as follows. i. Compared with wild-type hPIEZO1, the hydrophobic acyl chain tails of the pore lipids retracted from the hydrophobic pore region in slower inactivating mutant hPIEZO1-A1988V (Fig. 7a-b). ii. Previous electrophysiological functional studies revealed that substituting this hydrophobic pore formed by I2447, V2450, and F2454 with a hydrophilic pore prolongs the inactivation time for both PIEZO1 and PIEZO2 channels (PMID: 30628892). iii. In the structure of the HX channelopathy mutant R2456H, the interaction between the hydrophilic phosphate group head of pore lipids and R2456 is disrupted, remodeling the blade and pore module and resulting in a significantly slow-inactivating rate. iv. The interaction between pore lipids and lipidated-MDFIC stabilizes the pore lipids to reseal the pore upon activation of the hPIEZO1-MDFIC complex. Overall, the pore lipid is involved in inactivation, and we have toned down the statement.
(4) Cytosolic plug
There is additional cytosolic density for the human PIEZO1 that the authors intimate could be from a different binding partner. IS it possible to refine this density? Is it from the PIEZO1-tag? At the very least a little more information about this density should be given if it is going to be mentioned like this.
Our purification result shows that the protein is tag-free. We are also curious about the extra cytosolic density, but we do not know what it is.
(5) Reduced sensitivity of PIEZO1 in the presence of MDFIC and its regulatory mechanism
This was reported in the first article however no data is presented by the authors to support MDFIC increasing the mechanical energy required to open PIEZO1. The sentence in the discussion; "MDFIC enables hPIEZO1 to respond to different forces by modifying the pore module through lipid interactions." is not supported by any functional data and seems to be an over-interpretation of the structures.
We appreciate this suggestion. The half-activation threshold of hPEIZO1 and hPEIZO1-MDFIC is measured to be 7 μm and 9 μm, respectively (Fig.S2). In addition, the mechanical currents amplitude of hPIEZO1-MDFIC is extremely small compared to that of WT reaching the nA level (Fig.S2). Therefore, the less mechanosensitive hPIEZO1-MDFIC may require more mechanical energy to open than PIEZO1 WT.
6) Both referencing of the PIEZO1 literature and prose could be improved.
Thanks for the suggestion. We have improved the referencing and prose.
Reviewer #2 (Recommendations for the authors):
(1) The authors speculate that the difference in curvature between human and mouse PIEZO1 results in its fast inactivation but do not provide experimental evidence to support this idea. This claim would have been bolstered by showing that the GOF human mutations have a more curved structure, but these proved too structurally unstable to be solved at high resolution. However, the authors state that the 3.7 angstrom map solved for hPIEZO1-A1988V does have an overall similar architecture as wild-type hPIEZO1; thus, contradicting their hypothesis.
We apologize for the misleading statement. In our revised manuscript, we do not claim a relationship between the flattened structure and activation/inactivation. We only present the results of the structure of wild-type/mutant PIEZO1.
The structure comparison between the A1988V mutant and WT shows a similar architecture but a different occupancy pattern of pore lipids. Therefore, we suggested that the A1988V mutant has slightly slower inactivation kinetics, mainly due to the exit of pore lipids from the pore.
(2) The authors show that interaction with MDFIC alters hPIEZO1 structure to be more curved and use this to support their idea that changing the curvature of the protein underlies the prolonged inactivation kinetics. It has been previously shown that MDFIC does not change the structure of mPIEZO1 but does alter its inactivation and gating kinetics. How does this discrepancy fit into the inactivation model proposed by the authors? Similarly, their claim that MDFIC slows hPIEZO1 inactivation and weakens mechanosensitivity just by affecting the pore module and changing blade curvature is made based on observation and no experimental data to test it.
We have revised the manuscript to avoid misleading the relationship between the curvature and the inaction kinetics of hPIEZO1. The evidence reported previously that substitution of the hydrophobic pore, formed by I2447, V2450, and F2454, with a hydrophilic pore prolongs the inactivation time for both PIEZO1 and PIEZO2 channels (PMID: 30628892). In addition, the severe HX channelopathy mutant R2456H, wherein the interaction between the hydrophilic phosphate group head and R2456 is disrupted, leads to remodeling of the blade and pore module. Indeed, our observation is limited and further experiments will be performed to support our model.
(3) How does their model fit in cell types that have PIEZO1 (or GOF mutant PIEZO1) but not MDFIC?
In cell types that have PIEZO1 or GOF mutant PIEZO1 but not MDFIC, PIEZO1 or GOF mutant PIEZO1 may have a faster inactivation rate than those that bind to MDFIC. It can be proved that overexpressed PIEZOs exhibit faster inactivation kinetics than those in some native cell types with MDFIC expression (PMID: 20813920, 30132757).
(4) Figure S2 is missing quantification of the electrophysiology data. The authors should show summary data in addition to their representative traces including the Imax for all conditions, tau for data shown in b, and sample size for all conditions, and related statistics. The text claims that MDFIC decreases mechanosensitivity (line 156) but there is no data to support this.
For the electrophysiological assay in Figure S2, we referred to previously reported mPIEZO1 mutants (PMID: 23487776, 28716860). We confirmed that the slower inactivation phenotypes of these mutations of hPIEZO1 are similar to those of mPIEZO1.
The half-activation threshold of hPEIZO1 and hPEIZO1-MDFIC is measured to be 7 μm and 9 μm, respectively. This tendency of increased half-activation threshold of hPIEZO1 upon binding with MDFIC is also shown in the electrophysiological result of hPIEZO1 channelopathy mutants.
(5) In line 144, the authors mention that they were able to validate the MDFIC density with multilipidated cysteines on the C-terminal amphipathic helix, but they do not show the density with fitted lipids. While individual densities for some of the lipids are shown in extended Figure 12, it would be helpful to include a figure where they show the map for MDFIC with fitted lipids in it.
Thanks for the valuable suggestion. As the lipid densities of the post-transcriptional modification of PIEZOs auxiliary subunit MDFIC are not confident, we only use the single-chain lipids to represent them. And the lipidated MDFIC is proven by the MDFIC identification paper.
(6) The authors show that R2456 interacts with a lipid at the pore module and hypothesize that this underlies the fast inactivation of hPIEZO1. While they did not obtain a high-resolution structure of this mutant, this hypothesis could be tested by substituting R for side chains with different charges and performing electrophysiology to determine the effects on inactivation.
Thanks for the constructive suggestion. We will perform the electrophysiology assay for R2456 mutants with different side chains.
7) Figure 4 shows overall structure of hPIEZO1 GOF mutations A1988V and E756del in complex with MDFIC. Other than showing an overall similar structure to wildtype hPIEZO1, the authors do not show how the human mutations A1988V alter the structure of the protein at the site of change. Understanding how these mutations affect the local architecture of the protein has important relevance for human physiology.
As the GOF channelopathy mutant hPIEZO1-A1988V is structurally unstable, the density at the site of A1988V is too weak to figure out the related interaction in the structure of the hPIEZO1-A1988V mutant.
Minor comment:
In general, the manuscript will benefit from heavy copy editing. For example, the word cartoon is misspelled in many of the figure legends.
We apologize for the mistake. The manuscript has been checked and revised.
Reviewer #3 (Recommendations for the authors):
Some portions of this manuscript were not well written. For example, at the end of the 3rd paragraph in the introduction, the authors talked about HX mutations and their correlation with malaria infection and plasma iron. This is irrelevant information and will only distract the readers. It would be ideal if the authors could go through the entire manuscript and improve its clarity.
Thanks for the suggestion. We have revised the sentences about HX mutations as suggested and improved the entire manuscript.
Author Response
The following is the authors’ response to the original reviews.
Reviewer #1 (Public Review):
The biogenesis of outer membrane proteins (OMPs) into the outer membranes of Gram-negative bacteria is still not fully understood, particularly substrate recognition and insertion by beta-assembly machinery (BAM). In the studies, the authors present their studies that in addition to recognition by the last strand of an OMP, sometimes referred to as the beta-signal, an additional signal upstream of the last strand is also important for OMP biogenesis.
Strengths:
Overall the manuscript is well organized and written, and addresses an important question in the field. The idea that BAM recognizes multiple signals on OMPs has been presented previously, however, it was not fully tested.
The authors here re-address this idea and propose that it is a more general mechanism used by BAM for OMP biogenesis.
The notion that additional signals assist in biogenesis is an important concept that indeed needs fully tested in OMP biogenesis.
A significant study was performed with extensive experiments reported in an attempt to address this important question in the field.
The identification of important crosslinks and regions of substrates and Bam proteins that interact during biogenesis is an important contribution that gives clues to the path substrates take en route to the membrane.
Weaknesses:
Major critiques (in no particular order):
- The title indicates 'simultaneous recognition', however no experiments were presented that test the order of interactions during OMP biogenesis.
We have replaced the word “Simultaneous” with “Dual” so as not to reflect on the timing of the recognition events for the distinct C-terminal signal and -5 signal.
- Aspects of the study focus on the peptides that appear to inhibit OmpC assembly, but should also include an analysis of the peptides that do not to determine this the motif(s) present still or not.
We thank the reviewer for this comment. Our study focuses on the peptides which exhibited an inhibitory effect in order to elucidate further interactions between the BAM complex and substrate proteins, especially in early stage of the assembly process. In the case of peptide 9, which contains all of our proposed elements but did not have an inhibitory effect, there is the presence of an arginine residue at the polar residue next to hydrophobic residue in position 0 (0 Φ). As seen in Fig S5, S6, and S7, there are no positively charged amino acids in the polar residue positions in the -5 or last strands. This might be the reason why peptide 9, as well as peptide 24, the β-signal derived from the mitochondrial OMP Tom40 and contains a lysine at the polar position, did not display an inhibitory effect. Incorporating the reviewer's suggestions might elucidate conditions that should not be added to the elements, but this is not the focus of this paper and was not discussed to avoid complicating the paper.
- The β-signal is known to form a β-strand, therefore it is unclear why the authors did not choose to chop OmpC up according to its strands, rather than by a fixed peptide size. What was the rationale for how the peptide lengths were chosen since many of them partially overlap known strands, and only partially (2 residues) overlap each other? It may not be too surprising that most of the inhibitory peptides consist of full strands (#4, 10, 21, 23).
A simple scan of known β-strands would have been an alternative approach, however this comes with the bias of limiting the experiments to predicted substrate (strand) sequences, and it presupposes that the secondary structure element would be formed by this tightly truncated peptide.
Instead, we allowed for the possibility that OMPs meet the BAM complex in an unfolded or partially folded state, and that the secondary structure (β-strand) might only form via β-argumentation after the substrate is placed in the context of the lateral gate. We therefore used peptides that mapped right across the entirety of OmpC, with a two amino acid overlap.
To clarify this important point regarding the unbiased nature of our screen, we have revised the text:
(Lines 147-151) "We used peptides that mapped the entirety of OmpC, with a two amino acid overlap. This we considered preferable to peptides that were restricted by structural features, such as β-strands, in consideration that β-strand formation may or may not have occurred in early-stage interactions at the BAM complex."
- It would be good to have an idea of the propensity of the chosen peptides to form β-stands and participate in β-augmentation. We know from previous studies with darobactin and other peptides that they can inhibit OMP assembly by competing with substrates.
We appreciate the reviewer's suggestion. However, we have not conducted biophysical characterizations of the peptides to calculate the propensity of each peptide to form β-stands and participate in β-augmentation. The sort of detailed biophysical analysis done for Darobactin (by the Maier and Hiller groups, The antibiotic darobactin mimics a β-strand to inhibit outer membrane insertase Nature 593:125-129) was a Nature publication based on this single peptide. A further biophysical analysis of all of the peptides presented here goes well beyond the scope of our study.
- The recognition motifs that the authors present span up to 9 residues which would suggest a relatively large binding surface, however, the structures of these regions are not large enough to accommodate these large peptides.
The β-signal motif (ζxGxx[Ω/Φ]x[Ω/Φ]) is an 8-residue consensus, some of the inhibitory peptides include additional residues before and after the defined motif of 8 residues, and the lateral gate of BamA has been shown interact with a 7-residue span (eg. Doyle et al, 2022). Cross-linking presented in our study showed BamD residues R49 and G65 cross-linked to the positions 0 and 6 of the internal signal in OmpC (Fig. 6D).
We appreciate this point of clarification and have modified the text to acknowledge that in the final registering of the peptide with its binding protein, some parts of the peptide might sit beyond the bounds of the BamD receptor’s binding pocket and the BamA lateral gate:
(Lines 458-471) "The β-signal motif (ζxGxx[Ω/Φ]x[Ω/Φ]) is an eight-residue consensus, and internal signal motif is composed of a nine-residue consensus. Recent structures have shown the lateral gate of BamA interacts with a 7-residue span of substrate OMPs. Interestingly, inhibitory compounds, such as darobactin, mimic only three resides of the C-terminal side of β-signal motif. Cross-linking presented here in our study showed that BamD residues R49 and G65 cross-linked to the positions 0 and 6 of the internal signal in OmpC (Fig. 6D). Both signals are larger than the assembly machineries signal binding pocket, implying that the signal might sit beyond the bounds of the signal binding pocket in BamD and the lateral gate in BamA. These finding are consistent with similar observations in other signal sequence recognition events, such as the mitochondrial targeting presequence signal that is longer than the receptor groove formed by the Tom20, the subunit of the translocator of outer membrane (TOM) complex (Yamamoto et al., 2011). The presequence has been shown to bind to Tom20 in several different conformations within the receptor groove (Nyirenda et al., 2013)."
Moreover, the distance between amino acids of BamD which cross-linked to the internal signal, R49 and Y62, is approximately 25 Å (pdbID used 7TT3). The distance of the maximum amino acid length of the internal signal of OmpC, from F280 to Y288, is approximately 22 Å (pdbID used 2J1N). This would allow for the signal to fit within the confines of the TRP motif of BamD.
Author response image 1.
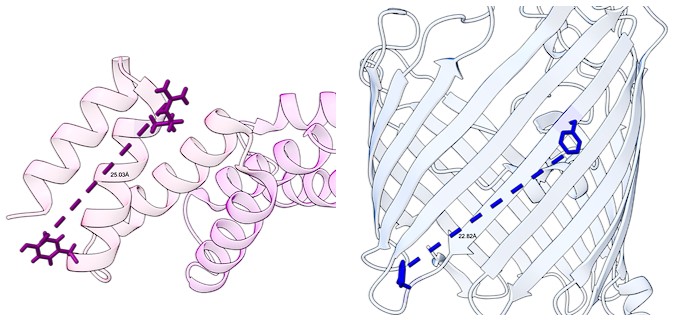
- The authors highlight that the sequence motifs are common among the inhibiting peptides, but do not test if this is a necessary motif to mediate the interactions. It would have been good to see if a library of non-OMP related peptides that match this motif could also inhibit or not.
With respect, this additional work would not address any biological question relevant to the function of BamD. To randomize sequences and then classify those that do or don’t fit the motif would help in refining the parameters of the β-signal motif, but that was not our intent.
We have identified the peptides from within the total sequence of an OMP, shown which peptides inhibit in an assembly assay, and then observed that the inhibitory peptides conform to a previously published (β-signal) motif.
- In the studies that disrupt the motifs by mutagenesis, an effect was observed and attributed to disruption of the interaction of the 'internal signal'. However, the literature is filled with point mutations in OMPs that disrupt biogenesis, particular those within the membrane region. F280, Y286, V359, and Y365 are all residues that are in the membrane region that point into the membrane. Therefore, more work is needed to confirm that these mutations are in parts of a recognition motif rather than on the residues that are disrupting stability/assembly into the membrane.
As the reviewer pointed out, the side chains of the amino acids constituting the signal elements we determined were all facing the lipid side, of which Y286 and Y365 were important for folding as well as to be recognized. However, F280A and V359A had no effect on folding, but only on assembly through the BAM complex. The fact that position 0 functions as a signal has been demonstrated by peptidomimetics (Fig. 1) and point mutant analysis (Fig. 2). We appreciate this clarification and have modified the text to acknowledge that the all of the signal element faces the lipid side, which contributes to their stability in the membrane finally, and before that the BAM complex actively recognizes them and determines their orientation:
(Lines 519-526) After OMP assembly, all elements of the internal signal are positioned such that they face into the lipid-phase of the membrane. This observation may be a coincidence, or may be utilized by the BAM complex to register and orientate the lipid facing amino acids in the assembling OMP away from the formative lumen of the OMP. Amino acids at position 6, such as Y286 in OmpC, are not only component of the internal signal for binding by the BAM complex, but also act in structural capacity to register the aromatic girdle for optimal stability of the OMP in the membrane.
- The title of Figure 3 indicates that disrupting the internal signal motif disrupts OMP assembly, however, the point mutations did not seem to have any effect. Only when both 280 and 286 were mutated was an effect observed. And even then, the trimer appeared to form just fine, albeit at reduced levels, indicating assembly is just fine, rather the rate of biogenesis is being affected.
We appreciate this point and have revised the title of Figure 3 to be:
(Lines 1070-1071) "Modifications in the putative internal signal slow the rate of OMP assembly in vivo."
- In Figure 4, the authors attempt to quantify their blots. However, this seems to be a difficult task given the lack of quality of the blots and the spread of the intended signals, particularly of the 'int' bands. However, the more disturbing trend is the obvious reduction in signal from the post-urea treatment, even for the WT samples. The authors are using urea washes to indicate removal of only stalled substrates. However a reduction of signal is also observed for the WT. The authors should quantify this blot as well, but it is clear visually that both WT and the mutant have obvious reductions in the observable signals. Further, this data seems to conflict with Fig 3D where no noticeable difference in OmpC assembly was observed between WT and Y286A, why is this the case?
We have addressed this point by adding a statistical analysis on Fig. 4A. As the reviewer points out, BN-PAGE band quantification is a difficult task given the broad spread of the bands on these gels. Statistical analysis showed that the increase in intermediates (int) was statistically significant for Y286A at all times until 80 min, when the intermediate form signals decrease.
(Lines 1093-1096) "Statistical significance was indicated by the following: N.S. (not significant), p<0.05; , p<0.005; *. Exact p values of intermediate formed by Wt vs Y286A at each timepoint were as follows; 20 minutes: p = 0.03077, 40 minutes: p = 0.02402, 60 minutes: p = 0.00181, 80 minutes: p = 0.0545."
Further regarding the Int. band, we correct the statement as follows.
(Lines 253-254) "Consistent with this, the assembly intermediate which was prominently observed at the OmpC(Y286A) can be extracted from the membranes with urea;"
OMP assembly in vivo has additional periplasmic chaperones and factors present in order to support the assembly process. Therefore, it is likely that some proteins were assembled properly in vivo compared to their in vitro counterparts. Such a decrease has been observed not only in E. coli but also in mitochondrial OMP import (Yamano et al., 2010).
- The pull-down assays with BamA and BamD should include a no protein control at the least to confirm there is no non-specific binding to the resin. Also, no detergent was mentioned as part of the pull downs that contained BamA or OmpC, nor was it detailed if OmpC was urea solubilized.
We have performed pull down experiments with a no-protein (Ni-NTA only) control as noted (Author response image 1). The results showed that the amount of OmpC carrying through on beads only was significantly lower than the amount of OmpC bound in the presence of BamD or BamA. The added OmpC was not treated with urea, but was synthesized by in vitro translation; the in vitro translated OmpC is the standard substrate in the EMM assembly assay (Supp Fig. S1) where it is recognized by the BAM complex. Thus, we used it for pull-down as well and, to make this clearer, we have revised as follows:
Author response image 2.
Pull down assay of radio-labelled OmpC with indicated protein or Ni-NTA alone (Ni-NTA) . T; total, FT; Flow throw, W; wash, E; Elute.
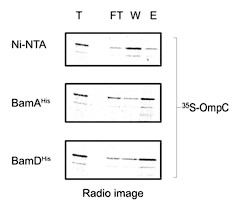
(Lines 252-265) "Three subunits of the BAM complex have been previously shown to interact with the substrates: BamA, BamB, and BamD (Hagan et al., 2013; Harrison, 1996; Ieva et al., 2011). In vitro pull-down assay showed that while BamA and BamD can independently bind to the in vitro translated OmpC polypeptide (Fig .S9A), BamB did not (Fig. S9B)."
11.
• The neutron reflectometry experiments are not convincing primarily due to the lack controls to confirm a consistent uniform bilayer is being formed and even if so, uniform orientations of the BamA molecules across the surface.
• Further, no controls were performed with BamD alone, or with OmpC alone, and it is hard to understand how the method can discriminate between an actual BamA/BamD complex versus BamA and BamD individually being located at the membrane surface without forming an actual complex.
• Previous studies have reported difficulty in preparing a complex with BamA and BamD from purified components.
• Additionally, little signal differences were observed for the addition of OmpC. However, an elongated unfolded polypeptide that is nearly 400 residues long would be expected to produce a large distinct signal given that only the C-terminal portion is supposedly anchored to BAM, while the rest would be extended out above the surface.
• The depiction in Figure 5D is quite misleading when viewing the full structures on the same scales with one another.
We have addressed these five points individually as follows.
i. The uniform orientation of BamA on the surface is guaranteed by the fixation through a His-tag engineered into extracellular loop 6 of BamA and has been validated in previous studies as cited in the text. Moreover, to explain this, we reconstructed another theoretical model for BamA not oriented well in the system as below. However, we found that the solid lines (after fitting) didn’t align well with the experimental data. We therefore assumed that BamA has oriented well in the membrane bilayer.
Author response image 3.
Experimental (symbols) and fitted (curves) NR profiles of BamA not oriented well in the POPC bilayer in D2O (black), GMW (blue) and H2O (red) buffer.
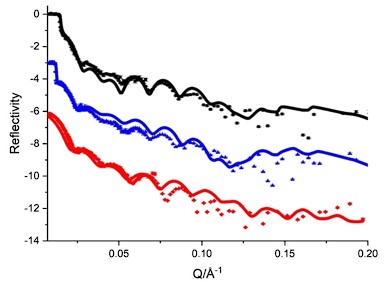
ii. There would be no means by which to do a control with OmpC alone or BamD alone as neither protein binds to the lipid layer chip. OmpC is diluted from urea and then the unbound OmpC is washed from the chip before NR measurements. BamD does not have an acyl group to anchor it to the lipid layer, without BamA to anchor to, it too is washed from the chip before NR measurements. We have reconstructed another theoretical model for both of BamA + BamD embedding in the membrane bilayer, and the fits were shown below. Apparently, the fits didn’t align well with the experimental data, which discriminate the BamA/BamD individually being located at the membrane surface without forming an actual complex.
Author response image 4.
Experimental (symbols) and fitted (curves) NR profiles of BamA+D embedding together in the POPC bilayer in D2O (black), GMW (blue) and H2O (red) buffer.
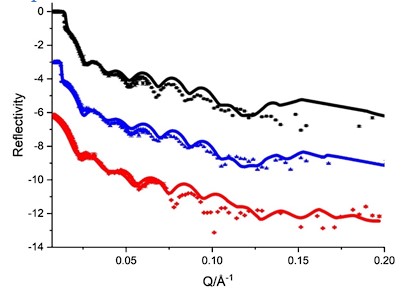
iii. The previous studies that reported difficulty in preparing a complex with BamA and BamD from purified components were assays done in aqueous solution including detergent solubilized BamA, or with BamA POTRA domains only. Our assay is superior in that it reports the binding of BamD to a purified BamA that has been reconstituted in a lipid bilayer.
iv. The relatively small signal differences observed for the addition of OmpC are expected, since OmpC is an elongated, unfolded polypeptide of nearly 400 residues long which, in the context of this assay, can occupy a huge variation in the positions at which it will sit with only the C-terminal portion anchored to BAM, and the rest moving randomly about and extended from the surface.
v. We appreciate the point raised and have now added a note in the Figure legend that these are depictions of the results and not a scale drawing of the structures.
- In the crosslinking studies, the authors show 17 crosslinking sites (43% of all tested) on BamD crosslinked with OmpC. Given that the authors are presenting specific interactions between the two proteins, this is worrisome as the crosslinks were found across the entire surface of BamD. How do the authors explain this? Are all these specific or non-specific?
The crosslinking experiment using purified BamD was an effective assay for comprehensive analysis of the interaction sites between BamD and the substrate. However, as the reviewer pointed out, cross-linking was observed even at the sites that, in the context of the BAM complex, interact with BamC as a protein-protein interaction and would not be available for substrate protein-protein interactions. To complement this, analysis and to address this issue, we also performed the experiment in Fig. 6C.
In Fig. 6C, the interaction of BamD with the substrate is examined in vivo, and the results demonstrate that if BPA is introduced into the site, we designated as the substrate recognition site, it is cross-linked to the substrate. On the other hand, position 114 was found to crosslink with the substrate in vitro crosslinking, but not in vivo. It should be noted that position 114 has also been confirmed to form cross-link products with BamC, we believe that BamD-substrate interactions in the native state have been investigated. To explain the above, we have added the following description to the Results section.
(Lines 319-321) "Structurally, these amino acids locate both the lumen side of funnel-like structure (e.g. 49 or 62) and outside of funnel-like structure such as BamC binding site (e.g. 114) (fig. S12C). (Lines 350-357) Positions 49, 53, 65, and 196 of BamD face the interior of the funnel-like structure of the periplasmic domain of the BAM complex, while position 114 is located outside of the funnel-like structure (Bakelar et al., 2016; Gu et al., 2016; Iadanza et al., 2016). We note that while position 114 was cross-linked with OmpC in vitro using purified BamD, that this was not seen with in vivo cross-linking. Instead, in the context of the BAM complex, position 114 of BamD binds to the BamC subunit and would not be available for substrate binding in vivo (Bakelar et al., 2016; Gu et al., 2016; Iadanza et al., 2016)."
- The study in Figure 6 focuses on defined regions within the OmpC sequence, but a more broad range is necessary to demonstrate specificity to these regions vs binding to other regions of the sequence as well. If the authors wish to demonstrate a specific interaction to this motif, they need to show no binding to other regions.
The region of affinity for the BAM complex was determined by peptidomimetic analysis, and the signal region was further identified by mutational analysis of OmpC. Subsequently, the subunit that recognizes the signal region was identified as BamD. In other words, in the process leading up to Fig. 6, we were able to analyze in detail that other regions were not the target of the study. We have revised the text to make clear that we focus on the signal region including the internal signal, and have not also analyzed other parts of the signal region:
(Lines 329-332) "As our peptidomimetic screen identified conserved features in the internal signal, and cross-linking highlighted the N-terminal and C-terminal TPR motifs of BamD as regions of interaction with OmpC, we focused on amino acids specifically within the β-signals of OmpC and regions of BamD which interact with β-signal."
- The levels of the crosslinks are barely detectable via western blot analysis. If the interactions between the two surfaces are required, why are the levels for most of the blots so low?
These are western blots of cross-linked products – the efficiency of cross-linking is far less than 100% of the interacting protein species present in a binding assay and this explains why the levels for the blots are ‘so low’. We have added a sentence to the revised manuscript to make this clear for readers who are not molecular biologists:
(Lines 345-348) "These western blots reveal cross-linked products representing the interacting protein species. Photo cross-linking of unnatural amino acid is not a 100% efficient process, so the level of cross-linked products is only a small proportion of the molecules interacting in the assays."
15.
• Figure 7 indicates that two regions of BamD promote OMP orientation and assembly, however, none of the experiments appears to measure OMP orientation?
• Also, one common observation from panel F was that not only was the trimer reduced, but also the monomer. But even then, still a percentage of the trimer is formed, not a complete loss.
(i) We appreciate this point and have revised the title of Figure 7 to be:
(Lines 1137-1138) "Key residues in two structurally distinct regions of BamD promote β-strand formation and OMP assembly."
(ii) In our description of Fig. 7F (Lines 356-360) we do not distinguish between the amount of monomer and trimer forms, since both are reflective of the overall assembly rate i.e. assembly efficiency. Rather, we state that:
"The EMM assembly assay showed that the internal signal binding site was as important as the β-signal binding site to the overall assembly rates observed for OmpC (Fig. 7F), OmpF (fig. S15D), and LamB (fig. S15E). These results suggest that recognition of both the C-terminal β-signal and the internal signal by BamD is important for efficient protein assembly."
16.
• The experiment in Fig 7B would be more conclusive if it was repeated with both the Y62A and R197A mutants and a double mutant. These controls would also help resolve any effect from crowding that may also promote the crosslinks.
• Further, the mutation of R197 is an odd choice given that this residue has been studied previously and was found to mediate a salt bridge with BamA. How was this resolved by the authors in choosing this site since it was not one of the original crosslinking sites?
As stated in the text, the purpose of the experiment in Figure 7B is to measure the impact of pre-forming a β-strand in the substrate (OmpC) before providing it to the receptor (BamD). We thank the reviewer for the comment on the R197 position of BamD. The C-terminal domain of BamD has been suggested to mediate the BamA-BamD interface, specifically BamD R197 amino acid creates a salt-bridge with BamA E373 (Ricci et al., 2012). It had been postulated that the formation of this salt-bridge is not strictly structural, with R197 highlighted as a key amino acid in BamD activity and this salt-bridge acts as a “check-point” in BAM complex activity (Ricci et al., 2012, Storek et al., 2023). Our results agree with this, showing that the C-terminus of BamD acts in substrate recognition and alignment of the β-signal (Fig. 6, Fig S12). We show that amino acids in the vicinity of R197 (N196, G200, D204) cross-linked well to substrate and mutations to the β-signal prevent this interaction (Fig S12B, D). For mutational analysis of BamD, we looked then at the conservation of the C-terminus of BamD and determined R197 was the most highly conserved amino acid (Fig 6C). In order to account for this, we have adjusted the manuscript:
(Lines 376-377) "R197 has previously been isolated as a suppressor mutation of a BamA temperature sensitive strain (Ricci et al., 2012)."
(Lines 495-496) "This adds an additional role of the C-terminus of BamD beyond a complex stability role (Ricci et al., 2012; Storek et al., 2023)."
- As demonstrated by the authors in Fig 8, the mutations in BamD lead to reduction in OMP levels for more than just OmpC and issues with the membrane are clearly observable with Y62A, although not with R197A in the presence of VCN. The authors should also test with rifampicin which is smaller and would monitor even more subtle issues with the membrane. Oddly, no growth was observed for the Vec control in the lower concentration of VCN, but was near WT levels for 3 times VCN, how is this explained?
While it would be interesting to correlate the extent of differences to the molecular size of different antibiotics such as rifampicin, such correlations are not the intended aim of our study. Vancomycin (VCN) is a standard measure of outer membrane integrity in our field, hence its use in our tests for membrane integrity.
We apologize to the reviewer as Figure 8 D-G may have been misleading. Figure 8D,E are using bamD shut-down cells expressing plasmid-borne BamD mutants. Whereas Figure 8F, G are the same strain as used in Figure 3. We have adjusted the figure as well as the figure legend: (Lines 1165-1169) D, E E coli bamD depletion cells expressing mutations at residues, Y62A and R197A, in the β-signal recognition regions of BamD were grown with of VCN. F, G, E coli cells expressing mutations to OmpC internal signal, as shown in Fig 3, grown in the presence of VCN. Mutations to two key residues of the internal signal were sensitive to the presence of VCN.
- While Fig 8I indeed shows diminished levels for FY as stated, little difference was observed for the trimer for the other mutants compared to WT, although differences were observed for the dimer. Interestingly, the VY mutant has nearly WT levels of dimer. What do the authors postulate is going on here with the dimer to trimer transition? How do the levels of monomer compare, which is not shown?
The BN-PAGE gel system cannot resolve protein species that migrate below ~50kDa and the monomer species of the OMPs is below this size. We can’t comment on effects on the monomer because it is not visualized. The non-cropped gel image is shown here. Recently, Hussain et al., has shown that in vitro proteo-liposome system OmpC assembly progresses from a “short-lived dimeric” form before the final process of trimerization (Hussain et al., 2021). However, their findings suggest that LPS plays the final role in stimulation of dimer-to-trimer, a step well past the recognition step of the β-signals. Mutations to the internal signal of OmpC results in the formation of an intermediate, the substrate stalled on the BAM complex. This stalling, presumably, causes a hinderance to the BAM complex resulting in reduced timer and loss of dimer OmpF signal in the EMM of cells expressing OmpC double mutant strain, FY. cannot resolve protein species that migrate below ~50kDa and the monomer species of the OMPs is below this size. We can’t comment on effects on the monomer because it is not visualized. The non-cropped gel image is shown here. We have noted this in the revised text:
Author response image 5.
Non-cropped gel of Fig. 8I. the asterisk indicates a band observed in the sample loading wells at the top of the gel.
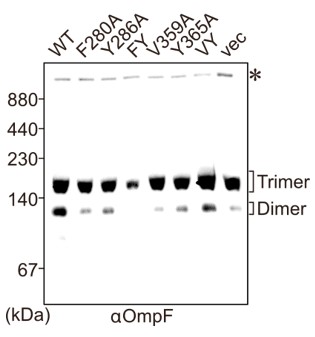
(Lines 417-418) "The dimeric form of endogenous OmpF was prominently observed in both the OmpC(WT) as well as the OmpC(VY) double mutant cells."
- In the discussion, the authors indicate they have '...defined an internal signal for OMP assembly', however, their study is limited and only investigates a specific region of OmpC. More is needed to definitively say this for even OmpC, and even more so to indicate this is a general feature for all OMPs.
We acknowledge the reviewer's comment on this point and have expanded the statement to make sure that the conclusion is justified with the specific evidence that is shown in the paper and the supplementary data. We now state:
(Lines 444-447) "This internal signal corresponds to the -5 strand in OmpC and is recognized by BamD. Sequence analysis shows that similar sequence signatures are present in other OMPs (Figs. S5, S6 and S7). These sequences were investigated in two further OMPs: OmpF and LamB (Fig. 2C and D)."
Note, we did not state that this is a general feature for all OMPs. That would not be a reasonable proposition.
20.
• In the proposed model in Fig 9, it is hard to conceive how 5 strands will form along BamD given the limited surface area and tight space beneath BAM.
• More concerning is that the two proposal interaction sites on BamD, Y62 and R197, are on opposite sides of the BamD structure, not along the same interface, which makes this model even more unlikely.
• As evidence against this model, in Figure 9E, the two indicates sites of BamD are not even in close proximity of the modeled substrate strands.
We can address the reviewer’s three concerns here:
i. The first point is that the region (formed by BamD engaged with POTRA domains 1-2 and 5 of BamA) is not sufficient to accommodate five β-strands. Structural analysis reveals that the interaction between the N-terminal side of BamD and POTRA1-2 is substantially changed the conformation by substrate binding, and that this surface is greatly extended. This surface does have enough space to accommodate five beta-strands, as now documented in Fig. 9D, 9E using the latest structures (7TT5 and 7TT2) as illustrations of this. The text now reads:
(Lines 506-515) "Spatially, this indicates the BamD can serve to organize two distinct parts of the nascent OMP substrate at the periplasmic face of the BAM complex, either prior to or in concert with, engagement to the lateral gate of BamA. Assessing this structurally showed the N-terminal region of BamD (interacting with the POTRA1-2 region of BamA) and the C-terminal region of BamD (interacting with POTRA5 proximal to the lateral gate of BamA) (Bakelar et al., 2016; Gu et al., 2016; Tomasek et al., 2020) has the N-terminal region of BamD changing conformation depending on the folding states of the last four β-strands of the substrate OMP, EspP (Doyle et al., 2022). The overall effect of this being a change in the dimensions of this cavity change, a change which is dependent on the folded state of the substrate engaged in it (Fig 9 B-E)."
ii. The second point raised regards the orientation of the substrate recognition residues of BamD. Both Y62A and R197 were located on the lumen side of the funnel in the EspP-BAM transport intermediate structure (PDBID;7TTC); Y62A is relatively located on the edge of BamD, but given that POTRA1-2 undergoes a conformational change and opens this region, as described above, both are located in locations where they could bind to substrates. This was explained in the following text in the results section of revised manuscript.
(Lines 377-379) "Each residue was located on the lumen side of the funnel-like structure in the EspP-BAM assembly intermediate structure (PDBID; 7TTC) (Doyle et al., 2022)."
**Reviewer #2 (Public Review):"
Previously, using bioinformatics study, authors have identified potential sequence motifs that are common to a large subset of beta-barrel outer membrane proteins in gram negative bacteria. Interestingly, in that study, some of those motifs are located in the internal strands of barrels (not near the termini), in addition to the well-known "beta-signal" motif in the C-terminal region.
Here, the authors carried out rigorous biochemical, biophysical, and genetic studies to prove that the newly identified internal motifs are critical to the assembly of outer membrane proteins and the interaction with the BAM complex. The author's approaches are rigorous and comprehensive, whose results reasonably well support the conclusions. While overall enthusiastic, I have some scientific concerns with the rationale of the neutron refractory study, and the distinction between "the intrinsic impairment of the barrel" vs "the impairment of interaction with BAM" that the internal signal may play a role in. I hope that the authors will be able to address this.
Strengths:
It is impressive that the authors took multi-faceted approaches using the assays on reconstituted, cell-based, and population-level (growth) systems.
Assessing the role of the internal motifs in the assembly of model OMPs in the absence and presence of BAM machinery was a nice approach for a precise definition of the role.
Weaknesses:
- The result section employing the neutron refractory (NR) needs to be clarified and strengthened in the main text (from line 226). In the current form, the NR result seems not so convincing.
What is the rationale of the approach using NR?
We have now modified the text to make clear that:
(Lines 276-280) "The rationale to these experiments is that NR provides: (i) information on the distance of specified subunits of a protein complex away from the atomically flat gold surface to which the complex is attached, and (ii) allows the addition of samples between measurements, so that multi-step changes can be made to, for example, detect changes in domain conformation in response to the addition of a substrate."
What is the molecular event (readout) that the method detects?
We have now modified the text to make clear that:
(Lines 270-274) "While the biochemical assay demonstrated that the OmpC(Y286A) mutant forms a stalled intermediate with the BAM complex, in a state in which membrane insertion was not completed, biochemical assays such as this cannot elucidate where on BamA-BamD this OmpC(Y286A) substrate is stalled."
What are "R"-y axis and "Q"-x axis and their physical meanings (Fig. 5b)?
The neutron reflectivity, R, refers to the ratio of the incoming and exiting neutron beams and it is measured as a function of Momentum transfer Q, which is defined as Q=4π sinθ/λ, where θ is the angle of incident and λ is the neutron wavelength. R(Q)is approximately given byR(Q)=16π2/ Q2 |ρ(Q)|2, where R(Q) is the one-dimensional Fourier transform of ρ(z), the scattering length density (SLD) distribution normal to the surface. SLD is the sum of the coherent neutron scattering lengths of all atoms in the sample layer divided by the volume of the layer. Therefore, the intensity of the reflected beams is highly dependent on the thickness, densities and interface roughness of the samples. This was explained in the following text in the method section of revised manuscript.
(Lines 669-678) "Neutron reflectivity, denoted as R, is the ratio of the incoming to the exiting neutron beams. It’s calculated based on the Momentum transfer Q, which is defined by the formula Q=4π sinθ/λ, where θ represents the angle of incidence and λ stands for the neutron wavelength. The approximate value of R(Q) can be expressed as R(Q)=16π2/ Q2 |ρ(Q)|2, where R(Q) is the one-dimensional Fourier transform of ρ(z), which is the scattering length density (SLD) distribution perpendicular to the surface. SLD is calculated by dividing the sum of the coherent neutron scattering lengths of all atoms in a sample layer by the volume of that layer. Consequently, factors such as thickness, volume fraction, and interface roughness of the samples significantly influence the intensity of the reflected beams."
How are the "layers" defined from the plot (Fig. 5b)?
The “layers” in the plot (Fig. 5b) represent different regions of the sample being studied. In this study, we used a seven-layer model to fit the experimental data (chromium - gold - NTA - HIS8 - β-barrel - P3-5 - P1-2. This was explained in the following text in the figure legend of revised manuscript. (Lines 1115-1116) The experimental data was fitted using a seven-layer model: chromium - gold - NTA - His8 - β-barrel - P3-5 - P1-2.
What are the meanings of "thickness" and "roughness" (Fig. 5c)?
We used neutron reflectometry to determine the relative positions of BAM subunits in a membrane environment. The binding of certain subunits induced conformational changes in other parts of the complex. When a substrate membrane protein is added, the periplasmic POTRA domain of BamA extends further away from the membrane surface. This could result in an increase in thickness as observed in neutron reflectometry measurements.
As for roughness, it is related to the interface properties of the sample. In neutron reflectometry, the intensity of the reflected beams is highly dependent on the thickness, densities, and interface roughness of the samples. An increase in roughness could suggest changes in these properties, possibly due to protein-membrane interactions or structural changes within the membrane.
(Lines 1116-1120) "Table summarizes of the thickness, roughness and volume fraction data of each layer from the NR analysis. The thickness refers to the depth of layered structures being studied as measured in Å. The roughness refers to the irregularities in the surface of the layered structures being studied as measured in Å."
What does "SLD" stand for?
We apologize for not explaining abbreviation when the SLD first came out. We explained it in revised manuscript. (Line 298)
- In the result section, "The internal signal is necessary for insertion step of assembly into OM" This section presents an important result that the internal beta-signal is critical to the intrinsic propensity of barrel formation, distinct from the recognition by BAM complex. However, this point is not elaborated in this section. For example, what is the role of these critical residues in the barrel structure formation? That is, are they involved in any special tertiary contacts in the structure or in membrane anchoring of the nascent polypeptide chains?
We appreciate the reviewer's comment on this point. Both position 0 and position 6 appear to be important amino acids for recognition by the BAM complex, since mutations introduced at these positions in peptide 18 prevent competitive inhibition activity.
In terms of the tertiary structure of OmpC, position 6 is an amino acid that contributes to the aromatic girdle, and since Y286A and Y365A affected OMP folding as measured in folding experiments, it is perhaps their position in the aromatic girdle that contributes to the efficiency of β-barrel folding in addition to its function as a recognition signal. We have added a sentence in the revised manuscript:
(Lines 233-236) "Position 6 is an amino acid that contributes to the aromatic girdle. Since Y286A and Y365A affected OMP folding as measured in folding experiments, their positioning into the aromatic girdle may contributes to the efficiency of β-barrel folding, in addition to contributing to the internal signal."
The mutations made at position 0 had no effect on folding, so this residue may function solely in the signal. Given the register of each β-strand in the final barrel, the position 0 residues have side-chains that face out into the lipid environment. From examination of the OmpC crystal structure, the residue at position 0 makes no special tertiary contacts with other, neighbouring residues.
Reviewer #1 (Recommendations For The Authors):
Minor critiques (in no particular order):
- Peptide 18 was identified based on its strong inhibition for EspP assembly but another peptide, peptide 23, also shows inhibition and has no particular consensus.
We would correct this point. Peptide 23 has a strong consensus to the canonical β-signal. We had explained the sequence consensus of β-signal in the Results section of the text. In the third paragraph, we have added a sentence indicating the relationship between peptide 18 and peptide 23.
(Lines 152-168) "Six peptides (4, 10, 17, 18, 21, and 23) were found to inhibit EspP assembly (Fig. 1A). Of these, peptide 23 corresponds to the canonical β-signal of OMPs: it is the final β-strand of OmpC and it contains the consensus motif of the β-signal (ζxGxx[Ω/Φ]x[Ω/Φ]). The inhibition seen with peptide 23 indicated that our peptidomimetics screening system using EspP can detect signals recognized by the BAM complex. In addition to inhibiting EspP assembly, five of the most potent peptides (4, 17, 18, 21, and 23) inhibited additional model OMPs; the porins OmpC and OmpF, the peptidoglycan-binding OmpA, and the maltoporin LamB (fig. S3). Comparing the sequences of these inhibitory peptides suggested the presence of a sub-motif from within the β-signal, namely [Ω/Φ]x[Ω/Φ] (Fig. 1B). The sequence codes refer to conserved residues such that: ζ, is any polar residue; G is a glycine residue; Ω is any aromatic residue; Φ is any hydrophobic residue and x is any residue (Hagan et al., 2015; Kutik et al., 2008). The non-inhibitory peptide 9 contained some elements of the β-signal but did not show inhibition of EspP assembly (Fig. 1A).
Peptide 18 also showed a strong sequence similarity to the consensus motif of the β-signal (Fig. 1B) and, like peptide 23, had a strong inhibitory action on EspP assembly (Fig. 1A). Variant peptides based on the peptide 18 sequence were constructed and tested in the EMM assembly assay (Fig. 1C)."
- It is unclear why the authors immediately focused on BamD rather than BamB, given that both were mentioned to mediate interaction with substrate. Was BamB also tested?
We thank the reviewer for this comment. Following the reviewer's suggestion, we have now performed a pull-down experiment on BamB and added it to Fig. S9. We also modified the text of the results as follows.
(Lines 262-265) "Three subunits of the BAM complex have been previously shown to interact with the substrates: BamA, BamB, and BamD (Hagan et al., 2013; Harrison, 1996; Ieva et al., 2011). In vitro pull-down assay showed that while BamA and BamD can independently bind to the in vitro translated OmpC polypeptide (Fig .S9A), BamB did not (Fig. S9B)."
- For the in vitro folding assays of the OmpC substrates, labeled and unlabeled, no mention of adding SurA or any other chaperone which is known to be important for mediating OMP biogenesis in vitro.
We appreciate the reviewer’s concerns on this point, however chaperones such as SurA are non-essential factors in the OMP assembly reaction mediated by the BAM complex: the surA gene is not essential and the assembly of OMPs can be measured in the absence of exogenously added SurA. It remains possible that addition of SurA to some of these assays could be useful in detailing aspects of chaperone function in the context of the BAM complex, but that was not the intent of this study.
- For the supplementary document, it would be much easier for the reader to have the legends groups with the figures.
Following the reviewer's suggestion, we have placed the legends of Supplemental Figures together with each Figure.
- Some of the figures and their captions are not grouped properly and are separated which makes it hard to interpret the figures efficiently.
We thank the reviewer for this comment, we have revised the manuscript and figures to properly group the figures and captions together on a single page.
- The authors begin their 'Discussion' with a question (line 454), however, they don't appear to answer or even attempt to address it; suggest removing rhetorical questions.
As per the reviewers’ suggestion, we removed this question.
- Line 464, 'unbiased' should be removed. This would imply that if not stated, experiments are 'negatively' biased.
We removed this word and revised the sentence as follows:
(Lines 431-433) "In our experimental approach to assess for inhibitory peptides, specific segments of the major porin substrate OmpC were shown to interact with the BAM complex as peptidomimetic inhibitors."
- Lines 466-467; '...go well beyond expected outcomes.' What does this statement mean?
Our peptidomimetics led to unexpected results in elucidating the additional essential signal elements. The manuscript was revised as follows:
(Lines 433-435) "Results for this experimental approach went beyond expected outcomes by identifying the essential elements of the signal Φxxxxxx[Ω/Φ]x[Ω/Φ] in β-strands other than the C-terminal strand."
- Line 478; '...rich information that must be oversimplified...'?
We appreciate the reviewer’s pointed out. For more clarity, the manuscript was revised as follows:
(Lines 450-453) "The abundance of information which arises from modeling approaches and from the multitude of candidate OMPs, is generally oversimplified when written as a primary structure description typical of the β-signal for bacterial OMPs (i.e. ζxGxx[Ω/Φ]x[Ω/Φ]) (Kutik et al., 2008)."
- There are typos in the supplementary figures.
We have revised and corrected the Supplemental Figure legends.
Reviewer #2 (Recommendations For The Authors):
- In Supplementary Information, I recommend adding the figure legends directly to the corresponding figures. Currently, it is very inconvenient to go back and forth between legends and figures.
Following the reviewer's suggestion, we have placed the legends of Supplemental Figures together with each Figure.
- Line 94 (p.3): "later"
Lateral?
Yes. We have corrected this.
- Line 113 (p.3): The result section, "Peptidomimetics derived from E. coli OmpC inhibit OMP assembly" Rationale of the peptide inhibition assay is not clear. How can the peptide sequence that effectively inhibit the assembly interpreted as the b-assembly signal? By competitive binding to BAM or by something else? What is the authors' hypothesis in doing this assay?
In revision, we have added following sentence to explain the aim and design of the peptidomimetics:
(Lines 140-145) "The addition of peptides with BAM complex affinity, such as the OMP β-signal, are capable of exerting an inhibitory effect by competing for binding of substrate OMPs to the BAM complex (Hagan et al., 2015). Thus, the addition of peptides derived from the entirety of OMPs to the EMM assembly assay, which can evaluate assembly efficiency with high accuracy, expects to identify novel regions that have affinity for the BAM complex."
- Line 113- (p.3) and Fig. S1: The result section, "Peptidomimetics derived from E. coli OmpC inhibit OMP assembly"
Some explanation seems to be needed why b-barrel domain of EspP appears even without ProK?
We appreciate the reviewer’s pointed out. We added following sentence to explain:
(Lines 128-137) "EspP, a model OMP substrate, belongs to autotransporter family of proteins. Autotransporters have two domains; (1) a β-barrel domain, assembled into the outer membrane via the BAM complex, and (2) a passenger domain, which traverses the outer membrane via the lumen of the β-barrel domain itself and is subsequently cleaved by the correctly assembled β-barrel domain (Celik et al., 2012). When EspP is correctly assembled into outer membrane, a visible decrease in the molecular mass of the protein is observed due to the self-proteolysis. Once the barrel domain is assembled into the membrane it becomes protease-resistant, with residual unassembled and passenger domains degraded (Leyton et al., 2014; Roman-Hernandez et al., 2014)."
- Line 186 (p.6): "Y285"
Y285A?
We have corrected the error, it was Y285A.
- Lines 245- (p. 7)/ Lines 330- (p. 10)
It needs to be clarified that the results described in these paragraphs were obtained from the assays with EMM.
We appreciate the reviewer’s concerns on these points. For the first half, the following text was added at the beginning of the applicable paragraph to indicate that all of Fig. 4 is the result of the EMM assembly assay.
(Line 241) "We further analyzed the role of internal β-signal by the EMM assembly assay. At the second half, we used purified BamD but not EMM. We described clearly with following sentence."
(Lines 316-318) "We purified 40 different BPA variants of BamD, and then irradiated UV after incubating with 35S-labelled OmpC."
Author response:
The following is the authors’ response to the original reviews.
Reviewer #2 (Public Review):
The authors make a compelling case for the biological need to exquisitely control RecB levels, which they suggest is achieved by the pathway they have uncovered and described in this work. However, this conclusion is largely inferred as the authors only investigate the effect on cell survival in response to (high levels of) DNA damage and in response to two perturbations - genetic knock-out or over-expression, both of which are likely more dramatic than the range of expression levels observed in unstimulated and DNA damage conditions.
In the discussion of the updated version of the manuscript, we have clarified the limits of our interpretation of the role of the uncovered regulation.
Lines 411-417: “It is worth noting that the observed decrease in cell viability upon DNA damage was detected for relatively drastic perturbations such as recB deletion and RecBCD overexpression. Verifying these observations in the context of more subtle changes in RecB levels would be important for further investigation of the biological role of the uncovered regulation mechanism. However, the extremely low numbers of RecB proteins make altering its abundance in a refined, controlled, and homogeneous across cells manner extremely challenging and would require the development of novel synthetic biology tools.”
Reviewer #3 (Public Review):
The major weaknesses include a lack of mechanistic depth, and part of the conclusions are not fully supported by the data.
(1) Mechanistically, it is still unclear why upon DNA damage, translation level of recB mRNA increases, which makes the story less complete. The authors mention in the Discussion that a moderate (30%) decrease in Hfq protein was observed in previous study, which may explain the loss of translation repression on recB. However, given that this mRNA exists in very low copy number (a few per cell) and that Hfq copy number is on the order of a few hundred to a few thousand, it's unclear how 30% decrease in the protein level should resides a significant change in its regulation of recB mRNA.
We agree that the entire mechanistic pathway controlling recB expression may be not limited to just Hfq involvement. We have performed additional experiments, proposed by the reviewer, suggesting that a small RNA might be involved (see below, response to comments 3&4). However, we consider that the full characterisation of all players is beyond the scope of this manuscript. In addition to describing the new data (see below), we expanded the discussion to explain more precisely why changes in Hfq abundance upon DNA damage may impact RecB translation.
Lines 384-391: “A modest decrease (~30%) in Hfq protein abundance has been seen in a proteomic study in E. coli upon DSB induction with ciprofloxacin (DOI: 10.1016/j.jprot.2018.03.002). While Hfq is a highly abundant protein, it has many mRNA and sRNA targets, some of which are also present in large amounts (DOI: 10.1046/j.1365-2958.2003.03734.x). As recently shown, the competition among the targets over Hfq proteins results in unequal (across various targets) outcomes, where the targets with higher Hfq binding affinity have an advantage over the ones with less efficient binding (DOI: 10.1016/j.celrep.2020.02.016). In line with these findings, it is conceivable that even modest changes in Hfq availability could result in significant changes in gene expression, and this could explain the increased translational efficiency of RecB under DNA damage conditions. “
(2) Based on the experiment and the model, Hfq regulates translation of recB gene through binding to the RBS of the upstream ptrA gene through translation coupling. In this case, one would expect that the behavior of ptrA gene expression and its response to Hfq regulation would be quite similar to recB. Performing the same measurement on ptrA gene expression in the presence and absence of Hfq would strengthen the conclusion and model.
Indeed, based on our model, we expect PtrA expression to be regulated by Hfq in a similar manner to RecB. However, the product encoded by the ptrA gene, Protease III, (i) has been poorly characterised; (ii) unlike RecB, is located in the periplasm (DOI: 10.1128/jb.149.3.1027-1033.1982); and (iii) is not involved in any DNA repair pathway. Therefore, analysing PtrA expression would take us away from the key questions of our study.
(3) The authors agree that they cannot exclude the possibility of sRNA being involved in the translation regulation. However, this can be tested by performing the imaging experiments in the presence of Hfq proximal face mutations, which largely disrupt binding of sRNAs.
(4) The data on construct with a long region of Hfq binding site on recB mRNA deleted is less convincing. There is no control to show that removing this sequence region itself has no effect on translation, and the effect is solely due to the lack of Hfq binding. A better experiment would be using a Hfq distal face mutant that is deficient in binding to the ARN motifs.
We performed the requested experiments. We included this data in the manuscript in the supplementary figure (Figure S11), and our interpretation in the discussion.
Lines 354-378: “While a few recent studies have shown evidence for direct gene regulation by Hfq in a sRNA-independent manner (DOI: 10.1101/gad.302547.117; DOI: 10.1111/mmi.14799; DOI: 10.1371/journal.pgen.1004440; DOI: 10.1111/mmi.12961; DOI: 10.1038/emboj.2013.205), we attempted to investigate whether a small RNA could be involved in the Hfq-mediated regulation of RecB expression. We tested Hfq mutants containing point mutations in the proximal and distal sides of the protein, which were shown to disrupt either binding with sRNAs or with ARN motifs of mRNA targets, respectively [DOI: 10.1016/j.jmb.2013.01.006, DOI: 10.3389/fcimb.2023.1282258]. Hfq mutated in either proximal (K56A) or distal (Y25D) faces were expressed from a plasmid in a ∆hfq background. In both cases, Hfq expression was confirmed with qPCR and did not affect recB mRNA levels (Supplementary Figure S11b). When the proximal Hfq binding side (K56A) was disrupted, RecB protein concentration was nearly similar to that obtained in a ∆hfq mutant (Supplementary Figure S11a, top panel). This observation suggests that the repression of RecB translation requires the proximal side of Hfq, and that a small RNA is likely to be involved as small RNAs (Class I and Class II) were shown to predominantly interact with the proximal face of Hfq [DOI: 10.15252/embj.201591569]. When we expressed Hfq mutated in the distal face (Y25D) which is deficient in binding to mRNAs, less efficient repression of RecB translation was detected (Supplementary Figure S11a, bottom panel). This suggests that RecB mRNA interacts with Hfq at this position. We did not observe full de-repression to the ∆hfq level, which might be explained by residual capacity of Hfq to bind its recB mRNA target in the point mutant (Y25D) (either via the distal face with less affinity or via the lateral rim Hfq interface).”
Taken together, these results suggest that Hfq binds to recB mRNA and that a small RNA might contribute to the regulation although this sRNA has not been identified.
(5) Ln 249-251: The authors claim that the stability of recB mRNA is not changed in ∆hfq simply based on the steady-state mRNA level. To claim so, the lifetime needs to be measured in the absence of Hfq.
We measured recB lifetime in the absence of Hfq in a time-course experiment where transcription initiation was inhibited with rifampicin and mRNA abundance was quantified with RT-qPCR. The results confirmed that recB mRNA lifetime in hfq mutants is similar to the one in the wild type (Figure S7d, referred to the line 263 of the manuscript).
(6) What's the labeling efficiency of Halo-tag? If not 100% labeled, is it considered in the protein number quantification? Is the protein copy number quantification through imaging calibrated by an independent method? Does Halo tag affect the protein translation or degradation?
Our previous study (DOI: 10.1038/s41598-019-44278-0) described a detailed characterization of the HaloTag labelling technique for quantifying low-copy proteins in single E. coli cells using RecB as a test case.
In that study, we showed complete quantitative agreement of RecB quantification between two fully independent methods: HaloTag-based labelling with cell fixation and RecB-sfGFP combined with a microfluidic device that lowers protein diffusion in the bacterial cytoplasm. This second method had previously been validated for protein quantification (DOI: 10.1038/ncomms11641) and provides detection of 80-90% of the labelled protein. Additionally, in our protocol, immediate chemical fixation of cells after the labelling and quick washing steps ensure that new, unlabelled RecB proteins are not produced. We, therefore, conclude that our approach to RecB detection is highly reliable and sufficient for comparing RecB production in different conditions and mutants.
The RecB-HaloTag construct has been designed for minimal impact on RecB production and function. The HaloTag is translationally fused to RecB in a loop positioned after the serine present at position 47 where it is unlikely to interfere with (i) the formation of RecBCD complex (based on RecBCD structure, DOI: 10.1038/nature02988), (ii) the initiation of translation (as it is far away from the 5’UTR and the beginning of the open reading frame) and (iii) conventional C-terminalassociated mechanisms of protein degradation (DOI: 10.15252/msb.20199208). In our manuscript, we showed that the RecB-HaloTag degradation rate is similar to the dilution rate due to bacterial growth. This is in line with a recent study on unlabelled proteins, which shows that RecB’s lifetime is set by the cellular growth rate (DOI: 10.1101/2022.08.01.502339).
Furthermore, we have demonstrated (DOI: 10.1038/s41598-019-44278-0) that (i) bacterial growth is not affected by replacing the native RecB with RecB-HaloTag, (ii) RecB-HaloTag is fully functional upon DNA damage, and (iii) no proteolytic processing of the RecB-HaloTag is detected by Western blot.
These results suggest that RecB expression and functionality are unlikely to be affected by the translational HaloTag insertion at Ser-47 in RecB.
In the revised version of the manuscript, we have added information about the construct and discuss the reliability of the quantification.
Lines 141-152: “To determine whether the mRNA fluctuations we observed are transmitted to the protein level, we quantified RecB protein abundance with singlemolecule accuracy in fixed individual cells using the Halo self-labelling tag (Fig. 2A&B).
The HaloTag is translationally fused to RecB in a loop after Ser47(DOI: 10.1038/s41598-019-44278-0) where it is unlikely to interfere with the formation of RecBCD complex (DOI: 10.1038/nature02988), the initiation of translation and conventional C-terminal-associated mechanisms of protein degradation (DOI: 10.15252/msb.20199208). Consistent with minimal impact on RecB production and function, bacterial growth was not affected by replacing the native RecB with RecBHaloTag, the fusion was fully functional upon DNA damage and no proteolytic processing of the construct was detected (DOI: 10.1038/s41598-019-44278-0). To ensure reliable quantification in bacteria with HaloTag labelling, the technique was previously verified with an independent imaging method and resulted in > 80% labelling efficiency (DOI: 10.1038/s41598-019-44278-0, DOI: 10.1038/ncomms11641). In order to minimize the number of newly produced unlabelled RecB proteins, labelling and quick washing steps were followed by immediate chemical fixation of cells.”
Lines 164-168: “Comparison to the population growth rate [in these conditions (0.017 1/min)] suggests that RecB protein is stable and effectively removed only as a result of dilution and molecule partitioning between daughter cells. This result is consistent with a recent high-throughput study on protein turnover rates in E. coli, where the lifetime of RecB proteins was shown to be set by the doubling time (DOI: 10.1038/s41467-024-49920-8).”
(7) Upper panel of Fig S8a is redundant as in Fig 5B. Seems that Fig S8d is not described in the text.
We have now stated in the legend of Fig S8a that the data in the upper panel were taken from Fig 5B to visually facilitate the comparison with the results given in the lower panel. We also noticed that we did not specify that in the upper panel in Fig S9a (the data in the upper panel of Fig S9a was taken from Fig 5C for the same reason). We added this clarification to the legend of the Fig S9 as well.
We referred to the Fig S8d in the main text.
Lines 283-284: “We confirmed the functionality of the Hfq protein expressed from the pQE-Hfq plasmid in our experimental conditions (Fig. S8d).”
Reviewer #1 (Recommendations For The Authors):
(1) Experimental regime to measure protein and mRNA levels.
(a) Authors expose cells to ciprofloxacin for 2 hrs. They provide a justification via a mathematical model. However, in the absence of a measurement of protein and mRNA across time, it is unclear whether this single time point is sufficient to make the conclusion on RecB induction under double-strand break.
In our experiments, we only aimed to compare recB mRNA and RecB protein levels in two steady-state conditions: no DNA damage and DNA damage caused by sublethal levels of ciprofloxacin. We did not aim to look at RecB dynamic regulation from nondamaged to damaged conditions – this would indeed require additional measurements at different time points. We revised this part of the results to ensure that our conclusions are stated as steady-state measurements and not as dynamic changes.
Line 203-205: “We used mathematical modelling to verify that two hours of antibiotic exposure was sufficient to detect changes in mRNA and protein levels and for RecB mRNA and protein levels to reach a new steady state in the presence of DNA damage.”
(b) Authors use cell area to account for the elongation under damage conditions. However, it is unclear whether the number of copies of the recB gene are similar across these elongated cells. Hence, authors should report mRNA and protein levels with respect to the number of gene copies of RecB or chromosome number as well.
Based on the experiments in DNA damaging conditions, our main conclusion is that the average translational efficiency of RecB is increased in perturbed conditions. We believe that this conclusion is well supported by our measurements and that it does not require information about the copy number of the recB gene but only the concentration of mRNA and protein. We did observe lower recB mRNA concentration upon DNA damage in comparison to the untreated conditions, which may be due to a lower concentration of genomic DNA in elongated cells upon DNA damage, as we mention in lines (221-223).
Our calculation of translation efficiency could be affected by variations of mRNA concentration across cells in the dataset. For example, longer cells that are potentially more affected by DNA damage could have lower concentrations of mRNA. We verified that this is not the case, as recB mRNA concentration is constant across cell size distribution (see the figure below or Figure S5a from Supplementary Information).
Therefore, we do not think that the measurements of recB gene copy would change our conclusions. We agree that measuring recB gene copies could help to investigate the reason behind the lower recB mRNA concentration under the perturbed conditions as this could be due to lower DNA content or due to shortage of resources (such as RNA polymerases). However, this is a side observation we made rather than a critical result, whose investigation is beyond the scope of this manuscript.
Author response image 1.
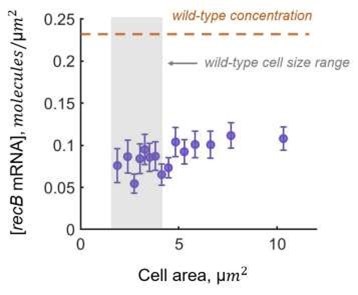
(2) RecB as a proxy for RecBCD. Authors suggest that RecB levels are regulated by hfq. However, how does this regulatory circuit affect the levels of RecC and RecD? Ratio of the three proteins has been shown to be important for the function of the complex.
A full discussion of RecBCD complex formation regulation would require a complete quantitative model based on precise information on the dynamic of the complex formation, which is currently lacking.
We can however offer the following (speculative) suggestions assuming that all three subunits are present in similar abundance in native conditions (DOI: 10.1038/s41598019-44278-0 for RecB and RecC). As the complex is formed in 1:1:1 ratio (DOI: 10.1038/nature02988), we propose that the regulation mechanism of RecB expression affects complex formation in the following way. If the RecB abundance becomes lower than the level of RecC and RecD subunits, the complex formation would be limited by the number of available RecB subunits and hence the number of functional RecBCDs will be decreased. On the contrary, if the number of RecB is higher than the baseline, then, especially in the context of low numbers, we would expect that the probability of forming a complex RecBC (and then RecBCD) will be increased. Based on this simple explanation, we might speculate that regulation of RecB expression may be sufficient to regulate RecB levels and RecBCD complex formation. However, we feel that this argument is too speculative to be added to the manuscript.
(3) Role of Hfq in RecB regulation. While authors show the role of hfq in recB translation regulation in non-damage conditions, it is unclear as to how this regulation occurs under damage conditions.
(a) Have the author carried out recB mRNA and protein measurement in hfqdeleted cells under ciprofloxacin treatment?
We attempted to perform experiments in hfq mutants under ciprofloxacin treatment. However, the cells exhibited a very strong and pleiotropic phenotype: they had large size variability and shape changes and were also frequently lysing. Therefore, we did not proceed with mRNA and protein quantification because the data would not have been reliable.
(b) How do the authors propose that Hfq regulation is alleviated under conditions of DNA damage, when RecB translation efficiency increases?
We propose that Hfq could be involved in a more global response to DNA damage as follows.
Based on a proteomic study where Hfq protein abundance has been found to decrease (~ 30%) upon DSB induction with ciprofloxacin (DOI: 10.1016/j.jprot.2018.03.002), we suggest that this could explain the increased translational efficiency of RecB. While Hfq is a highly abundant protein, it has many targets (mRNA and sRNA), some of which are also highly abundant. Therefore the competition among the targets over Hfq proteins results in unequal (across various targets) outcomes (DOI: 10.1046/j.13652958.2003.03734.x), where the targets with higher Hfq binding affinity have an advantage over the ones with less efficient binding. We reason that upon DNA damage, a moderate decrease in the Hfq protein abundance (30%) can lead to a similar competition among Hfq targets where high-affinity targets outcompete low-affinity ones as well as low-abundant ones (such as recB mRNAs). Thus, the regulation of lowabundant targets of Hfq by moderate perturbations of Hfq protein level is a potential explanation for the change in RecB translation that we have observed. Potential reasons behind the changes of Hfq levels upon DNA damage would be interesting to explore, however this would require a completely different approach and is beyond the scope of this manuscript.
We have modified the text of the discussion to explain our reasoning:
Lines 384-391: “A modest decrease (~30%) in Hfq protein abundance has been seen in a proteomic study in E. coli upon DSB induction with ciprofloxacin (DOI: 10.1016/j.jprot.2018.03.002). While Hfq is a highly abundant protein, it has many mRNA and sRNA targets, some of which are also present in large amounts (DOI: 10.1046/j.1365-2958.2003.03734.x). As recently shown, the competition among the targets over Hfq proteins results in unequal (across various targets) outcomes, where the targets with higher Hfq binding affinity have an advantage over the ones with less efficient binding (DOI: 10.1016/j.celrep.2020.02.016). In line with these findings, it is conceivable that even modest changes in Hfq availability could result in significant changes in gene expression, and this could explain the increased translational efficiency of RecB under DNA damage conditions.”
(c) Is there any growth phenotype associated with recB mutant where hfq binding is disrupted in damage and non-damage conditions? Does this mutation affect cell viability when over-expressed or under conditions of ciprofloxacin exposure?
We checked the phenotype and did not detect any difference in growth or cell viability affecting the recB-5 UTR* mutants either in normal conditions or upon exposure to ciprofloxacin. However, this is expected because the repair capacity is associated with RecB protein abundance and in this mutant, while translational efficiency of recB mRNA increases, the level of RecB proteins remains similar to the wild-type (Figure 5E).
Minor points:
(1) Introduction - authors should also discuss the role of RecFOR at sites of fork stalling, a likely predominant pathway for break generated at such sites.
The manuscript focuses on the repair of DNA double-strand breaks (DSBs). RecFOR plays a very important role in the repair of stalled forks because of single-strand gaps but is not involved in the repair of DSBs (DOI: 10.1038/35003501). We have modified the beginning of the introduction to mention the role of RecFOR.
Lines 35-39: “For instance, replication forks often encounter obstacles leading to fork reversal, accumulation of gaps that are repaired by the RecFOR pathway (DOI: 10.1038/35003501) or breakage which has been shown to result in spontaneous DSBs in 18% of wild-type Escherichia coli cells in each generation (DOI: 10.1371/journal.pgen.1007256), underscoring the crucial need to repair these breaks to ensure faithful DNA replication.”
(2) Methods: The authors refer to previous papers for the method used for single RNA molecule detection. More information needs to be provided in the present manuscript to explain how single molecule detection was achieved.
We added additional information in the method section on the fitting procedure allowing quantifying the number of mRNAs per detected focus.
Lines 515-530: “Based on the peak height and spot intensity, computed from the fitting output, the specific signal was separated from false positive spots (Fig. S1a). To identify the number of co-localized mRNAs, the integrated spot intensity profile was analyzed as previously described (DOI: 10.1038/nprot.2013.066). Assuming that (i) probe hybridization is a probabilistic process, (ii) binding each RNA FISH probe happens independently, and (iii) in the majority of cases, due to low-abundance, there is one mRNA per spot, it is expected that the integrated intensities of FISH probes bound to one mRNA are Gaussian distributed. In the case of two co-localized mRNAs, there are two independent binding processes and, therefore, a wider Gaussian distribution with twice higher mean and twice larger variance is expected. In fact, the integrated spot intensity profile had a main mode corresponding to a single mRNA per focus, and a second one representing a population of spots with two co-localized mRNAs (Fig. S1b). Based on this model, the integrated spot intensity histograms were fitted to the sum of two Gaussian distributions (see equation below where a, b, c, and d are the fitting parameters), corresponding to one and two mRNA molecules per focus. An intensity equivalent corresponding to the integrated intensity of FISH probes in average bound to one mRNA was computed as a result of multiple-Gaussian fitting procedure (Fig. S1b), and all identified spots were normalized by the one-mRNA equivalent.
 “
“
Reviewer #2 (Recommendations For The Authors):
Overall the work is carefully executed and highly compelling, providing strong support for the conclusions put forth by the authors.
One point: the potential biological consequences of the post-transcriptional mechanism uncovered in the work would be enhanced if the authors could 1) tune RecB protein levels and 2) directly monitor the role that RecB plays in generating single-standed DNA at DSBs.
We agree that testing viability of cells in case of tunable changes in RecB levels would be important to further investigate the biological role of the uncovered regulation mechanism. However, this is a very challenging experiment as it is technically difficult to alter the low number of RecB proteins in a controlled and homogeneous across-cell manner, and it would require the development of precisely tunable and very lowabundant synthetic designs.
We did monitor real-time RecB dynamics by tracking single molecules in live E. coli cells in a different study (DOI: 10.1101/2023.12.22.573010) that is currently under revision. There, reduced motility of RecB proteins was observed upon DSB induction indicating that RecB is recruited to DNA to start the repair process.
Author response:
The following is the authors’ response to the original reviews
Reviewer #1:
To gain further insight into the dynamics of microglial aging in the hippocampus, the authors used a bioinformatics method known as "pseudotime" or "trajectory inference" to understand how cells may progress through different functional states, as defined by cellular transcriptome (15,16). These bioinformatics approaches can reveal key patterns in scRNAseq / snRNAseq datasets and, in the present study, the authors conclude that a "stress response" module characterized by expression of TGFb1 represents a key "checkpoint" in microglial aging in midlife, after which the cells can move along distinct transcriptional trajectories as aging progresses. This is an intriguing possibility. However, pseudotime analyses need to be validated via additional bioinformatics as well as follow-up experiments. Indeed, Heumos et al, in their Nature Genetics "Expert Guidelines" Review, emphasize that "inferred trajectories might not necessarily have biological meaning." They recommend that "when the expected topology is unknown, trajectories and downstream hypotheses should be confirmed by multiple trajectory inference methods using different underlying assumptions."(15) Numerous algorithms are available for trajectory inference (e.g. Monocle, PAGA, Slingshot, RaceID/StemID, among many others) and their performance and suitability depends on the individual dataset and nature of the trajectories that are to be inferred. It is recommended to use dynGuidelines(16) for the selection of optimal pseudotime analysis methods. In the present manuscript, the authors do not provide any justification for their use of Monocle 3 over other trajectory inference approaches, nor do they employ a secondary trajectory inference method to confirm observations made with Monocle 3. Finally, follow-up validation experiments that the authors carry out have their own limitations and caveats (see below). Hence, while the microglial aging trajectories identified by this study are intriguing, they remain hypothetical trajectories that need to be proven with additional follow-up experiments.
We thank the reviewer for their suggestion. We have utilized the dynGuidelines kindly provided by the reviewer to utilize an additional trajectory inference tool to analyze our data. We selected Scorpius based on the structure of our data. The tool has provided additional support that microglia progress from a homeostatic state (Cx3cr1, Mef2c) to the induction of stress genes (Hspa1, Atf3) at an intermediate point during aging progression. Furthermore, we observe a concordant increase in ribosomal protein genes at a time point in the pseudotime analysis immediately prior to activation of inflammation-related genes (Il1b, Cst7). These additional analyses support the main findings of our original pseudotime analysis and have been added to the manuscript as Figure S3C,D. Additionally, in the statistical test that uncovers differentially expressed genes along the pseudotime trajectory in this analyses, we find that Tgfb1 is one of the genes that is differentially expressed with peak expression at an intermediate timepoint along the pseudotime trajectory. Furthermore, we have done some preliminary trajectory analysis with slingshot (Street et al, BMC Genomics, PMID: 29914354) that found a similar trajectory with analogous gene expression patterns and dynamic expression of Tgfb1.
To follow up on the idea that TGFb1 signaling in microglia plays a key role in determining microglial aging trajectories, the authors use RNAscope to show that TGFb1 levels in microglia peak in middle age. They also treat primary LPS-activated microglia with TGFb1 and show that this restores expression of microglial homeostatic gene expression and dampens expression of stress response and, potentially, inflammatory genes. Finally, they utilize transgenic approaches to delete TGFb1 from microglia around 8-10mo of age and scRNAseq to show that homeostatic signatures are lost and inflammatory signatures are gained. Hence, findings in this study support the idea that TGFb1 can strongly regulate microglial phenotype. Loss of TGFb1 signaling to microglia in adulthood has already been shown to cause decreased microglial morphological complexity and upregulation of genes typically associated with microglial responses to CNS insults(17-19). TGFb1 signaling to microglia has also been implicated in microglial responses to disease and manipulations to increase this signaling can improve disease progression in some cases(19). In this light, the findings in the present study are largely confirmatory of previous findings in the literature. They also fall short of unequivocally demonstrating that TGFb1 signaling acts as a "checkpoint" for determining subsequent microglial aging trajectory. To show this clearly, one would need to perturb TGFb1 signaling around 12mo of age and carry out sequencing (bulkRNAseq or scRNAseq) of microglia at 18mo and 24mo. Such experiments could directly demonstrate whether the whole microglial population has been diverted to the TGFb1-low aging trajectory (that progresses through a translational burst state to an inflammation state as proposed). Future development of tools to tag TGFb1 high or low microglia could also enable fate tracing type experiments to directly show whether the TGFb1 state in middle age predicts cell state at later phases of aging.
We apologize for the use of the term “checkpoint” when referring to the role of Tgfb1 in microglial aging. Instead, our model posits that Tgfb1 expression increases in response to the early insults of the aging process in an attempt to return microglia to homeostasis. Therefore, this would predict that increasing TGFB1 levels after an insult would decrease activation and age-related progression of microglia, which we demonstrate in vitro (Figure 3). Alternatively, the loss of TGFB1 should prevent microglia from returning to a homeostatic state after an age-related stressor, and thus increase the number of microglia in activated states. We observe this increase in activated microglia in our middle-aged microglia-specific Tgfb1 knockout mouse model. Furthermore, the haploinsufficiency of Tgfb1 at this age indicates that TGFB1 signaling in microglia is sensitive to relative levels of Tgfb1. The transient increase in Tgfb1 expression further suggests that the threshold for TGFB1 signaling is dynamic. Finally, RNA-Seq analysis of both in vitro TGFB1 supplemented microglia and in vivo Tgfb1 depleted microglia highlight that TGFB1 alters the aging microglia transcriptome. Combined, these results provide evidence that Tgfb1 modulates advancement of microglia through an aging continuum.
The present study would also like to draw links between features of microglial aging in the hippocampus and a decline in hippocampal-dependent cognition during aging. To this end, they carry out behavioral testing in 8-10mo old mice that have undergone microglial-specific TGFb1 deletion and find deficits in novel object recognition and contextual fear conditioning. While this provides compelling evidence that TGFb1 signaling in microglia can impact hippocampus-dependent cognition in midlife, it does not demonstrate that this signaling accelerates or modulates cognitive decline (see below). Age-associated cognitive decline refers to cognitive deficits that emerge as a result of the normative brain aging process (20-21). For a cognitive deficit to be considered age-associated cognitive decline, it must be shown that the cognitive operation under study was intact at some point earlier in the adult lifespan. This requires longitudinal study designs that determine whether a manipulation impacts the relationship between brain status and cognition as animals age (22-24). Alternatively, cross-sectional studies with adequate sample sizes can be used to sample the variability in cognitive outcomes at different points of the adult lifespan (22-24) and show that this is altered by a particular manipulation. For this specific study, one would ideally demonstrate that hippocampal-based learning/memory was intact at some point in the lifespan of mice with microglial TGFb1 KO but that this manipulation accelerated or exacerbated the emergence of deficits in hippocampal-dependent learning/memory during aging. In the absence of these types of data, the authors should tone down their claims that they have identified a cellular and molecular mechanism that contributes to cognitive decline.
We agree with the reviewer that to adequately demonstrate an age-dependent effect of microglia-derived TGFB1 on cognition it is necessary to perturb microglial TGFB1 at young and mature ages and assess the age-dependent effect on cognition. To address this, we have now performed a complementary behavioral study utilizing the Tmem119-CreER mouse model to drive the microglia-specific excision of Tgfb1 in two separate cohorts of mice – one young (2-3 months) and one in mature mice (7-8 months) – followed by cognitive testing. Using the novel object recognition test, we find that young mice of all genotypes (WT, Tgfb1 Het and Tgfb1 cKO ) retain the ability to recognize the novel object (as determined by having a significant preference in exploring the novel object). Alternatively, only the WT mature mice demonstrate a preference for the novel object, while the Tgfb1 Het and Tgfb1 cKO show no preference for the novel object. These behavioral data demonstrate an age-dependent necessity for microglia-specific TGFB1 in in maintain proper hippocampal-dependent memory and is now included in the manuscript as revised Figure 4I-J. We have also included additional behavioral tests (Y-Maze and open field) that did not show any difference between the genotypes as Figure S6D-G. Unfortunately, we were unable to perform the fear conditioning testing, as our apparatus broke during this time. Together, these results reveal that there is an age-dependent necessity for microglia-derived TGFB1 for hippocampal-dependent cognitive function.
A final point of clarification for the reader pertains to the mining of previously generated data sets within this study. The language in the results section, methods, and figure legends causes confusion about which experiments were actually carried out in this study versus previous studies. Some of the language makes it sound as though parabiosis experiments and experiments using mouse models of Alzheimer's Disease were carried out in this study. However, parabiosis and AD mouse model experiments were executed in previous studies (25,26), and in the present study, RNAseq datasets were accessed for targeted data mining. It is fantastic to see further mining of datasets that already exist in the field. However, descriptions in the results and methods sections need to make it crystal clear that this is what was done.
The reviewer makes an excellent point. While we referenced the public dataset in the original manuscript, the citation style of superscripted numbers diminishes our ability to adequately reference the datasets. Therefore, we have added the names of the first authors (Palovics for the parabiosis dataset and Sala Frigerio for the Alzheimer’s Disease dataset) to all the instances in the results and figure legends when we refer to these datasets.
Additional recommendations:
Major comments.
(1) There is some ambiguity surrounding how to interpret the microglial TGFb1 knockout that seems incompatible with viewing this molecule as a "checkpoint" in microglial aging. TGFb1 is believed to be primarily produced by microglia. Secreted TGFb1 is then detected by microglial TGFbR2. Are the microglia that have high levels of TGFb1 in middle age signaling to themselves (autocrine signaling)? Or contributing to a local milieu that impacts multiple neighbor microglia (paracrine signaling)? The authors could presumably look in their own dataset to evaluate microglial capacity to detect TGFb1 via its receptors.
We thank the reviewer for this insightful suggestion. We have undertaken analysis of our dataset to assess whether Tgfb1 acts through autocrine or paracrine signaling. To do so, we reanalyzed our microglia aging scRNA-Seq dataset leveraging the variation in microglia Tgfb1 expression to probe the relative activity of TGFB1. Specifically, we partitioned microglia into quartiles based on their Tgfb1 expression, and subsequently investigated the expression of TGFB signaling effectors and targets. High expression of downstream TGFB signaling pathway components in microglia with high Tgfb1 expression would point to autocrine mechanisms while, alternatively, high expression of downstream TGFB signaling pathway components in microglia with low Tgfb1 expression would point to paracrine mechanisms. We observed highest expression of TGFB signaling pathway components and targets in microglia with the highest expression of Tgfb1. These data suggest that Tgfb1 acts through an autocrine mechanism. These results have been added to our manuscript as Figure S4E-G. Additionally, while our manuscript was under review, a paper by Bedolla et al (Nature Communications 2024; PMID: 38906887) was published that investigated the role of Tgfb1 in adult microglia. This paper utilized orthogonal techniques – sparse microglia-specific Tgfb1 knockout and IHC - to also suggest that microglia utilize autocrine Tgfb1 signaling. Together, these complementary data provide strong evidence that Tgfb1 acts through an autocrine mechanism in adult microglia.
(2) Conclusions of the study rest on the assumption that microglial inflammatory responses are a central driver of cognitive decline. They assume that manipulations that increase microglial progression into an inflammatory state will negatively impact cognitive function. Although there are certainly a lot of data in the field that inflammatory factors can impact synaptic function, additional experiments would be required to unequivocally demonstrate that a "TGFb1 dependent" progression of microglia to an inflammatory state underlies any observed changes in cognition. For example, in the context of microglial TGFb1 deletion, can NSAIDs or blockers of soluble TNFa (e.g. XENP345), or blockers of SPP1, etc. rescue behavior? Can microglial depletion in this context rescue behavior? Assuming behavior was carried out in the same microglial TGFb1 KO mice that were used for microglial scRNAseq, they could also carry out linear regression-type analyses to link microglial inflammatory status to the behavioral performance of individual mice. In the absence of additional evidence of this sort, the authors should tone down claims about mechanistic relationships between microglial state and cognitive performance.
We thank the reviewer for realizing that the link between cognition and inflammation in our paper is speculative. Therefore, we have taken the reviewer’s advice and toned down the claims linking inflammation to cognition in our manuscript. Instead, we connect the disruption in cognition to what is observed in our data, a loss of microglia homeostasis and a shift in the microglia aging trajectories.
Additional Recommendations:
Minor comments:
(1) Ideally at some point in the results or discussion, the authors should acknowledge that the hippocampus has highly distinct sub-regions and that microglia show different functions and properties across these sub-regions (e.g. microglia in hilus and subgranular zone vs microglia in stratum radiatum, vs microglia immediately adjacent to or embedded within stratum pyrimidale). Do expression levels of TGFb1 and microglial aging trajectories vary across sub-regions? To what extent can this account for heterogeneity of aging trajectories observed in microglial aging within the hippocampus?
We are interested in how microglia heterogeneity during aging is influenced by the specific functions, and thus microenvironments within the hippocampus. Therefore, we have expanded our IHC analysis of microglia to determine how the microenvironment influences microglia phenotypes by looking at several different regions of the hippocampus. We have included this regional analysis as Figure S2 in the manuscript. This analysis has revealed region-specific effects on microglia activation during aging.
(2) For immunohistochemistry data, it is not particularly convincing to see one example of one cell from each condition. Generally, an accepted approach in the field is to present lower magnification images accompanied by zoom panels for several cells from each field of view. This reassures the reader that specific cells haven't simply been "cherry-picked" to support a particular conclusion.
To allay the concerns of the reviewer that cells haven’t been “cherry-picked”, we have provided low magnification images for the aging CD68 and NF<sub>κ</sub>B stains in Supplemental Figure S2.
(3) In immunohistochemistry data, have measures been taken to ensure that observed signals are not simply autofluorescence that becomes prominent in tissues with aging? (i.e. use of trueblack or photoquenching of tissue prior to staining) See PMID 37923732
We agree that autofluorescence, at least partially due to the accumulation of lipofuscin, becomes prominent in certain regions and cells of the hippocampus during aging. This most prominently occurs in the microglia of the hilus. This autofluorescence has a particular subcellular distribution, as it is localized to lyso-endosomal bodies. The microglia activation marker CD68 is also localized to lysosomes. A previous publication by Burns et al (eLife; PMID: 32579115) identified autofluorescent microglia (AF+) with unique molecular profiles that accumulate with age. They posited that these AF+ microglia resembled other microglia subsets that have pronounced storage compartments, such as the pro-inflammatory lipid droplet-containing microglia that accumulate with age reported by Marschallinger et al (Nature; PMID: 31959936). As such, autofluorescence present in microglia potentially represents distinctive and functional states of microglia. Our CD68 immunostaining accumulates with age, which could overlap with autofluorescent storage bodies. Thus, we performed a complementary CD68 immunostaining in an independent cohort of young (3 months) and aged (24 months) mice with autofluorescence quencher TrueBlack, and found that the staining pattern and accumulation of CD68 microglia with age persisted as previously observed after use of this quencher (see Authpr response image 1). Images are IBA1 (cyan) and CD68 (yellow) with the molecular layer (ML), granule cell (GC), and hilus illustrated and corresponding quantification provided (Two-way ANOVA with Sidak’s multiple comparisons test; ***P<0.001; ****P<0.0001).
We would like to note that the subcellular localization of the other immunostainings included in the manuscript was distinct from CD68, and not likely to be associated with the autofluorescent storage bodies. Additionally, our RNAScope staining for Tgfb1 did not show an accumulation with age, but rather a transient increase at 12 months of age, which indicates that the interpretation of the RNAScope stain for Tgfb1 was not unduly influenced by autofluorescence.
Author response image 1.
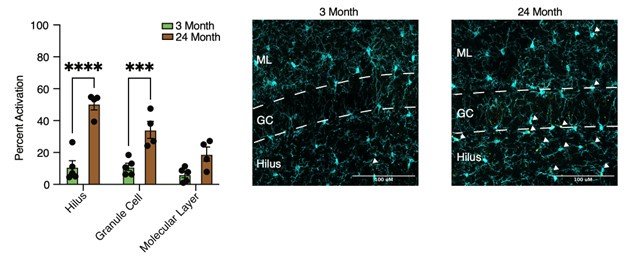
(4) Ideally, more care is needed with the language used to describe microglial state during aging. The terms "dystrophic," "dysfunctional," and "inflammatory" all carry their own implications and assumptions. Many changes exhibited by microglia during aging can initially be adaptive or protective, particularly during middle age. Without additional experiments to show that specific microglial attributes during aging are actively detrimental to the tissue and additional experiments to show that microglia have ceased to be capable of engaging in many of their normal actions to support tissue homeostasis, the authors should exercise caution in using terms like dysfunctional.
We appreciate the reviewers’ suggestion. To allay the concerns of the reviewer about the multiple implications of terms such as “dysfunctional” and “inflammatory”, we have tried to replace them throughout the text with more specific terms.
Reviewer #2:
That said, given what we recently learned about microglia isolation for RNA-seq analysis, there is a danger that some of the observations are a result of not age, but cell stress from sample preparation (enzymatic digestion 10min at 37C; e.g. PMID: 35260865). Changes in cell state distribution along aging were made based on scRNA-seq and were not corroborated by any other method, such as imaging of cluster-specific marker expression in microglia at different ages. This analysis would allow confirming the scRNA-seq data and would also give us an idea of where the subsets are present within the hippocampus, and whether there is any interesting distribution of cell states (e.g. some are present closer to stem cells?). Since TGFb is thought to be crucial to microglia biology, it would be valuable to include more analysis of the mice with microglia-specific Tgfb deletion e.g. what was the efficiency of recombination in microglia? Did their numbers change after induction of Tgfb deletion in Cx3cr1-creERT2::Tgfb-flox mice.
We thank the reviewer for their comment regarding potential ex vivo transcriptional alterations with the approaches used in our study. We performed our aging microglia scRNA-Seq characterization prior to the release of Marsh et al (Nature Neuroscience; PMID: 35260865), which revealed the potential transcriptional artefacts induced by isolation. That being said, we took great care to minimize the amount of time samples were subjected to enzymatic digestion (15 minutes) and kept cells at 4C during the remainder of the isolation. Furthermore, we performed all isolations simultaneously, so that transcriptional changes induced by the isolation would be present across all ages and should not be observed during our analysis unless indicative of a true age-related change. Additionally, we have corroborated changes in cell state distribution across ages using several markers (Tgfb1 and KLF2 for the intermediate stress state, S6 for the translation state, and NFKB and CD68 for activation states). In the revised manuscript, we have added additional hippocampal subregion analysis of several IHC immunostains to provide spatial insights into the microglia aging process (Figure S2). This analysis reveals unique spatial dynamics of microglia aging. For example, as the reviewer foresaw, we found that the granule cell layer (the location of adult hippocampal neurogenesis) had a more pronounced age-associated progression of microglial activation than several other regions. A subset of regions had minimal levels of activation during aging, such as the molecular layer and the stratum radiatum of the CA1 (inner CA1in the manuscript) – regions enriched in synaptic terminals. Furthermore, this analysis highlights the susceptibility of microglia aging to microenvironmental influences.
Regarding the temporally controlled microglia-specific genetic KO mouse model used in our original submission, the Cx3cr1-CreER allele selected (B6.129P2(Cg)-Cx3cr1tm2.1(cre/ERT2)Litt/WganJ) has been reported to have very high recombination efficiency (~94% in Parkhurst et al (Cell; PMID: 24360280)), and we used a tamoxifen induction protocol very similar to Faust et al. (Cell Reports; PMID: 37635351) that achieved ~98% recombination (they injected 100mg/kg for 5 days, while we injected 90mg/kg for 5 days). We analyzed our scRNA-Seq data for the expression of Tgfb1 and found that the knockout mice had a 67% reduction in cells expressing higher levels of Tgfb1 (see panel A in Author response image 2). This is likely a large underestimate of the recombination efficiency, as exon 3 is floxed and residual nonfunctional transcripts could be present, given nonsense-mediated decay is not realized in a number of knockout lines (Lindner et al, Methods, PMID: 33838271). We likely achieved a much higher excision efficiency. We would like to highlight that our data indicating increased microglia activation after tamoxifen treatment (Figure S5A) and the involvement of autonomous signaling (Figure S4E-G) are consistent with recently published work by Bedolla et al, (Nature Communications; PMID: 38906887). Additionally, as part of the revision process, we have now corroborated our behavioral data using and independent temporally controlled microglia-specific KO mouse model - Tmem119-CreER::Tgfb1 knockout mice (Figure 4I-K). We performed qPCR on sorted microglia to determine RNA levels in wildtype and knockout mice. Relative levels of Tgfb1 and exon 3 of Tgfb1 (the floxed exon) on technical replicates of 3 pooled samples indicated overall loss of Tgfb1 expression, as well as undetectable levels of exon 3 as normalized to Actb (see panel B in Author response image 2).
Author response image 2.
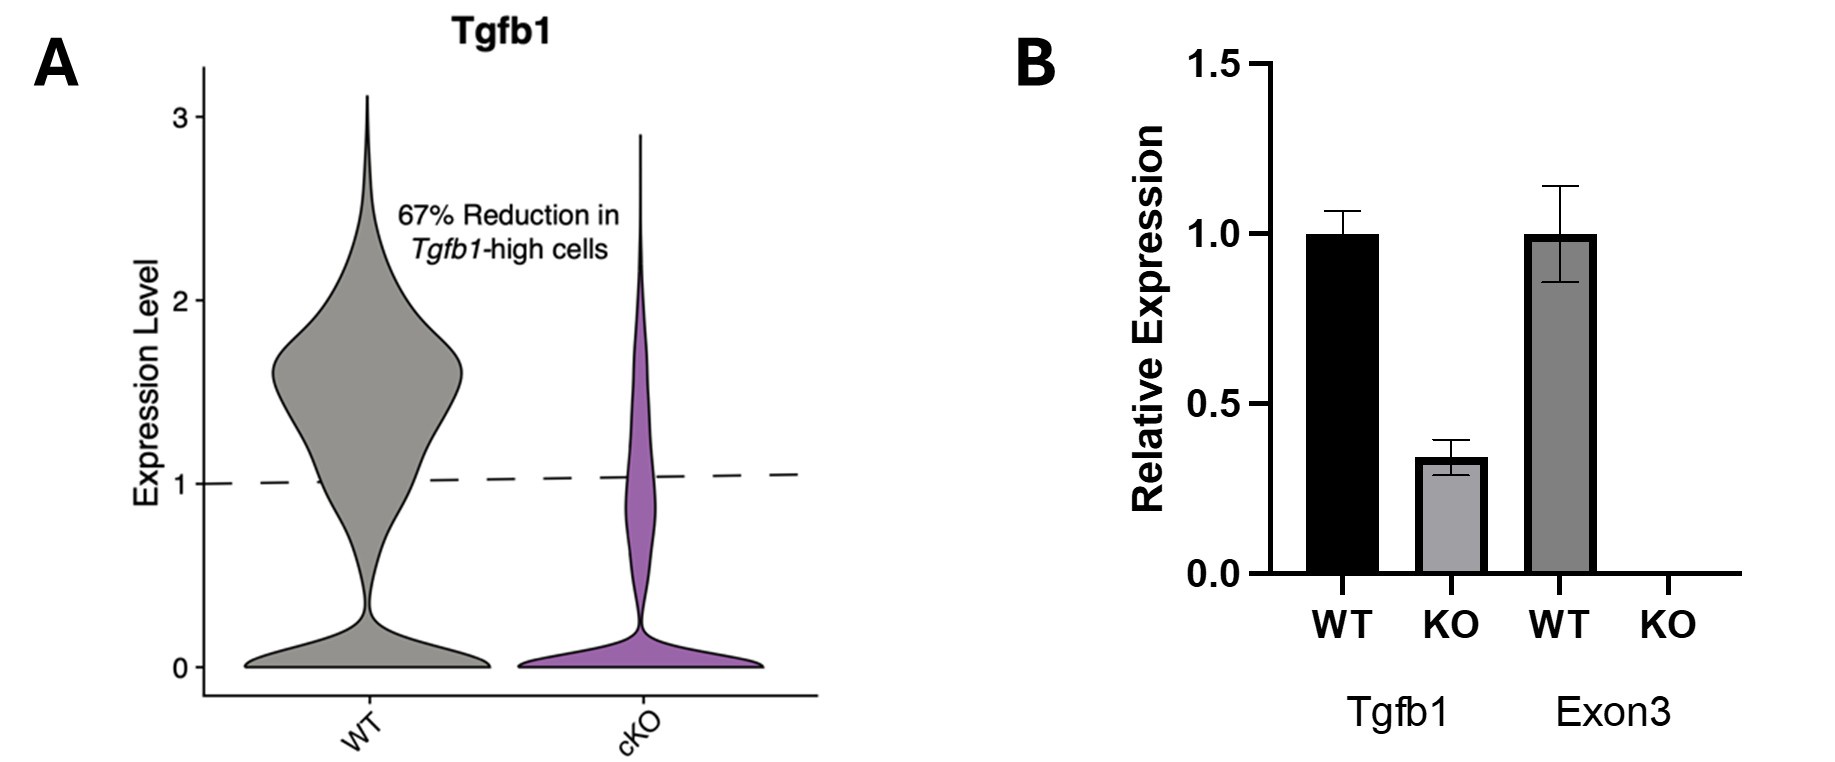
With respect to the effects of aging and Tgfb1 on microglia density, we find a slight region-specific increase in microglia density with age (see Author response image 3). The density of Iba1 cells across hippocampal regions was analyzed at 3 and 24 months of age (see panel A in Author response image 3) and along an aging continuum at 3, 6, 12, 18, and 24 months (see panel B in Author response image 3). These data are also included in the revised manuscript (Figure S2D-F).
Author response image 3.
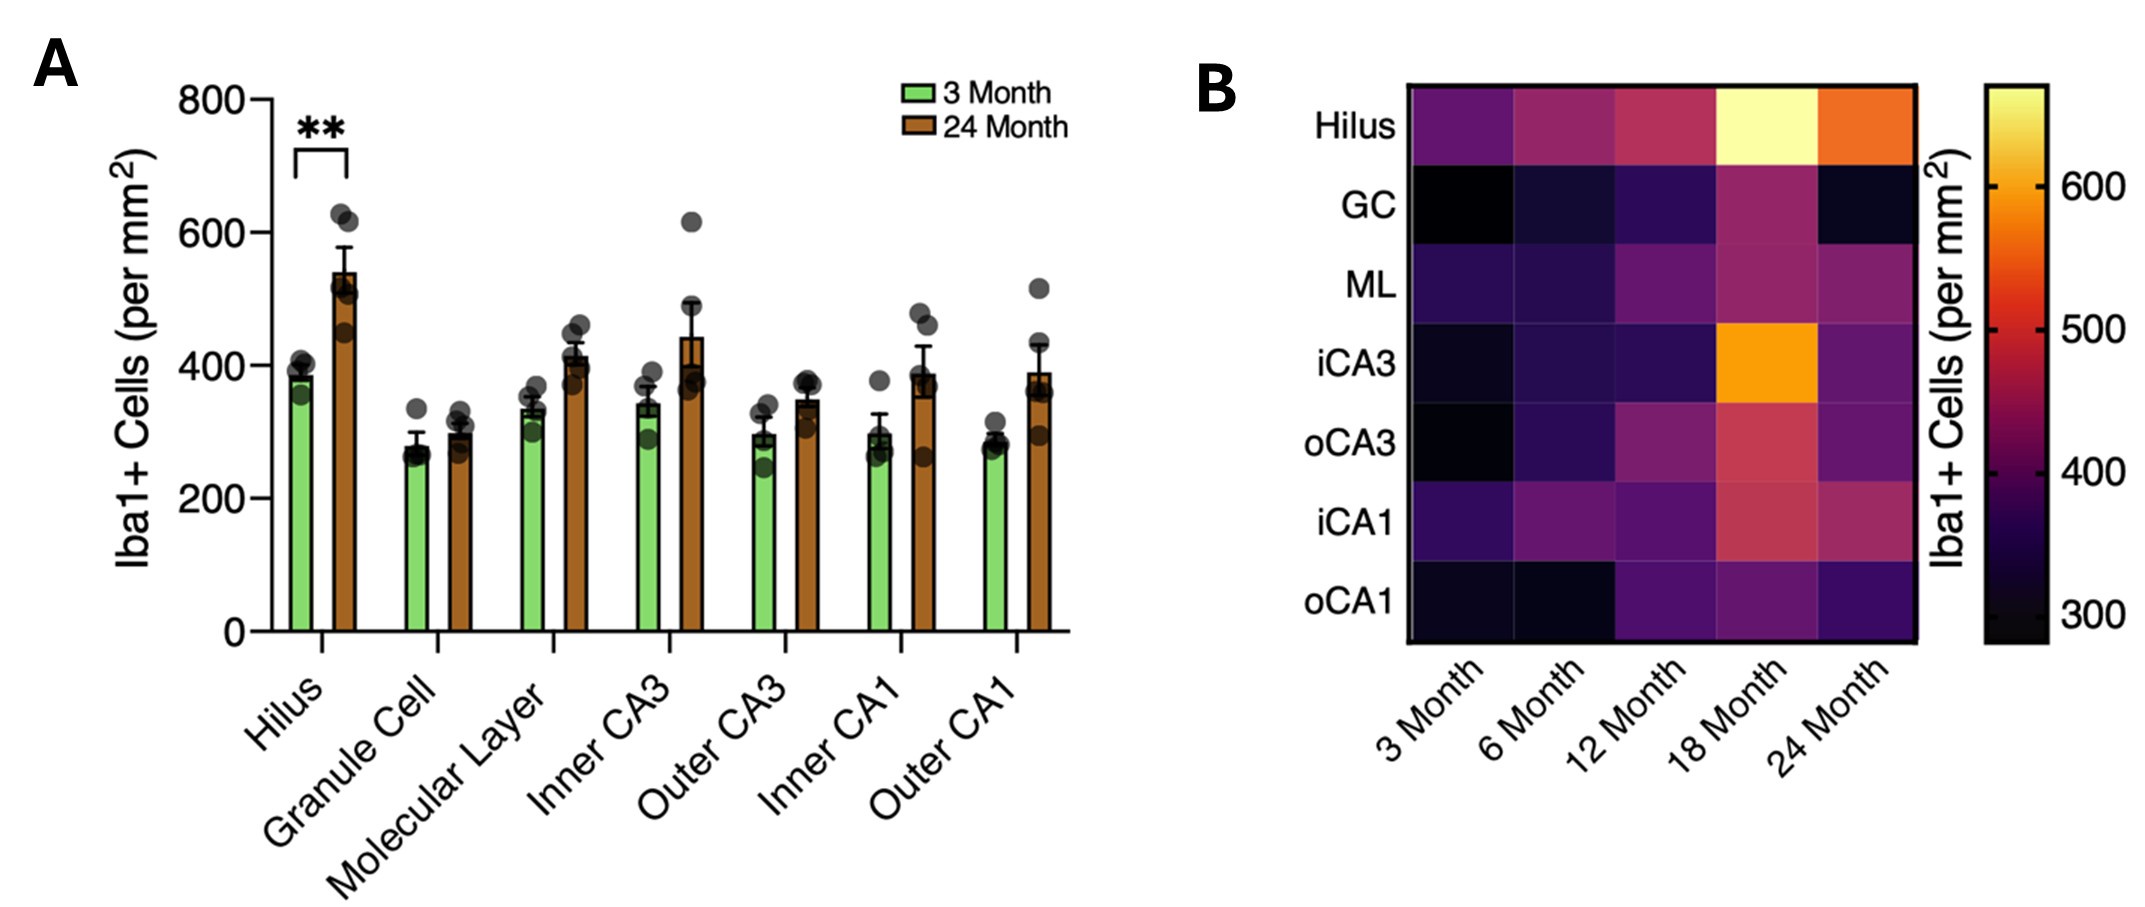
Deletion of Tgfb1 also had region-specific effects on microglia. While there was no difference in microglia density between wildtype and heterozygous microglia, there was a significant increase in microglia density in the hilus and molecular layers in knockout mice (see Author response image 4) and included in the revised manuscript (Figure S5A). These data indicate that there are subtle region-specific increases in microglia density with age, as well as following the deletion of Tgfb1 from microglia of mature mice.
Author response image 4.
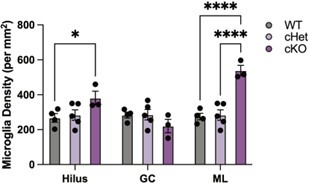
Additional Recommendations:
(1) The problem of possible digestion artifacts in scRNA-seq should be at least addressed in the discussion as a caveat in data interpretation. Staining for unique cluster markers in undigested tissue would solve the problem. It can be done with microscopy or using flow cytometry, but for this microglia, isolation should be done with no enzymes or with Actinomycin (PMID: 35260865).
The ex vivo activation signature uncovered by Marsh et al. (Nature Neuroscience; PMID: 35260865) arises from the digestion methods used to isolate microglia. We took the utmost care in processing our microglia identically within experiments, which should minimize the amount of uneven ex vivo activation of microglia. This is borne out by the structures of our single-cell sequencing data. Unlike Marsh et al_. where they observe unique cluster after addition of their inhibitors, we do not see any clusters unique to a single condition, suggesting that any influence of _ex vivo activation was evenly distributed.
Importantly, as suggested by the review, we have we have complemented our scRNA-Seq analysis by corroborating several markers for various stages of microglia aging progression using RNAScope and IHC in intact tissue. Specifically, the transient age-dependent increase in Tgfb1 high microglia was confirmed using RNAScope (Figure 3B), the age-related increase in ribosomal high microglia was confirmed using S6 immunostaining (Figure 3I), and the increase of various markers of age-associated activation (C1q, CD68 and NFkB) was confirmed using immunostaining (Figure 1F and Figure S2D-I). Additionally, we have also performed immunostainings for KLF2 and confirmed peak microglia expression at 18 months of age with lower levels at 24 months of age (Figure 2H).
(2) The figures of GO and violin plots are not easy to follow sometimes... what are the data points in the violin plots, maybe worth showing them as points? For the GO, e.g. in 3D, 3J, including a short description of the figure could help, e.g. in Figure 1. it was clear.
We chose not to include the datapoints in the violin plots for aesthetic purposes. Each violin plot would have had hundreds of points that would have made the plots very busy and hidden the structure of the distribution. In Author response image 5 we show the violin plot in Figure 2M with (panel A) and without (panel B) individual points. In a small format, the points overlap and become jumbled together. Therefore, we chose to present the violin plots without points for clarity on the data structure. As for the gene ontology plots in Figure 3, we have updated the descriptions in both the text and figure legends to provide clarification on what they represent.
Author response image 5.
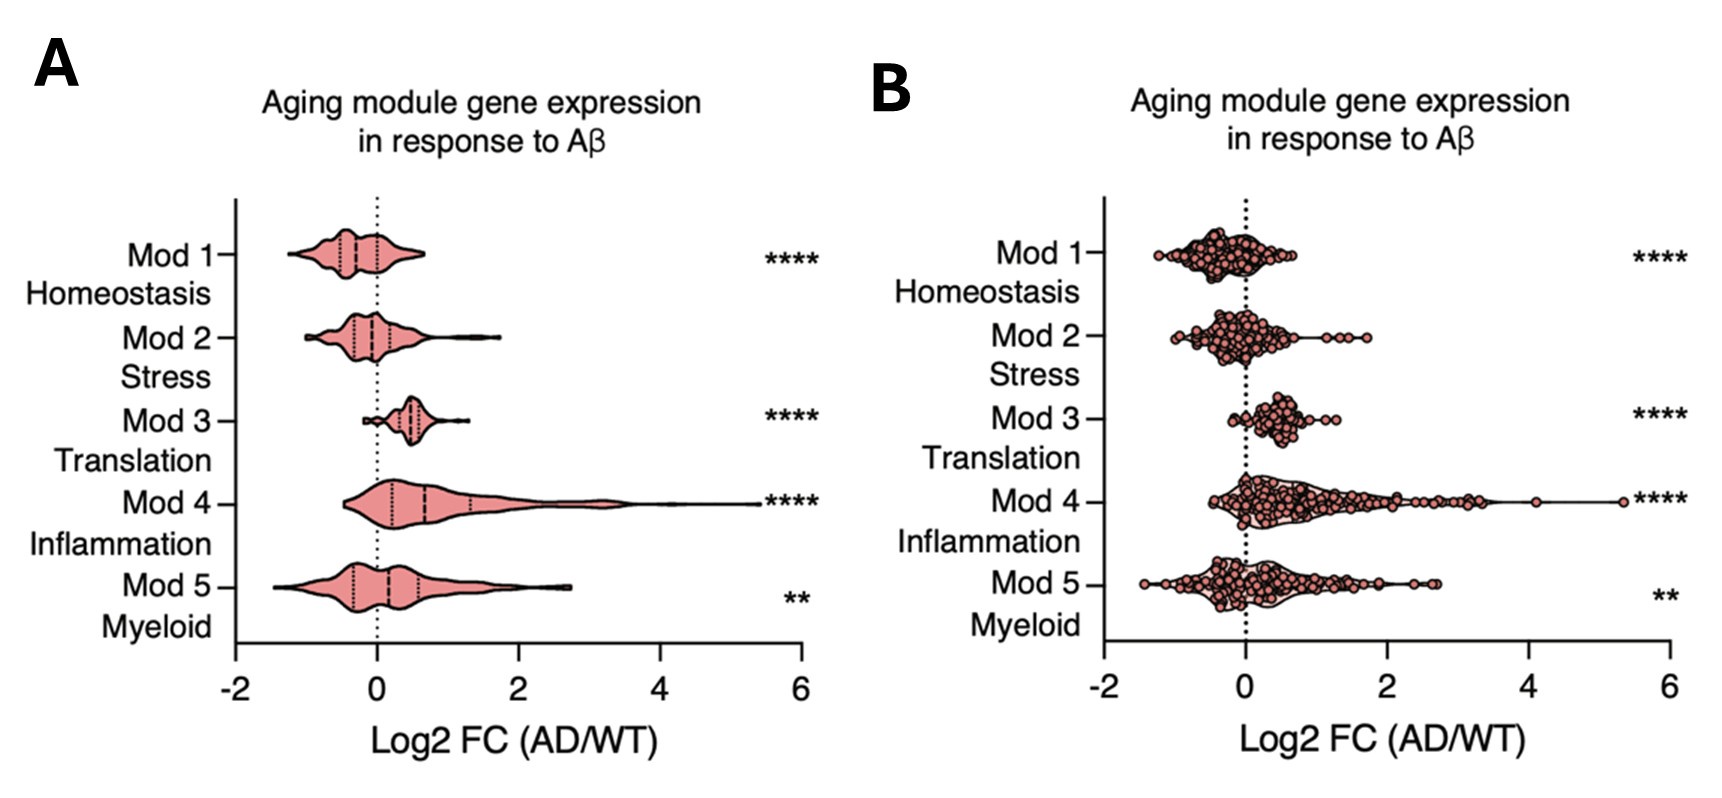
(3) I'm very curious to see the mechanism of action of "aged" microglia in the TGFb-depletion model. Is it creating hostile conditions for stem cells, or we have increased synapse loss? Something else?
We thank the reviewer for their insightful questions. We would like to note that during the revision process of our manuscript, a complementary study was published reporting that the loss of microglia-derived Tgfb1 leads to an aberrant increase in the density of dendritic spines in the CA1 region of the hippocampus (Bedolla et al, Nature Communications, PMID: 38906887). The data from Bedolla et al, shows sparsely labeled neurons in the CA1 with a mGreenLantern expressing virus in mice the had Tgfb1 deleted from microglia using the Cx3cr1-CreERT driver (Figure 7U,V). Additionally, McNamara et al (Nature; PMID: 36517604) demonstrated that microglia-derived Tgfb1 signaling regulates myelin integrity during development and several studies have revealed links between Tgfb1 signaling and altered neurogenesis (e.g., He et al, Nature, PMID: 24859199 and Dias et al, Neuron, PMID: 25467979). Together, this growing body of work indicates that microglia-derived TGFB1 regulates myelination, neurogenesis and synaptic plasticity, which have all been shown to play a role in cognition.
Author response:
The following is the authors’ response to the original reviews.
Reviewer #1 (Recommendations For The Authors):
Specific comments to improve the quality of the work:
(1) The choice of subunits to tag are really not ideal. In the available structures of the human proteasome, The C-terminus of Rpn3/PSMD3 points directly toward the ATPase pore and is likely to disrupt the structure and/or dynamics of the proteasome during proteolysis (see comments regarding controls for functionality below). Similarly, the C-terminal tail of Rpt1/PSMC2 has a key role in the opening of the 20S core particle gate for substrate translocation and processing (see 2018 Nature Communications, 9:1360 and 2018 Cell Reports 24:1301-1315), and Alpha3/PSMA4 can be substituted by a second copy of Alpha4/PSMA7 in some conditions (although tagging Alpha3/PSMA4 would admittedly provide a picture of the canonical proteasome interactome while actively excluding the interactome of the non-canonical proteasomes that form via replacement of Alpha3/PSMA4). Comparison of these cell lines with lines harboring tags on subunits that are commonly used for tagging in the field because of a lack of impacts, such as the N-terminus of Rpn1/PSMD2, the C-terminus of Rpn11/PSMD14, and the C-terminus of Beta4/PSMB2 would help instill confidence that the interactome reported largely arises from mature, functional proteasomes rather than subcomplexes, defective proteasomes, or other species that may occur due to tagging at these positions.
We thank the reviewer for pointing this out. The original purpose of our strategy was to establish proximity labeling of proteasomes to enable applications both in cell culture and in vivo. The choice of PSMA4 and PSMC2 was dictated by previous successful tagging with GFP in mammalian cells (Salomons et al., Exp Cell Res 2010)(Bingol and Schuman, Nature 2006). However, the choice of C-terminal PSMC2 might have been not optimal. HEK293 cells overexpressing PSMC2-BirA show slower growth and the BioID data retrieve higher enrichment of assembly factors suggesting slower assembly of this fusion protein in proteasome. Although we did not observe a negative impact on overall proteasome activity and PSMC2-BirA was (at least in part) incorporated into fully assembled proteasomes as indicated by enrichment of 20S proteins.We apologize for not making it clear that we labeled the N-terminus of PSMD3/Rpn3 and not the C-terminus (Figure 1a and S1a). Therefore, we included in Figure S1a of the revised manuscript structures of the proteasome where the tagged subunit termini are highlighted: C-terminus for PSMA4 and PSMC2 and N-terminus for PSMD3. Additionally, we would like to point out that, differently from PSMC2-BirA, cells expressing BirA-PSMD3 did not show slower growth, and BioID data showed a more homogenous enrichment of both 19S and 20S proteins, as compared to PSMC2-BirA (Figure 1D and 1E). However, the overall level of enrichment of proteasome subunits was not comparable to PSMA4-BirA and, therefore, we opted for focusing the rest of the manuscript on this construct.
In support of this point, the data provided in Figure 1E in which the change in the abundances of each proteasome subunit in the tagged line vs. the BirA control line demonstrates substantial enrichment of the subcomplexes of the proteasome that are tagged in each case; this effect may represent the known feedback-mediated upregulation of new proteasome subunit synthesis that occurs when proteasomal proteolysis is impaired, or alternatively, the accumulation of subcomplexes containing the tagged subunit that cannot readily incorporate into mature proteasomes. Acknowledging this limitation in the text would be valuable to readers who are less familiar with the proteasome.
We would like to clarify that the data shown in Figure 1E do not represent whole proteome data, but rather log2 fold changes vs. BirA* control calculated on streptavidin enrichment samples. The differences in the enrichment of the various subcomplexes between cell lines derives from the fact that the effect size of the enrichment depends on both protein abundance in the isolated complexes, but also on the efficiency of biotinylation. The latter will be higher for proteins located in closer proximity to the bait. A similar observation was pointed out in a recent publication (PMID:36410438) that compared BioID and Co-IP for the same bait. When a component of the nuclear pore complex (Nup158) was analyzed by BioID only the more proximal proteins were enriched as compared to the whole complex in Co-IP data (Author response image 1):
Author response image 1.
Proteins identified in the NUP158 BioID or pulldown experiments are filled in red or light red for significance intervals A or B, respectively. The bait protein NUP158 is filled in yellow. Proteins enriched in the pulldown falling outside the SigA/B cutoff are filled in gray. NPC, nuclear pore complex. SigA, significant class A; SigB, significant class B. Reproduced from Figure 6 of PMID: 36410438.
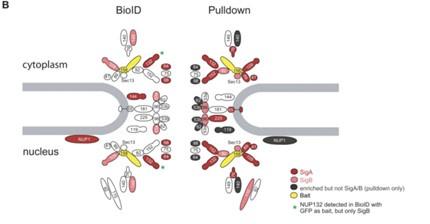
However, we would like to point out that despite quantitative differences between different proteasome subunits, both 19S and 20S proteins were found to be strongly enriched (typically >2 fold) in all the constructs compared to BirA* control line (Figure 1E). This indicates that at least a fraction of all the tagged subunits are incorporated into fully assembled proteasomes.
Regarding the upregulation of proteasome subunits as a consequence of proteasome dysfunction, we did not find evidence of this, at least in the case of PSMA4. The immunoblot shown in Figure 2A and its quantification in S3A indicate no increased abundance of endogenous PSMA4 upon tetracycline induction of PSMA4-BirA*.
(2) The use of myc as a substrate of the proteasome for demonstration that proteolysis is unaffected is perhaps not ideal. Myc is known to be degraded via both ubiquitin-dependent and ubiquitin-independent mechanisms, such that disruption of one means of degradation (e.g., ubiquitin-dependent degradation) via a given tag could potentially be compensated by another. A good example of this is that the C-terminal tagging of PSMC2/Rpt1 is likely to disrupt interaction between the core particle and the regulatory particle (as suggested in Fig. 1D); this may free up the core particle for ubiquitin-independent degradation of myc.
Aside from using specific reporters for ubiquitin-dependent vs. independent degradation or a larger panel of known substrates, analysis of the abundance of K48-ubiquitinated proteins in the control vs. tag lines would provide additional evidence as to whether or not proteolysis is generally perturbed in the tag lines.
We thank the reviewer for this suggestion. We have included an immunoblot analysis showing that the levels of K48 ubiquitylation (Figure S3d) are not affected by the expression of tagged PSMA4.
(3) On pg. 8 near the bottom, the authors accidentally refer to ARMC6 as ARMC1 in one instance.
We have corrected the mistake.
(4) On pg. 10, the authors explain that they analyzed the interactome for all major mouse organs except the brain; although they explain in the discussion section why the brain was excluded, including this explanation on pg. 10 here instead of in the discussion might be a better place to discuss this.
We moved the explanation from the discussion to the results part.
Reviewer #2 (Recommendations For The Authors):
(1) Perhaps the authors can quantify the fraction of unassembled PSMA4-BirA* from the SEC experiment (Fig. 2b) to give the readers a feeling for how large a problem this could be.
The percentages based on Area Under the Curve calculations have been added to Figure S3b.
(2) Do the authors observe any difference in the enrichment scores between proteins that are known to interact with the proteasome vs proteins that the authors can justify as "interactors of interactors" vs the completely new potential interactors? This could be an interesting way to show that the potential new interactors are not simply because of poor false positive rate calibration, but that they behave in the same way as the other populations.
We thank the reviewer for this suggestion. We analyzed the enrichment scores for 20S proteasome subunits, known PIPs, first neighbors and the remaining enriched proteins. The remaining proteins (potential new interactors) have very similar scores as the first neighbors of known interactors. This plot has been added to Figure S3g.
(3) Did the authors try to train a logistic model for the miniTurbo experiments, like it was done for the BirA* experiments? Perhaps combining the results of both experiments would yield higher confidence on the proteasome interactors.
Following the reviewers suggestion, we applied the classifier on the dataset of the comparison between miniTurbo and PSMA-miniTurbo. We found a clear separation between the FPR and the TPR with 136 protein groups enriched in PSMA-miniTurbo. We have added the classifier and corresponding ROC curve to Figure S4f and S4g.
75 protein groups were found to be enriched for both PSMA4-BirA* and PSMA4-miniTurbo (Author response image 2), including the proteasome core particles, regulatory particles, known interactors and potential new interactors. As we focused more on the identification of substrates with PSMA4-miniTurbo, we did not pursue these overlapping protein groups further, but rather used the comparison to the mouse model to identify potential new interactors.
Author response image 2.
Overlap between ProteasomeID enriched proteins (fpr<0.05) between PSMA4-BirA* and PSMA4-miniTurbo.
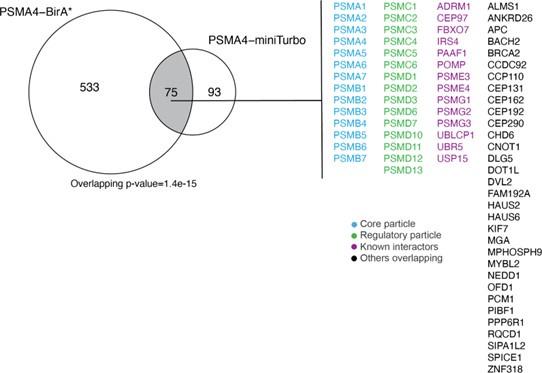
(4) Perhaps this is already known, but did the authors check if MG132 affect proteasome assembly? The authors could for example repeat their SEC experiments in the presence of MG132.
We thank the reviewer for the suggestion, however to our knowledge there are no reports that MG132 has an effect on the assembly of the proteasome. MG132 is one of the most used proteasome inhibitors in basic research and as such has been extensively characterized in the last 3 decades. The small peptide aldehyde acts as a substrate analogue and binds directly to the active site of the protease PSMB5/β5. We therefore think it is unlikely that MG132 is interfering with the assembly of the proteasome.
(5) Minor comment: at the bottom of page 8, the authors probably mean ARMC6 and not ARMC1.
We have corrected the mistake.
(6) It would be interesting to expand the analysis of the already acquired in vivo data to try to identify tissue-specific proteasome interactors. Can the authors draw a four-way Venn diagram with the interactors of each tissue?
We thank the reviewer for this suggestion. We have generated an UpSet plot showing the overlap of ProteasomeID enriched proteins in the four tissues that gave us meaningful results (Author response image 3). In order to investigate whether the observed differences in ProteasomeID enriched proteins could be meaningful in terms of proteasome biology, we have highlighted proteins belonging to the UPS that show tissue specific enrichments. We found proteasome activators such as PSME1/PA28alpha and PSME2/PA28beta to enrich preferentially in kidney and liver, respectively, as well as multiple deubiquitinases to enrich preferentially in the heart. These differences might be related to the specific cellular composition of the different tissues, e.g., number of immune cells present, or the tissue-specific interaction of proteasomes with enzymes involved in the ubiquitin cycle. Given the rather preliminary nature of these findings, we have opted for not including this figure in the main manuscript, but rather include it only in this rebuttal letter.
Author response image 3.
Upset plot showing overlap between ProteasomeID enriched proteins in different mouse organs.
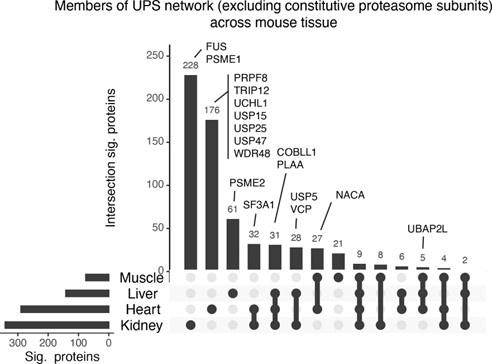
Reviewer #3 (Recommendations For The Authors):
(1) In the first paragraph of the Introduction, the authors link cellular senescence caused by partial proteasome inhibition with the efficacy of proteasome inhibitors in cancer therapy. Although this is an interesting hypothesis, I am not aware of any direct evidence for this; rather, I believe the efficacy of bortezomib/carfilzomib in haematological malignancies is most commonly attributed to these cells having adapted to high levels of proteotoxic stress (e.g., chronic unfolded protein response activation). I would suggest rephrasing this sentence.
We thank the reviewer for the comment and have amended the introduction.
(2) For the initial validation experiments (e.g., Fig. 1B), have the authors checked what level of Streptavidin signal is obtained with "+ bio, - tet" ? Although I accept that the induction of PSMA4-BirA* upon doxycycline addition is clear from the anti-Flag blots, it would still be informative to ascertain what level of background labelling is obtained without induction (but in the presence of exogenous biotin).
We tested four different conditions +/- tet and +/- biotin (24h) in PSMA4-BirA* cell lines (Author response image 4). As expected, biotinylation was most pronounced when tet and biotin were added. When biotin was omitted, streptavidin signal was the lowest regardless of the addition of tet. Compared to the -biotin conditions, a slight increase of streptavidin signal could be observed when biotin was added but tet was not added. This could be either due to the promoter leaking (PMID: 12869186) or traces of tetracycline in the FBS we used, as we did not specifically use tet-free FBS for our experiments.
Author response image 4.
Streptavidin-HRP immunoblot following induction of BirA fusion proteins with tetracycline (+tet) and supplementation of biotin (+bio). For the sample used as expression control tetracycline was omitted (-tet). To test background biotinylation, biotin supplementation was omitted (-bio). Immunoblot against BirA and PSMA was used to verify induction of fusion proteins, while GAPDH was used as loading control.
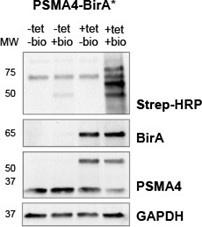
(3) For the proteasome structure models in Fig. 1D, a scale bar would be useful to inform the reader of the expected 10 nm labelling radius (as the authors have done later, in Fig. 2D).
We have added 10 nm scale bars to Figure 1d.
(4) In the "Identification of proteasome substrates by ProteasomeID" Results subsection, I believe there is a typo where the authors refer to ARMC1 instead of ARMC6.
We have corrected the mistake.
(5) I think Fig. S5 was one of the most compelling in the manuscript. Given the interest in confirming on-target efficacy of targeted degradation modalities, as well as identifying potential off-target effects early-on in development, I would consider promoting this out of the supplement.
We thank the reviewer for the comment and share the excitement about using ProteasomeID for targeted degradation screening. We have moved the data on PROTACs (Figure S5) into a new main Figure 5.
In addition, in relation to the comment of this reviewer regarding the detection of endogenous substrates, we have now included validation for one more hit emerging from our analysis (TIGD5) and included the results in Figure 4f, 4g and S4j.
Author response:
The following is the authors’ response to the original reviews
We thank the reviewers for their careful and positive assessment of our manuscript. Maybe our findings are best summarized in the model below, showing that KDM5 inhibition/loss mediates a viral mimicry and DNA damage response through the generation of R-loops in genomic repeats. This is a different mechanism from the more well studied double-stranded RNA-induced “viral mimicry” response. Our studies also suggest that KDM5 inhibition may have a larger therapeutic window than STING agonists, since KDM5 inhibition seemingly does not induce “viral mimicry” in normal breast epithelial cells.
Author response image 1.
Model of viral mimicry activation. De-repression of repetitive elements may trigger dsRNA formation, which activates the RIG-1/MDA5 pathway, as well as PKR. Alternatively, derepression of these elements may induce transcription replication conflicts (TRCs), resulting in R-loop formation. R-loops can lead to DNA damage, and/or activate the cGAS/STING pathway. Both the MAVS pathway and the cGAS/STING pathway converge to activate type I interferon (IFN) responses, resulting in decreased cell fitness and/or increased immunogenicity.
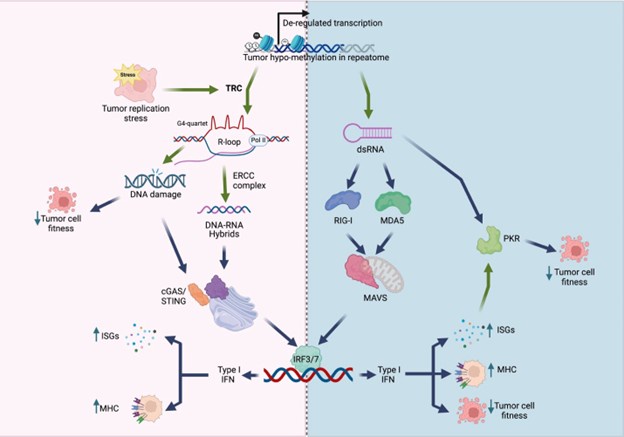
We do agree with the assessment that the study would be strengthened by in vivo studies. However, there are 4 different isoforms of KDM5 (3 in females), and existing KDM5specific inhibitors do not have adequate PK/PD properties for in vivo studies. We would also like to note that most mouse studies have not been proven to accurately predict immunotherapy responses in patients. Future studies in ex vivo tumor models would strengthen the clinical relevance of these studies. In the interim, we have added some normal macrophage studies in Figure S5 and an example of studies in normal T-cells below. Such studies will also be important to ensure that future KDM5 inhibitors do not have adverse effects on the immune system. Here, we observe that KDM5 inhibition appears to have neutral or slightly reduced T cell viability with KDM5 inhibition (Author response image 2a). However, KDM5 inhibition also results in increased CD107a expression in T-cells, indicative of a more cytotoxic phenotype (Author response image 2b). These studies suggest that KDM5 inhibitors do not have significant adverse effects on T cells or macrophages (figure S5) in the normal immune environment.
Author response image 2.
KDM5 inhibition does not have significant adverse effects on T-cells. a) Fold change proliferation of T-cells from 2 different human donors (left and right panels on graph) activated with 0.25ug/ml CD3 and treated with the indicated concentrations of C48 or a positive control (CBLB) compared to vehicle controls. b. FACS plots and histograms of CD107a surface expression (x-axis) versus forward scatter (FSC, y-axis) of T-cells from 2 different humans donors activated with 0.25ug/ml or 0.5mug/ml CD3 and treated with the indicated concentrations of C48.
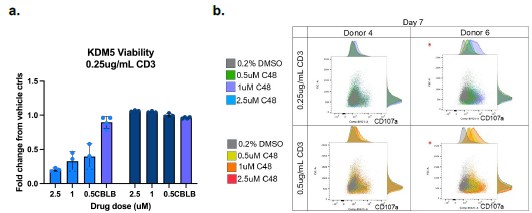
Specific comments and answers to Reviewer #1:
We have added some additional analysis of data from other breast cancer cell lines to strengthen our points (Figure S2f, Figure S3e, Figure S4g-h, k.) We have also uploaded all the data to Geo with the following accession numbers :
GSE296387: H3K4me3 CUT-and-Tag data
GSE296584: S9.6 CUT-and-Tag data
GSE296974: RNA-sequencing data
Responses to Reviewer #1 (Recommendations for the authors):
(1) We have not conducted genomic studies comparing KDM5 expression to retroelement activation status in the tumor data sets but recognize that this is important for future studies. Again, there are several KDM5 isoforms and looking at repeat expression in these larger data sets is complex. We have added some data correlating KDM5 expression with ISG signatures in Figure S3j-l as well as in the graph below (Author response image 3). The correlation with ISG and AP signatures is modest, but strongest for KDM5B and C in breast cancer data sets, consistent with our disruption data for these 2 isoforms. As mentioned above, we do agree that future studies of KDM5s along with a broader analysis of other epigenetic modifying enzymes over repeats in various cancer types will shed light on the role of histone modifying enzymes in suppressing “viral mimicry” in tumors.
Author response image 3.
Correlation between gene expression and IFN gene set GSVA scores in breast cancer cell lines. a) Pearson correlation score between gene expression and IFN signature (ISG) gene set variation analysis (GSVA) scores in breast cancer cell lines as reported in DepMap. Higher ranks indicate an inverse correlation between expression of the individual gene and the expression of the ISG gene set. Correlation ranks for KDM5A, B and C are highlighted. b) as in a), but comparing gene expression to antigen presentation (AP) GSVA scores.
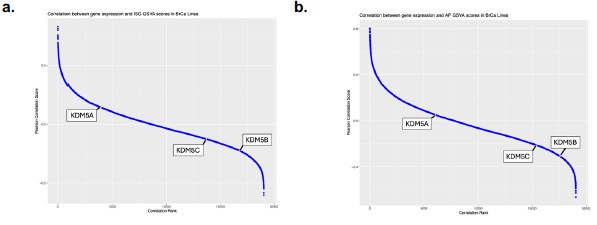
(2) We apologize for the mislabeling in figure 2B – has been corrected in the revised version.
(3) We agree that blocking the cGAS/STING pathway, only partially rescues the ISREGFP and HLA-A, B, C phenotype in HCC1428 cells. We have added data (Figure S2f) showing that this rescue is stronger in MCF7 cells. It is possible that the MDA5/MAVS pathway may also contribute to activation of the Type I interferon response. However, we have data that MAVS plays a minor (if any) role in this context, as MAVS KO minimally decreases C48-induced ISRE-GFP activity and HLA-A, B, C surface expression in HCC1428 cells (added Figure S2g).
Furthermore, there is no significant increase in dsRNA observed (using J2 antibody as a readout in immunofluorescence experiments) with C48 treatment as compared to 5’-azacytidine treatment or ADAR K/O (data not included). However, we have not performed MAVS/PKR K/O experiments to completely rule out the involvement of the dsRNA sensing pathways.
(4) These experiments were performed in the operetta imaging system, rather than confocal imaging, and therefore we do not have such images. Quantification of RNaseH1-GFP in the whole cell is reported in the figure, as RNaseH1-GFP signal is increased in both the nucleus and the cytoplasm with C48 treatment. This is not unexpected, as our data suggest that R-loop formation occurs in repetitive regions of the genome that are de-repressed by KDM5 inhibition in the nucleus, and the RNA/DNA hybrids, generated from R-loops, may activate cGAS/STING pathway in the cytoplasm.
(5) Disruption of siXPF and siXPG is relatively toxic in itself. Complete knockouts in breast cancer cells were not viable and we partially knocked down XPF using siRNA instead. We do agree that these kinds of rescue studies need to be expanded upon in future studies, but they served as further proof of the conclusions presented here.
(6) We have provided all the data in Geo and alternative representations can be made.
(7) Unfortunately, CUT-and-Tag experiments were not performed in cells expressing siXPF and therefore we cannot provide this data. However, XPF has been previously shown to be responsible for excising R-loops from the genome, rendering them detectable by cGAS/STING in the cytoplasm (Crossley et al, 2022, referenced in the current MS). Therefore, while we demonstrate that XPF knockdown attenuates type I IFN pathway activation upon KDM5 inhibition, it may not necessarily reduce R-loop formation in retroelements; it may just prevent their excision and downstream cGAS/STING activation. We do agree that CUT-and-Tag experiments in cells treated with siXPF versus siControl will have to be performed in the future to test this hypothesis.
Responses to Reviewer #2 (Recommendations for the authors):
(1) We have modified the text as well as the figure legend to state that this is a simplistic representation of the pathway in normal cells. As stated in the introduction, these pathways can be modified in tumors. The data presented suggest that the dsRNA pathway can be activated in all breast cancer cell lines tested, whereas more variation is observed in the activation of the STING pathway.
(2) The ADAR guides target ADAR 110 and p150 but not ADAR2. This has been clarified in the text.
(3) The guides have been renamed in the figure as the reviewer suggests.
(4) It has been shown by others that KDM5 can occupy the STING promoter (https://pubmed.ncbi.nlm.nih.gov/30080846/); which supports the reviewer’s suggestion that STING upregulation in HMECs may be due to increased H3K4me3 at the STING gene. However, we argue that STING upregulation is not sufficient to activate “viral mimicry” due to the absence of “tumor-specific R-loops” (due to an increase in TRC in tumor cells) in normal cells. It is interesting to note that the S9.6 signal in subtelomeric regions is increased in HMECS similar to what is observed in tumor cells. However, the S9.6 signal over other repeats is not (Author response image 4), suggesting that C48-induced increases over non-telomeric repeats are tumor specific. This suggests that the tumor-specific increases in R-loop formation, which lead to “viral mimicry” activation, are not driven by those formed in subtelomeric regions. Future studies will have to expand on these findings.
Author response image 4.
Percent of S9.6 reads that align to repetitive genome in HMEC cells. (a) % of total aligned S9.6 reads that map to subtelomeric region in HMEC cells treated with DMSO or 2.5 μM C48. (b) % of total aligned S9.6 reads that map to repetitive elements in general in HMEC cells treated as in a).
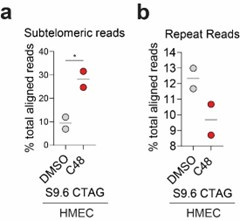
(5) Clarity on R-loop quantification has been added to the figure legend as well as in the Materials and Methods section. Mean fluorescence intensity in the whole cell (this includes both nuclear and cytoplasmic signals) was quantified together and normalized to the number of DAPI-stained nuclei per well. As mentioned above all quantified in the Operetta imaging system.
(6) We have added some data that shows that increases in H3K4me3 is observed in and around ISGs upon KDM5 inhibition (Figure S4f). However, without time course experiments it is difficult to assess whether these are direct effects of the KDM5 inhibitor or indirect effects from activation of Type I IFN (similarly to what has previously been reported with 5’-azacytidine induction of “viral mimicry”, https://pubmed.ncbi.nlm.nih.gov/26317465/).
(7) We have previously included data showing that S9.6 reads in repeats that do not display C48-mediated increases in H3K4me3 also do not increase with C48 treatment (this is now Figure S4o). In addition, we have added some data showing that repeats with increased H3K4me3 and repeats with increased transcription upon C48 treatment also have increased S9.6 reads. Repeats that display both increases in H3K4me3 and mRNA expression have even greater increases in S9.6 signal compared to repeats that have increases in either one (Figure S4m-n). Taken together, this data suggest that KDM5 inhibition increases H3K4me3 in repeats, thereby allowing for their transcription, which can increase the probability of Transcription replication conflicts (TRC) and R-loop formation at such loci.
(8) As mentioned earlier in this response, while we observe increased S9.6 reads in subtelomeric regions of HCC1428 cells upon KDM5 inhibition, we also observe this in normal HMEC cells. Since KDM5 inhibition does not induce viral mimicry in HMEC cells, this suggests that R-loops formed in subtelomeric regions do not dictate the response observed with C48 treatment in breast cancer cells.
We hope that these answers to the reviewers comments as well as the additional data provided strengthens our findings.
Author Response
The following is the authors’ response to the original reviews.
First, the authors would like to thank the reviewers and editors for their thoughtful comments. The comments were used to guide our revision, which is substantially improved over our initial submission. We have addressed all comments in our responses below, through a combination of clarification, new analyses and new experimental data.
Reviewer #1 (Public Review):
In this manuscript, the authors identified and characterized the five C-terminus repeats and a 14aa acidic tail of the mouse Dux protein. They found that repeat 3&5, but not other repeats, contribute to transcriptional activation when combined with the 14aa tail. Importantly, they were able to narrow done to a 6 aa region that can distinguish "active" repeats from "inactive" repeats. Using proximal labeling proteomics, the authors identified candidate proteins that are implicated in Dux-mediated gene activation. They were able to showcase that the C-terminal repeat 3 binds to some proteins, including Smarcc1, a component of SWI/SNF (BAF) complex. In addition, by overexpressing different Dux variants, the authors characterized how repeats in different combinations, with or without the 14aa tail, contribute to Dux binding, H3K9ac, chromatin accessibility, and transcription. In general, the data is of high quality and convincing. The identification of the functionally important two C-terminal repeats and the 6 aa tail is enlightening. The work shined light on the mechanism of DUX function.
A few major comments that the authors may want to address to further improve the work:
We thank the reviewer for their efforts and constructive comments, which have guided our revisions.
1) The summary table for the Dux domain construct characteristics in Fig. 6a could be more accurate. For example, C3+14 clearly showed moderate weaker Dux binding and H3K9ac enrichment in Fig 3c and 3e. However, this is not illustrated in Fig. 6a. The authors may consider applying statistical tests to more precisely determine how the different Dux constructs contribute to DNA binding (Fig. 3c), H3K9ac enrichment (Fig. 3e), Smarcc1 binding (Fig. 5e), and ATAC-seq signal (Fig. 5f).
We thank the reviewer for this comment, and agree that there were some modest differences in construct characteristics that were not captured in the Summary Table (6a). To better reflect the differences between constructs, we added additional dynamic range to our depiction/scoring, and believe that the new scoring system provides sufficient qualitative range to capture the difference without imposing a statistical approach.
2) Another concern is that exogenous overexpressed Dux was used throughout the experiments. The authors may consider validating some of the protein-protein interactions using spontaneous or induced 2CLCs (where Dux is expressed).
We agree that it would be helpful to determine endogenous DUX interaction with our BioID candidates. Here, we attempted co-IPs for endogenous DUX protein with the DUX antibody and were unsuccessful, which indicated that the DUX antibody is useful for detection but not efficient in the primary IP. This is why we utilized the mCherry tag for DUX IP experiments, which worked exceptionally well.
3) It could be technically challenging, but the authors may consider to validate Dux and Smarcc1 interaction in a biologically more relevant context such as mouse 2-cell embryos where both proteins are expressed. Whether Smarcc1 binding will be dramatically reduced at 4-cell embryos due to loss of Dux expression?
While we agree that it would be interesting to validate the in vivo interaction of DUX and SMARCC1 in the early embryo, it is not technically feasible for us to conduct the experiment, as the IP would require thousands of two-cell embryos, and we have the issue of poor co-IP quality with the DUX antibody.
Reviewer #2 (Public Review):
In this manuscript, Smith et al. delineated novel mechanistic insights into the structure-function relationships of the C-terminal repeat domains within the mouse DUX protein. Specifically, they identified and characterised the transcriptionally active repeat domains, and narrowed down to a critical 6aa region that is required for interacting with key transcription and chromatin regulators. The authors further showed how the DUX active repeats collaborate with the C-terminal acidic tail to facilitate chromatin opening and transcriptional activation at DUX genomic targets.
Although this study attempts to provide mechanistic insights into how DUX4 works, the authors will need to perform a number of additional experiments and controls to bolster their claims, as well as provide detailed analyses and clarifications.
We thank this reviewer for their constructive comments, and have conducted several new analyses, additional experiments and clarifications – which have strengthened the manuscript in several locations. Highlights include a statistical approach to the similarity of mouse repeats to themselves and to orthologs (Figure S1d) and clarified interpretations, a wider dynamic range to better reflect changes in DUX construct behaviors (Figure 6a), and additional data on construct behavior, including ‘inactive’ constructs (e.g C1+14aa in Figure 1a,d, new ATAC-seq in Figure S1g), and active constructs such as C3+C5+14aa and C3+C514aa (in Figure S1b).
Reviewer #3 (Public Review):
Dux (or DUX4 in human) is a master transcription factor regulating early embryonic gene activation and has garnered much attention also for its involvement in reprogramming pluripotent embryonic stem cells to totipotent "2C-like" cells. The presented work starts with the recognition that DUX contains five conserved c. 100-amino acid carboxy-terminal repeats (called C1-C5) in the murine protein but not in that of other mammals (e.g. human DUX4). Using state-of-the-art techniques and cell models (BioID, Cut&Tag; rescue experiments and functional reporter assays in ESCs), the authors dissect the activity of each repeat, concluding that repeats C3 and C5 possess the strongest transactivation potential in synergy with a short C-terminal 14 AA acidic motif. In agreement with these findings, the authors find that full-length and active (C3) repeat containing Dux leads to increased chromatin accessibility and active histone mark (H3K9Ac) signals at genomic Dux binding sites. A further significant conclusion of this mutational analysis is the proposal that the weakly activating repeats C2 and C4 may function as attenuators of C3+C5-driven activity.
By next pulling down and identifying proteins bound to Dux (or its repeat-deleted derivatives) using BioID-LC/MS/MS, the authors find a significant number of interactors, notably chromatin remodellers (SMARCC1), a histone chaperone (CHAF1A/p150) and transcription factors previously (ZSCAN4D) implicated in embryonic gene activation.
The experiments are of high quality, with appropriate controls, thus providing a rich compendium of Dux interactors for future study. Indeed, a number of these (SMARCC1, SMCHD1, ZSCAN4) make biological sense, both for embryonic genome activation and for FSHD (SMCHD1).
A critical question raised by this study, however, concerns the function of the Dux repeats, apparently unique to mice. While it is possible, as the authors propose, that the weak activating C1, C2 C4 repeats may exert an attenuating function on activation (and thus may have been selected for under an "adaptationist" paradigm), it is also possible that they are simply the result of Jacobian evolutionary bricolage (tinkering) that happens to work in mice. The finding that Dux itself is not essential, in fact appears to be redundant (or cooperates with) the OBOX4 factor, in addition to the absence of these repeats in the DUX protein of all other mammals (as pointed out by the authors), might indeed argue for the second, perhaps less attractive possibility.
In summary, while the present work provides a valuable resource for future study of Dux and its interactors, it fails, however, to tell a compelling story that could link the obtained data together.
We appreciated the reviewer’s views regarding the high quality of the work and our generation of an important dataset of DUX interactors. We also appreciate the comments provided to improve the work, and have performed and included in the revised version a set of clarifications, additional analyses and additional experiments that have served to reinforce our main points and provide additional mechanistic links. We also agree that more remains to be done to understand the function and evolution of repeats C1, C2 and C4.
Reviewer #1 (Recommendations For The Authors):
1) For immuno-blots, authors may indicate the expected bands to help readers better understand the results.
Agreed, and we have included the predicted molecular weight of proteins in the Figure Legends. We note that our work shows that the C-terminal domains confer anomalous migration in SDS-PAGE.
2) Fig. 5b, a blot missing for the mCherry group?
Figure 5b is a volcano blot, so we believe the reviewer is referring to Figure 5d, which is a coimmunoprecipitation experiment between SMARCC1 and mCherry-tagged DUX constructs. However, we are unsure of the comment as an anti mCherry sample is present in that panel.
3) Line 99-100, Fig. S1d, it seems that repeat2, but not repeat3, is more similar to human DUX4 C-terminal region.
This comment and one by another reviewer have prompted us to re-examine the similarities of the DUX repeats, and we have new analyses (Figure S1d) and an alternative framing in the manuscript as a result. We have expanded on this in our response to Reviewer #2, point #1 – and direct the reviewer there for our expanded treatment.
4) There are a few references are misplaced. For example, line 48, the studies that reported the role of Dux in inducing 2CLCs should be from Hendrickson et al., 2017, De Iaco et al., 2017, and Whiddon et al., 2017. The authors may want to double check all references.
Thanks for pointing these out. These issues have been corrected in the manuscript.
5) In the materials & methods section, a few potential errors are noticed. For example, concentrations of PD0325901 and CHIR99021 in mESC medium appear ~1000-fold higher than standards.
Thanks – corrected.
Reviewer #2 (Recommendations For The Authors):
Major Points
1) Line 99 - The authors claimed that the "human DUX4 C-terminal region is most similar to the 3rd repeat of mouse DUX", but based on Supp. Fig. 1d, the human DUX4 C-term should be most similar to the 2nd repeat of mouse DUX. If this is indeed the case, it will undermine the rest of this study, since the authors claim that the 3rd repeat is transcriptionally active, whereas the 2nd repeat is transcriptionally inactive, and the bulk of this study largely focused on how the active repeats, not the inactive repeats, are critical in recruiting key transcriptional and chromatin regulators to induce the embryonic gene expression program.
We thank the reviewer for their comments here. Since submission,and as mentioned above for reviewer #1 we have revisited the issue of similarity of the DUX4 C-terminal region to the mouse C-terminal repeats, with a BLAST-based approach that is more rigorous and informed by statistics – which is in Author response table 1 and now in the manuscript as Figure S1d, and has affected our interpretation. Our prior work involved a simple % identity comparison table and we now appreciate that some of the similarity analyses did not meet statistical significance, and therefore we are unable to draw certain conclusions. We make the appropriate modifications in the text. For example, we no longer state that the DUX4 C-terminus appears to be most similar to mouse repeats 3 and 5. This does not affect the main conclusions of the paper regarding interactions of the C-terminus with chromatin-related proteins, only our speculation on which repeat might have represented the original single repeat in the mouse – an issue we think of some interest, but did not rise to the level of mentioning in the original or current abstract.
Author response table 1.
Parameters: PAM250 matrix. Gap costs of existence: 15 and extension: 3. Numbers represent e-value of each pairwise comparison
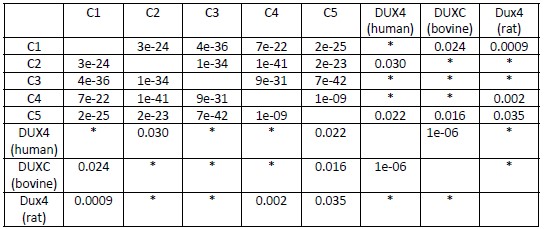
*No significant similarities found (>0.05).
2) In Supp Fig 1d, it seems that the rat DUX4 C-terminal region is most similar to the 4th repeat of mouse DUX, which according to the author is supposedly transcriptionally inactive. This weakens the authors justification that the 3rd or 5th repeat is likely the "parental repeat for the other four", and further echoes my concern in point 1 where the human DUX4 C-term is most similar to the 2nd (inactive) repeat of mouse DUX.
The reviewer’s point is well taken and is addressed in point #1 above.
3) In Fig. 1d, the authors showed that DUX4-containing C3 and C5, but lacking acidic tail, can promote MERVL::GFP expression, albeit to a slightly lower extent compared to FL. However, in Fig. 2b, C3 or C5 alone (lacking acidic tail) completely failed to promote MERVL::GFP expression. However, in the presence of the acidic tail, both versions were able to promote MERVL::GFP expression, similar to that of FL. The latter would suggest that it is the acidic tail that is crucial for MERVL::GFP expression, and this does not quite agree with Fig 1b, where C12345 (lacking acidic tail) was able to promote MERVL::GFP expression. Although C12345 did not activate MERVL to a similar level as FL, it is clearly proficient, compared to C3 or C5 alone (lacking acidic tail) where there is no increase in MERVL at all. Additional constructs will be helpful to clarify these points. For example, 'C3+C5 minus acidic tail' and 'HD1+HD2+acidic tail only' constructs.
We agree that constructs such as those mentioned would add to the work. First, we have done the additional construct HD1+HD2+14aa tail, which is presented as ΔC12345+14aa in Figure 2a and in S2a. Additionally, we performed experiments on the requested C3+C5+14aa and C3+C5Δ14aa (see samples 6 and 7 in Author response image 1, which are now included in Supplemental Figure 2b). The results reinforce our hypothesis of an additive effect toward DUX target gene activation by increasing C-terminal repeats and including the 14aa tail.
Author response image 1.
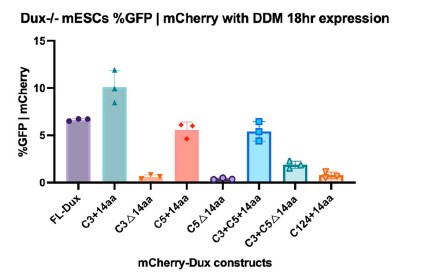
4) Related to the above, the flow cytometry data for the MERVL::GFP reporter as presented in Figures 1 and 2, as well as in Supp. Fig. 2, show a considerably large difference in the %GFP|mCherry for the FL construct, ranging from ~6-26%. This makes it difficult to convince the reader which of the different DUX domain constructs cannot or can partially induce GFP|mCherry signal when compared to FL, and hence it is tough to definitively ascertain the exact contribution of each of the 5 C-terminal repeats with high confidence, as it appears that there exists a significant amount of variability in this MERVL::GFP reporter system. The authors need to address this issue since this is their primary method to elucidate the transcriptional activity of each of the mouse DUX repeat domains.
We note that with the Dux-/- cell lines we used throughout the timeline of the study, the percent of %GFP|mCherry expression progressively and slowly decreased – possibly due to slow/modest epigenetic silencing of the reporter. However, we always used the full-length DUX construct to establish the dynamic range. We emphasize that the relative differences between constructs over multiple cell line replicates remained relatively consistent. However, we elected to show absolute values in each experiment, rather than simply normalizing the full-length to 100% and showing relative.
5) Lines 140-142 - The authors claimed that the functional difference between the transcriptionally active and inactive repeats could be narrowed down to a "6aa region which is conserved between repeats C3 and C5, but not conserved in C1, C2 and C4". Assuming the 6aa sequence is DPLELF, why does C1C3a elicit almost twice the intensity of GFP|mCherry signal compared to C3C1c, despite both constructs having the exact same 6aa sequence?
Indeed, C1C3a and C3C1c both containing the ‘active’ DPL sequence but having different relative levels of %GFP|mCherry. This is consistent with these sequences having a positive role in DUX target gene regulation – but likely in combination with other other regions which potentiate its affect, possibly through interacting proteins or post-translational modifications.
Why does DPLEPL (the intermediate C3C1b construct) induce a similar extent of GFP|mCherry signal as the FL construct, even though the former includes 3aa from a transcriptionally inactive repeat? In contrast, GSLELF (the other intermediate C1C3b construct) that also includes 3aa from a transcriptionally inactive repeat is almost completely deficient in inducing any GFP|mCherry signal. Why is that so? Is DPL the most crucial sequence? It will be important to mutate these 3 (or the above 6) residues on FL DUX4 to examine if its transcriptional activity is abolished.
These are interesting points. DPL does appear to be the most important region in the mouse DUX repeats. However, DPL is not shared in the C-terminus of human DUX4. Notably, the DUX4 C-terminus is sufficient to activate the mouse MERVL::GFP reporter when cloned to mouse homeodomains (see Author response image 2, second sample) and other DUX target genes (initially published in Whiddon et al. 2017). One clear possibility is that the DPL region is helping to coordinate the additive effects of multiple DUX repeats, which only exist in the mouse protein.
Author response image 2.
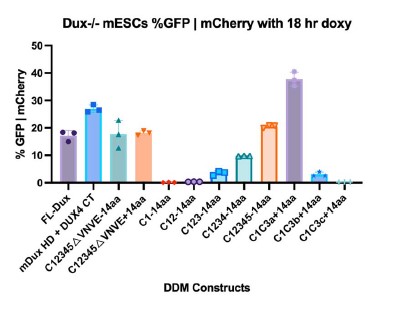
6) Line 154 - The intermediate DUX domain construct C1C3b occupied a different position on the PCA plot from the C1C3c construct that does not contain any of the critical 6aa sequence, as shown in Fig. 2e. However, both these constructs appear to be similarly deficient in inducing any GFP|mCherry signal, as seen in Fig. 2c. Why is that so?
The PCA plot assesses the impact on the whole transcriptome and not just the MERVL::GFP reporter, suggesting the 3aa region has transcriptional effects on the genome beyond what is detected in the MERVL::GFP reporter.
7) To strengthen the claim that "Chromatin alterations at DUX bindings sites require a transcriptionally active DUX repeat", the authors should also perform CUT&Tag for constructs containing transcriptionally inactive DUX repeats (e.g. C1+14aa), and show that such constructs fail to occupy DUX binding sites, as well as are deficient in H3K9ac accumulation.
This is a good comment. We elected to control this with constructs containing or lacking an active repeat. Although we have not pursued this by CUT&TAG, we have examined the impact of DUX constructs with inactive repeats (including the requested C1+14aa, new Figure S1g) by ATAC-seq (see #12, ATAC-seq section, below), and observe no chromatin opening, suggesting that the lack of transcriptional activity is rooted in the inability to open chromatin.
8) It would be good if the authors could also include CUT&Tag data for some of the C1C3 chimeric constructs that were used in Fig. 2, since the authors argued that the minimal 6aa region is sufficient to activate many of the DUX target genes. This would also strengthen the authors’ case that the transcriptionally active, not inactive, repeats are critical for binding at DUX binding sites and ensuring H3K9ac occupancy.
We agree that these would be helpful, and have examined the inactive repeats in transcription and ATAC-seq formats during revision (new data in Figures 1d and S1g), but not yet the CUT&TAG format.
9) Line 213 - "SMARCA4" should have been "SMARCA5"? Based on Fig. 4d, SMARCA5 is picked up in the BirA*-DUX interactome, not SMARCA4.
Thanks – corrected.
10) Lines 250-252 - The authors compared the active BirA-C3 against the inactive BirA-C1 to elucidate the interactome of the transcriptionally active C3 repeat, as illustrated in Fig. 5c. They found 12 proteins more enriched in C1 and 154 proteins in C3. This information should be presented clearly as a separate tab in Supp Table 2. What are the proteins common to both constructs, i.e. enriched to a similar extent? Do they include chromatin remodellers too? Although the authors sought to identify differential interactors between the 2 constructs, it is also meaningful to perform 2 separate comparisons - active BirA-C3 against BirA alone control, and inactive BirA-C1 against BirA alone control - like in Fig. 4d, so as to more accurately define whether the active C3 repeat, and not the inactive C1 repeat, interacts with proteins involved in chromatin remodeling.
We thank the reviewer for this comment, and we have modified the manuscript by adding a second sheet in Supplementary Table 2 including the results for enriched proteins in BirA-C1 vs. C3. Additionally, due to limitations of annotation between BirA alone and BirA*-C3 being sequenced in different mass spectrometry experiments, it is difficult to quantitatively compare the two datasets with pairwise comparisons.
11) Fig 5d: The authors mentioned in the legend that endogenous IP was performed for SMARCC1. However, in line 266, they stated Flag-tagged SMARCC1. Is SMARCC1 overexpressed? The reciprocal IP should also be presented. More importantly, C1 constructs (e.g. C1+14aa and C1Δ14aa) should also be included.
To clarify, Figure 4e used exogenously overexpressed FLAG-SMARCC1 in HEK-293T cells to confirm the results of the full-length DUX BioID experiment. Figure 5d was performed with overexpressed DUX construct, but involved endogenous SMARCC1 in mESCs. This has now been made clearer in the revised manuscript.
12) For both the SMARCC1 CUT&Tag and ATAC-seq experiments shown in Figures 5e and 5f respectively, the authors need to include DUX derivatives that contain transcriptionally inactive repeats with and without the 14aa acidic tail, i.e. C1+14aa and C1Δ14aa, and show that these constructs prevent the binding/recruitment of SMARCC1 to DUX genomic targets, and correspondingly display a decrease in chromatin accessibility. Only then can they assert the requirement of the transcriptionally active repeat domains for proper DUX protein interaction, occupancy and target activation.
We agree that examination of an inactive repeat in certain approaches would improve the manuscript. Importantly, we have now included C1+14 in our ATAC-seq experiments, and in Author response image 3 two individual replicates, which constitute a new Figure S1g. Compared to the transcriptionally active DUX constructs, which see opening at DUX binding sites, we do not see chromatin opening at DUX binding sites with transcriptionally inactive C1+14.
Author response image 3.
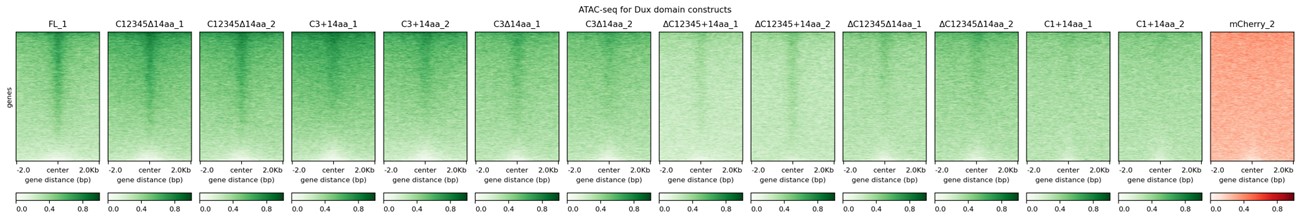
13) To prove that DUX-interactors are important for embryonic gene expression, it will be important to perform loss of function studies. For instance, will the knockdown/knockout of SMARCC1 in cells expressing the active DUX repeat(s) lead to a loss of DUX target gene occupancy and activation?
We agree that it would be interesting to better understand SMARCC1 cooperation with DUX function in the embryo, but we believe this is beyond the scope of this paper.
Minor Points
1) Lines 124-126 - What is the reason/rationale for why the authors used one linker (GGGGS2) for constructs with a single internal deletion, but 2 different linkers (GGGGS2 and GAGAS2) for constructs with 2 internal deletions?
With Gibson cloning, there are homology overhang arms for each PCR amplicon that are required to be specific for each overlap. Additionally, each PCR amplicon needs to be specific enough from one another so that all inserts (up to 5 in this manuscript) are included and oriented in the right order. The linker sequences were included in the homology arm overlaps, so the nucleotide sequences for each linker needed to be specific enough to include all inserts. This is a general rule to Gibson cloning. Additionally, both GGGGS2 and GAGAS2 are common linker sequences used in molecular biology and the amino acids structures are similar to one another, suggesting there is no functional difference between linkers.
2) Line 704 - 705: In the figure legend, the authors stated that 'Constructs with a single black line have the linker GGGGS2 and constructs with two black lines have linkers with GGGGS2 and GAGAS2, respectively.'. This was not obvious in the figures.
Constructs used for flow and genomics experiments that are depicted in Figure 2, Supplementary Figure 2, Figure 3, Figure 4, and Figure 5 have depicted black lines where deletions are present. Where these deletions are present, there are linkers in order to preserve spacing and mobility for the protein.
3) Line 160 - Clusters #1 and #2 are likely written in the wrong order. It should have been "activating the majority of DUX targets in cluster #2, not cluster #1" and "failed to activate those in cluster #1, not cluster #2", based on the RNA-seq heatmap in Fig. 2f.
We thank the reviewer for this comment, and the error has been corrected in the manuscript.
4) Line 188 - Delete the word "of" in the following sentence fragment: "DUX binding sites correlating with the of transcriptional".
Thanks – corrected.
5) Line 191 - Delete the word "aids" in the following sentence fragment: "important for conferring H3K9ac aids at bound".
Thanks – corrected.
6) Line 711 - "C1-C3 a,b,d" should be "C1-C3 a,b,c".
Thanks – corrected.
7) Lines 711-712 - The colors "pink to blue" and "blue to pink" are likely written in the wrong order. Based on Fig. 2c, the blue to pink bar graphs should represent C1-C3 a,b,c in that order, and likewise the pink to blue bar graphs should represent C3-C1 a,b,c in that order.
Thanks – corrected.
8) There is an overload of data presented in Fig. 2c, such that it is difficult to follow which part of the figure represents each data segment as written in the figure legend. It is recommended that the data presented here is split into 2 sub-figures.
Figure 2c has a supporting figure in Supplementary Figure 2b. While there is both a graphical depiction of the constructions and the data both in the main panel of Figure 2C, we have depicted it as so to be as clear as possible for the reader to interpret the complexity and presentence of amino acids in each of the constructs.
9) Line 717 - "following" is misspelt.
Thanks – corrected.
10) Lines 720-721 - "(Top)" and "(Bottom)" should be replaced with "(Left)" and "(Right)", as the 2 bar graphs presented in Fig. 2d are placed side by side to each other, not on the top and bottom.
Thanks – corrected.
11) Lines 725 and 839 - "Principle" is misspelt. It should be "Principal".
Thanks – corrected.
12) In Figures 3d and 3e, the sample labeled "C3+14_1" should be re-labeled to "C3+14", in accordance with the other sub-figures. Additionally, for the sake of consistency, "aa" should be appended to the relevant constructs, e.g. "C3+14aa" and "C3Δ14aa".
Thanks – corrected.
13) Line 773 - Were the DUX domain constructs over-expressed for 12hr (as written in the figure legend) or 18hr (as labeled in Fig. 5d)?
Thanks – corrected.
14) Related to minor point 19 above, is there a reason/rationale for why some of the experiments used 12hr over-expression of DUX domain constructs (e.g. for CUT&TAG in Fig. 3), whereas in other experiments 18hr over-expression was chosen instead (e.g. flow cytometry for MERVL::GFP reporter in Figures 1 and 2, and co-IP validations of BirA*-DUX interactions in Fig. 4)?
Thanks for the opportunity to explain. In this work, experiments that reported on proteins that are translated following DUX gene activation (e.g. MERVL:GFP via flow) were done at 18hr to allow for enough time for transcription and translation of GFP (or other DUX target genes). For experiments that report on the impact of DUX on chromatin and transcription, such as RNA-seq, CUT&Tag, and ATAC-seq, we induced DUX domain constructs for 12 hours.
15) Line 804 - "ΔHDs" is missing between "C2345+14aa" and "ΔHD1".
Thanks – corrected.
16) In Fig. 5c, "Chromatin remodelers" is misspelt.
Thanks – corrected.
17) There is no reference in the manuscript to the proposed model that is presented in Fig. 6b.
Thanks – corrected.
Reviewer #3 (Recommendations For The Authors):
Given the uncertainty of the function of the Dux peptide repeats in mice, could it not also be possible that the underlying repeated nature of the (coding) DNA? That is, could these DNA repeats exert a regulatory function on Dux transcription itself (also given the dire consequences of misregulated DUX4 expression as seen in FSHD, for example).
Yes, it remains possible that the internal coding repeats within Dux are playing a role in locus regulation, and might be interesting to examine. However, we consider this question as being outside the scope of the current paper.
Finally, it would be interesting to know whether these repeats are, in fact, present in all mouse species. Already no longer present in rat, do they exist, or not, in more "distant" mice, e.g. M. caroli?
Determining whether all mouse strains contain C-terminal repeats in DUX is a question we also considered. However, Dux and its orthologs are present in long and very complex repeat arrays that are not present in the sequencing data or annotation in other mouse strains. Therefore, we are not unable to answer this question from existing sequencing data. Answering would require a considerable genome sequencing and bioinformatics effort, or alternatively a considerable effort aimed at cloning ortholog cDNAs from 2-cell embryos.
Minor points:
line 169: here it seems, in fact, that the 'inactive' C2, C4 repeats are more similar to each other (my calculation: 91 and 96% identity at the protein and DNA level, respectively) than the active C3 and C5 repeats (82 and 89% identity, resp.), the outlier being C1.
Thanks for this comment, which was mentioned by other reviewers as well and has been addressed through new statistical analyses and interpretation (see new Figure S1d).
line 191: I'm not sure this sentence parses correctly ("...14AA tail is important for conferring H3K9Ac aids at bound sites...")
We thank the reviewer for this comment, and we have corrected the sentence in the manuscript.
Author response:
The following is the authors’ response to the original reviews
Public Reviews:
Reviewer #1 (Public review):
Summary:
This study focuses on characterizing a previously identified gene, encoding the secreted protein Ppe1, that may play a role in rice infection by the blast fungus Magnaporthe oryzae. Magnaporthe oryzae is a hemibiotrophic fungus that infects living host cells before causing disease. Infection begins with the development of a specialized infection cell, the appressorium, on the host leaf surface. The appressorium generates enormous internal turgor that acts on a thin penetration peg at the appressorial base, forcing it through the leaf cuticle. Once through this barrier, the peg elaborates into bulbous invasive hyphae that colonizes the first infected cell before moving to neighboring cells via plasmodesmata. During this initial biotrophic growth stage, invasive hyphae invaginate the host plasma membrane, which surrounds growing hyphae as the extra-invasive hyphae membrane (EIHM). To avoid detection, the fungus secretes apoplastic effectors into the EIHM matrix via the conventional ER-Golgi secretion pathway. The fungus also forms a plant-derived structure called the biotrophic interfacial complex (BIC) that receives cytoplasmic effectors through an unconventional secretion route before they are delivered into the host cell. Together, these secreted effector proteins act to evade or suppress host innate immune responses. Here the authors contribute to our understanding of M. oryzae infection biology by showing how Ppe1, which localizes to both the appressorial penetration peg and to the appressorial-like transpressoria associated with invasive hyphal movements into adjacent cells, maximizes host cell penetration and disease development and is thus a novel contributor to rice blast disease.
We sincerely appreciate the reviewer’s thoughtful evaluation of our work. We are grateful for your recognition of Ppe1 as a novel contributor to M. oryzae infection biology and your insightful summary of its spatio-temporal localization and functional importance in host penetration. We also appreciate devoting your time to provide us with constructive feedback, which greatly strengthens our manuscript.
Strengths:
A major goal of M. oryzae research is to understand how the fungus causes disease, either by determining the physiological underpinnings of the fungal infection cycle or by identifying effectors and their host targets. Such new knowledge may point the way to novel mitigation strategies. Here, the authors make an interesting discovery that bridges both fungal physiology and effector biology research by showing how a secreted protein Ppe1, initially considered an effector with potential host targets, associates with its own penetration peg (and transpressoria) to facilitate host invasion. In a previous study, the authors had identified a small family of small secreted proteins that may function as effectors. Here they suggest Ppe1 (and, later in the manuscript, Ppe2/3/5) localizes outside the penetration peg when appressoria develops on surfaces that permit penetration, but not on artificial hard surfaces that prevent peg penetration. Deleting the PPE1 gene reduced (although did not abolish) penetration, and a fraction of those that penetrated developed invasive hyphae that were reduced in growth compared to WT. Using fluorescent markers, the authors show that Ppe1 forms a ring underneath appressoria, likely where the peg emerges, which remained after invasive hyphae had developed. The ring structure is smaller than the width of the appressorium and also lies within the septin ring known to form during peg development. This so-called penetration ring also formed at the transpressorial penetration point as invasive hyphae moved to adjacent cells. This structure is novel, and required for optimum penetration during infection. Furthermore, Ppe1, which carries a functional signal peptide, may form on the periphery of the peg, together suggesting it is secreted and associated with the peg to facilitate penetration. Staining with aniline blue also suggests Ppe1 is outside the peg. Together, the strength of the work lies in identifying a novel appressorial penetration ring structure required for full virulence.
We are deeply grateful to the reviewer for the clear understanding and insightful evaluation of our work. Your recognition of the novel contribution and scientific merit of our study is both encouraging and motivating. We sincerely appreciate the time, expertise and constructive feedback dedicated to reviewing our manuscript, as the comments have been instrumental in enhancing the quality of this work.
Weaknesses:
The main weakness of the paper is that, although Ppe1 is associated with the peg and optimizes penetration, the function of Ppe1 is not known. The work starts off considering Ppe1 a secreted effector, then a facilitator of penetration by associating with the peg, but what role it plays here is only often speculated about. For example, the authors consider at various times that it may have a structural role, a signaling role orchestrating invasive hyphae development, or a tethering role between the peg and the invaginated host plasma membrane (called throughout the host cytoplasmic membrane, a novel term that is not explained). However, more effort should be expended to determine which of these alternative roles is the most likely. Otherwise, as it stands, the paper describes an interesting phenomenon (the appressorial ring) but provides no understanding of its function.
We sincerely appreciate the reviewer’s comments. We have revised "host cytoplasmic membrane" to "host plasma membrane" throughout the manuscript for consistency. To further investigate the role of the Ppe1 in the interaction between M. oryzae and rice, we overexpressed PPE1 in rice ZH11. A pCXUN-SP-GFP-Ppe1 vector containing a signal peptide and an N-terminal GFP tag was constructed (pCXUN-SP-GFP-Ppe1), and 35 GFP-PPE1-OX plants (T0) were subsequently obtained through Agrobacterium-mediated rice transformation. Subsequently, PCR and qRT-PCR validation were performed on the T0 transgenic plants. The PCR results showed that the inserted plasmid could be amplified from the genomic DNA extracted from the leaves of all the resulting T0 plants (Author response image 1A). qRT-PCR results indicated that most T0 transgenic plants could transcriptionally express PPE1 (Author response image 1B). T0 plants with higher expression levels were selected for western blot analysis, which confirmed the presence of GFP-Ppe1 bands of the expected size (Author response image 1C). To further explore the targets of Ppe1 in rice, the leaf sheaths of T0 plants were inoculated with M. oryzae strain Guy11. Total proteins were extracted at 24 hours post-inoculation (hpi) and subjected to immunoprecipitation using GFP magnetic beads. Silver staining revealed more interacting protein bands in T0 plants compared to ZH11 and GFP-OX controls (Author response image 1D). These samples were then analyzed by mass spectrometry in which 331 rice proteins that potentially interact with Ppe1 were identified (Author response image 1E). Subsequently, yeast two-hybrid assays were performed on 13 putative interacting proteins with higher coverage, but no interaction was detected between Ppe1 and these proteins (Author response image 1F-G). Considering that the identification and functional validation of interacting proteins is a labor-intensive and time-consuming endeavor, we will focus our future efforts on in-depth studies of Ppe1's function in rice.
Author response image 1.
Screening of Ppe1 candidate targets in rice. (A) The determination of GFP-PPE1 construct in transgenic rice. (B) The expression of PPE1 transgenic rice (T0) was verified by qRT-PCR. (C) Western blot analysis of Ppe1 expression in transgenic rice. (D) Rapid silver staining for detection of the purified proteins captured by the GFP-beads. (E) Venn diagram comparing the number of proteins captured in the different samples. (F) Identity of the potential targets of Ppe1 in rice. (G) Yeast two-hybrid assay showing negative interaction of Ppe1 with rice candidate proteins.
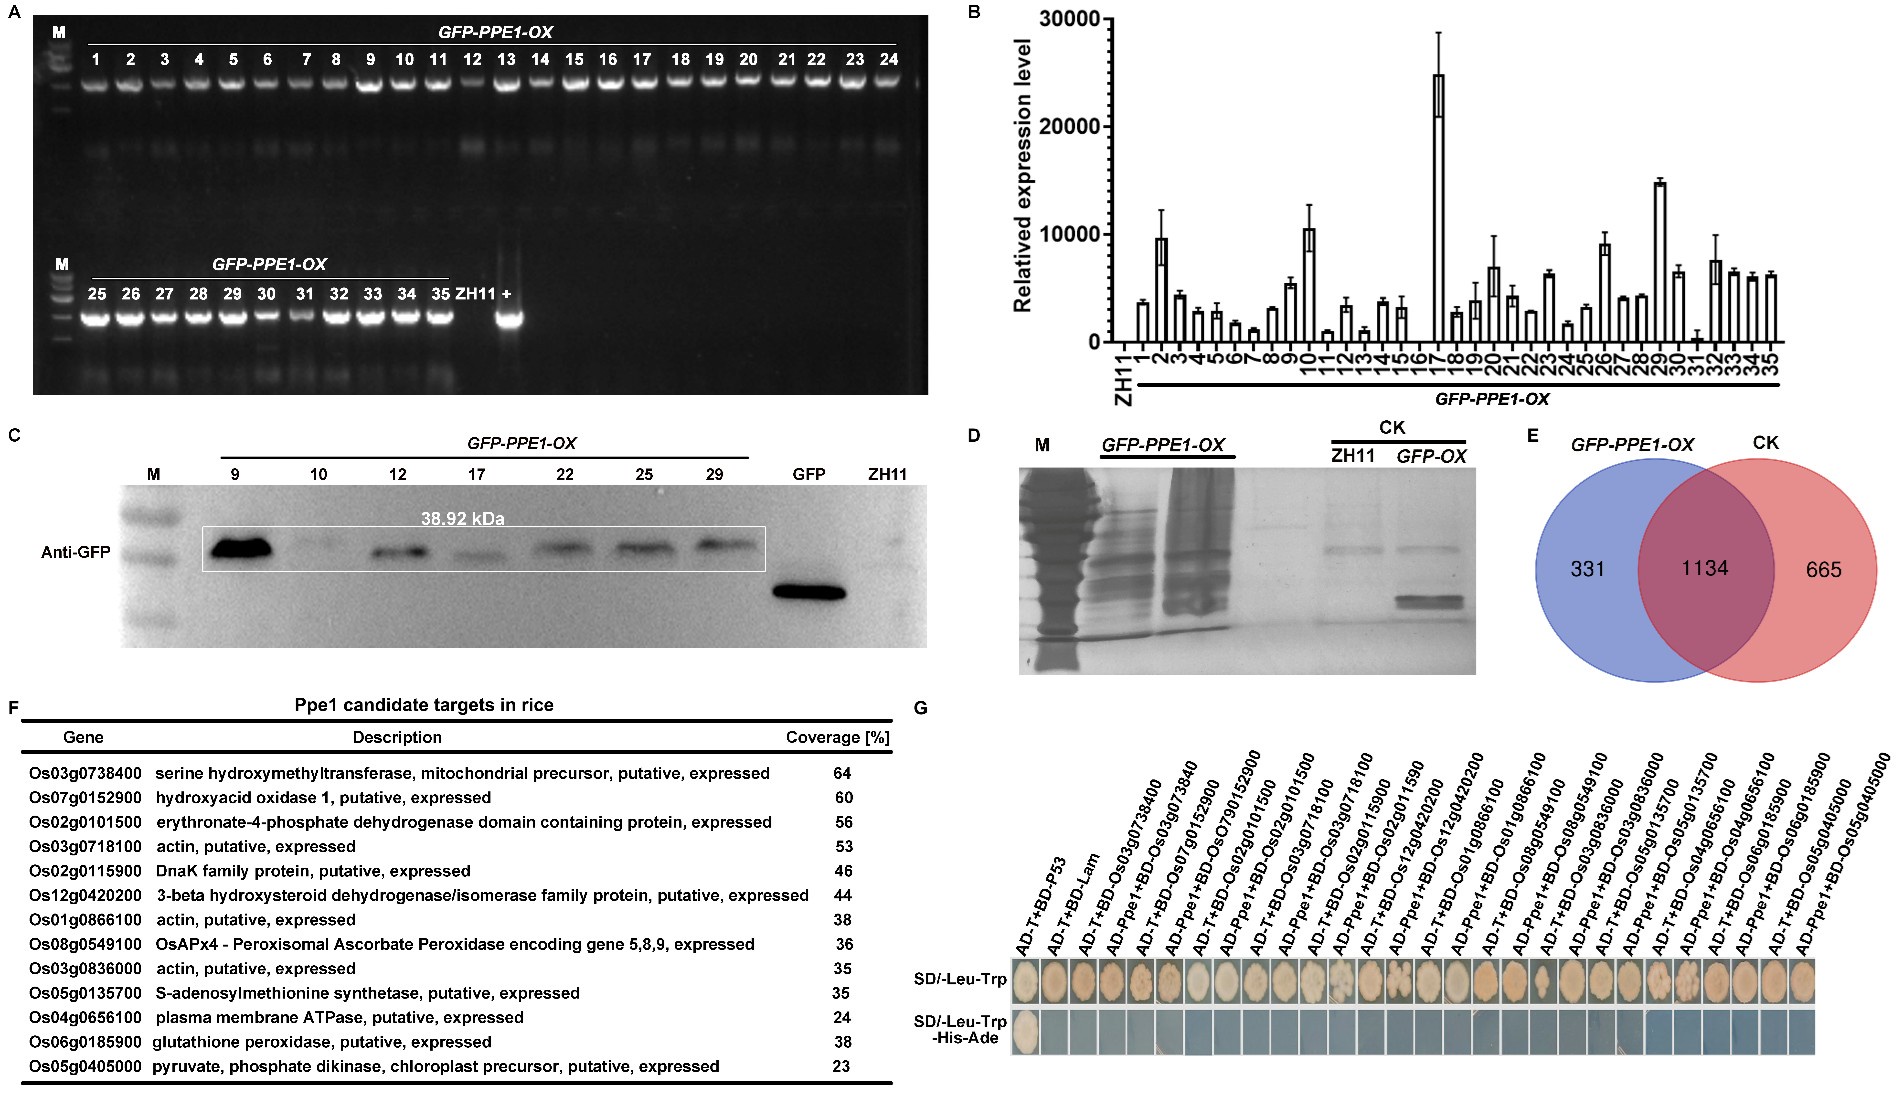
The inability to nail down the function of Ppe1 likely stems from two underlying assumptions with weak support. Firstly, the authors assume that Ppe1 is secreted and associated with the peg to form a penetration ring between the plant cell wall and cytoplasm membrane. However, the authors do not demonstrate it is secreted (for instance by blocking Ppe1 secretion and its association with the peg using brefeldin A).
To investigate the secretion pathway of Ppe1 in M. oryzae, we determined the inhibitory effects of Brefeldin A (BFA) on conventional ER-to-Golgi secretion in fungi as suggested by the reviewer. We inoculated rice leaf sheaths with conidia suspensions from the Ppe1-mCherry and PBV591 strains (containing a Pwl2-mCherry-NLS and Bas4-GFP co-expressing constructs) and treated them with BFA. We found that, even after exposure to BFA for 5 to 11 hours, the Ppe1-mCherry still formed its characteristic ring conformation (Author response image 2). Similarly, in the BFA-treated samples, the cytoplasmic effector Pwl2-mCherry accumulated at the BIC, while the apoplastic effector Bas4-GFP was retained in the invasive hyphae (Author response image 2). These results indicate that Ppe1 is not secreted through the conventional ER-Golgi secretion pathway.
Author response image 2.
The secretion of Ppe1 is not affected by BFA treatment. (A) and (B) The Ppe1-mCherry fluorescent signal was still observed both in the presence and absence of BFA. (C) Following BFA treatment, the secretion of the apoplastic effector Bas4-GFP was blocked while that of the cytoplasmic effector Pwl2-mCherry was not affected. The rice leaf sheath tissue was inoculated with 50 μg/mL BFA (0.1% DMSO) at 17 hpi. Images were captured at 22 hpi for A and 28 hpi for B and C. Scale bars = 10 µm.
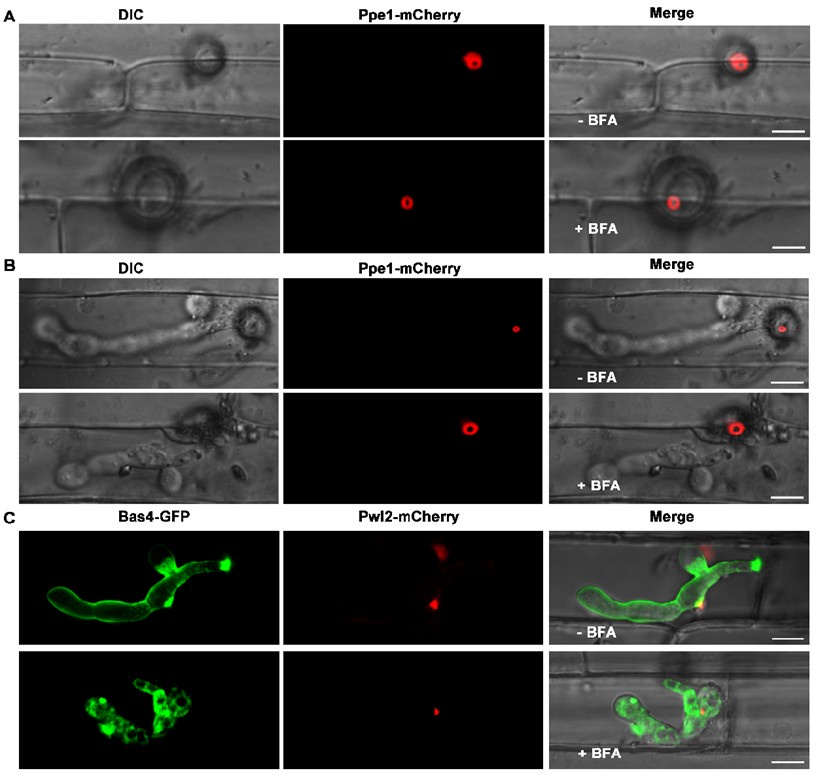
Also, they do not sufficiently show that Ppe1 localizes on the periphery of the peg. This is because confocal microscopy is not powerful enough to see the peg. The association they are seeing (for example in Figure 4) shows localization to the bottom of the appressorium and around the primary hyphae, but the peg cannot be seen. Here, the authors will need to use SEM, perhaps in conjunction with gold labeling of Ppe1, to show it is associating with the peg and, indeed, is external to the peg (rather than internal, as a structural role in peg rigidity might predict). It would also be interesting to repeat the microscopy in Figure 4C but at much earlier time points, just as the peg is penetrating but before invasive hyphae have developed - Where is Ppe1 then? Finally, the authors speculate, but do not show, that Ppe1 anchors penetration pegs on the plant cytoplasm membrane. Doing so may require FM4-64 staining, as used in Figure 2 of Kankanala et al, 2007 (DOI: 10.1105/tpc.106.046300), to show connections between Ppe1 and host membranes. Note that the authors also do not show that the penetration ring is a platform for effector delivery, as speculated in the Discussion.
We sincerely appreciate the reviewer's valuable suggestion regarding SEM with immunogold labeling to precisely visualize Ppe1's association with penetration peg. While we fully acknowledge this would be an excellent approach, after consulting several experts in the field, we realized that the specialized equipment and technical expertise required for fungal immunogold-SEM are currently unavailable to us. We sincerely hope that the reviewer will understand this technical limitation.
To further strengthen our evidence for the role of Ppe1's in anchoring penetration peg to the plant plasma membrane, we provided new co-localization images of Ppe1 and penetration peg (Fig. S7). At 16 hours post-inoculation (hpi), when the penetration peg was just forming and prior to the development of invasive hyphae, the Ppe1-mCherry fluorescence forms a tight ring-like structure closely associated with the base of the appressorium. As at 23 hpi, the circular Ppe1-mCherry signal was still detectable beneath the appressorium, and around the penetration peg which differentiated into the primary invasive hyphae. Furthermore, we obtained 3D images of the strain expressing both Ppe1-mCherry and Lifeact-GFP during primary invasive hyphal development. The results revealed that Ppe1 forms a ring-like structure that remains anchored to the penetration peg during fungal invasion (Fig. S6).
We also conducted FM4-64 staining experiment as recommended by the reviewer. Although the experiment provided valuable insights, we found that the resolution was insufficient to precisely delineate the spatial relationship between Ppe1 and host membranes at the penetration peg (Author response image 3). To optimize this colocalization, we tested the localization between Ppe1-mCherry ring and rice plasma membrane marker GFP-OsPIP2 (Fig. S8). These new results provide compelling complementary evidence supporting our conclusion that Ppe1 functions extracellularly at the host-pathogen interface. We hope these additional data will help address the reviewer's concerns regarding Ppe1's localization.
Author response image 3.
FM4-64-stained rice leaf sheath inoculated with M. oryzae strain expressing Ppe1-GFP. Ppe1-GFP ring was positioned above the primary invasive hyphae. Scale bar = 5 µm.
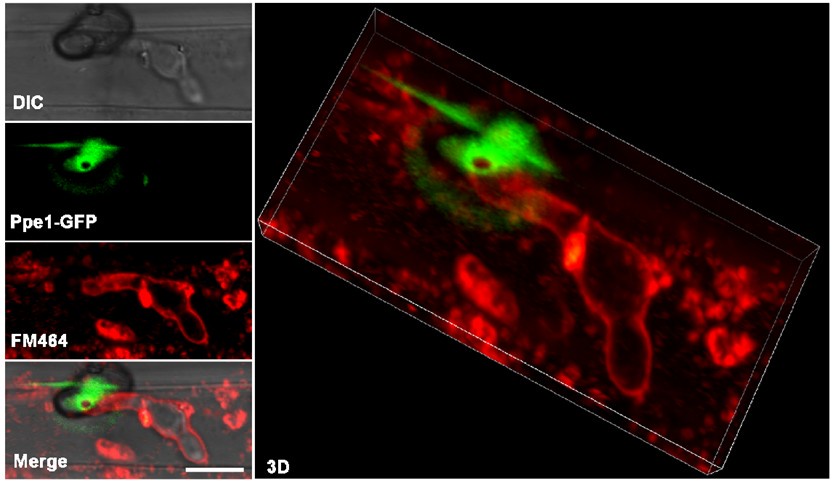
Secondly, the authors assume Ppe1 is required for host infection due to its association with the peg. However, its role in infection is minor. The majority of appressoria produced by the mutant strain penetrate host cells and elaborate invasive hyphae, and lesion sizes are only marginally reduced compared to WT (in fact, the lesion density of the 70-15 WT strain itself seems reduced compared to what would be expected from this strain). The authors did not analyze the lesions for spores to confirm that the mutant strains were non-pathogenic (non-pathogenic mutants sometimes form small pinprick-like lesions that do not sporulate). Thus, the pathogenicity phenotype of the knockout mutant is weak, which could contribute to the inability to accurately define the molecular and cellular function of Ppe1.
We appreciate the reviewer’s comments. To ensure the reliability of our findings, we conducted spray inoculation experiments with multiple independent repeats. Our results consistently demonstrated that deletion of the PPE1 gene significantly attenuates the virulence of M. oryzae. Further analysis of lesion development and sporulation in the Δ_ppe1_ mutant revealed that it retains the ability to produce conidia. To validate these observations, we generated a PPE1 knockout in the wild-type reference strain Guy11. Similarly, we observed a significant decrease in the pathogenicity of the Δ_ppe1_ mutants generated from the wild-type Guy11 strain compared to Guy11 in the spray assay (Fig S2). These results collectively indicate the importance of Ppe1 in the pathogenicity of M. oryzae to rice.
In summary, it is important that the role of Ppe1 in infection be determined.
Reviewer #2 (Public review):
The article focuses on the study of Magnaporthe oryzae, the fungal pathogen responsible for rice blast disease, which poses a significant threat to global food security. The research delves into the infection mechanisms of the pathogen, particularly the role of penetration pegs and the formation of a penetration ring in the invasion process. The study highlights the persistent localization of Ppe1 and its homologs to the penetration ring, suggesting its function as a structural feature that facilitates the transition of penetration pegs into invasive hyphae. The article provides a thorough examination of the infection process of M. oryzae, from the attachment of conidia to the development of appressoria and the formation of invasive hyphae. The discovery of the penetration ring as a structural element that aids in the invasion process is a significant contribution to the understanding of plant-pathogen interactions. The experimental methods are well-documented, allowing for reproducibility and validation of the results.
We sincerely appreciate the thoughtful and insightful evaluation of our work. Thank you for recognizing the significance of our findings regarding the penetration ring and the functional role of Ppe1 during host invasion.
Recommendations for the authors:
Reviewer #1 (Recommendations for the authors):
Line 48: "after appressorium- or transpressorium-mediated penetration of plant cell wall" - transpressoria do not penetrate the plant cell wall.
Thank you for your valuable suggestion. For improved clarity, we have rephrased the sentence as follows: In this study, we showed that a penetration ring is formed by penetration pegs after appressorium-mediated penetration of plant cell wall.
Line 143: "approximately 25% of the 143 appressoria formed by the Δppe1 mutant had no penetration peg" - It is not possible to see the penetration peg by confocal microscopy.
Thank you for your valuable suggestion. We have revised the sentence as follows: In contrast, approximately 25% of the appressoria formed by the Δ_ppe1_ mutant had no penetration.
Line 159: "inner cycle" -should be inner circle?
We gratefully acknowledge the reviewer's careful reading. The typographical error has been corrected throughout the revised manuscript.
Line 255: "These results indicate that initiation of penetration peg formation is necessary for the formation of the penetration ring." Actually, more precisely, they indicate that penetration is necessary.
We appreciate this suggestion and have revised the text to be more concise: These results indicate that penetration is necessary for the formation of the penetration ring.
Line 282: "unlike subcellular localizations of other effectors"- is this an effector if no plant targets are known?
We appreciate this suggestion and have revised the text as follows: unlike subcellular localizations of Bas4, Slp1, Pwl2, and AvrPiz-t.
Line 299: "it may function as a novel physical structure for anchoring penetration pegs on the surface of plant cytoplasm membrane after cell wall penetration" - an interaction with the plant plasma membrane was not shown and this is speculative.
We have provided new evidence to show the spatial positioning of Ppe1-mCherry ring with the rice plasma membrane (see figure S8)
Line 301: "It is also possible that this penetration ring functions as a collar or landmark that is associated with the differentiation of penetration pegs (on the surface of cytoplasm membrane) into primary invasive hyphae enveloped in the EIHM cytoplasm membrane (Figure 7)." The alternative conclusions for Ppe1 function, either interacting with host membranes or acting as a developmental landmark, need to be resolved here.
We appreciate this suggestion and have revised the text as follows: It is also possible that this penetration ring functions as a collar that is associated with the differentiation of penetration pegs into primary invasive hyphae enveloped in the EIHM (Figure 7).
Line 317: "is likely a structural feature or component for signaling the transition of penetration pegs to invasive hyphae",- if the authors think Ppe1 has these roles, why do they refer to Ppe1 as an effector?
Many thanks for these comments. We have revised this and refer to Ppe1 as a secreted protein throughout the revised manuscript.
Line 337: "After the penetration of plant cell wall, the penetration ring may not only function as a physical structure but also serve as an initial effector secretion site for the release of specific effectors to overcome plant immunity in early infection stages"- which is it? Also, no evidence is provided to suggest it is a platform for effector secretion.
We sincerely appreciate your valuable suggestion. We have revised this sentence as follows: After the penetration of plant cell wall, the penetration ring may not only function as a physical structure but also serve as a secretion site for the release of specific proteins to overcome plant immunity during the early infection stages.
Reviewer #2 (Recommendations for the authors):
(1) While the study suggests the penetration ring as a structural feature, it remains unclear whether it also serves as a secretion site for effectors. Further exploration of this aspect would strengthen the conclusions.
We thank the reviewer for this useful suggestion. In this study, we demonstrated that Ppe1 proteins form a distinct penetration ring structure at the site where the penetration peg contacts the plant plasma membrane prior to differentiation into primary invasive hyphae (Figs. 2 and 7). Thus, we reasoned that penetration ring may function as a novel physical structure. Notably, additional Ppe family members (Ppe2, Ppe3, and Ppe5) were also found to localize to this penetration ring (Fig. 6B), suggesting that it also serves as a secretion site for releasing proteins. To test whether Ppe1 and Ppe2 label to the same site, we analyzed the colocalization between Ppe1-GFP and Ppe2-mCherry. The results showed that Ppe1-GFP and Ppe2-mCherry are well colocalized (Author response image 4). This study primarily focuses on the discovery and characterization of the penetration ring. The potential role of this structure in effector translocation will be investigated in future studies.
Author response image 4.
Ppe1 co-localizes with Ppe2 at the penetration ring in M. oryzae. Line graphs were generated at the directions pointed by the white arrows. Scale bar = 2μm.
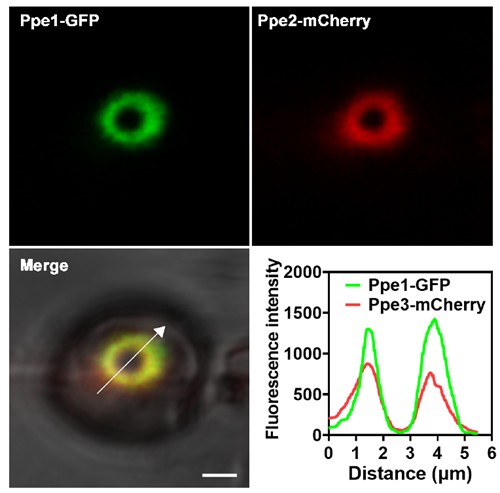
(2) The article could benefit from a discussion on the broader implications of these findings for developing resistant crop varieties or new fungicidal strategies.
We have incorporated this discussion as suggested (lines 358-360).
(3) What is the significance of the formation of the penetration ring in the pathogenicity of the rice blast fungus? Or, how does it assist the fungus in its infection process?
Our findings have several significant implications. First, we believe that the discovery of the penetration ring as a novel physical structure associated with the differentiation of invasive hyphae represents a breakthrough in plant-pathogen interactions that will be of interest to fungal biologists, pathologists and plant biologists. Secondly, our study presents new role of the peg as a specialized platform for secretory protein deployment, in addition to its commonly known role as a physical penetration tool for the pathogen. Thirdly, we identify Ppe1 as a potential molecular target for controlling the devastating rice blast disease, as Ppe homologs are absent in plants and mammals. We have incorporated this discussion in the revised manuscript (lines 354-362).
Author response:
The following is the authors’ response to the original reviews
Public Reviews:
Reviewer #1 (Public Review):
In this study, the authors aim to understand why decision formation during behavioural tasks is distributed across multiple brain areas. They hypothesize that multiple areas are used in order to implement an information bottleneck (IB). Using neural activity recorded from monkey DLPFC and PMd performing a 2-AFC task, they show that DLPFC represents various task variables (decision, color, target configuration), while downstream PMd primarily represents decision information. Since decision information is the only information needed to make a decision, the authors point out that PMd has a minimal sufficient representation (as expected from an IB). They then train 3-area RNNs on the same task and show that activity in the first and third areas resemble the neural representations of DLPFC and PMd, respectively. In order to propose a mechanism, they analyse the RNN and find that area 3 ends up with primarily decision information because feedforward connections between areas primarily propagate decision information.
The paper addresses a deep, normative question, namely why task information is distributed across several areas.
Overall, it reads well and the analysis is well done and mostly correct (see below for some comments). My major problem with the paper is that I do not see that it actually provides an answer to the question posed (why is information distributed across areas?). I find that the core problem is that the information bottleneck method, which is evoked throughout the paper, is simply a generic compression method.
Being a generic compressor, the IB does not make any statements about how a particular compression should be distributed across brain areas - see major points (1) and (2).
If I ignore the reference to the information bottleneck and the question of why pieces of information are distributed, I still see a more mechanistic study that proposes a neural mechanism of how decisions are formed, in the tradition of RNN-modelling of neural activity as in Mante et al 2013. Seen through this more limited sense, the present study succeeds at pointing out a good model-data match, and I could support a publication along those lines. I point out some suggestions for improvement below.
We thank the reviewer for their comments, feedback and suggestions. We are glad to hear you support the good model-data match for this manuscript. With your helpful comments, we have clarified the connections to the information bottleneck principle and also contrasted it against the information maximization principle (the InfoMax principle), an alternative hypothesis. We elaborate on these issues in response to your points below, particularly major points (1) and (2). We also address all your other comments below.
Major points
(1) It seems to me that the author's use of the IB is based on the reasoning that deep neural networks form decisions by passing task information through a series of transformations/layers/areas and that these deep nets have been shown to implement an IB. Furthermore, these transformations are also loosely motivated by the data processing inequality.
On Major Point 1 and these following subpoints, we first want to make a high-level statement before delving into a detailed response to your points as it relates to the information bottleneck (IB). We hope this high-level statement will provide helpful context for the rest of our point-by-point responses.
We want to be clear that we draw on the information bottleneck (IB) principle as a general principle to explain why cortical representations differ by brain area. The IB principle, as applied to cortex, is only stating that a minimal sufficient representation to perform the task is formed in cortex, not how it is formed. The alternative hypothesis to the IB is that brain areas do not form minimal sufficient representations. For example, the InfoMax principle states that each brain area stores information about all inputs (even if they’re not necessary to perform the task). InfoMax isn’t unreasonable: it’s possible that storing as much information about the inputs, even in downstream areas, can support flexible computation and InfoMax also supports redundancy in cortical areas. Indeed, many studies claim that action choice related signals are in many cortical areas, which may reflect evidence of an InfoMax principle in action for areas upstream of PMd.
While we observe an IB in deep neural networks and cortex in our perceptual decision-making task, we stress that its emergence across multiple areas is an empirical result. At the same time, multiple areas producing an IB makes intuitive sense: due to the data processing inequality, successive transformations typically decrease the information in a representation (especially when, e.g., in neural networks, every activation passes through the Relu function, which is not bijective). Multiple areas are therefore a sufficient and even ‘natural’ way to implement an IB, but multiple areas are not necessary for an IB. That we observe an IB in deep neural networks and cortex emerge through multi-area computation is empirical, and, contrasting InfoMax, we believe it is an important result of this paper.
Nevertheless, your incisive comments have helped us to update the manuscript that when we talk about the IB, we should be clear that the alternative hypothesis is non-minimal representations, a prominent example of which is the InfoMax principle. We have now significantly revised our introduction to avoid this confusion. We hope this provides helpful context for our point-by-point replies, below.
However, assuming as a given that deep neural networks implement an IB does not mean that an IB can only be implemented through a deep neural network. In fact, IBs could be performed with a single transformation just as well. More formally, a task associates stimuli (X) with required responses (Y), and the IB principle states that X should be mapped to a representation Z, such that I(X;Z) is minimal and I(Y,Z) is maximal. Importantly, the form of the map Z=f(X) is not constrained by the IB. In other words, the IB does not impose that there needs to be a series of transformations. I therefore do not see how the IB by itself makes any statement about the distribution of information across various brain areas.
We agree with you that an IB can be implemented in a single transformation. We wish to be clear that we do not intend to argue necessity: that multiple areas are the only way to form minimal sufficient representations. Rather, multiple areas are sufficient to induce minimal sufficient representations, and moreover, they are a natural and reasonably simple way to do so. By ‘natural,’ we mean that minimal sufficient representations empirically arise in systems with multiple areas (more than 2), including deep neural networks and the cortex at least for our task and simulations. For example, we did not see minimal sufficient representations in 1- or 2-area RNNs, but we did see them emerge in RNNs with 3 areas or more. One potential reason for this result is that sequential transformations through multiple areas can never increase information about the input; it can only maintain or reduce information due to the data processing inequality.
Our finding that multiple areas facilitate IBs in the brain is therefore an empirical result: like in deep neural networks, we observe the brain has minimal sufficient representations that emerge in output areas (PMd), even as an area upstream (DLPFC) is not minimal. While the IB makes a statement that this minimal sufficient representation emerges, to your point, the fact that it emerges over multiple areas is not a part of the IB – as you have pointed out, the IB doesn’t state where or how the information is discarded, only that it is discarded. Our RNN modeling later proposes one potential mechanism for how it is discarded. We updated the manuscript introduction to make these points:
“An empirical observation from Machine Learning is that deep neural networks tend to form minimal sufficient representations in the last layers. Although multi-layer computation is not necessary for an IB, they provide a sufficient and even “natural” way to form an IB. A representation z = f(x) cannot contain more information than the input x itself due to the data processing inequality[19]. Thus, adding additional layers typically results in representations that contain less information about the input.”
And later in the introduction:
“Consistent with these predictions of the IB principle, we found that DLPFC has information about the color, target configuration, and direction. In contrast, PMd had a minimal sufficient representation of the direction choice. Our recordings therefore identified a cortical IB. However, we emphasize the IB does not tell us where or how the minimal sufficient representation is formed. Instead, only our empirical results implicate DLPFC-PMd in an IB computation. Further, to propose a mechanism for how this IB is formed, we trained a multi-area RNN to perform this task. We found that the RNN faithfully reproduced DLPFC and PMd activity, enabling us to propose a mechanism for how cortex uses multiple areas to compute a minimal sufficient representation.”
In the context of our work, we want to be clear the IB makes these predictions:
Prediction 1: There exists a downstream area of cortex that has a minimal and sufficient representation to perform a task (i.e.,. I(X;Z) is minimal while preserving task information so that I(Z;Y) is approximately equal to I(X;Y)). We identify PMd as an area with a minimal sufficient representation in our perceptual-decision-making task.
Prediction 2 (corollary if Prediction 1 is true): There exists an upstream brain area that contains more input information than the minimal sufficient area. We identify DLPFC as an upstream area relative to PMd, which indeed has more input information than downstream PMd in our perceptual decision-making task.
Note: as you raise in other points, it could have been possible that the IB is implemented early on, e.g., in either the parietal cortex (dorsal stream) or inferotemporal cortex (ventral stream), so that DLPFC and PMd both contained minimal sufficient representations. The fact that it doesn’t is entirely an empirical result from our data. If DLPFC had minimal sufficient representations for the perceptual decision making task, we would have needed to record in other regions to identify brain areas that are consistent with Prediction 2. But, empirically, we found that DLPFC has more input information relative to PMd, and therefore the DLPFC-PMd connection is implicated in the IB process.
What is the alternative hypothesis to the IB? We want to emphasize: it isn’t single-area computation. It’s that the cortex does not form minimal sufficient representations. For example, an alternative hypothesis (“InfoMax”) would be for all engaged brain areas to form representations that retain all input information. One reason this could be beneficial is because each brain area could support a variety of downstream tasks. In this scenario, PMd would not be minimal, invalidating Prediction 1. However, this is not supported by our empirical observations of the representations in PMd, which has a minimal sufficient representation of the task. We updated our introduction to make this clear:
“But cortex may not necessarily implement an IB. The alternative hypothesis to IB is that the cortex does not form minimal sufficient representations. One manifestation of this alternative hypothesis is the “InfoMax” principle, where downstream representations are not minimal but rather contain maximal input information22. This means information about task inputs not required to perform the task are present in downstream output areas. Two potential benefits of an InfoMax principle are (1) to increase redundancy in cortical areas and thereby provide fault tolerance, and (2) for each area to support a wide variety of tasks and thereby improve the ability of brain areas to guide many different behaviors. In contrast to InfoMax, the IB principle makes two testable predictions about cortical representations. Prediction 1: there exists a downstream area of cortex that has a minimal and sufficient representation to perform a task (i.e., I(X; Z) is minimal while preserving task information so that I(Z; Y) ≈ I(X; Y)). Prediction 2 (corollary if Prediction 1 is true): there exists an upstream area of cortex that has more task information than the minimal sufficient area.”
Your review helped us realize we should have been clearer in explaining that these are the key predictions of the IB principle tested in our paper. We also realized we should be much clearer that these predictions aren’t trivial or expected, and there is an alternative hypothesis. We have re-written the introduction of our paper to highlight that the key prediction of the IB is minimal sufficient representations for the task, in contrast to the alternative hypothesis of InfoMax.
A related problem is that the authors really only evoke the IB to explain the representation in PMd: Fig 2 shows that PMd is almost only showing decision information, and thus one can call this a minimal sufficient representation of the decision (although ignoring substantial condition independent activity).
However, there is no IB prediction about what the representation of DLPFC should look like.
Consequently, there is no IB prediction about how information should be distributed across DLPFC and PMd.
We agree: the IB doesn’t tell us how information is distributed, only that there is a transformation that eventually makes PMd minimal. The fact that we find input information in DLPFC reflects that this computation occurs across areas, and is an empirical characterization of this IB in that DLPFC has direction, color and context information while PMd has primarily direction information. To be clear: only our empirical recordings verified that the DLPFC-PMd circuit is involved in the IB. As described above, if not, we would have recorded even further upstream to identify an inter-areal connection implicated in the IB.
We updated the text to clearly state that the IB predicts that an upstream area’s activity should contain more information about the task inputs. We now explicitly describe this in the introduction, copy and pasted again here for convenience.
“In contrast to InfoMax, the IB principle makes two testable predictions about cortical representations. Prediction 1: there exists a downstream area of cortex that has a minimal and sufficient representation to perform a task (i.e., I(X; Z) is minimal while preserving task information so that I(Z; Y) ≈ I(X; Y)). Prediction 2 (corollary if Prediction 1 is true): there exists an upstream area of cortex that has more task information than the minimal sufficient area.
Consistent with the predictions of the IB principle, we found that DLPFC has information about the color, target configuration, and direction. In contrast, PMd had a minimal sufficient representation of the direction choice. Our recordings therefore identified a cortical IB. However, we emphasize the IB does not tell us where or how the minimal sufficient representation is formed. Instead, only our empirical results implicate DLPFC-PMd in an IB computation Further, to propose a mechanism for how this IB is formed, we trained a multi-area RNN to perform this task.”
The only way we knew DLPFC was not minimal was through our experiments. Please also note that the IB principle does not describe how information could be lost between areas or layers, whereas our RNN simulations show that this may occur through preferential propagation of task-relevant information with respect to the inter-area connections.
(2) Now the authors could change their argument and state that what is really needed is an IB with the additional assumption that transformations go through a feedforward network. However, even in this case, I am not sure I understand the need for distributing information in this task. In fact, in both the data and the network model, there is a nice linear readout of the decision information in dPFC (data) or area 1 (network model). Accordingly, the decision readout could occur at this stage already, and there is absolutely no need to tag on another area (PMd, area 2+3).
Similarly, I noticed that the authors consider 2,3, and 4-area models, but they do not consider a 1-area model. It is not clear why the 1-area model is not considered. Given that e.g. Mante et al, 2013, manage to fit a 1-area model to a task of similar complexity, I would a priori assume that a 1-area RNN would do just as well in solving this task.
While decision information could indeed be read out in Area 1 in our multi-area model, we were interested in understanding how the network converged to a PMd-like representation (minimal sufficient) for solving this task. Empirically, we only observed a match between our model representations and animal cortical representations during this task when considering multiple areas. Given that we empirically observed that our downstream area had a minimal sufficient representation, our multi-area model allowed how this minimal sufficient representation emerged (through preferential propagation of task-relevant information).
We also analyzed single-area networks in our initial manuscript, though we could have highlighted these analyses more clearly to be sure they were not overlooked. We are clearer in this revision that we did consider a 1-area network (results in our Fig 5). While a single-area RNN can indeed solve this task, the single area model had all task information present in the representation, and did not match the representations in DLPFC or PMd. It would therefore not allow us to understand how the network converged to a PMd-like representation (minimal sufficient) for solving this task. We updated the schematic in Fig 5 to add in the single-area network (which may have caused the confusion).
We have added an additional paragraph commenting on this in the discussion. We also added an additional supplementary figure with the PCs of the single area RNN (Fig S15). We highlight that single area RNNs do not resemble PMd activity because they contain strong color and context information.
In the discussion:
“We also found it was possible to solve this task with single area RNNs, although they did not resemble PMd (Figure S15) since it did not form a minimal sufficient representation. Rather, for our RNN simulations, we found that the following components were sufficient to induce minimal sufficient representations: (1) RNNs with at least 3 areas, following Dale’s law (independent of the ratio of feedforward to feedback connections).”
I think there are two more general problems with the author's approach. First, transformations or hierarchical representations are usually evoked to get information into the right format in a pure feedforward network. An RNN can be seen as an infinitely deep feedforward network, so even a single RNN has, at least in theory, and in contrast to feedforward layers, the power to do arbitrarily complex transformations. Second, the information coming into the network here (color + target) is a classical xor-task. While this task cannot be solved by a perceptron (=single neuron), it also is not that complex either, at least compared to, e.g., the task of distinguishing cats from dogs based on an incoming image in pixel format.
An RNN can be viewed as an infinitely deep feedforward network in time. However, we wish to clarify two things. First, our task runs for a fixed amount of time, and therefore this RNN in practice is not infinitely deep in time. Second, if it were to perform an IB operation in time, we would expect to see color discriminability decrease as a function of time. Indeed, we considered this as a mechanism (recurrent attenuation, Figure 4a), but as we show in Supplementary Figure S9, we do not observe it to be the case that discriminability decreases through time. This is equivalent to a dynamical mechanism that removes color through successive transformations in time, which our analyses reject (Fig 4). We therefore rule out that an IB is implemented through time via an RNN’s recurrent computation (viewed as feedforward in time). Rather, as we show, the IB comes primarily through inter-areal connections between RNN areas. We clarified that our dynamical hypothesis is equivalent to rejecting the feedforward-in-time filtering hypothesis in the Results:
“We first tested the hypothesis that the RNN IB is implemented primarily by recurrent dynamics (left side of Fig. 4a). These recurrent dynamics can be equivalently interpreted as the RNN implementing a feedforward neural network in time.”
The reviewer is correct that the task is a classical XOR task and not as complex as e.g., computer vision classification. That said, our related work has looked at IBs for computer vision tasks and found them in deep feedforward networks (Kleinman et al., ICLR 2021). Even though the task is relatively straightforward, we believe it is appropriate for our conclusions because it does not have a trivial minimal sufficient representation: a minimal sufficient representation for XOR must contain only target, but not color or target configuration information. This can only be solved via a nonlinear computation. In this manner, we favor this task because it is relatively simple, and the minimal sufficient representations are interpretable, while at the same time not being so trivially simple (the minimal sufficient representations require nonlinearity to compute).
Finally, we want to note that this decision-making task is a logical and straightforward way to add complexity to classical animal decision-making tasks, where stimulus evidence and the behavioral report are frequently correlated. In tasks such as these, it may be challenging to untangle stimulus and behavioral variables, making it impossible to determine if an area like premotor cortex represents only behavior rather than stimulus. However, our task decorrelates both the stimulus and the behaviors.
(3) I am convinced of the author's argument that the RNN reproduces key features of the neural data. However, there are some points where the analysis should be improved.
(a) It seems that dPCA was applied without regularization. Since dPCA can overfit the data, proper regularization is important, so that one can judge, e.g., whether the components of Fig.2g,h are significant, or whether the differences between DLPFC and PMd are significant.
We note that the dPCA codebase optimizes the regularization hyperparameter through cross-validation and requires single-trial firing rates for all neurons, i.e., data matrices of the form (n_Neurons x Color x Choice x Time x n_Trials), which are unavailable for our data. We recognized that you are fundamentally asking whether differences are significant or not. We therefore believe it is possible to address this through a statistical test, described further below.
In order to test whether the differences of variance explained by task variables between DLPFC and PMd are significant, we performed a shuffle test. For this test, we randomly sampled 500 units from the DLPFC dataset and 500 units from the PMd dataset. We then used dPCA to measure the variance explained by target configuration, color choice, and reach direction (e.g., Var<sup>True</sup><sub>DLPFC,Color</sub>, Var<sup>True</sup><sub>PMd,Color</sub>).
To test if this variance was significant, we performed the following shuffle test. We combined the PMd and DLPFC dataset into a pool of 1000 units and then randomly selected 500 units from this pool to create a surrogate PMd dataset and used the remaining 500 units as a surrogate DLPFC dataset. We then again performed dPCA on these surrogate datasets and estimated the variance for the various task variables (e.g., Var<sub>ShuffledDLPFC,Color</sub> ,Var<sub>ShuffledPMd,Color</sub>).
We repeated this process for 100 times and estimated a sampling distribution for the true difference in variance between DLPFC and PMd for various task variables (e.g., Var<sup>True</sup><sub>DLPFC,Color</sub> - Var<sup>True</sup><sub>PMd,Color</sub>). At the same time, we estimated the distribution of the variance difference between surrogate PMd and DLPFC dataset for various task variables (e.g., Var<sub>ShuffleDLPFC,Color</sub> - Var<sub>ShufflePMd,Color</sub>).
We defined a p-value as the number of shuffles in which the difference in variance was higher than the median of the true difference and divided it by 100. Note, for resampling and shuffle tests with n shuffles/bootstraps, the lowest theoretical p-value is given as 2/n, even in the case that no shuffle was higher than the median of the true distribution. Thus, the differences were statistically significant (p < 0.02) for color and target configuration but not for direction (p=0.72). These results are reported in Figure S6 and show both the true sampling distribution and the shuffled sampling distributions.
(b) I would have assumed that the analyses performed on the neural data were identical to the ones performed on the RNN data. However, it looked to me like that was not the case. For instance, dPCA of the neural data is done by restretching randomly timed trials to a median trial. It seemed that this restretching was not performed on the RNN. Maybe that is just an oversight, but it should be clarified. Moreover, the decoding analyses used SVC for the neural data, but a neural-net-based approach for the RNN data. Why the differences?
Thanks for bringing up these points. We want to clarify that we did include SVM decoding for the multi-area network in the appendix (Fig. S4), and the conclusions are the same. Moreover, in previous work, we also found that training with a linear decoder led to analogous conclusions (Fig. 11 of Kleinman et al, NeurIPS 2021). As we had a larger amount of trials for the RNN than the monkey, we wanted to allow a more expressive decoder for the RNN, though this choice does not affect our conclusions. We clarified the text to reflect that we did use an SVM decoder.
“We also found analogous conclusions when using an SVM decoder (Fig. S4).”
dPCA analysis requires trials of equal length. For the RNN, this is straightforward to generate because we can set the delay lengths to be equal during inference (although the RNN was trained on various length trials and can perform various length trials). Animals must have varying delay periods, or else they will learn the timing of the task and anticipate epoch changes. Because animal trial lengths were therefore different, their trials had to be restretched. We clarified this in the Methods.
“For analyses of the RNN, we fixed the timing of trials, obviating the need to to restretch trial lengths. Note that while at inference, we generated RNN trials with equal length, the RNN was trained with varying delay periods.”
(4) The RNN seems to fit the data quite nicely, so that is interesting. At the same time, the fit seems somewhat serendipitous, or at least, I did not get a good sense of what was needed to make the RNN fit the data. The authors did go to great lengths to fit various network models and turn several knobs on the fit. However, at least to me, there are a few (obvious) knobs that were not tested.
First, as already mentioned above, why not try to fit a single-area model? I would expect that a single area model could also learn the task - after all, that is what Mante et al did in their 2013 paper and the author's task does not seem any more complex than the task by Mante and colleagues.
Thank you for bringing up this point. As mentioned in response to your prior point, we did analyze a single-area RNN (Fig. 5d). We updated the schematic to clarify that we analyzed a single area network. Moreover, we also added a supplementary figure to qualitatively visualize the PCs of the single area network (Fig. S15). While a single area network can solve the task, it does not allow us to study how representations change across areas, nor did it empirically resemble our neural recordings. Single-area networks contain significant color, context, and direction information. They therefore do not form minimal representations and do not resemble PMd activity.
Second, I noticed that the networks fitted are always feedforward-dominated. What happens when feedforward and feedback connections are on an equal footing? Do we still find that only the decision information propagates to the next area? Quite generally, when it comes to attenuating information that is fed into the network (e.g. color), then that is much easier done through feedforward connections (where it can be done in a single pass, through proper alignment or misalignment of the feedforward synapses) than through recurrent connections (where you need to actively cancel the incoming information). So it seems to me that the reason the attenuation occurs in the inter-area connections could simply be because the odds are a priori stacked against recurrent connections. In the real brain, of course, there is no clear evidence that feedforward connections dominate over feedback connections anatomically.
We want to clarify that we did pick feedforward and feedback connections based on the following macaque atlas, reference 27 in our manuscript:
Markov, N. T., Ercsey-Ravasz, M. M., Ribeiro Gomes, A. R., Lamy, C., Magrou, L., Vezoli, J., Misery, P., Falchier, A., Quilodran, R., Gariel, M. A., Sallet, J., Gamanut, R., Huissoud, C., Clavagnier, S., Giroud, P., Sappey-Marinier, D., Barone, P., Dehay, C., Toroczkai, Z., … Kennedy, H. (2014). A weighted and directed interareal connectivity matrix for macaque cerebral cortex. Cerebral Cortex , 24(1), 17–36.
We therefore believe there is evidence for more feedforward than feedback connections. Nevertheless, as stated in response to your next point below, we ran a simulation where feedback and feedforward connectivity were matched.
More generally, it would be useful to clarify what exactly is sufficient:
(a) the information distribution occurs in any RNN, i.e., also in one-area RNNs
(b) the information distribution occurs when there are several, sparsely connected areas
(c) the information distribution occurs when there are feedforward-dominated connections between areas
We better clarify what exactly is sufficient.
- We trained single-area RNNs and found that these RNNs contained color information; additionally two area RNNs also contained color information in the last area (Fig 5d).
- We indeed found that the minimal sufficient representations emerged when we had several areas, with Dale’s law constraint on the connectivity. When we had even sparser connections, without Dale’s law, there was significantly more color information, even at 1% feedforward connections; Fig 5a.
- When we matched the percentage of feedforward and feedback connections with Dale’s law constraint on the connectivity (10% feedforward and 10% feedback), we also observed minimal sufficient representations (Fig S9).
Together, we found that minimal sufficient representations emerged when we had several areas (3 or greater), with Dale’s law constraint on the connectivity, independent of the ratio of feedforward/feedback connections. We thank the reviewer for raising this point about the space of constraints leading to minimal sufficient representations in the late area. We clarified this in the Discussion.
“We also found it was possible to solve this task with single area RNNs, although they did not resemble PMd (Figure S15) since it did not form a minimal sufficient representation. Rather, for our RNN simulations, we found that the following components were sufficient to induce minimal sufficient representations: RNNs with at least 3 areas, following Dale’s law (independent of the ratio of feedforward to feedback connections).”
Thank you for your helpful and constructive comments!
Reviewer #2 (Public Review):
Kleinman and colleagues conducted an analysis of two datasets, one recorded from DLPFC in one monkey and the other from PMD in two monkeys. They also performed similar analyses on trained RNNs with various architectures.
The study revealed four main findings. (1) All task variables (color coherence, target configuration, and choice direction) were found to be encoded in DLPFC. (2) PMD, an area downstream of PFC, only encoded choice direction. (3) These empirical findings align with the celebrated 'information bottleneck principle,' which suggests that FF networks progressively filter out task-irrelevant information. (4) Moreover, similar results were observed in RNNs with three modules.
We thank the reviewer for their comments, feedback and suggestions, which we address below.
While the analyses supporting results 1 and 2 were convincing and robust, I have some concerns and recommendations regarding findings 3 and 4, which I will elaborate on below. It is important to note that findings 2 and 4 had already been reported in a previous publication by the same authors (ref. 43).
Note the NeurIPS paper only had PMd data and did not contain any DLPFC data. That manuscript made predictions about representations and dynamics upstream of PMd, and subsequent experiments reported in this manuscript validated these predictions. Importantly, this manuscript observes an information bottleneck between DLPFC and PMd.
Major recommendation/comments:
The interpretation of the empirical findings regarding the communication subspace in relation to the information bottleneck theory is very interesting and novel. However, it may be a stretch to apply this interpretation directly to PFC-PMd, as was done with early vs. late areas of a FF neural network.
In the RNN simulations, the main finding indicates that a network with three or more modules lacks information about the stimulus in the third or subsequent modules. The authors draw a direct analogy between monkey PFC and PMd and Modules 1 and 3 of the RNNs, respectively. However, considering the model's architecture, it seems more appropriate to map Area 1 to regions upstream of PFC, such as the visual cortex, since Area 1 receives visual stimuli. Moreover, both PFC and PMd are deep within the brain hierarchy, suggesting a more natural mapping to later areas. This contradicts the CCA analysis in Figure 3e. It is recommended to either remap the areas or provide further support for the current mapping choice.
We updated the Introduction to better clarify the predictions of the information bottleneck (IB) principle. In particular, the IB principle predicts that later areas should have minimal sufficient representations of task information, whereas upstream areas should have more information. In PMd, we observed a minimal sufficient representation of task information during the decision-making task. In DLPFC, we observed more task information, particularly more information about the target colors and the target configuration.
In terms of the exact map between areas, we do not believe or intend to claim the DLPFC is the first area implicated in the sensorimotor transformation during our perceptual decision-making task. Rather, DLPFC best matches Area 1 of our model. It is important to note that we abstracted our task so that the first area of our model received checkerboard coherence and target configuration as input (and hence did not need to transform task visual inputs). Indeed, in Figure 1d we hypothesize that the early visual areas should contain additional information, which we do not model directly in this work. Future work could model RNNs to take in an image or video input of the task stimulus. In this case, it would be interesting to assess if earlier areas resemble visual cortical areas. We updated the results, where we first present the RNN, to state the inputs explicitly and be clear the inputs are not images or videos of the checkerboard task.
“The RNN input was 4D representing the target configuration and checkerboard signed coherence, while the RNN output was 2D, representing decision variables for a left and right reach (see Methods).”
Another reason that we mapped Area 1 to DLPFC is because anatomical, physiological and lesion studies suggest that DLPFC receives inputs from both the dorsal and ventral stream (Romanski, et, al, 2007; Hoshi, et al, 2006; Wilson, at al, 1993). The dorsal stream originates from the occipital lobe, passes through the posterior parietal cortex, to DLPFC, which carries visuospatial information of the object. The ventral stream originates from the occipital lobe, passes through the inferior temporal cortex, ventrolateral prefrontal cortex to DLPFC, which encodes the identity of the object, including color and texture. In our RNN simulation, Area 1 receives processed inputs of the task: target configuration and the evidence for each color in the checkerboard. Target configuration contains information of the spatial location of the targets, which represents the inputs from the dorsal stream, while evidence for each color by analogy is the input from the ventral stream. Purely visual areas would not fit this dual input from both the dorsal and ventral stream. A potential alternative candidate would be the parietal cortex which is largely part of the dorsal stream and is thought to have modest color inputs (although there is some shape and color selectivity in areas such as LIP, e.g., work from Sereno et al.). On balance given the strong inputs from both the dorsal and ventral stream, we believe Area 1 maps better on to DLPFC than earlier visual areas.
Recommendations for the authors:
Reviewer #1 (Recommendations For The Authors):
(1) Line 35/36: Please specify the type of nuisance that the representation is robust to. I guess this refers to small changes in the inputs, not to changes in the representation itself.
Indeed it refers to input variability unrelated to the task. We clarified the text.
(2) For reference, it would be nice to have a tick for the event "Targets on" in Fig.2c.
In this plot, the PSTHs are aligned to the checkerboard onset. Because there is a variable time between target and checkerboard onset, there is a trial-by-trial difference of when the target was turned on, so there is no single place on the x-axis where we could place a “Targets on” tick. In response to this point, we generated a plot with both targets on and check on alignment, with a break in the middle, shown in Supplementary Figure S5.
(3) It would strengthen the comparison between neural data and RNN if the DPCA components of the RNN areas were shown, as they are shown in Fig.2g,h for the neural data.
We include the PSTHs plotted onto the dPCA components here for Area 1 of the exemplar network. Dashed lines indicate a left reach, while solid lines indicate a right reach, and the color corresponds to the color of the selected target. As expected, we find that the dPCA components capture the separation between components. We emphasize that the trajectory paths along the decoder axes are not particularly meaningful to interpret, except to demonstrate whether variables can be decoded or not (as in Fig 2g,h, comparing DLPFC and PMd). The decoder axes of dPCA are not constrained in any way, in contrast to the readout (encoder) axis (see Methods). This is why our manuscript focuses on analyzing the readout axes. However, if the reviewer strongly prefers these plots to be put in the manuscript, we will add them.
Author response image 1.
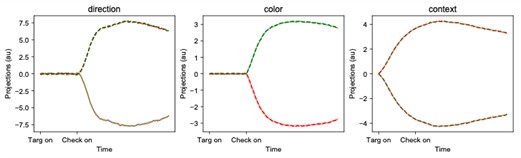
(4) The session-by-session decode analysis presented in Fig.2i suggests that DLPFC has mostly direction information while in Area 1 target information is on top, as suggested by Fig.3g. An additional decoding analysis on trial averaged neural data, i.e. a figure for neural data analogous to Fig.3g,h, would allow for a more straightforward and direct comparison between RNN and neural data.
We first clarify that we did not decode trial-averaged neural data for either recorded neural data or RNNs. In Fig 3g, h (for the RNN) all decoding was performed on single trial data and then averaged. We have revised the main manuscript to make this clear. Because of this, the mean accuracies we reported for DLPFC and PMd in the text are therefore computed in the same way as the mean accuracies presented in Fig 3g, h. We believe this likely addresses your concern: i.e., the mean decode accuracies presented for both neural data and the RNN were computed the same way.
If the above paragraph did not address your concern, we also wish to be clear that we presented the neural data as histograms, rather than a mean with standard error, because we found that accuracies were highly variable depending on electrode insertion location. For example, some insertions in DLPFC achieved chance-levels of decoding performance for color and target configuration. For this reason, we prefer to keep the histogram as it shows more information than reporting the mean, which we report in the main text. However, if the reviewer strongly prefers us to make a bar plot of these means, we will add them.
(5) Line 129 mentions an analysis of single trials. But in Fig.2i,j sessions are analyzed. Please clarify.
For each session, we decode from single trials and then average these decoding accuracies, leading to a per-session average decoding accuracy. Note that for each session, we record from different neurons. In the text, we also report the average over the sessions. We clarified this in the text and Methods.
(6) Fig.4c,f show how color and direction axes align with the potent subspaces. We assume that the target axis was omitted here because it highly aligns with the color axis, yet we note that this was not pointed out explicitly.
You are correct, and we revised the text to point this out explicitly.
“We quantified how the color and direction axis were aligned with these potent and null spaces of the intra-areal recurrent dynamics matrix of Area 1 ($\W^1_{rec}$). We did not include the target configuration axis for simplicity, since it highly aligns with the color axis for this network.”
(7) The caption of Fig.4c reads: "Projections onto the potent space of the intra-areal dynamics for each area." Yet, they only show area 1 in Fig.4c, and the rest in a supplement figure. Please refer properly.
Thank you for pointing this out. We updated the text to reference the supplementary figure.
(8) Line 300: "We found the direction axis was more aligned with the potent space and the color axis was more aligned with the null space." They rather show that the color axis is as aligned to the potent space as a random vector, but nothing about the alignments with the null space. Contrarily, on line 379 they write "...with the important difference that color information isn't preferentially projected to a nullspace...". Please clarify.
Thank you for pointing this out. We clarified the text to read: “We found the direction axis was more aligned with the potent space”. The text then describes that the color axis is aligned like a random vector: “In contrast, the color axis was aligned to a random vector.”
(9) Line 313: 'unconstrained' networks are mentioned. What constraints are implied there, Dale's law? Please define and clarify.
Indeed, the constraint refers to Dale’s law constraints. We clarified the text: “Further, we found that W<sub>21</sub> in unconstrained 3 area networks (i.e., without Dale's law constraints) had significantly reduced…”
(10) Line 355 mentions a 'feedforward bottleneck'. What does this exactly mean? No E-I feedforward connections, or...? Please define and clarify.
This refers to sparser connections between areas than within an area, as well as a smaller fraction of E-I connections. We clarified the text to read:
“Together, these results suggest that a connection bottleneck in the form of neurophysiological architecture constraints (i.e., sparser connections between areas than within an area, as well as a smaller fraction of E-I connections) was the key design choice leading to RNNs with minimal color representations and consistent with the information bottleneck principle.”
(11) Fig.5c is supposedly without feedforward connections, but it looks like the plot depicts these connections (i.e. identical to Fig.5b).
In Figure 5, we are varying the E to I connectivity in panel B, and the E-E connectivity in panel C. We vary the feedback connections in Supp Fig. S12. We updated the caption accordingly.
(12) For reference, it would be nice to have the parameters of the exemplar network indicated in the panels of Fig.5.
We updated the caption to reference the parameter configuration in Table 1 of the Appendix.
(13) Line 659: incomplete sentence
Thank you for pointing this out. We removed this incomplete sentence.
(14) In the methods section "Decoding and Mutual information for RNNs" a linear neural net decoder as well as a nonlinear neural net decoder are described, yet it was unclear which one was used in the end.
We used the nonlinear network, and clarified the text accordingly. We obtained consistent conclusions using a linear network, but did not include these results in the text. (These are reported in Fig. 11 of Kleinman et al, 2021). Moreover, we also obtain consistent results by using an SVM decoder in Fig. S4 for our exemplar parameter configuration.
(15) In the discussion, the paragraph starting from line 410 introduces a new set of results along with the benefits of minimal representations. This should go to the results section.
We prefer to leave this as a discussion, since the task was potentially too simplistic to generate a clear conclusion on this matter. We believe this remains a discussion point for further investigation.
(16) Fig S5: hard to parse. Show some arrows for trajectories (a) (d) is pretty mysterious: where do I see the slow dynamics?
Slow points are denoted by crosses, which forms an approximate line attractor. We clarified this in the caption.
Reviewer #2 (Recommendations For The Authors):
Minor recommendations (not ordered by importance)
(1) Be more explicit that the recordings come from different monkeys and are not simultaneously recorded. For instance, say 'recordings from PFC or PMD'. Say early on that PMD recordings come from two monkeys and that PFC recordings come from 1 of those monkeys. Furthermore, I would highlight which datasets are novel and which are not. For instance, I believe the PFC dataset is a previously unpublished dataset and should be highlighted as such.
We added: “The PMd data was previously described in a study by Chandrasekaran and colleagues” to the main text which clarifies that the PMd data was previously recorded and has been analyzed in other studies.
(2) I personally feel that talking about 'optimal', as is done in the abstract, is a bit of a stretch for this simple task.
In using the terminology “optimal,” we are following the convention of IB literature that optimal representations are sufficient and minimal. The term “optimal” therefore is task-specific; every task will have its own optimal representation. We clarify in the text that this definition comes from Machine Learning and Information Theory, stating:
“The IB principle defines an optimal representation as a representation that is minimal and sufficient for a task or set of tasks.”
In this way, we take an information-theoretic view for describing multi-area representations. This view was satisfactory for explaining and reconciling the multi-area recordings and simulations for this task, and we think it is helpful to provide a normative perspective for explaining the differences in cortical representations by brain area. Even though the task is simple, it still allows us to study how sensory/perceptual information is represented, and well as how choice-related information is being represented.
(3) It is mentioned (and even highlighted) in the abstract that we don't know why the brain distributes computations. I agree with that statement, but I don't think this manuscript answers that question. Relatedly, the introduction mentions robustness as one reason why the brain would distribute computations, but then raises the question of whether there is 'also a computational benefit for distributing computations across multiple areas'. Isn't the latter (robustness) a clear 'computational benefit'?
We decided to keep the word “why” in the abstract, because this is a generally true statement (it is unclear why the brain distributes computation) that we wish to convey succinctly, pointing to the importance of studying this relatively grand question (which could only be fully answered by many studies over decades). We consider this the setting of our work. However, to avoid confusion that we are trying to give a full answer to this question, we are now more precise in the first paragraph of our introduction as to the particular questions we ask that will take a step towards this question. In particular, the first paragraph now asks these questions, which we answer in our study.
“For example, is all stimuli and decision-related information present in all brain areas, or do the cortical representations differ depending on their processing stage? If the representations differ, are there general principles that can explain why the cortical representations differ by brain area?”
We also removed the language on robustness, as we agree it was confusing. Thank you for these suggestions.
(4) Figure 2e and Fig. 3d, left, do not look very similar. I suggest zooming in or rotating Figure 2 to highlight the similarities. Consider generating a baseline CCA correlation using some sort of data shuffle to highlight the differences.
The main point of the trajectories is to demonstrate that both Area 1 and DLPFC represent both color and direction. We now clarify this in the manuscript. However, we do not intend for these two plots to be a rigorous comparison of similarity. Rather, we quantify similarity using CCA and our decoding analysis. We also better emphasize the relative values of the CCA, rather than the absolute values.
(5) Line 152: 'For this analysis, we restricted it to sessions with significant decode accuracy with a session considered to have a significant decodability for a variable if the true accuracy was above the 99th percentile of the shuffled accuracy for a session.' Why? Sounds fishy, especially if one is building a case on 'non-decodability'. I would either not do it or better justify it.
The reason to choose only sessions with significant decoding accuracy is that we consider those sessions to be the sessions containing information of task variables. In response to this comment, we also now generate a plot with all recording sessions in Supplementary Figure S7. We modified the manuscript accordingly.
“For this analysis, we restricted it to sessions with significant decode accuracy with a session considered to have a significant decodability for a variable if the true accuracy was above the 99th percentile of the shuffled accuracy for a session. This is because these sessions contain information about task variables. However, we also present the same analyses using all sessions in Fig. S7.”
(6) Line 232: 'The RNN therefore models many aspects of our physiological data and is therefore'. Many seems a stretch?
We changed “many” to “key.”
(7) The illustration in Fig. 4B is very hard to understand, I recommend removing it.
We are unsure what this refers to, as Figure 4B represents data of axis overlaps and is not an illustration.
(8) At some point the authors use IB instead of information bottleneck (eg line 288), I would not do it.
We now clearly write that IB is an abbreviation of Information Bottleneck the first time it is introduced.
(9) Fig. 5 caption is insufficient to understand it. Text in the main document does not help. I would move most part of this figure, or at least F, to supplementary. Instead, I would move the results in S11 and S10 to the main document.
We clarified the caption to summarize the key points. It now reads:
“Overall, neurophysiological architecture constraints in the form of multiple areas, sparser connections between areas than within an area, as well as a smaller fraction of E-I connections lead to a minimal color representation in the last area.”
(10) Line 355: 'Together, these results suggest that a connection bottleneck in the form of neurophysiological architecture constraints was the key design choice leading to RNNs with minimal color representations and consistent with the information bottleneck principle.' The authors show convincingly that increased sparsity leads to the removal of irrelevant information. There is an alternative model of the communication subspace hypothesis that uses low-rank matrices, instead of sparse, to implement said bottlenecks (https://www.biorxiv.org/content/10.1101/2022.07.21.500962v2)
We thank the reviewer for pointing us to this very nice paper. Indeed, a low-rank connectivity matrix is another mechanism to limit the amount of information that is passed to subsequent areas. In fact, the low-rank matrix forms a hard-version of our observations as we found that task-relevant information was preferentially propagated along the top singular mode of the inter-areal connectivity matrix. In our paper we observed this tendency naturally emerges through training with neurophysiological architecture constraints. In the paper, for the multi-area RNN, they hand-engineered the multi-area network, whereas our network is trained. We added this reference to our discussion.
Thank you for your helpful and constructive comments.
Author response:
The following is the authors’ response to the original reviews.
Public Reviews:
Reviewer #1 (Public Review):
Summary:
In this work by Wang et al., the authors use single-molecule super-resolution microscopy together with biochemical assays to quantify the organization of Nipah virus fusion protein F (NiV-F) on cell and viral membranes. They find that these proteins form nanoscale clusters which favors membrane fusion activation, and that the physical parameters of these clusters are unaffected by protein expression level and endosomal cleavage. Furthermore, they find that the cluster organization is affected by mutations in the trimer interface on the NiV-F ectodomain and the putative oligomerization motif on the transmembrane domain, and that the clusters are stabilized by interactions among NiV-F, the AP2-complex, and the clathrin coat assembly. This work improves our understanding of the NiV fusion machinery, which may have implications also for our understanding of the function of other viruses.
Strengths:
The conclusions of this paper are well-supported by the presented data. This study sheds light on the activation mechanisms underlying the NiV fusion machinery.
Weaknesses:
The authors provide limited details of the convolutional neural network they developed in this work. Even though custom-codes are made available, a description of the network and specifications of how it was used in this work would aid the readers in assessing its performance and applicability. The same holds for the custom-written OPTICS algorithm. Furthermore, limited details are provided for the imaging setup, oxygen scavenging buffer, and analysis for the single-molecule data, which limits reproducibility in other laboratories. The claim of 10 nm resolution is not backed up by data and seems low given the imaging conditions and fluorophores used. Fourier Ring Correlation analysis would have validated this claim. If the authors refer to localization precision rather than resolution, then this should be specified and appropriate data provided to support this claim.
We thank reviewer 1 for these suggestions. We described key steps in imaging setup, singlemolecule data reconstruction, the OPTICS algorithm in cluster identification, and 1D CNN in
classification of the OPTICS data in the Materials and Methods section. We also provided a recipe for the imaging buffer. We refer to 10 nm localization precision rather than resolution. The localization precision achieved by our SMLM system is shown in the Author response image 1.
Author response image 1.
The localization precision of the custom-built SMLM. Shows the distribution of localization error at the x (dX), y (dY), and z (dZ) direction in nanometer of blinks generated from Alexa Flour 647 labeled to NiV-F expressed on the plasma membrane of PK13 cells. The lateral precision is <10 nm and the axial precision is < 20 nm.
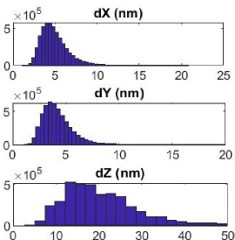
Reviewer #2 (Public Review):
Summary:
In this manuscript, Wang and co-workers employ single molecule light microscopy (SMLM) to detect NiV fusion protein (NiV-F) in the surface of cells. They corroborate that these glycoproteins form microclusters (previously seen and characterized together with the NiVG and Nipah Matrix protein by Liu and co-workers (2018) also with super-resolution light microscopy). Also seen by Liu and coworkers the authors show that the level of expression of NiV-F does not alter the identity of these microclusters nor endosomal cleavage. Moreover, mutations and the transmembrane domain or the hexamer-of-trimer interface seem to have a mild effect on the size of the clusters that the authors quantified.
Importantly, it has also been shown that these particles tend to cluster in Nipah VLPs.
We thank reviewer #2 for the comments and suggestions. This paper is built on Liu et al 1 to further characterize the nanoclusters formed by NiV-F and their role in membrane fusion activation. While Liu et al. studied the NiV glycoprotein distribution at the NiV assembly sites to inform mechanisms in NiV assembly and release, Wang et al. analyzed the nanoorganization and distribution of NiV-F at the prefusion conformation, providing insights into the membrane fusion activation mechanisms.
Strengths:
The authors have tried to perform SMLM in single VLPs and have shown partially the importance of NiV-F clustering.
Weaknesses:
The labelling strategy for the NiV-F is not sufficiently explained. The use of a FLAG tag in the extracellular domain should be validated and compared with the unlabelled WT NiV-F when expressed in functional pseudoviruses (for example HIV-1 based particles decorated with NiV-F). This experiment should also be carried out for both infection and fusion (including BlaM-Vpr as a readout for fusion). I would also suggest to run a time-of-addition BlaM experiment to understand how this particular labelling strategy affects single virion fusion as compared to the the WT.
We thank reviewer #2 for this suggestion. We have made various efforts to validate the expression and function of FLAG-tagged NiV-F. The NiV-F-FLAG shows comparable cell surface expression levels and induces similar cell-cell fusion levels in 293T cells as that of untagged NiV-F 1. The NiV-F-FLAG also showed similar levels of virus entry as untagged NiV-F when both were pseudotyped on a recombinant Vesicular Stomatitis Virus (VSV) with the VSV glycoprotein replaced by a Renilla luciferase reporter gene (VSV-ΔG-rLuc; Fig. S1D). We also performed a virus entry kinetics assay using NiV VLPs expressing NiV-M-βlactamase (NiV-M-Bla), NiV-G-HA, and NiV-F-FLAG, NiV-F-AU1 or untagged NiV-F. The intracellular AU1 tag is located at the C-terminus of NiV-F (Genbank accession no. AY816748.1). However, we detected different levels of NiV-M-Bla in equal volume of VLPs, suggesting that the tags in NiV-F affect the budding of the VLPs (Author response image 2A). Therefore, we performed fusion kinetics assay by using VLPs expressing the same levels of NiV-M-Bla. Among them, the NiV-F-FLAG on VLPs shows the most efficient fusion between VLP and HEK293T cell membranes (Author response image 2B), significantly more efficient than that of untagged NiV-F and NiV-FAU1. However, we cannot attribute the enhanced fusion activity to the FLAG tag, because the readout of this assay relies on both the levels of β-lactamase (introduced by NiV-M-Bla in VLPs) and the NiV-F constructs. The tags in NiV-F could affect both the budding of VLPs and the stoichiometry of F and M in individual VLPs. We did not use the HIV-based pseudovirus system because the incorporation of NiV-F into HIV pseudoviruses requires a C-terminal deletion 2,3.
In summary, the FLAG tag does not affect cell-cell fusion 1 and virus entry when pseudotyped to the recombinant VSV-ΔG-rLuc viruses (Fig. S1D). Given that we do not observe any difference in clustering between an HA- and FLAG-tagged NiV-F constructs on PK13 cell surface (Fig. S1A-C), we conclude that the FLAG tag has minimal effect on both the fusion activity and the nanoscale distribution of NiV-F.
Author response image 2.
Viral entry is not affected by labeling of NiV-F. A) Western blot analysis of NiV-M-Bla in NiV-VLPs generated by HEK293T cells expressing NiV-M-Bla, NiV-G-HA and NiV-F-FLAG, untagged NiV-F, or NiV-F-AU1. Equal volume of VLPs were separated by a denaturing 10% SDS–PAGE and probed against β-lactamase (SANTA CRUZ, sc-66062). B) NiV-VLPs expressing NiV-M-BLa, NiV-G-HA, and NiV-F-FLAG, untagged NiV-F or NiV-F-AU1 expression plasmids were bond to the target HEK293T cells loaded with CCF2-AM dye at 4°C. The Blue/Green (B/G) ratio was measured at 37°C for 4 hrs at a 3-min interval. Results were normalized to the maximal B/G ratio of NiV-F-FLAG-NiV VLPs. Results from one representative experiment out of three independent experiments are shown.
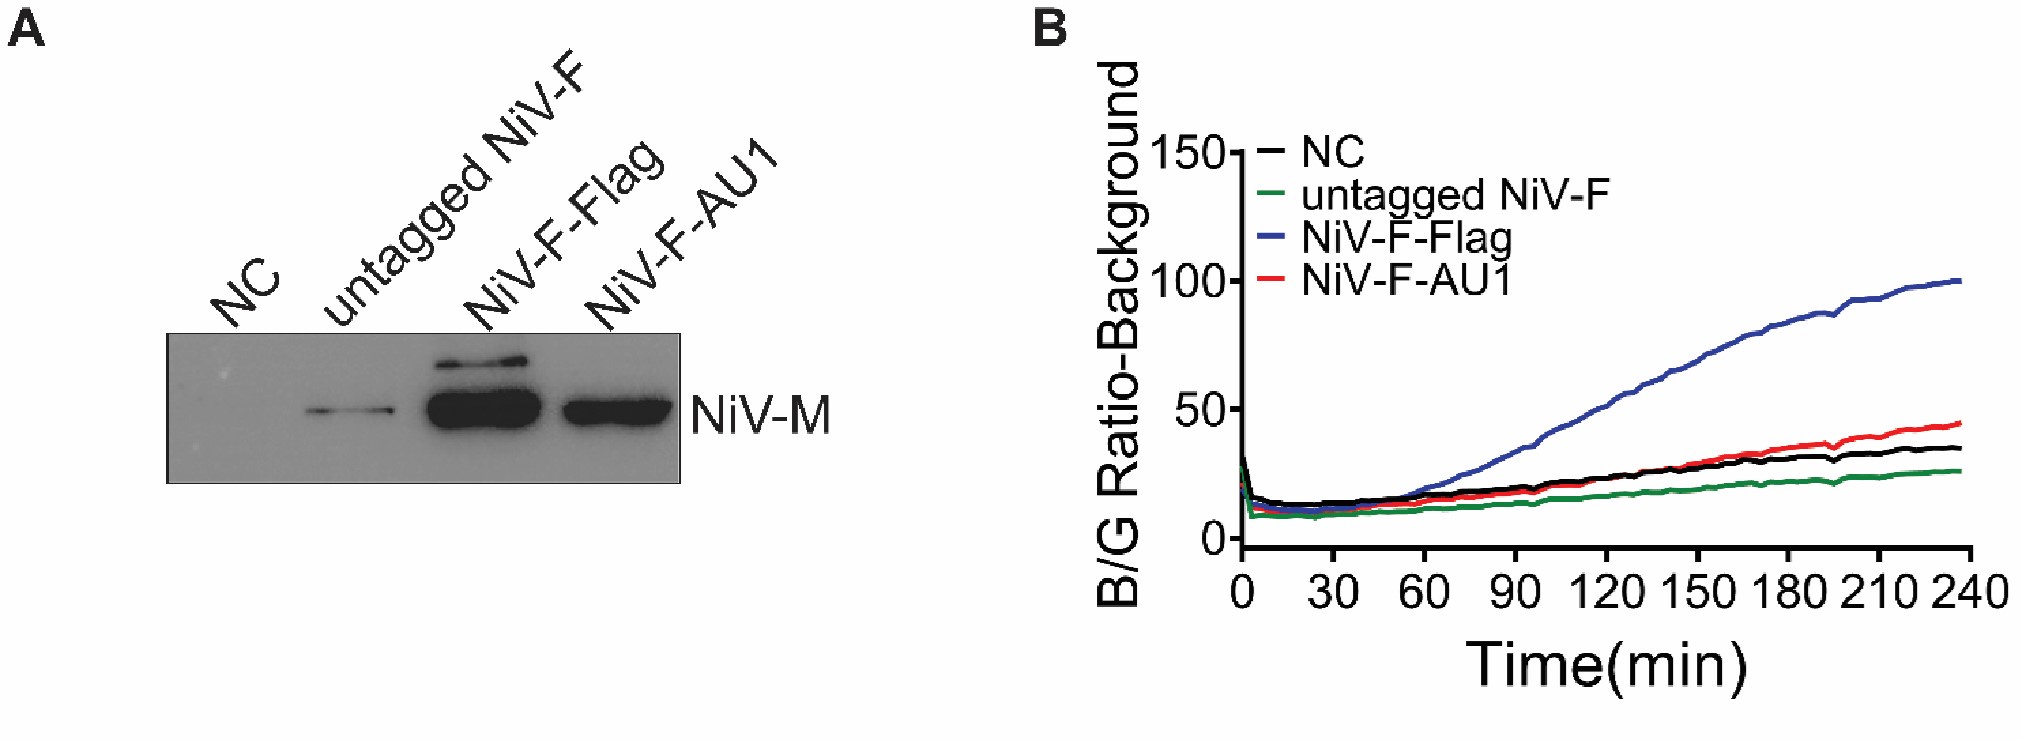
It would also be very important to compare the FLAG labelling approach with recent advances in the field (for instance incorporating noncanonical amino acids (ncAAs) into NiVF by amber stop-codon suppression, followed by click chemistry).
We are greatly thankful for this comment from reviewer #2. Labeling noncanonical amino acids (ncAAs) with biorthogonal click chemistry is indeed a more precise labeling strategy compared to the traditional epitope labeling approach used in this paper. We will explore the applications of ncAAs labeling in single-molecule localization imaging and virus-host interactions in future projects.
In this paper, the FLAG tag inserted in NiV-F protein seems to have minimal effect on the NiV-F-induced virus entry and cell-cell fusion 1 (Fig. S1). Although the FLAG tag labeling approach may increase the detectable size of NiV-F nanoclusters due to the use of the antibody complex, it should not affect our conclusions drawn from the relative comparisons between wt and mutant NiV-F or control and drug-treated cells.
The correlation between the existence of microclusters of a particular size and their functionality is missing. Only cell-cell fusion assays are shown in supplementary figures and clearly, single virus entry and fusion cannot be compared with the biophysics of cell-cell fusion. Not only the environment is completely different, membrane curvature and the number of NiV-F drastically varies also. Therefore, specific fusion assays (either single virus tracking and/or time-of-addition BlaM kinetics with functional pseudoviruses) are needed to substantiate this claim.
We thank Reviewer 2 for the suggestion. To support the link between F clustering and viruscell membrane fusion, we conducted pseudotyped virus entry and VLP fusion kinetics assays, as shown in revised Figure S4. The viral entry results (Fig. S4 E and F) corroborate that of the cell-cell fusion assay (Fig. S4A and B) and previously published data 4. The fusion kinetics confirmed that the real-time fusion kinetics was affected by mutations at the hexameric interface, with the hypo-fusogenic mutants L53D and V108D exhibited reduced entry efficiency while the hyper-fusogenic mutant Q393L showed increased efficiency (Fig. S4G and H). The results were described in detail in the revised manuscript.
Additionally, we performed a pseudotyped virus entry assay on the LI4A (Fig. S6F and G) and YA (Fig. S7F and G) mutants to verify the function of these mutants on viruses in revised Supplemental Figures. Neither LI4A nor YA incorporated into the VSV/NiV pseudotyped viruses as shown by the Western blot analyses of the pseudovirions (Fig. S6F and S7F), and thus did not induce virus entry, consisting with the cell-cell fusion results (Fig. S6C, D and Fig. S7C, D). We did not perform the entry kinetic assay of these two mutants as they do not incorporate into VLPs or pseudovirions.
The authors also claim they could not characterize the number of NiV-F particles per cluster. Another technique such as number and brightness (Digman et al., 2008) could support current SMLM data and identify the number of single molecules per cluster. Also, this technology does not require complex microscopy apparatus. I suggest they perform either confocal fluorescence fluctuation spectroscopy or TIRF-based nandb to validate the clusters and identify how many molecule are present in these clusters.
We thank reviewer 2 for this suggestion. Determining the true copy number of NiV-F in individual clusters could verify whether the F clusters on the plasma membrane are hexamer-of-trimer assemblies. Regardless, it does not affect our conclusion that the organization of NiV-F into nanoclusters affects the membrane fusion triggering ability. The confocal fluorescence fluctuation spectroscopy (FFS) and TIRF-based analyses are accessible tools for quantifying fluorophore copy numbers and/or stoichiometry based on fluorescence fluctuation or photobleaching. However, these methods are unable to quantify the number of proteins in individual clusters because they analyze fluorophores either in the entire cell (as in wide-field epifluorescence microscopy coupled with FFS and TIRF-coupled photobleaching) 5–7 or within a large excitation volume (confocal laser scanning microscopycoupled FFS) 8. Both of these volumes are significantly larger than a single NiV-F cluster, which has an average diameter of 24-26 nm (Fig. 1F).
The current SMLM setup is useful for characterizing the protein distribution and organization. However, quantifying the true protein copy number within a nanocluster is challenging because of the stochasticity of fluorophore blinking and the unknown labeling stoichiometry 9–11. To address the challenge in fluorophore blinking, quantitative DNA-PAINT (qDNA-PAINT) may be used because the on-off frequency of the fluorophores is tied to the well-defined kinetic constants of DNA binding and the influx rate of the imager strands, rather than the stochasticity of fluorophore blinking. Thus, the frequency of blinks can be translated to protein counting 12. To address the challenge in unknown labeling stoichiometry, DNA origami can be used as a calibration standard 11. DNA origami supports handles at a regular space with several to tens of nanometers apart, and the handles can be conjugated with a certain number of proteins of interest. The copy number of protein interest in the experimental group can be determined by comparing the SMLM localization distribution of the sample to that of the DNA origami calibration standard. Given the requirement of a more sophisticated SMLM setup and a high-precision calibration tool, we will explore the quantification of NiV-F copy numbers in nanoclusters in a future project.
Also, it is not clear how many cells the authors employ for their statistics (at least 30-50 cells should be employed and not consider the number of events blinking events. I hope the authors are not considering only a single cell to run their stats... The differences between the mutants and the NiV-F is minor even if their statistical analyses give a difference (they should average the number and size of the clusters per cell for a total of 30-50 cells with experiments performed at least in three different cells following the same protocol). Overall, it seems that the authors have only evaluated a very low number of cells.
We disagree with this comment from Reviewer #2. The sample size for cluster analysis in SMLM images was chosen by considering the target of the study (cells and VLPs) and the data acquisition and analysis standards in the SMLM imaging field. We also noted the sample size (# of ROI and cells) in the figure legend.
Below, we compared the sample sizes in our study to those in similar studies that used comparable imaging and cluster analysis methods from 2015 to 2024. The classical clustering analysis methods are categorized into global clustering (e.g. nearest neighbor analysis, Ripley’s K function, and pair correlation function) and complete clustering, such as density-based analysis (e.g. DBSCAN, Superstructure, FOCAL, ToMATo) and Tessellationbased analysis (e.g. Delaunay triangulation, Voronoii Tessellation). The global clustering analysis method provides spatial statistics for global protein clustering or organization (e.g. clustering extent), while the complete clustering approach extracts information from a single-cluster level, such as the morphology and localization density of individual clusters. We used the density-based analyses, DBSCAN and OPTICS, for cluster analysis on cell plasma membranes and VLP membranes.
Author response table 1.
The comparison of imaging methods, analysis methods, and sample size in the current study to other studies conducted from 2015 to 2024.
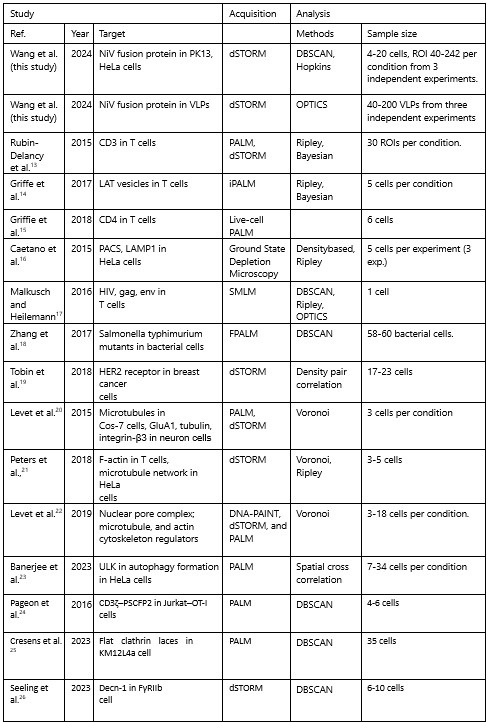
They should also compare the level of expression (with the number of molecules per cell provided by number and brightness) with the total number of clusters.
We thank reviewer 2 for this suggestion. We compared the level of expression with the total number of clusters for F-WT in Figure 1I in the main text.
The same applies to the VLP assay. I assume the authors have only taken VLPs expressing both NiV-M and NiV-F (and NiV-G). But even if this is not clearly stated I would urge the authors to show how many viruses were compared per condition (normally I would expect 300 particles per condition coming from three independent experiments. As a negative control to evaluate the cluster effect I would mix the different conditions. Clearly you have clusters with all conditions and the differences in clustering depending on each condition are minimal. Therefore you need to increase the n for all experiments.
We thank reviewer 2 for this comment. We acquired and analyzed more images of NiV VLPs bearing F-WT, Q393L, L53D, and V108D. Results are shown in the revised Figure 4 and the number of VLPs (>300) used for analysis is specified in the figure legend. An increased number of VLP images does not affect the classification result in Figure 4C.
As for the suggestion on “evaluating the cluster effect at different mixed conditions”, I assume that reviewer 2 would like to see how the presence of different viral structural proteins (F, M, and G) on VLPs could affect F clustering. We showed that the organization of NiV envelope proteins on the VLP membrane is similar in the presence or absence of NiV-M by direct visualization 27, suggesting that the effect of NiV-M on F-WT clustering on VLPs is minimal. We also show comparable incorporation of NiV-F among the NiV-F hexamer-oftrimer mutants (Fig. 4A). Therefore, we did not test the F clustering at different F, M, and G combinations in this paper. However, this could be an interesting question to pursue in a paper focusing on NiV VLP production.
Reviewer #3 (Public Review):
Summary:
The manuscript by Wang and colleagues describes single molecule localization microscopy to quantify the distribution and organization of Nipah virus F expressed on cells and on virus-like particles. Notably the crystal structure of F indicated hexameric assemblies of F trimers. The authors propose that F clustering favors membrane fusion.
Strengths:
The manuscript provides solid data on imaging of F clustering with the main findings of:
- F clusters are independent of expression levels
- Proteolytic cleavage does not affect F clustering
- Mutations that have been reported to affect the hexamer interface reduce clustering on cells and its distribution on VLPs - - F nanoclusters are stabilized by AP
Weaknesses:
The relationship between F clustering and fusion is per se interesting, but looking at F clusters on the plasma membrane does not exclude that F clustering occurs for budding. Many viral glycoproteins cluster at the plasma membrane to generate micro domains for budding.
This does not exclude that these clusters include hexamer assemblies or clustering requires hexamer assemblies.
We thank reviewer #3 for this question. We did not focus on the role of NiV-F clusters for budding in the current manuscript, although this is an interesting topic to pursue. In this manuscript, we observed that NiV VLP budding is decreased for some cluster-disrupting mutants, such as F-YA, and F-LI4A. however, F-V108D showed increased budding compared to F-WT (Fig. 4A). We also observed that VLPs and VSV/NiV pseudoviruses expressing L53D have little NiV-G (Fig. 4A, Fig. S4F and S4H), although the incorporation level of L53D is comparable to that of wt F in both VLPs and pseudovirions (Fig. 4A and Fig. S4F). L53D is a hypofusogenic mutant with decreased clustering ability. Therefore, our current data do not show a clear link between F clustering and NiV VLP budding or glycoprotein incorporation.
We reported that both NiV-F and -M form clusters at the plasma membrane although NiV-F clusters are not enriched at the NiV-M positive membrane domains 1. This result indicates that NiV-M is the major driving force for assembly and budding, while NiV-F is passively incorporated into the assembly sites. The central role of NiV-M in budding is also supported by a recent study showing that NiV-M induces membrane curvature by binding to PI(4,5)P2 in the inner leaflet of the plasma membrane 28. However, the expression of NiV-F alone induces the production of vesicles bearing NiV-F 29 and NiV-F recruits vesicular trafficking and actin cytoskeleton factors to VLPs either alone or in combination with NiV-G and -M, indicating a potential autonomous role in budding 30. Additionally, several electron microscopy studies show that the paramyxovirus F forms 2D lattice interspersed above the M lattice, suggesting the participation of F in virus assembly and budding. Nonetheless, the evidence above suggests that NiV-F may play a role in budding, but our data cannot correlate NiV-F clustering to budding.
Assuming that the clusters are important for entry, hexameric clusters are not unique to Nipah virus F. Similar hexameric clusters have been described for the HEF on influenza virus C particles (Halldorsson et al 2021) and env organization on Foamy virus particles (Effantin et al 2016), both with specific interactions between trimers. What is the organization of F on Nipah virus particles? If F requires to be hexameric for entry, this should be easily imaged by EM on infectious or inactivated virus particles.
We thank reviewer #3 for this suggestion. The hexamer-of-trimer NiV-F is observed on the VLP surface by electron tomography 4. The NiV-F hexamer-of-trimers are arranged into a soccer ball-like structure, with one trimer being part of multiple hexamer-of-trimers. The implication of NiV-F clusters in virus entry and the potential mechanism for NiV-F higherorder structure formation are discussed in the revised manuscripts.
AP stabilization of the F clusters is curious if the clusters are solely required for entry? Virus entry does not recruit the clathrin machinery. Is it possible that F clusters are endocytosed in the absence of budding?
We thank reviewer #3 for this question. The evidence from the current study does not exclude the role of NiV-F clustering in virus budding. NiV-F is known to be endocytosed in the virus-producing cells for cleavage by Cathepsin B or L at endocytic compartments at a pH-dependent manner31–33 in the absence of budding. However, given that all cleaved and uncleaved NiV-F have an endocytosis signal sequence at the cytoplasmic tail and are able to interact with AP-2 for endosome assembly and the cleaved and uncleaved F may have similar clustering patterns (Fig. 2), we do not think NiV-F clustering is specifically regulated for the cleavage of NiV-F. A plausible hypothesis is that NiV-F clusters are stabilized by multiple intrinsic factors (e.g. trimer interface) and host factors (e.g. AP-2) on cell membrane for cell-cell fusion and virus budding. We linked the clustering to the fusion ability of NiV-F in this study, but the NiV-F clustering may also be important in facilitating virus budding. Once in the viruses, the higher-order assembly of the clusters (e.g. lattice) may form due to protein enrichment, and the cell factors may not be the major maintenance force.
Clusters are required for budding.
Other points:
Fig. 3: Some of the V108D and L53D clusters look similar in size than wt clusters. It seems that the interaction is important but not absolutely essential. Would a double mutant abrogate clustering completely?
We thank Reviewer #3 for the suggestion. We generated a double mutant of NIV-F with L53D and V108D (NiV-F-LV) and assessed its expression and processing. Although the mutant retained processing capability, it exhibited minimal surface expression, making it unfeasible to analyze its nano-organization on the cell or viral membrane.
Author response image 4.
The expression and fusion activity of Flag-tagged NiV-F and NiV-F L53D-V108D (LV). (A) Representative western blot analysis of NiV-F-WT, LV in the cell lysate of 293T cells. 293T cells were transfected by NiV-F-WT or the LV mutant. The empty vector was used as a negative control. The cell lysates were analyzed on SDS-PAGE followed by western blotting after 28hrs post-transfection. F0 and F2 were probed by the M2 monoclonal mouse antiFLAG antibody. GAPDH was probed by monoclonal mouse anti-GAPDH. (B) Representative images of 293T cell-cell fusion induced by NiV-G and NiV-F-WT or NiV-F-LV. 293T cells were co-transfected with plasmids coding for NiV-G and empty vector (NC) or NiV-F constructs. Cells were fixed at 18 hrs post-transfection. Arrows point to syncytia. Scale bar: 10um. (C) Relative cell-cell fusion levels in 293T cells in (B). Five fields per experiment were counted from three independent experiments. Data are presented as mean ± SEM. (D) The cell surface expression levels of NiV-F-WT, NiV-F-LV in 293T cells measured by flow cytometry. Mean fluorescence Intensity (MFI) values were calculated by FlowJo and normalized to that of F-WT. Data are presented as mean ± SEM of three independent experiments. Statistical significance was determined by the unpaired t-test with Welch’s correction (*P<0.05, **P<0.01, ***P<0.001, ****P<0.0001). Values were compared to that of the NiV-F-WT.
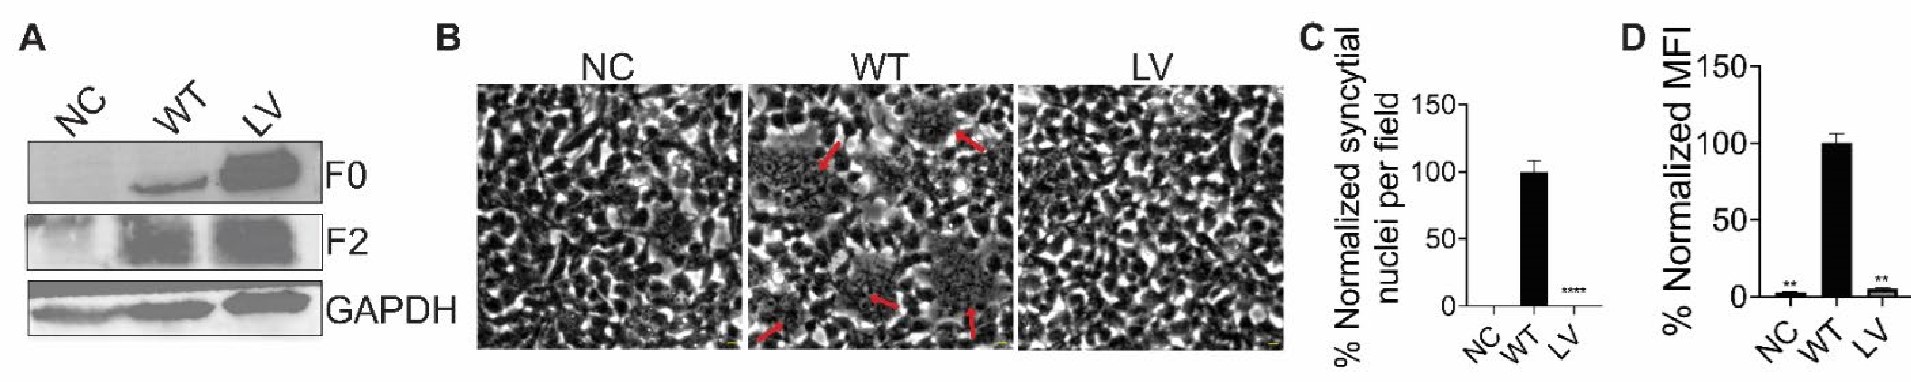
Fig. 4: The distribution of F on VLPs should be confirmed by cryoEM analyses. This would also confirm the symmetry of the clusters. The manuscript by Chernomordik et al. JBC 2004 showed that influenza HA outside the direct contact zone affects fusion, which could be further elaborated in the context of F clusters and the fusion mechanism.
We thank reviewer 3 for this suggestion. The distribution of F on VLPs was resolved by electron tomogram which showed that the NiV-F hexamer-of-trimers are arranged into a soccer ball-like structure 4. The role of influenza HA outside of the contact zone in fusion activation is an interesting phenomenon. It may address the energy transmission within and among clusters. We will pursue this topic in a future project.
Recommendations for the authors:
Reviewer #1 (Recommendations For The Authors):
• Please define all used abbreviations throughout the manuscript and in the SI.
We defined the abbreviations at their first usage.
• The sentence starting with "Additionally, ..." on line 155 appears to be incomplete.
We corrected this sentence.
• The statement starting with "As reported, ..." on line 181 should be supported by a reference.
We added a reference.
• In Fig. 4C, it is unclear what the x and y axes represent.
Fig. 4C is a t-SNE plot for visualizing high-dimensional data in a low-dimensional space. It maintains the local data structure but does not represent exact quantitative relationships. In other words, points that are close together in Fig. 4C are also close in the high-dimensional space, meaning the OPTICS plots, which reflect the clustering patterns, are similar for two points that are positioned near each other in Fig. 4C. Therefore, the x and y axes do not represent the original, quantitative data, and thus the axis titles are meaningless.
• The reference on line 306 appears to be unformatted.
We reformatted the reference.
Reviewer #2 (Recommendations For The Authors):
The authors need to include the overall statistics for each experiment (at least 30 to 50 cells with three independent experiments are needed).
We highlighted the sample size (number of ROI and number of cells) used for analysis in the figure legend. The determination of the sample size is justified in Table 1 in the response letter.
The authors need to generate a functional pseudovirus system (for example HIVpp/NiV F) to run both infectivity and fusion experiments (including Apr-BlaM assay).
We tested viral entry using a VSV/NiV pseudovirus system and the viral entry kinetics using VLPs expressing NiV-M-β-lactamase. The results are presented in Fig. S1, S4, S6, and S7.
Reviewer #3 (Recommendations For The Authors):
Even low resolution EM data on VLPs or viruses would strengthen the conclusions.
We thank this reviewer for the suggestion. We cited the NiV VLP images acquired by electron tomography 4, but we currently have limited resources to perform cryoEM on NiV VLPs.
References.
(1) Liu, Q., Chen, L., Aguilar, H. C. & Chou, K. C. A stochastic assembly model for Nipah virus revealed by super-resolution microscopy. Nature Communications 9, 3050 (2018).
(2) Khetawat, D. & Broder, C. C. A Functional Henipavirus Envelope Glycoprotein Pseudotyped Lentivirus Assay System. Virology Journal 7, 312 (2010).
(3) Palomares, K. et al. Nipah Virus Envelope-Pseudotyped Lentiviruses Efficiently Target ephrinB2Positive Stem Cell Populations In Vitro and Bypass the Liver Sink When Administered In Vivo. J Virol 87, 2094–2108 (2013).
(4) Xu, K. et al. Crystal Structure of the Pre-fusion Nipah Virus Fusion Glycoprotein Reveals a Novel Hexamer-of-Trimers Assembly. PLoS Pathog 11, e1005322 (2015).
(5) Bakker, E. & Swain, P. S. Estimating numbers of intracellular molecules through analysing fluctuations in photobleaching. Sci Rep 9, 15238 (2019).
(6) Nayak, C. R. & Rutenberg, A. D. Quantification of Fluorophore Copy Number from Intrinsic
Fluctuations during Fluorescence Photobleaching. Biophys J 101, 2284–2293 (2011).
(7) Salavessa, L. & Sauvonnet, N. Stoichiometry of ReceptorsReceptors at the Plasma MembranePlasma membrane During Their EndocytosisEndocytosis Using Total Internal Reflection Fluorescent (TIRF) MicroscopyMicroscopy Live Imaging and Single-Molecule Tracking. in Exocytosis and Endocytosis: Methods and Protocols (eds. Niedergang, F., Vitale, N. & Gasman, S.) 3–17 (Springer US, New York, NY, 2021). doi:10.1007/978-1-0716-1044-2_1.
(8) Slenders, E. et al. Confocal-based fluorescence fluctuation spectroscopy with a SPAD array detector. Light Sci Appl 10, 31 (2021).
(9) Annibale, P., Vanni, S., Scarselli, M., Rothlisberger, U. & Radenovic, A. Identification of clustering artifacts in photoactivated localization microscopy. Nat Methods 8, 527–528 (2011).
(10) Baumgart, F. et al. Varying label density allows artifact-free analysis of membrane-protein nanoclusters. Nat Methods 13, 661–664 (2016).
(11) Zanacchi, F. C. et al. A DNA origami platform for quantifying protein copy number in super-resolution. Nat Methods 14, 789–792 (2017).
(12) Jungmann, R. et al. Multiplexed 3D cellular super-resolution imaging with DNA-PAINT and Exchange-PAINT. Nature Methods 11, 313–318 (2014).
(13) Rubin-Delanchy, P. et al. Bayesian cluster identification in single-molecule localization microscopy data. Nat Methods 12, 1072–1076 (2015).
(14) Griffié, J. et al. 3D Bayesian cluster analysis of super-resolution data reveals LAT recruitment to the T cell synapse. Sci Rep 7, 4077 (2017).
(15) Dynamic Bayesian Cluster Analysis of Live-Cell Single Molecule Localization Microscopy Datasets - Griffié - 2018 - Small Methods - Wiley Online Library. https://onlinelibrary.wiley.com/doi/full/10.1002/smtd.201800008.
(16) Caetano, F. A. et al. MIiSR: Molecular Interactions in Super-Resolution Imaging Enables the Analysis of Protein Interactions, Dynamics and Formation of Multi-protein Structures. PLOS Computational Biology 11, e1004634 (2015).
(17) Malkusch, S. & Heilemann, M. Extracting quantitative information from single-molecule superresolution imaging data with LAMA – LocAlization Microscopy Analyzer. Sci Rep 6, 34486 (2016).
(18) Zhang, Y., Lara-Tejero, M., Bewersdorf, J. & Galán, J. E. Visualization and characterization of individual type III protein secretion machines in live bacteria. Proceedings of the National Academy of Sciences 114, 6098–6103 (2017).
(19) Tobin, S. J. et al. Single molecule localization microscopy coupled with touch preparation for the quantification of trastuzumab-bound HER2. Sci Rep 8, 15154 (2018).
(20) Levet, F. et al. SR-Tesseler: a method to segment and quantify localization-based super-resolution microscopy data. Nature Methods 12, 1065–1071 (2015).
(21) Peters, R., Griffié, J., Burn, G. L., Williamson, D. J. & Owen, D. M. Quantitative fibre analysis of singlemolecule localization microscopy data. Sci Rep 8, 10418 (2018).
(22) Levet, F. et al. A tessellation-based colocalization analysis approach for single-molecule localization microscopy. Nat Commun 10, (2019).
(23) Banerjee, C. et al. ULK1 forms distinct oligomeric states and nanoscopic structures during autophagy initiation. Science Advances 9, eadh4094 (2023).
(24) Pageon, S. V. et al. Functional role of T-cell receptor nanoclusters in signal initiation and antigen discrimination. Proceedings of the National Academy of Sciences 113, E5454–E5463 (2016).
(25) Cresens, C. et al. Flat clathrin lattices are linked to metastatic potential in colorectal cancer. iScience 26, 107327 (2023).
(26) Seeling, M. et al. Immunoglobulin G-dependent inhibition of inflammatory bone remodeling requires pattern recognition receptor Dectin-1. Immunity 56, 1046-1063.e7 (2023).
(27) Liu, Q. T. et al. The nanoscale organization of Nipah virus matrix protein revealed by super-resolution microscopy. Biophysical Journal 121, 2290–2296 (2022).
(28) Norris, M. J. et al. Measles and Nipah virus assembly: Specific lipid binding drives matrix polymerization. Science Advances 8, eabn1440 (2022).
(29) Patch, J. R. et al. The YPLGVG sequence of the Nipah virus matrix protein is required for budding. Virol. J. 5, 137 (2008).
(30) Johnston, G. P. et al. Nipah Virus-Like Particle Egress Is Modulated by Cytoskeletal and Vesicular Trafficking Pathways: a Validated Particle Proteomics Analysis. mSystems 4, e00194-19 (2019).
(31) Diederich, S. et al. Activation of the Nipah Virus Fusion Protein in MDCK Cells Is Mediated by Cathepsin B within the Endosome-Recycling Compartment. J Virol 86, 3736–3745 (2012).
(32) Diederich, S., Thiel, L. & Maisner, A. Role of endocytosis and cathepsin-mediated activation in Nipah virus entry. Virology 375, 391–400 (2008).
(33) Pager, C. T., Craft, W. W., Patch, J. & Dutch, R. E. A mature and fusogenic form of the Nipah virus fusion protein requires proteolytic processing by cathepsin L. Virology 346, 251–257 (2006).
Author Response
The following is the authors’ response to the original reviews.
Reviewer #1
The study provides a complete comparative interactome analysis of α-arrestin in both humans and drosophila. The authors have presented interactomes of six humans and twelve Drosophila α-arrestins using affinity purification/mass spectrometry (AP/MS). The constructed interactomes helped to find α-arrestins binding partners through common protein motifs. The authors have used bioinformatic tools and experimental data in human cells to identify the roles of TXNIP and ARRDC5: TXNIP-HADC2 interaction and ARRDC5-V-type ATPase interaction. The study reveals the PPI network for α-arrestins and examines the functions of α-arrestins in both humans and Drosophila.
Comments
I will like to congratulate the authors and the corresponding authors of this manuscript for bringing together such an elaborate study on α-arrestin and conducting a comparative study in drosophila and humans.
Introduction:
The introduction provides a rationale behind why the comparison between humans and Drosophila is carried out.
• Even though this is a research manuscript, including existing literature on similar comparison of α-arrestin from other articles will invite a wide readership.
Results:
The results cover all the necessary points concluded from the experiments and computational analysis.
1) The authors could point out the similarity of the α-arrestin in both humans and Drosophila. While comparing α-arrestin in both humans and Drosophila If percentage homology between α-arrestin of both Drosophila and humans needs to be calculated.
Thank you for your insightful feedback. As suggested by reviewer, we determined percentage homology of α-arrestin protein sequences from human and Drosophila using Clustal Omega. This homology is now illustrated as a heatmap in revised Figure S5. Please note that only the values with percentage homology of 40% or higher are selectively labeled.
• Citing the direct connecting genes from the network in the text will invite citations and a wider readership.
Figures:
The images are elaborate and well-made.
2) The authors could use a direct connected gene-gene network that pointing interactions. This can be used by other readers working on the same topic and ensure reproducibility and citations.
We appreciate your valuable comment. Based on the reviewer’s suggestion, we have developed a new website in which one can navigate the gene-gene networks of α-arrestins. These direct connected gene-gene networks are housed in the network data exchange (NDEx) project. Additionally, we have included gene ontology and protein class details for α-arrestins’ interactors in these set of networks, offering a more comprehensive view of α-arrestins’ interactomes.
On page 24 lines 15-18, we have revised the manuscript to introduce the newly developed website, as follows.
“Lastly, to assist the research community, we have made comprehensive α-arrestin interactome maps on our website (big.hanyang.ac.kr/alphaArrestin_PPIN). Researchers can search and download their interactomes of interest as well as access information on potential cellular functions and protein class associated with these interactomes.”
3-1) The co-expression interactions represented as figures should reveal interaction among the α-arrestin and other genes. Which are the sub-network genes does the α- arrestin interact to/ with from the sub-network? The arrows are only pointing at the sub-networks. The figures do not reveal their interaction. Kindly reveal the interaction in the figure with the proper nodes in the figure.
3-2) Figure 2: the network attached in both human and drosophila is well represented. The green lines from α-arrestin indicate the strength of the interaction. Several smaller expression networks are seen. But "α-arrestin" in both organisms seems highly disconnected from all the genes. Connected genes have edges, not arrows. If α-arrestin can be shown connected to these gene-gene networks will help in identifying which genes connect with which gene through α-arrestin. This can be used by other readers working on the same topic and ensure reproducibility and citations.
Thank you for your valuable comment. In response to the reviewer’s recommendation, we’ve added supplementary figure, Figure S4, which illustrates direct interaction between α-arrestin and protein components of clustered complexes (or sub-networks) in addition to the associations shown between α-arrestins and the clustered complexes in Figure 2. We believe that this newly incorporated information regarding direct protein interactions will invite citations and wider readership as the reviewer pointed out.
On page 12 line 27 to page 13 line 5, we have revised the manuscript to cite the direction interactions between ARRDC3 and proteins involved in ubiquitination-dependent proteolysis, as follows.
“While the association of ARRDC3 with these ubiquitination-dependent proteolysis complexes is statistically insignificant, ARRDC3 does interact with individual components of these complexes such as NEDD4, NEDD4L, WWP1, and ITCH (Figure S4A). This suggest their functional relevance in this context, as previously reported in both literatures and databases (Nabhan et al., 2010; Shea et al., 2012; Szklarczyk et al., 2015; Warde-Farley et al., 2010) (Puca & Brou, 2014; Xiao et al., 2018).”
Direct interaction between α-arrestins and protein components of clustered complexes are illustrated in the newly added figure, Figure S4.
4-1) Figure 4. The Protein blot image was blurred. Kindly provide a higher-resolution image.
4-2) Figure 5. B. - The authors can provide images with higher resolution blot images. The bands were not visible.
We appreciate for valuable comment. Unfortunately, the protein blot image was scanned from the original film and the images we provided in the figure represent the highest resolution that we have obtained to date. Raw, uncropped images are shown in Author response image 1 and 2.
Author response image 1.
Raw image of Figure 4B
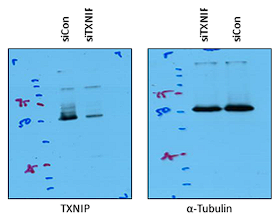
Author response image 2.
Raw image of Figure 5B
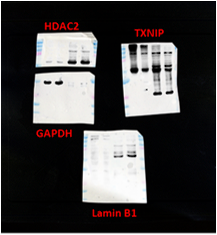
5) Figure: 5. A. - I see non-specific amplifications in the gel images. Are these blotting images? or the gel images that were changed to "Grayscale"? Non-specific amplification may imply that the experiment was not repeated and standardized. Was it gel images or blot images?
We appreciate your insightful comment. The images in Figure 5A represent western blot bands from co-immunoprecipitation assay for analysis of the interaction between TXNIP and HDAC2 proteins. Since immunoblotting using immunoprecipitates can usually detect some non-specific bands from heavy (~ 50 kDa) and light (~25 kDa) chains of the target antibody or from multiple co-immunoprecipitated proteins, we assume that the vague non-specific bands in Figure 5A might be a heavy chain of TXNIP or HDAC2 antibody or an unclear non-specific band. Because target bands showed strong intensity and very clear pattern compared to the non-specific bands in the co-immunoprecipitation assay, we believe that this data is sufficient to support the interaction of TXNIP with HDAC2. Finally, In the revised Figure 5A, we’ve modified the labeling for different experimental conditions, namely siCon and siTXNIP treatments, and added expected size of proteins (kDa), as shown below.
6) Figure 5. A. RT-PCR analysis: What was your expected size of the amplifications? the ladder indicated is in KDa. Is that right?
We appreciate your insightful questions. As mentioned above, Figure 5A shows the blotting images of co-immunoprecipitation analysis, and the ladder indicates the molecular weight (kDa) of protein markers. For clearer interpretation, the expected size of target proteins has been added in Figure 5A in the revised manuscript.
7) How were the band intensities determined?
Thank you for your question. For quantification of immunoblot results, the densities of target protein bands were analyzed with Image J, as we described in the Materials and Methods.
Discussion:
The authors have utilized and discussed the conclusion they draw from their study. But could highlight more on ARRDCs and why it was selected out of the other arrestins. The authors have provided future work directions associated with their work.
8) Why were only ARRDCs presented amongst all the arrestin in the main part of the manuscript?
We’re grateful for your valuable feedback. The reason we focused on α-arrestins was that α-arrestins have been discovered relatively recently, especially when compared to more established visual/ β-arrestin proteins in the same arrestin family but the biological functions of many α-arrestins remain largely unexplored, with notable exceptions in the budding yeast model and a few α-arrestins in mammals and invertebrate species. Most importantly, comparative study highlighting the shared or unique features of α-arrestins is yet to be undertaken. To gain a more comprehensive understanding of these unexplored α-arrestins across multiple species, we’ve centered our research on the ARRDCs within the arrestin protein family.
On page 21 lines 8-17, we’ve edited the manuscript to emphasize the importance of a comparative study on α-arrestins, as detailed below.
“According to a phylogenetic analysis of arrestin family proteins, α-arrestins were shown to be ubiquitously conserved from yeast to human (Alvarez, 2008). However, compared to the more established visual/ β-arrestin proteins, α-arrestins have been discovered more recently and much of their molecular mechanisms and functions remain mostly unexplored except for budding yeast model (Zbieralski & Wawrzycka, 2022). Based on the high-confidence interactomes of α-arrestins from human and Drosophila, we identified conserved and specific functions of these α-arrestins. Furthermore, we uncovered molecular functions of newly discovered function of human specific α-arrestins, TXNIP and ARRDC5. We anticipate that the discovery made here will enhance current understanding of α-arrestins.”
9) The discussion could be elaborated more by utilizing the data.
We appreciate your insightful feedback. Based on the reviewer’s suggestion, we’ve enhanced the discussion in the manuscript to provide a clearer interpretation of our results. First, we’ve added description of conserved protein complexes significantly associated with α-arrestins, stated on page 22 lines 5-12 and lines 23-26.
Page 22 lines 5-12: “The integrative map of protein complexes also highlighted both conserved and unique relationships between α-arrestins and diverse functional protein complexes. For instance, protein complexes involved in ubiquitination-dependent proteolysis, proteasome, RNA splicing, and intracellular transport (motor proteins) were prevalently linked with α-arrestins in both human and Drosophila. To more precisely identify conserved PPIs associated with α-arrestins, we undertook ortholog predictions within the α-arrestins’ interactomes. This revealed 58 orthologous interaction groups that were observed to be conserved between human and Drosophila (Figure 3).”
Page 22 lines 23-26: “Additionally, interaction between α-arrestins and entities like motor proteins, small GTPase, ATP binding proteins, and endosomal trafficking components were identified to be conserved. Further validation of these interactions could unveil molecular mechanisms consistently associated with these cellular functions.”
Secondly, we’ve added description of role of ARRDC5 in osteoclast maturation, as stated on page 23 lines 22-24.
“Conversely, depletion of ARRDC5 reduces osteoclast maturation, underscoring the pivotal role of ARRDC5 in osteoclast development and function (Figure S9A and B).”
Lastly, we examined the association between α-arrestins’ interactomes and human diseases, incorporating our findings into the discussion. The newly introduced figure based on the result is Figure S10.
On page 24 lines 10-14, we’ve added discussion on Figure S10 as follows.
“We further explored association between α-arrestins’ interactomes and disease pathways (Figure S10). Notably, the interactomes of α-arrestins in human showed clear links to specific diseases. For instance, ARRDC5 is closely associated with disease resulting from viral infection and cardiovascular conditions. ARRDC2, ARRDC4, and TXNIP share common association with certain neurodegenerative diseases, while ARRDC1 is implicated in cancer.”
Supplementary figures:
The authors have a rigorous amount of work added together for the success of this manuscript.
10) The reference section needs editing before publication. Maybe the arrangement was disturbed during compiling.
Thank you for your valuable comment. Based on the reviewer’s suggestion, we have rearranged the reference section to enhance its clarity. Below are excerpts from the update reference section in the manuscript.
“Adenuga, D., & Rahman, I. (2010). Protein kinase CK2-mediated phosphorylation of HDAC2 regulates co-repressor formation, deacetylase activity and acetylation of HDAC2 by cigarette smoke and aldehydes. Arch Biochem Biophys, 498(1), 62-73. doi:10.1016/j.abb.2010.04.002
Adenuga, D., Yao, H., March, T. H., Seagrave, J., & Rahman, I. (2009). Histone Deacetylase 2 Is Phosphorylated, Ubiquitinated, and Degraded by Cigarette Smoke. American Journal of Respiratory Cell and Molecular Biology, 40(4), 464-473. doi:10.1165/rcmb.2008-0255OC
Akalin, A., Franke, V., Vlahovicek, K., Mason, C. E., & Schubeler, D. (2015). Genomation: a toolkit to summarize, annotate and visualize genomic intervals. Bioinformatics, 31(7), 1127-1129. doi:10.1093/bioinformatics/btu775
Alvarez, C. E. (2008). On the origins of arrestin and rhodopsin. BMC Evol Biol, 8, 222. doi:10.1186/1471-2148-8-222”
11) many important references were missing.
We appreciate and agree with the reviewer’s comment. In response to the reviewer’s recommendation, we’ve thoroughly reviewed the manuscript and below are sections of the manuscript where around 20 new references have been added.
On page 8 lines 12-14:
“Utilizing the known affinities between short linear motifs in α-arrestins and protein domains in interactomes(El-Gebali et al., 2019; UniProt Consortium, 2018) “
On page 8 lines 19-22:
“One of the most well-known short-linear motifs in α-arrestin is PPxY, which is reported to bind with high affinity to the WW domain found in various proteins, including ubiquitin ligases (Ingham, Gish, & Pawson, 2004; Macias et al., 1996; Sudol, Chen, Bougeret, Einbond, & Bork, 1995)”
On page 9 lines 3-6:
“Next, we conducted enrichment analyses of Pfam proteins domains (El-Gebali et al., 2019; Huang da, Sherman, & Lempicki, 2009b) among interactome of each α-arrestin to investigate known and novel protein domains commonly or specifically associated (Figure S3A; Table S5).”
On page 9 lines 7-10:
“HECT and C2 domains are well known to be embedded in the E3 ubiquitin ligases such as NEDD4, HECW2, and ITCH along with WW domains (Ingham et al., 2004; Melino et al., 2008; Rotin & Kumar, 2009; Scheffner, Nuber, & Huibregtse, 1995; Weber, Polo, & Maspero, 2019)”
On page 10 lines 12-16:
“In fact, the known binding partners, NEDD4, WWP2, WWP1, and ITCH in human and CG42797, Su(dx), Nedd4, Yki, Smurf, and HERC2 in Drosophila, that were detected in our data are related to ubiquitin ligases and protein degradation (C. Chen & Matesic, 2007; Ingham et al., 2004; Y. Kwon et al., 2013; Marin, 2010; Melino et al., 2008; Rotin & Kumar, 2009) (Figure 1E; Figure S2F).”
On page 13 lines 20-21:
“Given that α-arrestins are widely conserved in metazoans (Alvarez, 2008; DeWire, Ahn, Lefkowitz, & Shenoy, 2007), “
On page 14 lines 12-17:
“The most prominent functional modules shared across both species were the ubiquitin-dependent proteolysis, endosomal trafficking, and small GTPase binding modules, which are in agreement with the well-described functions of α-arrestins in membrane receptor degradation through ubiquitination and vesicle trafficking (Dores et al., 2015; S. O. Han et al., 2013; Y. Kwon et al., 2013; Nabhan et al., 2012; Puca & Brou, 2014; Puca et al., 2013; Shea et al., 2012; Xiao et al., 2018; Zbieralski & Wawrzycka, 2022) (Figure 3).”
Reviewer #2
In this manuscript, the authors present a novel interactome focused on human and fly alpha-arrestin family proteins and demonstrate its application in understanding the functions of these proteins. Initially, the authors employed AP/MS analysis, a popular method for mapping protein-protein interactions (PPIs) by isolating protein complexes. Through rigorous statistical and manual quality control procedures, they established two robust interactomes, consisting of 6 baits and 307 prey proteins for humans, and 12 baits and 467 prey proteins for flies. To gain insights into the gene function, the authors investigated the interactors of alpha-arrestin proteins through various functional analyses, such as gene set enrichment. Furthermore, by comparing the interactors between humans and flies, the authors described both conserved and species-specific functions of the alpha-arrestin proteins. To validate their findings, the authors performed several experimental validations for TXNIP and ARRDC5 using ATAC-seq, siRNA knockdown, and tissue staining assays. The experimental results strongly support the predicted functions of the alpha-arrestin proteins and underscore their importance. `
I would like to suggest the following analyses to further enhance the study:
1) It would be valuable if the authors could present a side-by-side comparison of the interactomes of alpha-arrestin proteins, both before and after this study. This visual summary network would demonstrate the extent to which this work expanded the existing interactome, emphasizing the overall contribution of this study to the investigation of the alpha-arrestin protein family.
We greatly appreciate your insightful feedback. In response to the reviewer’s suggestion, we’ve depicted a network of known PPIs associated with α-arrestins (Figure S2C and D). Furthermore, by comparing our high-confidence PPIs to these known sets, we found that the overlaps are statistically significant and the high-confidence PPIs of α-arrestins broaden the existing interactome (Figure S2E).
From page 7 line 26 to page 8 line 8, we’ve detailed this side-by-side comparisons of existing interactome and newly discovered high-confidence PPIs of α-arrestins, as outline below.
“As a result, we successfully identified many known interaction partners of α-arrestins such as NEDD4, WWP2, WWP1, ITCH and TSG101, previously documented in both literatures and PPI databases (Figure S2C-F) (Colland et al., 2004; Dotimas et al., 2016; Draheim et al., 2010; Mellacheruvu et al., 2013; Nabhan et al., 2012; Nishinaka et al., 2004; Puca & Brou, 2014; Szklarczyk et al., 2015; Warde-Farley et al., 2010; Wu et al., 2013). Additionally, we greatly expanded repertoire of PPIs associated with α-arrestins in human and Drosophila, resulting in 390 PPIs between six α-arrestins and 307 prey proteins in human, and 740 PPIs between twelve α-arrestins and 467 prey proteins in Drosophila (Figure S2E). These are subsequently referred to as ‘high-confidence PPIs’ (Table S3).”
2) While the authors conducted several analyses exploring protein function, there is a need to further explore the implications of the interactome in human diseases. For instance, it would be beneficial to investigate the association of the newly identified interactome members with specific human diseases. Including such investigations would strengthen the link between the interactome and human disease contexts.
Thank you for your valuable comment. As suggested by the reviewer, we examined the association between α-arrestins’ interactomes and human diseases, incorporating our findings into the discussion. The newly introduced figure based on the result is Figure S10.
On page 24 lines 10-14, we’ve added discussion on Figure S10 as follows.
“We further explored association between α-arrestins’ interactomes and disease pathways (Figure S10). Notably, the interactomes of α-arrestins in human showed clear links to specific diseases. For instance, ARRDC5 is closely associated with disease resulting from viral infection and cardiovascular conditions. ARRDC2, ARRDC4, and TXNIP share common association with certain neurodegenerative diseases, while ARRDC1 is implicated in cancer.”
Reviewer #3:
Lee, Kyungtae and colleagues have discovered and mapped out alpha-arrestin interactomes in both human and Drosophila through the affinity purification/mass spectrometry and the SAINTexpress method. They found the high confident interactomes, consisting of 390 protein-protein interactions (PPIs) between six human alpha-arrestins and 307 preproteins, as well as 740 PPIs between twelve Drosophila alpha-arrestins and 467 prey proteins. To define and characterize these identified alpha-arrestin interactomes, the team employed a variety of widely recognized bioinformatics tools. These included protein domain enrichment analysis, PANTHER for protein class enrichment, DAVID for subcellular localization analysis, COMPLEAT for the identification of functional complexes, and DIOPT to identify evolutionary conserved interactomes. Through these analyses, they confirmed known alpha-arrestin interactors' role and associated functions such as ubiquitin ligase and protease. Furthermore, they found unexpected biological functions in the newly discovered interactomes, including RNA splicing and helicase, GTPase-activating proteins, ATP synthase. The authors carried out further study into the role of human TXNIP in transcription and epigenetic regulation, as well as the role of ARRDC5 in osteoclast differentiation. This study holds important value as the newly identified alpha-arrestin interactomes are likely aiding functional studies of this group of proteins. Despite the overall support from data for the paper's conclusions, certain elements related to data quantification, interpretation, and presentation demand more detailed explanation and clarification.
1) In Figure 1B, it is shown that human alpha-arrestins were N-GFP tagged (N-terminal) and Drosophila alpha-arrestins were C-GFP (C-terminal). However, the rationale of why the authors used different tags for human and fly proteins was not explained in the main text and methods.
We appreciate your valuable comment. Both N- and C-terminally tagged α-arrestins have been used previously. Given that our study aims to increase the repertoire of α-arrestin interacting proteins, where GFP is added might not be a concern. We note that GFP is a relatively bulky tag, and tagging a protein with GFP can potentially abolish the interaction with some of the binding proteins. Follow-up studies utilizing different approaches for detecting protein-protein interactions, such as BioID and yeast two-hybrid, will allow us to build more comprehensive α-arrestin interactomes.
2) In Figure 2A, there seems to be an error for labeling the GAL4p/GAL80p complex that includes NOTCH2, NOTCH1 and TSC2.
Thank you for comment. We double-checked COMPLEAT (protein COMPLex Enrichment Analysis Tool) database for the name of protein complex consisting of NOTCH1, NOTCH2, AND TSC2. The database indeed labeled this complex as the “GAL4p/GAL80p complex”. However, given the potential for mis-annotation (since we could not ascertain the relevance of these proteins to the “GAL4p/GAL80p complex”), we chose to exclude this protein complex from the network. The update protein complex network is illustrated in the revised Figure 2A.
3) In Figure 5, given that knockdown of TXNIP did not affect the levels and nuclear localization of HDAC2, the authors suggest that TXNIP might modulate HDAC2 activity. However, the ChiP assay suggest a different model - TXNIP-HDAC2 interaction might inhibit the chromatin occupancy of HDAC2, reducing histone deacetylation and increasing global chromatin accessibly. The authors need to propose a model consistent with these sets of all data.
We greatly appreciate your detailed feedback. Our data indicates a global decrease in chromatin accessibility (Figure 4C-G) and a diminished interaction between TXNIP and HDAC2 under depletion of TXNIP (Figure 5A). Additionally, we observed an increased occupancy of HDAC2 and subsequent histone deacetylation at TXNIP-target promoter regions (Figure 5C) without any changes in the HDAC2 expression level (Figure 5A) in TXNIP- knockdown cells. From these observations, we infer that the interaction between TXNIP-HDAC2 might suppress the function of HDAC2, a major gene silencer affecting the formation of condensed or accessible chromatin by deacetylating activity. Although we checked whether TXNIP could induce cytosolic retention of HDAC2 to inhibit nuclear function of HDAC2, TNXIP knockdown did not alter its subcellular localization (Figure 5B).
To elucidate the mechanism by which TXNIP inhibits the function of HDAC2, we further investigated the effect of TXNIP on the levels of HDAC2 phosphorylation, which is known to be crucial for its deacetylase activity and the formation of transcriptional repressive complex. However, as shown in the Figure S8C and D, the knockdown of TXNIP did not affect the HDAC2 phosphorylation status, as well as the interaction between HDAC2 and other components in NuRD complex in the immunoblotting and co-IP assays, respectively. The results suggest that TXNIP may inhibit the function of HDAC2 independently of these factors.
Following the reviewer’s suggestion, we carefully provided a proposed model describing the possible role of TXNIP in transcriptional regulation through interaction with HDAC2 and co-repressor complex in Figure S8E.
Description of these newly added figures can be found in the revised manuscript from page 18 line 7 to 27, as outlined below.
“HDAC2 typically operates within the mammalian nucleus as part of co-repressor complexes as it lacks ability to bind to DNA directly (Hassig, Fleischer, Billin, Schreiber, & Ayer, 1997). The nucleosome remodeling and deacetylation (NuRD) complex is one of the well-recognized co-repressor complexes that contains HDAC2 (Kelly & Cowley, 2013; Seto & Yoshida, 2014) and we sought to determine if depletion of TXNIP affects interaction between HDAC2 and other components in this NuRD complex. While HDAC2 interacted with MBD3 and MTA1 under normal condition, the interaction between HDAC2 and MBD3 or MTA1 was not affected upon TXNIP depletion (Figure S8C). Next, given that HDAC2 phosphorylation is known to influence its enzymatic activity and stability (Adenuga & Rahman, 2010; Adenuga, Yao, March, Seagrave, & Rahman, 2009; Bahl & Seto, 2021; Tsai & Seto, 2002), we tested if TXNIP depletion alters phosphorylation status of HDAC2. The result indicated, however, that phosphorylation status of HDAC2 does not change upon TXNIP depletion (Figure S8D). In summary, our findings suggest a model where TXNIP plays a role in transcriptional regulation independent of these factors (Figure S8E). When TXNIP is present, it directly interacts with HDAC2, a key component of transcriptional co-repressor complex. This interaction suppresses the HDAC2 ‘s recruitment to target genomic regions, leading to the histone acetylation of target loci possibly through active complex including histone acetyltransferase (HAT). As a result, transcriptional activation of target gene occurs. In contrast, when TXNIP expression is diminished, the interaction between TXNIP and HDAC2 weakens. This restores histone deacetylating activity of HDAC2 in the co-repressor complex, leading to subsequent repression of target gene transcription.”
4) The authors showed that ectopic expression of ARRDC5 increased osteoclast differentiation and function. Does loss of ARDDC5 lead to defects in osteoclast function and fate determination?
We appreciate your valuable comment. We have confirmed the endogenous expression of ARRDC5 in osteoclasts and conducted a loss-of-function study using shARRDC5. As determined by qPCR, ARRDC5 was endogenously expressed very low in osteoclasts. Even during RANKL-induced osteoclast differentiation, the CT value (29-31) for ARRDC5 expression was high in osteoclasts compared to the CT value (17-24) for the expression of marker genes Cathepsin K, TRAP, and NFATc1. Even though its endogenous expression was very low, we generated ARRDC5 knockdown cells by infecting BMMs with lentivirus expressing shRNA of ARRDC5 and subsequently differentiated the cells into mature osteoclasts. After five days of differentiation, we observed a significant decrease in the total number of TRAP-positive multinucleated cells (No. of TRAP+ MNCs) in shARRDC5 cells compared to that in the control cells. This result indicates that the loss of ARRDC5 leads to defects in osteoclast differentiation. Result of this loss-of-function study using shARRDC5 is depicted in Figure S9A and B.
In the revised manuscript, following sentence explaining Figure S9A and B was added on page 19 lines 15-17 as follows.
“Depletion of ARRDC5 using short hairpin RNA (shRNA) impaired osteoclast differentiation, further affirming its crucial role in this differentiation process (Figure S9A and B).”
5) From Figure 6D, the authors argued that ARRDC5 overexpression resulted in more V-ATPase signals: however, there is no quantification. Quantification of the confocal images will foster the conclusion. Also, western blots for V-ATPase proteins will provide an alternative way to determine the effects of ARRDC5.
We appreciate your insightful feedback. As suggested by the reviewer, we quantified V-type ATPase signals using confocal images, which were shown in Figure 6D. The ImageJ program was employed for integrated density measurements, and the integrated density of GFP-GFP overexpressing osteoclasts was set to 1 for relative comparison. The result in the revised Figure 6D revealed a significant increase in V-type ATPase signals in GFP-ARRDC5 overexpressing osteoclasts compared to that in GFP-GFP overexpressing osteoclasts, as outlined below.
We also agree with the reviewer’s comment that Western blot for V-ATPase proteins will be an alternative way to determine the effects of ARRDC5 in osteoclast differentiation. We have confirmed no different expression of V-type ATPase between GFP-GFP and GFP-ARRDC5 overexpressing osteoclasts using qPCR and western blot analysis. The corresponding western blot result is shown in the revised Figure S9C.
In addition, the corresponding qPCR that measures the expression level of V-type ATPase between GFP-GFP and GFP-ARRDC5 overexpressing osteoclasts is shown in Author response image 3.
Author response image 3.
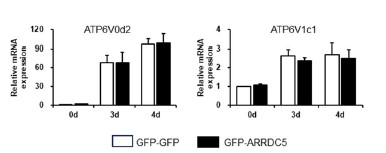
Moreover, based on the references, the V-type ATPase is localized at the plasma membrane during osteoclast differentiation (Toyomura et al., 2003). Although mRNA and protein expression levels were similar in both cells, localization of V-ATPase in plasma membrane was significantly increased in GFP-ARRDC5 overexpressing osteoclasts compared to that in GFP-GFP osteoclasts, as shown in the revised Figure 6D above.
6) The results from Figure 6D did not support the authors' argument that ARRDC5 might control the membrane localization of the V-ATPase, as bafilomycin is the V-ATPase inhibitor. ARRDC5 knockdown experiments will help to determine whether ARRDC5 can control the membrane localization of the V-ATPase in osteoclast.
Thank you for your insightful comment. V-type ATPase has been reported to play an important role in the differentiation and function of osteoclasts (Feng et al., 2009; Qin et al., 2012). Given that various subunits of the V-type ATPase interact with ARRDC5 (Figure 6A), we speculated that ARRDC5 might be involved in the function of this complex and play a role in osteoclast differentiation and function. As answered above, GFP-ARRDC5 overexpressing osteoclasts showed a similar expression level of V-type ATPase to GFP-GFP cells but exhibited increased V-type ATPase signals at the cell membrane compared to those in GFP-GFP cells (Figure 6D). Additionally, co-localization of ARRDC5 and V-type ATPase was observed in the osteoclast membrane (Figure 6D), as predicted by the human ARRDC5-centric PPI network. On the other side, bafilomycin A1, a V-type ATPase inhibitor, not only blocked localization of V-type ATPase to plasma membrane in GFP-ARRDC5 overexpressing osteoclasts, but also reduced ARRDC5 signals (Figure 6D). These results indicate that ARRDC5 plays a role in osteoclast differentiation and function by interacting with V-type ATPase and promoting the localization of V-type ATPase to plasma membrane in osteoclasts.
V-type ATPase present in osteoclast membrane is important to cell fusion, maturation, and function during osteoclast differentiation (Feng et al., 2009; Qin et al., 2012). GFP-ARRDC5 overexpressing osteoclasts showed a significant increase of V-type ATPase signals in the cell membrane compared to GFP-GFP cells (Figure 6D), and also significantly increased cell fusion (No. of TRAP+ MNCs in Figure 6B) and resorption activity (resorption pit formation in Figure 6C). However, ARRDC5 knockdown in osteoclasts (shARRDC5 cells) showed a significant decrease in No. of TRAP+ MNCs compared to that in the control cells, indicating that the loss of ARRDC5 leads to defects in cell fusion during osteoclast differentiation (Figure S9A and B). As described above, the endogenous expression of ARRDC5 was very low in osteoclasts and could be specifically expressed in a certain timepoint during the differentiation. Therefore, to better understand the interaction with V-type ATPase of ARRDC5 in osteoclasts, ARRDC5 overexpression is more suitable than its knockdown.
Part of the manuscript on page 19 line 21 to page 20 line 6 was edited to support our statement, as outlined below.
“The V-type ATPase is localized at the osteoclast plasma membrane (Toyomura et al., 2003) and its localization is important for cell fusion, maturation, and function during osteoclast differentiation (Feng et al., 2009; Qin et al., 2012). Furthermore, its localization is disrupted by bafilomycin A1, which is shown to attenuate the transport of the V-type ATPase to the membrane (Matsumoto & Nakanishi-Matsui, 2019). We analyzed changes in the expression level and localization of V-type ATPase, especially V-type ATPase V1 domain subunit (ATP6V1), in GFP-GFP and GFP-ARRDC5 overexpressing osteoclasts. The level of V-type ATPase expression did not change in osteoclasts regardless of ARRDC5 expression levels (Figure S9C). GFP signals were detected at the cell membrane when GFP-ARRDC5 was overexpressed, indicating that ARRDC5 might also localize to the osteoclast plasma membrane (Figure 6D; Figure S9D). In addition, we detected more V-type ATPase signals at the cell membrane in the GFP-ARRDC5 overexpressing osteoclasts, and ARRDC5 and V-type ATPase were co-localized at the osteoclast membrane (Figure 6D; Figure S9D).”
7) The tables (excel files) do not have proper names for each table S numbers. Please correct the name of excel files for readers.
We appreciate your valuable comments. In response to the reviewer’s suggestion, we’ve renamed excel files to more appropriate titles for easier readability. List of renamed tables (excel files) are shown below.
Table S1. List of α-arrestins from human and Drosophila Table S2. Evaluation sets of α-arrestins PPIs Table S3. Summary tables of SAINTexpress results Table S4. Protein domains and short linear motifs in the α-arrestin interactomes Table S5. Enriched Pfam domains in the α-arrestin interactomes Table S6. Subcellular localizations of α-arrestin interactomes Table S7. Summary of protein complexes and cellular components associated with α-arrestin Table S8. Orthologous relationship of α-arrestin interactomes between human and Drosophila Table S9. Summary of ATAC- and RNA-seq read counts before and after processing Table S10. Differential accessibility of ACRs and gene expression Table S11. Summary of ATAC-seq peaks located in promoters and gene expression level Table S12. List of primer sequences used in this study
8) http://big.hanyang.ac.kr/alphaArrestin_Fly link does not work. Please fix the link.
We appreciate your comment. In response to the reviewer’s comment, we have made comprehensive α-arrestin interactome maps on our new website (big.hanyang.ac.kr/alphaArrestin_PPIN) and confirmed that users can be re-directed to networks housed in NDEx.
Author response image 4.
Screen shot of the first page of the newly developed website.
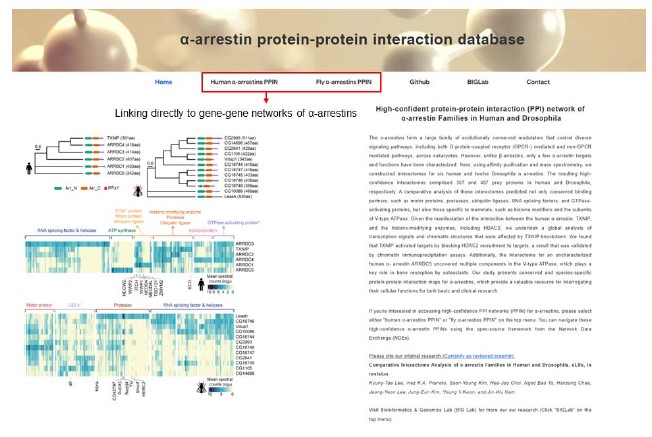
Website address: big.hanyang.ac.kr/alphaArrestin_PPIN
Author response image 5.
Screen shot of the gene-gene network involving α-arrestin in human.
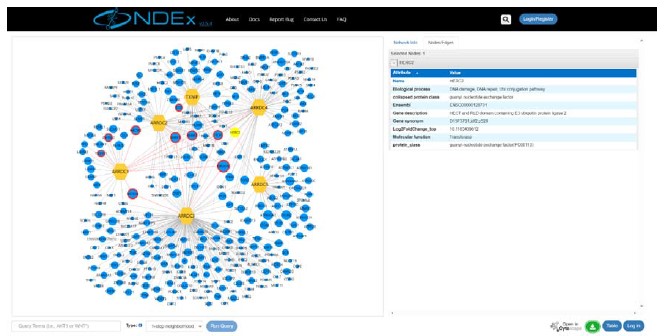
Author response:
The following is the authors’ response to the original reviews.
eLife assessment
This useful study describes an antibody-free method to map G-quadruplexes (G4s) in vertebrate cells. While the method might have potential, the current analysis is primarily descriptive and does not add substantial new insights beyond existing data (e.g., PMID:34792172). While the datasets provided might constitute a good starting point for future functional studies, additional data and analyses would be needed to fully support the major conclusions and, at the same time, clarify the advantage of this method over other methods. Specifically, the strength of the evidence for DHX9 interfering with the ability of mESCs to differentiate by regulating directly the stability of either G4s or R-loops is still incomplete.
We thank the editors for their helpful comments.
Given that antibody-based methods have been reported to leave open the possibility of recognizing partially folded G4s and promoting their folding, we have employed the peroxidase activity of the G4-hemin complex to develop a new method for capturing endogenous G4s that significantly reduces the risk of capturing partially folded G4s. We have included a new Fig. 9 and a new section “Comparisons of HepG4-seq and HBD-seq with previous methods” to carefully compare our methods to other methods.
In the Fig. 7, we applied the Dhx9 CUT&Tag assay to identify the G4s and R-loops directly bound by Dhx9 and further characterized the differential Dhx9-bound G4s and R-loops in the absence of Dhx9. Dhx9 is a versatile helicase capable of directly resolving R-loops and G4s or promoting R-loop formation (PMID: 21561811, 30341290, 29742442, 32541651, 35905379, 34316718). Furthermore, we showed that depletion of Dhx9 significantly altered the levels of G4s or R-loops around the TSS or gene bodies of several key regulators of mESC and embryonic development, such as Nanog, Lin28a, Bmp4, Wnt8a, Gata2, and Lef1, and also their RNA levels (Fig.7 I). The above evidence is sufficient to support the transcriptional regulation of mESCs cell fate by directly modulating the G4s or R-loops within the key regulators of mESCs.
Public Reviews:
Reviewer #1 (Public Review):
Summary:
Non-B DNA structures such as G4s and R-loops have the potential to impact genome stability, gene transcription, and cell differentiation. This study investigates the distribution of G4s and R-loops in human and mouse cells using some interesting technical modifications of existing Tn5-based approaches. This work confirms that the helicase DHX9 could regulate the formation and/or stability of both structures in mouse embryonic stem cells (mESCs). It also provides evidence that the lack of DHX9 in mESCs interferes with their ability to differentiate.
Strengths:
HepG4-seq, the new antibody-free strategy to map G4s based on the ability of Hemin to act as a peroxidase when complexed to G4s, is interesting. This study also provides more evidence that the distribution pattern of G4s and R-loops might vary substantially from one cell type to another.
We appreciate your valuable points.
Weaknesses:
This study is essentially descriptive and does not provide conclusive evidence that lack of DHX9 does interfere with the ability of mESCs to differentiate by regulating directly the stability of either G4 or R-loops. In the end, it does not substantially improve our understanding of DHX9's mode of action.
In this study, we aimed to report new methods for capturing endogenous G4s and R-loops in living cells. Dhx9 has been reported to directly unwind R-loops and G4s or promote R-loop formation (PMID: 21561811, 30341290, 29742442, 32541651, 35905379, 34316718). To understand the direct Dhx9-bound G4s and R-loops, we performed the Dhx9 CUT&Tag assay and analyzed the co-localization of Dhx9-binding sites and G4s or R-loops. We found that 47,857 co-localized G4s and R-loops are directly bound by Dhx9 in the wild-type mESCs and 4,060 of them display significantly differential signals in absence of Dhx9, suggesting that redundant regulators exist as well. We showed that depletion of Dhx9 significantly altered the RNA levels of several key regulators of mESC and embryonic development, such as Nanog, Lin28a, Bmp4, Wnt8a, Gata2, and Lef1, which coincides with the significantly differential levels of G4s or R-loops around the TSS or gene bodies of these genes (Fig.7). The comprehensive molecular mechanism of Dhx9 action is indeed not the focus of this study. We will work on it in the future studies. Thank you for the comments.
There is no in-depth comparison of the newly generated data with existing datasets and no rigorous control was presented to test the specificity of the hemin-G4 interaction (a lot of the hemin-dependent signal seems to occur in the cytoplasm, which is unexpected).
The specificity of hemin-G4-induced peroxidase activity and self-biotinylation has been well demonstrated in previous studies (PMID: 19618960, 22106035, 28973477, 32329781). In the Fig.1A, we compared the hemin-G4-induced biotinylation levels in different conditions. Cells treated with hemin and Bio-An exhibited a robust fluorescence signal, while the absence of either hemin or Bio-An almost completely abolished the biotinylation signals, suggesting a specific and active biotinylation activity. To identify the specific signals, we have included the non-label control and used this control to call confident HepG4 peaks in all HepG4-seq assays.
The hemin-RNA G4 complex has also been reported to have mimic peroxidase activity and trigger similar self-biotinylation signals as DNA G4s (PMID: 32329781, 31257395, 27422869). Therefore, it is not surprising to observe hemin-dependent signals in the cytoplasm generated by cytoplasmic RNA G4s.
In the revised version, we have included a new Fig. 9 and a new section “Comparisons of HepG4-seq and HBD-seq with previous methods” to carefully compare our methods to other methods.
The authors talk about co-occurrence between G4 and R-loops but their data does not actually demonstrate co-occurrence in time. If the same loci could form alternatively either R-loops or G4 and if DHX9 was somehow involved in determining the balance between G4s and R-loops, the authors would probably obtain the same distribution pattern. To manipulate R-loop levels in vivo and test how this affects HEPG4-seq signals would have been helpful.
Single-molecule fluorescence studies have shown the existence of a positive feedback mechanism of G4 and R-loop formation during transcription (PMID: 32810236, 32636376), suggesting that G4s and Rloops could co-localize at the same molecule. Dhx9 is a versatile helicase capable of directly resolving R-loops and G4s or promoting R-loop formation (PMID: 21561811, 30341290, 29742442, 32541651, 35905379, 34316718). Although depletion of Dhx9 resulted in 6,171 Dhx9-bound co-localized G4s and R-loops with significantly altered levels of G4s or R-loops, only 276 of them (~4.5%) harbored altered G4s and R-loops, suggesting that the interacting G4s and R-loops are rare in living cells. Nowadays, the genome-wide co-occurrence of two factors are mainly obtained by bioinformatically intersection analysis. We agreed that F We will carefully discuss this point in the revised version. At the same time, we will make efforts to develop a new method to map the co-localized G4 and R-loop in the same molecule in the future study.
This study relies exclusively on Tn5-based mapping strategies. This is a problem as global changes in DNA accessibility might strongly skew the results. It is unclear at this stage whether the lack of DHX9, BLM, or WRN has an impact on DNA accessibility, which might underlie the differences that were observed. Moreover, Tn5 cleaves DNA at a nearby accessible site, which might be at an unknown distance away from the site of interest. The spatial accuracy of Tn5-based methods is therefore debatable, which is a problem when trying to demonstrate spatial co-occurrence. Alternative mapping methods would have been helpful.
In this study, we used the recombinant streptavidin monomer and anti-GP41 nanobody fusion protein (mSA-scFv) to specifically recognize hemin-G4-induced biotinylated G4 and then recruit the recombinant GP41-tagged Tn5 protein to these G4s sites. Similarly, the recombinant V5-tagged N-terminal hybrid-binding domain (HBD) of RNase H1 specifically recognizes R-loops and recruit the recombinant protein G-Tn5 (pG-Tn5) with the help of anti-V5 antibody. Therefore, the spatial distance of Tn5 to the target sites is well controlled and very short, and also the recruitment of Tn5 is specifically determined by the existence of G4s in HepG4-seq and R-loops in HBD-seq. In addition, RNase treatment markedly abolished the HBD-seq signals and the non-labeled controls exhibit obviously reduction of HepG4-seq signals, demonstrating that HBD-seq and HepG4-seq were not contamination from tagmentation of asccessible DNA.
Reviewer #2 (Public Review):
Summary:
In this study, Liu et al. explore the interplay between G-quadruplexes (G4s) and R-loops. The authors developed novel techniques, HepG4-seq and HBD-seq, to capture and map these nucleic acid structures genome-wide in human HEK293 cells and mouse embryonic stem cells (mESCs). They identified dynamic, cell-type-specific distributions of co-localized G4s and R-loops, which predominantly localize at active promoters and enhancers of transcriptionally active genes. Furthermore, they assessed the role of helicase Dhx9 in regulating these structures and their impact on gene expression and cellular functions.
The manuscript provides a detailed catalogue of the genome-wide distribution of G4s and R-loops. However, the conceptual advance and the physiological relevance of the findings are not obvious. Overall, the impact of the work on the field is limited to the utility of the presented methods and datasets.
Strengths:
(1) The development and optimization of HepG4-seq and HBD-seq offer novel methods to map native G4s and R-loops.
(2) The study provides extensive data on the distribution of G4s and R-loops, highlighting their co-localization in human and mouse cells.
(3) The study consolidates the role of Dhx9 in modulating these structures and explores its impact on mESC self-renewal and differentiation.
We appreciate your valuable points.
Weaknesses:
(1) The specificity of the biotinylation process and potential off-target effects are not addressed. The authors should provide more data to validate the specificity of the G4-hemin.
The specificity of hemin-G4-induced peroxidase activity and self-biotinylation has been well demonstrated in previous studies (PMID: 19618960, 22106035, 28973477, 32329781). In the Fig.1A, we compared the hemin-G4-induced biotinylation levels in different conditions. Cells treated with hemin and Bio-An exhibited a robust fluorescence signal, while the absence of either hemin or Bio-An almost completely abolished the biotinylation signals, suggesting a specific and active biotinylation activity.
(2) Other methods exploring a catalytic dead RNAseH or the HBD to pull down R-loops have been described before. The superior quality of the presented methods in comparison to existing ones is not established. A clear comparison with other methods (BG4 CUT&Tag-seq, DRIP-seq, R-CHIP, etc) should be provided.
Thank you for the suggestions. We have included a new Fig. 9 and a new section “Comparisons of HepG4-seq and HBD-seq with previous methods” to carefully compare our methods to other methods.
(3) Although the study demonstrates Dhx9's role in regulating co-localized G4s and R-loops, additional functional experiments (e.g., rescue experiments) are needed to confirm these findings.
Dhx9 has been demonstrate as a versatile helicase capable of directly resolving R-loops and G4s or promoting R-loop formation in previous studies (PMID: 21561811, 30341290, 29742442, 32541651, 35905379, 34316718). We believe that the current new dataset and previous studies are enough to support the capability of Dhx9 in regulating co-localized G4s and R-loops.
(4) The manuscript would benefit from a more detailed discussion of the broader implications of co-localized G4s and R-loops.
Thank you for the suggestions. We have included the discussion in the revised version.
(5) The manuscript lacks appropriate statistical analyses to support the major conclusions.
We apologized for this point. Whereas we have applied careful statistical analyses in this study, lacking of some statistical details make people hard to understand some conclusions. We have carefully added details of all statistical analysis.
(6) The discussion could be expanded to address potential limitations and alternative explanations for the results.
Thank you for the suggestions. We have included the discussion about this point in the revised version.
Reviewer #3 (Public Review):
Summary:
The authors developed and optimized the methods for detecting G4s and R-loops independent of BG4 and S9.6 antibody, and mapped genomic native G4s and R-loops by HepG4-seq and HBD-seq, revealing that co-localized G4s and R-loops participate in regulating transcription and affecting the self-renewal and differentiation capabilities of mESCs.
Strengths:
By utilizing the peroxidase activity of G4-hemin complex and combining proximity labeling technology, the authors developed HepG4-seq (high throughput sequencing of hemin-induced proximal labelled G4s), which can detect the dynamics of G4s in vivo. Meanwhile, the "GST-His6-2xHBD"-mediated CUT&Tag protocol (Wang et al., 2021) was optimized by replacing fusion protein and tag, the optimized HBD-seq avoids the generation of GST fusion protein aggregates and can reflect the genome-wide distribution of R-loops in vivo.
The authors employed HepG4-seq and HBD-seq to establish comprehensive maps of native co-localized G4s and R-loops in human HEK293 cells and mouse embryonic stem cells (mESCs). The data indicate that co-localized G4s and R-loops are dynamically altered in a cell type-dependent manner and are largely localized at active promoters and enhancers of transcriptionally active genes.
Combined with Dhx9 ChIP-seq and co-localized G4s and R-loops data in wild-type and dhx9KO mESCs, the authors confirm that the helicase Dhx9 is a direct and major regulator that regulates the formation and resolution of co-localized G4s and R-loops.
Depletion of Dhx9 impaired the self-renewal and differentiation capacities of mESCs by altering the transcription of co-localized G4s and R-loops-associated genes.
In conclusion, the authors provide an approach to studying the interplay between G4s and R-loops, shedding light on the important roles of co-localized G4s and R-loops in development and disease by regulating the transcription of related genes.
We appreciate your valuable points.
Weaknesses:
As we know, there are at least two structure data of S9.6 antibody very recently, and the questions about the specificity of the S9.6 antibody on RNA:DNA hybrids should be finished. The authors referred to (Hartono et al., 2018; Konig et al., 2017; Phillips et al., 2013) need to be updated, and the authors' bias against S9.6 antibodies needs also to be changed. However, as the authors had questioned the specificity of the S9.6 antibody, they should compare it in parallel with the data they have and the data generated by the widely used S9.6 antibody.
Thank you for the updating information about the structure data of S9.6 antibody. We politely disagree the specificity of the S9.6 antibody on RNA:DNA hybrids. The structural studies of S9.6 (PMID: 35347133, 35550870) used only one RNA:DNA hybrid to show the superior specificity of S9.6 on RNA:DNA hybrid than dsRNA and dsDNA. However, Fabian K. et al has reported that the binding affinities of S9.6 on RNA:DNA hybrid exhibits obvious sequence-dependent bias from null to nanomolar range (PMID: 28594954). We have included the comparison between S9.6-derived data and our HBD-seq data in the Fig.9 and the section “Comparisons of HepG4-seq and HBD-seq with previous methods”.
Although HepG4-seq is an effective G4s detection technique, and the authors have also verified its reliability to some extent, given the strong link between ROS homeostasis and G4s formation, and hemin's affinity for different types of G4s, whether HepG4-seq reflects the dynamics of G4s in vivo more accurately than existing detection techniques still needs to be more carefully corroborated.
Thank you for pointing out this issue. In the in vitro hemin-G4 induced self-biotinylation assay, parallel G4s exhibit higher peroxidase activities than anti-parallel G4s. Thus, the dynamics of G4 conformation could affect the HepG4-seq signals (PMID: 32329781). In the future, people may need to combine HepG4-seq and BG4s-eq to carefully explain the endogenous G4s. We have discussed this point in the revised version.
Recommendations for the authors:
Reviewer #1 (Recommendations For The Authors):
Figures 1A&1G. Although no merge images were provided, it seems that the biotin signals are strongly enriched outside the nucleus. This suggests that hemin is not specific for G4s in DNA. Does it mean that Hemin can also recognise G4 on RNAs? How do the authors understand the cytoplasmic signal?
Hemin indeed could interact with RNA G4 to obtain the peroxidase activity like DNA G4-hemin complex (PMID: 27422869, 32329781, 31257395). The cytoplasmic signals in Figure 1A&1G were derived from RNA G4.
Figure 1A: The fact that there is no Alexa647 signal without hemin or Bio-An does not actually demonstrate that the signals are specific. These controls do not actually test for the specificity of the G4-Hemin interaction.
The specificity of hemin-G4-induced peroxidase activity and self-biotinylation has been well demonstrated in previous studies (PMID: 19618960, 22106035, 28973477, 32329781). In this study, we performed the IF to confirm this phenomena.
Figure 1C: It looks like the HepG4-seq signals are simply an amplification of the noise given by the Tn5 (the non-label ctrl has the same pattern, albeit weaker). It is unclear why this happens but it might happen if somehow hemin increased the probability that the Tn5 is close to chromatin in an unspecific manner (it would cut G-rich, nucleosome-poor, accessible sites in an unspecific manner). To discard this possibility, it would be interesting to investigate directly which loci are biotinylated. For this, the authors could extract and sonicate the genomic DNA and use streptavidin to enrich for biotinylated fragments. Strand-specific DNA sequencing could then be used to map the biotinylated loci.
In the cell culture medium, there were a certain amount of hemin from serum and a low dosage of biotin from the basal medium DMEM, which could not be avoid. Thus, these contaminated hemin and biotin would generate the background signals observed in the Non-label control samples. The biotinylated sites were specifically recognized by the recombinant Streptavidin monomer which further recruits Tn5 to the biotinylated sites with the help of Moon-tag. Different from the signals in the HEK293 samples, a much more robust HepG4-seq signals were observed in the mESC samples and the signals were also abolished in the non-label control samples. Thus, the relatively small signal-to-noise ratio in the HEK293 samples suggest the week abundance of endogenous G4s in the HEK293 cells. Thus, we politely disagree that hemin increased the non-specific recruitment of Th5. In addition, the CUT&Tag technology has been wildly demonstrated to have a much lower background, high signal-to-noise ratio and high sensitivity. Thus, we also politely disagree to replace the CUT&Tag with the traditional DNA library preparation method.
Figure 1H: No spike-in was added and the data are not quantitative. The number of replicates is unclear. 70000 extra peaks (10x) after inhibition of BLM or WRN seems enormous. These extra peaks should be better characterised: do they contain G4 motifs? Are they transcribed? etc...; again what kind of controls should be used here, in case the inhibition of BLP and WRN has a global impact on chromatin accessibility?
To quantitatively compare different samples, we have normalized all samples according their de-duplicated uniquely mapping reads numbers. Given that the inhibitors were dissolved in the DMSO, we used the DMSO as the control. Since the Tn5 were specifically recruited the biotinylated G4 sites through the recombinant Streptavidin monomer protein and the moon tag system, the chromatin accessibility will not affect the Tn5, which were normally observed in the ATAT-seq.
As suggested, we have analyzed the enriched motifs of the extra peaks induced by BLM or WRN inhibition and showed that the top enriched motifs are also G-rich in the supplementary Fig.1E. In addition, we analyzed the RNA-seq levels of genes-associated with these extra peaks. As shown in the figure below, the majority of these genes are actively transcribed.
Author response image 1.
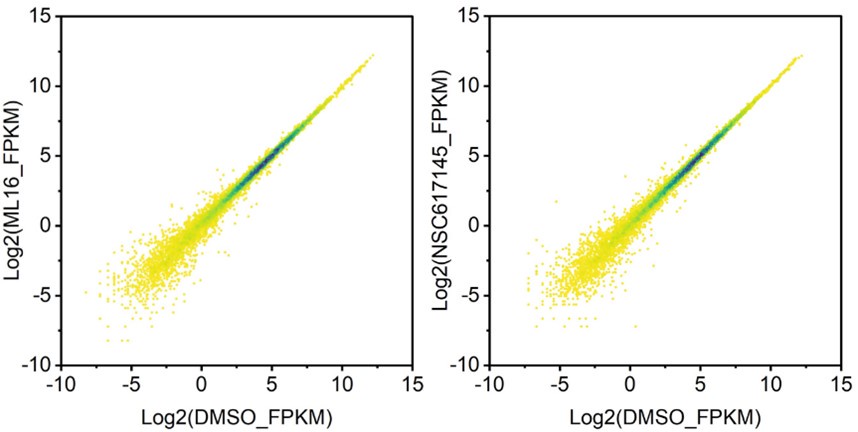
Figure 2: The mutated version of HBD should have been used as a control. As shown clearly in PMID: 37819055, the HBD domain does interact in an unspecific manner with chromatin at low levels. As above, this might be enough to increase the local concentration of the Tn5 close to chromatin in the Cut&Tag approach and to cleave accessible sites close to TSS in an unspecific manner.
As shown in Fig.2B and Fig.4A, we have included the RNase treatment as the control and showed that the HBD-seq-identified R-loops signals are dramatically attenuated (Fig.2B) or almost completely abolished after the RNase treatment (Fig.4A). These data demonstrate the specificity of HBD-seq.
Figure 2: What fraction of the HEPG4-seq signal is sensitive to RNase treatment? The authors used a combination of RNase A and RNase H but previous data have shown that the RNase A treatment is sufficient to remove the HBD-seq signal (which means that it is not actually possible on this sole basis to claim or disclaim that the signals do correspond to genuine R-loops). Do the authors have evidence that the RNase H treatment alone does impact their HBD-seq or HEPG4-seq signals?
As shown in Fig.2B and Fig.4A, the HBD-seq-identified R-loops signals are all dramatically attenuated (Fig.2B) or almost completely abolished after the RNase treatment (Fig.4A). The specificity of HBD on recognizing R-loops has been carefully demonstrated in the previous study (PMID: 33597247). In this study, we used the same two copies of HBD (2xHBD) and replaced the GST tag to EGFP-V5 to reduce the possibility of variable high molecular-weight aggregates caused by GST tag. In addition, RNase H treatment has been shown to fail to completely abolish the CUT&Tag signals since a subset of DNA-RNA hybrids with high GC skew are partially resistant to RNase H (PMID: 32544226, 33597247). In consideration of the high GC skew of co-localized G4s and R-loops, we combined the RNase A and RNase H. We currently did not have the RNaseH alone samples.
Figure 3A: "RNA-seq analysis revealed that the RNA levels of co-localized G4s and R-loops-associated genes are significantly higher": the differences are not very convincing.
In the Figure 3A, we have performed the Mann-Whitney test to examine the significance in the revised manuscript. RNA levels of co-localized G4s and R-loops-associated genes are indeed significantly higher than all genes, G4s or R-loops- associated genes with the Mann-Whitney test p < 2.2E-16.
Figure 3B: the patterns for "G4" and "co-localised G4 and R-loop" are extremely similar, suggesting that nearly all G4s mapped here could also form R-loops. If this is the case, most of the HEPG4-seq signals should be sensitive to exogenous RNase H treatment or to the in vivo over-expression of RNase H1. This should be tested (see above).
The percentage of co-localized G4 and R-loop in G4 peaks is 80.3% ( 5,459 out of 6,799) in HEK293 cells and 72.0% (68,482 out of 95,128) in mESC cells, respectively. The co-localization does not mean that G4 and R-loop interact with each other. We have showed that only small proportion of co-localized G4s and R-loops displayed differential G4s and R-loops at the same time in the dhx9KO mESCs (Fig. 6D, Supplementary Fig. 3B), suggesting that the majority of co-localized G4s and R-loops do not interact with each other. Thus, we thought that it is not necessary to perform the RNase H test.
Figure 3C: there is no correlation between the FC of G4 and the FC of RNA; this is not really consistent with the idea that the stabilisation of G4 is the driver rather than a consequence of the transcriptional changes.
Given that the treatment of WRN or BLM inhibition induced a large mount of G4 accumulation (Fig.1H-I), we examined the transcription effect on genes associated with these accumulated G4s in Fig.3C. We indeed observed the effect of G4 accumulation on transcription of G4-associated genes. Given that G4 stabilization triggers the transcriptional changes, it does not mean that the transcriptional changes should be highly correlated with the increase levels of G4s. To our knowledge, we have not observed this type of connections in the previous studies.
l279: the overlap with H3K4me1 is really not convincing.
For all G4 peaks, the signals of H3K4me1 indeed exhibit a high background around the center of G4 peaks but we still could observe a clear peak in the center.
Figure 5C: it should be clearly indicated here that the authors compare Cut&Tag and ChIP data. The origin of the ChIP-seq data is also unclear and should be indicated.
Thank you for the suggestions. We have clarified this point.
For the ChIP data, we have described the origin of ChIP-seq data in the “Data availability” section as below: “The ChIP-seq data of histone markers and RNAP are openly available in GNomEx database (accession number 44R) (Wamstad et al., 2012).”
Reviewer #2 (Recommendations For The Authors):
(1) Figure 1A. An experimental condition lacking H2O2 (-H2O2) should be included.
We have added this control in Fig.1A
(2) Does RNAse H affect G4 profiles?
We have not tested the effect of RNase H on G4 forming. However, we have showed that only small proportion of co-localized G4s and R-loops displayed differential G4s and R-loops at the same time in the dhx9KO mESCs (Fig. 6D, Supplementary Fig. 3B), suggesting that the majority of co-localized G4s and R-loops do not interact with each other. Thus, we thought that it is not necessary to perform the RNase H test on G4. In addition, to treat cells wit RNase H, we have to permeabilize cells first to let RNase H enter the nuclei. If so, we will lose the pictures of endogenous G4s.
(3) Figure 2G. R-loops are detected upstream of the KPNB1 gene. What is this region? Is it transcribed?
We are so sorry to make a mistake when we prepared this figure. We have change it to the correct one in Fig. 2G. The R-loop is around the TSS of KPNB1. We also showed the RNA-seq data in this region in Author response image 2 below. This region is indeed transcribed.
Author response image 2.
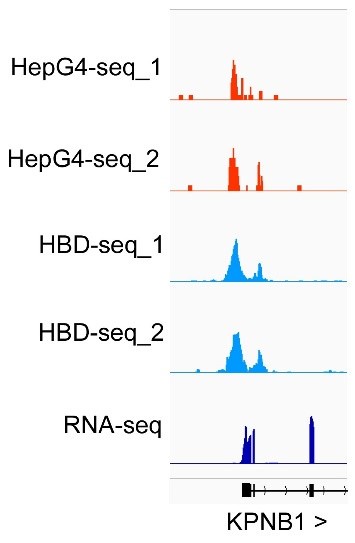
(4) Did BLM and WRN inhibition specifically affect the expression of genes containing colocalized G4s and R-loops? Was the effect seen in other genes as well? Appropriate statistical analyses are needed.
In the Fig.3, we have shown that the accumulation of co-localized G4 and R-loops induced by the inhibition of BLM or WRN significantly caused the changes of genes (480 in BLM inhibition, 566 in WRN inhibition) containing these structures most of which are localized at the promoter-TSS regions. We indeed detected the effect in other genes as well. There were 918 and 1020 genes with significantly changes (padjust <0.05 & FC >=2 or FC <=0.5) in BLM and WRN inhibition, respectively.
(5) The claim that "The co-localized G4s and R-loops-mediated transcriptional regulation in HEK293 cells" (title of Figure 3) is not supported by the presented data. A causality link is not established in this study, which only reports correlations between G4s/R-loops and transcription regulation.
We politely disagree with this point. BLM and WRN are the best characterized DNA G4-resolving helicase ((Fry and Loeb, 1999; Mendoza et al., 2016; Mohaghegh et al., 2001). Here, we used the selective small molecules to specifically inhibit their ATPase activity and observed dramatical induction of G4 accumulation. Notably, the accumulated G4s that trigger the transcriptional changes are mainly located at the promoter-TSS region. If the transcriptional changes trigger the G4 accumulations, we should not observe such a biased distribution and more accumulated G4s should be detected in the gene body.
(6) The effect of Dhx9 KO on colocalized G4s/R-loops and transcription is not clear. The suggestion that Dhx9 could regulate transcription by modulating G4s, R-loops, and co-localized G4s and R-loops is not supported by the presented data. Additional experiments and statistical analyses are needed to conclude the role of Dhx9 on colocalized G4s/Rloops and transcription.
Dhx9 has been extensively studied and reported to directly unwind R-loops and G4s or promote R-loop formation (PMID: 21561811, 30341290, 29742442, 32541651, 35905379, 34316718). Thus, it is not necessary to repeat these assays again. To understand the direct Dhx9-bound G4s and R-loops, we performed the Dhx9 CUT&Tag assay and analyzed the co-localization of Dhx9-binding sites and G4s or R-loops. 47,857 co-localized G4s and R-loops are directly bound by Dhx9 in the wild-type mESCs and 4,060 of them display significantly differential signals in absence of Dhx9, suggesting that redundant regulators exist as well. These data have clearly shown the roles of Dhx9 directly modulating the stabilities of G4s and R-loops. Furthermore, we showed that loss of Dhx9 caused 816 Dhx9 directly bound colocalized G4 and R-loop associated genes significantly differentially expressed, supporting the transcriptional regulation of Dhx9. We performed the differential analysis following the standard pipeline: DESeq2 for RNA-seq and DiffBind for HepG4-seq and HBD-seq. The statistical details have been described in the figure legends.
(7) The conclusion that Dhx9 regulates the self-renewal and differentiation capacities of mESCs is vague. Additional experiments are needed to elucidate the exact contribution of Dhx9.
In this study, we aimed to report new methods for capturing endogenous G4s and R-loops in living cells. In this study, we have shown that depletion of Dhx9 significantly attenuated the proliferation of the mESCs and also influenced the capacity of mESCs differentiation into three germline lineages during the EB assay. In addition, we showed that depletion of Dhx9 significantly reduced the protein levels of mESCs pluripotent markers Nanog and Lin28a. The comprehensive molecular mechanism of Dhx9 action is indeed not the focus of this study. We will work on it in the future studies. Thank you for the comments.
Reviewer #3 (Recommendations For The Authors):
The study on the involvement of native co-localized G4s and R-loops in transcriptional regulation further enriches the readers' understanding of genomic regulatory networks, and the functional dissection of Dhx9 also lays a good foundation for the study of the dynamic regulatory mechanisms of co-localized G4s and R-loops. Unfortunately, however, the authors lack a strong basis for questioning the widely used BG4 and S9.6 antibodies, and the co-localized G4s and R-loops sequencing data obtained by the developed and optimized method also lack parallel comparison with existing sequencing technologies, which cannot indicate that HepG4-seq and HBD-seq are more reliable and superior than BG4 and S9.6 antibody-based sequencing technologies. There are also some minor errors in the manuscript that need to be corrected.
Thank you for the constructive comments. We have added a new section (Comparisons of HepG4-seq and HBD-seq with previous methods) and a new figure 9 to parallelly compare our methods to other widely-used methods.
(1) This work mainly focuses on co-localized G4s and R-loops, but in the introduction section, the interplay between G4s and R-loops is only briefly mentioned. It is suggested that the importance of the interplay of G4s and R-loops for gene regulation should be further expanded to help readers better understand the significance of studying co-localized G4s and R-loops.
Thank you for the comments. The current studies about the interplay between G4s and R-loops are limited. We have summarized all we could find in the literatures.
(2) The authors mentioned that "a steady state equilibrium is generally set at low levels in living cells under physiological conditions (Miglietta et al., 2020) and thus the addition of high-affinity antibodies may pull the equilibrium towards folded states", in my understanding this is one of the important reasons why the authors optimized the G4s and R-loops detection assays, I wonder if there is a reliable basis for this statement. If there is, I suggest that the authors can supplement it in the manuscript.
The main reason we develop the new method is to develop an antibody-free method to label the endogenous G4s in living cells. We ever tried to capture endogenous G4s using the tet-on controlled BG4. Unfortunately, we found that even a short time induction of BG4 in living cells was toxic. The traditional antibody-based methos rely on permeabilizing cells first to let the antibodies enter the nuclei. In this case, it is easy to lost the physiological pictures of endogenous G4s. We will add more discussion about this point. For R-loops, we just further optimized the GST-2xHBD-mediated method to avoid the problem of GST-tag. GST-fusion proteins are prone to form variable high molecular-weight aggregates and these aggregates often undermine the reliability of the fusion proteins.
(3) Some questions about HepG4-seq:
Is there a difference in hemin affinity for intramolecular G quadruplexes, interstrand G quadruplexes, and their different topologies? If so, does this bias affect the accuracy of sequencing results based on G4-hemin complexes?
Thank you for pointing out this issue. In the in vitro hemin-G4 induced self-biotinylation assay, parallel G4s exhibit higher peroxidase activities than anti-parallel G4s (PMID: 32329781). Thus, the dynamics of G4 conformation possibly affect the HepG4-seq signals. In the future, people may need to combine HepG4-seq and BG4s-eq to carefully explain the endogenous G4s. We have discussed this point in the revised version.
HepG4-seq is based on proximity labeling and peroxidase activity of the G4-hemin complex. The authors tested and confirmed that the addition of hemin and Bio-An in the experiment had no significant influences on sequencing results, but the effect of exogenous H2O2 treatment may also need to be taken into account since ROS can mediate the formation of G4s.
For HepG4-seq protocol, we only treat cells with H2O2 for one minute. Thus, we thought that the side effect of H2O2 treatment should be limited in such a short time.
(4) As we know, there have been at least two structure data of the S9.6 antibody very recently, and the questions about the specificity of the S9.6 antibody on RNA:DNA hybrids should be finished. The authors referred to (Hartono et al., 2018; Konig et al., 2017; Phillips et al., 2013) need to be updated, and the author's bias against S9.6 antibodies needs also to be changed. However, as the authors had questioned the specificity of the S9.6 antibody, they should compare in parallel with the data they have and the data generated by the widely used S9.6 antibody.
Thank you for the updating information about the structure data of S9.6 antibody. We politely disagree the specificity of the S9.6 antibody on RNA:DNA hybrids. The structural studies of S9.6 (PMID: 35347133, 35550870) used only one RNA:DNA hybrid to show the superior specificity of S9.6 on RNA:DNA hybrid than dsRNA and dsDNA. However, Fabian K. et al has reported that the binding affinities of S9.6 on RNA:DNA hybrid exhibits obvious sequence-dependent bias from null to nanomolar range (PMID: 28594954). We have included the comparison between S9.6-derived data and our HBD-seq data in the Fig.9 and the section “Comparisons of HepG4-seq and HBD-seq with previous methods”.
(5) It is hoped that the results of immunofluorescence experiments can be statistically analyzed.
We have performed the statistical analysis and included the data in the new figure.
(6) Some minor errors:
Line 168, "G4-froming" should be "G4-forming";
Figure 5E, the color of the "Repressed" average signal at the top of the HepG4-seq heatmap should be blue;
Figure 7C, the abbreviation "Gloop" should be indicated in the text or in the figure caption.
Thank you for pointing out these issues. We are sorry for these mistakes. We have corrected them in the revised version.
Author Response
The following is the authors’ response to the original reviews.
Reviewer #1 (Recommendations For The Authors):
Some sentences need to be clarified and some additional data and references could be added.
1) Line 18
SRY is the sex-determining gene
SRY is the testis-determining gene is more accurate as described in line 44
Modification done
2) Line 50
Despite losing its function in early testis determination in mice, DMRT1 retained part of this function in adulthood when it is necessary to maintain Sertoli cell identity.
Losing its function is misleading. The authors describe firstly that Dmrt1 has no obvious function in embryonic testis development but is critical for the maintenance of Sertoli cells in adult mice. The wording "losing its function in early testis" is confusing. Do the authors mean that despite the expression of Dmrt1 in early testis development, the function of Dmrt1 seems to be restricted to adults in mice? A comparison between the testis and ovary should be more cautious since GarciaAlonso et al (2022) have shown that the transcriptomics of supporting cells between humans and mice is partly different.
That’s what we thought, and the sentence has been changed as follow: “Although DMRT1 is not required for testis determination in mice, it retained part of its function in adulthood when it is necessary to maintain Sertoli cell identity.” (line 51 to 53)
3) Line 78
XY DMRT1-/- rabbits showed early male-to-female sex reversal.
Sex reversal indicates that there is no transient Sertoli cell differentiation that transdifferentiate into granulosa cells. This brings us to an interesting point. In the case of reprogramming, the transient Sertoli cells can produce AMH leading to the regression of the Mullerian ducts. In humans, some 9pdeleted XY patients have Mullerian duct remnants and feminized external genitalia. This finding indicates early defects in testis development.
Is there also feminized external genitalia in XY Dmrt1−/− rabbits. Can the authors comment on the phenotype of the ducts?
We proposed to add “and complete female genitalia” at the end of the following sentence: “Secondly, thanks to our CRISPR/Cas9 genetically modified rabbit model, we demonstrated that DMRT1 was required for testis differentiation since XY DMRT1-/- rabbits showed early male-tofemale sex reversal with differentiating ovaries and complete female genitalia.” (line 77 to 80)
Indeed, since the first stage (16 dpc) where we can predict the sex of the individual by observing its gonads during dissection, we always predict a female sex for XY DMRT1 KO fetuses. It is only genotyping that reveals an XY genotype. At birth, our rabbits are sexed by technicians from the facility and again, but now based on the external genitalia, they always phenotype these rabbits as female ones. In these XY KO rabbits, the supporting cells never differentiate into Sertoli, and ovarian differentiation occurs as early as in XX animals. Thus, these animals are fully feminized with female internal and external genitalia. Most of 9p-deleted patients are not homozygous for the loss-offunction of DMRT1, and the remaining wild-type allele could explain the discrepancy between KO rabbits and humans.
4) Line 53
In the ovary, an equivalent to DMRT1 was observed since FOXL2 (Forkhead family box L2) is expressed in female supporting cells very early in development.
Can the authors clarify what is the equivalent of DMRT1, is it FOXL2? DMRT1 heterozygous mutations result in XY gonad dysgenesis suggesting haploinsufficiency of DMRT1. However, to my knowledge, there is no evidence of haploinsufficiency in XX babies. Thus can we compare testis and ovarian genetics?
We agree, the term “equivalent” is ambiguous, and we changed the sentence as follows: “In ovarian differentiation, FOXL2 (Forkhead family box L2) showed a similar function discrepancy between mice and goats as DMRT1 in the testis pathway. In the mouse, Foxl2 is expressed in female supporting cells early in development but does not appear necessary for fetal ovary differentiation. On the contrary, it is required in adult granulosa cells to maintain female-supporting cell identity.” (line 53 to 56)
Regarding reviewer 2's question on haploinsufficiency in humans: the patient described in Murphy et al., 2015 is an XY individual with complete gonadal dysgenesis. But, it has been shown that the mutation carried by this patient leads to a dominant-negative protein, equivalent to a homozygous state (Murphy et al., 2022).
For FOXL2 mutation in XX females, haploinsufficiency does not affect early ovarian differentiation (no sex reversal) but induces premature ovarian failure.
We agree with the reviewer, we cannot compare testis and ovarian genetics considering two different genes.
5) Line 55
In mice, Foxl2 does not appear necessary for fetal ovary differentiation (Uda et al., 2004), while it is required in adult granulosa cells to maintain female-supporting cell identity (Ottolenghi et al., 2005). The reference Uhlenhaut et al (2009) reporting the phenotype of the deletion of Foxl2 in adults should be added.
The reference has been added.
6) Line 64<br /> These observations in the goat suggested that DMRT1 could retain function in SOX9 activation and, thus, in testis determination in several mammals.
Lindeman et al (2021) have shown that DMRT1 can act as a pioneer factor to open chromatin upstream and Dmrt1 is expressed before Sry in mice (Raymond et al, 1999, Lei, Hornbaker et al, 2007). Whereas additional factors may compensate for the absence of Dmrt1, these results suggest that DMRT1 is also involved in Sox9 activation.
Dmrt1 is indeed expressed before Sry/Sox9 in the mouse gonad. However, no binding site for DMRT1 could be observed at Sox9 enhancer 13 in mice. This does not support a role for DMRT1 in the activation of Sox9 expression in this species. Furthermore, in Lindeman et al 2021, the authors clearly state that DMRT1 acts as a pioneering factor for SOX9 only after birth. It does not appear to have this role before. One of the explanations put forward is that the state of chromatin is different during fetal development in mice: chromatin is more permissive and does not require a factor to facilitate its opening. This hypothesis is based in particular on the description of a similar chromatin profile in the precursors of XX and XY fetal supporting cells, where many common regions display an open structure (Garcia-Moreno et al., 2019). Once sex determination and differentiation are established, a sex-specific epigenome is set up in gonadal cells. Chromatin remodeling agents are then needed to regulate gene expression. We hypothesize that in non-murine mammals such as rabbits, the state of gonadal cell chromatin would be different in the fetal period, more repressed, requiring the intervention of specific factors for its opening, such as DMRT1.
7) Figure 1
Most of the readers might not be familiar with the developmental stages of the gonad in rabbits. A diagram of the key stages in gonad development would facilitate the understanding of the results.
Thank you, it has been added in Figure 1.
8) Figure 2
Arrowheads are difficult to spot, could the authors use another color?
Done
9) Line 117: can the authors comment on the formation of the tunica albuginea? Do the epithelial cells acquire some specific characteristics?
The formation of the tunica albuginea begins with the formation of loose connective tissue beneath the surface epithelium of the male gonad. The appearance of this tissue is concomitant with the loss of expression of DMRT1 in the cell of the coelomic epithelium. Our interpretation is that the contribution of the cells from the coelomic epithelium and their proliferation stops when the tunica begins to form because the structure of the tissue beneath the epithelium change, and the cellular interactions between the epithelium and the tissue below remain disrupted. By contrast, these interactions persist in the ovary until around birth for ovigerous nest formation.
10) The first part of the results described DMRT1 expression in rabbits. With the new single-cell transcriptomic atlas of human gonads, it would be important to describe the pattern of expression in this species. This could be described in the introduction in order to know the DMRT1 expression pattern in the human gonad before that of the rabbit.
A comment on the expression pattern of DMRT1 in human fetal gonads has been added in the discussion section: “In the human fetal testis, DMRT1 expression is co-detected with SRY in early supporting gonadal cells (ESCGs), which become Sertoli cells following the activation of SOX9 expression (Garcia-Alonso et al., 2022) » (line 222 to 224)
11) Figure 3 supplement 3
Dotted line: delimitation of the ovarian surface epithelium. Could the authors check that there is a dotted line?
Done
12) Figure 5 and Line 186
Quantification is missing such as the % of germ cells, % of meiotic germ cells.
Quantification is not easy to realize in rabbits because of the size and the elongated shape of the gonad. Indeed, it’s difficult to be sure that both sections (one from WT, the other from KO) are strictly in a similar region of the gonad and that the section is perfectly longitudinal or not. See also our answer to reviewer 3 (point 7) on this aspect. Actually, we are trying to make a better characterization of this XX phenotype and to find a marker of the pre-leptotene/leptotene stage susceptible to work in rabbits (SYCP3 will be the best, but we encountered huge difficulties with different antibodies and even RNAscope probe!). So actually, the most convincing indirect evidence of this pre-meiotic blockage (in addition to HE staining at 18 dpp in the new Figure 6) is the persistence of POU5F1 (pluripotency), specifically in the germinal lineage of KO XX and XY gonads. In addition to the new figure supplement 5, we can show you in Author response image 1: (i) the gonadal section at a lower magnification, where it is evident that there is a big difference between WT and KO germ cell POU5F1-stainings; and (ii) POU5F1 expression from a bulk RNA-seq realized the day after birth at 1 dpp where the difference is also transcriptionally very clear.
Author response image 1.
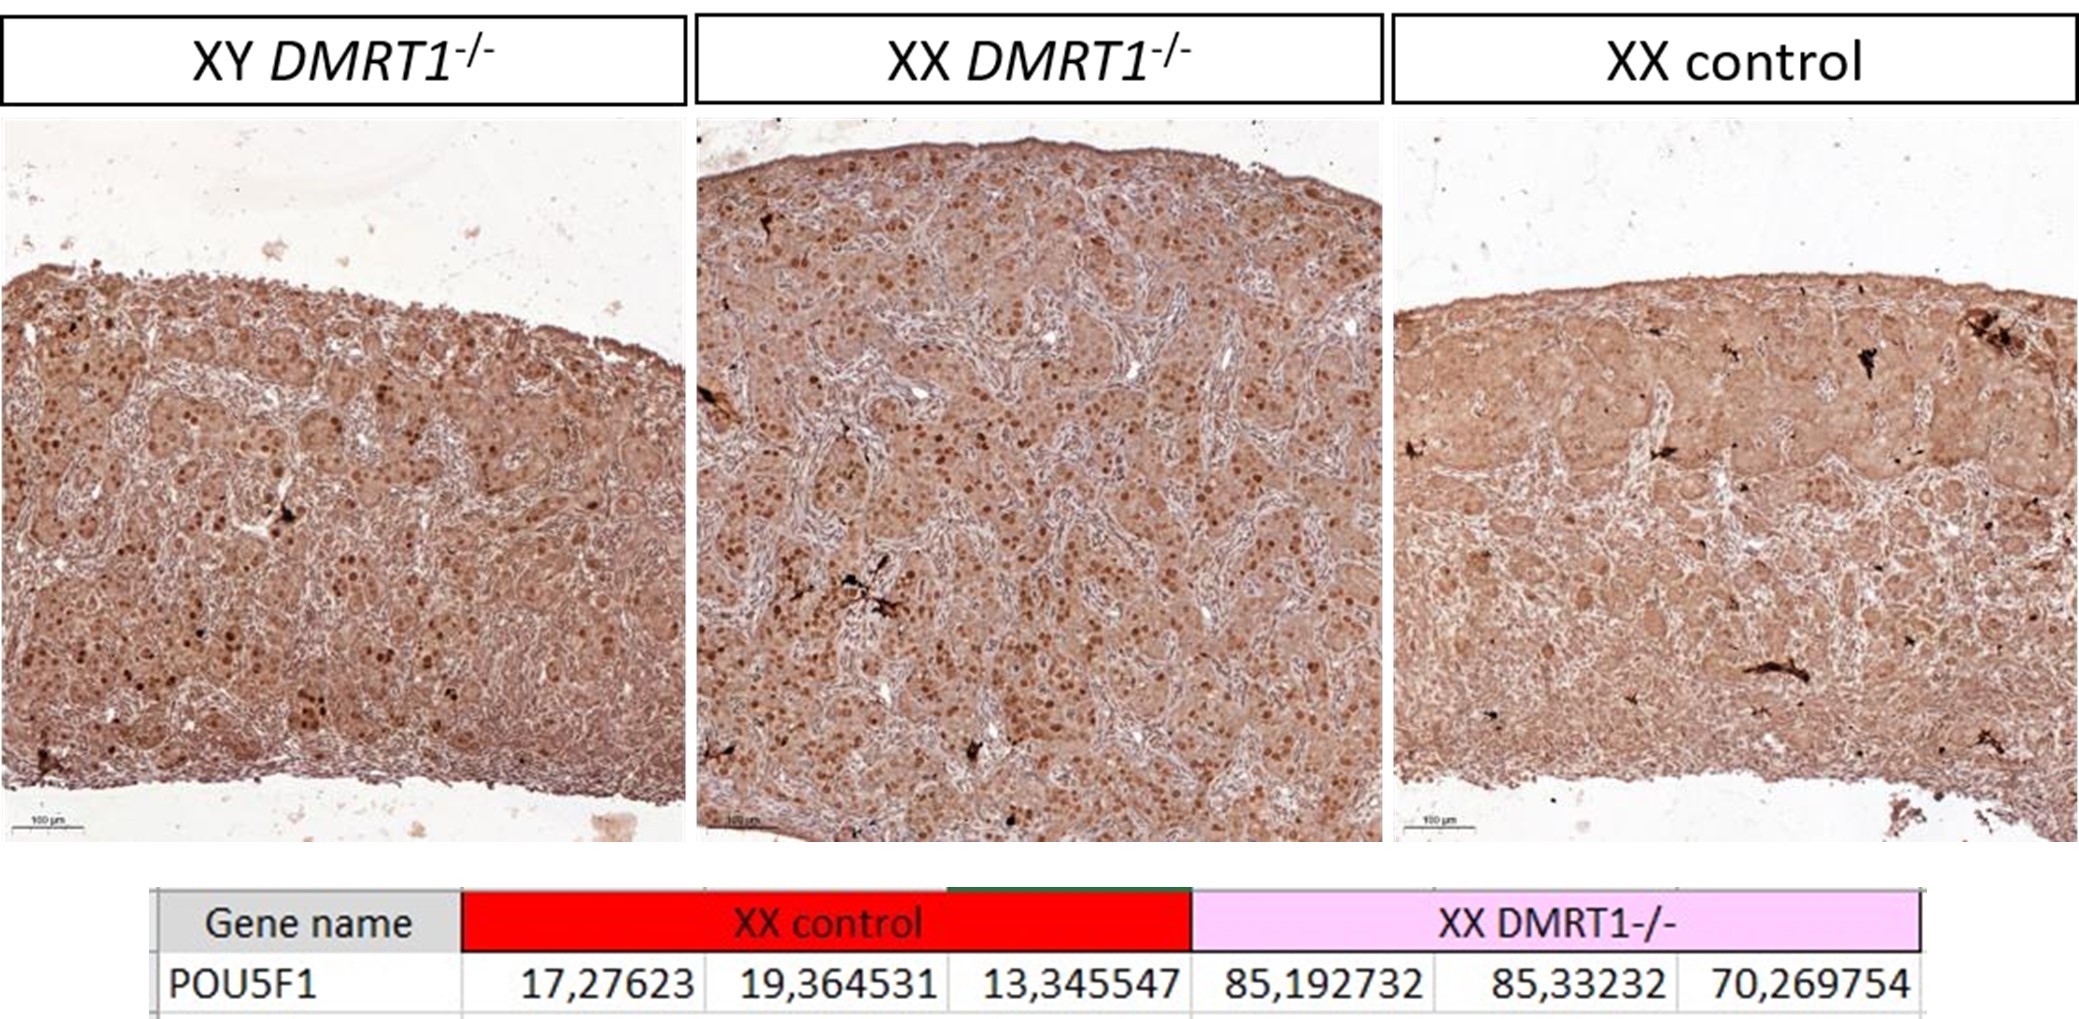
13) Line 186,
E is missing at preleptoten
Added
14) Figure supplement 7.
A magnification of the histology of the gonads is missing.
This figure is only for showing the gonadal size, and there are the same gonads as in the new Figure 6. So, the magnification is represented in Figure 6.
15)Discussion
Line 201
SOX9, well known in vertebrates,
The references of the human DSD associated with SOX9 mutations are missing. Thank you, references have been added.
16) Line 286
One of the targets of WNT signaling is Bmp2 in the somatic cells and in turn, Zglp1, which is required for meiosis entry in the ovary as shown by Miyauchi et al (2017) and Nagaoka et al (2020). Does the level of BMP pathway vary in DMRT1 mutants?
At 20 dpc, the expression level of BMP2 in XY and XX DMRT1 mutants gonads is similar to the one of XX control which is lower than in XY control (see the TMP values from our RNA-seq in Author response image 2).
Author response image 2.

Reviewer #2 (Recommendations For The Authors):
Here are my minor comments:
1) Line 106- You mention that coelomic epithelial cells only express DMRT1. Please add an arrow to highlight where you refer to.
Done
2) Line 112: In mice, the SLCs also express Sox9 but not Sry apart from Pax8. You mention here that the SLCs are expressing SRY and DMRT1 in addition to PAX8. Could you perhaps explain the difference? Please refer to that in the results or discussion.
We add a new sentence at the end of this paragraph on SLCs: “As in mice, these cells will express SOX9 at the latter stages (few of them are already SOX9 positive at 15 dpc), but unlike mice, they express SRY.” (line 114 to 115)
We already have collaborations with different labs on these SLC cells, and we will certainly come back later on this aspect, remaining slightly off-topic here.
3) Could you please explain why did you chose to target Exon 3 of DMRT1 and not exons 1-2 which contain the DM domain? Was it to prevent damaging other DMRT proteins? Is there an important domain or function in Exon 2?
Our choice was mainly based on technical issues (rabbit genome annotation & sgRNA design), but also we want to avoid targeting the DM domain due to its strong conservation with other DMRT genes. Due to the poor quality of the rabbit genome, exons 1 and 2 are not well annotated in this species. We have amplified and sequenced the region encompassing exons 1 & 2 from our rabbit line, but the software used for sgRNA design does not predict good guides on this region. The two best sgRNAs were predicted on exon 3, and we used both to obtain more mutated alleles.
4) Your scheme in Supp Figure 4 is not so clear. It is not clear that the black box between the two guides is part of Exon 3 (labelled in blue).
The scheme has been improved.
5) Did you only have 1 good founder rabbit in your experiment? Why did you choose to work with a line that had duplication rather than deletion?
Very good point! In the first version of this paper, we’d try to explain the long (around 2 years) story of breeding to obtain the founder animal. Here it is:
During the genome editing process, we generate 6 mosaic founder animals (5 males and 1 female), then we cross them with wild-type animals to isolate each mutated allele in F1 offspring used afterward to establish and amplify knockout lines. Unexpectedly, we observe a very slow ratio of mutated allele transmission (5 on 129 F1 animals), and only one mutated allele has been conserved from the unique surviving adult F1 animal. It consists of an insertion of the deleted 47 bp DNA fragment, flanked by the cutting sites of the two RNA guides used with Cas9.<br /> The main hypothesis to explain this mutation event is that in the same embryonic cell, the deletion occurs on one allele then the deleted fragment remains inserted into the other allele. Under this scheme, the embryonic cell carries a homozygous DMRT1 knockout genotype, albeit heterogeneous, with a deleted allele (del47) and the present allele (insertion of a 47 bp fragment leading to an in sense duplication). This may explain the very low frequency of transmission since all germ cells carrying a homozygous DMRT1-/- genotype will probably not be able to enter the meiotic process as suggested by our results on XX and XY DMRT1-/- ovaries. Finally, and under this hypothesis, the way we obtained this unique founder animal remains a mystery!
6) Figure 4- real-time data- where does it say what is a,b,c,d of the significance? It should appear on the figure itself and not elsewhere.
Modification done.
7) If I understand correctly, you were able to get the rabbits born and kept to adulthood (you show in supp figure 7 their gonads). What was the external phenotype of these rabbits? Did the XY mutant gonads have the internal and external genitals of a female (oviduct, uterus, vagina etc.)?
See our answer to Reviewer 1 on this question (point 3).
8) Line 20: It is more correct to write 46, XY DSD rather than XY DSD
Modification done.
9) Line 21: you can remove the "the" after abolished
Modification done.
10) Line 31: consider replacing the first "and" by "as well as" since the sentence sounds strange with two "and".
Modification done.
11) Line 212- Please check with the eLife guidelines if they allow "data not shown" in the paper.
This is unspecified.
Reviewer #3 (Recommendations For The Authors):
The following points should be addressed.
1) The in situ's in Fig 1 and 2 are very clear. Fig 1 and Fig 2, In situ hybridisation in tissue sections, it looked like DMRT1 could be expressed in some cells where SRY mRNA is absent @ E13.5dpc and 14.5 dpc. Do you think this is real, or maybe Sry is turned off now in those cells?
Based on the results of in situ hybridizations, DMRT1 appears to be expressed by both coelomic epithelium and genital crest medullar cells in a pattern that is actually broader than that of SRY. Moreover, in rabbits, SRY expression seems to start in the medulla of the genital ridge rather than in the surface epithelium, as described in mice (see Figure 1 at 12 and 13 dpc). Nevertheless, more detailed analyses are needed to ensure the lineage of cells expressing SRY and/or DMRT1, such as single-cell RNAseq at these key stages of sexual determination in rabbits (from 12 to 16 dpc).
2) It is curious that SRY expression is elevated in the DMRT1 KO (Knockout) rabbit gonads. Does this suggest feedback inhibition by DMRt1, or maybe indirect via effect on Sox9 (as I believe Sox9 feeds back to down-regulate Sry in mouse, for example).
The maintenance of SRY expression in the DMRT1 -/- rabbit testis seems to be linked to the absence of SOX9 expression. We believe that, as in mice, SOX9 would down-regulate SRY (even if, in rabbits, SRY expression is never completely turned off).
3) I suggest the targeting strategy and proof of DMRT1 knockout by sequencing etc. be brought out of the suppl. Data and shown as a figure in the text.
See also our answer to reviewer 2 (point 5). It has needed huge efforts to obtain these DMRT1 mutated rabbit line, and of course, it constitutes the basis of the study. But regarding the title and the main message of the article, we are not convinced that the targeting strategy should be moved into the main text.
4) Unless there are limitations imposed by the journal, I also feel that Suppl Fig 5 (the immunostaining) deserves to be in the paper text too. The Fig showing loss of DMRt1 by immunostaining is important.
We include the figure supplement 5 in the main text. So, Figure 4E and figure supplement 5 have been combined into a new Figure 5.
5) The RT-qPCR data should have the statistics clarified on the graphs. (e.g., it is stated that, although Sox9 mRNA is clearly down, there is a slight increase compared to control on KO XX gonads. Is this statistically significant? Figure legend states that the Kruskal-Wallis test is used, and significance is shown by letters. This is unclear. It would be better to use the more usual asterisks and lines to show comparisons.
Modification done.
6) Reference is made to DMRT1+/- rabbits having aberrant germ cell development, pointing to a dosage effect. This is interesting. Does the somatic part of the gonad look completely normal in the het knockouts?
DMRT1 heterozygous male rabbits have a phenotype of secondary infertility with aging, and we are trying now to better characterize this phenotype. The problem is complex because, as we cannot carry out conditional KO, it remains difficult to decipher the consequence of DMRT1 haploinsufficiency in the Sertoli cells versus the germinal ones. Anyway, the somatic part is sufficiently normal to support spermatogenesis since heterozygous males are fertile at puberty and for some months thereafter.
7) Can the authors indicate why meiotic markers were not used to explore the germ cell phenotype? It would be advantageous to use a meiotic germ cell marker to definitely show that the germ cells do not enter meiosis after DMRT1 loss. (Not just H/E staining or maintenance of POU). Example SYCP3, or STRA8 (as pre-meiotic marker) by in situ or immunostaining. Even though no germ cells were detected in adult KO gonads.
The expression of pre-meiotic or meiotic markers is currently under study in DMRT1 -/- females. Transcriptomic data (RNA-seq) are also being analyzed. We are preparing a specific article on the role of DMRT1 in ovarian differentiation in rabbits. We felt it was important to reveal the phenotype observed in females in this first article, but we still need time to refine our description and understanding of the role of DMRT1 in the female.
8) What future studies could be conducted? In the Discussion section, it is suggested that DMRT1 could act as a pioneering factor to allow SRY action upon Sox9. How could this be further explored?
To explore the function of DMRT1 as a pioneering factor, it now seems necessary to characterize the epigenetic landscapes of rabbit fetal gonads expressing or not DMRT1 (comparison of control and DMRT1-/- gonads). Two complementary approaches could be privileged: the study of chromatin opening (ATAC-seq) and the analysis of the activation state of regulatory regions (CUT&Tag). The study of several histone marks, such as H3K4me3 (active promoters), H3K4me1 (primed enhancers), H3K27ac (enhancers and active promoters), and H3K27me3 (enhancers and repressed promoters), would be of great interest. However, these techniques are only relevant for gonads that can be separated from the adjacent mesonephros, which is only possible from the 16 dpc stage in rabbits. To perform a relevant analysis at earlier stages, a "single-nucleus" approach such as ATAC-seq singlenucleus or multi-omic single-nucleus combining ATAC-seq and RNA-seq could be used.
Author response:
The following is the authors’ response to the original reviews.
Public Reviews:
Reviewer #1 (Public Review):
Summary:
UGGTs are involved in the prevention of premature degradation for misfolded glycoproteins, by utilizing UGGT-KO cells and a number of different ERAD substrates. They proposed a concept by which the fate of glycoproteins can be determined by a tug-of-war between UGGTs and EDEMs.
Strengths:
The authors provided a wealth of data to indicate that UGGT1 competes with EDEMs, which promotes glycoprotein degradation.
Weaknesses:
Less clear, though, is the involvement of UGGT2 in the process. Also, to this reviewer, some data do not necessarily support the conclusion.
Major criticisms:
(1) One of the biggest problems I had on reading through this manuscript is that, while the authors appeared to generate UGGTs-KO cells from HCT116 and HeLa cells, it was not clearly indicated which cell line was used for each experiment. I assume that it was HCT116 cells in most cases, but I did not see that it was clearly mentioned. As the expression level of UGGT2 relative to UGGT1 is quite different between the two cell lines, it would be critical to know which cells were used for each experiment.
Thank you for this comment. We have clarified this point, especially in the figure legends.
(2) While most of the authors' conclusion is sound, some claims, to this reviewer, were not fully supported by the data. Especially I cannot help being puzzled by the authors' claim about the involvement of UGGT2 in the ERAD process. In most of the cases, KO of UGGT2 does not seem to affect the stability of ERAD substrates (ex. Fig. 1C, 2A, 3D). When the author suggests that UGGT2 is also involved in the ERAD, it is far from convincing (ex. Fig. 2D/E). Especially because now it has been suggested that the main role of UGGT2 may be distinct from UGGT1, playing a role in lipid quality control (Hung, et al., PNAS 2022), it is imperative to provide convincing evidence if the authors want to claim the involvement of UGGT2 in a protein quality control system. In fact, it was not clear at all whether even UGGT1 is also involved in the process in Fig. 2D/E, as the difference, if any, is so subtle. How the authors can be sure that this is significant enough? While the authors claim that the difference is statistically significant (n=3), this may end up with experimental artifacts. To say the least, I would urge the authors to try rescue experiments with UGGT1 or 2, to clarify that the defect in UGGT-DKO cells can be reversed. It may also be interesting to see that the subtle difference the authors observed is indeed N-glycan-dependent by testing a non-glycosylated version of the protein (just like NHK-QQQ mutants in Fig. 2C).
We appreciate this comment. According to this comment, we reevaluated the importance of UGGT2 for ER-protein quality control. As this reviewer mentioned, KO of UGGT2 does not affect the stability of ATF6a, NHK, rRI332-Flag or EMC1-△PQQ-Flag (Fig. 1E, 2A, and 3DE). Furthermore, we tested whether overexpression of UGGT2 reverses the phenotype of UGGT-DKO regarding the degradation rate of NHK, and we found that it did not affect the degradation rate of NHK, whereas overexpression of UGGT1 restored the degradation rate to that in WT cells.
Author response image 1.
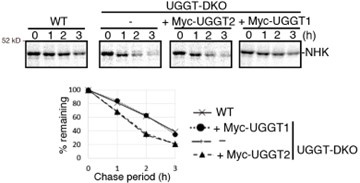
Collectively, these facts suggest that the role of UGGT2 in ER protein quality control is rather limited in HCT116 cells. Therefore, we have decided not to mention UGGT2 in the title, and weakened the overall claim that UGGT2 contributes to ER protein quality control. Tissues with high expression of UGGT2 or cultured cells other than HCT116 would be appropriate for revealing the detailed function of UGGT2.
To this reviewer, it is still possible that the involvement of UGGT1 (or 2, if any) could be totally substrate-dependent, and the substrates used in Fig 2D or E happen not to be dependent to the action of UGGTs. To the reviewer, without the data of Fig. 2D and E the authors provide enough evidence to demonstrate the involvement of UGGT1 in preventing premature degradation of glycoprotein ERAD substrates. I am just afraid that the authors may have overinterpreted the data, as if the UGGTs are involved in stabilization of all glycoproteins destined for ERAD.
Based on the point this reviewer mentioned, we decided to delete previous Fig. 2D and 2E. There may be more or less efficacy of UGGT1 for preventing early degradation of substrates.
(3) I am a bit puzzled by the DNJ treatment experiments. First, I do not see the detailed conditions of the DNJ treatment (concentration? Time?). Then, I was a bit surprised to see that there were so little G3M9 glycans formed, and there was about the same amount of G2M9 also formed (Figure 1 Figure supplement 4B-D), despite the fact that glucose trimming of newly syntheized glycoproteins are expected to be completely impaired (unless the authors used DNJ concentration which does not completely impair the trimming of the first Glc). Even considering the involvement of Golgi endo-alpha-mannosidase, a similar amount of G3M9 and G2M9 may suggest that the experimental conditions used for this experiment (i.e. concentration of DNJ, duration of treatment, etc) is not properly optimized.
We think that our experimental condition of DNJ treatment is appropriate to evaluate the effect of DNJ. Referring to the other papers (Ali and Field, 2000; Karlsson et al., 1993; Lomako et al., 2010; Pearse et al., 2010; Tannous et al., 2015), 0.5 mM DNJ is appropriate. In our previously reported experiment, 16 h treatment with kifunensine mannosidase inhibitor was sufficient for N-glycan composition analysis prior to cell collection (Ninagawa et al., 2014), and we treated cells for a similar time in Figure 1-Figure Supplement 4 and 5 (and Figure 1-Figure Supplement 6). We could see the clear effect of DNJ to inhibit degradation of ATF6a with 2 hours of pretreatment (Fig. 1G). Furthermore, our results are very reasonable and consistent with previous findings that DNJ increased GM9 the most (Cheatham et al., 2023; Gross et al., 1983; Gross et al., 1986; Romero et al., 1985). In addition to DNJ, we used CST for further experiments in new figures (Fig. 1H and Figure 1-Figure supplement 6). DNJ and CST are inhibitors of glucosidase; DNJ is a stronger inhibitor of glucosidase II, while CST is a stronger inhibitor of glucosidase I (Asano, 2000; Saunier et al., 1982; Szumilo et al., 1987; Zeng et al., 1997). An increase in G3M9 and G2M9 was detected using CST (Figure1-Figure Supplement 6). Like DNJ, CST also inhibited ATF6a degradation in UGGT-DKO cells (Fig. 1H). These findings show that our experimental condition using glucosidase inhibitor is appropriate and strongly support our model (Fig. 5). Differences between the effects of DNJ and CST are now described in our manuscript pages 8 to 10.
Reviewer #2 (Public Review):
In this study, Ninagawa et al., shed light on UGGT's role in ER quality control of glycoproteins. By utilizing UGGT1/UGGT2 DKO cells, they demonstrate that several model misfolded glycoproteins undergo early degradation. One such substrate is ATF6alpha where its premature degradation hampers the cell's ability to mount an ER stress response.
While this study convincingly demonstrates early degradation of misfolded glycoproteins in the absence of UGGTs, my major concern is the need for additional experiments to support the "tug of war" model involving UGGTs and EDEMs in influencing the substrate's fate - whether misfolded glycoproteins are pulled into the folding or degradation route. Specifically, it would be valuable to investigate how overexpression of UGGTs and EDEMs in WT cells affects the choice between folding and degradation for misfolded glycoproteins. Considering previous studies indicating that monoglucosylation influences glycoprotein solubility and stability, an essential question is: what is the nature of glycoproteins in UGGTKO/EDEMKO and potentially UGGT/EDEM overexpression cells? Understanding whether these substrates become more soluble/stable when GM9 versus mannose-only translation modification accumulates would provide valuable insights.
In the new figure 2DE, we conducted overexpression experiments of structure formation factors UGGT1 and/or CNX, and degradation factors EDEMs. While overexpression of structure formation factors (Fig. 2DE) and KO of degradation factors (Ninagawa et al., 2015; Ninagawa et al., 2014) increased stability of substrates, KO of UGGT1 (Fig. 1E, 2A and 3DF) and overexpression of degradation factors (Fig. 2DE) (Hirao et al., 2006; Hosokawa et al., 2001; Mast et al., 2005; Olivari et al., 2005) accelerated degradation of substrates. A comparison of the properties of N-glycan with the normal type and the type without glucoses was already reported (Tannous et al., 2015). The rate of degradation of substrate was unchanged, but efficiency of secretion of substrates was affected.
The study delves into the physiological role of UGGT, but is limited in scope, focusing solely on the effect of ATF6alpha in UGGT KO cells' stress response. It is crucial for the authors to investigate the broader impact of UGGT KO, including the assessment of basal ER proteotoxicity levels, examination of the general efflux of glycoproteins from ER, and the exploration of the physiological consequences due to UGGT KO. This broader perspective would be valuable for the wider audience. Additionally, the marked increase in ATF4 activity in UGGTKO requires discussion, which the authors currently omit.
We evaluated the sensitivity of WT and UGGT1-KO cells to ER stress (Figure 4G). KO of UGGT1 increased the sensitivity to ER stress inducer Tg, indicating the importance of UGGT1 for resisting ER stress.
We add the following description in the manuscript about ATF4 activity in UGGT1-KO: “In addition to this, UGGT1 is necessary for proper functioning of ER resident proteins such as ATF6a (Fig. 4B-F). It is highly possible that ATF6a undergoes structural maintenance by UGGT1, which could be necessary to avoid degradation and maintain proper function, because ATF6a with more rigid in structure tended to remain in UGGT1-KO cells (Fig. 4C). Responses of ERSE and UPRE to ER stress, which require ATF6a, were decreased in UGGT1-KO cells (Fig. 4DE). In contrast, ATF4 reporter activity was increased in UGGT1-KO cells (Fig. 4F), while the basal level of ATF4 in UGGT1-KO cells was comparable with that in WT (Figure 1-Figure supplement 2B). The ATF4 pathway might partially compensate the function of the ERSE and UPRE pathways in UGGT1-KO cells in acute ER stress. This is now described on Page 17 in our manuscript.
The discussion section is brief and could benefit from being a separate section. It is advisable for the authors to explore and suggest other model systems or disease contexts to test UGGT's role in the future. This expansion would help the broader scientific community appreciate the potential applications and implications of this work beyond its current scope.
Thank you for making this point. The DISCUSSION part has now been separated in our manuscript. We added some points in the manuscript about other model organisms and diseases in the DISCUSSION as follows: “ Our work focusing on the function of mammalian UGGT1 greatly advances the understanding how ER homeostasis is maintained in higher animals. Considering that Saccharomyces cerevisiae does not have a functional orthologue of UGGT1 (Ninagawa et al., 2020a) and that KO of UGGT1 causes embryonic lethality in mice (Molinari et al., 2005), it would be interesting to know at what point the function of UGGT1 became evolutionarily necessary for life. Related to its importance in animals, it would also be of interest to know what kind of diseases UGGT1 is associated with. Recently, it has been reported that UGGT1 is involved in ER retention of Trop-2 mutant proteins, which are encoded by a causative gene of gelatinous drop-like corneal dystrophy (Tax et al., 2024). Not only this, but since the ER is known to be involved in over 60 diseases (Guerriero and Brodsky, 2012), we must investigate how UGGT1 and other ER molecules are involved in diseases.”
Reviewer #3 (Public Review):
This manuscript focuses on defining the importance of UGGT1/2 in the process of protein degradation within the ER. The authors prepared cells lacking UGGT1, UGGT2, or both UGGT1/UGGT2 (DKO) HCT116 cells and then monitored the degradation of specific ERAD substrates. Initially, they focused on the ER stress sensor ATF6 and showed that loss of UGGT1 increased the degradation of this protein. This degradation was stabilized by deletion of ERAD-specific factors (e.g., SEL1L, EDEM) or treatment with mannose inhibitors such as kifunesine, indicating that this is mediated through a process involving increased mannose trimming of the ATF6 N-glycan. This increased degradation of ATF6 impaired the function of this ER stress sensor, as expected, reducing the activation of downstream reporters of ER stress-induced ATF6 activation. The authors extended this analysis to monitor the degradation of other well-established ERAD substrates including A1AT-NHK and CD3d, demonstrating similar increases in the degradation of destabilized, misfolding protein substrates in cells deficient in UGGT. Importantly, they did experiments to suggest that re-overexpression of wild-type, but not catalytically deficient, UGGT rescues the increased degradation observed in UGGT1 knockout cells. Further, they demonstrated the dependence of this sensitivity to UGGT depletion on N-glycans using ERAD substrates that lack any glycans. Ultimately, these results suggest a model whereby depletion of UGGT (especially UGGT1 which is the most expressed in these cells) increases degradation of ERAD substrates through a mechanism involving impaired re-glucosylation and subsequent re-entry into the calnexin/calreticulin folding pathway.
I must say that I was under the impression that the main conclusions of this paper (i.e., UGGT1 functions to slow the degradation of ERAD substrates by allowing re-entry into the lectin folding pathway) were well-established in the literature. However, I was not able to find papers explicitly demonstrating this point. Because of this, I do think that this manuscript is valuable, as it supports a previously assumed assertion of the role of UGGT in ER quality control. However, there are a number of issues in the manuscript that should be addressed.
Notably, the focus on well-established, trafficking-deficient ERAD substrates, while a traditional approach to studying these types of processes, limits our understanding of global ER quality control of proteins that are trafficked to downstream secretory environments where proteins can be degraded through multiple mechanisms. For example, in Figure 1-Figure Supplement 2, UGGT1/2 knockout does not seem to increase the degradation of secretion-competent proteins such as A1AT or EPO, instead appearing to stabilize these proteins against degradation. They do show reductions in secretion, but it isn't clear exactly how UGGT loss is impacting ER Quality Control of these more relevant types of ER-targeted secretory proteins.
We appreciate your comment. It is certainly difficult to assess in detail how UGGT1 functions against secretion-competent proteins, but we think that the folding state of these proteins is improved, which avoids their degradation and increases their secretion. In Figure 1-Figure supplement 2E, there is a clear decrease in secretion of EPO in UGGT1-KO cells, suggesting that UGGT1 also inhibits degradation of such substrates. Note that, as shown in Fig. 3A-C, once a protein forms a solid structure, it is rarely degraded in the ER.
Lastly, I don't understand the link between UGGT, ATF6 degradation, and ATF6 activation. I understand that the idea is that increased ATF6 degradation afforded by UGGT depletion will impair activation of this ER stress sensor, but if that is the case, how does UGGT2 depletion, which only minimally impacts ATF6 degradation (Fig. 1), impact activation to levels similar to the UGGT1 knockout (Fig 4)? This suggests UGGT1/2 may serve different functions beyond just regulating the degradation of this ER stress sensor. Also, the authors should quantify the impaired ATF6 processing shown in Fig 4B-D across multiple replicates.
According to this valuable comment, we reevaluated our manuscript. As this reviewer mentioned, involvement of UGGT2 in the activation of ATF6a cannot be explained only by the folding state of ATF6a. Thus, the part about whether UGGT2 is effective in activating ATF6 is outside the scope of this paper. The main focus of this paper is the contribution of UGGT1 to the ER protein quality control mechanism.
Ultimately, I do think the data support a role for UGGT (especially UGGT1) in regulating the degradation of ERAD substrates, which provides experimental support for a role long-predicted in the field. However, there are a number of ways this manuscript could be strengthened to further support this role, some of which can be done with data they have in hand (e.g., the stats) or additional new experiments.
In this revision period, to further elucidate the function of UGGT, we did several additional experiments (new figures Fig. 1H, 2DE, 4G and, Figure 1-Figure Supplement 6). We hope that these will bring our papers up to the level you have requested.
Reviewer #1 (Recommendations For The Authors):
Minor points:
(1) Abbreviations: GlcNAc, N-acetylglucosamines -> why plural?
Corrected.
(2) Abstract: to this reviewer, it may not be so common to cite references in the abstract.
We submit this manuscript to eLife as “Research Advances”. In the instructions of eLife for “Research Advances”, there is the description: “A reference to the original eLife article should be included in the abstract, e.g. in the format “Previously we showed that XXXX (author, year). Here we show that YYYY.” We follow this.
(3) Introduction: "as the site of biosynthesis of approximately one-third of all proteins." Probably this statement needs a citation?
We added the reference there. You can also confirm this in “The Human Protein Atlas” website. https://www.proteinatlas.org/humanproteome/tissue/secretome
(4) Figure 1F - the authors claimed that maturation of HA was delayed also in UGGT2 cells, but it was not at all clear to me. Rescue experiments with UGGT2 would be desired.
We agree with this reviewer, but there was a statistically significant difference in the 80 min UGGT2-KO strain. Previously, it was reported that HA maturation rate was not affected by UGGT2 (Hung et al., 2022). We think that the difference is not large. A rescue experiment of UGGT2 on the degradation of NHK was conducted, and is shown in this response to referees.
(5) Figure 4A, here also the authors claim that UGGT2 is "slightly" involved in folding of ATF6alpha(P) but it is far from convincing to this reviewer.
Now we also think that involvement of UGGT2 in ER protein quality control should be examined in the future.
(6) Page 11, line 7 from the bottom: "peak of activation was shifted from 1 hour to 4 hours after the treatment of Tg in UGGT-KO cells". I found this statement a bit awkward; how can the authors be sure that "the peak" is 4 hours when the longest timing tested is 4 hours (i.e. peak may be even later)?
Corrected. We deleted the description.
(7) Page 11, line 4 "a more rigid structure that averts degradation" Can the authors speculate what this "rigid" structure actually means? The reviewer has to wonder what kind of change can occur to this protein with or without UGGT1. Binding proteins? The difference in susceptibility against trypsin appears very subtle anyway (Figure 4 Figure Supplement 1).
Let us add our thoughts here: Poorly structured ATF6a is immediately routed for degradation in UGGT1-KO cells. As a result, ATF6a with a stable or rigid structure have remained in the UGGT1-KO strain. ATF6a with a metastable state is tended to be degraded without assistance of UGGT1.
(8) Figure 1 Figure supplement 2; based on the information provided, I calculate the relative ratio of UGGT2/UGGT1 in HCT116 which is 4.5%, and in HeLa 26%. Am I missing something? Also significant figure, at best, should be 2, not 3 (i.e. 30%, not 29.8%).
Corrected. Thank you for this comment.
Reviewer #2 (Recommendations For The Authors):
(1) The effect in Fig. 2B with UGGT1-D1358A add-back is minimal. Testing the inactive and active add-back on other substrates, such as ATF6alpha, which undergoes a more rapid degradation, would provide a more comprehensive assessment.
To examine the effect of full length and inactive mutant of UGGT1 in UGGT1-KO and UGGT2-KO on the rate of degradation of endogenous ATF6a, we tried to select more than 300 colonies stably expressing full-length Myc-UGGT1/2, UGGT1/2-Flag, and UGGT1/2 (no tag), and their point mutant of them. However, no cell lines expressing nearly as much or more UGGT1/2 than endogenous ones were obtained. The expression level of UGGT1 seemed to be tightly regulated. A low-expressing stable cell line could not recover the phenotype of ATF6a degradation.
We also tried to measure the degradation rate of exogenously expressed ATF6a. But overexpressed ATF6a is partially transported to the Golgi and cleaved by proteases, which makes it difficult to evaluate only the effect of degradation.
(2) In reference to this statement on pg. 11:
"This can be explained by the rigid structure of ATF6(P) lacking structural flexibility to respond to ER stress because the remaining ATF6(P) in UGGT1-KO cells tends to have a more rigid structure that averts degradation, which is supported by its slightly weaker sensitivity to trypsin (Figure 4-figure supplement 1A). "
The rationale for testing ATF6(P) rigidity via trypsin digestion needs clarification. The authors should provide more background, especially if it relates to previous studies demonstrating UGGT's influence on substrate solubility. If trypsin digestion is indeed addressing this, it should be applied consistently to all tested misfolded glycoproteins, ensuring a comprehensive approach.
We now provide more background with three references about trypsin digestion. Trypsin digestion allows us to evaluate the structure of proteins originated from the same gene, but it can sometimes be difficult to comparatively evaluate the structure of proteins originated from different genes. For example, antitrypsin is resistant to trypsin by its nature, which does not necessarily mean that antitrypsin forms a more stable structure than other proteins. NHK, a truncated version of antitrypsin, is still resistant to trypsin compared with other substrates.
(3) Many of the figures described in the manuscript weren't referred to a specific panel. For example, pg. 12 "Fig. 1E and Fig.5," the exact panel for Fig. 5 wasn't referenced.
Thank you for this comment. Corrected.
(4) For experiments measuring the composition of glycoproteins in different KO lines, it is necessary to do the experiment more than once for conducting statistical analysis and comparisons. Moreover, the authors did not include raw composition data for these experiments. Statistical analysis should also be done for Fig. 4E-F.
Our N-glycan composition data (Figure 1-Figure supplement 5 and 6C) is consistent with previous our papers (George et al., 2021; George et al., 2020; Ninagawa et al., 2015; Ninagawa et al., 2014). We did it twice in the previous study and please refer to it regarding statistical analysis (George et al., 2020). We add the raw composition data of N-glycan (Figure 1-Figure supplement 4 and 6B). In Fig. 4D-F, now statistical analysis is included.
Ali, B.R., and M.C. Field. 2000. Glycopeptide export from mammalian microsomes is independent of calcium and is distinct from oligosaccharide export. Glycobiology. 10:383-391.
Asano, N. 2000. Glycosidase-Inhibiting Glycomimetic Alkaloids. Biological Activities and Therapeutic Perspectives. Journal of Synthetic Organic Chemistry, Japan. 58:666-675.
Cheatham, A.M., N.R. Sharma, and P. Satpute-Krishnan. 2023. Competition for calnexin binding regulates secretion and turnover of misfolded GPI-anchored proteins. J Cell Biol. 222.
George, G., S. Ninagawa, H. Yagi, J.I. Furukawa, N. Hashii, A. Ishii-Watabe, Y. Deng, K. Matsushita, T. Ishikawa, Y.P. Mamahit, Y. Maki, Y. Kajihara, K. Kato, T. Okada, and K. Mori. 2021. Purified EDEM3 or EDEM1 alone produces determinant oligosaccharide structures from M8B in mammalian glycoprotein ERAD. Elife. 10.
George, G., S. Ninagawa, H. Yagi, T. Saito, T. Ishikawa, T. Sakuma, T. Yamamoto, K. Imami, Y. Ishihama, K. Kato, T. Okada, and K. Mori. 2020. EDEM2 stably disulfide-bonded to TXNDC11 catalyzes the first mannose trimming step in mammalian glycoprotein ERAD. Elife. 9:e53455.
Gross, V., T. Andus, T.A. Tran-Thi, R.T. Schwarz, K. Decker, and P.C. Heinrich. 1983. 1-deoxynojirimycin impairs oligosaccharide processing of alpha 1-proteinase inhibitor and inhibits its secretion in primary cultures of rat hepatocytes. Journal of Biological Chemistry. 258:12203-12209.
Gross, V., T.A. Tran-Thi, R.T. Schwarz, A.D. Elbein, K. Decker, and P.C. Heinrich. 1986. Different effects of the glucosidase inhibitors 1-deoxynojirimycin, N-methyl-1-deoxynojirimycin and castanospermine on the glycosylation of rat alpha 1-proteinase inhibitor and alpha 1-acid glycoprotein. Biochem J. 236:853-860.
Hirao, K., Y. Natsuka, T. Tamura, I. Wada, D. Morito, S. Natsuka, P. Romero, B. Sleno, L.O. Tremblay, A. Herscovics, K. Nagata, and N. Hosokawa. 2006. EDEM3, a soluble EDEM homolog, enhances glycoprotein endoplasmic reticulum-associated degradation and mannose trimming. J Biol Chem. 281:9650-9658.
Hosokawa, N., I. Wada, K. Hasegawa, T. Yorihuzi, L.O. Tremblay, A. Herscovics, and K. Nagata. 2001. A novel ER alpha-mannosidase-like protein accelerates ER-associated degradation. EMBO reports. 2:415-422.
Hung, H.H., Y. Nagatsuka, T. Solda, V.K. Kodali, K. Iwabuchi, H. Kamiguchi, K. Kano, I. Matsuo, K. Ikeda, R.J. Kaufman, M. Molinari, P. Greimel, and Y. Hirabayashi. 2022. Selective involvement of UGGT variant: UGGT2 in protecting mouse embryonic fibroblasts from saturated lipid-induced ER stress. Proc Natl Acad Sci U S A. 119:e2214957119.
Karlsson, G.B., T.D. Butters, R.A. Dwek, and F.M. Platt. 1993. Effects of the imino sugar N-butyldeoxynojirimycin on the N-glycosylation of recombinant gp120. Journal of Biological Chemistry. 268:570-576.
Lomako, J., W.M. Lomako, C.A. Carothers Carraway, and K.L. Carraway. 2010. Regulation of the membrane mucin Muc4 in corneal epithelial cells by proteosomal degradation and TGF-beta. Journal of cellular physiology. 223:209-214.
Mast, S.W., K. Diekman, K. Karaveg, A. Davis, R.N. Sifers, and K.W. Moremen. 2005. Human EDEM2, a novel homolog of family 47 glycosidases, is involved in ER-associated degradation of glycoproteins. Glycobiology. 15:421-436.
Ninagawa, S., T. Okada, Y. Sumitomo, S. Horimoto, T. Sugimoto, T. Ishikawa, S. Takeda, T. Yamamoto, T. Suzuki, Y. Kamiya, K. Kato, and K. Mori. 2015. Forcible destruction of severely misfolded mammalian glycoproteins by the non-glycoprotein ERAD pathway. J Cell Biol. 211:775-784.
Ninagawa, S., T. Okada, Y. Sumitomo, Y. Kamiya, K. Kato, S. Horimoto, T. Ishikawa, S. Takeda, T. Sakuma, T. Yamamoto, and K. Mori. 2014. EDEM2 initiates mammalian glycoprotein ERAD by catalyzing the first mannose trimming step. J Cell Biol. 206:347-356.
Olivari, S., C. Galli, H. Alanen, L. Ruddock, and M. Molinari. 2005. A novel stress-induced EDEM variant regulating endoplasmic reticulum-associated glycoprotein degradation. J Biol Chem. 280:2424-2428.
Pearse, B.R., T. Tamura, J.C. Sunryd, G.A. Grabowski, R.J. Kaufman, and D.N. Hebert. 2010. The role of UDP-Glc:glycoprotein glucosyltransferase 1 in the maturation of an obligate substrate prosaposin. J Cell Biol. 189:829-841.
Romero, P.A., B. Saunier, and A. Herscovics. 1985. Comparison between 1-deoxynojirimycin and N-methyl-1-deoxynojirimycin as inhibitors of oligosaccharide processing in intestinal epithelial cells. Biochem J. 226:733-740.
Saunier, B., R.D. Kilker, J.S. Tkacz, A. Quaroni, and A. Herscovics. 1982. Inhibition of N-linked complex oligosaccharide formation by 1-deoxynojirimycin, an inhibitor of processing glucosidases. Journal of Biological Chemistry. 257:14155-14161.
Szumilo, T., G.P. Kaushal, and A.D. Elbein. 1987. Purification and properties of the glycoprotein processing N-acetylglucosaminyltransferase II from plants. Biochemistry. 26:5498-5505.
Tannous, A., N. Patel, T. Tamura, and D.N. Hebert. 2015. Reglucosylation by UDP-glucose:glycoprotein glucosyltransferase 1 delays glycoprotein secretion but not degradation. Molecular biology of the cell. 26:390-405.
Zeng, Y., Y.T. Pan, N. Asano, R.J. Nash, and A.D. Elbein. 1997. Homonojirimycin and N-methyl-homonojirimycin inhibit N-linked oligosaccharide processing. Glycobiology. 7:297-304.
Author response:
The following is the authors’ response to the original reviews.
Public Reviews:
Reviewer #1 (Public Review):
Summary:
In this manuscript, the authors investigate the contributions of the long noncoding RNA snhg3 in liver metabolism and MAFLD. The authors conclude that liver-specific loss or overexpression of Snhg3 impacts hepatic lipid content and obesity through epigenetic mechanisms. More specifically, the authors invoke that the nuclear activity of Snhg3 aggravates hepatic steatosis by altering the balance of activating and repressive chromatin marks at the Pparg gene locus. This regulatory circuit is dependent on a transcriptional regulator SND1.
Strengths:
The authors developed a tissue-specific lncRNA knockout and KI models. This effort is certainly appreciated as few lncRNA knockouts have been generated in the context of metabolism. Furthermore, lncRNA effects can be compensated in a whole organism or show subtle effects in acute versus chronic perturbation, rendering the focus on in vivo function important and highly relevant. In addition, Snhg3 was identified through a screening strategy and as a general rule the authors the authors attempt to follow unbiased approaches to decipher the mechanisms of Snhg3.
Weaknesses:
Despite efforts at generating a liver-specific knockout, the phenotypic characterization is not focused on the key readouts. Notably missing are rigorous lipid flux studies and targeted gene expression/protein measurement that would underpin why the loss of Snhg3 protects from lipid accumulation. Along those lines, claims linking the Snhg3 to MAFLD would be better supported with careful interrogation of markers of fibrosis and advanced liver disease. In other areas, significance is limited since the presented data is either not clear or rigorous enough. Finally, there is an important conceptual limitation to the work since PPARG is not established to play a major role in the liver.
We thank the reviewer for the detailed comment. In this study, hepatocyte-specific Snhg3 deficiency decreased body and liver weight and alleviated hepatic steatosis in DIO mice, whereas overexpression induced the opposite effect (Figure 2 and 3). Furthermore, we investigated the hepatic differentially expressed genes (DEGs) between the DIO Snhg3-HKI and control WT mice using RNA-Seq and revealed that Snhg3 exerts a global effect on the expression of genes involved in fatty acid metabolism using GSEA (Figure 4B). We validated the expression of some DEGs involved in fatty acid metabolism by RT-qPCR. The results showed that the hepatic expression levels of some genes involved in fatty acid metabolism, including Cd36, Cidea/c and Scd1/2 were upregulated in Snhg3-HKO mice and were downregulated in Snhg3-HKI mice compared to the controls (Figure 4C), respectively. Please check them in the first paragraph in p8.
As a transcription regulator of Cd36 and Cidea/c, it is well known that PPARγ plays major adipogenic and lipogenic roles in adipose tissue. Although the expression of PPARγ in the liver is very low under healthy conditions, induced expression of PPARγ in both hepatocytes and non-parenchymal cells (Kupffer cells, immune cells, and HSCs) in the liver has a crucial role in the pathophysiology of MASLD (Lee et al., 2023b, Chen et al., 2023, Gross et al., 2017). The activation of PPARγ in the liver induces the adipogenic program to store fatty acids in lipid droplets as observed in adipocytes (Lee et al., 2018). Moreover, the inactivation of liver PPARγ abolished rosiglitazone-induced an increase in hepatic TG and improved hepatic steatosis in lipoatrophic AZIP mice (Gavrilova et al., 2003). Furthermore, there is a strong correlation between the onset of hepatic steatosis and hepatocyte-specific PPARγ expression. Clinical trials have also indicated that increased insulin resistance and hepatic PPARγ expressions were associated with NASH scores in some obese patients (Lee et al., 2023a, Mukherjee et al., 2022). Even though PPARγ’s primary function is in adipose tissue, patients with MASLD have much higher hepatic expression levels of PPARγ, reflecting the fact that PPARγ plays different roles in different tissues and cell types (Mukherjee et al., 2022). As these studies mentioned above, our result also hinted at the importance of PPARγ in the pathophysiology of MASLD. Snhg3 deficiency or overexpression respectively induced the decrease or increase in hepatic PPARγ. Moreover, administration of PPARγ antagonist T0070907 mitigated the hepatic Cd36 and Cidea/c increase and improved Snhg3-induced hepatic steatosis. However, conflicting findings suggest that the expression of hepatic PPARγ is not increased as steatosis develops in humans and in clinical studies and that PPARγ agonists administration didn’t aggravate liver steatosis (Gross et al., 2017). Thus, understanding how the hepatic PPARγ expression is regulated may provide a new avenue to prevent and treat the MASLD (Lee et al., 2018). We also discussed it in revised manuscript, please refer the first paragraph in the section of Discussion in p13.
Hepatotoxicity accelerates the development of progressive inflammation, oxidative stress and fibrosis (Roehlen et al., 2020). Chronic liver injury including MASLD can progress to liver fibrosis with the formation of a fibrous scar. Injured hepatocytes can secrete fibrogenic factors or exosomes containing miRNAs that activate HSCs, the major source of the fibrous scar in liver fibrosis (Kisseleva and Brenner, 2021). Apart from promoting lipogenesis, PPARγ has also a crucial function in improving inflammation and fibrosis (Chen et al., 2023). In this study, no hepatic fibrosis phenotype was seen in Snhg3-HKO and Snhg3-HKI mice (figures supplement 1D and 2D). Moreover, deficiency and overexpression of Snhg3 respectively decreased and increased the expression of profibrotic genes, such as collagen type I alpha 1/2 (Col1a1 and Col1a2), but had no effects on the pro-inflammatory factors, including transforming growth factor β1 (Tgfβ1), tumor necrosis factor α (Tnfα), interleukin 6 and 1β (Il6 and Il1β) (figures supplement 3A and B). Inflammation is an absolute requirement for fibrosis because factors from injured hepatocytes alone are not sufficient to directly activate HSCs and lead to fibrosis (Kisseleva and Brenner, 2021). Additionally, previous studies indicated that exposure to HFD for more 24 weeks causes less severe fibrosis (Alshawsh et al., 2022). In future, the effect of Snhg3 on hepatic fibrosis in mice need to be elucidated by prolonged high-fat feeding or by adopting methionine- and choline deficient diet (MCD) feeding. Please check them in the second paragraph in the section of Discussion in p13.
References
ALSHAWSH, M. A., ALSALAHI, A., ALSHEHADE, S. A., SAGHIR, S. A. M., AHMEDA, A. F., AL ZARZOUR, R. H. & MAHMOUD, A. M. 2022. A Comparison of the Gene Expression Profiles of Non-Alcoholic Fatty Liver Disease between Animal Models of a High-Fat Diet and Methionine-Choline-Deficient Diet. Molecules, 27. DIO:10.3390/molecules27030858, PMID:35164140
CHEN, H., TAN, H., WAN, J., ZENG, Y., WANG, J., WANG, H. & LU, X. 2023. PPAR-gamma signaling in nonalcoholic fatty liver disease: Pathogenesis and therapeutic targets. Pharmacol Ther, 245, 108391. DIO:10.1016/j.pharmthera.2023.108391, PMID:36963510
GAVRILOVA, O., HALUZIK, M., MATSUSUE, K., CUTSON, J. J., JOHNSON, L., DIETZ, K. R., NICOL, C. J., VINSON, C., GONZALEZ, F. J. & REITMAN, M. L. 2003. Liver peroxisome proliferator-activated receptor gamma contributes to hepatic steatosis, triglyceride clearance, and regulation of body fat mass. J Biol Chem, 278, 34268-76. DIO:10.1074/jbc.M300043200, PMID:12805374
GROSS, B., PAWLAK, M., LEFEBVRE, P. & STAELS, B. 2017. PPARs in obesity-induced T2DM, dyslipidaemia and NAFLD. Nat Rev Endocrinol, 13, 36-49. DIO:10.1038/nrendo.2016.135, PMID:27636730
KISSELEVA, T. & BRENNER, D. 2021. Molecular and cellular mechanisms of liver fibrosis and its regression. Nat Rev Gastroenterol Hepatol, 18, 151-166. DIO:10.1038/s41575-020-00372-7, PMID:33128017
LEE, S. M., MURATALLA, J., KARIMI, S., DIAZ-RUIZ, A., FRUTOS, M. D., GUZMAN, G., RAMOS-MOLINA, B. & CORDOBA-CHACON, J. 2023a. Hepatocyte PPARgamma contributes to the progression of non-alcoholic steatohepatitis in male and female obese mice. Cell Mol Life Sci, 80, 39. DIO:10.1007/s00018-022-04629-z, PMID:36629912
LEE, S. M., MURATALLA, J., SIERRA-CRUZ, M. & CORDOBA-CHACON, J. 2023b. Role of hepatic peroxisome proliferator-activated receptor gamma in non-alcoholic fatty liver disease. J Endocrinol, 257. DIO:10.1530/JOE-22-0155, PMID:36688873
LEE, Y. K., PARK, J. E., LEE, M. & HARDWICK, J. P. 2018. Hepatic lipid homeostasis by peroxisome proliferator-activated receptor gamma 2. Liver Res, 2, 209-215. DIO:10.1016/j.livres.2018.12.001, PMID:31245168
MUKHERJEE, A. G., WANJARI, U. R., GOPALAKRISHNAN, A. V., KATTURAJAN, R., KANNAMPUZHA, S., MURALI, R., NAMACHIVAYAM, A., GANESAN, R., RENU, K., DEY, A., VELLINGIRI, B. & PRINCE, S. E. 2022. Exploring the Regulatory Role of ncRNA in NAFLD: A Particular Focus on PPARs. Cells, 11. DIO:10.3390/cells11243959, PMID:36552725
ROEHLEN, N., CROUCHET, E. & BAUMERT, T. F. 2020. Liver Fibrosis: Mechanistic Concepts and Therapeutic Perspectives. Cells, 9. DIO:10.3390/cells9040875, PMID:32260126
Reviewer #2 (Public Review):
Through RNA analysis, Xie et al found LncRNA Snhg3 was one of the most down-regulated Snhgs by a high-fat diet (HFD) in mouse liver. Consequently, the authors sought to examine the mechanism through which Snhg3 is involved in the progression of metabolic dysfunction-associated fatty liver diseases (MASLD) in HFD-induced obese (DIO) mice. Interestingly, liver-specific Snhg3 knockout was reduced, while Snhg3 over-expression potentiated fatty liver in mice on an HFD. Using the RNA pull-down approach, the authors identified SND1 as a potential Sngh3 interacting protein. SND1 is a component of the RNA-induced silencing complex (RISC). The authors found that Sngh3 increased SND1 ubiquitination to enhance SND1 protein stability, which then reduced the level of repressive chromatin H3K27me3 on PPARg promoter. The upregulation of PPARg, a lipogenic transcription factor, thus contributed to hepatic fat accumulation.
The authors propose a signaling cascade that explains how LncRNA sngh3 may promote hepatic steatosis. Multiple molecular approaches have been employed to identify molecular targets of the proposed mechanism, which is a strength of the study. There are, however, several potential issues to consider before jumping to a conclusion.
(1) First of all, it's important to ensure the robustness and rigor of each study. The manuscript was not carefully put together. The image qualities for several figures were poor, making it difficult for the readers to evaluate the results with confidence. The biological replicates and numbers of experimental repeats for cell-based assays were not described. When possible, the entire immunoblot imaging used for quantification should be presented (rather than showing n=1 representative). There were multiple mislabels in figure panels or figure legends (e.g., Figure 2I, Figure 2K, and Figure 3K). The b-actin immunoblot image was reused in Figure 4J, Figure 5G, and Figure 7B with different exposure times. These might be from the same cohort of mice. If the immunoblots were run at different times, the loading control should be included on the same blot as well.
We thank the reviewer for the detailed comment. We have provided the clear figures in revised manuscript, please check them.
The biological replicates and numbers of experimental repeats for cell-based assays had been updated and please check them in the manuscript.
The entire immunoblot imaging used for quantification had been provided in the primary data. Please check them.
The original Figure 2I, Figure 2K, Figure 3K have been revised and replaced with new Figure 2F, Figure 2H, Figure 3H, and their corresponding figure legends has also been corrected in revised manuscript.
The protein levels of CD36, PPARγ and β-ACTIN were examined at the same time and we had revised the manuscript, please check them in revised Figure 7B and 7C.
(2) The authors can do a better job in explaining the logic for how they came up with the potential function of each component of the signaling cascade. Snhg3 is down-regulated by HFD. However, the evidence presented indicates its involvement in promoting steatosis. In Figure 1C, one would expect PPARg expression to be up-regulated (when Sngh3 was down-regulated). If so, the physiological observation conflicts with the proposed mechanism. In addition, SND1 is known to regulate RNA/miRNA processing. How do the authors rule out this potential mechanism? How about the hosting snoRNA, Snord17? Does it involve the progression of NASLD?
We thank the reviewer for the detailed comment. Our results showed that the expression of Snhg3 was decreased in DIO mice which led us to speculate that the downregulation of Snhg3 in DIO mice might be a stress protective reaction to high nutritional state, but the specific details need to be clarified. This is probably similar to fibroblast growth factor 21 (FGF21) and growth differentiation factor 15 (GDF15), whose endogenous expression and circulating levels are elevated in obese humans and mice despite their beneficial effects on obesity and related metabolic complications (Keipert and Ost, 2021). Although FGF21 can be induced by oxidative stress and be activated in obese mice and in NASH patients, elevated FGF21 paradoxically protects against oxidative stress and reduces hepatic steatosis (Tillman and Rolph, 2020). We had added the content the section of Discussion, please check it in the second paragraph in p12.
SND1 has multiple roles through associating with different types of RNA molecules, including mRNA, miRNA, circRNA, dsRNA and lncRNA. SND1 could bind negative-sense SARS-CoV-2 RNA and promoted viral RNA synthesis, and to promote viral RNA synthesis (Schmidt et al., 2023). SND1 is also involved in hypoxia by negatively regulating hypoxia‐related miRNAs (Saarikettu et al., 2023). Furthermore, a recent study revealed that lncRNA SNAI3-AS1 can competitively bind to SND1 and perturb the m6A-dependent recognition of Nrf2 mRNA 3'UTR by SND1, thereby reducing the mRNA stability of Nrf2 (Zheng et al., 2023). Huang et al. also reported that circMETTL9 can directly bind to and increase the expression of SND1 in astrocytes, leading to enhanced neuroinflammation (Huang et al., 2023). However, whether there is an independent-histone methylation role of SND1/lncRNA-Snhg3 involved in lipid metabolism in the liver needs to be further investigated. We also discussed the limitation in the manuscript and please refer the section of Discussion in the third paragraph in p17.
Snhg3 serves as host gene for producing intronic U17 snoRNAs, the H/ACA snoRNA. A previous study found that cholesterol trafficking phenotype was not due to reduced Snhg3 expression, but rather to haploinsufficiency of U17 snoRNA. Upregulation of hypoxia-upregulated mitochondrial movement regulator (HUMMR) in U17 snoRNA-deficient cells promoted the formation of ER-mitochondrial contacts, resulting in decreasing cholesterol esterification and facilitating cholesterol trafficking to mitochondria (Jinn et al., 2015). Additionally, disruption of U17 snoRNA caused resistance to lipid-induced cell death and general oxidative stress in cultured cells. Furthermore, knockdown of U17 snoRNA in vivo protected against hepatic steatosis and lipid-induced oxidative stress and inflammation (Sletten et al., 2021). We determined the expression of hepatic U17 snoRNA and its effect on SND1 and PPARγ. The results showed that the expression of U17 snoRNA decreased in the liver of DIO Snhg3-HKO mice and unchanged in the liver of DIO Snhg3-HKI mice, but overexpression of U17 snoRNA had no effect on the expression of SND1 and PPARγ (figure supplement 5A-C), indicating that Sngh3 induced hepatic steatosis was independent on U17 snoRNA. We also discussed it in revised manuscript, please refer the section of Discussion in p15.
References
HUANG, C., SUN, L., XIAO, C., YOU, W., SUN, L., WANG, S., ZHANG, Z. & LIU, S. 2023. Circular RNA METTL9 contributes to neuroinflammation following traumatic brain injury by complexing with astrocytic SND1. J Neuroinflammation, 20, 39. DIO:10.1186/s12974-023-02716-x, PMID:36803376
JINN, S., BRANDIS, K. A., REN, A., CHACKO, A., DUDLEY-RUCKER, N., GALE, S. E., SIDHU, R., FUJIWARA, H., JIANG, H., OLSEN, B. N., SCHAFFER, J. E. & ORY, D. S. 2015. snoRNA U17 regulates cellular cholesterol trafficking. Cell Metab, 21, 855-67. DIO:10.1016/j.cmet.2015.04.010, PMID:25980348
KEIPERT, S. & OST, M. 2021. Stress-induced FGF21 and GDF15 in obesity and obesity resistance. Trends Endocrinol Metab, 32, 904-915. DIO:10.1016/j.tem.2021.08.008, PMID:34526227
SAARIKETTU, J., LEHMUSVAARA, S., PESU, M., JUNTTILA, I., PARTANEN, J., SIPILA, P., POUTANEN, M., YANG, J., HAIKARAINEN, T. & SILVENNOINEN, O. 2023. The RNA-binding protein Snd1/Tudor-SN regulates hypoxia-responsive gene expression. FASEB Bioadv, 5, 183-198. DIO:10.1096/fba.2022-00115, PMID:37151849
SCHMIDT, N., GANSKIH, S., WEI, Y., GABEL, A., ZIELINSKI, S., KESHISHIAN, H., LAREAU, C. A., ZIMMERMANN, L., MAKROCZYOVA, J., PEARCE, C., KREY, K., HENNIG, T., STEGMAIER, S., MOYON, L., HORLACHER, M., WERNER, S., AYDIN, J., OLGUIN-NAVA, M., POTABATTULA, R., KIBE, A., DOLKEN, L., SMYTH, R. P., CALISKAN, N., MARSICO, A., KREMPL, C., BODEM, J., PICHLMAIR, A., CARR, S. A., CHLANDA, P., ERHARD, F. & MUNSCHAUER, M. 2023. SND1 binds SARS-CoV-2 negative-sense RNA and promotes viral RNA synthesis through NSP9. Cell, 186, 4834-4850 e23. DIO:10.1016/j.cell.2023.09.002, PMID:37794589
SLETTEN, A. C., DAVIDSON, J. W., YAGABASAN, B., MOORES, S., SCHWAIGER-HABER, M., FUJIWARA, H., GALE, S., JIANG, X., SIDHU, R., GELMAN, S. J., ZHAO, S., PATTI, G. J., ORY, D. S. & SCHAFFER, J. E. 2021. Loss of SNORA73 reprograms cellular metabolism and protects against steatohepatitis. Nat Commun, 12, 5214. DIO:10.1038/s41467-021-25457-y, PMID:34471131
TILLMAN, E. J. & ROLPH, T. 2020. FGF21: An Emerging Therapeutic Target for Non-Alcoholic Steatohepatitis and Related Metabolic Diseases. Front Endocrinol (Lausanne), 11, 601290. DIO:10.3389/fendo.2020.601290, PMID:33381084
ZHENG, J., ZHANG, Q., ZHAO, Z., QIU, Y., ZHOU, Y., WU, Z., JIANG, C., WANG, X. & JIANG, X. 2023. Epigenetically silenced lncRNA SNAI3-AS1 promotes ferroptosis in glioma via perturbing the m(6)A-dependent recognition of Nrf2 mRNA mediated by SND1. J Exp Clin Cancer Res, 42, 127. DIO:10.1186/s13046-023-02684-3, PMID:37202791
(3) The role of PPARg in fatty liver diseases might be a rodent-specific phenomenon. PPARg agonist treatment in humans may actually reduce ectopic fat deposition by increasing fat storage in adipose tissues. The relevance of the findings to human diseases should be discussed.
We thank the reviewer for the detailed comment. As a transcription regulator of Cd36 and Cidea/c, it is well known that PPARγ plays major adipogenic and lipogenic roles in adipose tissue. Although the expression of PPARγ in the liver is very low under healthy conditions, induced expression of PPARγ in both hepatocytes and non-parenchymal cells (Kupffer cells, immune cells, and hepatic stellate cells (HSCs)) in the liver has a crucial role in the pathophysiology of MASLD (Lee et al., 2023b, Chen et al., 2023, Gross et al., 2017). The activation of PPARγ in the liver induces the adipogenic program to store fatty acids in lipid droplets as observed in adipocytes (Lee et al., 2018). Moreover, the inactivation of liver PPARγ abolished rosiglitazone-induced an increase in hepatic TG and improved hepatic steatosis in lipoatrophic AZIP mice (Gavrilova et al., 2003). Apart from promoting lipogenesis, PPARγ has also a crucial function in improving inflammation and fibrosis (Chen et al., 2023). Furthermore, there is a strong correlation between the onset of hepatic steatosis and hepatocyte-specific PPARγ expression. Clinical trials have also indicated that increased insulin resistance and hepatic PPARγ expressions were associated with NASH scores in some obese patients (Lee et al., 2023a, Mukherjee et al., 2022). Even though PPARγ’s primary function is in adipose tissue, patients with MASLD have much higher hepatic expression levels of PPARγ, reflecting the fact that PPARγ plays different roles in different tissues and cell types (Mukherjee et al., 2022). As these studies mentioned above, our result also hinted at the importance of PPARγ in the pathophysiology of MASLD. Snhg3 deficiency or overexpression respectively induced the decrease or increase in hepatic PPARγ. Moreover, administration of PPARγ antagonist T0070907 mitigated the hepatic Cd36 and Cidea/c increase and improved Snhg3-induced hepatic steatosis. However, conflicting findings suggest that the expression of hepatic PPARγ is not increased as steatosis develops in humans and in clinical studies and that PPARγ agonists administration didn’t aggravate liver steatosis (Gross et al., 2017). Thus, understanding how the hepatic PPARγ expression is regulated may provide a new avenue to prevent and treat the MASLD (Lee et al., 2018). We also discussed it in revised manuscript, please refer the first paragraph in the section of Discussion in p13.
References
CHEN, H., TAN, H., WAN, J., ZENG, Y., WANG, J., WANG, H. & LU, X. 2023. PPAR-gamma signaling in nonalcoholic fatty liver disease: Pathogenesis and therapeutic targets. Pharmacol Ther, 245, 108391. DIO:10.1016/j.pharmthera.2023.108391, PMID:36963510
GAVRILOVA, O., HALUZIK, M., MATSUSUE, K., CUTSON, J. J., JOHNSON, L., DIETZ, K. R., NICOL, C. J., VINSON, C., GONZALEZ, F. J. & REITMAN, M. L. 2003. Liver peroxisome proliferator-activated receptor gamma contributes to hepatic steatosis, triglyceride clearance, and regulation of body fat mass. J Biol Chem, 278, 34268-76. DIO:10.1074/jbc.M300043200, PMID:12805374
GROSS, B., PAWLAK, M., LEFEBVRE, P. & STAELS, B. 2017. PPARs in obesity-induced T2DM, dyslipidaemia and NAFLD. Nat Rev Endocrinol, 13, 36-49. DIO:10.1038/nrendo.2016.135, PMID:27636730
LEE, S. M., MURATALLA, J., KARIMI, S., DIAZ-RUIZ, A., FRUTOS, M. D., GUZMAN, G., RAMOS-MOLINA, B. & CORDOBA-CHACON, J. 2023a. Hepatocyte PPARgamma contributes to the progression of non-alcoholic steatohepatitis in male and female obese mice. Cell Mol Life Sci, 80, 39. DIO:10.1007/s00018-022-04629-z, PMID:36629912
LEE, S. M., MURATALLA, J., SIERRA-CRUZ, M. & CORDOBA-CHACON, J. 2023b. Role of hepatic peroxisome proliferator-activated receptor gamma in non-alcoholic fatty liver disease. J Endocrinol, 257. DIO:10.1530/JOE-22-0155, PMID:36688873
LEE, Y. K., PARK, J. E., LEE, M. & HARDWICK, J. P. 2018. Hepatic lipid homeostasis by peroxisome proliferator-activated receptor gamma 2. Liver Res, 2, 209-215. DIO:10.1016/j.livres.2018.12.001, PMID:31245168
MUKHERJEE, A. G., WANJARI, U. R., GOPALAKRISHNAN, A. V., KATTURAJAN, R., KANNAMPUZHA, S., MURALI, R., NAMACHIVAYAM, A., GANESAN, R., RENU, K., DEY, A., VELLINGIRI, B. & PRINCE, S. E. 2022. Exploring the Regulatory Role of ncRNA in NAFLD: A Particular Focus on PPARs. Cells, 11. DIO:10.3390/cells11243959, PMID:36552725
Recommendations for the authors:
Reviewer #1 (Recommendations For The Authors):
As a general strategy for the revision, I would advise the authors to focus on strengthening the analysis of the liver with the two most important figures being Figure 2 and Figure 3. The mechanism as it stands is problematic which reduces the impact of the animal studies despite substantial efforts from the authors. Consider removing or toning down some of the studies focused on mechanisms in the nucleus, including changing the title.
We thank the reviewer for the detailed comment. In this study, hepatocyte-specific Snhg3 deficiency decreased body and liver weight, alleviated hepatic steatosis and promoted hepatic fatty acid metabolism in DIO mice, whereas overexpression induced the opposite effect. The hepatic differentially expressed genes (DEGs) between the DIO Snhg3-HKI and control WT mice using RNA-Seq and revealed that Snhg3 exerts a global effect on the expression of genes involved in fatty acid metabolism using GSEA (Figure 4B). RT-qPCR analysis confirmed that the hepatic expression levels of some genes involved in fatty acid metabolism, including Cd36, Cidea/c and Scd1/2, were upregulated in Snhg3-HKO mice and were downregulated in Snhg3-HKI mice compared to the controls (Figure 4C). Moreover, deficiency and overexpression of Snhg3 respectively decreased and increased the expression of profibrotic genes, such as Col1a1 and Col1a2, but had no effects on the pro-inflammatory factors, including Tgfβ1, Tnfα, Il6 and Il1β (figure supplement 3A and B). The results indicated that Snhg3 involved in hepatic steatosis through regulating fatty acid metabolism. Furthermore, PPARγ was selected to study its role in Snhg3-induced hepatic steatosis by integrated analyzing the data from CUT&Tag-Seq, ATAC-Seq and RNA-Seq. Finally, inhibition of PPARγ with T0070907 alleviated Snhg3 induced Cd36 and Cidea/c increases and improved Snhg3-aggravated hepatic steatosis. In summary, we confirmed that SND1/H3K27me3/PPARγ is partially responsible for Sngh3-inuced hepatic steatosis. As the reviewer suggested, we replaced the title with “LncRNA-Snhg3 Aggravates Hepatic Steatosis via PPARγ Signaling”.
(1) How is steatosis changing in the liver? Is this due to a change in fatty acid uptake, lipogenesis/synthesis, beta-oxidation, trig secretion, etc..? The analysis in Figures 2 and 3 is mostly focused on metabolic chamber studies which seem distracting, particularly in the absence of a mechanism and given a liver-specific perturbation. The authors should use a combination of targeted gene expression, protein blots, and lipid flux measurements to provide better insights here. The histology in Figure 2H suggests a very dramatic effect but does match with lipid measurements in 2I.
We thank the reviewer for the detailed comment. The pathogenesis of MASLD has not been entirely elucidated. Multifarious factors such as genetic and epigenetic factors, nutritional factors, insulin resistance, lipotoxicity, microbiome, fibrogenesis and hormones secreted from the adipose tissue, are recognized to be involved in the development and progression of MASLD (Buzzetti et al., 2016, Lee et al., 2017, Rada et al., 2020, Sakurai et al., 2021, Friedman et al., 2018). In this study, we investigated the hepatic differentially expressed genes (DEGs) between the DIO Snhg3-HKI and control WT mice using RNA-Seq and revealed that Snhg3 exerts a global effect on the expression of genes involved in fatty acid metabolism using GSEA (Figure 4B). We validated the expression of some DEGs involved in fatty acid metabolism by RT-qPCR. The results showed that the hepatic expression levels of some genes involved in fatty acid metabolism, including Cd36, Cidea/c and Scd1/2 were upregulated in Snhg3-HKO mice and were downregulated in Snhg3-HKI mice compared to the controls (Figure 4C), respectively. Additionally, we re-analyzed the metabolic chamber data using CalR and the results showed that there were no obvious differences in heat production, total oxygen consumption, carbon dioxide production or RER between DIO Snhg3-HKO or DIO Snhg3-HKI and the corresponding control mice (figure supplement 1C and 2C). Unfortunately, we did not detect lipid flux due to limited experimental conditions. However, in summary, our results indicated that Snhg3 is involved in hepatic steatosis by regulating fatty acid metabolism. Please check them in the first paragraph in p8.
Additionally, we determined the hepatic TC levels in other batch of DIO Snhg3-HKO and control mice and found there was no difference in hepatic TC (as below) between DIO Snhg3-HKO and control mice fed HFD 18 weeks. Perhaps the apparent difference in TC requires a prolonged high-fat diet feeding time.
Author response image 1.
Hepatic TC contents of in DIO Snhg3-Flox and Snhg3-HKO mice.
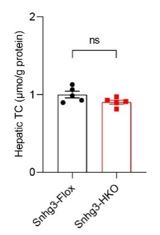
References
BUZZETTI, E., PINZANI, M. & TSOCHATZIS, E. A. 2016. The multiple-hit pathogenesis of non-alcoholic fatty liver disease (NAFLD). Metabolism, 65, 1038-48. DIO:10.1016/j.metabol.2015.12.012, PMID:26823198
FRIEDMAN, S. L., NEUSCHWANDER-TETRI, B. A., RINELLA, M. & SANYAL, A. J. 2018. Mechanisms of NAFLD development and therapeutic strategies. Nat Med, 24, 908-922. DIO:10.1038/s41591-018-0104-9, PMID:29967350
LEE, J., KIM, Y., FRISO, S. & CHOI, S. W. 2017. Epigenetics in non-alcoholic fatty liver disease. Mol Aspects Med, 54, 78-88. DIO:10.1016/j.mam.2016.11.008, PMID:27889327
RADA, P., GONZALEZ-RODRIGUEZ, A., GARCIA-MONZON, C. & VALVERDE, A. M. 2020. Understanding lipotoxicity in NAFLD pathogenesis: is CD36 a key driver? Cell Death Dis, 11, 802. DIO:10.1038/s41419-020-03003-w, PMID:32978374
SAKURAI, Y., KUBOTA, N., YAMAUCHI, T. & KADOWAKI, T. 2021. Role of Insulin Resistance in MAFLD. Int J Mol Sci, 22. DIO:10.3390/ijms22084156, PMID:33923817
(2) Throughout the manuscript the authors make claims about liver disease models, but this is not well supported since markers of advanced liver disease are not examined. The authors should stain and show expression for fibrosis and inflammation.
We thank the reviewer for the detailed comment. Metabolic dysfunction-associated fatty liver disease (MASLD) is characterized by excess liver fat in the absence of significant alcohol consumption. It can progress from simple steatosis to metabolic dysfunction-associated steatohepatitis (MASH) and fibrosis and eventually to chronic progressive diseases such as cirrhosis, end-stage liver failure, and hepatocellular carcinoma (Loomba et al., 2021). As the reviewer suggested, we detected the effect of Snhg3 on liver fibrosis and inflammation. The results showed no hepatic fibrosis phenotype was seen in Snhg3-HKO and Snhg3-HKI mice (figures supplement 1D and 2D). Moreover, deficiency and overexpression of Snhg3 respectively decreased and increased the expression of profibrotic genes, such as collagen type I alpha 1/2 (Col1a1 and Col1a2), but had no effects on the pro-inflammatory factors including Tgf-β, Tnf-α, Il-6 and Il-1β (figure supplement 3A and 3B). Inflammation is an absolute requirement for fibrosis because factors from injured hepatocytes alone are not sufficient to directly activate HSCs and lead to fibrosis (Kisseleva and Brenner, 2021). Additionally, previous studies indicated that exposure to HFD for more 24 weeks causes less severe fibrosis (Alshawsh et al., 2022). In future, the effect of Snhg3 on hepatic fibrosis in mice need to be elucidated by prolonged high-fat feeding or by adopting methionine- and choline deficient diet (MCD) feeding. Please check them in the second paragraph in the section of Discussion in p13.
References
ALSHAWSH, M. A., ALSALAHI, A., ALSHEHADE, S. A., SAGHIR, S. A. M., AHMEDA, A. F., AL ZARZOUR, R. H. & MAHMOUD, A. M. 2022. A Comparison of the Gene Expression Profiles of Non-Alcoholic Fatty Liver Disease between Animal Models of a High-Fat Diet and Methionine-Choline-Deficient Diet. Molecules, 27. DIO:10.3390/molecules27030858, PMID:35164140
KISSELEVA, T. & BRENNER, D. 2021. Molecular and cellular mechanisms of liver fibrosis and its regression. Nat Rev Gastroenterol Hepatol, 18, 151-166. DIO:10.1038/s41575-020-00372-7, PMID:33128017
LOOMBA, R., FRIEDMAN, S. L. & SHULMAN, G. I. 2021. Mechanisms and disease consequences of nonalcoholic fatty liver disease. Cell, 184, 2537-2564. DIO:10.1016/j.cell.2021.04.015, PMID:33989548
(3) Publicly available datasets show that PPARG protein is not expressed in the liver (Science 2015 347(6220):1260419, PMID: 25613900). Are the authors sure this is not an effect on another PPAR isoform like alpha? ChIP and RNA-seq pathway readouts do not distinguish between different isoforms.
We thank the reviewer for the detailed comment. As a transcription regulator of Cd36 and Cidea/c, it is well known that PPARγ plays major adipogenic and lipogenic roles in adipose tissue. Although the expression of PPARγ in the liver is very low under healthy conditions, induced expression of PPARγ in both hepatocytes and non-parenchymal cells (Kupffer cells, immune cells, and hepatic stellate cells (HSCs)) in the liver has a crucial role in the pathophysiology of MASLD (Lee et al., 2023b, Chen et al., 2023, Gross et al., 2017). The activation of PPARγ in the liver induces the adipogenic program to store fatty acids in lipid droplets as observed in adipocytes (Lee et al., 2018). Moreover, the inactivation of liver PPARγ abolished rosiglitazone-induced an increase in hepatic TG and improved hepatic steatosis in lipoatrophic AZIP mice (Gavrilova et al., 2003). Apart from promoting lipogenesis, PPARγ has also a crucial function in improving inflammation and fibrosis (Chen et al., 2023). Furthermore, there is a strong correlation between the onset of hepatic steatosis and hepatocyte-specific PPARγ expression. Clinical trials have also indicated that increased insulin resistance and hepatic PPARγ expressions were associated with NASH scores in some obese patients (Lee et al., 2023a, Mukherjee et al., 2022). Even though PPARγ’s primary function is in adipose tissue, patients with MASLD have much higher hepatic expression levels of PPARγ, reflecting the fact that PPARγ plays different roles in different tissues and cell types (Mukherjee et al., 2022). As these studies mentioned above, our result also hinted at the importance of PPARγ in the pathophysiology of MASLD. Snhg3 deficiency or overexpression respectively induced the decrease or increase in hepatic PPARγ. Moreover, administration of PPARγ antagonist T0070907 mitigated the hepatic Cd36 and Cidea/c increase and improved Snhg3-induced hepatic steatosis. However, conflicting findings suggest that the expression of hepatic PPARγ is not increased as steatosis develops in humans and in clinical studies and that PPARγ agonists administration didn’t aggravate liver steatosis (Gross et al., 2017). Thus, understanding how the hepatic PPARγ expression is regulated may provide a new avenue to prevent and treat the MASLD (Lee et al., 2018). We also discussed it in revised manuscript, please refer the first paragraph in the section of Discussion in p13 in revised manuscript.
PPARα, most highly expressed in the liver, transcriptionally regulates lipid catabolism by regulating the expression of genes mediating triglyceride hydrolysis, fatty acid transport, and β-oxidation. Activators of PPARα decrease plasma triglycerides by inhibiting its synthesis and accelerating its hydrolysis (Chen et al., 2023). Mice with deletion of the Pparα gene exhibited more hepatic steatosis under HFD induction. As the reviewer suggested, we investigated the effect of Snhg3 on Pparα expression. The result showed that both deficiency of Snhg3 or overexpression of Snhg3 doesn’t affect the mRNA level of Pparα as showing below, indicating that Snhg3-induced lipid accumulation independent on PPARα. Additionally, the exon, upstream 2k, 5’-UTR and intron regions of Pparγ, not Pparα, were enriched with the H3K27me3 mark (fold_enrichment = 4.15697) in the liver of DIO Snhg3-HKO mice using the CUT&Tag assay (table supplement 8), which was further confirmed by ChIP (Figure 6F and G). Therefore, we choose PPARγ to study its role in Sngh3-induced hepatic steatosis by integrated analyzing the data from CUT&Tag-Seq, ATAC-Seq and RNA-Seq.
Author response image 2.
The mRNA levels of hepatic Pparα expression in DIO Snhg3-HKO mice and Snhg3-HKI mice compared to the controls.
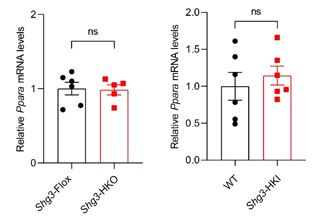
References
CHEN, H., TAN, H., WAN, J., ZENG, Y., WANG, J., WANG, H. & LU, X. 2023. PPAR-gamma signaling in nonalcoholic fatty liver disease: Pathogenesis and therapeutic targets. Pharmacol Ther, 245, 108391. DIO:10.1016/j.pharmthera.2023.108391, PMID:36963510
GAVRILOVA, O., HALUZIK, M., MATSUSUE, K., CUTSON, J. J., JOHNSON, L., DIETZ, K. R., NICOL, C. J., VINSON, C., GONZALEZ, F. J. & REITMAN, M. L. 2003. Liver peroxisome proliferator-activated receptor gamma contributes to hepatic steatosis, triglyceride clearance, and regulation of body fat mass. J Biol Chem, 278, 34268-76. DIO:10.1074/jbc.M300043200, PMID:12805374
GROSS, B., PAWLAK, M., LEFEBVRE, P. & STAELS, B. 2017. PPARs in obesity-induced T2DM, dyslipidaemia and NAFLD. Nat Rev Endocrinol, 13, 36-49. DIO:10.1038/nrendo.2016.135, PMID:27636730
LEE, S. M., MURATALLA, J., KARIMI, S., DIAZ-RUIZ, A., FRUTOS, M. D., GUZMAN, G., RAMOS-MOLINA, B. & CORDOBA-CHACON, J. 2023a. Hepatocyte PPARgamma contributes to the progression of non-alcoholic steatohepatitis in male and female obese mice. Cell Mol Life Sci, 80, 39. DIO:10.1007/s00018-022-04629-z, PMID:36629912
LEE, S. M., MURATALLA, J., SIERRA-CRUZ, M. & CORDOBA-CHACON, J. 2023b. Role of hepatic peroxisome proliferator-activated receptor gamma in non-alcoholic fatty liver disease. J Endocrinol, 257. DIO:10.1530/JOE-22-0155, PMID:36688873
LEE, Y. K., PARK, J. E., LEE, M. & HARDWICK, J. P. 2018. Hepatic lipid homeostasis by peroxisome proliferator-activated receptor gamma 2. Liver Res, 2, 209-215. DIO:10.1016/j.livres.2018.12.001, PMID:31245168
MUKHERJEE, A. G., WANJARI, U. R., GOPALAKRISHNAN, A. V., KATTURAJAN, R., KANNAMPUZHA, S., MURALI, R., NAMACHIVAYAM, A., GANESAN, R., RENU, K., DEY, A., VELLINGIRI, B. & PRINCE, S. E. 2022. Exploring the Regulatory Role of ncRNA in NAFLD: A Particular Focus on PPARs. Cells, 11. DIO:10.3390/cells11243959, PMID:36552725
(4) Previous work suggests that SNHG3 regulates its neighboring gene MED18 which is an important regulator of global transcription. Could some of the observed effects be due to changes in MED18 or other neighboring genes?
We thank the reviewer for the detailed comment. Previous work suggested that human SNHG3 promotes progression of gastric cancer by regulating neighboring MED18 gene methylation (Xuan and Wang, 2019). Here, we studied the effect of mouse Snhg3 on Med18 and the result showed that Snhg3 had no effect on the mRNA levels of Med18 (as below). Additionally, we also tested the effect of mouse Snhg3 on its neighboring gene, regulator of chromosome condensation 1 (Rcc1). Although deficiency of Snhg3 inhibited the mRNA level of Rcc1, overexpression of Snhg3 doesn’t affect the mRNA level of Rcc1 as showing below. RCC1, the only known guanine nucleotide exchange factor in the nucleus for Ran, a nuclear Ras-like G protein, directly participates in cellular processes such as nuclear envelope formation, nucleocytoplasmic transport, and spindle formation (Ren et al., 2020). RCC1 also regulates chromatin condensation in the late S and early M phases of the cell cycle. Many studies have found that RCC1 plays an important role in tumors. Furthermore, whether Rcc1 mediates the alleviated effect on MASLD of Snhg3 needs to be further investigated.
Author response image 3.
The mRNA levels of hepatic Rcc1 and Med18 expression in DIO Snhg3-HKO mice and Snhg3-HKI mice compared to the controls.
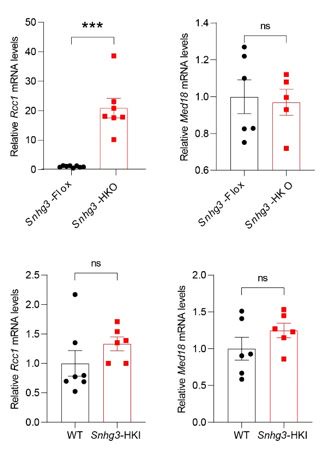
References
REN, X., JIANG, K. & ZHANG, F. 2020. The Multifaceted Roles of RCC1 in Tumorigenesis. Front Mol Biosci, 7, 225. DIO:10.3389/fmolb.2020.00225, PMID:33102517
XUAN, Y. & WANG, Y. 2019. Long non-coding RNA SNHG3 promotes progression of gastric cancer by regulating neighboring MED18 gene methylation. Cell Death Dis, 10, 694. DIO:10.1038/s41419-019-1940-3, PMID:31534128
(5) The claim that Snhg3 regulates SND1 protein stability seems subtle. There is data inconsistency between different panels regarding this regulation including Figure 5I, Figure 6A, and Figure 7E. In addition, is ubiquitination happening in the nucleus where Snhg3 is expressed?
We thank the reviewer for the detailed comment. The effect of Snhg3-induced SND1 expression had been confirmed by western blotting, please check them in Figure 5I, Figure 6A, Figure 7E and corresponding primary data. Additionally, Snhg3-induced SND1 protein stability seemed subtle, indicating there may be other mechanism by which Snhg3 promotes SND1, such as riboregulation. We had added it in the section of Discussion, please check it in the second paragraph in p16.
Additionally, we did not detect the sites where SND1 is modified by ubiquitination. Our results showed that Snhg3 was more localized in the nucleus (Figure 1D) and Snhg3 also promoted the nuclear localization of SND1 (Figure 5O). We had revised the diagram of Snhg3 action in Figure 8G. Please check them in revised manuscript.
(6) The authors show that the loss of Snhg3 changes the global H3K27me3 level. Few enzymes modify H3K27me3 levels. Did the authors check for an interaction between EZH2, Jmjd3, UTX, and Snhg3/SND1?
We thank the reviewer for the detailed comment. It is crucial to ascertain whether SND1 itself functions as a new demethylase or if it influences other demethylases, such as Jmjd3, enhancer of zeste homolog 2 (EZH2), and ubiquitously transcribed tetratricopeptide repeat on chromosome X (UTX). The precise mechanism by which SND1 regulates H3K27me3 is still unclear and hence requires further investigation. We had added the limitations in the section of Discussion and please check it in the third paragraph in p17.
(7) Can the authors speculate if the findings related to Snhg3/SND1 extend to humans?
We thank the reviewer for the detailed comment. Since the sequence of Snhg3 is not conserved between mice and humans, the findings in this manuscript may not be applicable to humans, but the detail need to be further exploited.
(8) As a general rule the figures are too small or difficult to read with limited details in the figure legends which limits evaluation. For example, Figure 1B and almost all of 4 cannot read labels. Figure 2, cannot see the snapshots show of mice or livers. What figure is supporting the claim that snhg3KI are more 'hyper-accessible'? Can the authors clarify what Figure 4H is referring to?
We thank the reviewer for the detailed comment. We have provided high quality figures in our revised manuscript.
The ‘hyper-accessible’ state in the liver of Snhg3-HKI mice was inferred by the differentially accessible regions (DARs), that is, we discovered 4305 DARs were more accessible in Snhg3-HKI mice and only 2505 DARs were more accessible in control mice and please refer table supplement 3).
The result of Figure 4H about heatmap for Cd36 was from hepatic RNA-seq of DIO Snhg3-HKI and control WT mice. For avoiding ambiguity, we have removed it.
(9) Authors stated that upon Snhg3 knock out, more genes are upregulated(1028) than downregulated(365). This description does not match Figure 4A. It seems in Figure 4A there are equal numbers of up and downregulated genes.
We thank the reviewer for the detailed question. We apologized for this mistake and have corrected it.
(10) Provide a schematic of the knockout and KI strategy in the supplement.
We thank the reviewer for the detailed comment. We had included the knockout and KI strategy in figure supplement 1A and B, and 2A.
Reviewer #2 (Recommendations For The Authors):
(1) Metabolic cage data need to be reanalyzed with CalR (particularly when the body weights are significantly different).
We thank the reviewer for the detailed comment. We reanalyzed the metabolic cage data using CalR (Mina et al., 2018). The results showed that there were no obvious differences in heat production, total oxygen consumption, carbon dioxide production and the respiratory exchange ratio between DIO Snhg3-HKO and control mice. Similar to DIO Snhg3-HKO mice, there was also no differences in heat production, total oxygen consumption, carbon dioxide production, and RER between DIO Snhg3-HKI mice and WT mice. Please check them in figure supplement 1C and 2C, and Mouse Calorimetry in Materials and Methods.
Reference
MINA, A. I., LECLAIR, R. A., LECLAIR, K. B., COHEN, D. E., LANTIER, L. & BANKS, A. S. 2018. CalR: A Web-Based Analysis Tool for Indirect Calorimetry Experiments. Cell Metab, 28, 656-666 e1. DIO:10.1016/j.cmet.2018.06.019, PMID:30017358
(2) ITT in Figure 2F should also be presented as % of the initial glucose level, which would reveal that there is no difference between WT and KO.
We thank the reviewer for the detailed comment. We repeated ITT experiment and include the new data in revised manuscript, please check it in Figure 2C.
(3) The fasting glucose results are inconsistent between ITT and GTT. Is there any difference in fasting glucose?
We thank the reviewer for the questions. The difference between GTT and ITT was caused owing to different fasting time, that is, mice were fasted for 6 h in ITT and were fasted for 16 h in GTT. It seems that Snhg3 doesn’t affect short- and longer-time fasting glucose levels and please refer Figures 2C and 3C.
Author Response
The following is the authors’ response to the original reviews.
We are very grateful to both reviewers for taking the time to review our manuscript and data in great detail. We thank you for the fair assessment of our work, the helpful feedback, and for recognizing the value of our work. We have done our best to address your concerns below:
eLife assessment This work reports a valuable finding on glucocorticoid signaling in male and female germ cells in mice, pointing out sexual dimorphism in transcriptomic responsiveness. While the evidence supporting the claims is generally solid, additional assessments would be required to fully confirm an inert GR signaling despite the presence of GR in the female germline and GR-mediated alternative splicing in response to dexamethasone treatment in the male germline. The work may interest basic researchers and physician-scientists working on reproduction and
Public Reviews:
Reviewer #1 (Public Review):
Summary:
Cincotta et al set out to investigate the presence of glucocorticoid receptors in the male and female embryonic germline. They further investigate the impact of tissue-specific genetically induced receptor absence and/or systemic receptor activation on fertility and RNA regulation. They are motivated by several lines of research that report inter and transgenerational effects of stress and or glucocorticoid receptor activation and suggest that their findings provide an explanatory mechanism to mechanistically back parental stress hormone exposure-induced phenotypes in the offspring.
Strengths:
A chronological immunofluorescent assessment of GR in fetal and early life oocyte and sperm development.
RNA seq data that reveal novel cell type specific isoforms validated by q-RT PCR E15.5 in the oocyte.
2 alternative approaches to knock out GR to study transcriptional outcomes. Oocytes: systemic GR KO (E17.5) with low input 3-tag seq and germline-specific GR KO (E15.5) on fetal oocyte expression via 10X single cell seq and 3-cap sequencing on sorted KO versus WT oocytes both indicating little impact on polyadenylated RNAs
2 alternative approaches to assess the effect of GR activation in vivo (systemic) and ex vivo (ovary culture): here the RNA seq did show again some changes in germ cells and many in the soma.
They exclude oocyte-specific GR signaling inhibition via beta isoforms.
Perinatal male germline shows differential splicing regulation in response to systemic Dex administration, results were backed up with q-PCR analysis of splicing factors. Weaknesses:
COMMENT #1: The presence of a protein cannot be entirely excluded based on IF data
We agree that very low levels of GR could escape the detection by IF and confocal imaging. We feel that our IF data do match transcript data in our validation studies of the GR KO using (1) qRT-PCR on fetal ovary in Fig 2E and (2) scRNA-seq in germ cells and ovarian soma in Fig S2B.
COMMENT #2: (staining of spermatids is referred to but not shown).
You are correct that this statement was based on a morphological identification of spermatids using DAPI morphology. We have performed a co-stain for GR with the spermatocyte marker SYCP3, and the spermatid/spermatozoa marker PNA (Peanut Agglutinin; from Arachis hypogaea) in adult testis tissue. We have updated Figure 4D to reflect this change, as well as the corresponding text in the Results section.
COMMENT #3: The authors do not consider post-transcriptional level a) modifications also triggered by GR activation b) non-coding RNAs (not assessed by seq).
We thank the reviewer for raising this very important point about potential post-transcriptional (non-genomic) effects of GR in the fetal oocyte. We agree that while our RNA-seq results show only a minimal transcriptional response, we cannot rule out a non-canonical signaling function of GR, such as the regulation of cellular kinases (as reviewed elsewhere1), or the regulation of non coding RNAs at the post-transcriptional level, and we have amended the discussion to include a sentence on this point. However, while we fully acknowledge the possibility of GR regulating non-genomic level cellular signaling, we chose not to explore this option further based on the lack of any overall functional effect on meiotic progression when GR signaling was perturbed- either by KO (Figure 2D) or dex-mediated activation (Figure S3C).
COMMENT #4: Sequencing techniques used are not total RNA but either are focused on all polyA transcripts (10x) or only assess the 3' prime end and hence are not ideal to study splicing
We thank the reviewer for raising this concern, however this statement is not correct and we have clarified this point in the Results section to explain how the sequencing libraries of the male germ cell RNA-seq were prepared. We agree that certain sequencing techniques (such as 3’ Tag-Seq) that generate sequencing libraries from a limited portion of an entire transcript molecule are not appropriate for analysis of differential splicing. This was not the case, however, for the RNA-seq libraries prepared on our male germ cells treated with dexamethasone. These libraries were constructed using full length transcripts that were reverse transcribed using random hexamer priming, thus accounting for sequencing coverage across the full transcript length. As a result, this type of library prep technique should be sufficient for capturing differential splicing events along the length of the transcript. We do, however, point out that these libraries were constructed on polyA-enriched transcripts. Thus while we obtained full length transcript coverage for these polyA transcripts, any differential splicing taking place in non poly-adenylated RNA moieties were not captured. While we are excited about the possibility of exploring GR-mediated splicing regulation of other RNA species in the future, we chose to focus the scope of our current study on polyA mRNA molecules specifically.
COMMENT #5: The number of replicates in the low input seq is very low and hence this might be underpowered
While the number of replicates (n=3-4 per condition) is sufficient for performing statistical analysis of a standard RNA-seq experiment, we do acknowledge and agree with the reviewer that low numbers of FACS-sorted germ cells from individual embryos combined with the low input 3’ Tag-Seq technique could have led to higher sample variability than desired. Given that we validated our bulk RNA-seq analysis of GR knockout ovaries using an orthogonal single-cell RNA-seq approach, we feel that our conclusions regarding a lack of transcriptional changes upon GR deletion remain valid.
COMMENT #6: Since Dex treatment showed some (modest) changes in oocyte RNA - effects of GR depletion might only become apparent upon Dex treatment as an interaction.
We may be missing the nuance of this point, but our interpretation of an effect that is seen only when the KO is treated with Dex would be that the mechanism would not be autonomous in germ cells but indirect or off-target.
COMMENT #7: Effects in oocytes following systemic Dex might be indirect due to GR activation in the soma.
As both the oocytes and ovarian soma express GR during the window of dex administration, we agree that it is possible that the few modest changes seen in the oocyte transcriptome are the result of indirect effects following robust GR signaling in the somatic compartment. However, given that these modest oocyte transcript changes in response to dex treatment did not significantly alter the ability of oocytes to progress through meiosis, we chose not to explore this mechanism further.
COMMENT #8: Even though ex vivo culture of ovaries shows GR translocation to the nucleus it is not sure whether the in vivo systemic administration does the same.
AND
The conclusion that fetal oocytes are resistant to GR manipulation is very strong, given that "only" poly A sequencing and few replicates of 3-prime sequencing have been analyzed and information is lacking on whether GR is activated in germ cells in the systemically dex-injected animals.
If we understand correctly, the first part refers to a technical limitation and the second part takes issue with our interpretation of the data. For the former, we appreciate this astute insight on the conundrum of detecting a response to systemic dex in fetal oocytes, which is generally monitored by nuclear translocation of GR. As shown in Figure 1A and 1B, GR localization is overwhelmingly nuclear in fetal oocytes of WT animals at E13.5 without addition of any dex. We could not, therefore, use GR translocation as a proxy for activation in response to dex treatment. We instead used ex vivo organ culture to monitor localization changes, as we were able to maintain fetal ovaries ex vivo in hormone-depleted and ligand negative conditions. As shown in Fig. 3, these defined culture conditions elicited a shift of GR to the cytoplasm of fetal oocytes. This led us to conclude that GR is capable of translocating between nucleus and cytoplasm in fetal oocytes, and we were able to counteract this loss in nuclear localization by providing dex ligand in the media.
We feel that our conclusion that oocytes are resistant to manipulation of glucocorticoid signaling despite their possession of the receptor and capacity for nuclear translocation is substantiated by multiple results: meiotic phenotyping, bulk RNA-seq and scRNA-seq analysis of both GR KO and dex dosed mice. Our basis for testing the timing and fidelity of meiotic prophase I was the coincident onset of GR expression in female germ cells at E13, and the disappearance of GR in neonatal oocytes as they enter meiotic arrest. The lack of transcriptional changes observed in oocytes in response to dex has made it even more challenging to demonstrate a bona fide “activation” of GR. Observation of a dose-dependent induction of the canonical GR response gene Fkbp5 in the somatic cells of the fetal ovary (Figure S3A and 3A) affirmed that dex traverses the placenta. We agree with the reviewer that it remains possible that dex or GR KO could lead to changes in epigenetic marks or small RNAs in oocytes, and have mentioned these possibilities in the discussion, but we note that even epigenetic perturbations during oocyte development such as the loss of Tet1 or Dnmt1 result in measurable changes in the transcriptome and the timing of meiotic prophase 2–4.
COMMENT #9: This work is a good reference point for researchers interested in glucocorticoid hormone signaling fertility and RNA splicing. It might spark further studies on germline-specific GR functions and the impact of GR activation on alternative splicing. While the study provides a characterization of GR and some aspects of GR perturbation, and the negative findings in this study do help to rule out a range of specific roles of GR in the germline, there is still a range of other potential unexplored options. The introduction of the study eludes to implications for intergenerational effects via epigenetic modifications in the germline, however, it does not mention that the indirect effects of reproductive tissue GR signaling on the germline have indeed already been described in the context of intergenerational effects of stress.
The reviewer raises an excellent point that we have not made sufficient distinction in our manuscript between prior studies of gestational stress and preconception stress and the light that our work may shed on those findings. We have revised the introduction to clarify this difference, and added reference to an outstanding study that identifies glucocorticoid-induced changes to microRNA cargo of extracellular vesicles shed by epididymal epithelial cells that when transferred to mature sperm can induce changes in the HPA axis and brain of offspring 5. Interestingly, this GR-mediated effect in the epididymal epithelial cells concurs with our observation in the adult testis that GR can be detected only cKit+ spermatogonia but not in subsequent stages of spermatids.
COMMENT #10: Also, the study does not assess epigenetic modifications.
We agree with the reviewer that exploring the role of GR in regulating epigenetic modifications within the germline is an area of extreme interest given the potential links between stress and transgenerational epigenetic inheritance. As this is a broader topic that requires a more thorough and comprehensive set of experiments, we have intentionally chosen to keep this work separate from the current study, and hope to expand upon this topic in the future.
COMMENT #11: The conclusion that the persistence of a phenotype for up to three generations suggests that stress can induce lasting epigenetic changes in the germline is misleading. For the reader who is unfamiliar with the field, it is important to define much more precisely what is referred to as "a phenotype". Furthermore, this statement evokes the impression that the very same epigenetic changes in the germline have been observed across multiple generations.
We see how this may be misleading, and we have amended the text of the introduction and discussion accordingly to avoid the use of the term “phenotype”.
COMMENT #12: The evidence of the presence of GR in the germline is also somewhat limited - since other studies using sequencing have detected GR in the mature oocyte and sperm.
As described above in response to Comment #2, we have included immunostaining of adult testis in a revised Figure 4D and shown that we detect GR in PLZF+ and cKIT+ spermatogonia. We also show low/minimal expression in some (SYCP3+) early meiotic spermatocytes, but not in (Lectin+) spermatids. We are not aware of any studies that have shown expression of GR protein in the mature oocyte.
COMMENT #13: The discussion ends again on the implications of sex-specific differences of GR signaling in the context of stress-induced epigenetic inheritance. It states that the observed differences might relate to the fact that there is more evidence for paternal lineage findings, without considering that maternal lineage studies in epigenetic inheritance are generally less prevalent due to some practical factors - such as more laborious study design making use of cross-fostering or embryo transfer.
We thank the reviewer for this valid point, and we have amended the discussion section.
Reviewer #2 (Public Review):
Summary:
There is increasing evidence in the literature that rodent models of stress can produce phenotypes that persist through multiple generations. Nevertheless, the mechanism(s) by which stress exposure produces phenotypes are unknown in the directly affected individual as well as in subsequent offspring that did not directly experience stress. Moreover, it has also been shown that glucocorticoid stress hormones can recapitulate the effects of programmed stress. In this manuscript, the authors test the compelling hypothesis that glucocorticoid receptor (GR)-signaling is responsible for the transmission of phenotypes across generations. As a first step, the investigators test for a role of GR in the male and female germline. Using knockouts and GR agonists, they show that although germ cells in male and female mice have GR that appears to localize to the nucleus when stimulated, oocytes are resistant to changes in GR levels. In contrast, the male germline exhibits changes in splicing but no overt changes in fertility.
Strengths:
Although many of the results in this manuscript are negative, this is a careful and timely study that informs additional work to address mechanisms of transmission of stress phenotypes across generations and suggests a sexually dimorphic response to glucocorticoids in the germline. The work presented here is well-done and rigorous and the discussion of the data is thoughtful. Overall, this is an important contribution to the literature.
Reviewer #1 (Recommendations For The Authors):
RECOMMENDATION #1: To assess whether in females the systemic Dex administration directly activates GR in oocytes it would be great to assess GR activation following Dex administration, and ideally to see the effects abolished when Dex is administered to germline-specific KO animals.
In regard to the recommendation to assess GR activation in response to systemic dex administration, we refer the reviewer back to our response in Comment #8 highlighting the difficulties defining and measuring GR activation in the germline.
This therefore has made it difficult to assess whether any of the modest effects seen in response to dex are abolished in our germline-specific KO animals. While repeating our RNA-seq experiment in dex-dosed germline KO animals would address whether the ~60 genes induced in oocytes are the result of oocyte-intrinsic GR activity, we have decided not to explore this mechanism further due to the overall lack of a functional effect on meiotic progression in response to dex (Figure S3C).
RECOMMENDATION #2: To further strengthen the link between GR and alternative splicing it would be great to see the dex administration experiment repeated in germline specific GR KO's.
While we understand the reviewer’s suggestion to explore whether deletion of GR in the spermatogonia is sufficient to abrogate the dex-mediated decreases in splice factor expression, we chose not to explore the details of this mechanism given that deletion of GR in the male germline does not impair fertility (Figure 6).
RECOMMENDATION #3: I am wondering how much a given reduction in one of the splicing factors indeed affects splicing events. Can the authors relate this to literature, or maybe an in vitro experiment can be done to see whether the level of differential splicing events detected is in a range that can be expected in the case of the magnitude of splicing factor reduction?
It has been shown in many instances in the literature that a full genetic deletion of a single splice factor leads to impairments in spermatogenesis, and ultimately infertility 6–16. We suspect that dex treatment leads to fewer differential splicing events than a full splice factor deletion, given that dex treatment causes a broader decrease in splice factor expression without entirely abolishing any single splice factor. We have amended the discussion section to include this point. While we share the reviewer’s curiosity to compare the effects of dex vs genetic deletion of splicing machinery on the overall magnitude of differential splicing events, we unfortunately do not have access to mice with a floxed splice factor at this time. While we have considered knocking out one or more splice factors in an ex vivo cultured testis to compare alongside dex treatment, our efforts to date have proven unsuccessful due to high cell death upon culture of the postnatal testis for more than 24 hours.
RECOMMENDATION #4: It is unclear from the methods whether in germline-specific KO's also the controls received tamoxifen.
We thank the reviewer for catching this missing piece of information. All control embryos that were assessed received an equivalent dose of tamoxifen to the germline-specific KO embryos. The only difference between cKOs and controls was the presence of the Cre transgene. We have updated the Materials and Methods 3’ Tag-Seq sample preparation section to include the sentence: “Both GRcKO/cKO and control GRflox/flox embryos were collected from tamoxifen-injected dams, and thus were equally exposed to tamoxifen in utero”.
Reviewer #2 (Recommendations For The Authors):
I just have only a few comments/questions.
RECOMMENDATION #5: It is somewhat surprising that GR is expressed in female germ cells, yet there doesn't seem to be a requirement. Is there any indication of what it does? Is the long-term stability of the germline compromised?
We thank the reviewer for these questions, and we agree that it was quite surprising to find a lack of GR function in the female germline despite its robust expression. The question of whether loss of GR affects the long-term stability of the female germline is interesting, given that similar work in GR KO zebrafish has shown impairments to female reproductive capacity, yet only upon aging 17–19.
While we have shared interest in this question, technical limitations thus far have prevented us from properly assessing the effect of GR loss in aged females. Homozygous deletion of GR results in embryonic lethality at approximately E17.5. Conditional deletion of GR using Oct4-CreERT2 with a single dose of tamoxifen (2.5 mg / 20g mouse) at E9.5 results in complete deletion of GR by E10.5, although dams consistently suffer from dystocia and are no longer able to deliver viable pups. While using the more active tamoxifen metabolite (4OHT) at 0.1 mg / 20g has allowed for successful delivery, the resulting deletion rate is very poor (see qPCR results in panel below, left). While using half the dose of standard tamoxifen (1.25 mg / 20g mouse) at E9.5 has on rare occasions led to a successful delivery, the resulting recombination efficiency is insufficient (Author response image 1 right panel).
Author response image 1.
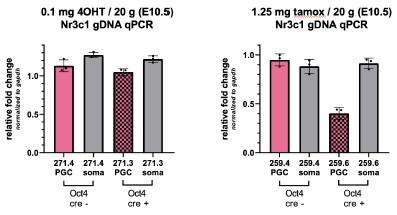
While a Blimp1-Cre conditional KO model was used to assess male fertility on GR deletion, we believe this model may not be ideal for studying fertility in the context of aging. While Blimp1-Cre is highly specific to the germ cells within the gonad, there are many cell types outside of the gonad that express Blimp1, including the skin and certain cells of the immune system. It is unclear, particularly over the course of aging, whether any effects on fertility seen would be due to an oocyte-intrinsic effect, or the result of GR loss elsewhere in the body. While we hope to explore the role of GR in the aging oocyte further using alternative Cre models in the future, this is currently outside the scope of this work.
RECOMMENDATION #6: Figure 5b: what is the left part of that panel? Is it the same volcano plot for germ cells as shown in part a but with splicing factors?
We apologize if this panel was unclear. Yes, the left panel of Figure 5B is in fact the same volcano plot in 5A, labeled with splicing factors instead of top genes. We have edited Figure 5B and corresponding figure legend to clarify this.
References: 1. Oakley, R.H., and Cidlowski, J.A. (2013). The biology of the glucocorticoid receptor: New signaling mechanisms in health and disease. J. Allergy Clin. Immunol. 132, 1033–1044. 10.1016/j.jaci.2013.09.007.
Hargan-Calvopina, J., Taylor, S., Cook, H., Hu, Z., Lee, S.A., Yen, M.-R., Chiang, Y.-S., Chen, P.-Y., and Clark, A.T. (2016). Stage-Specific Demethylation in Primordial Germ Cells Safeguards against Precocious Differentiation. Dev. Cell 39, 75–86. 10.1016/j.devcel.2016.07.019.
Hill, P.W.S., Leitch, H.G., Requena, C.E., Sun, Z., Amouroux, R., Roman-Trufero, M., Borkowska, M., Terragni, J., Vaisvila, R., Linnett, S., et al. (2018). Epigenetic reprogramming enables the transition from primordial germ cell to gonocyte. Nature 555, 392–396. 10.1038/nature25964.
Eymery, A., Liu, Z., Ozonov, E.A., Stadler, M.B., and Peters, A.H.F.M. (2016). The methyltransferase Setdb1 is essential for meiosis and mitosis in mouse oocytes and early embryos. Development 143, 2767–2779. 10.1242/dev.132746.
Chan, J.C., Morgan, C.P., Leu, N.A., Shetty, A., Cisse, Y.M., Nugent, B.M., Morrison, K.E., Jašarević, E., Huang, W., Kanyuch, N., et al. (2020). Reproductive tract extracellular vesicles are sufficient to transmit intergenerational stress and program neurodevelopment. Nat Commun 11, 1499. 10.1038/s41467-020-15305-w.
Kuroda, M., Sok, J., Webb, L., Baechtold, H., Urano, F., Yin, Y., Chung, P., Rooij, D.G. de, Akhmedov, A., Ashley, T., et al. (2000). Male sterility and enhanced radiation sensitivity in TLS−/− mice. Embo J 19, 453–462. 10.1093/emboj/19.3.453.
Liu, W., Wang, F., Xu, Q., Shi, J., Zhang, X., Lu, X., Zhao, Z.-A., Gao, Z., Ma, H., Duan, E., et al. (2017). BCAS2 is involved in alternative mRNA splicing in spermatogonia and the transition to meiosis. Nat Commun 8, 14182. 10.1038/ncomms14182.
Li, H., Watford, W., Li, C., Parmelee, A., Bryant, M.A., Deng, C., O’Shea, J., and Lee, S.B. (2007). Ewing sarcoma gene EWS is essential for meiosis and B lymphocyte development. J Clin Invest 117, 1314–1323. 10.1172/jci31222.
O’Bryan, M.K., Clark, B.J., McLaughlin, E.A., D’Sylva, R.J., O’Donnell, L., Wilce, J.A., Sutherland, J., O’Connor, A.E., Whittle, B., Goodnow, C.C., et al. (2013). RBM5 Is a Male Germ Cell Splicing Factor and Is Required for Spermatid Differentiation and Male Fertility. Plos Genet 9, e1003628. 10.1371/journal.pgen.1003628.
Zagore, L.L., Grabinski, S.E., Sweet, T.J., Hannigan, M.M., Sramkoski, R.M., Li, Q., and Licatalosi, D.D. (2015). RNA Binding Protein Ptbp2 Is Essential for Male Germ Cell Development. Mol Cell Biol 35, 4030–4042. 10.1128/mcb.00676-15.
Xu, K., Yang, Y., Feng, G.-H., Sun, B.-F., Chen, J.-Q., Li, Y.-F., Chen, Y.-S., Zhang, X.-X., Wang, C.-X., Jiang, L.-Y., et al. (2017). Mettl3-mediated m6A regulates spermatogonial differentiation and meiosis initiation. Cell Res 27, 1100–1114. 10.1038/cr.2017.100.
Horiuchi, K., Perez-Cerezales, S., Papasaikas, P., Ramos-Ibeas, P., López-Cardona, A.P., Laguna-Barraza, R., Balvís, N.F., Pericuesta, E., Fernández-González, R., Planells, B., et al. (2018). Impaired Spermatogenesis, Muscle, and Erythrocyte Function in U12 Intron Splicing-Defective Zrsr1 Mutant Mice. Cell Reports 23, 143–155. 10.1016/j.celrep.2018.03.028.
Ehrmann, I., Crichton, J.H., Gazzara, M.R., James, K., Liu, Y., Grellscheid, S.N., Curk, T., Rooij, D. de, Steyn, J.S., Cockell, S., et al. (2019). An ancient germ cell-specific RNA-binding protein protects the germline from cryptic splice site poisoning. Elife 8, e39304. 10.7554/elife.39304.
Legrand, J.M.D., Chan, A.-L., La, H.M., Rossello, F.J., Änkö, M.-L., Fuller-Pace, F.V., and Hobbs, R.M. (2019). DDX5 plays essential transcriptional and post-transcriptional roles in the maintenance and function of spermatogonia. Nat Commun 10, 2278. 10.1038/s41467-019-09972-7.
Yuan, S., Feng, S., Li, J., Wen, H., Liu, K., Gui, Y., Wen, Y., and Wang, X. (2021). hnRNPH1 recruits PTBP2 and SRSF3 to cooperatively modulate alternative pre-mRNA splicing in germ cells and is essential for spermatogenesis and oogenesis. 10.21203/rs.3.rs-1060705/v1.
Wu, R., Zhan, J., Zheng, B., Chen, Z., Li, J., Li, C., Liu, R., Zhang, X., Huang, X., and Luo, M. (2021). SYMPK Is Required for Meiosis and Involved in Alternative Splicing in Male Germ Cells. Frontiers Cell Dev Biology 9, 715733. 10.3389/fcell.2021.715733.
Maradonna, F., Gioacchini, G., Notarstefano, V., Fontana, C.M., Citton, F., Valle, L.D., Giorgini, E., and Carnevali, O. (2020). Knockout of the Glucocorticoid Receptor Impairs Reproduction in Female Zebrafish. Int J Mol Sci 21, 9073. 10.3390/ijms21239073.
Facchinello, N., Skobo, T., Meneghetti, G., Colletti, E., Dinarello, A., Tiso, N., Costa, R., Gioacchini, G., Carnevali, O., Argenton, F., et al. (2017). nr3c1 null mutant zebrafish are viable and reveal DNA-binding-independent activities of the glucocorticoid receptor. Sci Rep-uk 7, 4371. 10.1038/s41598-017-04535-6.
Faught, E., Santos, H.B., and Vijayan, M.M. (2020). Loss of the glucocorticoid receptor causes accelerated ovarian ageing in zebrafish. Proc Royal Soc B 287, 20202190. 10.1098/rspb.2020.2190.
Author response:
The following is the authors’ response to the original reviews.
Public Reviews:
Reviewer #1 (Public review):
Summary:
In this manuscript, the authors have tried to dissect the functions of Proteasome activator 28γ (PA28γ) which is known to activate proteasomal function in an ATP-independent manner. Although there are multiple works that have highlighted the role of this protein in tumours, this study specifically tried to develop a correlation with Complement C1q binding protein (C1QBp) that is associated with immune response and energy homeostasis.
Strengths:
The observations of the authors hint that beyond PA28y's association with the proteasome, it might also stabilize certain proteins such as C1QBP which influences energy metabolism.
Weaknesses:
The strength of the work also becomes its main drawback. That is, how PA28y stabilizes C1QBP or how C1QBP elicits its pro-tumourigenic role under PA28y OE.<br /> In most of the experiments, the authors have been dependent on the parallel changes in the expression of both the proteins to justify their stabilizing interaction. However, this approach is indirect at best and does not confirm the direct stabilizing effect of this interaction. IP experiments do not indicate direct interaction and have some quality issues. The upregulation of C1QBP might be indirect at best. It is quite possible that PA28y might be degrading some secondary protein/complex that is responsible for C1QBP expression. Since the core idea of the work is PA28y direct interaction with C1QBP stabilizing it, the same should be demonstrated in a more convincing manner.
Thank you very much for the important comments. Using AlphaFold 3, we found that interaction between PA28γ and C1QBP may depend on amino acids 1-167 and 1-213 (Revised Appendix Figure 1D-H), which was confirmed by our immunoprecipitation (Revised Figure 1I). In the future, we will use nuclear magnetic resonance spectroscopy to analyze protein-protein interaction between PA28γ and C1QBP and demonstrate it by GST pull down in vitro experiments.
In all of the assays, C1QBP has been detected as doublet. However, the expression pattern of the two bands varies depending on the experiment. In some cases, the upper band is intensely stained and in some the lower bands. Do C1QBP isoforms exist and are they differentially regulated depending on experiment conditions/tissue types?
Thank you very much for the important comments. We have rechecked the experimental results with two bands, which may have been caused by using polyclonal antibody of C1QBP (Abcam: ab101267). Therefore, we conducted the experiment with monoclonal antibody of C1QBP (Cell Signaling Technology: #6502) and replaced the corresponding images in revised figure (Revised Figure 1E and Revised Appendix Figure 3D).
Problems with the background of the work: Line 76. This statement is far-fetched. There are presently a number of works of literature that have dealt with the metabolic programming of OSCC including identification of specific metabolites. Moreover, beyond the estimation of OCR, the authors have not conducted any experiments related to metabolism. In the Introduction, the significance of this study and how it will extend our understanding of OSCC needs to be elaborated.
Thank you very much for the important comments. Based on your suggestion, we have revised the content and updated the references (“Introduction”, Paragraph 2, Line 13-17 and Paragraph 4, Line 5-8). In addition, we plan to conduct experiments to investigate the regulation of metabolism by PA28γ and C1QBP and update our data in the future.
The modified content is as follows:
“Current research on metabolic reprogramming in OSCC primarily focused on mechanism of glycolytic metabolism and metabolic shift from glycolysis to oxidative phosphorylation (OXPHOS) of oral squamous cell carcinoma, which lays the groundwork for novel therapeutic interventions to counteract OSCC (Chen et al., 2024; Zhang et al., 2020).”
“It is the first study to describe the undiscovered role of PA28γ in promoting the malignant progression of OSCC by elevating mitochondrial function, providing new clinical insights for the treatment of OSCC.”
Reviewer #2 (Public review):
Summary:
The authors tried to determine how PA28g functions in oral squamous cell carcinoma (OSCC) cells. They hypothesized it may act through metabolic reprogramming in the mitochondria.
Strengths:
They found that the genes of PA28g and C1QBP are in an overlapping interaction network after an analysis of a genome database. They also found that the two proteins interact in coimmunoprecipitation and pull-down assays using the lysate from OSCC cells with or without expression of the exogenous genes. They used truncated C1QBP proteins to map the interaction site to the N-terminal 167 residues of C1QBP protein. They observed the levels of the two proteins are positively correlated in the cells. They provided evidence for the colocalization of the two proteins in the mitochondria, the effect on mitochondrial form and function in vitro and in vivo OSCC models, and the correlation of the protein expression with the prognosis of cancer patients.
Weaknesses:
Many data sets are shown in figures that cannot be understood without more descriptions, either in the text or the legend, e.g., Figure 1A. Similarly, many abbreviations are not defined.
Thank you very much for the important comments. We have revised the descriptions in the legend to make it easier to understand.
Some of the pull-down and coimmunoprecipitation data do not support the conclusion about the PA28g-C1QBP interaction. For example, in Appendix Figure 1B the Flag-C1QBP was detected in the Myc beads pull-down when the protein was expressed in the 293T cells without the Myc-PA28g, suggesting that the pull-down was not due to the interaction of the C1QBP and PA28g proteins. In Appendix Figure 1C, assume the SFB stands for a biotin tag, then the SFB-PA28g should be detected in the cells expressing this protein after pull-down by streptavidin; however, it was not. The Western blot data in Figure 1E and many other figures must be quantified before any conclusions about the levels of proteins can be drawn.
Thank you very much for the meticulous review. We have rechecked the experimental results, and we made a mistake in the labeling of the image. Therefore, we have corrected it in the revised figure (Revised Appendix Figure 1B, C). In addition, we have conducted a quantitative analysis of gray values to confirm the results of western blot data are accurate by Image J software.
The immunoprecipitation method is flawed as it is described. The antigen (PA28g or C1QBP) should bind to the respective antibody that in turn should binds to Protein G beads. The resulting immunocomplex should end up in the pellet fraction after centrifugation and be analyzed further by Western blot for coprecipitates. However, the method in the Appendix states that the supernatant was used for the Western blot.
Thank you very much for the careful review. We have corrected it in the revised appendix file (“Supplemental Materials and Methods”, Part“Immunoprecipitation assay”, Line 4-6).
The modified content is as follows:
The sample was shaken on a horizontal shaker for 4 h, after which the deposit was collected for western blotting.
To conclude that PA28g stabilizes C1QBP through their physical interaction in the cells, one must show whether a protease inhibitor can substitute PA28q and prevent C1QBP degradation, and show whether a mutation that disrupts the PA28g-C1QBP interaction can reduce the stability of C1QBP. In Figure 1F, all cells expressed Myc-PA28g. Therefore, the conclusion that PA28g prevented C1QBP degradation cannot be reached. Instead, since more Myc-PA28g was detected in the cells expressing Flag-C1QBP compared to the cells not expressing this protein, a conclusion would be that the C1QBP stabilized the PA28g. Figure 1G is a quantification of Western blot data that should be shown.
Thank you very much for the meticulous review. We have rechecked the experimental results, and we made a mistake in the labeling of the image. Therefore, we have corrected it in the revised figure. Compared with the control group, the presence of Myc-PA28γ significantly increased the expression level of Flag-C1QBP (Revised Figure 1F). Gray value analysis showed that in cells transfected with Myc-PA28γ, the decay rate of Flag-C1QBP was significantly slower than that of the control group (Revised Figure 1G), suggesting that PA28γ can delay the protein degradation of C1QBP and stabilize its protein level. This indicates that an increase in the level of PA28γ protein can significantly enhance the expression level of C1QBP protein, while PA28γ can slow down the degradation rate of C1QBP and improve its stability. In addition, we plan to conduct experiments to investigate the effects of protease inhibitors and PA28γ mutants on the stability of C1QBP and update our data in the future.
The binding site for PA28g in C1QBP was mapped to the N-terminal 167 residues using truncated proteins. One caveat would be that some truncated proteins did not fold correctly in the absence of the sequence that was removed. Thus, the C-terminal region of the C1QBP with residues 168-283 may still bind to the PA29g in the context of full-length protein. In Figure 1I, more Flag-C1QBP 1-167 was pulled down by Myc-PA28g than the full-length protein or the Flag-C1QBP 1-213. Why?
Thank you very much for the important comments. Immunoprecipitation is a qualitative experiment. Using AlphaFold 3, we found that interaction between PA28γ and C1QBP may depend on amino acids 1-167 and 1-213 (Revised Appendix Figure 1D-H), which was confirmed by our immunoprecipitation (Revised Figure 1I).
The interaction site in PA28g for C1QBP was not mapped, which prevents further analysis of the interaction. Also, if the interaction domain can be determined, structural modeling of the complex would be feasible using AlphaFold2 or other programs. Then, it is possible to test point mutations that may disrupt the interaction and if so, the functional effect.
Thank you very much for the important comments. Based on your suggestion, we have added relevant content to the revised appendix figure. (Revised Appendix Figure 1D-H).
Recommendations for the authors:
Reviewer #1 (Recommendations for the authors):
(1) There are a lot of typos in the figure and manuscript that need to be addressed.
Thank you very much for the important comments. We have corrected the typos in the revised figure and manuscript.
(2) Figure 1A: The amount of protein that has been immunoprecipitated is more than the actual amount present in the lysate. The authors should calculate the efficiency of the precipitation to support their results.
Thank you very much for the important comments. Immunoprecipitation is a qualitative experiment. Moreover, it can enrich specific proteins and their binding partners, increase their concentration in the sample, and thus improve the sensitivity of detection.
(3) Figure 1D: The relative expression levels of C1QBP look similar in almost all cell lines except for HN12. It seems that the relation of PA28y with C1QBP is more of a cell type-specific effect. It would be better if the blots were quantified, and the differences were statistically determined.
Thank you very much for the important comments. We have conducted a quantitative analysis of gray values to confirm the results of western blot data are accurate by Image J software.
(4) Figure 1E: How do the authors quantify the expression of the protein in absolute terms? From the methods, it is understood that the flag-tagged construct is stably expressed. Under such conditions, how the authors observed the variable expression of the protein should be elaborated.
Thank you very much for the important comments. We transfected Flag-PA28γ plasmids at 0ug, 0.5ug, 1ug, and 2ug in 293T cells. After collecting the protein for Western Blot, we found that the protein expression of Flag-PA28γ gradually increased. Moreover, the increased protein expression of C1QBP is consistent with the expression of Flag-PA28γ, which indicated a dose-dependent relationship between the two proteins.
(5) Figures 1F, G: The data does not correlate with the arguments presented in the text. The authors propose that interaction with PA28y increases the stability of C1QBP. However, the experiment lacks appropriate controls. Ideally, the expression of C1QBP should be tested in the presence and absence of PA28y. Moreover, the observed difference in expression between lanes 1-4 and 5-8 for myc-PA28y needs to be explained. Are the samples from different sources with variable PA28y expression? Figure 1G quantification for C1QBP does not correlate with the figure presented in F since the expression of the protein in the first four lanes is undetectable.
Thank you very much for the meticulous review. We have rechecked the experimental results, and we made a mistake in the labeling of the image. Therefore, we have corrected it in the revised figure. Compared with the control group, the presence of Myc-PA28γ significantly increased the expression level of Flag-C1QBP (Revised Figure 1F). Gray value analysis showed that in cells transfected with Myc-PA28γ, the decay rate of Flag-C1QBP was significantly slower than that of the control group (Revised Figure 1G), suggesting that PA28γ can delay the protein degradation of C1QBP and stabilize its protein level. This indicates that an increase in the level of PA28γ protein can significantly enhance the expression level of C1QBP protein, while PA28γ can slow down the degradation rate of C1QBP and improve its stability. In addition, we plan to conduct experiments to investigate the effects of protease inhibitors and PA28γ mutants on the stability of C1QBP and update our data in the future.
(6) Appendix Figure 1B: Lane 1 does not express Myc-tagged protein but pull-down has been performed using Myc beads. Then how come flag-C1qbp is getting pulled down in lane 1 if there is no PA28y? This indicates a non-specific interaction of C1qbp with the substrata under the experimental conditions used. Similarly, in Figure 1C SFB-PA28y is expressed in both lanes but is reflected only in lane 2 and not in lane 1 even when pull-down is being performed using SFB beads, again reflecting the non-specificity of the interactions shown through immunoprecipitated.
Thank you very much for the meticulous review. We have rechecked the experimental results, and we made a mistake in the labeling of the image. Therefore, we have corrected it in the revised figure (Revised Appendix Figure 1B, C).
(7) Figure 2A: Figure 2A the co-localization of P28y with C1QBP in mitochondria is not very convincing. The authors are urged to provide high-resolution images for the same along with quantification of co-localization coefficients.
Thank you very much for the important comments. We plan to obtain high-resolution images of co-localization of PA28γ with C1QBP in mitochondria and add the quantification analysis. We will update our data in the future.
(8) Figure 2C: Mitochondria dynamics is an interplay of multiple factors. From the images, it seems that PA28y OE elevates mitochondria biogenesis in general which is having an umbrella effect on mitochondria fusion/fission and OCR. Images also do not convincingly indicate changes in mitochondrial length. The role of PA28y on mitochondria dynamics requires further justification. However, the presented data does not underline whether the changes in mitochondria behaviour are a consequence of PA28y and C1QBP interaction. Correlating higher mitochondria respiration with ROS generation is a far-fetched conclusion since, at present, there are multiple reports that suggest otherwise.
Thank you very much for the important comments. We plan to knock out the interaction regions between PA28γ and C1QBP (like amino acids 1-167 and 1-213) to confirm whether PA28γ affects mitochondrial function through C1QBP and update our data in the future.
(9) Line 157: The presented data does not substantiate the claims made that Pa28y regulates mitochondrial function through C1QBP.
Thank you very much for the important comments. Based on your suggestion, we have made some modifications to make it more accurate (“Results”, Part “PA28γ and C1QBP colocalize in mitochondria and affect mitochondrial functions”, Paragraph 3, Line 1-2).
The modified content is as follows:
“Collectively, these data suggest that PA28γ, which co-localizes with C1QBP in mitochondria, may involve in regulating mitochondrial morphology and function.”
(10) Line 159: From the past data it is not very clear how PA28y upregulates C1QBP, hence the statement is not well supported. The presented data indicates the presence of a functional association between the two proteins.
Thank you very much for the important comments. We detected the expression of C1QBP in two PA28γ-overexpressing OSCC cells (UM1 and 4MOSC2) and found an increase in C1QBP expression (Revised Figure 4B). Based on the results of the protein levels of the mitochondrial respiratory chain complex and other mitochondrial functional proteins, we believe that PA28γ regulates mitochondrial function by upregulating C1QBP.
(11) Figure 4A, B: Given the mitochondrial role of C1QBP, the lesser levels of mitochondrial proteins upon C1QBP silencing are expected. Does it get phenocopied upon PA28y silencing? Similarly, all the subsequent mitochondrial phenotypes in D should be seen in a PA28y-depleted background.
Thank you very much for the important comments. We plan to detect the mitochondrial protein expressions and OCRs of PA28γ-silenced OSCC cells. We will update our data in the future.
(12) Line 198: The presented data do indicate a functional association between these two proteins but it does not provide a solid evidence for the same.
Thank you very much for the important comments. Based on your suggestion, we have made some modifications to make it more accurate (“Discussion”, Paragraph 1, Line 9-10).
The modified content is as follows:
“Excitingly, we found the evidence that PA28γ interacts with and stabilizes C1QBP.”
(13) Line 218-220: In this work, the authors highlight the non-degradome role of PA28y and hence, this fact should be treated appropriately in discussion in line with the presented data.
Thank you very much for the important comments. Based on your suggestion, we have added relevant content to the revised manuscript (“Discussion”, Paragraph 2, Line 16-19).
The modified content is as follows:
“In addition, PA28γ can also play as a non-degradome role on tumor angiogenesis. For example, PA28γ can regulate the activation of NF-κB to promote the secretion of IL-6 and CCL2 in OSCC cells, thus promoting the angiogenesis of endothelial cells ( S. Liu et al., 2018).”
(14) Line 236-240: Although the authors' statement on organ heterogeneity being the cause for getting the contrasting result is justifiable but here there is no direct evidence of PA28y involvement in regulation of OXPHOS and its impact on cellular metabolism (glycolysis, metabolic signalling, etc).
Thank you very much for the important comments. Based on your suggestion, we have made some modifications to make it more accurate (“Discussion”, Paragraph 3, Line 7-9).
The modified content is as follows:
“Therefore, PA28γ's regulation of OXPHOS may impact cellular energy metabolism.”
(15) Line 249: No conclusive data supporting this statement.
Thank you very much for the important comments. Based on your suggestion, we have made some modifications to make it more accurate (“Discussion”, Paragraph 5, Line 1-3).
The modified content is as follows:
“Furthermore, our study reveals that PA28γ can regulate C1QBP and influence mitochondrial morphology and function by enhancing the expression of OPA1, MFN1, MFN2 and the mitochondrial respiratory complex.”
Reviewer #2 (Recommendations for the authors):
(1) The images shown in Figure 2A need to be quantified before the conclusion about the mitochondrial colocalization of the two proteins can be drawn. In Figure 2B and Appendix Figure 2A, the mitochondrial vacuoles and ridge should be indicated for general readers, and quantification should be performed before the conclusion is drawn.
Thank you very much for the important comments. We will update our data in the future.
(2) The OCR data from two cell lines are shown in Figure 2E and F. Which is which? The sentence, "The results indicated ... compared to control cells" in lines 130-132, was confusing; perhaps, it would be clear if "were significantly greater" could be deleted.
Thank you very much for the important comments. We have re-labeled the Figure 2E and F to make it clearly (Revised Figure 2E, F). Based on your suggestion, we have deleted the words in revised manuscript. (“Results”, Part “PA28γ and C1QBP colocalize in mitochondria and affect mitochondrial functions”, Paragraph 1, Line 9-11).
The modified content is as follows:
“The results indicated significantly higher basal respiration, maximal OCRs and ATP production in PA28γ-overexpressing cells compared to control cells (Fig. 2G-I and Appendix Fig. 2B-D).”
(3) Figures 4E-H show the migration, invasive, and proliferation capabilities of the cells. Which for which?
Thank you very much for the important comments. We have re-labeled the Figure 4F-H to make it clearly (Revised Figure 4F-H).
(4) In the Discussion, lines 198-201, it states that "C1QBP enhances ... function of OPA1, MNF1, MFN2..." What is the evidence? In lines 222-224, it says that "the binding sites ... may mask the specific ... modification sites". Please justify. In lines 253-254, "fuse" and fuses" are misleading, Did the authors mean "localize" and "localizes"?
Thank you very much for the important comments. Based on your suggestion, we have made some modifications to make it more accurate (“Discussion”, Paragraph 1, Line 9-13, Paragraph 2, Line 20-23, and Paragraph 5, Line 3-6).
The modified content is as follows:
“Excitingly, we found the evidence that PA28γ interacts with and stabilizes C1QBP. We speculate that aberrantly accumulated C1QBP enhances the function of mitochondrial OXPHOS and leads to the production of additional ATP and ROS by activating the expression and function of OPA1, MNF1, MFN2 and mitochondrial respiratory chain complex proteins.”
“Our study reveals that PA28γ interacts with C1QBP and stabilizes C1QBP at the protein level. Therefore, we speculate that the binding sites of PA28γ and C1QBP may mask the specific post-translational modification sites of C1QBP and inhibit its degradation.”
“Mitochondrial fusion, crucial for oxidative metabolism and cell proliferation, is regulated by MFN1, MFN2, and OPA1. The first two fuse with the outer mitochondrial membrane, while the last fuses with the inner mitochondrial membrane (Westermann, 2010).”
(5) Figure 6 was not referred to in the text. In this figure, PA28g and C1QBP are located in the inner membrane and matrix. Has this been determined? What is the blue ovals that are intermediaries of PA28g/C1QBP and OPA1/MFN1/MFN2?
Thank you very much for the important comments. According to our immunofluorescence assay (Figure 2A), PA28γ is in both the nucleus and cytoplasm. A recent study has demonstrated that PA28γ can shuttle between the nucleus and cytoplasm, participating in various cellular processes. Furthermore, GeneCard information indicates that the subcellular localization of PA28γ includes the nucleus, cytoplasm and mitochondria (Author response image 1). In this article, we mainly focus on the functions of PA28γ and C1QBP located in the cytoplasm. Therefore, figure 6 mainly displays PA28γ and C1QBP in the cytoplasm. Based on your suggestion, we have made some modifications to make it more accurate in revised figure (Revised Figure 6).
Author response image 1.
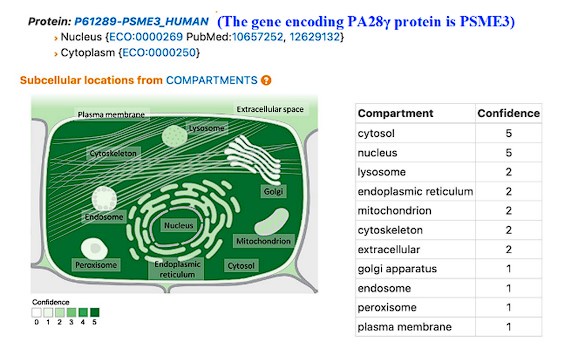
Author response:
The following is the authors’ response to the original reviews.
eLife Assessment
This study uses state-of-the-art methods to label endogenous dopamine receptors in a subset of Drosophila mushroom body neuronal types. The authors report that DopR1 and Dop2R receptors, which have opposing effects in intracellular cAMP, are present in axons termini of Kenyon cells, as well as those of two classes of dopaminergic neurons that innervate the mushroom body indicative of autocrine modulation by dopaminergic neurons. Additional experiments showing opposing effects of starvation on DopR1 and DopR2 levels in mushroom body neurons are consistent with a role for dopamine receptor levels increasing the efficiency of learned food-odour associations in starved flies. Supported by solid data, this is a valuable contribution to the field.
We thank the editors for the assessment, but request to change “DopR2” to “Dop2R”. The dopamine receptors in Drosophila have confusing names, but what we characterized in this study are called Dop1R1 (according to the Flybase; aka DopR1, dDA1, Dumb) and Dop2R (ibid; aka Dd2R). DopR2 is the name of a different dopamine receptor.
Public Reviews:
Reviewer #1 (Public Review):
Summary:
This is an important and interesting study that uses the split-GFP approach. Localization of receptors and correlating them to function is important in understanding the circuit basis of behavior.
Strengths:
The split-GFP approach allows visualization of subcellular enrichment of dopamine receptors in the plasma membrane of GAL4-expressing neurons allowing for a high level of specificity.
The authors resolve the presynaptic localization of DopR1 and Dop2R, in "giant" Drosophila neurons differentiated from cytokinesis-arrested neuroblasts in culture as it is not clear in the lobes and calyx.
Starvation-induced opposite responses of dopamine receptor expression in the PPL1 and PAM DANs provide key insights into models of appetitive learning.
Starvation-induced increase in D2R allows for increased negative feedback that the authors test in D2R knockout flies where appetitive memory is diminished.
This dual autoreceptor system is an attractive model for how amplitude and kinetics of dopamine release can be fine-tuned and controlled depending on the cellular function and this paper presents a good methodology to do it and a good system where the dynamics of dopamine release can be tested at the level of behavior.
Weaknesses:
LI measurements of Kenyon cells and lobes indicate that Dop2R was approximately twice as enriched in the lobe as the average density across the whole neuron, while the lobe enrichment of Dop1R1 was about 1.5 times the average, are these levels consistent during different times of the day and the state of the animal. How were these conditions controlled and how sensitive are receptor expression to the time of day of dissection, staining, etc.
To answer this question, we repeated the experiment in two replicates at different times of day and confirmed that the receptor localization was consistent (Figure 3 – figure supplement 1); LI measurements showed that Dop2R is enriched more in the lobe and less in the calyx compared to Dop1R1 (Figure 3D). The states of animals that could affect LI (e.g. feeding state and anesthesia for sorting, see methods) were kept constant.
The authors assume without discussion as to why and how presynaptic enrichment of these receptors is similar in giant neurons and MB.
In the revision, we added a short summary to recapitulate that the giant neurons exhibit many characteristics of mature neurons (Lines #152-156): "Importantly, these giant neurons exhibit characteristics of mature neurons, including firing patterns (Wu et al., 1990; Yao & Wu, 2001; Zhao & Wu, 1997) and acetylcholine release (Yao et al., 2000), both of which are regulated by cAMP and CaMKII signaling (Yao et al., 2000; Yao & Wu, 2001; Zhao & Wu, 1997)." In addition, we found punctate Brp accumulations localized to the axon terminals of the giant neurons (former Figure 4D and 4E). Therefore, the giant neuron serves as an excellent model to study the presynaptic localization of dopamine receptors in isolated large cells.
Figures 1-3 show the expensive expression of receptors in alpha and beta lobes while Figure 5 focusses on PAM and localization in γ and β' projections of PAM leading to the conclusion that presynaptic dopamine neurons express these and have feedback regulation. Consistency between lobes or discussion of these differences is important to consider.
In the revised manuscript, we show data in the γ KCs (Figure 4C, Figure 5 - figure supplement 1) in addition to α/β KCs, and demonstrate the consistent synaptic localization of Dop1R1 and Dop2R as in α/β KCs (Figure 4B and 5A).
Receptor expression in any learning-related MBONs is not discussed, and it would be intriguing as how receptors are organized in those cells. Given that these PAMs input to both KCs and MBONs these will have to work in some coordination.
The subcellular localization of dopamine receptors in MBONs indeed provides important insights into the site of dopaminergic signaling in these neurons (Takemura et al., 2017; Pavlowsky et al., 2018; Pribbenow et al., 2022). Therefore, we added new data for Dop1R1 and Dop2R in MBON-γ1pedc>αβ (Figure 6). Interestingly, these receptors are localized to in the dendritic projection in the γ1 compartment as well as presynaptic boutons (Figure 6).
Although authors use the D2R enhancement post starvation to show that knocking down receptors eliminated appetitive memory, the knocking out is affecting multiple neurons within this circuit including PAMs and KCs. How does that account for the observed effect? Are those not important for appetitive learning?
In the appetitive memory experiment (Figure 9C), we knocked down Dop2R only in the select neurons of the PPL1 cluster, and this manipulation does not directly affect Dop2R expression in PAMs and KCs.
Starvation-induced enhancement of Dop2R expression in the PPL1 neurons (Figure 8F) would attenuate their outputs and therefore disinhibit expression of appetitive memory in starved flies (Krashes et al., 2009). Consistently, Dop2R knock-down in PPL1 impaired appetitive memory in starved flies (Figure 9C). We revised the corresponding text to make this point clearer (Lines #224227).
The evidence for fine-tuning is completely based on receptor expression and one behavioral outcome which could result from many possibilities. It is not clear if this fine-tuning and presynaptic feedback regulation-based dopamine release is a clear possibility. Alternate hypotheses and outcomes could be considered in the model as it is not completely substantiated by data at least as presented.
The reviewer’s concern is valid, and the presynaptic dopamine tuning by autoreceptors may need more experimental support. We therefore additionally discussed another possibility (Lines #289-291): “Alternatively, these presynaptic receptors could potentially receive extrasynaptic dopamine released from other DANs. Therefore, the autoreceptor functions need to be experimentally clarified by manipulating the receptor expression in DANs.”
Reviewer #2 (Public Review):
Summary:
Hiramatsu et al. investigated how cognate neurotransmitter receptors with antagonizing downstream effects localize within neurons when co-expressed. They focus on mapping the localization of the dopaminergic Dop1R1 and Dop2R receptors, which correspond to the mammalian D1- and D2-like dopamine receptors, which have opposing effects on intracellular cAMP levels, in neurons of the Drosophila mushroom body (MB). To visualize specific receptors in single neuron types within the crowded MB neuropil, the authors use existing dopamine receptor alleles tagged with 7 copies of split GFP to target reconstitution of GFP tags only in the neurons of interest as a read-out of receptor localization. The authors show that both Dop1R1 and Dop2R, with differing degrees, are enriched in axonal compartments of both the Kenyon Cells cholinergic presynaptic inputs and in different dopamine neurons (DANs), which project axons to the MB. Co-localization studies of dopamine receptors with the presynaptic marker Brp suggest that Dop1R1 and, to a larger extent Dop2R, localize in the proximity of release sites. This localization pattern in DANs suggests that Dop1R1 and Dop2R work in dual-feedback regulation as autoreceptors. Finally, they provide evidence that the balance of Dop1R1 and Dop2R in the axons of two different DAN populations is differentially modulated by starvation and that this regulation plays a role in regulating appetitive behaviors.
Strengths:
The authors use reconstitution of GFP fluorescence of split GFP tags knocked into the endogenous locus at the C-terminus of the dopamine receptors as a readout of dopamine receptor localization. This elegant approach preserves the endogenous transcriptional and post-transcriptional regulation of the receptor, which is essential for studies of protein localization.
The study focuses on mapping the localization of dopamine receptors in neurons of the mushroom body. This is an excellent choice of system to address the question posed in this study, as the neurons are well-studied, and their connections are carefully reconstructed in the mushroom body connectome. Furthermore, the role of this circuit in different behaviors and associative memory permits the linking of patterns of receptor localization to circuit function and resulting behavior. Because of these features, the authors can provide evidence that two antagonizing dopamine receptors can act as autoreceptors within the axonal compartment of MB innervating DANs. The differential regulation of the balance of the two receptors under starvation in two distinct DAN innervations provides evidence of the role that regulation of this balance can play in circuit function and behavioral output.
Weaknesses:
The approach of using endogenously tagged alleles to study localization is a strength of this study, but the authors do not provide sufficient evidence that the insertion of 7 copies of split GFP to the C terminus of the dopamine receptors does not interfere with the endogenous localization pattern or function. Both sets of tagged alleles (1X Venus and 7X split GFP tagged) were previously reported (Kondo et al., 2020), but only the 1X Venus tagged alleles were further functionally validated in assays of olfactory appetitive memory. Despite the smaller size of the 7X split-GFP array tag knocked into the same location as the 1X venus tag, the reconstitution of 7 copies of GFP at the C terminus of the dopamine receptor, might substantially increase the molecular bulk at this site, potentially impeding the function of the receptor more significantly than the smaller, single Venus tag. The data presented by Kondo et al. 2020, is insufficient to conclude that the two alleles are equivalent.
In the revision, we validated the function of these engineered receptors by a new set of olfactory learning experiments. Both these receptors in KCs were shown to be required for aversive memory (Kim et al., 2007, Scholz-Kornehl et al., 2016). As in the anatomical experiments, we induced GFP110 expression in KC of the flies homozygous for 7xGFP<sub>11</sub>-tagged receptors using MB-Switch and 3 days of RU486 feeding o. We confirmed STM performance of these flies were not significantly different from the control (Figure 2 – figure supplement 1). Thus, these fusion receptors are functional.
The authors' conclusion that the receptors localize to presynaptic sites is weak. The analysis of the colocalization of the active zone marker Brp whole-brain staining with dopamine receptors labeled in specific neurons is insufficient to conclude that the receptors are localized at presynaptic sites. Given the highly crowded neuropil environment, the data cannot differentiate between the receptor localization postsynaptic to a dopamine release site or at a presynaptic site within the same neuron. The known distribution of presynaptic sites within the neurons analyzed in the study provides evidence that the receptors are enriched in axonal compartments, but co-labeling of presynaptic sites and receptors in the same neuron or super-resolution methods are needed to provide evidence of receptor localization at active zones. The data presented in Figures 5K-5L provides compelling evidence that the receptors localize to neuronal varicosities in DANs where the receptors could play a role as autoreceptors.
Given the highly crowded environment of the mushroom body neuropil, the analysis of dopamine receptor localization in Kenyon cells is not conclusive. The data is sufficient to conclude that the receptors are preferentially localizing to the axonal compartment of Kenyon cells, but co-localization with brain-wide Brp active zone immunostaining is not sufficient to determine if the receptor localizes juxtaposed to dopaminergic release sites, in proximity of release sites in Kenyon cells, or both.
To better resolve the microcircuits of KCs, we triple-labeled the plasma membrane and DAR::rGFP in KCs, and Brp, and examined their localizations with high-resolution imaging with Airyscan. This strategy revealed the receptor clusters associated with Brp accumulation within KCs (Figure 4). To further verify the association of DARs and active zones within KCs, we co-expressed Brp<sup>short</sup>::mStraw and GFP<sub>1-10</sub> and confirmed their colocalization (Figure 5A), suggesting presynaptic localization of DARs in KCs. With these additional characterizations, we now discuss the significance of receptors at the presynaptic sites of KCs.
Recommendations for the authors:
Reviewer #1 (Recommendations For The Authors):
This is an important and interesting study that uses the split-GFP approach. Localization of receptors and correlating them to function is important in understanding the circuit basis of behavior.
For Figure 1, the authors show PAM, PPL1 neurons, and the ellipsoid body as a validation of their tools (Dop1R1-T2A-GAL4 and Dop2R-T2A-GAL4) and the idea that these receptors are colocalized. However, it appears that the technique was applied to the whole brain so it would be great to see the whole brain to understand how much labelling is specific and how stochastic. Methods could include how dissection conditions were controlled and how sensitive are receptor expression to the time of day of dissection, staining, etc.
The expression patterns of the receptor T2A-GAL4 lines (Figure 1A and 1B) are consistent in the multiple whole brains (Kondo et al., 2020, Author response image 1).
Author response image 1.
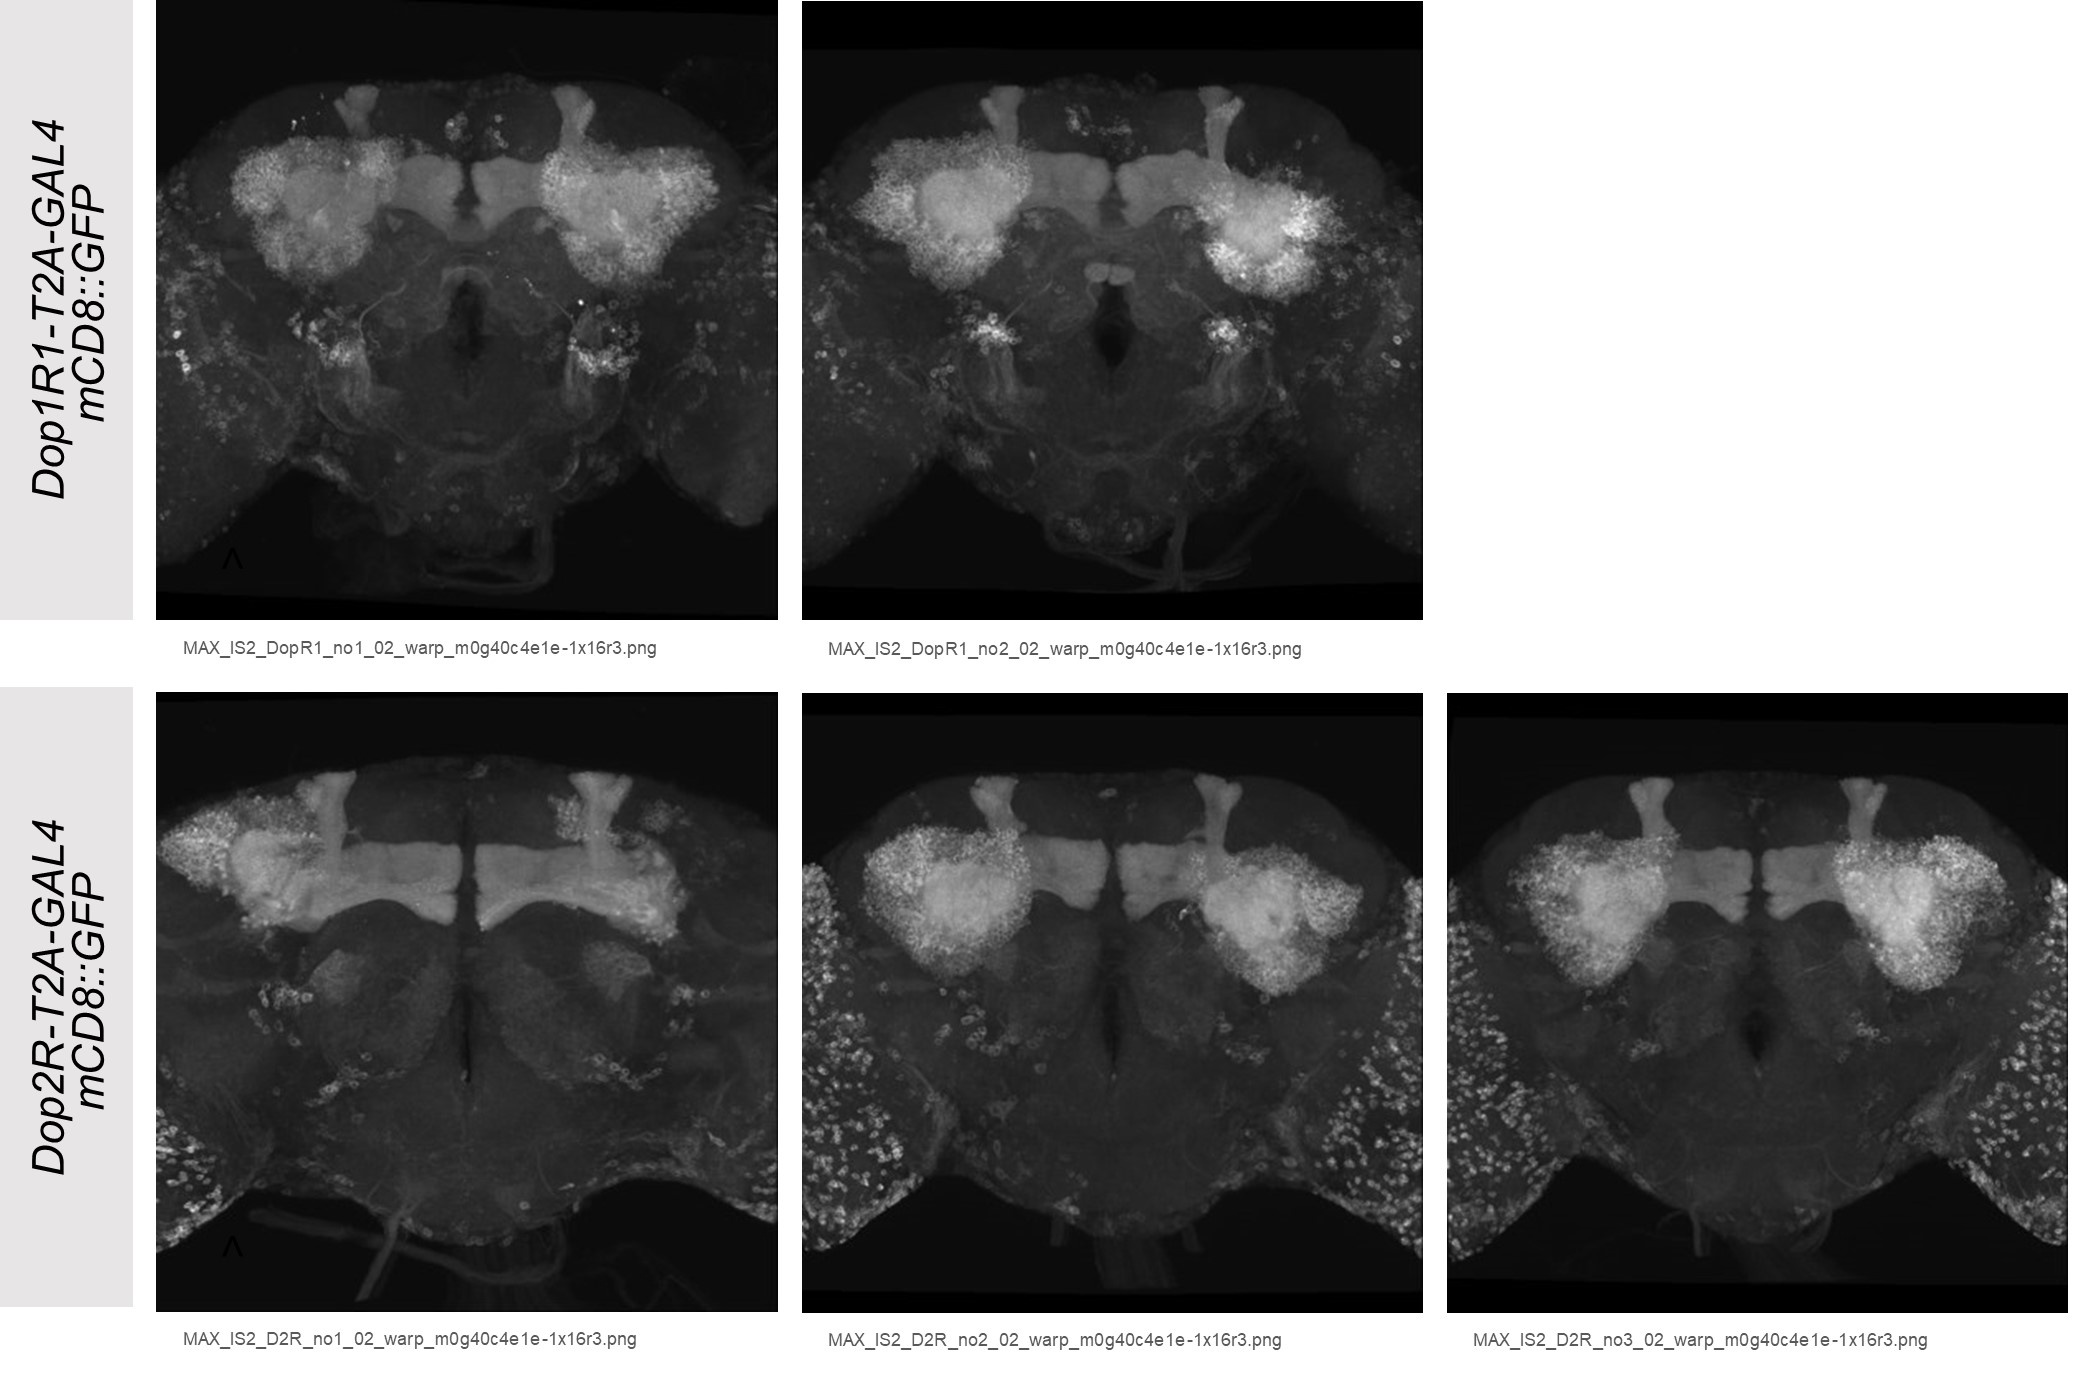
The significance of the expression of these two receptors in an active zone is not clearly discussed and presynaptic localization is not elaborated on. Would something like expansion microscopy be useful in resolving this? It would be important to discuss that as giant neurons in culture don't replicate many aspects of the MB system.
In the revised manuscript, we elaborated discussion regarding the function of the two antagonizing receptors at the AZ (Lines #226-275).
Does MB-GeneSwitch > GFP1-1 reliably express in gamma lobes? Most of the figures show alpha/beta lobes.
Yes. MB-GeneSwitch is also expressed in γ KCs, but weakly. 12 hours of RU486 feeding, which we did in the previous experiments, was insufficient to induce GFP reconstitution in the γ KCs. By extending the time of transgene induction, we visualized expression of Dop1R1 and Dop2R more clearly in γ KCs. Their localization is similar to that in the α/β KCs (Figure 4C, Figure 5 - figure supplement 1).
Figure 6, y-axis says protein level. At first, I thought it was related to starvation so maybe authors can be more specific as the protein level doesn't indicate any aspect of starvation.
We appreciate this comment, and the labels on the y-axis were now changed to “rGFP levels” (Figure 8C and 8F, Figure 8 - figure supplement 1B, 1D and 1F).
Reviewer #2 (Recommendations For The Authors):
Title:
The title of the manuscript focuses on the tagging of the receptors and their synaptic enrichment.
Given that the alleles used in the study were generated in a previously published study (Kondo et al, 2020), which describes the receptor tagging and that the data currently provided is insufficient to conclude that the receptors are localizing to synapses, the title should be changed to reflect the focus on localizing antagonistic cognate neurotransmitter receptors in the same neuron and their putative role as autoreceptors in DANs.
Following this advice, we removed the methodology from the title and revised it to “Synaptic enrichment and dynamic regulation of the two opposing dopamine receptors within the same neurons”.
Minor issues with text and figures:
Figure 1
A conclusion from Figure 1 is that the two receptors are co-expressed in Kenyon cells. Please provide panels equivalent to the ones shown in D-G, with Kenyon cells cell bodies, or mark these cells in the existing panels, if present. Line 111 refers to panel 1D as the Kenyon cells panel, which is currently a PAM panel.
We added images for coexpression of these receptors in the cell bodies of KCs (Figure 1 - figure supplement 1) and revised the text accordingly (Lines #89-90).
Given that most of the study centers on visualizing receptor localization, it would benefit the reader to include labels in Figure 1 that help understand that these panels reflect expression patterns rather than receptor localization. For instance, rCD2::GFP could be indicated in the Dop1R1-LexA panels.
As suggested, labels were added to indicate the UAS and lexAop markers (Figure 1D, 1E, 1G-1I and Figure 1 – figure supplement 1).
Given that panels D-E focus on the cell bodies of the neurons, it could be beneficial for the reader to present the ellipsoid body neurons using a similar view that only shows the cell bodies. Similarly, one could just show the glial cell bodies .
We now show the cell bodies of ring neurons (Figure 1G) and ensheathing glia (Figure 1I).
For panel 1E, please indicate the subset of PPL1 neurons that both expressed Dop1R1 and Dop2R, as indicated in the text, as it is currently unclear from the image.
Dop1R1-T2A-LexA was barely detected in all PPL1 (Figure 1E). We corrected the confusing text (Lines #95-96).
Figure 2
The cartoon of the cell-type-specific labeling should show that the tag is 7XFP-11 and the UAScomponent FP-10, as the current cartoon leads the reader to conclude that the receptors are tagged with a single copy of split GFP. The detail that the receptors are tagged with 7 copies of split GFP is only provided through the genotype of the allele in the resource table. This design aspect should be made clear in the figure and the text when describing the allele and approach used to tag receptors in specific neuron types.
We now added the construct design in the scheme (Figure 2A) and revised the corresponding text (Line #101-103).
Panel A. The arrow representing the endogenous promoter in the yellow gene representation should be placed at the beginning of the coding sequence. Currently, the different colors of what I assume are coding (yellow) and non-coding (white) transcript regions are not described in the legend. I would omit these or represent them in the same color as thinner boxes if the authors want to emphasize that the tag is inserted at the C terminus within the endogenous locus.
The color scheme was revised to be more consistent and intuitive (Figure 2A).
Figure 3
Labels of the calyx and MB lobes would benefit readers not as familiar with the system used in the study. In addition, it would be beneficial to the reader to indicate in panel A the location of the compartments analyzed in panel H (e.g., peduncle, α3).
Figure 3A was amended to clearly indicate the analyzed MB compartments.
Adding frontal and sagittal to panels B-E, as in Figure 2, would help the reader interpret the data.
In Figure 3B, “Frontal” and “Sagittal” were indicated.
Panel F-G. A scale bar should be provided for the data shown in the insets. Could the author comment on the localization of Dop1R1 in KCs? The data in the current panel suggests that only a subset of KCs express high levels of receptors in their axons, as a portion of the membrane is devoid of receptor signals. This would be in line with differential dopamine receptor expression in subsets of Kenyon cells, as shown in Kondo et al., 2020, which is currently not commented on in the paper.
We confirmed that the majority of the KCs express both Dop1R1 and Dop2R genes (Figure 1 - figure supplement 1). LIs should be compared within the same cells rather than the differences of protein levels between cell types as they also reflect the GAL4 expression levels.
Panel H. Some P values are shown as n.s. (p> 0.05). Other non-significant p values in this panel and in other figures throughout the paper are instead reported (e.g. peduncle P=0.164). For consistency, please report the values as n.s. as indicated in the methods for all non-significant tests in this panel and throughout the manuscript.
We now present the new dataset, and the graph represents the appropriate statistical results (Figure 3D; see the methods section for details).
The methods of labeling the receptors through the expression of the GeneSwitch-controlled GFP1-10 in Kenyon cells induced by RU486 are not provided in the methods. Please provide a description of this as referenced in the figure legend and the genotypes used in the analysis shown in the panels.
The method of RU486 feeding has been added. We apologize for the missing method.
Figure 4
Please provide scale bars for the inset in panels A-B.
Scale bars were added to all confocal images.
The current analysis cannot distinguish between postsynaptic and presynaptic dopamine receptors in KCs, and the figure title should reflect this.
We now present the new data dopamine receptors in KCs and clearly distinguish Brp clusters of the KCs and other cell types (Figure 4, Figure 5).
The reader could benefit from additional details of using the giant neuron model, as it is not commonly used, and it is not clear how to relate this to interpret the localization of dopaminergic receptors within Kenyon cells. The use of the venus-tagged receptor variant should be introduced in the text, as using a different allele currently lacks context. Figures 4F-4J show that the receptor is localizing throughout the neuron. Quantifying the fraction of receptor signal colocalizing with Brp could aid in interpreting the data. However, it would still not be clear how to interpret this data in the context of understanding the localization of the receptors in neurons within fly brain circuits. In the absence of additional data, the data provided in Figure 4 is inconclusive and could be omitted, keeping the focus of the study on the analysis of the two receptors in DANs. Co-expressing a presynaptic marker in Kenyon cells (e.g., by expressing Brp::SNAP) in conjunction with rGFP labeled receptor would provide additional evidence of the relationship of release sites in Kenyon cells and tagged dopamine receptors in these same cells and could add evidence in support to the current conclusion.
Following the advice, we added a short summary to recapitulate that the giant neurons exhibit many characteristics of mature neurons (Lines #152-156): "Importantly, these giant neurons exhibit characteristics of mature neurons, including firing patterns (Wu et al., 1990; Yao & Wu, 2001; Zhao & Wu, 1997) and acetylcholine release (Yao et al., 2000), both of which are regulated by cAMP and CaMKII signaling (Yao et al., 2000; Yao & Wu, 2001; Zhao & Wu, 1997)." Therefore, the giant neuron serves as an excellent model to study the presynaptic localization in large cells in isolation.
To clarify polarized localization of Brp clusters and dopamine receptors but not "localizing throughout the neuron", we now show less magnified data (Figure 5C). It clearly demonstrates punctate Brp accumulations localized to the axon terminals of the giant neurons (former Figure 4D and 4E). This is the same membrane segment where Dop1R1 and Dop2R are localized (Figure 5C). Therefore, the association of Brp clusters and the dopamine receptors in the isolated giant neurons suggests that the subcellular localization in the brain neurons is independent of the circuit context.
As the giant neurons do not form intermingled circuits, venus-tagged receptors are sufficient for this experiment and simpler in genetics.
Following the suggestion to clarify the AZ association of the receptors in KCs, we coexpressed Brpshort-mStraw and GFP1-10 in KCs and confirmed their colocalization (Figure 5A).
Figure 6
The data and analysis show that starvation induces changes in the α3 compartment in PPL1 neurons only, while the data provided shows no significant change for PPL1 neurons innervating other MB compartments. This should be clearly stated in lines 174-175, as it is implied that there is a difference in the analysis for compartments other than α3. Panel L of Figure 6 - supplement 1 shows no significant change for all three compartments analyzed and should be indicated as n.s. in all instances, as stated in the methods.
We revised the text to clarify that the starvation-induced differences of Dop2R expression were not significant (Lines #217-219). The reason to highlight the α3 compartment is that both Dop1R1 and Dop2R are coexpressed in this PPL1 neuron (Figure 8D).
Additional minor comments:
There are a few typos and errors throughout the manuscript. The text should be carefully proofread to correct these. Here are the ones that came to my attention:
Please reference all figure panels in the text. For instance, Figure 3A is not mentioned and should be revised in line 112 as Figure 3A-E.
Lines 103-104. The sentence "LI was visualized as the color of the membrane signals" is unclear and should be revised.
Figure 4 legend - dendritic claws should likely be B and C and not B and E.
Lines 147 - Incorrect figure panels, should be 5C-L or 5D-E.
Line 241 - DNAs should be DANs.
Methods - please define what the abbreviation CS stands for.
We really appreciate for careful reading of this reviewer. All these were corrected.
Author response:
The following is the authors’ response to the original reviews.
eLife Assessment
This valuable study investigates how the neural representation of individual finger movements changes during the early period of sequence learning. By combining a new method for extracting features from human magnetoencephalography data and decoding analyses, the authors provide incomplete evidence of an early, swift change in the brain regions correlated with sequence learning, including a set of previously unreported frontal cortical regions. The addition of more control analyses to rule out that head movement artefacts influence the findings, and to further explain the proposal of offline contextualization during short rest periods as the basis for improvement performance would strengthen the manuscript.
We appreciate the Editorial assessment on our paper’s strengths and novelty. We have implemented additional control analyses to show that neither task-related eye movements nor increasing overlap of finger movements during learning account for our findings, which are that contextualized neural representations in a network of bilateral frontoparietal brain regions actively contribute to skill learning. Importantly, we carried out additional analyses showing that contextualization develops predominantly during rest intervals.
Public Reviews:
Reviewer #1 (Public review):
Summary:
This study addresses the issue of rapid skill learning and whether individual sequence elements (here: finger presses) are differentially represented in human MEG data. The authors use a decoding approach to classify individual finger elements and accomplish an accuracy of around 94%. A relevant finding is that the neural representations of individual finger elements dynamically change over the course of learning. This would be highly relevant for any attempts to develop better brain machine interfaces - one now can decode individual elements within a sequence with high precision, but these representations are not static but develop over the course of learning.
Strengths:
The work follows a large body of work from the same group on the behavioural and neural foundations of sequence learning. The behavioural task is well established and neatly designed to allow for tracking learning and how individual sequence elements contribute. The inclusion of short offline rest periods between learning epochs has been influential because it has revealed that a lot, if not most of the gains in behaviour (ie speed of finger movements) occur in these socalled micro-offline rest periods. The authors use a range of new decoding techniques, and exhaustively interrogate their data in different ways, using different decoding approaches. Regardless of the approach, impressively high decoding accuracies are observed, but when using a hybrid approach that combines the MEG data in different ways, the authors observe decoding accuracies of individual sequence elements from the MEG data of up to 94%.
We have previously showed that neural replay of MEG activity representing the practiced skill was prominent during rest intervals of early learning, and that the replay density correlated with micro-offline gains (Buch et al., 2021). These findings are consistent with recent reports (from two different research groups) that hippocampal ripple density increases during these inter-practice rest periods, and predict offline learning gains (Chen et al., 2024; Sjøgård et al., 2024). However, decoder performance in our earlier work (Buch et al., 2021) left room for improvement. Here, we reported a strategy to improve decoding accuracy that could benefit future studies of neural replay or BCI using MEG.
Weaknesses:
There are a few concerns which the authors may well be able to resolve. These are not weaknesses as such, but factors that would be helpful to address as these concern potential contributions to the results that one would like to rule out. Regarding the decoding results shown in Figure 2 etc, a concern is that within individual frequency bands, the highest accuracy seems to be within frequencies that match the rate of keypresses. This is a general concern when relating movement to brain activity, so is not specific to decoding as done here. As far as reported, there was no specific restraint to the arm or shoulder, and even then it is conceivable that small head movements would correlate highly with the vigor of individual finger movements. This concern is supported by the highest contribution in decoding accuracy being in middle frontal regions - midline structures that would be specifically sensitive to movement artefacts and don't seem to come to mind as key structures for very simple sequential keypress tasks such as this - and the overall pattern is remarkably symmetrical (despite being a unimanual finger task) and spatially broad. This issue may well be matching the time course of learning, as the vigor and speed of finger presses will also influence the degree to which the arm/shoulder and head move. This is not to say that useful information is contained within either of the frequencies or broadband data. But it raises the question of whether a lot is dominated by movement "artefacts" and one may get a more specific answer if removing any such contributions.
Reviewer #1 expresses concern that the combination of the low-frequency narrow-band decoder results, and the bilateral middle frontal regions displaying the highest average intra-parcel decoding performance across subjects is suggestive that the decoding results could be driven by head movement or other artefacts.
Head movement artefacts are highly unlikely to contribute meaningfully to our results for the following reasons. First, in addition to ICA denoising, all “recordings were visually inspected and marked to denoise segments containing other large amplitude artifacts due to movements” (see Methods). Second, the response pad was positioned in a manner that minimized wrist, arm or more proximal body movements during the task. Third, while online monitoring of head position was not performed for this study, it was assessed at the beginning and at the end of each recording. The head was restrained with an inflatable air bladder, and head movement between the beginning and end of each scan did not exceed 5mm for all participants included in the study.
The Reviewer states a concern that “it is conceivable that small head movements would correlate highly with the vigor of individual finger movements”. We agree that despite the steps taken above, it is possible that minor head movements could still contribute to some remaining variance in the MEG data in our study. However, such correlations between small head movements and finger movements could only meaningfully contribute to decoding performance if: (A) they were consistent and pervasive throughout the recording (which might not be the case if the head movements were related to movement vigor and vigor changed over time); and (B) they systematically varied between different finger movements, and also between the same finger movement performed at different sequence locations (see 5-class decoding performance in Figure 4B). The possibility of any head movement artefacts meeting all these conditions is unlikely. Alternatively, for this task design a much more likely confound could be the contribution of eye movement artefacts to the decoder performance (an issue raised by Reviewer #3 in the comments below).
Remember from Figure 1A in the manuscript that an asterisk marks the current position in the sequence and is updated at each keypress. Since participants make very few performance errors, the position of the asterisk on the display is highly correlated with the keypress being made in the sequence. Thus, it is possible that if participants are attending to the visual feedback provided on the display, they may generate eye movements that are systematically related to the task. Since we did record eye movements simultaneously with the MEG recordings (EyeLink 1000 Plus; Fs = 600 Hz), we were able to perform a control analysis to address this question. For each keypress event during trials in which no errors occurred (which is the same time-point that the asterisk position is updated), we extracted three features related to eye movements: 1) the gaze position at the time of asterisk position update (triggered by a KeyDown event), 2) the gaze position 150ms later, and 3) the peak velocity of the eye movement between the two positions. We then constructed a classifier from these features with the aim of predicting the location of the asterisk (ordinal positions 1-5) on the display. As shown in the confusion matrix below (Author response image 1), the classifier failed to perform above chance levels (overall cross-validated accuracy = 0.21817):
Author response image 1.
Confusion matrix showing that three eye movement features fail to predict asterisk position on the task display above chance levels (Fold 1 test accuracy = 0.21718; Fold 2 test accuracy = 0.22023; Fold 3 test accuracy = 0.21859; Fold 4 test accuracy = 0.22113; Fold 5 test accuracy = 0.21373; Overall cross-validated accuracy = 0.2181). Since the ordinal position of the asterisk on the display is highly correlated with the ordinal position of individual keypresses in the sequence, this analysis provides strong evidence that keypress decoding performance from MEG features is not explained by systematic relationships between finger movement behavior and eye movements (i.e. – behavioral artefacts) (end of figure legend).
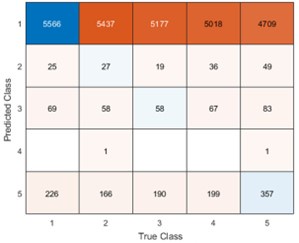
Remember that the task display does not provide explicit feedback related to performance, only information about the present position in the sequence. Thus, it is possible that participants did not actively attend to the feedback. In fact, inspection of the eye position data revealed that on majority of trials, participants displayed random-walk-like gaze patterns around a central fixation point located near the center of the screen. Thus, participants did not attend to the asterisk position on the display, but instead intrinsically generated the action sequence. A similar realworld example would be manually inputting a long password into a secure online application. In this case, one intrinsically generates the sequence from memory and receives similar feedback about the password sequence position (also provided as asterisks) as provided in the study task – feedback which is typically ignored by the user.
The minimal participant engagement with the visual task display observed in this study highlights another important point – that the behavior in explicit sequence learning motor tasks is highly generative in nature rather than reactive to stimulus cues as in the serial reaction time task (SRTT). This is a crucial difference that must be carefully considered when designing investigations and comparing findings across studies.
We observed that initial keypress decoding accuracy was predominantly driven by contralateral primary sensorimotor cortex in the initial practice trials before transitioning to bilateral frontoparietal regions by trials 11 or 12 as performance gains plateaued. The contribution of contralateral primary sensorimotor areas to early skill learning has been extensively reported in humans and non-human animals.(Buch et al., 2021; Classen et al., 1998; Karni et al., 1995; Kleim et al., 1998) Similarly, the increased involvement of bilateral frontal and parietal regions to decoding during early skill learning in the non-dominant hand is well known. Enhanced bilateral activation in both frontal and parietal cortex during skill learning has been extensively reported (Doyon et al., 2002; Grafton et al., 1992; Hardwick et al., 2013; Kennerley et al., 2004; Shadmehr & Holcomb, 1997; Toni, Ramnani, et al., 2001), and appears to be even more prominent during early fine motor skill learning in the non-dominant hand (Lee et al., 2019; Sawamura et al., 2019). The frontal regions identified in these studies are known to play crucial roles in executive control (Battaglia-Mayer & Caminiti, 2019), motor planning (Toni, Thoenissen, et al., 2001), and working memory (Andersen & Buneo, 2002; Buneo & Andersen, 2006; Shadmehr & Holcomb, 1997; Toni, Ramnani, et al., 2001; Wolpert et al., 1998) processes, while the same parietal regions are known to integrate multimodal sensory feedback and support visuomotor transformations (Andersen & Buneo, 2002; Buneo & Andersen, 2006; Shadmehr & Holcomb, 1997; Toni, Ramnani, et al., 2001; Wolpert et al., 1998), in addition to working memory (Grover et al., 2022). Thus, it is not surprising that these regions increasingly contribute to decoding as subjects internalize the sequential task. We now include a statement reflecting these considerations in the revised Discussion.
A somewhat related point is this: when combining voxel and parcel space, a concern is whether a degree of circularity may have contributed to the improved accuracy of the combined data, because it seems to use the same MEG signals twice - the voxels most contributing are also those contributing most to a parcel being identified as relevant, as parcels reflect the average of voxels within a boundary. In this context, I struggled to understand the explanation given, ie that the improved accuracy of the hybrid model may be due to "lower spatially resolved whole-brain and higher spatially resolved regional activity patterns".
We disagree with the Reviewer’s assertion that the construction of the hybrid-space decoder is circular for the following reasons. First, the base feature set for the hybrid-space decoder constructed for all participants includes whole-brain spatial patterns of MEG source activity averaged within parcels. As stated in the manuscript, these 148 inter-parcel features reflect “lower spatially resolved whole-brain activity patterns” or global brain dynamics. We then independently test how well spatial patterns of MEG source activity for all voxels distributed within individual parcels can decode keypress actions. Again, the testing of these intra-parcel spatial patterns, intended to capture “higher spatially resolved regional brain activity patterns”, is completely independent from one another and independent from the weighting of individual inter-parcel features. These intra-parcel features could, for example, provide additional information about muscle activation patterns or the task environment. These approximately 1150 intra-parcel voxels (on average, within the total number varying between subjects) are then combined with the 148 inter-parcel features to construct the final hybrid-space decoder. In fact, this varied spatial filter approach shares some similarities to the construction of convolutional neural networks (CNNs) used to perform object recognition in image classification applications (Srinivas et al., 2016). One could also view this hybrid-space decoding approach as a spatial analogue to common timefrequency based analyses such as theta-gamma phase amplitude coupling (θ/γ PAC), which assess interactions between two or more narrow-band spectral features derived from the same time-series data (Lisman & Jensen, 2013).
We directly tested this hypothesis – that spatially overlapping intra- and inter-parcel features portray different information – by constructing an alternative hybrid-space decoder (Hybrid<sub>Alt</sub>) that excluded average inter-parcel features which spatially overlapped with intra-parcel voxel features, and comparing the performance to the decoder used in the manuscript (Hybrid<sub>Orig</sub>). The prediction was that if the overlapping parcel contained similar information to the more spatially resolved voxel patterns, then removing the parcel features (n=8) from the decoding analysis should not impact performance. In fact, despite making up less than 1% of the overall input feature space, removing those parcels resulted in a significant drop in overall performance greater than 2% (78.15% ± 7.03% SD for Hybrid<sub>Orig</sub> vs. 75.49% ± 7.17% for Hybrid<sub>Alt</sub>; Wilcoxon signed rank test, z = 3.7410, p = 1.8326e-04; Author response image 2).
Author response image 2.
Comparison of decoding performances with two different hybrid approaches. Hybrid<sub>Alt</sub>: Intra-parcel voxel-space features of top ranked parcels and inter-parcel features of remaining parcels. Hybrid<sub>Orig</sub>: Voxel-space features of top ranked parcels and whole-brain parcel-space features (i.e. – the version used in the manuscript). Dots represent decoding accuracy for individual subjects. Dashed lines indicate the trend in performance change across participants. Note, that Hybrid<sub>Orig</sub> (the approach used in our manuscript) significantly outperforms the Hybrid<sub>Alt</sub> approach, indicating that the excluded parcel features provide unique information compared to the spatially overlapping intra-parcel voxel patterns (end of figure legend).
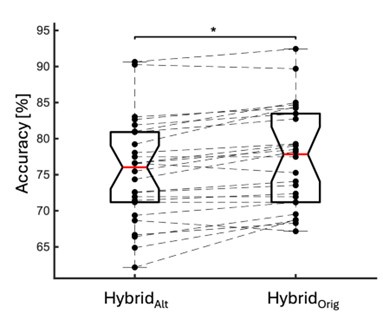
Firstly, there will be a relatively high degree of spatial contiguity among voxels because of the nature of the signal measured, i.e. nearby individual voxels are unlikely to be independent. Secondly, the voxel data gives a somewhat misleading sense of precision; the inversion can be set up to give an estimate for each voxel, but there will not just be dependence among adjacent voxels, but also substantial variation in the sensitivity and confidence with which activity can be projected to different parts of the brain. Midline and deeper structures come to mind, where the inversion will be more problematic than for regions along the dorsal convexity of the brain, and a concern is that in those midline structures, the highest decoding accuracy is seen.
We agree with the Reviewer that some inter-parcel features representing neighboring (or spatially contiguous) voxels are likely to be correlated, an important confound in connectivity analyses (Colclough et al., 2015; Colclough et al., 2016), not performed in our investigation.
In our study, correlations between adjacent voxels effectively reduce the dimensionality of the input feature space. However, as long as there are multiple groups of correlated voxels within each parcel (i.e. – the rank is greater than 1), the intra-parcel spatial patterns could meaningfully contribute to the decoder performance, as shown by the following results:
First, we obtained higher decoding accuracy with voxel-space features (74.51% ± 7.34% SD) compared to parcel space features (68.77% ± 7.6%; Figure 3B), indicating individual voxels carry more information in decoding the keypresses than the averaged voxel-space features or parcel space features. Second, individual voxels within a parcel showed varying feature importance scores in decoding keypresses (Author response image 3). This finding shows that correlated voxels form mini subclusters that are much smaller spatially than the parcel they reside within.
Author response image 3.:
Feature importance score of individual voxels in decoding keypresses: MRMR was used to rank the individual voxel space features in decoding keypresses and the min-max normalized MRMR score was mapped to a structural brain surface. Note that individual voxels within a parcel showed different contribution to decoding (end of figure legend).
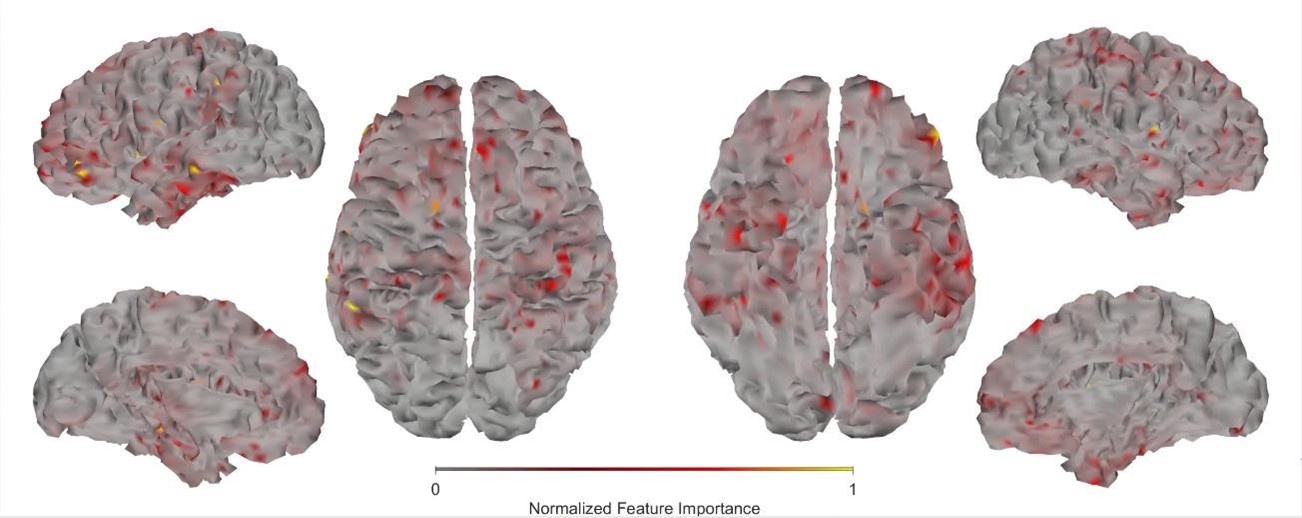
Some of these concerns could be addressed by recording head movement (with enough precision) to regress out these contributions. The authors state that head movement was monitored with 3 fiducials, and their time courses ought to provide a way to deal with this issue. The ICA procedure may not have sufficiently dealt with removing movement-related problems, but one could eg relate individual components that were identified to the keypresses as another means for checking. An alternative could be to focus on frequency ranges above the movement frequencies. The accuracy for those still seems impressive and may provide a slightly more biologically plausible assessment.
We have already addressed the issue of movement related artefacts in the first response above. With respect to a focus on frequency ranges above movement frequencies, the Reviewer states the “accuracy for those still seems impressive and may provide a slightly more biologically plausible assessment”. First, it is important to note that cortical delta-band oscillations measured with local field potentials (LFPs) in macaques is known to contain important information related to end-effector kinematics (Bansal et al., 2011; Mollazadeh et al., 2011) muscle activation patterns (Flint et al., 2012) and temporal sequencing (Churchland et al., 2012) during skilled reaching and grasping actions. Thus, there is a substantial body of evidence that low-frequency neural oscillatory activity in this range contains important information about the skill learning behavior investigated in the present study. Second, our own data shows (which the Reviewer also points out) that significant information related to the skill learning behavior is also present in higher frequency bands (see Figure 2A and Figure 3—figure supplement 1). As we pointed out in our earlier response to questions about the hybrid space decoder architecture (see above), it is likely that different, yet complimentary, information is encoded across different temporal frequencies (just as it is encoded across different spatial frequencies) (Heusser et al., 2016). Again, this interpretation is supported by our data as the highest performing classifiers in all cases (when holding all parameters constant) were always constructed from broadband input MEG data (Figure 2A and Figure 3—figure supplement 1).
One question concerns the interpretation of the results shown in Figure 4. They imply that during the course of learning, entirely different brain networks underpin the behaviour. Not only that, but they also include regions that would seem rather unexpected to be key nodes for learning and expressing relatively simple finger sequences, such as here. What then is the biological plausibility of these results? The authors seem to circumnavigate this issue by moving into a distance metric that captures the (neural network) changes over the course of learning, but the discussion seems detached from which regions are actually involved; or they offer a rather broad discussion of the anatomical regions identified here, eg in the context of LFOs, where they merely refer to "frontoparietal regions".
The Reviewer notes the shift in brain networks driving keypress decoding performance between trials 1, 11 and 36 as shown in Figure 4A. The Reviewer questions whether these shifts in brain network states underpinning the skill are biologically plausible, as well as the likelihood that bilateral superior and middle frontal and parietal cortex are important nodes within these networks.
First, previous fMRI work in humans assessed changes in functional connectivity patterns while participants performed a similar sequence learning task to our present study (Bassett et al., 2011). Using a dynamic network analysis approach, Bassett et al. showed that flexibility in the composition of individual network modules (i.e. – changes in functional brain region membership of orthogonal brain networks) is up-regulated in novel learning environments and explains differences in learning rates across individuals. Thus, consistent with our findings, it is likely that functional brain networks rapidly reconfigure during early learning of novel sequential motor skills.
Second, frontoparietal network activity is known to support motor memory encoding during early learning (Albouy et al., 2013; Albouy et al., 2012). For example, reactivation events in the posterior parietal (Qin et al., 1997) and medial prefrontal (Euston et al., 2007; Molle & Born, 2009) cortex (MPFC) have been temporally linked to hippocampal replay, and are posited to support memory consolidation across several memory domains (Frankland & Bontempi, 2005), including motor sequence learning (Albouy et al., 2015; Buch et al., 2021; F. Jacobacci et al., 2020). Further, synchronized interactions between MPFC and hippocampus are more prominent during early as opposed to later learning stages (Albouy et al., 2013; Gais et al., 2007; Sterpenich et al., 2009), perhaps reflecting “redistribution of hippocampal memories to MPFC” (Albouy et al., 2013). MPFC contributes to very early memory formation by learning association between contexts, locations, events and adaptive responses during rapid learning (Euston et al., 2012). Consistently, coupling between hippocampus and MPFC has been shown during initial memory encoding and during subsequent rest (van Kesteren et al., 2010; van Kesteren et al., 2012). Importantly, MPFC activity during initial memory encoding predicts subsequent recall (Wagner et al., 1998). Thus, the spatial map required to encode a motor sequence memory may be “built under the supervision of the prefrontal cortex” (Albouy et al., 2012), also engaged in the development of an abstract representation of the sequence (Ashe et al., 2006). In more abstract terms, the prefrontal, premotor and parietal cortices support novice performance “by deploying attentional and control processes” (Doyon et al., 2009; Hikosaka et al., 2002; Penhune & Steele, 2012) required during early learning (Doyon et al., 2009; Hikosaka et al., 2002; Penhune & Steele, 2012). The dorsolateral prefrontal cortex DLPFC specifically is thought to engage in goal selection and sequence monitoring during early skill practice (Schendan et al., 2003), all consistent with the schema model of declarative memory in which prefrontal cortices play an important role in encoding (Morris, 2006; Tse et al., 2007). Thus, several prefrontal and frontoparietal regions contributing to long term learning (Berlot et al., 2020) are also engaged in early stages of encoding. Altogether, there is strong biological support for the involvement of bilateral prefrontal and frontoparietal regions to decoding during early skill learning. We now address this issue in the revised manuscript.
If I understand correctly, the offline neural representation analysis is in essence the comparison of the last keypress vs the first keypress of the next sequence. In that sense, the activity during offline rest periods is actually not considered. This makes the nomenclature somewhat confusing. While it matches the behavioural analysis, having only key presses one can't do it in any other way, but here the authors actually do have recordings of brain activity during offline rest. So at the very least calling it offline neural representation is misleading to this reviewer because what is compared is activity during the last and during the next keypress, not activity during offline periods. But it also seems a missed opportunity - the authors argue that most of the relevant learning occurs during offline rest periods, yet there is no attempt to actually test whether activity during this period can be useful for the questions at hand here.
We agree with the Reviewer that our previous “offline neural representation” nomenclature could be misinterpreted. In the revised manuscript we refer to this difference as the “offline neural representational change”. Please, note that our previous work did link offline neural activity (i.e. – 16-22 Hz beta power (Bonstrup et al., 2019) and neural replay density (Buch et al., 2021) during inter-practice rest periods) to observed micro-offline gains.
Reviewer #2 (Public review):
Summary
Dash et al. asked whether and how the neural representation of individual finger movements is "contextualized" within a trained sequence during the very early period of sequential skill learning by using decoding of MEG signal. Specifically, they assessed whether/how the same finger presses (pressing index finger) embedded in the different ordinal positions of a practiced sequence (4-1-3-2-4; here, the numbers 1 through 4 correspond to the little through the index fingers of the non-dominant left hand) change their representation (MEG feature). They did this by computing either the decoding accuracy of the index finger at the ordinal positions 1 vs. 5 (index_OP1 vs index_OP5) or pattern distance between index_OP1 vs. index_OP5 at each training trial and found that both the decoding accuracy and the pattern distance progressively increase over the course of learning trials. More interestingly, they also computed the pattern distance for index_OP5 for the last execution of a practice trial vs. index_OP1 for the first execution in the next practice trial (i.e., across the rest period). This "off-line" distance was significantly larger than the "on-line" distance, which was computed within practice trials and predicted micro-offline skill gain. Based on these results, the authors conclude that the differentiation of representation for the identical movement embedded in different positions of a sequential skill ("contextualization") primarily occurs during early skill learning, especially during rest, consistent with the recent theory of the "micro-offline learning" proposed by the authors' group. I think this is an important and timely topic for the field of motor learning and beyond.
Strengths
The specific strengths of the current work are as follows. First, the use of temporally rich neural information (MEG signal) has a large advantage over previous studies testing sequential representations using fMRI. This allowed the authors to examine the earliest period (= the first few minutes of training) of skill learning with finer temporal resolution. Second, through the optimization of MEG feature extraction, the current study achieved extremely high decoding accuracy (approx. 94%) compared to previous works. As claimed by the authors, this is one of the strengths of the paper (but see my comments). Third, although some potential refinement might be needed, comparing "online" and "offline" pattern distance is a neat idea.
Weaknesses
Along with the strengths I raised above, the paper has some weaknesses. First, the pursuit of high decoding accuracy, especially the choice of time points and window length (i.e., 200 msec window starting from 0 msec from key press onset), casts a shadow on the interpretation of the main result. Currently, it is unclear whether the decoding results simply reflect behavioral change or true underlying neural change. As shown in the behavioral data, the key press speed reached 3~4 presses per second already at around the end of the early learning period (11th trial), which means inter-press intervals become as short as 250-330 msec. Thus, in almost more than 60% of training period data, the time window for MEG feature extraction (200 msec) spans around 60% of the inter-press intervals. Considering that the preparation/cueing of subsequent presses starts ahead of the actual press (e.g., Kornysheva et al., 2019) and/or potential online planning (e.g., Ariani and Diedrichsen, 2019), the decoder likely has captured these future press information as well as the signal related to the current key press, independent of the formation of genuine sequential representation (e.g., "contextualization" of individual press). This may also explain the gradual increase in decoding accuracy or pattern distance between index_OP1 vs. index_OP5 (Figure 4C and 5A), which co-occurred with performance improvement, as shorter inter-press intervals are more favorable for the dissociating the two index finger presses followed by different finger presses. The compromised decoding accuracies for the control sequences can be explained in similar logic. Therefore, more careful consideration and elaborated discussion seem necessary when trying to both achieve high-performance decoding and assess early skill learning, as it can impact all the subsequent analyses.
The Reviewer raises the possibility that (given the windowing parameters used in the present study) an increase in “contextualization” with learning could simply reflect faster typing speeds as opposed to an actual change in the underlying neural representation.
We now include a new control analysis that addresses this issue as well as additional re-examination of previously reported results with respect to this issue – all of which are inconsistent with this alternative explanation that “contextualization” reflects a change in mixing of keypress related MEG features as opposed to a change in the underlying representations themselves. As correct sequences are generated at higher and higher speeds over training, MEG activity patterns related to the planning, execution, evaluation and memory of individual keypresses overlap more in time. Thus, increased overlap between the “4” and “1” keypresses (at the start of the sequence) and “2” and “4” keypresses (at the end of the sequence) could artefactually increase contextualization distances even if the underlying neural representations for the individual keypresses remain unchanged. One must also keep in mind that since participants repeat the sequence multiple times within the same trial, a majority of the index finger keypresses are performed adjacent to one another (i.e. - the “4-4” transition marking the end of one sequence and the beginning of the next). Thus, increased overlap between consecutive index finger keypresses as typing speed increased should increase their similarity and mask contextualization related changes to the underlying neural representations.
We addressed this question by conducting a new multivariate regression analysis to directly assess whether the neural representation distance score could be predicted by the 4-1, 2-4 and 4-4 keypress transition times observed for each complete correct sequence (both predictor and response variables were z-score normalized within-subject). The results of this analysis also affirmed that the possible alternative explanation that contextualization effects are simple reflections of increased mixing is not supported by the data (Adjusted R<sup>2</sup> = 0.00431; F = 5.62). We now include this new negative control analysis in the revised manuscript.
We also re-examined our previously reported classification results with respect to this issue. We reasoned that if mixing effects reflecting the ordinal sequence structure is an important driver of the contextualization finding, these effects should be observable in the distribution of decoder misclassifications. For example, “4” keypresses would be more likely to be misclassified as “1” or “2” keypresses (or vice versa) than as “3” keypresses. The confusion matrices presented in Figures 3C and 4B and Figure 3—figure supplement 3A display a distribution of misclassifications that is inconsistent with an alternative mixing effect explanation of contextualization.
Based upon the increased overlap between adjacent index finger keypresses (i.e. – “4-4” transition), we also reasoned that the decoder tasked with separating individual index finger keypresses into two distinct classes based upon sequence position, should show decreased performance as typing speed increases. However, Figure 4C in our manuscript shows that this is not the case. The 2-class hybrid classifier actually displays improved classification performance over early practice trials despite greater temporal overlap. Again, this is inconsistent with the idea that the contextualization effect simply reflects increased mixing of individual keypress features.
In summary, both re-examination of previously reported data and new control analyses all converged on the idea that the proximity between keypresses does not explain contextualization.
We do agree with the Reviewer that the naturalistic, generative, self-paced task employed in the present study results in overlapping brain processes related to planning, execution, evaluation and memory of the action sequence. We also agree that there are several tradeoffs to consider in the construction of the classifiers depending on the study aim. Given our aim of optimizing keypress decoder accuracy in the present study, the set of trade-offs resulted in representations reflecting more the latter three processes, and less so the planning component. Whether separate decoders can be constructed to tease apart the representations or networks supporting these overlapping processes is an important future direction of research in this area. For example, work presently underway in our lab constrains the selection of windowing parameters in a manner that allows individual classifiers to be temporally linked to specific planning, execution, evaluation or memory-related processes to discern which brain networks are involved and how they adaptively reorganize with learning. Results from the present study (Figure 4—figure supplement 2) showing hybrid-space decoder prediction accuracies exceeding 74% for temporal windows spanning as little as 25ms and located up to 100ms prior to the KeyDown event strongly support the feasibility of such an approach.
Related to the above point, testing only one particular sequence (4-1-3-2-4), aside from the control ones, limits the generalizability of the finding. This also may have contributed to the extremely high decoding accuracy reported in the current study.
The Reviewer raises a question about the generalizability of the decoder accuracy reported in our study. Fortunately, a comparison between decoder performances on Day 1 and Day 2 datasets does provide insight into this issue. As the Reviewer points out, the classifiers in this study were trained and tested on keypresses performed while practicing a specific sequence (4-1-3-2-4). The study was designed this way as to avoid the impact of interference effects on learning dynamics. The cross-validated performance of classifiers on MEG data collected within the same session was 90.47% overall accuracy (4-class; Figure 3C). We then tested classifier performance on data collected during a separate MEG session conducted approximately 24 hours later (Day 2; see Figure 3 — figure supplement 3). We observed a reduction in overall accuracy rate to 87.11% when tested on MEG data recorded while participants performed the same learned sequence, and 79.44% when they performed several previously unpracticed sequences. Both changes in accuracy are important with regards to the generalizability of our findings. First, 87.11% performance accuracy for the trained sequence data on Day 2 (a reduction of only 3.36%) indicates that the hybrid-space decoder performance is robust over multiple MEG sessions, and thus, robust to variations in SNR across the MEG sensor array caused by small differences in head position between scans. This indicates a substantial advantage over sensor-space decoding approaches. Furthermore, when tested on data from unpracticed sequences, overall performance dropped an additional 7.67%. This difference reflects the performance bias of the classifier for the trained sequence, possibly caused by high-order sequence structure being incorporated into the feature weights. In the future, it will be important to understand in more detail how random or repeated keypress sequence training data impacts overall decoder performance and generalization. We strongly agree with the Reviewer that the issue of generalizability is extremely important and have added a new paragraph to the Discussion in the revised manuscript highlighting the strengths and weaknesses of our study with respect to this issue.
In terms of clinical BCI, one of the potential relevance of the study, as claimed by the authors, it is not clear that the specific time window chosen in the current study (up to 200 msec since key press onset) is really useful. In most cases, clinical BCI would target neural signals with no overt movement execution due to patients' inability to move (e.g., Hochberg et al., 2012). Given the time window, the surprisingly high performance of the current decoder may result from sensory feedback and/or planning of subsequent movement, which may not always be available in the clinical BCI context. Of course, the decoding accuracy is still much higher than chance even when using signal before the key press (as shown in Figure 4 Supplement 2), but it is not immediately clear to me that the authors relate their high decoding accuracy based on post-movement signal to clinical BCI settings.
The Reviewer questions the relevance of the specific window parameters used in the present study for clinical BCI applications, particularly for paretic patients who are unable to produce finger movements or for whom afferent sensory feedback is no longer intact. We strongly agree with the Reviewer that any intended clinical application must carefully consider the specific input feature constraints dictated by the clinical cohort, and in turn impose appropriate and complimentary constraints on classifier parameters that may differ from the ones used in the present study. We now highlight this issue in the Discussion of the revised manuscript and relate our present findings to published clinical BCI work within this context.
One of the important and fascinating claims of the current study is that the "contextualization" of individual finger movements in a trained sequence specifically occurs during short rest periods in very early skill learning, echoing the recent theory of micro-offline learning proposed by the authors' group. Here, I think two points need to be clarified. First, the concept of "contextualization" is kept somewhat blurry throughout the text. It is only at the later part of the Discussion (around line #330 on page 13) that some potential mechanism for the "contextualization" is provided as "what-and-where" binding. Still, it is unclear what "contextualization" actually is in the current data, as the MEG signal analyzed is extracted from 0-200 msec after the keypress. If one thinks something is contextualizing an action, that contextualization should come earlier than the action itself.
The Reviewer requests that we: 1) more clearly define our use of the term “contextualization” and 2) provide the rationale for assessing it over a 200ms window aligned to the KeyDown event. This choice of window parameters means that the MEG activity used in our analysis was coincident with, rather than preceding, the actual keypresses. We define contextualization as the differentiation of representation for the identical movement embedded in different positions of a sequential skill. That is, representations of individual action elements progressively incorporate information about their relationship to the overall sequence structure as the skill is learned. We agree with the Reviewer that this can be appropriately interpreted as “what-and-where” binding. We now incorporate this definition in the Introduction of the revised manuscript as requested.
The window parameters for optimizing accurate decoding individual finger movements were determined using a grid search of the parameter space (a sliding window of variable width between 25-350 ms with 25 ms increments variably aligned from 0 to +100ms with 10ms increments relative to the KeyDown event). This approach generated 140 different temporal windows for each keypress for each participant, with the final parameter selection determined through comparison of the resulting performance between each decoder. Importantly, the decision to optimize for decoding accuracy placed an emphasis on keypress representations characterized by the most consistent and robust features shared across subjects, which in turn maximize statistical power in detecting common learning-related changes. In this case, the optimal window encompassed a 200ms epoch aligned to the KeyDown event (t<sub>0</sub> = 0 ms). We then asked if the representations (i.e. – spatial patterns of combined parcel- and voxel-space activity) of the same digit at two different sequence positions changed with practice within this optimal decoding window. Of course, our findings do not rule out the possibility that contextualization can also be found before or even after this time window, as we did not directly address this issue in the present study. Future work in our lab, as pointed out above, are investigating contextualization within different time windows tailored specifically for assessing sequence skill action planning, execution, evaluation and memory processes.
The second point is that the result provided by the authors is not yet convincing enough to support the claim that "contextualization" occurs during rest. In the original analysis, the authors presented the statistical significance regarding the correlation between the "offline" pattern differentiation and micro-offline skill gain (Figure 5. Supplement 1), as well as the larger "offline" distance than "online" distance (Figure 5B). However, this analysis looks like regressing two variables (monotonically) increasing as a function of the trial. Although some information in this analysis, such as what the independent/dependent variables were or how individual subjects were treated, was missing in the Methods, getting a statistically significant slope seems unsurprising in such a situation. Also, curiously, the same quantitative evidence was not provided for its "online" counterpart, and the authors only briefly mentioned in the text that there was no significant correlation between them. It may be true looking at the data in Figure 5A as the online representation distance looks less monotonically changing, but the classification accuracy presented in Figure 4C, which should reflect similar representational distance, shows a more monotonic increase up to the 11th trial. Further, the ways the "online" and "offline" representation distance was estimated seem to make them not directly comparable. While the "online" distance was computed using all the correct press data within each 10 sec of execution, the "offline" distance is basically computed by only two presses (i.e., the last index_OP5 vs. the first index_OP1 separated by 10 sec of rest). Theoretically, the distance between the neural activity patterns for temporally closer events tends to be closer than that between the patterns for temporally far-apart events. It would be fairer to use the distance between the first index_OP1 vs. the last index_OP5 within an execution period for "online" distance, as well.
The Reviewer suggests that the current data is not enough to show that contextualization occurs during rest and raises two important concerns: 1) the relationship between online contextualization and micro-online gains is not shown, and 2) the online distance was calculated differently from its offline counterpart (i.e. - instead of calculating the distance between last Index<sub>OP5</sub> and first Index<sub>OP1</sub> from a single trial, the distance was calculated for each sequence within a trial and then averaged).
We addressed the first concern by performing individual subject correlations between 1) contextualization changes during rest intervals and micro-offline gains; 2) contextualization changes during practice trials and micro-online gains, and 3) contextualization changes during practice trials and micro-offline gains (Figure 5 – figure supplement 4). We then statistically compared the resulting correlation coefficient distributions and found that within-subject correlations for contextualization changes during rest intervals and micro-offline gains were significantly higher than online contextualization and micro-online gains (t = 3.2827, p = 0.0015) and online contextualization and micro-offline gains (t = 3.7021, p = 5.3013e-04). These results are consistent with our interpretation that micro-offline gains are supported by contextualization changes during the inter-practice rest periods.
With respect to the second concern, we agree with the Reviewer that one limitation of the analysis comparing online versus offline changes in contextualization as presented in the original manuscript, is that it does not eliminate the possibility that any differences could simply be explained by the passage of time (which is smaller for the online analysis compared to the offline analysis). The Reviewer suggests an approach that addresses this issue, which we have now carried out. When quantifying online changes in contextualization from the first Index<sub>OP1</sub> the last Index<sub>OP5</sub> keypress in the same trial we observed no learning-related trend (Figure 5 – figure supplement 5, right panel). Importantly, offline distances were significantly larger than online distances regardless of the measurement approach and neither predicted online learning (Figure 5 – figure supplement 6).
A related concern regarding the control analysis, where individual values for max speed and the degree of online contextualization were compared (Figure 5 Supplement 3), is whether the individual difference is meaningful. If I understood correctly, the optimization of the decoding process (temporal window, feature inclusion/reduction, decoder, etc.) was performed for individual participants, and the same feature extraction was also employed for the analysis of representation distance (i.e., contextualization). If this is the case, the distances are individually differently calculated and they may need to be normalized relative to some stable reference (e.g., 1 vs. 4 or average distance within the control sequence presses) before comparison across the individuals.
The Reviewer makes a good point here. We have now implemented the suggested normalization procedure in the analysis provided in the revised manuscript.
Reviewer #3 (Public review):
Summary:
One goal of this paper is to introduce a new approach for highly accurate decoding of finger movements from human magnetoencephalography data via dimension reduction of a "multiscale, hybrid" feature space. Following this decoding approach, the authors aim to show that early skill learning involves "contextualization" of the neural coding of individual movements, relative to their position in a sequence of consecutive movements. Furthermore, they aim to show that this "contextualization" develops primarily during short rest periods interspersed with skill training and correlates with a performance metric which the authors interpret as an indicator of offline learning.
Strengths:
A clear strength of the paper is the innovative decoding approach, which achieves impressive decoding accuracies via dimension reduction of a "multi-scale, hybrid space". This hybrid-space approach follows the neurobiologically plausible idea of the concurrent distribution of neural coding across local circuits as well as large-scale networks. A further strength of the study is the large number of tested dimension reduction techniques and classifiers (though the manuscript reveals little about the comparison of the latter).
We appreciate the Reviewer’s comments regarding the paper’s strengths.
A simple control analysis based on shuffled class labels could lend further support to this complex decoding approach. As a control analysis that completely rules out any source of overfitting, the authors could test the decoder after shuffling class labels. Following such shuffling, decoding accuracies should drop to chance level for all decoding approaches, including the optimized decoder. This would also provide an estimate of actual chance-level performance (which is informative over and beyond the theoretical chance level). Furthermore, currently, the manuscript does not explain the huge drop in decoding accuracies for the voxel-space decoding (Figure 3B). Finally, the authors' approach to cortical parcellation raises questions regarding the information carried by varying dipole orientations within a parcel (which currently seems to be ignored?) and the implementation of the mean-flipping method (given that there are two dimensions - space and time - what do the authors refer to when they talk about the sign of the "average source", line 477?).
The Reviewer recommends that we: 1) conduct an additional control analysis on classifier performance using shuffled class labels, 2) provide a more detailed explanation regarding the drop in decoding accuracies for the voxel-space decoding following LDA dimensionality reduction (see Fig 3B), and 3) provide additional details on how problems related to dipole solution orientations were addressed in the present study.
In relation to the first point, we have now implemented a random shuffling approach as a control for the classification analyses. The results of this analysis indicated that the chance level accuracy was 22.12% (± SD 9.1%) for individual keypress decoding (4-class classification), and 18.41% (± SD 7.4%) for individual sequence item decoding (5-class classification), irrespective of the input feature set or the type of decoder used. Thus, the decoding accuracy observed with the final model was substantially higher than these chance levels.
Second, please note that the dimensionality of the voxel-space feature set is very high (i.e. – 15684). LDA attempts to map the input features onto a much smaller dimensional space (number of classes – 1; e.g. – 3 dimensions, for 4-class keypress decoding). Given the very high dimension of the voxel-space input features in this case, the resulting mapping exhibits reduced accuracy. Despite this general consideration, please refer to Figure 3—figure supplement 3, where we observe improvement in voxel-space decoder performance when utilizing alternative dimensionality reduction techniques.
The decoders constructed in the present study assess the average spatial patterns across time (as defined by the windowing procedure) in the input feature space. We now provide additional details in the Methods of the revised manuscript pertaining to the parcellation procedure and how the sign ambiguity problem was addressed in our analysis.
Weaknesses:
A clear weakness of the paper lies in the authors' conclusions regarding "contextualization". Several potential confounds, described below, question the neurobiological implications proposed by the authors and provide a simpler explanation of the results. Furthermore, the paper follows the assumption that short breaks result in offline skill learning, while recent evidence, described below, casts doubt on this assumption.
We thank the Reviewer for giving us the opportunity to address these issues in detail (see below).
The authors interpret the ordinal position information captured by their decoding approach as a reflection of neural coding dedicated to the local context of a movement (Figure 4). One way to dissociate ordinal position information from information about the moving effectors is to train a classifier on one sequence and test the classifier on other sequences that require the same movements, but in different positions (Kornysheva et al., 2019). In the present study, however, participants trained to repeat a single sequence (4-1-3-2-4). As a result, ordinal position information is potentially confounded by the fixed finger transitions around each of the two critical positions (first and fifth press). Across consecutive correct sequences, the first keypress in a given sequence was always preceded by a movement of the index finger (=last movement of the preceding sequence), and followed by a little finger movement. The last keypress, on the other hand, was always preceded by a ring finger movement, and followed by an index finger movement (=first movement of the next sequence). Figure 4 - Supplement 2 shows that finger identity can be decoded with high accuracy (>70%) across a large time window around the time of the key press, up to at least +/-100 ms (and likely beyond, given that decoding accuracy is still high at the boundaries of the window depicted in that figure). This time window approaches the keypress transition times in this study. Given that distinct finger transitions characterized the first and fifth keypress, the classifier could thus rely on persistent (or "lingering") information from the preceding finger movement, and/or "preparatory" information about the subsequent finger movement, in order to dissociate the first and fifth keypress. Currently, the manuscript provides no evidence that the context information captured by the decoding approach is more than a by-product of temporally extended, and therefore overlapping, but independent neural representations of consecutive keypresses that are executed in close temporal proximity - rather than a neural representation dedicated to context.
Such temporal overlap of consecutive, independent finger representations may also account for the dynamics of "ordinal coding"/"contextualization", i.e., the increase in 2-class decoding accuracy, across Day 1 (Figure 4C). As learning progresses, both tapping speed and the consistency of keypress transition times increase (Figure 1), i.e., consecutive keypresses are closer in time, and more consistently so. As a result, information related to a given keypress is increasingly overlapping in time with information related to the preceding and subsequent keypresses. The authors seem to argue that their regression analysis in Figure 5 - Figure Supplement 3 speaks against any influence of tapping speed on "ordinal coding" (even though that argument is not made explicitly in the manuscript). However, Figure 5 - Figure Supplement 3 shows inter-individual differences in a between-subject analysis (across trials, as in panel A, or separately for each trial, as in panel B), and, therefore, says little about the within-subject dynamics of "ordinal coding" across the experiment. A regression of trial-by-trial "ordinal coding" on trial-by-trial tapping speed (either within-subject or at a group-level, after averaging across subjects) could address this issue. Given the highly similar dynamics of "ordinal coding" on the one hand (Figure 4C), and tapping speed on the other hand (Figure 1B), I would expect a strong relationship between the two in the suggested within-subject (or group-level) regression. Furthermore, learning should increase the number of (consecutively) correct sequences, and, thus, the consistency of finger transitions. Therefore, the increase in 2-class decoding accuracy may simply reflect an increasing overlap in time of increasingly consistent information from consecutive keypresses, which allows the classifier to dissociate the first and fifth keypress more reliably as learning progresses, simply based on the characteristic finger transitions associated with each. In other words, given that the physical context of a given keypress changes as learning progresses - keypresses move closer together in time and are more consistently correct - it seems problematic to conclude that the mental representation of that context changes. To draw that conclusion, the physical context should remain stable (or any changes to the physical context should be controlled for).
The issues raised by Reviewer #3 here are similar to two issues raised by Reviewer #2 above. We agree they must both be carefully considered in any evaluation of our findings.
As both Reviewers pointed out, the classifiers in this study were trained and tested on keypresses performed while practicing a specific sequence (4-1-3-2-4). The study was designed this way as to avoid the impact of interference effects on learning dynamics. The cross-validated performance of classifiers on MEG data collected within the same session was 90.47% overall accuracy (4class; Figure 3C). We then tested classifier performance on data collected during a separate MEG session conducted approximately 24 hours later (Day 2; see Figure 3—supplement 3). We observed a reduction in overall accuracy rate to 87.11% when tested on MEG data recorded while participants performed the same learned sequence, and 79.44% when they performed several previously unpracticed sequences. This classification performance difference of 7.67% when tested on the Day 2 data could reflect the performance bias of the classifier for the trained sequence, possibly caused by mixed information from temporally close keypresses being incorporated into the feature weights.
Along these same lines, both Reviewers also raise the possibility that an increase in “ordinal coding/contextualization” with learning could simply reflect an increase in this mixing effect caused by faster typing speeds as opposed to an actual change in the underlying neural representation. The basic idea is that as correct sequences are generated at higher and higher speeds over training, MEG activity patterns related to the planning, execution, evaluation and memory of individual keypresses overlap more in time. Thus, increased overlap between the “4” and “1” keypresses (at the start of the sequence) and “2” and “4” keypresses (at the end of the sequence) could artefactually increase contextualization distances even if the underlying neural representations for the individual keypresses remain unchanged (assuming this mixing of representations is used by the classifier to differentially tag each index finger press). If this were the case, it follows that such mixing effects reflecting the ordinal sequence structure would also be observable in the distribution of decoder misclassifications. For example, “4” keypresses would be more likely to be misclassified as “1” or “2” keypresses (or vice versa) than as “3” keypresses. The confusion matrices presented in Figures 3C and 4B and Figure 3—figure supplement 3A in the previously submitted manuscript do not show this trend in the distribution of misclassifications across the four fingers.
Following this logic, it’s also possible that if the ordinal coding is largely driven by this mixing effect, the increased overlap between consecutive index finger keypresses during the 4-4 transition marking the end of one sequence and the beginning of the next one could actually mask contextualization-related changes to the underlying neural representations and make them harder to detect. In this case, a decoder tasked with separating individual index finger keypresses into two distinct classes based upon sequence position might show decreased performance with learning as adjacent keypresses overlapped in time with each other to an increasing extent. However, Figure 4C in our previously submitted manuscript does not support this possibility, as the 2-class hybrid classifier displays improved classification performance over early practice trials despite greater temporal overlap.
As noted in the above reply to Reviewer #2, we also conducted a new multivariate regression analysis to directly assess whether the neural representation distance score could be predicted by the 4-1, 2-4 and 4-4 keypress transition times observed for each complete correct sequence (both predictor and response variables were z-score normalized within-subject). The results of this analysis affirmed that the possible alternative explanation put forward by the Reviewer is not supported by our data (Adjusted R<sup>2</sup> = 0.00431; F = 5.62). We now include this new negative control analysis result in the revised manuscript.
Finally, the Reviewer hints that one way to address this issue would be to compare MEG responses before and after learning for sequences typed at a fixed speed. However, given that the speed-accuracy trade-off should improve with learning, a comparison between unlearned and learned skill states would dictate that the skill be evaluated at a very low fixed speed. Essentially, such a design presents the problem that the post-training test is evaluating the representation in the unlearned behavioral state that is not representative of the acquired skill. Thus, this approach would miss most learning effects on a task in which speed is the main learning metrics.
A similar difference in physical context may explain why neural representation distances ("differentiation") differ between rest and practice (Figure 5). The authors define "offline differentiation" by comparing the hybrid space features of the last index finger movement of a trial (ordinal position 5) and the first index finger movement of the next trial (ordinal position 1). However, the latter is not only the first movement in the sequence but also the very first movement in that trial (at least in trials that started with a correct sequence), i.e., not preceded by any recent movement. In contrast, the last index finger of the last correct sequence in the preceding trial includes the characteristic finger transition from the fourth to the fifth movement. Thus, there is more overlapping information arising from the consistent, neighbouring keypresses for the last index finger movement, compared to the first index finger movement of the next trial. A strong difference (larger neural representation distance) between these two movements is, therefore, not surprising, given the task design, and this difference is also expected to increase with learning, given the increase in tapping speed, and the consequent stronger overlap in representations for consecutive keypresses. Furthermore, initiating a new sequence involves pre-planning, while ongoing practice relies on online planning (Ariani et al., eNeuro 2021), i.e., two mental operations that are dissociable at the level of neural representation (Ariani et al., bioRxiv 2023).
The Reviewer argues that the comparison of last finger movement of a trial and the first in the next trial are performed in different circumstances and contexts. This is an important point and one we tend to agree with. For this task, the first sequence in a practice trial is pre-planned before the first keypress is performed. This occurs in a somewhat different context from the sequence iterations that follow, which involve temporally overlapping planning, execution and evaluation processes. The Reviewer is concerned about a difference in the temporal mixing effect issue raised above between the first and last keypresses performed in a trial. Please, note that since neural representations of individual actions are competitively queued during the pre-planning period in a manner that reflects the ordinal structure of the learned sequence (Kornysheva et al., 2019), mixing effects are most likely present also for the first keypress in a trial.
Separately, the Reviewer suggests that contextualization during early learning may reflect preplanning or online planning. This is an interesting proposal. Given the decoding time-window used in this investigation, we cannot dissect separate contributions of planning, memory and sensory feedback to contextualization. Taking advantage of the superior temporal resolution of MEG relative to fMRI tools, work under way in our lab is investigating decoding time-windows more appropriate to address each of these questions.
Given these differences in the physical context and associated mental processes, it is not surprising that "offline differentiation", as defined here, is more pronounced than "online differentiation". For the latter, the authors compared movements that were better matched regarding the presence of consistent preceding and subsequent keypresses (online differentiation was defined as the mean difference between all first vs. last index finger movements during practice). It is unclear why the authors did not follow a similar definition for "online differentiation" as for "micro-online gains" (and, indeed, a definition that is more consistent with their definition of "offline differentiation"), i.e., the difference between the first index finger movement of the first correct sequence during practice, and the last index finger of the last correct sequence. While these two movements are, again, not matched for the presence of neighbouring keypresses (see the argument above), this mismatch would at least be the same across "offline differentiation" and "online differentiation", so they would be more comparable.
This is the same point made earlier by Reviewer #2, and we agree with this assessment. As stated in the response to Reviewer #2 above, we have now carried out quantification of online contextualization using this approach and included it in the revised manuscript. We thank the Reviewer for this suggestion.
A further complication in interpreting the results regarding "contextualization" stems from the visual feedback that participants received during the task. Each keypress generated an asterisk shown above the string on the screen, irrespective of whether the keypress was correct or incorrect. As a result, incorrect (e.g., additional, or missing) keypresses could shift the phase of the visual feedback string (of asterisks) relative to the ordinal position of the current movement in the sequence (e.g., the fifth movement in the sequence could coincide with the presentation of any asterisk in the string, from the first to the fifth). Given that more incorrect keypresses are expected at the start of the experiment, compared to later stages, the consistency in visual feedback position, relative to the ordinal position of the movement in the sequence, increased across the experiment. A better differentiation between the first and the fifth movement with learning could, therefore, simply reflect better decoding of the more consistent visual feedback, based either on the feedback-induced brain response, or feedback-induced eye movements (the study did not include eye tracking). It is not clear why the authors introduced this complicated visual feedback in their task, besides consistency with their previous studies.
We strongly agree with the Reviewer that eye movements related to task engagement are important to rule out as a potential driver of the decoding accuracy or contextualizaton effect. We address this issue above in response to a question raised by Reviewer #1 about the impact of movement related artefacts on our findings.
First, the assumption the Reviewer makes here about the distribution of errors in this task is incorrect. On average across subjects, 2.32% ± 1.48% (mean ± SD) of all keypresses performed were errors, which were evenly distributed across the four possible keypress responses. While errors increased progressively over practice trials, they did so in proportion to the increase in correct keypresses, so that the overall ratio of correct-to-incorrect keypresses remained stable over the training session. Thus, the Reviewer’s assumptions that there is a higher relative frequency of errors in early trials, and a resulting systematic trend phase shift differences between the visual display updates (i.e. – a change in asterisk position above the displayed sequence) and the keypress performed is not substantiated by the data. To the contrary, the asterisk position on the display and the keypress being executed remained highly correlated over the entire training session. We now include a statement about the frequency and distribution of errors in the revised manuscript.
Given this high correlation, we firmly agree with the Reviewer that the issue of eye movement related artefacts is still an important one to address. Fortunately, we did collect eye movement data during the MEG recordings so were able to investigate this. As detailed in the response to Reviewer #1 above, we found that gaze positions and eye-movement velocity time-locked to visual display updates (i.e. – a change in asterisk position above the displayed sequence) did not reflect the asterisk location above chance levels (Overall cross-validated accuracy = 0.21817; see Author response image 1). Furthermore, an inspection of the eye position data revealed that most participants on most trials displayed random walk gaze patterns around a center fixation point, indicating that participants did not attend to the asterisk position on the display. This is consistent with intrinsic generation of the action sequence, and congruent with the fact that the display does not provide explicit feedback related to performance. As pointed out above, a similar real-world example would be manually inputting a long password into a secure online application. In this case, one intrinsically generates the sequence from memory and receives similar feedback about the password sequence position (also provided as asterisks), which is typically ignored by the user.
The minimal participant engagement with the visual display in this explicit sequence learning motor task (which is highly generative in nature) contrasts markedly with behavior observed when reactive responses to stimulus cues are needed in the serial reaction time task (SRTT). This is a crucial difference that must be carefully considered when comparing findings across studies using the two sequence learning tasks.
The authors report a significant correlation between "offline differentiation" and cumulative microoffline gains. However, it would be more informative to correlate trial-by-trial changes in each of the two variables. This would address the question of whether there is a trial-by-trial relation between the degree of "contextualization" and the amount of micro-offline gains - are performance changes (micro-offline gains) less pronounced across rest periods for which the change in "contextualization" is relatively low? Furthermore, is the relationship between micro-offline gains and "offline differentiation" significantly stronger than the relationship between micro-offline gains and "online differentiation"?
In response to a similar issue raised above by Reviewer #2, we now include new analyses comparing correlation magnitudes between (1) “online differentiation” vs micro-online gains, (2) “online differentiation” vs micro-offline gains and (3) “offline differentiation” and micro-offline gains (see Figure 5 – figure supplement 4, 5 and 6). These new analyses and results have been added to the revised manuscript. Once again, we thank both Reviewers for this suggestion.
The authors follow the assumption that micro-offline gains reflect offline learning.
We disagree with this statement. The original (Bonstrup et al., 2019) paper clearly states that micro-offline gains do not necessarily reflect offline learning in some cases and must be carefully interpreted based upon the behavioral context within which they are observed. Further, the paper lays out the conditions under which one can have confidence that micro-offline gains reflect offline learning. In fact, the excellent meta-analysis of (Pan & Rickard, 2015), which re-interprets the benefits of sleep in overnight skill consolidation from a “reactive inhibition” perspective, was a crucial resource in the experimental design of our initial study (Bonstrup et al., 2019), as well as in all our subsequent work. Pan & Rickard state:
“Empirically, reactive inhibition refers to performance worsening that can accumulate during a period of continuous training (Hull, 1943 . It tends to dissipate, at least in part, when brief breaks are inserted between blocks of training. If there are multiple performance-break cycles over a training session, as in the motor sequence literature, performance can exhibit a scalloped effect, worsening during each uninterrupted performance block but improving across blocks(Brawn et al., 2010; Rickard et al., 2008 . Rickard, Cai, Rieth, Jones, and Ard (2008 and Brawn, Fenn, Nusbaum, and Margoliash (2010 (Brawn et al., 2010; Rickard et al., 2008 demonstrated highly robust scalloped reactive inhibition effects using the commonly employed 30 s–30 s performance break cycle, as shown for Rickard et al.’s (2008 massed practice sleep group in Figure 2. The scalloped effect is evident for that group after the first few 30 s blocks of each session. The absence of the scalloped effect during the first few blocks of training in the massed group suggests that rapid learning during that period masks any reactive inhibition effect.”
Crucially, Pan & Rickard make several concrete recommendations for reducing the impact of the reactive inhibition confound on offline learning studies. One of these recommendations was to reduce practice times to 10s (most prior sequence learning studies up until that point had employed 30s long practice trials). They state:
“The traditional design involving 30 s-30 s performance break cycles should be abandoned given the evidence that it results in a reactive inhibition confound, and alternative designs with reduced performance duration per block used instead (Pan & Rickard, 2015 . One promising possibility is to switch to 10 s performance durations for each performance-break cycle Instead (Pan & Rickard, 2015 . That design appears sufficient to eliminate at least the majority of the reactive inhibition effect (Brawn et al., 2010; Rickard et al., 2008 .”
We mindfully incorporated recommendations from (Pan & Rickard, 2015) into our own study designs including 1) utilizing 10s practice trials and 2) constraining our analysis of micro-offline gains to early learning trials (where performance monotonically increases and 95% of overall performance gains occur), which are prior to the emergence of the “scalloped” performance dynamics that are strongly linked to reactive inhibition effects.
However, there is no direct evidence in the literature that micro-offline gains really result from offline learning, i.e., an improvement in skill level.
We strongly disagree with the Reviewer’s assertion that “there is no direct evidence in the literature that micro-offline gains really result from offline learning, i.e., an improvement in skill level.” The initial (Bonstrup et al., 2019) report was followed up by a large online crowd-sourcing study (Bonstrup et al., 2020). This second (and much larger) study provided several additional important findings supporting our interpretation of micro-offline gains in cases where the important behavioral conditions clarified above were met (see Author response image 4 below for further details on these conditions).
Author response image 4.
This Figure shows that micro-offline gains o ser ed in learning and nonlearning contexts are attri uted to different underl ing causes. Micro-offline and online changes relative to overall trial-by-trial learning. This figure is based on data from (Bonstrup et al., 2019). During early learning, micro-offline gains (red bars) closely track trial-by-trial performance gains (green line with open circle markers), with minimal contribution from micro-online gains (blue bars). The stated conclusion in Bönstrup et al. (2019) is that micro-offline gains only during this Early Learning stage reflect rapid memory consolidation (see also (Bonstrup et al., 2020)). After early learning, about practice trial 11, skill plateaus. This plateau skill period is characterized by a striking emergence of coupled (and relatively stable) micro-online drops and micro-offline increases. Bönstrup et al. (2019) as well as others in the literature (Brooks et al., 2024; Gupta & Rickard, 2022; Florencia Jacobacci et al., 2020), argue that micro-offline gains during the plateau period likely reflect recovery from inhibitory performance factors such as reactive inhibition or fatigue, and thus must be excluded from analyses relating micro-offline gains to skill learning. The Non-repeating groups in Experiments 3 and 4 from Das et al. (2024) suffer from a lack of consideration of these known confounds (end of Fig legend).
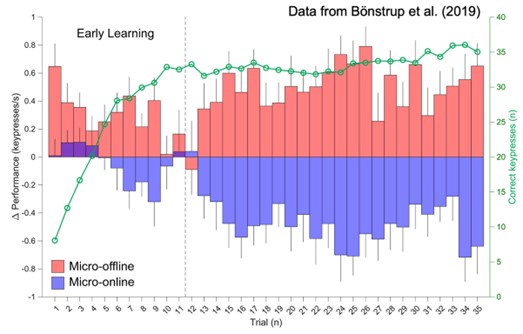
Evidence documented in that paper (Bonstrup et al., 2020) showed that micro-offline gains during early skill learning were: 1) replicable and generalized to subjects learning the task in their daily living environment (n=389); 2) equivalent when significantly shortening practice period duration, thus confirming that they are not a result of recovery from performance fatigue (n=118); 3) reduced (along with learning rates) by retroactive interference applied immediately after each practice period relative to interference applied after passage of time (n=373), indicating stabilization of the motor memory at a microscale of several seconds consistent with rapid consolidation; and 4) not modified by random termination of the practice periods, ruling out a contribution of predictive motor slowing (N = 71) (Bonstrup et al., 2020). Altogether, our findings were strongly consistent with the interpretation that micro-offline gains reflect memory consolidation supporting early skill learning. This is precisely the portion of the learning curve (Pan & Rickard, 2015) refer to when they state “…rapid learning during that period masks any reactive inhibition effect”.
This interpretation is further supported by brain imaging evidence linking known memory-related networks and consolidation mechanisms to micro-offline gains. First, we reported that the density of fast hippocampo-neocortical skill memory replay events increases approximately three-fold during early learning inter-practice rest periods with the density explaining differences in the magnitude of micro-offline gains across subjects (Buch et al., 2021). Second, Jacobacci et al. (2020) independently reproduced our original behavioral findings and reported BOLD fMRI changes in the hippocampus and precuneus (regions also identified in our MEG study (Buch et al., 2021)) linked to micro-offline gains during early skill learning. These functional changes were coupled with rapid alterations in brain microstructure in the order of minutes, suggesting that the same network that operates during rest periods of early learning undergoes structural plasticity over several minutes following practice (Deleglise et al., 2023). Crucial to this point, Chen et al. (2024) and Sjøgård et al (2024) provided direct evidence from intracranial EEG in humans linking sharp-wave ripple density during rest periods (which are known markers for neural replay (Buzsaki, 2015)) in the human hippocampus (80-120 Hz) to micro-offline gains during early skill learning.
Thus, there is now substantial converging evidence in humans across different indirect noninvasive and direct invasive recording techniques linking hippocampal activity, neural replay dynamics and offline performance gains in skill learning.
On the contrary, recent evidence questions this interpretation (Gupta & Rickard, npj Sci Learn 2022; Gupta & Rickard, Sci Rep 2024; Das et al., bioRxiv 2024). Instead, there is evidence that micro-offline gains are transient performance benefits that emerge when participants train with breaks, compared to participants who train without breaks, however, these benefits vanish within seconds after training if both groups of participants perform under comparable conditions (Das et al., bioRxiv 2024).
The recent work of (Gupta & Rickard, 2022, 2024) does not present any data that directly opposes our finding that early skill learning (Bonstrup et al., 2019) is expressed as micro-offline gains during rest breaks. These studies are an extension of the Rickard et al (2008) paper that employed a massed (30s practice followed by 30s breaks) vs spaced (10s practice followed by 10s breaks) experimental design to assess if recovery from reactive inhibition effects could account for performance gains measured after several minutes or hours. Gupta & Rickard (2022) added two additional groups (30s practice/10s break and 10s practice/10s break as used in the work from our group). The primary aim of the study was to assess whether it was more likely that changes in performance when retested 5 minutes after skill training (consisting of 12 practice trials for the massed groups and 36 practice trials for the spaced groups) had ended reflected memory consolidation effects or recovery from reactive inhibition effects. The Gupta & Rickard (2024) follow-up paper employed a similar design with the primary difference being that participants performed a fixed number of sequences on each trial as opposed to trials lasting a fixed duration. This was done to facilitate the fitting of a quantitative statistical model to the data.
To reiterate, neither study included any analysis of micro-online or micro-offline gains and did not include any comparison focused on skill gains during early learning trials (only at retest 5 min later). Instead, Gupta & Rickard (2022), reported evidence for reactive inhibition effects for all groups over much longer training periods than early learning. In fact, we reported the same findings for trials following the early learning period in our original 2019 paper (Bonstrup et al., 2019) (Author response image 4). Please, note that we also reported that cumulative microoffline gains over early learning did not correlate with overnight offline consolidation measured 24 hours later (Bonstrup et al., 2019) (see the Results section and further elaboration in the Discussion). We interpreted these findings as indicative that the mechanisms underlying offline gains over the micro-scale of seconds during early skill learning versus over minutes or hours very likely differ.
In the recent preprint from (Das et al., 2024), the authors make the strong claim that “micro-offline gains during early learning do not reflect offline learning” which is not supported by their own data. The authors hypothesize that if “micro-offline gains represent offline learning, participants should reach higher skill levels when training with breaks, compared to training without breaks”. The study utilizes a spaced vs. massed practice groups between-subjects design inspired by the reactive inhibition work from Rickard and others to test this hypothesis.
Crucially, their design incorporates only a small fraction of the training used in other investigations to evaluate early skill learning (Bonstrup et al., 2020; Bonstrup et al., 2019; Brooks et al., 2024; Buch et al., 2021; Deleglise et al., 2023; F. Jacobacci et al., 2020; Mylonas et al., 2024). A direct comparison between the practice schedule designs for the spaced and massed groups in Das et al., and the training schedule all participants experienced in the original Bönstrup et al. (2019) paper highlights this issue as well as several others (Author response image 5):
Author response image 5.
This figure shows (A) Comparison of Das et al. Spaced & Massed group training session designs, and the training session design from the original (Bonstrup et al., 2019) paper. Similar to the approach taken by Das et al., all practice is visualized as 10-second practice trials with a variable number (either 0, 1 or 30) of 10-second-long inter-practice rest intervals to allow for direct comparisons between designs. The two key takeaways from this comparison are that (1) the intervention differences (i.e. – practice schedules) between the Massed and Spaced groups from the Das et al. report are extremely small (less than 12% of the overall session schedule) (gaps in the red shaded area) and (2) the overall amount of practice is much less than compared to the design from the original Bönstrup report (Bonstrup et al., 2019) (which has been utilized in several subsequent studies). (B) Group-level learning curve data from Bönstrup et al. (2019) (Bonstrup et al., 2019) is used to estimate the performance range accounted for by the equivalent periods covering Test 1, Training 1 and Test 2 from Das et al (2024). Note that the intervention in the Das et al. study is limited to a period covering less than 50% of the overall learning range (end of figure legend).
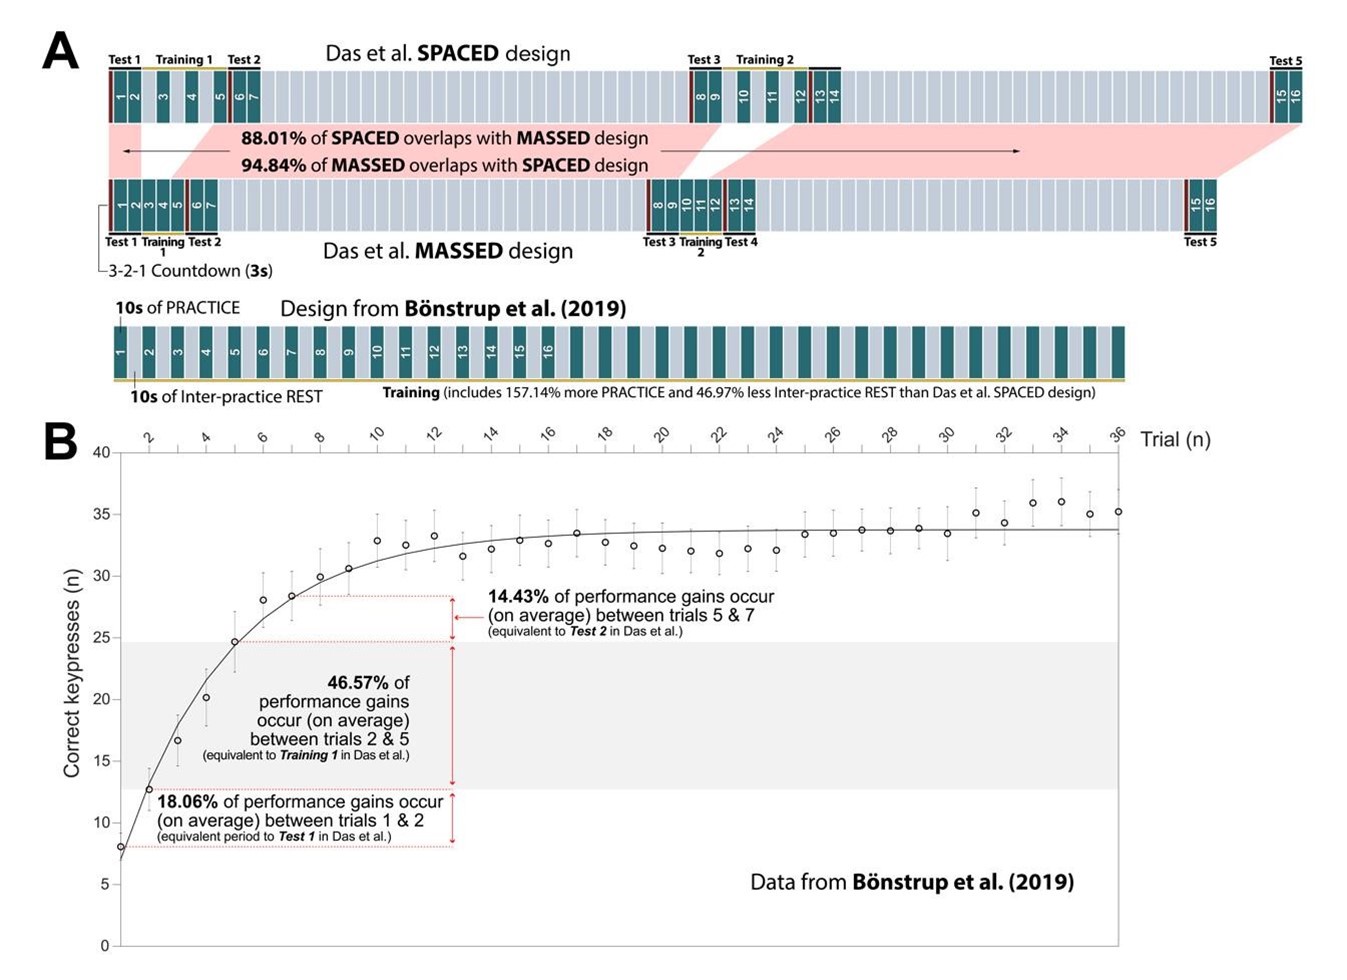
Participants in the original (Bonstrup et al., 2019) experienced 157.14% more practice time and 46.97% less inter-practice rest time than the Spaced group in the Das et al. study (Author response image 5). Thus, the overall amount of practice and rest differ substantially between studies, with much more limited training occurring for participants in Das et al.
In addition, the training interventions (i.e. – the practice schedule differences between the Spaced and Massed groups) were designed in a manner that minimized any chance of effectively testing their hypothesis. First, the interventions were applied over an extremely short period relative to the length of the total training session (5% and 12% of the total training session for Massed and Spaced groups, respectively; see gaps in the red shaded area in Author response image 5). Second, the intervention was applied during a period in which only half of the known total learning occurs. Specifically, we know from Bönstrup et al. (2019) that only 46.57% of the total performance gains occur in the practice interval covered by Das et al Training 1 intervention. Thus, early skill learning as evaluated by multiple groups (Bonstrup et al., 2020; Bonstrup et al., 2019; Brooks et al., 2024; Buch et al., 2021; Deleglise et al., 2023; F. Jacobacci et al., 2020; Mylonas et al., 2024), is in the Das et al experiment amputated to about half.
Furthermore, a substantial amount of learning takes place during Das et al’s Test 1 and Test 2 periods (32.49% of total gains combined). The fact that substantial learning is known to occur over both the Test 1 (18.06%) and Test 2 (14.43%) intervals presents a fundamental problem described by Pan and Rickard (Pan & Rickard, 2015). They reported that averaging over intervals where substantial performance gains occur (i.e. – performance is not stable) inject crucial artefacts into analyses of skill learning:
“A large amount of averaging has the advantage of yielding more precise estimates of each subject’s pretest and posttest scores and hence more statistical power to detect a performance gain. However, calculation of gain scores using that strategy runs the risk that learning that occurs during the pretest and (or posttest periods (i.e., online learning is incorporated into the gain score (Rickard et al., 2008; Robertson et al., 2004 .”
The above statement indicates that the Test 1 and Test 2 performance scores from Das et al. (2024) are substantially contaminated by the learning rate within these intervals. This is particularly problematic if the intervention design results in different Test 2 learning rates between the two groups. This in fact, is apparent in their data (Figure 1C,E of the Das et al., 2024 preprint) as the Test 2 learning rate for the Spaced group is negative (indicating a unique interference effect observable only for this group). Specifically, the Massed group continues to show an increase in performance during Test 2 and 4 relative to the last 10 seconds of practice during Training 1 and 2, respectively, while the Spaced group displays a marked decrease. This post-training performance decrease for the Spaced group is in stark contrast to the monotonic performance increases observed for both groups at all other time-points. One possible cause could be related to the structure of the Test intervals, which include 20 seconds of uninterrupted practice. For the Spaced group, this effectively is a switch to a Massed practice environment (i.e., two 10-secondlong practice trials merged into one long trial), which interferes with greater Training 1 interval gains observed for the Space group. Interestingly, when statistical comparisons between the groups are made at the time-points when the intervention is present (Figure 1E) then the stated hypothesis, “If micro-offline gains represent offline learning, participants should reach higher skill levels when training with breaks, compared to training without breaks”, is confirmed.
In summary, the experimental design and analyses used by Das et al does not contradict the view that early skill learning is expressed as micro-offline gains during rest breaks. The data presented by Gupta and Rickard (2022, 2024) and Das et al. (2024) is in many ways more confirmatory of the constraints employed by our group and others with respect to experimental design, analysis and interpretation of study findings, rather than contradictory. Still, it does highlight a limitation of the current micro-online/offline framework, which was originally only intended to be applied to early skill learning over spaced practice schedules when reactive inhibition effects are minimized (Bonstrup et al., 2019; Pan & Rickard, 2015). Extrapolation of this current framework to postplateau performance periods, longer timespans, or non-learning situations (e.g. – the Nonrepeating groups from Das et al. (2024)), when reactive inhibition plays a more substantive role, is not warranted. Ultimately, it will be important to develop new paradigms allowing one to independently estimate the different coincident or antagonistic features (e.g. - memory consolidation, planning, working memory and reactive inhibition) contributing to micro-online and micro-offline gains during and after early skill learning within a unifying framework.
Recommendations for the authors:
Reviewer #1 (Recommendations for the authors):
(1) I found Figure 2B too small to be useful, as the actual elements of the cells are very hard to read.
We have removed the grid colormap panel (top-right) from Figure 2B. All of this colormap data is actually a subset of data presented in Figure 2 – figure supplement 1, so can still be found there.
Reviewer #2 (Recommendations for the authors):
(1) Related to the first point in my concerns, I would suggest the authors compare decoding accuracy between correct presses followed by correct vs. incorrect presses. This would clarify if the decoder is actually taking the MEG signal for subsequent press into account. I would also suggest the authors use pre-movement MEG features and post-movement features with shorter windows and compare each result with the results for the original post-movement MEG feature with a longer window.
The present study does not contain enough errors to perform the analysis proposed by the Reviewer. As noted above, we did re-examine our data and now report a new control regression analysis, all of which indicate that the proximity between keypresses does not explain contextualization effects.
(2) I was several times confused by the author's use of "neural representation of an action" or "sequence action representations" in understanding whether these terms refer to representation on the level of whole-brain, region (as defined by the specific parcellation used), or voxels. In fact, what is submitted to the decoder is some complicated whole-brain MEG feature (i.e., the "neural representation"), which is a hybrid of voxel and parcel features that is further dimension-reduced and not immediately interpretable. Clarifying this point early in the text and possibly using some more sensible terms, such as adding "brain-wise" before the "sequence action representation", would be the most helpful for the readers.
We now clarified this terminology in the revised manuscript.
(3) Although comparing many different ways in feature selection/reduction, time window selection, and decoder types is undoubtedly a meticulous work, the current version of the manuscript seems still lacking some explanation about the details of these methodological choices, like which decoding method was actually used to report the accuracy, whether or not different decoding methods were chosen for individual participants' data, how training data was selected (is it all of the correct presses in Day 1 data?), whether the frequency power or signal amplitude was used, and so on. I would highly appreciate these additional details in the Methods section.
The reported accuracies were based on linear discriminant analysis classifier. A comparison of different decoders (Figure 3 – figure supplement 4) shows LDA was the optimal choice.
Whether or not different decoding methods were chosen for individual participants' data
We selected the same decoder (LDA) performance to report the final accuracy.
How training data was selected (is it all of the correct presses in Day 1 data?),
Decoder training was conducted as a randomized split of the data (all correct keypresses of Day 1) into training (90%) and test (10%) samples for 8 iterations.
Whether the frequency power or signal amplitude was used
Signal amplitude was used for feature calculation.
(4) In terms of the Methods, please consider adding some references about the 'F1 score', the 'feature importance score,' and the 'MRMR-based feature ranking,' as the main readers of the current paper would not be from the machine learning community. Also, why did the LDA dimensionality reduction reduce accuracy specifically for the voxel feature?
We have now added the following statements to the Methods section that provide more detailed descriptions and references for these metrics:
“The F1 score, defined as the harmonic mean of the precision (percentage of true predictions that are actually true positive) and recall (percentage of true positives that were correctly predicted as true) scores, was used as a comprehensive metric for all one-versus-all keypress state decoders to assess class-wise performance that accounts for both false-positive and false-negative prediction tendencies [REF]. A weighted mean F1 score was then computed across all classes to assess the overall prediction performance of the multi-class model.”
and
“Feature Importance Scores
The relative contribution of source-space voxels and parcels to decoding performance (i.e. – feature importance score) was calculated using minimum redundant maximum relevance (MRMR) and highlighted in topography plots. MRMR, an approach that combines both relevance and redundancy metrics, ranked individual features based upon their significance to the target variable (i.e. – keypress state identity) prediction accuracy and their non-redundancy with other features.”
As stated in the Reviewer responses above, the dimensionality of the voxel-space feature set is very high (i.e. – 15684). LDA attempts to map the input features onto a much smaller dimensional space (number of classes-1; e.g. – 3 dimensions for 4-class keypress decoding). It is likely that the reduction in accuracy observed only for the voxel-space feature was due to the loss of relevant information during the mapping process that resulted in reduced accuracy. This reduction in accuracy for voxel-space decoding was specific to LDA. Figure 3—figure supplement 3 shows that voxel-space decoder performance actually improved when utilizing alternative dimensionality reduction techniques.
(5) Paragraph 9, lines #139-142: "Notably, decoding associated with index finger keypresses (executed at two different ordinal positions in the sequence) exhibited the highest number of misclassifications of all digits (N = 141 or 47.5% of all decoding errors; Figure 3C), raising the hypothesis that the same action could be differentially represented when executed at different learning state or sequence context locations."
This does not seem to be a fair comparison, as the index finger appears twice as many as the other fingers do in the sequence. To claim this, proper statistical analysis needs to be done taking this difference into account.
We thank the Reviewer for bringing this issue to our attention. We have now corrected this comparison to evaluate relative false negative and false positive rates between individual keypress state decoders, and have revised this statement in the manuscript as follows:
“Notably, decoding of index finger keypresses (executed at two different ordinal positions in the sequence) exhibited the highest false negative (0.116 per keypress) and false positive (0.043 per keypress) misclassification rates compared with all other digits (false negative rate range = [0.067 0.114]; false positive rate range = [0.020 0.037]; Figure 3C), raising the hypothesis that the same action could be differentially represented when executed within different contexts (i.e. - different learning states or sequence locations).”
(6) Finally, the authors could consider acknowledging in the Discussion that the contribution of micro-offline learning to genuine skill learning is still under debate (e.g., Gupta and Rickard, 2023; 2024; Das et al., bioRxiv, 2024).
We have added a paragraph in the Discussion that addresses this point.
Reviewer #3 (Recommendations for the authors):
In addition to the additional analyses suggested in the public review, I have the following suggestions/questions:
(1) Given that the authors introduce a new decoding approach, it would be very helpful for readers to see a distribution of window sizes and window onsets eventually used across individuals, at least for the optimized decoder.
We have now included a new supplemental figure (Figure 4 – figure Supplement 2) that provides this information.
(2) Please explain in detail how you arrived at the (interpolated?) group-level plot shown in Figure 1B, starting from the discrete single-trial keypress transition times. Also, please specify what the shading shows.
Instantaneous correct sequence speed (skill measure) was quantified as the inverse of time (in seconds) required to complete a single iteration of a correctly generated full 5-item sequence. Individual keypress responses were labeled as members of correct sequences if they occurred within a 5-item response pattern matching any possible circular shifts of the 5-item sequence displayed on the monitor (41324). This approach allowed us to quantify a measure of skill within each practice trial at the resolution of individual keypresses. The dark line indicates the group mean performance dynamics for each trial. The shaded region indicates the 95% confidence limit of the mean (see Methods).
(3) Similarly, please explain how you arrived at the group-level plot shown in Figure 1C. What are the different colored lines (rows) within each trial? How exactly did the authors reach the conclusion that KTT variability stabilizes by trial 6?
Figure 1C provides additional information to the correct sequence speed measure above, as it also tracks individual transition speed composition over learning. Figure 1C, thus, represents both changes in overall correct sequence speed dynamics (indicated by the overall narrowing of the horizontal speed lines moving from top to bottom) and the underlying composition of the individual transition patterns within and across trials. The coloring of the lines is a shading convention used to discriminate between different keypress transitions. These curves were sampled with 1ms resolution, as in Figure 1B. Addressing the underlying keypress transition patterns requires within-subject normalization before averaging across subjects. The distribution of KTTs was normalized to the median correct sequence time for each participant and centered on the mid-point for each full sequence iteration during early learning.
(4) Maybe I missed it, but it was not clear to me which of the tested classifiers was eventually used. Or was that individualized as well? More generally, a comparison of the different classifiers would be helpful, similar to the comparison of dimension reduction techniques.
We have now included a new supplemental figure that provides this information.
(5) Please add df and effect sizes to all statistics.
Done.
(6) Please explain in more detail your power calculation.
The study was powered to determine the minimum sample size needed to detect a significant change in skill performance following training using a one-sample t-test (two-sided; alpha = 0.05; 95% statistical power; Cohen’s D effect size = 0.8115 calculated from previously acquired data in our lab). The calculated minimum sample size was 22. The included study sample size (n = 27) exceeded this minimum.
This information is now included in the revised manuscript.
(7) The cut-off for the high-pass filter is unusually high and seems risky in terms of potential signal distortions (de Cheveigne, Neuron 2019). Why did the authors choose such a high cut-off?
The 1Hz high-pass cut-off frequency for the 1-150Hz band-pass filter applied to the continuous raw MEG data during preprocessing has been used in multiple previous MEG publications (Barratt et al., 2018; Brookes et al., 2012; Higgins et al., 2021; Seedat et al., 2020; Vidaurre et al., 2018).
(8) "Furthermore, the magnitude of offline contextualization predicted skill gains while online contextualization did not", lines 336/337 - where is that analysis?
Additional details pertaining to this analysis are now provided in the Results section (Figure 5 – figure supplement 4).
(9) How were feature importance scores computed?
We have now added a new subheading in the Methods section with a more detailed description of how feature importance scores were computed.
(10) Please add x and y ticks plus tick labels to Figure 5 - Figure Supplement 3, panel A
Done
(11) Line 369, what does "comparable" mean in this context?
The sentence in the “Study Participants” part of the Methods section referred to here has now been revised for clarity.
(12) In lines 496/497, please specify what t=0 means (KeyDown event, I guess?).
Yes, the KeyDown event occurs at t = 0. This has now been clarified in the revised manuscript.
(13) Please specify consistent boundaries between alpha- and beta-bands (they are currently not consistent in the Results vs. Methods (14/15 Hz or 15/16 Hz)).
We thank the Reviewer for alerting us to this discrepancy caused by a typographic error in the Methods. We have now corrected this so that the alpha (8-14 Hz) and beta-band (15-24 Hz) frequency limits are described consistently throughout the revised manuscript.
References
Albouy, G., Fogel, S., King, B. R., Laventure, S., Benali, H., Karni, A., Carrier, J., Robertson, E. M., & Doyon, J. (2015). Maintaining vs. enhancing motor sequence memories: respective roles of striatal and hippocampal systems. Neuroimage, 108, 423-434. https://doi.org/10.1016/j.neuroimage.2014.12.049
Albouy, G., King, B. R., Maquet, P., & Doyon, J. (2013). Hippocampus and striatum: dynamics and interaction during acquisition and sleep-related motor sequence memory consolidation. Hippocampus, 23(11), 985-1004. https://doi.org/10.1002/hipo.22183 Albouy, G., Sterpenich, V., Vandewalle, G., Darsaud, A., Gais, S., Rauchs, G., Desseilles, M., Boly, M., Dang-Vu, T., Balteau, E., Degueldre, C., Phillips, C., Luxen, A., & Maquet, P. (2012). Neural correlates of performance variability during motor sequence acquisition. NeuroImage, 60(1), 324-331. https://doi.org/10.1016/j.neuroimage.2011.12.049
Andersen, R. A., & Buneo, C. A. (2002). Intentional maps in posterior parietal cortex. Annu Rev Neurosci, 25, 189-220. https://doi.org/10.1146/annurev.neuro.25.112701.142922 112701.142922 [pii]
Ashe, J., Lungu, O. V., Basford, A. T., & Lu, X. (2006). Cortical control of motor sequences. Curr Opin Neurobiol, 16(2), 213-221. http://www.ncbi.nlm.nih.gov/entrez/query.fcgi?cmd=Retrieve&db=PubMed&dopt=Citati on&list_uids=16563734
Bansal, A. K., Vargas-Irwin, C. E., Truccolo, W., & Donoghue, J. P. (2011). Relationships among low-frequency local field potentials, spiking activity, and three-dimensional reach and grasp kinematics in primary motor and ventral premotor cortices. J Neurophysiol, 105(4), 1603-1619. https://doi.org/10.1152/jn.00532.2010
Barratt, E. L., Francis, S. T., Morris, P. G., & Brookes, M. J. (2018). Mapping the topological organisation of beta oscillations in motor cortex using MEG. NeuroImage, 181, 831-844. https://doi.org/10.1016/j.neuroimage.2018.06.041
Bassett, D. S., Wymbs, N. F., Porter, M. A., Mucha, P. J., Carlson, J. M., & Grafton, S. T. (2011). Dynamic reconfiguration of human brain networks during learning. Proc Natl Acad Sci U S A, 108(18), 7641-7646. https://doi.org/10.1073/pnas.1018985108
Battaglia-Mayer, A., & Caminiti, R. (2019). Corticocortical Systems Underlying High-Order Motor Control. J Neurosci, 39(23), 4404-4421. https://doi.org/10.1523/JNEUROSCI.2094-18.2019
Berlot, E., Popp, N. J., & Diedrichsen, J. (2020). A critical re-evaluation of fMRI signatures of motor sequence learning. Elife, 9. https://doi.org/10.7554/eLife.55241
Bonstrup, M., Iturrate, I., Hebart, M. N., Censor, N., & Cohen, L. G. (2020). Mechanisms of offline motor learning at a microscale of seconds in large-scale crowdsourced data. NPJ Sci Learn, 5, 7. https://doi.org/10.1038/s41539-020-0066-9
Bonstrup, M., Iturrate, I., Thompson, R., Cruciani, G., Censor, N., & Cohen, L. G. (2019). A Rapid Form of Offline Consolidation in Skill Learning. Curr Biol, 29(8), 1346-1351 e1344. https://doi.org/10.1016/j.cub.2019.02.049
Brawn, T. P., Fenn, K. M., Nusbaum, H. C., & Margoliash, D. (2010). Consolidating the effects of waking and sleep on motor-sequence learning. J Neurosci, 30(42), 13977-13982. https://doi.org/10.1523/JNEUROSCI.3295-10.2010
Brookes, M. J., Woolrich, M. W., & Barnes, G. R. (2012). Measuring functional connectivity in MEG: a multivariate approach insensitive to linear source leakage. NeuroImage, 63(2), 910-920. https://doi.org/10.1016/j.neuroimage.2012.03.048
Brooks, E., Wallis, S., Hendrikse, J., & Coxon, J. (2024). Micro-consolidation occurs when learning an implicit motor sequence, but is not influenced by HIIT exercise. NPJ Sci Learn, 9(1), 23. https://doi.org/10.1038/s41539-024-00238-6
Buch, E. R., Claudino, L., Quentin, R., Bonstrup, M., & Cohen, L. G. (2021). Consolidation of human skill linked to waking hippocampo-neocortical replay. Cell Rep, 35(10), 109193. https://doi.org/10.1016/j.celrep.2021.109193
Buneo, C. A., & Andersen, R. A. (2006). The posterior parietal cortex: sensorimotor interface for the planning and online control of visually guided movements. Neuropsychologia, 44(13), 2594-2606. https://doi.org/10.1016/j.neuropsychologia.2005.10.011
Buzsaki, G. (2015). Hippocampal sharp wave-ripple: A cognitive biomarker for episodic memory and planning. Hippocampus, 25(10), 1073-1188. https://doi.org/10.1002/hipo.22488
Chen, P.-C., Stritzelberger, J., Walther, K., Hamer, H., & Staresina, B. P. (2024). Hippocampal ripples during offline periods predict human motor sequence learning. bioRxiv, 2024.2010.2006.614680. https://doi.org/10.1101/2024.10.06.614680
Churchland, M. M., Cunningham, J. P., Kaufman, M. T., Foster, J. D., Nuyujukian, P., Ryu, S. I., & Shenoy, K. V. (2012). Neural population dynamics during reaching. Nature, 487(7405), 51-56. https://doi.org/10.1038/nature11129
Classen, J., Liepert, J., Wise, S. P., Hallett, M., & Cohen, L. G. (1998). Rapid plasticity of human cortical movement representation induced by practice. J Neurophysiol, 79(2), 1117-1123. http://www.ncbi.nlm.nih.gov/entrez/query.fcgi?cmd=Retrieve&db=PubMed&dopt=Citati on&list_uids=9463469
Colclough, G. L., Brookes, M. J., Smith, S. M., & Woolrich, M. W. (2015). A symmetric multivariate leakage correction for MEG connectomes. NeuroImage, 117, 439-448. https://doi.org/10.1016/j.neuroimage.2015.03.071
Colclough, G. L., Woolrich, M. W., Tewarie, P. K., Brookes, M. J., Quinn, A. J., & Smith, S. M. (2016). How reliable are MEG resting-state connectivity metrics? NeuroImage, 138, 284-293. https://doi.org/10.1016/j.neuroimage.2016.05.070
Das, A., Karagiorgis, A., Diedrichsen, J., Stenner, M.-P., & Azanon, E. (2024). “Micro-offline gains” convey no benefit for motor skill learning. bioRxiv, 2024.2007.2011.602795. https://doi.org/10.1101/2024.07.11.602795
Deleglise, A., Donnelly-Kehoe, P. A., Yeffal, A., Jacobacci, F., Jovicich, J., Amaro, E., Jr., Armony, J. L., Doyon, J., & Della-Maggiore, V. (2023). Human motor sequence learning drives transient changes in network topology and hippocampal connectivity early during memory consolidation. Cereb Cortex, 33(10), 6120-6131. https://doi.org/10.1093/cercor/bhac489
Doyon, J., Bellec, P., Amsel, R., Penhune, V., Monchi, O., Carrier, J., Lehéricy, S., & Benali, H. (2009). Contributions of the basal ganglia and functionally related brain structures to motor learning. [Review]. Behavioural brain research, 199(1), 61-75. https://doi.org/10.1016/j.bbr.2008.11.012
Doyon, J., Song, A. W., Karni, A., Lalonde, F., Adams, M. M., & Ungerleider, L. G. (2002). Experience-dependent changes in cerebellar contributions to motor sequence learning. Proc Natl Acad Sci U S A, 99(2), 1017-1022. http://www.ncbi.nlm.nih.gov/entrez/query.fcgi?cmd=Retrieve&db=PubMed&dopt=Citati on&list_uids=11805340
Euston, D. R., Gruber, A. J., & McNaughton, B. L. (2012). The role of medial prefrontal cortex in memory and decision making. Neuron, 76(6), 1057-1070. https://doi.org/10.1016/j.neuron.2012.12.002
Euston, D. R., Tatsuno, M., & McNaughton, B. L. (2007). Fast-forward playback of recent memory sequences in prefrontal cortex during sleep. Science, 318(5853), 1147-1150. https://doi.org/10.1126/science.1148979
Flint, R. D., Ethier, C., Oby, E. R., Miller, L. E., & Slutzky, M. W. (2012). Local field potentials allow accurate decoding of muscle activity. J Neurophysiol, 108(1), 18-24. https://doi.org/10.1152/jn.00832.2011
Frankland, P. W., & Bontempi, B. (2005). The organization of recent and remote memories. Nat Rev Neurosci, 6(2), 119-130. https://doi.org/10.1038/nrn1607
Gais, S., Albouy, G., Boly, M., Dang-Vu, T. T., Darsaud, A., Desseilles, M., Rauchs, G., Schabus, M., Sterpenich, V., Vandewalle, G., Maquet, P., & Peigneux, P. (2007). Sleep transforms the cerebral trace of declarative memories. Proc Natl Acad Sci U S A, 104(47), 1877818783. https://doi.org/10.1073/pnas.0705454104
Grafton, S. T., Mazziotta, J. C., Presty, S., Friston, K. J., Frackowiak, R. S., & Phelps, M. E. (1992). Functional anatomy of human procedural learning determined with regional cerebral blood flow and PET. J Neurosci, 12(7), 2542-2548.
Grover, S., Wen, W., Viswanathan, V., Gill, C. T., & Reinhart, R. M. G. (2022). Long-lasting, dissociable improvements in working memory and long-term memory in older adults with repetitive neuromodulation. Nat Neurosci, 25(9), 1237-1246. https://doi.org/10.1038/s41593-022-01132-3
Gupta, M. W., & Rickard, T. C. (2022). Dissipation of reactive inhibition is sufficient to explain post-rest improvements in motor sequence learning. NPJ Sci Learn, 7(1), 25. https://doi.org/10.1038/s41539-022-00140-z
Gupta, M. W., & Rickard, T. C. (2024). Comparison of online, offline, and hybrid hypotheses of motor sequence learning using a quantitative model that incorporate reactive inhibition. Sci Rep, 14(1), 4661. https://doi.org/10.1038/s41598-024-52726-9
Hardwick, R. M., Rottschy, C., Miall, R. C., & Eickhoff, S. B. (2013). A quantitative metaanalysis and review of motor learning in the human brain. NeuroImage, 67, 283-297. https://doi.org/10.1016/j.neuroimage.2012.11.020
Heusser, A. C., Poeppel, D., Ezzyat, Y., & Davachi, L. (2016). Episodic sequence memory is supported by a theta-gamma phase code. Nat Neurosci, 19(10), 1374-1380. https://doi.org/10.1038/nn.4374
Higgins, C., Liu, Y., Vidaurre, D., Kurth-Nelson, Z., Dolan, R., Behrens, T., & Woolrich, M. (2021). Replay bursts in humans coincide with activation of the default mode and parietal alpha networks. Neuron, 109(5), 882-893 e887. https://doi.org/10.1016/j.neuron.2020.12.007
Hikosaka, O., Nakamura, K., Sakai, K., & Nakahara, H. (2002). Central mechanisms of motor skill learning. Curr Opin Neurobiol, 12(2), 217-222. http://www.ncbi.nlm.nih.gov/entrez/query.fcgi?cmd=Retrieve&db=PubMed&dopt=Citati on&list_uids=12015240
Jacobacci, F., Armony, J. L., Yeffal, A., Lerner, G., Amaro, E., Jr., Jovicich, J., Doyon, J., & Della-Maggiore, V. (2020). Rapid hippocampal plasticity supports motor sequence learning. Proc Natl Acad Sci U S A, 117(38), 23898-23903. https://doi.org/10.1073/pnas.2009576117
Jacobacci, F., Armony, J. L., Yeffal, A., Lerner, G., Amaro Jr, E., Jovicich, J., Doyon, J., & DellaMaggiore, V. (2020). Rapid hippocampal plasticity supports motor sequence learning.
Proceedings of the National Academy of Sciences, 117(38), 23898-23903. Karni, A., Meyer, G., Jezzard, P., Adams, M. M., Turner, R., & Ungerleider, L. G. (1995). Functional MRI evidence for adult motor cortex plasticity during motor skill learning. Nature, 377(6545), 155-158. https://doi.org/10.1038/377155a0
Kennerley, S. W., Sakai, K., & Rushworth, M. F. (2004). Organization of action sequences and the role of the pre-SMA. J Neurophysiol, 91(2), 978-993. https://doi.org/10.1152/jn.00651.2003 00651.2003 [pii]
Kleim, J. A., Barbay, S., & Nudo, R. J. (1998). Functional reorganization of the rat motor cortex following motor skill learning. J Neurophysiol, 80, 3321-3325.
Kornysheva, K., Bush, D., Meyer, S. S., Sadnicka, A., Barnes, G., & Burgess, N. (2019). Neural Competitive Queuing of Ordinal Structure Underlies Skilled Sequential Action. Neuron, 101(6), 1166-1180 e1163. https://doi.org/10.1016/j.neuron.2019.01.018
Lee, S. H., Jin, S. H., & An, J. (2019). The difference in cortical activation pattern for complex motor skills: A functional near- infrared spectroscopy study. Sci Rep, 9(1), 14066. https://doi.org/10.1038/s41598-019-50644-9
Lisman, J. E., & Jensen, O. (2013). The theta-gamma neural code. Neuron, 77(6), 1002-1016. https://doi.org/10.1016/j.neuron.2013.03.007
Mollazadeh, M., Aggarwal, V., Davidson, A. G., Law, A. J., Thakor, N. V., & Schieber, M. H. (2011). Spatiotemporal variation of multiple neurophysiological signals in the primary motor cortex during dexterous reach-to-grasp movements. J Neurosci, 31(43), 15531-15543. https://doi.org/10.1523/JNEUROSCI.2999-11.2011
Molle, M., & Born, J. (2009). Hippocampus whispering in deep sleep to prefrontal cortex--for good memories? Neuron, 61(4), 496-498. https://doi.org/10.1016/j.neuron.2009.02.002
Morris, R. G. M. (2006). Elements of a neurobiological theory of hippocampal function: the role of synaptic plasticity, synaptic tagging and schemas. [Review]. The European journal of neuroscience, 23(11), 2829-2846. https://doi.org/10.1111/j.1460-9568.2006.04888.x
Mylonas, D., Schapiro, A. C., Verfaellie, M., Baxter, B., Vangel, M., Stickgold, R., & Manoach, D. S. (2024). Maintenance of Procedural Motor Memory across Brief Rest Periods Requires the Hippocampus. J Neurosci, 44(14). https://doi.org/10.1523/JNEUROSCI.1839-23.2024
Pan, S. C., & Rickard, T. C. (2015). Sleep and motor learning: Is there room for consolidation? Psychol Bull, 141(4), 812-834. https://doi.org/10.1037/bul0000009
Penhune, V. B., & Steele, C. J. (2012). Parallel contributions of cerebellar, striatal and M1 mechanisms to motor sequence learning. Behav. Brain Res., 226(2), 579-591. https://doi.org/10.1016/j.bbr.2011.09.044
Qin, Y. L., McNaughton, B. L., Skaggs, W. E., & Barnes, C. A. (1997). Memory reprocessing in corticocortical and hippocampocortical neuronal ensembles. Philos Trans R Soc Lond B Biol Sci, 352(1360), 1525-1533. https://doi.org/10.1098/rstb.1997.0139
Rickard, T. C., Cai, D. J., Rieth, C. A., Jones, J., & Ard, M. C. (2008). Sleep does not enhance motor sequence learning. J Exp Psychol Learn Mem Cogn, 34(4), 834-842. https://doi.org/10.1037/0278-7393.34.4.834
Robertson, E. M., Pascual-Leone, A., & Miall, R. C. (2004). Current concepts in procedural consolidation. Nat Rev Neurosci, 5(7), 576-582. http://www.ncbi.nlm.nih.gov/entrez/query.fcgi?cmd=Retrieve&db=PubMed&dopt=Citati on&list_uids=15208699
Sawamura, D., Sakuraba, S., Suzuki, Y., Asano, M., Yoshida, S., Honke, T., Kimura, M., Iwase, Y., Horimoto, Y., Yoshida, K., & Sakai, S. (2019). Acquisition of chopstick-operation skills with the non-dominant hand and concomitant changes in brain activity. Sci Rep, 9(1), 20397. https://doi.org/10.1038/s41598-019-56956-0
Schendan, H. E., Searl, M. M., Melrose, R. J., & Stern, C. E. (2003). An FMRI study of the role of the medial temporal lobe in implicit and explicit sequence learning. Neuron, 37(6), 1013-1025. https://doi.org/10.1016/s0896-6273(03)00123-5
Seedat, Z. A., Quinn, A. J., Vidaurre, D., Liuzzi, L., Gascoyne, L. E., Hunt, B. A. E., O'Neill, G. C., Pakenham, D. O., Mullinger, K. J., Morris, P. G., Woolrich, M. W., & Brookes, M. J. (2020). The role of transient spectral 'bursts' in functional connectivity: A magnetoencephalography study. NeuroImage, 209, 116537. https://doi.org/10.1016/j.neuroimage.2020.116537
Shadmehr, R., & Holcomb, H. H. (1997). Neural correlates of motor memory consolidation. Science, 277, 821-824.
Sjøgård, M., Baxter, B., Mylonas, D., Driscoll, B., Kwok, K., Tolosa, A., Thompson, M., Stickgold, R., Vangel, M., Chu, C., & Manoach, D. S. (2024). Hippocampal ripples mediate motor learning during brief rest breaks in humans. bioRxiv. https://doi.org/10.1101/2024.05.02.592200
Srinivas, S., Sarvadevabhatla, R. K., Mopuri, K. R., Prabhu, N., Kruthiventi, S. S. S., & Babu, R. V. (2016). A Taxonomy of Deep Convolutional Neural Nets for Computer Vision [Technology Report]. Frontiers in Robotics and AI, 2. https://doi.org/10.3389/frobt.2015.00036
Sterpenich, V., Albouy, G., Darsaud, A., Schmidt, C., Vandewalle, G., Dang Vu, T. T., Desseilles, M., Phillips, C., Degueldre, C., Balteau, E., Collette, F., Luxen, A., & Maquet, P. (2009). Sleep promotes the neural reorganization of remote emotional memory. J Neurosci, 29(16), 5143-5152. https://doi.org/10.1523/JNEUROSCI.0561-09.2009
Toni, I., Ramnani, N., Josephs, O., Ashburner, J., & Passingham, R. E. (2001). Learning arbitrary visuomotor associations: temporal dynamic of brain activity. Neuroimage, 14(5), 10481057. http://www.ncbi.nlm.nih.gov/entrez/query.fcgi?cmd=Retrieve&db=PubMed&dopt=Citati on&list_uids=11697936
Toni, I., Thoenissen, D., & Zilles, K. (2001). Movement preparation and motor intention. NeuroImage, 14(1 Pt 2), S110-117. https://doi.org/10.1006/nimg.2001.0841
Tse, D., Langston, R. F., Kakeyama, M., Bethus, I., Spooner, P. A., Wood, E. R., Witter, M. P., & Morris, R. G. (2007). Schemas and memory consolidation. Science, 316(5821), 76-82. https://doi.org/10.1126/science.1135935
van Kesteren, M. T., Fernandez, G., Norris, D. G., & Hermans, E. J. (2010). Persistent schemadependent hippocampal-neocortical connectivity during memory encoding and postencoding rest in humans. Proc Natl Acad Sci U S A, 107(16), 7550-7555. https://doi.org/10.1073/pnas.0914892107
van Kesteren, M. T., Ruiter, D. J., Fernandez, G., & Henson, R. N. (2012). How schema and novelty augment memory formation. Trends Neurosci, 35(4), 211-219. https://doi.org/10.1016/j.tins.2012.02.001
Vidaurre, D., Hunt, L. T., Quinn, A. J., Hunt, B. A. E., Brookes, M. J., Nobre, A. C., & Woolrich, M. W. (2018). Spontaneous cortical activity transiently organises into frequency specific phase-coupling networks. Nat Commun, 9(1), 2987. https://doi.org/10.1038/s41467-01805316-z
Wagner, A. D., Schacter, D. L., Rotte, M., Koutstaal, W., Maril, A., Dale, A. M., Rosen, B. R., & Buckner, R. L. (1998). Building memories: remembering and forgetting of verbal experiences as predicted by brain activity. [Comment]. Science (New York, N.Y.), 281(5380), 1188-1191. http://eutils.ncbi.nlm.nih.gov/entrez/eutils/elink.fcgi?dbfrom=pubmed&id=9712582 &retmode=ref&cmd=prlinks
Wolpert, D. M., Goodbody, S. J., & Husain, M. (1998). Maintaining internal representations: the role of the human superior parietal lobe. Nat Neurosci, 1(6), 529-533. https://doi.org/10.1038/2245
Author Response
The following is the authors’ response to the original reviews.
Public Reviews:
Reviewer #1 (Public Review):
The authors of this study seek to visualize NS1 purified from dengue virus infected cells. They infect vero cells with DV2-WT and DV2 NS1-T164S (a mutant virus previously characterized by the authors). The authors utilize an anti-NS1 antibody to immunoprecipitate NS1 from cell supernatants and then elute the antibody/NS1 complex with acid. The authors evaluate the eluted NS1 by SDS-PAGE, Native Page, mass spec, negative-stain EM, and eventually Cryo-EM. SDS-PAGE, mas spec, and native page reveal a >250 Kd species containing both NS1 and the proteinaceous component of HDL (ApoA1). The authors produce evidence to suggest that this population is predominantly NS1 in complex with ApoA1. This contrasts with recombinantly produced NS1 (obtained from a collaborator) which did not appear to be in complex with or contain ApoA1 (Figure 1C). The authors then visualize their NS1 stock in complex with their monoclonal antibody by CryoEM. For NS1-WT, the major species visualized by the authors was a ternary complex of an HDL particle in complex with an NS1 dimer bound to their mAB. For their mutant NS1-T164S, they find similar structures, but in contrast to NS1-WT, they visualize free NS1 dimers in complex with 2 Fabs (similar to what's been reported previously) as one of the major species. This highlights that different NS1 species have markedly divergent structural dynamics. It's important to note that the electron density maps for their structures do appear to be a bit overfitted since there are many regions with electron density that do not have a predicted fit and their HDL structure does not appear to have any predicted secondary structure for ApoA1. The authors then map the interaction between NS1 and ApoA1 using cross-linking mass spectrometry revealing numerous NS1-ApoA1 contact sites in the beta-roll and wing domain. The authors find that NS1 isolated from DENV infected mice is also present as a >250 kD species containing ApoA1. They further determine that immunoprecipitation of ApoA1 out of the sera from a single dengue patient correlates with levels of NS1 (presumably COIPed by ApoA1) in a dose-dependent manner.
In the end, the authors make some useful observations for the NS1 field (mostly confirmatory) providing additional insight into the propensity of NS1 to interact with HDL and ApoA1. The study does not provide any functional assays to demonstrate activity of their proteins or conduct mutagenesis (or any other assays) to support their interaction predications. The authors assertion that higher-order NS1 exists primarily as a NS1 dimer in complex with HDL is not well supported as their purification methodology of NS1 likely introduces bias as to what NS1 complexes are isolated. While their results clearly reveal NS1 in complex with ApoA1, the lack of other NS1 homo-oligomers may be explained by how they purify NS1 from virally infected supernatant. Because NS1 produced during viral infection is not tagged, the authors use an anti-NS1 monoclonal antibody to purify NS1. This introduces a source of bias since only NS1 oligomers with their mAb epitope exposed will be purified. Further, the use of acid to elute NS1 may denature or alter NS1 structure and the authors do not include controls to test functionality of their NS1 stocks (capacity to trigger endothelial dysfunction or immune cell activation). The acid elution may force NS1 homo-oligomers into dimers which then reassociate with ApoA1 in a manner that is not reflective of native conditions. Conducting CryoEM of NS1 stocks only in the presence of full-length mAbs or Fabs also severely biases what species of NS1 is visualized since any NS1 oligomers without the B-ladder domain exposed will not be visualized. If the residues obscured by their mAb are involved in formation of higher-order oligomers then this antibody would functionally inhibit these species from forming. The absence of critical controls, use of one mAb, and acid elution for protein purification severely limits the interpretation of these data and do not paint a clear picture of if NS1 produced during infection is structurally distinct from recombinant NS1. Certainly there is novelty in purifying NS1 from virally infected cells, but without using a few different NS1 antibodies to purify NS1 stocks (or better yet a polyclonal population of antibodies) it's unclear if the results of the authors are simply a consequence of the mAb they selected.
Data produced from numerous labs studying structure and function of flavivirus NS1 proteins provide diverse lines of evidence that the oligomeric state of NS1 is dynamic and can shift depending on context and environment. This means that the methodology used for NS1 production and purification will strongly impact the results of a study. The data in this manuscript certainly capture one of these dynamic states and overall support the general model of a dynamic NS1 oligomer that can associate with both host proteins as well as itself but the assertions of this manuscript are overall too strong given their data, as there is little evidence in this manuscript, and none available in the large body of existing literature, to support that NS1 exists only as a dimer associated with ApoA1. More likely the results of this paper are a result of their NS1 purification methodology.
Suggestions for the Authors:
Major:
(1) Because of the methodology used for NS1 purification, it is not clear from the data provided if NS1 from viral infection differs from recombinant NS1. Isolating NS1 from viral infection using a polyclonal antibody population would be better to answer their questions. On this point, Vero cells are also not the best candidate for their NS1 production given these cells do not come from a human. A more relevant cell line like U937-DC-SIGN would be preferable.
We performed an optimization of sNS1 secretion from DENV infection in different cell lines (Author response image 1 below) to identify the best cell line candidate to obtain relatively high yield of sNS1 for the study. As shown in Author response image 1, the levels of sNS1 in the tested human cell lines Huh7 and HEK 293T were at least 3-5 fold lower than in Vero cells. Although using a monocytic cell line expressing DC-SIGN as suggested by the reviewer would be ideal, in our experience the low infectivity of DENV in monocytic cell lines will not yield sufficient amount of sNS1 needed for structural analysis. For these practical reasons we decided to use the closely related non-human primate cell line Vero for sNS1 production supported by our optimization data.
Author response image 1.
sNS1 secretion in different mammalian and mosquito cell lines after DENV2 infection. The NS1 secretion level is measured using PlateliaTM Dengue NS1 Ag ELISA kit (Bio-Rad) on day 3 (left) and day 5 (right) post infection respectively.
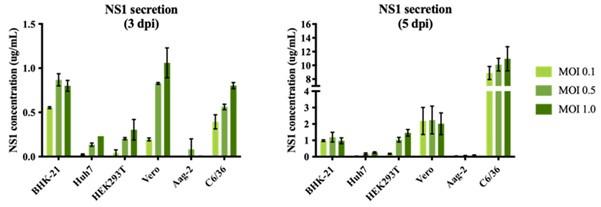
(2) The authors need to support their interaction predictions and models via orthogonal assays like mutagenesis followed by HDL/ApoA1 complexing and even NS1 functional assays. The authors should be able to mutate NS1 at regions predicted to be critical for ApoA1/HDL interaction. This is critical to support the central conclusions of this manuscript.
In our previous publication (Chan et al., 2019 Sci Transl Med), we used similarly purified sNS1 (immunoaffinity purification followed by acid elution) from infected culture supernatants from both DENV2 wild-type and T164S mutant (both also studied in the present work) to carry out stimulation assay on human PBMCs as described by other leading laboratories investigating NS1 (Modhiran et al., 2015 Sci Transl Med). For reader convenience we have extracted the data from our published paper and present it as Author response image 2 below.
Author response image 2.
(A) IL6 and (B) TNFa concentrations measured in the supernatants of human PBMCs incubated with either 1µg/ml or 10µg/ml of the BHK-21 immunoaffinity-purified WT and TS mutant sNS1 for 24 hours. Data is adapted from Chan et al., 2019.
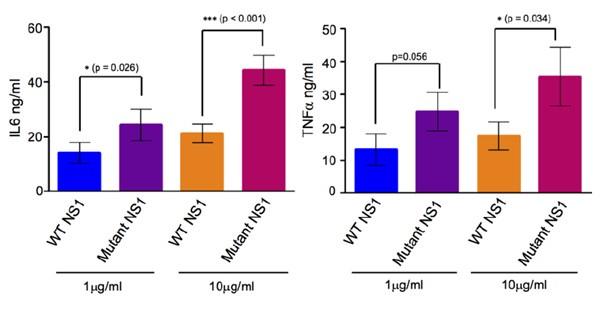
Incubation of immunoaffinity-purified sNS1 (WT and TS) with human PBMCs from 3 independent human donors triggered the production of proinflammatory cytokines IL6 and TNF in a concentration dependent manner (Author response image 2), consistent with the published data by Modhiran et al., 2015 Sci Transl Med. Interestingly the TS mutant derived sNS1 induced a higher proinflammatory cytokines production than WT virus derived sNS1 that appears to correlate with the more lethal and severe disease phenotype in mice as also reported in our previous work (Chan et al., 2019). Additionally, the functionality of our immune-affinity purified infection derived sNS1 (isNA1) is now further supported by our preliminary results on the NS1 induced endothelial cell permeability assay using the purified WT and mutant isNS1 (Author response image 3). As shown in Author response image 3, both the isNS1wt and isNS1ts mutant reduced the relative transendothelial resistance from 0 to 9 h post-treatment, with the peak resistance reduction observed at 6 h post-treatment, suggesting that the purified isNS1 induced endothelial dysfunction as reported in Puerta-Guardo et al., 2019, Cell Rep.) It is noteworthy that the isNS1 in our study behaves similarly as the commercial recombinant sNS1 (rsNS1 purchased from the same source used in study by Puerta-Guardo et al., 2019) in inducing endothelial hyperpermeability. Collectively our previous published and current data suggest that the purified isNS1 (as a complex with ApoA1) has a pathogenic role in disease pathogenesis that is also supported in a recent publication by Benfrid et al., EMBO 2022). The acid elution has not affected the functionality of NS1.
Author response image 3.
Functional assessment of isNS1wt and isNS1ts on vascular permeability in vitro. A trans-endothelial permeabilty assay via measurement of the transendothelial electrical resistance (TEER) on human umbilical vascular endothelial cells (hUVEC) was performed, as described previously (Puerta-Guardo et al., 2019, Cell Rep). Ovalbumin serves as the negative control, while TNF-α and rsNS1 serves as the positive controls.
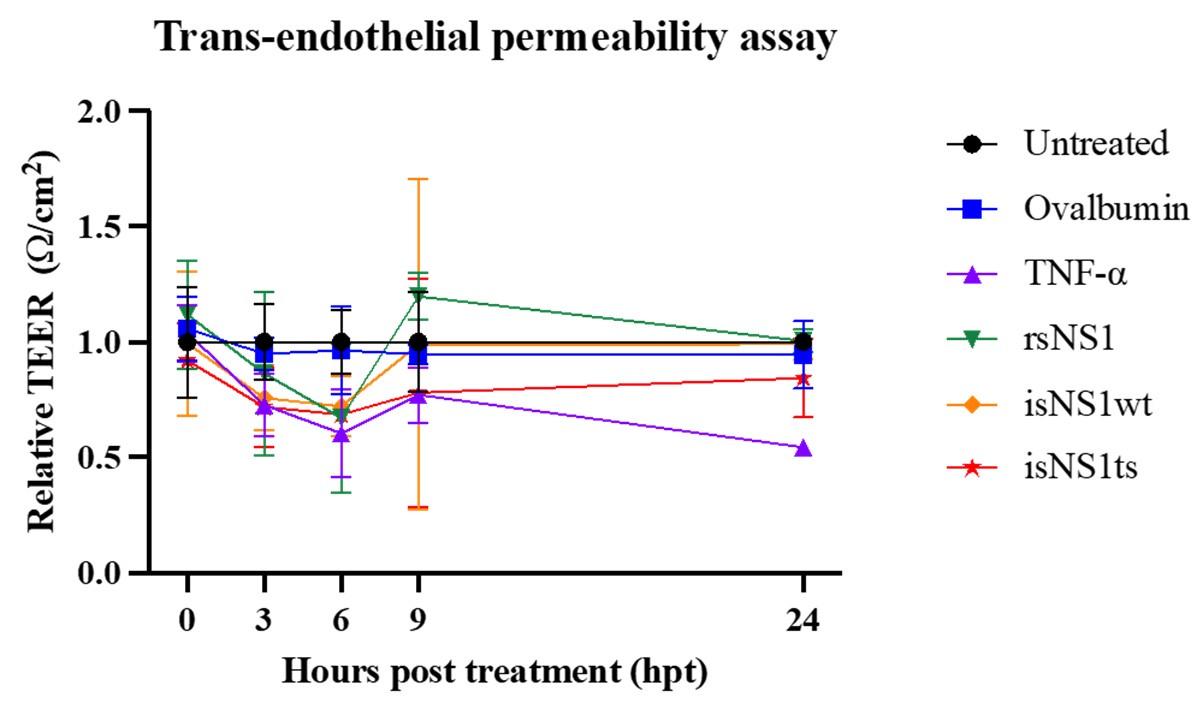
We agree with reviewer about the suggested mutagnesis study. We will perform site-directed mutagenesis at selected residues and further structural and functional analyses and report the results in a follow-up study.
(3) The authors need to show that the NS1 stocks produced using acid elution are functional compared to standard recombinantly produced NS1. Do acidic conditions impact structure/function of NS1?
We are providing the same response to comments 1 & 2 above. We would like to reiterate that we have previously used sNS1 from immunoaffinity purification followed by acid elution to test its function in stimulating PBMCs to produce pro-inflammatory cytokines (Chan et al., 2019; Author response image 2). Similar to Modhiran et al. (2015) and Benfrid et al. (2022), the sNS1 that we extracted using acid elution are capable of activating PBMCs to produce pro-inflammatory cytokines. We have now further demonstrated the ability of both WT and TS isNS1 in inducing endothelial permeability in vitro in hUVECs, using the TEER assay (Author response image 3). Based on the data presented in the rebuttal figures as well as our previous publication we do not think that the acid elution has a significant impact on function of isNS1.
We performed affinity purification to enrich the complex for better imaging and analysis (Supp Fig. 1b) since the crude supernatant contains serum proteins and serum-free infections also do not provide sufficient isNS1. The major complex observed in negative stain is 1:1 (also under acidic conditions which implies that the complex are stable and intact). We agree that it is possible that other oligomers can form but we have observed only a small population (74 out of 3433 particles, 2.15%; 24 micrographs) of HDL:sNS1 complex at 1:2 ratio as shown in the Author response image 4 below and in the manuscript (p. 4 lines 114-117, Supp Fig. 1c). Other NS1 dimer:HDL ratios including 2:1 and 3:1 have been reported by Benfrid et al., 2022 by spiking healthy sera with recombinant sNS1 and subsequent re-affinity purification. However, this method used an approximately 8-fold higher sNS1 concentration (400 ug/mL) than the maximum clinically reported concentration (50 ug/mL) (Young et al., 2000; Alcon et al., 2002; Libraty et al., 2002). In our hands, the sNS1 concentration in the concentrated media from in vitro infection was quantified as 30 ug/mL which is more physiologically relevant.
We conclude that the integrity of the HDL of the complex is not lost during sample preparation, as we are able to observe the complex under the negative staining EM as well as infer from XL-MS. Our rebuttal data and our previous studies with our acid-eluted isNS1 from immunoaffinity purification clearly show that our protein is functional and biologically relevant.
Author response image 4.
(A) Representative negative stain micrograph of sNS1wt (B) Representative 2D averages of negative stained isNS1wt. Red arrows indicating the characteristic wing-like protrusions of NS1 inserted in HDL. (C) Data adapted from Figure 2 in Benfrid et al. (2022).
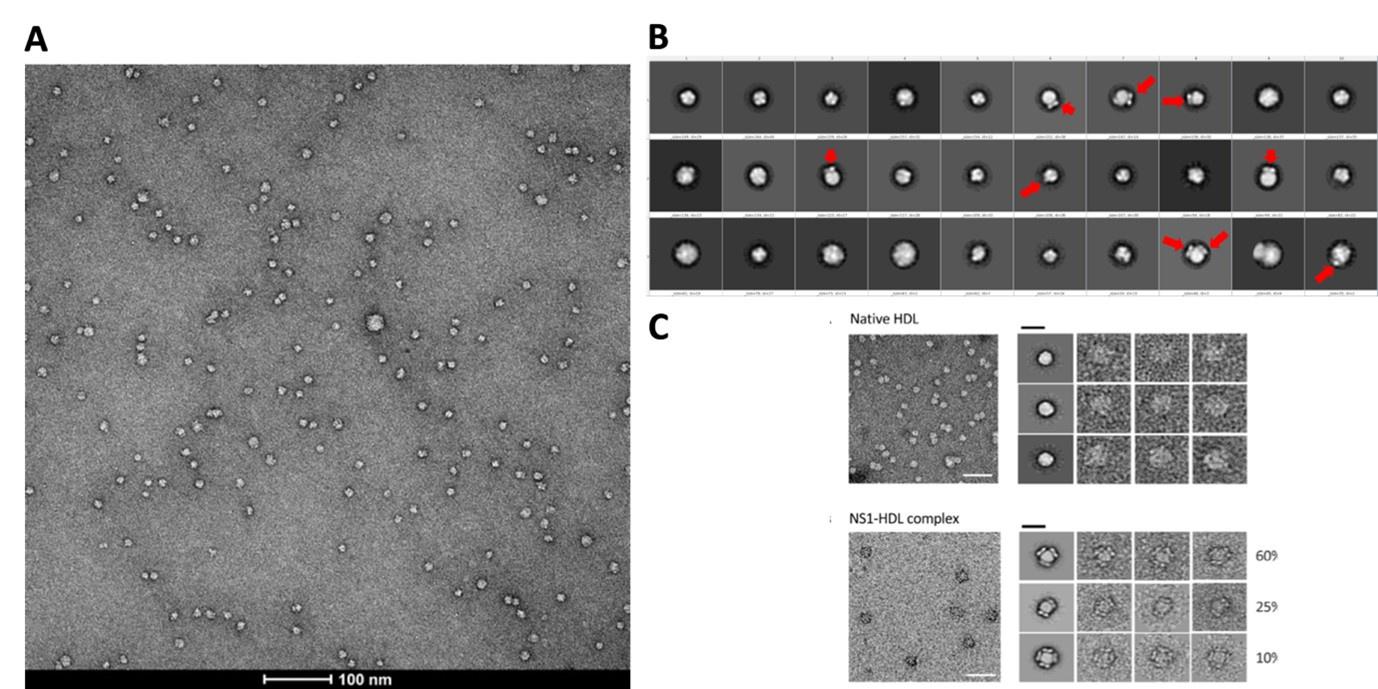
(4) Overall, the data obtained from the mutant NS1 (contrasted to WT NS1) reveals how dynamic the oligomeric state of NS1 proteins are but the authors do not provide any insight into how/why this is, some additional lines of evidence using either structural studies or mutagenesis to compare WT and their mutant and even NS1 from a different serotype of DENV would help the field to understand the dynamic nature of NS1.
The T164S mutation in DENV2 NS1 was proposed as the residue associated with disease severity in 1997 Cuban dengue epidemic (Halsted SB. “Intraepidemic increases in dengue disease severity: applying lessons on surveillance and transmission”. Whitehorn, J., Farrar. J., Eds., Clinical Insights in Dengue: Transmission, Diagnosis & Surveillance. The Future Medicine (2014), pp. 83-101). Our previous manuscript examined this mutation by engineering it into a less virulent clade 2 DENV isolated in Singapore and showed that sNS1 production was higher without any change in viral RNA replication. Transcript profiling of mutant compared to WT virus showed that genes that are usually induced during vascular leakage were upregulated for the mutant. We also showed that infection of interferon deficient AG129 mice with the mutant virus resulted in disease severity, increased complement protein expression in the liver, tissue inflammation and greater mortality compared to WT virus infected mice. The lipid profiling in our study (Chan et al., 2019) suggested small differences with WT but was overall similar to HDL as described by Gutsche et al. (2011). We were intrigued by our functional results and wanted to explore more deeply the impact of the mutation on sNS1 structure which at that stage was widely believed to be a trimer of NS1 dimers with a central channel (~ X Å) stuffed with lipid as established in several seminal publications (Flamand et al., 1999; Gutsche et al., 2011; Muller et al., 2012). In fact “This Week in Virology” netcast (https://www.microbe.tv/twiv/twiv-725/) discussed two back-to-back publications in Science (Modhiran et al., 371(6625)190-194; Biering et al., Science 371(6625):194-200)) which showed that therapeutic antibodies can ameliorate the NS1 induced pathogenesis and expert discussants posed questions that also pointed to the need for more accurate definition of the molecular composition and architecture of the circulating NS1 complex during virus infection to get a clearer handle on its pathogenic mechanism. Our current studies and also the recent high resolution cryoEM structures (Shu et al., 2022) do not support the notion of a central channel “stuffed with lipid”. Even in the rare instances where trimer of dimers are shown, the narrow channel in the center could only accommodate one molecule of lipoid molecule no bigger than a typical triglyceride molecule. This hexamer model cannot explain the lipid proeotmics data in the literature.
In our study we observed predominantly 1:1 NS1 dimer to HDL (~30 μg/mL) mirroring maximum clinically reported concentration of sNS1 in the sera of DENV patients (40-50 μg/mL) as we highlighted in our main text (P. 18, lines 461-471). What is often quoted (also see later) is the recent study of Flamand & co-workers which show 1-3 NS1 dimers per HDL (Benfrid et al, 2022) by spiking rsNS1 (400 μg/mL) with HDL. This should not be confused with the previous models which suggested a lipid filled central channel holding together the hexamer. The use of physiologically relevant concentrations is important for these studies as we have highlighted in our main text (P. 18, lines 461-471).
Our interpretation for the mutant (isNS1ts) is that it is possible that the hydrophilic serine at residue 164 located in the greasy finger loop may weaken the isNS1ts binding to HDL hence the observation of free sNS1 dimers in our immunoaffinity purified (acid eluted sample). The disease severity and increased complement protein expression in AG129 mice liver can be ascribed to weakly bound mutant NS1 with fast on/off rate with HDL being transported to the liver where specific receptors bind to free sNS1 and interact with effector proteins such as complement to drive inflammation and associated pathology. Our indirect support for this is that the XL-MS analysis of purified isNS1ts identified only 7 isNS1ts:ApoA1 crosslinks while 25 isNS1wt:ApoA1 crosslinks were identified from purified isNS1wt (refer to Fig. 4 and Supp. Fig. 8).
Taken together, the cryoEM and XL-MS analysis of purified isNS1ts suggest that isNS1ts has weaker affinity for HDL compared to isNS1wt. We welcome constructive discussion on our interpretation that we and others will hopefully obtain more data to support or deny our proposed explanation. Our focus has been to compare WT with mutant sNS1 from DENV2 and we agree that it will be useful to study other serotypes.
Reviewer #2:
CryoEM:
Some of the neg-stain 2D class averages for sNS1 in Fig S1 clearly show 1 or 2 NS1 dimers on the surface of a spherical object, presumably HDL, and indicate the possibility of high-quality cryoEM results. However, the cryoEM results are disappointing. The cryo 2D class averages and refined EM map in Fig S4 are of poor quality, indicating sub-optimal grid preparation or some other sample problem. Some of the FSC curves (2 in Fig S7 and 1 in Fig S6) have extremely peculiar shapes, suggesting something amiss in the map refinement. The sharp drop in the "corrected" FSC curves in Figs S5c and S6c (upper) indicate severe problems. The stated resolutions (3.42 & 3.82 Å) for the sNS1ts-Fab56.2 are wildly incompatible with the images of the refined maps in Figs 3 & S7. At those resolutions, clear secondary structural elements should be visible throughout the map. From the 2D averages and 3D maps shown in the figures this does not seem to be the case. Local resolution maps should be shown for each structure.
The same sample is used for negative staining and the cryoEM results presented. The cryoEM 2D class averages are similar to the negative stain ones, with many spherical-like densities with no discernible features, presumably HDL only or the NS1 features are averaged out. The key difference lies in the 2D class averages where the NS1 could be seen. The side views of NS1 (wing-like protrusion) are more obvious in the negative stain while the top views of NS1 (cross shaped-like protrusion) are more obvious under cryoEM. HDL particles are inherently heterogeneous and known to range from 70-120 Å, this has been highlighted in the main text (p. 8, lines 203 and 228). This helps to explain why the reviewer may find the cryoEM result disappointing. The sample is inherently challenging to resolve structurally as it is (not that the sample is of poor quality). In terms of grid preparation, Supp Fig 4b shows a representative motion-corrected micrograph of the isNS1ts sample whereby individual particles can be discerned and evenly distributed across the grid at high density.
We acknowledge that most of the dips in the FSC curves (Fig S5-7) are irregular and affect the accuracy of the stated resolutions, particularly for the HDL-isNS1ts-Fab56.2 and isNS1ts-Fab56.2 maps for which the local resolution maps are shown (Fig S7d-e). Probable reasons affecting the FSC curves include (1) the heterogeneous nature of HDL, (2) preferred orientation issue (p 7, lines 198 -200), and (3) the data quality is intrinsically less ideal for high resolution single particle analysis. Optimizing of the dynamic masking such that the mask is not sharper than the resolution of the map for the near (default = 3 angstroms) and far (12 angstroms) parameters during data processing, ranging from 6 - 12 and 14 - 20 respectively, did not help to improve the FSC curves. To report a more accurate global resolution, we have revised the figures S5-7 with new FSC curve plots generated using the remote 3DFSC processing server.
Regardless, the overall architecture and the relative arrangement of NS1 dimer, Fab, and HDL are clearly visible and identifiable in the map. These results agree well with our biochemical data and mass-spec data.
The samples were clearly challenging for cryoEM, leading to poor quality maps that were difficult to interpret. None of the figures are convincing that NS1, Ab56.2 or Fab56.2 are correctly fit into EM maps. There is no indication of ApoA1 helices. Details of the fit of models to density for key regions of the higher-resolution EM maps should be shown and the models should be deposited in the PDB. An example of modeling difficulty is clear in the sNS1ts dimer with bound Fab56.2 (figs 3c & S7e). For this complex, the orientation of the Fab56.2 relative to the sNS1ts dimer in this submission (Fig 3c) is substantially different than in the bioRxiv preprint (Fig 3c). Regions of empty density in Fig 3c also illustrate the challenge of building a model into this map.
We acknowledge the modelling challenge posed by low resolution maps in general, such as the handedness of the Fab molecule as pointed out by the reviewer (which is why others have developed the use of anti-fab nanobody to aid in structure determination among other methods). The change in orientation of the Fab56.2 relative to the sNS1ts dimer was informed by the HDX-MS results which was not done at the point of bioRxiv preprint mentioned. With regards to indication of ApoA1 helices, this is expected given the heterogeneous nature of HDL. To the best of our knowledge, engineered apoA1 helices were also not reported in many cryoEM structures of membrane proteins solved in membrane scaffold protein (MSP) nanodiscs. This is despite nanodiscs, comprised of engineered apoA1 helices, having well-defined size classifications.
Regions of weak density in Fig 3c is expected due to the preferred orientation issue acknowledged in the results section of the main text (p. 9, line 245). The cryoEM density maps have been deposited in the Electron Microscopy Data Bank (EMDB) under accession codes EMD-36483 (isNS1ts:Fab56.2) and EMD-36480 (Fab56.2:isNS1ts:HDL). The protein model files for isNS1ts:Fab56.2 and Fab56.2:isNS1ts:HDL model are available upon request. Crosslinking MS raw files and the search results can be downloaded from https://repository.jpostdb.org/preview/14869768463bf85b347ac2 with the access code: 3827. The HDX-MS data is deposited to the ProteomeXchange consortium via PRIDE partner repository51 with the dataset identifier PXD042235.
Mass spec:
Crosslinking-mass spec was used to detect contacts between NS1 and ApoA1, providing strong validation of the sNS1-HDL association. As the crosslinks were detected in a bulk sample, they show that NS1 is near ApoA1 in many/most HDL particles, but they do not indicate a specific protein-protein complex. Thus, the data do not support the model of an NS1-ApoA1 complex in Fig 4d. Further, a specific NS1-ApoA1 interaction should have evidence in the EM maps (helical density for ApoA1), but none is shown or mentioned. If such exists, it could perhaps be visualized after focused refinement of the map for sNS1ts-HDL with Fab56.2 (Fig S7d). The finding that sNS1-ApoA1 crosslinks involved residues on the hydrophobic surface of the NS1 dimer confirms previous data that this NS1 surface engages with membranes and lipids.
We thank the reviewer for the comment. The XL-MS is a method to identify the protein-protein interactions by proximity within the spacer arm length of the crosslinker. The crosslinking MS data do support the NS1-ApoA1 complex model obtained by cryo-EM because the identified crosslinks that are superimposed on the EM map are within the cut-off distance of 30 Å. We agree that the XL-MS data do not dictate the specific interactions between specific residues of NS1-ApoA1 in the EM model. We also do not claim that specific residue of NS1 in beta roll or wing domain is interacting with specific residue of ApoA1 in H4 and H5 domain. We claim that beta roll and wing domain regions of NS1 are interacting with ApoA1 in HDL indicating the proximity nature of NS1-ApoA1 interactions as warranted by the XL-MS data.
As explained in the previous response on the lack of indication of ApoA1 helical density, this is expected given the heterogeneous nature of HDL. It is typical to see lipid membranes as unstructured and of lower density than the structured protein. In our study, local refinement was performed on either the global map (presented in Fig S7d) or focused on the NS1-Fab region only. Both yielded similar maps as illustrated in the real space slices shown in Author response image 5. The mask and map overlay is depicted in similar orientations to the real space slices, and at different contour thresholds at 0.05 (Author response image 5e) and 0.135 (Author response image 5f). While the overall map is of poor resolution and directional anisotropy evident, there is clear signal differences in the low density region (i.e. the HDL sphere) indicative of NS1 interaction with ApoA1 in HDL, extending from the NS1 wing to the base of the HDL sphere.
Author response image 5.
Real Space Slices of map and mask used during Local Refinement for overall structure (a-b) and focused mask on NS1 region (c-d). The corresponding map (grey) contoured at 0.05 (e) and 0.135 (f) in similar orientations as shown for the real space slices of map and masks. The focused mask of NS1 used is colored in semi-transparent yellow. Real Space Slices of map and mask are generated during data processing in Cryosparc 4.0 and the map figures were prepared using ChimeraX.
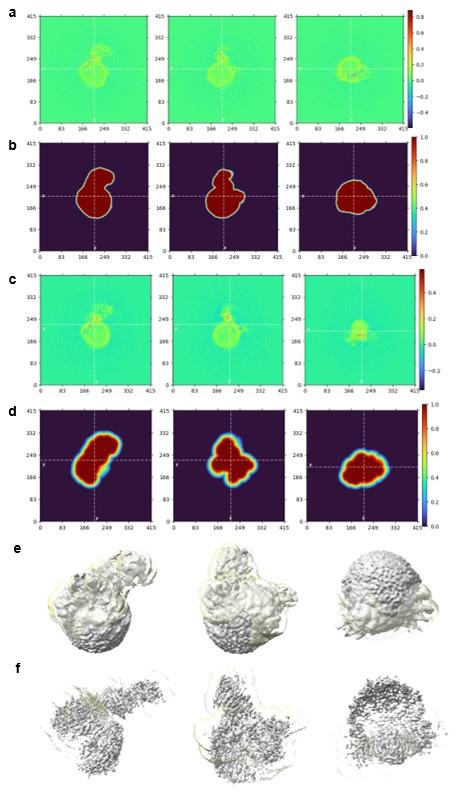
Sample quality:
The paper lacks any validation that the purified sNS1 retains established functions, for example the ability to enhance virus infectivity or to promote endothelial dysfunction.
Please see detailed response for question 2 in Reviewer #1’s comments. In essence, we have showed that both isNS1wt and isNS1ts are capable of inducing endothelial permeability in an in vitro TEER assay (Rebuttal Fig 3) and also in our previous study that quantified inflammation in human PBMC’s (Rebuttal Fig 2).
Peculiarities include the gel filtration profiles (Fig 2a), which indicate identical elution volumes (apparent MWs) for sNS1wt-HDL bound to Ab562 (~150 kDa) and to the ~3X smaller Fab56.2 (~50 kDa). There should also be some indication of sNS1wt-HDL pairs crosslinked by the full-length Ab, as can be seen in the raw cryoEM micrograph (Fig S5b).
Obtaining high quality structures is often more demanding of sample integrity than are activity assays. Given the low quality of the cryoEM maps, it's possible that the acidification step in immunoaffinity purification damaged the HDL complex. No validation of HDL integrity, for example with acid-treated HDL, is reported.
Please see detailed response for question 3 in Reviewer #1’s comments.
Acid treatment is perhaps discounted by a statement (line 464) that another group also used immunoaffinity purification in a recent study (ref 20) reporting sNS1 bound to HDL. However the statement is incorrect; the cited study used affinity purification via a strep-tag on recombinant sNS1.
We thank the Reviewer for pointing this out and have rewritten this paragraph instead (p 18, line 445-455). We also expanded our discussion to highlight our prior functional studies showing that acid-eluted isNS1 proteins do induce endothelial hyperpermeability (p 18-19, line 470-476).
Discussion:
The Discussion reflects a view that the NS1 secreted from virus-infected cells is a 1:1 sNS1dimer:HDL complex with the specific NS1-ApoA1 contacts detected by crosslinking mass spec. This is inconsistent with both the neg-stain 2D class average with 2 sNS1 dimers on an HDL (Fig S1c) and with the recent study of Flamand & co-workers showing 1-3 NS1 dimers per HDL (ref 20). It is also ignores the propensity of NS1 to associate with membranes and lipids. It is far more likely that NS1 association with HDL is driven by these hydrophobic interactions than by specific protein-protein contacts. A lengthy Discussion section (lines 461-522) includes several chemically dubious or inconsistent statements, all based on the assumption that specific ApoA1 contacts are essential to NS1 association with HDL and that sNS1 oligomers higher than the dimer necessarily involve ApoA1 interaction, conclusions that are not established by the data in this paper.
We thank the Reviewer and have revised our discussion to cover available structural and functional data to draw conclusions that invariably also need further validation by others. One point that is repeatedly brought up by Reviewer 1 & 2 is the quality and functionality of our sample. Our conclusion now reiterates this point based on our own published data (Chan et al., 2019) and also the TEER assay data provided as Author response image 3.
Reviewer #1 (Recommendations For The Authors):
Minor:
(1) Fig. S3B, should the label for lane 4 be isNS1? In figure 1C you do not see ApoA1 for rsNS1 but for S3B you do? Which is correct?
This has been corrected in the Fig. S3B, the label for lane 4 has been corrected to isNS1 and lane 1 to rsNS1, where no ApoA1 band (25 kDa) is found.
(2) Line 436, is this the correct reference? Reference 43?
This has been corrected in the main text. (p 20, Line 507; Lee et al., 2020, J Exp Med).
Reviewer #2 (Recommendations For The Authors):
The cryoEM data analysis is incompletely described. The process (software, etc) leading to each refined EM map should be stated, including the use of reference structures in any step. These details are not in the Methods or in Figs S4-7, as claimed in the Methods. The use of DeepEMhancer (which refinements?) with the lack of defined secondary structural features in the maps and without any validation (or discussion of what was used as "ground truth") is concerning. At the least, the authors should show pre- and post-DeepEMhancer maps in the supplemental figures.
The data processing steps in the Methods section have been described with improved clarity. DeepEMhancer is a deep learning solution for cryo-EM volume post-processing to reduce noise levels and obtain more detailed versions of the experimental maps (Sanchez-Garcia, et al., 2021). DeepEMhancer was only used to sharpen the maps and reduce the noise for classes 1 and 2 of isNS1wt in complex with Ab56.2 for visualization purpose only and not for any refinements. To avoid any confusion, the use of DeepEMhancer has been removed from the supp text and figures.
Line 83 - "cryoEM structures...recently reported" isn't ref 17
This reference has been corrected in to Shu et al. (2022) in p 3, line 83.
Fig. S3 - mis-labeled gel lanes
This has been corrected in the Fig. S3B, the label for lane 4 has been corrected to isNS1 and lane 1 to rsNS1.
Fig S6c caption - "Representative 2D classes of each 3D classes, white bar 100 Å. Refined 3D map for classes 1 and 2 coloured by local resolution". The first sentence is unclear, and there is no white scale bar and no heat map.
Fig S6c caption has been corrected to “Representative 3D classes contoured at 0.06 and its particle distribution as labelled and coloured in cyan. Scale bar of 100 Å as shown. Refined 3D maps and their respective FSC resolution charts and posterior precision directional distribution as generated in crysosparc4.0”.
Author response:
The following is the authors’ response to the original reviews.
Public Reviews:
Reviewer #1 (Public Review):
Summary:
Wang et al. generate XAP5 and XAP5L knockout mice and find that they are male infertile due to meiotic arrest and reduced sperm motility, respectively. RNA-Seq was subsequently performed and the authors concluded that XAP5 and XAP5L are antagonistic transcription factors of cilliogenesis (in XAP5-KO P16 testis: 554 genes were unregulated and 1587 genes were downregulated; in XAP5L-KO sperm: 2093 genes were unregulated and 267 genes were downregulated).
We are grateful for the comprehensive summary.
Strengths:
Knockout mouse models provided strong evidence to indicate that XAP5 and XAP5L are critical for spermatogenesis and male fertility.
Thank you for your positive comment.
Weaknesses:
The key conclusions are not supported by evidence. First, the authors claim that XAP5 and XAP5L transcriptionally regulate sperm flagella development; however, detailed molecular experiments related to transcription regulation are lacking. How do XAP5 and XAP5L regulate their targets? Only RNA-Seq is not enough. Second, the authors declare that XAP5 and XAP5L are antagonistic transcription factors; however, how do XAP5 and XAP5L regulate sperm flagella development antagonistically? Only RNA-Seq is not enough. Third, I am concerned about whether XAP5 really regulates sperm flagella development. XAP5 is specifically expressed in spermatogonia and XAP5-cKO mice are in meiotic arrest, indicating that XAP5 regulates meiosis rather than sperm flagella development.
Thank you for the critical comments. To strengthen our conclusions, we have included XAP5/XAP5L CUT&Tag data in our revised manuscript. This highly sensitive method has allowed us to identify direct target genes of XAP5 and XAP5L (Table S1, Figure S6). Notably, our results demonstrate that both FOXJ1 and RFX2 are occupied by XAP5 (Figure 4G). Additionally, real-time PCR validation confirmed that RFX2 is also associated with XAP5L, even though enriched peaks for the RFX2 gene were not detected in the initial CUT&Tag data (Figure 4G). These findings indicate that XAP5 and XAP5L regulate the expression of FOXJ1 and RFX2 by directly binding to these genes. De novo motif analyses revealed that XAP5 and XAP5L shared a conserved binding sequence (CCCCGCCC/GGGCGGGG) (Figure S6C), and the bound regions of FOXJ1 and RFX2 contain this sequence. Further analysis shows that many XAP5L target genes are also targets of XAP5 (Figure S6G), despite the limited number of identified XAP5L target genes. This differential binding and regulation of shared target genes underscore the antagonistic relationship between XAP5 and XAP5L. Collectively, these findings provide additional support for the idea that XAP5 and XAP5L function as antagonistic transcription factors, acting upstream of transcription factor families, including FOXJ1 and RFX factors, to coordinate ciliogenesis during spermatogenesis.
While we agree that XAP5 primarily regulates meiosis during spermatogenesis, our data also indicate that many cilia-related genes, including key transcription regulators of spermiogenesis such as RFX2 and SOX30, are downregulated in XAP5-cKO mice and are bound by XAP5 (Figure 4, Figures S4 and S6). It is important to note that genes coding for flagella components are expressed sequentially and in a germ cell-specific manner during development. When we refer to "regulating sperm flagella development", we mean the spatiotemporal regulation. We have revised the manuscript to clarify this point.
Reviewer #2 (Public Review):
In this study, Wang et al., report the significance of XAP5L and XAP5 in spermatogenesis, involved in transcriptional regulation of the ciliary gene in testes. In previous studies, the authors demonstrate that XAP5 is a transcription factor required for flagellar assembly in Chlamydomonas. Continuing from their previous study, the authors examine the conserved role of the XAP5 and XAP5L, which are the orthologue pair in mammals.
XAP5 and XAP5L express ubiquitously and testis specifically, respectively, and their absence in the testes causes male infertility with defective spermatogenesis. Interestingly, XAP5 deficiency arrests germ cell development at the pachytene stage, whereas XAP5L absence causes impaired flagellar formation. RNA-seq analyses demonstrated that XAP5 deficiency suppresses ciliary gene expression including Foxj1 and Rfx family genes in early testis. By contrast, XAP5L deficiency abnormally remains Foxj1 and Rfx genes in mature sperm. From the results, the authors conclude that XAP5 and XAP5L are the antagonistic transcription factors that function upstream of Foxj1 and Rfx family genes.
This reviewer thinks the overall experiments are performed well and that the manuscript is clear. However, the current results do not directly support the authors' conclusion. For example, the transcriptional function of XAP5 and XAP5L requires more evidence. In addition, this reviewer wonders about the conserved XAP5 function of ciliary/flagellar gene transcription in mammals - the gene is ubiquitously expressed despite its functional importance in flagellar assembly in Chlamydomonas. Thus, this reviewer thinks authors are required to show more direct evidence to clearly support their conclusion with more descriptions of its role in ciliary/flagellar assembly.
Thank you for your thoughtful review of our work. We appreciate your positive feedback on the overall quality of the experiments and the clarity of the manuscript. In response to your concerns, we have included new experimental data and made revisions to the manuscript (lines 193-217) to better support our conclusions, particularly regarding the transcriptional function of XAP5 and XAP5L. Additionally, we have expanded on the role of XAP5 in ciliary and flagellar assembly to provide more direct evidence for its functional importance. Thank you for your insights.
Recommendations for the authors:
Reviewer #1 (Recommendations For The Authors):
The title (Control of ciliary transcriptional programs during spermatogenesis by antagonistic transcription factors) is not specific and does tend to exaggerate.
Thank you for the comment, and we appreciate the opportunity to clarify the appropriateness of the title. Our paper extensively investigates the transcriptional regulation of ciliary genes during spermatogenesis. It demonstrates that XAP5/XAP5L are key transcription factors involved in this process. The title reflects our primary focus on the transcriptional programs that govern ciliary gene expression. Moreover, our paper shows that XAP5 positively regulates the expression of ciliary genes, particularly during the early stages of spermatogenesis, while XAP5L negatively regulates these genes. This antagonistic relationship is a crucial aspect of the study and is effectively conveyed in the title. In addition, our revised paper provides detailed insights into how XAP5/XAP5L control ciliary gene expression during spermatogenesis.
Figure 4C: FOXJ1 and RFX2 are absent in sperm from WT mice. Are you sure? They are highly expressed in WT testes.
Thank you for your careful review. While FOXJ1 and RFX2 are indeed highly expressed in the testes of wild-type (WT) mice, our data show that they are not detectable in mature sperm. This observation is consistent with published single-cell RNA-seq data(Jung et al., 2019), which indicate that FOXJ1 and RFX2 are primarily expressed in spermatocytes but not in spermatids (Figure S7). This expression pattern aligns with that that of IFT-particle proteins, which are essential for the formation but not the maintenance of mammalian sperm flagella(San Agustin, Pazour, & Witman, 2015).
XAP5 is specifically expressed in spermatogonia and XAP5-cKO mice are in meiotic arrest, indicating that XAP5 regulates meiosis rather than sperm flagella development.
We appreciate your insightful comments. As mentioned above, we agree that XAP5 primarily regulates meiosis during spermatogenesis. When we mentioned "regulating sperm flagella development," we were referring to the spatiotemporal regulation of these processes. We have revised the manuscript to clarify this distinction. Thank you for your understanding.
The title of Figure 2 (XAP5L is required for normal sperm formation) is not accurate because the progress of spermatogenesis and sperm count is normal in XAP5L-KO mice (only sperm motility is reduced).
We apologize for any confusion caused by the previous figure. It did not accurately convey the changes in sperm count. In the revised Figure 2B, we clearly demonstrate that the sperm count in XAP5L-KO mice is indeed lower than that in WT mice. This revision aims to provide a more accurate representation of the effects of XAP5L deficiency on spermatogenesis. Thank you for bringing this to our attention.
Reviewer #2 (Recommendations For The Authors):
(1) Although XAP5 and XAP5L deficiency alters the transcription of Foxj1 and Rfx family genes, which are the essential transcription factors for the ciliogenesis, current data do not directly support that XAP5 and XAP5L are the upstream transcription factors. The authors need to show more direct evidence such as CHIP-Seq data.
Thank you for your valuable feedback! In this revised manuscript, we have included data identifying candidate direct targets of XAP5 and XAP5L using the highly sensitive CUT&Tag method (Kaya-Okur et al., 2019). Our results show that XAP5 occupies both FOXJ1 and RFX2 (Figure 4G). Furthermore, real-time PCR validation of the CUT&Tag experiments confirmed that RFX2 is also occupied by XAP5L (Figure 4G), despite the initial CUT&Tag data not revealing enriched peaks for the RFX2 gene (Table S1). Unfortunately, the limited number of enriched peaks identified for XAP5L (Table S1) suggests that the XAP5L antibody used in the CUT&Tag experiment might have suboptimal performance, which prevented us from detecting occupancy on the FOXJ1 promoter. Nevertheless, these additional data provide strong evidence that XAP5 and XAP5L function as upstream transcription factors for FOXJ1 and RFX family genes, supporting their essential roles in ciliogenesis.
(2) Shared transcripts that are altered by the absence of either XAP5 or XAP5L do not clearly support they are antagonistic transcription factors.
Thank you for your insightful comment. In our revised manuscript, we performed CUT&Tag analysis to identify target genes of XAP5 and XAP5L. Motif enrichment analysis revealed conserved binding sequences for both factors (Figures S6C), indicating a subset of shared downstream genes between XAP5 and XAP5L. Among the downregulated genes in XAP5 cKO germ cells, 891 genes were bound by XAP5 (Figure S6D). Although the number of enriched peaks identified for XAP5L was limited, 75 of the upregulated genes in XAP5L KO sperm were bound by XAP5L (Figure S6E). Importantly, of these 75 XAP5L target genes, approximately 30% (22 genes) were also identified as targets of XAP5 (Figure S6G), further support the idea that XAP5 and XAP5L function as antagonistic transcription factors.
(3) XAP5 seems to be an ancient transcription factor for cilia and flagellar assembly. However, XAP5 expresses ubiquitously in mice. How can this discrepancy be explained? Is it also required for primary cilia assembly? Are their expression also directly linked to ciliogenesis in other types of cells?
Thank you for the thoughtful questions. The ubiquitous expression of XAP5 in mice can be understood in light of its role as an ancient transcription factor for cilia and flagellar assembly. Given that cilia are present on nearly every cell type in the mammalian body (O'Connor et al., 2013), this broad expression pattern makes sense. In fact, XAP5 serves not only as a master regulator of ciliogenesis but also as a critical regulator of various developmental processes (Kim et al., 2018; Lee et al., 2020; Xie et al., 2023).
Our current unpublished work demonstrates that XAP5 is essential for primary cilia assembly in different cell lines. The loss of XAP5 protein results in abnormal ciliogenesis, further supporting its vital role in ciliary formation across different cell types.
We believe that the widespread expression of XAP5 reflects its fundamental importance in multiple cellular processes, including ciliogenesis, development, and potentially other cellular functions yet to be discovered.
(4) XAP5L causes impairs flagellar assembly. Have the authors observed any other physiological defects in the absence of XAP5L in mouse models? Such as hydrocephalus and/or tracheal defects?
Thank you for the questions. We have carefully examined XAP5L KO mice for other physiological defects. To date, we have not observed any additional physiological abnormalities. Specifically, we assessed the condition of tracheal cilia in XAP5L KO mice and found no significant differences compared to wild-type (WT) mice, as illustrated in Author response image 1 below.
Author response image 1.
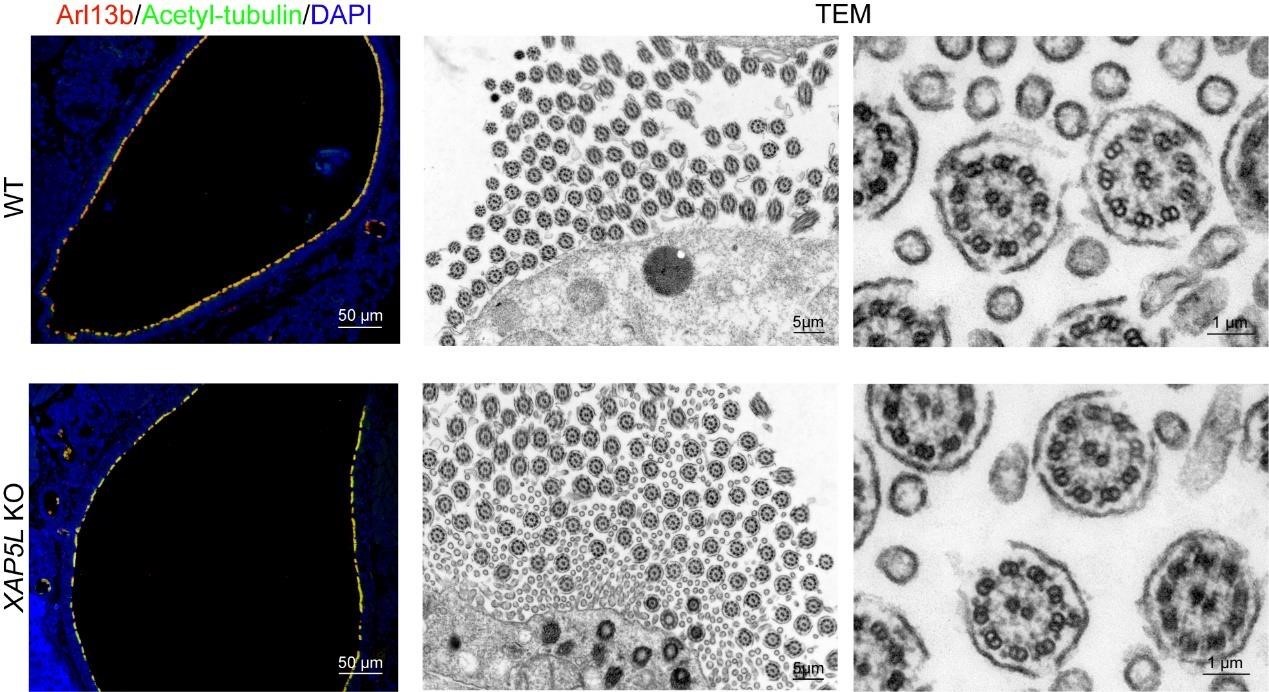
References
Jung, M., Wells, D., Rusch, J., Ahmad, S., Marchini, J., Myers, S. R., & Conrad, D. F. (2019). Unified single-cell analysis of testis gene regulation and pathology in five mouse strains. Elife, 8. doi:10.7554/eLife.43966
Kaya-Okur, H. S., Wu, S. J., Codomo, C. A., Pledger, E. S., Bryson, T. D., Henikoff, J. G., . . . Henikoff, S. (2019). CUT&Tag for efficient epigenomic profiling of small samples and single cells. Nat Commun, 10(1), 1930. doi:10.1038/s41467-019-09982-5
Kim, Y., Hur, S. W., Jeong, B. C., Oh, S. H., Hwang, Y. C., Kim, S. H., & Koh, J. T. (2018). The Fam50a positively regulates ameloblast differentiation via interacting with Runx2. J Cell Physiol, 233(2), 1512-1522. doi:10.1002/jcp.26038
Lee, Y.-R., Khan, K., Armfield-Uhas, K., Srikanth, S., Thompson, N. A., Pardo, M., . . . Schwartz, C. E. (2020). Mutations in FAM50A suggest that Armfield XLID syndrome is a spliceosomopathy. Nature Communications, 11(1). doi:10.1038/s41467-020-17452-6
O'Connor, A. K., Malarkey, E. B., Berbari, N. F., Croyle, M. J., Haycraft, C. J., Bell, P. D., . . . Yoder, B. K. (2013). An inducible CiliaGFP mouse model for in vivo visualization and analysis of cilia in live tissue. Cilia, 2(1), 8. doi:10.1186/2046-2530-2-8
San Agustin, J. T., Pazour, G. J., & Witman, G. B. (2015). Intraflagellar transport is essential for mammalian spermiogenesis but is absent in mature sperm. Mol Biol Cell, 26(24), 4358-4372. doi:10.1091/mbc.E15-08-0578
Xie, X., Li, L., Tao, S., Chen, M., Fei, L., Yang, Q., . . . Chen, L. (2023). Proto-Oncogene FAM50A Can Regulate the Immune Microenvironment and Development of Hepatocellular Carcinoma In Vitro and In Vivo. Int J Mol Sci, 24(4). doi:10.3390/ijms24043217
Author response:
The following is the authors’ response to the original reviews.
Public Reviews:
Reviewer #1 (Public Review):
Summary:
In this manuscript, the authors provide strong evidence that the cell surface E3 ubiquitin ligases RNF43 and ZNRF3, which are well known for their role in regulating cell surface levels of WNT receptors encoded by FZD genes, also target EGFR for degradation. This is a newly identified function for these ubiquitin ligases beyond their role in regulating WNT signaling. Loss of RNF43/ZNRF3 expression leads to elevated EGFR levels and signaling, suggesting a potential new axis to drive tumorigenesis, whereas overexpression of RNF43 or ZNRF3 decreases EGFR levels and signaling. Furthermore, RNF43 and ZNRF3 directly interact with EGFR through their extracellular domains.
Strengths:
The data showing that RNF43 and ZNRF3 interact with EGFR and regulate its levels and activity are thorough and convincing, and the conclusions are largely supported.
Weaknesses:
While the data support that EGFR is a target for RNF43/ZNRF3, some of the authors' interpretations of the data on EGFR's role relative to WNT's roles downstream of RNF43/ZNRF3 are overstated. The authors, perhaps not intentionally, promote the effect of RNF43/ZNRF3 on EGFR while minimizing their role in WNT signaling. This is the case in most of the biological assays (cell and organoid growth and mouse tumor models). For example, the conclusion of "no substantial activation of Wnt signaling" (page 14) in the prostate cancer model is currently not supported by the data and requires further examination. In fact, examination of the data presented here indicates effects on WNT/b-catenin signaling, consistent with previous studies.
Cancers in which RNF43 or ZNRF3 are deleted are often considered to be "WNT addicted", and inhibition of WNT signaling generally potently inhibits tumor growth. In particular, treatment of WNT-addicted tumors with Porcupine inhibitors leads to tumor regression. The authors should test to what extent PORCN inhibition affects tumor (and APC-min intestinal organoid) growth. If the biological effects of RNF43/ZNRF3 loss are mediated primarily or predominantly through EGFR, then PORCN inhibition should not affect tumor or organoid growth.
We thank the reviewer’s appreciation of the key strength of our study. We fully agree with the reviewer that RNF43/ZNRF3 play key roles in restraining WNT signaling and their deletions activate WNT signaling that leads to cancer promotion, as discussed and cited in our manuscript (Hao et al, 2012; Koo et al, 2012). We have revised the language in this manuscript to avoid any confusion or appearance of downplaying this known signaling pathway in cancer progression.
What we would like to highlight in this work is that our study uncovered an effect of RNF43/ZNRF3 on EGFR, leading to biological impact in multiple model systems. In particular, we included the APC-mutated human cancer cell line HT29 and Apc min mouse intestinal tumor organoids. In the context of APC mutations, β-catenin stabilization and the activation of WNT target genes are essentially decoupled from upstream WNT ligand binding to WNT receptors, thus we could primarily focus on the effect of RNF43/ZNRF3 on EGFR. Our statement of “no substantial activation of WNT signaling” as cited by the reviewer was made in describing the data in Fig. 7E where we did not observe β-catenin accumulation in the nucleus and reasoned no substantial activation of canonical WNT signaling. We agree that further examination would help strengthen the conclusion and appreciate the reviewer’s suggestion of PORCN inhibition experiments. While PORCN inhibition is a valuable experiment in models with abundance of WNT ligands/receptors and non-mutationally activated regulators of WNT signaling (Yu et al, 2020), in biological scenarios with existing APC mutations, another group has previously demonstrated that PORCN inhibition had no observable effect on WNT signaling in APC-deficient cells (PMID: 29533772). In our initial submission, we confirmed this predicted low response to manipulation of WNT signaling components upstream of a mutated APC. We showed that addition of RSPO1 in Apc min mouse intestinal tumor organoids failed to further activate WNT target expression (Fig. 6G). Furthermore, in this revised manuscript, we added new data on EGFR inhibition and PORCN inhibition in WT and Znrf3 KO MEFs (Fig. 6L). PORCN inhibition had no impact on cell growth in neither WT nor Znrf3 KO MEFs, suggesting that Znrf3 KO promoting MEF growth is WNT independent. In contrast, inhibition of EGFR downstream signaling components (Fig. 6L) significantly blocked MEF growth and abolished the impact of Znrf3 KO in MEF growth. This new evidence further supports our main conclusion that RNF43/ZNRF3 controls EGFR signaling to regulate cell growth.
Reviewer #2 (Public Review):
Using proteogenomic analysis of human cancer datasets, Yu et al, found that EGFR protein levels negatively correlate with ZNFR3/RNF43 expression across multiple cancers. Interestingly, they found that CRC harbouring the frequent RNF43 G659Vfs*41 mutation exhibits higher levels of EGFR when compared to RNF43 wild-type tumors. This is highly interesting since this mutation is generally not thought to influence Frizzled levels and Wnt-bcatenin pathway activity. Using CRISPR knockouts and overexpression experiments, the authors show that EGFR levels are modulated by ZNRF3/RNF43. Supporting these findings, modulation of ZNRF3/RNF43 activity using Rspondin also leads to increased EGFR levels. Mechanistically, the authors, show that ZNRF3/RNF43 ubiquitinate EGFR and leads to degradation. Finally, the authors present functional evidence that loss of ZNRF3/RNF43 unleashes EGFR-mediated cell growth in 2D culture and organoids and promotes tumor growth in vivo.
Overall, the conclusions of the manuscript are well supported by the data presented, but some aspects of the mechanism presented need to be reinforced to fully support the claims made by the authors. Additionally, the title of the paper suggests that ZNRF3 and RNF43 loss leads to the hyperactivity of EGFR and that its signalling activity contributes to cancer initiation/progression. I don't think the authors convincingly showed this in their study.
We thank the reviewer commenting that our “conclusions of the manuscript are well supported by the data presented.” We address the concerns raised by this reviewer in an itemized way as detailed below:
Major points:
(1) EGFR ubiquitination. All of the experiments supporting that ZNFR3/RNF43 mediates EGFR ubiquitination are performed under overexpression conditions. A major caveat is also that none of the ubiquitination experiments are performed under denaturing conditions. Therefore, it is impossible to claim that the ubiquitin immunoreactivity observed on the western blots presented in Figure 4 corresponds to ubiquitinated-EGFR species. Another issue is that in Figure 4A, the experiments suggest that the RNF43-dependent ubiquitination of EGFR is promoted by EGF. However, there is no control showing the ubiquitination of EGFR in the absence of EGF but under RNF43 overexpression. According to the other experiments presented in Figures 4B, 4C, and 4F, there seems to be a constitutive ubiquitination of EGFR upon overexpression. How do the authors reconcile the role of ZNRF3/RNF43 vs c-cbl?
We agree with this reviewer of the limitation of overexpression experiments. In this manuscript, we actually leveraged both overexpression and knockout systems to demonstrate that ZNRF3/RNF43 regulates EGFR ubiquitination: in Fig 4A, we showed that overexpression of RNF43 increased EGFR ubiquitination; in Fig 4B&C and Fig S3A, we showed that RNF43 knockout decreased EGFR ubiquitination; in Fig 4F, we showed that overexpression of ZNRF3 WT increased EGFR ubiquitination but overexpression of ZNRF3 RING domain deletion mutant failed to increase EGFR ubiquitination.
We also appreciate the rigor with which the reviewer has approached our methodology. We acknowledge that denaturing conditions can provide additional validation, but the technical challenges associated with denaturing conditions include the potential disruption of epitope structures recognized by these antibodies. Our methodology was chosen to balance the need for accurate detection with the preservation of protein structure and function, which are crucial for understanding the biological implications of EGFR ubiquitination. Moreover, our immunoprecipitation and subsequent Western blotting were stringent with high SDS and 2-ME, optimized to minimize non-specific binding and enhance the specificity of detection. We believe that the data presented are robust and contribute significantly to the existing body of knowledge on EGFR ubiquitination.
CBL is a well-known E3 ligase of EGFR, and it induces EGFR ubiquitination upon EGF ligand stimulation. Therefore, in order to have a fair comparison of RNF43 and CBL on EGFR ubiquitination, we designed Fig 4A and related experiments in the setting of EGF stimulation. We observed that RNF43 overexpression increased EGFR ubiquitination as potently as CBL did. Following this result, we further demonstrated that knockout of RNF43 decreased endogenous ubiquitinated EGFR level in the unstimulated/basal condition (Fig 4B) as well as in the EGF-stimulated condition (Fig 4C). We acknowledge the importance and interest in fully understanding how ZNRF3/RNF43 interplays with the functions of CBL in regulating EGFR ubiquitination. This line of investigation indeed holds the potential to uncover novel regulatory mechanisms in detail. However, the primary focus of the current study was to establish a foundational understanding of ZNRF3/RNF43 role in regulating EGFR ubiquitination. We look forward to exploring further in future work.
(2) EGFR degradation vs internalization. In Figure 3C, the authors show experiments that demonstrate that RNF43 KO increases steady-state levels of EGFR and prevents its EGF-dependent proteolysis. Using flow cytometry they then present evidence that the reduction in cell surface levels of EGFR mediated by EGF is inhibited in the absence of RNF43. The authors conclude that this is due to inhibition of EGF-induced internalization of surface EGF. However, the experiments are not designed to study internalization and rather merely examine steady-state levels of surface EGFR pre and post-treatment. These changes are an integration of many things (retrograde and anterograde transport mechanisms presumable modulated by EGF). What process(es) is/are specifically affected by ZNFR3/RNF43? Are these processes differently regulated by c-cbl? If the authors are specifically interested in internalization/recycling, the use of cell surface biotinylation experiments and time courses are needed to examine the effect of EGF in the presence or absence of the E3 ligases.
We agree that our study design primarily assesses EGFR levels on the cell surface before and after EGF treatment and does not comprehensively measure the whole internalization process. In response to the reviewer’s comments, we have revised the relevant sections of manuscript to clarify that our current findings are focused on changes in cell surface EGFR and do not extend to the detailed mechanisms of EGF-induced internalization or recycling.
(3) RNF43 G659fs*41. The authors make a point in Figure 1D that this mutant leads to elevated EGFR in cancers but do not present evidence that this mutant is ineffective in mediated ubiquitination and degradation of EGFR. As this mutant maintains its ability to promote Frizzled ubiquitination and degradation, it would be important to show side by side that it does not affect EGFR. This would perhaps imply differential mechanisms for these two substrates.
Fig 1D is based on bioinformatic analysis of colon cancer patient samples, showing that RNF43 G659Vfs*41 mutant tumors exhibited significantly higher levels of EGFR protein compared to RNF43 WT tumors. Following this lead, we investigated whether this RNF43 G659fs*41 hotspot mutation lost its role in downregulating EGFR. To this end, we transfected the same amount of control vector, RNF43 WT, RING deletion mutant, G659fs*41 mutant DNA into 293T cells and measured the level of EGFR (co-transfected). As shown in Author response image 1, overexpression of RNF43 WT decreased EGFR level while overexpression of RING deletion mutant had no impact on EGFR level as compared with the Vector group, which is consistent with our findings in the manuscript. Cells transfected with the RNF43 G659Vfs*41 mutant exhibited nearly normal levels of EGFR; however, we also observed that RNF43 G659Vfs*41 was less expressed than WT, even though the same amounts of DNA were transfected. Therefore, the insubstantial impact on EGFR levels could be attributed to both functional loss or compromised stability of RNF43 G659Vfs*41 mRNA or protein. Further investigation on RNF43 G659Vfs*41 mRNA and protein stability vs. RNF43 G659Vfs*41 protein function is needed to draw a solid conclusion.
Author response image 1.
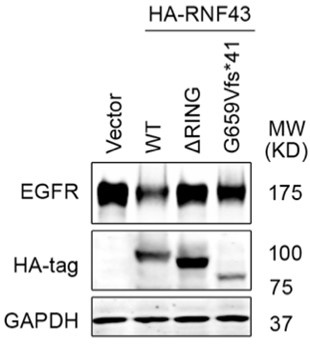
(4) "Unleashing EGFR activity". The title of the paper implies that ZNRF3/RNF43 loss leads to increased EGFR expression and hence increased activity that underlies cancer. However, I could find only one direct evidence showing that increased proliferation of the HT29 cell line mutant for RNF43 could be inhibited by the EGFR inhibitor Erlotinib. All the other evidence presented that I could find is correlative or indirect (e.g. RPPA showing increased phosphorylation of pathway members upon RNF43 KO, increased proliferation of a cell line upon ZNRF3/ RNF43 KO, decreased proliferation of a cell line upon ZNRF3/RNF43 OE in vitro or in xeno...). Importantly, the authors claim that cancer initiation/ progression in ZNRF3/RNF43 mutants may in some contexts be independent of their regulation of Wnt-bcatenin signaling and relying on EGFR activity upregulation. However, this has not been tested directly. Could the authors leverage their znrf3/RNF43 prostate cancer model to test whether EGFR inhibition could lead to reduced cancer burden whereas a Frizzled or Wnt inhibitor does not?
More broadly, if EGFR signaling were to be unleashed in cancer, then one prediction would be that these cells would be more sensitive to EGFR pathway inhibition. Could the authors provide evidence that this is the case? Perhaps using isogenic cell lines or a panel of patient-derived organoids (with known genotypes).
We appreciate the reviewer’s suggestion to provide more direct evidence demonstrating the importance of the ZNRF3/RNF43-EGFR axis in cancer cell proliferation. In this revised manuscript, we further studied this issue in the WT vs. Znrf3 KO MEF cells. We observed that treatment with the EGFR inhibitor erlotinib did not affect WT MEF but stunted the growth advantage of Znrf3 KO MEF cells (Fig. 6L). On the other hand, treatment with the porcupine inhibitor C59 did not impact either WT or Znrf3 KO MEF cells (Fig. 6L), suggesting a more important role of the ZNRF3/RNF43-EGFR axis in mediating the enhanced cell growth of MEF caused by Znrf3 knockout. Furthermore, considering EGFR is often mutated in human cancer, to increase the clinical relance of our study, we also tested the effect of RNF43 knockout on EGFR L858R (Fig. 2D), a common oncogenic EGFR mutant, and found that RNF43 knockout in HT29 boosted levels of this EGFR mutant detected by its FLAG tag, suggesting that RNF43 degrades both WT and mutated EGFR and its loss can enhance signaling of both WT EGFR and its oncogenic mutant . However, we emphasize again that this manuscript is in no way written to diminish the proven importance of ZNRF3/RNF43-WNT-β-catenin axis in cancer and development.
Recommendations for the authors:
Reviewer #1 (Recommendations For The Authors):
The main conclusion that EGFR is targeted for degradation by RNF43 and ZNRF3 is well supported and documented. Figures 1-5 and associated supplemental figures contain largely convincing data. Figures 6 and 7, however, require some modifications, as follows in order of appearance:
Figure 6C: Growth of intestinal tumor organoids from Apcmin mice does not require Rspo, however, the authors show that these organoids grow larger in the presence of Rspo, an effect they attribute to increased EGFR activity, rather than increased WNT activity. While this conclusion may be correct, the authors should address this possibility by treating the organoids with PORCN inhibitor. The prediction would be that Rspo treatment still increases organoid size in the presence of PORCN inhibition. A further prediction would be that blocking EGFR (e.g. with Cetuximab) will abrogate the RSPO1 effect.
Yes, we attributed the impact of Rspo on Apc min organoid growth to enhanced EGFR activity because we observed increased EGFR levels (Fig 6F) but no detectable increase in eight WNT target genes assayed. We agree that further pharmacologic experiments would further boost our conclusion, but our few attempts at treating organoids encountered technical difficulties. Hence, we switched to testing PORCN inhibition vs EGFR inhibition in WT and Znfr33 KO MEFs. As shown in the revised Fig. 6L, EGFR inhibition significantly reversed the growth advantage caused by Znrf3 KO but C59 did not.
Figure 6G: It is unclear why the authors provide "8-day RSPO1 treatment" data. Here, EGFR mRNA appears to be elevated 2-fold (perhaps not statistically significant), and the Wnt targets Lef1 and Axin2 are decreased, as indicated by the statistical significance. What point is being made here?
Our observation of increased size of APC min mouse intestinal tumor organoids and increased the EGFR protein levels were at 8 days of RSPO1 treatment. Therefore, we measured mRNA levels at the same time point with the 2-day time point also included for comparison. The goal of this qPCR experiment was to detect the contribution of WNT signaling, and we did not detect an increased transcriptional readout. We included EGFR mRNA levels for comparison, and we did not detect a statistically significant increase, consistent with our experiments concluding that ZNRF3/RNF43 regulate EGFR at the protein level. As stated in the preceding response, these data led us to attribute the impact of Rspo on Apc min organoid growth to enhanced EGFR activity.
Figure 7A: This requires quantitation. How many mice were used per cell line? The data shown is not particularly convincing, with ZNRF3 overexpressing HT29 cells growing detectably. Showing representative mice is fine, but this should be supplemented with quantitation of all mice.
We had provided this data. The BLI signal quantification was shown below the representative BLI images. Seven mice were used per cell line, as annotated at the top of the graph.
Figure 7B: The authors assert that "canonical WNT signaling, based on levels of active-β-Catenin (non-phosphorylated at Ser33/37/Thr41; Figure 7B), remained unaffected". As shown, 2 of the 3 Myc-Znrf3 tumors have increased active-b-catenin signal over the GFP tumors. This indicates to me that canonical Wnt signaling was affected. The authors either need to present quantitative data that supports this claim or modify their conclusions. As presented, I don't think it is appropriate to decouple the effect of Znrf3 overexpression on EGFR from its effect on WNT.
As requested, we have quantified the level of non-phospho β-Catenin at Ser33/37/Thr41 and found no significant differences (p > 0.05) between the control group vs. ZNRF3 overexpression group. We once again note that our manuscript was not meant to dispute the proven signaling and biological significance of WNT signaling regulation by ZNRF3/RNF43, and we have proof-read the manuscript multiple times to ensure that we did not make any generalized or misleading statements in this aspect.
Author response image 2.
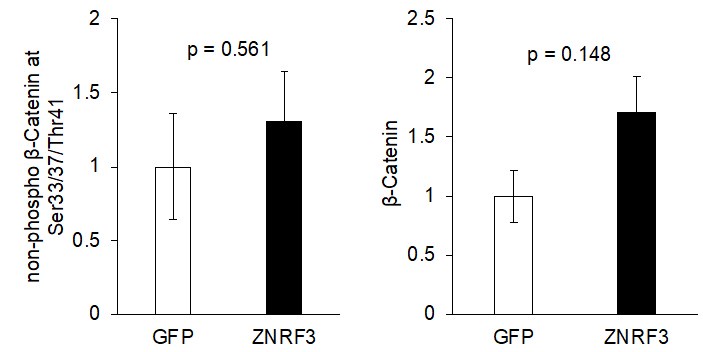
Figure 7E: Here the authors assert that "no substantial activation of canonical Wnt signaling" in the Z&R KO tumors, however, the figure shows a substantial increase in active b-catenin staining. The current resolution is insufficient to claim that there is no increase in nuclear b-catenin. The authors' claim that WNT signaling is not involved here is not supported by the data presented here. One way to demonstrate that this effect is through EGFR activation and not through WNT activation is to treat mice with PORCN inhibitor. WNT-addicted tumors, such as by Rnf43 or Znrf3 deletion, regress upon PORCN inhibition. In this case, if the effect of Z&R KO is mediated through EGFR rather than WNT, then there should be no effect on tumor growth upon PORCN inhibition. This is a critical experiment in order to make this point.
We appreciate the reviewer’s comments and suggestion of experiments. We based our initial statement on insubstantial nuclear β-catenin staining, but we agree that immunohistochemical staining lacks the resolution suitable for quantification. We could not generate the adequate number of KO animals for these in vivo experiments in the window of time planned for this revision. Rather, as shown in the newly added Fig. 6L, we tested EGFR inhibition and PORCN inhibition in Znrf3 KO MEFs and obtained strong data further supporting EGFR in mediating Znrf3 KO promotion of MEF growth. Notwithstanding, we have carefully revised our description of the in vivo data in Fig 7E to avoid any confusion or over-interpretation.
Minor points:
Figure 2A: provide quantitation of this immunoblot.
We have revised manuscript with quantification result shown next to the immunoblot.
Figure 2B: provide more detail in the figure legend and in the Materials and Methods section on how the KO MEFs were generated. Confirmation that Znrf3 (or in cases of Rnf43 KO) expression is lost in KO would be advisable.
We have confirmed Znrf3 KO by genotyping and RNF43 KO by immunofluorescent staining. We have also tested multiple commercial anti-ZNRF3 antibodies and anti-RNF43 antibodies for Western blotting, but they all failed.
Figure 4C is a little misleading. The schematic indicates that ECD-TM and TM-ICD truncations were analyzed for both ZNRF3 and RNF43. However, Figure 4 only shows data for ZNRF3, and the corresponding Figure S4 lacks data for the TM-ICD of Rnf43. A recommendation is to show only those schematics for which data is presented in that figure. On a related topic, the results using the deltaRING constructs (Figure S5) are not mentioned/described in the text.
We think that the reviewer meant Fig 5C. We have revised the Fig 5C by removing the RNF43 label, and we confirm that Results section does include the data in Fig S5.
Figure S4A: Only ZNRF3 is indicated in this figure. Please explain why RNF43 is not represented here. Also, indicate what is plotted along the x-axis.
We only detected the endogenous ZNRF3-EGFR interaction, possibly because the RNF43 protein level is relatively low in the cell line we used for the mass spec experiment. X-axis is the proteins ordered based on Y-axis values as detailed in the figure legend -- each data point was arranged along the x axis based on the fold change of iBAQ of EGFR-associated proteins identified in EGF-stimulated vs. control in the log2 scale, from low to high (from left to right on x axis). We have added the phrase “Proteins detected by Mass-Spec” for X-axis.
Reviewer #2 (Recommendations For The Authors):
Minor Points.
(1) In Figure 2B, the authors claim that Znrf3 KO enhanced both EGFR and p-EGFR levels both in the absence and presence of EGF. Although it is clear in the presence of EGF, the increased in p-EGFR in the absence of EGF is less than clear.
We have revised the manuscript to more clearly state the result in Fig 2B.
(2) Importantly the authors validated their findings using three independent RNF43 gRNA (fig S2D) but they do not show the editing efficiency obtained with the gRNA.
We did not include RNF43 IB in this Figure due to lack of specific antibodies for detecting RNR43 in IB. We have no reasons to doubt adequate efficiency of knockout since EGFR was increased compared to the control group. As a result, we did not perform deep sequencing to validate knockout efficacy.
(3) In S2E, the authors show that KO of either ZNRF3 or RNF43 enhance HER2 levels. This suggests that there is no redundancy between these E3 ligases, at least in this context. How do the authors reconcile that?
The reviewer raised an interesting issue. Due to the lack of WB antibodies for these two proteins, we would not easily assess the feedback impact of knockout of either gene on the protein levels of the other gene. We speculate that there may be a threshold level of the sum of the two proteins that is needed for adequate degradation of HER2, leading to HER2 increase when either gene is knocked out. Detailed studies of this issue is beyond the scope of this current work.
(4) Experiments performed in Fig 3C are performed in only one clone. The authors need to repeat in an additional clone or rescue this phenotype using a RNF43 cDNA.
Our RNF43 KO HT29 line is a pool of KO cells, not a single clone.
(5) In Figure 7E, the authors suggest that the absence of nuclear bcatenin means that canonical Wnt signaling is unaffected. It is widely known that nuclear bcatenin is often not correlating with pathway activity.
As stated above, we have revised the manuscript to avoid confusion and misinterpretation.
(6) What is the nature of the error bars in Fig 3c? Are the differences statistically significant?
As mentioned in the figure legend, the error bars are SEM. The result is statistically significant, and p-value is noted in the graph.
(7) In the Figure legends, it should be stated clearly how many biological replicates were performed for each experiment and single data points should be plotted where applicable (e.g. qPCR data). It would be helpful if the uncropped and unprocessed Western blot membranes and replicates that are not shown would be accessible to allow the reader a more comprehensive view of the acquired data, especially for blots that were quantified (e.g. Figure 2F, Figure 3C, there is clearly some defect on the blot).
For WB representation, it would be helpful to include more size markers on the Western blots (especially on the Ips that show ubiquitin smear) and in general to use a reference protein (GAPDH, Actin, Vinculin) that is closer to the protein being accessed.
More details should be added in the Methods section to explain how protocols were performed in detail. For example, it should be explained how the viruses used for infecting cells were produced (which plasmids were transfected using which transfection reagent, how long was the virus collected for, etc). Then, it should be stated how long the cells were undergoing selection before being harvested. Because the expression of the viral constructs potentially has an effect on cell proliferation through EGFR, this information is quite relevant. This is just an example, there are details missing in nearly every section (Flow: washing protocols, gating protocols (Live/dead stain?), WB: RIPA lysis buffer composition? How much protein was loaded on blots? How was protein quantification done? IP: how were washes performed and how often repeated?)
Missing: antibody dilutions for IF, IHC, and WB, plasmid backbones, sequences and availability, qPCR primer sequences from Origene.
Incucyte experiments are not described.
We have revised the relevant sections to include more details.
(8) Line 141: revise text: 2x mRNA abundance in the same sentence.
Line 162: define intermediate expression better.
Line 197/198: revise text ('the predominant one'?).
Line 218/219: revise text (Internalisation of surface EGFR?).
Line 245: clarify in text that it is endogenous EGFR that is being pulled down.
Line 264: typo: conserved instead of conservative.
Line 324: revise text (What does 'unknown significance' mean).
Line 396/397: revise text: 2x Co-IP in the same sentence.
Figure 3 D/E: more details on the Method in the figure legend.
We have revised them accordingly.
Author Response
The following is the authors’ response to the original reviews.
Public Reviews:
Reviewer #1 (Public Review):
Koumoundourou et al., identify a pathway downstream of Bcl11b that controls synapse morphology and plasticity of hippocampal mossy fiber synapses. Using an elegant combination of in vivo, ex vivo, and in vitro approaches, the authors build on their previous work that indicated C1ql2 as a functional target of Bcl11b (De Bruyckere et al., 2018). Here, they examine the functional implications of C1ql2 at MF synapses in Bcl11b cKO mice and following C1ql2 shRNA. The authors find that Bcl11b KO and shRNA against C1ql2 significantly reduces the recruitment of synaptic vesicles and impairs LTP at MF synapses. Importantly, the authors test a role for the previously identified C1ql2 binding partner, exon 25b-containing Nrxn3 (Matsuda et al., 2016), as relevant at MF synapses to maintain synaptic vesicle recruitment. To test this, the authors developed a K262E C1ql2 mutant that disrupts binding to Nrxn3. Curiously, while Bcl11b KO and C1ql2 KD largely phenocopy (reduced vesicle recruitment and impaired LTP), only vesicle recruitment is dependent on C1ql2-Nrxn3 interactions. These findings provide new insight into the functional role of C1ql2 at MF synapses. While the authors convincingly demonstrate a role for C1ql2-Nrxn3(25b+) interaction for vesicle recruitment and a Nrxn3(25b+)independent role for C1ql2 in LTP, the underlying mechanisms remain inconclusive. Additionally, a discussion of how these findings relate to previous work on C1ql2 at mossy fiber synapses and how the findings contribute to the biology of Nrxn3 would increase the interpretability of this work.
As suggested by reviewer #1, we extended our discussion of previous work on C1ql2 and additionally discussed the biology of Nrxn3 and how our work relates to it. Moreover, we extended our mechanistic analysis of how Bcl11b/C1ql2/Nrxn3 pathway controls synaptic vesicle recruitment as well as LTP (please see also response to reviewer #2 points 5 and 8 and reviewer #3 point 4 of public reviews below for detailed discussion).
Reviewer #2 (Public Review):
This manuscript describes experiments that further investigate the actions of the transcription factor Bcl11b in regulating mossy fiber (MF) synapses in the hippocampus. Prior work from the same group had demonstrated that loss of Bcl11b results in loss of MF synapses as well as a decrease in LTP. Here the authors focus on a target of Bcl11b a secreted synaptic organizer C1ql2 which is almost completely lost in Bcl11b KO. Viral reintroduction of C1ql2 rescues the synaptic phenotypes, whereas direct KD of C1ql2 recapitulates the Bcl1 phenotype. C1ql2 itself interacts directly with Nrxn3 and replacement with a binding deficient mutant C1q was not able to rescue the Bcl11b KO phenotype. Overall there are some interesting observations in the study, however there are also some concerns about the measures and interpretation of data.
The authors state that they used a differential transcriptomic analysis to screen for candidate targets of Bcl11b, yet they do not present any details of this screen. This should be included and at the very least a table of all DE genes included. It is likely that many other genes are also regulated by Bcl11b so it would be important to the reader to see the rationale for focusing attention on C1ql2 in this study.
The transcriptome analysis mentioned in our manuscript was published in detail in our previous study (De Bruyckere et al., 2018), including chromatin-immunoprecipitation that revealed C1ql2 as a direct transcriptional target of Bcl11b. Upon revision of the manuscript, we made sure that this was clearly stated within the main text module to avoid future confusion. In the same publication (De Bruyckere et al., 2018), we discuss in detail several identified candidate genes such as Sema5b, Ptgs2, Pdyn and Penk as putative effectors of Bcl11b in the structural and functional integrity of MFS. C1ql2 has been previously demonstrated to be almost exclusively expressed in DG neurons and localized to the MFS.
There it bridges the pre- and post-synaptic sides through interaction with Nrxn3 and KAR subunits, respectively, and regulates synaptic function (Matsuda et al., 2016). Taken together, C1ql2 was a very good candidate to study as a potential effector downstream of Bcl11b in the maintenance of MFS structure and function. However, as our data reveal, not all Bcl11b mutant phenotypes were rescued by C1ql2 (see supplementary figures 2d-f of revised manuscript). We expect additional candidate genes, identified in our transcriptomic screen, to act downstream of Bcl11b in the control of MFS.
All viral-mediated expression uses AAVs which are known to ablate neurogenesis in the DG (Johnston DOI: 10.7554/eLife.59291) through the ITR regions and leads to hyperexcitability of the dentate. While it is not clear how this would impact the measurements the authors make in MF-CA3 synapses, this should be acknowledged as a potential caveat in this study.
We agree with reviewer #2 and are aware that it has been demonstrated that AAV-mediated gene expression ablates neurogenesis in the DG. To avoid potential interference of the AAVs with the interpretability of our phenotypes, we made sure during the design of the study that all of our control groups were treated in the same way as our groups of interest, and were, thus, injected with control AAVs. Moreover, the observed phenotypes were first described in Bcl11b mutants that were not injected with AVVs (De Bruyckere et al., 2018). Finally, we thoroughly examined the individual components of the proposed mechanism (rescue of C1ql2 expression, over-expression of C1ql3 and introduction of mutant C1ql2 in Bcl11b cKOs, KD of C1ql2 in WT mice, and Nrxn123 cKO) and reached similar conclusions. Together, this strongly supports that the observed phenotypes occur as a result of the physiological function of the proteins involved in the described mechanism and not due to interference of the AAVs with these biological processes. We have now addressed this point in the main text module of the revised ms.
The authors claim that the viral re-introduction "restored C1ql2 protein expression to control levels. This is misleading given that the mean of the data is 2.5x the control (Figure 1d and also see Figure 6c). The low n and large variance are a problem for these data. Moreover, they are marked ns but the authors should report p values for these. At the least, this likely large overexpression and variability should be acknowledged. In addition, the use of clipped bands on Western blots should be avoided. Please show the complete protein gel in primary figures of supplemental information.
We agree with reviewer #2 that C1ql2 expression after its re-introduction in Bcl11b cKO mice was higher compared to controls and that this should be taken into consideration for proper interpretation of the data. To address this, based also on the suggestion of reviewer #3 point 1 below, we overexpressed C1ql2 in DG neurons of control animals. We found no changes in synaptic vesicle organization upon C1ql2 over-expression compared to controls. This further supports that the observed effect upon rescue of C1ql2 expression in Bcl11b cKOs is due to the physiological function of C1ql2 and not as result of the overexpression. These data are included in supplementary figure 2g-j and are described in detail in the results part of the revised manuscript.
Additionally, we looked at the effects of C1ql2 overexpression in Bcl11b cKO DGN on basal synaptic transmission. We plotted fEPSP slopes versus fiber volley amplitudes, measured in slices from rescue animals, as we had previously done for the control and Bcl11b cKO (Author response image 1a). Although regression analysis revealed a trend towards steeper slopes in the rescue mice (Author response image 1a and b), the observation did not prove to be statistically significant, indicating that C1ql2 overexpression in Bcl11b cKO animals does not strongly alter basal synaptic transmission at MFS. Overall, our previous and new findings support that the observed effects of the C1ql2 rescue are not caused by the artificially elevated levels of C1ql2, as compared to controls, but are rather a result of the physiological function of C1ql2.
Following the suggestion of reviewer #2 all western blot clipped bands were exchanged for images of the full blot. This includes figures 1c, 4c, 6b and supplementary figure 2g of the revised manuscript. P-value for Figure 1d has now been included.
Author response image 1.
C1ql2 reintroduction in Bcl11b cKO DGN does not significantly alter basal synaptic transmission at mossy fiber-CA3 synapses. a Input-output curves generated by plotting fEPSP slope against fiber volley amplitude at increasing stimulation intensities. b Quantification of regression line slopes for input-output curves for all three conditions. Control+EGFP, 35 slices from 16 mice; Bcl11b cKO+EGFP, 32 slices from 14 mice; Bcl11b cKO+EGFP-2A-C1ql2, 22 slices from 11 mice. The data are presented as means, error bars represent SEM. Kruskal-Wallis test (non-parametric ANOVA) followed by Dunn’s post hoc pairwise comparisons. p=0.106; ns, not significant.
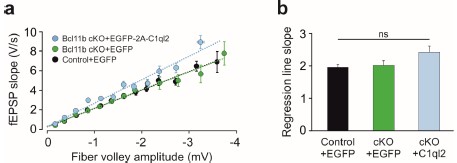
Measurement of EM micrographs: As prior work suggested that MF synapse structure is disrupted the authors should report active zone length as this may itself affect "synapse score" defined by the number of vesicles docked. More concerning is that the example KO micrographs seem to have lost all the densely clustered synaptic vesicles that are away from the AZ in normal MF synapses e.g. compare control and KO terminals in Fig 2a or 6f or 7f. These terminals look aberrant and suggest that the important measure is not what is docked but what is present in the terminal cytoplasm that normally makes up the reserve pool. This needs to be addressed with further analysis and modifications to the manuscript.
As requested by reviewer #2 we analyzed and reported in the revised manuscript the active zone length. We found that the active zone length remained unchanged in all conditions (control/Bcl11b cKO/C1ql2 rescue, WT/C1ql2 KD, control/K262E and control/Nrxn123 cKO), strengthening our results that the described Bcl11b/C1ql2/Nrxn3 mechanism is involved in the recruitment of synaptic vesicles. These data have been included in supplementary figures 2c, 4h, 5f and 6g and are described in the results part of the revised manuscript.
We want to clarify that the synapse score is not defined by the number of docked vesicles to the plasma membrane. The synapse score, which is described in great detail in our materials and methods part and has been previously published (De Bruyckere et al., 2018), rates MFS based on the number of synaptic vesicles and their distance from the active zone and was designed according to previously described properties of the vesicle pools at the MFS. The EM micrographs refer to the general misdistribution of SV in the proximity of MFS. Upon revision of the manuscript, we made sure that this was clearly stated in the main text module to avoid further confusion.
The study also presents correlated changes in MF LTP in Bcl11b KO which are rescued by C1ql2 expression. It is not clear whether the structural and functional deficits are causally linked and this should be made clearer in the manuscript. It is also not apparent why this functional measure was chosen as it is unlikely that C1ql2 plays a direct role in presynaptic plasticity mechanisms that are through a cAMP/ PKA pathway and likely disrupted LTP is due to dysfunctional synapses rather than a specific LTP effect.
The inclusion of functional experiments in this and our previous study (de Bruyckere et al., 2018) was first and foremost intended to determine whether the structural alterations observed at MFB disrupt MFS signaling. From the signaling properties we tested, basal synaptic transmission (this study) and short-term potentiation (de Bruyckere et al., 2018) were unaltered by Bcl11b KO, whereas MF LTP was found to be abolished (de Bruyckere et al., 2018). Indeed, because MF LTP largely depends on presynaptic mechanisms, including the redistribution of the readily releasable pool and recruitment of new active zones (Orlando et al., 2021; Vandael et al., 2020), it appears to be particularly sensitive to the specific structural changes we observed. We therefore believe that it is valuable information that MF LTP is affected in Bcl11b cKO animals - it conveys a direct proof for the functional importance of the observed morphological alterations, while basic transmission remains largely normal. Furthermore, it subsequently provided a functional marker for testing whether the reintroduction of C1ql2 in Bcl11b cKO animals or the KD of C1ql2 in WT animals can functionally recapitulate the control or the Bcl11b KO phenotype, respectively.
We fully agree with the reviewer that C1ql2 is unlikely to directly participate in the cAMP/PKA pathway and that the ablation of C1ql2 likely disrupts MF LTP through an alternative mode of action. Our original wording in the paragraph describing the results of the forskolin-induced LTP experiment might have overstressed the importance of the cAMP pathway. We have now rephrased that paragraph to better describe the main idea behind the forskolin experiment, namely to circumvent the initial Ca2+ influx in order to test whether deficient presynaptic Ca2+ channel/KAR signaling might be responsible for the loss of LTP in Bcl11b cKO. The results are strongly indicative of a downstream mechanism and further investigation is needed to determine the specific mechanisms by which C1ql2 regulates MFLTP, especially in light of the result that C1ql2.K262E rescued LTP, while it was unable to rescue the SV recruitment at the MF presynapse. This raises the possibility that C1ql2 can influence MF-LTP through additional, yet uncharacterized mechanisms, independent of SV recruitment. As such, a causal link between the structural and functional deficits remains tentative and we have now emphasized that point by adding a respective sentence to the discussion of our revised manuscript. Nevertheless, we again want to stress that the main rationale behind the LTP experiments was to assess the functional significance of structural changes at MFS and not to elucidate the mechanisms by which MF LTP is established.
The authors should consider measures that might support the role of Bcl11b targets in SV recruitment during the depletion of synapses or measurements of the readily releasable pool size that would complement their findings in structural studies.
We fully agree that functional measurements of the readily releasable pool (RRP) size would be a valuable addition to the reported redistribution of SV in structural studies. We have, in fact, attempted to use high-frequency stimulus trains in both field and single-cell recordings (details on single-cell experiments are described in the response to point 8) to evaluate potential differences in RRP size between the control and Bcl11b KO (Figure for reviewers 2a and b). Under both recording conditions we see a trend towards lower values of the intersection between a regression line of late responses and the y-axis. This could be taken as an indication of slightly smaller RRP size in Bcl11b mutant animals compared to controls. However, due to several technical reasons we are extremely cautious about drawing such far-reaching conclusions based on these data. At most, they suffice to conclude that the availability of release-ready vesicles in the KO is likely not dramatically smaller than in the control.
The primary issue with using high-frequency stimulus trains for RRP measurements at MFS is the particularly low initial release probability (Pr) at these synapses. This means that a large number of stimulations is required to deplete the RRP. As the RRP is constantly replenished, it remains unclear when steady state responses are reached (reviewed by Kaeser and Regehr, 2017). This is clearly visible in our single-cell recordings (Author response image 2b), which were additionally complicated by prominent asynchronous release at later stages of the stimulus train and by a large variability in the shapes of cumulative amplitude curves between cells. In contrast, while the cumulative amplitude curves for field potential recordings do reach a steady state (Author response image 2a), field potential recordings in this context are not a reliable substitute for single cell or, in the case of MFB, singlebouton recordings. Postsynaptic cells in field potential recordings are not clamped, meaning that the massive release of glutamate due to continuous stimulation depolarizes the postsynaptic cells and reduces the driving force for Na+, irrespective of depletion of the RRP. This is supported by the fact that we consistently observed a recovery of fEPSP amplitudes later in the trains where RRP had presumably been maximally depleted. In summary, high-frequency stimulus trains at the field potential level are not a valid and established technique for estimating RRP size at MFS.
Specialized laboratories have used highly advanced techniques, such as paired recordings between individual MFB and postsynaptic CA3 pyramidal cells, to estimate the RRP size of MFB (Vandael et al., 2020). These approaches are outside the scope of our present study which, while elucidating functional changes following Bcl11b depletion and C1ql2 rescue, does not aim to provide a high-end biophysical analysis of the presynaptic mechanisms involved.
Author response image 2.
Estimation of RRP size using high-frequency stimulus trains at mossy fiber-CA3 synapses. a Results from field potential recordings. Cumulative fEPSP amplitude in response to a train of 40 stimuli at 100 Hz. All subsequent peak amplitudes were normalized to the amplitude of the first peak. Data points corresponding to putative steady state responses were fit with linear regression (RRP size is indirectly reflected by the intersection of the regression line with the yaxis). Control+EGFP, 6 slices from 5 mice; Bcl11b cKO+EGFP, 6 slices from 3 mice. b Results from single-cell recordings. Cumulative EPSC amplitude in response to a train of 15 stimuli at 50 Hz. The last four stimuli were fit with linear regression. Control, 5 cells from 4 mice; Bcl11b cKO, 3 cells from 3 mice. Note the shallow onset of response amplitudes and the subsequent frequency potentiation. Due to the resulting increase in slope at higher stimulus numbers, intersection with the y-axis occurs at negative values. The differences shown were not found to be statistically significant; unpaired t-test or Mann-Whitney U-test.
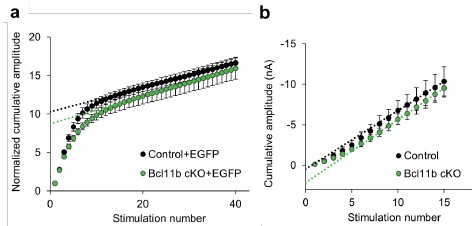
Bcl11b KO reduces the number of synapses, yet the I-O curve reported in Supp Fig 2 is not changed. How is that possible? This should be explained.
We agree with reviewer #2– this apparent discrepancy has indeed struck us as a counterintuitive result. It might be that synapses that are preferentially eliminated in Bcl11b cKO are predominantly silent or have weak coupling strength, such that their loss has only a minimal effect on basal synaptic transmission. Although perplexing, the result is fully supported by our single-cell data which shows no significant differences in MF EPSC amplitudes recorded from CA3 pyramidal cells between controls and Bcl11b mutants (Author response image 3; please see the response below for details and also our response to Reviewer #1 question 2).
Matsuda et al DOI: 10.1016/j.neuron.2016.04.001 previously reported that C1ql2 organizes MF synapses by aligning postsynaptic kainate receptors with presynaptic elements. As this may have consequences for the functional properties of MF synapses including their plasticity, the authors should report whether they see deficient postsynaptic glutamate receptor signaling in the Bcl11b KO and rescue in the C1ql2 re-expression.
We agree that the study by Matsuda et al. is of key importance for our present work. Although MF LTP is governed by presynaptic mechanisms and we previously did not see differences in short-term plasticity between the control and Bcl11b cKO (De Bruyckere et al., 2018), the clustering of postsynaptic kainate receptors by C1ql2 is indeed an important detail that could potentially alter synaptic signaling at MFS in Bcl11b KO. We, therefore, re-analyzed previously recorded single-cell data by performing a kinetic analysis on MF EPSCs recorded from CA3 pyramidal cells in control and Bcl11b cKO mice (Figure for reviewers 3a) to evaluate postsynaptic AMPA and kainate receptor responses in both conditions. We took advantage of the fact that AMPA receptors deactivate roughly 10 times faster than kainate receptors, allowing the contributions of the two receptors to mossy fiber EPSCs to be separated (Castillo et al., 1997 and reviewed by Lerma, 2003). We fit the decay phase of the second (larger) EPSC evoked by paired-pulse stimulation with a double exponential function, yielding a fast and a slow component, which roughly correspond to the fractional currents evoked by AMPA and kainate receptors, respectively. Analysis of both fast and slow time constants and the corresponding fractional amplitudes revealed no significant differences between controls and Bcl11b mutants (Figure for reviewers 3e-h), indicating that both AMPA and kainate receptor signaling is unaffected by the ablation of C1ql2 following Bcl11b KO.
Importantly, MF EPSC amplitudes evoked by the first and the second pulse (Author response image 3b), paired-pulse facilitation (Author response image 3c) and failure rates (Author response image 3d) were all comparable between controls and Bcl11b mutants. These results further corroborate our observations from field recordings that basal synaptic transmission at MFS is unaltered by Bcl11b KO.
We note that the results from single cell recordings regarding basal synaptic transmission merely confirm the observations from field potential recordings, and that the attempted measurement of RRP size at the single cell level was not successful. Thus, our single-cell data do not add new information about the mechanisms underlying the effects of Bcl11b-deficiency and we therefore decided not to report these data in the manuscript.
Author response image 3.
Basal synaptic transmission at mossy fiber-CA3 synapses is unaltered in Bcl11b cKO mice. a Representative average trace (20 sweeps) recorded from CA3 pyramidal cells in control and Bcl11b cKO mice at minimal stimulation conditions, showing EPSCs in response to paired-pulse stimulation (PPS) at an interstimulus interval of 40 ms. The signal is almost entirely blocked by the application of 2 μM DCG-IV (red). b Quantification of MF EPSC amplitudes in response to PPS for both the first and the second pulse. c Ratio between the amplitude of the second over the first EPSC. d Percentage of stimulation events resulting in no detectable EPSCs for the first pulse. Events <5 pA were considered as noise. e Fast decay time constant obtained by fitting the average second EPSC with the following double exponential function: I(t)=Afaste−t/τfast+Aslowe−t/τslow+C, where I is the recorded current amplitude after time t, Afast and Aslow represent fractional current amplitudes decaying with the fast (τfast) and slow (τslow) time constant, respectively, and C is the offset. Starting from the peak of the EPSC, the first 200 ms of the decaying trace were used for fitting. f Fractional current amplitude decaying with the fast time constant. g-h Slow decay time constant and fractional current amplitude decaying with the slow time constant. For all figures: Control, 8 cells from 4 mice; Bcl11b cKO, 8 cells from 6 mice. All data are presented as means, error bars indicate SEM. None of the differences shown were found to be statistically significant; Mann-Whitney U-test for nonnormally and unpaired t-test for normally distributed data.
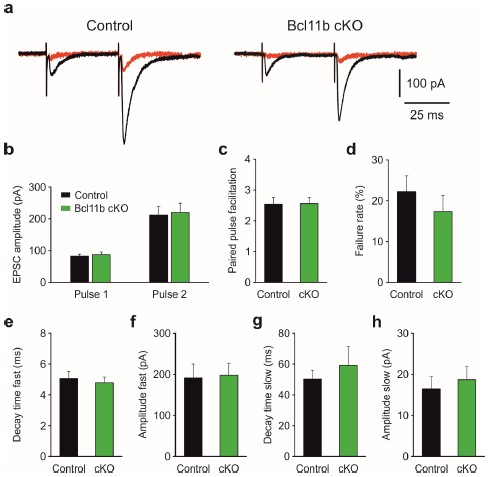
Reviewer #3 (Public Review):
Overall, this is a strong manuscript that uses multiple current techniques to provide specific mechanistic insight into prior discoveries of the contributions of the Bcl11b transcription factor to mossy fiber synapses of dentate gyrus granule cells. The authors employ an adult deletion of Bcl11b via Tamoxifen-inducible Cre and use immunohistochemical, electron microscopy, and electrophysiological studies of synaptic plasticity, together with viral rescue of C1ql2, a direct transcriptional target of Bcl11b or Nrxn3, to construct a molecular cascade downstream of Bcl11b for DG mossy fiber synapse development. They find that C1ql2 re-expression in Bcl11b cKOs can rescue the synaptic vesicle docking phenotype and the impairments in MF-LTP of these mutants. They also show that C1ql2 knockdown in DG neurons can phenocopy the vesicle docking and plasticity phenotypes of the Bcl11b cKO. They also use artificial synapse formation assays to suggest that C1ql2 functions together with a specific Nrxn3 splice isoform in mediating MF axon development, extending these data with a C1ql2-K262E mutant that purports to specifically disrupt interactions with Nrxn3. All of the molecules involved in this cascade are disease-associated and this study provides an excellent blueprint for uncovering downstream mediators of transcription factor disruption. Together this makes this work of great interest to the field. Strengths are the sophisticated use of viral replacement and multi-level phenotypic analysis while weaknesses include the linkage of C1ql2 with a specific Nrxn3 splice variant in mediating these effects.
Here is an appraisal of the main claims and conclusions:
1) C1ql2 is a downstream target of Bcl11b which mediates the synaptic vesicle recruitment and synaptic plasticity phenotypes seen in these cKOs. This is supported by the clear rescue phenotypes of synapse anatomy (Fig.2) and MF synaptic plasticity (Fig.3). One weakness here is the absence of a control assessing over-expression phenotypes of C1ql2. It's clear from Fig.1D that viral rescue is often greater than WT expression (totally expected). In the case where you are trying to suppress a LoF phenotype, it is important to make sure that enhanced expression of C1ql2 in a WT background does not cause your rescue phenotype. A strong overexpression phenotype in WT would weaken the claim that C1ql2 is the main mediator of the Bcl11b phenotype for MF synapse phenotypes.
As suggested by reviewer #3, we carried out C1ql2 over-expression experiments in control animals. We show that the over-expression of C1ql2 in the DG of control animals had no effect on the synaptic vesicle organization in the proximity of MFS. This further supports that the observed effect upon rescue of C1ql2 expression in Bcl11b cKOs is due to the physiological function of C1ql2 and not a result of the artificial overexpression. These data are now included in supplementary figure 2g-j and are described in detail in the results part of the revised manuscript. Please also see response to point 3 of reviewer #2.
2) Knockdown of C1ql2 via 4 shRNAs is sufficient to produce the synaptic vesicle recruitment and MFLTP phenotypes. This is supported by clear effects in the shRNA-C1ql2 groups as compared to nonsense-EGFP controls. One concern (particularly given the use of 4 distinct shRNAs) is the potential for off-target effects, which is best controlled for by a rescue experiment with RNA insensitive C1ql2 cDNA as opposed to nonsense sequences, which may not elicit the same off-target effects.
We agree with reviewer #3 that the usage of shRNAs could potentially create unexpected off-target effects and that the introduction of a shRNA-insensitive C1ql2 in parallel to the expression on the shRNA cassette would be a very effective control experiment. However, the suggested experiment would require an additional 6 months (2 months for AAV production, 2-3 months from animal injection to sacrifice and 1-2 months for EM imaging/analysis and LTP measurements) and a high number of additional animals (minimum 8 for EM and 8 for LTP measurements). We note here, that before the production of the shRNA-C1ql2 and the shRNA-NS, the individual sequences were systematically checked for off-target bindings on the murine exome with up to two mismatches and presented with no other target except the proposed (C1ql2 for shRNA-C1ql2 and no target for shRNA-NS). Taking into consideration our in-silico analysis, we feel that the interpretation of our findings is valid without this (very reasonable) additional control experiment.
3) C1ql2 interacts with Nrxn3(25b+) to facilitate MF terminal SV clustering. This claim is theoretically supported by the HEK cell artificial synapse formation assay (Fig.5), the inability of the K262-C1ql2 mutation to rescue the Bcl11b phenotype (Fig.6), and the altered localization of C1ql2 in the Nrxn1-3 deletion mice (Fig.7). Each of these lines of experimental evidence has caveats that should be acknowledged and addressed. Given the hypothesis that C1ql2 and Nrxn3b(25b) are expressed in DG neurons and work together, the heterologous co-culture experiment seems strange. Up till now, the authors are looking at pre-synaptic function of C1ql2 since they are re-expressing it in DGNs. The phenotypes they are seeing are also pre-synaptic and/or consistent with pre-synaptic dysfunction. In Fig.5, they are testing whether C1ql2 can induce pre-synaptic differentiation in trans, i.e. theoretically being released from the 293 cells "post-synaptically". But the post-synaptic ligands (Nlgn1 and and GluKs) are not present in the 293 cells, so a heterologous synapse assay doesn't really make sense here. The effect that the authors are seeing likely reflects the fact that C1ql2 and Nrxn3 do bind to each other, so C1ql2 is acting as an artificial post-synaptic ligand, in that it can cluster Nrxn3 which in turn clusters synaptic vesicles. But this does not test the model that the authors propose (i.e. C1ql2 and Nrxn3 are both expressed in MF terminals). Perhaps a heterologous assay where GluK2 is put into HEK cells and the C1ql2 and Nrxn3 are simultaneously or individually manipulated in DG neurons?
C1ql2 is expressed by DG neurons and is then secreted in the MFS synaptic cleft, while Nrxn3, that is also expressed by DG neurons, is anchored at the presynaptic side. In our work we used the well established co-culture system assay and cultured HEK293 cells secreting C1ql2 (an IgK secretion sequence was inserted at the N-terminus of C1ql2) together with hippocampal neurons expressing Nrxn3(25b+). We used the HEK293 cells as a delivery system of secreted C1ql2 to the neurons to create regions of high concentration of C1ql2. By interfering with the C1ql2-Nrxn3 interaction in this system either by expression of the non-binding mutant C1ql2 variant in the HEK cells or by manipulating Nrxn expression in the neurons, we could show that C1ql2 binding to Nrxn3(25b+) is necessary for the accumulation of vGlut1. However, we did not examine and do not claim within our manuscript that the interaction between C1ql2 and Nrxn3(25b+) induces presynaptic differentiation. Our experiment only aimed to analyze the ability of C1ql2 to cluster SV through interaction with Nrxn3. Moreover, by not expressing potential postsynaptic interaction partners of C1ql2 in our system, we could show that C1ql2 controls SV recruitment through a purely presynaptic mechanism. Co-culturing GluK2-expressing HEK cells with simultaneous manipulation of C1ql2 and/or Nrxn3 in neurons would not allow us to appropriately answer our scientific question, but rather focus on the potential synaptogenic function of the Nrxn3/C1ql2/GluK2 complex and the role of the postsynaptic ligand in it. Thus, we feel that the proposed experiment, while very interesting in characterization of additional putative functions of C1ql2, may not provide additional information for the point we were addressing. In the revised manuscript we tried to make the aim and methodological approach of this set of experiments more clear.
4) K262-C1ql2 mutation blocks the normal rescue through a Nrxn3(25b) mechanism (Fig.6). The strength of this experiment rests upon the specificity of this mutation for disrupting Nrxn3b binding (presynaptic) as opposed to any of the known postsynaptic C1ql2 ligands such as GluK2. While this is not relevant for interpreting the heterologous assay (Fig.5), it is relevant for the in vivo phenotypes in Fig.6. Similar approaches as employed in this paper can test whether binding to other known postsynaptic targets is altered by this point mutation.
It has been previously shown that C1ql2 together with C1ql3 recruit postsynaptic GluK2 at the MFS. However, loss of just C1ql2 did not affect the recruitment of GluK2, which was disrupted only upon loss of both C1ql2 and C1ql3 (Matsuda et al., 2018). In our study we demonstrate a purely presynaptic function of C1ql2 through Nrxn3 in the synaptic vesicle recruitment. This function is independent of C1ql3, as C1ql3 expression is unchanged in all of our models and its over-expression did not compensate for C1ql2 functions (Fig. 2, 3a-c). Our in vitro experiments also reveal that C1ql2 can recruit both Nrxn3 and vGlut1 in the absence of any known postsynaptic C1ql2 partner (KARs and BAI3; Fig.5; please also see response above). Furthermore, we have now performed a kinetic analysis on single-cell data which we had previously collected to evaluate postsynaptic AMPA and kainate receptor responses in both the control and Bcl11b KO. Our analysis reveals no significant differences in postsynaptic current kinetics, making it unlikely that AMPA and kainate receptor signaling is altered upon the loss of C1ql2 following Bcl11b cKO (Author response image 3e-h; please also see our response to reviewer #2 point 8). Thus, we have no experimental evidence supporting the idea that a loss of interaction between C1ql2.K262E and GluK2 would interfere with the examined phenotype. However, to exclude that the K262E mutation disrupts interaction between C1ql2 and GluK2, we performed co-immunoprecipitation from protein lysate of HEK293 cells expressing GluK2myc-flag and GFP-C1ql2 or GluK2-myc-flag and GFP-K262E and could show that both C1ql2 and K262E had GluK2 bound when precipitated. These data are included in supplementary figure 5k of the revised manuscript.
5) Altered localization of C1ql2 in Nrxn1-3 cKOs. These data are presented to suggest that Nrx3(25b) is important for localizing C1ql2 to the SL of CA3. Weaknesses of this data include both the lack of Nrxn specificity in the triple a/b KOs as well as the profound effects of Nrxn LoF on the total levels of C1ql2 protein. Some measure that isn't biased by this large difference in C1ql2 levels should be attempted (something like in Fig.1F).
We acknowledge that the lack of specificity in the Nrxn123 model makes it difficult to interpret our data. We have now examined the mRNA levels of Nrxn1 and Nrxn2 upon stereotaxic injection of Cre in the DG of Nrxn123flox/flox animals and found that Nrxn1 was only mildly reduced. At the same time Nrxn2 showed a tendency for reduction that was not significant (data included in supplementary figure 6a of revised manuscript). Only Nrxn3 expression was strongly suppressed. Of course, this does not exclude that the mild reduction of Nrxn1 and Nrxn2 interferes with the C1ql2 localization at the MFS. We further examined the mRNA levels of C1ql2 in control and Nrxn123 mutants to ensure that the observed changes in C1ql2 protein levels at the MFS are not due to reduced mRNA expression and found no changes (data are included in supplementary figure 6b of the revised manuscript), suggesting that overall protein C1ql2 expression is normal.
The reduced C1ql2 fluorescence intensity at the MFS was first observed when non-binding C1ql2 variant K262E was introduced to Bcl11b cKO mice that lack endogenous C1ql2 (Fig.6). In these experiments, we found that despite the overall high protein levels of C1ql2.K262E in the hippocampus (Fig. 6c), its fluorescence intensity at the SL was significantly reduced compared to WT C1ql2 (Fig. 6d-e). The remaining signal of the C1ql2.K262E at the SL was equally distributed and in a punctate form, similar to WT C1ql2. Together, this suggests that loss of C1ql2-Nrxn3 interaction interferes with the localization of C1ql2 at the MFS, but not with the expression of C1ql2. Of course, this does not exclude that other mechanisms are involved in the synaptic localization of C1ql2, beyond the interaction with Nrxn3, as both the mutant C1ql2 in Bcl11b cKO and the endogenous C1ql2 in Nrxn123 cKOs show residual immunofluorescence at the SL. Further studies are required to determine how C1ql2-Nrxn3 interaction regulates C1ql2 localization at the MFS.
Reviewer #1 (Recommendations For The Authors):
In addition to addressing the comments below, this study would benefit significantly from providing insight and discussion into the relevant potential postsynaptic signaling components controlled exclusively by C1ql2 (postsynaptic kainate receptors and the BAI family of proteins).
We have now performed a kinetic analysis on single-cell data that we had previously collected to evaluate postsynaptic AMPA and kainate receptor responses in both the control and Bcl11b cKO. Our analysis reveals no significant differences in postsynaptic current kinetics, making it unlikely that AMPA and kainate receptor signaling differ between controls and upon the loss of C1ql2 following Bcl11b cKO (Author response image 3e-h; please also see our response to Reviewer #2 point 8). This agrees with previous findings that C1ql2 regulates postsynaptic GluK2 recruitment together with C1ql3 and only loss of both C1ql2 and C1ql3 results in a disruption of KAR signaling (Matsuda et al., 2018). In our study we demonstrate a purely presynaptic function of C1ql2 through Nrxn3 in the synaptic vesicle recruitment. This function is independent of C1ql3, as C1ql3 expression is unchanged in all of our models and its over-expression did not compensate for C1ql2 functions (Fig. 2, 3a-c). Our in vitro experiments also reveal that C1ql2 can recruit both Nrxn3 and vGlut1 in the absence of any known postsynaptic C1ql2 partner (KARs and BAI3; Fig.5; please also see our response to reviewer #3 point 4 above). We believe that further studies are needed to fully understand both the pre- and the postsynaptic functions of C1ql2. Because the focus of this manuscript was on the role of the C1ql2-Nrxn3 interaction and our investigation on postsynaptic functions of C1ql2 was incomplete, we did not include our findings on postsynaptic current kinetics in our revised manuscript. However, we increased the discussion on the known postsynaptic partners of C1ql2 in the revised manuscript to increase the interpretability of our results.
Major Comments:
The authors demonstrate that the ultrastructural properties of presynaptic boutons are altered after Bcl11b KO and C1ql2 KD. However, whether C1ql2 functions as part of a tripartite complex and the identity of the postsynaptic receptor (BAI, KAR) should be examined.
Matsuda and colleagues have nicely demonstrated in their 2016 (Neuron) study that C1ql2 is part of a tripartite complex with presynaptic Nrxn3 and postsynaptic KARs. Moreover, they demonstrated that C1ql2, together with C1ql3, recruit postsynaptic KARs at the MFS, while the KO of just C1ql2 did not affect the KAR localization. In our study we demonstrate a purely presynaptic function of C1ql2 through Nrxn3 in the synaptic vesicle recruitment. This function is independent of C1ql3, as C1ql3 expression is unchanged in all of our models and its over-expression did not compensate for C1ql2 functions (Fig. 2, 3a-c). Our in vitro experiments also reveal that C1ql2 is able to recruit both Nrxn3 and vGlut1 in the absence of any known postsynaptic C1ql2 partner (Fig. 5; please also see our response to reviewer #3 point 4 above). Moreover, we were able to show that the SV recruitment depends on C1ql2 interaction with Nrxn3 through the expression of a non-binding C1ql2 (Fig. 6) that retains the ability to interact with GluK2 (supplementary figure 5k of revised manuscript) or by KO of Nrxns (Fig. 7). Furthermore, we have now performed a kinetic analysis on single-cell data which we had previously collected to evaluate postsynaptic AMPA and kainate receptor responses in both the control and Bcl11b cKO. Our analysis reveals no significant differences in postsynaptic current kinetics, making it unlikely that AMPA and kainate receptor signaling differ between controls and Bcl11b mutants (Author response image 3e-h; please also see our response to Reviewer #2 question 8). Together, we have no experimental evidence so far that would support that the postsynaptic partners of C1ql2 are involved in the observed phenotype. While it would be very interesting to characterize the postsynaptic partners of C1ql2 in depth, we feel this would be beyond the scope of the present study.
Figure 1f: For a more comprehensive understanding of the Bcl11b KO phenotype and the potential role for C1ql2 on MF synapse number, a complete quantification of vGlut1 and Homer1 for all conditions (Supplement Figure 2e) should be included in the main text.
In our study we focused on the role of C1ql2 in the structural and functional integrity of the MFS downstream of Bcl11b. Bcl11b ablation leads to several phenotypes in the MFS that have been thoroughly described in our previous study (De Bruyckere et al., 2018). As expected, re-expression of C1ql2 only partially rescued these phenotypes, with full recovery of the SV recruitment (Fig. 2) and of the LTP (Fig. 3), but had no effect on the reduced numbers of MFS nor the structural complexity of the MFB created by the Bcl11b KO (supplementary figure 2d-f of revised manuscript). We understand that including the quantification of vGlut1 and Homer1 co-localization in the main figures would help with a better understanding of the Bcl11b mutant phenotype. However, in our manuscript we investigate C1ql2 as an effector of Bcl11b and thus we focus on its functions in SV recruitment and LTP. As we did not find a link between C1ql2 and the number of MFS/MFB upon re-expression of C1ql2 in Bcl11b cKO or now also in C1ql2 KD (see response to comment #4 below), we believe it is more suitable to present these data in the supplement.
Figure 3/4: Given the striking reduction in the numbers of synapses (Supplement Figure 2e) and docked vesicles (Figure 2d) in the Bcl11b KO and C1ql2 KD (Figure 4e-f), it is extremely surprising that basal synaptic transmission is unaffected (Supplement Figure 2g). The authors should determine the EPSP input-output relationship following C1ql2 KD and measure EPSPs following trains of stimuli at various high frequencies.
We fully acknowledge that this is an unexpected result. It is, however, well feasible that the modest displacement of SV fails to noticeably influence basal synaptic transmission. This would be the case, for example, if only a low number of vesicles are released by single stimuli, in line with the very low initial Pr at MFS. In contrast, the reduction in synapse numbers in the Bcl11b mutant might indeed be expected to reflect in the input-output relationship. It is possible, however, that synapses that are preferentially eliminated in Bcl11b cKO are predominantly silent or have weak coupling strength, such that their loss has only a minimal effect on basal synaptic transmission. Finally, we cannot exclude compensatory mechanisms (homeostatic plasticity) at the remaining synapses. A detailed analysis of these potential mechanisms would be a whole project in its own right.
As additional information, we can say that the largely unchanged input-output-relation in Bcl11b cKO is also present in the single-cell level data (Author response image 3; details on single-cell experiments are described in the response to Reviewer #2 point 8).
As suggested by the reviewer, we have now additionally analyzed the input-output relationship following C1ql2 KD and again did not observe any significant difference between control and KD animals. We have incorporated the respective input-output curves into the revised manuscript under Supplementary figure 3c-d.
Figure 4: Does C1ql2 shRNA also reduce the number of MFBs? This should be tested to further identify C1ql2-dependent and independent functions.
As requested by reviewer #1 we quantified the number of MFBs upon C1ql2 KD. We show that C1ql2 KD in WT animals does not alter the number of MFBs. The data are presented in supplementary figure 4d of the revised manuscript. Re-expression of C1ql2 in Bcl11b cKO did not rescue the loss of MFS created by the Bcl11b mutation. Moreover, C1ql2 re-expression did not rescue the complexity of the MFB ultrastructure perturbed by the Bcl11b ablation. Together, this suggests that Bcl11b regulates MFs maintenance through additional C1ql2-independent pathways. In our previously published work (De Bruyckere et al., 2018) we identified and discussed in detail several candidate genes such as Sema5b, Ptgs2, Pdyn and Penk as putative effectors of Bcl11b in the structural and functional integrity of MFS (please also see response to reviewer #2- point 1 of public reviews).
Figure 5: Clarification is required regarding the experimental design of the HEK/Neuron co-culture: 1. C1ql2 is a secreted soluble protein - how is the protein anchored to the HEK cell membrane to recruit Nrxn3(25b+) binding and, subsequently, vGlut1?
C1ql2 was secreted by the HEK293 cells through an IgK signaling peptide at the N-terminus of C1ql2. The high concentration of C1ql2 close to the secretion site together with the sparse coculturing of the HEK293 cells on the neurons allows for the quantification of accumulation of neuronal proteins. We have now described the experimental conditions in greater detail in the main text module of the revised manuscript
2) Why are the neurons transfected and not infected? Transfection efficiency of neurons with lipofectamine is usually poor (1-5%; Karra et al., 2010), while infection of neurons with lentiviruses or AAVs encoding cDNAs routinely are >90% efficient. Thus, interpretation of the recruitment assays may be influenced by the density of neurons transfected near a HEK cell.
We agree with reviewer #1 that viral infection of the neurons would have been a more effective way of expressing our constructs. However, due to safety allowances in the used facility and time limitation at the time of conception of this set of experiments, a lipofectamine transfection was chosen.
However, as all of our examined groups were handled in the same way and multiple cells from three independent experiments were examined for each experimental set, we believe that possible biases introduced by the transfection efficiency have been eliminated and thus have trust in our interpretation of these results.
3) Surface labeling of HEK cells for wild-type C1ql2 and K262 C1ql2 would be helpful to assess the trafficking of the mutant.
We recognize that potential changes to the trafficking of C1ql2 caused by the K262E mutation would be important to characterize, in light of the reduced localization of the mutant protein at the SL in the in vivo experiments (Fig. 6e). In our culture system, C1ql2 and K262E were secreted by the HEK cells through insertion of an IgK signaling peptide at the N-terminus of the myc-tagged C1ql2/K262E. Thus, trafficking analysis on this system would not be informative, as the system is highly artificial compared to the in vivo model. Further studies are needed to characterize C1ql2 trafficking in neurons to understand how C1ql2-Nrxn3 interaction regulates the localization of C1ql2. However, labeling of the myc-tag in C1ql2 or K262E expressing HEK cells of the co-culture model reveals a similar signal for the two proteins (Fig. 5a,c). Nrxn-null mutation in neurons co-cultured with C1ql2-expressing HEK cells disrupted C1ql2 mediated vGlut1 accumulation in the neurons. Selective expression of Nrxn3(25b) in the Nrxn-null neurons restored vGlut1 clustering was (Fig. 5e-f). Together, these data suggest that it is the interaction between C1ql2 and Nrxn3 that drives the accumulation of vGlut1.
Figure 6: Bcl11b KO should also be included in 6f-h.
As suggested by reviewer #1, we included the Bcl11b cKO in figures 6f-h and in corresponding supplementary figures 5c-j.
Figure 7b: What is the abundance of mRNA for Nrxn1 and Nrxn2 as well as the abundance of Nrxns after EGFP-Cre injection into DG?
We addressed this point raised by reviewer #1 by quantifying the relative mRNA levels of Nrxn1 and Nrxn2 via qPCR upon Nrxn123 mutation induction with EGFP-Cre injection. We have now examined the mRNA levels of Nrxn1 and Nrxn2 upon stereotaxic injection of Cre in the DG of Nrxn123flox/flox animals and found that Nrxn1 was only mildly reduced. At the same time Nrxn2 showed a tendency for reduction that was not significant. The data are presented in supplementary figure 6a of the revised maunscript.
Minor Comments for readability:
Synapse score is referred to frequently in the text and should be defined within the text for clarification.
'n' numbers should be better defined in the figure legends. For example, for protein expression analysis in 1c, n=3. Is this a biological or technical triplicate? For electrophysiology (e.g. 3c), does "n=7" reflect the number of animals or the number of slices? n/N (slices/animals) should be presented.
Figure 7a: Should the diagrams of the cre viruses be EGFP-Inactive or active Cre and not CRE-EGFP as shown in the diagram?
Figure 7b: the region used for the inset should be identified in the larger image.
All minor points have been fixed in the revised manuscript according to the suggestions.
Reviewer #3 (Recommendations For The Authors):
-Please describe the 'synapse score' somewhere in the text - it is too prominently featured to not have a clear description of what it is.
The description of the synapse score has been included in the main text module of the revised manuscript.
-The claim that Bcl11b controls SV recruitment "specifically" through C1ql2 is a bit stronger than is warranted by the data. Particularly given that C1ql2 is expressed at 2.5X control levels in their rescue experiments. See pt.2
Please see response to reviewer #3 point 1 of public reviews. To address this, we over-expressed C1ql2 in control animals and found no changes in the synaptic vesicle distribution (supplementary figure 2g-j of revised manuscript). This supports that the observed rescue of synaptic vesicle recruitment by re-expression of C1ql2 is due to its physiological function and not due to the artificially elevated protein levels. Of course, we cannot exclude the possibility that other, C1ql2-independent, mechanisms also contribute to the SV recruitment downstream of Bcl11b. Our data from the C1ql2 rescue, C1ql2 KD, the in vitro experiments and the interruption of C1ql2-Nrxn3 in vivo, strongly suggest C1ql2 to be an important regulator of SV recruitment.
-Does Bcl11b regulate Nrxn3 expression? Considering the apparent loss of C1ql2 expression in the Nrxn KO mice, this is an important detail.
We agree with reviewer #3 that this is an important point. We have previously done differential transcriptomics from DG neurons of Bcl11b cKOs compared to controls and did not find Nrxn3 among the differentially expressed genes. To further validate this, we now quantified the Nrxn3 mRNA levels via qPCR in Bcl11b cKOs compared to controls and found no differences. These data are included in supplementary figure 5a of the revised manuscript.
-It appears that C1ql2 expression is much lower in the Nrxn123 KO mice. Since the authors are trying to test whether Nrxn3 is required for the correct targeting of C1ql2, this is a confounding factor. We can't really tell if what we are seeing is a "mistargeting" of C1ql2, loss of expression, or both. If the authors did a similar analysis to what they did in Figure 1 where they looked at the synaptic localization of C1ql2 (and quantified it) that could provide more evidence to support or refute the "mistargeting" claim.
Please also see response to reviewer #3 point 5 of public reviews. To exclude that reduction of fluorescence intensity of C1ql2 at the SL in Nrxn123 KO mice is due to loss of C1ql2 expression, we examined the mRNA levels of C1ql2 in control and Nrxn123 mutants and found no changes (data are included in supplementary figure 6b of the revised manuscript), suggesting that C1ql2 gene expression is normal. The reduced C1ql2 fluorescence intensity at the MFS was first observed when non-binding C1ql2 variant K262E was introduced to Bcl11b cKO mice that lack endogenous C1ql2 (Fig.6). In these experiments, we found that despite the overall high protein levels of C1ql2.K262E in the hippocampus (Fig. 6c), its fluorescence intensity at the SL was significantly reduced compared to WT C1ql2 (Fig. 6d-e). The remaining C1ql2.K262E signal in the SL was equally distributed and in a punctate form, similar to WT C1ql2. Together, this indicates that the loss of C1ql2-Nrxn3 interaction interferes with the localization of C1ql2 along the MFS, but not with expression of C1ql2. Of course, this does not exclude that additional mechanisms regulate C1ql2 localization at the synapse, as both the mutant C1ql2 in Bcl11b cKO and the endogenous C1ql2 in Nrxn123 cKO show residual immunofluorescence at the SL.
We note here that we have not previously quantified the co-localization of C1ql2 with individual synapses. C1ql2 is a secreted molecule that localizes at the MFS synaptic cleft. However, not much is known about the number of MFS that are positive for C1ql2 nor about the mechanisms regulating C1ql2 targeting, transport, and secretion to the MFS. Whether C1ql2 interaction with Nrxn3 is necessary for the protection of C1ql2 from degradation, its surface presentation and transport or stabilization to the synapse is currently unclear. Upon revision of our manuscript, we realized that we might have overstated this particular finding and have now rephrased the specific parts within the results to appropriately describe the observation and have also included a sentence in the discussion referring to the lack of understanding of the mechanism behind this observation.
-Title of Figure S5 is "Nrxn KO perturbs C1ql2 localization and SV recruitment at the MFS", but there is no data on C1ql2 localization.
This issue has been fixed in the revised manusript.
-S5 should be labeled more clearly than just Cre+/-
This issue has been fixed in the revised manuscript.
References
Castillo, P.E., Malenka, R.C., Nicoll, R.A., 1997. Kainate receptors mediate a slow postsynaptic current in hippocampal CA3 neurons. Nature 388, 182–186. https://doi.org/10.1038/40645
De Bruyckere, E., Simon, R., Nestel, S., Heimrich, B., Kätzel, D., Egorov, A.V., Liu, P., Jenkins, N.A., Copeland, N.G., Schwegler, H., Draguhn, A., Britsch, S., 2018. Stability and Function of Hippocampal Mossy Fiber Synapses Depend on Bcl11b/Ctip2. Front. Mol. Neurosci. 11. https://doi.org/10.3389/fnmol.2018.00103
Kaeser, P.S., Regehr, W.G., 2017. The readily releasable pool of synaptic vesicles. Curr. Opin. Neurobiol. 43, 63–70. https://doi.org/10.1016/j.conb.2016.12.012
Lerma, J., 2003. Roles and rules of kainate receptors in synaptic transmission. Nat. Rev. Neurosci. 4, 481–495. https://doi.org/10.1038/nrn1118
Orlando, M., Dvorzhak, A., Bruentgens, F., Maglione, M., Rost, B.R., Sigrist, S.J., Breustedt, J., Schmitz, D., 2021. Recruitment of release sites underlies chemical presynaptic potentiation at hippocampal mossy fiber boutons. PLoS Biol. 19, e3001149. https://doi.org/10.1371/journal.pbio.3001149
Vandael, D., Borges-Merjane, C., Zhang, X., Jonas, P., 2020. Short-Term Plasticity at Hippocampal Mossy Fiber Synapses Is Induced by Natural Activity Patterns and Associated with Vesicle Pool Engram Formation. Neuron 107, 509-521.e7. https://doi.org/10.1016/j.neuron.2020.05.013
Author Response
The following is the authors’ response to the original reviews.
We are very grateful to the reviewers for their thoughtful comments on the manuscript and to the editors for their assessment.
We thank the reviewers for their positive feedback and appreciate that they consider our method a valid addition to previously established systems for generating recombinant RNA viruses.
To strengthen this point, we have now included additional validation by the rescue of recombinant Chikungunya and Dengue virus from viral RNA directly, using the CLEVER protocol. This strengthens the potential of this method as a reverse genetics platform for positive-stranded viruses in general.
The supportive data has been amended in the Results section, taken into account in Materials and Methods, and the corresponding supplementary figure (Figure S4) has been added.
One key point raised by one of the reviewers, a comparison with different systems, could not be addressed in this manuscript as our lab does not at all perform BAC cloning. We currently do not have the necessary expertise to conduct an unbiased side-by-side comparison.
All other comments were addressed in detail, either by including additional data or through specific clarification in the revised text. We are grateful for the careful review and constructive criticisms raised by the reviewers and feel that the corrections and additions have significantly improved the manuscript.
We have revised the latest version posted May 30, 2023 on bioRxiv (https://doi.org/10.1101/2023.05.11.540343).
Reviewer #1:
Public Review:
In this manuscript, Kipfer et al describe a method for a fast and accurate SARS-CoV2 rescue and mutagenesis. This work is based on a published method termed ISA (infectious subgenomic amplicons), in which partially overlapping DNA fragments covering the entire viral genome and additional 5' and 3' sequences are transfected into mammalian cell lines. These DNA fragments recombine in the cells, express the full length viral genomic RNA and launch replication and rescue of infectious virus.
CLEVER, the method described here significantly improves on the ISA method to generate infectious SARS-CoV2, making it widely useful to the virology community.
Specifically, the strengths of this method are:
1) The successful use of various cell lines and transfection methods.
2) Generation of a four-fragment system, which significantly improves the method efficiency due to lower number of required recombination events.
3) Flexibility in choice of overlapping sequences, making this system more versatile.
4) The authors demonstrated how this system can be used to introduce point mutations as well as insertion of a tag and deletion of a viral gene.
5) Fast-tracking generation of infectious virus directly from RNA of clinical isolates by RT-PCR, without the need for cloning the fragments or using synthetic sequences.
One weakness of the latter point, which is also pointed out by the authors, is that the direct rescue of clinical isolates was not tested for sequence fidelity.
The manuscript clearly presents the findings, and the proof-of-concept experiments are well designed.
Overall, this is a very useful method for SARS-CoV2 research. Importantly, it can be applicable to many other viruses, speeding up the response to newly emerging viruses than threaten the public health.
We thank the reviewer for this positive feedback and the summary of the main points. Nevertheless, we would like to comment on point 5): “the direct rescue of clinical isolates was not tested for sequence fidelity”
This impression by the reviewer suggests that the data was not sufficient on this point. However, the sequence fidelity after direct rescue from RNA was indeed tested in this study, even on a clonal level (please see: Table S2, or raw NGS data SRX20303605 - SRX20303607). For higher clarity, we added the following sentence to the manuscript:<br /> “Indeed, a slight increase of unintentional mutations was observed when sequencing clonal virus populations rescued from RNA directly”.
Recommendations for the authors:
Minor Points:
1) On page 8, the authors write: "levels correlated very well with the viral phenotype". This sentence is not clear. Please clarify what you mean by "viral phenotype". Do you mean CPE on Vero cells?
We corrected the sentence to: “(…) staining intensity and patterns correlated very well with the wild-type phenotype.”
2) Page 9 "sequences were analyzed with a cut-off of 10%. Cutoff of what? please clarify.
The sentence was rephrased to: “(…)mutations with a relative abundance of >10% in the entire virus population were analyzed”
3) Page 15: The authors refer to the time required for completion of each step of the process. It would be helpful and informative for the readers to include a panel in figure 4, visualizing the timelines.
We included a timeline in Figure 4, Panel A.
4) Materials and methods, first paragraph: Please specify which human samples were collected. Do the authors refer to clinical virus isolates?
We added the following information to the Materials and Methods section:<br /> “Human serum samples for neutralization assays were collected from SARS-CoV-2 vaccinated anonymous donors (…)”
Clinical virus isolates (Material and Methods; Virus) were used for control experiments, neutralization assays, or as templates for RT-PCR.
5) Supplementary figure 4A: The color scheme makes it hard to differentiate between the BA.1 and BA.5 fragments. Please choose colors that are not as similar to each other.
Colors were adapted for better distinction.
Reviewer #2:
Public Review:
The authors of the manuscript have developed and used cloning-free method. It is not entirely novel (rather it is based on previously described ISA method) but it is clearly efficient and useful complementation to the already existing methods. One of strong points of the approach use by authors is that it is very versatile, i.e. can be used in combination with already existing methods and tools. I find it important as many laboratories have already established their favorite methods to manipulate SARS-CoV-2 genome and are probably unwilling to change their approach entirely. Though authors highlight the benefits of their method these are probably not absolute - other methods may be as efficient or as fast. Still, I find myself thinking that for certain purposes I would like to complement my current approach with elements from authors CLEVER method.
The work does not contain much novel biological data - which is expected for a paper dedicated to development of new method (or for improving the existing one). It may be kind of shortcoming as it is commonly expected that authors who have developed new methods apply it for discovery of something novel. The work stops on step of rescue the viruses and confirming their biological properties. This part is done very well and represents a strength of the study. The properties of rescued viruses were also studied using NSG methods that revealed high accuracy of the used method, which is very important as the method relies on use of PCR that is known to generate random mistakes and therefore not always method of choice.
What I found missing is a real head-to-head comparison of the developed system with an existing alternatives, preferably some PCR-free standard methods such as use of BAC clones. There are a lot of comparisons but they are not direct, just data from different studies has been compared. Authors could also be more opened to discuss limitations of the method. One of these seems to be rather low rescue efficiency - 1 rescue event per 11,000 transfected cells. This is much lower compared to infectious plasmid (about 1 event per 100 cells or so) and infectious RNAs (often 1 event per 10 cells, for smaller genomes most of transfected cells become infected). This makes the CLEVER method poorly suitable for generation of large infectious virus libraries and excludes its usage for studies of mutant viruses that harbor strongly attenuating mutations. Many of such mutations may reduce virus genome infectivity by 3-4 orders of magnitude; with current efficiencies the use of CLEVER approach may result in false conclusions (mutant viruses will be classified as non-viable while in reality they are just strongly attenuated).
We thank reviewer 2 for the careful review of our work and the valuable feedback. We agree that a direct comparison with other (PCR-free) methods such as BAC cloning, could be useful for demonstrating the unique benefits of the CLEVER method. However, as our laboratory does not use any BAC or YAC cloning methods, we could not ensure an unbiased side-byside comparison using different techniques.
We would like to highlight the avoidance of any yeast/bacterial cloning steps that render the CLEVER protocol significantly faster and easier to handle. A visualization of the key steps that could be skipped using CLEVER in comparison to common reverse genetics methods is given in Figure 6.
Further, we firmly believe that the benefits of the CLEVER method become especially apparent for large viral genomes such as the one of SARS-CoV-2, where assembly, genome amplification and sequence verification of plasmid DNA are highly inefficient and more timeconsuming than for small viruses like DENV, CHIKV or HIV.
We agree with the reviewer that the overall transfection and recombination efficiencies observed with CLEVER seemed rather low. Although data on transfection/rescue efficiency is known for many techniques and viruses, we did not find any published data on the reconstitution of SARS-CoV-2 or viruses with similar genome sizes. Therefore, a useful comparator for our observations in relation to other techniques is currently simply missing. We therefore emphasize that the efficiencies of CLEVER were achieved with one of the largest plus-stranded RNA virus genomes, and our data can’t be directly compared to transfection efficiencies of short infectious RNAs.
On the contrary, it was rather interesting to observe the very high rescue efficiency of infectious virus progeny. During the two years of establishing and validating the CLEVER protocol, we reached success rates for the genome reconstitution after transfection of >95 %. This was even obtained with highly attenuated mutants including rCoV2∆ORF3678 (joint deletion of ORF3a, ORF6, ORF7a, and ORF8) (Liu et al., 2022)(see Author response image 1). We amended this data in response to the reviewers’ comment and as an example of the successful rescue of an attenuated virus from five overlapping genome fragments (fragments A, B, C, D1, and D2∆ORF3678).
The latter data were not added to the main manuscript since in this case the deletions were introduced using a different method: from the plasmid-based DNA fragment D2∆ORF3678 and not directly from PCR-based mutagenesis.
Further, CLEVER was used for related substantial manipulations, including the complete deletion of the Envelope gene (E) which led to the creation of a single-cycle virus that may serve as a live, replication-incompetent vaccine candidate (Lett et al., 2023).
Author response image 1.
rCoV2∆ORF3678. Detection of intracellular SARS-CoV-2 nucleocapsid protein (N, green) and nuclei (Hoechst, blue) in Vero E6TMPRSS2 cells infected with rCoV2∆ORF3678 by immunocytochemistry. Scalebar is 200 µm in overview and 50 µm in ROI images.
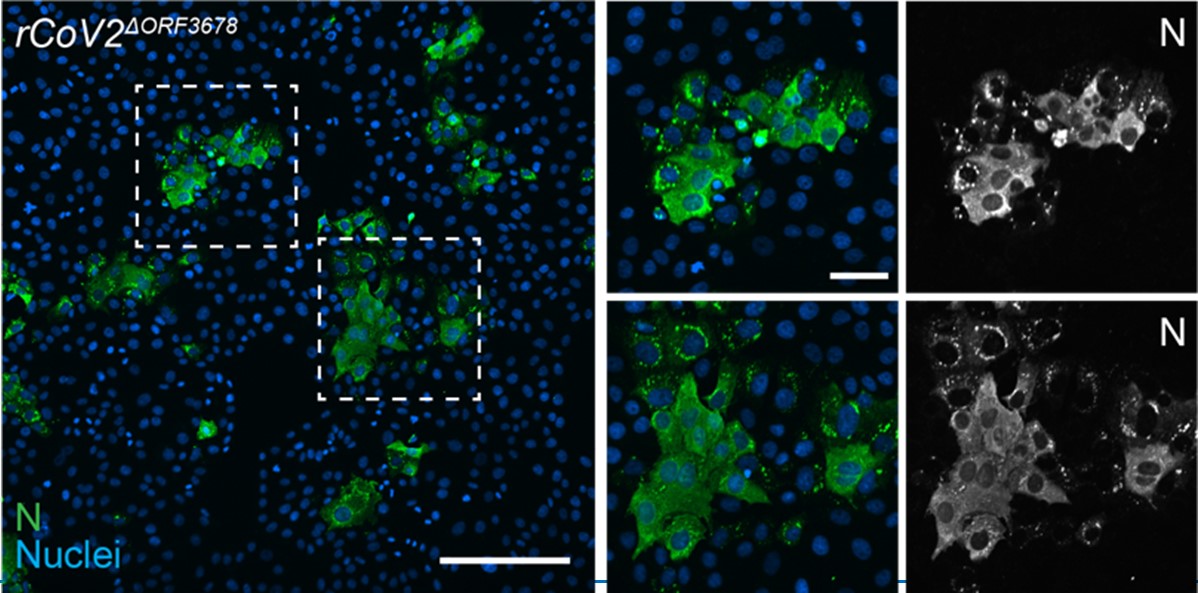
Recommendations for the authors:
The work is nicely presented and the method authors has developed is clearly valuable. As indicated in Public review section the work would benefit from direct comparison of CLEVER with that of infectious plasmid (or RNA) based methods; direct comparison of data would be more convincing that indirect one. Authors should also discuss possible limitations of the method - this is helpful for a reader.
We were not able to perform a direct comparison of CLEVER with other methods (see our statement above).
We added the following section to the discussion: “Along with the advantages of the CLEVER protocol, limitations must be considered: Interestingly, virus was never rescued after transfecting Vero E6 cells, as has been observed previously (Mélade et al., 2022). Whether this is due to low transfection efficiency or the cell’s inability to recombine remains to be elucidated. Other cell lines not tested within this study will have to be tested for efficient recombination and virus production first. Further, the high sequence integrity of rescued virus is highly dependent on the fidelity of the DNA polymerase used for amplification. The use of other enzymes might negatively influence the sequence integrity of recombinant virus, as it has been observed for the direct rescue from viral RNA using a commercially available onestep RT-PCR kit. Another limitation when performing direct mutagenesis is the synthesis of long oligos to create an overlapping region. Repetitive sequences, for example, can impair synthesis, and self-annealing and hairpin formation increase with prolonged oligos.”
Some technical corrections of the text would be beneficial. In all past of the text the use of terms applicable only for DNA or RNA is mixed and creates some confusion. For example, authors state that "the human cytomegalovirus promoter (CMV) was cloned upstream of 5' UTR and poly(A) tail, the hepatitis delta ribozyme (HDVr) and the simian virus 40 polyadenylation signal downstream of the 3' UTR". Strictly speaking it is impossible as such a construct would contain dsDNA sequence (CMV promoter) followed by ssRNA (5'UTR, polyA tail and HDV ribozyme) and then again dsDNA (SV40 terminator). So, better to be correct and add "sequences corresponding to", "dsDNA copies of" to the description of RNA elements
We thank the reviewer for the advice but would like to state that in scientific language it is common to assume that nucleic acid cloning is based on DNA.
We have corrected the description in the Methods section: “The human cytomegalovirus promoter (CMV) was cloned upstream of the DNA sequence of the viral 5’UTR; herein, the first five nucleotides (ATATT) correspond to the 5’UTR of SARS-CoV. Sequences corresponding to the poly(A) tail (n=35), the hepatitis delta virus ribozyme (HDVr), and the simian virus 40 polyadenylation signal (SV40pA) were cloned immediately downstream of the DNA sequence of the viral 3’UTR.”
For ease of reading and for consistent terminology, we kept the original spelling in the rest of the manuscript.
In description of neutralization assay authors have used temperature 34 C for incubation of virus with antibodies as well as for subsequent incubation of infected cells. Why this temperature was used?
The following sentence was added (Materials and Methods; Cells): “A lower incubation temperature was chosen based on previous studies (V’kovski et al., 2021).”
References
Lett MJ, Otte F, Hauser D, Schön J, Kipfer ET, Hoffmann D, Halwe NJ, Ulrich L, Zhang Y, Cmiljanovic V, Wylezich C, Urda L, Lang C, Beer M, Mittelholzer C, Klimkait T. 2023. Single-cycle SARS-CoV-2 vaccine elicits high protection and sterilizing immunity in hamsters. doi:10.1101/2023.05.17.541127
Liu Y, Zhang X, Liu J, Xia H, Zou J, Muruato AE, Periasamy S, Kurhade C, Plante JA, Bopp NE, Kalveram B, Bukreyev A, Ren P, Wang T, Menachery VD, Plante KS, Xie X, Weaver SC, Shi P-Y. 2022. A live-attenuated SARS-CoV-2 vaccine candidate with accessory protein deletions. Nat Commun 13:4337. doi:10.1038/s41467-022-31930-z
V’kovski P, Gultom M, Kelly JN, Steiner S, Russeil J, Mangeat B, Cora E, Pezoldt J, Holwerda M, Kratzel A, Laloli L, Wider M, Portmann J, Tran T, Ebert N, Stalder H, Hartmann R, Gardeux V, Alpern D, Deplancke B, Thiel V, Dijkman R. 2021. Disparate temperaturedependent virus–host dynamics for SARS-CoV-2 and SARS-CoV in the human respiratory epithelium. PLoS Biol 19:e3001158. doi:10.1371/journal.pbio.3001158
Author response:
The following is the authors’ response to the original reviews.
Public Reviews:
Reviewer #1 (Public Review):
The aim of this paper is to describe a novel method for genetic labelling of animals or cell populations, using a system of DNA/RNA barcodes.
Strengths:
• The author's attempt at providing a straightforward method for multiplexing Drosophila samples prior to scRNA-seq is commendable. The perspective of being able to load multiple samples on a 10X Chromium without antibody labelling is appealing.
• The authors are generally honest about potential issues in their method, and areas that would benefit from future improvement.
• The article reads well. Graphs and figures are clear and easy to understand.
We thank the reviewer for these positive comments.
Weaknesses:
• The usefulness of TaG-EM for phototaxis, egg laying or fecundity experiments is questionable. The behaviours presented here are all easily quantifiable, either manually or using automated image-based quantification, even when they include a relatively large number of groups and replicates. Despite their claims (e.g., L311-313), the authors do not present any real evidence about the cost- or time-effectiveness of their method in comparison to existing quantification methods.
While the behaviors that were quantified in the original manuscript were indeed relatively easy to quantify through other methods, they nonetheless demonstrated that sequencing-based TaG-EM measurements faithfully recapitulated manual behavioral measurements. In response to the reviewer’s comment, we have added additional experiments that demonstrate the utility of TaG-EM-based behavioral quantification in the context of a more labor-intensive phenotypic assay (measuring gut motility via food transit times in Drosophila larvae, Figure 4, Supplemental Figure 7). We found that food transit times in the presence and absence of caffeine are subtly different and that, as with larger effect size behaviors, TaG-EM data recapitulates the results of the manual assay. This experiment demonstrates both that TaG-EM can be used to streamline labor-intensive behavioral assays (we have included an estimate of the savings in hands-on labor for this assay by using a multiplexed sequencing approach, Supplemental Figure 8) and that TaG-EM can quantify small differences between experimental groups. We also note in the discussion that an additional benefit of TaGEM-based behavioral assays is that the observed is blinded as to the experimental conditions as they are intermingled in a single multiplexed assay. We have added the following text to the paper describing these experiments.
Results:
“Quantifying food transit time in the larval gut using TaG-EM
Gut motility defects underlie a number of functional gastrointestinal disorders in humans (Keller et al., 2018). To study gut motility in Drosophila, we have developed an assay based on the time it takes a food bolus to transit the larval gut (Figure 4A), similar to approaches that have been employed for studying the role of the microbiome in human gut motility (Asnicar et al., 2021). Third instar larvae were starved for 90 minutes and then fed food containing a blue dye. After 60 minutes, larvae in which a blue bolus of food was visible were transferred to plates containing non-dyed food, and food transit (indicated by loss of the blue food bolus) was scored every 30 minutes for five hours (Supplemental Figure 7).
Because this assay is highly labor-intensive and requires hands-on effort for the entire five-hour observation period, there is a limit on how many conditions or replicates can be scored in one session (~8 plates maximum). Thus, we decided to test whether food transit could be quantified in a more streamlined and scalable fashion by using TaG-EM (Figure 4B). Using the manual assay, we observed that while caffeinecontaining food is aversive to larvae, the presence of caffeine reduces transit time through the gut (Figure 4C, Supplemental Figure 7). This is consistent with previous observations in adult flies that bitter compounds (including caffeine) activate enteric neurons via serotonin-mediated signaling and promote gut motility (Yao and Scott, 2022). We tested whether TaG-EM could be used to measure the effect of caffeine on food transit time in larvae. As with prior behavioral tests, the TaG-EM data recapitulated the results seen in the manual assay (Figure 4D). Conducting the transit assay via TaGEM enables several labor-saving steps. First, rather than counting the number of larvae with and without a food bolus at each time point, one simply needs to transfer nonbolus-containing larvae to a collection tube. Second, because the TaG-EM lines are genetically barcoded, all the conditions can be tested at once on a single plate, removing the need to separately count each replicate of each experimental condition. This reduces the hands-on time for the assay to just a few minutes per hour. A summary of the anticipated cost and labor savings for the TaG-EM-based food transit assay is shown in Supplemental Figure 8.”
Discussion:
“While the utility of TaG-EM barcode-based quantification will vary based on the number of conditions being analyzed and the ease of quantifying the behavior or phenotype by other means, we demonstrate that TaG-EM can be employed to cost-effectively streamline labor-intensive assays and to quantify phenotypes with small effect sizes (Figure 4, Supplemental Figure 8). An additional benefit of multiplexed TaG-EM behavioral measurements is that the experimental conditions are effectively blinded as the multiplexed conditions are intermingled in a single assay.”
Methods:
“Larval gut motility experiments
Preparing Yeast Food Plates
Yeast agar plates were prepared by making a solution containing 20% Red Star Active Dry Yeast 32oz (Red Star Yeast) and 2.4% Agar Powder/Flakes (Fisher) and a separate solution containing 20% Glucose (Sigma-Aldrich). Both mixtures were autoclaved with a 45-minute liquid cycle and then transferred to a water bath at 55ºC. After cooling to 55ºC, the solutions were combined and mixed, and approximately 5 mL of the combined solution was transferred into 100 x 15 mm petri dishes (VWR) in a PCR hood or contamination-free area. For blue-dyed yeast food plates, 0.4% Blue Food Color (McCormick) was added to the yeast solution. For the caffeine assays, 300 µL of a solution of 100 mM 99% pure caffeine (Sigma-Aldrich) was pipetted onto the blue-dyed yeast plate and allowed to absorb into the food during the 90-minute starvation period.
Manual Gut Motility Assay
Third instar Drosophila larvae were transferred to empty conical tubes that had been misted with water to prevent the larvae from drying out. After a 90-minute starvation period the larvae were moved from the conical to a blue-dyed yeast plate with or without caffeine and allowed to feed for 60 minutes. Following the feeding period, the larvae were transferred to an undyed yeast plate. Larvae were scored for the presence or absence of a food bolus every 30 minutes over a 5-hour period. Up to 8 experimental replicates/conditions were scored simultaneously.
TaG-EM Gut Motility Assay
Third instar larvae were starved and fed blue dye-containing food with or without caffeine as described above. An equal number of larvae from each experimental condition/replicate were transferred to an undyed yeast plate. During the 5-hour observation period, larvae were examined every 30 minutes and larvae lacking a food bolus were transferred to a microcentrifuge tube labeled for the timepoint. Any larvae that died during the experiment were placed in a separate microcentrifuge tube and any larvae that failed to pass the food bolus were transferred to a microcentrifuge tube at the end of the experiment. DNA was extracted from the larvae in each tube and TaG-EM barcode libraries were prepared and sequenced as described above.”
• Behavioural assays presented in this article have clear outcomes, with large effect sizes, and therefore do not really challenge the efficiency of TaG-EM. By showing a Tmaze in Fig 1B, the authors suggest that their method could be used to quantify more complex behaviours. Not exploring this possibility in this manuscript seems like a missed opportunity.
See the response to the previous point.
• Experiments in Figs S3 and S6 suggest that some tags have a detrimental effect on certain behaviours or on GFP expression. Whereas the authors rightly acknowledge these issues, they do not investigate their causes. Unfortunately, this question the overall suitability of TaG-EM, as other barcodes may also affect certain aspects of the animal's physiology or behaviour. Revising barcode design will be crucial to make sure that sequences with potential regulatory function are excluded.
We have determined that the barcode (BC#8) that had no detectable Gal4induced gene expression in Figure S6 (now Supplemental Figure 9) has a deletion in the GFP coding region that ablates GFP function. Interestingly, the expressed TaG-EM barcode transcript is still detectable in single cell sequencing experiments, but obviously this line cannot be used for cell enrichment (at least based solely on GFP expression from the TaG-EM construct). While it is unclear how this line came to have a lesion in the GFP gene, we have subsequently generated >150 additional TaG-EM stocks and we have tested the GFP expression of these newly established stocks by crossing them to Mhc-Gal4. All of the additional stocks had GFP expression in the expected pattern, indicating that the BC#8 construct is an outlier with respect to inducibility of GFP. We have added the following text to the results section to address this point:
“No GFP expression was visible for TaG-EM barcode number 8, which upon molecular characterization had an 853 bp deletion within the GFP coding region (data not shown). We generated and tested GFP expression of an additional 156 TaG-EM barcode lines (Alegria et al., 2024), by crossing them to Mhc-Gal4 and observing expression in the adult thorax. All 156 additional TaG-EM lines had robust GFP expression (data not shown).”
It is certainly the case that future improvements to the construct design may be necessary or desirable and that back-crossing could likely be used to alleviate line-toline differences for specific phenotypes, we also address this point in the discussion with the following text:
“We excluded this poor performing barcode line from the fecundity tests, however, backcrossing is often used to bring reagents into a consistent genetic background for behavioral experiments and could also potentially be used to address behavior-specific issues with specific TaG-EM lines. In addition, other strategies such as averaging across multiple barcode lines or permutation of barcode assignment across replicates could also mitigate such deficiencies.”
• For their single-cell experiments, the authors have used the 10X Genomics method, which relies on sequencing just a short segment of each transcript (usually 50-250bp - unknown for this study as read length information was not provided) to enable its identification, with the matching paired-end read providing cell barcode and UMI information (Macosko et al., 2015). With average fragment length after tagmentation usually ranging from 300-700bp, a large number of GFP reads will likely not include the 14bp TaG-EM barcode.
The 10x Genomics 3’ workflows that were used for sequencing TaG-EM samples reads the cell barcode and UMI in read one and the expressed RNA sequence in read two. We sequenced the samples shown in Figure 5 in the initial manuscript using a run configuration that generated 150 bp for read two. The TaG-EM barcodes are located just upstream of the poly-adenylation sites (based on the sequencing data, we observe two different poly-A sites and the TaG-EM barcode is located 35 and 60 bp upstream of these sites). Based on the location of the TaG-EM barcodes,150 bp reads is sufficient to see the barcode in any GFP-associated read (when using the 3’ gene expression workflow). In addition to detecting the expression of the TaG-EM barcodes in the 10x Genomics gene expression library, it is possible to make a separate library that enriches the barcode sequence (similar to hashtag or CITE-Seq feature barcode libraries). We have added experimental data where we successfully performed an enrichment of the TaG-EM barcodes and sequenced this as a separate hashtag library (Supplemental Figure 18). We have added text to the results describing this work and also included a detailed information in the methods for performing TaG-EM barcode enrichment during 10x library prep.
Results:
“In antibody-conjugated oligo cell hashing approaches, sparsity of barcode representation is overcome by spiking in an additional primer at the cDNA amplification step and amplifying the hashtag oligo by PCR. We employed a similar approach to attempt to enrich for TaG-EM barcodes in an additional library sequenced separately from the 10x Genomics gene expression library. Our initial attempts at barcode enrichment using spike-in and enrichment primers corresponding to the TaG-EM PCR handle were unsuccessful (Supplemental Figure 18). However, we subsequently optimized the TaG-EM barcode enrichment by 1) using a longer spike-in primer that more closely matches the annealing temperature used during the 10x Genomics cDNA creation step, and 2) using a nested PCR approach to amplify the cell-barcode and unique molecular identifier (UMI)-labeled TaG-EM barcodes (Supplemental Figure 18). Using the enriched library, TaG-EM barcodes were detected in nearly 100% of the cells at high sequencing depths (Supplemental Figure 19). However, although we used a polymerase that has been engineered to have high processivity and that has been shown to reduce the formation of chimeric reads in other contexts (Gohl et al., 2016), it is possible that PCR chimeras could lead to unreliable detection events for some cells. Indeed, many cells had a mixture of barcodes detected with low counts and single or low numbers of associated UMIS. To assess the reliability of detection, we analyzed the correlation between barcodes detected in the gene expression library and the enriched TaG-EM barcode library as a function of the purity of TaG-EM barcode detection for each cell (the percentage of the most abundant detected TaG-EM barcode, Supplemental Figure 19). For TaG-EM barcode detections where the most abundance barcode was a high percentage of the total barcode reads detected (~75%-99.99%), there was a high correlation between the barcode detected in the gene expression library and the enriched TaG-EM barcode library. Below this threshold, the correlation was substantially reduced.
In the enriched library, we identified 26.8% of cells with a TaG-EM barcode reliably detected, a very modest improvement over the gene expression library alone (23.96%), indicating that at least for this experiment, the main constraint is sufficient expression of the TaG-EM barcode and not detection. To identify TaG-EM barcodes in the combined data set, we counted a positive detection as any barcode either identified in the gene expression library or any barcode identified in the enriched library with a purity of >75%. In the case of conflicting barcode calls, we assigned the barcode that was detected directly in the gene expression library. This increased the total fraction of cells where a barcode was identified to approximately 37% (Figure 6B).”
Methods:
“The resulting pool was prepared for sequencing following the 10x Genomics Single Cell 3’ protocol (version CG000315 Rev C), At step 2.2 of the protocol, cDNA amplification, 1 µl of TaG-EM spike-in primer (10 µM) was added to the reaction to amplify cDNA with the TaG-EM barcode. Gene expression cDNA and TaG-EM cDNA were separated using a double-sided SPRIselect (Beckman Coulter) bead clean up following 10x Genomics Single Cell 3’ Feature Barcode protocol, step 2.3 (version CG000317 Rev E). The gene expression cDNA was created into a library following the CG000315 Rev C protocol starting at section 3. Custom nested primers were used for enrichment of TaG-EM barcodes after cDNA creation using PCR. The following primers were tested (see Supplemental Figure 18):
UMGC_IL_TaGEM_SpikeIn_v1:
GTGACTGGAGTTCAGACGTGTGCTCTTCCGATCTCTTCCAACAACCGGAAGT*G*A UMGC_IL_TaGEM_SpikeIn_v2:
GTGACTGGAGTTCAGACGTGTGCTCTTCCGATCTGCAGCTTATAACTTCCAACAACCGGAAGT*G*A
UMGC_IL_TaGEM_SpikeIn_v3:
TGTGCTCTTCCGATCTGCAGCTTATAACTTCCAACAACCGGAAGT*G*A D701_TaGEM:
CAAGCAGAAGACGGCATACGAGATCGAGTAATGTGACTGGAGTTCAGACGTGTGCTCTTCCGATCTGCAGC*T*T
SI PCR Primer:
AATGATACGGCGACCACCGAGATCTACACTCTTTCCCTACACGACGC*T*C
UMGC_IL_DoubleNest:
GTGACTGGAGTTCAGACGTGTGCTCTTCCGATCTGCAGCTTATAACTTCCAACAACCGG*A*A
P5: AATGATACGGCGACCACCGA
D701:
GATCGGAAGAGCACACGTCTGAACTCCAGTCACATTACTCGATCTCGTATGCCGTCTTCTGCTTG
D702:
GATCGGAAGAGCACACGTCTGAACTCCAGTCACTCCGGAGAATCTCGTATGCCGTCTTCTGCTTG
After multiple optimization trials, the following steps yielded ~96% on-target reads for the TaG-EM library (Supplemental Figure 18, note that for the enriched barcode data shown in Figure 6 and Supplemental Figure 19, a similar amplification protocol was used TaG-EM barcodes were amplified from the gene expression library cDNA and not the SPRI-selected barcode pool). TaG-EM cDNA was amplified with the following PCR reaction: 5 µl purified TaG-EM cDNA, 50 µl 2x KAPA HiFi ReadyMix (Roche), 2.5 µl UMGC_IL_DoubleNest primer (10 µM), 2.5 µl SI_PCR primer (10 µM), and 40 µl nuclease-free water. The reaction was amplified using the following cycling conditions: 98ºC for 2 minutes, followed by 15 cycles of 98ºC for 20 seconds, 63ºC for 30 seconds, 72ºC for 20 seconds, followed by 72ºC for 5 minutes. After the first PCR, the amplified cDNA was purified with a 1.2x SPRIselect (Beckman Coulter) bead cleanup with 80% ethanol washes and eluted into 40 µL of nuclease-water. A second round of PCR was run with following reaction: 5 µl purified TaG-EM cDNA, 50 µl 2x KAPA HiFi ReadyMix (Roche), 2.5 µl D702 primer (10 µM), 2.5 µl p5 Primer (10 µM), and 40 µl nuclease-free water. The reaction was amplified using the following cycling conditions: 98ºC for 2 minutes, followed by 10 cycles of 98ºC for 20 seconds, 63ºC for 30 seconds, 72ºC for 20 seconds, followed by 72ºC for 5 minutes. After the second PCR, the amplified cDNA was purified with a 1.2x SPRIselect (Beckman Coulter) bead cleanup with 80% ethanol washes and eluted into 40uL of nuclease-water. The resulting 3’ gene expression library and TaG-EM enrichment library were sequenced together following Scenario 1 of the BioLegend “Total-Seq-A Antibodies and Cell Hashing with 10x Single Cell 3’ Reagents Kit v3 or v3.1” protocol. Additional sequencing of the enriched TaG-EM library also done following Scenario 2 from the same protocol.”
When a given cell barcode is not associated with any TaG-EM barcode, then demultiplexing is impossible. This is a major problem, which is particularly visible in Figs 5 and S13. In 5F, BC4 is only detected in a couple of dozen cells, even though the Jon99Ciii marker of enterocytes is present in a much larger population (Fig 5C). Therefore, in this particular case, TaG-EM fails to detect most of the GFP-expressing cells.
Figure 5 in the original manuscript represented data from an experiment in which there were eight different TaG-EM barcoded samples present, including four replicates of the pan-midgut driver (each of which included enterocyte populations). One would not expect the BC4 enterocyte driver expression to be observed in all of the Jon99Ciii cells, since the majority of the GFP+ cells shown in the UMAP plot were likely derived from and are labeled by the pan-midgut driver-associated barcodes. Thus, the design and presentation of this particular experiment (in particular, the presence of eight distinct samples in the data set) is making the detection of the TaG-EM barcodes look sparser than it actually is. We have added a panel in both Figure 6B and Supplemental Figure 17B that shows the overall detection of barcodes in the enriched barcode library and gene expression library or the gene expression library only, respectively, for this experiment.
However, the reviewer’s overall point regarding barcode detection is still valid in that if we consider all eight barcodes, we only see TaG-EM barcode labeling associated with about a quarter of all the cells in this gene expression library, or about 37% of cells when we include the enriched TaG-EM barcode library. While improving barcode detection will improve the yield and is necessary for some applications (such as robust detection of multiplets), we would argue that even at the current level of success this approach has significant utility. First, if one’s goal is to unambiguously label a cell cluster and trace it to a defined cell population in vivo, sparse labeling may be sufficient. Second, demultiplexing is still possible (as we demonstrate) but involves a trade off in yield (not every cell is recovered and there is some extra sequencing cost as some sequenced cells cannot be assigned to a barcode).
Similarly, in S13, most cells should express one of the four barcodes, however many of them (maybe up to half - this should be quantified) do not. Therefore, the claim (L277278) that "the pan-midgut driver were broadly distributed across the cell clusters" is misleading. Moreover, the hypothesis that "low expressing driver lines may result in particularly sparse labelling" (L331-333) is at least partially wrong, as Fig S13 shows that the same Gal4 driver can lead to very different levels of barcode coverage.
As described above, since this experiment included eight different TaG-EM barcodes expressed by five different drivers, the expectation is that only about half of the cells in Figure S13 (now Figure S20) should express a TaG-EM barcode. It is not clear why BC2 is underrepresented in terms of the number of cells labeled and BC7 is overrepresented. We agree with the reviewer that this should be described more accurately in the paper and that it does impact our interpretation related to driver strength and barcode detection. We have revised this sentence in the discussion and also added additional text in the results describing the within driver variability seen in this experiment.
Results text:
“As expected, the barcodes expressed by the pan-midgut driver were broadly distributed across the cell clusters (Supplemental Figure 20). However, the number of cells recovered varied significantly among the four pan-midgut driver associated barcodes.”
Discussion text:
“It is likely that the strength of the Gal4 driver contributes to the labeling density. However, we also observed variable recovery of TaG-EM barcodes that were all driven by the same pan-midgut Gal4 driver (Supplemental Figure 20).”
• Comparisons between TaG-EM and other, simpler methods for labelling individual cell populations are missing. For example, how would TaG-EM compare with expression of different fluorescent reporters, or a strategy based on the brainbow/flybow principle?
The advantage of TaG-EM is that an arbitrarily large number of DNA barcodes can be used (contingent upon the availability of transgenic lines – we described 20 barcoded lines in our initial manuscript and we have now extended this collection to over 170 lines), while the number of distinguishable FPs is much lower. Brainbow/Flybow uses combinatorial expression of different FPs, but because this combinatorial expression is stochastic, tracing a single cell transcriptome to a defined cell population in vivo based on the FP signature of a Brainbow animal would likely not be possible (and would almost certainly be impossible at scale).
• FACS data is missing throughout the paper. The authors should include data from their comparative flow cytometry experiment of TaG-EM cells with or without additional hexameric GFP, as well as FSC/SSC and fluorescence scatter plots for the FACS steps that they performed prior to scRNA-seq, at least in supplementary figures.
We have added Supplemental Figures with the FACS data for all of the single cell sequencing data presented in the manuscript (Supplemental Figures 12 and 14).
• The authors should show the whole data described in L229, including the cluster that they chose to delete. At least, they should provide more information about how many cells were removed. In any case, the fact that their data still contains a large number of debris and dead cells despite sorting out PI negative cells with FACS and filtering low abundance barcodes with Cellranger is concerning.
This description was referring to the unprocessed Cellranger output (not filtered for low abundance barcodes). Prior to filtering for cell barcodes with high mitochondria or rRNA (or other processing in Seurat/Scanpy), we saw two clusters, one with low UMI counts and enrichment of mitochondrial genes (see Cellranger report below).
Author response image 1.
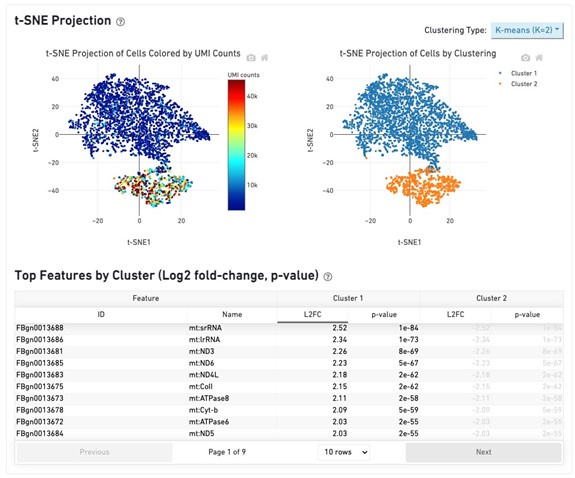
These cell barcodes were removed by downstream quality filtering and the remaining cells showed expression of expected intestinal stem cell and enteroblast marker genes.
Overall, although a method for genetic tagging cell populations prior to multiplexing in single-cell experiments would be extremely useful, the method presented here is inadequate. However, despite all the weaknesses listed above, the idea of barcodes expressed specifically in cells of interest deserves more consideration. If the authors manage to improve their design to resolve the major issues and demonstrate the benefits of their method more clearly, then TaG-EM could become an interesting option for certain applications.
We thank the reviewer for this comment and hope that the above responses and additional experiments and data that we have added have helped to alleviate the noted weaknesses.
Reviewer #2 (Public Review):
In this manuscript, Mendana et al developed a multiplexing method - Targeted Genetically-Encoded Multiplexing or TaG-EM - by inserting a DNA barcode upstream of the polyadenylation site in a Gal4-inducible UAS-GFP construct. This Multiplexing method can be used for population-scale behavioral measurements or can potentially be used in single-cell sequencing experiments to pool flies from different populations. The authors created 20 distinctly barcoded fly lines. First, TaG-EM was used to measure phototaxis and oviposition behaviors. Then, TaG-EM was applied to the fly gut cell types to demonstrate its applications in single-cell RNA-seq for cell type annotation and cell origin retrieving.
This TaG-EM system can be useful for multiplexed behavioral studies from nextgeneration sequencing (NGS) of pooled samples and for Transcriptomic Studies. I don't have major concerns for the first application, but I think the scRNA-seq part has several major issues and needs to be further optimized.
Major concerns:
(1) It seems the barcode detection rate is low according to Fig S9 and Fig 5F, J and N. Could the authors evaluate the detection rate? If the detection rate is too low, it can cause problems when it is used to decode cell types.
See responses to Reviewer #1 on this topic above.
(2) Unsuccessful amplification of TaG-EM barcodes: The authors attempted to amplify the TaG-EM barcodes in parallel to the gene expression library preparation but encountered difficulties, as the resulting sequencing reads were predominantly offtarget. This unsuccessful amplification raises concerns about the reliability and feasibility of this amplification approach, which could affect the detection and analysis of the TaG-EM barcodes in future experiments.
As noted above, we have now established a successful amplification protocol for the TaG-EM barcodes. This data is shown in Figure 6, and Supplemental Figures 18-19 and we have included a detailed information in the methods for performing TaG-EM barcode enrichment during 10x library prep. We have also included code in the paper’s Github repository for assigning TaG-EM barcodes from the enriched library to the associated 10x Genomics cell barcodes.
(3) For Fig 5, the singe-cell clusters are not annotated. It is not clear what cell types are corresponding to which clusters. So, it is difficult to evaluate the accuracy of the assignment of barcodes.
We have added annotation information for the cell clusters based on expression of cell-type-specific marker genes (Figure 6A, Supplemental Figures 16-17).
(4) The scRNA-seq UMAP in Fig 5 is a bit strange to me. The fly gut epithelium contains only a few major cell types, including ISC, EB, EC, and EE. However, the authors showed 38 clusters in fig 5B. It is true that some cell types, like EE (Guo et al., 2019, Cell Reports), have sub-populations, but I don't expect they will form these many subtypes. There are many peripheral small clusters that are not shown in other gut scRNAseq studies (Hung et al., 2020; Li et al., 2022 Fly Cell Atlas; Lu et al., 2023 Aging Fly Cell Atlas). I suggest the authors try different data-processing methods to validate their clustering result.
For all of the single cell experiments, after doublet and ambient RNA removal (as suggested below), we have reclustered the datasets and evaluated different resolutions using Clustree. As the Reviewer points out, there are different EE subtypes, as well as regionalized expression differences in EC and other cell populations, so more than four clusters are expected (an analysis of the adult midgut identified 22 distinct cell types). With this revised analysis our results more closely match the cell populations observed in other studies (though it should be noted that the referenced studies largely focus on the adult and not the larval stage).
(5) Different gut drivers, PMC-, PC-, EB-, EC-, and EE-GAL4, were used. The authors should carefully characterize these GAL4 expression in larval guts and validate sequencing data. For example, does the ratio of each cell type in Fig 5B reflect the in vivo cell type ratio? The authors used cell-type markers mostly based on the knowledge from adult guts, but there are significant morphological and cell ratio differences between larval and adult guts (e.g., Mathur...Ohlstein, 2010 Science).
We have characterized the PC driver which is highlighted in Supplemental Figure 13, and the EC and EE drivers which are highlighted in Figure 6G-N in detail in larval guts and have added this data to the paper (Supplemental Figure 21). The EB driver was not characterized histologically as EB-specific antibodies are not currently available. The PMG-Gal4 line exhibits strong expression throughout the larval gut (Figure 5B and barcodes are recovered from essentially all of the larval gut cell clusters using this driver (Supplemental Figure 20). We don’t necessarily expect the ratios of cells observed in the scRNA-Seq data to reflect the ratios typically observed in the gut as we performed pooled flow sorting on a multiplexed set of eight genotypes and driver expression levels, flow sorting, and possibly other processing steps could all influence the relative abundance of different cell types. However, detailed characterization of these driver lines did reveal spatial expression patterns that help explain aspects of the scRNA-Seq data. We have also added the following text to the paper to further describe the characterization of the drivers:
Results:
“Detailed characterization of the EC-Gal4 line indicated that although this line labeled a high percentage of enterocytes, expression was restricted to an area at the anterior and middle of the midgut, with gaps between these regions and at the posterior (Supplemental Figure 21). This could explain the absence of subsets of enterocytes, such as those labeled by betaTry, which exhibits regional expression in R2 of the adult midgut (Buchon et al., 2013).”
“Detailed characterization of the EE-Gal4 driver line indicated that ~80-85% of Prospero-positive enteroendocrine cells are labeled in the anterior and middle of the larval midgut, with a lower percentage (~65%) of Prospero-positive cells labeled in the posterior midgut (Supplemental Figure 21). As with the enterocyte labeling, and consistent with the Gal4 driver expression pattern, the EE-Gal4 expressed TaG-EM barcode 9 did not label all classes of enteroendocrine cells and other clusters of presumptive enteroendocrine cells expressing other neuropeptides such as Orcokinin, AstA, and AstC, or neuropeptide receptors such as CCHa2 (not shown) were also observed.”
Methods:
“Dissection and immunostaining
Midguts from third instar larvae of driver lines crossed to UAS-GFP.nls or UAS-mCherry were dissected in 1xPBS and fixed with 4% paraformaldehyde (PFA) overnight at 4ºC. Fixed samples were washed with 0.1% PBTx (1xPBS + 0.1% Triton X-100) three times for 10 minutes each and blocked in PBTxGS (0.1% PBTx + 3% Normal Goat Serum) for 2–4 hours at RT. After blocking, midguts were incubated in primary antibody solution overnight at 4ºC. The next day samples were washed with 0.1% PBTx three times for 20 minutes each and were incubated in secondary antibody solution for 2–3 hours at RT (protected from light) followed by three washes with 0.1% PBTx for 20 minutes each. One µg/ml DAPI solution prepared in 0.1% PBTx was added to the sample and incubated for 10 minutes followed by washing with 0.1% PBTx three times for 10 minutes each. Finally, samples were mounted on a slide glass with 70% glycerol and imaged using a Nikon AX R confocal microscope. Confocal images were processed using Fiji software.
The primary antibodies used were rabbit anti-GFP (A6455,1:1000 Invitrogen), mouse anti-mCherry (3A11, 1:20 DSHB), mouse anti-Prospero (MR1A, 1:50 DSHB) and mouse anti-Pdm1 (Nub 2D4, 1:30 DSHB). The secondary antibodies used were goat antimouse and goat anti-rabbit IgG conjugated to Alexa 647 and Alexa 488 (1:200) (Invitrogen), respectively. Five larval gut specimens per Gal4 line were dissected and examined.”
(6) Doublets are removed based on the co-expression of two barcodes in Fig 5A. However, there are also other possible doublets, for example, from the same barcode cells or when one cell doesn't have detectable barcode. Did the authors try other computational approaches to remove doublets, like DoubleFinder (McGinnis et al., 2019) and Scrublet (Wolock et al., 2019)?
We have included DoubleFinder-based doublet removal in our data analysis pipeline. This is now described in the methods (see below).
(7) Did the authors remove ambient RNA which is a common issue for scRNA-seq experiments?
We have also used DecontX to remove ambient RNA. This is now described in the methods:
“Datasets were first mapped and analyzed using the Cell Ranger analysis pipeline (10x Genomics). A custom Drosophila genome reference was made by combining the BDGP.28 reference genome assembly and Ensembl gene annotations. Custom gene definitions for each of the TaG-EM barcodes were added to the fasta genome file and .gtf gene annotation file. A Cell Ranger reference package was generated with the Cell Ranger mkref command. Subsequent single-cell data analysis was performed using the R package Seurat (Satija et al., 2015). Cells expressing less than 200 genes and genes expressed in fewer than three cells were filtered from the expression matrix. Next, percent mitochondrial reads, percent ribosomal reads cells counts, and cell features were graphed to determine optimal filtering parameters. DecontX (Yang et al., 2020) was used to identify empty droplets, to evaluate ambient RNA contamination, and to remove empty cells and cells with high ambient RNA expression. DoubletFinder (McGinnis et al., 2019) to identify droplet multiplets and remove cells classified as multiplets. Clustree (Zappia and Oshlack, 2018) was used to visualize different clustering resolutions and to determine the optimal clustering resolution for downstream analysis. Finally, SingleR (Aran et al., 2019) was used for automated cell annotation with a gut single-cell reference from the Fly Cell Atlas (Li et al., 2022). The dataset was manually annotated using the expression patterns of marker genes known to be associated with cell types of interest. To correlate TaG-EM barcodes with cell IDs in the enriched TaG-EM barcode library, a custom Python script was used (TaGEM_barcode_Cell_barcode_correlation.py), which is available via Github: https://github.com/darylgohl/TaG-EM.”
(8) Why does TaG-EM barcode #4, driven by EC-GAL4, not label other classes of enterocyte cells such as betaTry+ positive ECs (Figures 5D-E)? similarly, why does TaG-EM barcode #9, driven by EE-GAL4, not label all EEs? Again, it is difficult to evaluate this part without proper data processing and accurate cell type annotation.
As noted in the response to a comment by Reviewer #1 above, part of this apparent sparsity of labeling is due to the way that this experiment was designed and visualized. We have added a new Figure panel in both Figure 6B and Supplemental Figure 17B that shows the overall detection of barcodes in the enriched barcode library and gene expression library or the gene expression library only, respectively, to better illustrate the efficacy of barcode detection. See also the response to point 5 above. Both the lack of labelling of betaTry+ ECs and subsets of EEs is consistent with the expression patterns of the EC-Gal4 and EE-Gal4 drivers.
(9) For Figure 2, when the authors tested different combinations of groups with various numbers of barcodes. They found remarkable consistency for the even groups. Once the numbers start to increase to 64, barcode abundance becomes highly variable (range of 12-18% for both male and female). I think this would be problematic because the differences seen in two groups for example may be due to the barcode selection rather than an actual biologically meaningful difference.
While there is some barcode-to-barcode variability for different amplification conditions, the magnitude of this variation is relatively consistent across the conditions tested. We looked at the coefficient of variation for the evenly pooled barcodes or for the staggered barcodes pooled at different relative levels. While the absolute magnitude of the variation is higher for the highly abundant barcodes in the staggered conditions, the CVs for these conditions (0.186 for female flies and for 0.163 male flies) were only slightly above the mean CV (0.125) for all conditions (see Supplemental Figure 3):
We have added this analysis as Supplemental Figure 3 and added the following text to the paper:(
“The coefficients of variation were largely consistent for groups of TaG-EM barcodes pooled evenly or at different levels within the staggered pools (Supplemental Figure 3).”
(10) Barcode #14 cannot be reliably detected in oviposition experiment. This suggests that the BC 14 fly line might have additional mutations in the attp2 chromosome arm that affects this behavior. Perhaps other barcode lines also have unknown mutations and would cause issues for other untested behaviors. One possible solution is to backcross all 20 lines with the same genetic background wild-type flies for >7 generations to make all these lines to have the same (or very similar) genetic background. This strategy is common for aging and behavior assays.
See response to Reviewer #1 above on this topic.
Reviewer #3 (Public Review):
The work addresses challenges in linking anatomical information to transcriptomic data in single-cell sequencing. It proposes a method called Targeted Genetically-Encoded Multiplexing (TaG-EM), which uses genetic barcoding in Drosophila to label specific cell populations in vivo. By inserting a DNA barcode near the polyadenylation site in a UASGFP construct, cells of interest can be identified during single-cell sequencing. TaG-EM enables various applications, including cell type identification, multiplet droplet detection, and barcoding experimental parameters. The study demonstrates that TaGEM barcodes can be decoded using next-generation sequencing for large-scale behavioral measurements. Overall, the results are solid in supporting the claims and will be useful for a broader fly community. I have only a few comments below:
We thank the reviewer for these positive comments.
Specific comments:
(1) The authors mentioned that the results of structure pool tests in Fig. 2 showed a high level of quantitative accuracy in detecting the TaG-EM barcode abundance. Although the data were generally consistent with the input values in most cases, there were some obvious exceptions such as barcode 1 (under-represented) and barcodes 15, 20 (overrepresented). It would be great if the authors could comment on these and provide a guideline for choosing the appropriate barcode lines when implementing this TaG-EM method.
See the response to point 9 from Reviewer 2. Although there seem to be some systematic differences in barcode amplification, the coefficient of variation was relatively consistent across all of the barcode combinations and relative input levels that we examined. Our recommendation (described in the text) is to average across 3-4 independent barcodes (which yielded a R2 values of >0.99 with expected abundance in the structured pooled tests).
(2) In Supplemental Figure 6, the authors showed GFP antibody staining data with 20 different TaG-EM barcode lines. The variability in GFP antibody staining results among these different TaG-EM barcode lines concerns the use of these TaG-EM barcode lines for sequencing followed by FACS sorting of native GFP. I expected the native GFP expression would be weaker and much more variable than the GFP antibody staining results shown in Supplemental Figure 6. If this is the case, variation of tissue-specific expression of TaG-EM barcode lines will likely be a confounding factor.
Aside from barcode 8, which had a mutation in the GFP coding sequence, we did not see significant variability in expression levels either in the wing disc. Subtle differences seen in this figure most likely result from differences in larval staging. Similar consistent native (unstained) GFP expression of the TaG-EM constructs was seen in crosses with Mhc-Gal4 (described above).
(3) As the authors mentioned in the manuscript, multiple barcodes for one experimental condition would be a better experimental design. Could the authors suggest a recommended number of barcodes for each experiential condition? 3? 4? Or more?
See response to Reviewer #3, point number 1 above.
(3b) Also, it would be great if the authors could provide a short discussion on the cost of such TaG-EM method. For example, for the phototaxis assay, if it is much more expensive to perform TaG-EM as compared to manually scoring the preference index by videotaping, what would be the practical considerations or benefits of doing TaG-EM over manual scoring?
While this will vary depending on the assay and the scale at which one is conducting experiments, we have added an analysis of labor savings for the larval gut motility assay (Supplemental Figure 8). We have also added the following text to the Discussion describing some of the trade-offs to consider in assessing the potential benefit of incorporating TaG-EM into behavioral measurements:
“While the utility of TaG-EM barcode-based quantification will vary based on the number of conditions being analyzed and the ease of quantifying the behavior or phenotype by other means, we demonstrate that TaG-EM can be employed to cost-effectively streamline labor-intensive assays and to quantify phenotypes with small effect sizes (Figure 4, Supplemental Figure 8).”
Recommendations for the authors:
While recognising the potential of the TaG-EM methodology, we had a few major concerns that the authors might want to consider addressing:
As stated above, we are grateful to the reviewers and editor for their thoughtful comments. We have addressed many of the points below in our responses above, so we will briefly respond to these points and where relevant direct the reader to comments above.
(1) We were concerned about the efficacy of TaG-EM in assessing more complex behaviours than oviposition and phototaxis. We note that Barcode #14 cannot be reliably detected in oviposition experiment. This suggests that the BC 14 fly line might have additional mutations in the attp2 chromosome arm that affects this behavior. Perhaps other barcode lines also have unknown mutations and would cause issues for other untested behaviors. One possible solution is to back-cross all 20 lines with the same genetic background wild-type flies for >7 generations to make all these lines to have the same (or very similar) genetic background. This strategy is common for aging and behavior assays.
See response to Reviewer #1 and Reviewer #2, item 10, above.
(2) We were unable to assess the drop-out rates of the TaG-EM barcode from the sequencing. The barcode detection rate is low (Fig S9 and Fig 5F, J and N). This would be a considerable drawback (relating to both experimental design and cost), if a large proportion of the cells could not be assigned an identity.
See comments above addressing this point.
(3) The effectiveness of TaG-EM scRNA-seq on the larvae gut is not very effective - the cells are not well annotated, the barcodes seem not to have labelled expected cell types (ECs and EEs), and there is no validation of the Gal4 drivers in vivo.
See previous comments. We have addressed specific comments above on data processing and annotation, included a visualization of the overall effectiveness of labeling, added a protocol and data on enriched TaG-EM barcode libraries, and have added detailed characterization of the Gal4 drivers in the larval gut (Figure 6, Supplemental Figures 17-21).
(4) A formal assessment of the cost-effectiveness would be an important consideration in broad uptake of the methodology.
While this is difficult to do in a comprehensive manner given the breadth of potential applications, we have included estimates of labor savings for one of the behavioral assays that we tested (Supplemental Figure 8). We have also included a discussion of some of the factors that would make TaG-EM useful or cost-effective to apply for behavioral assays (see response to Reviewer #3, comment 3b, above). We have also added the following text to the discussion to address the cost considerations in applying TaG-EM for scRNA-Seq:
“For single cell RNA-Seq experiments, the cost savings of multiplexing is roughly the cost of a run divided by the number of independent lines multiplexed, plus labor savings by also being able to multiplex upstream flow cytometry, minus loss of unbarcoded cells. Our experiments indicated that for the specific drivers we tested TaG-EM barcodes are detected in around one quarter of the cells if relying on endogenous expression in the gene expression library, though this fraction was higher (~37%) if sequencing an enriched TaG-EM barcode library in parallel (Figure 6, Supplemental Figures 18-19).”
(5) Similarly, a formal assessment of the effect of the insertion on the variability in GFP expression and the behaviour needs to be documented.
See responses to Reviewer #1, Reviewer #2, item 9, and Reviewer #3, item 2 above.
Reviewer #1 (Recommendations For The Authors):
(in no particular order of importance)
• L84-85: the authors should either expand, or remove this statement. Indeed, lack of replicates is only true if one ignores that each cell in an atlas is indeed a replicate. Therefore, depending on the approach or question, this statement is inaccurate.
This sentence was meant to refer to experiments where different experimental conditions are being compared and not to more descriptive studies such as cell atlases. We have revised this sentence to clarify.
“Outside of descriptive studies, these costs are also a barrier to including replicates to assess biological variability; consequently, a lack of biological replicates derived from independent samples is a common shortcoming of single-cell sequencing experiments.”
• L103-104: this sentence is unclear.
We have revised this sentence as follows:
“Genetically barcoded fly lines can also be used to enable highly multiplexed behavioral assays which can be read out using high throughput sequencing.”
• In Fig S1 it is unclear why there are more than 20 different sequences in panel B where the text and panel A only mention the generation of 20 distinct constructs. This should be better explained.
The following text was added to the Figure legend to explain this discrepancy:
“Because the TaG-EM barcode constructs were injected as a pool of 29 purified plasmids, some of the transgenic lines had inserts of the same construct. In total 20 unique lines were recovered from this round of injection.”
• It would be interesting to compare the efficiency of TaG-EM driven doublet removal (Fig 5A) with standard doublet-removing software (e.g., DoubletFinder, McGinnis et al., 2019).
We have done this comparison, which is now shown in Supplemental Figure 15.
• I would encourage the authors to check whether barcode representation in Fig S13 can be correlated to average library size, as one would expect libraries with shorter reads to be more likely to include the 14-bp barcode and therefore more accurately recapitulate TaG-EM barcode expression.
These are not independent sequencing libraries, but rather data from barcodes that were multiplexed in a single flow sort, 10x droplet capture, and sequencing library. Thus, there must be some other variable that explains the differential recovery of these barcodes.
• Fig 4A should appear earlier in the paper.
We have moved Figure 4A from the previous manuscript (a schematic showing the detailed design of the TaG-EM construct) to Figure 1A in the revised version.
Reviewer #2 (Recommendations For The Authors):
Minor:
(1) There is a typo for Fig S13 figure legends: BC1, BC1, BC3... should be BC1, BC2, BC3.
Fixed.
Reviewer #3 (Recommendations For The Authors):
Comments to authors:
(1) It would be great if the authors could provide an additional explanation on how these 29 barcode sequences were determined.
Response: This information is in the Methods section. For the original cloned plasmids:
“Expected construct size was verified by diagnostic digest with _Eco_RI and _Apa_LI. DNA concentration was determined using a Quant-iT PicoGreen dsDNA assay (Thermo Fisher Scientific) and the randomer barcode for each of the constructs was determined by Sanger sequencing using the following primers:
SV40_post_R: GCCAGATCGATCCAGACATGA
SV40_5F: CTCCCCCTGAACCTGAAACA”
For transgenic flies, after DNA extraction and PCR enrichment (details also in the Methods section):
“The barcode sequence for each of the independent transgenic lines was determined by Sanger sequencing using the SV40_5F and SV40_PostR primers.”
(2) Why did the authors choose myr-GFP as the backbone instead of nls-GFP if the downstream application is to perform sequencing?
We initially chose myr::GFP as we planned to conduct single cell and not single nucleus sequencing and myr::GFP has the advantage of labeling cell membranes which could facilitate the characterization or confirmation of cell type-specific expression, particularly in the nervous system. However, we have considered making a version of the TaG-EM construct with a nuclear targeted GFP (thereby enabling “NucEM”). In the Discussion, we mention this possibility as well as the possibility of using a second nuclear-GFP construct in conjunction with TaG-EM lines is nuclear enrichment is desired:
“In addition, while the original TaG-EM lines were made using a membrane-localized myr::GFP construct, variants that express GFP in other cell compartments such as the cytoplasm or nucleus could be constructed to enable increased expression levels or purification of nuclei. Nuclear labeling could also be achieved by co-expressing a nuclear GFP construct with existing TaG-EM lines in analogy to the use of hexameric GFP described above.”
Minor comments:
(1) Line 193, Supplemental Figure 4 should be Supplemental Figure 5
Fixed.
(2) Scale bars should be added in Figure 4, Supplemental Figures 6, 7, and 8A.
We have added scale bars to these figures and also included scale bars in additional Supplemental Figures detailing characterization of the gut driver lines.
(3) Were Figure 4C and Supplemental Figure 7 data stained with a GFP antibody?
No, this is endogenous GFP signal. This is now noted in the Figure legends.
(4) Line 220, specify the three barcode lines (lines #7, 8, 9) in the text.
Added this information.
Same for Lines 251-254. Line 258, which 8 barcode Gal4 line combinations?
(5) Line 994, typo: (BC1, BC1, BC3, and BC7)-> (BC1, BC2, BC3, and BC7)
Fixed.
(6) Figure 5 F, J and N, add EC-Gal4, EB-Gal4, and EE-Gal4 above each panel to improve readability.
We have added labels of the cell type being targeted (leftmost panels), the barcode, and the marker gene name to Figure 6 C-N.
Author response:
The following is the authors’ response to the original reviews.
Reviewer 1:
This research used cell-based signaling assay and Gaussian-accelerated molecular dynamics (GaMD) to study peptide-mediated signaling activation of Polycystin-1 (PC1), which is responsible for the majority of autosomal dominant polycystic kidney disease (ADPKD) cases. Synthetic peptides of various lengths derived from the N-terminal portion of the PC1 C-terminal fragment (CTF) were applied to HEK293T cells transfected with stalkless mouse CTF expression construct. It was shown that peptides including the first 7, 9, and 17 residues of the N-terminal portion could activate signaling to the NFAT reporter. To further understand the underlying mechanism, docking and peptide-GaMD simulations of peptides composed of the first 9, 17, and 21 residues from the N-terminal portion of the human PC1 CTF were performed. These simulations revealed the correlation between peptide-CTF binding and PC1 CTF activation characterized by the close contact (salt bridge interaction) between residues R3848 and E4078. Finally, a Potts statistical model was inferred from diverged PC1 homologs to identify strong/conserved interacting pairs within PC1 CTF, some of which are highly relevant to the findings from the peptide GaMD simulations. The peptide binding pockets identified in the GaMD simulations may serve as novel targets for the design of therapeutic approaches for treating ADPKD.
We greatly appreciate the reviewer’s encouraging and positive comments. The reviewer’ specific comments are addressed pointwise below and changes to the text will be highlighted in yellow in the revised manuscript.
(1) The GaMD simulations all include exogenous peptides, thus lacking a control where no such peptide is present (and only stalkless CTF). An earlier study (PNAS 2022 Vol. 119 No. 19 e2113786119) covered this already, but it should be mentioned here that there was no observation of close/activation for the stalkless CTF.
We appreciate the reviewer’s concern about the lack of a control where no exogenous peptide is present. As suggested by the reviewer, we are adding more details about the study on the stalkless CTF as a control in the Introduction of the revised manuscript.
(2) Although 5 independent trajectories were generated for each peptide, the authors did not provide sufficient details regarding the convergence of the simulation. This leaves some uncertainties in their results. Given that the binding poses changed relative to the starting docked poses for all three peptides, it is possible that some other binding pockets and/or poses were not explored.
We appreciate the reviewer’s comment regarding the convergence of the simulation results. This is clarified in the revised manuscript as:
“We have calculated free energy profiles of individual simulations for each system, including the p9, p17, and p21, as shown below (Figs. S5, S6 and S8). For the p9 peptide, the “Bound” lowenergy state was consistently identified in the 2D free energy profile of each individual simulation (Fig. S5). For the p17 peptide, Pep-GaMD simulations were able to refine the peptide conformation from the "Unbound” to the "Intermediate” and “Bound” states in Sim1 and Sim5, while the peptide reached only the "Intermediate” state in the other three simulations (Fig. S6). For the p21 peptide, Pep-GaMD was able to refine the peptide docking conformation to the
"Bound” state in all the five individual simulations (Fig. S8).”
“It is important to note that the free energy profiles calculated from GaMD simulations of PC1 CTF were not fully converged since certain variations were observed among the individual simulations. Nevertheless, these calculations allowed us to identify representative low-energy binding conformations of the peptides.”
(3) The free energy profiles (Figures 2 to 4) based on the selected coordinates provide important information regarding binding and CTF conformational change. However, it is a coarsegrained representation and complementary analysis such as RDFs, and/or contact maps between the peptide and CTF residues might be helpful to understand the details of their interactions. These details are currently only available in the text.
Following the reviewer's suggestion, we have now included a set of protein contact maps showing contacts between the peptides and the TOP domain for each peptide in the representative "Bound” state in revised Supplementary Information (Fig. S4). The contact maps serve to visualize the list of contacts mentioned in the main text. This will be clarified in the revised manuscript.
(4) The use of a stalkless CTF is necessary for studying the functions of the exogenous peptides. However, the biological relevance of the stalkless CTF to ADPKD was not clearly explained, if any.
We appreciate the reviewer’s comment. As correctly assessed by the reviewer, the stalkless CTF is not a biological form of PC1 observed in ADPKD, but rather was used as the simplest or least complex system in which the activities and binding of exogenous peptides could be studied. However, in ADPKD, there are numerous missense mutations reported within the GPCR autoproteolysis-inducing (GAIN) domain that have been shown to prevent or inhibit cleavage at the GPCR-coupled proteolysis site (GPS). Loss of PC1 GPS cleavage, which is known to cause ADPKD, would retain or sequester the stalk tethered agonist within the interior of the GAIN domain, which would presumably interfere with interactions between stalk tethered agonist residues and the remainder of the CTF. Furthermore, there are 10 single nucleotide polymorphisms reported within the stalk sequence (ADPKD Variant Database; https://pkdb.mayo.edu/welcome), most of which we have found to significantly reduce CTF-mediated activation of the NFAT reporter (Magenheimer BS, et al., Constitutive signaling by the C-terminal fragment of polycystin1 is mediated by a tethered peptide agonist; bioRxiv 2021.08.05.455255). In particular, the ADPKD-associated G3052R stalk mutation that was analyzed along with the stalkless CTF by GaMD simulations (Pawnikar et al, PNAS, 2022) has the same reduction in activity as the stalkless CTF in the cellular signaling reporter assays and the same loss of closed conformation interactions in GaMD analyses. As such, we believe the stalkless CTF has biological relevance from the aspect that it mimics the deficiency in signaling activation observed for PC1 CTF stalk mutants. This is clarified in the revised manuscript in the Introduction, page 5, “constructs encoding a stalkless PC1 CTF (a nonbiological mutant of PC1 with deletion of the first 21 N-terminal residues of CTF) and three ADPKD-associated…”) and near the beginning of the Discussion, page 16, where the biological relevance of studying the stalkless CTF is explained
(5) The authors might want to clarify if a stalkless CTF is commonly seen in ADPKD, or if it is just a construct used for this study.
The stalkless CTF is not a biological form of PC1, but rather a construct used for this study. This was clarified in the revised manuscript (see response above).
(6) (Pages 7-8) "...we generated expression constructs of mouse (m) PC1 consisting of the CD5 signal peptide sequence fused in frame with the stalk sequence of mCTF ...". What is the CD5 signal peptide sequence here? What is its use?
The CD5 signal peptide sequence is “MPMGSLQPLATLYLLGMLVASVLG” from the T cell surface glycoprotein, CD5. Since the N-terminus of PC1 CTF is derived from a posttranslational, autocatalytic, endoproteolytic cleavage event, this isoform is already membraneembedded and therefore lacks its endogenous signal peptide. The CD5 signal peptide coding sequence is added to the PC1 CTF expression constructs in order to ensure translation and insertion of the encoded protein at the endoplasmic reticulum. Additional details were added to the Experimental Procedures, page 2 of Supporting Information.
(7) (Page 8) "All peptides were appended with a C-terminal, 7-residue hydrophilic sequence (GGKKKKK) to increase solubility". How did the authors make sure that this sequence has no influence on the signaling?
To determine the possible effect of the hydrophilic GGKKKKK sequence on signaling, we had a ‘solubility tag’ peptide (LGGKKKKK) synthesized and purified by GenScript. It was necessary to add an N-terminal Leu residue to the 7-residue hydrophilic tag sequence in order for the highly hydrophilic peptide to be recovered. Effect of treatment with the solubility tag peptide on activation of the NFAT reporter was assessed for both empty vector- and ∆stalkCTF-transfected cells in 3 separate signaling experiments (see figure below). Each experiment also included a negative control treatment (no peptide/culture medium only addition) and a positive control treatment (stalk peptide p17). The p17 peptide we had available was derived from the stalk sequence of human PC1 that differs from the mouse PC1 sequence at residues 15 and 17, which are two poorly conserved positions within the stalk sequence (see Reviewer 2, Response 3). In the first experiment with the solubility tag and human p17 peptides (B in figure below), we inadvertently used the empty expression vector and ∆stalkCTF expression construct from mouse PC1. After realizing our error, we then performed 2 additional signaling experiments (C and D in figure below) with the ‘correct’ human ∆stalkCTF expression construct and empty vector. In the revised manuscript, we have provided the results from each of the 3 experiments as Fig. S2 (below).
(8) (Page 9) "Using a computational model of the ΔStalk PC1 CTF developed previously". The authors might want to expand here a little to give a short review about the structure preparation.
We appreciate the reviewer’s suggestion regarding the addition of details for structure preparation for Stalkless CTF. We have added these details in section “Docking and Pep-GaMD simulations of peptide agonist binding to stalkless PC1 CTF” on Page 10 in the revised manuscript: “The cryo-EM structure of human PC1-PC2 complex (PDB: 6A70) was used to build the computational model for WT PC1 CTF. As the protein had several missing regions including the Stalk and several loops, homology modeling of the missing regions was done using I-TASSER web server. Using the WT PC1 CTF model, computational model for ΔStalk was generated by deleting the first 21 residues (3049-3069) of the WT PC1 and using the structure for stalkless CTF, we successfully docked the p9, p17 and p21 stalk peptides with HPEPDOCK. The peptides all bound to the TOP domain and the interface between the TOP domain and extracellular loop 1 (ECL1) of CTF.”
(9) How was "contact" defined when counting the number of contacts used in the 2D PMFs (Figures 2-4). Response: We appreciate the reviewer’s comment regarding the definition of the number of contacts used in the 2D PMFs. This has been clarified in the revised manuscript as: “The number of contacts is calculated between any atom pairs within 4 Å distance of the peptide and extracellular domains of PC1 protein.”
(10) How was the ranking of GaMD clusters done? It looks from Figure 3A that the "intermediate" state is more favorable compared to the "bound" state, but it was claimed in the text the "bound" state was ranked 1st.
Thanks to the reviewer for this comment. It has been clarified in the revised
Supplementary Information: “Three independent Pep-GaMD simulations were combined to perform structural clustering using the hierarchical agglomerative clustering algorithm in CPPTRAJ. A 3 Å RMSD cutoff was used for each peptide system. PyReweighting was then applied to calculate the original free energy values of each peptide structural cluster with a cutoff of 500 frames. The structural clusters were finally ranked according to the reweighted free energy values.” And in the revised main text: “It is important to note that the free energy profiles calculated from GaMD simulations of PC1 CTF were not fully converged since certain variations were observed among the individual simulations. The free energy values of 2D PMF minima shown in Figure 3A could differ from those in the 1D PMF minima of peptide structural clusters, especially with the usage of distinct reaction coordinates. Nevertheless, these calculations allowed us to identify representative low-energy binding conformations of the peptides.”
(11) When mentioning residue pair distances, such as in the sentence "The distance between the TOP domain residue R3848 and PL residue E4078 was 3.8 Å (Fig. 4D)" on page 12, it should be clarified if these distances are average distance, or a statistical error can be given.
We appreciate the reviewer’s comment regarding the TOP Domain and PL distance between residues R3848-E4078. This has been clarified on page 14 in the revised manuscript as:
“The distance between the TOP domain residue R3848 and PL residue E4078 was 3.8 Å. The distance was extracted from the top-ranked structural cluster of the p21 bound to the ΔStalk CTF, corresponding to the “Closed/Active” low-energy conformational state. (Fig. 4E)”.
(12) More analysis of the GaMD can be performed. For example, the authors observed a single "bound" state for p21, but there must be some flexibility in the peptide and the protein itself. The authors might want to consider adding some plots illustrating the flexibility of the peptide residues (for example, a RMSD plot). Contact maps can also be added to visualize the results currently discussed in the text.
We thank the reviewer for their constructive suggestions. To characterize flexibility of the peptide and protein in the revised manuscript, we have added plots of the TOP-PL interaction distance between residues R3848-E4078 in PC1, the radius of gyration (Rg) of p21 and root-mean square deviation (RMSD) of p21 relative to the starting HPEPDOCK conformation of the peptide in the new Fig. S7. The peptide-protein contact map has also been added in the new Fig. S4.
(13) (Page 7) In the sentence `...sampled the "Closed/Active" low-energy state relative to the large number of Stalk-TOP contacts`, I suggest using "related to" instead of "relative to"
We thank the reviewer for the comment, and we have replaced "relative to" to “related to” in the following sentence `...sampled the "Closed/Active" low-energy state relative to the large number of Stalk-TOP contacts`
(14) (Page 7) In the sentence `Our previous study utilized expression constructs of human PC1 CTF, however, in order to prepare for ...`, "PC1 CTF, however," -> "PC1 CTF. However,"
We thank the reviewer for the comment, and we have replaced "PC1 CTF, however," to "PC1 CTF. However," in the following sentence `Our previous study utilized expression constructs of human PC1 CTF, however, in order to prepare for ...`.
Reviewer 2:
The autosomal dominant polycystic kidney disease (ADPKD) is a major form of polycystic kidney disease (PKD). To provide better treatment and avoid side effects associated with currently available options, the authors investigated an interesting GPCR, polycystin-1 (PC1), as a potential therapeutic target. In vitro and in silico studies were combined to identify peptide agonists for PC1 and to elucidate their roles in PC1 signaling. Overall, regarding the significance of the findings, this work described valuable peptide agonists for PC1 and the combined in vitro and in silico approach can be useful to study a complex system like PC1. However, the strength of the evidence is incomplete, as more experiments are needed as controls to validate the computational observations. The work appears premature.
We greatly appreciate the reviewer’s encouraging and positive comments. The reviewer’ specific comments are addressed pointwise below and changes to the text will be highlighted in yellow in the revised manuscript.
(1) The therapeutic potential of PC1 peptide agonists is unclear in the introduction. For example, while the FDA-approved drug Jynarque was mentioned, the text was misleading as it sounded like Jynarque targeted PC1. In fact, it targets another GPCR, the vasopressin receptor 2 (V2). A clear comparison of targeting PC1 over V2 pathways and their therapeutic relevance can help the readers better understand the importance of this work. Importantly, a clear background on the relationship between PC1 agonism and treatments for ADPKD is necessary.
We understand the confusion that was caused by the brevity of our introductory paragraph and will clarify the differences in therapeutic targeting between Jynarque and our PC1 stalk-derived peptides in the revised manuscript. We will also expound on the rationale for targeting PC1 agonism as a therapeutic approach for ADPKD versus Jynarque. For example: It is known that ADPKD disease severity is dependent on the functional levels of PC1. Jynarque is a small molecule antagonist of the arginine vasopressin receptor 2, V2R, whose signaling, and production of cAMP has been shown to be increased in ADPKD. As this drug targets one of the downstream aberrant pathways, it is only capable of slowing disease progression and has numerous undesirable side effects. We reasoned that a therapeutic agent capable of stimulating and thus augmenting PC1 signaling function would be a safer, cyst initiation-proximal treatment capable of preventing cyst formation with few side effects.
(2) PC1 is a complex membrane protein, and most figures focus on the peptide-binding site. For general readers (or readers that did not read the previous PNAS publication), it is hard to imagine the overall structure and understand where the key interactions (e.g., R3848-E4078) are in the protein and how peptide binding affects locally and globally. I suggest enhancing the illustrations.
We thank the reviewer for the constructive comment on adding more illustrations for the PC1 protein to understand the overall structure and the location of the key interaction R3848E4078. We have included these suggestions and modified the main figures in the revised manuscript.
(3) The authors used the mouse construct for the cellular assays and the peptide designs in preparation for future in vivo assays. This is helpful in understanding biology, but the relevance of drug discovery is weakened. Related to Point 1, the therapeutic potential of PC1 peptide agonist is largely missing.
The therapeutic potential of a PC1 peptide agonist is addressed in response #1 above. As mentioned in the manuscript and recognized by the reviewer, the cellular signaling assays were performed with the mouse PC1 CTF expression construct and with peptides based on the mouse PC1 stalk sequence for future, pre-clinical studies, while the peptide binding studies were performed with the human PC1 stalk sequence. We feel the relevance for drug discovery is not significantly weakened for a number of reasons: 1) as shown in Fig. 1A, the stalk sequence is highly conserved between mouse and human PC1, specifically there are only 2 residue differences present within peptides p17 and p21. One of the differences is a ‘semi-conservative’ Gln-Arg substitution at peptide residue 15, while the second difference is a conservative Ile-Val substitution at peptide residue 17; 2) we have found that an Arg to Cys mutation within the mouse PC1 CTF stalk has the same effect on signaling as the corresponding human Gln to Cys ADPKD-associated mutation which was analyzed in Pawnikar et al., 2022; and 3) both peptide residues 15 and 17 represent highly variable positions within the PC1 stalk as shown in the sequence logo (below) of the stalk sequence from 16 vertebrate species; and 4) while addressing the potential effect of the hydrophilic solubility tag on stalk peptide-mediated rescue of CTF∆stalk signaling (see Reviewer 1 comments, point #7), we utilized the ‘human’ version of p17 as a positive control and tested its activation with both mouse and human CTF∆stalk expression constructs and found that human p17 peptide was also capable of stimulating the mouse CTF∆stalk protein (Fig. S2).
Author response image 1.
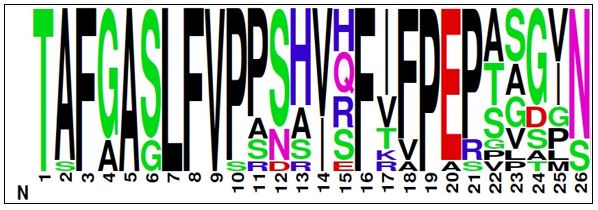
(4) More control experiments are needed. For example, a 7-residue hydrophilic sequence (GGKKKKK) is attached to the peptide design to increase solubility. This 7-residue peptide should be tested for PC1 activation as a control. Second, there is no justification for why the peptide design must begin with residue T3041. Can other segments of the stalk also be agonists?
As mentioned above for Reviewer 1, the hydrophilic peptide has been synthesized and tested for activation of signaling by the stalkless CTF in the revised manuscript as Fig. S2. The design of peptides that begin with residue T3041 of mouse PC1 CTF is modeled on numerous similar studies for the family of adhesion GPCRs. Optimization of the binding and activity of the PC1 peptide agonist will be investigated in future studies and could include such parameters as whether the peptide must include the first residue and whether subsegments of the stalk are also agonists, however, we feel these questions are beyond the scope of this initial report.
(5) There are some major concerns about the simulations: The GaMD simulations showed different binding sites of p-21, p-17, and p-9, and the results report the simulated conformations as "active conformational states". However, these are only computational findings without structural biology or mutagenesis data to validate. Further, neither docking nor the simulation data can explain the peptide SAR. Finally, it will be interesting if the authors can use docking or GaMD and explain why some peptide designs (like P11-P15) are less active (as control simulations).
The reviewer brings up an important observation regarding differences in binding sites between peptides p9, p17 and p21. We will include discussion of this observation and our interpretations to the revised manuscript. While the present study is focused on identification of initial peptides that are able to activate the PC1 CTF, we shall include further mutation experiments and simulations, peptide SAR and optimization of the lead peptides in future studies. This has been clarified in the revised manuscript.
(6) Additional experiments for the controls and for validating the simulations. Additional simulations to explain the SAR.
We appreciate the reviewer’s comment for additional experiments for the controls and additional simulations to explain the SAR. For future studies, we shall include further mutation experiments and simulations, peptide SAR and optimization of the lead peptides.
(7) What is the selectivity of the peptides between PC1 and PC2?
We have not tested the selectivity of the peptides for PC1 versus PC2 primarily because transfection of PC2 does not activate the NFAT reporter. However, it is possible that co-transfection of PC2 with the PC1 CTF could alter stalk peptide binding. This will be important to consider in future studies.
Reviewer 3:
The authors demonstrate the activation of Polycystin-1 (PC1), a G-protein coupled receptor, using small peptides derived from its original agonist, the stalk TA protein. In the experimental part of the study, the authors performed cellular assays to check the peptide-induced reactivation of a mutant form of PC1 which does not contain the stalk agonist. The experimental data is supported by computational studies using state-of-the-art Gaussian accelerated Molecular Dynamics (GaMD) and bioinformatics analysis based on sequence covariance. The computer simulations revealed the mechanistic details of the binding of the said peptides with the mutant PC1 protein and discovered different bound, unbound, and intermediate conformations depending on the peptide size and sequence. The use of reliable and well-established molecular simulation algorithms and the physiological relevance of this protein autosomal dominant polycystic kidney disease (ADPKD) make this work particularly valuable.
We greatly appreciate the reviewer’s encouraging and positive comments. The reviewer’ specific comments are addressed pointwise below and changes to the text will be highlighted in yellow in the revised manuscript.
(1) No control has been used for the computational (GaMD) study as the authors only report the free energy surface for 3 highly agonistic peptides but for none of the other peptides that did not induce an agonistic effect. Therefore, in the current version, the reliability of the computational results is not foolproof.
We appreciate the reviewer’s concern about the lack of control with the other peptides that did not induce an agonistic effect. To address the reviewer’s concern, we have included more details on the study of the stalkless CTF and the solubility tag peptide (Fig. S2) as controls in the revised manuscript.
(2) All discussions about the residue level interactions focused only on geometric aspects (distance, angle, etc) but not the thermodynamic aspect (e.g. residue-wise interaction energy). Considering they perform a biased simulation; the lack of interaction energy analysis only provides a qualitative picture of the mechanism.
As mentioned by the reviewer, we have added MM/PBSA analysis results in the revised manuscript and SI.
Molecular Mechanics/Poisson-Boltzmann Surface Area (MM/PBSA) analysis was performed to calculate the binding free energies of peptides p9, p17 and p21 to PC1 CTF. The analysis was performed using the trajectory in which the peptide was bound to the receptor. In MM/PBSA, the binding free energy of the ligand (L) to the receptor (R) to form the complex (RL) is calculated as:

where GRL is the Gibbs free energy of the complex RL, GR is the Gibbs free energy of the molecule R in its unbound state and GL is the Gibbs free energy of the molecule L in its unbound state, respectively.
𝛥𝐺𝑏𝑖𝑛𝑑 can be divided into contributions of different interactions as:

in which


where ΔEMM , ΔGsol , 𝞓H and −TΔS are the changes in the gas-phase molecular mechanics (MM) energy, solvation free energy, enthalpy and conformational entropy upon ligand binding, respectively. ΔEMM includes the changes in the internal energies ΔEint (bond, angle and dihedral energies), electrostatic energies ΔEelec , and the van der Waals energies ΔEvdW. ΔGsol is the sum of the electrostatic solvation energy ΔGPB/GB (polar contribution) and the nonpolar contribution ΔGSA between the solute and the continuum solvent. The polar contribution is calculated using either the Poisson Boltzmann (PB) or Generalized Born (GB) model, while the nonpolar energy is usually estimated using the solvent-accessible surface area (SASA) where 𝞬 is surface tension coefficient and b is the constant offset. The change in conformational entropy −TΔS is usually calculated by normal-mode analysis on a set of conformational snapshots taken from MD simulations. However, due to the large computational cost, changes in the conformational entropy are usually neglected as we were concerned more on relative binding free energies of the similar peptide ligands.
MM/PBSA analysis was performed using the gmx_MMPBSA software with the following command line:
gmx_MMPBSA -O -i mmpbsa.in -cs com.tpr -ci index.ndx -cg 1 13 -ct com_traj.xtc -cp topol.top -o FINAL_RESULTS_MMPBSA.dat -eo FINAL_RESULTS_MMPBSA.csv Input file for running MM/PBSA analysis:
&general
sys_name="Prot-Pep-CHARMM",
startframe=1, endframe=200, # In gmx_MMPBSA v1.5.0 we have added a new PB radii set named charmm_radii.
# This radii set should be used only with systems prepared with CHARMM force fields.
# Uncomment the line below to use charmm_radii set
# PBRadii=7,
/
&pb
# radiopt=0 is recommended which means using radii from the prmtop file for both the PB calculation and for the NP
# calculation
istrng=0.15, fillratio=4.0, radiopt=0
The relative rank of the overall peptide binding free energies (Table S1) was consistent with the experimental signaling data, i.e., p21>p9>p17, for which p21 showed the largest binding free energy value of binding (-40.29±6.94 kcal/mol).
(3) It is not mentioned clearly whether the reader should interpret the free energy landscapes quantitatively or qualitatively. Considering no error analysis or convergence plots are reported for the GaMD free energy surfaces, it may be assumed the results are qualitative. The readers should consider this caveat and not try to quantitatively reproduce these free energy landscapes with other comparable techniques.
We appreciate the reviewer’s comment whether the free energy landscapes should be interpreted quantitatively or qualitatively. The presented free energy landscapes could be considered semi-quantitative since the simulations are not fully converged. This will be clarified in the revised manuscript as: “It is important to note that the free energy profiles calculated from GaMD simulations of PC1 CTF were not fully converged since certain variations were observed among the individual simulations. Nevertheless, these calculations allowed us to identify representative low-energy binding conformations of the peptides.”
(4) Energy decomposition analysis similar to the following paper (https://pubs.acs.org/doi/10.1021/bi201856m) should be provided to understand the residue level enthalpic contribution in the peptide-protein interaction.
As mentioned by the reviewer, we have performed residue-wise interaction energy analysis and included the analysis results in the revised manuscript and SI.
Residue-wise interaction energy analysis was performed on peptides p9, p17 and p21 using the trajectory in which the peptide was bound to the PC1 CTF using the gmx_MMPBSA software with the following command line:
gmx_MMPBSA -O -i mmpbsa.in -cs com.tpr -ct com_traj.xtc -ci index.ndx -cg 3 4 -cp topol.top -o FINAL_RESULTS_MMPBSA.dat -eo FINAL_RESULTS_MMPBSA.csv -do FINAL_DECOMP_MMPBSA.dat -deo FINAL_DECOMP_MMPBSA.csv
Input file for running residue-wise energy decomposition analysis:
&general
sys_name="Decomposition", startframe=1, endframe=200,
# forcefields="leaprc.protein.ff14SB"
/
&gb
igb=5, saltcon=0.150,
/
# make sure to include at least one residue from both the receptor #and peptide in the print_res mask of the &decomp section.
# this requirement is automatically fulfilled when using the within keyword.
# http://archive.ambermd.org/201308/0075.html
&decomp
idecomp=2, dec_verbose=3, print_res="A/854-862 A/1-853”,
/
Residue-wise energy decomposition analysis allowed us to identify key residues that contributed the most to the peptide binding energies. These included residues T1 and V9 in p9 (Table S2), residues T1, R15 and V17 in p17 (Table S3), and residues P10, P11, P19 and P21 in p21 and residue W3726 in the PC1 CTF (Table S4). The energetic contributions of these residues apparently correlated to the sequence coevolution predicted from the Potts model.
(5) To showcase the reliability of the computational approach, the authors should perform the MD simulation studies with one peptide that did not show any significant agonistic effect in the experiment. This will work as a control for the computational protocol and will demonstrate the utility of the pep-GaMD simulation in this work.
We appreciate the reviewer’s concern about the lack of control with the other peptides that did not induce an agonistic effect. It is difficult for us to add more MD simulations on the other peptides, due to student leave after PhD graduation. But to address the reviewer’s concern, we have included more details on the study of the stalkless CTF as a control in the revised manuscript.
(6) To assess the accuracy of the computational results the authors should mention (either in the main text or SI) whether the reported free energy surfaces were the average of the five simulations or computed from one simulation. In the latter case, free energy surfaces computed from the other four simulations should be provided in the SI. In addition, how many binding unbinding events have been observed in each simulation should be mentioned.
We appreciate the reviewer’s comment regarding convergence of the simulation free energy surfaces. In response to Reviewer 1, we have calculated free energy profiles of individual simulations for each system, including the p9, p17, and p21 (Figs. S5, S6 and S8).
“We have calculated free energy profiles of individual simulations for each system, including the p9, p17, and p21 (Figs. S5, S6 and S8). For the p9 peptide, the “Bound” low-energy state was consistently identified in the 2D free energy profile of each individual simulation (Fig. S5). For the p17 peptide, Pep-GaMD simulations were able to refine the peptide conformation from the "Unbound” to the "Intermediate” and “Bound” states in Sim1 and Sim5, while the peptide reached only the "Intermediate” state in the other three simulations (Fig. S6). For the p21 peptide, PepGaMD was able to refine the peptide docking conformation to the "Bound” state in all the five individual simulations (Fig. S8).”
“It is important to note that the free energy profiles calculated from GaMD simulations of PC1 CTF were not fully converged since certain variations were observed among the individual simulations. Nevertheless, these calculations allowed us to identify representative low-energy binding conformations of the peptides.”
Author response:
The following is the authors’ response to the original reviews
Public Reviews:
Reviewer #1 (Public review):
Summary:
Govindan and Conrad use a genome-wide CRISPR screen to identify genes regulating retention of intron 4 in OGT, leveraging an intron retention reporter system previously described (PMID: 35895270). Their OGT intron 4 reporter reliably responds to O-GlcNAc levels, mirroring the endogenous splicing event. Through a genome-wide CRISPR knockout library, they uncover a range of splicing-related genes, including multiple core spliceosome components, acting as negative regulators of OGT intron 4 retention. They choose to follow up on SFSWAP, a largely understudied splicing regulator shown to undergo rapid phosphorylation in response to O-GlcNAc level changes (PMID: 32329777). RNA-sequencing reveals that SFSWAP depletion not only promotes OGT intron 4 splicing but also broadly induces exon inclusion and intron splicing, affecting decoy exon usage. While this study offers interesting insights into intron retention and O-GlcNAc signaling regulation, the RNA sequencing experiments lack the essential controls needed to provide full confidence to the authors' conclusions.
Strengths:
(1) This study presents an elegant genetic screening approach to identify regulators of intron retention, uncovering core spliceosome genes as unexpected positive regulators of intron retention.
(2) The work proposes a novel functional role for SFSWAP in splicing regulation, suggesting that it acts as a negative regulator of splicing and cassette exon inclusion, which contrasts with expected SR-related protein functions.
(3) The authors suggest an intriguing model where SFSWAP, along with other spliceosome proteins, promotes intron retention by associating with decoy exons.
We thank the reviewer for recognizing and detailing the strengths of our manuscript.
Weaknesses:
(1) The conclusions on SFSWAP impact on alternative splicing are based on cells treated with two pooled siRNAs for five days. This extended incubation time without independent siRNA treatments raises concerns about off-target effects and indirect effects from secondary gene expression changes, potentially limiting confidence in direct SFSWAP-dependent splicing regulation. Rescue experiments and shorter siRNA-treatment incubation times could address these issues.
We repeated our SFSWAP knockdown analysis and analyzed both OGT e4-e5 junction splicing and SFSWAP transcript levels by RT-qPCR (now included in Sup. Fig. S4) from day 2 to day 5 post siRNA treatment. We observed that the time point at which OGT intron 4 removal increases (day 2) coincides with the time at which SFSWAP transcript levels start decrease, consistent with a direct effect of SFSWAP knockdown on OGT intron 4 splicing. Moreover, the effect of SFSWAP knockdown on OGT intron 4 splicing peaks between day 4-5, supporting our use of these longer time points to cast a wide net for SFSWAP targets.
(2) The mechanistic role of SFSWAP in splicing would benefit from further exploration. Key questions remain, such as whether SFSWAP directly binds RNA, specifically the introns and exons (including the decoy exons) it appears to regulate. Furthermore, given that SFSWAP phosphorylation is influenced by changes in O-GlcNAc signaling, it would be interesting to investigate this relationship further. While generating specific phosphomutants may not yield definitive insights due to redundancy and also beyond the scope of the study, the authors could examine whether distinct SFSWAP domains, such as the SR and SURP domains, which likely overlap with phosphorylation sites, are necessary for regulating OGT intron 4 splicing.
We absolutely agree with the reviewer that the current work stops short of a detailed mechanistic study, and we have made every attempt to be circumspect in our interpretations to reflect that limitation. In addition, we are very interested in delving more deeply into the mechanistic aspects of this regulation. In fact, we have initiated many of the experiments suggested by the reviewer (and more), but in each case, rigorous interpretable results will require a minimum another year’s time.
For example, we have used crosslinking and biotin labeling techniques (using previously available reagents from Eclipsebio) to test whether SFSWAP binds RNA. The results were negative, but the lack of strong SFSWAP antibodies required that we use a transiently expressed myc-tagged SFSWAP. Therefore, this negative result could be an artifact of the exogenous expression and/or tagging. Given the difficulties of “proving the negative”, considerably more work will be required to substantiate this finding. As another example, we intend to develop a complementation assay as suggested. For an essential gene, the ideal complementation system employs a degron system, and we have spent months attempting to generate a homozygous AID-tagged SFSWAP. Unfortunately, we so far have only found heterozygotes. Of course, this could be because the tag interferes with function, the insert was not efficiently incorporated by homologous repair, or that we simply haven’t yet screened a sufficient number of clones. We’re confident that these technical issues that can be addressed, but they will take a significant amount of time to resolve. While we would ideally define a mechanism, we think that the data reported here outlining functions for SFSWAP in splicing represent a body of work sufficient for publication.
(3) Data presentation could be improved (specific suggestions are included in the recommendations section). Furthermore, Excel tables with gene expression and splicing analysis results should be provided as supplementary datasheets. Finally, a more detailed explanation of statistical analyses is necessary in certain sections.
We have addressed all specific suggestions as detailed in the recommendations below.
Reviewer #2 (Public review):
Summary:
The paper describes an effort to identify the factors responsible for intron retention and alternate exon splicing in a complex system known to be regulated by the O-GlcNAc cycling system. The CRISPR/Cas9 system was used to identify potential factors. The bioinformatic analysis is sophisticated and compelling. The conclusions are of general interest and advance the field significantly.
Strengths:
(1) Exhaustive analysis of potential splicing factors in an unbiased screen.
(2) Extensive genome wide bioinformatic analysis.
(3) Thoughtful discussion and literature survey.
We thank the reviewer for recognizing and detailing the strengths of our manuscript.
Weaknesses:
(1) No firm evidence linking SFSWAP to an O-GlcNAc specific mechanism.
We couldn’t agree more with this critique. Indeed, our intention at the outset for the screen was to find an O-GlcNAc sensor linking OGT splicing with O-GlcNAc levels. As often occurs with high-throughput screens, we didn’t find exactly what we were looking for, but the screen nonetheless pointed us to interesting biology. Prompted by our screen, we describe new insights into the function of SFSWAP a relatively uncharacterized essential gene. Currently, we are testing other candidates from our screen, and we are performing additional studies to identify potential O-GlcNAc sensors.
(2) Resulting model leaves many unanswered questions.
We agree (see Reviewer 1, point 2 response).
Reviewer #3 (Public review):
Summary:
The major novel finding in this study is that SFSWAP, a splicing factor containing an RS domain but no canonical RNA binding domain, functions as a negative regulator of splicing. More specifically, it promotes retention of specific introns in a wide variety of transcripts including transcripts from the OGT gene previously studied by the Conrad lab. The balance between OGT intron retention and OGT complete splicing is an important regulator of O-GlcNAc expression levels in cells.
Strengths:
An elegant CRISPR knockout screen employed a GFP reporter, in which GFP is efficiently expressed only when the OGT retained intron is removed (so that the transcript will be exported from the nucleus to allow for translation of GFP). Factors whose CRISPR knockdown causes decreased intron retention therefore increase GFP, and can be identified by sequencing RNA of GFP-sorted cells. SFSWAP was thus convincingly identified as a negative regulator of OGT retained intron splicing. More focused studies of OGT intron retention indicate that it may function by regulating a decoy exon previously identified in the intron, and that this may extend to other transcripts with decoy exons.
We thank the reviewer for recognizing the strengths of our manuscript.
Weaknesses:
The mechanism by which SFSWAP represses retained introns is unclear, although some data suggests it can operate (in OGT) at the level of a recently reported decoy exon within that intron.
Interesting/appropriate speculation about possible mechanisms are provided and will likely be the subject of future studies.
We completely agree that this is a limitation of the current study (see above). Now that we have a better understanding of SFSWAP functions, we will continue to explore SFSWAP mechanisms as suggested.
Overall the study is well done and carefully described but some figures and some experiments should be described in more detail.
Recommendations for the authors:
Reviewer #1 (Recommendations for the authors):
(1) Clarify and add missing statistical details across the figures. For example, Figure S2 lacks statistical comparisons, and in Figures 4A and 4C the tests applied should be specified in the legend.
We have added appropriate statistical analysis wherever missing and edited figure legends to specify the tests used.
(2) The authors are strongly encouraged to provide detailed tables of gene expression and alternative splicing analyses from RNA-Seq experiments (e.g., edgeR, rMATS, Whippet, and MAJIQ), as this would enhance transparency and facilitate data interpretation.
We have added tables for gene expression and alternate splicing analysis as suggested (Suppl. tables 3-
6).
(3) Although the legend sometimes indicates differently (e.g., Figure 3b, 5a, 5c, etc), the volcano plots showing the splicing changes do not contain a cutoff for marginally differential percent spliced in or intron retention values.
The legends have been edited to reflect the correct statistical and/or PSI cutoffs.
(4) For consistency, use a consistent volcano plot format across all relevant figures (Figures 3b, 5a-c, S3, S4, S7, and S8), including cutoffs for differential splicing and the total count of up- and down-regulated events.
Due to different statistical frameworks and calculations employed by different alternate splicing pipelines, we could not use the same cutoffs for different pipelines. However, we have now indicated the number of up- and down-regulated events for consistency among the volcano plots.
(5) What is the overlap of differentially regulated events between the different analytical methodologies applied?
We analyzed the degree of overlap between the three pipelines used in the paper using a Venn diagram (added to Suppl. Fig. S7). However, as widely reported in literature (e.g., Olofsson et al., 2023; Biochem Biophys Res Commun. 2023; doi: 10.1016/j.bbrc.2023.02.053.), the degree of overlap between pipelines is quite low.
(6) To further substantiate your conclusions, additional validations of RNA-Seq splicing data, ideally visualized on an agarose gel, would be valuable, especially for exons and introns regulated by SFSWAP, and particularly for OGT decoy exons in Figure 4c.
We have not included these experiments as we focused on other critiques for this resubmission. Because the RNA-seq, RT-PCR and RT-qPCR data all align, we are confident that the products we are seeing are correctly identified and orthogonally validated (Figs 2d, 4a, 4b, and 4c).
(7) It would be more informative if the CRISPR screen data were presented in a format where both the adjusted p-value and LFC values of the hits are presented. Perhaps a volcano plot?
We have now included these graphs in revised Supplementary Figure S2.
(8) In Figure 2d, a cartoon showing primer binding sites for each panel could aid interpretation, particularly in explaining the unexpected simultaneous increase in OGT mRNA and intron retention upon SFSWAP knockdown.
We have added a cartoon showing primer binding sites similar to that shown in Fig. 4a.
(9) Page 9, line 1, states that SFSWAP autoregulates its expression by controlling intron retention. Including a Sashimi plot would provide visual support for this claim.
The data suggesting that SFSWAP autoregulates its own transcript abundance were reported in Zachar et al. (1994), not from our own studies. Validation of those data with our RNA-seq data is confounded by the fact that we are using siRNAs to knockdown the SFSWAP RNA at the transcript level (Fig. S15).
(10) In the legend of Figure S2 the authors state that negative results are inconclusive because RNA knockdowns are not verified by western blotting or qRT-PCR. This is correct, but the reviewer would also argue that the positive results are also inconclusive as they are not supported by a rescue experiment to confirm that the effect is not due to off-target effects.
This is a fair point with respect to the siRNA experiments on their own. However, the CRISPR screen was performed with sgRNAs, and MAGeCK RRA scores are high only for those genes that have multiple sgRNAs that up-regulate the gene. Examination of the SFSWAP sgRNAs individually shows that three of four SFSWAP sgRNAs had false discovery rates ≤10<sup>-42</sup> for GFP upregulation. Thus, the siRNAs provide an additional orthogonal approach. It seems unlikely that the siRNAs, and three independent sgRNAs will have the same off-target results. Thus, these combined observations support the conclusion that SFSWAP loss leads to decreased OGT intron retention.
(11) For clarity in Figure 3a, consider using differential % spliced in or intron retention bar plots with directionality (positive and negative axis) and labeling siSFSWAP as the primary condition.
(12) Consider presenting Figure 5D as a box plot with a Wilcoxon test for statistical comparison.
For both points 11 and 12, we have tried the graphs as the reviewer suggested. While these were good suggestions, in both cases we felt that the original plots ended up presenting a clearer presentation of the data (see Author response image 1).
Author response image 1.
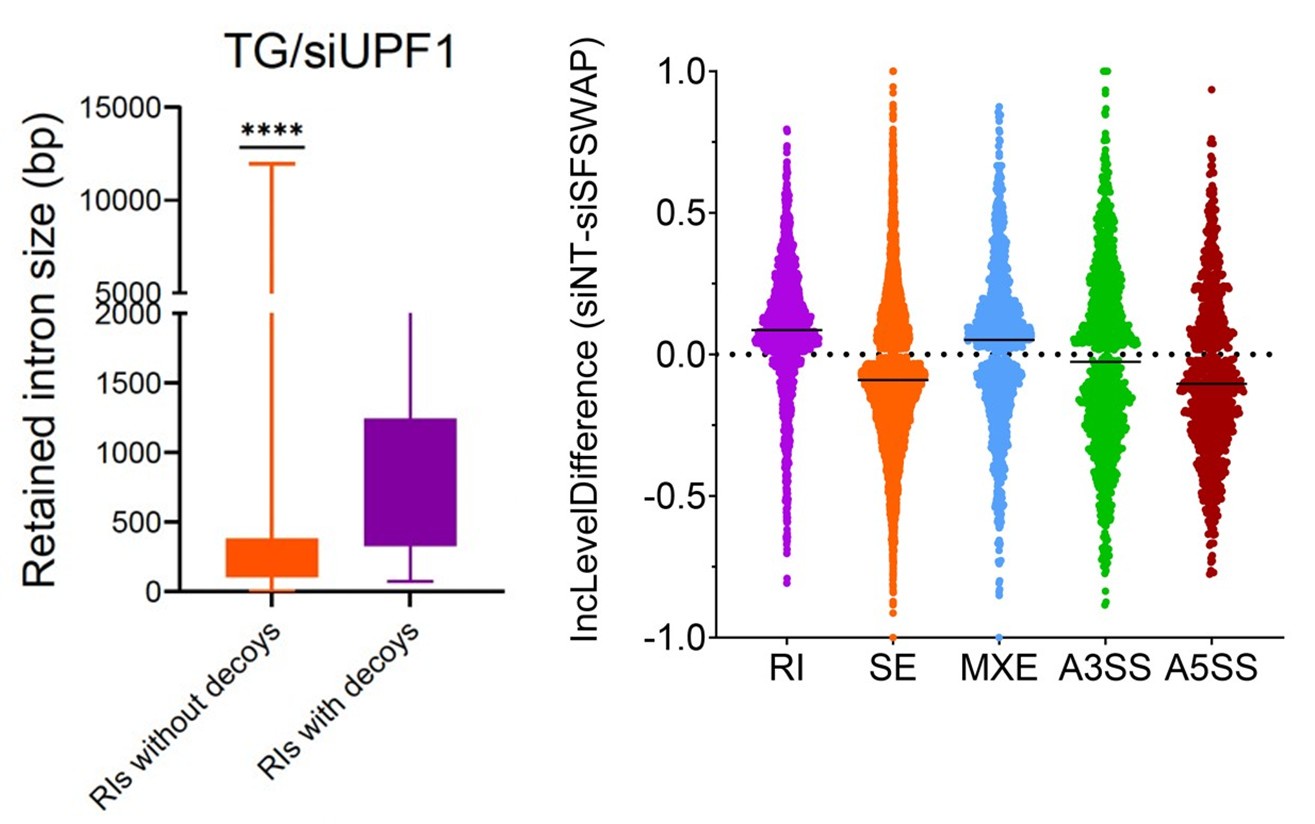
(13) Please expand the Methods section to detail the Whippet and MAJIQ analyses.
We have expanded the methods section to include additional details of the alternate splicing analysis.
(14) Include coordinates for the four possible OGT decoy exon combinations analyzed in the Methods section.
We have added the coordinates of all four decoy forms in the methods section.
(15) A section on SFSWAP mass spectrometry is listed in Methods but is missing from the manuscript.
This section has now been removed.
Reviewer #2 (Recommendations for the authors):
This is an excellent contribution. The paper describes an effort to identify the factors responsible for intron retention and alternate exon splicing in a complex system known to be regulated by the O-GlcNAc cycling system. The CRISPR/Cas9 system was used to identify potential factors. The bioinformatic analysis is sophisticated and compelling. The conclusions are of general interest and advance the field significantly.
Some specific recommendations.
(1) The plots in Figure 3 describing SI and ES events are confusing to this reader. Perhaps the violin plot is not the best way to visualize these events. The same holds true for the histograms in the lower panel of Figure 3. Not sure what to make of these plots.
For Figure 3b, we include both scatter and violin plots to represent the same data in two distinct ways. For Figure 3d, we agree that these are not the simplest plots to understand, and we have spent significant time trying to come up with a better way of displaying these trends in GC content as they relate to SE and RI events. Unfortunately, we were unable to identify a clearer way to present these data.
(2) The model (Figure 6) is very useful but confusing. The legend and the Figure itself are somewhat inconsistent. The bottom line of the figure is apparent but I fear that the authors are trying to convey a more complete model than is apparent from this figure. Please revise.
We have simplified the figure from the previous submission. As mentioned above, we admit that mechanistic details remain unknown. However, we have tried to generate a model that reflects our data, adds some speculative elements to be tested in the future, but remains as simple as possible. We are not quite sure what the reviewer was referring to as “somewhat inconsistent”, but we have attempted to clarify the model in the revised Discussion and Figure legend.
(3) It is unclear how normalization of the RNA seq experiments was performed (eg. Figure S5 and 6).
The normalization differences in Fig. S5 and S6 (now Fig S8 and S9) were due to scaling differences during the use of rmats2sashimiplot software. We have now replaced Fig. S5 to reflect correctly scaled images.
I am enthusiastic about the manuscript and feel that with some clarification it will be an important contribution.
Thank you for these positive comments about our study!
Reviewer #3 (Recommendations for the authors):
(1) In Figure 1f, it is clear that siRNA-mediated knockdown of OGT greatly increases spliced RNA as the cells attempt to compensate by more efficient intron removal (three left lanes). However, there is no discussion of the various treatments with TG or OSMI. Might quantitation of these lanes not also show the desired effects of TG and OSMI on spliced transcript levels?
The strong effect of OGT knockdown masks the (comparatively modest) effects of subsequent inhibitor treatments on the reporter RNA. We have edited the results section to clarify this.
(2) In Figure 2c, why is the size difference between spliced RNA and intron-retained RNA so different in the GFP-probed gel (right) compared with the OGT-probed gel (left)? Even recognizing that the GFP probe is directed against reporter transcripts, and the OGT probe (I think) is directed against endogenous OGT transcripts, shouldn't the difference between spliced and unspliced bands be the same, i.e., +/- the intron 4 sequence. Also, why does the GFP probe detect the unspliced transcript so poorly?
The fully spliced endogenous OGT mRNA is ~5.5 kb while the fully spliced reporter is only ~1.6kb, so the difference in size (the apparent shift relative to the mRNA) is quite different. Moreover, the two panels in Fig 2c are not precisely scaled to one another, so direct comparisons cannot be made.
The intron retained isoform does not accumulate to high levels in this reporter, a phenotype that we also observed with our GFP reporter designed to probe the regulation of the MAT2A retained intron (Scarborough et al., 2021). We are not certain about the reason for these observations, but suspect that the reporter RNA’s retained intron isoforms are less stable in the nucleus than their endogenous counterparts. Alternatively, the lack of splicing may affect 3´ processing of the transcripts so that they do not accumulate to the high levels observed for the wild-type genes.
(3) Please provide more information about the RNA-seq experiments. How many replicates were performed under each of the various conditions? The methods section says three replicates were performed for the UPF1/TG experiments; was this also true for the SFSWAP experiments?
All RNA-seq experiments were performed in biological triplicates. We have edited the methods section to clarify this.
(4) Relatedly, the several IGV screenshots shown in Figure 3C presumably represent the triplicate RNA seq experiments. In part D, how many experiments does the data represent? Is it a compilation of three experiments?
Fig. 3d is derived from alternate splicing analysis performed on three biological replicates. We have added the number of replicates (n=3) on the figure to clarify this. We have also noted that the three IGV tracks represent biological replicates in the Figure legend for 3c.
(5) Please provide more details regarding the qRT-PCR experiments.
We have provided the positions of primer sets used for RT-qPCR analysis and cartoon depictions of target sites below the data wherever appropriate.
(6) In the discussion of decoy exon function (in the Discussion section), several relevant observations are cited to support a model in which decoy exons promote assembly of splicing factors. One might also cite the finding that eCLIP profiling has found enriched binding of U2AF1 and U2AF2 at the 5' splice site region of decoy exons (reference 16).
Excellent point. This has now been added to the Discussion.
Minor corrections / clarifications:
(1) In the Figure 2A legend, CRISPR is misspelled.
Corrected.
(2) In the discussion, the phrase "indirectly inhibits splicing of exons 4 and 5, but promoting stable unproductive assembly of the spliceosome", the word "but" should probably be "by".
Corrected.
Author Response:
The following is the authors' response to the original reviews.
Reply to Public Reviews:
Reply to Reviewer #1:
This is a carefully performed and well-documented study to indicate that the FUS protein interacts with the GGGGCC repeat sequence in Drosophila fly models, and the mechanism appears to include modulating the repeat structure and mitigating RAN translation. They suggest FUS, as well as a number of other G-quadruplex binding RNA proteins, are RNA chaperones, meaning they can alter the structure of the expanded repeat sequence to modulate its biological activities.
Response: We would like to thank the reviewer for her/his time for evaluating our manuscript. We are very happy to see the reviewer for highly appreciating our manuscript.
1. Overall this is a nicely done study with nice quantitation. It remains somewhat unclear from the data and discussions in exactly what way the authors mean that FUS is an RNA chaperone: is FUS changing the structure of the repeat or does FUS binding prevent it from folding into alternative in vivo structure?
Response: We appreciate the reviewer’s constructive comments. Indeed, we showed that FUS changes the higher-order structures of GGGGCC [G4C2] repeat RNA in vitro, and that FUS suppresses G4C2 RNA foci formation in vivo. According to the established definition of RNA chaperone, RNA chaperones are proteins changing the structures of misfolded RNAs without ATP use, resulting in the maintenance of proper RNAs folding (Rajkowitsich et al., 2007). Thus, we consider that FUS is classified into RNA chaperone. To clarify these interpretations, we revised the manuscript as follows.
(1) On page 10, line 215-219, the sentence “These results were in good agreement with our previous study on SCA31 showing the suppressive effects of FUS and other RBPs on RNA foci formation of UGGAA repeat RNA as RNA chaperones …” was changed to “These results were in good agreement with … RNA foci formation of UGGAA repeat RNA through altering RNA structures and preventing aggregation of misfolded repeat RNA as RNA chaperones …”.
(2) On page 17, line 363-366, the sentence “FUS directly binds to G4C2 repeat RNA and modulates its G-quadruplex structure, as evident by CD and NMR analyses (Figure 5), suggesting its functional role as an RNA chaperone.” was changed to “FUS directly binds to G4C2 repeat RNA and modulates its G-quadruplex structure as evident by CD and NMR analyses (Figure 5, Figure 5—figure supplement 2), and suppresses RNA foci formation in vivo (Figures 3A and 3B), suggesting its functional role as an RNA chaperone.”
Reply to Reviewer #2:
Fuijino et al. provide interesting data describing the RNA-binding protein, FUS, for its ability to bind the RNA produced from the hexanucleotide repeat expansion of GGGGCC (G4C2). This binding correlates with reductions in the production of toxic dipeptides and reductions in toxic phenotypes seen in (G4C2)30+ expressing Drosophila. Both FUS and G4C2 repeats of >25 are associated with ALS/FTD spectrum disorders. Thus, these data are important for increasing our understanding of potential interactions between multiple disease genes. However, further validation of some aspects of the provided data is needed, especially the expression data.
Response: We would like to thank the reviewer for her/his time for evaluating our manuscript and also for her/his important comments that helped to strengthen our manuscript.
Some points to consider when reading the work:
1. The broadly expressed GMR-GAL4 driver leads to variable tissue loss in different genotypes, potentially confounding downstream analyses dependent on viable tissue/mRNA levels.
Response: We thank the reviewer for this constructive comment. In the RT-qPCR experiments (Figures 1E, 3C, 4G, 6D and Figure 1—figure supplement 1C), the amounts of G4C2 repeat transcripts were normalized to those of gal4 transcripts expressed in the same tissue, to avoid potential confounding derived from the difference in tissue viability between genotypes, as the reviewer pointed out. To clarify this process, we have made the following change to the revised manuscript.
(1) On page 30, line 548-550, the sentence “The amounts of G4C2 repeat transcripts were normalized to those of gal4 transcripts in the same sample” was changed to “The amounts of G4C2 repeat transcripts were normalized to those of gal4 transcripts expressed in the same tissue to avoid potential confounding derived from the difference in tissue viability between genotypes”.
2. The relationship between FUS and foci formation is unclear and should be interpreted carefully.
Response: We appreciate the reviewer’s important comment. We apologize for the lack of clarity. We showed the relationship between FUS and RNA foci formation in our C9-ALS/FTD fly, that is, FUS suppresses RNA foci formation (Figures 3A and 3B), and knockdown of endogenous caz, a Drosophila homologue of FUS, enhanced it conversely (Figures 4E and 4F). We consider that FUS suppresses RNA foci formation through altering RNA structures and preventing aggregation of misfolded G4C2 repeat RNA as an RNA chaperone. To clarify these interpretations, we revised the manuscript as follows.
(1) On page 10, line 215-219, the sentence “These results were in good agreement with our previous study on SCA31 showing the suppressive effects of FUS and other RBPs on RNA foci formation of UGGAA repeat RNA as RNA chaperones …” was changed to “These results were in good agreement with … RNA foci formation of UGGAA repeat RNA through altering RNA structures and preventing aggregation of misfolded repeat RNA as RNA chaperones …”.
(2) On page 17, line 363-366, the sentence “FUS directly binds to G4C2 repeat RNA and modulates its G-quadruplex structure, as evident by CD and NMR analyses (Figure 5), suggesting its functional role as an RNA chaperone.” was changed to “FUS directly binds to G4C2 repeat RNA and modulates its G-quadruplex structure as evident by CD and NMR analyses (Figure 5, Figure 5—figure supplement 2), and suppresses RNA foci formation in vivo (Figures 3A and 3B), suggesting its functional role as an RNA chaperone.”
Reply to Reviewer #3:
In this manuscript Fujino and colleagues used C9-ALS/FTD fly models to demonstrate that FUS modulates the structure of (G4C2) repeat RNA as an RNA chaperone, and regulates RAN translation, resulting in the suppression of neurodegeneration in C9-ALS/FTD. They also confirmed that FUS preferentially binds to and modulates the G-quadruplex structure of (G4C2) repeat RNA, followed by the suppression of RAN translation. The potential significance of these findings is high since C9ORF72 repeat expansion is the most common genetic cause of ALS/FTD, especially in Caucasian populations and the DPR proteins have been considered the major cause of the neurodegenerations.
Response: We would like to thank the reviewer for her/his time for evaluating our manuscript. We are grateful to the reviewer for the insightful comments, which were very helpful for us to improve the manuscript.
1. While the effect of RBP as an RNA chaperone on (G4C2) repeat expansion is supposed to be dose-dependent according to (G4C2)n RNA expression, the first experiment of the screening for RBPs in C9-ALS/FTD flies lacks this concept. It is uncertain if the RBPs of the groups "suppression (weak)" and "no effect" were less or no ability of RNA chaperone or if the expression of the RBP was not sufficient, and if the RBPs of the group "enhancement" exacerbated the toxicity derived from (G4C2)89 RNA or the expression of the RBP was excessive. The optimal dose of any RBPs that bind to (G4C2) repeats may be able to neutralize the toxicity without the reduction of (G4C2)n RNA.
Response: We appreciate the reviewer’s constructive comments. We employed the site-directed transgenesis for the establishment of RBP fly lines, to ensure the equivalent expression levels of the inserted transgenes. We also evaluated the toxic effects of overexpressed RBPs themselves by crossbreeding with control EGFP flies, showing in Figure 1A. To clarify them, we have made the following changes to the revised manuscript.
(1) On page 8, line 166-168, the sentence “The variation in the effects of these G4C2 repeat-binding RBPs on G4C2 repeat-induced toxicity may be due to their different binding affinities to G4C2 repeat RNA, and their different roles in RNA metabolism.” was changed to “The variation in the effects of these G4C2 repeat-binding RBPs on G4C2 repeat-induced toxicity may be due to their different binding affinities to G4C2 repeat RNA, and the different toxicity of overexpressed RBPs themselves.”.
(2) On page 29, line 519-522, the sentence “By employing site-specific transgenesis using the pUASTattB vector, each transgene was inserted into the same locus of the genome, and was expected to be expressed at the equivalent levels.” was added.
2. In relation to issue 1, the rescue effect of FUS on the fly expressing (G4C2)89 (FUS-4) in Figure 4-figure supplement 1 seems weaker than the other flies expressing both FUS and (G4C2)89 in Figure 1 and Figure 1-figure supplement 2. The expression level of both FUS protein and (G4C2)89 RNA in each line is important from the viewpoint of therapeutic strategy for C9-ALS/FTD.
Response: We appreciate the reviewer’s important comment. The FUS-4 transgene is expected to be expressed at the equivalent level to the FUS-3 transgene, since they are inserted into the same locus of the genome by the site-directed transgenesis. Thus, we suppose that the weaker suppressive effect of FUS-4 coexpression on G4C2 repeat-induced eye degeneration can be attributed to the C-terminal FLAG tag that is fused to FUS protein expressed in FUS-4 fly line. Since the caz fly expresses caz protein also fused to FLAG tag at the C-terminus, we used this FUS-4 fly line to directly compare the effect of caz on G4C2 repeat-induced toxicity to that of FUS.
3. While hallmarks of C9ORF72 are the presence of DPRs and the repeat-containing RNA foci, the loss of function of C9ORF72 is also considered to somehow contribute to neurodegeneration. It is unclear if FUS reduces not only the DPRs but also the protein expression of C9ORF72 itself.
Response: We thank the reviewer for this comment. We agree that not only DPRs, but also toxic repeat RNA and the loss-of-function of C9ORF72 jointly contribute to the pathomechanisms of C9-ALS/FTD. Since Drosophila has no homolog corresponding to the human C9orf72 gene, the effect of FUS on C9orf72 expression cannot be assessed. Our fly models are useful for evaluating gain-of-toxic pathomechanisms such as RNA foci formation and RAN translation, and the association between FUS and loss-of function of C9ORF72 is beyond the scope of this study.
4. In Figure 5E-F, it cannot be distinguished whether FUS binds to GGGGCC repeats or the 5' flanking region. The same experiment should be done by using FUS-RRMmut to elucidate whether FUS binding is the major mechanism for this translational control. Authors should show that FUS binding to long GGGGCC repeats is important for RAN translation.
Response: We would like to thank the reviewer for these insightful comments. Following the reviewer’s suggestion, we perform in vitro translation assay again using FUS-RRMmut, which loses the binding ability to G4C2 repeat RNA as evident by the filter binding assay (Figure 5A), instead of BSA. The results are shown in the figures of Western blot analysis below. The addition of FUS to the translation system suppressed the expression levels of GA-Myc efficiently, whereas that of FUS-RRMmut did not. FUS decreased the expression level of GA-Myc at as low as 10nM, and nearly eliminated RAN translation activity at 100nM. At 400nM, FUS-RRMmut weakly suppressed the GA-Myc expression levels probably because of the residual RNA-binding activity. These results suggest that FUS suppresses RAN translation in vitro through direct interactions with G4C2 repeat RNA.
Unfortunately, RAN translation from short G4C2 repeat RNA was not investigated in our translation system, although the previous study reported the low efficacy of RAN translation from short G4C2 repeat RNA (Green et al., 2017).
Author response image 1.
(A) Western blot analysis of the GA-Myc protein in the samples from in vitro translation. (B) Quantification of the GA-Myc protein levels.
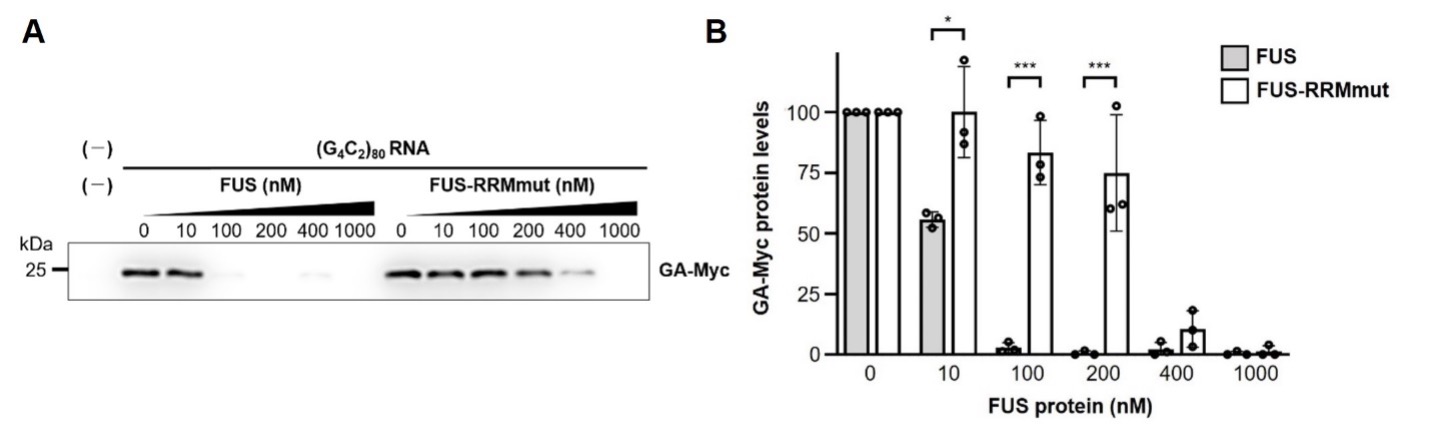
We have made the following changes to the revised manuscript.
(1) Figure 5F was replaced to new Figures 5F and 5G.
(2) On page 14-15, line 326-330, the sentence “Notably, the addition of FUS to this system decreased the expression level of GA-Myc in a dose-dependent manner, whereas the addition of the control bovine serum albumin (BSA) did not (Figure 5F).” was changed to “Notably, upon the addition to this translation system, FUS suppressed RAN translation efficiently, whereas FUS-RRMmut did not. FUS decreased the expression levels of GA-Myc at as low as 10nM, and nearly eliminated RAN translation activity at 100nM. At 400nM, FUS-RRMmut weakly suppressed the GA-Myc expression levels probably because of the residual RNA-binding activity (Figure 5F and 5G).”.
(3) On page 15, line 330-332, the sentence “Taken together, these results indicate that FUS suppresses RAN translation from G4C2 repeat RNA in vitro as an RNA chaperone.” was changed to “Taken together, these results indicate that FUS suppresses RAN translation in vitro through direct interactions with G4C2 repeat RNA as an RNA chaperone.”.
(4) On page 37, line 720-723, the sentence “For preparation of the FUS protein, the human FUS (WT) gene flanked at the 5¢ end with an Nde_I recognition site and at the 3¢ end with a _Xho_I recognition site was amplified by PCR from pUAST-_FUS.” was changed to “For preparation of the FUS proteins, the human FUS (WT) and FUS-RRMmut genes flanked at the 5¢ end with an Nde_I recognition site and at the 3¢ end with a _Xho_I recognition site was amplified by PCR from pUAST-_FUS and pUAST- FUS-RRMmut, respectively.”.
(5) On page 41, line 816-819, the sentence “FUS or BSA at each concentration (10, 100, and 1,000 nM) was added for translation in the lysate.” was changed to “FUS or FUS-RRMmut at each concentration (10, 100, 200, 400, and 1,000 nM) was preincubated with mRNA for 10 min to facilitate the interaction between FUS protein and G4C2 repeat RNA, and added for translation in the lysate.”.
5. It is not possible to conclude, as the authors have, that G-quadruplex-targeting RBPs are generally important for RAN translation (Figure 6), without showing whether RBPs that do not affect (G4C2)89 RNA levels lead to decreased DPR protein level or RNA foci.
Response: We appreciate the reviewer’s critical comment. Following the suggestion by the reviewer, we evaluate the effect of these G-quadruplex-targeting RBPs on RAN translation. We additionally performed immunohistochemistry of the eye imaginal discs of fly larvae expressing (G4C2)89 and these G-quadruplex-targeting RBPs. As shown in the figures of immunohistochemistry below, we found that coexpression of EWSR1, DDX3X, DDX5, and DDX17 significantly decreased the number of poly(GA) aggregates. The results suggest that these G-quadruplex-targeting RBPs regulate RAN translation as well as FUS.
Author response image 2.
(A) Immunohistochemistry of poly(GA) in the eye imaginal discs of fly larvae expressing (G4C2)89 and the indicated G-quadruplex-targeting RBPs. (B) Quantification of the number of poly(GA) aggregates.
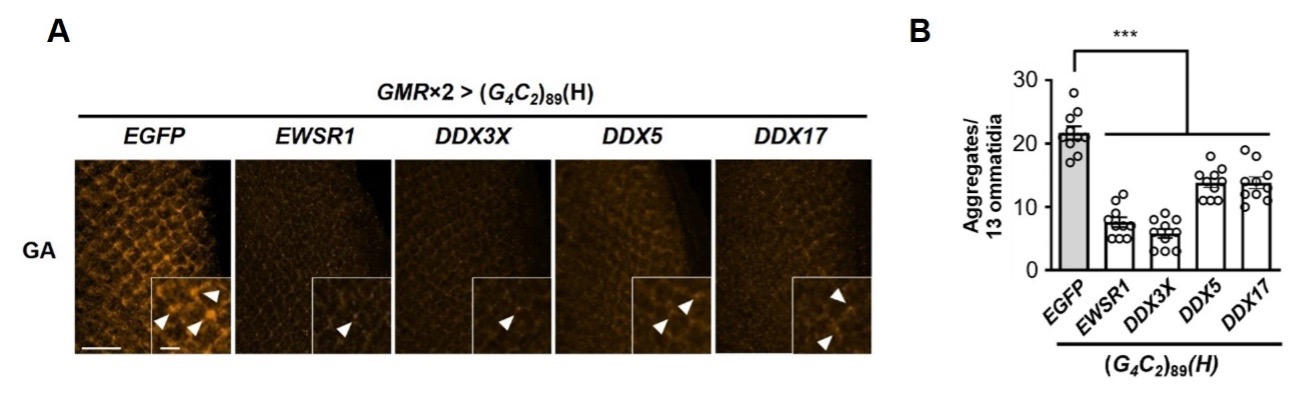
We have made the following changes to the revised manuscript.
(1) Figures 6E and 6F were added.
(2) On page 6-7, line 135-137, the sentence “In addition, other G-quadruplex-targeting RBPs also suppressed G4C2 repeat-induced toxicity in our C9-ALS/FTD flies.” was changed to “In addition, other G-quadruplex-targeting RBPs also suppressed RAN translation and G4C2 repeat-induced toxicity in our C9-ALS/FTD flies.”.
(3) On page 15, line 344-346, the sentence “As expected, these RBPs also decreased the number of poly(GA) aggregates in the eye imaginal discs (Figures 6E and 6F).” was added.
(4) On page 15, line 346-347, the sentence “Their effects on G4C2 repeat-induced toxicity and repeat RNA expression were consistent with those of FUS.” was changed to “Their effects on G4C2 repeat-induced toxicity, repeat RNA expression, and RAN translation were consistent with those of FUS.”
(5) On page 16, line 355-357, the sentence “Thus, some G-quadruplex-targeting RBPs regulate G4C2 repeat-induced toxicity by binding to and possibly by modulating the G-quadruplex structure of G4C2 repeat RNA.” was changed to “Thus, some G-quadruplex-targeting RBPs regulate RAN translation and G4C2 repeat-induced toxicity by binding to and possibly by modulating the G-quadruplex structure of G4C2 repeat RNA.”
(6) On page 19, line 417-421, the sentence “We further found that G-quadruplex-targeting RNA helicases, including DDX3X, DDX5, and DDX17, which are known to bind to G4C2 repeat RNA (Cooper-Knock et al., 2014; Haeusler et al., 2014; Mori et al., 2013a; Xu et al., 2013), also alleviate G4C2 repeat-induced toxicity without altering the expression levels of G4C2 repeat RNA in our Drosophila models.” was changed to “We further found that G-quadruplex-targeting RNA helicases, … ,also suppress RAN translation and G4C2 repeat-induced toxicity without altering the expression levels of G4C2 repeat RNA in our Drosophila models.”.
Reply to Recommendations For The Authors:
1) It is not clear from the start that the flies they generated with the repeat have an artificial vs human intronic sequence ahead of the repeat. It would be nice if they presented somewhere the entire sequence of the insert. The reason being that it seems they also tested flies with the human intronic sequence, and the effect may not be as strong (line 234). In any case, in the future, with a new understanding of RAN translation, it would be nice to compare different transgenes, and so as much transparency as possible would be helpful regarding sequences. Can they include these data?
Response: We thank the editors and reviewers for this comment. We apologize for the lack of clarity. We used artificially synthesized G4C2 repeat sequences when generating constructs for (G4C2)n transgenic flies, so these constructs do not contain human intronic sequence ahead of the G4C2 repeat in the C9orf72 gene, as explained in the Materials and Methods section. To clarify the difference between our C9-ALS/FTD fly models and LDS-(G4C2)44GR-GFP fly model (Goodman et al., 2019), we have made the following change to the revised manuscript.
(1) Schema of the LDS-(G4C2)44GR-GFP construct was presented in Figure 3—figure supplement 1.
Furthermore, to maintain transparency of the study, we have provided the entire sequence of the insert as the following source file.
(2) The artificial sequences inserted in the pUAST vector for generation of the (G4C2)n flies were presented in Figure 1—figure supplement 1—source data 1.
2) It is really nice how they quantitated everything and showed individual data points.
Response: We thank the editors and reviewers for appreciating our data analysis method. All individual data points and statistical analyses are summarized in source data files.
3) So when they call FUS an RNA chaperone, are they simply meaning it is changing the structure of the repeat, or could it just be interacting with the repeat to coat the repeat and prevent it from folding into whatever in vivo structures? Can they speculate on why some RNA chaperones lead to presumed decay of the repeat and others do not? Can they discuss these points in the discussion? Detailed mechanistic understanding of RNA chaperones that ultimately promote decay of the repeat might be of highly significant therapeutic benefit.
Response: We appreciate these critical comments. Indeed, we showed that FUS changes the higher-order structures of G4C2 repeat RNA in vitro, and that FUS suppresses G4C2 RNA foci formation. According to the established definition of RNA chaperone, RNA chaperones are proteins changing the structures of misfolded RNAs without ATP use, resulting in the maintenance of proper RNAs folding (Rajkowitsich et al., 2007). Thus, we consider that FUS is classified into RNA chaperone. To clarify these interpretations, we revised the manuscript as follows.
(1) On page 10, line 215-219, the sentence “These results were in good agreement with our previous study on SCA31 showing the suppressive effects of FUS and other RBPs on RNA foci formation of UGGAA repeat RNA as RNA chaperones …” was changed to “These results were in good agreement with … RNA foci formation of UGGAA repeat RNA through altering RNA structures and preventing aggregation of misfolded repeat RNA as RNA chaperones …”.
(2) On page 17, line 363-366, the sentence “FUS directly binds to G4C2 repeat RNA and modulates its G-quadruplex structure, as evident by CD and NMR analyses (Figure 5), suggesting its functional role as an RNA chaperone.” was changed to “FUS directly binds to G4C2 repeat RNA and modulates its G-quadruplex structure as evident by CD and NMR analyses (Figure 5, Figure 5—figure supplement 2), and suppresses RNA foci formation in vivo (Figures 3A and 3B), suggesting its functional role as an RNA chaperone.”
Besides these RNA chaperones, we observed the expression of IGF2BP1, hnRNPA2B1, DHX9, and DHX36 decreased G4C2 repeat RNA expression levels. In addition, we recently reported that hnRNPA3 reduces G4C2 repeat RNA expression levels, leading to the suppression of neurodegeneration in C9-ALS/FTD fly models (Taminato et al., 2023). We speculate these RBPs could be involved in RNA decay pathways as components of the P-body or interactors with the RNA deadenylation machinery (Tran et al., 2004; Katahira et al., 2008; Geissler et al., 2016; Hubstenberger et al., 2017), possibly contributing to the reduced expression levels of G4C2 repeat RNA. To clarify these interpretations, we revised the manuscript as follows.
(3) On page 18, line 392-398, the sentences “Similarly, we recently reported that hnRNPA3 reduces G4C2 repeat RNA expression levels, leading to the suppression of neurodegeneration in C9-ALS/FTD fly models (Taminato et al., 2023). Interestingly, these RBPs have been reported to be involved in RNA decay pathways as components of the P-body or interactors with the RNA deadenylation machinery (Tran et al., 2004; Katahira et al., 2008; Geissler et al., 2016; Hubstenberger et al., 2017), possibly contributing to the reduced expression levels of G4C2 repeat RNA.” was added.
4) What is the level of the G4C2 repeat when they knock down caz? Is it possible that knockdown impacts the expression level of the repeat? Can they show this (or did they and I miss it)?
Response: We thank the editors and reviewers for this comment. The expression levels of G4C2 repeat RNA in (G4C2)89 flies were not altered by the knockdown of caz, as shown in Figure 4G.
5) A puzzling point is that FUS is supposed to be nuclear, so where is FUS in the brain in their lines? They suggest it modulates RAN translation, and presumably, that is in the cytoplasm. Is FUS when overexpressed now in part in the cytoplasm? Is the repeat dragging it into the cytoplasm? Can they address this in the discussion? If FUS is never found in vivo in the cytoplasm, then it raises the point that the impact they find of FUS on RAN translation might not reflect an in vivo situation with normal levels of FUS.
Response: We appreciate these important comments. We agree with the editors and reviewers that FUS is mainly localized in the nucleus. However, FUS is known as a nucleocytoplasmic shuttling RBP that can transport RNA into the cytoplasm. Indeed, FUS is reported to facilitate transport of actin-stabilizing protein mRNAs to function in the cytoplasm (Fujii et al., 2005). Thus, we consider that FUS binds to G4C2 repeat RNA in the cytoplasm and suppresses RAN translation in this study.
6) When they are using 2 copies of the driver and repeat, are they also using 2 copies of FUS? These are quite high levels of transgenes.
Response: We thank the editors and reviewers for this comment. We used only 1 copy of FUS when using 2 copies of GMR-Gal4 driver. Full genotypes of the fly lines used in all experiments are described in Supplementary file 1.
7) In Figure5-S1, FUS colocalizing with (G4C2)RNA is not clear. High-magnification images are recommended.
Response: We appreciate this constructive comment on the figure. Following the suggestion, high-magnification images are added in Figure 5—figure supplement 1.
8) I also suggest that the last sentence of the Discussion be revised as follows: Thus, our findings contribute not only to the elucidation of C9-ALS/FTD, but also to the elucidation of the repeat-associated pathogenic mechanisms underlying a broader range of neurodegenerative and neuropsychiatric disorders than previously thought, and it will advance the development of potential therapies for these diseases.
Response: We appreciate this recommendation. We have made the following change based on the suggested sentence.
(1) On page 20-21, line 455-459, “Thus, our findings contribute not only towards the elucidation of repeat-associated pathogenic mechanisms underlying a wider range of neuropsychiatric diseases than previously thought, but also towards the development of potential therapies for these diseases.” was changed to “Thus, our findings contribute to the elucidation of the repeat-associated pathogenic mechanisms underlying not only C9-ALS/FTD, but also a broader range of neuromuscular and neuropsychiatric diseases than previously thought, and will advance the development of potential therapies for these diseases.”.
Authors’ comment on previous eLife assessment:
We thank the editors and reviewers for appreciating our study. We mainly evaluated the function of human FUS protein on RAN translation and G4C2 repeat-induced toxicity using Drosophila expressing human FUS in vivo, and the recombinant human FUS protein in vitro. To validate that FUS functions as an endogenous regulator of RAN translation, we additionally evaluated the function of Drosophila caz protein as well. We are afraid that the first sentence of the eLife assessment, that is, “This important study demonstrates that the Drosophila FUS protein, the human homolog of which is implicated in amyotrophic lateral sclerosis (ALS) and related conditions, …” is somewhat misleading. We would be happy if you modify this sentence like “This important study demonstrates that the human FUS protein, which is implicated in amyotrophic lateral sclerosis (ALS) and related conditions, …”.
Author response:
The following is the authors’ response to the original reviews.
Public Reviews:
Reviewer #1 (Public Review):
Summary:
In their manuscript, Yu et al. describe the chemotactic gradient formation for CCL5 bound to - i.e. released from - glycosaminoglycans. The authors provide evidence for phase separation as the driving mechanism behind chemotactic gradient formation. A conclusion towards a general principle behind the finding cannot be drawn since the work focuses on one chemokine only, which is particularly prone to glycan-induced oligomerisation.
Strengths:
The principle of phase separation as a driving force behind and thus as an analytical tool for investigating protein interactions with strongly charged biomolecules was originally introduced for protein-nucleic acid interactions. Yu et al. have applied this in their work for the first time for chemokine-heparan sulfate interactions. This opens a novel way to investigate chemokine-glycosaminoglycan interactions in general.
Response: Thanks for the encouragement of the reviewer.
Weaknesses:
As mentioned above, one of the weaknesses of the current work is the exemplification of the phase separation principle by applying it only to CCL5-heparan sulfate interactions. CCL5 is known to form higher oligomers/aggregates in the presence of glycosaminoglycans, much more than other chemokines. It would therefore have been very interesting to see, if similar results in vitro, in situ, and in vivo could have been obtained by other chemokines of the same class (e.g. CCL2) or another class (like CXCL8).
Response: We share the reviewer’s opinion that to investigate more molecules/cytokines that interact with heparan sulfate in the system should be of interesting. We expect that researchers in the field will adapt the concept to continue the studies on additional molecules. Nevertheless, our earlier study has demonstrated that bFGF was enriched to its receptor and triggered signaling transduction through phase separation with heparan sulfate (PMID: 35236856; doi: 10.1038/s41467-022-28765-z), which supports the concept that phase separation with heparan sulfate on the cell surface may be a common mechanism for heparan sulfate binding proteins. The comment of the reviewer that phase separation is related to oligomerization is demonstrated in (Figure 1—figure supplement 2C and D), showing that the more easily aggregated mutant, A22K-CCL5, does not undergo phase separation.
In addition, the authors have used variously labelled CCL5 (like with the organic dye Cy3 or with EGFP) for various reasons (detection and immobilisation). In the view of this reviewer, it would have been necessary to show that all the labelled chemokines yield identical/similar molecular characteristics as the unlabelled wildtype chemokine (such as heparan sulfate binding and chemotaxis). It is well known that labelling proteins either by chemical tags or by fusion to GFPs can lead to manifestly different molecular and functional characteristics.
Response: We agree with the reviewer that labeling may lead to altered property of a protein, thus, we have compared chemotactic activity of CCL5 and CCL5-EGFP (Figure 2—figure supplement 1). To further verify this, we performed additional experiment to compare chemotactic activity between CCL5 and Cy3-CCL5 (see Author response image 1). For the convenience of readers, we have combined the original Figure 2—figure supplement 1 with the new data (Figure R1), which replaced original Figure 2—figure supplement 1.
Author response image 1.
Chemotactic function of CCL5-EGFP and CCL5-Cy3. Cy3-Labeled CCL5 has similar activity as CCL5, 50 nM CCL5 or CCL5-Cy3 were added to the lower chamber of the Transwell. THP-1 cells were added to upper chambers. Data are mean ± s.d. n=3. P values were determined by unpaired two-tailed t-tests. NS, Not Significant.
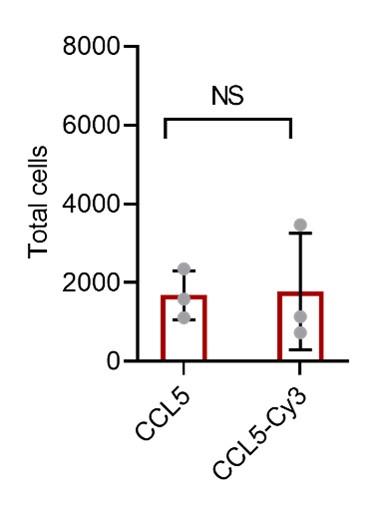
Reviewer #2 (Public Review):
Although the study by Xiaolin Yu et al is largely limited to in vitro data, the results of this study convincingly improve our current understanding of leukocyte migration.
(1) The conclusions of the paper are mostly supported by the data although some clarification is warranted concerning the exact CCL5 forms (without or with a fluorescent label or His-tag) and amounts/concentrations that were used in the individual experiments. This is important since it is known that modification of CCL5 at the N-terminus affects the interactions of CCL5 with the GPCRs CCR1, CCR3, and CCR5 and random labeling using monosuccinimidyl esters (as done by the authors with Cy-3) is targeting lysines. Since lysines are important for the GAG-binding properties of CCL5, knowledge of the number and location of the Cy-3 labels on CCL5 is important information for the interpretation of the experimental results with the fluorescently labeled CCL5. Was the His-tag attached to the N- or C-terminus of CCL5? Indicate this for each individual experiment and consider/discuss also potential effects of the modifications on CCL5 in the results and discussion sections.
Response: We agree with the reviewer that labeling may lead to altered property of a protein, thus, we have compared chemotactic activity of CCL5 and CCL5-EGFP (Figure 2—figure supplement 1). To further verify this, we performed additional experiment to compare chemotactic activity between CCL5 and Cy3-CCL5 (see Author response image 1). For the convenience of readers, we have combined the original Figure 2—figure supplement 1 with the new data (Author response image 1), which replaced original Figure 2—figure supplement 1.
The His-tag is attached to the C-terminus of CCL5, in consideration of the potential impact on the N-terminus.
(2) In general, the authors appear to use high concentrations of CCL5 in their experiments. The reason for this is not clear. Is it because of the effects of the labels on the activity of the protein? In most biological tests (e.g. chemotaxis assays), unmodified CCL5 is active already at low nM concentrations.
Response: We agree with the reviewer that the CCL5 concentrations used in our experiments were higher than reported chemotaxis assays and also higher than physiological levels in normal human plasma. In fact, we have performed experiments with lower concentration of CCL5, where the effect of LLPS was not seen though the chemotactic activity of the cytokine was detected. Thus, LLPS-associated chemotactic activity may represent a scenario of acute inflammatory condition when the inflammatory cytokines can increase significantly.
(3) For the statistical analyses of the results, the authors use t-tests. Was it confirmed that data follow a normal distribution prior to using the t-test? If not a non-parametric test should be used and it may affect the conclusions of some experiments.
Response: We thank the reviewer for pointing out this issue. As shown in Author response table 1, The Shapiro-Wilk normality test showed that only two control groups (CCL5 and 44AANA47-CCL5+CHO K1) in Figure 3 did not conform to the normal distribution. The error was caused by using microculture to count and calculate when there were very few cells in the microculture. For these two groups, we re-counted 100 μL culture medium to calculate the number of cells. The results were consistent with the positive distribution and significantly different from the experimental group (Author response image 3). The original data for the number of cells chemoattractant by 500 nM CCL5 was revised from 0, 247, 247 to 247, 123, 370 and 500 nM 44AANA47 +CHO-K1 was revised from 1111, 1111, 98 to 740, 494, 617. The revised data does not affect the conclusion.
Author response table 1.
Table R1 Shapiro-Wilk test results of statistical data in the manuscript
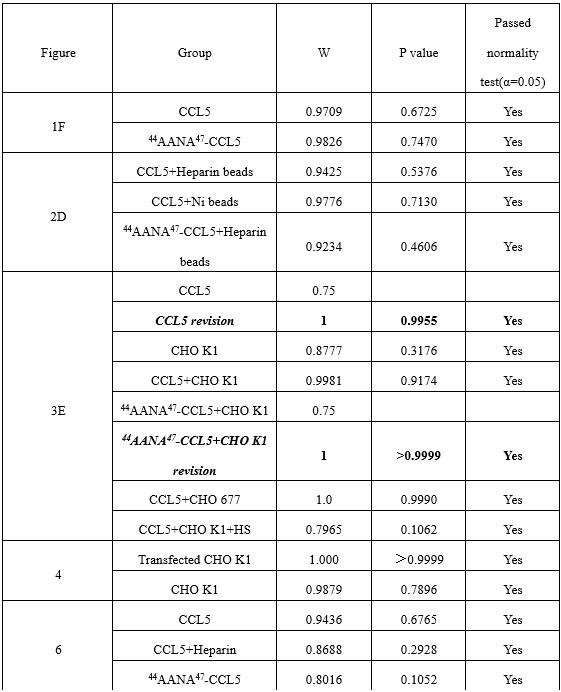
Author response image 3.
Quantification of THP-1collected from the lower chamber. Data are mean ± s.d. n=3. P values were determined by unpaired two-tailed t-tests.
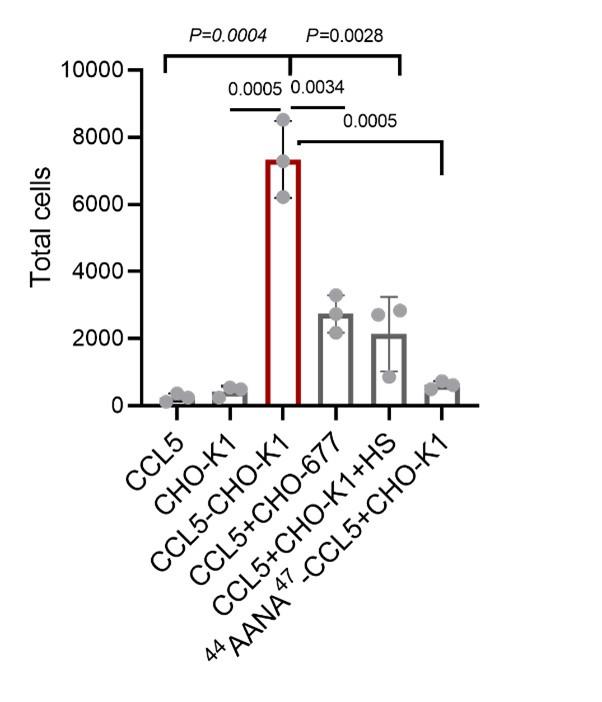
Recommendations for the authors:
Reviewer #1:
See the weaknesses section of the Public Review. In addition, the authors should discuss the X-ray structure of CCL5 in complex with a heparin disaccharide in comparison with their docked structure of CCL5 and a heparin tetrasaccharide.
Response: Our study, in fact, is strongly influenced by the report (Shaw, Johnson et al., 2004) that heparin disaccharide interaction with CCL5, which is highlighted in the text (page5, line100-102).
Reviewer #2:
(1) Clearly indicate in the results section and figure legends (also for the supplementary figures) which form and concentration of CCL5 is used.
Response: The relevant missing information is indicated across the manuscript.
(2) Clearly indicate which GAG was used. Was it heparin or heparan sulfate and what was the length (e.g. average molecular mass if known) or source (company?)?
Response: Relevant information is added in the section “Materials and Methods.
(3) Line 181: What do you mean exactly with "tiny amounts"?
Response: “tiny amounts” means 400 transfected cells. This is described in the section of Materials and Methods. It is now also indicated in the text and legend to the figure.
(4) Lines 216-217: This is a very general statement without a link to the presented data. No combination of chemokines is used, in vivo testing is limited (and I agree very difficult). You may consider deleting this sentence (certainly as an opening sentence for the Discussion).
Response: We appreciate very much for the thoughtful suggestion of the reviewer. This sentence is deleted in the revised manuscript.
(5) Why was 5h used for the in vitro chemotaxis assay? This is extremely long for an assay with THP-1 cells.
Response: We apologize for the unclear description. The 5 hr includes 1 hr pre- incubation of CCL5 with the cells enable to form phase separation. After transferring the cells into the upper chamber, the actual chemotactic assay was 4 hr. This is clarified in the Materials and Methods section and the legend to each figure.
(6) Define "Sec" in Sec-CCL5-EGFP and "Dil" in the legend of Figure 4.
Response: The Sec-CCL5-EGFP should be “CCL5-EGFP’’, which has now been corrected. Dil is a cell membrane red fluorescent probe, which is now defined.
(7) Why are different cell concentrations used in the experiment described in Figure 5?
Response: The samples were from three volunteers who exhibited substantially different concentrations of cells in the blood. The experiment was designed using same amount of blood, so we did not normalize the number of the cell used for the experiment. Regardless of the difference in cell numbers, all three samples showed the same trend.
(8) Check the text for some typos: examples are on line 83 "ratio of CCL5"; line 142 "established cell lines"; line 196 "peripheral blood mononuclear cells"; line 224 "to mediate"; line 226 "bind"; line 247 "to form a gradient"; line 248 "of the glycocalyx"; line 343 and 346 "tetrasaccharide"; line 409-410 "wild-type"; line 543 "on the surface of CHO-K1 and CHO-677"; line 568 "white".
Response: Thanks for the careful reading. The typo errors are corrected and Manuscript was carefully read by colleagues.
Author response:
The following is the authors’ response to the original reviews.
Reviewer #1 (Public Review):
Summary:
This paper details a study of endothelial cell vessel formation during zebrafish development. The results focus on the role of aquaporins, which mediate the flow of water across the cell membrane, leading to cell movement. The authors show that actin and water flow together drive endothelial cell migration and vessel formation. If any of these two elements are perturbed, there are observed defects in vessels. Overall, the paper significantly improves our understanding of cell migration during morphogenesis in organisms.
Strengths:
The data are extensive and are of high quality. There is a good amount of quantification with convincing statistical significance. The overall conclusion is justified given the evidence.
Weaknesses:
There are two weaknesses, which if addressed, would improve the paper.
(1) The paper focuses on aquaporins, which while mediates water flow, cannot drive directional water flow. If the osmotic engine model is correct, then ion channels such as NHE1 are the driving force for water flow. Indeed this water is shown in previous studies. Moreover, NHE1 can drive water intake because the export of H+ leads to increased HCO3 due to the reaction between CO2+H2O, which increases the cytoplasmic osmolarity (see Li, Zhou and Sun, Frontiers in Cell Dev. Bio. 2021). If NHE cannot be easily perturbed in zebrafish, it might be of interest to perturb Cl channels such as SWELL1, which was recently shown to work together with NHE (see Zhang, et al, Nat. Comm. 2022).
(2) In some places the discussion seems a little confusing where the text goes from hydrostatic pressure to osmotic gradient. It might improve the paper if some background is given. For example, mention water flow follows osmotic gradients, which will build up hydrostatic pressure. The osmotic gradients across the membrane are generated by active ion exchangers. This point is often confused in literature and somewhere in the intro, this could be made clearer.
Reviewer #1 (Recommendations For The Authors):
(1) The paper focuses on aquaporins, which while mediating water flow, cannot drive directional water flow. If the osmotic engine model is correct, then ion channels such as NHE1 are the driving force for water flow. Indeed this water is shown in previous studies. Moreover, NHE1 can drive water intake because the export of H+ leads to increased HCO3 due to the reaction between CO2+H2O, which increases the cytoplasmic osmolarity (see Li, Zhou and Sun, Frontiers in Cell Dev. Bio. 2021). If NHE cannot be easily perturbed in zebrafish, it might be of interest to perturb Cl channels such as SWELL1, which was recently shown to work together with NHE (see Zhang, et al, Nat. Comm. 2022).
We thank Reviewer #1 for this very important comment and the suggestion to examine the function of ion channels in establishing an osmotic gradient to drive directional flow. We have taken on board the reviewer’s suggestion and examined the expression of NHE1 and SWELL1 in endothelial cells using published scRNAseq of 24 hpf ECs (Gurung et al, 2022, Sci. Rep.). We found that slc9a1a, slc9a6a, slc9a7, slc9a8, lrrc8aa and lrrc8ab are expressed in different endothelial subtypes. To examine the function of NHE1 and SWELL1 in endothelial cell migration, we used the pharmacological compounds, 5-(N-ethyl-Nisopropyl)amiloride (EIPA) and DCPIB, respectively. While we were unable to observe an ISV phenotype after EIPA treatment at 5, 10 and 50µM, we were able to observe impaired ISV formation after DCPIB treatment that was very similar to that observed in Aquaporin mutants. We were very encouraged by these results and proceeded to perform more detailed experiments whose results have yielded a new figure (Figure 6) and are described and discussed in lines 266 to 289 and 396 to 407, respectively, in the revised manuscript.
(2) In some places the discussion seems a little confusing where the text goes from hydrostatic pressure to osmotic gradient. It might improve the paper if some background is given. For example, mention water flow follows osmotic gradients, which will build up hydrostatic pressure. The osmotic gradients across the membrane are generated by active ion exchangers. This point is often confused in literature and somewhere in the intro, this could be made clearer.
Thank you for pointing out the deficiency in explaining how osmotic gradients drive water flow to build up hydrostatic pressure. We have clarified this in lines 50, 53 - 54 and 385.
The two recommendations listed above would improve the paper. They are however not mandatory. The paper would be acceptable with some clarifying rewrites. I am not an expert on zebrafish genetics, so it might be difficult to perturb ion channels in this model organism. Have the authors tried to perturb ion channels in these cells?
We hope that our attempts at addressing Reviewer’s 1 comments are satisfactory and sufficient to clarify the concerns outlined.
Reviewer #2 (Public Review):
Summary:
Directional migration is an integral aspect of sprouting angiogenesis and requires a cell to change its shape and sense a chemotactic or growth factor stimulus. Kondrychyn I. et al. provide data that indicate a requirement for zebrafish aquaporins 1 and 8, in cellular water inflow and sprouting angiogenesis. Zebrafish mutants lacking aqp1a.1 and aqp8a.1 have significantly lower tip cell volume and migration velocity, which delays vascular development. Inhibition of actin formation and filopodia dynamics further aggravates this phenotype. The link between water inflow, hydrostatic pressure, and actin dynamics driving endothelial cell sprouting and migration during angiogenesis is highly novel.
Strengths:
The zebrafish genetics, microscopy imaging, and measurements performed are of very high quality. The study data and interpretations are very well-presented in this manuscript.
Weaknesses:
Some of the mechanobiology findings and interpretations could be strengthened by more advanced measurements and experimental manipulations. Also, a better comparison and integration of the authors' findings, with other previously published findings in mice and zebrafish would strengthen the paper.
We thank Reviewer #2 for the critique that the paper can be strengthened by more advanced measurements and experimental manipulations. One of the technical challenges that we face is how to visualize and measure water flow directly in the zebrafish. We have therefore taken indirect approaches to assess water abundance in endothelial cells in vivo. One approach was to measure the diffusion of GEM nanoparticles in tip cell cytoplasm in wildtype and Aquaporin mutants, but results were inconclusive. The second was to measure the volume of tip cells, which should reflect water in/outflow. As the second approach produced clear and robust differences between wildtype ECs, ECs lacking Aqp1a.1 and Aqp8a.1 and ECs overexpressing Aqp1a.1 (revised Fig. 5), we decided to present these data in this manuscript.
We have also taken Reviewer 2 advice to better incorporate previously published data in our discussion (see below and lines 374 to 383 of the revised manuscript).
Reviewer #2 (Recommendations For The Authors):
I have a few comments that the authors may address to further improve their manuscript analysis, quality, and impact.
Major comments:
(1) Citation and discussion of published literature
The authors have failed to cite and discuss recently published results on the role of aqp1a.1 and aqp8a.1 in ISV formation and caliber in zebrafish (Chen C et al. Cardiovascular Research 2024). That study showed a similar impairment of ISV formation when aqp1a.1 is absent but demonstrated a stronger phenotype on ISV morphology in the absence of aqp8a.1 than the current manuscript by Kondrychyn I et al. Furthermore, Chen C et al show an overall decrease in ISV diameter in single aquaporin mutants suggesting that the cell volume of all ECs in an ISV is affected equally. Given this published data, are ISV diameters affected in single and double mutants in the current study by Kondrochyn I et al? An overall effect on ISVs would suggest that aquaporin-mediated cell volume changes are not an inherent feature of endothelial tip cells. The authors need to analyse/compare and discuss all differences and similarities of their findings to what has been published recently.
We apologise for having failed and discussed the recently published paper by Chen et al. This has been corrected and discussed in lines 374 to 383.
In the paper by Chen et al, the authors describe a role of Aqp1a.1 and Aqp8a.1 in regulating ISV diameter (ISV diameter was analysed at 48 hpf) but they did not examine the earlier stages of sprouting angiogenesis between 20 to 30 hpf, which is the focus of our study. We therefore cannot directly compare the ISV phenotypes with theirs. Nevertheless, we recognise that there are differences in ISV phenotypes from 2 dpf. For example, they did not observe incompletely formed or missing ISVs at 2 and 3 dpf, which we clearly observe in our study. This could be explained by differences in the mutations generated. In Chen et al., the sgRNA used targeted the end of exon 2 that resulted in the generation of a 169 amino acid truncated aqp1a.1 protein. However, in our approach, our sgRNA targeted exon 1 of the gene that resulted in a truncated aqp1a.1 protein that is 76 amino acid long. As for the aqp8a.1 zebrafish mutant that we generated, our sgRNA targeted exon 1 of the gene that resulted in a truncated protein that is 73 amino acids long. In Chen et al., the authors did not generate an aqp8a.1 mutant but instead used a crispant approach, which leads to genetic mosaicism and high experimental variability.
Following the reviewer’s suggestion, we have now measured the diameters of arterial ISVs (aISVs) and venous ISVs (vISVs) in aqp1a.1<sup>-/-</sup>, aqp8a.1<sup>-/-</sup> and aqp1a.1<sup>-/-</sup>;aqp8a.1<sup>-/-</sup> zebrafish. In our lab, we always make a distinction between aISVs and vISVs are their diameters are significantly different from each other. The results are in Fig S11A. While we corroborate a decrease in diameter in both aISVs and vISVs in single aqp1a.1<sup>-/-</sup> and double aqp1a.1<sup>-/-</sup>;aqp8a.1<sup>-/-</sup>.zebrafish, we observed a slight increase in diameter in both aISVs and vISVs in aqp8a.1<sup>-/-</sup> zebrafish at 2 dpf. We also measured the diameter of aISV and vISV in Tg(fli1ep:aqp1a.1-mEmerald) and Tg(fli1ep:aqp8a.1-mEmerald) zebrafish at 2 dpf (Fig S11B) and unlike in Chen et al., we could not detect a difference in the diameter between control and aqp1a.1- or aqp8a.1-overexpressing endothelial cells.
We also would also like to point out that, because ISVs are incompletely formed or are missing in aqp1a.1<sup>-/-</sup>;aqp8a.1<sup>-/-</sup> zebrafish (Fig. 3G – L), blood flow is most likely altered in the zebrafish trunk of these mutants, and this can have a secondary effect on blood vessel calibre or diameter. In fact, we often observed wider ISVs adjacent to unperfused ISVs (Fig. 3J) as more blood flow enters the lumenized ISV. Therefore, to determine the cell autonomous function of Aquaporin in mediating cell volume changes in vessel diameter regulation, one would need to perform cell transplantation experiments where we would measure the volume of single aqp1a.1<sup>-/-</sup>;aqp8a.1<sup>-/-</sup> endothelial cells in wildtype embryos with normal blood flow. As this is beyond the scope of the present study, we have not done this experiment during the revision process.
(2) Expression of aqp1a.1 and aqp8a.1
The quantification shown in Figure 1G shows a relative abundance of expression between tip and stalk cells. However, it seems aqp8a.1 is almost never detected in most tip cells. The authors could show in addition, the % of Tip and stalk cells with detectable expression of the 2 aquaporins. It seems aqp8a1 is really weakly or not expressed in the initial stages. Ofcourse the protein may have a different dynamic from the RNA.
We would like to clarify that aqp8a.1 mRNA is not detected in tip cells of newly formed ISVs at 20hpf. At 22 hpf, it is expressed in both tip cells (22 out of 23 tip cells analysed) and stalk cells of ISVs at 22hpf. This is clarified in lines 107 - 109. We also include below a graph showing that although aqp8a.1 mRNA is expressed in tip cells, its expression is higher in stalk cells.
Author response image 1.
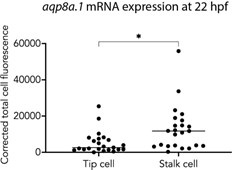
Could the authors show endogenously expressed or tagged protein by antibody staining? The analysis of the Tg(fli1ep:aqp8a.1-mEmerald)rk31 zebrafish line is a good complement, but unfortunately, it does not reveal the localization of the endogenously expressed protein. Do the authors have any data supporting that the endogenously expressed aqp8a.1 protein is present in sprouting tip cells?
We tested several antibodies against AQP1 (Alpha Diagnostic International, AQP11-A; ThermoFisher Scientific, MA1-20214; Alomone Labs, AQP-001) and AQP8 (Sigma Aldrich, SAB 1403559; Alpha Diagnostic International, AQP81-A; Almone Labs, AQP-008) but unfortunately none worked. As such, we do not have data demonstrating endogenous expression and localisation of Aqp1a.1 and Aqp8a.1 proteins in endothelial cells.
Could the authors perform F0 CRISPR/Cas9 mediated knockin of a small tag (i.e. HA epitope) in zebrafish and read the endogenous protein localization with anti-HA Ab?
CRISPR/Cas9 mediated in-frame knock-in of a tag into a genomic locus is a technical challenge that our lab has not established. We therefore cannot do this experiment within the revision period.
Given the double mutant phenotypic data shown, is aqp8a.1 expression upregulated and perhaps more important in aqp1a.1 mutants?
In our analysis of aqp1a.1 homozygous zebrafish, there is a slight down_regulation in _aqp8a.1 expression (Fig. S5C). Because the loss of Aqp1a.1 leads to a stronger impairment in ISV formation than the loss of Aqp8a.1 (see Fig. S6F, G, I and J), we believe that Aqp1a.1 has a stronger function than Aqp8a.1 in EC migration during sprouting angiogenesis.
Regarding the regulation of expression by the Vegfr inhibitor Ki8751, does this inhibitor affect Vegfr/ERK signalling in zebrafish and the sprouting of ISVs significantly?
ki8751 has been demonstrated to inhibit ERK signalling in tip cells in the zebrafish by Costa et al., 2016 in Nature Cell Biology. In our experiments, treatment with 5 µM ki8751 for 6 hours from 20 hpf also inhibited sprouting of ISVs.
The data presented suggest that tip cells overexpressing aqp1a.1-mEmerald (Figure 2C) need more than 6 times longer to migrate the same distance as tip cells expressing aqp8a.1mEmerald (Figure 2D). How does this compare with cells expressing only Emerald? A similar time difference can be seen in Movie S1 and Movie S2. Is it just a coincidence? Could aqp8a.1, when expressed at similar levels than aqp1a, be more functional and induce faster cell migration? These experiments were interpreted only for the localization of the proteins, but not for the potential role of the overexpressed proteins on function. Chen C et al. Cardiovascular Research 2024 also has some Aqp overexpression data.
The still images prepared for Fig. 2 C and D were selected to illustrate the localization of Aqp1a.1-mEmerald and Aqp8a.1-mEmerald at the leading edge of migrating tip cells. We did not notice that the tip cell overexpressing Aqp1a.1-mEmerald (Figure 2C) needed more than 6 times longer to migrate the same distance as the tip cell expressing aqp8a.1-mEmerald (Figure 2D), which the reviewer astutely detected. To ascertain whether there is a difference in migration speed between Aqp1a.1-mEmerald and Aqp8a.1-mEmerald overexpressing endothelial cells, we measured tip cell migration velocity of three ISVs from Tg(fli1ep:aqp1a.1-mEmerald) and Tg(fli1ep:aqp8a.1-mEmerald) zebrafish during the period of ISV formation (24 to 29 hpf) using the Manual Tracking plugin in Fiji. As shown in the graph, there is no significant difference in the migration speed of ECs overexpressing Aqp1a.1-mEmerald and Aqp8a.1-mEmerald, suggesting that Aqp8a.1-overexpressing cells migrate at a similar rate as Aqp1a.1-overexpressing cells. As we have not generated a Tg(fli1ep:mEmerald) zebrafish line, we are unable to determine whether endothelial cells migrate faster in Tg(fli1ep:aqp1a.1mEmerald) and Tg(fli1ep:aqp8a.1-mEmerald) zebrafish compared to endothelial cell expressing only mEmerald. As for the observation that tip cells overexpressing aqp1a.1mEmerald (Figure 2C) need more than 6 times longer to migrate the same distance as tip cells expressing aqp8a.1-mEmerald, we can only surmise that it is coincidental that the images selected “showed” faster migration of one ISV from Tg(fli1ep:aqp8a.1-mEmerald) zebrafish. We do not know whether the Aqp1a.1 and Aqp8a.1 are overexpressed to the same levels in Tg(fli1ep:aqp1a.1mEmerald) and Tg(fli1ep:aqp8a.1-mEmerald) zebrafish.
We would also like to point out that when we analysed the lengths of ISVs at 28 hpf in aqp1a.1<sup>-/-</sup> and aqp8a.1<sup>-/-</sup> zebrafish, ISVs were shorter in aqp1a.1<sup>-/-</sup> zebrafish compared to aqp8a.1<sup>-/-</sup> zebrafish (Fig. S6 F to J). These results indicate that the loss of Aqp1a.1 function causes slower migration than the loss of aqp8a.1 function, and suggest that Aqp1a.1 induces faster endothelial cell migration that Aqp8a.1.
Author response image 2.
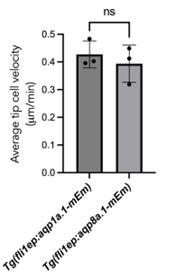
The data on Aqps expression after the Notch inhibitor DBZ seems unnecessary, and is at the moment not properly discussed. It is also against what is set in the field. aqp8a.1 levels seem to increase only 24h after DBZ, not at 6h, and still authors conclude that Notch activation inhibits aqp8a.1 expression (Line 138-139). In the field, Notch is considered to be more active in stalk cells, where aqp8a.1 expression seems higher (not lower). Maybe the analysis of tip vs stalk cell markers in the scRNAseq data, and their correlation with Hes1/Hey1/Hey2 and aqp1 vs aqp8 mRNA levels will be more clear than just showing qRT-PCR data after DBZ.
As our scRNAseq data did not include ECs from earlier during development when ISVs are developing, we have analysed of scRNAseq data of 24 hpf endothelial cells published by Gurung et al, 2022 in Scientific Reports during the revision of this manuscript. However, we are unable to detect separate clusters of tip and stalk cells. As such, we are unable to correlate hes1/hey1/hey2 expression (which would be higher in stalk cells) with that of aqp1a.1/aqp8a.1. Also, we have decided to remove the DBZ-treatment results from our manuscript as we agree with the two reviewers that they are unnecessary.
The paper would also benefit from some more analysis and interpretation of available scRNAseq data in development/injury/disease/angiogenesis models (zebrafish, mice or humans) for the aquaporin genes characterized here. To potentially raise a broader interest at the start of the paper.
We thank the reviewer for suggesting examining aquaporin genes in other angiogenesis/disease/regeneration models to expand the scope of aquaporin function. We will do this in future studies.
(3) Role of aqp1a.1 and aqp8a.1 on cytoplasmic volume changes and related phenotypes
In Figure 5 the authors show that Aqp1/Aqp8 mutant endothelial tip cells have a lower cytoplasmic volume than tip cells from wildtype fish. If aquaporin-mediated water inflow occurs locally at the leading edge of endothelial tip cells (Figure 2, line 314-318), why doesn't cytoplasmic volume expand specifically only at that location (as shown in immune cells by Boer et al. 2023)? Can the observed reduction in cytoplasmic volume simply be a side-effect of impaired filopodia formation (Figure 4F-I)?
We believe that water influx not only expands filopodia but also the leading front of tip cells (see bracket region in Fig. 4D), where Aqp1a.1-mEmerald/Aqp8a.1-mEmerald accumulate (Fig. 2), to generate an elongated protrusion and forward expansion of the tip cell. The decrease in cytoplasmic volume observed in the aqp1a.1;aqp8a.1 double mutant zebrafish is a result of decreased formation of these elongated protrusions at the leading front of migration tip cells as shown in Fig. 4E (compare to Fig. 4D), not from just a decrease in filopodia number. In fact, in the method used to quantify cell volume, mEmerald/EGFP localization is limited to the cytoplasm and does not label filopodia well (compare mEmerald/EGFP in green with membrane tagged-mCherry in Fig. 5A - C). The volume measured therefore reflects cytoplasmic volume of the tip cell, not filopodia volume.
Do the authors have data on cytoplasmic volume changes of endothelial tip cells in latrunculin B treated fish? The images in Figures 6 A,B suggest that there is a difference in cell volume upon lat b treatment only.
No, unfortunately we have not performed single cell labelling and measurement of tip cells in Latrunculin B-treated embryos. We can speculate that as there is a decrease in actindriven membrane protrusions in this experiment, one would also expect a decrease in cell volume as the reviewer has observed.
(4) Combined loss of aquaporins and actin-based force generation.
Lines 331-332 " we show that hydrostatic pressure is the driving force for EC migration in the absence of actin-based force generation"....better leave it more open and stick to the data. The authors show that aquaporin-mediated water inflow partially compensates for the loss of actin-based force generation in cell migration. Not that it is the key driving/rescuing force in the absence of actin-based force.
We have changed it to “we show that hydrostatic pressure can generate force for EC migration in the absence of actin-based force generation” in line 348.
(5) Aquaporins and their role in EC proliferation
In the study by Phnk LK et al. 2013, the authors have shown that proliferation is not affected when actin polymerization or filopodia formation is inhibited. However, in the current manuscript by Kondrychyn I. et al. this has not been analysed carefully. In Movie S4 the authors indicate by arrows tip cells that fail to invade the zebrafish trunk demonstrating a severe defect of sprouting initiation in these mutants. Yet, when only looking at ISVs that reach the dorsal side in Movie S4, it appears that they are comprised of fewer EC nuclei/ISV than the ISVs in Movie S3. At the beginning of DLAV formation, most ISVs in control Movie S3 consist of 3-4 EC nuclei, while in double mutants Movie S4 it appears to be only 2-3 EC nuclei. At the end of the Movie S4, one ISV on the left side even appears to consist of only a single EC when touching the dorsal roof. The authors provide convincing data on how the absence of aquaporin channels affects sprouting initiation and migration speed, resulting in severe delay in ISV formation. However, the authors should also analyse EC proliferation, as it may also be affected in these mutants, and may also contribute to the observed phenotype. We know that effects on cell migration may indirectly change the number of cells and proliferation at the ISVs, but this has not been carefully analysed in this paper.
We thank the reviewer for highlighting the lack of information on EC number and division in the aquaporin mutants. We have now quantified EC number in ISVs that are fully formed (i.e. connecting the DA or PCV to the DLAV) at 2 and 3 dpf and the results are displayed in Figure S10A and B. At 2 dpf, there is a slight but significant reduction in EC number in both aISVs and vISVs in aqp1a.1<sup>-/-</sup> zebrafish and an even greater reduction in the double aqp1a. aqp1a.1<sup>/-</sup>;aqp8a.1<sup>-/-</sup> zebrafish. No significant change in EC number was observed in aqp8a.1<sup>-/-</sup> zebrafish. EC number was also significantly decreased at 3 dpf for aqp1a.1<sup>-/-</sup>, aqp8a.1<sup>-/-</sup> and aqp1a.1<sup>-/-</sup>;aqp8a.1<sup>-/-</sup> zebrafish. The decreased in EC number per ISV may therefore contribute to the observed phenotype.
We have also quantified the number of cell divisions during sprouting angiogenesis (from 21 to 30 hpf) to assess whether the lack of Aquaporin function affects EC proliferation. This analysis shows that there is no significant difference in the number of mitotic events between aqp1a.1<sup>+/-</sup>; aqp8a.1<sup>+/-</sup> and aqp1a.1<sup>-/-</sup>;aqp8a.1<sup>-/-</sup> zebrafish (Figure S10 C), suggesting that the reduction in EC number is not caused by a decrease in EC proliferation.
These new data are reported on lines 198 to 205 of the manuscript.
Minor comments:
- Figure 3K data seems not to be necessary and even partially misleading after seeing Figure 3E. Fig. 3E represents the true strength of the phenotype in the different mutants.
Figure 3K has been removed from Figure 3.
- Typo Figure 3L (VII should be VI).
Thank you for spotting this typo. VII has been changed to VI.
- Line 242: The word "required" is too strong because there is vessel formation without Aqps in endothelial cells.
This has been changed to “ …Aqp1a.1 and Aqp8a.1 regulate sprouting angiogenesis…” (lines 238 - 239).
- From Figure S2, the doublets cluster should be removed.
We have performed a new analysis of 24 hpf, 34hpf and 3 dpf endothelial cells scRNAseq data (the previous analysis did not consist of 24 hpf endothelial cells). The doublets cluster is not included in the UMAP analysis.
- Better indicate the fluorescence markers/alleles/transgenes used for imaging in Figures 6A-D.
The transgenic lines used for this experiment are now indicated in the figure (this figure is now Figure 7).
Reviewer #3 (Public Review):
Summary:
Kondrychyn and colleagues describe the contribution of two Aquaporins Aqp1a.1 and Aqp8a.1 towards angiogenic sprouting in the zebrafish embryo. By whole-mount in situ hybridization, RNAscope, and scRNA-seq, they show that both genes are expressed in endothelial cells in partly overlapping spatiotemporal patterns. Pharmacological inhibition experiments indicate a requirement for VEGR2 signaling (but not Notch) in transcriptional activation.
To assess the role of both genes during vascular development the authors generate genetic mutations. While homozygous single mutants appear normal, aqp1a.1;aqp8a.1 double mutants exhibit defects in EC sprouting and ISV formation.
At the cellular level, the aquaporin mutants display a reduction of filopodia in number and length. Furthermore, a reduction in cell volume is observed indicating a defect in water uptake.
The authors conclude, that polarized water uptake mediated by aquaporins is required for the initiation of endothelial sprouting and (tip) cell migration during ISV formation. They further propose that water influx increases hydrostatic pressure within the cells which may facilitate actin polymerization and formation membrane protrusions.
Strengths:
The authors provide a detailed analysis of Aqp1a.1 and Aqp8a.1 during blood vessel formation in vivo, using zebrafish intersomitic vessels as a model. State-of-the-art imaging demonstrates an essential role in aquaporins in different aspects of endothelial cell activation and migration during angiogenesis.
Weaknesses:
With respect to the connection between Aqp1/8 and actin polymerization/filopodia formation, the evidence appears preliminary and the authors' interpretation is guided by evidence from other experimental systems.
Reviewer #3 (Recommendations For The Authors):
Figure 1 H, J:
The differential response of aqp1/-8 to ki8751 vs DBZ after 6h treatment is quite obvious. Why do the authors show the effect after 24h? The effect is more likely than not indirect.
We agree with the reviewer and we have now removed 24 hour Ki8751 treatment and all DBZ treatments from Figure 1.
Figure 2:
According to the authors' model anterior localization of Aqp1 protein is critical. The authors perform transient injections to mosaically express Aqp fusion proteins using an endothelial (fli1) promoter. For the interpretation, it would be helpful to also show the mCherry-CAAX channel in separate panels. From the images, it is not possible to discern how many cells we are looking at. In particular the movie in panel D may show two cells at the tip of the sprout. A marker labelling cell-cell junctions would help. Furthermore, the authors are using a strong exogenous promoter, thus potentially overexpressing the fusion protein, which may lead to mislocalization. For Aqp1a.1 an antibody has been published to work in zebrafish (e.g. Kwong et al., Plos1, 2013).
We would like to clarify that we generated transgenic lines - Tg(fli1ep:aqp1a.1-mEmerald) and Tg(fli1ep:aqp8a.1-mEmerald) - to visualize the localization of Aqp1a.1 and Aqp8a.1 in endothelial cells, and the images displayed in Fig. 2 are from the transgenic lines (not transient, mosaic expression).
To aid visualization and interpretation, we have now added mCherry-CAAX only channel to accompany the Aqp1a.1/Aqp8a.1-mEmerald channel in Fig. 2A and B. To discern how many cells there are in the ISVs at this stage, we have crossed Tg(fli1ep:aqp1a.1-mEmerald) and Tg(fli1ep:aqp8a.1-mEmerald) zebrafish to TgKI(tjp1a-tdTomato)<sup>pd1224</sup> (Levic et al., 2021) to visualize ZO1 at cell-cell junction. However, because tjp1-tdTomato is expressed in all cell types including the skin that lies just above the ISV and the signal in ECs in ISVs is very weak at 22 to 25 hpf, it was very difficult to obtain good quality images that can properly delineate cell boundaries to determine the number of cells in the ISVs at this early stage. Instead, we have annotated endothelial cell boundaries based on more intense mCherryCAAX fluorescence at cell-cell borders, and from the mosaic expression of mCherryCAAX that is intrinsic to the Tg(kdrl:ras-mCherry)<sup>s916</sup> zebrafish line.
In Fig. 2D, there are two endothelial cells in the ISV during the period shown but there is only 1 cell occupying the tip cell position i.e. there is one tip cell in this ISV. Unlike the mouse retina where it has been demonstrated that two endothelial cells can occupy the tip cell position side-by-side (Pelton et al., 2014), this is usually not observed in zebrafish ISVs. This is demonstrated in Movie S3, where it is clear that one nucleus (belonging to the tip cell) occupies the tip of the growing ISV. The accumulation of intracellular membranes is often observed in tip cells that may serve as a reservoir of membranes for the generation of membrane protrusions at the leading edge of tip cells.
We agree that by generating transgenic Tg(fli1ep:aqp1a.1-mEmerald) and Tg(fli1ep:aqp8a.1mEmerald) zebrafish, Aqp1a.1 and Aqp8a.1 are overexpressed that may affect their localization. The eel anti-Aqp1a.1 antibody used in (Kwong et la., 2013) was a gift from Dr. Gordon Cramb, Univ. of St Andrews, Scotland and it was first published in 2001. This antibody is not available commercially. Instead, we have tried to several other antibodies against AQP1 (Alpha Diagnostic International , AQP11-A; ThermoFisher Scientific, MA120214; Alomone Labs, AQP-001) and AQP8 (Sigma Aldrich, SAB 1403559; Alpha Diagnostic International, AQP81-A; Almone Labs, AQP-008) but unfortunately none worked. As such, we cannot compare localization of Aqp1a.1-mEmerald and Aqp8a.1-mEmerald with the endogenous proteins.
Figure 3:
E: the quantification is difficult to read. Wouldn't it be better to set the y-axis in % of the DV axis? (see also Figure S6).
We would like to show the absolute length of the ISVs, and to illustrate that the ISV length decreases from anterior to posterior of the zebrafish trunk. We have increased the size of Fig. 3E to enable easier reading of the bars.
K: This quantification appears arbitrary.
We have removed this panel from Figure 3.
G-J: The magenta channel is difficult to see. Is the lifeact-mCherry mosaic? In panel J there appears to be a nucleus between the sprout and the DLAV. It would be helpful to crop the contralateral side of the image.
No, the Tg(fli1:Lifeact-mCherry) line is not mosaic. The “missing” vessels are not because of mosaicism in transgene but because of truncated ISVs that is a phenotype of loss Aquaporin function. We have changed the magenta channel to grey and hope that by doing so, the reviewer will be able to see the shape of the blood vessels more clearly. We would like to leave the contralateral side in the images, as it shows that the defective vessel is only on one side of body. Furthermore, when we tried to remove it (reducing the number of Z-stacks) neighbour ISV looks incomplete because the embryos were not mounted flat. To clarify what the nucleus between the sprout and the DLAV is, we have indicated that it is that of the contralateral ISV.
L: I do not quite understand the significance of the different classes of phenotypes. Do the authors propose different morphogenetic events or contexts of how these differences come about?
Here, we report the different types of ISV phenotypes that we observe in 3 dpf aqp1a.1<sup>-/-</sup>; aqp8a.1<sup>-/-</sup> zebrafish (Fig. 3 and Fig. S7). As demonstrated in Fig. 4, most of the phenotypes can be explained by the delayed emergence of tip cells from the dorsal aorta and slower tip cell migration. However, in some instances, we also observed retraction of tip cells (Movie S4) and failure of tip cells to emerge from the dorsal aorta or endothelial cell death (see attached figure on page 14), which can give rise to the Class II phenotype. In the dominant class I phenotype (in contrast to class II), secondary sprouting from the posterior cardinal vein is unaffected, and the secondary sprout migrates dorsally passing the level of horizontal myoseptum but cannot complete the formation of vISV (it stops beneath the spinal cord). The Class III phenotype appears to result from a failure of the secondary sprout to fuse with the regressed primary ISV. In the Class IV phenotype, the ventral EC does not maintain a connection to the dorsal aorta. We did not examine how Class III and IV phenotypes arise in detail in this current study.
Author response image 3.
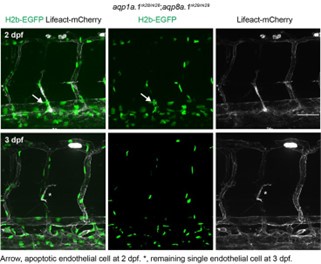
Figure 4:
This figure nicely demonstrates the defects in cell behavior in aqp mutants.
In panel F it would be helpful to show the single channels as well as the merge.
We have now added single channels for PLCd1PH and Lifeact signal in panels F and G.
In Figure 1 the authors argue that the reduction of Aqp1/8 by VEGFR2 inhibition may account for part of that phenotype. In turn, the aqp phenotype seems to resemble incomplete VEGFR2 inhibition. The authors should check whether expression Aqp1Emerald can partially rescue ki8751 inhibition.
To address the reviewer’s comment, we have treated Tg(fli1ep:Aqp1-Emerald) embryos with ki8751 from 20 hpf for 6 hours but we were unable to observe a rescue in sprouting. It could be because VEGFR2 inhibition also affects other downstream signalling pathways that also control cell migration as well as proliferation.
Based on previous studies (Loitto et al.; Papadopoulus et al.) the authors propose that also in ISVs aquaporin-mediated water influx may promote actin polymerization and thereby filopodia formation. However, while the effect on filopodia number and length is well demonstrated, the underlying cause is less clear. For example, filopodia formation could be affected by reduced cell polarization. This can be tested by using a transgenic golgi marker (Kwon et al., 2016).
We have examined tip cell polarity of wildtype, aqp1a.1<sup>-/-</sup> and aqp8a. 1<sup>-/-</sup> embryos at 24-26 hpf by analysing Golgi position relative to the nucleus. We were unable to analyze polarity in aqp1a.1<sup>rk28/rk28</sup>; aqp8a.1<sup>rk29/rk29</sup> embryos as they exist in an mCherry-containing transgenic zebrafish line (the Golgi marker is also tagged to mCherry). The results show that tip cell polarity is similar, if not more polarised, in aqp1a.1<sup>-/-</sup> and aqp8a. 1<sup>-/-</sup> embryos when compared to wildtype embryos (Fig. S10D). This new data is discussed in lines 234 to 237.
Figure 5:
Panel D should be part of Figure 4.
Panel 5D is now in panel J of Figure 4 and described in lines 231 and 235.
Author Response
The following is the authors’ response to the original reviews.
Reviewer #2 (Public Review):
Making state-of-the-art (super-resolution) microscopy widely available has been the subject of many publications in recent years as correctly referenced in the manuscript. By advocating the ideas of open-microscopy and trying to replace expensive, scientific-grade components such as lasers, cameras, objectives, and stages with cost-effective alternatives, interested researchers nowadays have a number of different frameworks to choose from. In the iteration of the theme presented here, the authors used the existing modular UC2 framework, which consists of 3D printable building blocks, and combined a cheapish laser, detector and x,y,(z) stage with expensive filters/dichroics and a very expensive high-end objective (>15k Euros). This particular choice raises a first technical question, to which extent a standard NA 1.3 oil immersion objective available for <1k would compare to the chosen NA 1.49 one.
Measurement of the illumination quality (e.g. the spectral purity) of low budget lasers convinced us of the necessity to use spectral filtering. These cannot be replaced with lower budget alternatives, to sill retain the necessary sensitivity to image single molecules. As expected, the high-quality objectives are able to produce high-quality data. Lower budget alternatives (<500 €) to replace the objective have been tried out. Image quality is reduced but key features in fluorescent images can be identified (see figure S1). The usage of a low budget objective for SMLM imaging is possible, but quality benchmarks such as identifying railroad tracks along microtubule profiles is not possible. Their usage is not optimal for applications aiming to visualize single molecules and might find better application in teaching projects.
The choice of using the UC2 framework has the advantage, that the individual building blocks can be 3D printed, although it should be mentioned that the authors used injection-molded blocks that will have a limited availability if not offered commercially by a third party. The strength of the manuscript is the tight integration of the hardware and the software (namely the implementations of imSwitch as a GUI to control data acquisition, OS SMLM algorithms for fast sub-pixel localisation and access to Napari).
The injection-molded cubes can be acquired through the OpenUC2 platform. Alternatively, the 3D printable version of the cubes is freely available and just requires the user to have a 3D printer. https://github.com/openUC2/UC2-GIT/tree/master/CAD/CUBE_EmptyTemplate
The presented experimental data is convincing, demonstrating (1) extended live cell imaging both using bright-field and fluorescence in the incubator, (2) single-particle tracking of quantum dots, and (3) and STORM measurements in cells stained against tubulin. In the following I will raise two aspects that currently limit the clarity and the potential impact of the manuscript.
First, the manuscript would benefit from further refinement. Elements in Figure 1d/e are not described properly. Figure 2c is not described in the caption. GPI-GFP is not introduced. MMS (moment scaling spectrum) could benefit from a one sentence description of what it actually is. In Figure 6, the size of the STORM and wide-field field of views are vastly different, the distances between the peaks on the tubuli are given in micrometers rather than nanometers. (more in the section on recommendations for the author)
Second, and this is the main criticism at this point, is that although all the information and data is openly available, it seems very difficult to actually build the setup due to a lack of proper documentation (as of early July 2023).
1) The bill of materials (https://github.com/openUC2/UC2-STORM-and-Fluorescence#bill-of-material) should provide a link to the commercially available items. Some items are named in German. Maybe split the BoM in commercially available and 3D printable parts (I first missed the option to scroll horizontally).
2) The links to the XY and Z stage refer to the general overview site of the UC2 project (https://github.com/openUC2/) requiring a deep dive to find the actual information.
3) Detailed building instructions are unfortunately missing. How to assemble the cubes (pCad files showing exploded views, for example)? Trouble shooting?
4) Some of the hardware details (e.g. which laser was being used, lenses, etc) should be mentioned in the manuscript (or SI)
I fully understand that providing such level of detail is very time consuming, but I hope that the authors will be able to address these shortcomings.
1) The bill of materials has been and will also in future still be improved. The items have been sorted into UC2 printed parts and externally acquired parts. The combination of part name as well as provider enables users to find and acquire the same parts. Additionally, depending on the country where the user is located, different providers of a given part might be advantageous as delivery means and costs might vary.
2) The Z-stage now has a specific repository with different solutions, offering different solutions with different levels of movement precision. According to the user and their budget, different solutions can be optimal for the endeavor.
https://github.com/openUC2/UC2-Zstage
The XY stage now also has a detailed repository, as the motorizing of the stage requires a fair amount of tinkering. The video tutorials and the detailed instructions on stage motorizing should help any user to reproduce the stage shown within this manuscript. https://github.com/openUC2/UC2-Motorized-XY-Table
3) The updated repository has a short video showing the general assembly of the cubes and the layers. Additionally, figure S2 shows all the pieces that are included in every layer (as a photograph as well as CAD). An exploded view of the complete setup would certainly be a helpful visualization of the complete setup. We however hope that the presented assembly tutorials and documents are sufficient to successfully reproduce the U.C.STORM setup.
First, we want to thank the reviewers for their effort to help us improving our work. We apologize for any trivial mistakes we had overlooked. Please find below our answers to the very constructive and helpful comments of the editors.
Recommendations for the authors:
Reviewer #1 (Recommendations for The Authors):
To complement the current data set:
Figure 2(a & b): Panels i & ii, were chosen on the area where the distribution of the laser appears to be flatter. Can the authors select microtubules from a different section? Otherwise, it is reasonable to also crop the field-of-view along the flatter area (as done in Fig 6).
Figure 2 was changed to according to the reviewer’s suggestions. The profiles of microtubules from a different section have similar profiles, but the region with best illumination thus best SNR of the profile have been used for the figure.
Figure 2(c): The current plot shows the gaussian distribution which does not appear to be centered. Instead of a horizontal line, can the authors provide a diagonal profile across the field of view and update the panel below?
A diagonal cross-section of the illuminated FOV is provided in figure 2 to replace the previous horizontal profile. The pattern seems not to be perfectly radially symmetric, and more light seems to be blocked at the bottom of the illumination pattern compared to the top. A possible improvement can be provided by a fiber-coupled laser, that could provide a more homogeneous illumination while being easier to handle in the assembly process.
Author response image 1.
Diagonal cross-section of the illuminated FOV. Pixel-size (104nm) is the same as in figure 2. Intensity has been normalized according to the maximal value.
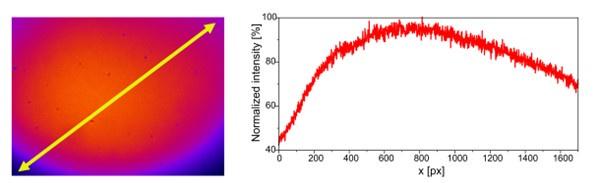
Figure 2(d): The system presents a XY drift of ~500nm over the course of a couple of hours. However, is not clear how the focus is being maintained. Can the authors clarify this point and add the axial drift to the plot?
The axial position of the sample could be maintained over a prolonged period of time without correcting for drift. Measurements where an axial shift was induced by tension pulses in the electronics have been discarded, but the stability of the stage seems to be sufficient to allow for imaging without lateral and axial drift correction. The XY drift measurement displayed in Figure 2(d) can be extended by measuring the σ of the PSF over time. The increase of σ would suggest an axial displacement in relation to the focus plane. In these measurements, a slight axial drift can be seen, the fluorescent beads however can still be localized over the whole course of the measurement.
A separate experiment was performed, using the same objective on the UC2 setup and on a high-quality setup equipped with a piezo actuator able to move in 10 nm steps. The precise Z steps of the piezo allows to reproducibly swipe through the PSF shape and to give an estimate of the axial displacement of the sample, according to the changes in PSF FWHM (Full Width at Half Maximum). When superimposing the graph with the UC2 measurement of fluorescent beads with the smallest possible Z step, an estimate about the relative axial position of the sample can be provided. The accuracy of the stage however remains limited.
Author response image 2.
Drift Figure: a. Drift of fluorescent TS beads on the UC2 setup positioned upon an optical table over a duration of two hours. Beads are localized and resulting displacement in i. and ii. are plotted in the graphs below. The procedure is repeated in b. with the microscope placed on a laboratory bench instead. c. (for the optical table i.) and d. (for the laboratory bench i.) show the variation in the sigma value of the localized beads over the measurement duration. As the sigma values changes when the beads are out of focus, the stability of the setup can be confirmed, as it remains practically unchanged over the measurement duration.
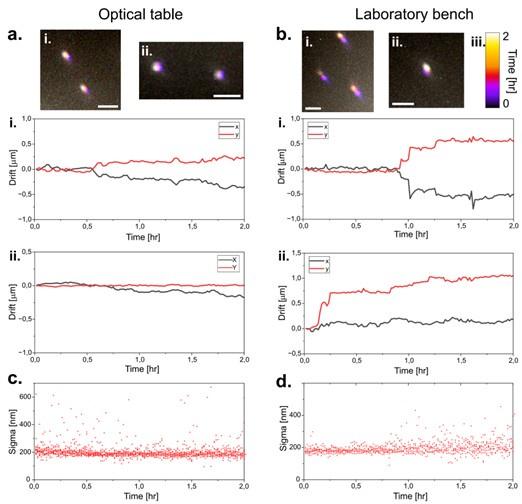
Author response image 3.
Z-focus Figure: Estimation of the axial position of TS beads on the UC2 setup. a. The change in PSF FWHM was quantified by acquiring a Z stack of a beads sample. The homebuilt high-quality setup (HQ) was used as a reference, by using the same objective and TS sample. The PSF FWHM on the UC2 setup was measured using the lowest possible axial stage displacement. A Z-position can thus be estimated for single molecules, as displayed in b.
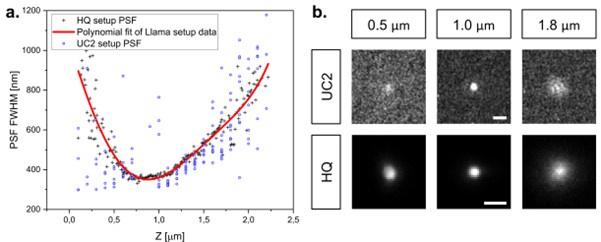
Addressing the seemingly correlated behavior of the X and Y drift:
Further measurement show less correlation between drift in X and in Y. Simultaneous motion in X and Y seems to indicate that the stage or the sample is tilted. The collective movement in X and Y seems accentuated by bigger jumps, probably originating from vibrations (as more predominantly shown in the measurements on the laboratory bench compared to the optical table). Tension fluctuations inducing motion of the stage are possible but are highly unlikely to have induced the drift in the displayed measurements.
Figure 3: Can the authors comment on the effect or otherwise potential effect of the incubator (humidity, condensation etc) may have on the system (e.g., camera, electronics etc)?
When moving the microscope into the incubator, the first precaution is to check if the used electronics are able to perform at 37° C. Then, placing the microscope inside the incubator can induce condensation of water droplets at the cold interfaces, potentially damaging the electronics or reducing imaging quality. This can be prevented by preheating the microscope in e.g. an incubator without humidity, for a few hours before placing it within the functional incubator. The used incubator should also be checked for air streams (to distribute the CO2), and a direct exposure of the setup to the air stream should be prevented. The usage of a layer of foam material (e.g. Polyurethane) under the microscope helps to reduce possible effects of incubator vibrations on the microscope. The hydrophilic character of PLA makes its usage within the incubator challenging due to its reduced thermal stability. The temperature also inherently reduces the mechanical stability of 3D printed parts. Using a less hydrophilic and more thermally stable plastic, such as ABS, combined with a higher percentage of infill are the empirical solution to this challenge. Further options and designs to improve the usage of the microscope within the incubator are still in developement.
Figure 5: Can the authors perform single molecule experiments with an alternative tag such as Alexa647?
The SPT experiments were performed with QDs to make use of their photostability and brightness. The dSTORM experiment suggests that imaging single AF647 molecules with sufficient SNR is possible. The usage of AF647 for SPT is possible but would reduce the accuracy of the localization and shorten the acquired track-lengths, due to the blinking properties of AF647 when illuminated. The tracking experiment with the QDs thus was a proof of concept that the SPT experiments are possible and allow to reproduce the diffusion coefficients published in common literature. The usage of alternative tags can be an interesting extension of the capabilities that users can perform for their applications.
Figure 6: The authors demonstrate dSTORM of microtubules. It would enhance the paper to also demonstrate 3D imaging (e.g., via cylindrical lens).
The usage of a cylindrical lens for 3D imaging was not performed yet. The implementation would not be difficult, given the high modularity of the setup in general. The calibration of the PSF shape with astigmatism might however be challenging as the vertical scanning of the Z-stage lacks reliability in its current build. Methods such as biplane imaging might also be difficult to implement, as the halved number of photons in each channel leads to losses in the accuracy of localization. As a future improvement of the setup, the option of providing 3D information with single molecule accuracy is definitely desirable and will be tried out. In the following figure, two concepts for introducing 3D imaging capabilities in the detection layer of the microscope are presented.
Author response image 4.
3D concept Figure: Two possible setup modifications to provide axial information when imaging single molecules. a. A cylindrical lens can be placed to induce an asymmetry between the PSF FWHM in x and in y. Every Z position can be identified by two distinct PSF FWHM values in X and Y. b. By splitting the beam in two and defocusing one path, every PSF will have a specific set of values for its FWHM on the two detectors.
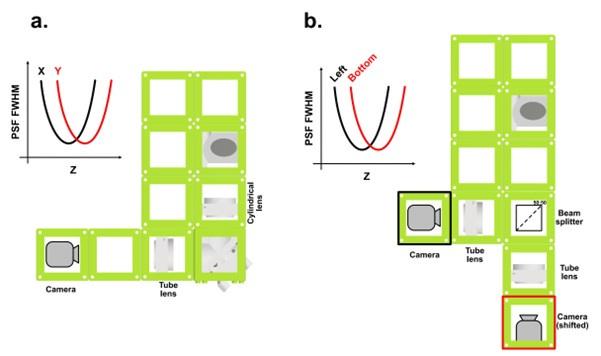
Imaging modalities section: Regarding the use of cling film to diffuse; can the authors comment on the continual use of this approach, including its degradation over time?
The cling foil was only used as a diffuser for broadening the laser profile. A detailed analysis of the constitution of the foil was not done, as no visible changes could be seen on the illumination pattern and the foil itself. The piece of cling foil is attached to a rotor. Detaching of the cling foil or vibrations originating from the rotor need to be minimized. By keeping the rotation speed to a necessary minimum and attaching the cling foil correctly to the rotor, a usable solution can be created. The low price of the cling foil provides the possibility to exchange the foil on a regular basis, allowing to keep the foil under optimal conditions.
Author response image 5.
Profile Figure: By moving a combination of pinhole and photometer to scan through the laser profile with a translational mount, the shape of the laser beam can be estimated. The cling foil plays the same role as a diffuser in other setups.
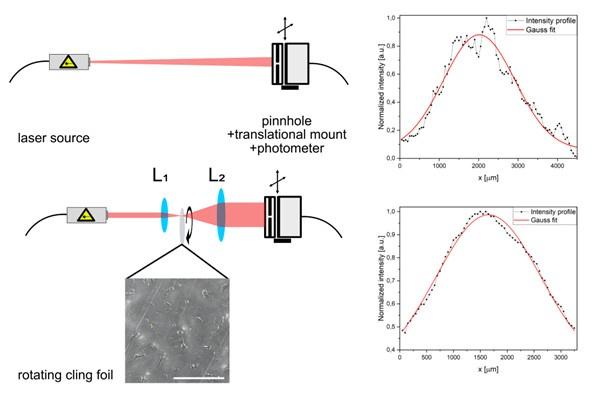
Reviewer #2 (Recommendations for The Authors):
lines
20, add "," after parts
110, rotating cling foil?
112/116, "custom 3D printed" I thought they were injection molded, please finalize
113, "puzzle pieces" rephrase and they are also barely visible
119, not clear that the stage is a manual stage that was turned into a motorised one by adding belts
123-126, detail for SI,
132, replace Arduino-coded with Arduino-based
143, add reference to Napari
146, (black) cardboard seems to be a cheaper and quicker alternative
153, dichroic
151-155, reads more like a blog post than a paper (maybe add a section on trouble shooting)
156, antibody?
167/189, moderate, please be specific
194, layer of foam material, specify
221, add description/reference to GPI. What is that? why is it relevant?
226: add one sentence description of MMS
318, add "," after students
332-334, as mentioned earlier, not clear, you bought a manual stage and connected belts, correct?
376-377, might be difficult to understand for the layman
391, what laser was used?
Figure 1, poor contrast between components, components visible should be named as much as possible, maybe provide the base layer in a different shade. To me, the red and blue labels look like fluorophores.
Figure 1. looks like d is the excitation layer and not e, please fix.
Figure 2, caption a-c, figure 1-d!, btw, why is the drift so anti-correlated?
Figure 6 (line 259) nanometer I guess, not micrometer
We now incorporated all the above-mentioned changes in the manuscript. Furthermore we added the supplementary Figures as below.
Author response image 6.
Basic concept of the UC2 setup: Left: Cubes (green) are connected to one another via puzzle pieces (white). Middle: 3D printed mounts have been designed to adapt various optics (right) to the cube framework. Combined usage of cubes and design of various mounts allows to interface various optics for the assembly.

Author response image 7.
Building the UC2 widefield microscope: a. Photograph of the complete setup. b. All pieces necessary to build the setup. A list of the components can be found in the bill of materials. c. Bottom emission layer of the microscope before assembly. d. Emission layer after assembly. Connection between cubes is doubled by using a layer of puzzles on the top and the bottom of the emission layer. e. CAD schematic of the emission layer and the positioning of the optics. f. Middle excitation layer of the microscope before assembly. Beam magnifier and homogenizer have been left out for clarity. g. Excitation layer after assembly is also covered by a puzzle layer. h. CAD schematic of the excitation layer and the positioning of the optics. i. Z-stage photograph and corresponding CAD file. Motor of the stage is embedded within the bottom cube. j. A layer of empty cubes supports the microscope stage. k. At this stage of the assembly, the objective is screwed into the objective holder. l. Finally, the stage is wired to the electronics and can then be mounted on top of the microscope (see a.).
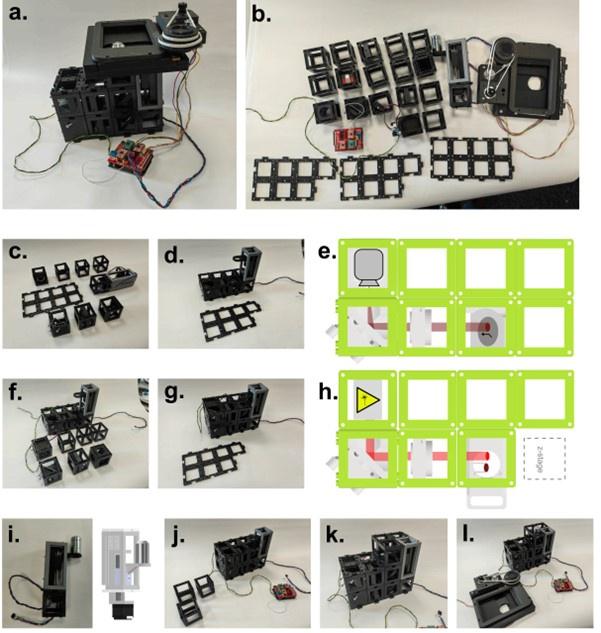
Author response image 8.
Measurements performed on the UC2 setup with lower budget objectives. The imaged sample is HeLa cells, stably transfected to express CLC-GFP, then labelled with AF647 through immunostaining. The setup has been kept identical except for the objectives. Scale bar respectively represents 30 µm.
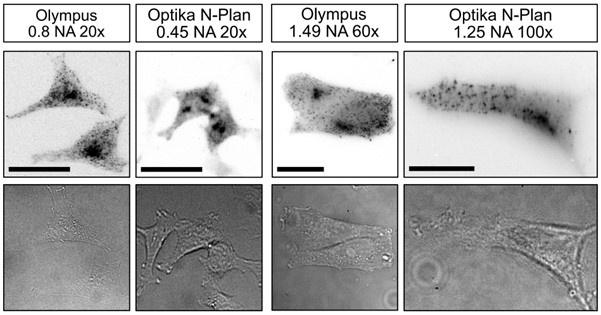
Author response:
The following is the authors’ response to the original reviews.
Reviewer #1 (Public review):
Summary:
This work investigated the role of CXXC-finger protein 1 (CXXC1) in regulatory T cells. CXXC1-bound genomic regions largely overlap with Foxp3-bound regions and regions with H3K4me3 histone modifications in Treg cells. CXXC1 and Foxp3 interact with each other, as shown by co-immunoprecipitation. Mice with Treg-specific CXXC1 knockout (KO) succumb to lymphoproliferative diseases between 3 to 4 weeks of age, similar to Foxp3 KO mice. Although the immune suppression function of CXXC1 KO Treg is comparable to WT Treg in an in vitro assay, these KO Tregs failed to suppress autoimmune diseases such as EAE and colitis in Treg transfer models in vivo. This is partly due to the diminished survival of the KO Tregs after transfer. CXXC1 KO Tregs do not have an altered DNA methylation pattern; instead, they display weakened H3K4me3 modifications within the broad H3K4me3 domains, which contain a set of Treg signature genes. These results suggest that CXXC1 and Foxp3 collaborate to regulate Treg homeostasis and function by promoting Treg signature gene expression through maintaining H3K4me3 modification.
Strengths:
Epigenetic regulation of Treg cells has been a constantly evolving area of research. The current study revealed CXXC1 as a previously unidentified epigenetic regulator of Tregs. The strong phenotype of the knockout mouse supports the critical role CXXC1 plays in Treg cells. Mechanistically, the link between CXXC1 and the maintenance of broad H3K4me3 domains is also a novel finding.
Weaknesses:
(1) It is not clear why the authors chose to compare H3K4me3 and H3K27me3 enriched genomic regions. There are other histone modifications associated with transcription activation or repression. Please provide justification.
Thank you for highlighting this important point. We chose to focus on H3K4me3 and H3K27me3 enriched genomic regions because these histone modifications are well-characterized markers of transcriptional activation and repression, respectively. H3K4me3 is predominantly associated with active promoters, while H3K27me3 marks repressed chromatin states, particularly in the context of gene regulation at promoters. This duality provides a robust framework for investigating the balance between transcriptional activation and repression in Treg cells. While histone acetylation, such as H3K27ac, is linked to enhancer activity and transcriptional elongation, our focus was on promoter-level regulation, where H3K4me3 and H3K27me3 are most relevant. Although other histone modifications could provide additional insights, we chose to focus on these two to maintain clarity and feasibility in our analysis. We have revised the text accordingly; please refer to Page 18, lines 353-356.
(2) It is not clear what separates Clusters 1 and 3 in Figure 1C. It seems they share the same features.
We apologize for not clarifying these clusters clearly. Cluster 1 and 3 are both H3K4me3 only group, with H3K4me3 enrichment and gene expression levels being higher in Cluster 1. At first, we divided the promoters into four categories because we wanted to try to classify them into four categories: H3K4me3 only, H3K27me3 only, H3K4me3-H3K27me3 co-occupied, and None. However, in actual classification, we could not distinguish H3K4me3-H3K27me3 co-occupied group. Instead, we had two categories of H3K4me3 only, with cluster 1 having a higher enrichment level for H3K4me3 and gene expression levels.
(3) The claim, "These observations support the hypothesis that FOXP3 primarily functions as an activator by promoting H3K4me3 deposition in Treg cells." (line 344), seems to be a bit of an overstatement. Foxp3 certainly can promote transcription in ways other than promoting H3K3me3 deposition, and it also can repress gene transcription without affecting H3K27me3 deposition. Therefore, it is not justified to claim that promoting H3K4me3 deposition is Foxp3's primary function.
Thank you for your insightful feedback. We agree that the statement in line 344 may have overstated the role of FOXP3 in promoting H3K4me3 deposition as its primary function. As you pointed out, FOXP3 is indeed a multifaceted transcription factor that regulates gene expression through various mechanisms. It can promote transcription independent of H3K4me3 deposition, as well as repress transcription without directly influencing H3K27me3 levels.
To more accurately reflect the broader regulatory functions of FOXP3, we have revised the manuscript. The updated text (Page 19, lines 385-388) now reads:
"These findings collectively support the conclusion that FOXP3 contributes to transcriptional activation in Treg cells by promoting H3K4me3 deposition at target loci, while also regulating gene expression directly or indirectly through other epigenetic modifications.
(4) For the in vitro suppression assay in Figure S4C, and the Treg transfer EAE and colitis experiments in Figure 4, the Tregs should be isolated from Cxxc1 fl/fl x Foxp3 cre/wt female heterozygous mice instead of Cxxc1 fl/fl x Foxp3 cre/cre (or cre/Y) mice. Tregs from the homozygous KO mice are already activated by the lymphoproliferative environment and could have vastly different gene expression patterns and homeostatic features compared to resting Tregs. Therefore, it's not a fair comparison between these activated KO Tregs and resting WT Tregs.
Thank you for raising this insightful point regarding the potential activation status of Treg cells in homozygous knockout mice. To address this concern, we performed additional experiments using Treg cells isolated from Foxp3<sup>Cre/+</sup>Cxxc1<sup>fl/fl</sup> (hereafter referred to as “het-KO”) female mice and their littermate controls, Foxp3<sup>Cre/+</sup>Cxxc1<sup>fl/+</sup> (referred to as “het-WT”) mice.
The results of these new experiments are now included in the manuscript (Page25, lines 507–509, Figure 6E and Figure S6A-E):
(1) In the in vitro suppression assay, Treg cells from het-KO mice exhibited reduced suppressive function compared to het-WT Treg cells. This finding underscores the intrinsic defect in Treg cells suppressive capacity attributable to the loss of one Cxxc1 allele.
(2) In the experimental autoimmune encephalomyelitis (EAE) model, Treg cells isolated from het-KO mice also demonstrated impaired suppressive function.
(5) The manuscript didn't provide a potential mechanism for how CXXC1 strengthens broad H3K4me3-modified genomic regions. The authors should perform Foxp3 ChIP-seq or Cut-n-Taq with WT and Cxxc1 cKO Tregs to determine whether CXXC1 deletion changes Foxp3's binding pattern in Treg cells.
Thank you for raising this important point. To address your suggestion, we performed CUT&Tag experiments and found that Cxxc1 deletion does not alter FOXP3 binding patterns in Treg cells. Most FOXP3-bound regions in WT Treg cells were similarly enriched in KO Treg cells, indicating that Cxxc1 deficiency does not impair FOXP3’s DNA-binding ability. These results have been added to the revised manuscript (Page 28, lines 567-575, Figure S8A-B) and are further discussed in the Discussion (Pages 28-29, lines 581-587).
Reviewer #2 (Public review):
FOXP3 has been known to form diverse complexes with different transcription factors and enzymes responsible for epigenetic modifications, but how extracellular signals timely regulate FOXP3 complex dynamics remains to be fully understood. Histone H3K4 tri-methylation (H3K4me3) and CXXC finger protein 1 (CXXC1), which is required to regulate H3K4me3, also remain to be fully investigated in Treg cells. Here, Meng et al. performed a comprehensive analysis of H3K4me3 CUT&Tag assay on Treg cells and a comparison of the dataset with the FOXP3 ChIP-seq dataset revealed that FOXP3 could facilitate the regulation of target genes by promoting H3K4me3 deposition.
Moreover, CXXC1-FOXP3 interaction is required for this regulation. They found that specific knockdown of Cxxc1 in Treg leads to spontaneous severe multi-organ inflammation in mice and that Cxxc1-deficient Treg exhibits enhanced activation and impaired suppression activity. In addition, they have also found that CXXC1 shares several binding sites with FOXP3 especially on Treg signature gene loci, which are necessary for maintaining homeostasis and identity of Treg cells.
The findings of the current study are pretty intriguing, and it would be great if the authors could fully address the following comments to support these interesting findings.
Major points:
(1) There is insufficient evidence in the first part of the Results to support the conclusion that "FOXP3 functions as an activator by promoting H3K4Me3 deposition in Treg cells". The authors should compare the results for H3K4Me3 in FOXP3-negative conventional T cells to demonstrate that at these promoter loci, FOXP3 promotes H3K4Me3 deposition.
Thank you for this insightful comment. We have already performed additional experiments comparing H3K4Me3 levels between FOXP3-positive Treg cells and FOXP3-negative conventional T cells (Tconv). Please refer to Pages 18, lines 361-368, and Figure 1C and Figure S1C for the results. Our results show that H3K4Me3 abundance is higher at many Treg-specific gene loci in Treg cells compared to Tconv cells. This supports our conclusion that FOXP3 promotes H3K4Me3 deposition at these loci.
(2) In Figure 3 F&G, the activation status and IFNγ production should be analyzed in Treg cells and Tconv cells separately rather than in total CD4+ T cells. Moreover, are there changes in autoantibodies and IgG and IgE levels in the serum of cKO mice?
Thank you for your valuable suggestions. In response to your comment, we reanalyzed the data in Figures 3F and 3G to assess the activation status and IFN-γ production in Tconv cells. The updated analysis revealed that Cxxc1 deletion in Treg cells leads to increased activation and IFN-γ production in Tconv cells. Additionally, we corrected the analysis of IL-17A and IL-4 expression, which were upregulated in Tconv cells. These updated results are now included in the revised manuscript (Page 21, lines 429-431, Figure 3I and Figure S3E-F).
Additionally, we examined autoantibodies and immunoglobulin levels in the serum of Cxxc1 cKO mice. Our data show a significant increase in serum IgG levels, accompanied by elevated IgG autoantibodies, indicating heightened autoimmune responses. In contrast, serum IgE levels remained largely unchanged. The results are detailed in the revised manuscript (Page 21, lines 421-423, Figure 3E and Figure S3B).
(3) Why did Cxxc1-deficient Treg cells not show impaired suppression than WT Treg during in vitro suppression assay, despite the reduced expression of Treg cell suppression assay -associated markers at the transcriptional level demonstrated in both scRNA-seq and bulk RNA-seq?
Thank you for your thoughtful comment. The absence of impaired suppression in Cxxc1-deficient Treg cells from homozygous knockout (KO) mice during the in vitro suppression assay, despite the reduced expression of Treg-associated markers at the transcriptional level (as demonstrated by scRNA-seq), can likely be explained by the activated state of these Treg cells. In homozygous KO mice, Treg cells are already activated due to the lymphoproliferative environment, resulting in gene expression patterns that differ from those of resting Treg cells. This pre-activation may obscure the effect of Cxxc1 deletion on their suppressive function in vitro.
To address this limitation, we used heterozygous Foxp3<sup>Cre/+</sup>Cxxc1<sup>fl/fl</sup> (het-KO) female mice, along with their littermate controls, Foxp3<sup>Cre/+</sup>Cxxc1<sup>fl/+</sup> (het-WT) mice. In these heterozygous mice, we observed an impairment in Treg cell suppressive function in vitro, which was accompanied by the downregulation of several key Treg-associated genes, as confirmed by RNA-Seq analysis.
These updated findings, based on the use of het-KO mice, are now incorporated into the revised manuscript (Page 25, lines 507–509, Figure 6E).
(4) Is there a disease in which Cxxc1 is expressed at low levels or absent in Treg cells? Is the same immunodeficiency phenotype present in patients as in mice?
This is indeed a very meaningful and intriguing question, and we are equally interested in understanding whether low or absent Cxxc1 expression in Treg cells is associated with any human diseases. However, despite an extensive review of the literature and available data, we found no reports linking Cxxc1 deficiency in Treg cells to immunodeficiency phenotypes in patients comparable to those observed in mice.
Reviewer #3 (Public review):
In the report entitled "CXXC-finger protein 1 associates with FOXP3 to stabilize homeostasis and suppressive functions of regulatory T cells", the authors demonstrated that Cxxc1-deletion in Treg cells leads to the development of severe inflammatory disease with impaired suppressive function. Mechanistically, CXXC1 interacts with Foxp3 and regulates the expression of key Treg signature genes by modulating H3K4me3 deposition. Their findings are interesting and significant. However, there are several concerns regarding their analysis and conclusions.
Major concerns:
(1) Despite cKO mice showing an increase in Treg cells in the lymph nodes and Cxxc1-deficient Treg cells having normal suppressive function, the majority of cKO mice died within a month. What causes cKO mice to die from severe inflammation?
Considering the results of Figures 4 and 5, a decrease in the Treg cell population due to their reduced proliferative capacity may be one of the causes. It would be informative to analyze the population of tissue Treg cells.
Thank you for your insightful observation regarding the mortality of cKO mice despite increased Treg cells in lymph nodes and the normal suppressive function of Cxxc1-deficient Treg cells.
As suggested, we hypothesized that the reduction of tissue-resident Treg cells could be a key factor. Additional experiments revealed a significant decrease in Treg cell populations in the small intestine lamina propria (LPL), liver, and lung of cKO mice. These findings highlight the critical role of tissue-resident Treg cells in preventing systemic inflammation.
This reduction aligns with Figures 4 and 5, which demonstrate impaired proliferation and survival of Cxxc1-deficient Treg cells. Together, these defects lead to insufficient Treg populations in peripheral tissues, escalating localized inflammation into systemic immune dysregulation and early mortality.
These additional results have been incorporated into the revised manuscript (Page21, lines 424-427, Figure 3G and Figure S3C).
(2) In Figure 5B, scRNA-seq analysis indicated that the Mki67+ Treg subset is comparable between WT and Cxxc1-deficient Treg cells. On the other hand, FACS analysis demonstrated that Cxxc1-deficient Treg shows less Ki-67 expression compared to WT in Figure 5I. The authors should explain this discrepancy.
Thank you for pointing out the apparent discrepancy between the scRNA-seq and FACS analyses regarding Ki-67 expression in Cxxc1-deficient Treg cells.
In Figure 5B, the scRNA-seq analysis identified the Mki67+ Treg subset as comparable between WT and Cxxc1-deficient Treg cells. This finding reflects the overall proportion of cells expressing Mki67 transcripts within the Treg population. In contrast, the FACS analysis in Figure 5I specifically measures Ki-67 protein levels, revealing reduced expression in Cxxc1-deficient Treg cells compared to WT.
To resolve this discrepancy, we performed additional analyses of the scRNA-seq data to directly compare the expression levels of Mki67 mRNA between WT and Cxxc1-deficient Treg cells. The results revealed a consistent reduction in Mki67 transcript levels in Cxxc1-deficient Treg cells, aligning with the reduced Ki-67 protein levels observed by FACS.
These new analyses have been included in the revised manuscript (Author response image 1) to clarify this point and demonstrate consistency between the scRNA-seq and FACS data.
Author response image 1.
Violin plots displaying the expression levels of Mki67 in T<sub>reg</sub> cells from Foxp3<sup>cre</sup> and Foxp3<sup>cre</sup>Cxxc1<sup>fl/fl</sup> mice.
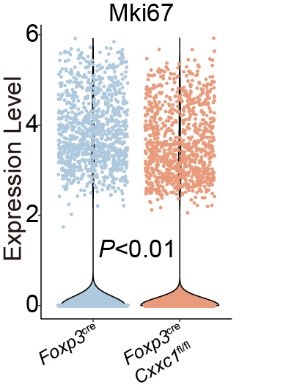
In addition, the authors concluded on line 441 that CXXC1 plays a crucial role in maintaining Treg cell stability. However, there appears to be no data on Treg stability. Which data represent the Treg stability?
Thank you for your valuable comment. We agree that our wording in line 441 may have been too conclusive. Our data focus on the impact of Cxxc1 deficiency on Treg cell homeostasis and transcriptional regulation, rather than directly measuring Treg cell stability. Specifically, the downregulation of Treg-specific suppressive genes and upregulation of pro-inflammatory markers suggest a shift in Treg cell function, which points to disrupted homeostasis rather than stability.
We have revised the manuscript to clarify that CXXC1 plays a crucial role in maintaining Treg cell function and homeostasis, rather than stability (Page 24, lines 489-491).
(3) The authors found that Cxxc1-deficient Treg cells exhibit weaker H3K4me3 signals compared to WT in Figure 7. This result suggests that Cxxc1 regulates H3K4me3 modification via H3K4 methyltransferases in Treg cells. The authors should clarify which H3K4 methyltransferases contribute to the modulation of H3K4me3 deposition by Cxxc1 in Treg cells.
We appreciate the reviewer’s insightful comment regarding the role of H3K4 methyltransferases in regulating H3K4me3 deposition by CXXC1 in Treg cells.
CXXC1 has been reported to function as a non-catalytic component of the Set1/COMPASS complex, which includes the H3K4 methyltransferases SETD1A and SETD1B—key enzymes responsible for H3K4 trimethylation(1-4). Based on these findings, we propose that CXXC1 modulates H3K4me3 levels in Treg cells by interacting with and stabilizing the activity of the Set1/COMPASS complex.
These revisions are further discussed in the Discussion (Page 30-31, lines 624-632).
Furthermore, it would be important to investigate whether Cxxc1-deletion alters Foxp3 binding to target genes.
Thank you for raising this important point. To address your suggestion, we performed CUT&Tag experiments and found that Cxxc1 deletion does not alter FOXP3 binding patterns in Treg cells. Most FOXP3-bound regions in WT Treg cells were similarly enriched in KO Treg cells, indicating that Cxxc1 deficiency does not impair FOXP3’s DNA-binding ability. These results have been added to the revised manuscript (Page 28, lines 567-575, Figure S8A-B) and are further discussed in the Discussion (Pages 28-29, lines 581-587).
(4) In Figure 7, the authors concluded that CXXC1 promotes Treg cell homeostasis and function by preserving the H3K4me3 modification since Cxxc1-deficient Treg cells show lower H3K4me3 densities at the key Treg signature genes. Are these Cxxc1-deficient Treg cells derived from mosaic mice? If Cxxc1-deficient Treg cells are derived from cKO mice, the gene expression and H3K4me3 modification status are inconsistent because scRNA-seq analysis indicated that expression of these Treg signature genes was increased in Cxxc1-deficient Treg cells compared to WT (Figure 5F and G).
Thank you for your insightful comment. To clarify, the Cxxc1-deficient Treg cells analyzed for H3K4me3 modifications in Figure 7 were derived from Cxxc1 conditional knockout (cKO) mice, not mosaic mice.
Regarding the apparent inconsistency between reduced H3K4me3 levels and the increased expression of Treg signature genes observed in scRNA-seq analysis (Figure 5F and G), we believe this discrepancy can be attributed to distinct mechanisms regulating gene expression. H3K4me3 is an epigenetic mark that facilitates chromatin accessibility and transcriptional regulation, reflecting upstream chromatin dynamics. However, gene expression levels are influenced by a combination of factors, including transcriptional activators, downstream compensatory mechanisms, and the inflammatory environment in cKO mice.
The upregulation of Treg signature genes in scRNA-seq data likely reflects an activated or pro-inflammatory state of Cxxc1-deficient Treg cells in response to systemic inflammation, as previously described in the manuscript. This contrasts with the intrinsic reduction in H3K4me3 levels at these loci, indicating a loss of epigenetic regulation by CXXC1.
To further support this interpretation, RNA-seq analysis of Treg cells from Foxp3<sup>Cre/+</sup> Cxxc1<sup>fl/fl</sup> (“het-KO”) and their littermate Foxp3<sup>Cre/+</sup> Cxxc1<sup>fl/+</sup> (“het-WT”) female mice (Figure S6C) revealed a significant reduction in key Treg signature genes such as Icos, Ctla4, Tnfrsf18, and Nt5e in het-KO Treg cells. These results align with the diminished H3K4me3 modifications observed in cKO Treg cells, further underscoring the role of CXXC1 as an epigenetic regulator.
In summary, while the gene expression changes observed in scRNA-seq may reflect adaptive responses to inflammation, the reduced H3K4me3 modifications directly highlight the critical role of CXXC1 in maintaining the epigenetic landscape essential for Treg cell homeostasis and function.
Recommendations for the authors:
Reviewer #1 (Recommendations for the authors):
In Figure 7E, the y-axis scale for H3K4me3 peaks at the Ctla4 locus should be consistent between WT and cKO samples.
We thank the reviewer for pointing out the inconsistency in the y-axis scale for the H3K4me3 peaks at the Ctla4 locus in Figure 7E. We have carefully revised the figure to ensure that the y-axis scale is now consistent between the WT and cKO samples.
We appreciate the reviewer’s attention to this detail, as it enhances the rigor of the data presentation. Please find the updated Figure 7E in the revised manuscript.
Reviewer #2 (Recommendations for the authors):
In lines 455 and 466, the name of Treg signature markers validated by flow cytometry should be written as protein name and capitalized.
Thank you for pointing this out. We have carefully reviewed lines 455 and 466 and have revised the text to ensure that the Treg signature markers validated by flow cytometry are referred to using their protein names, with proper capitalization.
Reviewer #3 (Recommendations for the authors):
(1) On line 431, "Cxxc1-deficient cells" should be Cxxc1-deficient Treg cells".
We thank the reviewer for highlighting this oversight. On line 431, we have revised "Cxxc1-deficient cells" to "Cxxc1-deficient Treg cells" to provide a more accurate and specific description. We appreciate the reviewer's attention to detail, as this correction improves the precision of our manuscript.
(2) In Figure 4H, negative values should be removed from the y-axis.
Thank you for your observation. We have revised Figure 4H to remove the negative values from the y-axis, as requested. This adjustment ensures a more accurate and meaningful representation of the data.
(3) It is better to provide the lists of overlapping genes in Figure 7C.
Thank you for your suggestion. We agree that providing the lists of overlapping genes in Figure 7C would enhance the clarity and reproducibility of the results. We have now included the gene lists as supplementary information (Supplementary Table 3) accompanying Figure 7C.
(1) Lee, J. H. & Skalnik, D. G. CpG-binding protein (CXXC finger protein 1) is a component of the mammalian set1 histone H3-Lys4 methyltransferase complex, the analogue of the yeast Set1/COMPASS complex. Journal of Biological Chemistry 280, 41725-41731, doi:10.1074/jbc.M508312200 (2005).
(2) Thomson, J. P., Skene, P. J., Selfridge, J., Clouaire, T., Guy, J., Webb, S., Kerr, A. R. W., Deaton, A., Andrews, R., James, K. D., Turner, D. J., Illingworth, R. & Bird, A. CpG islands influence chromatin structure via the CpG-binding protein Cfp1. Nature 464, 1082-U1162, doi:10.1038/nature08924 (2010).
(3) Shilatifard, A. in Annual Review of Biochemistry, Vol 81 Vol. 81 Annual Review of Biochemistry (ed R. D. Kornberg) 65-95 (2012).
(4) Brown, D. A., Di Cerbo, V., Feldmann, A., Ahn, J., Ito, S., Blackledge, N. P., Nakayama, M., McClellan, M., Dimitrova, E., Turberfield, A. H., Long, H. K., King, H. W., Kriaucionis, S., Schermelleh, L., Kutateladze, T. G., Koseki, H. & Klose, R. J. The SET1 Complex Selects Actively Transcribed Target Genes via Multivalent Interaction with CpG Island Chromatin. Cell Reports 20, 2313-2327, doi:10.1016/j.celrep.2017.08.030 (2017).
Author response:
The following is the authors’ response to the original reviews.
Reviewer 1 (Public Comments):
(1) The central concern for this manuscript is the apparent lack of reproducibility. The way the authors discuss the issue (lines 523-554) it sounds as though they are unable to reproduce their initial results (which are reported in the main text), even when previous versions of AlphaFold2 are used. If this is the case, it does not seem that AlphaFold can be a reliable tool for predicting antibody-peptide interactions.
The driving point behind the multiple sequence alignment (MSA) discussion was indeed to point out that AlphaFold2 (AF2) performance when predicting scFv:peptide complexes is highly dependent upon the MSA, but that is a function of MSA generation algorithm (MMseqs2, HHbiltz, jackhmmer, hhsearch, kalign, etc) and sequence databases, and less an intrinsic function of AF2. It is important to report MSA-dependent performance precisely because this results in changing capabilities with respect to peptide prediction.
Performance also significantly varies with the target peptide and scFv framework changes. By reporting the varying success rates (as a function of MSA, peptide target, and framework changes) we aim to help future researchers craft modified algorithms that can achieve increased reliability at protein-peptide binding predictions. Ultimately, tracking down how MSA generation details vary results (especially when the MSA’s are hundreds long) is significantly outside the scope of this paper. Our goal for this paper was to show a general method for identification of linear antibody epitopes using only sequence information, and future work by us or others should focus on optimization of the process.
(2) Aside from the fundamental issue of reproducibility, the number of validating tests is insufficient to assess the ability of AlphaFold to predict antibody-peptide interactions. Given the authors' use of AlphaFold to identify antibody binding to a linear epitope within a whole protein (in the mBG17:SARS-Cov-2 nucleocapsid protein interaction), they should expand their test set well beyond Myc- and HA-tags using antibody-antigen interactions from existing large structural databases.
Performing the calculations at the scale that the reviewer is requesting is not feasible at this time. We showed in this manuscript that we were able to predict 3 of 3 epitopes, including one antigen and antibody pair that have not been deposited into the PDB with no homologs. While we feel that an N=3 is acceptable to introduce this method to the scientific community, we will consider adding more examples of success and failure in the future to optimize and refine the method as computational resources become available. Notably, future efforts that attempt high-throughput predictions of this class using existing databases should take particular care to avoid contamination.
(3) As discussed in lines 358-361, the authors are unsure if their primary control tests (antibody binding to Myc-tag and HA-tag) are included in the training data. Lines 324-330 suggest that even if the peptides are not included in the AlphaFold training data because they contain fewer than 10 amino acids, the antibody structures may very well be included, with an obvious "void" that would be best filled by a peptide. The authors must confirm that their tests are not included in the AlphaFold training data, or re-run the analysis with these templates removed.
First, we address the simpler question of templates.
The reruns of AF2 with the local 2022 rebuild, the most reproducible method used with results most on par with the MMSEQS server in the Fall of 2022, were run without templates. This is because the MSA was generated locally; no templates were matched and generated locally. The only information passed then was the locally generated MSA, and the fasta sequence of the unchanging scFv and the dynamic epitope sequence. Because of how well this performed despite the absence of templates, we can confidently say the inclusion of the template flag is not significant with respect to how universally accurately PAbFold can identify the correct epitope.
Second, we can partially address the question of whether the AlphaFold models had access to models suitable, in theory, for “memorization” of pertinent structural details.
With respect to tracking the exact role and inclusion of specific PDB entries, the AF2 paper provides the following:
“Structures from the PDB were used for training and as templates (https://www.wwpdb.org/ftp/pdb-ftp-sites; for the associated sequence data and 40% sequence clustering see also https://ftp.wwpdb.org/pub/pdb/derived_data/ and https://cdn.rcsb.org/resources/sequence/clusters/bc-40.out). Training used a version of the PDB downloaded 28 August 2019, while the CASP14 template search used a version downloaded 14 May 2020. The template search also used the PDB70 database, downloaded 13 May 2020 (https://wwwuser.gwdg.de/~compbiol/data/hhsuite/databases/hhsuite_dbs/).”
Three of these links are dead. As such, it is difficult to definitively assess the role of any particular PDB entry with respect to AF2 training/testing, nor what impact homologous training structures given the very large number of immunoglobin structures in the training set. That said, we can summarize information for the potentially relevant PDB entries (l 2or9, which is shown in Fig. 1 and 1frg), and believe it is most conservative to assume that each such entry was within the training set.
PDB entry 2or9 (released 2008): the anti-c-myc antibody 9E10 Fab fragment in complex with an 11-amino acid synthetic epitope: EQKLISEEDLN. This crystal structure is also noteworthy for featuring a binding mode where the peptide is pinned between two Fab. The apo structure (2orb) is also in the database but lacks the peptide and a resolved structure for CDR H3.
PDB entry 1a93 (released 1998): a c-Myc-Max leucine zipper structure, where the c-Myc epitope (in a 34-amino acid protein) adopts an alpha helical conformation completely different from the epitope captured in entry 2or9.
PDB entries 5xcs and 5xcu (released 2017): engineered Fv-clasps (scFv alternatives) in complex with the 9-amino acid synthetic HA epitope: YPYDVPDYA.
PDB entry 1frg (released 1994): anti-HA peptide Fab in complex with HA epitope subset Ace-DVPDYASL-NH2.
Since the 2or9 entry has our target epitope (10 aa) embedded within an 11aa sequence, we have revised this line in the manuscript:
The AlphaFold2 training set was reported to exclude chains of less than 10, which would eliminate the myc and HA epitope peptides. => The AlphaFold2 training set was reported to exclude chains of less than 10, which would eliminate the HA epitope peptide from potential training PDB entries such as 5xcs or 5xcu”
It is important to note that we obtained the best prediction performance for the scFv:peptide pair that had no pertinent PDB entries (mBG17). Specifically, doing a Protein Blast against the PDB using the mBG17 scFv revealed diverse homologs, but a maximum sequence identity of 89.8% for the heavy chain (to an unrelated antibody) and 93.8% for the light chain (to an unrelated antibody). Additionally, while it is possible that the AF2 models might have learned from the complex in pdb entry 2or9, Supplemental Figure 3 shows how often the peptide is “misplaced”, and the performance does not exceed the performance for mBG17.
(4) The ability of AlphaFold to refine the linear epitope of antibody mBG17 is quite impressive and robust to the reproducibility issues the authors have run into. However, Figure 4 seems to suggest that the target epitope adopts an alpha-helical structure. This may be why the score is so high and the prediction is so robust. It would be very useful to see along with the pLDDT by residue plots a structure prediction by residue plot. This would help to see if the high confidence pLDDT is coming more from confidence in the docking of the peptide or confidence in the structure of the peptide.
The reviewer is correct that target mBG17 epitope adopts an alpha helical conformation, and we concur that this likely contributes to the more reliable structure prediction performance. When we predict the structure of the epitope alone without the mBG17 scFv, AF2 confidently predicts an alpha helix with an average pLDDT of 88.2 (ranging from 74.6 to 94.4).
Author response image 1.
The AF2 prediction for the mBG17 epitope by itself.
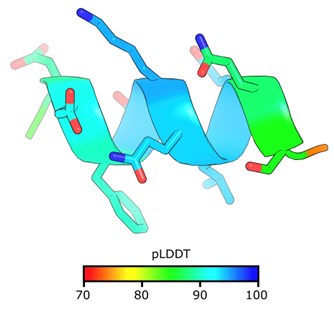
However, as one interesting point of comparison, a 10 a.a. poly-alanine peptide is also consistently folded into an alpha-helical coil by AF2. The A<sub>10</sub> peptide is also predicted to bind among the traditional scFv CDR loops, but the pLDDT scores are very poor (Supplemental Figure 5J). We also observed the opposite case; when a peptide has a very unstructured region in the binding domain but is nonetheless still be placed confidently, as seen in Supplemental Figure 3 C&D. Therefore, while we suspect peptides with strong alpha helical propensity are more likely to be accurately predicted, the data suggests that that alpha helix adoption is neither necessary nor sufficient to reach a confident prediction.
(5) Related to the above comment, pLDDT is insufficient as a metric for assessing antibody antigen interactions. There is a chance (as is nicely shown in Figure S3C) that AlphaFold can be confident and wrong. Here we see two orange-yellow dots (fairly high confidence) that place the peptide COM far from the true binding region. While running the recommended larger validation above, the authors should also include a peptide RMSD or COM distance metric, to show that the peptide identity is confident, and the peptide placement is roughly correct. These predictions are not nearly as valuable if AlphaFold is getting the right answer for the wrong reasons (i.e. high pLDDT but peptide binding to a nonCDR loop region). Eventual users of the software will likely want to make point mutations or perturb the binding regions identified by the structural predictions (as the authors do in Figure 4).
We agree with the reviewer that pLDDT is not a perfect metric, and we are following with great interest the evolving community discussion as to what metrics are most predictive of binding affinity (e.g. pAE, or pITM as a decent predictor for binding, but not affinity ranking). To our knowledge, there is not yet a consensus for the most predictive metrics for protein:protein binding nor protein:peptide binding. Intriguingly, since the antigen peptides are so small in our case, the pLDDT of the peptide residues should be mostly reporting on the confidence of the distances to neighboring protein residues.
As to the suggestion for a RMSD or COM distance metric, we agree that these are useful -with the caveat that these require a reference structure. The goal of our method is to quickly narrow down candidate linear epitopes and thereby guide experimentalists to more efficiently determine the actual binding sequence of an antibody-antigen sequence. Presumably this would not be necessary if a reference structure were known.
It may also be possible to invent a method to filter unlikely binding modes that is specific to antibodies and peptide epitopes that does not require a known reference structure, but this would be an interesting problem for subsequent study.
Reviewer 1 (Recommendations for the Authors):
(1) "Linear epitope" should be more precisely defined in the text. It isn't clear whether the authors hope that they can use AlphaFold to predict where on a given protein antigen an antibody will bind, or which antigenic peptide the antibody will bind to. The authors discuss both problems, and there is an important distinction between the two. If the authors are only concerned with isolated antigenic peptides, rather than linear epitopes in their full length structural contexts, they should be more precise in the introduction and discussion.
We thank the reviewer for the prompt towards higher precision. We are using the short contiguous antigen definition of “linear epitope” that depends on secondary rather than tertiary structure. The linear epitopes this paper considers are short “peptides” that form secondary structure independent of their structure in the complete folded antigen protein. We have clarified our definition of “linear epitope” in the text (lines 64-66).
(2) Line 101: "Not all portions of the antibody are critical". First, this is not consistent with the literature, particularly where computational biology is concerned.
See https://pubs.acs.org/doi/10.1021/acs.jctc.7b00080 . Second, while I largely agree with what I think the authors are trying to say (that we can largely reduce the problem to the CDR loops), this is inconsistent with what the authors later find, which is that inexplicably the VH/VL scaffold used alters results strongly.
We have adopted verbiage that should be less provocative: “Fortunately, with respect to epitope specificity, antibody constant domains are less critical than the CDR loops and the remainder of the variable domain framework regions.”
(3) Related to the above comment, do the authors have any idea why epitope prediction performance improved for the chimeric scFvs? Is this due to some stochasticity in AlphaFold? Or is there something systematic? Expanding the test dataset would again help answer this question.
We agree that future study with a larger test set could help address this intriguing result, for which we currently lack a conclusive explanation. Part of our motivation for this publication was to bring to light this unexpected result. Notably, these framework differences are not only implicated as a factor in driving AF2 performance, but also changing experimental intracellular performance as reported by our group (DOI: 10.1038/s41467-019-10846-1 ). We can generate a variety of hypotheses for this phenomenon. Just as MSA sub-sampling has been a popular approach to drive AF2 to sample alternative conformations, sequence recombination may be a generically effective way to generate usefully different binding predictions. However, it is difficult to discriminate between recombination inducing subtle structural tweaks that increase protein intracellular fitness and binding, from recombination causing changes to the MSA that affect the likelihood of sampling a good epitope binding conformation. It is also possible that the chimeras are more deftly predicted by AF2 due to differences in sequence representation during the training of the AF2 models (e.g. more exposure to models containing 15F11 or 2E2 structures). We attempted to deconvolute MSA differences by using single-sequence mode (Supplementary Figure 13) but this ablated performance.
(4) Figure 2: The reported consensus pLDDT scores are actually quite low here, suggesting low confidence in the result. This is in strong contrast to the reported consensus scores for mBG17. Again, a larger test dataset would help set a quantitative cutoff for where to draw the line for "trustworthy" AlphaFold predictions in antibody-peptide binding applications.
We agree that a larger dataset will be useful to begin to establish metrics and thresholds and will contribute to the aforementioned community discussion about reliable predictors of binding. Our current focus is not structure prediction per se. In the current work we are more focused on relative binding likelihood and increasing the efficiency of experimental epitope verification by flagging the most likely linear epitopes. Thus, while the pLDDT scores are low for Myc in Figure 2, it is remarkable (and worth reporting) that there is still useful signal in the relative variation in pLDDT. The utility of the signal variation is evident in the ability to short-list correct lead peptides via the two methods we demonstrate (consensus and per-residue max).
(5) Figure 4: if the authors are going to draw conclusions from the actual structure predictions of AlphaFold (not just the pLDDT scores), the side-chain accuracy placement should be assessed in the test dataset (RMSD or COM distance).
We agree with the reviewer that side-chain placement accuracy is important when evaluating the accuracy of AF2 structure predictions. However, here our focus was relative binding likelihood rather than structure prediction. The one case where we attempted to draw conclusions from the structure prediction was in the context of mBG17, where there is not yet an experimental reference structure. Absolutely, if we were to obtain a crystal structure for that complex, we would assess side-chain placement accuracy.
(6) Lines 493-508: I am not sure that this assessment for why AlphaFold has difficulty with antibody-antigen interactions is correct. If the authors' interpretation is correct (larger complicated structures are more challenging to move) then AlphaFold-Multimer (https://www.biorxiv.org/content/10.1101/2021.10.04.463034v2.full) wouldn't perform as well as it does. Instead, the issue is likely due to the incredibly high diversity in antibody CDR loops, which reduces the ability of the AlphaFold MSA step (which the authors show is quite critical to predictions: Figure S13) to inform structure prediction. This, coupled with the importance of side chain placement in antibody and TCR interactions, which is notoriously difficult (https://elifesciences.org/articles/90681), are likely the largest source of uncertainty in antibody-antigen interaction prediction.
We agree with the reviewer that CDR loop diversity (and associated side chain placement challenges) are a major barrier to successfully predict antibody-antigen complexes. Presumably this is true for both peptide antigens and protein antigens. Indeed, the authors of AlphaFold-multimer admit that the updated model struggles with antibody-antigen complexes, saying “As a limitation, we observe anecdotally that AlphaFold-Multimer is generally not able to predict binding of antibodies and this remains an area for future work.” The point about how loop diversity could reduce MSA quality is well taken. We have included the following thanks to the guidance of the reviewer when discussing MSA sensitivity is discussed later on in lines 570-572.:
“These challenges are presumably compounded by the incredible diversity of the CDR loops in antibodies which could decrease the useful signal from the MSA as well as drive inconsistent MSA-dependent performance”.
With respect to lines 493-508, we have also rephrased a key sentence to try to better explain that we are comparing the often-good recognition performance for short epitopes to the never-good performance when those epitopes are embedded within larger sequences. Instead of saying, “In contrast, a larger and complicated structure may be more challenging to move during the AlphaFold2 structure prediction or recycle steps.” we now say in lines 520-522 , “In contrast, embedding the epitope within a larger and more complicated structure appears to degrade the ability of AlphaFold2 to sample a comparable bound structure within the allotted recycle steps.”
(7) Related to major comment 1: Are AlphaFold predictions deterministic? That is, if you run the same peptide through the PAbFold pipeline 20 times, will you get the same pLDDT score 20 times? The lack of reproducibility may be in part due to stochasticity in AlphaFold, which the authors could actually leverage to provide more consistent results.
This is a good question that we addressed while dissecting the variable performance. When the random seed is fixed, AF2 returns the same prediction every time. After running this 10 times with a fixed seed, the mBG17 epitope was predicted with an average pLDDT of 88.94, with a standard deviation of 1.4 x 10<sup>-14</sup>. In contrast, when no seed is specified, AF2 did not return an *identical* result. However, the results were still remarkably consistent. Running the mBG17 epitope prediction 10 times with a different seed gave an average pLDDT of 89.24, with a standard deviation of 0.49.
(8) Related to major comment 2: The authors could use, for example, this previous survey of 1833 antibody-antigen interactions (https://www.sciencedirect.com/science/article/pii/S2001037023004725) the authors could likely pull out multiple linear epitopes to test AlphaFold's performance on antibody peptide interactions. A large number of tests are necessary for validation.
We thank the reviewer for this report of antibody-antigen interactions and will use it as a source of complexes in a future expanded study. Given the quantity and complexity of the data that we are already providing, as well as logistical challenges for compute and personnel the reviewer is asking for, we must defer this expansion to future work.
(9) Related to major comment 3: Apologies if this is too informal for a review, but this Issue on the AlphaFold GitHub may be useful: https://github.com/googledeepmind/alphafold/issues/416 .
We thank the reviewer for the suggestion – per our response above we have indeed run predictions with no templates. Since we are using local AlphaFold2 calculations with localcolabfold, the use or non-use of templates is fairly simple: including a “—templates” flag or not.
(10) Related to major comment 4: I am not sure if AlphaFold outputs by-residue secondary structure prediction by default, but I know that Phyre2 does http://www.sbg.bio.ic.ac.uk/~phyre2/html/page.cgi?id=index .
To our knowledge, AF2 does not predict secondary structure independent of the predicted tertiary structure. When we need to analyze the secondary structure we typically use the program DSSP from the tertiary structure.
(11) The documentation for this software is incomplete. The GitHub ReadMe should include complete guidelines for users with details of expected outputs, along with a thorough step-by-step walkthrough for use.
We thank the reviewer for pointing this out, but we feel that the level of detail we provide in the GitHub is sufficient for users to utilize the method described.
Stylistic comments:
(1) I do not think that the heatmaps (as in 1C, top) add much information for the reader. They are largely uniform across the y-axis (to my eyes), and the information is better conveyed by the bar and line graphs (as in 1C, middle and bottom panels).
We thank the reviewer for this feedback but elect to leave it in on the premise of more data presented is (usually) better. Including the y-axis reveals common patterns such as the lower confidence of the peptide termini, as well as the lack of some patterns that might have occurred. For example, if a subset of five contiguous residues was necessary and sufficient for local high confidence this could be visually apparent as a “staircase” in the heat map.
(2) A discussion of some of the shortcomings of other prediction-based software (lines 7177) might be useful. Why are these tools less well-equipped than AlphaFold for this problem? And if they have tried to predict antibody-antigen interactions, why have they failed?
We agree with the reviewer that a broader review of multiple methods would be interesting and useful. One challenge is that the suite of available methods is evolving rapidly, though only a subset work for multimeric systems. Some detail on deficiencies of other approaches was provided in lines 71-77 originally, although we did not go into exhaustive detail since we wanted to focus on AF2. We view using AF2 in this manner is novel and that providing additional options predict antibody epitopes will be of interest to the scientific community. We also chose AF2 because we have ample experience with it and is a software that many in the scientific community are already using and comfortable with. Additionally, AF2 provided us with a quantification parameter (pLDDT) to assess the peptides’ binding abilities. We think a future study that compares the ability of multiple emerging tools for scFv:peptide prediction will be quite interesting.
(3) Similar to the above comment, more discussion focused on why AlphaFold2 fails for antibodies (lines 126-128) might be useful for readers.
We thank the reviewer for the suggestion. The following line has been added shortly after lines 135-137:
“Another reason for selecting AF2 is to attempt to quantify its abilities the compare simple linear epitopes, since the team behind AF-multimer reported that conformational antibody complexes were difficult to predict accurately (14).”
Per earlier responses, we also added text that flags one particular possible reason for the general difficulty of predicting antibody-antigen complexes (the diversity of the CDR loops and associated MSA challenges).
(4) The first two paragraphs of the results section (lines 226-254) could likely be moved to the Methods. Additionally, details of how the scores are calculated, not just how the commands are run in python, would be useful.
Per the reviewer suggestion, we moved this section to the end of the Methods section. Also, to aid in the reader’s digestion of the analysis, the following text has been added to the Results section (lines 256-264):
“Both the ‘Simple Max’ and ‘Consensus’ methods were calculated first by parsing every pLDDT score received by every residue in the antigen sequence sliding window output structures. From the resulting data structure, the Simple Max method simply finds the maximum pLDDT value ever seen for a single residue (across all sliding windows and AF2 models). For the Consensus method, per-residue pLDDT was first averaged across the 5 AF2 models. These averages are reported in the heatmap view, and further averaged per sliding window for the bar chart below.
In principle, the strategy behind the Consensus method is to take into account agreement across the 5 AF2 models and provide insight into the confidence of entire epitopes (whole sliding windows of n=10 default) instead of disconnected, per-residue pLDDT maxima.”
(5) Figure 1 would be more useful if you could differentiate specifically how the Consensus and Simple Max scoring is different. Providing examples for how and why the top 5 peptide hits can change (quite significantly) using both methods would greatly help readers understand what is going on.
Per the reviewer suggestion, we have added text to discuss the variable hit selection that results from the two scoring metrics. The new text (lines 264-271) adds onto the added text block immediately above:
“Having two scoring metrics is useful because the selection of predicted hits can differ. As shown in Figure 2, part of the Myc epitope makes it into the top 5 peptides when selection is based on summing per-residue maximum pLDDT (despite there being no requirement that these values originate in the same physical prediction). In contrast, a Consensus method score more directly reports on a specific sliding window, and the strength of the highest confidence peptides is more directly revealed with superior signal to noise as shown in Figure 3. Variability in the ranking of top hits between the two methods arises from the fundamental difference in strategy (peptide-centric or residue-centric scoring) as well as close competition between the raw AF2 confidence in the known peptide and competing decoy sequences.”
(6) Hopefully the reproducibility issue is alleviated, but if not the discussion of it (lines 523554) should be moved to the supplement or an appendix.
The ability of the original AF2 model to predict protein-protein complexes was an emergent behavior, and then an explicit training goal for AF2.multimer. In this vein, the ability to predict scFv:peptide complexes is also an emergent capability of these models. It is our hope that by highlighting this capacity, as well as the high level of sensitivity, that this capability will be enhanced and not degraded in future models/algorithms (both general and specialized). In this regard, with an eye towards progress, we think it is actually important to put this issue in the scientific foreground rather than the background. When it comes to improving machine learning methods negative results are also exceedingly important.
Reviewer 2 (Recommendations for the Author):
- Line 113, page 3 - the structures of the novel scFv chimeras can be rapidly and confidently be predicted by AlphaFold2 to the structures of the novel scFv chimeras can be rapidly and confidently predicted by AlphaFold2.
The superfluous “be” was removed from the text.
- Line 276 and 278 page 9 - peptide sequences QKLSEEDLL and EQKLSEEDL in the text are different from the sequences reported in Figures 1 and 2 (QKLISEEDLL and EQKLISEEDL). Please check throughout the manuscript and also in the Figure caption (as in Figure 2).
These changes were made throughout the text.
- I would include how you calculate the pLDDT score for both Simple Max approach and Consensus analysis.
Good suggestion, this should be covered via the additions noted above.
Author response:
The following is the authors’ response to the original reviews
We thank the reviewers for the constructive comments, which have improved the manuscript. In response to these comments, we have made the following major changes to the main text and reviewer response:
(1) Added experimental and computational evidence to support the use of Cut&Tag to determine speckle location.
(2) Performed new Transmission Electron Microscopy (TEM) experiments to visualize interchromatin granule clusters +/- speckle degradation.
(3) Altered the text of the manuscript to remove qualitative statements and clarify effect sizes.
(4) Performed new analyses of published whole genome bisulfite data from LIMe-Hi-C following DNMT1 inhibition to demonstrate that CpG methylation is lost at DNMT1i-specific gained CTCF sites.
(5) Included citations for relevant literature throughout the text.
These revisions in addition to others are described in the point-by-point response below.
Reviewer #1 (Public review):
Summary
Roseman et al. use a new inhibitor of the maintenance DNA methyltransferase DNMT1 to probe the role of methylation on binding of the CTCF protein, which is known to be involved chromatin loop formation. As previous reported, and as expected based on our knowledge that CTCF binding is methylation-sensitive, the authors find that loss of methylation leads to additional CTCF binding sites and increased loop formation. By comparing novel loops with the binding of the pre-mRNA splicing factor SON, which localizes to the nuclear speckle compartment, they propose that these reactivated loops localize to near speckles. This behavior is dependent on CTCF whereas degradation of two speckle proteins does not affect CTCF binding or loop formation. The authors propose a model in which DNA methylation controls the association of genome regions with speckles via CTCF-mediated insulation.
Strengths
The strengths of the study are 1) the use of a new, specific DNMT1 inhibitor and 2) the observation that genes whose expression is sensitive to DNMT1 inhibition and dependent on CTCF (cluster 2) show higher association with SON than genes which are sensitive to DNMT1 inhibition but are CTCF insensitive, is in line with the authors' general model.
Weaknesses
There are a number of significant weaknesses that as a whole undermine many of the key conclusions, including the overall mechanistic model of a direct regulatory role of DNA methylation on CTCF-mediated speckle association of chromatin loops.
We appreciate the reviewer’s constructive comments and address them point-by-point below.
(1) The authors frequently make quasi-quantitative statements but do not actually provide the quantitative data, which they actually all have in hand. To give a few examples: "reactivated CTCF sites were largely methylated (p. 4/5), "many CTCF binding motifs enriched..." (p.5), "a large subset of reactivated peaks..."(p.5), "increase in strength upon DNMT1 inhibition" (p.5); "a greater total number....." (p.7). These statements are all made based on actual numbers and the authors should mention the numbers in the text to give an impression of the extent of these changes (see below) and to clarify what the qualitative terms like "largely", "many", "large", and "increase" mean. This is an issue throughout the manuscript and not limited to the above examples.
Related to this issue, many of the comparisons which the authors interpret to show differences in behavior seem quite minor. For example, visual inspection suggests that the difference in loop strength shown in figure 1E is something like from 0 to 0.1 for K562 cells and a little less for KCT116 cells. What is a positive control here to give a sense of whether these minor changes are relevant. Another example is on p. 7, where the authors claim that CTCF partners of reactivated peaks tend to engage in a "greater number" of looping partners, but inspection of Figure 2A shows a very minor difference from maybe 7 to 7.5 partners. While a Mann-Whitney test may call this difference significant and give a significant P value, likely due to high sample number, it is questionable that this is a biologically relevant difference.
We have amended the text to include actual values, instead of just qualitative statements. We have also moderated our claims in the text to note where effect sizes are more modest.
The following literature examples can serve as positive controls for the effect sizes that we might expect when perturbing CTCF. Our observed effect sizes are largely in line with these expected magnitudes.
https://pmc.ncbi.nlm.nih.gov/articles/PMC8386078/ Fig. 2E
https://www.cell.com/cell-reports/pdf/S2211-1247(23)01674-1.pdf Fig. 3J,K
https://academic.oup.com/nar/article/52/18/10934/7740592 Fig. S5D (CTCF binding only).
(2) The data to support the central claim of localization of reactivated loops to speckles is not overly convincing. The overlap with SON Cut&Tag (figure 2F) is partial at best and although it is better with the publicly available TSA-seq data, the latter is less sensitive than Cut&Tag and more difficult to interpret. It would be helpful to validate these data with FISH experiments to directly demonstrate and measure the association of loops with speckles (see below).
A recent publication we co-authored validated the use of speckle (SON) Cut&Run using FISH (Yu et al, NSMB 2025, doi: 10.1038/s41594-024-01465-6). This paper also supports a role of CTCF in positioning DNA near speckles. Unfortunately, the resolution of these FISH probes is in the realm of hundreds of kilobases. This was not an issue for Yu et. al., as they were looking at large-scale effects of CTCF degradation on positioning near speckles. However, FISH does not provide the resolution we need to look at more localized changes over methylation-specific peak sites.
Instead, we use Cut&Tag to look at these high-resolution changes. In Figure 3C, we show that SON localizes to DNMT1i-specific peaks only upon DNMT1 inhibition. We further demonstrate that this interaction is dependent on CTCF. In response to reviewer comments, we have now also performed spike-in normalized Cut&Tag upon acute (6 hr) SON degradation to validate that our signal is also directly dependent on SON and not merely due to a bias toward open chromatin.
Author response image 1.
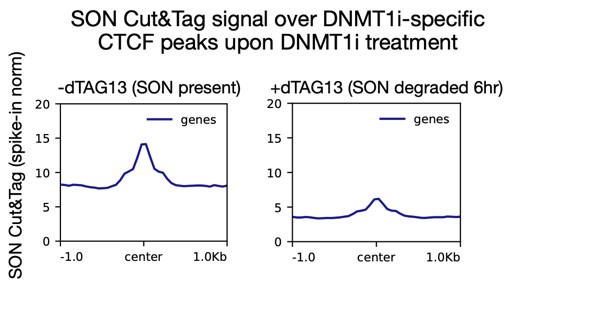
TSA-seq has been validated with FISH (Chen et. al., doi: 10.1083/jcb.201807108), Alexander et. Al 10.1016/j.molcel.2021.03.006) Fig 6. We include TSA-seq data where possible in our manuscript to support our claims.
We also note that Fig 2F shows all CTCF peaks and loops, not just methylation-sensitive peaks and loops, to give a sense of the data. We apologize for any confusion and have clarified this in the figure legend.
(3) It is not clear that the authors have indeed disrupted speckles from cells by degrading SON and SRRM2. Speckles contain a large number of proteins and considering their phase separated nature stronger evidence for their complete removal is needed. Note that the data published in ref 58 suffers from the same caveat.
Based upon the reviewers’ feedback, we generated Tranmission electron microscopy (TEM) data to visualize nuclear speckles +/- degradation of SON and SRRM2 (DMSO and dTAG). We were able to detect Interchromatin Granules Clusters (ICGs) that are representative of nuclear speckles in the DMSO condition. However, even at baseline, we observed a large degree of cell-to-cell variability in these structures. In addition, we also observe potential structural changes in the distribution of heterochromatin upon speckle degradation. Consequently, we hesitate to make quantitative conclusions regarding loss of these nuclear bodies. In the interest of transparency, we have included representative raw images from both conditions for the reviewers’ consideration.
We also note that in Ref 58 (Ilik et. Al., https://doi.org/10.7554/eLife.60579), the authors show diffusion of speckle client proteins RBM25, SRRM1, and PNN upon SON and SRRM2 depletion, further supporting speckle dissociation in these conditions.
Author response image 2.
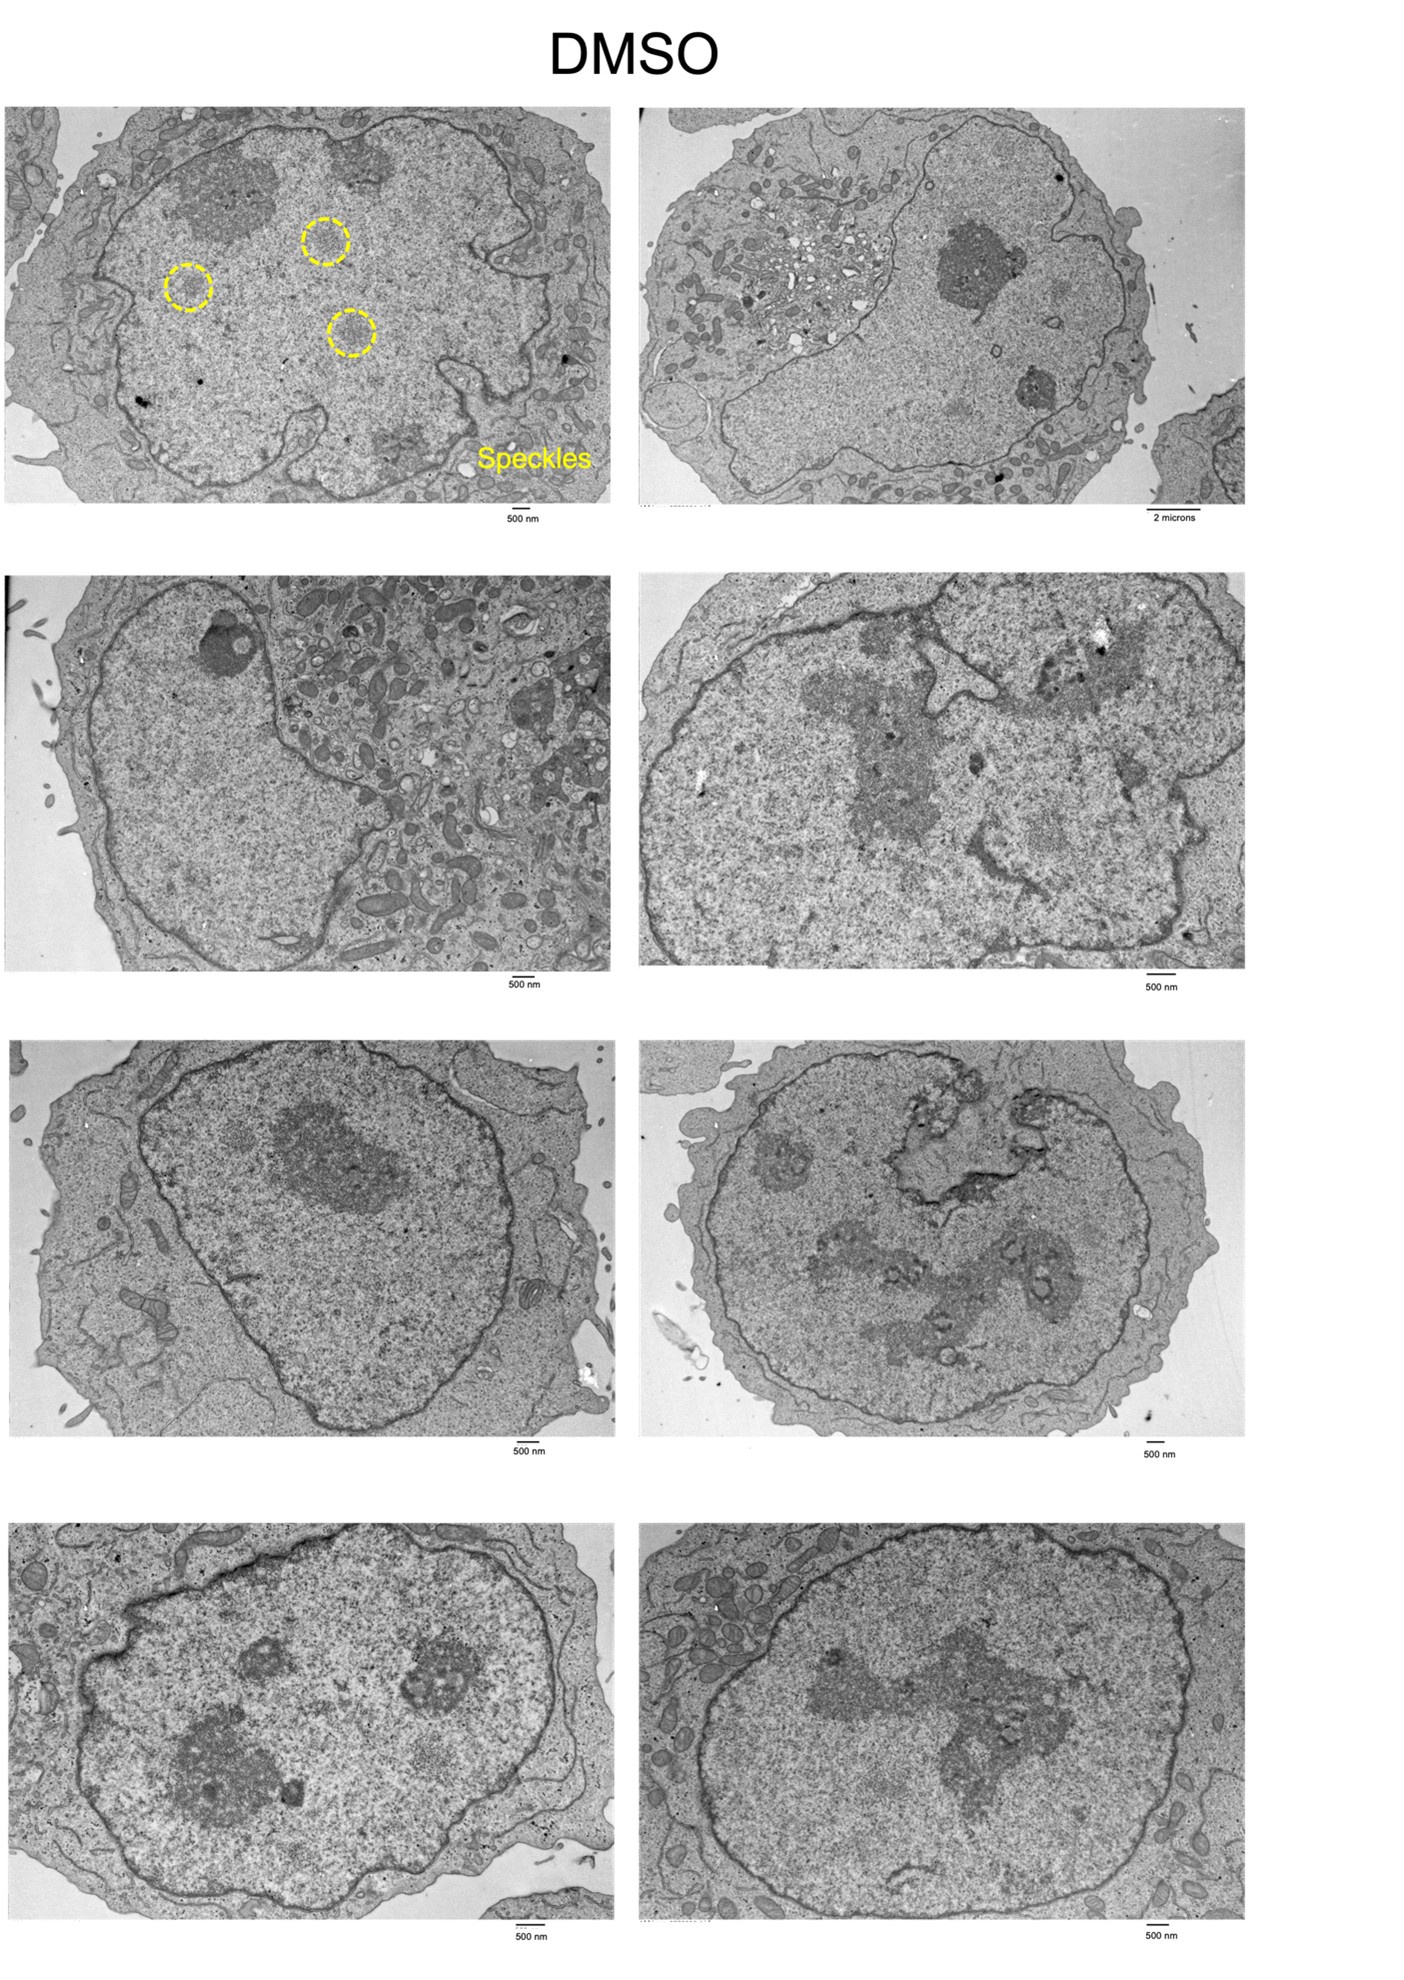
Author response image 3.
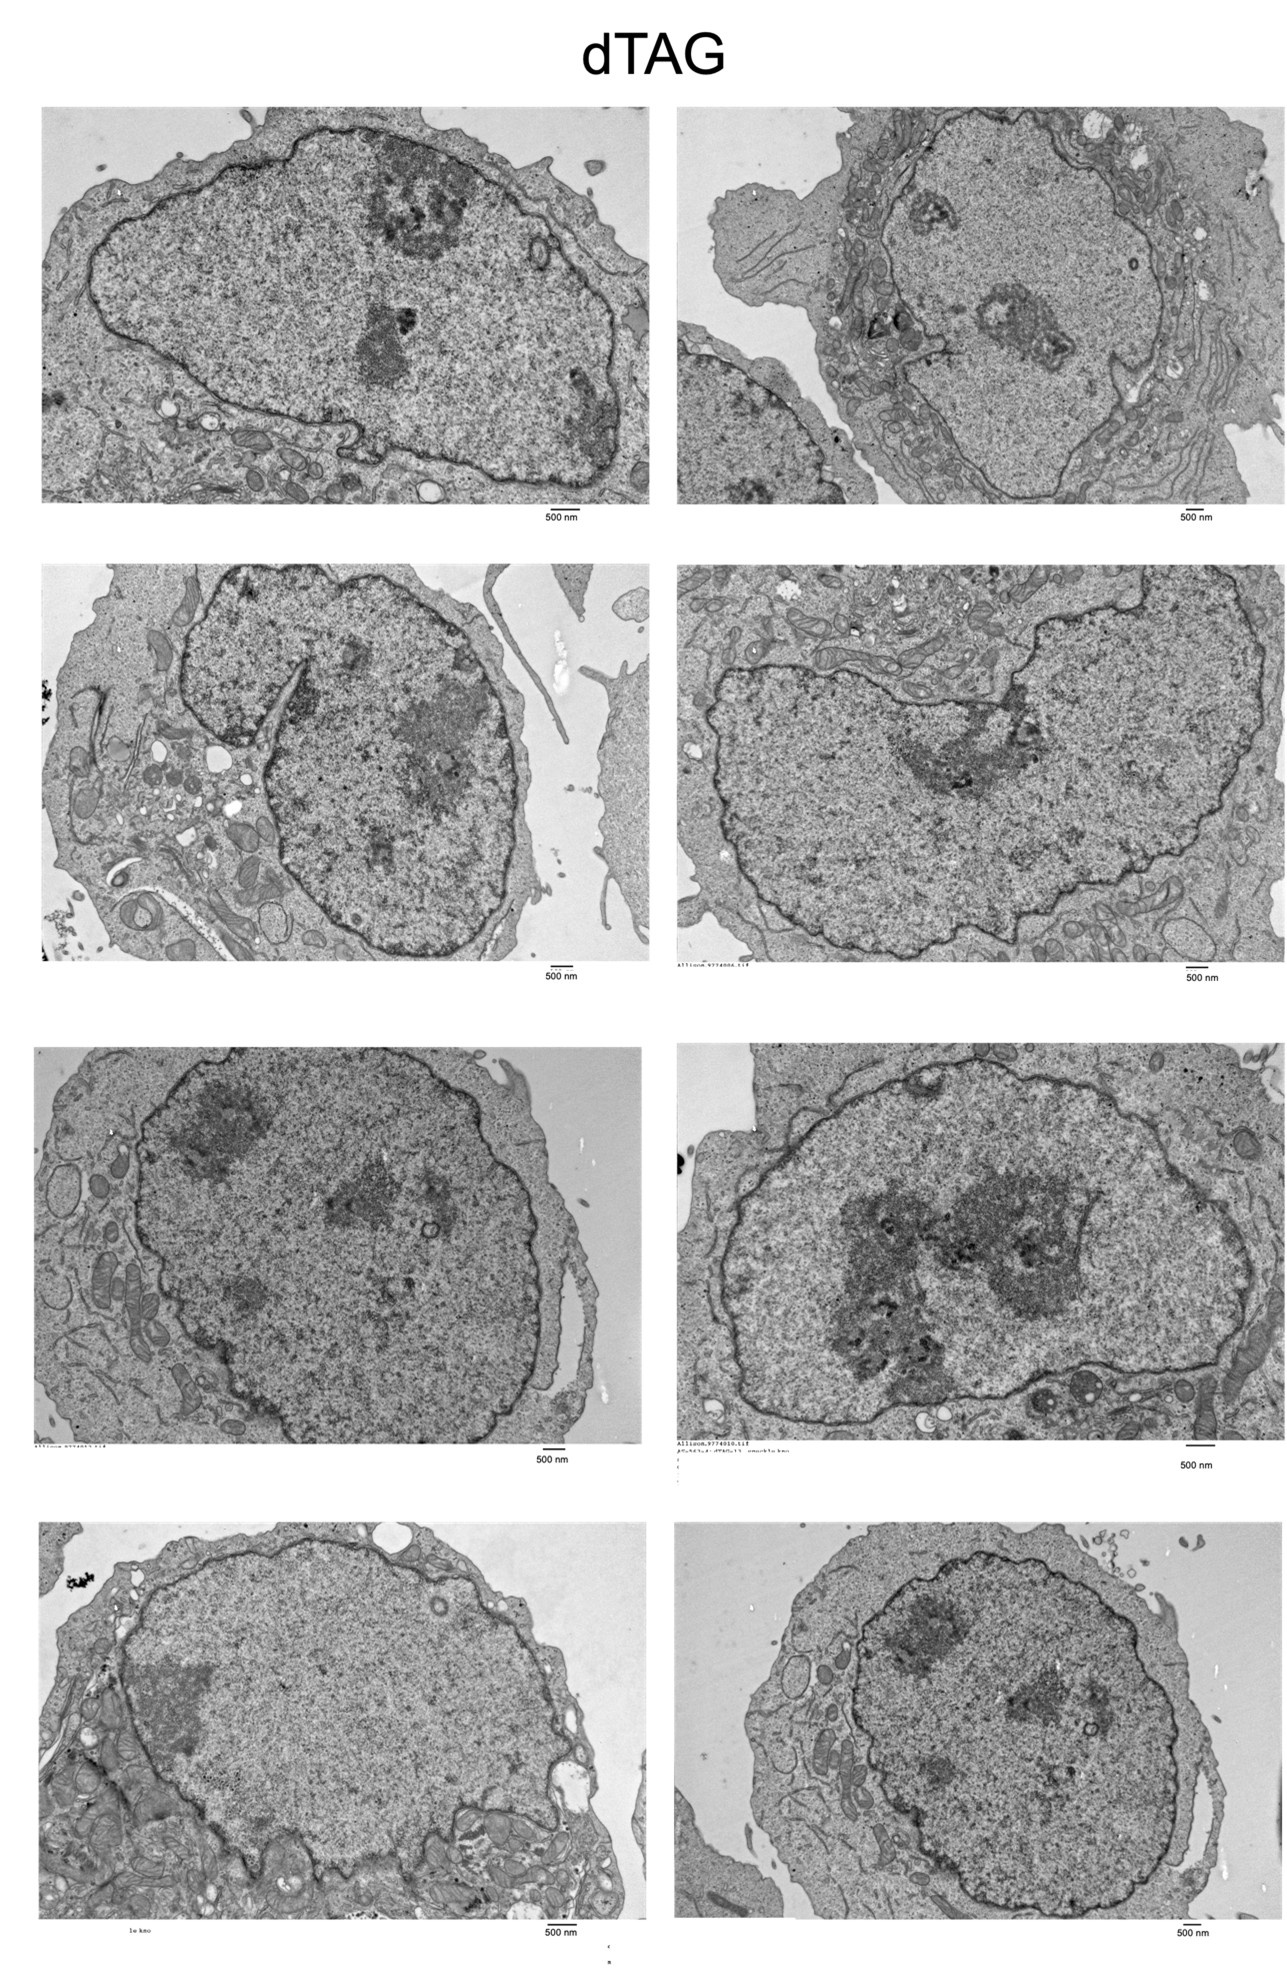
(4) The authors ascribe a direct regulatory role to DNA methylation in controlling the association of some CTCF-mediated loops to speckles (p. 20). However, an active regulatory role of speckle association has not been demonstrated and the observed data are equally explainable by a more parsimonious model in which DNA methylation regulates gene expression via looping and that the association with speckles is merely an indirect bystander effect of the activated genes because we know that active genes are generally associated with speckles. The proposed mechanism of a regulatory role of DNA methylation in controlling speckle association is not convincingly demonstrated by the data. As a consequence, the title of the paper is also misleading.
While it is difficult to completely rule out indirect effects, we do not believe that the relationship between methylation-sensitive CTCF sites and speckles relies only on gene activity.
We can partially decouple SON Cut&Tag signal from gene activation if we break down Figure 4D to look only at methylation-sensitive CTCF peaks on genes whose expression is unchanged upon DNMT1 inhibition (using thresholds from manuscript, P-adj > 0.05 and/or |log2(fold-change)| < 0.5). This analysis shows that many methylation-sensitive CTCF peaks on genes with unchanged expression still change speckle association upon DNMT1 inhibition. This result refutes the necessity of transcriptional activation to recruit speckles to CTCF.
Author response image 4.
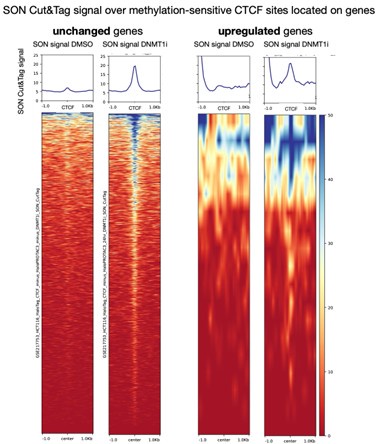
We note the comparator upregulated gene set here is small (~20 genes with our stringent threshold for methylation-sensitive CTCF after 1 day DNMT1i treatment).
However, we acknowledge that these effects cannot be completely disentangled. We previously included the statement “other features enriched near speckles, such as open chromatin, high GC content, and active gene expression, could instead contribute to increased CTCF binding and looping near speckles” in the discussion. In response to the reviewer’s comment, we have further tempered our statements on page 20/21 and also added a statement noting that DNA demethylation and gene activation cannot be fully disentangled. While we are also open to a title change, we are unsure which part of the title is problematic.
(5) As a minor point, the authors imply on p. 15 that ablation of speckles leads to misregulation of genes by altering transcription. This is not shown as the authors only measure RNA abundance, which may be affected by depletion of constitutive splicing factors, but not transcription. The authors would need to show direct effects on transcription.
We agree, and we have changed this wording to say RNA abundance.
Reviewer #2 (Public review):
Summary:
CTCF is one of the most well-characterized regulators of chromatin architecture in mammals. Given that CTCF is an essential protein, understanding how its binding is regulated is a very active area of research. It has been known for decades that CTCF is sensitive to 5-cystosine DNA methylation (5meC) in certain contexts. Moreover, at genomic imprints and in certain oncogenes, 5meC-mediated CTCF antagonism has very important gene regulatory implications. A number of labs (eg, Schubeler and Stamatoyannopoulos) have assessed the impact of DNA methylation on CTCF binding, but it is important to also interrogate the effect on chromatin organization (ie, looping). Here, Roseman and colleagues used a DNMT1 inhibitor in two established human cancer lines (HCT116 [colon] and K562 [leukemia]), and performed CTCF ChIPseq and HiChIP. They showed that "reactivated" CTCF sites-that is, bound in the absence of 5meC-are enriched in gene bodies, participate in many looping events, and intriguingly, appear associated with nuclear speckles. This last aspect suggests that these reactivated loops might play an important role in increased gene transcription. They showed a number of genes that are upregulated in the DNA hypomethylated state actually require CTCF binding, which is an important result.
Strengths:
Overall, I found the paper to be succinctly written and the data presented clearly. The relationship between CTCF binding in gene bodies and association with nuclear speckles is an interesting result. Another strong point of the paper was combining DNMT1 inhibition with CTCF degradation.
Weaknesses:
The most problematic aspect of this paper in my view is the insufficient evidence for the association of "reactivated" CTCF binding sites with nuclear speckles needs to be more diligently demonstrated (see Major Comment). One unfortunate aspect was that this paper neglected to discuss findings from our recent paper, wherein we also performed CTCF HiChIP in a DNA methylation mutant (Monteagudo-Sanchez et al., 2024 PMID: 39180406). It is true, this is a relatively recent publication, although the BioRxiv version has been available since fall 2023. I do not wish to accuse the authors of actively disregarding our study, but I do insist that they refer to it in a revised version. Moreover, there are a number of differences between the studies such that I find them more complementary rather than overlapping. To wit, the species (mouse vs human), the cell type (pluripotent vs human cancer), the use of a CTCF degron, and the conclusions of the paper (we did not make a link with nuclear speckles). Furthermore, we used a constitutive DNMT knockout which is not viable in most cell types (HCT116 cells being an exception), and in the discussion mentioned the advantage of using degron technology:
"With high-resolution techniques, such as HiChIP or Micro-C (119-121), a degron system can be coupled with an assessment of the cis-regulatory interactome (118). Such techniques could be adapted for DNA methylation degrons (eg, DNMT1) in differentiated cell types in order to gauge the impact of 5meC on the 3D genome."
The authors here used a DNMT1 inhibitor, which for intents and purposes, is akin to a DNMT1 degron, thus I was happy to see a study employ such a technique. A comparison between the findings from the two studies would strengthen the current manuscript, in addition to being more ethically responsible.
We thank the reviewer for the helpful comments, which we address in the point-by-point response below. We sincerely apologize for this oversight in our references. We have included references to your paper in our revised manuscript. It is exciting to see these complementary results! We now include discussion of this work to contextualize the importance of methylation-sensitive CTCF sites and motivate our study.
Recommendations for the authors:
Reviewer #1 (Recommendations for the authors):
To address the above points, the authors should:
(1) Provide quantitative information in the text on all comparisons and justify that the small differences observed, albeit statistically significant, are biologically relevant. Inclusion of positive controls to give an indication of what types of changes can be expected would be helpful.
We have added quantitative information to the text, as discussed in the response to public comments above. We also provide literature evidence of expected effect sizes in that response.
(2) Provide FISH data to a) validate the analysis of comparing looping patterns with SON Cut&Tag data as an indicator of physical association of loops with speckles and b) demonstrate by FISH increased association of some of the CTCF-dependent loops/genes (cluster 2) with speckles upon DNMT1 inhibition.
Please see response to Reviewer 1 comment #2 above. Unfortunately, FISH will not provide the resolution we need for point a). We have confidence in our use of TSA-seq and Cut&Tag to study SON association with CTCF sites on a genome-wide scale, which would not be possible with individual FISH probes. Specifically, since the submission of our manuscript several other researchers (Yu et al, Nat. Struct. and Mol. Biol. 2025, Gholamalamdari et al eLife 2025) have leveraged CUT&RUN/CUT&TAG and TSA-seq to map speckle associated chromatin and have validated these methods with orthogonal imaging based approaches.
(3) Demonstrate loss of speckles upon SON or SRRM2 by probing for other speckle components and ideally analysis by electron microscopy which should show loss of interchromatin granules.
We have performed TEM in K562 cells +/- SON/SRRM2 degradation. Please see response to Reviewer 1 comment #3. Specifically, interchromatin granule clusters are visible in the TEM images of the DMSO sample (see highlighted example above), however, given the heterogeneity of these structures and potential global alterations in heterochromatin that may be occurring following speckle loss, we refrained from making quantitative conclusions from this data. We instead include the raw images above.
(4) The authors should either perform experiments to clearly show whether loop association is transcription dependent or whether association is merely a consequence of gene activation. Alternatively, they should tone down their model ascribing a direct regulatory role of methylation in control of loop association with speckles and also discuss other models. Unless the model is more clearly demonstrated, the title of the paper should be changed to reflect the uncertainty of the central conclusion.
Please see response to Reviewer 1 comment #4 above.
(5) The authors should either probe directly for the effect of speckle ablation on transcription or change their wording.
We have changed our wording to RNA abundance.
Reviewer #2 (Recommendations for the authors):
Major:
⁃ There was no DNA methylation analysis after inhibitor treatment. Ideally, genome bisulfite sequencing should be performed to show that the DNMT1i-specific CTCF binding sites are indeed unmethylated. But at the very least, a quantitative method should be employed to show the extent to which 5meC levels decrease in the presence of the DNMT1 inhibitor
Response: We have now included analysis of genome wide bisulfite information from LIMe-Hi-C (bisulfite Hi-C) in K562 following DNMT1i inhibition. Specifically, we leverage the CpG methylation readout and find that DNTM1i-specific CTCF sites are more methylated than non-responsive CTCF peaks at baseline. In addition, these sites show the greatest decrease in CpG methylation upon 3 days of DNMT1 inhibition. We include a figure detailing these analyses in the supplement (Fig S1E). In addition, we have added CpG methylation genome browser tracks to (Fig S1D). In terms of global change, we have found that 3 days of DNMT1 inhibitor treatment leads to a reduction in methylation to about ~1/4 the level at baseline.
I am not convinced that CUT&Tag is the proper technique to assess SON binding. CUT&Tag only works under stringent conditions (high salt), and can be a problematic assay for non-histone proteins, which bind less well to chromatin. In our experience, even strong binders such as CTCF exhibit a depleted binding profile when compared to ChIP seq data. I would need to be strongly convinced that the analysis presented in figures 2F-J and S2 D-I simply do not represent ATAC signal (ie, default Tn5 activity). For example, SON ChIP Seq, CUT&Tag in the SON degron and/or ATAC seq could be performed. What worries me is that increased chromatin accessibility would also be associated with increased looping, so they have generated artifactual results that are consistent with their model.
As the reviewer suggested, we have now performed spike-in normalized SON Cut&Tag with DNMT1 inhibition and 6 hours of SON/SRRM2 degradation in our speckle dTAG knockin cell line. These experiments confirm that the SON Cut&Tag signal we see is SON-dependent. If the signal was truly due to artifactual binding, gained peaks would be open irrespective of speckle binding, however we see a clear speckle dependence as this signal is much lower if SON is degraded.
Author response image 5.

Moreover, in our original Cut&Tag experiments, we did not enrich detectable DNA without using the SON antibody (see last 4 samples-IgG controls). This further suggests that our signal is SON-dependent.
Author response image 6.
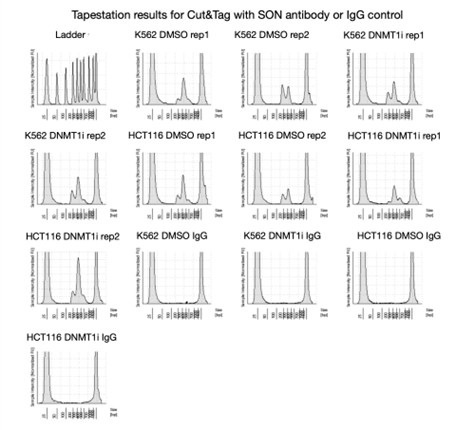
Finally, we see good agreement between Cut&Tag and TSA-seq (Spearman R=0.82). The agreement is particularly strong in the top quadrant, which is most relevant since this is where the non-zero signal is.
Author response image 7.
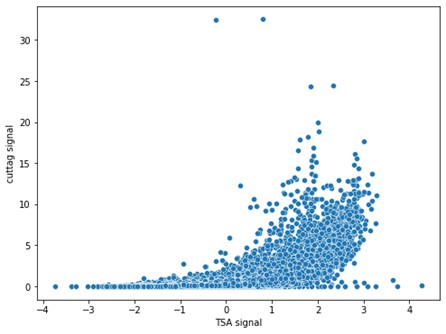
Minor points
⁃ Why are HCT116 cells more responsive to treatment than K562 cells? This is something that could be addressed with DNA methylation analysis, for example
K562 is a broadly hypomethylated cell line (Siegenfeld et.al, 2022 https://doi.org/10.1038/s41467-022-31857-5 Fig S2A-C). Thus, there may be less dynamic range to lose methylation compared to HCT116.
Our results are also consistent with previous results comparing DKO HCT116 and aza-treated K562 cells (Maurano 2015, http://dx.doi.org/10.1016/j.celrep.2015.07.024). They state “In K562 cells, 5-aza-CdR treatment resulted in weaker reactivation than in DKO cells…” In addition, cell-type-specific responsiveness to DNA methyltransferase KO depending upon global CpG methylation levels, has also been observed in ES and EpiLC cells (Monteagudo-Sanchez et al., 2024), which we now comment on in the manuscript.
⁃ How many significant CTCF loops in DNMTi, compared to DMSO? It was unclear what the difference in raw totals is.
We now include a supplemental table with the HiChIP loop information. We call similar numbers of raw loops comparing DNMT1i and DMSO, as only a small subset of loops is changing.
⁃ For the architectural stripes, it would be nice to see a representative example in the form of a contact plot. Is that possible to do with the hiChIP data?
As described in our methods, we called architectural stripes using Stripenn (Yoon et al 2022) from LIMe-Hi-C data under DNMT1i conditions (Siegenfeld et al, 2022). Shown below is a representative example of a stripe in the form of a Hi-C contact map.
Author response image 8.
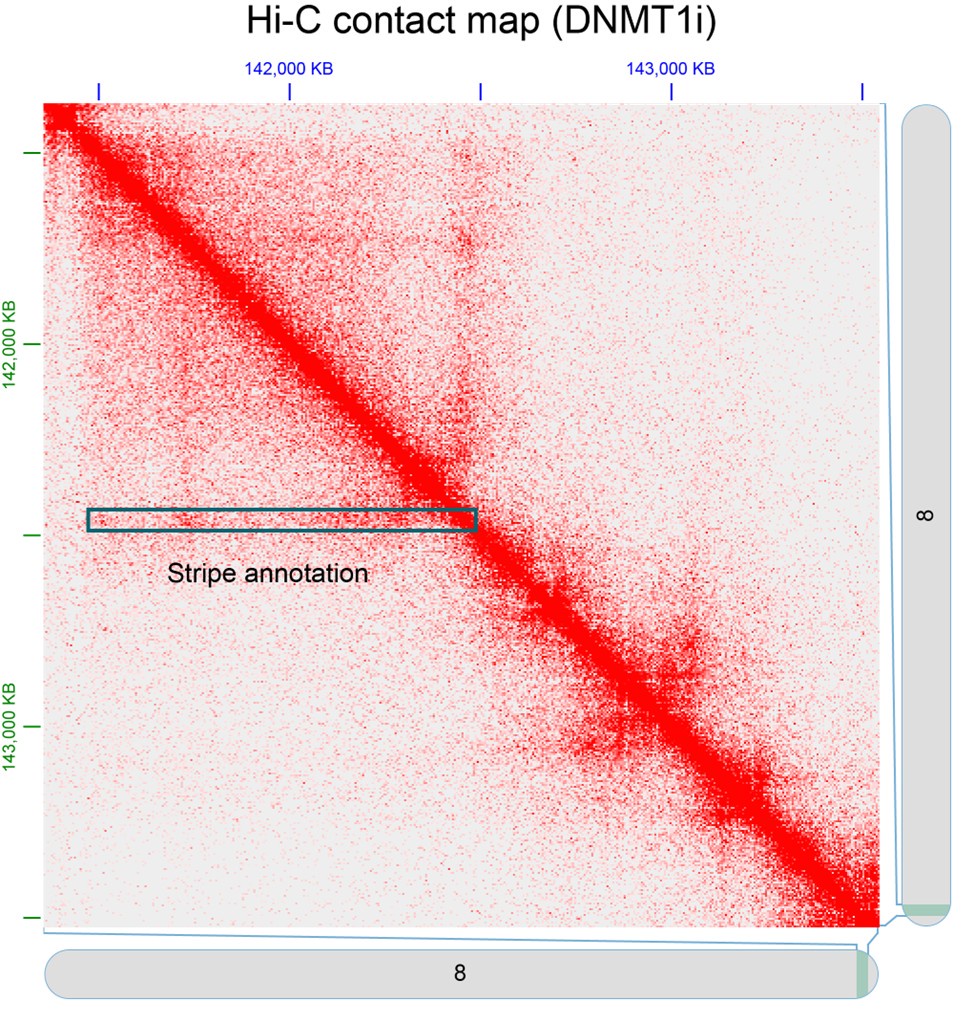
⁃ Here 4-10x more DNMT1i-specific CTCF binding sites were observed than we saw in our study. What are thresholds? Could the thresholds for DNMT1i-specific peaks be defined more clearly? For what it's worth, we defined our DNMT KO-specific peaks as fold-change {greater than or equal to} 2, adjusted P< 0.05. The scatterplots (1B) indicate a lot of "small" peaks being called "reactivated."
We called DNMT1i-specific peaks using HOMER getDifferentialPeaksReplicates function. We used foldchange >2 and padj <0.05. We further restricted these peaks to those that were not called in the DMSO condition.
⁃ On this note, is "reactivated" the proper term? Reactivated with regards to what? A prior cell state? I think DNMT1i-specific is a safer descriptor.
We chose this term based on prior literature (Maurano 2015 http://dx.doi.org/10.1016/j.celrep.2015.07.024, Spracklin 2023 https://doi.org/10.1038/s41594-022-00892-7) . However, we agree it is not very clear, so we’ve altered the text to say “DNMT1i-specific”. We thank the reviewer for suggesting this improved terminology.
⁃ It appears there is a relatively small enrichment for CTCF peaks (of any class) in intergenic regions. How were intergenic regions defined? For us, it is virtually half of the genome. We did some enrichment of DNMT KO-specific peaks in gene bodies (our Supplemental Figure 1C), but a substantial proportion were still intergenic.
We defined intergenic peaks using HOMER’s annotatepeaks function, with the -gtf option using Ensembl gene annotations (v104). We used the standard annotatepeaks priority order, which is TSS > TTS> CDS Exons > 5’UTR exons >3’ UTR exons > Introns > Intergenic.
Maurano et. al. 2015 (http://dx.doi.org/10.1016/j.celrep.2015.07.024) also found reduced representation of intergenic sites among demethylation-reactivated CTCF sites in their Fig S5A. We note this is not a perfect comparison because their data is displayed as a fraction of all intergenic peaks.
⁃ We also recently published a review on this subject: The impact of DNA methylation on CTCF-mediated 3D genome organization NSMB 2024 (PMID: 38499830) which could be cited if the authors choose.
We have cited this relevant review.
Author response:
The following is the authors’ response to the original reviews
Public Reviews:
Reviewer #1 (Public review):
Summary:
This study puts forth the model that under IFN-B stimulation, liquid-phase WTAP coordinates with the transcription factor STAT1 to recruit MTC to the promoter region of interferon-stimulated genes (ISGs), mediating the installation of m<sup>6</sup>A on newly synthesized ISG mRNAs. This model is supported by strong evidence that the phosphorylation state of WTAP, regulated by PPP4, is regulated by IFN-B stimulation, and that this results in interactions between WTAP, the m<sup>6</sup>A methyltransferase complex, and STAT1, a transcription factor that mediates activation of ISGs. This was demonstrated via a combination of microscopy, immunoprecipitations, m<sup>6</sup>A sequencing, and ChIP. These experiments converge on a set of experiments that nicely demonstrate that IFN-B stimulation increases the interaction between WTAP, METTL3, and STAT1, that this interaction is lost with the knockdown of WTAP (even in the presence of IFN-B), and that this IFN-B stimulation also induces METTL3-ISG interactions.
Strengths:
The evidence for the IFN-B stimulated interaction between METTL3 and STAT1, mediated by WTAP, is quite strong. Removal of WTAP in this system seems to be sufficient to reduce these interactions and the concomitant m<sup>6</sup>A methylation of ISGs. The conclusion that the phosphorylation state of WTAP is important in this process is also quite well supported.
Weaknesses:
The evidence that the above mechanism is fundamentally driven by different phase-separated pools of WTAP (regulated by its phosphorylation state) is weaker. These experiments rely relatively heavily on the treatment of cells with 1,6-hexanediol, which has been shown to have some off-target effects on phosphatases and kinases (PMID 33814344).
Given that the model invoked in this study depends on the phosphorylation (or lack thereof) of WTAP, this is a particularly relevant concern.
We are grateful for the reviewer’s positive comment and constructive feedback. 1,6-hexanediol (hex) was considered an inhibitor of hydrophobic interaction, thereby capable of dissolving protein phase separation condensates. Hex (5%-10% w/v) was still widely used to explore the phase separation characteristic and function on various protein, including some phosphorylated proteins such as pHSF1, or kinases such as NEMO1-3. Since hydrophobic interactions involved in various types of protein-protein interaction, the off-target effects of hex were inevitable. It has been reported that hex impaired RNA polymerase II CTD-specific phosphatase and kinase activity at 5% concentration4, which led to the reviewer’s concern. In response to this concern, we investigated the phosphorylation level of WTAP under hex concentration gradient treatment. Surprisingly, we found that both 2% and 5% hex maintained the PPP4c-mediated dephosphorylation level of WTAP but still led to the dissolution of WTAP LLPS condensates (Figure 5-figure supplement 1H; Author response image 1), indicating that hex dispersed WTAP phase separation in a phosphorylation-independent manner. Consistent with our findings, Ge et al. used 10% hex to dissolve WTAP phase separation condensates5. Additionally, we found the phosphorylation level of STAT1 was not affected by both 2% and 5% hex, revealing the off-target and impairment function of hex on kinases or phosphatases might not be universal (Figure 5-figure supplement 1H). Collectively, since the 5% hex we used did not influence the de-phosphorylation event of WTAP, function of WTAP LLPS mediating interaction between methylation complex and STAT1 revealed by our results was independent from its phosphorylation status.
Author response image 1.
mCherry-WTAP-rescued HeLa cells were treated with 10 ng/mL IFN-β together with or without 2% or 5% hex and 20 μg/mL digitonin for 1 hour or left untreated. Phase separation of mCherry-WTAP was observed through confocal microscopy. The number of WTAP condensates that diameter over 0.4 μm of n = 20 cells were counted through ImageJ and shown. Scale bars indicated 10 μm. All error bars, mean values ± SD, P-values were determined by unpaired two-tailed Student’s t-test of n = 20 cells in (B). For (A), similar results were obtained for three independent biological experiments.
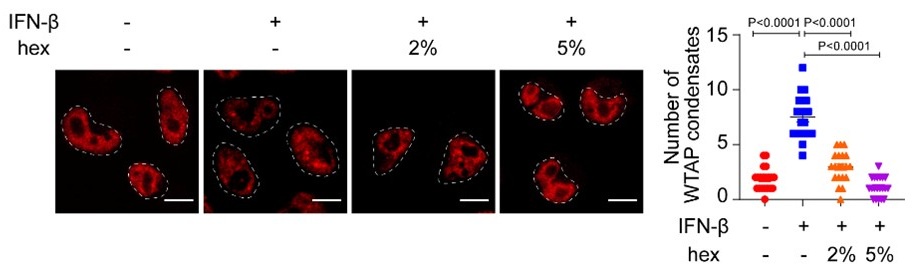
Related to this point, it is also interesting (and potentially concerning for the proposed model) that the initial region of WTAP that was predicted to be disordered is in fact not the region that the authors demonstrate is important for the different phase-separated states.
A considerable number of proteins undergo phase separation via interactions between intrinsically disordered regions (IDRs). IDR contains more charged and polar amino acids to present multiple weakly interacting elements, while lacking hydrophobic amino acids to show flexible conformations6. In our study, we used PLAAC websites (http://plaac.wi.mit.edu/) to predict IDR domain of WTAP, and a fragment (234-249 amino acids) was predicted as prion-like domain (PLD). However, deletion of this fragment failed to abolish the phase separation properties of WTAP, which might be the main confusion to reviewers. To explain this issue, we checked the WTAP structure (within part of MTC complex) from protein data bank (https://www.rcsb.org/structure/7VF2) and found that the prediction of IDR has been renewed due to the update of different algorithm. IDR of WTAP expanded to 245-396 amino acids, encompassing the entire CTD region. Our results demonstrate that the CTD was critical for WTAP LLPS, as CTD deficiency significantly inhibited the formation of liquid condensates both in vitro and in cells. Also, phosphorylation sites on CTD were important for the phase transition of WTAP. These observations highlight the phosphorylation status on CTD region as a key driving force of phase separation, consistent with the established role of IDR in regulating LLPS. We have revised our description on WTAP IDR in our article following the reviewers’ suggestion.
Taking all the data together, it is also not clear to me that one has to invoke phase separation in the proposed mechanism.
In this article, we observed that WTAP underwent phase transition during virus infection and IFN-β treatment, and proposed a novel mechanism whereby post translational modification (PTM)-driven WTAP LLPS was required for the m<sup>6</sup>A modification of ISG mRNAs. To verify the hypothesis, we first demonstrated the relationship between PTM and phase separation of WTAP. We constructed WTAP 5ST-D and 5ST-A mutant to mimic WTAP phosphorylation and dephosphorylation status respectively, and figured out that dephosphorylated WTAP underwent LLPS. We also found that PPP4 was the main phosphatase to regulate WTAP dephosphorylation. To further investigation, we introduced the potent PPP4 inhibitor, fostriecin. Consistent with our findings in PPP4 deficient model, fostriecin treatment significantly inhibited the IFN-β-induced dephosphorylation of WTAP and disrupted its LLPS condensates, indicating that PPP4 was the key phosphatase recruited by IFN-β to regulate WTAP, confirming that PTM governs WTAP LLPS dynamics (Figure 2-figure supplement 1C and H). Furthermore, fostriecin-induced impairment of WTAP phosphorylation and phase separation correlated with reduced m<sup>6</sup>A modification level and elevated ISGs expression level (Figure 4C and Figure 4-figure supplement 1E). These findings together emphasized that dephosphorylation is required for WTAP LLPS.
As for the function of WTAP LLPS, we assumed that WTAP might undergo LLPS to sequester STAT1 together with m<sup>6</sup>A methyltransferase complex (MTC) for mediating m<sup>6</sup>A deposition on ISG mRNAs co-transcriptionally under IFN-β stimulation. Given that hex dissolved WTAP LLPS condensates without affecting dephosphorylation status (Figure 5-figure supplement 1H; Author response image 1), various experiments we performed previously actually confirmed the critical role of WTAP LLPS during m<sup>6</sup>A modification (Figure 4A), as well as the mechanism that WTAP phase separation enhanced the interaction between MTC and STAT1 (Figure 5E-F). Subsequent to reviewer’s comments, more experiments were conducted for further validation. We found the WTAP liquid condensates formed by wild type (WT) WTAP or WTAP 5ST-A mutant (which mimics dephosphorylated-WTAP) could be dissembled by hex, which also led to the impairment of the interaction between STAT1, METTL3 and WTAP (Figure 5-figure supplement 1E). In addition, in vitro experiments demonstrated that hex treatment significantly disrupted the interaction between recombinant GFP-STAT1 and mCherry-WTAP which expressed in the E. coli system (Figure 5F and Figure 5-figure supplement 1G). Notably, this prokaryotic expression system lacks endogenous phosphorylation machinery, resulting in non-phosphorylated mCherry-WTAP. For further validation, we performed the interaction of WTAP WT or 5ST-A with the promoter regions of ISG as well as the m<sup>6</sup>A modification of ISG mRNAs were attenuated by WTAP LLPS dissolution (Figure 4E and Figure 6E). These findings together revealed that WTAP LLPS were the critical mediators of the STAT1-MTC interactions, ISG promoter regions binding and the co-transcription m<sup>6</sup>A modification.
Collectively, our results demonstrated that IFN-β treatment recruited PPP4c to dephosphorylate WTAP, thereby driving the formation of WTAP liquid condensates which were essential for facilitating STAT1-MTC interaction and m<sup>6</sup>A deposition, subsequently mediated ISG expression. Since we revealed a strong association between PTM-regulated WTAP phase transition and its m<sup>6</sup>A modification function, WTAP LLPS was a novel and functionally distinct mechanism that must be reckoned with in this study.
Author response image 2.
Wild type (WT) WTAP or 5ST-A mutant-rescued WTAP<sup>sgRNA</sup> THP-1-derived macrophages are stimulated with or without with 10 ng/mL IFN-β together followed with 2% or 5% 1,6-hexanediol (hex) and 20 μg/mL digitonin for 1 hour or left untreated. antibody and imaged using confocal microscope. Scale bars indicated 10 μm.
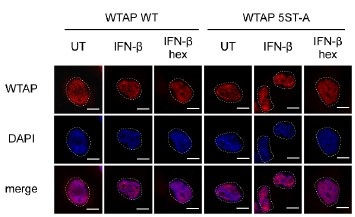
Reviewer #2 (Public review):
In this study, Cai and colleagues investigate how one component of the m<sup>6</sup>A methyltransferase complex, the WTAP protein, responds to IFNb stimulation. They find that viral infection or IFNb stimulation induces the transition of WTAP from aggregates to liquid droplets through dephosphorylation by PPP4. This process affects the m<sup>6</sup>A modification levels of ISG mRNAs and modulates their stability. In addition, the WTAP droplets interact with the transcription factor STAT1 to recruit the methyltransferase complex to ISG promoters and enhance m<sup>6</sup>A modification during transcription. The investigation dives into a previously unexplored area of how viral infection or IFNb stimulation affects m<sup>6</sup>A modification on ISGs. The observation that WTAP undergoes a phase transition is significant in our understanding of the mechanisms underlying m<sup>6</sup>A's function in immunity. However, there are still key gaps that should be addressed to fully accept the model presented.
Major points:
(1) More detailed analyses on the effects of WTAP sgRNA on the m<sup>6</sup>A modification of ISGs:
a. A comprehensive summary of the ISGs, including the percentage of ISGs that are m<sup>6</sup>A-modified. merip-isg percentage
b. The distribution of m<sup>6</sup>A modification across the ISGs. Topology
c. A comparison of the m<sup>6</sup>A modification distribution in ISGs with non-ISGs. Topology
In addition, since the authors propose a novel mechanism where the interaction between phosphorylated STAT1 and WTAP directs the MTC to the promoter regions of ISGs to facilitate co-transcriptional m<sup>6</sup>A modification, it is critical to analyze whether the m<sup>6</sup>A modification distribution holds true in the data.
We appreciate the reviewer’s summary of our manuscript and the constructive assessment. We have conducted the related analysis accordingly to present the m<sup>6</sup>A modification in ISGs in our model as reviewers suggested. Our results showed that about 64.29% of core ISGs were m<sup>6</sup>A modified under IFN-β stimulation (Figure 3-figure supplement 1B; Figure 3G), which was consistent with the similar percentage in previous studies[7,8]. The m<sup>6</sup>A distribution of the ISGs transcripts including IFIT1, IFIT2, OAS1 and OAS2 was validated (Figure 3-figure supplement 1H).
Generally, m<sup>6</sup>A deposition preferentially located in the vicinity of stop codon, while m<sup>6</sup>A modification was highly dynamic under different cellular condition. However, we compared the topology of m<sup>6</sup>A deposition of ISGs with non-ISGs, and found that m<sup>6</sup>A modification of ISG mRNAs showed higher preference of coding sequences (CDS) localization compared to global m<sup>6</sup>A deposition (Figure 3H). Similarly, various researches uncovered the m<sup>6</sup>A deposition regulated by co-transcriptionally m<sup>6</sup>A modification preferred to locate in the CDS [9-11]. Since our results of m<sup>6</sup>A modification distribution of ISGs was consistent with the co-transcriptional m<sup>6</sup>A modification characteristics, we believed that our hypothesis and results were correlated and consistent.
(2) Since a key part of the model includes the cytosol-localized STAT1 protein undergoing phosphorylation to translocate to the nucleus to mediate gene expression, the authors should focus on the interaction between phosphorylated STAT1 and WTAP in Figure 4, rather than the unphosphorylated STAT1. Only phosphorylated STAT1 localizes to the nucleus, so the presence of pSTAT1 in the immunoprecipitate is critical for establishing a functional link between STAT1 activation and its interaction with WTAP.
Thank you for the constructive comments. As we showed in Figure 4, we found the enhanced interaction between phase-separated WTAP and the nuclear-translocated STAT1 which were phosphorylated under IFN-β stimulation, indicating the importance of phosphorylation of STAT1. We repeated the immunoprecipitation experiments to clarify the function of pSTAT1 in WTAP interaction. Our results showed that IFN-β stimulation induced the interaction of WTAP with both pSTAT1 and STAT1 (Figure 5-figure supplement 1C), indicating that most of the WTAP-associated STAT1 was phosphorylated. Taken together, our data proved that LLPS WTAP bound with nuclear-translocated pSTAT1 under IFN-β stimulation.
(3) The authors should include pSTAT1 ChIP-seq and WTAP ChIP-seq on IFNb-treated samples in Figure 5 to allow for a comprehensive and unbiased genomic analysis for comparing the overlaps of peaks from both ChIP-seq datasets. These results should further support their hypothesis that WTAP interacts with pSTAT1 to enhance m<sup>6</sup>A modifications on ISGs.
Thank you for raising this thoughtful comment. In this study, MeRIP-seq and RNA-seq along with immunoprecipitation and immunofluorescence experiments supported that phase transition of WTAP enhanced its interaction to pSTAT1, thus mediating ISGs m<sup>6</sup>A modification and expression by enhancing its interaction with nuclear-translocated pSTAT1 during virus infection and IFN-β stimulation. However, how WTAP-mediated m<sup>6</sup>A modification was related to STAT1-mediated transcription remained unclear. Several researches have revealed the recruitment of m<sup>6</sup>A methyltransferase complex (MTC) to transcription start sites (TSS) of coding genes and R-loop structure by interacting with transcriptional factors STAT5B, SMAD2/3, DNA helicase DDX21, indicating the engagement of MTC mediated m<sup>6</sup>A modification on nascent transcripts at the very beginning of transcription [11-13]. These researches inspired us that phase-separated WTAP could be recruited to the ISG promoter regions via interacting with nuclear-translocated pSTAT1. To validate this mechanism, we have conducted ChIP-qPCR experiments targeting STAT1 and WTAP, revealed that IFN-β induced the comparable recruitment dynamics of both STAT1 and WTAP to ISG promoter regions (Figure 6A-B). Notably, STAT1 deficiency significantly abolished the bindings between WTAP and ISG promoter regions (Figure 6C). These findings established nuclear-translocated STAT1-dependent recruitment of phase separated WTAP and ISG promoter region, substantiated our hypothesis within the current study. We totally agree that ChIP-seq data will be more supportive to explore the mechanism in depth. We will continuously focus on the whole genome chromatin distribution of WTAP and explore more functional effect of transcriptional factor-dependent WTAP-promoter regions interaction in the future.
Minor points:
(1) Since IFNb is primarily known for modulating biological processes through gene transcription, it would be informative if the authors discussed the mechanism of how IFNb would induce the interaction between WTAP and PPP4.
Protein phosphatase 4 (PPP4) is a multi-subunit serine/threonine phosphatase complex that participates in diverse biologic process, including DDR, cell cycle progression, and apoptosis[14]. Several signaling pathway such as NF-κB and mTOR signaling, can be regulated by PPP4. Previous research showed that deficiency of PPP4 enhanced IFN-β downstream signaling and ISGs expression, which was consistent with our findings that knockdown of PPP4C impaired WTAP-mediated m<sup>6</sup>A modification, enhanced the ISGs expression[15,16]. Since there was no significant enhancement in PPP4 expression level during 0-3 hours of IFN-β stimulation in our results, we explored the PTM that may influence the protein-protein interaction, such as ubiquitination. Intriguingly, we found the ubiquitination level of PPP4 was enhanced after IFN-β stimulation, which may affect the interaction between PPP4 and WTAP (Author response image 3). Further investigation between PPP4 and WTAP will be conducted in our future study.
Author response image 3.
HEK 293T transfected with HA-ubiquitin (HA-Ub) and Flag-PPP4 were treated with 10 ng/mL IFN-β or left untreated. Whole cell lysate (WCL) was collected and immunoprecipitation (IP) experiment using anti-Flag antibody was performed, followed with immunoblot. Similar results were obtained for three independent biological experiments.
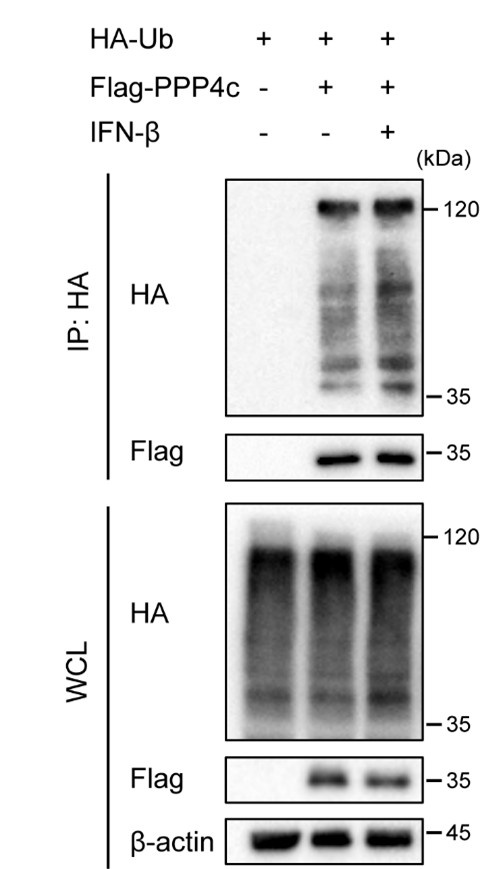
(2) The authors should include mCherry alone controls in Figure 1D to demonstrate that mCherry does not contribute to the phase separation of WTAP. Does mCherry have or lack a PLD?
According to the crystal structure of mCherry protein in protein structure database RCSB-PDB, mCherry protein presents as a β-barrel protein, with no IDRs or multivalent interaction domains including PLD, indicating that mCherry protein has no capability to undergo phase separation. This characteristic makes it a suitable protein to tag and trace the localization or expression levels of proteins, and a negative control for protein phase separation studies. As the reviewer suggested, we include mCherry alone controls in the revised version (Figure 1D).
(3) The authors should clarify the immunoprecipitation assays in the methods. For example, the labeling in Figure 2A suggests that antibodies against WTAP and pan-p were used for two immunoprecipitations. Is that accurate?
Due to the lack of phosphorylated-WTAP antibody, the detection of phosphorylation of WTAP was conducted by WTAP-antibody-mediated immunoprecipitation. We conducted immunoprecipitation to pull-down WTAP protein by WTAP antibody, then used antibody against phosphoserine/threonine/tyrosine (pan-p) to detect the phosphorylation level of WTAP. To avoid the misunderstanding, we have modified the description from pan-p to pWTAP (pan-p) in figures and revised the figure legends.
(4) The authors should include overall m<sup>6</sup>A modification levels quantified of GFP<sup>sgRNA</sup> and WTAP<sup>sgRNA</sup> cells, either by mass spectrometry (preferably) or dot blot.
We thank reviewer for raising these useful suggestions. As we showed in Figure 3F and J-K, the m<sup>6</sup>A modification event and degradation of ISG mRNAs were significantly depleted in WTAP<sup>sgRNA</sup> cell lines, indicating that function of WTAP was deficient. Thus, we used the WTAP<sup>sgRNA</sup> #2 cell line to perform most of our experiment. Furthermore, we also found 46.4% of global m<sup>6</sup>A modification was decreased in WTAP<sup>sgRNA</sup> THP-1 cells than that of control cells with or without IFN-β stimulation (Author response image 4), further validating that level of m<sup>6</sup>A modification was significantly affected in WTAP<sup>sgRNA</sup> cells. Taken together, our data confirmed that m<sup>6</sup>A methyltransferase activity was efficiently inhibited in our WTAP<sup>sgRNA</sup> cells.
Author response image 4.
Control (GFP<sup>sgRNA</sup>) and WTAP<sup>sgRNA</sup> #2 THP-1-derived macrophages were treated with 10 ng/mL IFN-β for 4 hours. Global m<sup>6</sup>A level was detected and quantified through ELISA assays. All error bars, mean values ± SEM, P-values were determined by two-way ANOVA test independent biological experiments.
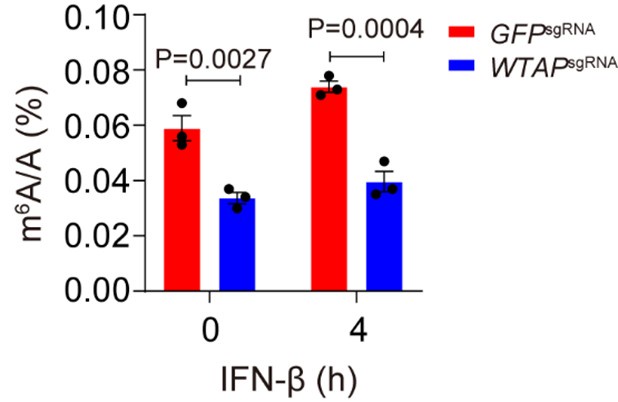
Reviewer #3 (Public review):
Summary:
This study presents a valuable finding on the mechanism used by WTAP to modulate the IFN-β stimulation. It describes the phase transition of WTAP driven by IFN-β-induced dephosphorylation. The evidence supporting the claims of the authors is solid, although major analysis and controls would strengthen the impact of the findings. Additionally, more attention to the figure design and to the text would help the reader to understand the major findings.
Strength:
The key finding is the revelation that WTAP undergoes phase separation during virus infection or IFN-β treatment. The authors conducted a series of precise experiments to uncover the mechanism behind WTAP phase separation and identified the regulatory role of 5 phosphorylation sites. They also succeeded in pinpointing the phosphatase involved.
Weaknesses:
However, as the authors acknowledge, it is already widely known in the field that IFN and viral infection regulate m<sup>6</sup>A mRNAs and ISGs. Therefore, a more detailed discussion could help the reader interpret the obtained findings in light of previous research.
We are grateful for the positive comments and the unbiased advice by the reviewer. To interpret our findings in previous research, we have revised the manuscript carefully and added more detailed discussion on ISG mRNAs m<sup>6</sup>A modification during virus infection or IFN stimulation.
It is well-known that protein concentration drives phase separation events. Similarly, previous studies and some of the figures presented by the authors show an increase in WTAP expression upon IFN treatment. The authors do not discuss the contribution of WTAP expression levels to the phase separation event observed upon IFN treatment. Similarly, METTL3 and METTL14, as well as other proteins of the MTC are upregulated upon IFN treatment. How does the MTC protein concentration contribute to the observed phase separation event?
We thank reviewer for pointing out the importance of the concentration dependent phase transition. Previously, Ge et al. discovered that expression level of WTAP was up-regulated during LPS stimulation, thereby promoting WTAP phase separation ability and m<sup>6</sup>A modification, indicating that WTAP concentration indeed affects the phase separation event. In our article, we have generated the phase diagram with different concentration of recombinant mCherry-WTAP in vitro (Figure 1-figure supplement 1C). For in cells experiments, we constructed the TRE-mCherry-WTAP HeLa cells in which the expression of mCherry-WTAP was induced by doxycycline (Dox) in a dose-dependent manner (Author response image 5A). We detected the LLPS of mCherry-WTAP at different concentrations by increasing the doses of Dox, and found that WTAP automatically underwent LLPS only in an artificially high expression level (Author response image 5B). However, the cells we used to detect the WTAP phase separation in our article was mCherry-WTAP-rescued HeLa cells, in which mCherry-WTAP was introduced in WTAP<sup>sgRNA</sup> HeLa cells to stably express mCherry-WTAP. We had adjusted and verified the mCherry-WTAP expression level precisely to make the protein abundance similar to endogenous WTAP in wild type (WT) HeLa cells (Author response image 5C). We also repeated the IFN-β stimulation experiments and found no significant increase of WTAP protein level (Figure 5-figure supplement 1A). These findings indicated the phase separation of WTAP in our article was not artificially induced due to the extremely high protein expression level.
MTC protein expression level was crucial for m<sup>6</sup>A modification during virus infection event. Rubio et al. and Winkler et al. revealed that WTAP, METTL3 and METTL14 were up-regulated after 24 hours of HCMV infection[8,17]. Recently, Ge et al. proposed that WTAP protein was degraded after 12 hours of VSV and HSV stimulation5,18. However, these studies only focused on the virus infection event, how the MTC protein expression change after direct IFN-β stimulation was still unclear. Our study investigated the transition change of WTAP under IFNβ stimulation in a short time, we detected the expression level of MTC proteins within 6 hours of IFN-β treatment, and found no significant enhancement of WTAP, METTL3 or METTL14 protein level and mRNA level (Figure 5-figure supplement 1B and Figure 5-figure supplement 1A;). Our in vitro experiments showed that introducing CFP-METTL3 protein have no significant influence on WTAP phase separation (Figure 4H). Additionally, we performed in cells experiments and found that increased expression of METTL3 had no effect on WTAP phase separation event (Author response image 5D). Taken together, WTAP phase separation can be promoted by dramatically increased concentration of WTAP both in vitro and in cells, but the phase separation of WTAP under IFN-β stimulation in our study was not related with the expression level of MTC proteins.
Author response image 5.
(A) Immunoblot analysis of the expression of mCherry-WTAP in TRE-mCherry-WTAP HeLa cells treated with different doses of doxycycline (Dox). Protein level of mCherry-WTAP was quantified and normalized to β-actin of n=3 independent biological experiments. Results were obtained for three independent biological experiments. (B) Phase separation diagram of mCherry-WTAP in TRE-mCherry-WTAP HeLa cells treated with different doses of Dox were observed through confocal microscopy. Representative images for three independent biological experiments were shown in b while number of WTAP condensates that diameter over 0.4 μm of n=80 cells were counted and shown as medium with interquartile range. Dotted white lines indicated the location of nucleus. Scale bars indicated 10 μm. (C) Immunoblot analysis of the expression of endogenous WTAP in wildtype (WT) HeLa cells and mCherry-WTAP-rescued WTAP<sup>sgRNA</sup> HeLa cells. (D) mCherry-WTAP-rescued HeLa cells were transfected with 0, 200 or 400 ng of Flag-METTL3, followed with 10 ng/mL IFN-β for 1 hour or left untreated (UT). Phase separation of mCherry-WTAP was observed through confocal microscopy. The number of WTAP condensates that diameter over 0.4 μm of n = 20 cells were counted through ImageJ and shown. Representative images of n=20 cells were shown. All error bars, mean values ± SD were determined by unpaired two-tailed Student’s t-test of n = 3 independent biological experiments in (A). For (A, C), similar results were obtained for three independent biological experiments.
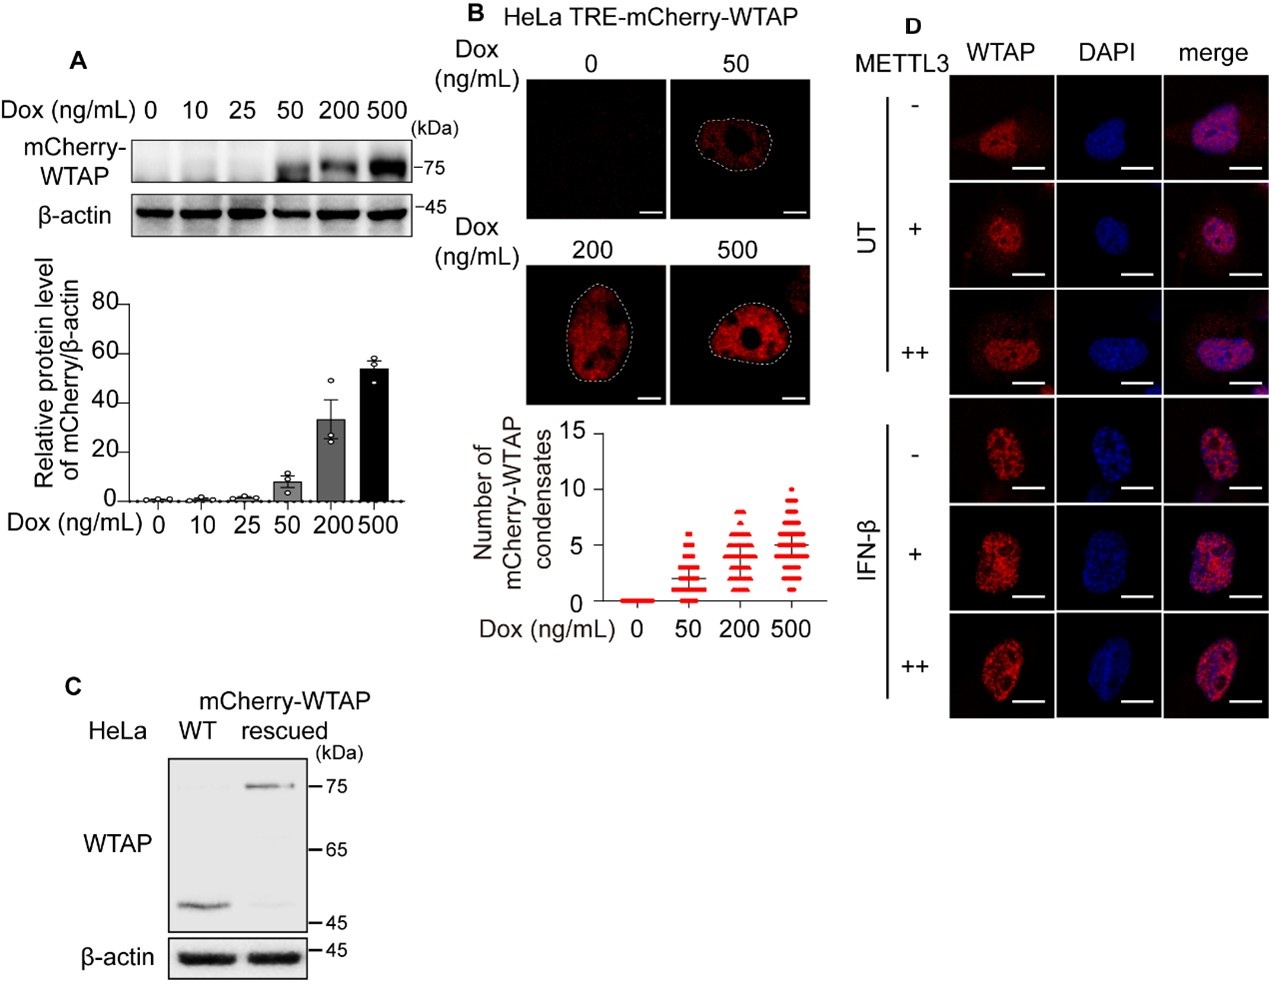
How is PP4 related to the IFN signaling cascade?
Both reviewer #2 and reviewer #3 raised a similar point on the relationship between PPP4 and IFN signaling. In short, protein phosphatase 4 (PPP4) participates in diverse biologic process, including DDR, cell cycle progression and apoptosis14 and several signaling pathway. Previous research showed that deficiency of PPP4 enhanced IFN-β downstream signaling and ISGs expression, which was consistent with our findings that knockdown of PPP4C impaired WTAP-mediated m<sup>6</sup>A modification, and enhanced the ISGs expression[15,16]. Since there was no significant enhancement in PPP4C expression level during 0-3 hours of IFN-β stimulation in our results, we tried to explore the post-translation modification which may influence the protein-protein interaction, such as ubiquitination. Intriguingly, we found the ubiquitination level of PPP4 was enhanced after IFN-β stimulation, which may affect the interaction between PPP4 and WTAP (Author response image 4). Investigation between PPP4 and WTAP will be conducted in our further study (also see minor points 1 of reviewer#2).
In general, it is very confusing to talk about WTAP KO as WTAPgRNA.
As we describe above, all WTAP-deficient THP-1 cells were generated using the CRISPR-Cas9 system with WTAP-specific sgRNA, and used bulk cells instead of the monoclonal knockout cell for further experiments. Since monoclonal knockout cells were not obtained, we refer it as WTAP<sup>sgRNA</sup> THP-1 cells rather than WTAP-KO THP-1 cells. We confirmed that WTAP expression was efficiently knocked down in WTAP<sup>sgRNA</sup> THP-1 cells, and the m<sup>6</sup>A modification level was significantly impaired (Figure 3I, Figure 3-figure supplement 1A and Author response image 4), which was suitable for mechanism investigation.
Recommendations for the authors:
Reviewer #1 (Recommendations for the authors):
Related to the points raised in 'weaknesses' above, if the authors want to claim that this mechanism is reliant on WTAP phase-separated states, additional controls should be done to demonstrate this. Based on the available data it seems that it is just as likely that the phosphorylation state of WTAP is mediating interactions with other factors and/or altering its subcellular localization, which may or may not be related to phase separation.
We are grateful for the constructive suggestions. As we showed in , Figure 5-figure supplement 1H; Author response image 1 along with the explanation above, 5% hex dispersed the phase separation condensates of WTAP without affecting its phosphorylation status, proving the interaction between STAT1 and methylation complex impaired by hex was depended on WTAP LLPS but not its phosphorylation status (Figure 5E-H). To further confirmed the recruitment of WTAP LLPS on ISG promoter region, we performed the immunoprecipitation and ChIP-qPCR experiments of wild type (WT) WTAP, 5ST-D and 5ST-A rescued THP-1 cells. Our results uncovered the interaction between de-phosphorylated-mimic WTAP mutant and STAT1, and its binding ability with ISG promoter regions were depleted by hex without affecting its phosphorylation status (Author response image 2, Figure 5-figure supplement 1 F, Figure 6E). Taken together, we identified the de-phosphorylation event that regulated phase transition of WTAP during IFN-β stimulation, and proposed that LLPS of WTAP mediated by dephosphorylation was the key mechanism to bind with STAT1 and mediate the m<sup>6</sup>A modification on ISG mRNAs.
Reviewer #2 (Recommendations for the authors):
The author order is different for the main text and the supplementary file.
Thank you for pointing out this mistake. We have corrected it in our revised version.
Reviewer #3 (Recommendations for the authors):
Signaling molecules? Do you mean RNA or protein post-translational modification?
Thank you for pointing out this problem. In this sentence, we mean the post-translational modification of signaling proteins. We have corrected this mistake in our revised version.
Line 145: Do you mean Figure 1C?
We have corrected it in our revised version.
Line 214: Are the cells KO for WTAP? Do you mean CRISPR KO? In general, it is easier to present WTAPgRNA as WTAPKO.
Thank you for the constructive suggestion. As we explained above, in this project, all WTAP-deficient THP-1 cells were generated using the CRISPR-Cas9 system with WTAP-specific sgRNA, and used bulk cells instead of the monoclonal knockout cells. We confirmed that WTAP expression was efficiently knocked down in WTAP<sup>sgRNA</sup> THP-1 cells, and the m<sup>6</sup>A modification level was significantly impaired (Figure 3I, Figure3-figure supplement 1A and Author response image 4). Since monoclonal knockout cells were not obtained, we refer it as WTAP<sup>sgRNA</sup> THP-1 cells rather than WTAP-KO THP-1 cells.
Line 221: WTAP KO has no effect on the expression level of transcription factors?
Thank you for pointing out the uncritical expression. We have corrected this in our revised version.
Figure 3C: I would suggest removing the tracks and showing the expression levels in TPMs.
According to the reviewer’s suggestion, we have analyzed the results and showed the ISGs expression levels in fold change of TPMs (Figure 3D).
Figure 4C: It seems that the IP efficiency from METTL3 is lower in WTAP KO cells. That may impact the author's conclusions.
We have repeated the immunoprecipitation experiments of METTL3 and confirmed the immunoprecipitation (IP) efficiency from METTL3 had no difference between WTAP<sup>sgRNA</sup> cells and the control cells (Figure 5C).
I would suggest performing an IP of WTAP with the 5StoA mutation to confirm the missing interaction with WTAP.
According to the reviewer’s suggestion, we investigated the interaction between STAT1 and WTAP in WT cells and WTAP 5ST-A-rescued THP-1 cells. Our results showed that interaction between STAT1, METTL3 and WTAP were enhanced with WTAP 5ST-A mutation, which was depleted by hex treatment (Figure 5-figure supplement 1E). Thus, the interaction of WTAP WT or 5ST-A with the promoter regions of ISG were attenuated by WTAP LLPS dissolution (Figure 6E). Taken together, the interaction between STAT1 and MTC were relied on LLPS of WTAP.
In the graphical abstract, it is confusing to represent WTAP as a line. All other proteins are presented as circles. It is easy to confuse WTAP protein with an RNA. Additionally, m<sup>6</sup>A is too big in size. It should be smaller than a protein.
We thank the reviewer for raising this suggestion. We have modified the graphical abstract to avoid the confusion in our revised version (Figure 6F).
References
(1) Wegmann, S., Eftekharzadeh, B., Tepper, K., Zoltowska, K.M., Bennett, R.E., Dujardin, S., Laskowski, P.R., MacKenzie, D., Kamath, T., Commins, C., et al. (2018). Tau protein liquid-liquid phase separation can initiate tau aggregation. The EMBO journal 37. 10.15252/embj.201798049.
(2) Lu, Y., Wu, T., Gutman, O., Lu, H., Zhou, Q., Henis, Y.I., and Luo, K. (2020). Phase separation of TAZ compartmentalizes the transcription machinery to promote gene expression. Nat Cell Biol 22, 453-464. 10.1038/s41556-020-0485-0.
(3) Zhang, H., Shao, S., Zeng, Y., Wang, X., Qin, Y., Ren, Q., Xiang, S., Wang, Y., Xiao, J., and Sun, Y. (2022). Reversible phase separation of HSF1 is required for an acute transcriptional response during heat shock. Nat Cell Biol 24, 340-352. 10.1038/s41556-022-00846-7.
(4) Duster, R., Kaltheuner, I.H., Schmitz, M., and Geyer, M. (2021). 1,6-Hexanediol, commonly used to dissolve liquid-liquid phase separated condensates, directly impairs kinase and phosphatase activities. J Biol Chem 296, 100260. 10.1016/j.jbc.2021.100260.
(5) Ge, Y., Chen, R., Ling, T., Liu, B., Huang, J., Cheng, Y., Lin, Y., Chen, H., Xie, X., Xia, G., et al. (2024). Elevated WTAP promotes hyperinflammation by increasing m<sup>6</sup>A modification in inflammatory disease models. J Clin Invest 134. 10.1172/JCI177932.
(6) Hou, S., Hu, J., Yu, Z., Li, D., Liu, C., and Zhang, Y. (2024). Machine learning predictor PSPire screens for phase-separating proteins lacking intrinsically disordered regions. Nat Commun 15, 2147. 10.1038/s41467-024-46445-y.
(7) McFadden, M.J., McIntyre, A.B.R., Mourelatos, H., Abell, N.S., Gokhale, N.S., Ipas, H., Xhemalce, B., Mason, C.E., and Horner, S.M. (2021). Post-transcriptional regulation of antiviral gene expression by N6-methyladenosine. Cell Rep 34, 108798. 10.1016/j.celrep.2021.108798.
(8) Winkler, R., Gillis, E., Lasman, L., Safra, M., Geula, S., Soyris, C., Nachshon, A., Tai-Schmiedel, J., Friedman, N., Le-Trilling, V.T.K., et al. (2019). m(6)A modification controls the innate immune response to infection by targeting type I interferons. Nat Immunol 20, 173-182. 10.1038/s41590-018-0275-z.
(9) Li, Y., Xia, L., Tan, K., Ye, X., Zuo, Z., Li, M., Xiao, R., Wang, Z., Liu, X., Deng, M., et al. (2020). N(6)-Methyladenosine co-transcriptionally directs the demethylation of histone H3K9me2. Nat Genet 52, 870-877. 10.1038/s41588-020-0677-3.
(10) Huang, H., Weng, H., Zhou, K., Wu, T., Zhao, B.S., Sun, M., Chen, Z., Deng, X., Xiao, G., Auer, F., et al. (2019). Histone H3 trimethylation at lysine 36 guides m(6)A RNA modification co-transcriptionally. Nature 567, 414-419. 10.1038/s41586-019-1016-7.
(11) Barbieri, I., Tzelepis, K., Pandolfini, L., Shi, J., Millan-Zambrano, G., Robson, S.C., Aspris, D., Migliori, V., Bannister, A.J., Han, N., et al. (2017). Promoter-bound METTL3 maintains myeloid leukaemia by m(6)A-dependent translation control. Nature 552, 126-131. 10.1038/nature24678.
(12) Hao, J.D., Liu, Q.L., Liu, M.X., Yang, X., Wang, L.M., Su, S.Y., Xiao, W., Zhang, M.Q., Zhang, Y.C., Zhang, L., et al. (2024). DDX21 mediates co-transcriptional RNA m(6)A modification to promote transcription termination and genome stability. Mol Cell 84, 1711-1726 e1711. 10.1016/j.molcel.2024.03.006.
(13) Bhattarai, P.Y., Kim, G., Lim, S.C., and Choi, H.S. (2024). METTL3-STAT5B interaction facilitates the co-transcriptional m(6)A modification of mRNA to promote breast tumorigenesis. Cancer Lett 603, 217215. 10.1016/j.canlet.2024.217215.
(14) Dong, M.Z., Ouyang, Y.C., Gao, S.C., Ma, X.S., Hou, Y., Schatten, H., Wang, Z.B., and Sun, Q.Y. (2022). PPP4C facilitates homologous recombination DNA repair by dephosphorylating PLK1 during early embryo development. Development 149. 10.1242/dev.200351.
(15) Zhan, Z., Cao, H., Xie, X., Yang, L., Zhang, P., Chen, Y., Fan, H., Liu, Z., and Liu, X. (2015). Phosphatase PP4 Negatively Regulates Type I IFN Production and Antiviral Innate Immunity by Dephosphorylating and Deactivating TBK1. J Immunol 195, 3849-3857. 10.4049/jimmunol.1403083.
(16) Raja, R., Wu, C., Bassoy, E.Y., Rubino, T.E., Jr., Utagawa, E.C., Magtibay, P.M., Butler, K.A., and Curtis, M. (2022). PP4 inhibition sensitizes ovarian cancer to NK cell-mediated cytotoxicity via STAT1 activation and inflammatory signaling. J Immunother Cancer 10. 10.1136/jitc-2022-005026.
(17) Rubio, R.M., Depledge, D.P., Bianco, C., Thompson, L., and Mohr, I. (2018). RNA m(6) A modification enzymes shape innate responses to DNA by regulating interferon beta. Genes Dev 32, 1472-1484. 10.1101/gad.319475.118.
(18) Ge, Y., Ling, T., Wang, Y., Jia, X., Xie, X., Chen, R., Chen, S., Yuan, S., and Xu, A. (2021). Degradation of WTAP blocks antiviral responses by reducing the m(6) A levels of IRF3 and IFNAR1 mRNA. EMBO Rep 22, e52101. 10.15252/embr.202052101.
Author response:
The following is the authors’ response to the original reviews.
Public Reviews:
Reviewer #1 (Public Review):
The model of phosphotransfer from Y169 IKK to S32 IkBa is compelling and an important new contribution to the field. In fact, this model will not be without controversy, and publishing the work will catalyze follow-up studies for this kinase and others as well. As such, I am supportive of this paper, though I do also suggest some shortening and modification.
We appreciate the reviewers candid response on the difficulty of this study and the requirement of follow-up studies to confirm a direct transfer of the phosphate. We also have edited the manuscript to make it shorter.
Generally, the paper is well written, but several figures should be quantified, and experimental reproducibility is not always clear. The first 4 figures are slow-going and could be condensed to show the key points, so that the reader gets to Figures 6 and 7 which contain the "meat" of the paper.
We have indicated the experimental reproducibility in the methodology section against each assay. We have shortened the manuscript corresponding to sections describing figures 1-4. However, when we talked to some of our colleagues whose expertise do not align with kinases and IKK, we realized that some description were necessary to introduce them to the next figures. Additionally, we added Fig. S6 indicating that the radiolabelled phospho-IKK2 Y169F is unable to transfer its own phosphate group(s) to the substrate IkBa.
Reviewer #2 (Public Review):
Phosphorylation of IκBα is observed after ATP removal, although there are ambiguous requirements for ADP.
We agree with the reviewer that this observation is puzzling. We hypothesize that ADP is simultaneously regulating the transfer process likely through binding to the active site.
It seems that the analysis hinges on the fidelity of pan-specific phosphotyrosine antibodies.
We agree with the reviewer. To bolster our conclusion, we used antibodies from two different sources. These were Monoclonal mouse anti-Phospho-Tyrosine (catalogue number: 610000) was from BD Biosciences or from EMD Millipore (catalogue no. 05-321X).
The analysis often returns to the notion that tyrosine phosphorylation(s) (and critical active site Lys44) dictate IKK2 substrate specificity, but evidence for this seems diffuse and indirect. This is an especially difficult claim to make with in vitro assays, omitting the context of other cellular specificity determinants (e.g., localization, scaffolding, phosphatases).
We agree with the concerns that the specificity could be dependent on other cellular specificity determinants and toned down our claims where necessary. However, we would like to point out that the specificity of IKK2 towards S32 and S36 of IkBa in cells in response to specific stimuli is well-established. It is also well-established that its non-catalytic scaffolding partner NEMO is critical in selectively bringing IkBa to IKK from a large pool of proteins. The exact mechanism of how IKK2 choose the two serines amongst many others in the substrate is not clear.
Multiple phosphorylated tyrosines in IKK2 were apparently identified by mass spectrometric analyses, but the data and methods are not described. It is common to find non-physiological post-translational modifications in over-expressed proteins from recombinant sources. Are these IKK2 phosphotyrosines evident by MS in IKK2 immunoprecipitated from TNFa-stimulated cells? Identifying IKK2 phosphotyrosine sites from cells would be especially helpful in supporting the proposed model.
Mass spectrometric data for identification of phosphotyrosines from purified IKK2 is now incorporated (Figure S3A). Although we have not analyzed IKK2 from TNF-a treated cells in this study, a different study of phospho-status of cellular IKK2 indicated tyrosine phosphorylation (Meyer et al 2013).
Reviewer #3 (Public Review):
The identity and purity of the used proteins is not clear. Since the findings are so unexpected and potentially of wide-reaching interest - this is a weakness. Similar specific detection of phospho-Ser/Thr vs phospho-Tyr relies largely on antibodies which can have varying degrees of specificity.
We followed a stringent purification protocol of several steps (optimized for the successful crystallization of the IKK2) that removed most impurities (PMID: 23776406, PMID: 39227404). The samples analysed with ESI MS did not show any significant contaminating kinase from the Sf9 cells.
Sequence specific phospho-antibodies used in this study are very well characterized and have been used in the field for years (Basak et al 2007, PMID: 17254973). We agree on the reviewer’s concerns on the pan-specific phospho-antibodies. Since phospho-tyrosine detection is the crucial aspect of this study, we minimized such bias by using pan-specific phosphotyrosine antibodies from two independent sources.
Reviewer #1 (Recommendations For The Authors):
I understand that Figure 3 shows that K44M abolishes both S32/26 phosphorylation and tyrosine phosphorylation, but not PEST region phosphorylation. This suggests that autophosphorylation is reflective of its known specific biological role in signal transduction. But I do not understand why "these results strongly suggest that IKK2-autophosphorylation is critical for its substrate specificity". That statement would be supported by a mutant that no longer autophosphorylates, and as a result shows a loss of substrate specificity, i.e. phosphorylates non-specific residues more strongly. Is that the case? Maybe Darwech et al 2010 or Meyer et al 2013 showed this.
Later figures seem to address this point, so maybe this conclusion should be stated later in the paper.
We have now clarified this in the manuscript and moved the comment to the next section. We have consolidated the results in Figure 3 and 4 in the previous version into a single figure in Figure. The text has also been modified accordingly.
Page 10: mentions DFG+1 without a proper introduction. The Chen et al 2014 paper appears to inform the author's interest in Y169 phosphorylation, or is it just an additional interesting finding? Does this publication belong in the Introduction or the Discussion?
The position of Y169 at the DFG+1 was intriguing and the 2014 article Chen et al further bolstered our interest in this residue to be investigated. We think this publication is important in both sections.
To understand the significance of Figure 4D, we need a WT IKK2 control: or is there prior literature to cite? This is relevant to the conclusion that Y169 phosphorylation is particularly important for S32 phosphorylation.
We have now added a new supplementary figure where activities of WT and Y169F IKK2 towards WT and S32/S36 mutants are compared (Figure S3F). At a similar concentration, the activity of WT-IKK2 is many fold higher than that of YtoF mutants (Fig. 4C). The experiments were performed simultaneously, although samples were loaded on different gels but otherwise processed in a similar way. The corresponding data is now included in the manuscript as Figure S3F.
The cold ATP quenching experiment is nice for testing the model that Y169 functions as a phospho sink that allows for a transfer reaction. However, there is only a single timepoint and condition, which does not allow for a quantitative analysis. Furthermore, a positive control would make this experiment more compelling, and Y169F mutant should show that cold ATP quenching reduces the phosphorylation of IkBa.
We thank the reviewer for appreciating our experimental design, and pointing out the concerns. We kept the ATP-time point as the maximum of the non-competition experiment. Also, we took 50mM ATP to compare its competition with highest concentration of ADP used. The idea behind using the maximum time and ATP (comparable to ADP) was to capture the effect of competitive-effect of ATP, if any, that would be maximal in the given assay condition in comparison with the phospho-transfer set up in absence of cold ATP. We agree that finer ranges of ATP concentration and time points would have enabled more quantitative analyses. We have now included data where different time intervals are tested (Figure S5D).
Why is the EE mutant recognized by anti-phospho-serine antibodies? In Figure 2F.
We anticipate Serine residues besides those in the activation loop to be phosphorylated when IKK2 is overexpressed and purified from the Sf9 cells. Since Glu (E) mimics phospho-Ser, the said antibody cross reacts with the IKK2-EE that mimics IKK2 phosphorylated at Ser177 and 181.
Figure 7B is clear, but 7C does not add much.
We have now removed the Fig. 7C in the current version. Figure 7 is now renumbered as Figure 6 that does not contain the said cartoon.
Reviewer #2 (Recommendations For The Authors):
Regarding the specificity arguments (see above in public review), the authors note that NEMO is very important in IKK specificity, and - if I'm understanding correctly - most of these assays were performed without NEMO. Would the IKK2-NEMO complex change these conclusions?
NEMO is a scaffolding protein whose action goes beyond the activation of the IKK-complex. In cells, NEMO brings IkBa from a pool of thousands of proteins to its bonafide kinase when the cells encounter specific signals. In other words, NEMO channels IKK-activity towards its bonafide substrate IkBa at that moment. Though direct proof is lacking, it is likely that NEMO present IkBa in the correct pose to IKK such that the S32/S36 region of IkBa is poised for phosphorylation. The proposed mechanism in the current study further ensures the specificity and fidelity of that phosphorylation event. We believe this mechanism will be preserved in the IKK-NEMO complex unless proven otherwise. As shown below, IKK2 undergoes tyrosine autophosphorylation in presence of NEMO.
Author response image 1.
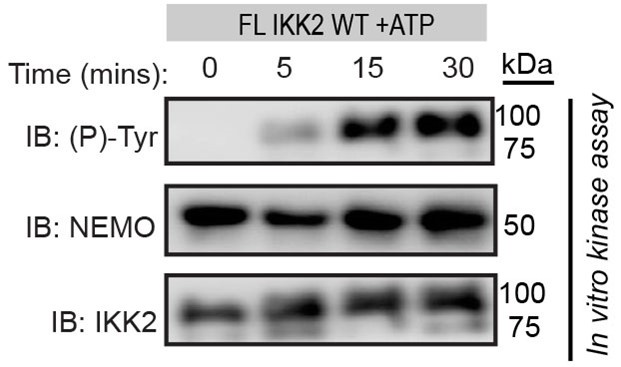
The work primarily focuses on Y169 as a candidate target for IKK autophosphorylation. This seems reasonable given the proximity to the ATP gamma phosphate. However, Y188F more potently disrupted IκBα phosphorylation. The authors note that this could be due to folding perturbations, but this caveat would also apply to Y169F. A test for global fold perturbations for both Tyr mutants would be helpful.
Y188 is conserved in S/T kinases and that in PKA (Y204) has been studied extensively using structural, biochemical and biophysical tools. It was found in case of PKA that Y204 participates in packing of the hydrophobic core of the large lobe. Disruption of this core structure by mutation allosterically affect the activity of the kinase. We also observed similar engagement of Y188 in IKK2’s large lobe, and speculated folding perturbations in analogy with the experimental evidence observed in PKA. What we meant was mutation of Y188 would allosterically affect the kinase activity. Y169 on the other hand is unique at that position, an no experimental evidence on the effect of phospho-ablative mutation of this residue exist in the literature. Hence, we refrained from speculating its effect on the folding or conformational allostery, however, such a possibility cannot be ruled out.
I struggled to follow the rationalization of the results of Figure 4D, the series of phosphorylation tests of Y169F against IκBα with combinations of phosphoablative or phosphomimetic variants at Ser32 and Ser36. This experiment is hard to interpret without a direct comparison to WT IKK2.
We agree with the reviewer’s concerns. Through this experiment we wanted to inform about the importance of Tyr-phosphorylation of IKK2 in phosphorylating S32 of IκBα which is of vital importance in NF-kB signaling. We have now provided a comparison with WT-IKK2 in the supplementary Figure S3F. We hope this will help bring more clarity to the issue.
MD simulations were performed to compare structures of unphosphorylated vs. Ser-phosphorylated (p-IKK2) vs. Ser+Tyr-phosphorylated (P-IKK2) forms of IKK2. These simulations were performed without ATP bound, and then a representative pose was subject to ADP or ATP docking. The authors note distortions in the simulated P-IKK2 kinase fold and clashes with ATP docking. Given the high cellular concentration of ATP, it seems more logical to approach the MD with the assumption of nucleotide availability. Most kinase domains are highly dynamic in the absence of substrate. Is it possible that the P-IKK2 poses are a result of simulation in a non-physiological absence of bound ATP? Ultimately, this MD observation is linked to the proposed model where ADP-binding is required for efficient phospho-relay to IκBα. Therefore, this observation warrants scrutiny. Perhaps the authors could follow up with binding experiments to directly test whether P-IKK2 binds ADP and fails to bind ATP.
We thank that reviewer for bringing up this issue. This is an important issue and we must agree that we don’t fully understand it yet. We took more rigorous approach this time where we used three docking programs: ATP and ADP were docked to the kinase structures using LeDock and GOLD followed by rescoring with AutoDock Vina. We found that ATP is highly unfavourable to P-IKK2 compared to ADP. To further address these issues, we performed detailed MM-PBSA (Molecular Mechanics Poisson-Boltzmann Surface Area) analyses after MD-simulation to estimate binding free energies and affinities of ADP and ATP for each of the three differently phosphorylated states of IKK2. These analyses (Figure S4 E and F) clearly indicate that phosphorylated IKK2 have much higher preference for ADP over ATP. However, it does not negate ATP-binding by P-IKK2 in a different pose that may not support kinase activity.
We could not perform any binding experiment because of the following reason. We incubated FL IKK2 WT with or without cold ATP for 30mins, and then incubated these samples with <sup>32</sup>P-ATP and analysed the samples by autoradiography after resolving them on a 10% SDS-PAGE. We found that even after pre-incubation of the kinase with excess cold ATP it still underwent autophosphorylation when radioactive ATP was added as shown below. This prevented us from doing direct binding experiment with ATP as it would not represent true binding event. We also noticed that after removal of bulk ATP post autophosphorylation, phosphorylated IKK2 is capable of further autophosphorylation when freshly incubated with ATP. We have not been able to come up with a condition that would only account for binding of ATP and not hydrolysis.
Author response image 2.
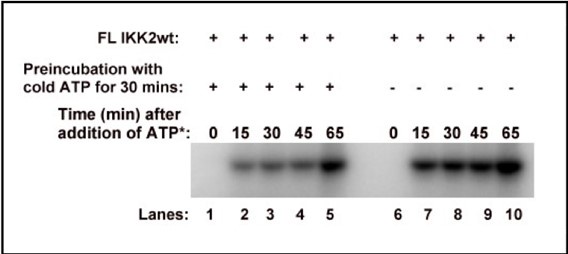
The authors could comment on whether robust phosphorylation of NEMO was expected (Figure 1D). On a related note, why is NEMO a single band in the 1D left panel and double bands on the right?
No, we did not expect robust phosphorylation of NEMO. However, robust phosphorylation of NEMO is observed only in the absence of IκBα. In presence of IκBα, phosphorylation of NEMO goes down drastically. These were two different preparations of NEMO. When TEV-digestion to remove His-tag is incomplete it gives two bands as the tagged and untagged versions cannot be separated in size exclusion chromatography which is the final step.
Page 14, line 360. "...observed phosphorylation of tyrosine residue(s) only upon fresh ATP-treatment..." I'm not sure I understand the wording here (or the relevance of the citation). Is this a comment on unreported data demonstrating the rapid hydrolysis of the putative phosphotyrosine(s)? If so, that would be helpful to clarify and report in the supporting information.
In our X-ray crystallographic studies with phosphorylated IKK2 we failed to observe any density of phosphate moiety. Furthermore, this IKK2 showed further autophosphorylation when incubated with fresh ATP. These two observations lead us to believe that some of the autophosphorylation are transient in nature. However, quantitative kinetic analyses of this dephosphorylation have not been performed.
Figure S3 middle panel: The PKA substrate overlaid on the IKK2 seems sterically implausible for protein substrate docking. Is that just a consequence of the viewing angle? On a related note, Figure S3 may be mislabeled as S4 in the main text).
It is a consequence of the viewing angle. Also, we apologize for this inadvertent mislabelling. It has been corrected in the current version.
Reviewer #3 (Recommendations For The Authors):
The detection of phosphorylated amino acids relies largely on antibodies which can have a varying degree of specificity. An alternative detection mode of the phospho-amino acids for example by MS would strengthen the evidence.
We agree with the concern of specificity bias of antibodies. We tried to minimize such bias by using two different p-Tyr antibodies as noted previously and also in the methodology section. We were also able to detect phospho-tyrosine residues by MS/MS analyses, representative spectra are now added (Figure S3A).
IKK2 purity - protocol states "desired purity". What was the actual purity and how was it checked? MS would be useful to check for the presence of other kinases.
Purity of the recombinantly purified IKK2s are routinely checked by silver staining. A representative silver stained SDS-PAGE is shown (Figure S1C). It may be noted that, there’s a direct correlation of expression level and solubility, and hence purification yield and quality with the activity of the kinase. Active IKK2s express at much higher level and yields cleaner prep. In our experience, inactive IKKs like K44M give rise to poor yield and purity. We analysed K44M by LC MS/MS to identify other proteins present in the sample. We did not find any significant contaminant kinase the sample (Figure S1D). The MS/MS result is attached.
Figure 1C&D: where are the Mw markers? What is the size of the band? What is the MS evidence for tyrosine phosphorylation?
We have now indicated MW marker positions on these figures.
MS/MS scan data for the two peptides containing pTyr169 and pTyr188 are shown separately (Figure S3A).
Figure 2F: Why is fresh ATP necessary? Why was Tyr not already phosphorylated? The kinetics of this process appear to be unusual when the reaction runs to completion within 5 minutes ?
As stated earlier, we believe some of the autophosphorylation are transient in nature. We think the Tyr-phosphorylation are lost due to the action of cellular phosphatases. We agree with the concern of the reviewer that, the reaction appears to reach completion within 5 minutes in Fig 2F. We believe it is probably due to the fact that the amount of kinase used in this study exceeds the linear portion of the dynamic range of the antibody used. Lower concentration of the kinase do show that reaction does not reach completion until 60mins as shown in Fig. 2A.
Figure 3: Can the authors exclude contamination with a Tyr kinase in the IKK2-K44M prep? The LC/MS/MS data should be included.
We have reanalysed the sample on orbitrap to check if there’s any Tyr-kinase or any other kinase contamination. We used Spodoptera frugiperda proteome available on the Uniprot website for this analysis. These analyses confirmed that there’s no significant kinase contaminant present in the fraction (Figure S1D).
What is the specificity of IKK-2 Inhibitor VII? Could it inhibit a contaminant kinase?
This inhibitor is highly potent against IKK2 and the IKK-complex, and to a lesser extent to IKK1. No literature is available on its activity on other kinases. In an unrelated study, this compound was used alongside MAPK inhibitor SB202190 wherein they observed completely different outcomes of these two inhibitors (Matou-Nasri S, Najdi M, AlSaud NA, Alhaidan Y, Al-Eidi H, Alatar G, et al. (2022) Blockade of p38 MAPK overcomes AML stem cell line KG1a resistance to 5-Fluorouridine and the impact on miRNA profiling. PLoS ONE 17(5):e0267855. https://doi.org/10.1371/journal.pone.0267855). This study indirectly proves that IKK inhibitor VII does not fiddle with the MAPK pathways. We have not found any literature on the non-specific activity of this inhibitor.
Figure 6B: the band corresponding to "p-IkBa" appears to be similar in the presence of ADP (lanes 4-7) or in the absence of ADP but the presence of ATP (lane 8).
Radioactive p-IκBα level is more when ADP is added than in absence of ADP. In presence of cold ATP, radioactive p-IκBα level remains unchanged. This result strongly indicate that the addition of phosphate group to IκBα happens directly from the radioactively labelled kinase that is not competed out by the cold ATP.
Author response:
The following is the authors’ response to the original reviews.
Public Reviews:
Reviewer #1 (Public Review):
Summary:
In this manuscript, Eaton et al. examine the regulation of transcription directionality using a powerful genomic approach (more about the methodology below). Their data challenge the notion that the polyadenylation signal-reading Cleavage and Polyadenylation (CPA) complex is responsible for controlling promoter directionality by terminating antisense transcription. Namely, depletion of the required CPA factor RBBP6 has little effect on antisense transcription measured by POINT. They find instead that initiation is intrinsically preferential in the sense direction and additionally maintained by the activities of an alternative processing complex called Integrator, together with the kinase CDK9. In the presence of CDK9 activity, depletion of Integrator endoribonuclease INTS11 leads to globally increased transcription in the antisense direction, and minor effects in the sense direction. However, CDK9 inhibition reveals that sense transcription is also sensitive to INS11 depletion. The authors suggest that CDK9 activity is stronger in the sense direction, preventing INTS11-mediated premature termination of sense transcrpts.
Strengths:
The combination of acute depletion of the studied factors using degron approaches (important to limit possible secondary effects), together with novel and very sensitive nascent transcriptomics methods POINT and sPOINT is very powerful. The applied spike-in normalization means the analysis is more rigorous than most. Using this methodology allowed the authors to revisit the interesting question of how promoter/transcription directionality is determined.
The data quality appears very good and the fact that both global analysis as well as numerous gene-specific examples are shown makes it convincing.
The manuscript is well written and hence a pleasure to read.
We appreciate this positive assessment.
Weaknesses:
I am slightly worried about the reproducibility of the data - it is unclear to me from the manuscript if and which experiments were performed in replicate (lack of table with genomic experiments and GEO access, mentioned in more detail in below recommendations to authors), and the methods could be more detailed.
All sequencing data was deposited with GEO. Multiple biological replicates were performed for each sequencing experiment. Bigwig files are presented as a table in the GEO submissions. This data has now been made public.
A separate discussion section would be useful, particularly since the data provided challenge some concepts in the field. How do the authors interpret U1 data from the Dreyfuss lab in light of their results? How about the known PAS-density directionality bias (more PAS present in antisense direction than in sense) - could the differential PAS density be still relevant to transcription directionality?
As suggested, we have expanded our discussion to relate our findings to existing data. We think the results from the Dreyfuss lab are very important and highlight the role of U1 snRNA in enforcing transcriptional elongation. It does this in part by shielding PAS sequences. Recent work from our lab also shows that U1 snRNA opposes the Restrictor complex and PNUTS, which otherwise suppress transcription (Estell et al., Mol Cell 2023). Most recently, the Adelman lab has demonstrated that U1 snRNA generally enhances transcription elongation (Mimoso and Adelman., Mol Cell 2023). Our work does not challenge and is not inconsistent with these studies.
The role of U1 in opposing PAS-dependent termination inspired the idea that antisense transcriptional termination may utilise PASs. This was because such regions are rich in AAUAAA and comparatively poor in U1 binding sites. However, our RBBP6 depletion and POINT-seq data suggest that PAS-dependent termination is uncommon in the antisense direction. As such, other mechanisms suppress antisense transcription and influence promoter directionality. In our paper, we propose a major role for the Integrator complex.
We do not completely rule out antisense PAS activity and discuss the prior work that identified polyadenylated antisense transcripts. Nevertheless, this was detected by oligo-dT primed RT-PCR/Northern blotting, which cannot determine the fraction of non-polyadenylated RNA that could result from PAS-independent termination (e.g. by Integrator). To do that requires an analysis of total nascent transcription as achieved by our POINT-seq. Based on these experiments, Integrator depletion has a greater impact on antisense transcription than RBBP6 depletion.
I find that the provided evidence for promoter directionality to be for the most part due to preferential initiation in the sense direction should be stressed more. This is in my eyes the strongest effect and is somehow brushed under the rug.
We agree that this is an important finding and incorporated it into the title and abstract. As the reviewer recommends, we now highlight it further in the new discussion.
References 12-17 report an effect of Integrator on 5' of protein-coding genes, while data in Figure 2 appears contradictory. Then, experiments in Figure 4 show a global effect of INST11 depletion on promoter-proximal sense transcription. In my opinion, data from the 2.5h time-point of depletion should be shown alongside 1.5h in Figure 2 so that it is clear that the authors found an effect similar to the above references. I find the current presentation somehow misleading.
We are grateful for this suggestion and present new analyses demonstrating that our experiment in Figure 2 concurs with previous findings (Supplemental Figures 2A and B). Our original heatmap (Figure 2E) shows a very strong and general antisense effect of INTS11 loss. On the same scale, the effects in the sense direction are not as apparent, which is also the case using metaplots. New supplemental figure 2A now shows sense transcription from this experiment in isolation and on a lower scale, demonstrating that a subset of genes shows promoter-proximal increases in transcription following INTS11 depletion. This is smaller and less general than the antisense effect but consistent with previous findings. Indeed, our new analysis in supplemental figure 2B shows that affected protein-coding genes are lowly expressed, in line with Hu et al., Mol Cell 2023. This explains why a sense effect is not as apparent by metaplot, for which highly expressed genes contribute the most signal.
As a result of our analyses, we are confident that the apparently larger effect at the 2.5hr timepoint (Figure 4) that we initially reported is due to experimental variability and not greater effects of extended INTS11 depletion. Overlaying the 1.5h and 2.5h datasets (Supplemental Figure 4B) revealed a similar number of affected protein-coding genes with a strong (83%) overlap between the affected genes. To support this, we performed qPCR on four affected protein-coding transcripts which revealed no significant difference in the level of INTS11 effect after 2.5h vs 1.5h (Supplemental Figure 4C).
We now present data for merged replicates in Figures 2 and 4 which reveal very similar average profiles for -INTS11 vs +INTS11 at both timepoints. Overall, we believe that we have resolved this discrepancy by showing that it amounts to experimental variability and because the most acutely affected protein-coding genes are lowly expressed. As detailed above, we show this in multiple ways (and validate by qPCR) We have revised the text accordingly and removed our original speculation that differences reflected the timeframe of INTS11 loss.
Conclusion/assessment:
This important work substantially advances our understanding of the mechanisms governing the directionality of human promoters. The evidence supporting the claims of the authors is compelling, with among others the use of advanced nascent transcriptomics including spike-in normalization controls and acute protein depletion using degron approaches.
In my opinion, the authors' conclusions are in general well supported.
Not only the manuscript but also the data generated will be useful to the wide community of researchers studying transcriptional regulation. Also, the POINT-derived novel sPOINT method described here is very valuable and can positively impact work in the field.
We are grateful for the reviewers' positive assessment of our study.
Reviewer #2 (Public Review):
Summary:
Eaton and colleagues use targeted protein degradation coupled with nascent transcription mapping to highlight a role for the integrator component INST11 in terminating antisense transcription. They find that upon inhibition of CDK9, INST11 can terminate both antisense and sense transcription - leading to a model whereby INST11 can terminate antisense transcription and the activity of CDK9 protects sense transcription from INST11-mediated termination. They further develop a new method called sPOINT which selectively amplifies nascent 5' capped RNAs and find that transcription initiation is more efficient in the sense direction than in the antisense direction. This is an excellent paper that uses elegant experimental design and innovative technologies to uncover a novel regulatory step in the control of transcriptional directionality.
Strengths:
One of the major strengths of this work is that the authors endogenously tag two of their proteins of interest - RBBP6 and INST11. This tag allows them to rapidly degrade these proteins - increasing the likelihood that any effects they see are primary effects of protein depletion rather than secondary effects. Another strength of this work is that the authors immunoprecipitate RNAPII and sequence extracted full-length RNA (POINT-seq) allowing them to map nascent transcription. A technical advance from this work is the development of sPOINT which allows the selective amplification of 5' capped RNAs < 150 nucleotides, allowing the direction of transcription initiation to be resolved.
We appreciate this positive assessment.
Weaknesses:
While the authors provide strong evidence that INST11 and CDK9 play important roles in determining promoter directionality, their data suggests that when INST11 is degraded and CDK9 is inhibited there remains a bias in favour of sense transcription (Figures 4B and C). This suggests that there are other unknown factors that promote sense transcription over antisense transcription and future work could look to identify these.
We agree that other (so far, unknown) factors promote sense transcription over antisense, which was demonstrated by our short POINT. We have provided an expanded discussion on this in the revision. In our opinion, demonstrating that sense transcription is driven by preferential initiation in that direction is a key finding and we agree that the identification of the underlying mechanism constitutes an interesting avenue for future study.
Reviewer #3 (Public Review):
Summary:
Using a protein degradation approach, Eaton et al show that INST11 can terminate the sense and anti-sense transcription but higher activity of CDK9 in the sense direction protects it from INS11-dependent termination. They developed sPOINT-seq that detects nascent 5'-capped RNA. The technique allowed them to reveal robust transcription initiation of sense-RNA as compared to anti-sense.
Strengths:
The strength of the paper is the acute degradation of proteins, eliminating the off-target effects. Further, the paper uses elegant approaches such as POINT and sPOINT-seq to measure nascent RNA and 5'-capped short RNA. Together, the combination of these three allowed the authors to make clean interpretations of data.
We appreciate this positive assessment.
Weaknesses:
While the manuscript is well written, the details on the panel are not sufficient. The methods could be elaborated to aid understanding. Additional discussion on how the authors' findings contradict the existing model of anti-sense transcription termination should be added.
We have added more detail to the figure panels, which we hope will help readers to navigate the paper more easily. Specifically, the assay employed for each experiment is indicated in each figure panel. As requested, we provide a new and separate discussion section in the revision.
Recommendations for the authors:
Reviewer #1 (Recommendations For The Authors):
Congratulations on this important piece of work!
Some specific suggestions.
MAJOR
-The data are not available (Accession "GSE243266" is currently private and is scheduled to be released on Sep 01, 2026.) This should be corrected and as a minimum, the raw sequencing files as well as the spike-in scaled bigwig files should be provided in GEO.
We have made the data public. Raw and bigwig files are provided as part of the GEO upload.
MINOR
- It would be useful for readers if you could include catalog numbers of the reagents used in the study.
We have included this information in our revision.
- A table in experimental procedures summarizing the genomic experiments performed in this study as well as published ones reanalyzed here would be helpful.
This is now provided as part of the resources table.
- It would be easier for reviewers to evaluate the manuscript if the figure legends were included together with the figures on one page. This is now allowed by most journals.
We have used this formatting in the revision.
- Providing some captions for the results sections would be helpful.
We have included subheadings as suggested.
Reviewer #2 (Recommendations For The Authors):
Generally, I would suggest writing the experiment-type above panels where it is not immediately obvious what they are so a reader can appreciate the figures without referencing the legend. E.g. write POINT-seq on Figure 1B just to make it obvious to someone looking at the figures what methodology they are looking at. Likewise, you could write RNAPII ChIP-seq for Supplementary Figures 3D and 3E.
We have carried out this recommendation.
Can a y-axis be indicated on POINT-seq genome browser tracks? This could make them easier to interpret.
Y-axis scales are provided as RPKM as stated in the figure legends.
The authors could address/speculate in the text why there is less POINT-seq signal for the antisense transcript in the treatment condition in Figure 1B? Or could consider including a different example locus where this is not the case for clarity.
Acute depletion of poly(A) factors (like RBBP6) results in a strong read-through beyond the poly(A) signal of protein-coding genes as Figure 1 shows. However, it also causes a reduction in transcription levels, which can be seen in the figure and is correctly noted by the reviewer in this comment. We see this with other poly(A) factor depletions (e.g. CPSF73 and CPSF30 – Eaton et al., 2020 and Estell et al., 2021) and other labs have observed this too (e.g for CPSF73-dTAG depletion (Cugusi et al., Mol Cell 2022)). Plausible reasons include a limited pool of free RNAPII due to impaired transcriptional termination or limited nucleotide availability due to their incorporation within long read-through transcripts. For these reasons, we have retained the example in Figure 1B as a typical representation of the effect. Moreover, the heatmap in Figure 1D fairly represents the spectrum of effects following RBBP6 loss – highlighting the strong read-through beyond poly(A) signals and the marginal antisense effects.
"The established effect of INTS11 at snRNAs was detected in our POINT-seq data and demonstrates the efficacy of this approach (Figure 2B)." The authors could explain this point more clearly in the text and describe the data - e.g. As expected, depletion of INTS11 leads to increased POINT-seq signal at the 3' end of snRNAs, consistent with defects in transcriptional termination. This is highlighted by the RNU5A-1 and RNU5B-1 loci (Figure 2B).
We agree and have added more context to clarify this.
I would suggest adjusting the scale of the heatmap in Figure 2E - I think it would be easier to interpret if the value of 0 was white - with >0 a gradient of orange and <0 a gradient of blue (as is done in Figure 1C). I think making this change would make the point as written in the text clearer i.e. "heatmap analysis demonstrates the dominant impact of INTS11 on antisense versus sense transcription at most promoters (Figure 2E)." I'm assuming most of the sense transcription would be white (more clearly unchanging) when the scale is adjusted.
We agree and have done this. The reviewer is correct that most sense transcription is unchanged by INTS11 loss. However, as we alluded to in the original submission, a subset of transcripts shows a promoter-proximal increase after INTS11 depletion. We have expanded the analyses of this effect (see responses to other comments) but stress that it is neither as general nor as large as the antisense effect.
The authors make the point that there is mildly increased transcription over the 5' end of some genes upon INST11 depletion and show a track (Supplementary Fig 2A). It is not immediately obvious from the presentation of the meta-analysis in Figure 2D how generalisable this statement is. Perhaps the size of the panel or thickness of the lines in Figure 2D could be adjusted so that the peak of the control (in blue) could be seen. Perhaps an arrow indicating the peak could be added? I'm assuming the peak at the TSS is slightly lower in the control compared to INST11 depletion based on the authors' statement.
We have provided multiple new analyses of this data to highlight where there are promoter-proximal effects of INTS11 loss in the sense direction. Please see our response to the public review of reviewer 1 and new supplemental figures 2A, 2B, 4A and 4B which highlight the sense transcription increased in the absence of INTS11.
The authors label Figure 4 "Promoters lose their directionality when CDK9 is inhibited" - but in INST11 depleted cells treated with CDK9i they find that there still is a bias towards sense transcription. Suggested edit "Some promoter directionality is lost when CDK9 is inhibited" or similar.
We agree and have made this change.
The authors conclude that INTS11-mediated effects are the result of perturbation of the catalytic activities of Integrator, the authors should perform rescue experiments with the catalytically dead E203Q-INTS11 mutant.
This is a very good suggestion and something we had intended to pursue. However, as we will describe below (and shown in Supplemental Figure 4G), there were confounding issues with this experiment.
The E203Q mutant of INTS11 is widely used in the literature to test for catalytic functions of INTS11. However, we have found that this mutation impairs the ability of INTS11 to bind other Integrator modules in cells. Based on co-immunoprecipitation of flag-tagged WT and E203Q derivatives, INTS1 (backbone module), 10 (tail module), and 8 (phosphatase module) all show reduced binding to E203Q vs. WT. Because E203Q INTS11 is defective in forming Integrator complexes, rescue experiments might not fully distinguish the effects of INTS11 activity from those caused by defects in complex assembly. While this may at first seem unexpected, in the analogous 3’ end processing complex, catalytic mutants of CPSF73 (which is highly related to INTS11) negatively affect its interaction with other complex members (Kolev and Steitz, EMBO Reports 2005).
We hypothesise that INTS11 activity is most likely involved in attenuating promoter-proximal transcription, but we cannot formally rule out other explanations and discuss this in our revision. Regardless of how INTS11 attenuates transcription, our main conclusion is on its requirement to terminate antisense transcription whether this involves its cleavage activity or not.
The authors suggest that CDK9 modulates INTS11 activity/assembly and suggest this may be related to SPT5. Is there an effect of CDK9 inhibition on the snRNA's highlighted in Figure 2B?
We believe that snRNAs are different from protein-coding genes concerning CDK9 function. Shona Murphy’s lab previously showed that, unlike protein-coding genes, snRNA transcription is insensitive to CDK9 inhibition, and that snRNA processing is impaired by CDK9 inhibition (Medlin et al., EMBO 2003 and EMBO 2005). We reproduce these findings by metaanalysis of 15 highly expressed and well-separated snRNAs and by qRT-PCR of unprocessed RNU1-1, RNU5A-1 and RNU7-1 snRNA following CDK9 inhibition. We observe snRNA read-through by POINT-seq following INTS11 loss whether CDK9 is inhibited or not (left panel, below). Note the higher TES proximal signal in CDK9i conditions, which likely reflects the accumulation of unprocessed snRNA as validated by qPCR for three example snRNAs (right panel, below).
Author response image 1.
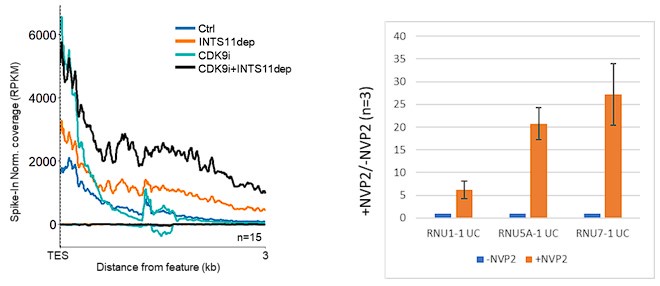
For Figure 4, would similar results be observed using inhibitors targeting other transcriptional CDKs such as CDK7,12/13?
In response to this suggestion, we analysed four selected protein-coding transcripts (the same 4 that we used to validate the CDK9i results) by qRT-PCR in a background of CDK7 inhibition using the THZ2 compound (new Supplemental Figure 4E). THZ2 suppresses transcription from these genes as expected. Interestingly, expression is restored by co-depleting Integrator, recapitulating our findings with CDK9 inhibition. As CDK7 is the CDK-activating kinase for CDK9, its inhibition will also inhibit CDK9 so THZ2 may simply hit this pathway upstream of where CDK9 inhibitors. Second, CDK7 may independently shield transcription from INTS11. We allude to both interesting possibilities.
What happens to the phosphorylation state of anti-sense engaged RNAPII when INTS11 is acutely depleted and/or CDK9 is inhibited? This could be measured by including Ser5 and Ser2 antibodies in the sPOINT-seq assay and complemented with Western Blot analysis.
We have performed the western blot for Ser5 and Ser2 phosphorylation as suggested. Both signals are mildly enhanced by INTS11 loss, which is consistent with generally increased transcription. Ser2p is strongly reduced by CDK9 inhibition, which is consistent with the loss of nascent transcription in this condition. Interestingly, both modifications are partly recovered when INTS11 is depleted in conjunction with CDK9 inhibition. This is consistent with the effects that we see on POINT-seq and shows that the recovered transcription is associated with some phosphorylation of RNAPII CTD. This presumably reflects the action(s) of kinases that can act redundantly with CDK9.
We have not performed POINT-seq with Ser5p and Ser2p antibodies under these various conditions. Our rationale is that our existing data uses an antibody that captures all RNAPII (regardless of its phosphorylation status), which we feel most comprehensively assays transcription in either direction. Moreover, the lab of Fei Chen (Hu et al., Mol Cell 2023) recently published Ser5p and Ser2p ChIP-seq following INTS11 loss. By ChIP-seq, they observe a bigger increase in antisense RNAPII occupancy vs. sense providing independent and orthogonal support for our POINT-seq data. Interestingly, this antisense increase is not paralleled by proportional increases in Ser5p or Ser2p signals. This suggests that the unattenuated antisense transcription resulting from INTS11 loss does not have high Ser5p or Ser2p. Since CDK7 and 9 are major Ser5 and 2 kinases, this supports our model that their activity is less prevalent for antisense transcription. We now discuss these data in our revision.
The HIV reporter RNA experiments should be performed with the CDK9 inhibitor added to the experimental conditions. Presumably CDK9 inhibition would result in no upregulation of the reporter upon addition of TAT and/or dTAG. Perhaps the amount of TAT should be reduced to still have a dynamic window in which changes can be detected. It is possible that reporter activation is simply at a maximum. Can anti-sense transcription be measured from the reporter?
We have performed the requested CDK9 inhibitor experiment to confirm that TAT-activated transcription from the HIV promoter is CDK9-dependent (new supplemental figure 4F). Consistent with previous literature on HIV transcription, CDK9 inhibition attenuates TAT-activated transcription. Importantly, and in line with our other experiments, depletion of INTS11 results in significant restoration of transcription from the HIV promoter when CDK9 is inhibited. Thus, TAT-activated transcription is CDK9-dependent and, as for endogenous genes, CDK9 prevents attenuation by INTS11.
While TAT-activated transcription is high, we do not think that the plasmid is saturated. When considering this question, we revisited previous experiments using this system to study RNA processing (Dye et al., Mol Cell 1999, Cell 2001, Mol Cell 2006). In these cases, mutations in splice sites or polyadenylation sites have a strong effect on RNA processing and transcription around HIV reporter plasmids. Effects on transcription and RNA processing are; therefore, apparent in the appropriate context. In contrast, we find that the complete elimination of INTS11 has no impact on RNA output from the HIV reporter. Our original experiment assessing the impact of INTS11 loss in +TAT conditions used total RNA. One possibility is that this allows non-nascent RNA to accumulate which might confound our interpretation of INTS11 effects on ongoing transcription. However, the new experiment described in the paragraph above was performed on chromatin-associated (nascent) RNA to rule this out. This again shows no impact of INTS11 loss on HIV promoter-derived transcription in the presence of TAT.
To our knowledge, antisense transcription is not routinely assayed from plasmids. They generally employ very strong promoters (e.g. CMV, HIV) to drive sense transcription. Crucially, their circular nature means that RNAPII going around the plasmid could interfere with antisense transcription coming the other way which does not happen in a linear genomic context. This is why we restricted our use of plasmids to looking at the effects of stimulated CDK9 recruitment (via TAT) on transcription rather than promoter directionality.
The authors should clearly state how many replicates were performed for the genomics experiments. Ideally, a signal should be quantified and compared statistically rather than relying on average profiles only.
We have stated the replicate numbers for sequencing experiments in the relevant figure legends. All sequencing experiments were performed in at least two biological replicates, but often three. In addition, we validated their key conclusions by qPCR or with orthogonal sequencing approaches.
Reviewer #3 (Recommendations For The Authors):
The authors provide strong evidence in support of their claims.
ChIP-seq of pol2S5 and S2 upon INST11 and CDK9 inhibition will strengthen the observation that transcription in the sense direction is more efficient.
We view the analysis of total RNAPII as the most unbiased way of establishing how much RNAPII is going one way or the other. Importantly, ChIP-seq was very recently performed for Ser2p and Ser5p RNAPII derivatives in the lab of Fei Chen (Hu et al., Mol Cell 2023). Their data shows that loss of INTS11 increases the occupancy of total RNAPII in the antisense direction more than in the sense direction, which is consistent with our finding. Interestingly, the increased antisense RNAPII was not paralleled with an increase in Ser2p or Ser5p. This suggests that, following INTS11 loss, the unattenuated antisense transcription is not associated with full/normal Ser2p or Ser5p. These modifications are normally established by CDK7 and 9; therefore, this published ChIP-seq suggests that they are not fully active on antisense transcription when INTS11 is lost. This supports our overall model that CDK9 (and potentially CDK7 as suggested for a small number of genes in new Supplemental Figure 4E) is more active in the sense direction to prevent INTS11-dependent attenuation. We now discuss these data in our revision.
In Supplementary Figure 2, the eRNA expression increases upon INST11 degradation, I wonder if the effects of this will be appreciated on cognate promoters? Can the authors test some enhancer:promoter pairs?
We noticed that some genes (e.g. MYC) that are regulated by enhancers show reduced transcription in the absence of INTS11. Whilst this could suggest a correlation, the transcription of other genes (e.g. ACTB and GAPDH) is also reduced by INTS11 loss although they are not regulated by enhancers. A detailed and extensive analysis would be required to establish any link between INTS11-regulated enhancer transcription and the transcription of genes from their cognate promoters. We agree that this would be interesting, but it seems beyond the scope of our short report on promoter directionality.
Line 111, meta plot was done of 1316 genes. Details on this number should be provided. Overall, the details of methods and analysis need improvement. The layout of panels and labelling on graphs can be improved.
We have now explained the 1316 gene set. In essence, these are the genes separated from an expressed neighbour by at least 10kb. This distance was selected because depletion of RBBP6 induces extensive read-through transcription beyond the polyadenylation site of protein-coding genes. To avoid including genes affected by transcriptional read-through from nearby transcription units we selected those with a 10kb gap between them. This was the only selection criteria so is unlikely to induce any unintended biases. Finally, we have added more information to the figure panels and their legends, which we hope will make our manuscript more accessible.
Author response:
The following is the authors’ response to the original reviews.
Public Reviews:
Reviewer #1 (Public Review):
The manuscript by Li et al. investigates the metabolism-independent role of nuclear IDH1 in chromatin state reprogramming during erythropoiesis. The authors describe accumulation and redistribution of histone H3K79me3, and downregulation of SIRT1, as a cause for dyserythropoiesis observed due to IDH1 deficiency. The authors studied the consequences of IDH1 knockdown, and targeted knockout of nuclear IDH1, in normal human erythroid cells derived from hematopoietic stem and progenitor cells and HUDEP2 cells respectively. They further correlate some of the observations such as nuclear localization of IDH1 and aberrant localization of histone modifications in MDS and AML patient samples harboring IDH1 mutations. These observations are intriguing from a mechanistic perspective and they hold therapeutic significance, however there are major concerns that make the inferences presented in the manuscript less convincing.
(1) The authors show the presence of nuclear IDH1 both by cell fractionation and IF, and employ an efficient strategy to knock out nuclear IDH1 (knockout IDH1/ Sg-IDH1 and rescue with the NES tagged IDH1/ Sg-NES-IDH1 that does not enter the nucleus) in HUDEP2 cells. However, some important controls are missing.
A) In Figure 3C, for IDH1 staining, Sg-IDH1 knockout control is missing.
Thanks for the reviewer’s suggestion. We have complemented the staining of Sg-IDH1 knockout cells, and made corresponding revision in Figure 3C in the revised manuscript.
B) Wild-type IDH1 rescue control (ie., IDH1 without NES tag) is missing to gauge the maximum rescue that is possible with this system.
Thanks for the reviewer’s suggestion. We have overexpressed wild-type IDH1 in the IDH1-deficient HUDEP2 cell line and detected the phenotype. The results are presented in Supplementary Figure 9 in the revised manuscript. As shown in Supplementary Figure 9A, IDH1 deficiency resulted in reduced cell number in HUDEP2 cells, a phenotype that was rescued by overexpression of wild-type IDH1 but not by NES-IDH1. Given IDH1's well-established role in redox homeostasis through catalyzing isocitrate to α-KG conversion, we hypothesized that both wild-type IDH1 and NES-IDH1 overexpression would significantly restore α-KG levels compared to the IDH1-deficient group. Supplementary Figure 9B demonstrates that IDH1 depletion resulted in a dramatic decrease in α-KG levels, whereas overexpression of either wild-type IDH1 or NES-IDH1 almost completely restored α-KG levels, as anticipated. These results suggest that wild-type IDH1 overexpression can restore metabolic regulatory functions as effectively as NES-IDH1 overexpression. To investigate whether apoptosis contributes to the impaired cell expansion caused by IDH1 deficiency, we performed Annexin V/PI staining to quantify apoptotic cells. As shown in Supplementary Figure 9C and D, flow cytometry analysis revealed no significant changes in apoptosis rates following either IDH1 depletion or ectopic expression of wild-type IDH1 or NES-IDH1 in IDH1 deficient HUDEP2 cells.
Flow cytometric analysis demonstrated that IDH1 deficiency triggered S-phase accumulation at day 8, indicative of cell cycle arrest. Whereas ectopic expression of wild-type IDH1 significantly rescued this cell cycle defect, overexpression of NES-IDH1 failed to ameliorate the S-phase accumulation phenotype induced by IDH1 depletion, as presented in Supplementary Figure 9E and F. Although NES-IDH1 overexpression rescued metabolic regulatory function defect, it failed to alleviate the cell cycle arrest induced by IDH1 deficiency. In contrast, wild-type IDH1 overexpression fully restored normal cell cycle progression. This functional dichotomy demonstrates that nuclear-localized IDH1 executes critical roles distinct from its cytoplasmic counterpart, and overexpression of wild-type IDH1 could efficient restore the functional impairment induced by depletion of nuclear localized IDH1.
(2) Considering the nuclear knockout of IDH1 (Sg-NES-IDH1 referenced in the previous point) is a key experimental system that the authors have employed to delineate non-metabolic functions of IDH1 in human erythropoiesis, some critical experiments are lacking to make convincing inferences.
A) The authors rely on IF to show the nuclear deletion of Sg-NES-IDH1 HUDEP2 cells. As mentioned earlier since a knockout control is missing in IF experiments, a cellular fractionation experiment (similar to what is shown in Figure 2F) is required to convincingly show the nuclear deletion in these cells.
We sincerely thank the reviewer for raising this critical point. As suggested, we have performed additional IF experiments and cellular fractionation experiments to comprehensively address the subcellular localization of IDH1.
The results of IF staining were shown in Figure 3C of the revised manuscript. In Control HUDEP2 cells, endogenous IDH1 was detected in both the cytoplasm and nucleus. This dual localization may reflect its dynamic roles in cytoplasmic metabolic processes and potential nuclear functions under specific conditions. In Sg-IDH1 cells (IDH1 knockout), IDH1 signal was undetectable, confirming efficient depletion of the protein. In Sg-NES-IDH1 cells (overexpressing NES-IDH1 in IDH1 deficient cells), IDH1 predominantly accumulated in the cytoplasm, consistent with the disruption of its nuclear export signal. The dual localization of IDH1 that was determined by IF staining experiment were then further confirmed by cellular fractionation assays, as shown in Figure 3D.
B) Since the authors attribute nuclear localization to a lack of metabolic/enzymatic functions, it is important to show the status of ROS and alpha-KG in the Sg-NES-IDH1 in comparison to control, wild type rescue, and knockout HUDEP2 cells. The authors observe an increase of ROS and a decrease of alpha-KG upon IDH1 knockdown. If nuclear IDH1 is not involved in metabolic functions, is there only a minimal or no impact of the nuclear knockout of IDH1 on ROS and alpha-KG, in comparison to complete knockout? These studies are lacking.
We appreciate the insightful suggestions of the reviewers and agree that the detection of ROS and alpha-KG is useful for the demonstration of the non-canonical function of IDH1. We examined alpha-KG concentrations in control, IDH1 knockout and nuclear IDH1 knockout HUDEP2 cell lines. The results showed a significant decrease in alpha-KG content after complete knockout of IDH1, whereas there was no significant change in nuclear knockout IDH1 (Supplementary Figure 9B). As to the detection of ROS level, the commercial ROS assay kits that we can get are detected using PE (Excitation: 565nm; Emission: 575nm) and FITC (Excitation: 488nm; Emission: 518nm) channels in flow cytometry. We constructed HUDEP2 cell lines of Sg-IDH1 and Sg-NES-IDH1 to express green fluorescent protein (Excitation: 488nm; Emission: 507nm) and Kusabira Orange fluorescent protein (Excitation: 500nm; Emission: 561nm) by themselves. Unfortunately, due to the spectral overlap of the fluorescence channels, we were unable to detect the changes in ROS levels in these HUDEP2 cell lines using the available commercial kit.
(3) The authors report abnormal nuclear phenotype in IDH1 deficient erythroid cells. It is not clear what parameters are used here to define and quantify abnormal nuclei. Based on the cytospins (eg., Figure 1A, 3D) many multinucleated cells are seen in both shIDH1 and Sg-NES-IDH1 erythroid cells, compared to control cells. Importantly, this phenotype and enucleation defects are not rescued by the administration of alpha-KG (Figures 1E, F). The authors study these nuclei with electron microscopy and report increased euchromatin in Figure 4B. However, there is no discussion or quantification of polyploidy/multinucleation in the IDH1 deficient cells, despite their increased presence in the cytospins.
A) PI staining followed by cell cycle FACS will be helpful in gauging the extent of polyploidy in IDH1 deficient cells and could add to the discussions of the defects related to abnormal nuclei.
We appreciate the reviewer’s insightful suggestion. Since PI dye is detected using the PE channel (Excitation: 565nm; Emission: 575nm) of the flow cytometer and the HUDEP2 cell line expresses Kusabira orange fluorescent protein (Excitation: 500nm; Emission: 561nm), we were unable to use PI staining to detect the cell cycle. Edu staining is another commonly used method to determine cell cycle progression, and we performed Edu staining followed by flow cytometry analysis on Control, Sg-IDH1 and Sg-NES-IDH1 HUDEP2 cells, respectively. The results showed that complete knockdown of IDH1 resulted in S-phase block and increased polyploidy in HUDEP2 cells on day 8 of erythroid differentiation, and overexpression of IDH1-NES did not reverse this phenotype (Supplemental Figure 9E-F). Moreover, we have added a discussion of abnormal nuclei being associated with impaired erythropoiesis.
B) For electron microscopy quantification in Figures 4B and C, how the quantification was done and the labelling of the y-axis (% of euchromatin and heterochromatin) in Figure 4 C is not clear and is confusingly presented. The details on how the quantification was done and a clear label (y-axis in Figure 4C) for the quantification are needed.
Thanks for the reviewer's suggestion. In this study, we calculated the area of nuclear, heterochromatin and euchromatin by using Image J software. We addressed the quantification strategy in the section of Supplementary methods of the revised Supplementary file. In addition, the y-axis label in Figure 4C was changed to “the area percentage of euchromatin and heterochromatin’’.
C) As mentioned earlier, what parameters were used to define and quantify abnormal nuclei (e.g. Figure 1A) needs to be discussed clearly. The red arrows in Figure 1A all point to bi/multinucleated cells. If this is the case, this needs to be made clear.
We thank the reviewer for their suggestion. In our present study, nuclear malformations were defined as cells exhibiting binucleation or multinucleation based on cytospin analysis. A minimum of 300 cells per group were evaluated, and the proportion of aberrant nuclei was calculated as (number of abnormal cells / total counted cells) × 100%.
(4) The authors mention that their previous study (reference #22) showed that ROS scavengers did not rescue dyseythropoiesis in shIDH1 cells. However, in this referenced study they did report that vitamin C, a ROS scavenger, partially rescued enucleation in IDH1 deficient cells and completely suppressed abnormal nuclei in both control and IDH1 deficient cells, in addition to restoring redox homeostasis by scavenging reactive oxygen species in shIDH1 erythroid cells. In the current study, the authors used ROS scavengers GSH and NAC in shIDH1 erythroid cells and showed that they do not rescue abnormal nuclei phenotype and enucleation defects. The differences between the results in their previous study with vitamin C vs GSH and NAC in the context of IDH1 deficiency need to be discussed.
We appreciate the reviewer’s insightful observation. The apparent discrepancy between the effects of vitamin C (VC) in our previous study and glutathione (GSH)/N-acetylcysteine (NAC) in the current work can be attributed to divergent molecular mechanisms beyond ROS scavenging. A growing body of evidence has identified vitamin C as a multifunctional regulator. In addition to acting as an antioxidant maintaining redox homeostasis, VC also acts as a critical epigenetic modulator. VC have been identified as a cofactor for α-ketoglutarate (α-KG)-dependent dioxygenases, including TET2, which catalyzes 5-methylcytosine (5mC) oxidation to 5-hydroxymethylcytosine (5hmC) [1,2]. Structural studies confirm its direct interaction with TET2’s catalytic domain to enhance enzymatic activity in vitro [3]. The biological significance of the epigenetic modulation induced by vitamin C is illustrated by its ability to improve the generation of induced pluripotent stem cells and to induce a blastocyst-like state in mouse embryonic stem cells by promoting demethylation of H3K9 and 5mC, respectively [4,5]. In contrast, GSH and NAC are canonical ROS scavengers lacking intrinsic epigenetic-modifying activity. While they effectively neutralize oxidative stress (as validated by reduced ROS levels in our current data, Supplemental Figure 7), their inability to rescue nuclear abnormalities or enucleation defects in IDH1 deficient cells suggests that IDH1 deficiency-driven dyserythropoiesis is not solely ROS-dependent.
References:
(1) Blaschke K, Ebata KT, Karimi MM, Zepeda-Martínez JA, Goyal P, et al. Vitamin C induces Tet-dependent DNA demethylation and a blastocyst-like state in ES cells. Nature. 20138;500(7461): 222-226.
(2) Minor EA, Court BL, Young JI, Wang G. Ascorbate induces ten-eleven translocation (Tet) methylcytosine dioxygenase-mediated generation of 5-hydroxymethylcytosine. J Biol Chem. 2013;288(19): 13669-13674.
(3) Yin R, Mao S, Zhao B, Chong Z, Yang Y, et al. Ascorbic acid enhances Tet-mediated 5-methylcytosine oxidation and promotes DNA demethylation in mammals. J Am Chem Soc. 2013;135(28):10396-10403.
(4) Esteban MA, Wang T, Qin B, Yang J, Qin D, et al. Vitamin C enhances the generation of mouse and human induced pluripotent stem cells. Cell Stem Cell. 2010;6(1):71-79.
(5) Chung T, Brena RM, Kolle G, Grimmond SM, Berman BP, et al. Vitamin C promotes widespread yet specific DNA demethylation of the epigenome in human embryonic stem cells. Stem Cells. 2010;28(10):1848-1855.
(5) The authors describe an increase in euchromatin as the consequential abnormal nuclei phenotype in shIDH1 erythroid cells. However, in their RNA-seq, they observe an almost equal number of genes that are up and down-regulated in shIDH1 cells compared to control cells. If possible, an RNA-Seq in nuclear knockout Sg-NES-IDH1 erythroid cells in comparison with knockout and wild-type cells will be helpful to tease out whether a specific absence of IDH1 in the nucleus (ie., lack of metabolic functions of IDH) impacts gene expression differently.
Thanks for the reviewer's suggestion. ATAC-seq showed an increase in chromatin accessibility after IDH1 deletion, but the number of up-regulated genes was slightly larger than that of down-regulated genes, which may be caused by the metabolic changes affected by IDH1 deletion. In order to explore the effect of chromatin accessibility changes on gene expression after IDH1 deletion, we analyzed the changes in differential gene expression at the differential ATAC peak region (as shown in Author response image 1), and the results showed that the gene expression at the ATAC peak region with increased chromatin accessibility was significantly up-regulated. This may explain the regulation of chromatin accessibility on gene expression.
Author response image 1.
Box plots of gene expression differences of differential ATAC peaks located in promoter for the signal increasing and decreasing groups.
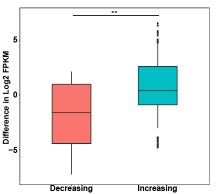
(6) In Figure 8, the authors show data related to SIRT1's role in mediating non-metabolic, chromatin-associated functions of IDH1.
A) The authors show that SIRT1 inhibition leads to a rescue of enucleation and abnormal nuclei. However, whether this rescues the progression through the late stages of terminal differentiation and the euchromatin/heterochromatin ratio is not clear.
Thanks for the reviewer's suggestion. As shown in Supplementary Figure 14 and 15 in the revised Supplementary Data, our data showed that both the treatment of SRT1720 on normal erythroid cells and treatment of IDH1-deficient erythroid cells with SIRT1 inhibitor both have no effect on the terminal differentiation.
(7) In Figure 4 and Supplemental Figure 8, the authors show the accumulation and altered cellular localization of H3K79me3, H3K9me3, and H3K27me2, and the lack of accumulation of other three histone modifications they tested (H3K4me3, H3K35me4, and H3K36me2) in shIDH1 cells. They also show the accumulation and altered localization of the specific histone marks in Sg-NES-IDH1 HUDEP2 cells.
A) To aid better comparison of these histone modifications, it will be helpful to show the cell fractionation data of the three histone modifications that did not accumulate (H3K4me3, H3K35me4, and H3K36me2), similar to what was shown in Figure 4E for H3K79me3, H3K9me3, and H3K27me2).
We appreciate the reviewer’s insightful suggestion. We collected erythroblasts on day 15 of differentiation from cord blood-derived CD34<sup>+</sup> hematopoietic stem cells to erythroid lineage and performed ChIP assay. As shown in Author response image 2, the results showed that the concentration of bound DNA of H3K9me3, H3K27me2 and H3K79me3 was too low to meet the sequencing quality requirement, which was consistent with that of WB. In addition, we tried to perform ChIP-seq for H3K79me3, and the results showed that there was no marked peak signal.
Author response image 2.
ChIP-seq analysis show that there was no marked peak signal of H3K79me3 on D15. (A) Quality control of ChIP assay for H3K9me3, H3K27me2, and H3K79me3. (B) Representative peaks chart image showed normalized ChIP signal of H3K79me3 at gene body regions. (C) Heatmaps displayed normalized ChIP signal of H3K79me3 at gene body regions. The window represents ±1.5 kb regions from the gene body. TES, transcriptional end site; TSS, transcriptional start site.
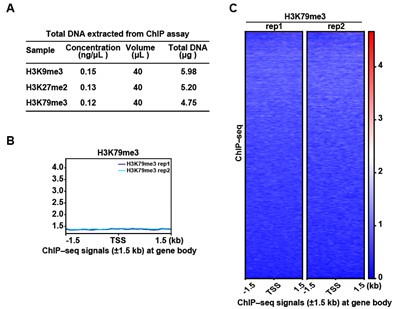
C) Among the three histone marks that are dysregulated in IDH1 deficient cells (H3K79me3, H3K9me3, and H3K27me2), the authors show via ChIP-seq (Fig5) that H3K79me3 is the critical factor. However, the ChIP-seq data shown here lacks many details and this makes it hard to interpret the data. For example, in Figure 5A, they do not mention which samples the data shown correspond to (are these differential peaks in shIDH1 compared to shLuc cells?). There is also no mention of how many replicates were used for the ChIP seq studies.
We thank the reviewer for pointing this out. We apologize for not clearly describing the ChIP-seq data for H3K9me3, H3K27me2 and H3K79me3 and we have revised them in the corresponding paragraphs. Since H3 proteins gradually translocate from the nucleus to the cytoplasm starting at day 11 (late Baso-E/Ploy-E) of erythroid lineage differentiation, we performed ChIP-seq for H3K9me3, H3K27me2 and H3K79me3 only for the shIDH1 group, and set up three independent biological replicates for each of them.
Reviewer #2 (Public Review):
Li and colleagues investigate the enzymatic activity-independent function of IDH1 in regulating erythropoiesis. This manuscript reveals that IDH1 deficiency in the nucleus leads to the redistribution of histone marks (especially H3K79me3) and chromatin state reprogramming. Their findings suggest a non-typical localization and function of the metabolic enzyme, providing new insights for further studies into the non-metabolic roles of metabolic enzymes. However, there are still some issues that need addressing:
(1) Could the authors show the RNA and protein expression levels (without fractionation) of IDH1 on different days throughout the human CD34+ erythroid differentiation?
We sincerely appreciate the reviewer’s constructive feedback. To address this point, we have now systematically quantified IDH1 expression dynamics across erythropoiesis stages using qRT-PCR and Western blot analyses. As quantified in Supplementary fige 1, IDH1 expression exhibited a progressive upregulation during early erythropoiesis and subsequently stabilized throughout terminal differentiation.
(2) Even though the human CD34+ erythroid differentiation protocol was published and cited in the manuscript, it would be helpful to specify which erythroid stages correspond to cells on days 7, 9, 11, 13, and 15.
We sincerely thank the reviewer for raising this important methodological consideration. Our research group has previously established a robust platform for staged human erythropoiesis characterization using cord blood-derived CD34<sup>+</sup> hematopoietic stem cells (HSCs) [6-9]. This standardized protocol enables high-purity isolation and functional analysis of erythroblasts at defined differentiation stages.
Thanks for the reviewer’s suggestion. Our previous work (Jingping Hu et.al, Blood 2013. Xu Han et.al, Blood 2017.Yaomei Wang et.al, Blood 2021.) have isolation and functional characterization of human erythroblasts at distinct stages by using Cord blood. These works illustrated that using cord blood-derived hematopoietic stem cells and purification each stage of human erythrocytes can facilitate a comprehensive cellular and molecular characterization.
Following isolation from cord blood, CD34<sup>+</sup> cells were cultured in a serum-free medium and induced to undergo erythroid differentiation using our standardized protocol. The process of erythropoiesis was comprised of 2 phases. During the early phase (day 0 to day 6), hematopoietic stem progenitor cells expanded and differentiated into erythroid progenitors, including BFU-E and CFU-E cells.
During terminal erythroid maturation (day 7 to day 15), CFU-E cells progressively transitioned through defined erythroblast stages, as validated by daily cytospin morphology and expression of band 3/α4 integrin. The stage-specific composition was quantitatively characterized as follows:
Author response table 1.
The composition of erythroblast during terminal stage erythropoiesis.
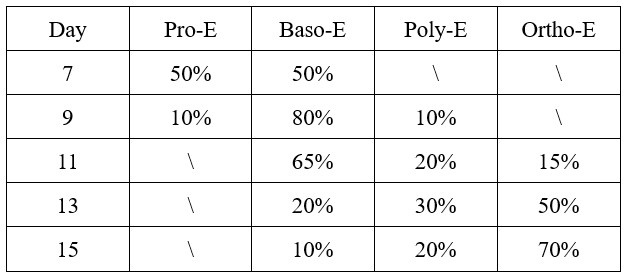
This differentiation progression from proerythroblasts (Pro-E) through basophilic (Baso-E), polychromatic (Poly-E), to orthochromatic erythroblasts (Ortho-E) recapitulates physiological human erythropoiesis, confirming the validity of our differentiation system for mechanistic studies.
Reference:
(6) Li J, Hale J, Bhagia P, Xue F, Chen L, et al. Isolation and transcriptome analyses of human erythroid progenitors: BFU-E and CFU-E. Blood. 2014;124(24):3636-3645.
(7) Hu J, Liu J, Xue F, Halverson G, Reid M, et al. Isolation and functional characterization of human erythroblasts at distinct stages: implications for understanding of normal and disordered erythropoiesis in vivo. Blood. 2013;121(16):3246-3253.
(8) Wang Y, Li W, Schulz VP, Zhao H, Qu X, et al. Impairment of human terminal erythroid differentiation by histone deacetylase 5 deficiency. Blood. 2021;138(17):1615-1627.
(9) Li M, Liu D, Xue F, Zhang H, Yang Q, et al. Stage-specific dual function: EZH2 regulates human erythropoiesis by eliciting histone and non-histone methylation. Haematologica. 2023;108(9):2487-2502.
(3) It is important to mention on which day the lentiviral knockdown of IDH1 was performed. Will the phenotype differ if the knockdown is performed in early vs. late erythropoiesis? In Figures 1C and 1D, on which day do the authors begin the knockdown of IDH1 and administer NAC and GSH treatments?
We sincerely appreciate the reviewer’s inquiry regarding the experimental timeline. The day of getting CD34<sup>+</sup> cells was recorded as day 0. Lentivirus of IDH1-shRNA and Luciferase -shRNA was transduced in human CD34<sup>+</sup> at day 2. Puromycin selection was initiated 24h post-transduction to eliminate non-transduced cells. IDH1-KD cells were then selected for 3 days. The knock down deficiency of IDH1 was determined on day 7. NAC or GSH was added to culture medium and replenished every 2 days.
(4) While the cell phenotype of IDH1 deficiency is quite dramatic, yielding cells with larger nuclei and multi-nuclei, the authors only attribute this phenotype to defects in chromatin condensation. Is it possible that IDH1-knockdown cells also exhibit primary defects in mitosis/cytokinesis (not just secondary to the nuclear condensation defect)?), given the function of H3K79Me in cell cycle regulation?
We appreciate the reviewer’s insightful suggestion. We performed Edu based cell cycle analysis on Control, Sg-IDH1 and Sg-NES-IDH1 HUDEP2 cells, respectively. The results showed that IDH1 deficiency resulted in S-phase block and increased polyploidy in HUDEP2 cells on day 8 of erythroid differentiation. NES-IDH1 overexpression failed to rescue these defects, indicating nuclear IDH1 depletion as the primary driving factor (Figure 3E,F). Recent studies have established a clear link between cell cycle arrest and nuclear malformation. Chromosome mis-segregation, nuclear lamina disruption, mechanical stress on the nuclear envelope, and nucleolar dysfunction all contribute to nuclear abnormalities that trigger cell cycle checkpoints [10,11]. Based on all these findings, it reasonable for us to speculate that the cell cycle defect in IDH1 deficient cells might caused by the nuclear malfunction.
Reference:
(10) Hong T, Hogger AC, Wang D, Pan Q, Gansel J, et al. Cell Death Discov. CDK4/6 inhibition initiates cell cycle arrest by nuclear translocation of RB and induces a multistep molecular response. 2024;10(1):453.
(11) Hervé S, Scelfo A, Marchisio GB, Grison M, Vaidžiulytė K, et al. Chromosome mis-segregation triggers cell cycle arrest through a mechanosensitive nuclear envelope checkpoint. Nat Cell Biol. 2025;27(1):73-86.
(5) Why are there two bands of Histone H3 in Figure 4A?
We sincerely appreciate the reviewer's insightful observation regarding the dual bands of Histone H3 in our original Figure 4A. Upon rigorous investigation, we identified that the observed doublet pattern likely originated from the inter-batch variability of the original commercial antibody. To conclusively resolve this technical artifact, we have procured a new lot of Histone H3 antibody and repeated the western blot experimental under optimized conditions, and the results demonstrates a single band of H3.
(6) Displaying a heatmap and profile plots in Figure 5A between control and IDH1-deficient cells will help illustrate changes in H3K79me3 density in the nucleus after IDH1 knockdown.
Thank you for your suggestion. As presented in Author response image 2, we performed ChIP assays on erythroblasts collected at day 15. However, the concentration of H3K79me3-bound DNA was insufficient to meet the quality threshold required for reliable sequencing. Consequently, we are unable to generate the requested heatmap and profile plots due to limitations in data integrity from this experimental condition.
Reviewer #3 (Public Review):
Li, Zhang, Wu, and colleagues describe a new role for nuclear IDH1 in erythroid differentiation independent from its enzymatic function. IDH1 depletion results in a terminal erythroid differentiation defect with polychromatic and orthochromatic erythroblasts showing abnormal nuclei, nuclear condensation defects, and an increased proportion of euchromatin, as well as enucleation defects. Using ChIP-seq for the histone modifications H3K79me3, H3K27me2, and H3K9me3, as well as ATAC-seq and RNA-seq in primary CD34-derived erythroblasts, the authors elucidate SIRT1 as a key dysregulated gene that is upregulated upon IDH1 knockdown. They furthermore show that chemical inhibition of SIRT1 partially rescues the abnormal nuclear morphology and enucleation defect during IDH1-deficient erythroid differentiation. The phenotype of delayed erythroid maturation and enucleation upon IDH1 shRNA-mediated knockdown was described in the group's previous co-authored study (PMID: 33535038). The authors' new hypothesis of an enzyme- and metabolism-independent role of IDH1 in this process is currently not supported by conclusive experimental evidence as discussed in more detail further below. On the other hand, while the dependency of IDH1 mutant cells on NAD+, as well as cell survival benefit upon SIRT1 inhibition, has already been shown (see, e.g, PMID: 26678339, PMID: 32710757), previous studies focused on cancer cell lines and did not look at a developmental differentiation process, which makes this study interesting.
(1) The central hypothesis that IDH1 has a role independent of its enzymatic function is interesting but not supported by the experiments. One of the author's supporting arguments for their claim is that alpha-ketoglutarate (aKG) does not rescue the IDH1 phenotype of reduced enucleation. However, in the group's previous co-authored study (PMID: 33535038), they show that when IDH1 is knocked down, the addition of aKG even exacerbates the reduced enucleation phenotype, which could indicate that aKG catalysis by cytoplasmic IDH1 enzyme is important during terminal erythroid differentiation. A definitive experiment to test the requirement of IDH1's enzymatic function in erythropoiesis would be to knock down/out IDH1 and re-express an IDH1 catalytic site mutant. The authors perform an interesting genetic manipulation in HUDEP-2 cells to address a nucleus-specific role of IDH1 through CRISPR/Cas-mediated IDH1 knockout followed by overexpression of an IDH1 construct containing a nuclear export signal. However, this system is only used to show nuclear abnormalities and (not quantified) accumulation of H3K79me3 upon nuclear exclusion of IDH1. Otherwise, a global IDH1 shRNA knockdown approach is employed, which will affect both forms of IDH1, cytoplasmic and nuclear. In this system and even the NES-IDH1 system, an enzymatic role of IDH1 cannot be excluded because (1) shRNA selection takes several days, prohibiting the assessment of direct effects of IDH1 loss of function (only a degron approach could address this if IDH1's half-life is short), and (2) metabolic activity of this part of the TCA cycle in the nucleus has recently been demonstrated (PMID: 36044572), and thus even a nuclear role of IDH1 could be linked to its enzymatic function, which makes it a challenging task to separate two functions if they exist.
We appreciate the reviewer’s emphasis on rigorously distinguishing between enzymatic and enzymatic independent roles of IDH1. In our revised manuscript, we have removed all assertions of a "metabolism-independent" mechanism. Instead, we focus on demonstrating that nuclear-localized IDH1 contributes to chromatin state regulation during terminal erythropoiesis (e.g., H3K79me3 accumulation). While we acknowledge that nuclear IDH1’s enzymatic activity may still play a role [12], our data emphasize its spatial association with chromatin remodeling. We now explicitly state that nuclear IDH1’s function may involve both enzymatic and structural roles, and further studies are required to dissect these mechanisms.
Reference:
(12) Kafkia E, Andres-Pons A, Ganter K, Seiler M, Smith TS, et al.Operation of a TCA cycle subnetwork in the mammalian nucleus. Sci Adv. 2022;8(35):eabq5206.
(2) It is not clear how the enrichment of H3K9me3, a prominent marker of heterochromatin, upon IDH1 knockdown in the primary erythroid culture (Figure 4), goes along with a 2-3-fold increase in euchromatin. Furthermore, in the immunofluorescence (IF) experiments presented in Figure 4Db, it seems that H3K9me3 levels decrease in intensity (the signal seems more diffuse), which seems to contrast the ChIP-seq data. It would be interesting to test for localization of other heterochromatin marks such as HP1gamma. As a related point, it is not clear at what stage of erythroid differentiation the ATAC-seq was performed upon luciferase- and IDH1-shRNA-mediated knockdown shown in Figure 6. If it was done at a similar stage (Day 15) as the electron microscopy in Figure 4B, then the authors should explain the discrepancy between the vast increase in euchromatin and the rather small increase in ATAC-seq signal upon IDH1 knockdown.
Thank you for raising this important point. We agree that while H3K9me3 and H3K27me2 modifications are detectable in the nucleus, their functional association with chromatin in this context remains unclear. Our ChIP-seq data did not reveal distinct enrichment peaks for H3K9me3 or H3K27me2 (unlike the well-defined H3K79me3 peaks), suggesting that these marks may not be stably bound to specific chromatin regions under the experimental conditions tested. However, we acknowledge that the absence of clear peaks in our dataset does not definitively rule out chromatin interactions, as technical limitations or transient binding dynamics could influence these results. To avoid over-interpretation, we have removed speculative statements about the chromatin-unbound status of H3K9me3 and H3K27me2 from the revised manuscript. This revision aligns with our broader effort to present conclusions strictly supported by the current data while highlighting open questions for future investigation.
(3)The subcellular localization of IDH1, in particular its presence on chromatin, is not convincing in light of histone H3 being enriched in the cytoplasm on the same Western blot. H3 would be expected to be mostly localized to the chromatin fraction (see, e.g., PMID: 31408165 that the authors cite). The same issue is seen in Figure 4A.
We sincerely appreciate the reviewer's insightful comment regarding the subcellular distribution of histone H3 in our study. We agree that histone H3 is classically associated with chromatin-bound fractions, and its cytoplasmic enrichment in our Western blot analyses appears counterintuitive at first glance. However, this observation is fully consistent with the unique biology of terminal erythroid differentiation, which involves drastic nuclear remodeling and histone release - a hallmark of terminal stage erythropoiesis. Terminal erythroid differentiation is characterized by progressive nuclear condensation, chromatin compaction, and eventual enucleation. During this phase, global chromatin reorganization leads to the active eviction of histones from the condensed nucleus into the cytoplasm. This process has been extensively documented in erythroid cells, with studies demonstrating cytoplasmic accumulation of histones H3 and H4 as a direct consequence of nuclear envelope breakdown and chromatin decondensation preceding enucleation [13-16]. Our experiments specifically analyzed terminal-stage polychromatic and orthochromatic erythroblasts. At this stage, histone releasing into the cytoplasm is a dominant biological event, explaining the pronounced cytoplasmic H3 signal in our subcellular fractionation assays.
In summary, the cytoplasmic enrichment of histone H3 in our data aligns with established principles of erythroid biology and reinforces the physiological relevance of our findings. We thank the reviewer for raising this critical point, which allowed us to better articulate the unique aspects of our experimental system.
Reference:
(13) Hattangadi SM, Martinez-Morilla S, Patterson HC, Shi J, Burke K, et al. Histones to the cytosol: exportin 7 is essential for normal terminal erythroid nuclear maturation. Blood. 2014;124(12):1931-1940.
(14) Zhao B, Mei Y, Schipma MJ, Roth EW, Bleher R, et al. Nuclear Condensation during Mouse Erythropoiesis Requires Caspase-3-Mediated Nuclear Opening. Dev Cell. 2016;36(5): 498-510.
(15) Zhao B, Liu H, Mei Y, Liu Y, Han X, et al. Disruption of erythroid nuclear opening and histone release in myelodysplastic syndromes. Cancer Med. 2019;8(3):1169-1174.
(16) Zhen R, Moo C, Zhao Z, Chen M, Feng H, et al. Wdr26 regulates nuclear condensation in developing erythroblasts. Blood. 2020;135(3):208-219.
(4) This manuscript will highly benefit from more precise and complete explanations of the experiments performed, the material and methods used, and the results presented. At times, the wording is confusing. As an example, one of the "Key points" is described as "Dyserythropoiesis is caused by downregulation of SIRT1 induced by H3K79me3 accumulation." It should probably read "upregulation of SIRT1".
We sincerely thank the reviewer for highlighting the need for improved clarity in our experimental descriptions and textual precision. We fully agree that rigorous wording is essential to accurately convey scientific findings. Specific modifications have been made and are highlighted in Track Changes mode in the resubmitted manuscript.
The reviewer correctly identified an inconsistency in the original phrasing of one key finding. The sentence in question ("Dyserythropoiesis is caused by downregulation of SIRT1 induced by H3K79me3 accumulation") has been revised to:"Dyserythropoiesis is caused by the upregulation of SIRT1 mediated through H3K79me3 accumulation." This correction aligns with our experimental data showing that H3K79me3 elevation promotes SIRT1 transcriptional activation. We apologize for this oversight and have verified the consistency of all regulatory claims in the text.
Recommendations for the authors:
Reviewer #1 (Recommendations For The Authors):
(1) It will be helpful to mention/introduce the cells used for the study at the beginning of the results section. For example, for Figure 1A neither the figure legend nor the results text includes information on the cells used.
Thanks for the reviewer’s suggestion. The detail information of the cells that were used in our study have been provided in the revised manuscript.
(2) Important details for many figures are lacking. For example, in Figure 5, there is no mention of the replicates for ChIP-Seq studies. Also, the criteria used for quantifications of abnormal nuclei, % euchromatin vs heterochromatin, the numbers of biological replicates, and how many fields/cells were used for these quantifications are missing.
We thank the reviewer for emphasizing the importance of methodological transparency. It has been revised accordingly. The ChIP-Seq data in Figure 5 was generated from three independent biological replicates to ensure reproducibility. In this study, Image J software was used to calculate the area of nuclear, heterochromatin/euchromatin and to quantify the percentage of euchromatin and heterochromatin. A minimum of 300 cells per group were evaluated, and the proportion of aberrant nuclei was calculated as (number of abnormal cells / total counted cells) × 100%.
(3) It will be helpful if supplemental data are ordered according to how they are discussed in the text. Currently, the order of the supplemental data is hard to keep track of eg., the results section starts describing supplemental Figure 1, then the text jumps to supplemental Figure 5 followed by Supplemental Figure 3 (and so on).
Thanks for the reviewer’s suggestion. It has been revised accordingly.
(4) Overall, there are many incomplete sentences and typos throughout the manuscript including some of the figures e.g. on page 10 the sentence "Since the generation of erythroid with abnormal nucleus and reduction of mature red blood cells caused by IDH1 absence are notable characteristics of MDS and AML." is incomplete. On page 11, it reads "Histone post-modifications". This needs to be either histone modifications or histone post-translational modifications. In Figure 4C, the y-axis title is hard to understand "% of euchromatin and heterochromatin". Overall, the document needs to be proofread and revised carefully.
Thanks for the reviewer’s suggestion. We have made revision accordingly in the revised manuscript. The sentence "Since the generation of erythroid with abnormal nucleus and reduction of mature red blood cells caused by IDH1 absence are notable characteristics of MDS and AML." has been revised to “The production of erythrocytes with abnormal nuclei and the reduction of mature erythrocytes due to IDH1 deletion are prominent features of MDS and AML.” “% of euchromatin and heterochromatin” has been modified to “Area ratio of euchromatin to heterochromatin”.
Reviewer #3 (Recommendations For The Authors):
The following critique points aim to help the authors to improve their manuscript:
(1) The authors reason (p. 10) that because mutant IDH1 has been shown to result in altered chromatin organization, this could be the case in their system, too. However, mutant IDH1 has an ascribed metabolic consequence, the generation of 2-HG, which further weakens the author's argument for an enzymatically independent role of IDH1 in their system. The same is true for the author's observation in Supplementary Figure 9B that in IDH1-mutant AML/MDS samples, H3K79me3 colocalized with the IDH1 mutants in the nucleus. Again, this speaks in favor of IDH1's role being linked to metabolism. The authors could re-write this manuscript, not so much emphasizing the separation of function between different subcellular forms of IDH1 but rather focusing on the chromatin changes and how they could be linked to the actual phenotype, the nuclear condensation and enucleation defect - if so, addressing the surprising finding of enrichment of both active and repressive chromatin marks will be important.
Thanks for the reviewer’s suggestion. We agree with the reviewers and editors all the data we present in the current are not robust enough to rigorously distinguish between enzymatic and enzymatic-independent roles of IDH1. In our revised manuscript, we have removed all assertions of a "metabolism-independent" mechanism. Instead, we focus on demonstrating that nuclear-localized IDH1 contributes to chromatin state regulation during terminal erythropoiesis (e.g., H3K79me3 accumulation).
(2) How come so many genes were downregulated by RNA-seq (about an equal number as upregulated genes) but not more open by ATAC-seq? The authors should discuss this result.
Thanks for the reviewer's suggestion. ATAC-seq showed an increase in chromatin accessibility after IDH1 deletion, but the number of up-regulated genes was slightly larger than that of down-regulated genes, which may be caused by the metabolic changes affected by IDH1 deletion. In order to explore the effect of chromatin accessibility changes on gene expression after IDH1 deletion, we analyzed the changes in differential gene expression at the differential ATAC peak region (as shown in the figure below), and the results showed that the gene expression at the ATAC peak region with increased chromatin accessibility was significantly up-regulated. This may explain the regulation of chromatin accessibility on gene expression.
(3) For the ChIP-seq analyses of H3K79me3, H3K27me2, and H3K9me3, the authors should not just show genome-wide data but also several example gene tracks to demonstrate the differential abundance of peaks in control versus IDH1 knockdown. Furthermore, the heatmap shown in Figure 5A should include broader regions spanning the gene bodies, to visualize the intergenic H3K27me2 and H3K9me3 peaks. Expression could very well be regulated from these intergenic regions as they could bear enhancer regions. ChIP-seq for H3K27Ac in the same setting would be very useful to identify those enhancers.
Thanks for the reviewer’s suggestion. It has been revised accordingly. We reanalyzed the ChIP-seq peak signal of H3K79me3, H3K27me2 and H3K9me3 in a wider region (±5Kb) at gene body, and the results showed that the H3K27me2 and H3K9me3 peak signals did not change significantly. Since H3K79me3 showed a higher peak signal and was mainly enriched in the promoter region, our subsequent analysis focusing on the impact of H3K79me3 accumulation on chromatin accessibility and gene expression might be more valuable.
Author response image 3.
ChIP-seq analysis show that the peak signal of H3K79me3,H3K27me2 and H3K9me3. (A) Heatmaps displayed normalized ChIP signal of H3K9me3, H3K27me2, and H3K79me3 at gene body regions. The window represents ±5 kb regions from the gene body. TES, transcriptional end site; TSS, transcriptional start site. (B) Representative peaks chart image showed normalized ChIP signal of H3K9me3, H3K27me2, and H3K79me3 at gene body regions.
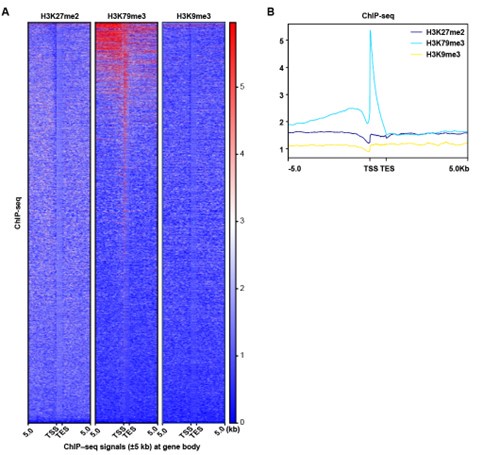
(4) The absent or very mild delay (also no significance visible in the quantification plots) in the generation of orthochromatic erythroblasts on Day 13 upon IDH1 shRNA knockdown as per a4-integrin/Band3 flow cytometry does not correspond to the already quite prominent number of multinucleated cells at that stage seen by cytospin/Giemsa staining. Why do the authors think this is the case? Cytospin/Giemsa staining might be the better method to quantify this phenotype and the authors should quantify the cells at different stages in at least 100 cells from non-overlapping cytospin images.
Thanks for the reviewer’s suggestion. We have supplemented the cytpspin assay and the results were presented in Supplemental Figure 4.
(5) The pull-down assay in Figure 7E does not show a specific binding of H3K79me3 to the SIRT1 promoter. Rather, there is just more H3K79me3 in the nucleus, thus leading to generally increased binding. The authors should show that H3K79me3 does not bind more just everywhere but to specific loci. The ChIP-seq data mention only categories but don't show any gene lists that could hint at the specificity of H3K79me3 binding at genes that would promote nuclear abnormalities and enucleation defects.
We thank the reviewer for pointing this out. The GSEA results of H3K79me3 peak showed enrichment of chromatin related biological processes, and the list of associated genes is shown Figure 7B. In addition, we also displayed the changes in H3K79me3 peak signals, ATAC peak signals, and gene expression at gene loci of three chromatin-associated genes (SIRT1, KMT5A and NUCKS1).
(6) P. 12: "Representatively, gene expression levels and ATAC peak signals at SIRT1 locus were elevated in IDH1-shRNA group and were accompanied by enrichment of H3K9me3 (Figure 7F)." Figure 7F does not show an enrichment of H3K9me3, but if the authors found such, they should explain how this modification correlates with the activation of gene expression.
Thank you for bringing this issue to our attention. We sincerely apologize for the mistake in the description of Figure 7F on page 12. We have already corrected this error in the revised manuscript.
(7) Related to the mild phenotype by flow cytometry on Day 13, are the "3 independent biological replicates" from culturing and differentiating CD34 cells from 3 different donors? If all are from the same donor, experiments from at least a second donor should be performed to generalize the results.
In our current study, CD34<sup>+</sup> cells were derived from different donors.
(8) If the images in Supplementary Figure 4 are only the indicated cell type, then it is not clear how the data were quantified since only some cells in each image are pointed at and others do not seem to have as large nuclei. There is also no explanation in the legend what the colors mean (nuclei were presumably stained with DAPI, not clear what the cytoplasm stain is - GPA?).
We thank the reviewer for pointing this out. We have revised the manuscript accordingly. Specifically, the nuclei was stained with DAPI and the color was blue. The cell membrane was stained with GPA and the color was red. This staining method allows for clear visualization of the cell structure and helps to better understand the localization of the proteins of interest.
(9) It is not clear to this reviewer whether Figure 4F is a quantification of the Western Blot or of the IF data.
Figure 4F is a quantification of the Western Blot experiment.
(10) The authors sometimes do not describe experiments well, e.g., "treatment of IDH1-deficient erythroid cells with IDH1-EX527" (p. 13). EX-527 is a SIRT1 inhibitor, which the authors only explicitly mention later in that paragraph. It is unclear to this reviewer, why the authors call it IDH1-EX527.
Thank you for pointing out the unclear description in our manuscript. We apologize for the confusion caused by the unclear statement. We have revised the manuscript accordingly. The compound EX-527 is a SIRT1 inhibitor, and we have corrected the description to simply "EX-527" in the revised manuscript.
(11) The end of the introduction needs revising to be more concise; the last paragraph on p. 4 ("Recently, the decreased expression of IDH1...") partially should be integrated with the previous paragraph, and partially is repeated in the last paragraph (top paragraph on p. 5). The last sentence on p. 4, "These findings strongly suggest that aberrant expression of IDH1 is also an important factor in the pathogenesis of AML and MDS.", should rather read "increased expression of IDH1", to distinguish it from mutant IDH1 (mutant IDH1 is also aberrantly expressed IDH1).
We appreciated the reviewer for the helpful suggestion. Considering that the inclusion of this paragraph did not provide a valuable contribution to the formulation of the scientific question, we have removed it after careful consideration, and the revised manuscript is generally more logically smooth.
(12) Abstract and last sentence of the introduction: "innovative perspective" should be re-worded, as the authors present data, not a perspective. Maybe could use "evidence".
Thanks for the reviewer’s suggestion. It has been revised accordingly.
(13) "IDH1-mut AML/MDS" on p. 11. The authors should provide more information about these AML/MDS samples. The legend contains no information about them/their mutational status. How many samples did the authors look at? Do these cells contain mutations other than IDH1?
Thanks for the reviewer’s suggestion. The detail information of these AML/MDS samples are provide in supplemental table 1. In our current study, we collected ten AML/MDS samples and the majority of the samples only contain IDH1 mutations at different sites.
(14) The statement, "Taken together, these results indicated that IDH1 deficiency reshaped chromatin states and subsequently altered gene expression pattern, especially for genes regulated by H3K79me3, which was the mechanism underlying roles of IDH1 in modulation of terminal erythropoiesis." (p. 10), is not correct at that point in the manuscript as the authors have not yet introduced the RNA-seq data.
Thanks for the reviewer’s suggestion. The statement has been revised to “Taken together, these results indicated that IDH1 deficiency reshaped chromatin states by altering the abundance and distribution of H3K79me3, which was the mechanism underlying roles of IDH1 in modulation of terminal erythropoiesis”.
(15) For easier readability, the authors should present the data in order. For example, the supplemental data for IDH shRNA and siRNA should be presented together and not in Supplementary Figures 1 and 5. Supplementary Figure 3 is mentioned after Supplementary Figure 1, but before Supplementary Figure 2 - again, all data need to be presented in subsequent figures to be viewed together.
Thank you for your suggestion regarding the order of data presentation. We have reorganized the figures in the manuscript to improve readability. We apologize for any confusion caused by the previous arrangement and hope that the revised version meets your expectations.
Author Response
The following is the authors’ response to the original reviews.
Reviewer #1 (Public Review):
Several concerns are raised from the current study.
1) Previous studies showed that iTregs generated in vitro from culturing naïve T cells with TGF-b are intrinsically unstable and prone to losing Foxp3 expression due to lack of DNA demethylation in the enhancer region of the Foxp3 locus (Polansky JK et al, Eur J Immunol., 2008, PMID: 18493985). It is known that removing TGF-b from the culture media leads to rapid loss of Foxp3 expression. In the current study, TGF-b was not added to the media during iTreg restimulation, therefore, the primary cause for iTreg instability should be the lack of the positive signal provided by TGF-b. NFAT signal is secondary at best in this culturing condition.
In restimulation, void of TGFb is necessary to cause iTreg instability. Otherwise, the setup is similar to the iTreg-inducing environment (Author response image 1). On the other hand, the ultimate goal of this study is to provide a scenario that bears some resemblance of clinical treatment, where TGFb may not be available. The reviewer is correct in stating that TGFb is essential for iTreg stability, we are studying the role played by NFAT in iTreg instability in vitro, and possibly in potential clinical use of iTreg .
Author response image 1.
Restimulation with TGFb will persist iTreg inducing environment, resulting in less pronounced instability. Sorted Foxp3-GFP+ iTregs were rested for 1d, and then rested or restimulated in the presence of TGF-β for 2 d. Percentages of Foxp3+ cells were analyzed by intracellular staining of Foxp3 after 2 d.
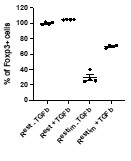
2) It is not clear whether the NFAT pathway is unique in accelerating the loss of Foxp3 expression upon iTreg restimulation. It is also possible that enhancing T cell activation in general could promote iTreg instability. The authors could explore blocking T cell activation by inhibiting other critical pathways, such as NF-kb and c-Jun/c-Fos, to see if a similar effect could be achieved compared to CsA treatment.
We thank the reviewer for this suggestion. We performed this experiment according to see extent of the role that NFAT plays, or whether other major pathways are involved. As Author response image 2 shows, solely inhibiting NFAT effectively rescued the instability of iTreg. The inhibition of NFkB (BAY 11-7082), c-Jun (SP600125), or a c-Jun/c-Fos complex (T5224) had no discernable effect, or in one case, possibly further reduction in stability. These results may indicate that NFAT plays a crucial and special role in TCR activation, which leads to iTreg instability. Other pathways, as far as how this experiment is designed, do not appear to be significantly involved.
Author response image 2.
Comparing effects of NFAT, NF-kB and c-Jun/c-Fos inhibitors on iTreg instability. Sorted Foxp3-GFP+ iTregs were rested for 1d, then restimulated by anti-CD3 and CD28 in the presence of listed inhibitors. Percentages of Foxp3+ cells were analyzed by intracellular staining after 2d restimulation.
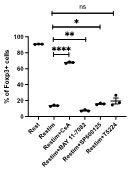
3) The authors linked chromatin accessibility and increased expression of T helper cell genes to the loss of Foxp3 expression and iTreg instability. However, it is not clear how the former can lead to the latter. It is also not clear whether NFAT binds directly to the Foxp3 locus in the restimulated iTregs and inhibits Foxp3 expression.
T helper gene activation is likely to cause instability in iTregs by secreting more inflammatory cytokines, as shown in Figure Q9, for example, IL-21 secretion. Further investigation is needed to understand how these genes contribute to Foxp3 gene instability exactly. With our limited insight, there may be two possibilities. 1. IL-21 directly affects Foxp3 through its impact on certain inflammation-related transcription factors (TFs). 2. There could be an indirect relationship where NFAT has a greater tendency to bind to those inflammatory TFs when iTreg instability appears, promoting the upregulation of these Th genes like in activated T cells, while being less likely to bind to SMAD and Foxp3, representing a competitive behavior. We at the moment cannot comprehend the intricacies that lead to the differential effects on T helper genes and Treg related genes.
With that said, we have previously attempted to explore the direct effect of NFAT on Foxp3 gene locus. Foxp3 transcription in iTregs primarily relies on histone modifications such as H3K4me3 (Tone et al., 2008; Lu et al., 2011) rather than DNA demethylation (Ohkura et al., 2012; Hilbrands et al., 2016). Previous studies have reported that NFAT and SMAD3 can together promote the histone acetylation of Foxp3 genes (Tone et al., 2008). In our previous set of experiments, we simultaneously obtained information of NFAT binding sites and H3K4me3. In Foxp3 locus, we observed a decreasing trend in NFAT binding to the CNS3 region of Foxp3 in restimulated iTregs compared to resting iTregs (Author response image 3). Additionally, the H3K4me3 modification in the CNS3 region of Foxp3 decreased upon iTreg restimulation, but inhibiting NFAT nuclear translocation with CsA could maintain this modification at its original level (Author response image 3).
Author response image 3.
The NFAT binding and histone modification on Foxp3 gene locus. Genome track visualization of NFAT binding profiles and H3K4me3 profiles in Foxp3 CNS3 locus in two batches of dataset.
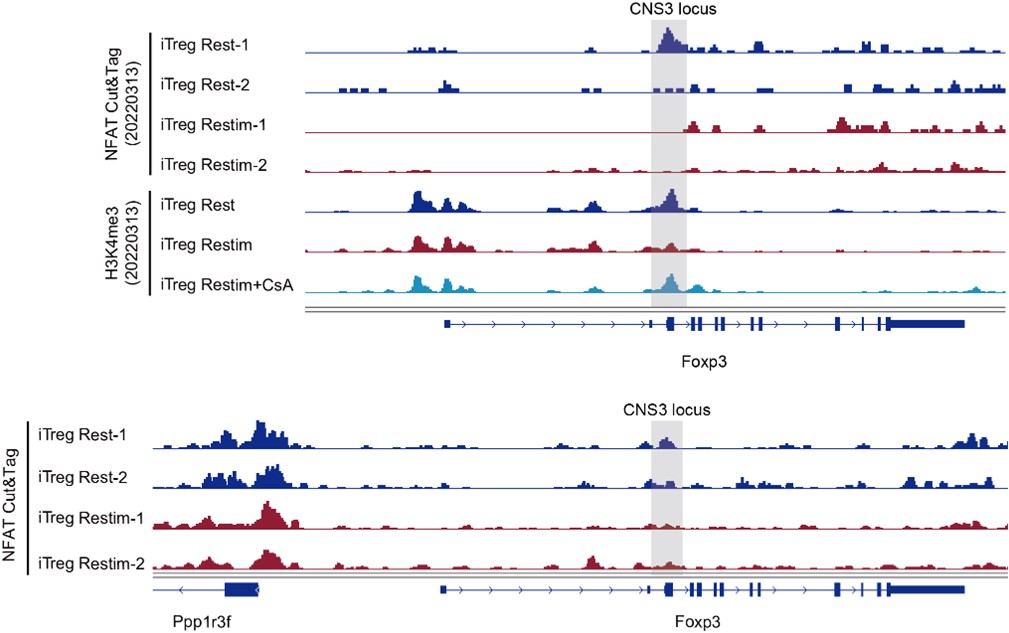
Based on these preliminary explorations, it is concluded that NFAT can directly bind to the Foxp3 locus, and it appears that NFAT decreases upon restimulation, resulting in a decrease in H3K4me3, ultimately leading to the close association of NFAT and Foxp3 instability. However, due to limited sample replicates, these data need to be verified for more solid conclusions. We speculate that during the induction of iTregs, NFAT may recruit histone-modifying enzymes to open the Foxp3 CNS3 region, and this effect is synergistic with SMAD. When instability occurs upon restimulation, NFAT binding to Foxp3 weakens due to the absence of SMAD's assistance, subsequently reducing the recruitment of histone modifications enzyme and ultimately inhibiting Foxp3 transcription.
Reviewer #2 (Public Review):
(1) Some concerns about data processing and statistic analysis.
The authors did not provide sufficient information on statistical data analysis; e.g. lack of detailed descriptions about
-the precise numbers of technical/biological replicates of each experiment
-the method of how the authors analyze data of multiple comparisons... Student t-test alone is generally insufficient to compare multiple groups; e.g. figure 1.
These inappropriate data handlings are ruining the evidence level of the precious findings.
We thank the reviewer for pointing out this important aspect. In the figure legend, numbers of independently-performed experiment repeats are shown as N, biological replicates of each experiment as n. Student’s t test was used for comparing statistical significance between two groups. In this manuscript, all calculations of significant differences were based on comparisons between two groups. There were no multiple conditions compared simultaneously within a single group, and thus, no other calculation methods were used.
(2) Untransparent data production; e.g. the method of Motif enrichment analysis was not provided. Thus, we should wait for the author's correction to fully evaluate the significance and reliability of the present study.
Per this reviewer’s request, we have provided detailed descriptions of the data analysis for Fig 5, including both the method section and the Figure legend, as presented below:
“The peaks annotations were performed with the “annotatePeak” function in the R package ChIPseeker (Yu et al, 2015).
The plot of Cut&Tag signals over a set of genomic regions were calculated by using “computeMatrix” function in deepTools and plotted by using “plotHeatmap” and “plotProfile” functions in deepTools. The motif enrichment analysis was performed by using the "findMotifsGenome.pl" command in HOMER with default parameters.
The motif occurrences in each peak were identified by using FIMO (MEME suite v5.0.4) with the following settings: a first-order Markov background model, a P value cutoff of 10-4, and PWMs from the mouse HOCOMOCO motif database (v11).”
Additionally, we have also supplemented the method section with further details on the analysis of RNA-seq and ATAC-seq data.
(3) Lack of evidence in human cells. I wonder whether human PBMC-derived iTreg cells are similarly regulated.
This is a rather complicated issue, human T cells express FoxP3 upon TCR stimulation (PNAS, 103(17): 6659–6664), whose function is likely to protect T cells from activation induced cell death, and does not offer Treg like properties. In contrast in mice, FoxP3 can be used as an indicator of Treg. Currently, this is not a definitive marker for Treg in human, our FoxP3 based readouts do not apply. Nevertheless, we have now investigated whether inhibiting calcium signaling or NFAT could enhance the stability of human iTreg. As shown in Author response image 4, we found that the proportion of Foxp3-expressing cells did not show significant changes across the different conditions, while the MFI analysis revealed that CsA-treated iTreg exhibited higher Foxp3 expression levels compared to both restimulated iTreg and rest iTreg. However, CM4620 had no significant effect on Foxp3 stability, consistent with the observation of its limited efficacy in suppressing human iTreg long term activation. In summary, our results suggest that inhibiting NFAT signaling through CsA treatment can help maintain higher levels of Foxp3 expression in human iTreg.
Author response image 4.
Effect of inhibiting NFAT and calcium on human iTreg stability. Human naïve CD4 cells from PBMC were subjected to a two-week induction process to generate human iTreg. Subsequently, human iTreg were restimulated for 2 days with dynabeads followed by 2 days of rest in the prescence of CsA and CM-4620. Four days later, percentages of Foxp3+ cells and Foxp3 mean fluorescence intensity (MFI) were analyzed by intracellular staining.
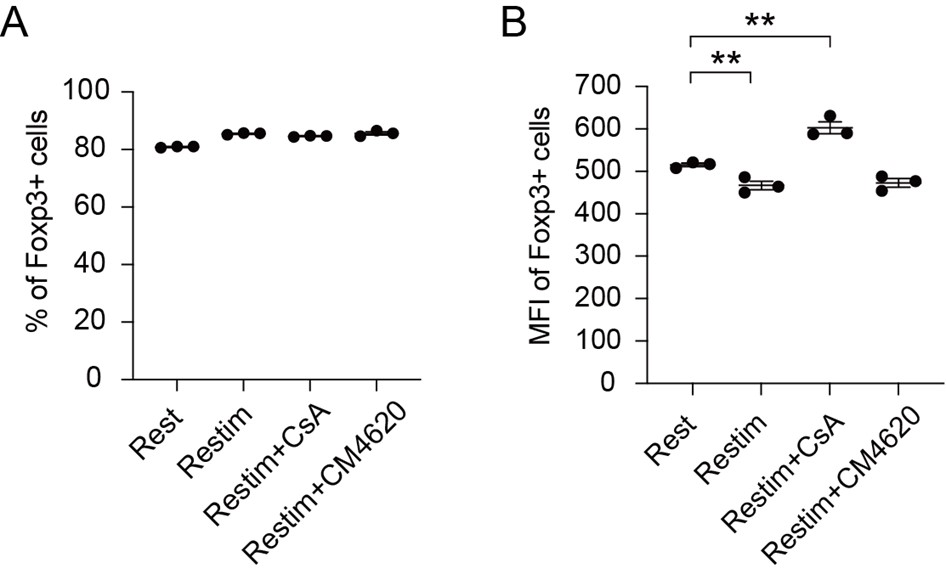
(4) NFAT regulation did not explain all of the differences between iTregs and nTregs, as the authors mentioned as a limitation. Also, it is still an open question whether NFAT can directly modulate the chromatin configuration on the effector-type gene loci, or whether NFAT exploits pre-existing open chromatin due to the incomplete conversion of Treg-type chromatin landscape in iTreg cells. The authors did not fully demonstrate that the distinct pattern of chromatin regional accessibility found in iTreg cells is the direct cause of an effector-type gene expression.
To our surprise, the inhibition of NFkB (BAY 11-7082), c-Jun (SP600125), and the c-Jun/c-Fos complex (T5224) resulted in minimal alterations, as shown in Fig Q1. This seems to argue that NFAT may play a more special role in events leading iTreg instability.
We hypothesize that NFAT takes advantage of pre-existing open chromatin state due to the incomplete conversion of chromatin landscape in iTreg cells. Because iTreg cells, after induction, already exhibit inherent chromatin instability, with highly-open inflammatory genes. Furthermore, when iTreg cells were restimulated, the subsequent change in chromatin accessibility was relatively limited and not rescued by NFAT inhibitor treatment (Author response image 5). Therefore, in the case of iTreg cells, we propose that NFAT exploits the easy access of those inflammatory genes, leading to rapid destabilization of iTreg cells in the short term.
In contrast, tTreg cells possess a relatively stable chromatin structure in the beginning, it would be interesting to investigate whether NFAT or calcium signaling could disrupt chromatin accessibility during the activation or expansion of tTreg cells. It is possible that NFAT might cause the loss of the originally established demethylation map and open up inflammatory loci, thereby inducing a shift in gene transcriptional profiles, equally leading to instability.
Author response image 5.
Chromatin accessibility of Rest, Retimulated, CsA/ORAIinh treated restimulated iTreg. PCA visualization of chromatin accessibility profiles of different cell types. Color indicates cell type.
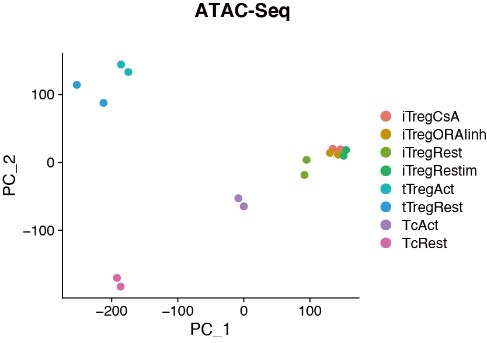
To establish a direct relationship between gene locus accessibility and its overexpression, a controlled experimental approach can be employed. One such method involves precise manipulation of the accessibility of a specific genomic locus using CRISPR-mediated epigenetic modifications at targeted loci. Subsequently, the impact of this manipulation on the expression level of the target gene can be precisely examined. By conducting these experiments, it will be possible to determine whether the augmented gene accessibility directly causes the observed gene overexpression.
Reviewer #1 (Recommendations For The Authors):
1) It might be helpful to add TGF-b to the iTreg restimulation culture to remove the influence of the lack of TGF-b from the equation, and measure the influence of SOCE/NFAT on iTreg instability.
Please refer to Author response image 1.
2) Alternatively, authors can also culture iTreg cells with TGF-b for 2 weeks when they undergo epigenetic changes and become more stabilized (Polansky JK et al, Eur J Immunol., 2008, PMID: 18493985). At this point, the stabilized iTregs can be used to measure the influence of SOCE/NFAT on iTreg instability.
In the study conducted by Polansky, it was observed in Figure 1 that prolonged exposure to TGF-β fails to induce stable Foxp3 expression and demethylation of the Treg-specific demethylated region (TSDR). Based on this finding, we could consider exploring alternative approaches to obtain a more stabilized iTreg population. One such approach could be isolating Foxp3+helios-Nrp1- iTreg cells directly from the peripheral in vivo, which are also known as pTregs. Generally, pTreg cells generated in vivo tend to be more stable compared to iTreg cells induced in vitro, and they already exhibit partial demethylation of the Treg signature, as shown in Fig 6C (Polansky JK et al, Eur J Immunol., 2008, PMID: 18493985). Investigating the role of NFAT and calcium signaling in pTreg cells would provide further insights into the additional roles of NFAT in Treg phenotypical transitions, particularly its role in chromatin accessibility.
3) In Figure 3, NFAT binding to the inflammatory genes in iTreg cells was even stronger than in activated T conventional cells. This is possibly due to Tconv cells being stimulated only once while iTregs were restimulated. A fair comparison should be conducted with restimulated activated conventional T cells.
Figure 3 demonstrates the accessibility of inflammatory gene loci, rather than NFAT binding. Comparing restimulated Tconvs with restimulated iTreg cells is indeed a valuable suggestion, as their activation state and polarization in iTreg directions could lead to distinct chromatin accessibility. Although one is activated long term regularly and the other is activated long term under iTreg polarization, it is highly likely that the chromatin state of both activated Tconvs and iTreg cells is highly open, especially in terms of the accessibility of inflammatory genes. This may provide us with a new perspective to understand iTreg cells, but will unlikely affect our central conclusion.
4) In the in vivo experiment in Figure 6, a control condition without OVA immunization should be included as a baseline.
We have performed this experiment in the absence of OVA, as depicted in Author response image 6. In the absence of OVA immunization, both WT-ORAI and DN-ORAI iTreg exhibited substantial stability, although DN-ORAI demonstrated a slightly less stable trend. Upon activation with 40ug and 100ug of OVA, DN-ORAI iTreg demonstrated enhanced stability than WT-ORAI iTreg, maintaining a higher proportion of Foxp3 expression.
Author response image 6.
Stability of DN-ORAI iTreg in vivo with or without OVA immunization. WT-ORAI/DN-ORAI-GFP+-transfected CD45.2+ Foxp3-RFP+ OT-II iTregs were transferred i.v. into CD45.1 mice. Recipients were left or immunized with OVA323-339 in Alum adjuvant. On day 5, mLN were harvested and analyzed for Foxp3 expression by intracellular staining.
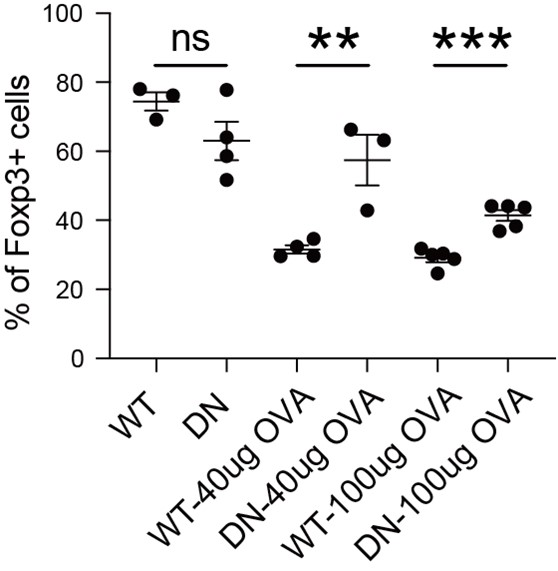
Reviewer #2 (Recommendations For The Authors):
Major
Some concerns about the data processing and statistic analysis, as mentioned in the public review. In the figure legend, what does it mean e.g. n=3, N=3? Technical triplicate experiments? Three mice? Independently-performed three experiments? The authors should define it at least in the "Statistical analysis" in the method section otherwise the readers cannot determine the reason why they mainly use SEM for the data description.
Moreover, in some cases, the number of experiments was not sure; e.g., Fig.1B, Fig. 5.
How did the authors analyze data including multiple comparisons? Student t-test alone is generally insufficient to compare multiple groups; e.g. figure 1.
We thank the reviewer for pointing out this omission. Now, in the figure legend, numbers of independently-performed experiment repeats are shown as N, biological replicates of each experiment as n. For Fig. 1B, N=2, and for Fig 5, we have acquired NFAT Cut&Tag data for 2 times, N=2. Student’s t test was used for comparing statistical significance between two groups. In this manuscript, all calculations of significant differences were based on comparisons between two groups. There were no multiple conditions compared simultaneously within a single group, and thus, no other calculation methods were involved apart from the Student's t-test.
In Figure 1A, the difference in suppressiveness seemed subtle. Data collection of multiple doses of Tconv:Treg ratio will enhance the reliability of such kind of analysis.
We have now attempted the suppression assay with varying Treg:Tconv ratios and observed that the suppressive effect of iTreg was more obvious than that of tTreg when co-cultured at a 1:1 ratio with Tconv cells. However, as the cell number of tTreg and iTreg decreased, the inhibitory effects converged.
Author response image 7.
Compare multiple dose of Tconv:Treg ratio in suppression function CFSE-labelled OT-II T cells were stimulated with OVA-pulsed DC, then different number of Foxp3-GFP+ iTregs and tTregs were added to the culture to suppress the OT-II proliferation. After 4 days, CFSE dilution were analyzed. Left, Representative histograms of CFSE in divided Tconvs. Right, graph for the percentage of divided Tconvs.
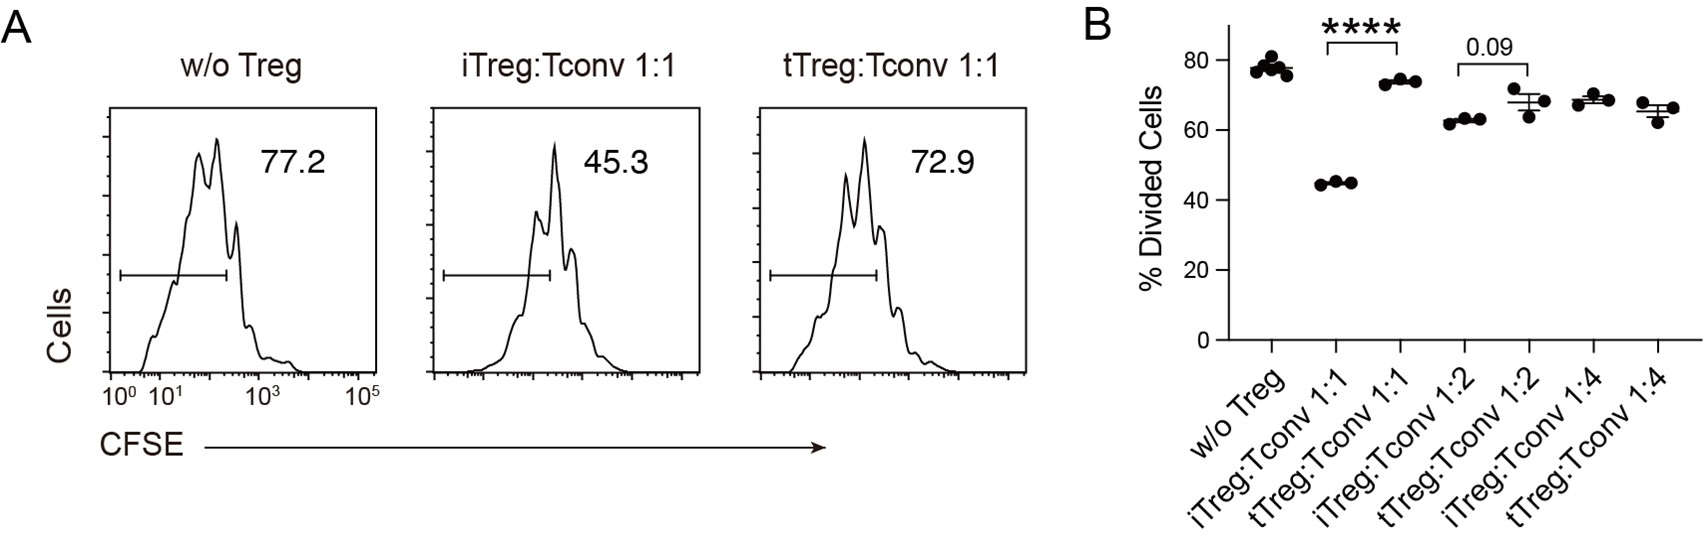
In Figure 3F, to which group did the shaded peaks belong? In this context, the authors should focus on "Activation Region" peaks (open chromatin signature in both TcAct & iTreg defined in Fig. 4D) but I did not find the peak in the focusing DNA regions in TcAct (e.g. the shaded regions in IL-4 loci). The clear attribution of the peaks to the heatmap will enhance the visibility and understanding of readers.
We have selected some typical peaks that belong to Fig 3D. These genes encompass some T-cell activation-associated transcription factors, such as Irf4, Atf3, as well as multiple members of the Tnf family including Lta, Tnfsf4, Tnfsf8, and Tnfsf14. Additionally, genes related to inflammation such as Il12rb2, Il9, and Gzmc are included. These genes show elevated accessibility upon T-cell activation, partially open in activated nTreg cells, referred to as the "Activation Region." They collectively exhibit high accessibility in iTreg cells, which may contribute to their instability.
Author response image 8.
Chromatin accessibility of some “Activation Region”. Genomic track showing chromatin accessibility of Irf4, Atf3, Lta, Tnfsf8, Tnfsf4, Tnsfsf14, Il12rb2, Il9, Gzmc in activated Tconv and iTreg.
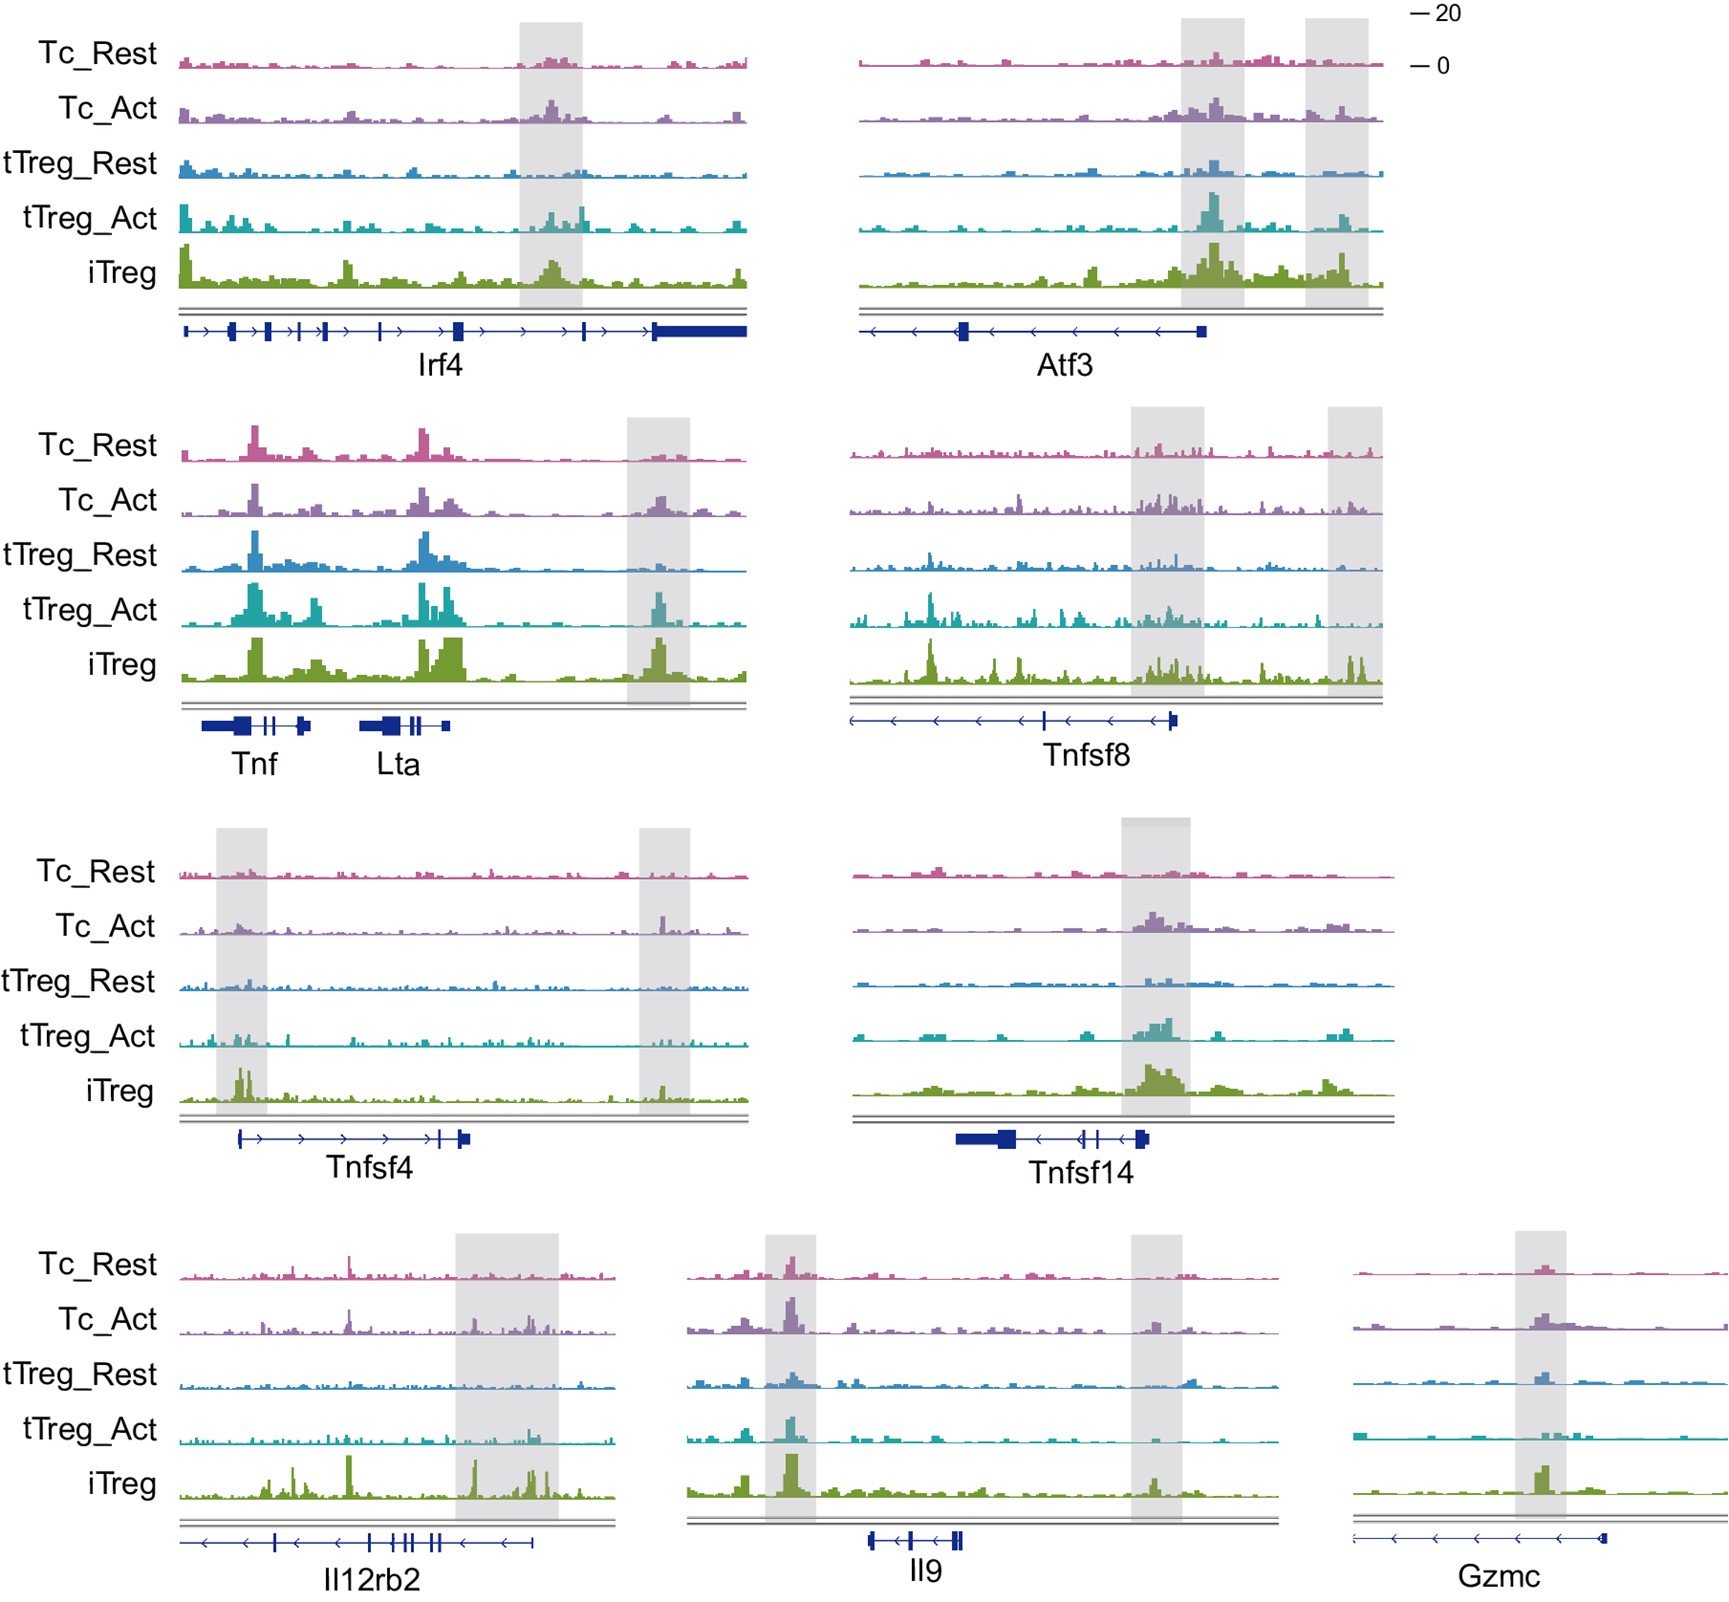
In Figure 4A/S4A, the information on cell death will help the understanding of readers because the sustained SOCE is associated with cell survival as shown in Fig. S2. The authors can discuss the relationships between cell death and Foxp3 retention, which potentially leads to a further interesting question; e.g. the selective/resistance to activation-induced cell death as the identity of Treg cells.
As shown in Author response image 9, activated iTreg cells indeed exhibit a certain degree of cell death compared to resting iTreg cells. The inhibition of NFAT by CsA enhances the survival rate of iTreg cells, but the inhibition of ORAI by CM-4620 leads to more severe cell death. The cell death induced by CsA and CM-4620 is not consistent, indicating that there may not be a direct proportional relationship between cell death and the expression of Foxp3 and Treg identity.
Author response image 9.
Relationship of cell death and Foxp3 stability in restimulated iTregs. Sorted Foxp3-GFP+ iTregs were rested for 1d, then restimulated by anti-CD3 and CD28 in the presence of CsA or CM-4620. After 2d restimulation, live cell percentage were analyzed by staining of Live/Dead fixable Aqua, and percentages of Foxp3+ cells were analyzed by intracellular staining of Foxp3. Upper, live cell percentage of iTregs. Lower, percentages of Foxp3 in iTregs.
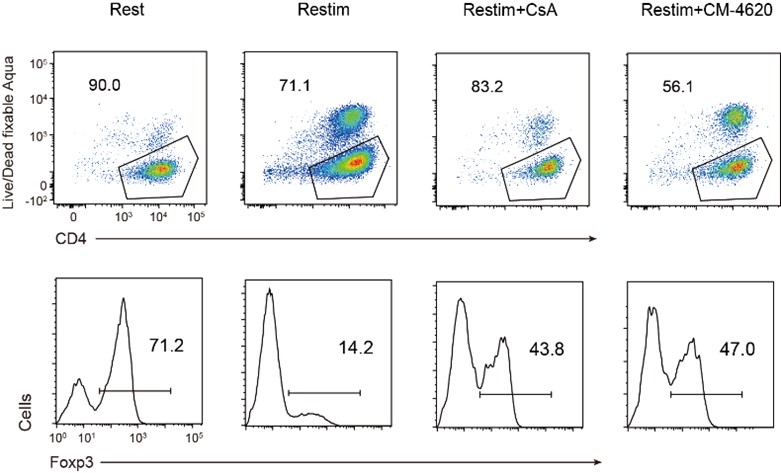
In Figure 5, the information for the data interpretation was insufficient.
We have provided detailed descriptions of the data analysis for Fig 5, including both the method section and the Figure legend, as presented below:
“The peaks annotations were performed with the “annotatePeak” function in the R package ChIPseeker (Yu et al, 2015). The plot of Cut&Tag signals over a set of genomic regions were calculated by using “computeMatrix” function in deepTools and plotted by using “plotHeatmap” and “plotProfile” functions in deepTools. The motif enrichment analysis was performed by using the "findMotifsGenome.pl" command in HOMER with default parameters. The motif occurrences in each peak were identified by using FIMO (MEME suite v5.0.4) with the following settings: a first-order Markov background model, a P value cutoff of 10-4, and PWMs from the mouse HOCOMOCO motif database (v11).”
Additionally, we have also supplemented the method section with further details on the analysis of RNA-seq and ATAC-seq data.
The correlation between the open chromatin status of the gene loci described in Fig.5E and the expression at mRNA level? e.g.; Do iTreg-Act cells produce a higher level of IL-21 than nTreg-act? The analysis in Fig.5F-G should be performed in parallel with nTreg cells to emphasize the distinct NFAT-chromatin regulation in iTreg cells.
We have now compared the secretion levels of IL-21 in tTreg and iTreg upon activation and treated with CsA by ELISA. As shown in Author response image 10, tTreg did not secrete IL-21 regardless of activation status (undetectable), while iTreg did not secrete IL-21 at resting state but exhibited IL-21 secretion after 48 h of activation. Moreover, the secretion of IL-21 was inhibited by CsA and CM-4620 treatment. This observation aligns with our earlier findings where we observed nuclear binding of NFAT to gene loci of these cytokines, enhancing their expression and pushing iTreg unstable under inflammatory conditions. These findings further underscore the likelihood that the inhibition of calcium and NFAT signaling might contribute to the stabilization of iTreg by suppressing the secretion of inflammatory cytokines.
Author response image 10.
IL-21 secretion in tTreg and iTreg upon activation. iTregs and tTregs were sorted and restimulated with anti-CD3 and anti-CD28 antibodies, in the presence of CsA and CM-4620. Cell culture supernatant were harvested after 2 d restimulation and IL-21 secretion was analyzed by ELISA.
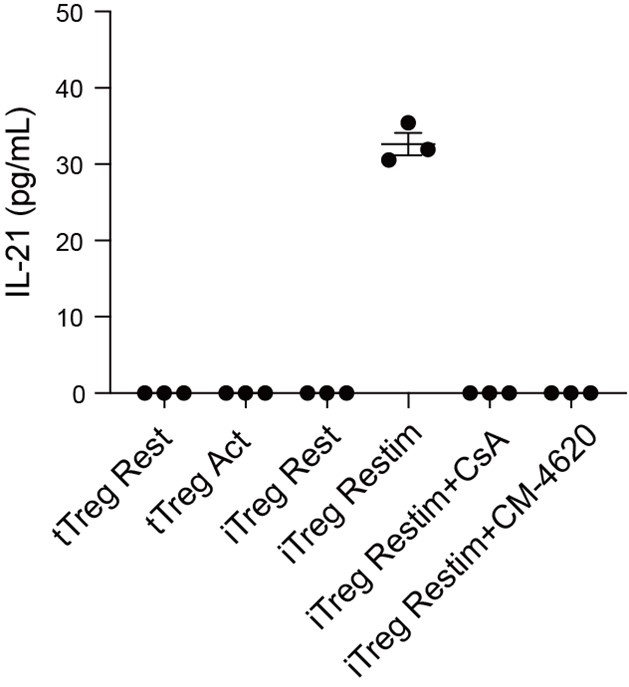
Performing a parallel comparison of NFAT activity between tTreg and iTreg cells was initially part of our experimental plan. However, it proved challenging in practice, as we encountered difficulties in efficiently infecting tTreg cells with NFAT-flag. Consequently, we could not obtain a sufficient number of tTreg cells for conducting Cut&Tag experiments.
Based on our observations, we speculate that there might be substantial differences in the accessibility of genes in tTreg cells, leading to considerable variations in the repertoire of genes available for NFAT to regulate. As a result, we expect significant differences in the nuclear localization and activity of NFAT between iTreg and tTreg cells.
In Figure 6C, what does the FCM plot between Foxp3-CFSE look like?
The authors can discuss the mechanism of ORAI-DN-mediated through such analysis; e.g. the possibility that selective proliferation defect by ORAI-DN in Foxp3- cells led to an increased percentage of Foxp3, not only just unstable transcription of Foxp3.
This is an in vitro experiment to assess the suppressive effect of iTreg on Tconv proliferation. Therefore, CFSE is used to stain Tconv cells, but not iTreg cells, so we did not detect proliferation feature of iTreg.
Minor
Confusing terminology of "tTreg" at line 47, etc. "natural Treg" contains both thymic-derived Treg and periphery-derived Treg cells. (A Abbas et al. Nat Immunol. 2013)
We have now changed the designation to tTreg at line 47. tTreg refers to thymus-derived regulatory T cells, while nTreg includes both tTreg and pTreg. However, it is important to note that the Treg cells used in our study were isolated from the spleen of 2-4-month-old Foxp3-GFP or Foxp3-RFP mice. The CD4+ T cells were first enriched using the CD4 Isolation kit, and the FACSAriaII was utilized to collect CD4+ Foxp3-GFP/RFP+ Treg cells. Subsequently, Helios and Nrp-1 staining revealed that the majority of these cells were nTreg, with only approximately 6% being pTreg. Overall, we consider the cells we used as tTreg.
In all FCM analyses, the authors should clarify how to detect Foxp3 expression; Foxp3-GFP/Foxp3-RFP/Intracellular staining like Figure S5A (but not specified in the other FCM plots)
All Foxp3 expressions in the article were assessed using intracellular staining, as described in the methods section, and we have added specific descriptions to each figure legend. The reason for employing intracellular staining is that we used Foxp3-IRES-GFP mice, where GFP and Foxp3 are not fused into a single protein, existing as separate proteins after expression. Therefore, during induction, the appearance of GFP protein might potentially represent the presence of Foxp3. However, in cases of Foxp3 instability, the degradation of GFP protein may not be entirely synchronized with that of Foxp3 protein, making GFP an unreliable indicator of Foxp3 expression levels. As a result, for the purification of pure iTreg cells, we used Foxp3-GFP/RFP fluorescence, while for observing instability, we employed intranuclear staining of Foxp3.
In Figure 6B, the captions were lacking in the two graphs on the right side
The two restimulation conditions, 0.125+0.25 and 0.25+0.5, have been added into Fig 6B right side.
In Figure S2, the annotation of the x-y axis was missing.
Added.
Lack of reference at line 292.
Reference 42-46 were added.
In the method section, the authors should note the further product information of antibodies and reagents to enhance reproducibility and transparency. Making a list that clarifies the suppliers, Ab clone, product IDs, etc. is encouraged. The authors did not specify the supplier of recombinant proteins and which type of TGF-beta (TGF-beta 1, 2, or 3?).
A detailed description of the mice, antibodies, Peptide recombinant protein, commercial kit, and software has been provided and incorporated into the methods section.
In the method section, the authors should clarify which Foxp3-reporter strain. There are many strains of Foxp3-reporter mice in the world. In line 373, is the "FoxP3-IRES-GFP transgenic mice" true? Knock-in strain or BAC-transgene?
This mouse is a gift from Hai Qi Lab in Tsinghua University. They acquired this mouse strain from Jackson Laboratory, and the strain name is B6.Cg-Foxp3tm2Tch/J, Strain #:006772. An IRES-EGFP-SV40 poly A sequence was inserted immediately downstream of the endogenous Foxp3 translational stop codon, but upstream of the endogenous polyA signal, generating a bicistronic locus encoding both Foxp3 and EGFP.
The age of mice used in the experiments should be specified, and confusing words such as "young" should not be used in any method descriptions; e.g. line 405.
The detailed mouse age has been added in the methods section. “To prepare Tconv, tTreg and iTreg for experiments, spleen was isolated from 2-4-month-old Foxp3-GFP mice for Tconv and tTreg sorting, and 6-week-old mice for iTreg induction.”
The method of how the original ATAC-seq/Cut & Tag data were generated was not described in the method section.
Added in method section.
The reference section was incomplete, and the style was not unified. e.g.; ref 7, 24, 25, 26 ... I gave up checking all.
The style of ref 7, 22, 24, 26, 28, 31, 33, 35 were modified.
Changes in manuscript:
Author Name: “Huiyun Lv” to “Huiyun Lyu”.
Fig 1A was updated according to Reviwer 2’s suggestion.
Fig S3E and associated description was added according to Reviwer 2’s suggestion.
Fig S4C and associated description was added according to Reviwer 1’s suggestion.
Fig 5H and associated description was added according to Reviwer 2’s suggestion.
Fig 6D were updated according to Reviwer 1’s suggestion.
Fig 2D was corrected, the labels for gapdh and actin in the iTreg panel were inadvertently switched. The mistake has been rectified, and the original gel image will be provided.
Fig 2A and Fig 4A was updated.
The style of Fig 6B and Fig S2A was modified.
Method:
Mice: FoxP3-IRES-GFP with more description.
Flow Cytometry sorting and FACS: the detailed mouse age has been added. RNA-seq analysis, ATAC-sequencing, ATAC-seq analysis, Cut&Tag assay, Cut&Tag data analysis: more description was added.
Statistical analysis: “Numbers of independently-performed experiment repeats are shown as N, biological replicates of each experiment as n.” were added.
Reference: Ref 42-46 and 49-52 were added. The style of ref 7, 22, 24, 26, 28, 31, 33, 35 were corrected.
A detailed description of the mice, antibodies, Peptide recombinant protein, commercial kit, and software has been provided.
Author response:
The following is the authors’ response to the original reviews.
Reviewer #1 (Public review):
(1) The mechanism by which STAMBPL1 mediates GRHL3 transcription through its interaction with FOXO1 is not sufficiently discussed, especially in relation to how STAMBPL1 regulates FOXO1. Some reported effects are modest.
We appreciate the reviewer’s comments. In response, we have added a discussion on the potential mechanisms by which STAMPBL1 regulates FOXO1 transcriptional activity in Discussion, highlighted in red on page 18, lines 342 to 352. The specific reply content is as follows: “The transcriptional activity of FOXO1 is primarily regulated by its nucleocytoplasmic shuttling process (Van Der Heide, Hoekman et al. 2004). The PI3K/AKT pathway promotes the phosphorylation of FOXO1, resulting in the formation of a complex with members of the 14-3-3 family (including 14-3-3σ, 14-3-3ε, and 14-3-3ζ), which facilitates its export from the nucleus and inhibits its transcriptional activity (Huang and Tindall 2007, Tzivion, Dobson et al. 2011). It’s reported that TDAG51 prevents the binding of 14-3-3ζ to FOXO1 in the nucleus by interacting with FOXO1, thereby enhancing its transcriptional activity through increased accumulation within the nucleus (Park, Jeon et al. 2023). Our results indicate that the overexpression of STAMBPL1 and STAMBPL1-E292A did not affect the protein levels of FOXO1 (Fig.7E and Fig.S5E), but STAMBPL1 co-localizes with FOXO1 in the nucleus (Fig.7M) and interacts with it (Fig.7N and Fig.S5I-J). This suggests that STAMBPL1 enhances the transcriptional activity of FOXO1 on GRHL3 by interacting with nuclear FOXO1.” The result was added to Supplementary Figure 5 as Fig.S5E.
Reviewer #2 (Public review):
(1) A potential limitation of the study is the reliance on specific cellular and animal models, which may constrain the extrapolation of these findings to the broader spectrum of human TNBC biology. Furthermore, while the study provides evidence for a novel regulatory axis involving STAMBPL1, FOXO1, and GRHL3, the multifaceted nature of angiogenesis may implicate additional regulatory factors not exhaustively addressed in this research.
We appreciate the valuable suggestions provided by the reviewer. In Discussion, we have added an in-depth discussion of the limitations of the study, as well as an analysis of the regulatory factors related to tumor angiogenesis, which highlighted in red on pages 20 to 21, lines 396 to 412. The relevant content added is as follows: “In this study, we utilized two triple-negative breast cancer cell lines, HCC1806 and HCC1937, along with human primary umbilical vein endothelial cells (HUVECs) and a nude mouse breast orthotopic transplantation tumor model to investigate the regulatory mechanism by which STAMBPL1 activates the GRHL3/HIF1α/VEGFA signaling pathway through its interaction with FOXO1, thereby promoting angiogenesis in TNBC. The results of this study have certain limitations regarding their applicability to human TNBC biology. Furthermore, in addition to the HIF1α/VEGFA signaling pathway emphasized in this study, tumor cells can continuously release or upregulate various pro-angiogenic factors, such as Angiopoietin and FGF, which activate endothelial cells, pericytes (PCs), cancer-associated fibroblasts (CAFs), endothelial progenitor cells (EPCs), and immune cells (ICs). This leads to capillary dilation, basement membrane disruption, extracellular matrix remodeling, pericyte detachment, and endothelial cell differentiation, thereby sustaining a highly active state of angiogenesis (Liu, Chen et al. 2023). It is important to collect clinical TNBC tissue samples in the future to analyze the expression of the STAMBPL1/FOXO1/GRHL3/HIF1α/VEGFA signaling axis. Furthermore, patient-derived organoid and xenograft models are useful to elucidate the regulatory relationship of this axis in TNBC angiogenesis”
Reviewer #3 (Public review):
The main weaknesses of this work are that the relevance of this molecular axis to the pathogenesis of TNBC is not clear, and it is not clearly established whether this is a regulatory pathway that occurs in hypoxic conditions or independently of oxygen levels.
(1) With respect to the first point, both FOXO1 and GRHL3 have been previously described as tumor suppressors, with reports of FOXO1 inhibiting tumor angiogenesis. Therefore, this works describes an apparently contradictory function of these proteins in TNBC. While it is not surprising that the same genes perform divergent functions in different tumor contexts, a stronger evidence in support of the oncogenic function of these two genes should be provided to make the data more convincing. As an example, the data in support of high STAMBPL1, FOXO and GRHL3 gene expression in TNBC TCGA specimens provided in Figure 8 is not very strong and it is not clear what the non-TNBC specimens are (whether other breast cancers or other tumors, perhaps those tumors whether these genes perform tumor suppressive functions). To strengthen the notion that STAMBPL1, FOXO and GRHL3 are overexpressed in TNCB, the authors could provide a comparison with normal tissue, as well as the analysis of other publicly available datasets (like the NCI Clinical Proteomic Tumor Analysis Consortium as an example). Finally, is it not clear what are the basal protein expression levels of STAMBPL1 in the cell lines used in this study, as based on the data presented in Figures 2D and F it appears that the protein is not expressed if not exogenously overexpressed. It would be helpful if the authors addressed this issue and provided further evidence of STAMBPL1 expression in TNBC cell lines.
We appreciate the suggestions. In this study, we utilized the BCIP online tool to analyze the Metabric database, incorporating adjacent normal tissues as controls. Although the expression levels of STAMBPL1, FOXO1, and GRHL3 in breast cancer tissues are not uniformly higher than those in adjacent tissues, their expression levels in triple-negative breast cancer (TNBC) are significantly elevated compared to non-TNBC. The results of this re-analysis have been added in Supplementary Figure 6 as Fig.S6A-C.
About the question of the basal protein expression levels of STAMBPL1 in the cell lines used in this study, our response is that Fig. 2A showed the endogenous level of STAMBPL1 in HCC1806 and HCC1937. For Fig. 2D and 2F, the overexpressed STAMBPL1 was fused with a 3xFlag tag, resulting in a higher molecular weight compared to the endogenous STAMBPL1. In the revised Figure 2, we have indicated the positions of the endogenous (Endo.) and exogenous (OE.) STAMBPL1 bands with arrows.
(2) Linked to these considerations is the second major criticism, namely that it is not made clear if this new regulatory axis is proposed to act in normoxic or hypoxic conditions. The experiments presented in this paper are performed in both conditions but a clear explanation as to why cells are exposed to hypoxia is not given and would be necessary being that HIF-1a transcription and not protein stability is being analyzed. Also, different hypoxic conditions are sometimes used, resulting in different mRNA levels of HIF-1a and its downstream targets and quite significant fluctuations within the same cell line from one experimental setting to the next. The authors should provide an explanation as to why experimental conditions are changed and, more importantly, the experiments presented in Figure 2 should be performed also in normoxia.
Thanks for the comments. Under normoxic conditions, HIF1α is recognized by pVHL due to hydroxylation and is rapidly degraded via the proteasomal pathway. In contrast, under hypoxic conditions, HIF1α protein is accumulated. To investigate the effect of STAMBPL1 knockdown on HIF1A gene transcription levels, we conducted experiments under hypoxic conditions to avoid interference from the rapid degradation of HIF1α at the protein level, as shown in Figures 2B-C. Furthermore, under normoxic conditions, the overexpression of STAMBPL1 had been demonstrated to significantly enhance the protein levels of HIF1α and upregulate the transcription of VEGFA through HIF1α. To avoid the potential impact of excessive accumulation of HIF1α protein under hypoxic conditions on its protein level detection and the transcription of downstream VEGFA, the related experiments shown in Figure 2D-G were performed under normoxic conditions. We have explained the corresponding experimental conditions in the “Result” and “Figure legends” according to the reviewer's comments, highlighted in red.
(3) Another critical point is that necessary experimental controls are sometimes missing, and this is reducing the strength of some of the conclusions enunciated by the authors. As examples, experiments where overexpression of STAMBPL1 is coupled to silencing of FOXO1 to demonstrate dependency lack FOXO1 silencing the absence of STAMBPL1 overexpression. Because diminishing FOXO1 expression affects HIF-1a/VEGF transcription even in the absence of STAMBPL1 (shown in Figure 7C, D), it is not clear if the data presented in Figure 7G are significant. The difference between HIF-1a expression upon FOXO1 silencing should be compared in the presence or absence of STAMBPL1 overexpression to understand if FOXO1 impacts HIF-1a transcription dependently or independently of STAMBPL1.
Thank you for this comment. For Fig.7G-H, our experimental objective was to determine whether the activation of HIF1A/VEGFA transcription by STAMBPL1 via FOXO1. Therefore, under STAMBPL1 overexpression, we knocked down FOXO1 to investigate whether FOXO1 silencing could reverse the upregulation of HIF1A/VEGFA transcription induced by STAMBPL1 overexpression.
(4) In addition, some minor comments to improve the quality of this manuscript are provided.
(4.1) As a general statement, the manuscript is extremely synthetic. While this is not necessarily a negative feature, sometimes results are discussed in the figure legends and not in the main text (as an example, western blots showing HIF-1a expression) and this makes it hard to read thought the data in an easy and enjoyable manner.
Thank you for this suggestion. We have revised the figure legends to make them clearer and more concise, highlighted in red.
(4.2) The effect of STAMBPL1 overexpression on HIF-1a transcription is minor (Figure 2) The authors should explain why they think this is the case and whether hypoxia may provide a molecular environment that is more permissive to this type of regulation.
Thank you for the comment. Under normoxic conditions, we conducted WB to examine the protein expression of HIF1α after the overexpression of STAMBPL1 and the knockdown of HIF1α. To visually illustrate the impact of STAMBPL1 overexpression on HIF1A protein levels, as well as the effectiveness of HIF1α knockdown, we annotated the grayscale analysis results of the bands in Figures 2D and 2F. As the reviewer pointed out, under normoxic conditions, HIF1α is rapidly degraded, which may explain why the upregulation of HIF1α protein levels by STAMBPL1 overexpression is not very pronounced.
(4.3) HIF-1a does not appear upregulated at the protein level protein by STAMBPL1 or GRLH3 overexpression, even though this is stated in the legends of Figures 2 and 6. The authors should show unsaturated western blots images and provide quantitative data of independent experiments to make this point.
Thank you for this comment. We have added the unsaturated image of HIF1α into Fig.2D, and performed a grayscale analysis of the HIF1α bands in Fig.2D and Fig.6A to indicate the relative protein level of HIF1α.
Reviewer #1 (Recommendations for the authors):
(1) The authors previously reported that STAMBPL1 stabilizes MKP1 in TNBC. However, in this study, they focus on HIF1a. Given that STAMBPL1 affects HIF1a expression, it would be valuable to examine the levels of ROS in TNBC cells with or without STAMBPL1, as ROS is known to influence HIF1a stability.
Thank you for your comments. It’s known that STAMBPL1 functions as a deubiquitinating enzyme. However, our study reveals that the upregulation of HIF1α by STAMBPL1 is independent of its deubiquitinating activity. This conclusion is supported by the observation that overexpression of the deubiquitinase active site mutant, STAMBPL1-E292A, also upregulated HIF1α expression (Figure 1F). Moreover, STAMBPL1 overexpression enhanced HIF1α transcription (Figures 4E and S3E), while STAMBPL1 knockdown was able to inhibit the transcription of HIF1α (Figures 2B-C). These results indicate that STAMBPL1 mediates the transcription of HIF1α but does not affect the stability of HIF1α. For these reasons, we think that it is unnecessary to examine the ROS levels.
(2) Figure 1A: The regulation of HIF1a mRNA by STAMBPL1, but not its protein levels, could be better addressed by using MG132 to rule out the impact of protein degradation.
Thanks for this comment. Under normoxic conditions, the oxygen-sensitive prolyl hydroxylases PHD1-3 act on HIF1α, specifically inducing hydroxylation at the proline 402 and 564 residues. These hydroxylated residues are recognized by the pVHL/E3 ubiquitin ligase complex, leading to ubiquitination and subsequent degradation via the proteasome pathway. Conversely, under hypoxic conditions, PHD1-3 are inactivated, and non-hydroxylated HIF1α is not recognized by the pVHL/E3 ubiquitin ligase complex, thereby avoiding ubiquitination and proteasomal degradation (DOI: 10.1073/pnas.95.14.7987, DOI: 10.1515/BC.2004.016, and DOI: 10.1042/BJ20040620). The mechanism of HIF1α accumulation under hypoxia is analogous to the action of the proteasome inhibitor MG132. When we treated cells with hypoxia, the ubiquitination and proteasomal degradation pathway of HIF1α was blocked. At this time, STAMBPL1 knockdown could downregulate the expression of HIF1α (Fig.1A). Meanwhile, since the knockdown of STAMBPL1 significantly downregulated the mRNA level of HIF1α under hypoxia (Fig.2B-C), we concluded that STAMBPL1 affects the expression of HIF1α by mediating its transcription. In addition, MG132 will block all proteasomal substrate degradation and may affect HIF1α mRNA levels indirectly.
(3) Figure 2D and 2F: The effect of STAMBPL1 in promoting HIF1a expression is quite mild, and the effect of HIF1a knockdown is also modest. Given the high levels of STAMBPL1 in TNBC cell lines (Figure 2A), it would be better to repeat these experiments in a STAMBPL1-knockdown setting for clearer insights.
We appreciate this insightful suggestion. Considering that the regulation of HIF1α expression by STAMBPL1 occurs at the transcriptional level, and to prevent excessive accumulation of HIF1a during hypoxia that could confound the effect of STAMBPL1 overexpression on HIF1α regulation, we opted to overexpress STAMBPL1 under normoxic conditions and subsequently knock down HIF1α, as shown in Fig.2D and Fig.2F. This approach allowed us to observe that STAMBPL1 overexpression can upregulate HIF1a expression to some extent. Additionally, in response to the reviewer's suggestion to knock down STAMBPL1, we have conducted the corresponding experiments, with results presented in Fig.1A-E and Fig.2B-C.
(4) Figure 4A: Why does the RNA-seq pattern differ significantly between the two siRNAs? Additionally, the authors should clarify why they focus primarily on transcription factors, as other mechanisms, such as mRNA stability and RNA modification, could also influence gene transcription.
Thank you for this comment. Two siRNAs for STAMBPL1 were designed and synthesized by a biotechnology company. Although both siRNAs target STAMBPL1, they target different sequences. While both siRNAs effectively knocked down STAMBPL1 (Fig. 1A and Fig. 2A), the possibility of off-target effects cannot be completely ruled out. Therefore, we needed to use two siRNAs simultaneously for RNA-seq, ensuring that the gene expression changes observed are due to the knockdown of STAMBPL1 by focusing on genes downregulated by both two siRNAs. Additionally, among the 27 genes downregulated by both two siRNAs, only 18 genes were annotated. Of these 18 genes, except for GRHL3, which is a transcription factor reported to be involved in gene transcription regulation, the remaining 17 genes have no documented association with RNA transcription, stability, or modification. Therefore, we focused on the GRHL3 gene.
(5) Figure 5G: To investigate whether STAMBPL1 and GRHL3 function epistatically in the pathway, a double knockdown of STAMBPL1 and GRHL3 should be examined. Additionally, a double knockdown of STAMBPL1 and FOXO1 should be assessed.
Thank you for your comment. In Figure 5G, we aimed to assess the knockdown efficiency of GRHL3 using siRNAs. To determine whether STAMBPL1 upregulates the HIF1a/VEGFA axis via GRHL3, we overexpressed STAMBPL1 and subsequently knocked down GRHL3. Our findings indicated that STAMBPL1 overexpression indeed enhanced the HIF1a/VEGFA axis, which was rescued by the knockdown of GRHL3, as shown in Figures 4E-F and S3E-F. Similarly, upon overexpressing STAMBPL1 and knocking down FOXO1, we observed that STAMBPL1 overexpression increased the GRHL3/HIF1a/VEGFA axis, which could also be rescued by knocking down FOXO1, as shown in Figures 7F-H. These results suggest that STAMBPL1 upregulates the GRHL3/HIF1a/VEGFA axis through FOXO1. We do not think it is a right way to double knock down STAMBPL1 and FOXO1 or GRHL3.
(6) Figure 7: It remains unclear how STAMBPL1 regulates FOXO1. The authors show that STAMBPL1 increases the transcriptional activation of FOXO1 at the GRHL3 promoter, but it is not clear if STAMBPL1 is required for FOXO1 binding to the GRHL3 promoter. To address this, STAMBPL1-knockdown should be included to examine its effect on FOXO1 binding to the GRHL3 promoter. Furthermore, it would be important to determine whether the STAMBPL1-FOXO1 interaction is essential for GRHL3 transcription. Since the interaction sites of STAMBPL1-FOXO1 have been mapped, a mutant disrupting the interaction would provide better insight into how STAMBPL1 promotes GRHL3 transcription by interacting with FOXO1.
Thank you for this comment. It has been reported that FOXO1 promotes the transcription of the GRHL3 gene by interacting with its promoter (DOI: 10.1093/nar/gkw1276). We also verified through ChIP assay that FOXO1 can bind to the promoter of GRHL3 gene (Fig.7I) and mediate its transcription. Specifically, knocking down FOXO1 significantly down-regulated the mRNA level of GRHL3 (Fig.7B), and the GRHL3 promoter lacking FOXO1 binding site almost completely lost transcriptional activity (Fig.7J), indicating that FOXO1 is crucial for the transcriptional activity of the GRHL3 promoter. Overexpression of STAMBPL1 enhances the activating effect of FOXO1 on the transcriptional activity of the GRHL3 promoter (Fig.7K). However, the up-regulation of GRHL3 transcription by overexpression of STAMBPL1 is completely blocked by FOXO1 knockdown (Fig.7F), and the knockdown of FOXO1 essentially blocks the binding of STAMBPL1 to the GRHL3 promoter (Fig.7L), suggesting that STAMBPL1 affects the transcriptional expression of GRHL3 based on FOXO1. As we added in Discussion, the transcription factor activity of FOXO1 is mainly regulated by its nucleoplasm shuttling process, and the accumulation of FOXO1 in nucleus can enhance its transcription factor activity (DOI: 10.1042/BJ20040167; DOI: 10.15252/embj.2022111867). In our research, neither STAMBPL1 nor its mutant of deubiquitinating enzyme site affected the expression of FOXO1 (Fig.S5E), but STAMBPL1 and FOXO1 co-located in the nucleus (Fig.7M), and they interacted with each other (Fig.7N, Fig.S5I-J). Therefore, we speculate that STAMBPL1 interacts with FOXO1 in the nucleus, obstructs the binding of FOXO1 with the members of 14-3-3 family, inhibits the export of FOXO1, thereby enhancing its transcriptional activity. This interaction between STAMBPL1 and FOXO1 does not necessarily affect the binding of FOXO1 with DNA, including the GRHL3 promoter.
(7) Figure 8 A-C: What is the correlation among the expressions of STAMBPL1, FOXO1, and GRHL3 in TNBC tumors compared to non-TNBC tumors?
Thank you for your comment. In Figure 8A-C, we analyzed the expression levels of STAMBPL1, FOXO1, and GRHL3 in both TNBC and non-TNBC samples using the BCIP. The results indicate that the expression levels of these three genes are significantly higher in TNBC compared to non-TNBC samples. To investigate the correlation among the expressions of STAMBPL1, FOXO1, and GRHL3 in TNBC versus non-TNBC, we further utilized the Metabric data. Besides the positive correlation trend between STAMBPL1 and GRHL3 expression in TNBC clinical samples (Pearson R = 0.27), no significant correlation was observed in the expression levels of STAMBPL1, FOXO1, and GRHL3 in TNBC and non-TNBC clinical samples (as shown in Author response image 1 below). Since STAMBPL1 and FOXO1 are involved as protein molecules in the transcriptional regulation of GRHL3 gene, and the data obtained from the Metabric database are the transcriptional levels of these three genes, this might be the reason why the correlation between their expressions was not observed.
Author response image 1.
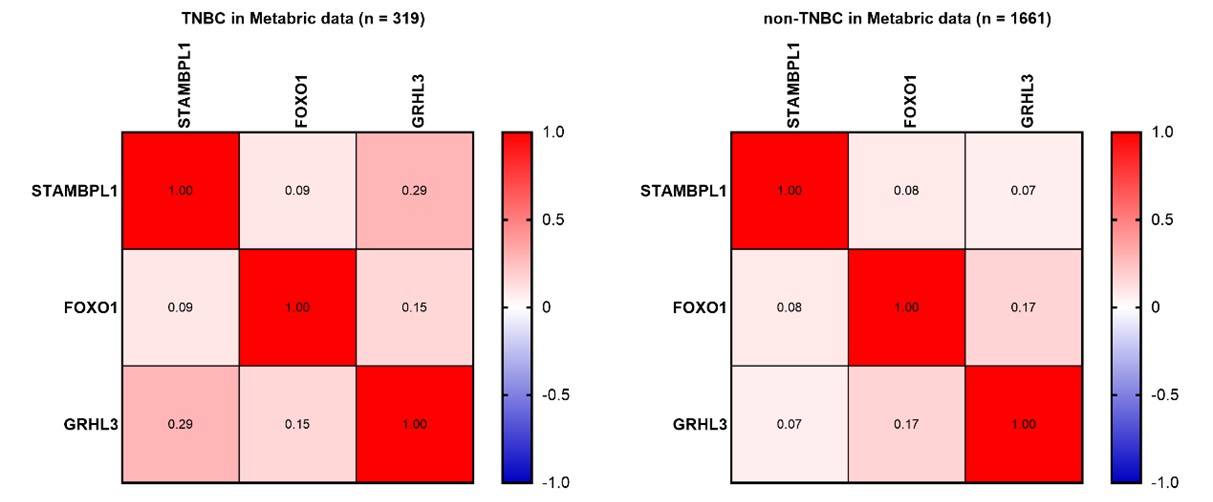
Reviewer #2 (Recommendations for the authors):
The authors have thoroughly elucidated the role of STAMBPL1 in TNBC. However, it would be beneficial to discuss the potential clinical implications of these findings, such as how targeting STAMBPL1 or FOXO1 might impact current treatment strategies for TNBC. However, several issues need to be addressed.
Major:
(1) While the study provides an exhaustive analysis of the molecular mechanisms, a comparison with other subtypes of breast cancer could enhance our understanding of the specificity of the STAMBPL1/FOXO1/GRHL3/HIF1α/VEGFA axis in TNBC.
Thank you for your comment. According to report, STAMBPL1 is significantly associated with the mesenchymal characteristics of breast cancer (DOI: 10.1038/s41416-020-0972-x). We utilized cBioPortal (http://www.cbioportal.org/) to analyze the expression of STAMBPL1 across various clinical subtypes of breast cancer. The results indicated that STAMBPL1 is highly expressed in invasive breast cancer, which has been added to Supplementary Figure 6 as Fig.S6D. Given that TNBC is an aggressive type of invasive breast cancer, we further examined the expression of STAMBPL1 in TNBC compared to non-TNBC using BCIP (http://omicsnet.org/bcancer/database). Our findings revealed that the expression level of STAMBPL1 in TNBC was elevated relative to its levels in non-TNBC (Fig.8A). Additionally, since tumor angiogenesis is a critical factor influencing the metastasis of cancer cells, our study focused specifically on the pro-angiogenic effects of STAMBPL1 in TNBC.
(2) The authors might consider discussing any potential off-target effects of the siRNA and shRNA used in the study to bolster the conclusions drawn from the knockdown experiments.
We appreciate the reviewer's suggestion. It is well-known that siRNA or shRNA have off-target effects. To address this concern, we employed two siRNAs for each gene knockdown in our study. Specifically, we knocked down genes such as STAMBPL1, FOXO1, GRHL3, and HIF1A in two TNBC cell lines, HCC1806 and HCC1937, using two siRNAs. Except for siRNA#1 targeting HIF1A, which did not show a significant knockdown effect in HCC1806 cells (Fig.2D and Fig.6A), the knockdown effects of other siRNAs on their respective genes were effective, and the resulting phenotypes were consistent. As shown in Fig.2F and Fig.S4H, siRNA#1 targeting HIF1A had a significant knockdown effect in HCC1937 cells. The lower knockdown efficiency of this siRNA in HCC1806 cell line might be attributed to cell-specific factors.
(3) It would be advantageous if the authors could provide further details on the patient demographics and tumor characteristics in the TCGA database analysis to better comprehend the clinical relevance of their findings.
Thanks for the reviewer's suggestions. We have now indicated the number of clinical samples in each group in the legend of Fig.8A-C. Since we utilized the BCIP online database to analyze and compare the expression levels of the three genes STAMBPL1, FOXO1, and GRHL3 in TNBC and non-TNBC, we are unable to obtain more specific information regarding the tumor characteristics of each sample. However, our analysis clearly shows that the expression levels of these three genes are significantly higher in TNBC compared to non-TNBC.
(4) The authors should consider discussing any limitations regarding the generalizability of their findings, such as potential variations among different TNBC subtypes or the specificity of their observations to certain stages of the disease.
We appreciate the reviewer's comment. Accordingly, we have added a discussion on the limitation of this study in Discussion, highlighted in red font on pages 20 to 21, lines 396 to 412. In addition, we utilized the bc-GenExMiner online database to conduct a comparative analysis of STAMBPL1 expression in different subtypes of non-TNBC and TNBC. The result indicates that STAMBPL1 is highly expressed in mesenchymal-like and basal-like TNBC, which has been added into Supplementary Figure 6 as Fig.S6E. Since these two subtypes of TNBC are highly invasive and metastatic, it suggests that targeting the signaling pathway of STAMBPL1/FOXO1/GRHL3/HIF1α/VEGFA may offer clinical benefits for patients with invasive TNBC.
Minor:
The paper is generally well-written, but it's crucial to maintain vigilance for subject-verb agreement, proper use of tense, and consistent terminology.
Thank you for this suggestion. We have thoroughly revised the article for issues such as grammar, including tense, subject-verb agreement, and terminology.
Author response:
The following is the authors’ response to the original reviews
Reviewer #1:
While very positive towards our manuscript, this reviewer also points out three suggestions for improvement.
Overall, there are not many weaknesses. The main one I noticed is with the lipidomic analysis shown in Figs 3C, 7C, S1 and S3. While these data are an essential part of the analysis and provide strong evidence for the conclusions of the study, it is unfortunate that the methods used did not enable the distinction between two 18:1 isomers. These two isomers of 18:1 are important in C. elegans biology, because one is a substrate for FAT-2 (18:1n-9, oleic acid) and the other is not (18:1n-7, cis vaccenic acid). Although rarer in mammals, cisvaccenic acid is the most abundant fatty acid in C. elegans and is likely the most important structural MUFA. The measurement of these two isomers is not essential for the conclusions of the study, but the manuscript should include a comment about the abundance of oleic vs vaccenic acid in C. elegans (authors can find this information, even in the fat-2 mutant, in other publications of C. elegans fatty acid composition). Otherwise, readers who are not familiar with C. elegans might assume the 18:1 that is reported is likely to be mainly oleic acid, as is common in mammals.
Excellent point. As suggested by the reviewer, we now include a clarification of this in the text: "Consistent with previous publications [10], the levels of 18:1 fatty acids were greatly increased in the fat-2(wa17) mutant. It is important to note that the majority of these 18:1 fatty acids is likely 18:1n7 (vaccenic acid) and not 18:1n9 (OA) [10,23], which is the substrate of FAT-2; the lipid analysis methods used here are not able to distinguish between the two 18:1 species."
The title could be less specific; it might be confusing to readers to include the allele name in the title.
We thank the reviewer for the suggestion, and we have now modified the title:
"Forward Genetics In C. elegans Reveals Genetic Adaptations To Polyunsaturated Fatty Acid Deficiency"
There are two errors in the pathway depicted in Figure 1A. The16:0-16:1 desaturation can be performed by FAT-5, FAT-6, and FAT-7. The 18:0-18:1 desaturation can only be performed by FAT-6 and FAT-7.
We thank the reviewer for pointing out this mistake. The pathway in Fig. 1A has been corrected.
Reviewer #2:
This reviewer was also very positive towards our manuscript but also pointed out several suggestions for additional experiments or changes to the manuscript.
Major recommendations
(1) To conclude that membrane rigidification is not the major cause of defects associated with fat-2 mutations, the authors need to show that fluidity is rescued by their treatments (oleic acid or NP-40). I honestly doubt that it is the case, as oleic acid is already abundant in fat-2 mutants. It is possible that the treatments, which are effective in rescuing fluidity in paqr-2 mutants, do not have the same effects in fat-2 mutants.
The reviewer raises an important point. In an effort to address this, we have now performed a FRAP study on fat-2(wa17) mutants with/without NP40 as a fluidizing agent (with wild-type and paqr-2 mutants as controls). The new data, now included as Fig. 2J, shows that NP40 did improve the fluidity of the intestinal cell membrane in the fat-2(wa17) mutant, though not to the same degree as in the paqr-2 mutant. This is now cited in the text as follows:
"However, cultivating the fat-2(wa17) mutant in the presence of the non-ionic detergent NP40, which improves the growth of the paqr-2(tm3410) mutant [17], did not suppress the poor growth phenotype of the fat-2(wa17) mutant even though it did improve membrane fluidity as measured using FRAP (Fig. 2I-J). Similarly, supplementing the fat-2(wa17) mutant with the MUFA oleic acid (OA, 18:1), which also suppresses paqr-2(tm3410) phenotypes [17], did not suppress the poor growth phenotype of the fat-2(wa17) mutant (Fig 2K)."
(2) It is not validated experimentally that the mutations converge into FTN-2 repression. This can be verified by analyzing mRNA or protein expression of FTN-2 in the egl-9 and hif-1 mutants obtained in the screening.
Our manuscript does lean on several publications that previously established the HIF-1 pathway in C. elegans. Additionally, we now added a qPCR experiment showing that the newly isolated hif-1(et69) allele indeed suppresses the expression of ftn-2. This was an especially valuable experiment since the hif-1(et69) is proposed to act as a gain-of-function allele that would constitutively suppress ftn-2 expression. This new result is included as Fig. 6C and mentioned in the text:
"Inhibition of egl-9 promotes HIF-1 activity [41], which we here verified for the egl-9(et60) allele using western blots (Fig 6A). Additionally, we found by qPCR that ftn-2 mRNA levels are as expected reduced by the proposed gain-of-function hif-1(et69) allele (Fig 6C). We conclude that the egl-9 and hif-1 suppressor mutations likely converge on inhibiting ftn-2 and thus act similarly to the ftn-2 loss-of-function alleles."
(3) In the hif-1(et69) and ftn-2(et68) mutants, the rescues in lipid composition seem to be minor, with eicosapentaenoic acid (EPA) levels remaining low. The ftn-2 mutant data is especially concerning, as it suggests that egl-9 mutants rescue lipid composition via distinct mechanisms not including ftn-2 suppression. I suggest that the authors test the minimal doses of linoleic acid or EPA required to rescue fat-2 mutants and perform lipidomics to test which is the degree of EPA restoration that is needed. If a low level of restoration is sufficient, the hif-1 and ftn-2 mutants might indeed rescue phenotypes via a restoration of EPA levels. Otherwise, other mechanisms have to be considered.
In line with the above issue, the low level or EPA restoration in hif-1 and ftn-2 mutants raise the possibility that the mutations rescue fat-2 mutants downstream of lipid changes. The reduction in HIF-1 levels in fat-2 mutants also suggest that lipid changes affect HIF-1 expression. Thus, the "impossibility to genetically compensate PUFA deficiency" might be wrong. The above experiment would answer to this point too.
The reviewer is entirely correct to consider alternative explanations. In the lipidomics in Fig 3, we see that fat-2(wa17) worms on NGM have only ~1.5-2%mol EPA in phosphatidylcholines. When treated with 2 mM LA, the levels of EPA rise to ~10%mol, still below the ~ 25% observed in N2 but perhaps this is sufficient cause for restoring fat-2(wa17) health. Similarly, the hif-1(et69) and ftn-2(et68) mutant alleles elevate EPA levels to 5- 7% in fat-2(wa17). Thus, we have a correlation where a significant increase in EPA, obtained either through LA supplementation or through suppressor mutations (e.g. egl-9 (et60), hif-1(et69) or ftn-2(et68)), is associated with improved growth and health of the fat-2(wa17) mutant. However, correlation is of course not proof. The suggested experiment to titrate EPA to its lowest fat-2(wa17) rescuing levels and then perform lipidomics analysis was not possible in a reasonable time frame during this revision. However, preliminary experiments showed that even 25 μM LA (most of which will be converted to EPA by the worms) is enough to rescue the fat-2(wa17) or null mutant (Author response image 1), suggesting that even tiny amounts (much below the >250 μM used in our article) bring great benefits.
Author response image 1.
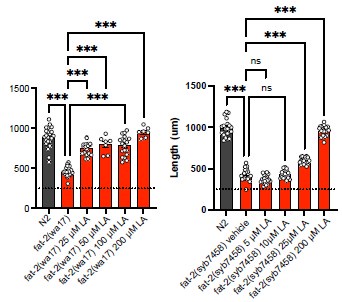
Nevertheless, we now acknowledge in the discussion that alternative explanations exist:
"Other mechanisms are also possible. For example, mutations in the HIF-1 pathway could somehow reduce EPA turnover rates in the fat-2(wa17) mutant and allow its levels to rise above an essential threshold. This hypothesis is consistent with the observation that the suppressors can rescue both the fat-2(wa17) mutant and fat-2 RNAi-treated worms but not the fat-2 null mutant. It is even possible, though deemed unlikely, that the fat-2(wa17) suppressors act by compensating for the PUFA shortage via some undefined separate process downstream of the lipid changes and that they only indirectly result in elevated EPA levels."
Additionally, another possible mechanism of action of the fat-2(wa17) suppressors could have been that they all cause upregulation of the FAT-2 protein. We have now explored this possibility using Western blots and found that this is an unlikely mechanism. This is presented in Fig. 6D-E and S3C-D, mentioned in the text as follows:
"We also used Western blots to evaluate the abundance of the FAT-2 protein expressed from endogenous wild-type or mutant loci but to which a HA tag was fused using CRISPR/Cas9. We found that the FAT-2::HA levels are severely reduced when the locus contains the S101F substitution present in the wa17 allele, but restored close to wild-type levels by the fat2(et65) suppressor mutation (Fig 6D-E, S3C-D Fig). The levels of FAT-2 in the HIF-1 pathway suppressors varied between experiments, with the suppressors sometimes restoring FAT-2 levels and sometimes not even when the worms were growing well (Fig 6D-E, S3C-D Fig). The fat-2(wa17) suppressors, except for the intragenic fat-2 alleles, likely do not act by increasing FAT-2 protein levels."
(4) It should be tested how Fe2+ levels are changed in the mutants, and how effective the ferric ammonium citrate treatment is. The authors might use a ftn-1::GFP reporter for this purpose.
We did obtain a strain carrying the ftn-1::GFP reporter but could not generate conclusive data with it. In particular, we saw no increase in fluorescence in fat-2(wa17) worms carrying suppressor mutations. However, we also found that even FAC treatment that rescue the fat2(wa17) mutant did not result in a measurable increased GFP levels suggesting that the reporter is not sensitive enough.
Minor comments
(1) I think that putting Figure 6A in Figure 5 would be helpful for the readers, so that they understand that the mutations converge in the same pathway.
This is now done.
(2) Page 3: While it is clear that paqr-2 regulates lipid composition, I believe that it remains unclear if it "promote the production and incorporation of PUFAs into phospholipids to restore membrane homeostasis".
A reference was missing to support that statement. Ruiz et al. (2023) is now cited for this (ref. 7).
(3) C. elegans is extremely rich in EPA (see for example DOI: 10.3390/jcm5020019), but the lipidomics data in this study rather suggest that oleic acid is predominant. I recommend to check why this discrepancy occurs.
OA (18:1n9) makes up only ~2%, but vaccenic acid (18:1n7) is ~21% in WT worms, EPA is slightly less at ~19% (Watts et al. 2002). These match with our lipidomics results although we cannot distinguish between 18:1n9 and n7. See also answer to Reviewer #1, comment 1.
(4) Abstract: The authors write that mammals do not synthesize PUFAs, which is almost correct, but they still produce the PUFA mead acid. Thus, the statement is not completely right.
Didn't know that! From literature, it is our understanding that mammals synthesize mead acid during FA deficiency but not in normal conditions, so they are not regularly producing mead acid. We have now updated the introduction:
"An exception to this exists during severe essential fatty acid deficiency when mammals can synthesize mead acid (20:3n9), though this is not a common occurrence [11]"
(5) Page 10: Eicosanoids are C20 lipid mediators, thus those produced from docosahexaenoic acid are not eicosanoids. Correct the statement.
We thank the reviewer for pointing this out. We now write:
" EPA and DHA, being long chain PUFAs should have similar fluidizing effects on membrane properties (though in vitro experiments challenge this view [78]), and both can serve as precursors of eicosanoids or docosanoids, particularly inflammatory ones [79]."
(6) Page 7: "hif-1(et69) is similarly able to suppress fat-2(wa17) when ftn-2 is knocked out" I am not sure that the data agrees with this statement, and it is unclear what we can conclude from such observation.
Fig. 2D shows that ftn-2(et68) suppresses fat-2(wa17) even in the presence of a hif-1(ok2654) null allele, showing that no HIF-1 function is required once ftn-2 is mutated. Conversely, Fig S2E shows that combining both the hif-1(et69) and the ftn-2(ok404) null allele also suppresses fat-2(wa17) (the worms do not fully reach N2 length, but they are significantly longer and were fertile adults); this is merely the expected outcome if the pathway converges on loss of ftn-2 function, though other interpretations could be possible from this experiment alone.
(7) S3 Fig: in panel B, is the last column ftn-2;egl-9 mutant? I would imagine that it is ftn2;fat-2.
We thank the reviewer for pointing this out. This has been corrected.
(8) Fig 6B, how many times has been this experiment done?
With these exact conditions (6h and 20h hypoxia) and order of strains the blot was done once, but the blot overall was done 5 times. We now added another replicate in Fig. S3A.
Note also that a few minor modifications have been made throughout the text, which can be seen in the Word file with tracked changes.
Author Response
The following is the authors’ response to the original reviews.
eLife assessment:
This important study represents a comprehensive computational analysis of Plasmodium falciparum gene expression, with a focus on var gene expression, in parasites isolated from patients; it assesses changes that occur as the parasites adapt to short-term in vitro culture conditions. The work provides technical advances to update a previously developed computational pipeline. Although the findings of the shifts in the expression of particular var genes have theoretical or practical implications beyond a single subfield, the results are incomplete and the main claims are only partially supported.
The authors would like to thank the reviewers and editors for their insightful and constructive assessment. We particularly appreciate the statement that our work provides a technical advance of our computational pipeline given that this was one of our main aims. To address the editorial criticisms, we have rephrased and restructured the manuscript to ensure clarity of results and to support our main claims. For the same reason, we removed the var transcript differential expression analysis, as this led to confusion.
Public Reviews:
Reviewer #1:
The authors took advantage of a large dataset of transcriptomic information obtained from parasites recovered from 35 patients. In addition, parasites from 13 of these patients were reared for 1 generation in vivo, 10 for 2 generations, and 1 for a third generation. This provided the authors with a remarkable resource for monitoring how parasites initially adapt to the environmental change of being grown in culture. They focused initially on var gene expression due to the importance of this gene family for parasite virulence, then subsequently assessed changes in the entire transcriptome. Their goal was to develop a more accurate and informative computational pipeline for assessing var gene expression and secondly, to document the adaptation process at the whole transcriptome level.
Overall, the authors were largely successful in their aims. They provide convincing evidence that their new computational pipeline is better able to assemble var transcripts and assess the structure of the encoded PfEMP1s. They can also assess var gene switching as a tool for examining antigenic variation. They also documented potentially important changes in the overall transcriptome that will be important for researchers who employ ex vivo samples for assessing things like drug sensitivity profiles or metabolic states. These are likely to be important tools and insights for researchers working on field samples.
One concern is that the abstract highlights "Unpredictable var gene switching..." and states that "Our results cast doubt on the validity of the common practice of using short-term cultured parasites...". This seems somewhat overly pessimistic with regard to var gene expression profiling and does not reflect the data described in the paper. In contrast, the main text of the paper repeatedly refers to "modest changes in var gene expression repertoire upon culture" or "relatively small changes in var expression from ex vivo to culture", and many additional similar assessments. On balance, it seems that transition to culture conditions causes relatively minor changes in var gene expression, at least in the initial generations. The authors do highlight that a few individuals in their analysis showed more pronounced and unpredictable changes, which certainly warrants caution for future studies but should not obscure the interesting observation that var gene expression remained relatively stable during transition to culture.
Thank you for this comment. We were happy to modify the wording in the abstract to have consistency with the results presented by highlighting that modest but unpredictable var gene switching was observed while substantial changes were found in the core transcriptome. Moreover, any differences observed in core transcriptome between ex vivo samples from naïve and pre-exposed patients are diminished after one cycle of cultivation making inferences about parasite biology in vivo impossible.
Therefore, – to our opinion – the statement in the last sentence is well supported by the data presented.
Line 43–47: “Modest but unpredictable var gene switching and convergence towards var2csa were observed in culture, along with differential expression of 19% of the core transcriptome between paired ex vivo and generation 1 samples. Our results cast doubt on the validity of the common practice of using short-term cultured parasites to make inferences about in vivo phenotype and behaviour.” Nevertheless, we would like to note that this study was in a unique position to assess changes at the individual patient level as we had successive parasite generations. This comparison is not done in most cross-sectional studies and therefore these small, unpredictable changes in the var transcriptome are missed.
Reviewer #2:
In this study, the authors describe a pipeline to sequence expressed var genes from RNA sequencing that improves on a previous one that they had developed. Importantly, they use this approach to determine how var gene expression changes with short-term culture. Their finding of shifts in the expression of particular var genes is compelling and casts some doubt on the comparability of gene expression in short-term culture versus var expression at the time of participant sampling. The authors appear to overstate the novelty of their pipeline, which should be better situated within the context of existing pipelines described in the literature.
Other studies have relied on short-term culture to understand var gene expression in clinical malaria studies. This study indicates the need for caution in over-interpreting findings from these studies.
The novel method of var gene assembly described by the authors needs to be appropriately situated within the context of previous studies. They neglect to mention several recent studies that present transcript-level novel assembly of var genes from clinical samples. It is important for them to situate their work within this context and compare and contrast it accordingly. A table comparing all existing methods in terms of pros and cons would be helpful to evaluate their method.
We are grateful for this suggestion and agree that a table comparing the pros and cons of all existing methods would be helpful for the general reader and also highlight the key advantages of our new approach. A table comparing previous methods for var gene and transcript characterisation has been added to the manuscript and is referenced in the introduction (line 107).
Author response table 1.
Comparison of previous var assembly approaches based on DNA- and RNA-sequencing.
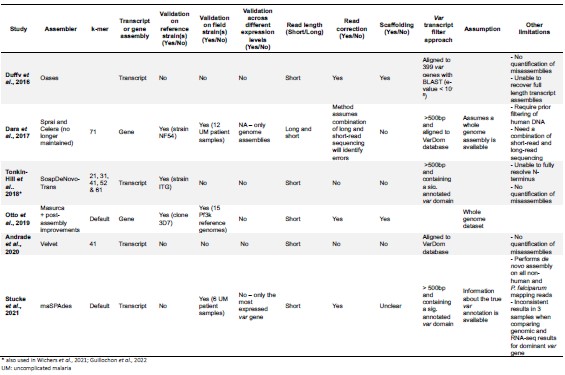
Reviewer #3:
This work focuses on the important problem of how to access the highly polymorphic var gene family using short-read sequence data. The approach that was most successful, and utilized for all subsequent analyses, employed a different assembler from their prior pipeline, and impressively, more than doubles the N50 metric.
The authors then endeavor to utilize these improved assemblies to assess differential RNA expression of ex vivo and short-term cultured samples, and conclude that their results "cast doubt on the validity" of using short-term cultured parasites to infer in vivo characteristics. Readers should be aware that the various approaches to assess differential expression lack statistical clarity and appear to be contradictory. Unfortunately, there is no attempt to describe the rationale for the different approaches and how they might inform one another.
It is unclear whether adjusting for life-cycle stage as reported is appropriate for the var-only expression models. The methods do not appear to describe what type of correction variable (continuous/categorical) was used in each model, and there is no discussion of the impact on var vs. core transcriptome results.
We agree with the reviewer that the different methods and results of the var transcriptome analysis can be difficult to reconcile. To address this, we have included a summary table with a brief description of the rationale and results of each approach in our analysis pipeline.
Author response table 2.
Summary of the different levels of analysis performed to assess the effect of short-term parasite culturing on var and core gene expression, their rational, method, results, and interpretation.
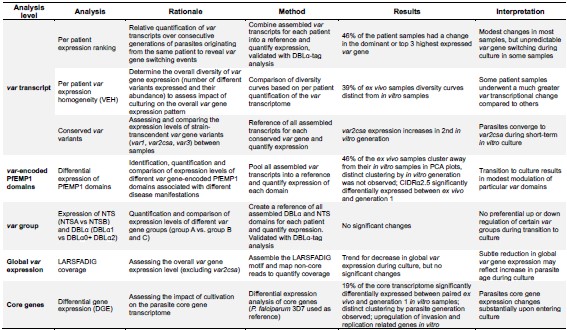
Additionally, the var transcript differential expression analysis was removed from the manuscript, because this study was in a unique position to perform a more focused analysis of var transcriptional changes across paired samples, meaning the per-patient approach was more suitable. This allowed for changes in the var transcriptome to be identified that would have gone unnoticed in the traditional differential expression analysis.
We thank the reviewer for his highly important comment about adjusting for life cycle stage. Var gene expression is highly stage-dependent, so any quantitative comparison between samples does need adjustment for developmental stage. All life cycle stage adjustments were done using the mixture model proportions to be consistent with the original paper, described in the results and methods sections:
Line 219–221: “Due to the potential confounding effect of differences in stage distribution on gene expression, we adjusted for developmental stage determined by the mixture model in all subsequent analyses.”
Line 722–725: “Var gene expression is highly stage dependent, so any quantitative comparison between samples needs adjustment for developmental stage. The life cycle stage proportions determined from the mixture model approach were used for adjustment.“
The rank-expression analysis did not have adjustment for life cycle stage as the values were determined as a percentage contribution to the total var transcriptome. The var group level and the global var gene expression analyses were adjusted for life cycle stages, by including them as an independent variable, as described in the results and methods sections.
Var group expression:
Line 321–326: “Due to these results, the expression of group A var genes vs. group B and C var genes was investigated using a paired analysis on all the DBLα (DBLα1 vs DBLα0 and DBLα2) and NTS (NTSA vs NTSB) sequences assembled from ex vivo samples and across multiple generations in culture. A linear model was created with group A expression as the response variable, the generation and life cycle stage as independent variables and the patient information included as a random effect. The same was performed using group B and C expression levels.“
Line 784–787: “DESeq2 normalisation was performed, with patient identity and life cycle stage proportions included as covariates and differences in the amounts of var transcripts of group A compared with groups B and C assessed (Love et al., 2014). A similar approach was repeated for NTS domains.”
Gobal var gene expression:
Line 342–347: “A linear model was created (using only paired samples from ex vivo and generation 1) (Supplementary file 1) with proportion of total gene expression dedicated to var gene expression as the response variable, the generation and life cycle stage as independent variables and the patient information included as a random effect. This model showed no significant differences between generations, suggesting that differences observed in the raw data may be a consequence of small changes in developmental stage distribution in culture.”
Line 804–806: “Significant differences in total var gene expression were tested by constructing a linear model with the proportion of gene expression dedicated to var gene expression as the response variable, the generation and life cycle stage as an independent variables and the patient identity included as a random effect.“
The analysis of the conserved var gene expression was adjusted for life cycle stage:
And life cycle stage estimates were included as covariates in the design matrix for the domain differential expression analysis:
Reviewer #1:
- In the legend to Figure 1, the authors cite "Deitsch and Hviid, 2004" for the classification of different var gene types. This is not the best reference for this work. Better citations would be Kraemer and Smith, Mol Micro, 2003 and Lavstsen et al, Malaria J, 2003.
We agree and have updated the legend in Figure 1 with these references, consistent with the references cited in the introduction.
- In Figures 2 and 3, each of the boxes in the flow charts are largely filled with empty space while the text is nearly too small to read. Adjusting the size of the text would improve legibility.
We have increased the size of the text in these figures.
- My understanding of the computational method for assessing global var gene expression indicates an initial step of identifying reads containing the amino acid sequence LARSFADIG. It is worth noting that VAR2CSA does not contain this motif. Will the pipeline therefore miss expression of this gene, and if so, how does this affect the assessment of global var gene assessment? This seems relevant given that the authors detect increased expression of var2csa during adaptation to culture.
To address this question, we have added an explanation in the methods section to better explain our analysis. Var2csa was not captured in the global var gene expression analysis, but was analyzed separately because of its unique properties (conservation, proposed role in regulating var gene switching, slightly divergent timing of expression, translational repression).
- In Figures 4 and 7, panels a and b display virtually identical PCA plots, with the exception that panel A displays more generations. Why are both panels included? There doesn't appear to be any additional information provided by panel B.
We agree and have removed Figure 7b for the core transcriptome PCA as it did not provide any new information. The var transcript differential analysis (displayed in Figure 4) has been removed from the manuscript.
- On line 560-567, the authors state "However, the impact of short-term culture was the most apparent at the var transcript level and became less clear at higher levels." What are the high levels being referred to here?
We have replaced this sentence to make it clearer what the different levels are (global var gene expression, var domain and var type).
Reviewer #2:
The authors make no mention or assessment of previously published var gene assembly methods from clinical samples that focus on genomic or transcriptomic approaches. These include:
https://pubmed.ncbi.nlm.nih.gov/28351419/
https://pubmed.ncbi.nlm.nih.gov/34846163/
These methods should be compared to the method for var gene assembly outlined by the co-authors, especially as the authors say that their method "overcomes previous limitations and outperforms current methods" (128-129). The second reference above appears to be a method to measure var expression in clinical samples and so should be particularly compared to the approach outlined by the authors.
Thank you for pointing this out. We have included the second reference in the introduction of our revised manuscript, where we refer to var assembly and quantification from RNA-sequencing data. We abstained from including the first paper in this paragraph (Dara et al., 2017) as it describes a var gene assembly pipeline and not a var transcript assembly pipeline.
Additionally, we have updated the manuscript with a table (Table S1) comparing these two methods plus other previously used var transcript/gene assembly approaches (see comment to the public reviews).
But to address this particular comment in more detail, the first paper (Dara et al., 2017) is a var gene assembly pipeline and not a var transcript assembly pipeline. It is based on assembling var exon 1 from unfished whole genome assemblies of clinical samples and requires a prior step for filtering out human DNA. The authors used two different assemblers, Celera for short reads (which is no longer maintained) and Sprai for long reads (>2000bp), but found that Celera performed worse than Sprai, and subsequently used Sprai assemblies. Therefore, this method does not appear to be suitable for assembling short reads from RNA-seq.
The second paper (Stucke et al. 2021) focusses more on enriching for parasite RNA, which precedes assembly. The capture method they describe would complement downstream analysis of var transcript assembly with our pipeline. Their assembly pipeline is similar to our pipeline as they also performed de novo assembly on all P. falciparum mapping and non-human mapping reads and used the same assembler (but with different parameters). They clustered sequences using the same approach but at 90% sequence identity as opposed to 99% sequence identity using our approach. Then, Stucke et al. use 500nt as a cut-off as opposed to the more stringent filtering approach used in our approach. They annotated their de novo assembled transcripts with the known amino acid sequences used in their design of the capture array; our approach does not assume prior information on the var transcripts. Finally, their approach was validated only for its ability to recover the most highly expressed var transcript in 6 uncomplicated malaria samples, and they did not assess mis-assemblies in their approach.
For the methods (619–621), were erythrocytes isolated by Ficoll gradient centrifugation at the time of collection or later?
We have updated the methods section to clarify this.
Was the current pipeline and assembly method assessed for var chimeras? This should be described.
Yes, this was quantified in the Pf 3D7 dataset and also assessed in the German traveler dataset. For the 3D7 dataset it is described in the result section and Figure S1.
Author response image 1.
Performance of novel computational pipelines for var assembly on Plasmodium falciparum 3D7: The three approaches (whole transcript: blue, domain approach: orange, original approach: green) were applied to a public RNA-seq dataset (ENA: PRJEB31535) of the intra-erythrocytic life cycle stages of 3 biological replicates of cultured P. falciparum 3D7, sampled at 8-hour intervals up until 40hrs post infection (bpi) and then at 4-hour intervals up until 48 (Wichers al., 2019). Boxplots show the data from the 3 biological replicates for each time point in the intra-erythrocytic life cycle: a) alignment scores for the dominantly expressed var gene (PF3D7_07126m), b) accuracy scores for the dominantly var gene (PF3D7_0712600), c) number of contigs to assemble the dominant var gene (PF3D7_0712600), d) alignment scores for a middle ranking expressed vargene (PF3D7_0937800), e) alignment scores for the lowest expressed var gene (PF3D7_0200100). The first best blast hit (significance threshold = le-10) was chosen for each contig. The alignment score was used to evaluate the each method. The alignment score represents √accuracy* recovery. The accuracy is the proportion of bases that are correct in the assembled transcript and the recovery reflects what proportion of the true transcript was assembled. Assembly completeness of the dominant vargene (PF3D7 071200, length = 6648nt) for the three approaches was assessed for each biological f) biological replicate 1, g) biological replicate 2, h) biological replicate 3. Dotted lines represent the start and end of the contigs required to assemble the vargene. Red bars represent assembled sequences relative to the dominantly whole vargene sequence, where we know the true sequence (termed “reference transcript”).
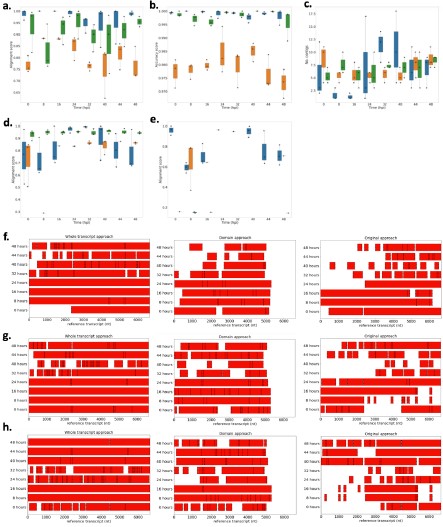
For the ex vivo samples, this has been discussed in the result section and now we also added this information to Table 1.
Line 182/3: “Remarkably, with the new whole transcript method, we observed a significant decrease (2 vs 336) in clearly misassembled transcripts with, for example, an N-terminal domain at an internal position.”
Table 1:
Author response table 3.
Statistics for the different approaches used to assemble the var transcripts. Var assembly approaches were applied to malaria patient ex vivo samples (n=32) from (Wichers et al., 2021) and statistics determined. Given are the total number of assembled var transcripts longer than 500 nt containing at least one significantly annotated var domain, the maximum length of the longest assembled var transcript in nucleotides and the N50 value, respectively. The N50 is defined as the sequence length of the shortest var contig, with all var contigs greater than or equal to this length together accounting for 50% of the total length of concatenated var transcript assemblies. Misassemblies represents the number of misassemblies for each approach. **Number of misassemblies were not determined for the domain approach due to its poor performance in other metrics.
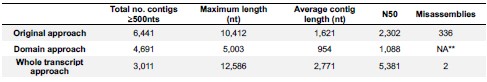
Line 432: "the core gene transcriptome underwent a greater change relative to the var transcriptome upon transition to culture." Can this be shown statistically? It's unclear whether the difference in the sizes of the respective pools of the core genome and the var genes may account for this observation.
We found 19% of the core transcriptome to be differentially expressed. The per patient var transcript analysis revealed individually highly variable but generally rather subtle changes in the var transcriptome. The different methods for assessing this make it difficult to statistically compare these two different results.
The feasibility of this approach for field samples should be discussed in the Discussion.
In the original manuscript we reflected on this already several times in the discussion (e.g., line 465/6; line 471–475; line 555–568). We now have added another two sentences at the end of the paragraph starting in line 449 to address this point. It reads now:
MINOR
The plural form of PfEMP1 (PfEMP1s) is inconsistently used throughout the text.
Corrected.
404-405: statistical test for significance?
Thank you for this suggestion. We have done two comparisons between the original analysis from Wichers et al., 2021 and our new whole transcript approach to test concordance of the RNAseq approaches with the DBLα-tag approach using paired Wilcoxon tests. These comparisons suggest that our new approach has significantly increased concordance with DBLα-tag data and might be better at capturing all expressed DBLα domains than the original analysis (and the DBLα-approach), although not statistically significant. We describe this now in the result section.
Figure 4: The letters for the figure panels need to be added.
The figure has been removed from the manuscript.
Reviewer #3:
It is difficult from Table S2 to determine how many unique var transcripts would have enough coverage to be potentially assembled from each sample. It seems unlikely that 455 distinct vars (~14 per sample) would be expressed at a detectable level for assembly. Why not DNA-sequence these samples to get the full repertoire for comparison to RNA? Why would so many distinct transcripts be yielded from fairly synchronous samples?
We know from controlled human malaria infections of malaria-naive volunteers, that most var genes present in the genomic repertoire of the parasite strain are expressed at the onset of the human blood phase (heterogenous var gene expression) (Wang et al., 2009; Bachmann et al, 2016; Wichers-Misterek et al., 2023). This pattern shifts to a more restricted, homogeneous var expression pattern in semi-immune individuals (expression of few variants) depending on the degree of immunity (Bachmann et al., 2019).
Author response image 2.
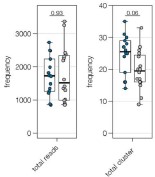
In this cohort, 15 first-time infections are included, which should also possess a more heterogenous var gene expression in comparison to the pre-exposed individuals, and indeed such a trend is already seen in the number of different DBLa-tag clusters found in both patient groups (see figure panel from Wichers et al. 2021: blue-first-time infections; grey–pre-exposed). Moreover, Warimwe et al. 2013 have shown that asymptomatic infections have a more homogeneous var expression in comparison to symptomatic infections. Therefore, we expect that parasites from symptomatic infections have a heterogenous var expression pattern with multiple var gene variants expressed, which we could assemble due to our high read depth and our improved var assembly pipeline for even low expressed variants.
Moreover, the distinct transcripts found in the RNA-seq approach were confirmed with the DBLα tag data. To our opinion, previous approaches may have underestimated the complexity of the var transcriptome in less immune individuals.
Mapping reads to these 455 putative transcripts and using this count matrix for differential expression analysis seems very unlikely to produce reliable results. As acknowledged on line 327, many reads will be mis-mapped, and perhaps most challenging is that most vars will not be represented in most samples. In other words, even if mapping were somehow perfect, one would expect a sparse matrix that would not be suitable for statistical comparisons between groups. This is likely why the per-patient transcript analysis doesn't appear to be consistent. I would recommend the authors remove the DE sections utilizing this approach, or add convincing evidence that the count matrix is useable.
We agree that this is a general issue of var differential expression analysis. Therefore, we have removed the var differential expression analysis from this manuscript as the per patient approach was more appropriate for the paired samples. We validated different mapping strategies (new Figure S6) and included a paragraph discussing the problem in the result section:
Author response image 3.
Var expression profiles across different mapping. Different mapping approaches Were used to quantify the Var expression profiles of each sample (ex Vivo (n=13), generation I (n=13), generation 2 (n=10) and generation 3 (n=l). The pooled sample approach in Which all significantly assembled van transcripts (1500nt and containing3 significantly annotated var domains) across samples were combined into a reference and redundancy was removed using cd-hit (at sequence identity = 99%) (a—c). The non-core reads of each sample were mapped to this pooled reference using a) Salmon, b) bowtie2 filtering for uniquely mapping paired reads with MAPQ and c) bowtie2 filtering for uniquely mapping paired reads with a MAPQ > 20. d) The per patient approach was applied. For each patient, the paired ex vivo and in vitro samples were analysed. The assembled var transcripts (at least 1500nt and containing3 significantly annotated var domains) across all the generations for a patient were combined into a reference, redundancy was removed using cd-hit (at sequence identity: 99%), and expression was quantified using Salmon. Pie charts show the var expression profile With the relative size of each slice representing the relative percentage of total var gene expression of each var transcript. Different colours represent different assembled var transcripts with the same colour code used across a-d.
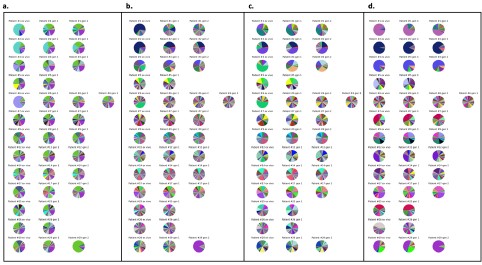
For future cross-sectional studies a per patient analysis that attempts to group per patient assemblies on some unifying structure (e.g., domain, homology blocks, domain cassettes etc) should be performed.
Line 304. I don't understand the rationale for comparing naïve vs. prior-exposed individuals at ex-vivo and gen 1 timepoints to provide insights into how reliable cultured parasites are as a surrogate for var expression in vivo. Further, the next section (per patient) appears to confirm the significant limitation of the 'all sample analysis' approach. The conclusion on line 319 is not supported by the results reported in figures S9a and S9b, nor is the bold conclusion in the abstract about "casting doubt" on experiments utilizing culture adapted
We have removed this comparison from the manuscript due to the inconsistencies with the var per patient approach. However, the conclusion in the abstract has been rephrased to reflect the fact we observed 19% of the core transcript differentially expressed within one cycle of cultivation.
Line 372/391 (and for the other LMM descriptions). I believe you mean to say response variable, rather than explanatory variable. Explanatory variables are on the right hand side of the equation.
Thank you for spotting this inaccuracy, we changed it to “response variable” (line 324, line 343, line 805).
Line 467. Similar to line 304, why would comparisons of naïve vs. prior-exposed be informative about surrogates for in vivo studies? Without a gold-standard for what should be differentially expressed between naïve and prior-exposed in vivo, it doesn't seem prudent to interpret a drop in the number of DE genes for this comparison in generation 1 as evidence that biological signal for this comparison is lost. What if the generation 1 result is actually more reflective of the true difference in vivo, but the ex vivo samples are just noisy? How do we know? Why not just compare ex vivo vs generation 1/2 directly (as done in the first DE analysis), and then you can comment on the large number of changes as samples are less and less proximal to in vivo?
In the original paper (Wichers et al., 2021), there were differences between the core transcriptome of naïve vs previously exposed patients. However, these differences appeared to diminish in vitro, suggesting the in vivo core transcriptome is not fully maintained in vitro.
We have added a sentence explaining the reasoning behind this analysis in the results section:
Overall, I found the many DE approaches very frustrating to interpret coherently. If not dropped in revision, the reader would benefit from a substantial effort to clarify the rationale for each approach, and how each result fits together with the other approaches and builds to a concise conclusion.
We agree that the manuscript contains many different complex layers of analysis and that it is therefore important to explain the rationale for each approach. Therefore, we now included the summary Table 3 (see comment to public review). Additionally, we have removed the var transcript differential expression due to its limitations, which we hope has already streamlined our manuscript.
Author response:
The following is the authors’ response to the current reviews.
Public Reviews:
Reviewer #1 (Public Review):
This article by Navratna et al. reports the first structure of human HGSNAT in an acetyl-CoA-bound state. Through careful structural analysis, the authors propose potential reasons why certain human mutations lead to lysosomal storage disorders and outline a catalytic mechanism. The structural data are of good quality, and the manuscript is clearly written. This study represents an important step toward understanding the mechanism of HGSNAT and is valuable to the field. I have the following suggestions:
(1) The authors should characterize whether the purified protein is active. Otherwise, how does one know if the detergent used maintains the protein in a biologically relevant state? The authors should at least attempt to do so. If these prove to be challenging, at the very least, the authors should try a cell-based assay to demonstrate that the GFP tag does not interfere with the function.
We have addressed these concerns in the revised version and mentioned these efforts in our previous response letter. We’re briefly mentioning them here again. We attempted measuring HGSNAT catalyzed reaction by monitoring the decrease in acetyl-CoA in the presence of D-glucosamine (acetyl group acceptor) using a coupled enzyme acetyl-CoA assay kit from SIGMA (MAK039) that converts acetyl-CoA to a fluorescent product measurable at Ex/Em of 535/587 nm. We noticed a decrease in the level of acetyl-CoA (gray) upon the addition of HGSNAT (red) (Rebuttal figure 1).
Author response image 1.
Acetyl-CoA levels in absence and presence of HGSNAT purified in digitonin. Decrease in the levels of 10 M acetyl-CoA was measured in presence of 10 M D-glucosamine and 30 nM HGSNAT at pH 7.5.
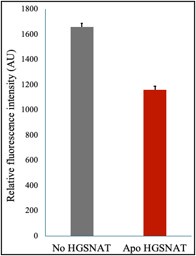
While optimizing the assay, Xu et al. (2024, Nat Struct Mol Biol) published structural and biochemical characterization of HGSNAT, showing that detergent-purified HGSNAT is active. In addition, we have shown by cryo-EM that GFP-tagged HGSNAT that we purified in detergent was already bound to the endogenous substrate ACO, an observation that has been observed by Xu et al., as well. Finally, we performed LC-MS on GFP-tagged HGSNAT purified in detergent to detect bound ACO, which could be further removed by dialysis. These results have been included in Figure S9. The endogenous binding of ACO to HGSNAT in detergent suggests that neither the tag nor detergent are detrimental to the function.
(2) In Figure 5, the authors present a detailed schematic of the catalytic cycle, which I find to be too speculative. There is no evidence to suggest that this enzyme undergoes isomerization, similar to a transporter, between open-to-lumen and open-to-cytosol states. Could it not simply involve some movements of side chains to complete the acetyl transfer?
We have already changed this figure in our latest submission. Perhaps the changes made were not obvious while reviewing. We agreed with this reviewer that the enzyme could likely achieve catalysis by simple side chain movements without undergoing extensive isomerization steps, as depicted in Figure 5. In the absence of data supporting large movements during the acetyl transfer reaction, old Figure 5 appeared speculative. Hence, we have edited Figure 5 in the revised version of the manuscript based on the observations we made in this study, and different states shown in the figure do not show any conformational changes and only depict acetyl transfer.
Reviewer #2 (Public Review):
Summary:
This work describes the structure of Heparan-alpha-glucosaminide N-acetyltransferase (HGSNAT), a lysosomal membrane protein that catalyzes the acetylation reaction of the terminal alpha-D-glucosamine group required for degradation of heparan sulfate (HS). HS degradation takes place during the degradation of the extracellular matrix, a process required for restructuring tissue architecture, regulation of cellular function and differentiation. During this process, HS is degraded into monosaccharides and free sulfate in lysosomes.
HGSNAT catalyzes the transfer of the acetyl group from acetyl-CoA to the terminal non-reducing amino group of alpha-D-glucosamine. The molecular mechanism by which this process occur has not been described so far. One of the main reasons to study the mechanism of HGSNAT is that multiple mutations spanning the entire sequence of the protein, such as, nonsense mutations, splice-site variants, and missense mutations lead to dysfunction that causes abnormal accumulation of HS within the lysosomes. This accumulation is a cause of mucopolysaccharidosis IIIC (MPS IIIC), an autosomal recessive neurodegenerative lysosomal storage disorder, for which there are no approved drugs or treatment strategies.
This paper provides a 3.26A structure of HGSNAT, determined by single-particle cryo-EM. The structure reveals that HGSNAT is a dimer in detergent micelles, and a density assigned to acetyl-CoA. The authors speculate about the molecular mechanism of the acetylation reaction, map the mutations known to cause MPS IIIC on the structure and speculate about the nature of the HGSNAT disfunction caused by such mutations.
Strengths:
The paper describes a structure of HGSNAT a member of the transmembrane acyl transferase (TmAT) superfamily. The high-resolution of a HGSNAT bound to acetyl-CoA is important for our understanding of HGSNAT mechanism. The density map is of high-quality, except for the luminal domain. The location of the acetyl-CoA allows speculation about the mechanistic role of multiple residues surrounding this molecule. The authors thoroughly describe the architecture of HGSNAT and map the mutations leading to MPS IIIC.
Reviewer #3 (Public Review):
Summary:
Navratna et al. have solved the first structure of a transmembrane N-acetyltransferase (TNAT), resolving the architecture of human heparan-alpha-glucosaminide N-acetyltransferase (HGSNAT) in the acetyl-CoA bound state using single particle cryo-electron microscopy (cryoEM). They show that the protein is a dimer, and define the architecture of the alpha- and beta-GSNAT fragments, as well as convincingly characterizing the binding site of acetyl-CoA.
Strengths:
This is the first structure of any member of the transmembrane acyl transferase superfamily, and as such it provides important insights into the architecture and acetyl-CoA binding site of this class of enzymes.
The structural data is of a high quality, with an isotropic cryoEM density map at 3.3Å facilitating building of a high-confidence atomic model. Importantly, the density for the acetyl-CoA ligand is particularly well-defined, as are the contacting residues within the transmembrane domain.
The structure of HSGNAT presented here will undoubtedly lay the groundwork for future structural and functional characterization of the reaction cycle of this class of enzymes.
Weaknesses:
While the structural data for the state presented in this work is very convincing, and clearly defines the binding site of acetyl-CoA, to get a complete picture of the enzymatic mechanism of this family, additional structures of other states will be required.
A weakness of the study is the lack of functional validation. The enzymatic activity of the enzyme characterized was not measured, and the enzyme lacks native proteolytic processing, so it is a little unclear whether the structure represents an active enzyme.
Recommendations for the authors:
Reviewer #3 (Recommendations For The Authors):
In the response to reviewers, the authors mention revised coordinates, but the revised coordinates provided to this reviewer do not reflect the stated changes (I assume a technical error somewhere)
Perhaps, the old coordinates in the deposition system were resubmitted with the revised draft. Nevertheless, we have made the changes suggested by this reviewer to structure in the previous round and have released the new coordinates (PDB ID: 8TU9).
Is there any evidence for the interprotomer disulfide except for the map? e.g. if it is a disulfide-linked dimer, one should see a shift in mobility on non-reducing vs reducing SDS-PAGE. Without this, the evidence from the map is not conclusive - while the symmetry-related cysteines are nearby to one another, based on the map I could argue that they could just as well be modeled with the cys sidechains reduced and pointing away from one another.
In addition to building the density based on cryo-EM maps, we have performed FSEC-based thermal melt analysis of the Ala mutation of C334 that is involved in disulfide at the dimer interface. C334A is still expressed as a dimer, suggesting that C334A is not the only residue stabilizing the dimer. Upon heating the detergent-solubilized protein, we noticed that the FSEC peak for C334A shows a monomeric HGSNAT (Figure 4-Figure supplement 1 in main manuscript). We hypothesize that in the absence of C334 disulfide, the extensive hydrophobic side-chain interaction network displayed in Figure 2C is responsible for maintaining the integrity of the dimer. Heating disturbs these non-disulfide interactions, thereby rendering the protein monomer. We have also performed PAGE analysis as suggested by this reviewer and noticed that reducing conditions result in a monomeric protein band (Rebuttal figure 2). While we were revising this manuscript, two other groups published structures of HGSNAT (Xu et al., 2024, Nat. Struct Mol Biol, and Zhao et al., 2024, Nat. Comm). These groups have also identified this disulfide at the dimer interface in their HGSNAT structures. Zhao et al. showed that this disulfide is not crucial for dimerization and also suggested that it can break depending on the conformation of HGSNAT. Our FSEC results agree with this observation.
Author response image 2.
Comparison of purified HGSNAT on native and reducing SDS-PAGE. The arrows on both the gels indicate N-GFP-HGSNAT. The two bands on the SDS PAGE are, perhaps, two differentially glycosylated forms of HGSNAT.
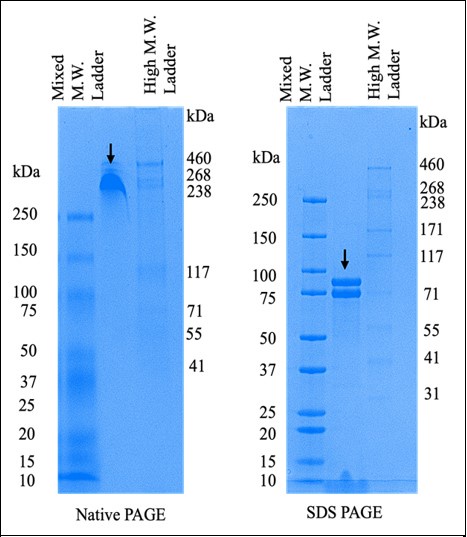
The following is the authors’ response to the original reviews.
(1) The authors should characterize whether the purified protein is active. Otherwise, how does one know if the detergent used maintains the protein in a biologically relevant state? The authors should at least attempt to do so. If these prove to be challenging, at the very least, the authors should try a cell-based assay to demonstrate that the GFP tag does not interfere with the function. The authors would need to establish an in vitro assay using purified protein and assess the level of Acetyl-CoA in the reaction (there are commercial kits and a long list of literature showing how to measure this). They could also follow the HS acetylation reaction by e.g. HPLC-MS or NMR (among other methods).
The cryo-EM sample was prepared without the exogenous addition of ligand, as noted in the manuscript. However, we see that acetyl-CoA was intrinsically bound to the protein, indicating the ability of GFP-tagged HGSNAT protein to bind the ligand. Upon dialysis, we see release of acetyl-CoA from the protein, which we have confirmed by LC-MS analysis (Fig S9). We purified the protein at a pH optimal for acetyl-CoA binding, as suggested by Bame, K. J. and Rome, L. H. (1985) and Meikle, P. J. et al., (1995). Because we see acetyl-CoA in a structure obtained using a GFP fusion, we argue that GFP does not interfere with protein stability and ability to bind to the co-substrate. As demonstrated by existing literature HGSNAT catalyzed reaction is compartmentalized spatially and conditionally. The binding of acetyl-CoA happens towards the cytosol and is optimal at pH 7-0.8.0, while the transfer of the acetyl group to heparan sulfate occurs towards the luminal side and is optimal at pH 5.0-6.0. We attempted measuring HGSNAT catalyzed reaction by monitoring decrease in acetyl-CoA in presence of D-glucosamine (acetyl group acceptor) using a coupled enzyme acetyl-CoA assay kit from SIGMA (MAK039) that converts acetyl-CoA to a fluorescent product measurable at Ex/Em of 535/587 nm. We noticed a decrease in the level of acetyl-CoA in the presence of HGSNAT-ACO complex (blue) and apo HGSNAT (red); the difference compared to the ACO standard (gray) was not significant. While optimizing the assay, Xu et al. (2024, Nat Struct Mol Biol) published structural and biochemical characterization of HGSNAT, showing that detergent-purified HGSNAT is active.
Author response image 3.
Acetyl-CoA levels in absence and presence of HGSNAT purified in digitonin. Decrease in the levels of 10 mM acetyl-CoA was measured in presence of 10 mM D-glucosamine and 30 nM HGSNAT at pH 7.5.
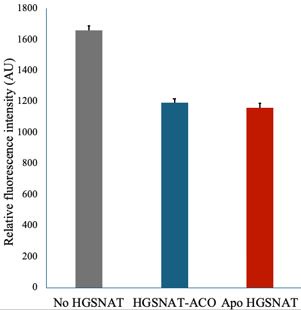
(2) In Figure 5, the authors present a detailed schematic of the catalytic cycle, which I find to be too speculative. There is no evidence to suggest that this enzyme undergoes isomerization, similar to a transporter, between open-to-lumen and open-to-cytosol states. Could it not simply involve some movements of side chains to complete the acetyl transfer? The speculative nature of this assumption needs to be clearly acknowledged throughout the manuscript and discussed in more detail. The authors could use HDX-MS or introduce cysteine residues in the hypothetical inward- and outward-facing cavities and test accessibility by incubating the purified protein with maleimides or other agents reacting with free cysteine.
We thank the reviewers for this insightful critique. Yes, the enzyme could likely achieve catalysis by simple side chain movements without undergoing extensive isomerization steps, as depicted in Figure 5. We also agree with the reviewer that HDX-MS could be the best way to monitor the substrate-induced conformational dynamics within HGSNAT experimentally. In the absence of data supporting large movements during the acetyl transfer reaction, figure 5 is speculative. We have now edited Figure 5 in the revised version of the manuscript based on the observations we made in this study.
(3) The acetyl-CoA-bound state is described as the open-to-lumen state. Indeed, from Figure 1C, the lumen opening appears much larger than the cytosol opening. Is there any small tunnel that connects the substrate site to the cytosol? In other words, is this state accessible to both the lumen and the cytosol, albeit with a larger opening toward the lumen? This question arises because, in Figure S5, the tunnel calculated by MOLE seems to also connect to the cytosol.
Yes, it is likely that the ACOS is accessible via lumen and cytosol to varying degrees, as evidenced by MOLE prediction. However, binding of the bulky nucleoside head group of acetyl-CoA at ACOS blocks the cytosolic entrance in the confirmation discussed in this manuscript. MOLE prediction was performed on a structure devoid of acetyl-CoA, and it is possible that the protein doesn’t essentially undergo isomerization between open-to-lumen and open-to-cytosol confirmations during acetyl transfer. Likely, ACOS is always accessible from both the lumen and cytosol, but depending on the substrates or products bound, the accessibility could be limited to either the lysosomal lumen or cytosol. We have rewritten all the statements mentioning an open-to-lumen confirmation to reflect this argument.
(4) The authors state, "Interestingly, in most of the detergent conditions we tested, HGSNAT was predominantly dimeric (Fig S1C-H)," and also mention, "In all the detergents we tested, HGSNAT eluted as a dimer, a testament to the extensive side-chain interaction network." The dimerization is said to be mediated by a disulfide bond. I would be surprised if the detergents the authors tested could break a disulfide bond. Therefore, can this observation truly serve as a testament to an "extensive" side-chain interaction network?
We agree with the reviewer that detergents are unlikely to break a disulfide bond. To address this comment, we generated a C334A mutant of HGSNAT and extracted it from cells in 1% digitonin. It is still expressed as a dimer (Fig S8E). However, upon heating the detergent solubilized protein, we noticed that the FSEC peak for C334A shows a monomeric HGSNAT (Fig S8I and S8K). We hypothesize that in the absence of C334 disulfide, the extensive hydrophobic side-chain interaction network displayed in Figure 2C is responsible for maintaining the integrity of the dimer. Heating disturbs these non-disulfide interactions, thereby rendering the protein monomer.
(5) Apart from the cryo-EM structure, the article does not provide any other experimental evidence to support or explain a molecular mechanism. Due to the complete absence of functional assays, mutagenesis analysis, or other structures such as a ternary complex or an acetylated enzyme intermediate, the mechanistic model depicted in Figure 5 should be taken with caution. This uncertainty needs to be clearly described in the manuscript text. Performing additional mutagenesis experiments to test key hypotheses, or further discussing relevant data from the literature, would strengthen the manuscript.
We agree with the reviewer on the lack of supporting evidence for the mechanistic models proposed in Fig 5. They were made based on previously reported biochemical characterization of HGSNAT by Rome & Crain (1981), Rome et al. (1983), Miekle et al. (1995), and Fan et al. (2011). However, we agree with the reviewer that this schematic is not experimentally proven and is speculative at best. We have edited Figure 5 in the revised version of the manuscript. In addition, we have also performed mutagenesis analysis to study the stability of mutants (Fig S8) and performed LC-MS analysis to identify endogenously bound acetyl-CoA (Fig S9) to strengthen parts of the manuscript. We have discussed our findings in the results and modified the discussion according to these suggestions.
(6) It is discussed that H269 is an essential residue that participates in the acetylation reaction, possibly becoming acetylated during the process. However, there is no solid experimental evidence, e.g. mutagenesis analysis or structural analysis, in this or previous articles, that demonstrates this to be the case. Providing more information, ideally involving additional experimental work, would strengthen this aspect of the mechanism that is proposed. This would require establishing an in vitro assay, as described in 1).
H269, as a crucial catalytic residue, was suggested by monitoring the effect of chemical modifications of amino acids on acetylation of HGSNAT membranes by Bame, K. J. and Rome, L. H. (1986). We generated N258I and H269A mutants of HGSNAT and analyzed their stability. We noticed a greater destabilization in N258I compared to H269A (Fig S8). We believe this is because of the loss of ability to bind acetyl-CoA, as the TMs around a catalytic core of the protein in our cryo-EM structure were stabilized by interactions with acetyl-CoA. Recently, Xu et al. (2024, Nat Struct Mol Biol) suggested that they do not observe acetylated histidine in their structure. However, our structure and that reported by Xu et al. (2024) are obtained at cytosolic pH. Perhaps, acetylation of H269 occurs at acidic lysosomal pH. Extensive structural and catalytic investigation of HGSNAT at low pH is required to rule out H269 acetylation as a step in the HGSNAT catalyzed reaction.
(7) In the discussion part, the authors mention previous studies in which it was postulated that the catalytic reaction can be described by a random order mechanistic model or a Ping Pong Bi Bi model. However, the authors leave open the question of which of these mechanisms best describes the acetylation reaction. The structure presented here does not provide evidence that could support one mechanism or the other. The authors could explore if an in vitro experimental measurement of protein activity would provide any information in this regard.
We agree with the reviewer that a more detailed kinetic analysis is necessary to define the bisubstrate reaction mechanism of HGSNAT. All the existing structural data on two isoforms of HGSNAT is obtained at basic pH. As a result, the existing structures do not unambiguously demonstrate the bisusbtrate mechanism of HGSNAT. We believe low pH structural characterization and a detailed kinetic and structural characterization of HGSNAT in membrane mimetics like nanodiscs could provide more insights into the mechanism. However, these studies are a future undertaking and are not a part of this manuscript.
(8) Although the authors map the mutations leading to MPS IIIC on the structure and use FoldX software to predict the impact of these mutations on folding and fold stability, there is no experimental evidence to support FoldX's predictions. It would be ideal if an additional test for these predictions were included in the manuscript. The authors could follow the unfolding of purified mutants by SEC, FSEC, or changes in intrinsic fluorescence to assess protein stability.
As suggested here, we prepared HGSNAT MPSIIIC variants and tested their expression and stability (please see Fig S8). These results have been included in the revised version of the manuscript.
(9) Some sidechains that have quite strong sidechain density are missing atoms. I would be particularly careful with omitting sidechains that pack in the hydrophobic core, as this can tend to artificially reduce the clash score. Check F81, L62, P91 and V87, for example.
We have revisited the modeling of these regions and deposited new coordinates.
(10) W316 seems to have the wrong rotamer.
This has been corrected in the new coordinate file that has been released.
(11) N134 and N433 seem to have extra density. Are these known glycosylation sites?
As per Hrebicek M. et al., 2006 and Feldhammer M. et al., 2009, there are five predicted glycosylation sites: N66, N114, N134, N433, and N602. However, we see evidence for NAG density at N114, N134, and N433. These have now been modeled in the structure.
(12) At the C-terminal residue (Ile-635), the very C-terminal carboxylate is modeled pointing to a hydrophobic environment. It seems more likely to me that the Ile sidechain is packing here, with the C-terminal carboxylate facing the solvent.
Thank you for pointing this out. We have edited the orientation of the Ile sidechain accordingly.
Presentation and wording of results/methods:
- Figure S3 legend "At places with missing density, the side chains were trimmed to C- alpha" - this is incorrect, I think the authors mean C-beta.
We have corrected this error in the revised version of the manuscript.
- Figure S3 legend - the authors refer to a gray mesh, where a transparent surface is displayed.
Thanks for pointing this error out. We have corrected this in the revised version.
- Some colloquial/vague wording in the main text (a lot of sentences starting with "Interestingly, ...". Making the wording more specific would help the reader I think.
We have edited out ‘interestingly’ from the document and have re-written parts of the manuscript, per reviewers’ suggestion, for brevity.
- Figure S2 legend, "throughout the processing workflow the resolution of luminal domain was used as a guidepost" - it is not entirely clear to me what this means in this context, perhaps revise the wording?
We have rephrased this line in the revised draft of the manuscript.
- Figure S2 and methods, Local refinements of LD and TMD are mentioned, but not indicated on the processing workflow.
We have included a new Fig S2 & edited the legend, including these changes, per the reviewers’ suggestions.
Author response:
The following is the authors’ response to the original reviews.
Reviewer #1:
I will summarize my comments and suggestions below.
(1) Abstract:
"Non-catalytic (pseudo)kinase signaling mechanisms have been described in metazoans, but information is scarce for plants." To the best of my understanding EFR is an active protein kinase in vitro and in vivo and cannot be considered a pseudokinase. Consider rephrasing.
We rephrased to: “Non-catalytic signaling mechanisms of protein kinase domains have been described in metazoans, but information is scarce for plants.”
(2) Page 4: It should be noted, that while membrane associated Rap-RiD systems have been used in planta to activate receptor kinase intracellular domains by promoting interaction with a co-receptor kinase domain, this system does not resemble the actual activation mechanism in the plasma membrane. This would be worth discussing when introducing the system. For example, the first substrates of the RK signaling complex may also be membrane associated and not freely diffuse in solution, which may be important for enzyme-substrate interaction.
We inserted on page 4: “The RiD system was previously applied in planta, maintaining membrane-association by N-terminal myristoylation (Kim et al., 2021). For the in vitro experiments, the myristoylation sites were excluded to facilitate the production of recombinant protein.”
(3) Page 4 and Fig 1: The catalytic Asp in BRI1 is D1027 and not D1009 (https://pubmed.ncbi.nlm.nih.gov/21289069/). Please check and prepare the correct mutant protein if needed.
We clarified this in the text by stating that we mutated the HRD-aspartate to asparagine in all our catalytic-dead mutants: “Kinase-dead variants with the catalytic residue (HRD-aspartate) replaced by asparagine (EFRD849N and BRI1D1009N), had distinct effects […]”. D1027 in BRI1 is the DFG-Asp, which was not mutated in our study.
(4) Page 4 and Fig 1: Is BIK1 a known component of the BR signaling pathway and a direct BRI1 substrate? Or in other words how specific is the trans-phosphorylation assay? In my opinion, a more suitable substrate for BRI1/BAK1 would be BSK1 or BSK3 (for example https://pubmed.ncbi.nlm.nih.gov/30615605/).
Kinase-dead BIK1 is a reported substrate of BRI1. We clarified this in the results section by inserting: “BIK1 was chosen as it is reported substrate of both, EFR/BAK1 and BRI1/BAK1 complexes (Lin et al., 2013).”
(5) Fig. 1B Why is BIK1 D202N partially phosphorylated in the absence of Rap? I would suggest to add control lanes showing BRI1, EFR, FLS2, BAK1 and BIK1 in isolation. Given that a nice in vitro activation system with purified components is available, why not compare the different enzyme kinetics rather than band intensities at only 1 enzyme : substrate ratio?
BIK1 D202N is partially phosphorylated due to the presence of active BAK1 that is capable of transphosphorylating BIK1 D202N as it has been reported in a previous study: (DOI: 10.1038/s41586-018-0471-x).
(6) Page 4 and Fig 1: Is the kinase dead variant of EFR indeed kinase dead? I could still see a decent autorad signal for this mutant when expressed in E. coli (Fig 1 A in Bender et al., 2021; https://pubmed.ncbi.nlm.nih.gov/34531323/)? If this mutant is not completely inactive, could this change the interpretation of the experiments performed with the mutant protein in vitro and in planta in the current manuscript? In my opinion, it could be possible that a partially active EFR mutant can be further activated by BAK1, and in turn can phosphorylate BIK1 D202N. The differences in autorad signal for BRI1D1009?N and EFRD849N is very small, and the entire mechanism hinges on this difference.
We would like to emphasize that the mechanism hinges on the difference between non-dimerized and dimerized kinase domains in the in vitro kinase assay. BRI1 D1009N fails to enhance BIK1 D202N trans-phosphorylation compared to the non-dimerized sample, while EFR D849N is still capable of enhancing BIK1 transphosphorylation upon dimerization as indicated by quantification of autorads (Figure 1B/C). We have also addressed this point in a section on the limitations of our study.
(7) Fig 1B. "Our findings therefore support the hypothesis that EFR increases BIK1 phosphorylation by allosterically activating the BAK1 kinase domain." To the best of my understanding presence of wild-type EFR in the EFR-BAK1 signaling complex leads to much better phosphorylation of BIK1D202N when compared to the EFRD849N mutant. How does that support the allosteric mechanism? By assuming that the D849N mutant is in an inactive conformation and fully catalytically inactive (see above)? Again, I think the data could also be interpreted in such a way that the small difference in autorad signal for BIK1 between BRI1 inactive (but see above) and ERF inactive are due to EFR not being completely kinase dead (see above), rather than EFR being an allosteric regulator. To clarify this point I would suggest to a) perform quantitative auto- and trans-(generic substrate) phosphorylation assays with wt and D849N EFR to derive enzyme kinetic parameters, to (2) include the EFRD849 mutant in the HDX analysis and (3) to generate transgenic lines for EFRD489N/F761H/Y836F // EFRD489N/F761H/SSAA and compare them to the existing lines in Fig. 3.
Mutations of proteins, especially those that require conformational plasticity for their function can have pleiotropic effects as the mutation may affect the conformational plasticity and consequently catalytic and non-catalytic functions that depend on the conformational plasticity. In such cases, it is difficult to fully untangle catalytic and non-catalytic functions. Coming back to EFR D849N, the D849N mutation may also impact the non-catalytic function by altering the conformational plasticity, explaining the difference observed in EFR vs EFR D849N. As you rightly suggested, HDX would be a way to address this but would still not clarify whether catalytic activity contributes to activation. We instead attempted to produce analog sensitive EFR variants for in vivo characterization of EFR-targeted catalytic inhibition. Unfortunately, we failed in producing an analog-sensitive variant for which we could show ATP-analog binding. To address your concern, we inserted a section on limitations of the study.
(8) Fig. 2B,C, supplement 3 C,D. Has it been assessed if the different EFR versions were expressed to similar protein levels and still localized to the PM?
Localization of the mutant receptors has not been explicitly evaluated by confocal microscopy. However, the selected mutation EFRF761H is shown to accumulate in stable Arabidopsis lines (Figure 3 – Supplement 1C) and BAK1 could be coIPed by all EFR variants upon elf18-treatment (Figure 3 B), indicating plasma membrane localization.
(9) How the active-like conformation of EFR is in turn activating BAK1 is poorly characterized, but appears to be the main step in the activation of the receptor complex. Extending the HDX analyses to resting and Rap-activated receptor complexes could be a first step to address this question. I tried to come up with an experimental plan to test if indeed the kinase activity of BAK1 and not of EFR is essential for signal propagation, but this is a complex issue. You would need to be able to mimic an activated form of EFR (which you can), to make sure its inactive (possibly, see above) and likewise to engineer a catalytically inactive form of BAK1 in an active-like state (difficult). As such a decisive experiment is difficult to implement, I would suggest to discuss different possible interpretations of the existing data and alternative scenarios in the discussion section of the manuscript.
We addressed your concern whether BAK1 kinase activity is essential for signaling propagation by pairing EFRF761H and BAK1D416N (Figure 4 Supplement 2 C) which fails to induce signaling. In this case, EFRF761H is in its activated conformation but cannot activate downstream signaling. We also attempted to address your concern by an in vitro kinase assay by pairing EFR and BAK1D416N and using a range of concentrations of the substrate BIK1D202N. We observed that catalytic activity of BAK1 but not EFR was essential for BIK1 phosphorylation. However, this experiment does not address whether activated EFR can efficiently propagate signaling in the absence of BAK1 catalytic activity. In the limitations of the study section, we now discuss the catalytic importance of EFR for signaling activation.
Author response image 1.
BIK1 trans-phosphorylation depends on BAK1 catalytic activity. Increasing concentrations of BIK1 D202N were used as substrate for Rap-induced dimers of EFR-BAK1, EFR D849N-BAK1, and EFR-BAK1 D416N respectively. BIK1 trans-phosphorylation depended on the catalytic activity of BAK1. Proteins were purified from E. coli λPP cells. Three experiments yielded similar results of which a representative is shown here.
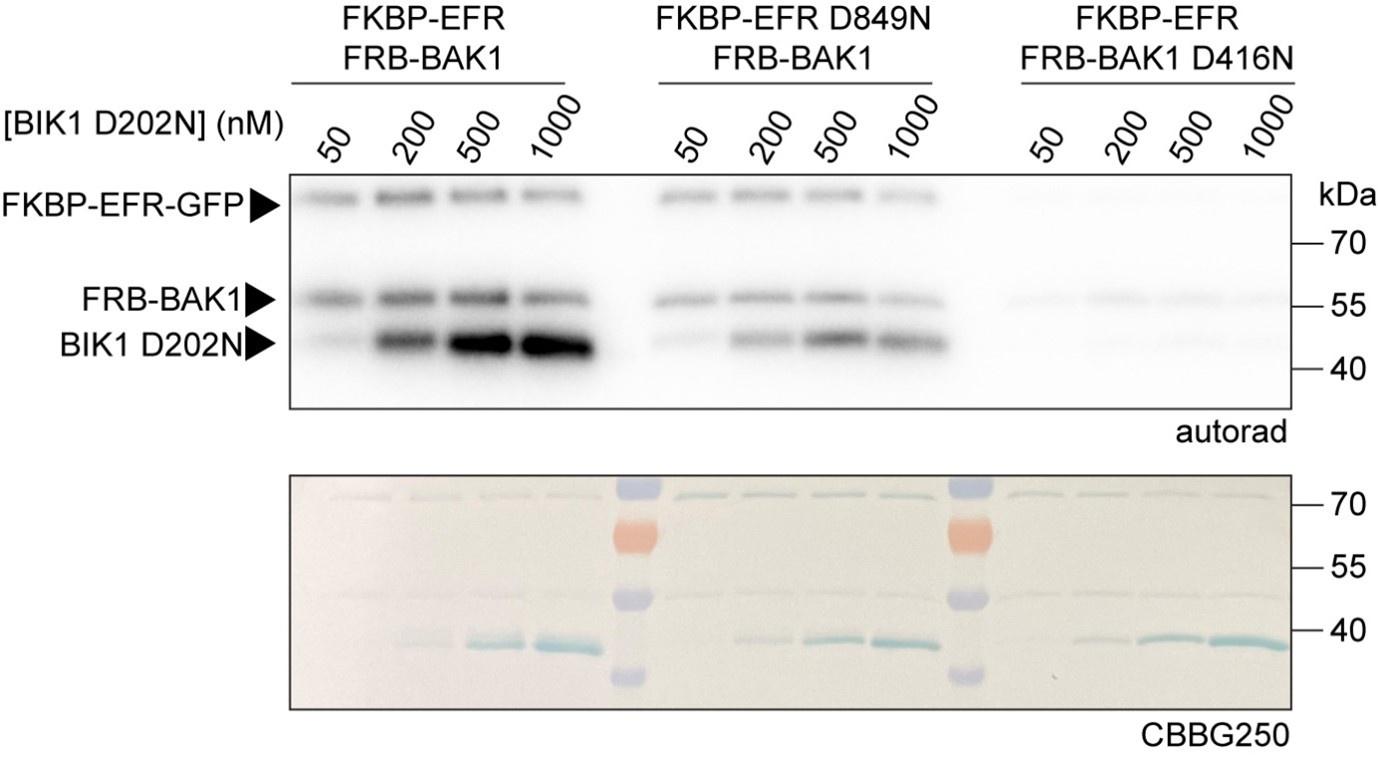
Reviewer #2:
All of my suggestions are minor.
Figure 1B, I think it would be more useful to readers to explain the amino acid in the D-N change, rather than just call it D-to-N? Also, please label the bands on the stained gel; the shift on FKBP-BRI1 and FKBP-EFR are noticeable on the Coomassie stain.
We implemented your suggestions.
Figure 1-Supplement 1. There is still a signal in pS612 BAK1 (it states 'also failed to induce BAK1 S612 phosphorylation' in the text, which is not quite correct). Also, could mention the gel shift seen in BAK1, which appears absent in Y836F.
We corrected the text which now states: “To test whether the requirement for Y836 phosphorylation is similar, we immunoprecipitated EFR-GFP and EFRY836F-GFP from mock- or elf18-treated seedlings and probed co-immunoprecipitated BAK1 for S612 phosphorylation. EFRY836F also obstructed the induction of BAK1 S612 phosphorylation (Figure 1 – Supplement 1), indicating that EFRY836F and EFRSSAA impair receptor complex activation.” The gel shift of BAK1 you pointed out was not observed in replications and thus we prefer not to comment on it.
Figure 2 and 3 are full of a, b, c,d's, which I don't understand. Sorry
We used uppercase letters to indicate subpanels and lowercase letters to indicate the results of the statistical testing. In the figure caption, we have clarified that the lowercase letters refer to statistical comparisons.
Figure 2 A. If each point on the x-axis is one amino acid, I think it would again be useful to name the amino acids that the gold or purple or blue colored lines extend through.
Each point stands for a peptide which are sorted by position of their starting amino acid from N-terminus to C-terminus. We now added plots of HDX for individual peptides that correspond to the highlighted region in subpanel A.
Figure Supplement 1 is very small for what it is trying to show, even on the printed page. If this residue were to be phosphorylated, what would happen to the H-bond?
We suppose that VIa-Tyr phosphorylation would break the H-bond and causes displacement of the aC-b4 loop. Recent studies, published after our submission, highlight the importance of this loop for substrate coordination and ATP binding. Thus, phosphorylation of VIa-Tyr and displacing this loop may render the kinase rather unproductive. We have expanded the discussion to include this point.
Figure 2B: Tyr 836 is not present in any of the alignments in Figure 2A. This should be rectified, because the text talks about the similarity to Tyr 156 in PKA.
We have adjusted the alignments such that they now contain the VIa-Tyr residues of EFR and PKA.
Figure 4D. Is there any particular reason that these Blots are so hard to compare or FKBP and BAK1?
We assume it is referred to Figure 4 – Supplement 2 D. FKBP-EFR and FRB-BAK1 both are approximately the size of RubisCo, the most abundant protein in plant protein samples and which overlay the FKBP- and FRB-tagged kinase. Thus, it is difficult to detect these proteins.
Reviewer #3:
(1) The paper reporting the allosteric activation mechanism of EGFR should be cited.
Will be included.
(2)The authors showed that "Rap addition increased BIK1 D202N phosphorylation when the BRI1 or EFR kinase domains were dimerized with BAK1, but no such effect was observed with FLS2". Please explain why FLS2 failed to enhance BIK1 transphosphorylation by Rap treatment?
Even though BIK1 is a reported downstream signaling component of FLS2/BAK1, it might be not the most relevant downstream signaling component and rather related RLCKs, like PBL1, might be better substrates for dimerized FLS2/BAK1. We haven’t tested this, however. Alternatively, the purified FLS2 kinase domain might be labile and quickly unfolds even though it was kept on ice until the start of the assay, or the N-terminal FKBP-tag may disrupt function. As the reason for our observation is not clear, we have removed FLS2 in vitro dimerization experiments from the manuscript.
(3) Based solely on the data presented in Figure 1, it can be concluded that EFR's kinase activity is not required to facilitate BIK1 transphosphorylation. Therefore, the title of Figure 1, "EFR Allosterically Activates BAK1," may be inappropriate.
We have changed the figure title to: “EFR facilitates BIK1 trans-phosphorylation by BAK1 non-catalytically.”
(4) In Figure 1- Supplement 1, I could not find any bands in anti-GFP and anti-BAK1 pS612 of input. Please redo it.
Indeed, we could not detect protein in the input samples of this experiment. BAK1 S612 phosphorylation is an activation mark and not necessarily expected to be abundant enough for detection in input samples. EFR-GFP, however, is usually detected in input samples and is reported in Macho et al. 2014 from which manuscript these lines come. Why EFR-GFP is not detected in this set of experiments is unclear but, in our opinion, does not detract from the conclusions drawn since similar amounts of EFR-GFP are pulled-down across all samples.
(5) For Figure 2A, please mark the structure represented by each color directly in the figure.
We have made the suggested change.
(6) Please modify "EFRF761/Y836F and EFRF761H/SSAA restore BIK1 trans-phosphorylation" to "EFRF761H/Y836F and EFRF761H/SSAA restore BIK1 trans-phosphorylation".
Thank you for spotting this. We changed it.
(7) The HDX-MS analysis demonstrated that the EFR (Y836F) mutation inhibits the formation of the active-like conformation. Conversely, the EFR (F761H) mutation serves as a potent intragenic suppressor, significantly stabilizing the active-like conformation. Confirming through HDX-MS conformational testing that the EFR (Y836F F761H) double mutation does not hinder the formation of the active-like EFR kinase conformation would greatly strengthen the conclusions of the article.
Response: We agree that this is beneficial, and we attempted to do it but failed to produce enough protein for HDX-MS analysis. We stated this now in an extra section of the paper (“Limitations of the study”).
Author response:
The following is the authors’ response to the original reviews.
Reviewer #1 (Public Review):
The authors in this paper investigate the nature of the activity in the rodent EPN during a simple freely moving cue-reward association task. Given that primate literature suggests movement coding whereas other primate and rodent studies suggest mainly reward outcome coding in the EPNs, it is important to try to tease apart the two views. Through careful analysis of behavior kinematics, position, and neural activity in the EPNs, the authors reveal an interesting and complex relationship between the EPN and mouse behavior.
Strengths:
(1) The authors use a novel freely moving task to study EPN activity, which displays rich movement trajectories and kinematics. Given that previous studies have mostly looked at reward coding during head-fixed behavior, this study adds a valuable dataset to the literature. (2) The neural analysis is rich and thorough. Both single neuron level and population level (i.e. PCA) analysis are employed to reveal what EPN encodes.
Thank you very much for this appreciation.
Weaknesses:
(1) One major weakness in this paper is the way the authors define the EPN neurons. Without a clear method of delineating EPN vs other surrounding regions, it is not convincing enough to call these neurons EPNs solely from looking at the electrode cannula track from Figure 2B. Indeed, EPN is a very small nucleus and previous studies like Stephenson-Jones et al (2016) have used opto-tagging of Vglut2 neurons to precisely label EPN single neurons. Wallace et al (2017) have also shown the existence of SOM and PV-positive neurons in the EPN. By not using transgenic lines and cell-type specific approaches to label these EPN neurons, the authors miss the opportunity to claim that the neurons recorded in this study do indeed come from EPN. The authors should at least consider showing an analysis of neurons slightly above or below EPN and show that these neurons display different waveforms or firing patterns.
We thank the reviewer for their comment, and we thank the opportunity to expand on the inclusion criteria of studied units after providing an explanation.
As part of another study, we performed experiments recording in EPN with optrodes and photoidentification in PV-Cre animals. We found optoidentified units in both: animals with correct placement (within the EPN) and on those with off-target placement (within the thalamus or medial to the EPN). Thus, despite the use of Cre animals, we relied on histology to ensure correct EPN recording. We believe that the optotagging based purely on neural makers such as PV, SOM, VGLUT, VGAT would not provide a better anatomical delineation of the EPN since adjacent structures are rich in those same markers. The thalamic reticular nucleus is just dorsal to the EPN and it has been shown to express both SOM and PV (Martinez-Garcia et al., 2020).
On the other hand, the lateral hypothalamus (just medial to the EPN) also expresses vGlut2 and SOM. Stephenson-Jones (2016), Extended Data Figure 1, panel g, shows vGluT2 and somatostatin labeling of neurons, with important expression of neurons dorsal, ventral and medial to the EPN. Thus, we believe that viral strategies relying on single neuronal markers still depend on careful histological analysis of recording sites.
A combination of neural markers or more complex viral strategies might be more suitable to delineate the EPN. As an example, for anatomical tracing Stephenson-Jones et al. 2016 performed a rabies-virus based approach involving retrogradely transported virus making use of projection sites through two injections. Two step viral approaches were also performed in Wallace, M. et al. 2017. We attempted to perform a two-step viral approach, using an anterogradely transported Cre-expressing virus (AAV1.hSyn.Cre.WPRE.hGH) injected into the striatum and a second Cre dependent ChR2 into the EPN. However, our preliminary experiments showed that this double viral approach had a stark effect decreasing the performance of animals during the task (we attempted re-training 2-3 weeks after viral infections and animals failed to turn to the contralateral side of the injections). We believe that this approach might have had a toxic effect (Zingg et al., 2017).
To this point, a recent paper (Lazaridis et al., 2019) repeated an optogenetic experiment performed in the Stephenson-Jones et al. study, using a set of different viral approaches and concluded that increasing the activity of GPi-LHb is not aversive, as it had been previously reported. Thus, future studies attempting to increase anatomical specificity are a must, but they will require using viral approaches amenable to the behavioral paradigm.
We attempted to find properties regarding waveforms, firing rate, and firing patterns from units above or below, however, we did not find a marker that could generate a clear demarcation. We show here a figure that includes the included units in this study as well as excluded ones to show that there is a clear overlap.
Author response image 1.
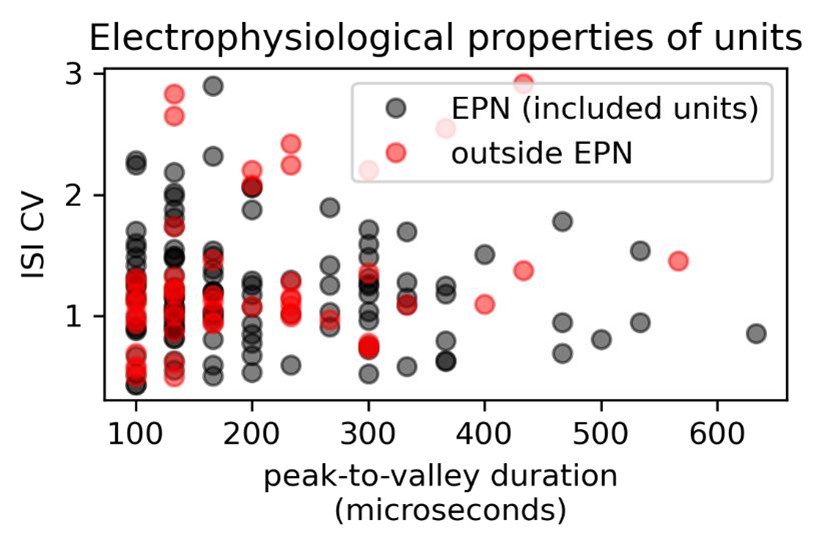
Finally, we completely agree with the reviewer in that there is still room for improvement. We have further expanded the Methods section to explain better our efforts to include units recorded within the EPN. Further, we have added a paragraph within the Discussion section to point out this limitation (lines 871-876).
Methods (lines 116-131):
“Recordings. Movable microwire bundles (16 microwires, 32 micrometers in diameter, held inside a cannula, Innovative Neurophysiology, Durham, NC)] were stereotaxtically implanted just above the entopeduncular nucleus (-0.8 AP, 1.7 ML, 3.9 DV). Post surgical care included antibiotic, analgesic and antiinflammatory pharmacological treatment. After 5 days of recovery, animals were retrained for 1-2 weeks. Unitary activity was recorded for 2-6 days at each dorsoventral electrode position and the session with the best electrophysiological (signal to noise ratio (>2), stability across time) and behavioral [performance, number of trials (>220)] quality was selected. Microwire electrodes were advanced in 50 micrometer dorsoventral steps for 500 micrometers in total. After experiment completion, animals were perfused with a 4% paraformaldehyde solution. Brains were extracted, dehydrated with a 30% sucrose solution and sectioned in a cryostat into 30micron thick slices. Slices were mounted and photographed using a light microscope. Microwire tracks of the 16-microwire bundle were analyzed (Fig. 2A-B) and only animals with tracks traversing the EPN were selected (6 out of 10). Finally, we located the final position of microwire tips and inferred the dorsoventral recording position of each of the recording sessions. Only units recorded within the EPN were included.”
Discussion (lines 871-876):
“A weakness of the current study is the lack of characterization of neuronal subtypes. An area of opportunity for future research could be to perform photo-identification of neuronal subtypes within the EPN which could contribute to the overall description of the information representation. Further, detailed anatomical viral vector strategies could aid to improve anatomical localization of recordings, reduce reliance on histological examination, and solve some current controversies (Lazaridis et al., 2019).”
(2) The authors fail to replicate the main finding about EPN neurons which is that they encode outcome in a negative manner. Both Stephenson-Jones et al (2016) and Hong and Hikosaka (2008) show a reward response during the outcome period where firing goes down during reward and up during neutral or aversive outcome. However, Figure 2 G top panel shows that the mean population is higher during correct trials and lower during incorrect trials. This could be interesting given that the authors might try recording from another part of EPN that has not been studied before. However, without convincing evidence that the neurons recorded are from EPN in the first place (point 1), it is hard to interpret these results and reconcile them with previous studies.
We really thank the reviewer for pointing out that we need to better explain how EPN units encode outcome. We now provide an additional panel in Figure 4, its corresponding text in the results section (lines 544-562) and a new paragraph in the discussion related to this comment.
We believe that we do indeed recapitulate findings of both of Stephenson-Jones et al (2016) and Hong and Hikosaka (2008). Both studies focus on a specific subpopulation of GPi/EPN neurons that project to the lateral habenula (LHb). Stephenson-Jones et al (2016) posit that GPi-LHb neurons (which they opto-tag as vGluT2) exhibit a decreased firing rate during rewarding outcomes. Hong and Hikosaka (2008) antidromically identified LHb projecting neurons through within the GPi and found reward positive and reward negative neurons, which were respectively modulated either by increasing or decreasing their firing rate with a rewarding outcome (red and green dots on the x-axis of Figure 5A in their paper).
As the reviewer pointed out the zScore may be misleading. Therefore, in our study we also decomposed population activity on reward axis through dPCA. When marginalizing for reward in Figure 3F, we find that the weights of individual units on this axis are centered around zero, with positive and negative values (Figure 3F, right panel). Thus, units can code a rewarding outcome as either an increase or a decrease of activity. We show example units of such modulation in Figure 3-1g and h.
We had segregated our analysis of spatio-temporal and kinematic coding upon the reward coding of units in Figure 4L-M. Yet, following this comment and in an effort of further clarifying this segregation, we introduced panels with the mean zScore of units during outcome evaluation in Figure 4L.
We amended the main text to better explain these findings (lines 544-562).
“Previous reports suggest that EPN units that project to the lateral habenula encode reward as a decrease in firing rate. Thus, we wished to ask whether reward encoding units can code kinematic and spatio-temporal variables as well.
To this end, we first segregated units upon their reward coding properties: reward positive (which increased activity with reward) and reward negative units (which decreased activity with reward). We performed auROC on the 250ms after head entry comparing rewarded trials and incorrect trails (p<0.001, permutation test). Mean activity of reward insensitive, positive and negative units is shown in Fig. 4L. Next, we performed a dimensionality reduction on the coefficients of the model that best explained both contexts (kinematic + spatio-temporal model on pooled data) using UMAP (McInnes et al., 2018). We observe a continuum rather than discrete clusters (Fig. 4L). Note that individual units are color coded according to their responsivity to reward. We did not find a clear clustering either.”
Paragraph added in the discussion (lines 749-755):
“In this study, we found that rewarding outcomes can be represented by EPN units through either an increase or a decrease in firing rate (Fig. 3F, 3-1g-h, 4L). While Stephenson-Jones et al., 2016 found that lateral habenula (LHb)-projecting neurons within the EPN of mice primarily encoded rewarding outcomes by a decrease in firing rate, Hong and Hikosaka, 2008 observed that in primates, LHb-projecting units could encode reward through either a decrease or an increase in firing rate. Thus, our results align more closely with the latter study, which also employed an operant conditioning task.”
(3) The authors say that: 'reward and kinematic doing are not mutually exclusive, challenging the notion of distinct pathways and movement processing'. However, it is not clear whether the data presented in this work supports this statement. First, the authors have not attempted to record from the entire EPN. Thus it is possible that the coding might be more segregated in other parts of EPN. Second, EPNs have previously been shown to display positive firing for negative outcomes and vice versa, something which the authors do not find here. It is possible that those neurons might not encode kinematic and movement variables. Thus, the authors should point out in the main text the possibility that the EPN activity recorded might be missing some parts of the whole EPN.
We thank the reviewer for the opportunity to expand on this topic. We believe it is certainly possible that other not-recorded regions of the EPN might exhibit greater segregation of reward and kinematics. However, we considered it worthwhile pointing out that from the dataset collected in this study reward-sensitive units encode kinematics in a similar fashion to reward-insensitive ones (Fig. 4L,M). Moreover, we asked specifically whether reward-negative units (that decrease firing rate with rewarding outcomes, as previously reported) could encode kinematics and spatio-temporal variables with different strength than reward-insensitive ones and could not find significant differences (Fig. 4M).
We did indeed find units that displayed decreased firing rate upon rewarding outcomes, as has been previously reported. We have addressed this fact more thoroughly in point (2).
Finally, we agree with the reviewer that the dataset collected in this study is by no means exhaustive of the entire EPN and have thus included a sentence pointing this out in the Discussion section (lines 805-806):
“Given that we did not record from the entire EPN, it is still possible that another region of the nucleus might exhibit more segregation.”
(4) The authors use an IR beam system to record licks and make a strong claim about the nature of lick encoding in the EPN. However, the authors should note that IR beam system is not the most accurate way of detecting licks given that any object blocking the path (paw or jaw-dropping) will be detected as lick events. Capacitance based, closed-loop detection, or video capturing is better suited to detect individual licks. Given that the authors are interested in kinematics of licking, this is important. The authors should either point this out in the main text or verify in the system if the IR beam is correctly detecting licks using a combination of those methods.
We thank the reviewer for the opportunity of clarifying the lick event acquisition. We have experience using electrical alternatives to lickometers; however, we believe they were not best suited to this application. Closed-loop lickometers generally use a metallic grid upon which animals stand so that the loop can be closed; however, we wanted to have a transparent floor. We have found capacitance based lickometers to be useful in head-fixed conditions but have noticed that they are very dependent on animal position and proximity of other bodyparts such as limbs. Given the freely moving aspect of the task this was difficult to control. Finally, both electric alternatives for lickometers are more prone to noise and may introduce electrical artifacts that might contaminate the spiking signal. This is why we opted to use a slit in combination with an IR beam that would only fit the tongue and that forced enough protrusion such that individual licks could be monitored. Further, the slit could not fit other body-parts like the paw or jaw. We have now included a video (Supp. Video 2) showing a closeup of this behavior that better conveys how the jaw and paw do not fit inside the slit. The following text has been added in the corresponding methods section (lines 97-98):
“The lickometer slit was just wide enough to fit the tongue and deep enough to evoke a clear tongue protrusion.”
Reviewer #1 (Recommendations For The Authors):
(1)The authors should verify using opto-tagging of either Vglut2, SOM, or PV neurons whether they can see the same firing pattern. If not, the authors should address this weakness in the paper.
We thank the reviewer for this important point, we have provided a more detailed reply above.
(2)The way dPCA or PCA is applied to the data is not stated at all in the main text. Are all units from different mice combined? Or applied separately for each mouse? How does that affect the interpretation of the data? At least a brief text should be included in the main text to guide the readers.
We thank the reviewer for pointing out this important omission. We have included an explanation in the Methods section and in the Main text.
Methods (lines 182-184):
“For all population level analyses individual units recorded from all sessions and all animals were pooled to construct pseudo-simultaneous population response of combined data mostly recorded separately.”
Main text (lines 397-399):
“For population level analyses throughout the study, we pooled recorded units from all animals to construct a pseudo-simultaneous population.”
Discussion (lines 729-730):
“…(from pooled units from all animals to construct a pseudo-simultaneous population, which assumes homogeneity across subjects)”
(3) The authors argue that they do not find 'value coding' in this study. However, the authors never manipulate reward size or probability, but only the uncertainty or difficulty of the task. This might be better termed 'difficulty', and it is difficult to say whether this correlates with value in this task. For instance, mice might be very confident about the choice, even for an intermediate frequency sweep, if the mouse had waited long enough to hear the full sweep. In that case, the difficulty would not correlate with value, given that the mouse will think the value of the port it is going to is high. Thus, authors should avoid using the term value.
We agree with the reviewer. We have modified the text to specify that difficulty was the variable being studied and added the following sentence in the Discussion (lines 747-748):
“It is still possible that by modifying reward contingencies such as droplet size value coding could be evidenced.”
(4) How have the authors obtained Figure 7D bottom panel? It is unclear at all what this correlation represents. Are the authors looking at a correlation between instantaneous firing rate and lick rate during a lick bout?
We thank the reviewer for pointing out that omission. It is indeed correlation coefficient between the instantaneous firing rate and the instantaneous lick rate for a lick bout. We have included labeling in Figure 7D and pointed this out in the main text [lines 680-681]:
“Fig.7D, lower panel shows the correlation coefficient between the instantaneous firing rate and the instantaneous lick rate within a lick bout for all units.”
Reviewer #2 (Public Review):
This paper examined how the activity of neurons in the entopeduncular nucleus (EPN) of mice relates to kinematics, value, and reward. The authors recorded neural activity during an auditory-cued two-alternative choice task, allowing them to examine how neuronal firing relates to specific movements like licking or paw movements, as well as how contextual factors like task stage or proximity to a goal influence the coding of kinematic and spatiotemporal features. The data shows that the firing of individual neurons is linked to kinematic features such as lick or step cycles. However, the majority of neurons exhibited activity related to both movement types, suggesting that EPN neuronal activity does not merely reflect muscle-level representations. This contradicts what would be expected from traditional action selection or action specification models of the basal ganglia.
The authors also show that spatiotemporal variables account for more variability compared to kinematic features alone. Using demixed Principal Component Analysis, they reveal that at the population level, the three principal components explaining the most variance were related to specific temporal or spatial features of the task, such as ramping activity as mice approached reward ports, rather than trial outcome or specific actions. Notably, this activity was present in neurons whose firing was also modulated by kinematic features, demonstrating that individual EPN neurons integrate multiple features. A weakness is that what the spatiotemporal activity reflects is not well specified. The authors suggest some may relate to action value due to greater modulation when approaching a reward port, but acknowledge action value is not well parametrized or separated from variables like reward expectation.
We thank the reviewer for the comment. We indeed believe that further exploring these spatiotemporal signals is important and will be the subject of future studies.
A key goal was to determine whether activity related to expected value and reward delivery arose from a distinct population of EPN neurons or was also present in neurons modulated by kinematic and spatiotemporal features. In contrast to previous studies (Hong & Hikosaka 2008 and Stephenson-Jones et al., 2016), the current data reveals that individual neurons can exhibit modulation by both reward and kinematic parameters. Two potential differences may explain this discrepancy: First, the previous studies used head-fixed recordings, where it may have been easier to isolate movement versus reward-related responses. Second, those studies observed prominent phasic responses to the delivery or omission of expected rewards - responses largely absent in the current paper. This absence suggests a possibility that neurons exhibiting such phasic "reward" responses were not sampled, which is plausible since in both primates and rodents, these neurons tend to be located in restricted topographic regions. Alternatively, in the head-fixed recordings, kinematic/spatial coding may have gone undetected due to the forced immobility.
Thank you for raising this point. Nevertheless, there is some phasic activity associated with reward responses, which can be seen in the new panel in Figure 4L.
Overall, this paper offers needed insight into how the basal ganglia output encodes behavior. The EPN recordings from freely moving mice clearly demonstrate that individual neurons integrate reward, kinematic, and spatiotemporal features, challenging traditional models. However, the specific relationship between spatiotemporal activity and factors like action value remains unclear.
We really appreciate this reviewer for their valuable comments.
Reviewer #2 (Recommendations For The Authors):
One small suggestion is to make sure that all the panels in the figures are well annotated. I struggled in places to know what certain alignments or groupings meant because they were not labelled. An example would be what do the lines correspond to in the lower panels of Figure 2D and E. I could figure it out from other panels but it would have helped if each panel had better labelling.
Thanks for pointing this out, we have improved labelling across the figures and corrected the specific example you have pointed out.
The paper is very nice though. Congratulations!
Thank you very much.
Editor's note:
Should you choose to revise your manuscript, please include full statistical reporting including exact p-values wherever possible alongside the summary statistics (test statistic and df) and 95% confidence intervals. These should be reported for all key questions and not only when the p-value is less than 0.05 in the main manuscript.
We thank the editor for the comment. A statistics table has been added.
References:
Lazaridis, I., Tzortzi, O., Weglage, M., Märtin, A., Xuan, Y., Parent, M., Johansson, Y., Fuzik, J., Fürth, D., Fenno, L. E., Ramakrishnan, C., Silberberg, G., Deisseroth, K., Carlén, M., & Meletis, K. (2019). A hypothalamus-habenula circuit controls aversion. Molecular Psychiatry, 24(9), 1351–1368. https://doi.org/10.1038/s41380-019-0369-5
Martinez-Garcia, R. I., Voelcker, B., Zaltsman, J. B., Patrick, S. L., Stevens, T. R., Connors, B. W., & Cruikshank, S. J. (2020). Two dynamically distinct circuits drive inhibition in the sensory thalamus. Nature, 583(7818), 813–818. https://doi.org/10.1038/s41586-0202512-5
McInnes, L., Healy, J., Saul, N., & Großberger, L. (2018). UMAP: Uniform Manifold Approximation and Projection. Journal of Open Source Software, 3(29), 861. https://doi.org/10.21105/joss.00861
Zingg, B., Chou, X. lin, Zhang, Z. gang, Mesik, L., Liang, F., Tao, H. W., & Zhang, L. I. (2017). AAV-Mediated Anterograde Transsynaptic Tagging: Mapping Corticocollicular Input-Defined Neural Pathways for Defense Behaviors. Neuron, 93(1), 33–47. https://doi.org/10.1016/j.neuron.2016.11.045