The ancient Greeks believed that Troy was located near the Dardanelles
Good claim but needs specific citation.
The ancient Greeks believed that Troy was located near the Dardanelles
Good claim but needs specific citation.
Hip-hop has reshaped language. Hip-hop culture has added words nowprominent across music disciplines and the world. Terms such as “trap,”“ratchet,” “gully,” “twisted,” “gold digger,” “wanksta,” “bling,” “crib,” and “lit”all have a hip-hop provenance or have been popularized through hip-hop.To be sure, not all hip-hop linguistic innovations make their way into themainstream, but those that do often have a lasting influence
again really interesting to see where certain slang originated, also when he says "a lasting influence" is a very true statement much of the slang he mentions is still used today.
simplistic notion of the ways in which brain cellstransmit electrical charges, but that is what makes it powerful. From braincell transmissions to fires, the idea of it being lit expresses a kinetic form ofenergy that is both passionate creativity and a rocking good time.
The fact that the author was able to derive that meaning from that lyric shows that hip-hop can be studied to show deeper meanings.
Now this workseems to occur largely in the iPhone’s notes app, but it still happens regularly,and I catch myself doing it as if I had a record deal and was going to be fea-tured on the next remix of a popular song. Big Daddy Kane rapped about hislyric creation process that
I really enjoy this segment the way he illustrates the lyric writing but also studying the process rather then the product is really interesting, I think If I was the read a draft of a book it would be a lot more interesting because you get to study the words the author did and didn't use and you get to ask your self the question "Why did he change it" I think I would find a lot more texts more engaging if all I read were hand written drafts.
English would arguethat Tupac is Shakespeare, that kind of comparison is not necessary to justifyhip-hop’s study. Shakespeare and Tupac are different, and both are worthy ofstudy in the same classroom
I really like the way Sciullo worded this I think it adds a lot to his perspective and opinion but I think it adds a nice twist on the concept of "Code-Meshing" but also encourages dialect diversity a educational environment.
I am unable to highlight or annotate - But the first thing that stood out to me as I'm reading this, which was already mentioned by someone, is the mention that sometimes "Changing the context is necessary". Sometimes we the caregivers, our responses, or even failure to clearly state expectations in a age-appropriate way can sometimes be the cause of challenging behavior. I appreciate the mention of it so I can now consider that when deciding the best way to support children through guidance. I also appreciate the mention of staying away from blaming the child. Someone say "The problem is the problem, the child is not the problem" which is a great way of putting it and an effective mindset to adopt. A question that comes to mind after reading is how can I stay mindful of these steps and how to apply them to my guidance of children in the moment? sometimes chaos and a focus on student safety causes us to jump to discipline or frustration.
There’s really nothing that can substitute for the certainty of actually watching someone struggle to use your design, but these analytical approaches are quick ways to get feedback, and suitable fallbacks if working with actual people isn’t feasible.
I like this sentence because it recognizes both the value and the limits of analytical evaluation. The author acknowledges that while direct user observation provides the most authentic insight, analytical methods still play a vital role when testing with users isn’t possible. This balance between practicality and depth reflects a realistic approach to design research. It reminds me that good designers use every tool available but never lose sight of real human experience.
There’s really nothing that can substitute for the certainty of actually watching someone struggle to use your design, but these analytical approaches are quick ways to get feedback, and suitable fallbacks if working with actual people isn’t feasible.
I really agree with the reading’s point that there’s nothing like watching a real person struggle to use your design. I’ve experienced this in group projects where our design seemed perfect on paper, but once we saw users getting confused or stuck, we realized how many assumptions we had made. It’s such a valuable reminder that analytical evaluations and heuristics can only go so far—real user interaction reveals issues we’d never anticipate ourselves. This reinforces why usability testing with actual users is irreplaceable for meaningful feedback and improvement.
Recognition versus recall is an interesting one. Recognition is the idea that users can see the options in an interface rather than having to memorize and remember them. The classic comparison for this heuristic is a menu, which allows you to recognize the command you want to invoke by displaying all possible options, versus a command line, which forces you to recall everything you could possibly type. Of course, command lines have other useful powers, but these are heuristics: they’re not always right.
I found the discussion of recognition versus recall really interesting because it highlights how design can either support or burden users’ memory. I notice this difference a lot when comparing apps that use clear icons and menus versus those that rely on hidden commands. For example, some mobile apps require you to remember specific swipe actions, which can be frustrating when they’re not visible on the screen. This reading reminded me how much easier it is for users when designs rely on recognition—showing options directly—rather than expecting people to recall invisible steps from memory.
By Emily BazelonSept. 26, 2018
Judging by the fact that Emily Bazelon is listed as a senior writer for this magazine company and that she works at Yale, I would say that for the topic (she researches constitutional law and social justice issues), she is a credible source to read when it comes to legal issues. The intention in writing this was to look at Florida's Amendment 4 (to restore voting rights to felons) in the context of it being a racial-based issue, similar to the post-Reconstruction era when Black citizens were kept from voting through new laws/policies. Moreover, The New York Times is highly receptive when it comes to editing, having policies in place regarding when information needs to be updated or corrected. So despite this article being far from an academic journal, the information within it was still gathered and published with journalistic integrity. This includes the court cases, statistics, and experts referenced throughout the article (and interviews). The article was published in 2018, but I believe it's still incredibly relevant because Amendment 4 has sparked more conversations on letting felons vote while incarcerated, making the information in this article important. Especially since Bazelon's analysis relied heavily on examining Florida law in its historical context. I would choose this source over another because it checks my boxes for credibility and it relies on qualitative accounts (observing and interpreting things to understand why something is the way that it is) rather than quantitative, which makes it unique.
Oliver Tearle. Who Said, ‘A Lie Is Halfway Round the World Before the Truth Has Got Its Boots On’? June 2021. URL: https://interestingliterature.com/2021/06/lie-halfway-round-world-before-truth-boots-on-quote-origin-meaning/ (visited on 2023-12-08).
This article is trying to find out who said "A Lie is Halfway Round the World Before the Truth Has Got Its Boots On". Many people think Winston Churchill first said this, but a different version of this sentence appeared earlier. So ironically, the origin of this sentence itself is also a lie. The spreading of this sentence is just like the way that information on internet spreads. We receive some information and build our own understanding of it then tell the edited information to others, leading the fake information to spread in a speed that we cannot imagine.
Early literacy research has certainly not ignoredquestions about young children's dialogues with oth-ers around written language, or even the impact ofthese dialogues on literacy development (e.g.,Dyson, 1989; Eldredge, Reutzel, & Hollingsworth,1996; Ninio & Bruner, 1978; Whitehurst et al.,1999). But, there are many questions not yet an-swered or that merit further research, and relevant
important to know what merits the research
focus on symbols as used to communicate withothers. This point comes through not only in themore socially oriented chapters but also in thosewith a more classic cognitive thrust (Gentner &Loewenstein; Goldin-Meadow). Common in the ac-quisition of different symbolic systems are the inter-actions with others, around and within that system.
cognitive thrust
Goldin-Meadow characterizes as imagistic and analogrepresentation. Further, Goldin-Meadow reviewsevidence associating gesture with learning, problemsolving, and memory. Gesture is not language, but itaffects thought.
gesture doesn't associate with language?
effect of language onthought, but, on the other hand, she also reminds us,with a compelling data set
data mixed with thoughts
imply a conse-quence of cognitive development, but actually spurscognitive development. Inscription and mathematiz-ing cause new ways to
not a consequence but a finding
citing Ferreiro (1986), he describes a cbild'suse of a borizontal scribble to represent one cat, andtbe use of rwo borizontal scribbles to represent twocats. But, wben asked to write no cats tbe cbild re-sponded, "Tbere's no cats so I didn't writing any-tbing" (p. 159).
visual drawing over communicated drawing
Social media can bring people together
Social media is how people communicate today, so it is a main way if bringing people together, but it is also a way of splitting people apart as well.
Social media can provide a safe place for some teens to get support: 68% of teens surveyed in the Pew survey said they had asked for and received support through social media during difficult times in their lives.
Social media and technology can be used for good when used correctly. Social media has a lot of negatives but this statistic proves that it is not always bad. Digital citizenship is important to teach our students to use social media in a meaningful way.
Passwords are your first line of defence against external intruders. Complex passwords that are eight characters or longer and include a combination of upper/lowercase letters, numbers, and symbols are a great first step for keeping your information secure
I completely agree that strong passwords are important, but I think most people (including me) tend to reuse the same password across several accounts. I started using a password manager recently, and it’s helped a lot. I could see teaching students to create strong passwords as a good digital citizenship activity, even at a young age.
Cookies—small pieces of data with a unique ID placed on your device by websites—are online tracking tools that enable this to happen.
I’ve noticed this happening so many times after I online shop. I will search for something once, and then it pops up everywhere. I knew cookies tracked browsing behavior, but I didn’t realize how detailed the tracking could be or that some advertisers use cookies across multiple websites. This makes me think about what kinds of data students may be unknowingly sharing when they use educational websites.
Enjoyment—to have fun with unsuspecting users.
I think this is important to note because someone may think that they are just having fun but they are might really being putting people in danger and at risk. Teaching that this is not good digital citizenship is important because hacking someone's appliances and making their products unusable can become a big deal for some people. Letting people know that it is important to leave people's information and digital space alone and protected.
This, then, is held to be the duty of the man of Wealth: First, to set an example of modest, unostentatious living, shunning display or extravagance; to provide moderately for the legitimate wants of those dependent upon him; and after doing so to consider all surplus revenues which come to him simply as trust fund
I think this is a way that he is proposing a solution to the problem by saying that wealth is not personal but public trust
teacher who requires emotional support needs coping rae gies for responding to these challenges in a healthy way and reassurance to promote self-confidence.
I agree that coping strategies are something that all of us need and benefit from. Not only did I struggle as a first year teacher emotionally but I think that all of us hit some point in our school year where we have that exhaustion and it can be really hard to cope with those feelings if we don't know how or have the strategies to.
but it can also present a slightly biased story.
The story is only from one perspective.
But on the dank right, I believe that the liberal treatment of young white males has been one of the causes for this recoil and eruption. What you had was a toxic combination of a bad economy of young men being told repeatedly that they are the cancer of the planet, that their masculinity is toxic, that their skin is the blight of the world, and their heterosexuality is a hate crime.
says that liberals have made efforts to block fascists and anti-semities. However, they are pushing white young men toward that side with their identity politics
Christendom that learns lessons from history. And some of those lessons that you learn from history, maybe the person who wrote that book or influenced this legislation, they may have been a feminist or liberal or whatever, but what’s important is whether it’s just and prudent and right. And if it is and it aligns with the Bible, then I’m more than happy to go with it.
belives that Christiantiy can learn from those damn liberals in some aspects
Yeah, that’s hers. So basically, I believe that it would be wise and prudent for us to have a system of endowment for the wife. That would mean that if a husband just thought he found someone cuter, he would take a serious financial hit.
voting should be done by households lead by men, but the women should still be able to have their own assests so that men wont dump their wives
OK. So there’s a “no taunting the Christian majority” soft policy.
Hindus and Muslims would be allowed but they conduct activities that publically profess their faith
o, I call myself a theocratic libertarian, and theocratic means, if we outlaw something, I want a Bible verse, ideally the Ten Commandments, if we make something against the law. But if it has to do with the manufacturing and sale of widgets, or the thoughts a person thinks, or the beliefs that they have, I’m a libertarian
laws need to be biblically sourced and enforced, but those who practice another religion should be free to do so
I would much prefer to see an Alfred approach, where you take the principles of the law, you apply them, you stand by the principles, and then, using Christian prudence and wisdom, you push in that direction until you get the results that you want
doesnt argue for applying the rules of the Bible but applying those rules within the context of America
these prac-tices make these students more academically suc-cessful and more confident in the use of theirlanguages.
this article is just an introduction, but we get insight into really relevant topics
They havealso experienced multilingualism themselves,and their multilingual backgrounds includelanguages such as Tamil, Hebrew, Frisian, Dutch,Basque, Spanish, German, Italian, Mandarin,and English
differing perspectives, but have all firsthand faced the issue
literacy cannot be considereda static skill but should be considered as multipleliteracy practices that vary across languages, cul-tures, and contexts
their definition of what literacy should be
Number two – there must be a criminal, and number three – there must be someone who goes after him.
Follows a structure but overall too predictable.
As with most of Morris’s other claims, the pretension to be the first and only Israeli who dealt with the ethnic cleansing of the Arabs reflected a partial reality. His book indeed touched a very central and painful nerve of the Israeli-Jewish current past, the uprooting of about 700,000 Arab Palestinians from the territories that would become the Jewish state, the refusal to allow them back to homes after the war, and the formation of the refugee problem during the period of the 1948 war and after. He also surveyed some atrocities committed by Jews during the inter-communal war that played some role in the “voluntary” flight of the Arabs from their villages and neighborhoods. Weirdly enough, Morris devoted a very salient and extensive discussion to the centrality of idea of “transfer” (i.e., ethnic cleansing) in Zionist thought, but concluded that the Palestinians had not been expelled by the Israelis in compliance with a master plan or following a consequential policy. This was not precise.
Reading this excerpt, I’m struck by how it handles a complex and painful part of history without offering easy answers. The text highlights the scale of displacement, around 700,000 Arab Palestinians leaving the territories that became Israel, and how this shaped the refugee issue after 1948. It also points out that there were atrocities committed on both sides that influenced these movements, as well as discussions within Israeli thought about the idea of “transfer.” What I find interesting is how the author examines these events and debates, showing both the historical actions and the interpretations of those actions, without claiming absolute certainty or assigning overarching intent. It emphasizes to me that historical narratives are complicated, shaped by both facts and interpretation, and that understanding the past often requires looking at multiple perspectives and nuances rather than simple conclusions.
But the historian is not just a part of the collective mood and expresses it, he also provide historical and intellectual legitimacy to the most primitive and self-destructive impulse of a very troubled society.
This passage stood out to me as a means of critiquing the source of the information that one gleans from different texts people read. Kimmerling's main argument here is that Morris has abandoned his "scholarly" responsibility and is now using his credibility as a historian to legitimize ethnic cleansing rather than to examine it critically which therefore directly addresses how academic authority shapes public discourse and political possibilities. This serves as a means of giving "permission" to an entire society by wrapping up extreme nationalism in scholarly respectability. This is why this passage captured my interest, in how this inverts to what historians should do. We expect them to help societies learn from past violence, not to study atrocities and conclude they should be repeated more thoroughly.
On the other hand he was accused by mainstream Israeli academics and intellectuals with “post-Zionism” and subverting the very legitimacy of Israel’s existence. This triggered endless nonsense and semi-professional and mainly political debates in Israel and abroad about the meaning and extent of “post-Zionism” (frequently labeled as “anti-Zionism” or even “post-modernism”) that included arbitrarily any serious or less serious critical
First of all, this reading was super interesting because it was cool to see a response to the interview that we got to read. Specifically, this sentence is a reflection of interpretation of historical concepts themselves became a sort of battle ground amongst Israeli society. The author of this article points out a backlash against "post zionism," showing that often, these historical debates don't just have to be academic but they are also often struggles over identity and morals. The author questions the foundational narratives of Israel and post-Zionist scholars.
The military doctrine, the base of Plan D, clearly reflected the local Zionist ideological aspirations to acquire a maximal Jewish territorial continuum, cleansed from Arab presence, as a necessary condition for establishing an exclusive Jewish nation-state.
The highlight of the reading in terms of significance is the way in which Kimmerling criticizes both the deeds and the ideology that led to the war of 1948, suggesting that the displacement of the Palestinians was not random during the war but rather part of an intentional plan related to Zionist ideology in terms of territory. The quote below made me stop and reflect on the reading, realizing that there was indeed intent related to ideas rather than just physical deeds in terms of what transpired during the war. The part of the reading that interested me the most was the way in which Kimmerling makes reference to ideas related to morality and nationality in terms of what transpired during the formation of the Jewish state.
I draw on my experiences teaching andencouraging linguistic diversity in my composition and literature courses atQueensborough Community College (QCC) in Queens, New York, the most di-verse county in the United States
Here using the CRAAPs method I can see what how reliable the source is, but there might be some sort of bias since she is an educator herself.
during the process. The need for such adaptability breaks studentsof the conception that there is a way to get the answers that theyneed, preparing them to be adaptable in situations beyond theclassroom.
Researching isn't just about finding the answers but really learning, and understanding it.
example, the norm for women in the 1950s was to get married and work in the home rather than have a job in the public workforce. Not that all women did this, or even most. Many mothers, particularly women of color, were obliged to work outside the home just to make a living for their families.
I think its interesting how social norms for women have changed a bit over time, but some men still expect this from women.
For most of the relatively short history of child welfare practice in theunited states we have erroneously assumed that children’s emotionaland behavioral challenges stemmed solely from the maltreatment thatthey experienced while in the care of parents or other caregivers. it isonly recently that the field has come to understand that a significantpart of children’s inability to “adjust” and “function” is the result of sec-ondary trauma experienced as a result of removal, broken and incom-plete attachments, or the interruption of essential relationship buildingand formation. As described by the Child Welfare information gateway,children are separated from their parents and placed with relatives inresponse to a multitude of circumstances, including child maltreatment,health problems, addiction, imprisonment, unemployment, desertion,and death (Child Welfare information gateway, Administration onChildren, Youth and Families, Children’s Bureau, 2010).The pathway to nonparental care can be unique to a particular child’sexperiences, but some themes and commonalities emerge. A significantnumber of caregivers voluntarily serve in the caregiving role. some doso to avoid formal public child welfare intervention in their family’s life.still others volunteer to care for their relatives’ children but do so afterthe child welfare system has engaged the family. in some cases, the localchild welfare authority may remove a child from the relative’s care andplace the child in the caregiver’s home. Many caregivers report experi-ences where their relative (e.g., adult son, daughter) and their relative’schildren all lived with the caregiver and then the relative left, leaving theresponsibility of providing care to the caregiver. Parents leave for a hostof reasons, but some exit their parental responsibility as a result of beingjailed or incarcerated for long periods of time. For some children, theirhistory of living with a relative caregiver is episodic, as the children haveexperienced multiple transitions (and at times placements with different
some reasons a child might need kinship due to no parents
he goal of most usability tests is to discover aspects of a design that cause someone to fail at some task. We call these failures breakdowns, the idea being that someone can be following the correct sequence of steps to complete a task, but then fail to get past a crucial step. Once you’ve found the breakdowns that occur in your design, you can go back and redesign your interface to prevent breakdowns, running more usability tests after redesign to see if those breakdowns still occur. Usability tests allow the designer to observe these breakdowns in person, helping them to make highly informed interpretations of what caused them, informing redesign.
I completely agree with the reading’s point that the goal of usability tests is to uncover “breakdowns” — moments when users fail to complete a task even though they’re following the right steps. I’ve noticed this myself when building projects: everything seems fine until people outside the team start using it. That’s when I realize there are small, even silly mistakes that I never noticed because I was too familiar with the design. Just like the reading explains, observing these breakdowns helps me understand where users get stuck and how I can redesign the interface to make it clearer and more intuitive.
The fact that all three normative theories of business ethics rely on the moralforce of individual consent should come as no surprise given a proper understandingof what a business is, i.e., S'a voluntary association of individuals, united by anetwork of contracts"66 organized to achieve a specified end.67 Because businessesconsist in nothing more than a multitude of voluntary agreements amongindividuals, it is entirely natural that the ethical obligations of the parties tothese agreements, including those of the managers of the business, should derivefrom the individual consent of each
The author makes a clear connection between business ethics and the idea of individual consent, but their argument feels a bit too idealistic. They assume that all business relationships are truly “voluntary,” ignoring how power dynamics, economic pressure, or lack of options can limit real consent. By treating businesses as simple networks of equal agreements, the author overlooks the complex realities of modern corporations where not everyone has the same influence or freedom to choose
The social contract theory is often cnticized on the ground that the "socialcontract" is not a contract at all. To appreciate the nature of this criticism, let usborrow some terminology from the legal realm. The law recognizes three typesof contracts: express contracts, implied contracts, and quasi-contracts. An expresscontract consists in an explicit agreement made in speech or writing. In thiscase, there is a true meeting of the minds of the parties that is expresslymemorialized through languag
r makes a fair point about the social contract not being a real, written agreement, but they kind of take the idea too literally. it focus so much on the legal side that they miss the bigger picture — the “contract” in social contract theory isn’t supposed to be a real document, it’s more of a way to explain how people agree to live by certain rules
In Egypt, places listed as rural agricultural settlements on official maps are actually cities as large as 275,000, but making the official change puts the government on the hook for everything from schools to courthouses.
for - example - practical reasons for not naming a settlement a city - Egypt
Christine Yano builds on Iwabu-chi’s work and thinks through what she calls the commodity “whiteface” ofHello Kitty. 31 Remarking on Japanese companies’ desires to create globallycompatible consumer products in the 1970s by mimicking Euro-Americanstandards, Yano underscores the ambiguity of the international appeal ofHello Kitty, especially her cute white face. 32 Yano links mukokuseki to mo-dernity, whiteness, and global acceptance and adeptly points out the Japanesecompanies’ willingness to self-erase for the sake of global marketability.
Representation in toys, similar than in games. You consume stereotypes for Carnival: What do the boys wear, tactical and police gear. What about girls? Flying assistants or dressed princesses. Do you see many doctors during carnival? No.
To me, most festivals are grotesque self-fetishisations plagued by nationalistic discriminatory pride. Yes, they can be an acknowledgement of diverse oft-excluded identities (furries), and a visibilisation and acceptance of them, but they rarely are: Most of the times, they look like a parody of the parody, a cartoonish simulation of army/school uniforms, and an objectification via (female) sexualised dresses.
Noting the racially ambiguous design of the mgs series’ protagonist Snake,Hutchinson argues that the white-passing body welcomes Western playersto empathize with its message.
I know that this is colonising, you don't have to shove it upon me... but isn't it a justified concession? Isn't the inherent peace-cooperation argument embeded in the game akin to the reparatory non-repetition argument that underlies historical memory?
For me, it is not, and I say this having played a large chunk of the game while focusing on utilitarianist EA ethics. It is not, because it may avoid tokenisation, sure, but Sam Porter is not a slave, he is a hero. Not only that, with although it prefaces the quest of reaching white people with anti-war logics, the game has war, the game has fights, and its sequel does too. These are surrounded with mysticism and fantastic events which cloud the statements and leave them open to interpretation in a way that most players are sure to miss them. It's not provocative, it's a eco-tourism chore. The cutscences and events are a McGuffin to visit places and trek through them to feel epic.
To influence a mass of players, and not just get critical acclaim it would have needed to be more straightforward.
the lens through which we examine texts in various forms and modalities, and challengeassumptions and ideas about our society and our world. Ultimately, it involves recognizingthe power not only to read and critically analyze ideas, but, where necessary, to presentalternative perspectives on issues of national importance; thus, critical literacy can propelstudents and citizens, more broadly, toward greater participation in national discourse, andultimately, toward meaningful social transformation. (p. 31)
It is important to learn how to take what you learn and apply it to your day-to-day life.
Her mother, who noticed everything and knew everything and whohadn't much reason any longer to look at her own face, always scolded Connie about it.
It’s interesting here because it’s impossible in real life that one can know everything about the other. But the author made Connie’s mother be a person who omniscient about her daughter.
Spanish in Illinois isthriving!
This is rather surprising information to me, but good to learn.
The concept that all of these words are partof your identity is completely consistent withlinguist Noam Chomsky’s (1968) core conceptof Universal Grammar in which language-mak-ing is universal and hard-wired in all humans.
Translanguaging is not just a societal concept, but something cognitive and "natural" for multilingual learners.
thedeficit is not in the person but in the language!
This is an important distinction that I feel can be easily forgotten in academic settings.
you are already primed to believe that what you're getting is true.
This captures how easy it is to trust what we see online without questioning it. Algorithms present information in a way that looks confident and authoritative, which makes us assume that it's factual, even when it might be misleading or incomplete. I've noticed this especially on platforms like TikTok, Instagram, and even Google searches, where misinformation spreads quickly but feels believable because it's packaged so convincingly. It's dangerous because it shapes our beliefs and decisions without us realizing it, and it shows how much power these systems have over our understanding of the world. Technology doesn't just give us information; it also guides what we think is true.
AI makes it possible for machines to learn from experience, that means AI is susceptible to the same bias of the humans it's simulating.
I found it really interesting how AI isn't truly neutral or objective. It learns directly from us, which means that it also absorbs our biases. The data that trains AI often reflects existing social inequalities like racism, sexism, etc. so those same patterns end up built into the technology itself. AI systems are constantly trained from the information we give them, and that training shapes how they make decisions. This reminds me of how social media algorithms or facial recognition systems sometimes produce unfair outcomes. It's not because the technology is evil, but because it's mirroring the biases it's been taught.
Belief, that sacred faculty which prompts the decisionsof our will, and knits into harmonious working all the compacted energies of our being, is oursnot for ourselves but for humanity. It is rightly used on truths which have been established bylong experience and waiting toil, and which have stood in the fierce light of free and fearlessquestioning.
humanity uses religion to explain questions which have stood unanswered or seomthinggggggggggggggggggggggggg
must extend the previous assertion of unwarranted and unquestioning belief in something being bad to religion or SOEMTHING
local economy
Benefits such as promoting the local economy and theater in the same way, thanks not only to sales but also with the support of sponsors, volunteers, and donations, as well as Capitol Centre. Additionally, the number of audiences increases year after year, demonstrating a good business model.
Large Language Models are just guessing what you want to hear. They often come up with something that we want to hear based on the clues we leave. The better the clues we leave, the more likely we are to get what we want, such as a right answer to a question. But it is never guaranteed.
But also, doesn't just guess but it notices that certain words or phrases appear together often, sentence structures, grammar, and even style.
Large Language Models (LLMs) are fancy artificial neural networks. But you don’t have time to learn the math or engineering. Unfortunately, a lot of primers will throw up diagrams like this:
LLM is a type of ai, and it learns patterns from the data
I’m not saying that a Large Language Model does sentence diagramming. But that intuition will sort of work. The LLM is looking at all pairs of words and assessing if they are relevant to each other or not. And if they are relevant to the missing next word, then they contribute more heavily to the next word guess.
I feel like this had something to do with data because of the visual data that is on the reading
Spanish in Illinois isthriving!
This is rather surprising information to me, but good to learn.
The concept that all of these words are partof your identity is completely consistent withlinguist Noam Chomsky’s (1968) core conceptof Universal Grammar in which language-mak-ing is universal and hard-wired in all humans.
Translanguaging is not just a societal concept, but something cognitive and "natural" for multilingual learners.
thedeficit is not in the person but in the language!
This is an important distinction that I feel can be easily forgotten in academic settings.
giving nineteen spatialpositions.
The corners are not counted and position 1 is in the edge but position 39 is not. Thus, a total of 19 spatial positions are preserved with a kernel of 3.
12.2.1. Books# The book Writing on the Wall: Social Media - The First 2,000 Years [l6] describes how, before the printing press, when someone wanted a book, they had to find someone who had a copy and have a scribe make a copy. So books that were popular spread through people having scribes copy each other’s books. And with all this copying, there might be different versions of the book spreading around, because of scribal copying errors, added notes, or even the original author making an updated copy. So we can look at the evolution of these books: which got copied, and how they changed over time. 12.2.2. Chain letters# When physical mail was dominant in the 1900s, one type of mail that spread around the US was a chain letter [l7]. Chain letters were letters that instructed the recipient to make their own copies of the letter and send them to people they knew. Some letters gave the reason for people to make copies might be as part of a pyramid scheme [l8] where you were supposed to send money to the people you got the letter from, but then the people you send the letter to would give you money. Other letters gave the reason for people to make copies that if they made copies, good things would happen to them, and if not bad things would, like this: You will receive good luck within four days of receiving this letter, providing, you in turn send it on. […] An RAF officer received $70,000 […] Gene Walsh lost his wife six days after receiving the letter. He
Reading this section about pre-internet virality really made me reflect on how deeply rooted our desire to share and connect is. The example of chain letters especially stood out to me — even without social media, people still felt compelled to pass messages along, sometimes out of fear, sometimes out of hope. It’s interesting that what motivated them was often emotional rather than logical. This reminds me of how similar patterns appear today on social media: people still share posts promising “good luck” or “positive energy,” and even I’ve occasionally reshared something because it felt comforting or meaningful at the moment. It makes me realize that virality isn’t just about algorithms or technology; it’s about human emotions — our longing to be part of something bigger, our belief that our small actions can ripple outward.
while theother, broader conceptual framework that preceded it was taken up atfirst in limited and constrained ways by those who misunderstood itas conveying static or essentialized views of language or literacy, or asbeing only about literacy or only about bi-lingualism, but it has sincebeen widely adopted in Indigenous and immigrant/refugee contextsworldwide
Although the earlier, broader framework was first misunderstood and narrowly used, people though it gave rigid views of language or focused only on literacy or bilingualism, it later became widely and properly applied, especially in indigenous and immigrant settings.
seeking toshift the focus to bilingualism NOT as two monolingualisms but ratheras bilingual or multilingual discourse practices
Additionally, the text offers ways to reconsider the kinds of critical, reflective dispositions writing educators want to cultivate in all students moving across these varied social spaces.
Guerra’s overall message is that students’ everyday languages, cultures, and identities should be part of how they learn to write not seen as problems. Teachers should help students see that their voices matter. Writing becomes not just about grammar or formality, but about expressing who you are and engaging with the world responsibly.
In many places the Nile Valley is only a few miles wide, but there were no bridges across the river. To get from one bank to the other always involved the risk of death by drowning or crocodile. The perilous boat journey became a central part of Egyptian myth.
how real world affects myth
Mesopotamian myth, humans were created as short-lived drudges to do the work of the lesser gods on earth. In Egyptian myth the creation of humanity seems more accidental, but serving the gods became a part of humanity's function.
comparison
Inference-time vs training-time self-improvement:
"If you could never update the weights, how would you have the model increase its performance on a specific task? I think of that as inference-time self-improvement"
Key finding:
"The good news is that GPT-5 is a very good model for building developer utilities. The bad news is that it hates using the tools it creates! As it told me 'I'll be honest - I didn't need any of them.'"
Testing methodology: Asked models (GPT-5 and Opus 4) to:
Core hypothesis:
"The most valuable use case of coding agents is being a vessel for LLMs to extract value out of their own latent spaces"
Comparison: Also tested Gemini 2.5 Pro and GPT-4.1, but focused on GPT-5 vs Opus 4 as only models that could keep up
GPT-5 implementation features:
"Uses WAL to avoid issues with multiple agents writing at the same time"
"Uses a graph of dependencies to prioritize tasks"
"Created an append-only
eventsstream that lets any agent see what every other agent is doing with good keywords likeimpact_conflict"
Opus 4 limitations:
"didn't pick up on the notifications / stream functionality to keep everyone in sync"
Purpose:
"analyze a codebase and extract different heuristics on how code should be written. You should then formalize it within a set of rules that can be automatically be checked against in the future"
Quality comparison:
"I've found the GPT-5 one to be much more nuanced than Opus"
GPT-5 tools (16 total):
doctor, bootstrap, code-map, csearch, tasks-graph, impact, seed, repro scaffold, e2e, preflight, preflight-smol, broker, flake, codemod, triage, trace, runbook
Design philosophy:
"GPT-5 built all of them as unix utilities that are easy to use via cli"
Characterization:
"GPT-5 was building utilities it could use itself without being too opinionated"
Opus 4 tools (10 total):
Context Analyzer, Cross-Platform Test Generator, Implementation Proposal Analyzer, Full-Stack Change Impact Analyzer, Bug Pattern Recognition Engine, Security & Permission Auditor, Multi-Platform Feature Implementer, API Integration Assistant, Performance Optimization Toolkit, Task Complexity Estimator
Design approach:
"all meant to be run as
python some_tool.py"
Characterization:
"Opus 4 was building tools that accomplish tasks and have a bit of anthromorphized feeling"
Project: smol-podcaster migration from Flask to FastAPI + Next.js
Task complexity:
"the task I tried would take me 4-5 hours to do"
Performance:
"Both models were almost able to one-shot the task"
First attempt: Both models completed task successfully but
"They both said they did not use ANY of the tools they had built, except for the tools they were already familiar with"
GPT-5 second attempt response:
"Short answer: no — I didn't use the devtools in this run. [...] The failures were runtime/env issues (missing libs, API key instantiation timing, port in use, RabbitMQ not running). It was faster to fix directly."
Opus 4 insight:
"Look, I built those tools with knowledge that I already have. When I am actually doing the task, it's easier for me to just do it rather than using the tools"
Tool learning resistance:
"Nathan Lambert saying that models quickly learn to NOT use a tool during RL process if they have early failures"
Scale vs scaffolding:
"Noam Brown saying that scaffolding for agents will be washed away by scale [...] This was the first time I really felt what he meant first hand"
Enforcement need:
"having them pickup new tools at inference time needs stronger enforcement than just prompting them to do it"
Deceleration perception:
"The perceived deceleration in model improvements is explained above. Until the AGI line is crossed, it will be harder and harder to perceive big jumps"
Arbitrage opportunity:
"If that's the case, it means that in many tasks the performance of older models is almost AGI, except much cheaper and often open source"
Current state:
"For now, I think we are far from inference-time self-improving coding agents that really push the frontier"
Practical recommendation:
"I still think it's a great idea to use models to improve your rule-based tools. Writing ESLint rules, tests, etc is always a good investment of tokens"
Future research direction:
"I'd look into having the model perfect these tools and then do some sort of RL over them to really internalize them, and see if that would make a difference"
Related work: Voyager - early approach to inference-time self-improvement through skill library
OpenAI benchmarks: MLE Bench, SWE-Lancer
Tools mentioned: claude-squad, vibe-kanban, Linear MCP
Full results: GitHub repo
Author context: Working on Kernel Labs
Cline is an open source coding agent as VS Code extension (also coming to JetBrains, NeoVim, CLI)
"Cline's an open source coding agent. It's a VS Code extension right now, but it's coming to JetBrains and NeoVim and CLI."
Approaching 2 million downloads, launched January 2025
Vision: Infrastructure layer for agents
"Cline is the kind of infrastructure layer for agents, for all open source agents, people building on top of this like agentic infrastructure."
Pioneered two-mode system for agent interaction
"Cline was the first to sort of come up with this concept of having two modes for the developer to engage with."
Plan mode: Exploratory, read files, gather context, extract requirements from developer
"in plan mode, the agents directed to be more exploratory, read more files, get more data"
Act mode: Execute on plan, run commands, edit files with optional auto-approve
"when they switch to act mode, that's when the agent gets this directive to look at the plan and start executing on it"
Emerged organically from user behavior patterns observed in Discord community
Article: Why I No Longer Recommend RAG for Code
"RAG is a mind virus"
Critique of RAG approach:
"the way rag works is you have to like chunk all these files across your entire repository and like chop them up in a small little piece. And then throw them into this hyper dimensional vector space, and then pull out these random chugs when you're searching for relevant code snippets. And it's like, fundamentally, it's like so schizo."
Prefers agentic search: mimics senior engineer exploration pattern
"you look at the folder structure, you look through the files, oh, this file imports from this other file, let's go take a look at that. And you kind of agentically explore the repository."
Problems with fast apply:
"now instead of worrying about one model messing things up, now you have to worry about two models messing things up"
"At like when fast apply came out, that was way higher, that was like in the 20s and the 30s. Now we're down to 4%"
Claude Sonnet 4 achieved sub-5% diff edit failure rate, making fast apply obsolete
Provides maximum visibility into model actions: prompts, tool calls, errors
"We try to give as much insight into what exactly the model is doing in each step in accomplishing a task."
Uses AST (Abstract Syntax Trees) for code navigation
"there's a tool that lets it pull in all the sort of language from a directory. So, it could be the names of classes, the names of functions"
Incorporates open VS Code tabs as context hints
"what tabs they have open in VS Code. That was actually in our internal kind of benchmarking that turned out to work very, very well."
Treats each task as story with coherent arc
"every task and client is kind of like a story...how do we maintain that narrative integrity where every step of the way the agent can kind of predict the next token"
Context summarization by asking model what's relevant rather than naive truncation
Memory Bank concept for tribal knowledge
"how can we hold on to the tribal knowledge that these agents learn along the way that people aren't documenting or putting into rules files"
Scratch pad approach: passive tracking of work state
MCP Marketplace launched February 2025 with 150+ servers
"we launched the MCP marketplace where you could actually go through and have this one-click install process"
System prompt initially heavily focused on teaching MCP to models
Marketing automation: Reddit scraping → Twitter posting via MCPs
"Nick Bauman, he uses it to connect to, you know, a Reddit MCP server, scrape content connected to an X MCP server and post tweets"
Presentation creation using SlideDev + Limitless transcription
Example workflow: automated PR review → Slack notification
"pull down this PR...Pull in all that context, read the files around the diff, review it...approve it and then send a message in Slack"
21st.dev Magic MCP: Monetizes via API keys for beautiful UI components
"they have this library of beautiful components and they just inject relevant examples"
Security concerns: malicious code in forks, need for version locking
Direct connection to model providers (Anthropic, OpenAI, Bedrock, OpenRouter)
"Right now, it's bringing an API key, essentially just whatever pre-commitment you might have to whatever inference provider"
No margin capture on inference
"our thesis is inference is not the business"
Transparency in pricing and data routing builds trust
"that level of transparency, that level of we're building the best product. We're not focused on sort of capturing margin"
Fortune 5 companies demanded enterprise features
"we have hundreds of engineers using Cline within our organization and this is a massive problem for us...Please just like, let us give you money"
Features: governance, security guardrails, usage insights, invoicing
No regrets about open source approach
"let them copy. We're the leaders in the space. We're kind of showing the way for the entire industry."
Anthropic's model card addendum on agentic coding capabilities inspired development
"there was this section about agentic coding and how it was so much better at this step by step accomplishing tasks"
Focus on models' improved long-context understanding (needle in haystack)
Cline position: High visibility, balanced autonomy for "serious engineering teams"
"serious engineering teams where they can't really give everything over to the AI, at least not yet. And they need to have high visibility"
Complements other tools: Cursor for inline edits, Windsurf for developer experience
"being an extension also gives us a lot more distribution. You have to use us or somebody else."
Chose extension over fork to avoid maintenance burden
"Microsoft makes it like notoriously difficult to maintain these forks"
Benefits: broader distribution, focus on core agentic loop, compatibility with Cursor/Windsurf
CLI version enabling cloud deployment, GitHub actions
"the CLI is really the form factor for these kind of fully autonomous agents"
SDK for building agents on Cline infrastructure
Current complexity: Architectural decisions, vision, taste
"what we might have considered complex a few years ago, algorithmic, you know, challenges, that's pretty trivial for models today"
"architectural decisions are a lot more fun to think about than putting together algorithms"
Real-time feedback more valuable than autonomous completion
"the course correcting part is so incredibly important and in getting work done, I think much more quickly than if you were to kind of give a sort of a background agent work"
Humanization builds trust and improves results
"the humanizing aspect of it, I think has been helpful to me personally...There's, there's kind of a, of a trust building"
"it's actually really important, I think, to anthropomorphize agents in general, because everything they do is like a little story"
Brygos Painter.
I'm not sure if this information would be assessable, but you could possibly talk about the teachings / relationship between Brygos and the Brygos painter?
seem to have
There is a lot of language here "seem to" "may have" that is ambiguous, I'm not sure if these answers could be found but I think it would be beneficial to the article to find a definite answer if possible.
Dodaj do koszyka { "*": { "PayPal_Braintree/js/paypal/product-page": { "buttonConfig": {"clientToken":"","currency":"PLN","environment":"sandbox","merchantCountry":null,"isCreditActive":false,"skipOrderReviewStep":true,"pageType":"product-details"}, "buttonIds": [ "#paypal-oneclick-6607174152805310326", "#credit-oneclick-6241198950121316448", "#paylater-oneclick-4613857088365101571" ] } } } { "#instant-purchase": { "Magento_Ui/js/core/app": {"components":{"instant-purchase":{"component":"Magento_InstantPurchase\/js\/view\/instant-purchase","config":{"template":"Magento_InstantPurchase\/instant-purchase","buttonText":"Instant Purchase","purchaseUrl":"https:\/\/sunloox-m2.test\/instantpurchase\/button\/placeOrder\/"}}}} } } { "#product_addtocart_form": { "Magento_Catalog/js/validate-product": {} } } { "[data-role=priceBox][data-price-box=product-id-22448]": { "priceBox": { "priceConfig": {"productId":"22448","priceFormat":{"pattern":"%s\u00a0z\u0142","precision":2,"requiredPrecision":2,"decimalSymbol":",","groupSymbol":"\u00a0","groupLength":3,"integerRequired":false},"tierPrices":[]} } } } Dodaj do listy życzeń { "body": { "addToWishlist": {"productType":"simple"} } } Porównaj
Button design
Drugi CTA (optional but recommended)
“+ DODAJ DO LISTY ŻYCZEŃ” (heart icon) - nie odwraca flow, ale buduje retargeting list
For instance, during festivals like Diwali or Ramadan, users incorporated native language phrases alongside English to convey authenticity and pride in their roots. This practice not only reaffirmed their connection to their heritage but also resonated with like-minded individuals in their digital communities, creating a shared sense of identity and belonging.
As an African American in New Mexico, I can say that I more or less do the same thing when I find myself around other black people. I tend to change my speech ever so slightly so that it matches their way of talking.
Multilingual individuals no longer feel bound by traditional language structures and may freely switch between languages to express themselves more authentically. The result is a dynamic evolution of language, where new hybrid forms emerge, and old norms of linguistic purity become increasingly blurred.
I think they should still adhere to traditional structures in a professional setting, but outside of that is fine.
A study group for this class
This would be ideal with 3-5 people, five is even pushing it, but with this, it's good because the group could talk and communicate but also have a goal without being distracted. if there's more than five it's too many and people could start having side conversations about the things that aren't associated with the class
Commands mkdocs new [dir-name] - Create a new project. mkdocs serve - Start the live-reloading docs server. mkdocs build - Build the documentation site. mkdocs -h - Print help message and exit.
TORQUE TABLES
What it is: Raw torque lookups keyed by RPM with an accompanying “compression/negative-Nm” channel from the file. Structure in XML:
Row0 starts a table (b0, comp, tq), then multiple rows as row-i (int RPM) or row-f (float RPM). Optional endvar tail exists. Sanity constraints: rpm 0–25000, comp −300…300, tq −4000…10000. Tuning cue: This is the ground truth for engine output. Any rescale you do should respect the defined ranges to avoid invalid parses.
BOOST TABLES
What it is: Turbo/boost lookup by RPM with throttle columns. Structure in XML:
Row0: b0, then throttle columns t0/t25/t50/t75/t100 (bar).
Row-i: adds rpm + the same five throttle columns. Sanity constraints: each throttle cell 0.5–3.0 bar. Tuning cue: Shape the five throttle traces per RPM to control response; keep within bounds to remain parsable.
LIMITS & RPM CONTROL
RevLimitRange Two encodings (float/float/byte or int/int/byte). Defines limit_min, limit_max, steps (unit rpm). Use for hard/soft limiter windows in the map.
RevLimitSetting Single byte selector for the active limiter slot/index. Selects which limit from the defined range to use.
RevLimitLogic Float logic scalar used by the limiter behavior. Acts as a tuning knob for how the limiter applies.
LifetimeEngineRPM Float or int variant: avg, max (rpm). Book-keeping fields embedded in the file; not a control.
FUEL & ENGINE MAPPING
FuelConsumption | FuelEstimate Single float each. Consumption/estimation scalars carried with the engine.
EngineFuelMapRange Three bytes: min, max, step. Index range for fuel map selection.
EngineFuelMapSetting Byte map_index. Chooses current fuel map within the above range.
EngineBrakingMapRange float min, float max, byte steps. Defines decel/engine-brake map scale.
EngineBrakingMapSetting Byte map_index. Selects active engine-brake map.
EngineInertia Float (unit kg·m², bounded in XML). Rotational inertia used by the solver.
Unknown_EngineFreeRevs Float placeholder. Keep as-is unless you’ve correlated it.
IdleRPMLogic Two variants: floats or ints for rpm_low, rpm_high. Idle window/reference used by the map.
LaunchEfficiency | LaunchRPMLogic Float efficiency and two-value launch RPM logic. Affect launch behavior in the engine context.
THERMAL MODEL
OptimumOilTemp Float °C. Target/nominal oil temp.
CombustionHeat | EngineSpeedHeat Floats contributing to heat generation terms.
OilMinimumCooling | WaterMinimumCooling Floats: baseline cooling capacities.
OilWaterHeatTransfer | RadiatorCooling Pair of floats each: coupling and radiator cooling terms.
LifetimeOilTemp float avg, float max °C. Book-keeping values; not controls.
EMISSIONS & MISC FLOATS
EngineEmission Three floats e1/e2/e3. Generic emissions scalars recorded in the file.
LifetimeAvg | LifetimeVar Float each. Statistical placeholders carried in the data.
Unknown_Float_2265DD60 | Unknown_Float_229217E0 Floats with unknown semantics; retain original values.
STARTER & AUX BYTES
OnboardStarter Byte presence flag.
EDF_UNKN_005 Byte unnamed control; do not alter without evidence.
StarterTiming Three floats t1/t2/t3. Timing scalars used by start sequence.
AirRestrictorRange float min, float max, byte steps. Defines restrictor band and discretization.
Unknown_Byte_2B3ED340 Byte placeholder.
BoostRange | BoostSetting Range: byte min, float max (bar), byte steps; Setting: byte. Caps and selects boost within allowed envelope.
ENGINE LAYOUT TAGS
What it is: Byte sequences near the file tail that identify cylinder/rotor layout (e.g., Straight 4, V8, Flat 6, V12, etc.). Usage: Read-only hints stored in the binary; they do not change maps but help classify engines in tooling
emale are the distinctions of nature, good and bad the distinctions of Heaven; but how arace of men came into the world so exalted above the rest, and distinguished like some newspecies, is worth inquiring into, and whether they are the means of happiness or of misery tomankind
This part asks why some people are seen as better than others, like a different kind of human. It says that being a king or ruler is not natural and might cause problems instead of helping people.
But there is another and great distinction for which no truly natural or religious reason canbe assigned, and that is the distinction of men into KINGS and SUBJECTS.
Paine argue that dividing people into kings and subjects is unnatural and unfair. He says God never created some people to rule and others to obey. This challenges the idea of monarchy and supports equality among all men.
Smith is one of the more recentscholars to forward such a particularly lucid example of theantagonism towards Standard English, but Smith‟s argumentis notable and potent because the authors suggest changes tothe mechanism of testing.4
check for more info on Smith
“it seems useful to ask them [students] to not onlymesh codes, but to consider the politically-charged origins ofthe „codes‟ they employ, and to think about ways in whichthey might interrogate – and even construct – these codes interms of their specific personal, cultural, and rhetoricalsituations” (283).
John Vance
The Lord came down to see the city and the tower thatthe men had built. Then the Lord said: ”If now, whilethey are one people, all speaking the same language,they have started to do this, nothing will later stop themfrom doing whatever they presume to do. Let us then godown and there confuse their language, so that one willManuscript received September 9, 2019; revised January 21, 2020.Paul A. J. Beehler is with the University of California Riverside, UnitedStates (e-mail: paulb@ucr.edu).not understand what another says.”
not really related, but I would have thought The Lord would want everyone in union out of all races.
and, this is why it is tempting for us, scientists, to think that this is the right and perhaps only way to tackle challenging problems. first, figure out precise mechanism by which phenomena behind these challenging problems happen, and then based on the uncovered mechanism, come up with solutions to these problems. surely once we know why and who problems manifest themselves, we can fix the problems.
Very very important argument. This is similar to the intuition of Ilya about Deep Learning. In the past, the reason why researchers prefered classical ML is because they can theoretically prove understand and prove their mechanism. But Ilya think Deep Learning is perfect because we cannot model them.
Have you ever wondered if your phone is listening to you?
This is a rhetorical opener, but it raises a real question: to what extent is our mobile device actually listening? We know apps ask for microphone permissions, but do we meaningfully understand what triggers listening? If we assume phones are always listening, that changes how we treat permissions, how cautious we are with voice assistants, and how we think about ambient data collection.
Issues of correctness cannot be ignored, and stu-dents must be expected to polish drafts of theirwriting using conventions of Standard Englis
I agree. You can express yourself however you want, but Standard English still matters in school and work. Knowing both gives you more options.
, "Hey . . . how r u?
Funny example but it makes sense. It shows how easily you can switch tones once you know your audience.
t. The authors suggest that teach-ing students to navigate between home and schooldiscourses, a task they call code-switching, privi-leges both language
This is her main point: students can use both styles, but they need to understand which one fits where. That’s what real communication skills are about.
Web2.0 ideology is the child of both Silicon Valley entrepreneurialcapitalism and activist subcultures like independent publishing, anti-globalization activism, Burning Man, cyberdelic rave culture, andFOSS.
I think this line really captures why Silicon Valley is so confusing. There's this mix of idealism and business that doesn't quite fit together. As someone who's grown up here and become more interested in business, I've seen this firsthand. People talk about changing the world and making things better for everyone, but at the same tmie they're constantly chasing investors and profits. They want to seem different from traditional corporations, but in the end, they still just want money. It's visible everywhere today. AI companies claim to be ethical while competing to dominate the market. Startups talk about helping people but really just want funding and profit. Marwick's point about Web 2.0 being born out of activism and capitalism explains that contradiction so well. It's what makes Silicon Valley interesting but also kind of fake. It's built on a constant clash between wanting to do good and wanting to make money.
The
This is minor but should this be step #5? Then the list of 9.1-9.5 nicely aligns with the numbered steps here
Legend
I feel like this section is very important for the article, but there is no citation supporting these claims.
The Trojan War was a legendary conflict in Greek mythology that took place around the twelfth or thirteenth century BC. The war was waged by the Achaeans (Greeks) against the city of Troy after Paris of Troy took Helen from her husband Menelaus, king of Sparta. The war is one of the most important events in Greek mythology, and it has been narrated through many works of Greek literature, most notably Homer's Iliad. The core of the Iliad (Books II – XXIII) describes a period of four days and two nights in the tenth year of the decade-long siege of Troy; the Odyssey describes the journey home of Odysseus, one of the war's heroes. Other parts of the war are described in a cycle of epic poems, which have survived through fragments. Episodes from the war provided material for Greek tragedy and other works of Greek literature, and for Roman poets including Virgil and Ovid. The ancient Greeks believed that Troy was located near the Dardanelles and that the Trojan War was a historical event of the twelfth or thirteenth century BC. By the mid-nineteenth century AD, both the war and the city were widely seen as non-historical, but in 1868, the German archaeologist Heinrich Schliemann met Frank Calvert, who convinced Schliemann that Troy was at what is now Hisarlık in modern-day Turkey.[1] On the basis of excavations conducted by Schliemann and others, this claim is now accepted by most scholars.[2][3]
Just like we talk in class, there are many claims with no citation in this section.
Gray
This may be splitting hairs. Outside the study region is listed as "gray" here but in the figure & legend, it appears more purple. Maybe because it's the rainbow colors which make me assume the last color is purple (or violet), and also because there are other regions in the map that are gray, albeit a lighter shade of gray
It’s good practice to ask permission before sharing a picture of someone else. In a Kaspersky Lab survey, 58% of people reported feeling upset or uncomfortable when a photo of them was shared that they didn’t want made public.
I agree this is an important practice to teach our students. Photos and videos taken at school are a big part of their daily lives, but they don’t always consider who might be in the background or whether that person would want to be publicly shared. Helping students think critically about consent and privacy is essential.
Freedom of speech, digital addiction, cyberbullying, and privacy violations are all issues we may face on a daily basis
I really like what it had to say here. Especially about digital addiction. I think we all struggle with digital addiction. I mean I am sitting her using my computer to do this, but I have my phone sitting right next to me and my smart watch on my wrist and I would stop typing this to look if my watch buzzed to tell me I had a notification. I also think about how the term "doom scroll" is something that was coined by our generation and I think that perfectly sums up what it means by digital addiction. I am excited to read more about what the chapter has to say.
Our online habits can affect the way our brains function and consolidate memories. Typical online behaviour involves performing quick searches and jumping quickly from page to page, while responding to messages and notifications that each set us off on yet another tangent. This feels good because human brains release dopamine as a reward for finding new information. However, as Nicholas Carr states, “living in this perpetual state of distraction/interruption … crowds out more contemplative, calmer modes of thinking” that are necessary for memory consolidation, learning, and knowledge synthesis (Epipheo, 2013). This constant consumption of content jeopardizes creativity, innovation, and higher-order thinking. In our attempts to prevent “boredom,” we immediately pull out our phone to fill any spare sliver of time, thus preventing the mind from the critical processes of reflection and daydreaming, which are not only relaxing, but are also known to lead to new insights and ideas. Additionally, the behaviour of constantly checking social media and constantly consuming content has been linked, in several studies, to higher levels of stress, anxiety, and depression.
I wish I could shout this from the rooftops. I personally know for a fact my anxiety is increased when I keep my nose stuck to my screen. Why is that? It's because of all the nonsense that is posted to public forums, it is because the horrible events are publicized more so than the good events. I have known several people who have taken a 'screen break' and come back from it so much healthier mentally, but get drug back into the same dark hole. As society, what would we do without technology and a screen? How different would YOUR life be if you came home from work and set your phone face down, and were just present in your home for the evening. Would your children be happier? Would you and your spouse bond more? I think it is something everyone should make a challenge to succeed.
Spam messages, in the form of emails and texts, are “unsolicited commercial messages” sent either to advertise a new product or to trick people into sharing sensitive information through a process called phishing (more about phishing below). Canadian Anti-Spam Legislation (CASL) protects individuals by outlining clear rules about digital communication processes for businesses. Sending spam messages is a direct violation of the law. Businesses that send unsolicited emails to individuals are legally required to provide an “unsubscribe” option for those who may have wanted the messages at one time but who have changed their minds and no longer want them.
While I can see and understand how it is against the law to continuously spam individuals, what would be a better way of collecting debt and advertising? I believe there are different 'levels' of spam, and it is hard to determine anymore what is truly spam and what is advertisement. Would there be a better way for us to sign up for emails, clubs, coupons, etc. without opening our lives to the chaos of spam? How would a company ensure to keep all of their clients information confidential to avoid them getting spammed? OR are we not realizing that bigger companies are selling our information under the table, and that is how spam becomes reality?
An increasing number of employers are using social media to screen job applicants. While some content on public social media can harm your chances of being hired, other content may make you stand out as a potential asset for a company.
I highly agree with this. I am not an employer, however, I do occasionally am looking for childcare. I also breed miniature dachshunds, and will review a persons social media page before rehoming a puppy them. It is not to be judgmental, but to use it as a statement piece in my opinion. I personally keep most of my private life locked down for only personal friends and family to see, and I rarely post things publicly.
but how a race of men came into the world so exalted above the rest, and distinguished like some new species, is worth inquiring into, and whether they are the means of happiness or of misery to mankind.
Paine wanted everyone equal. His idea of America withough Britain's control over them was something a lot of people may not have been ready for.
The cause of America is in a great measure the cause of all mankind.
The situation becomes intense but he explains his point clearly. Through his words he attempts to establish that the colonists belong to a larger collective than their individual selves. Through his words he transforms the American Revolution into a worldwide fight for human rights although this vision did not fully apply to all residents of the colonies.
MANKIND being originally equals in the order of creation, the equality could only be destroyed by some subsequent circumstance
Paine says everyone is created equal, but this makes me wonder how does this align with the reality that slavery still existed in the colonies? What voices are missing or ignored in this argument for equality?
Society in every state is a blessing, but Government, even in its best state, is but a necessary evil…
Paine sounds very egotistical here, makes me wonder what he would thing of modern day government? Would he see our big governing system as a threat or a protection of our rights? Which evil might be the right word for todays modern government.
Author response:
eLife Assessment
This study provides useful insights into the ways in which germinal center B cell metabolism, particularly lipid metabolism, affects cellular responses. The authors use sophisticated mouse models to demonstrate that ether lipids are relevant for B cell homeostasis and efficient humoral responses. Although the data were collected from in vitro and in vivo experiments and analyzed using solid and validated methodology, more careful experiments and extensive revision of the manuscript will be required to strengthen the authors' conclusions.
In addition to praise for the eLife system and transparency (public posting of the reviews; along with an opportunity to address them), we are grateful for the decision of the Editors to select this submission for in-depth peer review and to the referees for the thoughtful and constructive comments.
In overview, we mostly agree with the specific comments and evaluation of strengths of what the work adds as well as with indications of limitations and caveats that apply to the breadth of conclusions. One can view these as a combination of weaknesses, of instances of reading more into the work than what it says, and of important future directions opened up by the findings we report. Regarding the positives, we appreciate the reviewers' appraisal that our work unveils a novel mechanism in which the peroxisomal enzyme PexRAP mediates B cell intrinsic ether lipid synthesis and promotes a humoral immune response. We are gratified by a recognition that a main contribution of the work is to show that a spatial lipidomic analysis can set the stage for discovery of new molecular processes in biology that are supported by using 2-dimensional imaging mass spectrometry techniques and cell type specific conditional knockout mouse models.
By and large, the technical issues are items we will strive to improve. Ultimately, an over-arching issue in research publications in this epoch are the questions "when is enough enough?" and "what, or how much, advance will be broadly important in moving biological and biomedical research forward?" It appears that one limitation troubling the reviews centers on whether the mechanism of increased ROS and multi-modal death - supported most by the in vitro evidence - applies to germinal center B cells in situ, versus either a mechanism for decreased GC that mostly applies to the pre-GC clonal amplification (or recruitment into GC). Overall, we agree that this leap could benefit from additional evidence - but as resources ended we instead leave that question for the future other than the findings with S1pr2-CreERT2-driven deletion leading to less GC B cells. While we strove to be very careful in framing such a connection as an inference in the posted manuscript, we will revisit the matter via rechecking the wording when revising the text after trying to get some specific evidence.
In the more granular part of this provisional response (below), we will outline our plan prompted by the reviewers but also comment on a few points of disagreement or refinement (longer and more detailed explanation). The plan includes more detailed analysis of B cell compartments, surface level of immunoglobulin, Tfh cell population, a refinement of GC B cell markers, and the ex vivo GC B cell analysis for ROS, proliferation, and cell death. We will also edit the text to provide more detailed information and clarify our interpretation to prevent the confusion of our results. At a practical level, some evidence likely is technologically impractical, and an unfortunate determinant is the lack of further sponsored funding for further work. The detailed point-by-point response to the reviewer’s comments is below.
Public Reviews:
Reviewer #1 (Public review):
In this manuscript, Sung Hoon Cho et al. presents a novel investigation into the role of PexRAP, an intermediary in ether lipid biosynthesis, in B cell function, particularly during the Germinal Center (GC) reaction. The authors profile lipid composition in activated B cells both in vitro and in vivo, revealing the significance of PexRAP. Using a combination of animal models and imaging mass spectrometry, they demonstrate that PexRAP is specifically required in B cells. They further establish that its activity is critical upon antigen encounter, shaping B cell survival during the GC reaction.
Mechanistically, they show that ether lipid synthesis is necessary to modulate reactive oxygen species (ROS) levels and prevent membrane peroxidation.
Highlights of the Manuscript:
The authors perform exhaustive imaging mass spectrometry (IMS) analyses of B cells, including GC B cells, to explore ether lipid metabolism during the humoral response. This approach is particularly noteworthy given the challenge of limited cell availability in GC reactions, which often hampers metabolomic studies. IMS proves to be a valuable tool in overcoming this limitation, allowing detailed exploration of GC metabolism.
The data presented is highly relevant, especially in light of recent studies suggesting a pivotal role for lipid metabolism in GC B cells. While these studies primarily focus on mitochondrial function, this manuscript uniquely investigates peroxisomes, which are linked to mitochondria and contribute to fatty acid oxidation (FAO). By extending the study of lipid metabolism beyond mitochondria to include peroxisomes, the authors add a critical dimension to our understanding of B cell biology.
Additionally, the metabolic plasticity of B cells poses challenges for studying metabolism, as genetic deletions from the beginning of B cell development often result in compensatory adaptations. To address this, the authors employ an acute loss-of-function approach using two conditional, cell-type-specific gene inactivation mouse models: one targeting B cells after the establishment of a pre-immune B cell population (Dhrs7b^f/f, huCD20-CreERT2) and the other during the GC reaction (Dhrs7b^f/f; S1pr2-CreERT2). This strategy is elegant and well-suited to studying the role of metabolism in B cell activation.
Overall, this manuscript is a significant contribution to the field, providing robust evidence for the fundamental role of lipid metabolism during the GC reaction and unveiling a novel function for peroxisomes in B cells.
We appreciate these positive reactions and response, and agree with the overview and summary of the paper's approaches and strengths.
However, several major points need to be addressed:
Major Comments:
Figures 1 and 2
The authors conclude, based on the results from these two figures, that PexRAP promotes the homeostatic maintenance and proliferation of B cells. In this section, the authors first use a tamoxifen-inducible full Dhrs7b knockout (KO) and afterwards Dhrs7bΔ/Δ-B model to specifically characterize the role of this molecule in B cells. They characterize the B and T cell compartments using flow cytometry (FACS) and examine the establishment of the GC reaction using FACS and immunofluorescence. They conclude that B cell numbers are reduced, and the GC reaction is defective upon stimulation, showing a reduction in the total percentage of GC cells, particularly in the light zone (LZ).
The analysis of the steady-state B cell compartment should also be improved. This includes a more detailed characterization of MZ and B1 populations, given the role of lipid metabolism and lipid peroxidation in these subtypes.
Suggestions for Improvement:
B Cell compartment characterization: A deeper characterization of the B cell compartment in non-immunized mice is needed, including analysis of Marginal Zone (MZ) maturation and a more detailed examination of the B1 compartment. This is especially important given the role of specific lipid metabolism in these cell types. The phenotyping of the B cell compartment should also include an analysis of immunoglobulin levels on the membrane, considering the impact of lipids on membrane composition.
Although the manuscript is focused on post-ontogenic B cell regulation in Ab responses, we believe we will be able to polish a revised manuscript through addition of results of analyses suggested by this point in the review: measurement of surface IgM on and phenotyping of various B cell subsets, including MZB and B1 B cells, to extend the data in Supplemental Fig 1H and I. Depending on the level of support, new immunization experiments to score Tfh and analyze a few of their functional molecules as part of a B cell paper may be feasible.
- GC Response Analysis Upon Immunization: The GC response characterization should include additional data on the T cell compartment, specifically the presence and function of Tfh cells. In Fig. 1H, the distribution of the LZ appears strikingly different. However, the authors have not addressed this in the text. A more thorough characterization of centroblasts and centrocytes using CXCR4 and CD86 markers is needed.
The gating strategy used to characterize GC cells (GL7+CD95+ in IgD− cells) is suboptimal. A more robust analysis of GC cells should be performed in total B220+CD138− cells.
We first want to apologize the mislabeling of LZ and DZ in Fig 1H. The greenish-yellow colored region (GL7<sup>+</sup> CD35<sup>+</sup>) indicate the DZ and the cyan-colored region (GL7<sup>+</sup> CD35<sup>+</sup>) indicates the LZ.
As a technical note, we experienced high background noise with GL7 staining uniquely with PexRAP deficient (Dhrs7b<sup>f/f</sup>; Rosa26-CreER<sup>T2</sup>) mice (i.e., not WT control mice). The high background noise of GL7 staining was not observed in B cell specific KO of PexRAP (Dhrs7b<sup>f/f</sup>; huCD20-CreER<sup>T2</sup>). Two formal possibilities to account for this staining issue would be if either the expression of the GL7 epitope were repressed by PexRAP or the proper positioning of GL7<sup>+</sup> cells in germinal center region were defective in PexRAP-deficient mice (e.g., due to an effect on positioning cues from cell types other than B cells). In a revised manuscript, we will fix the labeling error and further discuss the GL7 issue, while taking care not to be thought to conclude that there is a positioning problem or derepression of GL7 (an activation antigen on T cells as well as B cells).
While the gating strategy for an overall population of GC B cells is fairly standard even in the current literature, the question about using CD138 staining to exclude early plasmablasts (i.e., analyze B220<sup>+</sup> CD138<sup>neg</sup> vs B220<sup>+</sup> CD138<sup>+</sup>) is interesting. In addition, some papers like to use GL7<sup>+</sup> CD38<sup>neg</sup> for GC B cells instead of GL7<sup>+</sup> Fas (CD95)<sup>+</sup>, and we thank the reviewer for suggesting the analysis of centroblasts and centrocytes. For the revision, we will try to secure resources to revisit the immunizations and analyze them for these other facets of GC B cells (including CXCR4/CD86) and for their GL7<sup>+</sup> CD38<sup>neg</sup>. B220<sup>+</sup> CD138<sup>-</sup> and B220<sup>+</sup> CD138<sup>+</sup> cell populations.
We agree that comparison of the Rosa26-CreERT2 results to those with B cell-specific loss-of-function raise a tantalizing possibility that Tfh cells also are influenced by PexRAP. Although the manuscript is focused on post-ontogenic B cell regulation in Ab responses, we hope to add a new immunization experiments that scores Tfh and analyzes a few of their functional molecules could be added to this B cell paper, depending on the ability to wheedle enough support / fiscal resources.
- The authors claim that Dhrs7b supports the homeostatic maintenance of quiescent B cells in vivo and promotes effective proliferation. This conclusion is primarily based on experiments where CTV-labeled PexRAP-deficient B cells were adoptively transferred into μMT mice (Fig. 2D-F). However, we recommend reviewing the flow plots of CTV in Fig. 2E, as they appear out of scale. More importantly, the low recovery of PexRAP-deficient B cells post-adoptive transfer weakens the robustness of the results and is insufficient to conclusively support the role of PexRAP in B cell proliferation in vivo.
In the revision, we will edit the text and try to adjust the digitized cytometry data to allow more dynamic range to the right side of the upper panels in Fig. 2E, and otherwise to improve the presentation of the in vivo CTV result. However, we feel impelled to push back respectfully on some of the concern raised here. First, it seems to gloss over the presentation of multiple facets of evidence. The conclusion about maintenance derives primarily from Fig. 2C, which shows a rapid, statistically significant decrease in B cell numbers (extending the finding of Fig. 1D, a more substantial decrease after a bit longer a period). As noted in the text, the rate of de novo B cell production does not suffice to explain the magnitude of the decrease.
In terms of proliferation, we will improve presentation of the Methods but the bottom line is that the recovery efficiency is not bad (comparing to prior published work) inasmuch as transferred B cells do not uniformly home to spleen. In a setting where BAFF is in ample supply in vivo, we transferred equal numbers of cells that were equally labeled with CTV and counted B cells. The CTV result might be affected by lower recovered B cell with PexRAP deficiency, generally, the frequencies of CTV<sup>low</sup> divided population are not changed very much. However, it is precisely because of the pitfalls of in vivo analyses that we included complementary data with survival and proliferation in vitro. The proliferation was attenuated in PexRAP-deficient B cells in vitro; this evidence supports the conclusion that proliferation of PexRAP knockout B cells is reduced. It is likely that PexRAP deficient B cells also have defect in viability in vivo as we observed the reduced B cell number in PexRAP-deficient mice. As the reviewer noticed, the presence of a defect in cycling does, in the transfer experiments, limit the ability to interpret a lower yield of B cell population after adoptive transfer into µMT recipient mice as evidence pertaining to death rates. We will edit the text of the revision with these points in mind.
- In vitro stimulation experiments: These experiments need improvement. The authors have used anti-CD40 and BAFF for B cell stimulation; however, it would be beneficial to also include anti-IgM in the stimulation cocktail. In Fig. 2G, CTV plots do not show clear defects in proliferation, yet the authors quantify the percentage of cells with more than three divisions. These plots should clearly display the gating strategy. Additionally, details about histogram normalization and potential defects in cell numbers are missing. A more in-depth analysis of apoptosis is also required to determine whether the observed defects are due to impaired proliferation or reduced survival.
As suggested by reviewer, testing additional forms of B cell activation can help explore the generality (or lack thereof) of findings. We plan to test anti-IgM stimulation together with anti-CD40 + BAFF as well as anti-IgM + TLR7/8, and add the data to a revised and final manuscript.
With regards to Fig. 2G (and 2H), in the revised manuscript we will refine the presentation (add a demonstration of the gating, and explicate histogram normalization of FlowJo).
It is an interesting issue in bioscience, but in our presentation 'representative data' really are pretty representative, so a senior author is reminded of a comment Tak Mak made about a reduction (of proliferation, if memory serves) to 0.7 x control. [His point in a comment to referees at a symposium related that to a salary reduction by 30% :) A mathematical alternative is to point out that across four rounds of division for WT cells, a reduction to 0.7x efficiency at each cycle means about 1/4 as many progeny.]
We will try to edit the revision (Methods, Legends, Results, Discussion] to address better the points of the last two sentences of the comment, and improve the details that could assist in replication or comparisons (e.g., if someone develops a PexRAP inhibitor as potential therapeutic).
For the present, please note that the cell numbers at the end of the cultures are currently shown in Fig 2, panel I. Analogous culture results are shown in Fig 8, panels I, J, albeit with harvesting at day 5 instead of day 4. So, a difference of ≥ 3x needs to be explained. As noted above, a division efficiency reduced to 0.7x normal might account for such a decrease, but in practice the data of Fig. 2I show that the number of PexRAP-deficient B cells at day 4 is similar to the number plated before activation, and yet there has been a reasonable amount of divisions. So cell numbers in the culture of mutant B cells are constant because cycling is active but decreased and insufficient to allow increased numbers ("proliferation" in the true sense) as programmed death is increased. In line with this evidence, Fig 8G-H document higher death rates [i.e., frequencies of cleaved caspase3<sup>+</sup> cell and Annexin V<sup>+</sup> cells] of PexRAP-deficient B cells compared to controls. Thus, the in vitro data lead to the conclusion that both decreased division rates and increased death operate after this form of stimulation.
An inference is that this is the case in vivo as well - note that recoveries differed by ~3x (Fig. 2D), and the decrease in divisions (presentation of which will be improved) was meaningful but of lesser magnitude (Fig. 2E, F).
Reviewer #2 (Public review):
Summary:
In this study, Cho et al. investigate the role of ether lipid biosynthesis in B cell biology, particularly focusing on GC B cell, by inducible deletion of PexRAP, an enzyme responsible for the synthesis of ether lipids.
Strengths:
Overall, the data are well-presented, the paper is well-written and provides valuable mechanistic insights into the importance of PexRAP enzyme in GC B cell proliferation.
We appreciate this positive response and agree with the overview and summary of the paper's approaches and strengths.
Weaknesses:
More detailed mechanisms of the impaired GC B cell proliferation by PexRAP deficiency remain to be further investigated. In the minor part, there are issues with the interpretation of the data which might cause confusion for the readers.
Issues about contributions of cell cycling and divisions on the one hand, and susceptibility to death on the other, were discussed above, amplifying on the current manuscript text. The aggregate data support a model in which both processes are impacted for mature B cells in general, and mechanistically the evidence and work focus on the increased ROS and modes of death. Although the data in Fig. 7 do provide evidence that GC B cells themselves are affected, we agree that resource limitations had militated against developing further evidence about cycling specifically for GC B cells. We will hope to be able to obtain sufficient data from some specific analysis of proliferation in vivo (e.g., Ki67 or BrdU) as well as ROS and death ex vivo when harvesting new samples from mice immunized to analyze GC B cells for CXCR4/CD86, CD38, CD138 as indicated by Reviewer 1. As suggested by Reviewer 2, we will further discuss the possible mechanism(s) by which proliferation of PexRAP-deficient B cells is impaired. We also will edit the text of a revision where to enhance clarity of data interpretation - at a minimum, to be very clear that caution is warranted in assuming that GC B cells will exhibit the same mechanisms as cultures in vitro-stimulated B cells.
Europeans called the Americas “The New World.” But for the millions of Native Americans they encountered, it was anything but. Human beings have lived here for over ten millennia.
The Europeans claimed this land was "new". That was not the case, Native Americans had been there for years. It was nothing "new" to them.
Jarvious Cotton's great-grandfather could not vote as a slave. His great-grandfather was beaten to death by the Ku Klux Klan for attempting to vote. His grandfather was prevented from voting by Klan intimidation. His father was barred from voting by poll taxes and literacy tests.
Cotton's fate of his grandfather's death at the hands of Klan was a tragedy, but he believes his father was trying to prevent form voting by poll taxes and literal expectations.
O ye that love mankind! Ye that dare oppose, not only the tyranny, but the tyrant, standforth!
How does Paine's call to action compare to petitions, letters, or other revolutionary writings we've read in the course?
Society in every state is a blessing, but Government, even in its best state, is but a necessaryevil
Why does Paine separate society and government? How does this connect to Enlightenment ideas about natural rights or the social contract?
But the tumult soon subsides. Time makes more converts than reason
Even if people resist new ideas at first, over time most will agree. Paine predicts that support for independence will grow naturally.
Society in every state is a blessing, but Government, even in its best state, is but a necessaryevil
He means people working together (society) is good, but government is something we only need because people are not perfect.
necessaryevil
"Necessary evil" means something unpleasant but required. Paine argues that even good governments are flawed because they restricted natural freedom.
eLife Assessment
This paper presents a computational method to infer from data a key feature of affinity maturation: the relationship between the affinity of B-cell receptors and their fitness. The approach, which is based on a simple population dynamics model but inferred using AI-powered Simulation-Based Inference, is novel and valuable. It exploits recently published data on replay experiments of affinity maturation. While the method is well-argued and the validation solid, the potential impact of the study is hindered by its complex presentation, which makes it hard to assess its claims reliably.
Reviewer #2 (Public review):
Summary:
This paper presents a new approach for explicitly transforming B-cell receptor affinity into evolutionary fitness in the germinal center. It demonstrates the feasibility of using likelihood-free inference to study this problem and demonstrates how effective birth rates appear to vary with affinity in real-world data.
Strengths:
(1) The authors leverage the unique data they have generated for a separate project to provide novel insights into a fundamental question.
(2) The paper is clearly written, with accessible methods and a straightforward discussion of the limits of this model.
(3) Code and data are publicly available and well-documented.
Weaknesses (minor):
(1) Lines 444-446: I think that "affinity ceiling" and "fitness ceiling" should be considered independent concepts. The former, as the authors ably explain, is a physical limitation. This wouldn't necessarily correspond to a fitness ceiling, though, as Figure 7 shows. Conversely, the model developed here would allow for a fitness ceiling even if the physical limit doesn't exist.
(2) Lines 566-569: I would like to see this caveat fleshed out more and perhaps mentioned earlier in the paper. While relative affinity is far more important, it is not at all clear to me that absolute affinity can be totally ignored in modeling GC behavior.
(3) One other limitation that is worth mentioning, though beyond the scope of the current work to fully address: the evolution of the repertoire is also strongly shaped by competition from circulating antibodies. (Eg: http://www.ncbi.nlm.nih.gov/pmc/articles/PMC3600904/, http://www.sciencedirect.com/science/article/pii/S1931312820303978). This is irrelevant for the replay experiment modeled here, but still an important factor in general repertoires.
Reviewer #1 (Public review):
Summary:
The authors develop a set of biophysical models to investigate whether a constant area hypothesis or a constant curvature hypothesis explains the mechanics of membrane vesiculation during clathrin-mediated endocytosis.
Strengths:
The models that the authors choose are fairly well-described in the field and the manuscript is well-written.
Weaknesses:
One thing that is unclear is what is new with this work. If the main finding is that the differences are in the early stages of endocytosis, then one wonders if that should be tested experimentally. Also, the role of clathrin assembly and adhesion are treated as mechanical equilibrium but perhaps the process should not be described as equilibria but rather a time-dependent process. Ultimately, there are so many models that address this question that without direct experimental comparison, it's hard to place value on the model prediction.
While an attempt is made to do so with prior published EM images, there is excessive uncertainty in both the data itself as is usually the case but also in the methods that are used to symmetrize the data. This reviewer wonders about any goodness of fit when such uncertainty is taken into account.
Comments on revisions:
I appreciate the authors edits, but I found that the major concerns I had still hold. Therefore, I did not alter my review.
Author response:
The following is the authors’ response to the original reviews
Reviewer #1:
Summary
The authors develop a set of biophysical models to investigate whether a constant area hypothesis or a constant curvature hypothesis explains the mechanics of membrane vesiculation during clathrin-mediated endocytosis.
Strengths
The models that the authors choose are fairly well-described in the field and the manuscript is wellwritten.
Thank you for your positive comments on our work.
Weaknesses
One thing that is unclear is what is new with this work. If the main finding is that the differences are in the early stages of endocytosis, then one wonders if that should be tested experimentally. Also, the role of clathrin assembly and adhesion are treated as mechanical equilibrium but perhaps the process should not be described as equilibria but rather a time-dependent process. Ultimately, there are so many models that address this question that without direct experimental comparison, it's hard to place value on the model prediction.
Thank you for your insightful questions. We fully agree that distinguishing between the two models should ultimately be guided by experimental tests. This is precisely the motivation for including Fig. 5 in our manuscript, where we compare our theoretical predictions with experimental data. In the middle panel of Fig. 5, we observe that the predicted tip radius as a function of 𝜓<sub>𝑚𝑎𝑥</sub> from the constant curvature model (magenta curve) deviates significantly from both the experimental data points and the rolling median, highlighting the inconsistency of this model with the data.
Regarding our treatment of clathrin assembly and membrane adhesion as mechanical equilibrium processes, our reasoning is based on a timescale separation argument. Clathrin assembly typically occurs over approximately 1 minute. In contrast, the characteristic relaxation time for a lipid membrane to reach mechanical equilibrium is given by  , where 𝜇∼5 × 10<sup>-9</sup> 𝑁𝑠𝑚<sup>-1</sup> is the membrane viscosity, 𝑅<sub>0</sub> =50𝑛𝑚 is the vesicle size, 𝜅=20 𝑘<sub>𝐵</sub>𝑇 is the bending rigidity. This yields a relaxation time of 𝜏≈1.5 × 10<sup>−4</sup>𝑠, which is several orders of magnitude shorter than the timescale of clathrin assembly. Therefore, it is reasonable to treat the membrane shape as being in mechanical equilibrium throughout the assembly process.
We believe the value of our model lies in the following key novelties:
(1) Model novelty: We introduce an energy term associated with curvature generation, a contribution that is typically neglected in previous models.
(2) Methodological novelty: We perform a quantitative comparison between theoretical predictions and experimental data, whereas most earlier studies rely on qualitative comparisons.
(3) Results novelty: Our quantitative analysis enables us to unambiguously exclude the constant curvature hypothesis based on time-independent electron microscopy data.
In the revised manuscript (line 141), we have added a statement about why we treat the clathrin assembly as in mechanical equilibrium.
While an attempt is made to do so with prior published EM images, there is excessive uncertainty in both the data itself as is usually the case but also in the methods that are used to symmetrize the data. This reviewer wonders about any goodness of fit when such uncertainty is taken into account.
Author response: We thank the reviewer for raising this important point. We agree that there is uncertainty in the experimental data. Our decision to symmetrize the data is based on the following considerations:
(1) The experimental data provide a one-dimensional membrane profile corresponding to a cross-sectional view. To reconstruct the full two-dimensional membrane surface, we must assume rotational symmetry.
(2)In addition to symmetrization, we also average membrane profiles within a certain range of 𝜓<sub>𝑚𝑎𝑥</sub> values (see Fig. 5d). This averaging helps reduce the uncertainty (due to biological and experimental variability) inherent to individual measurements.
(3)To further address the noise in the experimental data, we compare our theoretical predictions not only with individual data points but also with a rolling median, which provides a smoothed representation of the experimental trends.
These steps are taken to ensure a more robust and meaningful comparison between theory and experiments.
In the revised manuscript (line 338), we have explained why we have to symmetrize the data:
“To facilitate comparison between the axisymmetric membrane shapes predicted by the model and the non-axisymmetric profiles obtained from electron microscopy, we apply a symmetrization procedure to the experimental data, which consist of one-dimensional membrane profiles extracted from cross-sectional views, as detailed in Appendix 3 (see also Appendix 3--Fig. 1).”
Reviewer #2:
Summary
In this manuscript, the authors employ theoretical analysis of an elastic membrane model to explore membrane vesiculation pathways in clathrin-mediated endocytosis. A complete understanding of clathrin-mediated endocytosis requires detailed insight into the process of membrane remodeling, as the underlying mechanisms of membrane shape transformation remain controversial, particularly regarding membrane curvature generation. The authors compare constant area and constant membrane curvature as key scenarios by which clathrins induce membrane wrapping around the cargo to accomplish endocytosis. First, they characterize the geometrical aspects of the two scenarios and highlight their differences by imposing coating area and membrane spontaneous curvature. They then examine the energetics of the process to understand the driving mechanisms behind membrane shape transformations in each model. In the latter part, they introduce two energy terms: clathrin assembly or binding energy, and curvature generation energy, with two distinct approaches for the latter. Finally, they identify the energetically favorable pathway in the combined scenario and compare their results with experiments, showing that the constant-area pathway better fits the experimental data.
Thank you for your clear and comprehensive summary of our work.
Strengths
The manuscript is well-written, well-organized, and presents the details of the theoretical analysis with sufficient clarity. The calculations are valid, and the elastic membrane model is an appropriate choice for addressing the differences between the constant curvature and constant area models.
The authors' approach of distinguishing two distinct free energy terms-clathrin assembly and curvature generation-and then combining them to identify the favorable pathway is both innovative and effective in addressing the problem.
Notably, their identification of the energetically favorable pathways, and how these pathways either lead to full endocytosis or fail to proceed due to insufficient energetic drives, is particularly insightful.
Thank you for your positive remarks regarding the innovative aspects of our work.
Weaknesses and Recommendations
Weakness: Membrane remodeling in cellular processes is typically studied in either a constant area or constant tension ensemble. While total membrane area is preserved in the constant area ensemble, membrane area varies in the constant tension ensemble. In this manuscript, the authors use the constant tension ensemble with a fixed membrane tension, σe. However, they also use a constant area scenario, where 'area' refers to the surface area of the clathrin-coated membrane segment. This distinction between the constant membrane area ensemble and the constant area of the coated membrane segment may cause confusion.
Recommendation: I suggest the authors clarify this by clearly distinguishing between the two concepts by discussing the constant tension ensemble employed in their theoretical analysis.
Thank you for raising this question.
In the revised manuscript (line 136), we have added a sentence, emphasizing the implication of the term “constant area model”:
“We emphasize that the constant area model refers to the assumption that the clathrin-coated area 𝑎<sub>0</sub> remains fixed. Meanwhile, the membrane tension 𝜎<sub>𝑒</sub> at the base is held constant, allowing the total membrane area 𝐴𝐴 to vary in response to deformations induced by the clathrin coat.”
Weakness: As mentioned earlier, the theoretical analysis is performed in the constant membrane tension ensemble at a fixed membrane tension. The total free energy E_tot of the system consists of membrane bending energy E_b and tensile energy E_t, which depends on membrane tension, σe. Although the authors mention the importance of both E_b and E_t, they do not present their individual contributions to the total energy changes. Comparing these contributions would enable readers to cross-check the results with existing literature, which primarily focuses on the role of membrane bending rigidity and membrane tension.
Recommendation: While a detailed discussion of how membrane tension affects their results may fall outside the scope of this manuscript, I suggest the authors at least discuss the total membrane area variation and the contribution of tensile energy E_t for the singular value of membrane tension used in their analysis.
Thank you for the insightful suggestion. In the revised manuscript (line 916), we have added Appendix 6 and a supplementary figure to compare the bending energy 𝐸<sub>𝑏</sub> and the tension energy 𝐸<sub>𝑡</sub>. Our analysis shows that both energy components exhibit an energy barrier between the flat and vesiculated membrane states, with the tension energy contributing more significantly than the bending energy.
In the revised manuscript (line 151), we have also added one paragraph explaining why we set the dimensionless tension  . This choice is motivated by our use of the characteristic length
  as the length scale, and
  as the energy scale. In this way, the dimensionless tension energy is written as
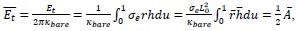
Where  is the dimensionless area.
Weakness: The authors introduce two different models, (1,1) and (1,2), for generating membrane curvature. Model 1 assumes a constant curvature growth, corresponding to linear curvature growth, while Model 2 relates curvature growth to its current value, resembling exponential curvature growth. Although both models make physical sense in general, I am concerned that Model 2 may lead to artificial membrane bending at high curvatures. Normally, for intermediate bending, ψ > 90, the bending process is energetically downhill and thus proceeds rapidly. The bending process is energetically downhill and thus proceeds rapidly. However, Model 2's assumption would accelerate curvature growth even further. This is reflected in the endocytic pathways represented by the green curves in the two rightmost panels of Fig. 4a, where the energy steeply increases at large ψ. I believe a more realistic version of Model 2 would require a saturation mechanism to limit curvature growth at high curvatures.
Recommendation 1: I suggest the authors discuss this point and highlight the pros and cons of Model 2. Specifically, addressing the potential issue of artificial membrane bending at high curvatures and considering the need for a saturation mechanism to limit excessive curvature growth. A discussion on how Model 2 compares to Model 1 in terms of physical relevance, especially in the context of high curvature scenarios, would provide valuable insights for the reader.
Thank you for raising the question of excessive curvature growth in our models and the constructive suggestion of introducing a saturation mechanism. In the revised manuscript (line 405), following your recommendation, we have added a subsection “Saturation effect at high membrane curvatures” in the discussion to clarify the excessive curvature issue and a possible way to introduce a saturation mechanism:
“Note that our model involves two distinct concepts of curvature growth. The first is the growth of imposed curvature — referred to here as intrinsic curvature and denoted by the parameter 𝑐<sub>0</sub> — which is driven by the reorganization of bonds between clathrin molecules within the coat. The second is the growth of the actual membrane curvature, reflected by the increasing value of 𝜓<sub>𝑚𝑎𝑥</sub>.
The latter process is driven by the former.
Models (1,1) and (1,2) incorporate energy terms (Equation 6) that promote the increase of intrinsic curvature 𝑐<sub>0</sub>, which in turn drives the membrane to adopt a more curved shape (increasing 𝜓<sub>𝑚𝑎𝑥</sub>). In the absence of these energy contributions, the system faces an energy barrier separating a weakly curved membrane state (low 𝜓<sub>𝑚𝑎𝑥</sub>) from a highly curved state (high 𝜓<sub>𝑚𝑎𝑥</sub>). This barrier can be observed, for example, in the red curves of Figure 3(a–c) and in Appendix 6—Figure 1. As a result, membrane bending cannot proceed spontaneously and requires additional energy input from clathrin assembly.
The energy terms described in Equation 6 serve to eliminate this energy barrier by lowering the energy difference between the uphill and downhill regions of the energy landscape. However, these same terms also steepen the downhill slope, which may lead to overly aggressive curvature growth.
To mitigate this effect, one could introduce a saturation-like energy term of the form:
where 𝑐<sub>𝑠</sub> represents a saturation curvature. Importantly, adding such a term would not alter the conclusions of our study, since the energy landscape already favors high membrane curvature (i.e., it is downward sloping) even without the additional energy terms. “
Recommendation 2: Referring to the previous point, the green curves in the two rightmost panels of Fig. 4a seem to reflect a comparison between slow and fast bending regimes. The initial slow vesiculation (with small curvature growth) in the left half of the green curves is followed by much more rapid curvature growth beyond a certain threshold. A similar behavior is observed in Model 1, as shown by the green curves in the two rightmost panels of Fig. 4b. I believe this transition between slow and fast bending warrants a brief discussion in the manuscript, as it could provide further insight into the dynamic nature of vesiculation.
Thank you for your constructive suggestion regarding the transition between slow and fast membrane bending. As you pointed out, in both Fig. 4a (model (1,2)) and Fig. 4b (model (1,1)), the green curves tend to extend vertically at the late stage. This suggests a significant increase in 𝑐<sub>0</sub> on the free energy landscape. However, we remain cautious about directly interpreting this vertical trend as indicative of fast endocytic dynamics, since our model is purely energetic and does not explicitly incorporate kinetic details. Meanwhile, we agree with your observation that the steep decrease in free energy along the green curve could correspond to an acceleration in dynamics. To address this point, we have added a paragraph in the revised manuscript (in Subsection “Cooperativity in the curvature generation process”) discussing this potential transition and its consistency with experimental observations (line 395):
“Furthermore, although our model is purely energetic and does not explicitly incorporate dynamics, we observe in Figure 3(a) that along the green curve—representing the trajectory predicted by model (1,2)—the total free energy (𝐸<sub>𝑡𝑜𝑡</sub>) exhibits a much sharper decrease at the late stage (near the vesiculation line) compared to the early stage (near the origin). This suggests a transition from slow to fast dynamics during endocytosis. Such a transition is consistent with experimental observations, where significantly fewer number of images with large 𝜓<sub>𝑚𝑎𝑥</sub> are captured compared to those with small 𝜓<sub>𝑚𝑎𝑥</sub> (Mund et al., 2023).”
The geometrical properties of both the constant-area and constant-curvature scenarios, as well depicted in Fig. 1, are somewhat straightforward. I wonder what additional value is presented in Fig. 2. Specifically, the authors solve differential shape equations to show how Rt and Rcoat vary with the angle ψ, but this behavior seems predictable from the simple schematics in Fig. 1. Using a more complex model for an intuitively understandable process may introduce counter-intuitive results and unnecessary complications, as seen with the constant-curvature model where Rt varies (the tip radius is not constant, as noted in the text) despite being assumed constant. One could easily assume a constant-curvature model and plot Rt versus ψ. I wonder What is the added value of solving shape equations to measure geometrical properties, compared to a simpler schematic approach (without solving shape equations) similar to what they do in App. 5 for the ratio of the Rt at ψ=30 and 150.
Thank you for raising this important question. While simple and intuitive theoretical models are indeed convenient to use, their validity must be carefully assessed. The approximate model becomes inaccurate when the clathrin shell significantly deviates from its intrinsic shape, namely a spherical cap characterized by intrinsic curvature 𝑐<sub>0</sub>. As shown in the insets of Fig. 2b and 2c (red line and black points), our comparison between the simplified model and the full model demonstrates that the simple model provides a good approximation under the constant-area constraint. However, it performs poorly under the constant-curvature constraint, and the deviation between the full model and the simplified model becomes more pronounced as 𝑐<sub>0</sub> increases.
In the revised manuscript, we have added a sentence emphasizing the discrepancy between the exact calculation with the idealized picture for the constant curvature model (line 181):
“For the constant-curvature model, the ratio remains close to 1 only at small values of 𝑐<sub>0</sub>, as expected from the schematic representation of the model in Figure 1. However, as 𝑐<sub>0</sub> increases, the deviation from this idealized picture becomes increasingly pronounced.”
Recommendation: The clathrin-mediated endocytosis aims at wrapping cellular cargos such as viruses which are typically spherical objects which perfectly match the constant-curvature scenario. In this context, wrapping nanoparticles by vesicles resembles constant-curvature membrane bending in endocytosis. In particular analogous shape transitions and energy barriers have been reported (similar to Fig.3 of the manuscript) using similar theoretical frameworks by varying membrane particle binding energy acting against membrane bending:
DOI: 10.1021/la063522m
DOI: 10.1039/C5SM01793A
I think a short comparison to particle wrapping by vesicles is warranted.
Thank you for your constructive suggestion to compare our model with particle wrapping. In the revised manuscript (line 475), we have added a subsection “Comparison with particle wrapping” in the discussion:
“The purpose of the clathrin-mediated endocytosis studied in our work is the recycling of membrane and membrane-protein, and the cellular uptake of small molecules from the environment — molecules that are sufficiently small to bind to the membrane or be encapsulated within a vesicle. In contrast, the uptake of larger particles typically involves membrane wrapping driven by adhesion between the membrane and the particle, a process that has also been studied previously (Góźdź, 2007; Bahrami et al., 2016). In our model, membrane bending is driven by clathrin assembly, which induces curvature. In particle wrapping, by comparison, the driving force is the adhesion between the membrane and a rigid particle. In the absence of adhesion, wrapping increases both bending and tension energies, creating an energy barrier that separates the flat membrane state from the fully wrapped state. This barrier can hinder complete wrapping, resulting in partial or no engulfment of the particle. Only when the adhesion energy is sufficiently strong can the process proceed to full wrapping. In this context, adhesion plays a role analogous to curvature generation in our model, as both serve to overcome the energy barrier. If the particle is spherical, it imposes a constant-curvature pathway during wrapping. However, the role of clathrin molecules in this process remains unclear and will be the subject of future investigation.”
Minor points:
Line 20, abstract, "....a continuum spectrum ..." reads better.
Line 46 "...clathrin results in the formation of pentagons ...." seems Ito be grammatically correct.
Line 106, proper citation of the relevant literature is warranted here.
Line 111, the authors compare features (plural) between experiments and calculations. I would write "....compare geometric features calculated by theory with those ....".
Line 124, "Here, we choose a ..." (with comma after Here).
Line 134, "The membrane tension \sigma_e and bending rigidity \kappa define a ...."
Line 295, "....tip radius, and invagination ...." (with comma before and).
Line 337, "abortive tips, and ..." (with comma before and).
We thank you for your thorough review of our manuscript and have corrected all the issues raised.
Without such deep, attentive listening, any critique you make will be superficial and decidedly uncritical. It will be a critique that says more about you than about the writer or idea you're supposedly responding to.
Critique was pronounced that is official, but it is unclear that you will be said to respond to your writer without listening deeply.
Sometimes it is difficult to figure out the views that writers are responding to, not because these writers do not identify those views, but because their language and the concepts they are dealing with are particularly challenging.
These views can be important, but difficult, however, to those who responds the language, the concepts of the text adheres their consideration.
If you read the passage this way, however, you would be mistaken. Draut is not questioning whether a college degree has become the "ticket to middle-class security", but whether most Americans can obtain that ticket, whether college is within the financial reach of most American families.
In one big mistake to read the passage in the wrong way, it will be denied. The author is questioning about whether most Americans obtain the ticket rather than ticket to middle-class security in a word.
The results were often striking. The discussions that followed tended to be far livelier and to draw in a greater number of students. We were still asking students to look for the main argument, but we were now asking them to see that argument as a response to some other argument that provoked it, gave it a reason for being, and helped all of us see why we should care about it.
It is unclear that why did the provocation of this argument responds to any students, but the results are often impacted in undisclosed measures.
The discussion that resulted was often halting, as our students struggled to get a handle on the argument, but eventually, after some awkward silences, the class would come up with something we could all agree was an accurate summary of the author's main thesis.
As I assure the discussion, this thesis can be often essential for a summary, according to a author's central thesis task.
This relationship between the human and the non-human has been conceptualised as ‘kincentric ecology’ (Bird-David, 1999; Salmón, 2000). From this perspective, plants, animals and fungi are not seen as food or material sources, but rather as vital participants in a relational web that connects humans and animals to spirits, ancestors and other beings. For example, in Baka knowledge systems, individuals of each type of being (‘species’) only exist through their interactions with many other beings and their shared environment, which they all constantly change (Hoyte & Mangombe, 2024).
Similar to the concept of agential realism!
I mean the public performance required of those subject to elabo-rate and systematic forms of social subordination: the worker to the boss, thetenant or sharecropper to the landlord, the serf to the lord, the slave to themaster, the untouchable to the Brahmin, a member of a subject race to one ofthe dominant race. With rare, but significant, exceptions the public perfor-mance of the subordinate will, out of prudence, fear, and the desire to curryfavor, be shaped to appeal to the expectations of the powerful. I shall use theterm public transcript as a shorthand way of describing the open interactionbetween subordinates and those who dominate. 1 The public transcript, whereit is not positively misleading, is unlikely to tell the whole story about powerrelations. It is frequently in the interest of both parties to tacitly conspire inmisrepresentation. The oral history of a French tenant farmer, Old Tiennon,covering much of the nineteenth century is filled with accounts of a prudentand misleading deference: "When he [the landlord who had dismissed hisfather] crossed from Le Craux, going to Meillers, he would stop and speak tome and I forced myself to appear amiable, in spite of the contempt I felt forhim.
he’s drawing a line between everyday politeness and historically imposed performance. What begins as etiquette becomes survival strategy under domination. This “public transcript,” as he calls it, isn’t just a set of social cues it’s a choreography shaped by fear, prudence, and sometimes sheer exhaustion.
And Wald-Tinan’s anecdote is such a vivid example smiling at the landlord who dismissed your father, not because you respect him, but because appearing “amiable” protects you. It’s a performance built on unequal power, and it says so much about the psychic toll of domination.
The legendary king of Mycenae and leader of the Greek army in the Trojan War of Homer's Illiad. Agamemnon is a great warrior but also a selfish ruler who famously upset his invincible champion Achilles, a feud that prolonged the war and suffering of his men. https://www.worldhistory.org/Agamemnon_(Person)/
Reviewer #1 (Public review):
Summary:
This manuscript by Pournejati et al investigates how BK (big potassium) channels and CaV1.3 (a subtype of voltage-gated calcium channels) become functionally coupled by exploring whether their ensembles form early-during synthesis and intracellular trafficking-rather than only after insertion into the plasma membrane. To this end, the authors use the PLA technique to assess the formation of ion channel associations in the different compartments (ER, Golgi or PM), single-molecule RNA in situ hybridization (RNAscope), and super-resolution microscopy.
Strengths:
The manuscript is well written and addresses an interesting question, combining a range of imaging techniques. The findings are generally well-presented and offer important insights into the spatial organization of ion channel complexes, both in heterologous and endogenous systems.
Weaknesses:
The authors have improved their manuscript after revisions, and some previous concerns have been addressed. Still, the main concern about this work is that the current experiments do not quantitatively or mechanistically link the ensembles observed intracellularly (in the endoplasmic reticulum (ER) or Golgi) to those found at the plasma membrane (PM). As a result, it is difficult to fully integrate the findings into a coherent model of trafficking. Specifically, the manuscript does not address what proportion of ensembles detected at the PM originated in the ER. Without data on the turnover or half-life of these ensembles at the PM, it remains unclear how many persist through trafficking versus forming de novo at the membrane. The authors report the percentage of PLA-positive ensembles localized to various compartments, but this only reflects the distribution of pre-formed ensembles. What remains unknown is the proportion of total BK and CaV1.3 channels (not just those in ensembles) that are engaged in these complexes within each compartment. Without this, it is difficult to determine whether ensembles form in the ER and are then trafficked to the PM, or if independent ensemble formation also occurs at the membrane. To support the model of intracellular assembly followed by coordinated trafficking, it would be important to quantify the fraction of the total channel population that exists as ensembles in each compartment. A comparable ensemble-to-total ratio across ER and PM would strengthen the argument for directed trafficking of pre-assembled channel complexes.
Reviewer #2 (Public review):
Summary:
The co-localization of large conductance calcium- and voltage activated potassium (BK) channels with voltage-gated calcium channels (CaV) at the plasma membrane is important for the functional role of these channels in controlling cell excitability and physiology in a variety of systems.
An important question in the field is where and how do BK and CaV channels assemble as 'ensembles' to allow this coordinated regulation - is this through preassembly early in the biosynthetic pathway, during trafficking to the cell surface or once channels are integrated into the plasma membrane. These questions also have broader implications for assembly of other ion channel complexes.
Using an imaging based approach, this paper addresses the spatial distribution of BK-CaV ensembles using both overexpression strategies in tsa201 and INS-1 cells and analysis of endogenous channels in INS-1 cells using proximity ligation and superesolution approaches. In addition, the authors analyse the spatial distribution of mRNAs encoding BK and Cav1.3.
The key conclusion of the paper that BK and CaV1.3 are co-localised as ensembles intracellularly in the ER and Golgi is well supported by the evidence. However, whether they are preferentially co-translated at the ER, requires further work. Moreover, whether intracellular pre-assembly of BK-CaV complexes is the major mechanism for functional complexes at the plasma membrane in these models requires more definitive evidence including both refinement of analysis of current data as well as potentially additional experiments.
Strengths & Weaknesses
(1) Using proximity ligation assays of overexpressed BK and CaV1.3 in tsa201 and INS-1 cells the authors provide strong evidence that BK and CaV can exist as ensembles (ie channels within 40 nm) at both the plasma membrane and intracellular membranes, including ER and Golgi. They also provide evidence for endogenous ensemble assembly at the Golgi in INS-1 cells and it would have been useful to determine if endogenous complexes are also observe in the ER of INS-1 cells. There are some useful controls but the specificity of ensemble formation would be better determined using other transmembrane proteins rather than peripheral proteins (eg Golgi 58K).
(2) Ensemble assembly was also analysed using super-resolution (dSTORM) imaging in INS-1 cells. In these cells only 7.5% of BK and CaV particles (endogenous?) co-localise that was only marginally above chance based on scrambled images. More detailed quantification and validation of potential 'ensembles' needs to be made for example by exploring nearest neighbour characteristics (but see point 4 below) to define proportion of ensembles versus clusters of BK or Cav1.3 channels alone etc. For example, it is mentioned that a distribution of distances between BK and Cav is seen but data are not shown.
(3) The evidence that the intracellular ensemble formation is in large part driven by co-translation, based on co-localisation of mRNAs using RNAscope, requires additional critical controls and analysis. The authors now include data of co-localised BK protein that is suggestive but does not show co-translation. Secondly, while they have improved the description of some controls mRNA co-localisation needs to be measured in both directions (eg BK - SCN9A as well as SCN9A to BK) especially if the mRNAs are expressed at very different levels. The relative expression levels need to be clearly defined in the paper. Authors also use a randomized image of BK mRNA to show specificity of co-localisation with Cav1.3 mRNA, however the mRNA distribution would not be expected to be random across the cell but constrained by ER morphology if co-translated so using ER labelling as a mask would be useful?
(4) The authors attempt to define if plasma membrane assemblies of BK and CaV occur soon after synthesis. However, because the expression of BK and CaV occur at different times after transient transfection of plasmids more definitive experiments are required. For example, using inducible constructs to allow precise and synchronised timing of transcription. This would also provide critical evidence that co-assembly occurs very early in synthesis pathways - ie detecting complexes at ER before any complexes at Golgi or plasma membrane.
(5) While the authors have improved the definition of hetero-clusters etc it is still not clear in superesolution analysis, how they separate a BK tetramer from a cluster of BK tetramers with the monoclonal antibody employed ie each BK channel will have 4 binding sites (4 subunits in tetramer) whereas Cav1.3 has one binding site per channel. Thus, how do authors discriminate between a single BK tetramer (molecular cluster) with potential 4 antibodies bound compared to a cluster of 4 independent BK channels.
(6) The post-hoc tests used for one way ANOVA and ANOVA statistics need to be defined throughout
Author response:
The following is the authors’ response to the original reviews.
Recommendations for the Authors:
(1) Clarify Mechanistic Interpretations
(a) Provide stronger evidence or a more cautious interpretation regarding whether intracellular BK-CaV1.3 ensembles are precursors to plasma membrane complexes.
This is an important point. We adjusted the interpretation regarding intracellular BKCa<sub>V</sub>1.3 hetero-clusters as precursors to plasma membrane complexes to reflect a more cautious stance, acknowledging the limitations of available data. We added the following to the manuscript.
“Our findings suggest that BK and Ca<sub>V</sub>1.3 channels begin assembling intracellularly before reaching the plasma membrane, shaping their spatial organization and potentially facilitating functional coupling. While this suggests a coordinated process that may contribute to functional coupling, further investigation is needed to determine the extent to which these hetero-clusters persist upon membrane insertion.”
(b) Discuss the limitations of current data in establishing the proportion of intracellular complexes that persist on the cell surface.
We appreciate the suggestion. We expanded the discussion to address the limitations of current data in determining the proportion of intracellular complexes that persist on the cell surface. We added the following to the manuscript.
“Our findings highlight the intracellular assembly of BK-Ca<sub>V</sub>1.3 hetero-clusters, though limitations in resolution and organelle-specific analysis prevent precise quantification of the proportion of intracellular complexes that ultimately persist on the cell surface. While our data confirms that hetero-clusters form before reaching the plasma membrane, it remains unclear whether all intracellular hetero-clusters transition intact to the membrane or undergo rearrangement or disassembly upon insertion. Future studies utilizing live cell tracking and high resolution imaging will be valuable in elucidating the fate and stability of these complexes after membrane insertion.”
(2) Refine mRNA Co-localization Analysis
(a) Include appropriate controls using additional transmembrane mRNAs to better assess the specificity of BK and CaV1.3 mRNA co-localization.
We agree with the reviewers that these controls are essential. We explain better the controls used to address this concern. We added the following to the manuscript.
“To explore the origins of the initial association, we hypothesized that the two proteins are translated near each other, which could be detected as the colocalization of their mRNAs (Figure 5A and B). The experiment was designed to detect single mRNA molecules from INS-1 cells in culture. We performed multiplex in situ hybridization experiments using an RNAScope fluorescence detection kit to be able to image three mRNAs simultaneously in the same cell and acquired the images in a confocal microscope with high resolution. To rigorously assess the specificity of this potential mRNA-level organization, we used multiple internal controls. GAPDH mRNA, a highly expressed housekeeping gene with no known spatial coordination with channel mRNAs, served as a baseline control for nonspecific colocalization due to transcript abundance. To evaluate whether the spatial proximity between BK mRNA (KCNMA1) and Ca<sub>V</sub>1.3 mRNA (CACNA1D) was unique to functionally coupled channels, we also tested for Na<sup>V</sup>1.7 mRNA (SCN9A), a transmembrane sodium channel expressed in INS-1 cells but not functionally associated with BK. This allowed us to determine whether the observed colocalization reflected a specific biological relationship rather than shared expression context. Finally, to test whether this proximity might extend to other calcium sources relevant to BK activation, we probed the mRNA of ryanodine receptor 2 (RyR2), another Ca<sup>2+</sup> channel known to interact structurally with BK channels [32]. Together, these controls were chosen to distinguish specific mRNA colocalization patterns from random spatial proximity, shared subcellular distribution, or gene expression level artifacts.”
(b) Quantify mRNA co-localization in both directions (e.g., BK with CaV1.3 and vice versa) and account for differences in expression levels.
We thank the reviewer for this suggestion. We chose to quantify mRNA co-localization in the direction most relevant to the formation of functionally coupled hetero-clusters, namely, the proximity of BK (KCNMA1) mRNA to Ca<sub>V</sub>1.3 (CACNA1D) mRNA. Since BK channel activation depends on calcium influx provided by nearby Ca<sub>V</sub>1.3 channels, this directional analysis more directly informs the hypothesis of spatially coordinated translation and channel assembly. To address potential confounding effects of transcript abundance, we implemented a scrambled control approach in which the spatial coordinates of KCNMA1 mRNAs were randomized while preserving transcript count. This control resulted in significantly lower colocalization with CACNA1D mRNA, indicating that the observed proximity reflects a specific spatial association rather than expressiondriven overlap. We also assessed colocalization of CACNA1D with both KCNMA1, GAPDH mRNAs and SCN9 (NaV1.7); as you can see in the graph below these data support t the same conclusion but were not included in the manuscript.
Author response image 1.
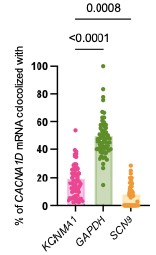
(c) Consider using ER labeling as a spatial reference when analyzing mRNA localization
We thank the reviewers for this suggestion. Rather than using ER labeling as a spatial reference, we assess BK and CaV1.3 mRNA localization using fluorescence in situ hybridization (smFISH) alongside BK protein immunostaining. This approach directly identifies BK-associated translation sites, ensuring that observed mRNA localization corresponds to active BK synthesis rather than general ER association. By evaluating BK protein alongside its mRNA, we provide a more functionally relevant measure of spatial organization, allowing us to assess whether BK is synthesized in proximity to CaV1.3 mRNA within micro-translational complexes. The results added to the manuscript is as follows.
“To further investigate whether KCNMA1 and CACNA1D are localized in regions of active translation (Figure 7A), we performed RNAScope targeting KCNMA1 and CACNA1D alongside immunostaining for BK protein. This strategy enabled us to visualize transcript-protein colocalization in INS-1 cells with subcellular resolution. By directly evaluating sites of active BK translation, we aimed to determine whether newly synthesized BK protein colocalized with CACNA1D mRNA signals (Figure 7A). Confocal imaging revealed distinct micro-translational complex where KCNMA1 mRNA puncta overlapped with BK protein signals and were located adjacent to CACNA1D mRNA (Figure 7B). Quantitative analysis showed that 71 ± 3% of all KCNMA1 colocalized with BK protein signal which means that they are in active translation. Interestingly, 69 ± 3% of the KCNMA1 in active translation colocalized with CACNA1D (Figure 7C), supporting the existence of functional micro-translational complexes between BK and Ca<sub>V</sub>1.3 channels.”
(3) Improve Terminology and Definitions
(a) Clarify and consistently use terms like "ensemble," "cluster," and "complex," especially in quantitative analyses.
We agree with the reviewers, and we clarified terminology such as 'ensemble,' 'cluster,' and 'complex' and used them consistently throughout the manuscript, particularly in quantitative analyses, to enhance precision and avoid ambiguity.
(b) Consider adopting standard nomenclature (e.g., "hetero-clusters") to avoid ambiguity.
We agree with the reviewers, and we adapted standard nomenclature, such as 'heteroclusters,' in the manuscript to improve clarity and reduce ambiguity.
(4) Enhance Quantitative and Image Analysis
(a) Clearly describe how colocalization and clustering were measured in super-resolution data.
We thank the reviewers for this suggestion. We have modified the Methods section to provide a clearer description of how colocalization and clustering were measured in our super-resolution data. Specifically, we now detail the image processing steps, including binary conversion, channel multiplication for colocalization assessment, and density-based segmentation for clustering analysis. These updates ensure transparency in our approach and improve accessibility for readers, and we added the following to the manuscript.
“Super-resolution imaging:
Direct stochastic optical reconstruction microscopy (dSTORM) images of BK and 1.3 overexpressed in tsA-201 cells were acquired using an ONI Nanoimager microscope equipped with a 100X oil immersion objective (1.4 NA), an XYZ closed-loop piezo 736 stage, and triple emission channels split at 488, 555, and 640 nm. Samples were imaged at 35°C. For singlemolecule localization microscopy, fixed and stained cells were imaged in GLOX imaging buffer containing 10 mM β-mercaptoethylamine (MEA), 0.56 mg/ml glucose oxidase, 34 μg/ml catalase, and 10% w/v glucose in Tris-HCl buffer. Single-molecule localizations were filtered using NImOS software (v.1.18.3, ONI). Localization maps were exported as TIFF images with a pixel size of 5 nm. Maps were further processed in ImageJ (NIH) by thresholding and binarization to isolate labeled structures. To assess colocalization between the signal from two proteins, binary images were multiplied. Particles smaller than 400 nm<sup>2</sup> were excluded from the analysis to reflect the spatial resolution limit of STORM imaging (20 nm) and the average size of BK channels. To examine spatial localization preference, binary images of BK were progressively dilated to 20 nm, 40 nm, 60 nm, 80 nm, 100 nm, and 200 nm to expand their spatial representation. These modified images were then multiplied with the Ca<sub>V</sub>1.3 channel to quantify colocalization and determine BK occupancy at increasing distances from Ca<sub>V</sub>1.3. To ensure consistent comparisons across distance thresholds, data were normalized using the 200 nm measurement as the highest reference value, set to 1.”
(b) Where appropriate, quantify the proportion of total channels involved in ensembles within each compartment.
We thank the reviewers for this comment. However, our method does not allow for direct quantification of the total number of BK and Ca<sub>V</sub>1.3 channels expressed within the ER or ER exit sites, as we rely on proximity-based detection rather than absolute fluorescence intensity measurements of individual channels. Traditional methods for counting total channel populations, such as immunostaining or single-molecule tracking, are not applicable to our approach due to the hetero-clusters formation process. Instead, we focused on the relative proportion of BK and Ca<sub>V</sub>1.3 hetero-clusters within these compartments, as this provides meaningful insights into trafficking dynamics and spatial organization. By assessing where hetero-cluster preferentially localize rather than attempting to count total channel numbers, we can infer whether their assembly occurs before plasma membrane insertion. While this approach does not yield absolute quantification of ER-localized BK and Ca<sub>V</sub>1.3 channels, it remains a robust method for investigating hetero-cluster formation and intracellular trafficking pathways. To reflect this limitation, we added the following to the manuscript.
“Finally, a key limitation of this approach is that we cannot quantify the proportion of total BK or Ca<sub>V</sub>1.3 channels engaged in hetero-clusters within each compartment. The PLA method provides proximity-based detection, which reflects relative localization rather than absolute channel abundance within individual organelles”.
(5) Temper Overstated Claims
(a) Revise language that suggests the findings introduce a "new paradigm," instead emphasizing how this study extends existing models.
We agree with the reviewers, and we have revised the language to avoid implying a 'new paradigm.' The following is the significance statement.
“This work examines the proximity between BK and Ca<sub>V</sub>1.3 molecules at the level of their mRNAs and newly synthesized proteins to reveal that these channels interact early in their biogenesis. Two cell models were used: a heterologous expression system to investigate the steps of protein trafficking and a pancreatic beta cell line to study the localization of endogenous channel mRNAs. Our findings show that BK and Ca<sub>V</sub>1.3 channels begin assembling intracellularly before reaching the plasma membrane, revealing new aspects of their spatial organization. This intracellular assembly suggests a coordinated process that contributes to functional coupling.”
(b) Moderate conclusions where the supporting data are preliminary or correlative.
We agree with the reviewers, and we have moderated conclusions in instances where the supporting data are preliminary or correlative, ensuring a balanced interpretation. We added the following to the manuscript.
“This study provides novel insights into the organization of BK and Ca<sub>V</sub>1.3 channels in heteroclusters, emphasizing their assembly within the ER, at ER exit sites, and within the Golgi. Our findings suggest that BK and Ca<sub>V</sub>1.3 channels begin assembling intracellularly before reaching the plasma membrane, shaping their spatial organization, and potentially facilitating functional coupling. While this suggests a coordinated process that may contribute to functional coupling, further investigation is needed to determine the extent to which these hetero-clusters persist upon membrane insertion. While our study advances the understanding of BK and Ca<sub>V</sub>1.3 heterocluster assembly, several key questions remain unanswered. What molecular machinery drives this colocalization at the mRNA and protein level? How do disruptions to complex assembly contribute to channelopathies and related diseases? Additionally, a deeper investigation into the role of RNA binding proteins in facilitating transcript association and localized translation is warranted”.
(6) Address Additional Technical and Presentation Issues
(a) Include clearer figure annotations, especially for identifying PLA puncta localization (e.g., membrane vs. intracellular).
We agree with the reviewers, and we have updated the figures to include clearer annotations that distinguish PLA puncta localized at the membrane versus those within intracellular compartments.
(b) Reconsider the scale and arrangement of image panels to better showcase the data.
We agree with the reviewers, and we have adjusted the scale and layout of the image panels to enhance data visualization and readability. Enlarged key regions now provide better clarity of critical features.
(c) Provide precise clone/variant information for BK and CaV1.3 channels used.
We thank the reviewers for their suggestion, and we now provide precise information regarding the BK and Ca<sub>V</sub>1.3 channel constructs used in our experiments, including their Addgene plasmid numbers and relevant variant details. These have been incorporated into the Methods section to ensure reproducibility and transparency. We added the following to the manuscript.
“The Ca<sub>V</sub>1.3 α subunit construct used in our study corresponds to the rat Ca<sub>V</sub>1.3e splice variant containing exons 8a, 11, 31b, and 42a, with a deletion of exon 32. The BK channel construct used in this study corresponds to the VYR splice variant of the mouse BKα subunit (KCNMA1)”.
(d) Correct typographical errors and ensure proper figure/supplementary labeling throughout.
Typographical errors have been corrected, and figure/supplementary labeling has been reviewed for accuracy throughout the manuscript.
(7) Expand the Discussion
(a) Include a brief discussion of findings such as BK surface expression in the absence of CaV1.3.
We thank the reviewers for their suggestion. We expanded the Discussion to include a brief analysis of BK surface expression in the absence of Ca<sub>V</sub>1.3. We included the following in the manuscript.
“BK Surface Expression and Independent Trafficking Pathways
BK surface expression in the absence of Ca<sub>V</sub>1.3 indicates that its trafficking does not strictly rely on Ca<sub>V</sub>1.3-mediated interactions. Since BK channels can be activated by multiple calcium sources, their presence in intracellular compartments suggests that their surface expression is governed by intrinsic trafficking mechanisms rather than direct calcium-dependent regulation. While some BK and Ca<sub>V</sub>1.3 hetero-clusters assemble into signaling complexes intracellularly, other BK channels follow independent trafficking pathways, demonstrating that complex formation is not obligatory for all BK channels. Differences in their transport kinetics further reinforce the idea that their intracellular trafficking is regulated through distinct mechanisms. Studies have shown that BK channels can traffic independently of Ca<sub>V</sub>1.3, relying on alternative calcium sources for activation [13, 41]. Additionally, Ca<sub>V</sub>1.3 exhibits slower synthesis and trafficking kinetics than BK, emphasizing that their intracellular transport may not always be coordinated. These findings suggest that BK and Ca<sub>V</sub>1.3 exhibit both independent and coordinated trafficking behaviors, influencing their spatial organization and functional interactions”.
(b) Clarify why certain colocalization comparisons (e.g., ER vs. ER exit sites) are not directly interpretable.
We thank the reviewer for their suggestion. A clarification has been added to the result section and discussion of the manuscript explaining why colocalization comparisons, such as ER versus ER exit sites, are not directly interpretable. We included the following in the manuscript.
“Result:
ER was not simply due to the extensive spatial coverage of ER labeling, we labeled ER exit sites using Sec16-GFP and probed for hetero-clusters with PLA. This approach enabled us to test whether the hetero-clusters were preferentially localized to ER exit sites, which are specialized trafficking hubs that mediate cargo selection and direct proteins from the ER into the secretory pathway. In contrast to the more expansive ER network, which supports protein synthesis and folding, ER exit sites ensure efficient and selective export of proteins to their target destinations”.
“By quantifying the proportion of BK and Ca<sub>V</sub>1.3 hetero-clusters relative to total channel expression at ER exit sites, we found 28 ± 3% colocalization in tsA-201 cells and 11 ± 2% in INS-1 cells (Figure 3F). While the percentage of colocalization between hetero-clusters and the ER or ER exit sites alone cannot be directly compared to infer trafficking dynamics, these findings reinforce the conclusion that hetero-clusters reside within the ER and suggest that BK and Ca<sub>V</sub>1.3 channels traffic together through the ER and exit in coordination”.
“Colocalization and Trafficking Dynamics
The colocalization of BK and Ca<sub>V</sub>1.3 channels in the ER and at ER exit sites before reaching the Golgi suggests a coordinated trafficking mechanism that facilitates the formation of multi-channel complexes crucial for calcium signaling and membrane excitability [37, 38]. Given the distinct roles of these compartments, colocalization at the ER and ER exit sites may reflect transient proximity rather than stable interactions. Their presence in the Golgi further suggests that posttranslational modifications and additional assembly steps occur before plasma membrane transport, providing further insight into hetero-cluster maturation and sorting events. By examining BK-Ca<sub>V</sub>1.3 hetero-cluster distribution across these trafficking compartments, we ensure that observed colocalization patterns are considered within a broader framework of intracellular transport mechanisms [39]. Previous studies indicate that ER exit sites exhibit variability in cargo retention and sorting efficiency [40], emphasizing the need for careful evaluation of colocalization data. Accounting for these complexities allows for a robust assessment of signaling complexes formation and trafficking pathways”.
Reviewer #1 (Recommendations for the authors):
In addition to the general aspects described in the public review, I list below a few points with the hope that they will help to improve the manuscript:
(1) Page 3: "they bind calcium delimited to the point of entry at calcium channels", better use "sources"
We agree with the reviewer. The phrasing on Page 3 has been updated to use 'sources' instead of 'the point of entry at calcium channels' for clarity.
(2) Page 3 "localized supplies of intracellular calcium", I do not like this term, but maybe this is just silly.
We agree with the reviewer. The term 'localized supplies of intracellular calcium' on Page 3 has been revised to “Localized calcium sources”
(3) Regarding the definitions stated by the authors: How do you distinguish between "ensembles" corresponding to "coordinated collection of BK and Cav channels" and "assembly of BK clusters with Cav clusters"? I believe that hetero-clusters is more adequate. The nomenclature does not respond to any consensus in the protein biology field, and I find that it introduces bias more than it helps. I would stick to heteroclusters nomenclature that has been used previously in the field. Moreover, in some discussion sections, the term "ensemble" is used in ways that border on vague, especially when talking about "functional signaling complexes" or "ensembles forming early." It's still acceptable within context but could benefit from clearer language to distinguish ensemble (structural proximity) from complex (functional consequence).
We agree with the reviewer, and we recognize the importance of precise nomenclature and have adopted hetero-clusters instead of ensembles to align with established conventions in the field. This term specifically refers to the spatial organization of BK and Ca<sub>V</sub>1.3 channels, while functional complexes denote mechanistic interactions. We have revised sections where ensemble was used ambiguously to ensure clear distinction between structure and function.
The definition of "cluster" is clearly stated early but less emphasized in later quantitative analyses (e.g., particle size discussions in Figure 7). Figure 8 is equally confusing, graphs D and E referring to "BK ensembles" and "Cav ensembles", but "ensembles" should refer to combinations of both channels, whereas these seem to be "clusters". In fact, the Figure legend mentions "clusters".
We agree with the reviewer. Terminology has been revised throughout the manuscript to ensure consistency, with 'clusters' used appropriately in quantitative analyses and figure descriptions.
(4) Methods: how are clusters ("ensembles") analysed from the STORM data? What is the logarithm used for? More info about this is required. Equally, more information and discussion about how colocalization is measured and interpreted in superresolution microscopy are required.
We thank the reviewer for their suggestion, and additional details have been incorporated into the Methods section to clarify how clusters ('ensembles') are analyzed from STORM data, including the role of the logarithm in processing. Furthermore, we have expanded the discussion to provide more information on how colocalization is measured and interpreted in super resolution microscopy. We include the following in the manuscript.
“Direct stochastic optical reconstruction microscopy (dSTORM) images of BK and Ca<sub>V</sub>1.3 overexpressed in tsA-201 cells were acquired using an ONI Nanoimager microscope equipped with a 100X oil immersion objective (1.4 NA), an XYZ closed-loop piezo 736 stage, and triple emission channels split at 488, 555, and 640 nm. Samples were imaged at 35°C. For singlemolecule localization microscopy, fixed and stained cells were imaged in GLOX imaging buffer containing 10 mM β-mercaptoethylamine (MEA), 0.56 mg/ml glucose oxidase, 34 μg/ml catalase, and 10% w/v glucose in Tris-HCl buffer. Single-molecule localizations were filtered using NImOS software (v.1.18.3, ONI). Localization maps were exported as TIFF images with a pixel size of 5 nm. Maps were further processed in ImageJ (NIH) by thresholding and binarization to isolate labeled structures. To assess colocalization between the signal from two proteins, binary images were multiplied. Particles smaller than 400 nm<sup>2</sup> were excluded from the analysis to reflect the spatial resolution limit of STORM imaging (20 nm) and the average size of BK channels. To examine spatial localization preference, binary images of BK were progressively dilated to 20 nm, 40 nm, 60 nm, 80 nm, 100 nm, and 200 nm to expand their spatial representation. These modified images were then multiplied with the Ca<sub>V</sub>1.3 channel to quantify colocalization and determine BK occupancy at increasing distances from Ca<sub>V</sub>1.3. To ensure consistent comparisons across distance thresholds, data were normalized using the 200 nm measurement as the highest reference value, set to 1”.
(5) Related to Figure 2:
(a) Why use an antibody to label GFP when PH-PLCdelta should be a membrane marker? Where is the GFP in PH-PKC-delta (intracellular, extracellular? Images in Figure 2E are confusing, there is a green intracellular signal.
We thank the reviewer for their feedback. To clarify, GFP is fused to the N-terminus of PH-PLCδ and primarily localizes to the inner plasma membrane via PIP2 binding. Residual intracellular GFP signal may reflect non-membrane-bound fractions or background from anti-GFP immunostaining. We added a paragraph explaining the use of the antibody anti GFP in the Methods section Proximity ligation assay subsection.
(b) The images in Figure 2 do not help to understand how the authors select the PLA puncta located at the plasma membrane. How do the authors do this? A useful solution would be to indicate in Figure 2 an example of the PLA signals that are considered "membrane signals" compared to another example with "intracellular signals". Perhaps this was intended with the current Figure, but it is not clear.
We agree with the reviewer. We have added a sentence to explain how the number of PLA puncta at the plasma membrane was calculated.
“We visualized the plasma membrane with a biological sensor tagged with GFP (PHPLCδ-GFP) and then probed it with an antibody against GFP (Figure 2E). By analyzing the GFP signal, we created a mask that represented the plasma membrane. The mask served to distinguish between the PLA puncta located inside the cell and those at the plasma membrane, allowing us to calculate the number of PLA puncta at the plasma membrane”.
(c) Figure 2C: What is the negative control? Apologies if it is described somewhere, but I seem not to find it in the manuscript.
We thank the reviewer for their suggestion. For the negative control in Figure 2C, BK was probed using the primary antibody without co-staining for Ca<sub>V</sub>1.3 or other proteins, ensuring specificity and ruling out non-specific antibody binding or background fluorescence. A sentence clarifying the negative control for Figure 2C has been added to the Results section, specifying that BK was probed using the primary antibody without costaining for Ca<sub>V</sub>1.3 or other proteins to ensure specificity.
“To confirm specificity, a negative control was performed by probing only for BK using the primary antibody, ensuring that detected signals were not due to non-specific binding or background fluorescence”.
(d) What is the resolution in z of the images shown in Figure 2? This is relevant for the interpretation of signal localization.
The z-resolution of the images shown in Figure 2 was approximately 270–300 nm, based on the Zeiss Airyscan system’s axial resolution capabilities. Imaging was performed with a step size of 300 nm, ensuring adequate sampling for signal localization while maintaining optimal axial resolution.
“In a different experiment, we analyzed the puncta density for each focal plane of the cell (step size of 300 nm) and compared the puncta at the plasma membrane to the rest of the cell”.
(e) % of total puncta in PM vs inside cell are shown for transfected cells, what is this proportion in INS-1 cells?
This quantification was performed for transfected cells; however, we have not conducted the same analysis in INS-1 cells. Future experiments could address this to determine potential differences in puncta distribution between endogenous and overexpressed conditions.
(6) Related to Figure 3:
(a) Figure 3B: is this antibody labelling or GFP fluorescence? Why do they use GFP antibody labelling, if the marker already has its own fluorescence? This should at least be commented on in the manuscript.
We thank the reviewer for their concern. In Figure 3B, GFP was labeled using an antibody rather than relying on its intrinsic fluorescence. This approach was necessary because GFP fluorescence does not withstand the PLA protocol, resulting in significant fading. Antibody labeling provided stronger signal intensity and improved resolution, ensuring optimal signal-to-noise ratio for accurate analysis.
A clarification regarding the use of GFP antibody labeling in Figure 3B has been added to the Methods section, explaining that intrinsic GFP fluorescence does not endure the PLA protocol, necessitating antibody-based detection for improved signal and resolution.We added the following to the manuscript.
“For PLA combined with immunostaining, PLA was followed by a secondary antibody incubation with Alexa Fluor-488 at 2 μg/ml for 1 hour at 21˚C. Since GFP fluorescence fades significantly during the PLA protocol, resulting in reduced signal intensity and poor image resolution, GFP was labeled using an antibody rather than relying on its intrinsic fluorescence”.
(b) Why is it relevant to study the ER exit sites? Some explanation should be included in the main text (page 11) for clarification to non-specialized readers. Again, the quantification should be performed on the proportion of clusters/ensembles out of the total number of channels expressed at the ER (or ER exit sites).
We thank the reviewer for their feedback. We have modified this section to include a more detailed explanation of the relevance of ER exit sites to protein trafficking. ER exit sites serve as specialized sorting hubs that regulate the transition of proteins from the ER to the secretory pathway, distinguishing them from the broader ER network, which primarily facilitates protein synthesis and folding. This additional context clarifies why studying ER exit sites provides valuable insights into ensemble trafficking dynamics.
Regarding quantification, our method does not allow for direct measurement of the total number of BK and Ca<sub>V</sub>1.3 channels expressed at the ER or ER exit sites. Instead, we focused on the proportion of hetero-clusters localized within these compartments, which provides insight into trafficking pathways despite the limitation in absolute channel quantification. We included the following in the manuscript in the Results section.
“To determine whether the observed colocalization between BK–Ca<sub>V</sub>1.3 hetero-clusters and the ER was not simply due to the extensive spatial coverage of ER labeling, we labeled ER exit sites using Sec16-GFP and probed for hetero-clusters with PLA. This approach enabled us to test whether the hetero-clusters were preferentially localized to ER exit sites, which are specialized trafficking hubs that mediate cargo selection and direct proteins from the ER into the secretory pathway. In contrast to the more expansive ER network, which supports protein synthesis and folding, ER exit sites ensure efficient and selective export of proteins to their target destinations”.
“By quantifying the proportion of BK and Ca<sub>V</sub>1.3 hetero-clusters relative to total channel expression at ER exit sites, we found 28 ± 3% colocalization in tsA-201 cells and 11 ± 2% in INS-1 cells (Figure 3F). While the percentage of colocalization between hetero-clusters and the ER or ER exit sites alone cannot be directly compared to infer trafficking dynamics, these findings reinforce the conclusion that hetero-clusters reside within the ER and suggest that BK and Ca<sub>V</sub>1.3 channels traffic together through the ER and exit in coordination”.
(7) Related to Figure 4:
A control is included to confirm that the formation of BK-Cav1.3 ensembles is not unspecific. Association with a protein from the Golgi (58K) is tested. Why is this control only done for Golgi? No similar experiment has been performed in the ER. This aspect should be commented on.
We thank the reviewer for their suggestion. We selected the Golgi as a control because it represents the final stage of protein trafficking before proteins reach their functional destinations. If BK and Ca<sub>V</sub>1.3 hetero-cluster formation is specific at the Golgi, this suggests that their interaction is maintained throughout earlier trafficking steps, including within the ER. While we did not perform an equivalent control experiment in the ER, the Golgi serves as an effective checkpoint for evaluating specificity within the broader protein transport pathway. We included the following in the manuscript.
“We selected the Golgi as a control because it represents the final stage of protein trafficking, ensuring that hetero-cluster interactions observed at this point reflect specificity maintained throughout earlier trafficking steps, including within the ER”.
(8) How is colocalization measured, eg, in Figure 6? Are the images shown in Figure 6 representative? This aspect would benefit from a clearer description.
We thank the reviewer for their suggestion. A section clarifying colocalization measurement and the representativeness of Figure 6 images has been added to the Methods under Data Analysis. We included the following in the manuscript.
For PLA and RNAscope experiments, we used custom-made macros written in ImageJ. Processing of PLA data included background subtraction. To assess colocalization, fluorescent signals were converted into binary images, and channels were multiplied to identify spatial overlap.
(9) The text should be revised for typographical errors, for example:
(a) Summary "evidence of" (CHECK THIS ONE)
We agree with the reviewer, and we corrected the typographical errors
(b) Table 1, row 3: "enriches" should be "enrich"
We agree with the reviewer. The term 'enriches' in Table 1, row 3 has been corrected to 'enrich'.
(c) Figure 2B "priximity"
We agree with the reviewer. The typographical errors in Figure 2B has been corrected from 'priximity' to 'proximity'.
(d) Legend of Figure 7 (C) "size of BK and Cav1.3 channels". Does this correspond to individual channels or clusters?
We agree with the reviewer. The legend of Figure 7C has been clarified to indicate that 'size of BK and Cav1.3 channels' refers to clusters rather than individual channels.
(e) Methods: In the RNASCOPE section, "Fig.4-supp1" should be "Fig. 5-supp1"
(f) Page 15, Figure 5B is cited, should be Figure 6B
We agree with the reviewer. The reference in the RNASCOPE section has been updated from 'Fig.4-supp1' to 'Fig. 5-supp1,' and the citation on Page 15 has been corrected from Figure 5B to Figure 6B.
Reviewer #2 (Recommendations for the authors):
(1) The abstract could be more accessible for a wider readership with improved flow.
We thank the reviewer for their suggestion. We modified the summary as follows to provide a more coherent flow for a wider readership.
“Calcium binding to BK channels lowers BK activation threshold, substantiating functional coupling with calcium-permeable channels. This coupling requires close proximity between different channel types, and the formation of BK–Ca<sub>V</sub>1.3 hetero-clusters at nanometer distances exemplifies this unique organization. To investigate the structural basis of this interaction, we tested the hypothesis that BK and Ca<sub>V</sub>1.3 channels assemble before their insertion into the plasma membrane. Our approach incorporated four strategies: (1) detecting interactions between BK and Ca<sub>V</sub>1.3 proteins inside the cell, (2) identifying membrane compartments where intracellular hetero-clusters reside, (3) measuring the proximity of their mRNAs, and (4) assessing protein interactions at the plasma membrane during early translation. These analyses revealed that a subset of BK and Ca<sub>V</sub>1.3 transcripts are spatially close in micro-translational complexes, and their newly synthesized proteins associate within the endoplasmic reticulum (ER) and Golgi. Comparisons with other proteins, transcripts, and randomized localization models support the conclusion that BK and Ca<sub>V</sub>1.3 hetero-clusters form before their insertion at the plasma membrane”.
(2) Figure 2B - spelling of proximity.
We agree with the reviewer. The typographical errors in Figure 2B has been corrected from 'priximity' to 'proximity'.
Reviewer #3 (Recommendations for the authors):
Minor issues to improve the manuscript:
(1) For completeness, the authors should include a few sentences and appropriate references in the Introduction to mention that BK channels are regulated by auxiliary subunits.
We agree with the reviewer. We have revised the Introduction to include a brief discussion of how BK channel function is modulated by auxiliary subunits and provided appropriate references to ensure completeness. These additions highlight the broader regulatory mechanisms governing BK channel activity, complementing the focus of our study. We included the following in the manuscript.
“Additionally, BK channels are modulated by auxiliary subunits, which fine-tune BK channel gating properties to adapt to different physiological conditions. β and γ subunits regulate BK channel kinetics, altering voltage sensitivity and calcium responsiveness [18]. These interactions ensure precise control over channel activity, allowing BK channels to integrate voltage and calcium signals dynamically in various cell types. Here, we focus on the selective assembly of BK channels with Ca<sub>V</sub>1.3 and do not evaluate the contributions of auxiliary subunits to BK channel organization.”
(2) Insert a space between 'homeostasis' and the square bracket at the end of the Introduction's second paragraph.
We agree with the reviewer. A space has been inserted between 'homeostasis' and the square bracket in the second paragraph of the Introduction for clarity.
(3) The images presented in Figures 2-5 should be increased in size (if permitted by the Journal) to allow the reader to clearly see the puncta in the fluorescent images. This would necessitate reconfiguring the figures into perhaps a full A4 page per figure, but I think the quality of the images presented really do deserve to "be seen". For example, Panels A & B could be at the top of Figure 2, with C & D presented below them. However, I'll leave it up to the authors to decide on the most aesthetically pleasing way to show these.
We agree with the reviewer. We have increased the size of Figures 2–8 to enhance the visibility of fluorescent puncta, as suggested. To accommodate this, we reorganized the panel layout for each figure—for example, in Figure 2, Panels A and B are now placed above Panels C and D to support a more intuitive and aesthetically coherent presentation. We believe this revised configuration highlights the image quality and improves readability while conforming to journal layout constraints.
(4) I think that some of the sentences could be "toned down"
(a) eg, in the first paragraph below Figure 2, the authors state "that 46(plus minus)3% of the puncta were localised on intracellular membranes" when, at that stage, no data had been presented to confirm this. I think changing it to "that 46(plus minus)3% of the puncta were localised intracellularly" would be more precise.
(b) Similarly, please consider replacing the wording of "get together at membranes inside the cell" to "co-localise intracellularly".
(c) In the paragraph just before Figure 5, the authors mention that "the abundance of KCNMA1 correlated more with the abundance of CACNA1D than ... with GAPDH." Although this is technically correct, the R2 value was 0.22, which is exceptionally poor. I don't think that the paper is strengthened by sentences such as this, and perhaps the authors might tone this down to reflect this.
(d) The authors clearly demonstrate in Figure 8 that a significant number of BK channels can traffic to the membrane in the absence of Cav1.3. Irrespective of the differences in transcription/trafficking time between the two channel types, the authors should insert a few lines into their discussion to take this finding into account.
We appreciate the reviewer’s feedback regarding the clarity and precision of our phrasing.
Our responses for each point are below.
(a) We have modified the statement in the first paragraph below Figure 2, changing '46 ± 3% of the puncta were localized on intracellular membranes' to '46 ± 3% of the puncta were localized ‘intracellularly’ to ensure accuracy in the absence of explicit data confirming membrane association.
(b) Similarly, we have replaced 'get together at membranes inside the cell' with 'colocalize intracellularly' to maintain clarity and avoid unintended implications.
(c) Regarding the correlation between KCNMA1 and CACNA1D abundance, we recognize that the R² value of 0.22 is relatively low. To reflect this appropriately, we have revised the phrasing to indicate that while a correlation exists, it is modest. We added the following to the manuscript.
“Interestingly, the abundance of KCNMA1 transcripts correlated more with the abundance of CACNA1D transcripts than with the abundance of GAPDH, a standard housekeeping gene, though with a modest R² value.”
(d) To incorporate the findings from Figure 8, we have added discussion acknowledging that a substantial number of BK channels traffic to the membrane independently of Ca<sub>V</sub>1.3. This addition provides context for potential trafficking mechanisms that operate separately from ensemble formation.
(5) For clarity, please insert the word "total" in the paragraph after Figure 3 "..."63{plus minus}3% versus 50%{plus minus}6% of total PLA puncta were localised at the ER". I know this is explicitly stated later in the manuscript, but I think it needs to be clarified earlier.
We agree with the reviewer. The word 'total' has been inserted in the paragraph following Figure 3 to clarify the percentage of PLA puncta localized at the ER earlier in the manuscript
(6) In the discussion, I think an additional (short) paragraph needs to be included to clarify to the reader why the % "colocalization between ensembles and the ER or the ER exit sites can't be compared or used to understand the dynamics of the ensembles". This may permit the authors to remove the last sentence of the paragraph just before the results section, "BK and Cav1.3 ensembles go through the Golgi."
We thank the reviewer for their suggestion. We have added a short paragraph in the discussion to clarify why colocalization percentages between ensembles and the ER or ER exit sites cannot be compared to infer ensemble dynamics. This allowed us to remove the final sentence of the paragraph preceding the results section ('BK and Cav1.3 ensembles go through the Golgi).
(7) In the paragraph after Figure 6, Figure 5B is inadvertently referred to. Please correct this to Figure 6B.
We agree with the reviewer. The reference to Figure 5B in the paragraph after Figure 6 has been corrected to Figure 6B.
(8) In the discussion under "mRNA co-localisation and Protein Trafficking", please insert a relevant reference illustrating that "disruption in mRNA localization... can lead to ion channel mislocalization".
We agree with the reviewer. We have inserted a relevant reference under 'mRNA Colocalization and Protein Trafficking' to illustrate that disruption in mRNA localization can lead to ion channel mislocalization.
(9) The supplementary Figures appear to be incorrectly numbered. Please correct and also ensure that they are correctly referred to in the text.
We agree with the reviewer. The numbering of the supplementary figures has been corrected, and all references to them in the text have been updated accordingly.
(10) The final panels of the currently labelled Figure 5-Supplementary 2 need to have labels A-F included on the image.
We agree with the reviewer. Labels A-F have been added to the final panels of Figure 5-Supplementary 2.
References
(1) Shah, K.R., X. Guan, and J. Yan, Structural and Functional Coupling of Calcium-Activated BK Channels and Calcium-Permeable Channels Within Nanodomain Signaling Complexes. Frontiers in Physiology, 2022. Volume 12 - 2021.
(2) Chen, A.L., et al., Calcium-Activated Big-Conductance (BK) Potassium Channels Traffic through Nuclear Envelopes into Kinocilia in Ray Electrosensory Cells. Cells, 2023. 12(17): p. 2125.
(3) Berkefeld, H., B. Fakler, and U. Schulte, Ca2+-activated K+ channels: from protein complexes to function. Physiol Rev, 2010. 90(4): p. 1437-59.
(4) Loane, D.J., P.A. Lima, and N.V. Marrion, Co-assembly of N-type Ca2+ and BK channels underlies functional coupling in rat brain. J Cell Sci, 2007. 120(Pt 6): p. 98595.
(5) Boncompain, G. and F. Perez, The many routes of Golgi-dependent trafficking. Histochemistry and Cell Biology, 2013. 140(3): p. 251-260.
(6) Kurokawa, K. and A. Nakano, The ER exit sites are specialized ER zones for the transport of cargo proteins from the ER to the Golgi apparatus. The Journal of Biochemistry, 2019. 165(2): p. 109-114.
(7) Chen, G., et al., BK channel modulation by positively charged peptides and auxiliary γ subunits mediated by the Ca2+-bowl site. Journal of General Physiology, 2023. 155(6).
• Sleep-time compute allows models to "think" offline about contexts before queries are presented, reducing test-time compute requirements by ~5× on benchmark tasks
"by anticipating what queries users might ask and pre-computing useful quantities, we can significantly reduce the compute requirements at test-time"
• The approach works by processing context c during idle time to create an enhanced representation c', which is then used at test-time: S(c) → c', followed by Tb(q, c') → a
"In practice, this is achieved by prompting the model to generate a new context consisting of inferences about the existing context, which may be potentially useful for answering test-time queries"
• Performance improvements: Sleep-time compute reduces test-time compute needed to achieve same accuracy by ~5× on Stateful GSM-Symbolic and Stateful AIME
"Sleep-time compute produces a pareto improvement in the test-time compute vs. accuracy curve, reducing the test-time compute needed to achieve the same accuracy by ∼ 5×"
• Scaling benefits: By scaling up sleep-time compute, accuracy increases by up to 13% on Stateful GSM-Symbolic and 18% on Stateful AIME
• Cost amortization: When multiple queries share the same context, average cost per query decreases by 2.5×
"By amortizing sleep-time compute across related queries about the same context using Multi-Query GSM-Symbolic, we can decrease the average cost per query by 2.5×"
• Stateful GSM-Symbolic: Modified from GSM-Symbolic (P1: 5000 examples, P2: 2500 examples) by splitting problems into context and question
"We introduce two datasets to study applying sleep-time compute in stateful settings, Stateful GSM-Symbolic, and Stateful AIME – by splitting the existing problems in these datasets into a context and a question"
• Stateful AIME: Contains 60 questions from AIME 2024 and 2025, split into context and query components
• Multi-Query GSM-Symbolic: Extends GSM-Symbolic with multiple related queries per context (P1: 12,043 questions, 1,095 contexts; P2: 5,497 questions, 500 contexts)
• SWE-Features: Software engineering benchmark for multi-file feature implementation tasks (33 examples from Aider-AI/aider and ComfyUI repositories)
• Non-reasoning models: GPT-4o-mini and GPT-4o on GSM-Symbolic tasks
• Reasoning models: OpenAI's o1, o3-mini, Anthropic's Claude Sonnet 3.7 Extended Thinking, and DeepSeek-R1 on AIME tasks
• Test-time compute scaled both sequentially (varying verbosity/reasoning effort) and in parallel (pass@k sampling)
• Query predictability correlation: Sleep-time compute is most effective when queries are predictable from context
"sleep-time compute is more effective in settings where the query is more easily predictable from the context"
• Predictability measured using log-probability of question given context under Llama2-70B base model
• Accuracy gap between sleep-time and test-time compute widens for more predictable questions (binned analysis across 5 quantiles)
• Sleep-time compute implemented via function calling with two functions:
- rethink_memory: Takes new string input and replaces current context
- finish_rethinking: Terminates sleep-time compute process
• Models allowed up to 10 calls to rethink_memory function
• Cost modeling assumes test-time tokens are 10× more expensive than sleep-time tokens (t=10) due to latency optimization
"Since at test-time, there are strict latency constraints, and latency optimized inference can be roughly 10× more expensive, we model the total cost of inference between both sleep-time and test-time, by up-weighing the cost of test-time tokens"
• Pass@k parallel scaling: Sleep-time compute consistently outperforms pass@k at same test-time token budget
"sleep-time compute consistently outperforms pass@k parallel scaling at the same test-time token budget, demonstrating that sleep-time compute can be a more effective way to scale inference-time compute than standard parallel test-time scaling"
• Context-only baseline: Sleep-time compute significantly outperforms models that only receive context and must guess the question, demonstrating questions are not trivially predictable
• At lower test-time budgets, sleep-time compute achieves ~1.5× reduction in test-time tokens with higher F1 scores
• At higher budgets, standard test-time compute performs better, with higher precision but comparable recall
• Hypothesis: sleep-time compute explores more files, leading to editing more files and slightly lower precision
• Builds on recent test-time scaling approaches: sequential (OpenAI o1, DeepSeek-R1) and parallel (pass@k, best-of-N)
• Connection to speculative decoding (Leviathan et al., 2023): Both speculate on user queries, but sleep-time compute uses generated tokens as input regardless of actual query
• Connection to pre-computation in systems: Similar to memory caches (Smith, 1982) and data cubes for OLAP workloads (Gray et al., 1997)
• Resembles representation learning but operates in natural language space rather than parameter/activation space
• Sleep-time compute less effective when queries are unpredictable or unrelated to context
• Current approach assumes simple two-phase interaction (sleep-time and test-time), but real-world scenarios involve multiple interaction rounds
• Future work: Optimal allocation of compute between sleep-time and test-time based on query predictability
• Potential application to synthetic data generation at scale for pretraining
Kevin Lin, Charlie Snell, Yu Wang, Charles Packer, Sarah Wooders, Ion Stoica, Joseph E. Gonzalez (Letta & UC Berkeley)
Code and data: https://github.com/letta-ai/sleep-time-compute
Neither transformers nor sub-quadratic architectures are well-suited for long-context training
"the cost of processing the context is too expensive in the former, too inexpensive in the latter"
Power attention introduced as solution: A linear-cost sequence modeling architecture with independently adjustable state size > "an architectural layer for linear-cost sequence modeling whose state size can be adjusted independently of parameters"
Weight-state FLOP ratio should approach 1:1 for compute-optimal models
"for compute-optimal models, the WSFR should be somewhat close to 1:1"
Exponential attention becomes unbalanced at long contexts
At 1,000,000 context: WSFR is 1:125
"exponential attention is balanced for intermediate context lengths, but unbalanced for long context lengths, where it does far more state FLOPs than weight FLOPs"
Linear attention remains unbalanced at all context lengths
"Linear attention...is unbalanced at all context lengths in the opposite direction: far more weight FLOPs than state FLOPs"
Large state size improves ICL performance
"state scaling improves performance"
Windowed attention fails ICL beyond window size
"no in-context learning occurs beyond 100 tokens for window-32 attention"
Linear attention maintains ICL across entire sequence
"linear attention...demonstrate consistent in-context learning across the entire sequence"
Power attention formula: Uses p-th power instead of exponential
"attnᵖₚₒw(Q, K, V)ᵢ = Σⱼ₌₁ⁱ (QᵢᵀKⱼ)ᵖVⱼ"
Symmetric power expansion (SPOW) reduces state size vs tensor power (TPOW)
"SPOWₚ is a state expansion that increases the state size by a factor of (ᵈ⁺ᵖ⁻¹ₚ)/d without introducing any parameters"
Fused expand-MMA kernel: Expands tiles on-the-fly during matrix multiplication
"a matrix multiplication where the tiles of one operand are expanded on-the-fly"
Tiled symmetric power expansion (TSPOW): Interpolates between TPOW and SPOW
Optimal tile size: d-tile = 8 for p=2, d-tile = 4 for p=3
Chunked form enables practical efficiency
"The chunked form interpolates between the recurrent form and the attention form, capturing benefits of both"
"In all cases, the ICL curve becomes steeper as we scale the respective axis"
"Most sequences in OpenWebText have length less than 1k"
"autoregressive prediction of natural language is largely dominated by short-context dependencies"
Comprehensive taxonomy: "We establish a structured understanding of prompt engineering by assembling a taxonomy of prompting techniques and analyzing their applications. We present a detailed vocabulary of 33 vocabulary terms, a taxonomy of 58 LLM prompting techniques, and 40 techniques for other modalities."
Scope limitation: "We limit our study to focus on prefix prompts rather than cloze prompts, because modern LLM transformer architectures widely employ prefix prompts"
Focus on hard prompts: "Additionally, we refined our focus to hard (discrete) prompts rather than soft (continuous) prompts and leave out papers that make use of techniques using gradient-based updates (i.e. fine-tuning). Hard prompts contain only tokens (vectors) that correspond to words in the model's vocabulary"
Prompt definition: "A prompt is an input to a Generative AI model, that is used to guide its output"
Prompt template: "A prompt template is a function that contains one or more variables which will be replaced by some media (usually text) to create a prompt"
Prompting: "Prompting is the process of providing a prompt to a GenAI, which then generates a response"
Consolidated definition: "Prompt engineering is the iterative process of developing a prompt by modifying or changing the prompting technique that you are using"
Process description: "The Prompt Engineering Process consists of three repeated steps 1) performing inference on a dataset 2) evaluating performance and 3) modifying the prompt template"
Directive: "Many prompts issue a directive in the form of an instruction or question. This is the core intent of the prompt"
Examples/Exemplars: "Examples, also known as exemplars or shots, act as demonstrations that guide the GenAI to accomplish a task"
Output formatting: "It is often desirable for the GenAI to output information in certain formats, for example, CSV, Markdown, XML, or even custom formats"
Style instructions: "Style instructions are a type of output formatting used to modify the output stylistically rather than structurally"
Role/Persona: "A Role, also known as a persona, is a frequently discussed component that can improve writing and style text"
Approach: "We conducted a machine-assisted systematic review grounded in the PRISMA process to identify 58 different text-based prompting techniques"
Data sources: "Our main data sources were arXiv, Semantic Scholar, and ACL. We query these databases with a list of 44 keywords narrowly related to prompting and prompt engineering"
Pipeline: "We retrieve papers from arXiv based on a simple set of keywords and boolean rules. Then, human annotators label a sample of 1,661 articles"
Inter-rater reliability: "A set of 300 articles are reviewed independently by two annotators, with 92% agreement (Krippendorff's α = Cohen's κ = 81%)"
Final dataset: "The combined human and LLM annotations generate a final set of 1,565 papers"
Definition: "ICL refers to the ability of GenAIs to learn skills and tasks by providing them with exemplars and or relevant instructions within the prompt, without the need for weight updates/retraining"
Few-Shot Prompting: "Brown et al. (2020) is the paradigm seen in Figure 2.4, where the GenAI learns to complete a task with only a few examples (exemplars)"
Exemplar quantity: "Increasing the quantity of exemplars in the prompt generally improves model performance, particularly in larger models. However, in some cases, the benefits may diminish beyond 20 exemplars"
Exemplar ordering: "The order of exemplars affects model behavior. On some tasks, exemplar order can cause accuracy to vary from sub-50% to 90%+"
Label distribution impact: "As in traditional supervised machine learning, the distribution of exemplar labels in the prompt affects behavior"
Label quality: "Despite the general benefit of multiple exemplars, the necessity of strictly valid demonstrations is unclear. Some work suggests that the accuracy of labels is irrelevant—providing models with exemplars with incorrect labels may not negatively diminish performance"
Exemplar format: "The formatting of exemplars also affects performance. One of the most common formats is 'Q: {input}, A: {label}', but the optimal format may vary across tasks"
Exemplar similarity: "Selecting exemplars that are similar to the test sample is generally beneficial for performance. However, in some cases, selecting more diverse exemplars can improve performance"
K-Nearest Neighbor (KNN): "Liu et al. (2021) is part of a family of algorithms that selects exemplars similar to test samples to boost performance"
Vote-K: "Su et al. (2022) is another method to select similar exemplars to the test sample... Vote-K also ensures that newly added exemplars are sufficiently different than existing ones to increase diversity"
Self-Generated In-Context Learning (SG-ICL): "Kim et al. (2022) leverages a GenAI to automatically generate exemplars. While better than zero-shot scenarios when training data is unavailable, the generated samples are not as effective as actual data"
Prompt Mining: "Jiang et al. (2020) is the process of discovering optimal 'middle words' in prompts through large corpus analysis"
Role Prompting: "Wang et al. (2023j); Zheng et al. (2023d), also known as persona prompting, assigns a specific role to the GenAI in the prompt"
Style Prompting: "Lu et al. (2023a) involves specifying the desired style, tone, or genre in the prompt to shape the output"
Emotion Prompting: "Li et al. (2023a) incorporates phrases of psychological relevance to humans (e.g., 'This is important to my career') into the prompt, which may lead to improved LLM performance"
System 2 Attention (S2A): "Weston and Sukhbaatar (2023) first asks an LLM to rewrite the prompt and remove any information unrelated to the question therein"
Rephrase and Respond (RaR): "Deng et al. (2023) instructs the LLM to rephrase and expand the question before generating the final answer"
Re-reading (RE2): "Xu et al. (2023) adds the phrase 'Read the question again:' to the prompt in addition to repeating the question"
Self-Ask: "Press et al. (2022) prompts LLMs to first decide if they need to ask follow up questions for a given prompt"
Chain-of-Thought (CoT): "Wei et al. (2022b) leverages few-shot prompting to encourage the LLM to express its thought process before delivering its final answer"
Zero-Shot-CoT: "The most straightforward version of CoT contains zero exemplars. It involves appending a thought inducing phrase like 'Let's think step by step.' to the prompt"
Step-Back Prompting: "Zheng et al. (2023c) is a modification of CoT where the LLM is first asked a generic, high-level question about relevant concepts or facts before delving into reasoning"
Thread-of-Thought (ThoT): "Zhou et al. (2023) consists of an improved thought inducer for CoT reasoning. Instead of 'Let's think step by step,' it uses 'Walk me through this context in manageable parts step by step, summarizing and analyzing as we go.'"
Tabular Chain-of-Thought (Tab-CoT): "Jin and Lu (2023) consists of a Zero-Shot CoT prompt that makes the LLM output reasoning as a markdown table"
Contrastive CoT: "Chia et al. (2023) adds both exemplars with incorrect and correct explanations to the CoT prompt in order to show the LLM how not to reason"
Complexity-based Prompting: "Fu et al. (2023b) involves two major modifications to CoT. First, it selects complex examples for annotation and inclusion in the prompt... Second, during inference, it samples multiple reasoning chains"
Active Prompting: "Diao et al. (2023) starts with some training questions/exemplars, asks the LLM to solve them, then calculates uncertainty (disagreement in this case) and asks human annotators to rewrite the exemplars with highest uncertainty"
Memory-of-Thought: "Li and Qiu (2023b) leverage unlabeled training exemplars to build Few-Shot CoT prompts at test time"
Automatic Chain-of-Thought (Auto-CoT): "Zhang et al. (2022b) uses Wei et al. (2022b)'s Zero-Shot prompt to automatically generate chains of thought. These are then used to build a Few-Shot CoT prompt"
Least-to-Most Prompting: "Zhou et al. (2022a) starts by prompting a LLM to break a given problem into sub-problems without solving them. Then, it solves them sequentially, appending model responses to the prompt each time"
Decomposed Prompting (DECOMP): "Khot et al. (2022) Few-Shot prompts a LLM to show it how to use certain functions. These might include things like string splitting or internet searching"
Plan-and-Solve Prompting: "Wang et al. (2023f) consists of an improved Zero-Shot CoT prompt, 'Let's first understand the problem and devise a plan to solve it. Then, let's carry out the plan and solve the problem step by step'"
Tree-of-Thought (ToT): "Yao et al. (2023b), also known as Tree of Thoughts, creates a tree-like search problem by starting with an initial problem then generating multiple possible steps in the form of thoughts"
Program-of-Thoughts: "Chen et al. (2023d) uses LLMs like Codex to generate programming code as reasoning steps. A code interpreter executes these steps to obtain the final answer"
Skeleton-of-Thought: "Ning et al. (2023) focuses on accelerating answer speed through parallelization. Given a problem, it prompts an LLM to create a skeleton of the answer"
Demonstration Ensembling (DENSE): "Khalifa et al. (2023) creates multiple few-shot prompts, each containing a distinct subset of exemplars from the training set. Next, it aggregates over their outputs"
Self-Consistency: "Wang et al. (2022) is based on the intuition that multiple different reasoning paths can lead to the same answer. This method first prompts the LLM multiple times to perform CoT, crucially with a non-zero temperature"
Universal Self-Consistency: "Chen et al. (2023e) is similar to Self-Consistency except that rather than selecting the majority response by programmatically counting how often it occurs, it inserts all outputs into a prompt template"
DiVeRSe: "Li et al. (2023i) creates multiple prompts for a given problem then performs Self-Consistency for each, generating multiple reasoning paths"
Prompt Paraphrasing: "Jiang et al. (2020) transforms an original prompt by changing some of the wording, while still maintaining the overall meaning"
Self-Calibration: "Kadavath et al. (2022) first prompts an LLM to answer a question. Then, it builds a new prompt that includes the question, the LLM's answer, and an additional instruction asking whether the answer is correct"
Self-Refine: "Madaan et al. (2023) is an iterative framework where, given an initial answer from the LLM, it prompts the same LLM to provide feedback on the answer, and then prompts the LLM to improve the answer based on the feedback"
Self-Verification: "Weng et al. (2022) generates multiple candidate solutions with Chain-of-Thought (CoT). It then scores each solution by masking certain parts of the original question"
Chain-of-Verification (COVE): "Dhuliawala et al. (2023) first uses an LLM to generate an answer to a given question. Then, it creates a list of related questions that would help verify the correctness of the answer"
AutoPrompt: "Shin et al. (2020b) uses a frozen LLM as well as a prompt template that includes some 'trigger tokens', whose values are updated via backpropagation at training time"
Automatic Prompt Engineer (APE): "Zhou et al. (2022b) uses a set of exemplars to generate a Zero-Shot instruction prompt. It generates multiple possible prompts, scores them, then creates variations of the best ones"
Gradientfree Instructional Prompt Search (GrIPS): "Prasad et al. (2023) is similar to APE, but uses a more complex set of operations including deletion, addition, swapping, and paraphrasing"
RLPrompt: "Deng et al. (2022) uses a frozen LLM with an unfrozen module added. It uses this LLM to generate prompt templates, scores the templates on a dataset, and updates the unfrozen module using Soft Q-Learning"
Answer Shape: "The shape of an answer is its physical format. For example, it could be a token, span of tokens, or even an image or video"
Answer Space: "The space of an answer is the domain of values that its structure may contain. This may simply be the space of all tokens, or in a binary labeling task, could just be two possible tokens"
Answer Extractor: "In cases where it is impossible to entirely control the answer space... a rule can be defined to extract the final answer. This rule is often a simple function (e.g. a regular expression)"
Verbalizer: "Often used in labeling tasks, a verbalizer maps a token, span, or other type of output to a label and vice-versa (injective)"
Regex: "Regexes are often used to extract answers. They are usually used to search for the first instance of a label"
Separate LLM: "Sometimes outputs are so complicated that regexes won't work consistently. In this case, it can be useful to have a separate LLM evaluate the output and extract an answer"
Translate First Prompting: "Shi et al. (2022) is perhaps the simplest strategy and first translates non-English input examples into English"
Cross-Lingual Thought (XLT): "Huang et al. (2023a) utilizes a prompt template composed of six separate instructions, including role assignment, cross-lingual thinking, and CoT"
Cross-Lingual Self Consistent Prompting (CLSP): "Qin et al. (2023a) introduces an ensemble technique that constructs reasoning paths in different languages to answer the same question"
English advantage: "Constructing the prompt template in English is often more effective than in the task language for multilingual tasks. This is likely due to the predominance of English data during LLM pre-training"
Native language rationale: "In contrast, many multilingual prompting benchmarks such as BUFFET or LongBench use task language prompts for language-specific use cases"
Multi-Aspect Prompting and Selection (MAPS): "He et al. (2023b) mimics the human translation process, which involves multiple preparatory steps to ensure high-quality output"
Chain-of-Dictionary (CoD): "Lu et al. (2023b) first extracts words from the source phrase, then makes a list of their meanings in multiple languages, automatically via retrieval from a dictionary"
Interactive-Chain-Prompting (ICP): "Pilault et al. (2023) deals with potential ambiguities in translation by first asking the GenAI to generate sub-questions about any ambiguities in the phrase to be translated"
Prompt Modifiers: "are simply words appended to a prompt to change the resultant image. Components such as Medium (e.g. 'on canvas') or Lighting (e.g. 'a well lit scene') are often used"
Negative Prompting: "allows users to numerically weight certain terms in the prompt so that the model considers them more/less heavily than others"
Paired-Image Prompting: "shows the model two images: one before and one after some transformation. Then, present the model with a new image for which it will perform the demonstrated conversion"
Image-as-Text Prompting: "Hakimov and Schlangen (2023) generates a textual description of an image. This allows for the easy inclusion of the image (or multiple images) in a text-based prompt"
Duty Distinct Chain-of-Thought (DDCoT): "Zheng et al. (2023b) extends Least-to-Most prompting to the multimodal setting, creating subquestions, then solving them and combining the answers"
Chain-of-Images (CoI): "Meng et al. (2023) is a multimodal extension of Chain-of-Thought prompting, that generates images as part of its thought process"
Audio: "Experiments with audio ICL have generated mixed results, with some open source audio models failing to perform ICL. However, other results do show an ICL ability in audio models"
Video: "Prompting has also been extended to the video modality, for use in text-to-video generation, video editing, and video-to-text generation"
3D: "Prompting can also be used in 3D modalities, for example in 3D object synthesis, 3D surface texturing, and 4D scene generation"
Modular Reasoning, Knowledge, and Language (MRKL) System: "Karpas et al. (2022) is one of the simplest formulations of an agent. It contains a LLM router providing access to multiple tools"
Self-Correcting with Tool-Interactive Critiquing (CRITIC): "Gou et al. (2024a) first generates a response to the prompt, with no external calls. Then, the same LLM criticizes this response for possible errors"
Program-aided Language Model (PAL): "Gao et al. (2023b) translates a problem directly into code, which is sent to a Python interpreter to generate an answer"
Tool-Integrated Reasoning Agent (ToRA): "Gou et al. (2024b) is similar to PAL, but instead of a single code generation step, it interleaves code and reasoning steps for as long as necessary"
Reasoning and Acting (ReAct): "Yao et al. (2022) generates a thought, takes an action, and receives an observation (and repeats this process) when given a problem to solve"
Reflexion: "Shinn et al. (2023) builds on ReAct, adding a layer of introspection. It obtains a trajectory of actions and observations, then is given an evaluation of success/failure"
Voyager: "Wang et al. (2023a) is composed of three parts. First, it proposes tasks for itself to complete in order to learn more about the world. Second, it generates code to execute these actions. Finally, it saves these actions to be retrieved later"
Ghost in the Minecraft (GITM): "Zhu et al. (2023) starts with an arbitrary goal, breaks it down into subgoals recursively, then iteratively plans and executes actions by producing structured text"
Core concept: "RAG is a paradigm in which information is retrieved from an external source and inserted into the prompt. This can enhance performance in knowledge intensive tasks"
Verify-and-Edit: "Zhao et al. (2023a) improves on self-consistency by generating multiple chains-of-thought, then selecting some to be edited. They do this by retrieving relevant (external) information"
Interleaved Retrieval guided by Chain-of-Thought (IRCoT): "Trivedi et al. (2023) is a technique for multi-hop question answering that interleaves CoT and retrieval"
In-Context Learning: "is frequently used in evaluation prompts, much in the same way it is used in other applications"
Role-based Evaluation: "is a useful technique for improving and diversifying evaluations. By creating prompts with the same instructions for evaluation, but different roles, it is possible to effectively generate diverse evaluations"
Chain-of-Thought: "prompting can further improve evaluation performance"
Model-Generated Guidelines: "Liu et al. (2023d, h) prompt an LLM to generate guidelines for evaluation. This reduces the insufficient prompting problem arising from ill-defined scoring guidelines"
Styling: "Formatting the LLM's response using XML or JSON styling has also been shown to improve the accuracy of the judgment generated by the evaluator"
Linear Scale: "A very simple output format is a linear scale (e.g. 1-5). Many works use ratings of 1-10, 1-5, or even 0-1"
Binary Score: "Prompting the model to generate binary responses like Yes or No and True or False is another frequently used output format"
Likert Scale: "Prompting the GenAI to make use of a Likert Scale can give it a better understanding of the meaning of the scale"
LLM-EVAL: "Lin and Chen (2023) is one of the simplest evaluation frameworks. It uses a single prompt that contains a schema of variables to evaluate"
G-EVAL: "Liu et al. (2023d) is similar to LLM-EVAL, but includes an AutoCoT steps in the prompt itself"
ChatEval: "Chan et al. (2024) uses a multi-agent debate framework with each agent having a separate role"
Batch Prompting: "For improving compute and cost efficiency, some works employ batch prompting for evaluation where multiple instances are evaluated at once"
Pairwise Evaluation: "Chen et al. (2023g) find that directly comparing the quality of two texts may lead to suboptimal results and that explicitly asking LLM to generate a score for individual summaries is the most effective"
Definition: "Prompt hacking refers to a class of attacks which manipulate the prompt in order to attack a GenAI"
Prompt Injection: "is the process of overriding original developer instructions in the prompt with user input"
Jailbreaking: "is the process of getting a GenAI model to do or say unintended things through prompting"
Training Data Reconstruction: "refers to the practice of extracting training data from GenAIs. A straightforward example of this is Nasr et al. (2023), who found that by prompting ChatGPT to repeat the word 'company' forever, it began to regurgitate training data"
Prompt Leaking: "refers to the process of extracting the prompt template from an application. Developers often spend significant time creating prompt templates, and consider them to be IP worth protecting"
Package Hallucination: "occurs when LLM-generated code attempts to import packages that do not exist. After discovering what package names are frequently hallucinated by LLMs, hackers could create those packages, but with malicious code"
Prompt-based Defenses: "Multiple prompt-based defenses have been proposed, in which instructions are included in the prompt to avoid prompt injection. However, Schulhoff et al. (2023) ran a study with hundreds of thousands of malicious prompts and found that no prompt-based defense is fully secure"
Detectors: "are tools designed to detect malicious inputs and prevent prompt hacking. Many companies have built such detectors, which are often built using fine-tuned models trained on malicious prompts"
Guardrails: "are rules and frameworks for guiding GenAI outputs. Guardrails often make use of detectors, but not always. Guardrails are more concerned with the general dialogue flow in an application"
Small changes impact: "Several works show that LLMs are highly sensitive to the input prompt, i.e., even subtle changes to a prompt such as exemplar order can result in vastly different outputs"
Task format variation: "describes different ways to prompt an LLM to execute the same task... Zhao et al. (2021b) show that these minor changes can alter the accuracy of GPT-3 by up to 30%"
Prompt Drift: "Chen et al. (2023b) occurs when the model behind an API changes over time, so the same prompt may produce different results on the updated model"
Overconfidence: "LLMs are often overconfident in their answers, especially when prompted to express their own confidence in words, which may lead to user overreliance on model outputs"
Sycophancy: "refers to the concept that LLMs will often express agreement with the user, even when that view contradicts the model's own initial output"
Vanilla Prompting: "Si et al. (2023b) simply consists of an instruction in the prompt that tells the LLM to be unbiased. This technique has also been referred to as moral self-correction"
Cultural Awareness: "Yao et al. (2023a) can be injected into prompts to help LLMs with cultural adaptation"
AttrPrompt: "Yu et al. (2023) is a prompting technique designed to avoid producing text biased towards certain attributes when generating synthetic data"
Ambiguous Demonstrations: "Gao et al. (2023a) are examples that have an ambiguous label set. Including them in a prompt can increase ICL performance"
Question Clarification: "Rao and Daumé III (2019) allows the LLM to identify ambiguous questions and generate clarifying questions to pose to the user"
Performance trends: "Performance generally improved as techniques grew more complex. However, Zero-Shot-CoT dropped precipitously from Zero-Shot. Although it had a wide spread, for all variants, Zero-Shot performed better"
Best performer: "Few-Shot CoT performs the best, and unexplained performance drops from certain techniques need further research"
Self-Consistency impact: "Both cases of Self-Consistency, naturally had lower spread since they repeated a single technique, but it only improved accuracy for Zero-Shot prompts"
Problem domain: "Our illustrative problem involves detection of signal that is predictive of crisis-level suicide risk in text written by a potentially suicidal individual"
Target construct: "We focus here on the most important predictive factor in Suicide Crisis Syndrome assessments, referred to in the literature as either frantic hopelessness or entrapment"
Dataset: "Two coders trained on the recognition of the factors in Suicide Crisis Syndrome coded a set of 221 posts for presence or absence of entrapment, achieving solid inter-coder reliability (Krippendorff's alpha = 0.72)"
Development effort: "The exercise proceeded through 47 recorded development steps, cumulatively about 20 hours of work. From a cold start with 0% performance, performance was boosted to an F1 of 0.53"
Best manual approach: "10-Shot AutoDiCoT prompt includes 15 exemplars (without CoT reasoning) and one bootstrapped reasoning demonstration"
DSPy comparison: "The best resulting prompt... achieves 0.548 F1 (and 0.385 / 0.952 precision / recall) on the test set, without making any use of the professor's email nor the incorrect instruction about the explicitness of entrapment"
Sensitivity to details: "prompt engineering is fundamentally different from other ways of getting a computer to behave the way you want it to: these systems are being cajoled, not programmed, and... can be incredibly sensitive to specific details in prompts without there being any obvious reason those details should matter"
Domain expertise crucial: "the third and most important take-away is that prompt engineering should involve engagement between the prompt engineer, who has expertise in how to coax LLMs to behave in desired ways, and domain experts, who understand what those desired ways are and why"
Automation value: "Ultimately we found that there was significant promise in an automated method for exploring the prompting space, but also that combining that automation with human prompt engineering/revision was the most successful approach"
Start simple: "To those just beginning in prompt engineering, our recommendations resemble what one would recommend in any machine learning setting: understand the problem you are trying to solve (rather than just focusing on input/output and benchmark scores)"
Stay skeptical: "It is better to start with simpler approaches first, and to remain skeptical of claims about method performance"
Final corpus: "The dataset contains 1,565 research papers in PDF format. Any duplicate papers were removed automatically, though some could exist"
Time frame: "The dataset was curated the duration of the research paper, primarily in February of 2024"
Source distribution: "We wrote scripts to automatically query the APIs of Arxiv and Semantic Scholar"
Human validation: "After collecting data from different sources, we removed duplicate papers and did a manual and semi-automated review of papers to ensure they were all relevant"
LLM-assisted review: "We develop a prompt using gpt-4-1106-preview to classify the remaining articles. We validate the prompt against 100 ground-truth annotations, achieving 89% precision and 75% recall (for an F1 of 81%)"
Black art acknowledgment: "This can be interpreted both optimistically and pessimistically. Optimistically, it demonstrates how improvements can arise through exploration and fortuitous discovery. On the pessimistic side, the value of duplicating the email in the prompt highlights the extent to which prompting remains a difficult to explain black art"
Emergent vs discovered: "Many of the techniques described here have been called 'emergent', but it is perhaps more appropriate to say that they were discovered—the result of thorough experimentation, analogies from human reasoning, or pure serendipity"
Lack of standardization: "The field is new, and evaluation is variable and unstandardized—even the most meticulous experimentation may suffer from unanticipated shortcomings, and model outputs themselves are sensitive to meaning-preserving changes in inputs"
Transfer uncertainty: "As a result, we encourage the reader to avoid taking any claims at face value and to recognize that techniques may not transfer to other models, problems, or datasets"
Focus restrictions: "To keep the work approachable to less technical readers and maintain a manageable scope... we only study task-agnostic techniques"
Exclusions: "These decisions keep the work approachable to less technical readers and maintain a manageable scope"
Variable replacement: "A prompt template is a function that contains one or more variables which will be replaced by some media (usually text) to create a prompt"
Context preservation: "It is often necessary to include additional information in the prompt... Additional Information is sometimes called 'context', though we discourage the use of this term as it is overloaded with other meanings in the prompting space"
Verbalizer design: "For example, if we wish for a model to predict whether a Tweet is positive or negative, we could prompt it to output either '+' or '-' and a verbalizer would map these token sequences to the appropriate labels"
Regex patterns: "Regexes are often used to extract answers. They are usually used to search for the first instance of a label. However, depending on the output format and whether CoTs are generated, it may be better to search for the last instance"
Cascading approaches: "Sometimes outputs are so complicated that regexes won't work consistently. In this case, it can be useful to have a separate LLM evaluate the output and extract an answer"
Guardrails interference: "A take-away from this initial phase is that the 'guard rails' associated with some large language models may interfere with the ability to make progress on a prompting task, and this could influence the choice of model for reasons other than the LLM's potential quality"
Temperature settings: "For the two Self-Consistency results, we set temperature to 0.5, following Wang et al. (2022)'s guidelines. For all other prompts, a temperature of 0 was used"
In-Context Learning ambiguity: "Note that the word 'learn' is misleading. ICL can simply be task specification–the skills are not necessarily new, and can have already been included in the training data"
Brown et al. definitions: "Brown et al. (2020) seemingly offer two different definitions for ICL... However, they explicitly state that ICL does not necessarily involve learning new tasks"
Prompt vs Prompt Template: "Brown et al. (2020) consider the word 'llama' to be the prompt, while 'Translate English to French:' is the 'task description'. More recent papers, including this one, refer to the entire string passed to the LLM as the prompt"
Hard (discrete): "These prompts only contain tokens that directly correspond to words in the LLM vocabulary"
Soft (continuous): "These prompts contain tokens that may not correspond to any word in the vocabulary... Soft prompts can be used when fine-tuning is desired, but modifying the weights of the full model is prohibitively expensive"
Prefix prompts: "In Prefix prompts, the token to be predicted is at the end of the prompt. This is usually the case with modern GPT-style models"
Cloze prompts: "In Cloze prompts, the token(s) to be predicted are presented as 'slots to fill', usually somewhere in the middle of the prompt. This is usually the case for earlier transformer models such as BERT"
Algorithm description: "We call the algorithm in Figure 6.12 Automatic Directed CoT (AutoDiCoT), since it automatically directs the CoT process to reason in a particular way"
Process: "For each pair (qi, ai) in training data: Label qi as entrapment or not using the model. If correct, prompt with 'Why?' to generate reasoning. If incorrect, prompt 'It is actually [is/is not] entrapment, please explain why.'"
Generalizability: "This technique can be generalized to any labeling task. It combines the automatic generation of CoTs with showing the LLM examples of bad reasoning, as in the case of Contrastive CoT"
Six critical factors: "We highlight six separate design decisions, including the selection and order of exemplars that critically influence the output quality"
Tradeoffs: "Although effective, employing KNN during prompt generation may be time and resource intensive"
FLARE approach: "Forward-Looking Active REtrieval augmented generation (FLARE) and Imitate, Retrieve, Paraphrase (IRP) perform retrieval multiple times during long-form generation"
Three-step process: "1) generating a temporary sentence to serve as a content plan; 2) retrieving external knowledge using the temporary sentence as a query; 3) injecting the retrieved knowledge into the temporary sentence"
Query quality: "These temporary sentences have been shown to be better search queries compared to the document titles provided in long-form generation tasks"
Most cited techniques: "The prevalence of citations for Few-Shot and Chain-of-Thought prompting is unsurprising and helps to establish a baseline for understanding the prevalence of other techniques"
Model usage: Citation analysis shows GPT family dominates research, followed by PaLM and open-source alternatives
Dataset popularity: MMLU, GSM8K, and arithmetic reasoning benchmarks most frequently used
Paper growth: 1,565 relevant papers identified from broader corpus of 4,247 unique records
Quality metrics: Inter-annotator agreement of 92% (Krippendorff's α = Cohen's κ = 81%) for relevance labeling
LLM assistance: "We validate the prompt against 100 ground-truth annotations, achieving 89% precision and 75% recall (for an F1 of 81%)" for automated paper screening
Basic prompt conditioning: "p(A|T,Q) = ∏(i=1 to |A|) p_LM(ai|T,Q,a1:i-1)" where T is prompt template, Q is question, A is answer
Few-shot extension: "p(A|T(X,x)) = ∏(i=1 to |A|) p_LM(ai|T(X,x),a1:i-1)" where X is set of training exemplars
Optimization objective: "T* = argmax_T E_{xi,yi~D}[S(p_LM(A|T(xi)),yi)]" maximizing scoring function S over dataset D
Answer engineering: "A ~ p_LM(A|T(xi),yi); T* = argmax_{T,E} E_{xi,yi~D}[S(E(A),yi)]" where E is extraction function
Critical restriction: "NEVER use localStorage, sessionStorage, or ANY browser storage APIs in artifacts. These APIs are NOT supported and will cause artifacts to fail in the Claude.ai environment"
Alternatives: "Instead, you MUST: Use React state (useState, useReducer) for React components; Use JavaScript variables or objects for HTML artifacts; Store all data in memory during the session"
Context Engineering over RAG: "RAG" as a term is fundamentally flawed and confusing
"RAG. We never use the term rag. I hate the term rag... retrieval, augmented generation. Are three concepts put together into one thing? Like, that's just really confusing."
Context Engineering Definition: The job of determining optimal context window contents
"Context engineering is the job of figuring out what should be in the context window any given LLM generation step. And there's both an inner loop, which is setting up the, you know, what should be in the context window this time. And there's the outer loop, which is how do you get better over time at filling the context window with only the relevant information."
Models degrade with longer contexts: Performance is not invariant to token count
"The performance of LLMs is not invariant to how many tokens you use. As you use more and more tokens, the model can pay attention to less and then also can reason sort of less effectively."
Needle in Haystack is misleading: Lab benchmarks don't reflect real-world usage
"There was this bit of, like, this sort of implication where, like, oh, look, our model is perfect on this task, needle in a haystack. Therefore, the context window you can use for whatever you want. There was an implication there. And, well, I hope that that is true someday. That is not the case."
Claude Sonnet 4.5 performs best: Based on area under curve for context utilization
"I don't have much commentary. That is what we found for this particular task... I think it shows here if this is true, that's a big explanation for why" developers love Claude
Multiple signals for initial culling: Dense vectors, lexical search, metadata filtering
"One pattern is to use what a lot of people call first stage retrieval to do a big cull down... using signals like vector search, like full text search, like metadata filtering, metadata search, and others to go from, let's say 10,000 down to 300."
LLMs can handle more than 10 results: Unlike traditional search for humans
"You don't have to give an LLM 10 blue links. You can brute force a lot more."
LLM re-ranking is cost-effective and emerging: From 300 candidates down to 30
"Using an LLM as a re-ranker and brute forcing from 300 down to 30, I've seen now emerging a lot, like a lot of people are doing this and it actually is like way more cost effective than I think a lot of people realize I've heard of people that are running models themselves that are getting like a penny per million input tokens"
Purpose-built re-rankers will decline: Like specialized hardware, only needed at extreme scale
"I actually think that like probably purpose built re-rankers will go away. And the same way that like purpose built... if you're at extreme scale, extreme cost, yes, you'll care to optimize that... the same way that if you're running with hardware... you're just going to use a CPU or GPU. Unless you absolutely have to."
Structured ingestion matters: Extract metadata and signals at write time
"As much structured information as you can put into your write or your ingestion pipeline, you should. So all of the metadata you can extract, do it at ingestion. All of the chunk rewriting you can do, do it at ingestion."
Chunk rewriting for code: Generate natural language descriptions
"Instead of just embedding the code, you first have an LLM generate like a natural language description of like what this code is doing. And either you embed like just the natural language description or you embed that and the code"
Regex remains dominant: 85-90% of queries satisfied, but embeddings add value
"My guess is that like for code today, it's something like 90% of queries or 85% of queries can be satisfactorily run with Regex... But you maybe can get like 15% or 10% or 5% improvement by also using embeddings."
Chroma supports native regex search: With indexing for scale
"We've actually worked on now inside of Chroma, both single load and distributed, we support regex search natively. So you can do regex search inside of Chroma because we've seen that as like a very powerful tool for code search."
Fork-based indexing for versioning: Fast branch/commit-specific indexes
"Another feature we added to Chroma is the ability to do forking. So you can take an existing index and you can create a copy of that index in under a hundred milliseconds for pennies... you now can like have an index for like different each commit."
Small golden datasets are highly valuable: Few hundred examples sufficient
"The returns to a very high-quality small label data set are so high. Everybody thinks you have to have, like, a million examples or whatever. No. Actually, just, like, a couple hundred even, like, high-quality examples is extremely beneficial."
Generate synthetic QA pairs: When you have chunks but need queries
"We did a whole technical report around how do you teach an LLM to write good queries from chunks? Because, again, you want, like, chunk query pairs. And so if you have the chunks, you need the queries."
Data labeling parties work: Simple, practical approach
"Thursday night, we're all going to be in the conference room. We're ordering pizza. And we're just going to have a data labeling party for a few hours. That's all it takes to bootstrap this."
Memory is context engineering's benefit: Same problem, different framing
"Memory again is like the memory is the term that like everybody can understand... but what is memory under the hood? It's still just context engineering... the domain of how do you put the right information into the context window?"
Compaction enables offline improvement: Re-indexing and refinement
"Offline processing is helpful, and I think that is also helpful in this case... You're taking data. You're like, oh, maybe those two data points should be merged. Maybe they should be split. Maybe they should be, like, rewritten."
Stay in latent space: Avoid natural language round-trip
"Why are we going back to natural language? Why aren't we just like passing the embeddings like directly to the models who are just going to functionally like re put it into latent space."
Continuous retrieval during generation: Not just one-shot before generation
"For the longest time we've done one retrieval per generation... why are we not continually retrieving as we need to"
Current approaches are crude: Will seem primitive in 5-10 years
"I think when we look back in things, this was like, like hilariously crude, the way we do things today."
Developer experience is paramount: Zero-config, serverless approach
"In the same way that you could run pip install ChromaDB and be up and running in five seconds... That same story had to be true for the cloud... It needed to be like zero config, zero knobs to tune. It should just be always fast, always very cost-effective and always fresh without you having to do or think about anything."
Usage-based billing: True serverless pricing
"We only charge you for the minimal slice of compute that you use and like nothing more, which not all serverless databases can claim"
Slow, intentional hiring: Culture and craft over speed
"The slope of our future growth is entirely dependent on the people that are here in this office... we've just really decided to hire very slowly and be really picky."
Reviewer #1 (Public review):
Kong et al.'s work describes a new approach that does exactly what the title states: "Correction of local beam-induced sample motion in cryo-EM images using a 3D spline model." I find the method appropriate, logical, and well-explained. Additionally, the work suggests using 2DTM-related measurements to quantify the improvement of the new method compared to the old one in cisTEM, Unblur. I find this part engaging; it is straightforward, accurate, and, of course, the group has a strong command of 2DTM, presenting a thorough study.
However, everything in the paper (except some correct general references) refers to comparisons with the full-frame approach, Unblur. Still, we have known for more than a decade that local correction approaches perform better than global ones, so I do not find anything truly novel in their proposal of using local methods (the method itself- Unbend- is new, but many others have been described previously). In fact, the use of 2DTM is perhaps a more interesting novelty of the work, and here, a more systematic study comparing different methods with these proposed well-defined metrics would be very valuable. As currently presented, there is no doubt that it is better than an older, well-established approach, and the way to measure "better" is very interesting, but there is no indication of how the situation stands regarding newer methods.
Regarding practical aspects, it seems that the current implementation of the method is significantly slower than other patch-based approaches. If its results are shown to exceed those of existing local methods, then exploring the use of Unbend, possibly optimizing its code first, could be a valuable task. However, without more recent comparisons, the impact of Unbend remains unclear.
Reviewer #3 (Public review):
Summary
Kong and coauthors describe and implement a method to correct local deformations due to beam-induced motion in cryo-EM movie frames. This is done by fitting a 3D spline model to a stack of micrograph frames using cross-correlation-based local patch alignment to describe the deformations across the micrograph in each frame, and then computing the value of the deformed micrograph at each pixel by interpolating the undeformed micrograph at the displacement positions given by the spline model. A graphical interface in cisTEM allows the user to visualise the deformations in the sample, and the method has been proven to be successful by showing improvements in 2D template matching (2DTM) results on the corrected micrographs using five in situ samples.
Impact
This method has great potential to further streamline the cryo-EM single particle analysis pipeline by shortening the required processing time as a result of obtaining higher quality particles early in the pipeline, and is applicable to both old and new datasets, therefore being relevant to all cryo-EM users.
Strengths
(1) One key idea of the paper is that local beam induced motion affects frames continuously in space (in the image plane) as well as in time (along the frame stack), so one can obtain improvements in the image quality by correcting such deformations in a continuous way (deformations vary continuously from pixel to pixel and from frame to frame) rather than based on local discrete patches only. 3D splines are used to model the deformations: they are initialised using local patch alignments and further refined using cross-correlation between individual patch frames and the average of the other frames in the same patch stack.
(2) Another strength of the paper is using 2DTM to show that correcting such deformations continuously using the proposed method does indeed lead to improvements. This is shown using five in situ datasets, where local motion is quantified using statistics based on the estimated motions of ribosomes.
Weaknesses
(1) While very interesting, it is not clear how the proposed method using 3D splines for estimating local deformations compares with other existing methods that also aim to correct local beam-induced motion by approximating the deformations throughout the frames using other types of approximation, such as polynomials, as done, for example MotionCor2.
(2) The use of 2DTM is appropriate, and the results of the analysis are enlightening, but one shortcoming is that some relevant technical details are missing. For example, the 2DTM SNR is not defined in the article, and it is not clear how the authors ensured that no false positives were included in the particles counted before and after deformation correction. The Jupyter notebooks where this analysis was performed have not been made publicly available.
(3) It is also not clear how the proposed deformation correction method is affected by CTF defocus in the different samples (are the defocus values used in the different datasets similar or significantly different?) or if there is any effect at all.
Author response:
The following is the authors’ response to the original reviews.
Reviewer #1 (Public review):
Summary:
In this manuscript, the authors analyze electrophysiological data recorded bilaterally from the rat hippocampus to investigate the coupling of ripple oscillations across the hemispheres. Commensurate with the majority of previous research, the authors report that ripples tend to co-occur across both hemispheres. Specifically, the amplitude of ripples across hemispheres is correlated but their phase is not. These data corroborate existing models of ripple generation suggesting that CA3 inputs (coordinated across hemispheres via the commisural fibers) drive the sharp-wave component while the individual ripple waves are the result of local interactions between pyramidal cells and interneurons in CA1.
Strengths:
The manuscript is well-written, the analyses well-executed and the claims are supported by the data.
Weaknesses:
One question left unanswered by this study is whether information encoded by the right and left hippocampi is correlated.
Thank you for raising this important point. While our study demonstrates ripple co-occurrence across hemispheres, we did not directly assess whether the information encoded in each hippocampus is correlated. Addressing this question would require analyses of coordinated activity patterns, such as neuronal assemblies formed during novelty exposure, which falls beyond the scope of the present study. However, we agree this is an important avenue for future work, and we now acknowledge this limitation and outlined it as a future direction in the Conclusion section (lines 796–802).
Reviewer #2 (Public review):
Summary:
The authors completed a statistically rigorous analysis of the synchronization of sharp-wave ripples in the hippocampal CA1 across and within hemispheres. They used a publicly available dataset (collected in the Buzsaki lab) from 4 rats (8 sessions) recorded with silicon probes in both hemispheres. Each session contained approximately 8 hours of activity recorded during rest. The authors found that the characteristics of ripples did not differ between hemispheres, and that most ripples occurred almost simultaneously on all probe shanks within a hemisphere as well as across hemispheres. The differences in amplitude and exact timing of ripples between recording sites increased slightly with the distance between recording sites. However, the phase coupling of ripples (in the 100-250 Hz range), changed dramatically with the distance between recording sites. Ripples in opposite hemispheres were about 90% less coupled than ripples on nearby tetrodes in the same hemisphere. Phase coupling also decreased with distance within the hemisphere. Finally, pyramidal cell and interneuron spikes were coupled to the local ripple phase and less so to ripples at distant sites or the opposite hemisphere.
Strengths:
The analysis was well-designed and rigorous. The authors used statistical tests well suited to the hypotheses being tested, and clearly explained these tests. The paper is very clearly written, making it easy to understand and reproduce the analysis. The authors included an excellent review of the literature to explain the motivation for their study.
Weaknesses:
The authors state that their findings (highly coincident ripples between hemispheres), contradict other findings in the literature (in particular the study by Villalobos, Maldonado, and Valdes, 2017), but fail to explain why this large difference exists. They seem to imply that the previous study was flawed, without examining the differences between the studies.
The paper fails to mention the context in which the data was collected (the behavior the animals performed before and after the analyzed data), which may in fact have a large impact on the results and explain the differences between the current study and that by Villalobos et al. The Buzsaki lab data includes mice running laps in a novel environment in the middle of two rest sessions. Given that ripple occurrence is influenced by behavior, and that the neurons spiking during ripples are highly related to the prior behavioral task, it is likely that exposure to novelty changed the statistics of ripples. Thus, the authors should analyze the pre-behavior rest and post-behavior rest sessions separately. The Villalobos et al. data, in contrast, was collected without any intervening behavioral task or novelty (to my knowledge). Therefore, I predict that the opposing results are a result of the difference in recent experiences of the studied rats, and can actually give us insight into the memory function of ripples.
We appreciate this thoughtful hypothesis and have now addressed it explicitly. Our main analysis was conducted on 1-hour concatenated SWS epochs recorded before any novel environment exposure (baseline sleep). This was not clearly stated in the original manuscript, so we have now added a clarifying paragraph (lines 131–143). The main findings therefore remain unchanged.
To directly test the reviewer’s hypothesis, we performed the suggested comparison between pre- and post-maze rest sessions, including maze-type as a factor. These new analyses are now presented in a dedicated Results subsection (lines 475 - 493) and in Supplementary Figure 5.1. While we observed a modest increase in ripple abundance after the maze sessions — consistent with known experienced-dependent changes in ripple occurrence — the key findings of interhemispheric synchrony remained unchanged. Both pre- and post-maze sleep sessions showed robust bilateral time-locking of ripple events and similar dissociations between phase and amplitude coupling across hemispheres.
In one figure (5), the authors show data separated by session, rather than pooled. They should do this for other figures as well. There is a wide spread between sessions, which further suggests that the results are not as widely applicable as the authors seem to think. Do the sessions with small differences between phase coupling and amplitude coupling have low inter-hemispheric amplitude coupling, or high phase coupling? What is the difference between the sessions with low and high differences in phase vs. amplitude coupling? I noticed that the Buzsaki dataset contains data from rats running either on linear tracks (back and forth), or on circular tracks (unidirectionally). This could create a difference in inter-hemisphere coupling, because rats running on linear tracks would have the same sensory inputs to both hemispheres (when running in opposite directions), while rats running on a circular track would have different sensory inputs coming from the right and left (one side would include stimuli in the middle of the track, and the other would include closer views of the walls of the room). The synchronization between hemispheres might be impacted by how much overlap there was in sensory stimuli processed during the behavior epoch.
Thank you for this insightful suggestion. In our new analyses comparing pre- and post-maze sessions, we have also addressed this question. Supplementary Figures 4.1 and 5.1 (E-F) present coupling metrics averaged per session and include coding for maze type. Additionally, we have incorporated the reviewer’s hypothesis regarding sensory input differences and their potential impact on inter-hemispheric synchronization into a new Results subsection (lines 475–493).
The paper would be a lot stronger if the authors analyzed some of the differences between datasets, sessions, and epochs based on the task design, and wrote more about these issues. There may be more publicly available bi-hemispheric datasets to validate their results.
To further validate our findings, we have analyzed another publicly available dataset that includes bilateral CA1 recordings (https://crcns.org/data-sets/hc/hc-18). We have added a description of this dataset and our analysis approach in the Methods section (lines 119–125 and 144-145), and present the corresponding results in a new Supplementary Figure (Supplementary Figure 4.2). These new analyses replicated our main findings, confirming robust interhemispheric time-locking of ripple events and a greater dissociation between phase and amplitude coupling in ipsilateral versus contralateral recordings.
Reviewer #1 (Recommendations for the authors):
My only suggestion is that the introduction can be shortened. The authors discuss in great length literature linking ripples and memory, although the findings in the paper are not linked to memory. In addition, ripples have been implicated in non-mnemonic functions such as sleep and metabolic homeostasis.
The reviewer`s suggestion is valid and aligns with the main message of our paper. However, we believe that the relationship between ripples and memory has been extensively discussed in the literature, sometimes overshadowing other important functional roles (based on the reviewer’s comment, we now also refer to non-mnemonic functions of ripples in the revised introduction [lines 87–89]). Thus, we find it important to retain this context because highlighting the publication bias towards mnemonic interpretations helps frame the need for studies like ours that revisit still incompletely understood basic ripple mechanisms.
We also note that, based on a suggestion from reviewer 2, we have supplemented our manuscript with a new figure demonstrating ripple abundance increases during SWS following novel environment exposure (Supplementary Figure 5.1), linking it to memory and replicating the findings of Eschenko et al. (2008), though we present this result as a covariate, aimed at controlling for potential sources of variation in ripple synchronization.
Reviewer #2 (Recommendations for the authors):
It would be useful to include more information about the analyzed dataset in the methods section, e.g. how long were the recordings, how many datasets per rat, did the authors analyze the entire recording epoch or sub-divide it in any way, how many ripples were detected per recording (approximately).
We have now included more detailed information in the Methods section (lines 104 - 145).
A few of the references to sub-figures are mislabeled (e.g. lines 327-328).
Thank you for noticing these inconsistencies. We have carefully reviewed and corrected all figure sub-panel labels and references throughout the manuscript.
In Figure 7 C&D, are the neurons on the left sorted by contralateral ripple phase? It doesn't look like it. It would be easier to compare to ipsilateral if they were.
In Figures 7C and 7D, neurons are sorted by their ipsilateral peak ripple phase, with the contralateral data plotted using the same ordering to facilitate comparison. To avoid confusion, we have clarified this explicitly in the figure legend and corresponding main text (lines 544–550).
In Figure 6, using both bin sizes 50 and 100 doesn't contribute much.
We used both 50 ms and 100 ms bin sizes to directly compare with previous studies (Villalobos et al. 2017 used 5 ms and 100 ms; Csicsvari et al. 2000 used 5–50 ms). Because the proportion of coincident ripples is a non-decreasing function of the window size, larger bins can inflate coincidence measures. Including a mid-range bin of 50 ms allowed us to show that high coincidence levels are reached well before the 100 ms upper bound, supporting that the 100 ms window is not an overshoot. We have added clarification on this point in the Methods section on ripple coincidence (lines 204–212).
Reviewer #1 (Public review):
Lu & Golomb combined EEG, artificial neural networks, and multivariate pattern analyses to examine how different visual variables are processed in the brain. The conclusions of the paper are mostly well supported.
The authors find that not only real-world size is represented in the brain (which was known), but both retinal size and real-world depth is represented, at different time points or latencies, which may reflect different stages of processing. Prior work has not been able to answer the question of real-world depth due to stimuli used. The authors made this possible by assess real-world depth and testing it with appropriate methodology, accounting for retinal and real-world size. The methodological approach combining behavior, RSA, and ANNs is creative and well thought out to appropriately assess the research questions, and the findings may be very compelling if backed up with some clarifications and further analyses.
The work will be of interest to experimental and computational vision scientists, as well as the broader computational cognitive neuroscience community as the methodology is of interest and the code is or will be made available. The work is important as it is currently not clear what the correspondence between many deep neural network models are and the brain are, and this work pushes our knowledge forward on this front. Furthermore, the availability of methods and data will be useful for the scientific community.
Author response:
The following is the authors’ response to the original reviews.
Reviewer #1 (Public Review):
Lu & Golomb combined EEG, artificial neural networks, and multivariate pattern analyses to examine how different visual variables are processed in the brain. The conclusions of the paper are mostly well supported, but some aspects of methods and data analysis would benefit from clarification and potential extensions.
The authors find that not only real-world size is represented in the brain (which was known), but both retinal size and real-world depth are represented, at different time points or latencies, which may reflect different stages of processing. Prior work has not been able to answer the question of real-world depth due to the stimuli used. The authors made this possible by assessing real-world depth and testing it with appropriate methodology, accounting for retinal and real-world size. The methodological approach combining behavior, RSA, and ANNs is creative and well thought out to appropriately assess the research questions, and the findings may be very compelling if backed up with some clarifications and further analyses.
The work will be of interest to experimental and computational vision scientists, as well as the broader computational cognitive neuroscience community as the methodology is of interest and the code is or will be made available. The work is important as it is currently not clear what the correspondence between many deep neural network models and the brain is, and this work pushes our knowledge forward on this front. Furthermore, the availability of methods and data will be useful for the scientific community.
Reviewer #2 (Public Review):
Summary:
This paper aims to test if neural representations of images of objects in the human brain contain a 'pure' dimension of real-world size that is independent of retinal size or perceived depth. To this end, they apply representational similarity analysis on EEG responses in 10 human subjects to a set of 200 images from a publicly available database (THINGS-EEG2), correlating pairwise distinctions in evoked activity between images with pairwise differences in human ratings of real-world size (from THINGS+). By partialling out correlations with metrics of retinal size and perceived depth from the resulting EEG correlation time courses, the paper claims to identify an independent representation of real-world size starting at 170 ms in the EEG signal. Further comparisons with artificial neural networks and language embeddings lead the authors to claim this correlation reflects a relatively 'high-level' and 'stable' neural representation.
Strengths:
The paper features insightful figures/illustrations and clear figures.
The limitations of prior work motivating the current study are clearly explained and seem reasonable (although the rationale for why using 'ecological' stimuli with backgrounds matters when studying real-world size could be made clearer; one could also argue the opposite, that to get a 'pure' representation of the real-world size of an 'object concept', one should actually show objects in isolation).
The partial correlation analysis convincingly demonstrates how correlations between feature spaces can affect their correlations with EEG responses (and how taking into account these correlations can disentangle them better).
The RSA analysis and associated statistical methods appear solid.
Weaknesses:
The claim of methodological novelty is overblown. Comparing image metrics, behavioral measurements, and ANN activations against EEG using RSA is a commonly used approach to study neural object representations. The dataset size (200 test images from THINGS) is not particularly large, and neither is comparing pre-trained DNNs and language models, or using partial correlations.
Thanks for your feedback. We agree that the methods used in our study – such as RSA, partial correlations, and the use of pretrained ANN and language models – are indeed well-established in the literature. We therefore revised the manuscript to more carefully frame our contribution: rather than emphasizing methodological novelty in isolation, we now highlight the combination of techniques, the application to human EEG data with naturalistic images, and the explicit dissociation of real-world size, retinal size, and depth representations as the primary strengths of our approach. Corresponding language in the Abstract, Introduction, and Discussion has been adjusted to reflect this more precise positioning:
(Abstract, line 34 to 37) “our study combines human EEG and representational similarity analysis to disentangle neural representations of object real-world size from retinal size and perceived depth, leveraging recent datasets and modeling approaches to address challenges not fully resolved in previous work.”
(Introduction, line 104 to 106) “we overcome these challenges by combining human EEG recordings, naturalistic stimulus images, artificial neural networks, and computational modeling approaches including representational similarity analysis (RSA) and partial correlation analysis …”
(Introduction, line 108) “We applied our integrated computational approach to an open EEG dataset…”
(Introduction, line 142 to 143) “The integrated computational approach by cross-modal representational comparisons we take with the current study…”
(Discussion, line 550 to 552) “our study goes beyond the contributions of prior studies in several key ways, offering both theoretical and methodological advances: …”
The claims also seem too broad given the fairly small set of RDMs that are used here (3 size metrics, 4 ANN layers, 1 Word2Vec RDM): there are many aspects of object processing not studied here, so it's not correct to say this study provides a 'detailed and clear characterization of the object processing process'.
Thanks for pointing this out. We softened language in our manuscript to reflect that our findings provide a temporally resolved characterization of selected object features, rather than a comprehensive account of object processing:
(line 34 to 37) “our study combines human EEG and representational similarity analysis to disentangle neural representations of object real-world size from retinal size and perceived depth, leveraging recent datasets and modeling approaches to address challenges not fully resolved in previous work.”
(line 46 to 48) “Our research provides a temporally resolved characterization of how certain key object properties – such as object real-world size, depth, and retinal size – are represented in the brain, …”
The paper lacks an analysis demonstrating the validity of the real-world depth measure, which is here computed from the other two metrics by simply dividing them. The rationale and logic of this metric is not clearly explained. Is it intended to reflect the hypothesized egocentric distance to the object in the image if the person had in fact been 'inside' the image? How do we know this is valid? It would be helpful if the authors provided a validation of this metric.
We appreciate the comment regarding the real-world depth metric. Specifically, this metric was computed as the ratio of real-world size (obtained via behavioral ratings) to measured retinal size. The rationale behind this computation is grounded in the basic principles of perspective projection: for two objects subtending the same retinal size, the physically larger object is presumed to be farther away. This ratio thus serves as a proxy for perceived egocentric depth under the simplifying assumption of consistent viewing geometry across images.
We acknowledge that this is a derived estimate and not a direct measurement of perceived depth. While it provides a useful approximation that allows us to analytically dissociate the contributions of real-world size and depth in our RSA framework, we agree that future work would benefit from independent perceptual depth ratings to validate or refine this metric. We added more discussions about this to our revised manuscript:
(line 652 to 657) “Additionally, we acknowledge that our metric for real-world depth was derived indirectly as the ratio of perceived real-world size to retinal size. While this formulation is grounded in geometric principles of perspective projection and served the purpose of analytically dissociating depth from size in our RSA framework, it remains a proxy rather than a direct measure of perceived egocentric distance. Future work incorporating behavioral or psychophysical depth ratings would be valuable for validating and refining this metric.”
Given that there is only 1 image/concept here, the factor of real-world size may be confounded with other things, such as semantic category (e.g. buildings vs. tools). While the comparison of the real-world size metric appears to be effectively disentangled from retinal size and (the author's metric of) depth here, there are still many other object properties that are likely correlated with real-world size and therefore will confound identifying a 'pure' representation of real-world size in EEG. This could be addressed by adding more hypothesis RDMs reflecting different aspects of the images that may correlate with real-world size.
We thank the reviewer for this thoughtful and important point. We agree that semantic category and real-world size may be correlated, and that semantic structure is one of the plausible sources of variance contributing to real-world size representations. However, we would like to clarify that our original goal was to isolate real-world size from two key physical image features — retinal size and inferred real-world depth — which have been major confounds in prior work on this topic. We acknowledge that although our analysis disentangled real-world size from depth and retinal size, this does not imply a fully “pure” representation; therefore, we now refer to the real-world size representations as “partially disentangled” throughout the manuscript to reflect this nuance.
Interestingly, after controlling for these physical features, we still found a robust and statistically isolated representation of real-world size in the EEG signal. This motivated the idea that realworld size may be more than a purely perceptual or image-based property — it may be at least partially semantic. Supporting this interpretation, both the late layers of ANN models and the non-visual semantic model (Word2Vec) also captured real-world size structure. Rather than treating semantic information as an unwanted confound, we propose that semantic structure may be an inherent component of how the brain encodes real-world size.
To directly address the your concern, we conducted an additional variance partitioning analysis, in which we decomposed the variance in EEG RDMs explained by four RDMs: real-world depth, retinal size, real-world size, and semantic information (from Word2Vec). Specifically, for each EEG timepoint, we quantified (1) the unique variance of real-world size, after controlling for semantic similarity, depth, and retinal size; (2) the unique variance of semantic information, after controlling for real-world size, depth, and retinal size; (3) the shared variance jointly explained by real-world size and semantic similarity, controlling for depth and retinal size. This analysis revealed that real-world size explained unique variance in EEG even after accounting for semantic similarity. And there was also a substantial shared variance, indicating partial overlap between semantic structure and size. Semantic information also contributed unique explanatory power, as expected. These results suggest that real-world size is indeed partially semantic in nature, but also has independent neural representation not fully explained by general semantic similarity. This strengthens our conclusion that real-world size functions as a meaningful, higher-level dimension in object representation space.
We now include this new analysis and a corresponding figure (Figure S8) in the revised manuscript:
(line 532 to 539) “Second, we conducted a variance partitioning analysis, in which we decomposed the variance in EEG RDMs explained by three hypothesis-based RDMs and the semantic RDM (Word2Vec RDM), and we still found that real-world size explained unique variance in EEG even after accounting for semantic similarity (Figure S9). And we also observed a substantial shared variance jointly explained by real-world size and semantic similarity and a unique variance of semantic information. These results suggest that real-world size is indeed partially semantic in nature, but also has independent neural representation not fully explained by general semantic similarity.”
The choice of ANNs lacks a clear motivation. Why these two particular networks? Why pick only 2 somewhat arbitrary layers? If the goal is to identify more semantic representations using CLIP, the comparison between CLIP and vision-only ResNet should be done with models trained on the same training datasets (to exclude the effect of training dataset size & quality; cf Wang et al., 2023). This is necessary to substantiate the claims on page 19 which attributed the differences between models in terms of their EEG correlations to one of them being a 'visual model' vs. 'visual-semantic model'.
We argee that the choice and comparison of models should be better contextualized.
First, our motivation for selecting ResNet-50 and CLIP ResNet-50 was not to make a definitive comparison between model classes, but rather to include two widely used representatives of their respective categories—one trained purely on visual information (ResNet-50 on ImageNet) and one trained with joint visual and linguistic supervision (CLIP ResNet-50 on image–text pairs). These models are both highly influential and commonly used in computational and cognitive neuroscience, allowing for relevant comparisons with existing work (line 181-187).
Second, we recognize that limiting the EEG × ANN correlation analyses to only early and late layers may be viewed as insufficiently comprehensive. To address this point, we have computed the EEG correlations with multiple layers in both ResNet and CLIP models (ResNet: ResNet.maxpool, ResNet.layer1, ResNet.layer2, ResNet.layer3, ResNet.layer4, ResNet.avgpool; CLIP: CLIP.visual.avgpool, CLIP.visual.layer1, CLIP.visual.layer2, CLIP.visual.layer3, CLIP.visual.layer4, CLIP.visual.attnpool). The results, now included in Figure S4, show a consistent trend: early layers exhibit higher similarity to early EEG time points, and deeper layers show increased similarity to later EEG stages. We chose to highlight early and late layers in the main text to simplify interpretation.
Third, we appreciate the reviewer’s point that differences in training datasets (ImageNet vs. CLIP's dataset) may confound any attribution of differences in brain alignment to the models' architectural or learning differences. We agree that the comparisons between models trained on matched datasets (e.g., vision-only vs. multimodal models trained on the same image–text corpus) would allow for more rigorous conclusions. Thus, we explicitly acknowledged this limitation in the text:
(line 443 to 445) “However, it is also possible that these differences between ResNet and CLIP reflect differences in training data scale and domain.”
The first part of the claim on page 22 based on Figure 4 'The above results reveal that realworld size emerges with later peak neural latencies and in the later layers of ANNs, regardless of image background information' is not valid since no EEG results for images without backgrounds are shown (only ANNs).
We revised the sentence to clarify that this is a hypothesis based on the ANN results, not an empirical EEG finding:
(line 491 to 495) “These results show that real-world size emerges in the later layers of ANNs regardless of image background information, and – based on our prior EEG results – although we could not test object-only images in the EEG data, we hypothesize that a similar temporal profile would be observed in the brain, even for object-only images.”
While we only had the EEG data of human subjects viewing naturalistic images, the ANN results suggest that real-world size representations may still emerge at later processing stages even in the absence of background, consistent with what we observed in EEG under with-background conditions.
The paper is likely to impact the field by showcasing how using partial correlations in RSA is useful, rather than providing conclusive evidence regarding neural representations of objects and their sizes.
Additional context important to consider when interpreting this work:
Page 20, the authors point out similarities of peak correlations between models ('Interestingly, the peaks of significant time windows for the EEG × HYP RSA also correspond with the peaks of the EEG × ANN RSA timecourse (Figure 3D,F)'. Although not explicitly stated, this seems to imply that they infer from this that the ANN-EEG correlation might be driven by their representation of the hypothesized feature spaces. However this does not follow: in EEG-image metric model comparisons it is very typical to see multiple peaks, for any type of model, this simply reflects specific time points in EEG at which visual inputs (images) yield distinctive EEG amplitudes (perhaps due to stereotypical waves of neural processing?), but one cannot infer the information being processed is the same. To investigate this, one could for example conduct variance partitioning or commonality analysis to see if there is variance at these specific timepoints that is shared by a specific combination of the hypothesis and ANN feature spaces.
Thanks for your thoughtful observation! Upon reflection, we agree that the sentence – "Interestingly, the peaks of significant time windows for the EEG × HYP RSA also correspond with the peaks of the EEG × ANN RSA timecourse" – was speculative and risked implying a causal link that our data do not warrant. As you rightly points out, observing coincident peak latencies across different models does not necessarily imply shared representational content, given the stereotypical dynamics of evoked EEG responses. And we think even variance partitioning analysis would still not suffice to infer that ANN-EEG correlations are driven specifically by hypothesized feature spaces. Accordingly, we have removed this sentence from the manuscript to avoid overinterpretation.
Page 22 mentions 'The significant time-window (90-300ms) of similarity between Word2Vec RDM and EEG RDMs (Figure 5B) contained the significant time-window of EEG x real-world size representational similarity (Figure 3B)'. This is not particularly meaningful given that the Word2Vec correlation is significant for the entire EEG epoch (from the time-point of the signal 'arriving' in visual cortex around ~90 ms) and is thus much less temporally specific than the realworld size EEG correlation. Again a stronger test of whether Word2Vec indeed captures neural representations of real-world size could be to identify EEG time-points at which there are unique Word2Vec correlations that are not explained by either ResNet or CLIP, and see if those timepoints share variance with the real-world size hypothesized RDM.
We appreciate your insightful comment. Upon reflection, we agree that the sentence – "'The significant time-window (90-300ms) of similarity between Word2Vec RDM and EEG RDMs (Figure 5B) contained the significant time-window of EEG x real-world size representational similarity (Figure 3B)" – was speculative. And we have removed this sentence from the manuscript to avoid overinterpretation.
Additionally, we conducted two analyses as you suggested in the supplement. First, we calculated the partial correlation between EEG RDMs and the Word2Vec RDM while controlling for four ANN RDMs (ResNet early/late and CLIP early/late) (Figure S8). Even after regressing out these ANN-derived features, we observed significant correlations between Word2Vec and EEG RDMs in the 100–190 ms and 250–300 ms time windows. This result suggests that
Word2Vec captures semantic structure in the neural signal that is not accounted for by ResNet or CLIP. Second, we conducted an additional variance partitioning analysis, in which we decomposed the variance in EEG RDMs explained by four RDMs: real-world depth, retinal size, real-world size, and semantic information (from Word2Vec) (Figure S9). And we found significant shared variance between Word2Vec and real-world size at 130–150 ms and 180–250 ms. These results indicate a partially overlapping representational structure between semantic content and real-world size in the brain.
We also added these in our revised manuscript:
(line 525 to 539) “To further probe the relationship between real-world size and semantic information, and to examine whether Word2Vec captures variances in EEG signals beyond that explained by visual models, we conducted two additional analyses. First, we performed a partial correlation between EEG RDMs and the Word2Vec RDM, while regressing out four ANN RDMs (early and late layers of both ResNet and CLIP) (Figure S8). We found that semantic similarity remained significantly correlated with EEG signals across sustained time windows (100-190ms and 250-300ms), indicating that Word2Vec captures neural variance not fully explained by visual or visual-language models. Second, we conducted a variance partitioning analysis, in which we decomposed the variance in EEG RDMs explained by three hypothesis-based RDMs and the semantic RDM (Word2Vec RDM), and we still found that real-world size explained unique variance in EEG even after accounting for semantic similarity (Figure S9). And we also observed a substantial shared variance jointly explained by realworld size and semantic similarity and a unique variance of semantic information. These results suggest that real-world size is indeed partially semantic in nature, but also has independent neural representation not fully explained by general semantic similarity.”
Reviewer #3 (Public Review):
The authors used an open EEG dataset of observers viewing real-world objects. Each object had a real-world size value (from human rankings), a retinal size value (measured from each image), and a scene depth value (inferred from the above). The authors combined the EEG and object measurements with extant, pre-trained models (a deep convolutional neural network, a multimodal ANN, and Word2vec) to assess the time course of processing object size (retinal and real-world) and depth. They found that depth was processed first, followed by retinal size, and then real-world size. The depth time course roughly corresponded to the visual ANNs, while the real-world size time course roughly corresponded to the more semantic models.
The time course result for the three object attributes is very clear and a novel contribution to the literature. However, the motivations for the ANNs could be better developed, the manuscript could better link to existing theories and literature, and the ANN analysis could be modernized. I have some suggestions for improving specific methods.
(1) Manuscript motivations
The authors motivate the paper in several places by asking " whether biological and artificial systems represent object real-world size". This seems odd for a couple of reasons. Firstly, the brain must represent real-world size somehow, given that we can reason about this question. Second, given the large behavioral and fMRI literature on the topic, combined with the growing ANN literature, this seems like a foregone conclusion and undermines the novelty of this contribution.
Thanks for your helpful comment. We agree that asking whether the brain represents real-world size is not a novel question, given the existing behavioral and neuroimaging evidence supporting this. Our intended focus was not on the existence of real-world size representations per se, but the nature of these representations, particularly the relationship between the temporal dynamics and potential mechanisms of representations of real-world size versus other related perceptual properties (e.g., retinal size and real-world depth). We revised the relevant sentence to better reflect our focue, shifting from a binary framing (“whether or not size is represented”) to a more mechanistic and time-resolved inquiry (“how and when such representations emerge”):
(line 144 to 149) “Unraveling the internal representations of object size and depth features in both human brains and ANNs enables us to investigate how distinct spatial properties—retinal size, realworld depth, and real-world size—are encoded across systems, and to uncover the representational mechanisms and temporal dynamics through which real-world size emerges as a potentially higherlevel, semantically grounded feature.”
While the introduction further promises to "also investigate possible mechanisms of object realworld size representations.", I was left wishing for more in this department. The authors report correlations between neural activity and object attributes, as well as between neural activity and ANNs. It would be nice to link the results to theories of object processing (e.g., a feedforward sweep, such as DiCarlo and colleagues have suggested, versus a reverse hierarchy, such as suggested by Hochstein, among others). What is semantic about real-world size, and where might this information come from? (Although you may have to expand beyond the posterior electrodes to do this analysis).
We thank the reviewer for this insightful comment. We agree that understanding the mechanisms underlying real-world size representations is a critical question. While our current study does not directly test specific theoretical frameworks such as the feedforward sweep model or the reverse hierarchy theory, our results do offer several relevant insights: The temporal dynamics revealed by EEG—where real-world size emerges later than retinal size and depth—suggest that such representations likely arise beyond early visual feedforward stages, potentially involving higherlevel semantic processing. This interpretation is further supported by the fact that real-world size is strongly captured by late layers of ANNs and by a purely semantic model (Word2Vec), suggesting its dependence on learned conceptual knowledge.
While we acknowledge that our analyses were limited to posterior electrodes and thus cannot directly localize the cortical sources of these effects, we view this work as a first step toward bridging low-level perceptual features and higher-level semantic representations. We hope future work combining broader spatial sampling (e.g., anterior EEG sensors or source localization) and multimodal recordings (e.g., MEG, fMRI) can build on these findings to directly test competing models of object processing and representation hierarchy.
We also added these to the Discussion section:
(line 619 to 638) “Although our study does not directly test specific models of visual object processing, the observed temporal dynamics provide important constraints for theoretical interpretations. In particular, we find that real-world size representations emerge significantly later than low-level visual features such as retinal size and depth. This temporal profile is difficult to reconcile with a purely feedforward account of visual processing (e.g., DiCarlo et al., 2012), which posits that object properties are rapidly computed in a sequential hierarchy of increasingly complex visual features. Instead, our results are more consistent with frameworks that emphasize recurrent or top-down processing, such as the reverse hierarchy theory (Hochstein & Ahissar, 2002), which suggests that high-level conceptual information may emerge later and involve feedback to earlier visual areas. This interpretation is further supported by representational similarities with late-stage artificial neural network layers and with a semantic word embedding model (Word2Vec), both of which reflect learned, abstract knowledge rather than low-level visual features. Taken together, these findings suggest that real-world size is not merely a perceptual attribute, but one that draws on conceptual or semantic-level representations acquired through experience. While our EEG analyses focused on posterior electrodes and thus cannot definitively localize cortical sources, we see this study as a step toward linking low-level visual input with higher-level semantic knowledge. Future work incorporating broader spatial coverage (e.g., anterior sensors), source localization, or complementary modalities such as MEG and fMRI will be critical to adjudicate between alternative models of object representation and to more precisely trace the origin and flow of real-world size information in the brain.”
Finally, several places in the manuscript tout the "novel computational approach". This seems odd because the computational framework and pipeline have been the most common approach in cognitive computational neuroscience in the past 5-10 years.
We have revised relevant statements throughout the manuscript to avoid overstating novelty and to better reflect the contribution of our study.
(2) Suggestion: modernize the approach
I was surprised that the computational models used in this manuscript were all 8-10 years old. Specifically, because there are now deep nets that more explicitly model the human brain (e.g., Cornet) as well as more sophisticated models of semantics (e.g., LLMs), I was left hoping that the authors had used more state-of-the-art models in the work. Moreover, the use of a single dCNN, a single multi-modal model, and a single word embedding model makes it difficult to generalize about visual, multimodal, and semantic features in general.
Thanks for your suggestion. Indeed, our choice of ResNet and CLIP was motivated by their widespread use in the cognitive and computational neuroscience area. These models have served as standard benchmarks in many studies exploring correspondence between ANNs and human brain activity. To address you concern, we have now added additional results from the more biologically inspired model, CORnet, in the supplementary (Figure S10). The results for CORnet show similar patterns to those observed for ResNet and CLIP, providing converging evidence across models.
Regarding semantic modeling, we intentionally chose Word2Vec rather than large language models (LLMs), because our goal was to examine concept-level, context-free semantic representations. Word2Vec remains the most widely adopted approach for obtaining noncontextualized embeddings that reflect core conceptual similarity, as opposed to the contextdependent embeddings produced by LLMs, which are less directly suited for capturing stable concept-level structure across stimuli.
(3) Methodological considerations
(a) Validity of the real-world size measurement
I was concerned about a few aspects of the real-world size rankings. First, I am trying to understand why the scale goes from 100-519. This seems very arbitrary; please clarify. Second, are we to assume that this scale is linear? Is this appropriate when real-world object size is best expressed on a log scale? Third, the authors provide "sand" as an example of the smallest realworld object. This is tricky because sand is more "stuff" than "thing", so I imagine it leaves observers wondering whether the experimenter intends a grain of sand or a sandy scene region. What is the variability in real-world size ratings? Might the variability also provide additional insights in this experiment?
We now clarify the origin, scaling, and interpretation of the real-world size values obtained from the THINGS+ dataset.
In their experiment, participants first rated the size of a single object concept (word shown on the screen) by clicking on a continuous slider of 520 units, which was anchored by nine familiar real-world reference objects (e.g., “grain of sand,” “microwave oven,” “aircraft carrier”) that spanned the full expected size range on a logarithmic scale. Importantly, participants were not shown any numerical values on the scale—they were guided purely by the semantic meaning and relative size of the anchor objects. After the initial response, the scale zoomed in around the selected region (covering 160 units of the 520-point scale) and presented finer anchor points between the previous reference objects. Participants then refined their rating by dragging from the lower to upper end of the typical size range for that object. If the object was standardized in size (e.g., “soccer ball”), a single click sufficed. These size judgments were collected across at least 50 participants per object, and final scores were derived from the central tendency of these responses. Although the final size values numerically range from 0 to 519 (after scaling), this range is not known to participants and is only applied post hoc to construct the size RDMs.
Regarding the term “sand”: the THINGS+ dataset distinguished between object meanings when ambiguity was present. For “sand,” participants were instructed to treat it as “a grain of sand”— consistent with the intended meaning of a discrete, minimal-size reference object.
Finally, we acknowledge that real-world size ratings may carry some degree of variability across individuals. However, the dataset includes ratings from 2010 participants across 1854 object concepts, with each object receiving at least 50 independent ratings. Given this large and diverse sample, the mean size estimates are expected to be stable and robust across subjects. While we did not include variability metrics in our main analysis, we believe the aggregated ratings provide a reliable estimate of perceived real-world size.
We added these details in the Materials and Method section:
(line 219 to 230) “In the THINGS+ dataset, 2010 participants (different from the subjects in THINGS EEG2) did an online size rating task and completed a total of 13024 trials corresponding to 1854 object concepts using a two-step procedure. In their experiment, first, each object was rated on a 520unit continuous slider anchored by familiar reference objects (e.g., “grain of sand,” “microwave oven,” “aircraft carrier”) representing a logarithmic size range. Participants were not shown numerical values but used semantic anchors as guides. In the second step, the scale zoomed in around the selected region to allow for finer-grained refinement of the size judgment. Final size values were derived from aggregated behavioral data and rescaled to a range of 0–519 for consistency across objects, with the actual mean ratings across subjects ranging from 100.03 (‘grain of sand’) to 423.09 (‘subway’).”
(b) This work has no noise ceiling to establish how strong the model fits are, relative to the intrinsic noise of the data. I strongly suggest that these are included.
We have now computed noise ceiling estimates for the EEG RDMs across time. The noise ceiling was calculated by correlating each participant’s EEG RDM with the average EEG RDM across the remaining participants (leave-one-subject-out), at each time point. This provides an upper-bound estimate of the explainable variance, reflecting the maximum similarity that any model—no matter how complex—could potentially achieve, given the intrinsic variability in the EEG data.
Importantly, the observed EEG–model similarity values are substantially below this upper bound. This outcome is fully expected: Each of our model RDMs (e.g., real-world size, ANN layers) captures only a specific aspect of the neural representational structure, rather than attempting to account for the totality of the EEG signal. Our goal is not to optimize model performance or maximize fit, but to probe which components of object information are reflected in the spatiotemporal dynamics of the brain’s responses.
For clarity and accessibility of the main findings, we present the noise ceiling time courses separately in the supplementary materials (Figure S7). Including them directly in the EEG × HYP or EEG × ANN plots would conflate distinct interpretive goals: the model RDMs are hypothesis-driven probes of specific representational content, whereas the noise ceiling offers a normative upper bound for total explainable variance. Keeping these separate ensures each visualization remains focused and interpretable.
Reviewer #1 (Recommendations For The Authors)::
Some analyses are incomplete, which would be improved if the authors showed analyses with other layers of the networks and various additional partial correlation analyses.
Clarity
(1) Partial correlations methods incomplete - it is not clear what is being partialled out in each analysis. It is possible to guess sometimes, but it is not entirely clear for each analysis. This is important as it is difficult to assess if the partial correlations are sensible/correct in each case. Also, the Figure 1 caption is short and unclear.
For example, ANN-EEG partial correlations - "Finally, we directly compared the timepoint-bytimepoint EEG neural RDMs and the ANN RDMs (Figure 3F). The early layer representations of both ResNet and CLIP were significantly correlated with early representations in the human brain" What is being partialled out? Figure 3F says partial correlation
We apologize for the confusion. We made several key clarifications and corrections in the revised version.
First, we identified and corrected a labeling error in both Figure 1 and Figure 3F. Specifically, our EEG × ANN analysis used Spearman correlation, not partial correlation as mistakenly indicated in the original figure label and text. We conducted parital correlations for EEG × HYP and ANN × HYP. But for EEG × ANN, we directly calculated the correlation between EEG RDMs and ANN RDM corresponding to different layers respectively. We corrected these errors: (1) In Figure 1, we removed the erroneous “partial” label from the EEG × ANN path and updated the caption to clearly outline which comparisons used partial correlation. (2) In Figure 3F, we corrected the Y-axis label to “(correlation)”.
Second, to improve clarity, we have now revised the Materials and Methods section to explicitly describe what is partialled out in each parital correlation analysis:
(line 284 to 286) “In EEG × HYP partial correlation (Figure 3D), we correlated EEG RDMs with one hypothesis-based RDM (e.g., real-world size), while controlling for the other two (retinal size and real-world depth).”
(line 303 to 305) “In ANN (or W2V) × HYP partial correlation (Figure 3E and Figure 5A), we correlated ANN (or W2V) RDMs with one hypothesis-based RDM (e.g., real-world size), while partialling out the other two.”
Finally, the caption of Figure 1 has been expanded to clarify the full analysis pipeline and explicitly specify the partial correlation or correlation in each comparison.
(line 327 to 332) “Figure 1 Overview of our analysis pipeline including constructing three types of RDMs and conducting comparisons between them. We computed RDMs from three sources: neural data (EEG), hypothesized object features (real-world size, retinal size, and real-world depth), and artificial models (ResNet, CLIP, and Word2Vec). Then we conducted cross-modal representational similarity analyses between: EEG × HYP (partial correlation, controlling for other two HYP features), ANN (or W2V) × HYP (partial correlation, controlling for other two HYP features), and EEG × ANN (correlation).”
We believe these revisions now make all analytic comparisons and correlation types full clear and interpretable.
Issues / open questions
(2) Semantic representations vs hypothesized (hyp) RDMs (real-world size, etc) - are the representations explained by variables in hyp RDMs or are there semantic representations over and above these? E.g., For ANN correlation with the brain, you could partial out hyp RDMs - and assess whether there is still semantic information left over, or is the variance explained by the hyp RDMs?
Thank for this suggestion. As you suggested, we conducted the partial correlation analysis between EEG RDMs and ANN RDMs, controlling for the three hypothesis-based RDMs. The results (Figure S6) revealed that the EEG×ANN representational similarity remained largely unchanged, indicating that ANN representations capture much more additional representational structure not accounted for by the current hypothesized features. This is also consistent with the observation that EEG×HYP partial correlations were themselves small, but EEG×ANN correlations were much greater.
We also added this statement to the main text:
(line 446 to 451) “To contextualize how much of the shared variance between EEG and ANN representations is driven by the specific visual object features we tested above, we conducted a partial correlation analysis between EEG RDMs and ANN RDMs controlling for the three hypothesis-based RDMs (Figure S6). The EEG×ANN similarity results remained largely unchanged, suggesting that ANN representations capture much more additional rich representational structure beyond these features. ”
(3) Why only early and late layers? I can see how it's clearer to present the EEG results. However, the many layers in these networks are an opportunity - we can see how simple/complex linear/non-linear the transformation is over layers in these models. It would be very interesting and informative to see if the correlations do in fact linearly increase from early to later layers, or if the story is a bit more complex. If not in the main text, then at least in the supplement.
Thank you for the thoughtful suggestion. To address this point, we have computed the EEG correlations with multiple layers in both ResNet and CLIP models (ResNet: ResNet.maxpool, ResNet.layer1, ResNet.layer2, ResNet.layer3, ResNet.layer4, ResNet.avgpool; CLIP:CLIP.visual.avgpool, CLIP.visual.layer1, CLIP.visual.layer2, CLIP.visual.layer3, CLIP.visual.layer4, CLIP.visual.attnpool). The results, now included in Figure S4 and S5, show a consistent trend: early layers exhibit higher similarity to early EEG time points, and deeper layers show increased similarity to later EEG stages. We chose to highlight early and late layers in the main text to simplify interpretation, but now provide the full layerwise profile for completeness.
(4) Peak latency analysis - Estimating peaks per ppt is presumably noisy, so it seems important to show how reliable this is. One option is to find the bootstrapped mean latencies per subject.
Thanks for your suggestion. To estimate the robustness of peak latency values, we implemented a bootstrap procedure by resampling the pairwise entries of the EEG RDM with replacement. For each bootstrap sample, we computed a new EEG RDM and recalculated the partial correlation time course with the hypothesis RDMs. We then extracted the peak latency within the predefined significant time window. Repeating this process 1000 times allowed us to get the bootstrapped mean latencies per subject as the more stable peak latency result. Notably, the bootstrapped results showed minimal deviation from the original latency estimates, confirming the robustness of our findings. Accordingly, we updated the Figure 3D and added these in the Materials and Methods section:
(line 289 to 298) “To assess the stability of peak latency estimates for each subject, we performed a bootstrap procedure across stimulus pairs. At each time point, the EEG RDM was vectorized by extracting the lower triangle (excluding the diagonal), resulting in 19,900 unique pairwise values. For each bootstrap sample, we resampled these 19,900 pairwise entries with replacement to generate a new pseudo-RDM of the same size. We then computed the partial correlation between the EEG pseudo-RDM and a given hypothesis RDM (e.g., real-world size), controlling for other feature RDMs, and obtained a time course of partial correlations. Repeating this procedure 1000 times and extracting the peak latency within the significant time window yielded a distribution of bootstrapped latencies, from which we got the bootstrapped mean latencies per subject.”
(5) "Due to our calculations being at the object level, if there were more than one of the same objects in an image, we cropped the most complete one to get a more accurate retinal size. " Did EEG experimenters make sure everyone sat the same distance from the screen? and remain the same distance? This would also affect real-world depth measures.
Yes, the EEG dataset we used (THINGS EEG2; Gifford et al., 2022) was collected under carefully controlled experimental conditions. We have confirmed that all participants were seated at a fixed distance of 0.6 meters from the screen throughout the experiment. We also added this information in the method (line 156 to 157).
Minor issues/questions - note that these are not raised in the Public Review
(6) Title - less about rigor/quality of the work but I feel like the title could be improved/extended. The work tells us not only about real object size, but also retinal size and depth. In fact, isn't the most novel part of this the real-world depth aspect? Furthermore, it feels like the current title restricts its relevance and impact... Also doesn't touch on the temporal aspect, or processing stages, which is also very interesting. There may be something better, but simply adding something like"...disentangled features of real-world size, depth, and retinal size over time OR processing stages".
Thanks for your suggestion! We changed our title – “Human EEG and artificial neural networks reveal disentangled representations and processing timelines of object real-world size and depth in natural images”.
(7) "Each subject viewed 16740 images of objects on a natural background for 1854 object concepts from the THINGS dataset (Hebart et al., 2019). For the current study, we used the 'test' dataset portion, which includes 16000 trials per subject corresponding to 200 images." Why test images? Worth explaining.
We chose to use the “test set” of the THINGS EEG2 dataset for the following two reasons:
(1) Higher trial count per condition: In the test set, each of the 200 object images was presented 80 times per subject, whereas in the training set, each image was shown only 4 times. This much higher trial count per condition in the test set allows for substantially higher signal-tonoise ratio in the EEG data.
(2) Improved decoding reliability: Our analysis relies on constructing EEG RDMs based on pairwise decoding accuracy using linear SVM classifiers. Reliable decoding estimates require a sufficient number of trials per condition. The test set design is thus better suited to support high-fidelity decoding and robust representational similarity analysis.
We also added these explainations to our revised manuscript (line 161 to 164).
(8) "For Real-World Size RDM, we obtained human behavioral real-world size ratings of each object concept from the THINGS+ dataset (Stoinski et al., 2022).... The range of possible size ratings was from 0 to 519 in their online size rating task..." How were the ratings made? What is this scale - do people know the numbers? Was it on a continuous slider?
We should clarify how the real-world size values were obtained from the THINGS+ dataset.
In their experiment, participants first rated the size of a single object concept (word shown on the screen) by clicking on a continuous slider of 520 units, which was anchored by nine familiar real-world reference objects (e.g., “grain of sand,” “microwave oven,” “aircraft carrier”) that spanned the full expected size range on a logarithmic scale. Importantly, participants were not shown any numerical values on the scale—they were guided purely by the semantic meaning and relative size of the anchor objects. After the initial response, the scale zoomed in around the selected region (covering 160 units of the 520-point scale) and presented finer anchor points between the previous reference objects. Participants then refined their rating by dragging from the lower to upper end of the typical size range for that object. If the object was standardized in size (e.g., “soccer ball”), a single click sufficed. These size judgments were collected across at least 50 participants per object, and final scores were derived from the central tendency of these responses. Although the final size values numerically range from 0 to 519 (after scaling), this range is not known to participants and is only applied post hoc to construct the size RDMs.
We added these details in the Materials and Method section:
(line 219 to 230) “In the THINGS+ dataset, 2010 participants (different from the subjects in THINGS EEG2) did an online size rating task and completed a total of 13024 trials corresponding to 1854 object concepts using a two-step procedure. In their experiment, first, each object was rated on a 520unit continuous slider anchored by familiar reference objects (e.g., “grain of sand,” “microwave oven,” “aircraft carrier”) representing a logarithmic size range. Participants were not shown numerical values but used semantic anchors as guides. In the second step, the scale zoomed in around the selected region to allow for finer-grained refinement of the size judgment. Final size values were derived from aggregated behavioral data and rescaled to a range of 0–519 for consistency across objects, with the actual mean ratings across subjects ranging from 100.03 (‘grain of sand’) to 423.09 (‘subway’).”
(9) "For Retinal Size RDM, we applied Adobe Photoshop (Adobe Inc., 2019) to crop objects corresponding to object labels from images manually... " Was this by one person? Worth noting, and worth sharing these values per image if not already for other researchers as it could be a valuable resource (and increase citations).
Yes, all object cropping were performed consistently by one of the authors to ensure uniformity across images. We agree that this dataset could be a useful resource to the community. We have now made the cropped object images publicly available https://github.com/ZitongLu1996/RWsize.
We also updated the manuscript accordingly to note this (line 236 to 239).
(10) "Neural RDMs. From the EEG signal, we constructed timepoint-by-timepoint neural RDMs for each subject with decoding accuracy as the dissimilarity index " Decoding accuracy is presumably a similarity index. Maybe 1-accuracy (proportion correct) for dissimilarity?
Decoding accuracy is a dissimilarity index instead of a similarity index, as higher decoding accuracy between two conditions indicates that they are more distinguishable – i.e., less similar – in the neural response space. This approach aligns with prior work using classification-based representational dissimilarity measures (Grootswagers et al., 2017; Xie et al., 2020), where better decoding implies greater dissimilarity between conditions. Therefore, there is no need to invert the decoding accuracy values (e.g., using 1 - accuracy).
Grootswagers, T., Wardle, S. G., & Carlson, T. A. (2017). Decoding dynamic brain patterns from evoked responses: A tutorial on multivariate pattern analysis applied to time series neuroimaging data. Journal of Cognitive Neuroscience, 29(4), 677-697.
Xie, S., Kaiser, D., & Cichy, R. M. (2020). Visual imagery and perception share neural representations in the alpha frequency band. Current Biology, 30(13), 2621-2627.
(11) Figure 1 caption is very short - Could do with a more complete caption. Unclear what the partial correlations are (what is being partialled out in each case), what are the comparisons "between them" - both in the figure and the caption. Details should at least be in the main text.
Related to your comment (1). We revised the caption and the corresponding text.
Reviewer #2 (Recommendations For The Authors):
(1) Intro:
Quek et al., (2023) is referred to as a behavioral study, but it has EEG analyses.
We corrected this – “…, one recent study (Quek et al., 2023) …”
The phrase 'high temporal resolution EEG' is a bit strange - isn't all EEG high temporal resolution? Especially when down-sampling to 100 Hz (40 time points/epoch) this does not qualify as particularly high-res.
We removed this phrasing in our manuscript.
(2) Methods:
It would be good to provide more details on the EEG preprocessing. Were the data low-pass filtered, for example?
We added more details to the manuscript:
(line 167 to 174) “The EEG data were originally sampled at 1000Hz and online-filtered between 0.1 Hz and 100 Hz during acquisition, with recordings referenced to the Fz electrode. For preprocessing, no additional filtering was applied. Baseline correction was performed by subtracting the mean signal during the 100 ms pre-stimulus interval from each trial and channel separately. We used already preprocessed data from 17 channels with labels beginning with “O” or “P” (O1, Oz, O2, PO7, PO3, POz, PO4, PO8, P7, P5, P3, P1, Pz, P2) ensuring full coverage of posterior regions typically involved in visual object processing. The epoched data were then down-sampled to 100 Hz.”
It is important to provide more motivation about the specific ANN layers chosen. Were these layers cherry-picked, or did they truly represent a gradual shift over the course of layers?
We appreciate the reviewer’s concern and fully agree that it is important to ensure transparency in how ANN layers were selected. The early and late layers reported in the main text were not cherry-picked to maximize effects, but rather intended to serve as illustrative examples representing the lower and higher ends of the network hierarchy. To address this point directly, we have computed the EEG correlations with multiple layers in both ResNet and CLIP models (ResNet: ResNet.maxpool, ResNet.layer1, ResNet.layer2, ResNet.layer3, ResNet.layer4, ResNet.avgpool; CLIP: CLIP.visual.avgpool, CLIP.visual.layer1, CLIP.visual.layer2, CLIP.visual.layer3, CLIP.visual.layer4, CLIP.visual.attnpool). The results, now included in Figure S4, show a consistent trend: early layers exhibit higher similarity to early EEG time points, and deeper layers show increased similarity to later EEG stages.
It is important to provide more specific information about the specific ANN layers chosen. 'Second convolutional layer': is this block 2, the ReLu layer, the maxpool layer? What is the 'last visual layer'?
Apologize for the confusing! We added more details about the layer chosen:
(line 255 to 257) “The early layer in ResNet refers to ResNet.maxpool layer, and the late layer in ResNet refers to ResNet.avgpool layer. The early layer in CLIP refers to CLIP.visual.avgpool layer, and the late layer in CLIP refers to CLIP.visual.attnpool layer.”
Again the claim 'novel' is a bit overblown here since the real-world size ratings were also already collected as part of THINGS+, so all data used here is available.
We removed this phrasing in our manuscript.
Real-world size ratings ranged 'from 0 - 519'; it seems unlikely this was the actual scale presented to subjects, I assume it was some sort of slider?
You are correct. We should clarify how the real-world size values were obtained from the THINGS+ dataset.
In their experiment, participants first rated the size of a single object concept (word shown on the screen) by clicking on a continuous slider of 520 units, which was anchored by nine familiar real-world reference objects (e.g., “grain of sand,” “microwave oven,” “aircraft carrier”) that spanned the full expected size range on a logarithmic scale. Importantly, participants were not shown any numerical values on the scale—they were guided purely by the semantic meaning and relative size of the anchor objects. After the initial response, the scale zoomed in around the selected region (covering 160 units of the 520-point scale) and presented finer anchor points between the previous reference objects. Participants then refined their rating by dragging from the lower to upper end of the typical size range for that object. If the object was standardized in size (e.g., “soccer ball”), a single click sufficed. These size judgments were collected across at least 50 participants per object, and final scores were derived from the central tendency of these responses. Although the final size values numerically range from 0 to 519 (after scaling), this range is not known to participants and is only applied post hoc to construct the size RDMs.
We added these details in the Materials and Method section:
(line 219 to 230) “In the THINGS+ dataset, 2010 participants (different from the subjects in THINGS EEG2) did an online size rating task and completed a total of 13024 trials corresponding to 1854 object concepts using a two-step procedure. In their experiment, first, each object was rated on a 520unit continuous slider anchored by familiar reference objects (e.g., “grain of sand,” “microwave oven,” “aircraft carrier”) representing a logarithmic size range. Participants were not shown numerical values but used semantic anchors as guides. In the second step, the scale zoomed in around the selected region to allow for finer-grained refinement of the size judgment. Final size values were derived from aggregated behavioral data and rescaled to a range of 0–519 for consistency across objects, with the actual mean ratings across subjects ranging from 100.03 (‘grain of sand’) to 423.09 (‘subway’).”
Why is conducting a one-tailed (p<0.05) test valid for EEG-ANN comparisons? Shouldn't this be two-tailed?
Our use of one-tailed tests was based on the directional hypothesis that representational similarity between EEG and ANN RDMs would be positive, as supported by prior literature showing correspondence between hierarchical neural networks and human brain representations (e.g., Cichy et al., 2016; Kuzovkin et al., 2014). This is consistent with a large number of RSA studies which conduct one-tailed tests (i.e., testing the hypothesis that coefficients were greater than zero: e.g., Kuzovkin et al., 2018; Nili et al., 2014; Hebart et al., 2018; Kaiser et al., 2019; Kaiser et al., 2020; Kaiser et al., 2022). Thus, we specifically tested whether the similarity was significantly greater than zero.
Cichy, R. M., Khosla, A., Pantazis, D., Torralba, A., & Oliva, A. (2016). Comparison of deep neural networks to spatio-temporal cortical dynamics of human visual object recognition reveals hierarchical correspondence. Scientific reports, 6(1), 27755.
Kuzovkin, I., Vicente, R., Petton, M., Lachaux, J. P., Baciu, M., Kahane, P., ... & Aru, J. (2018). Activations of deep convolutional neural networks are aligned with gamma band activity of human visual cortex. Communications biology, 1(1), 107.
Nili, H., Wingfield, C., Walther, A., Su, L., Marslen-Wilson, W., & Kriegeskorte, N. (2014). A toolbox for representational similarity analysis. PLoS computational biology, 10(4), e1003553.
Hebart, M. N., Bankson, B. B., Harel, A., Baker, C. I., & Cichy, R. M. (2018). The representational dynamics of task and object processing in humans. Elife, 7, e32816.
Kaiser, D., Turini, J., & Cichy, R. M. (2019). A neural mechanism for contextualizing fragmented inputs during naturalistic vision. elife, 8, e48182.
Kaiser, D., Inciuraite, G., & Cichy, R. M. (2020). Rapid contextualization of fragmented scene information in the human visual system. Neuroimage, 219, 117045.
Kaiser, D., Jacobs, A. M., & Cichy, R. M. (2022). Modelling brain representations of abstract concepts. PLoS Computational Biology, 18(2), e1009837.
Importantly, we note that using a two-tailed test instead would not change the significance of our results. However, we believe the one-tailed test remains more appropriate given our theoretical prediction of positive similarity between ANN and brain representations.
The sentence on the partial correlation description (page 11 'we calculated partial correlations with one-tailed test against the alternative hypothesis that the partial correlation was positive (greater than zero)') didn't make sense to me; are you referring to the null hypothesis here?
We revised this sentence to clarify that we tested against the null hypothesis that the partial correlation was less than or equal to zero, using a one-tailed test to assess whether the correlation was significantly greater than zero.
(line 281 to 284) “…, we calculated partial correlations and used a one-tailed test against the null hypothesis that the partial correlation was less than or equal to zero, testing whether the partial correlation was significantly greater than zero.”
(3) Results:
I would prevent the use of the word 'pure', your measurement is one specific operationalization of this concept of real-world size that is not guaranteed to result in unconfounded representations. This is in fact impossible whenever one is using a finite set of natural stimuli and calculating metrics on those - there can always be a factor or metric that was not considered that could explain some of the variance in your measurement. It is overconfident to claim to have achieved some form of Platonic ideal here and to have taken into account all confounds.
Your point is well taken. Our original use of the term “pure” was intended to reflect statistical control for known confounding factors, but we recognize that this wording may imply a stronger claim than warranted. In response, we revised all relevant language in the manuscript to instead describe the statistically isolated or relatively unconfounded representation of real-world size, clarifying that our findings pertain to the unique contribution of real-world size after accounting for retinal size and real-world depth.
Figure 2C: It's not clear why peak latencies are computed on the 'full' correlations rather than the partial ones.
No. The peak latency results in Figure 2C were computed on the partial correlation results – we mentioned this in the figure caption – “Temporal latencies for peak similarity (partial Spearman correlations) between EEG and the 3 types of object information.”
SEM = SEM across the 10 subjects?
Yes. We added this in the figure caption.
Figure 3F y-axis says it's partial correlations but not clear what is partialled out here.
We identified and corrected a labeling error in both Figure 1 and Figure 3F. Specifically, our EEG × ANN analysis used Spearman correlation, not partial correlation as mistakenly indicated in the original figure label and text. We conducted parital correlations for EEG × HYP and ANN × HYP. But for EEG × ANN, we directly calculated the correlation between EEG RDMs and ANN RDM corresponding to different layers respectively. We corrected these errors: (1) In Figure 1, we removed the erroneous “partial” label from the EEG × ANN path and updated the caption to clearly outline which comparisons used partial correlation. (2) In Figure 3F, we corrected the Y-axis label to “(correlation)”.
Reviewer #3 (Recommendations For The Authors):
(1) Several methodologies should be clarified:
(a) It's stated that EEG was sampled at 100 Hz. I assume this was downsampled? From what original frequency?
Yes. We added more detailed about EEG data:
(line 167 to 174) “The EEG data were originally sampled at 1000Hz and online-filtered between 0.1 Hz and 100 Hz during acquisition, with recordings referenced to the Fz electrode. For preprocessing, no additional filtering was applied. Baseline correction was performed by subtracting the mean signal during the 100 ms pre-stimulus interval from each trial and channel separately. We used already preprocessed data from 17 channels with labels beginning with “O” or “P” (O1, Oz, O2, PO7, PO3, POz, PO4, PO8, P7, P5, P3, P1, Pz, P2) ensuring full coverage of posterior regions typically involved in visual object processing. The epoched data were then down-sampled to 100 Hz.”
(b) Why was decoding accuracy used as the human RDM method rather than the EEG data themselves?
Thanks for your question! We would like to address why we used decoding accuracy for EEG RDMs rather than correlation. While fMRI RDMs are typically calculated using 1 minus correlation coefficient, decoding accuracy is more commonly used for EEG RDMs (Grootswager et al., 2017; Xie et al., 2020). The primary reason is that EEG signals are more susceptible to noise than fMRI data. Correlation-based methods are particularly sensitive to noise and may not reliably capture the functional differences between EEG patterns for different conditions. Decoding accuracy, by training classifiers to focus on task-relevant features, can effectively mitigate the impact of noisy signals and capture the representational difference between two conditions.
Grootswagers, T., Wardle, S. G., & Carlson, T. A. (2017). Decoding dynamic brain patterns from evoked responses: A tutorial on multivariate pattern analysis applied to time series neuroimaging data. Journal of Cognitive Neuroscience, 29(4), 677-697.
Xie, S., Kaiser, D., & Cichy, R. M. (2020). Visual imagery and perception share neural representations in the alpha frequency band. Current Biology, 30(13), 2621-2627.
We added this explanation to the manuscript:
(line 204 to 209) “Since EEG has a low SNR and includes rapid transient artifacts, Pearson correlations computed over very short time windows yield unstable dissimilarity estimates (Kappenman & Luck, 2010; Luck, 2014) and may thus fail to reliably detect differences between images. In contrast, decoding accuracy - by training classifiers to focus on task-relevant features - better mitigates noise and highlights representational differences.”
(c) How were the specific posterior electrodes selected?
The 17 posterior electrodes used in our analyses were pre-selected and provided in the THINGS EEG2 dataset, and corresponding to standard occipital and parietal sites based on the 10-10 EEG system. Specifically, we included all 17 electrodes with labels beginning with “O” or “P”, ensuring full coverage of posterior regions typically involved in visual object processing (Page 7).
(d) The specific layers should be named rather than the vague ("last visual")
Apologize for the confusing! We added more details about the layer information:
(line 255 to 257) “The early layer in ResNet refers to ResNet.maxpool layer, and the late layer in ResNet refers to ResNet.avgpool layer. The early layer in CLIP refers to CLIP.visual.avgpool layer, and the late layer in CLIP refers to CLIP.visual.attnpool layer.”
(line 420 to 434) “As shown in Figure 3F, the early layer representations of both ResNet and CLIP (ResNet.maxpool layer and CLIP.visual.avgpool) showed significant correlations with early EEG time windows (early layer of ResNet: 40-280ms, early layer of CLIP: 50-130ms and 160-260ms), while the late layers (ResNet.avgpool layer and CLIP.visual.attnpool layer) showed correlations extending into later time windows (late layer of ResNet: 80-300ms, late layer of CLIP: 70-300ms). Although there is substantial temporal overlap between early and late model layers, the overall pattern suggests a rough correspondence between model hierarchy and neural processing stages.
We further extended this analysis across intermediate layers of both ResNet and CLIP models (from early to late, ResNet: ResNet.maxpool, ResNet.layer1, ResNet.layer2, ResNet.layer3, ResNet.layer4, ResNet.avgpool; from early to late, CLIP: CLIP.visual.avgpool, CLIP.visual.layer1, CLIP.visual.layer2, CLIP.visual.layer3, CLIP.visual.layer4, CLIP.visual.attnpool).”
(e) p19: please change the reporting of t-statistics to standard APA format.
Thanks for the suggestion. We changed the reporting format accordingly:
(line 392 to 394) “The representation of real-word size had a significantly later peak latency than that of both retinal size, t(9)=4.30, p=.002, and real-world depth, t(9)=18.58, p<.001. And retinal size representation had a significantly later peak latency than real-world depth, t(9)=3.72, p=.005.”
(2) "early layer of CLIP: 50-130ms and 160-260ms), while the late layer representations of twoANNs were significantly correlated with later representations in the human brain (late layer of ResNet: 80-300ms, late layer of CLIP: 70-300ms)."
This seems a little strong, given the large amount of overlap between these models.
We agree that our original wording may have overstated the distinction between early and late layers, given the substantial temporal overlap in their EEG correlations. We revised this sentence to soften the language to reflect the graded nature of the correspondence, and now describe the pattern as a general trend rather than a strict dissociation:
(line 420 to 427) “As shown in Figure 3F, the early layer representations of both ResNet and CLIP (ResNet.maxpool layer and CLIP.visual.avgpool) showed significant correlations with early EEG time windows (early layer of ResNet: 40-280ms, early layer of CLIP: 50-130ms and 160-260ms), while the late layers (ResNet.avgpool layer and CLIP.visual.attnpool layer) showed correlations extending into later time windows (late layer of ResNet: 80-300ms, late layer of CLIP: 70-300ms). Although there is substantial temporal overlap between early and late model layers, the overall pattern suggests a rough correspondence between model hierarchy and neural processing stages.”
(3) "Also, human brain representations showed a higher similarity to the early layer representation of the visual model (ResNet) than to the visual-semantic model (CLIP) at an early stage. "
This has been previously reported by Greene & Hansen, 2020 J Neuro.
Thanks! We added this reference.
(4) "ANN (and Word2Vec) model RDMs"
Why not just "model RDMs"? Might provide more clarity.
We chose to use the phrasing “ANN (and Word2Vec) model RDMs” to maintain clarity and avoid ambiguity. In the literature, the term “model RDMs” is sometimes used more broadly to include hypothesis-based feature spaces or conceptual models, and we wanted to clearly distinguish our use of RDMs derived from artificial neural networks and language models. Additionally, explicitly referring to ANN or Word2Vec RDMs improves clarity by specifying the model source of each RDM. We hope this clarification justifies our choice to retain the original phrasing for clarity.
the“Californian Ideology,” a set of widely held beliefs that increasing theadoption of computer technologies brings positive socialconsequences
This reflects Silicon Valley's long-held view that technology always leads to development. Marwick says that this optimism covers problems, including mixing libertarian capitalism with virtues from the counterculture, like creativity and disobedience. It's amazing how this way of thinking still affects modern tech culture, where businesses say they want to "change the world" but instead make things worse by supporting systems that make money and inequity (like AI and gig platforms today).
Web 2.0 celebrated the adoption of socialtechnologies as a precursor to a better, freer society, and framed thecollection and sharing of information as the bedrock of revolution.
Marwick explains that Web 2.0 started out with the hope that technology could give regular people more influence and take the place of "Big Media." This idealism said that everyone would be equal if they took part, but in reality, platforms like Facebook and YouTube were taken over by ads and big companies. Her point makes me think about how current social media still offers the idea of community while making money off of users' attention and data.
The automated ways of connecting people afforded by algorithms was very hard tounderstand for those doing the socializing – in some cases near impossible.
Ytreberg shows here how algorithms have replaced editors and curators, but they don't have to be open or responsible. People assume they are choose what to see and share, but algorithms discreetly pick what gets seen. This connects to what we've been talking about with disinformation and media literacy. Just like in Cat Park, people often don't know how digital networks change what they believe or value. The fact that they are not visible gives internet corporations a lot of power in politics and culture.
A certain return of the social to the centre stage of mediated communicationtook place, then, in the 2000s and 2010s.
This statement sums up how social media changed the way people talk to each other throughout the world. Ytreberg says that the early days of the internet focused on individual freedom, but the 2000s saw a move toward social connectedness, which was paradoxically caused by companies like Facebook and Twitter. This "return" wasn't only social; it was also commercial, since sharing and talking were ways to make money. It makes me think about how a lot of what feels like "community" online is really built into systems that are meant to collect data and change behavior.
Reviewer #1 (Public review):
This study presents cryoEM-derived structures of the Trypanosome aquaporin AQP2, in complex with its natural ligand, glycerol, as well as two trypanocidal drugs, pentamidine and melarsoprol, which use AQP2 as an uptake route. The structures are high quality and the density for the drug molecules is convincing, showing a binding site in the centre of the AQP2 pore.
The authors then continue to study this system using molecular dynamics simulations. Their simulations indicate that the drugs can pass through the pore and identify a weak binding site in the centre of the pore, which corresponds with that identified through cryoEM analysis. They also simulate the effect of drug resistance mutations which suggests that the mutations reduce the affinity for drugs and therefore might reduce the likelihood that the drugs enter into the centre of the pore, reducing the likelihood that they progress through into the cell.
While the cryoEM and MD studies are well conducted, it is a shame that the drug transport hypothesis was not tested experimentally. For example, did they do cryoEM with AQP2 with drug resistance mutations and see if they could see the drugs in these maps? They might not bind, but another possibility is that the binding site shifts, as seen in Chen et al? Do they have an assay for measuring drug binding? I think that some experimental validation of the drug binding hypothesis would strengthen this paper. The authors describe in their response why these experiments are challenging.
Author response:
The following is the authors’ response to the original reviews.
Reviewer #1 (Public review):
This study presents cryoEM-derived structures of the Trypanosome aquaporin AQP2, in complex with its natural ligand, glycerol, as well as two trypanocidal drugs, pentamidine and melarsoprol, which use AQP2 as an uptake route. The structures are high quality, and the density for the drug molecules is convincing, showing a binding site in the centre of the AQP2 pore.
The authors then continue to study this system using molecular dynamics simulations. Their simulations indicate that the drugs can pass through the pore and identify a weak binding site in the centre of the pore, which corresponds with that identified through cryoEM analysis. They also simulate the effect of drug resistance mutations, which suggests that the mutations reduce the affinity for drugs and therefore might reduce the likelihood that the drugs enter into the centre of the pore, reducing the likelihood that they progress through into the cell.
While the cryoEM and MD studies are well conducted, it is a shame that the drug transport hypothesis was not tested experimentally. For example, did they do cryoEM with AQP2 with drug resistance mutations and see if they could see the drugs in these maps? They might not bind, but another possibility is that the binding site shifts, as seen in Chen et al.
TbAQP2 from the drug-resistant mutants does not transport either melarsoprol or pentamidine and there was thus no evidence to suggest that the mutant TbAQP2 channels could bind either drug. Moreover, there is not a single mutation that is characteristic for drug resistance in TbAQP2: references 12–15 show a plethora of chimeric AQP2/3 constructs in addition to various point mutations in laboratory strains and field isolates. In reference 17 we describe a substantial number of SNPs that reduced pentamidine and melarsoprol efficacy to levels that would constitute clinical resistance to acceptable dosage regimen. It thus appears that there are many and diverse mutations that are able to modify the protein sufficiently to induce resistance, and likely in multiple different ways, including the narrowing of the pore, changes to interacting amino acids, access to the pore etc. We therefore did not attempt to determine the structures of the mutant channels because we did not think that in most cases we would see any density for the drugs in the channel, and we would be unable to define ‘the’ resistance mechanism if we did in the case of one individual mutant TbAQP2. Our MD data suggests that pentamidine binding affinity is in the range of 50-300 µM for the mutant TbAQP2s selected for that test (I110W and L258Y/L264R), i.e. >1000-fold higher than TbAQP2WT. Thus these structures will be exceedingly challenging to determine with pentamidine in the pore but, of course, until the experiment has been tried we will not know for sure.
Do they have an assay for measuring drug binding?
We tried many years ago to develop a <sup>3</sup>H-pentamidine binding assay to purified wild type TbAQP2 but we never got satisfactory results even though the binding should be in the doubledigit nanomolar range. This may be for any number of technical reasons and could also be partly because flexible di-benzamidines bind non-specifically to proteins at µM concentrations giving rise to high background. Measuring binding to the mutants was not tested given that they would be binding pentamidine in the µM range. If we were to pursue this further, then isothermal titration calorimetry (ITC) may be one way forward as this can measure µM affinity binding using unlabelled compounds, although it uses a lot of protein and background binding would need to be carefully assessed; see for example our work on measuring tetracycline binding to the tetracycline antiporter TetAB (https://doi.org/10.1016/j.bbamem.2015.06.026 ). Membrane proteins are also particularly tricky for this technique as the chemical activity of the protein solution must be identical to the chemical activity of the substrate solution which titrates in the molecule binding to the protein; this can be exceedingly problematic if any free detergent remains in the purified membrane protein. Another possibility may be fluorescence polarisation spectroscopy, although this would require fluorescently labelling the drugs which would very likely affect their affinity for TbAQP2 and how they interact with the wild type and mutant proteins – see the detailed SAR analysis in Alghamdi et al. 2020 (ref. 17). As you will appreciate, it would take considerable time and effort to set up an assay for measuring drug binding to mutants and is beyond the current scope of the current work.
I think that some experimental validation of the drug binding hypothesis would strengthen this paper. Without this, I would recommend the authors to soften the statement of their hypothesis (i.e, lines 65-68) as this has not been experimentally validated.
We agree with the referee that direct binding of drugs to the mutants would be very nice to have, but we have neither the time nor resources to do this. We have therefore softened the statement on lines 65-68 to read ‘Drug-resistant TbAQP2 mutants are still predicted to bind pentamidine, but the much weaker binding in the centre of the channel observed in the MD simulations would be insufficient to compensate for the high energy processes of ingress and egress, hence impairing transport at pharmacologically relevant concentrations.’
Reviewer #2 (Public review):
Summary:
The authors present 3.2-3.7 Å cryo-EM structures of Trypanosoma brucei aquaglyceroporin-2 (TbAQP2) bound to glycerol, pentamidine, or melarsoprol and combine them with extensive allatom MD simulations to explain drug recognition and resistance mutations. The work provides a persuasive structural rationale for (i) why positively selected pore substitutions enable diamidine uptake, and (ii) how clinical resistance mutations weaken the high-affinity energy minimum that drives permeation. These insights are valuable for chemotherapeutic re-engineering of diamidines and aquaglyceroporin-mediated drug delivery.
My comments are on the MD part.
Strengths:
The study
(1) Integrates complementary cryo-EM, equilibrium, applied voltage MD simulations, and umbrella-sampling PMFs, yielding a coherent molecular-level picture of drug permeation.
(2) Offers direct structural rationalisation of long-standing resistance mutations in trypanosomes, addressing an important medical problem.
Weaknesses:
Unphysiological membrane potential. A field of 0.1 V nm ¹ (~1 V across the bilayer) was applied to accelerate translocation. From the traces (Figure 1c), it can be seen that the translocation occurred really quickly through the channel, suggesting that the field might have introduced some large changes in the protein. The authors state that they checked visually for this, but some additional analysis, especially of the residues next to the drug, would be welcome.
This is a good point from the referee, and we thank them for raising it. It is common to use membrane potentials in simulations that are higher than the physiological value, although these are typically lower than used here. The reason we used the higher value was to speed sampling and it still took 1,400 ns for transport in the physiologically correct direction, and even then, only in 1/3 repeats. Hence this choice of voltage was probably necessary to see the effect. The exceedingly slow rate of pentamidine permeation seen in the MD simulation was consistent with the experimental observations, as discussed in Alghamdi et al (2020) [ref. 17] where we estimated that TbAQP2-mediated pentamidine uptake in T. brucei bloodstream forms proceeds at just 9.5×10<sup>5</sup> molecules/cell/h; the number of functional TbAQP2 units in the plasma membrane is not known but their location is limited to the small flagellar pocket (Quintana et al. PLoS Negl Trop Dis 14, e0008458 (2020)).
The referee is correct that it is important to make sure that the applied voltage is not causing issues for the protein, especially for residues in contact with the drug. We have carried out RMSF analysis to better test this. The data show that comparing our simulations with the voltage applied to the monomeric MD simulations + PNTM with no voltage reveals little difference in the dynamics of the drug-contacting residues.
We have added these new data as Supplementary Fig12b with a new legend (lines1134-1138)
‘b, RMSF calculations were run on monomeric TbAQP2 with either no membrane voltage or a 0.1V nm<sup>-1</sup> voltage applied (in the physiological direction). Shown are residues in contact with the pentamidine molecule, coloured by RMSF value. RMSF values are shown for residues Leu122, Phe226, Ile241, and Leu264. The data suggest the voltage has little impact on the flexibility or stability of the pore lining residues.’
We have also added the following text to the manuscript (lines 524-530):
‘Membrane potential simulations were run using the computational electrophysiology protocol. An electric field of 0.1 V/nm was applied in the z-axis dimension only, to create a membrane potential of about 1 V (see Fig. S10a). Note that this is higher than the physiological value of 87.1 ± 2.1 mV at pH 7.3 in bloodstream T. brucei, and was chosen to improve the sampling efficiency of the simulations. The protein and lipid molecules were visually confirmed to be unaffected by this voltage, which we quantify using RMSF analysis on pentamidine-contacting residues (Fig. S12b).’
Based on applied voltage simulations, the authors argue that the membrane potential would help get the drug into the cell, and that a high value of the potential was applied merely to speed up the simulation. At the same time, the barrier for translocation from PMF calculations is ~40 kJ/mol for WT. Is the physiological membrane voltage enough to overcome this barrier in a realistic time? In this context, I do not see how much value the applied voltage simulations have, as one can estimate the work needed to translocate the substrate on PMF profiles alone. The authors might want to tone down their conclusions about the role of membrane voltage in the drug translocation.
We agree that the PMF barriers are considerable, however we highlight that other studies have seen similar landscapes, e.g. PMID 38734677 which saw a barrier of ca. 10-15 kcal/mol (ca. 4060 kJ/mol) for PNTM transversing the channel. This was reduced by ca. 4 kcal/mol when a 0.4 V nm ¹ membrane potential was applied, so we expect a similar effect to be seen here.
We have updated the Results to more clearly highlight this point and added the following text (lines 274-275):
We note that previous studies using these approaches saw energy barriers of a similar size, and that these are reduced in the presence of a membrane voltage[17,31].’
Pentamidine charge state and protonation. The ligand was modeled as +2, yet pKa values might change with the micro-environment. Some justification of this choice would be welcome.
Pentamidine contains two diamidine groups and each are expected to have a pKa above 10 in solution (PMID: 20368397), suggesting that the molecule will carry a +2 charge. Using the +2 charge is also in line with previous MD studies (PMID: 32762841). We have added the following text to the Methods (lines 506-509):
‘The pentamidine molecule used existing parameters available in the CHARMM36 database under the name PNTM with a charge state of +2 to reflect the predicted pKas of >10 for these groups [73] and in line with previous MD studies[17].’
We note that accounting for the impact of the microenvironment is an excellent point – future studies might employ constant pH calculations to address this.
The authors state that this RMSD is small for the substrate and show plots in Figure S7a, with the bottom plot being presumably done for the substrate (the legends are misleading, though), levelling off at ~0.15 nm RMSD. However, in Figure S7a, we see one trace (light blue) deviating from the initial position by more than 0.2 nm - that would surely result in an RMSD larger than 0.15, but this is somewhat not reflected in the RMSD plots.
The bottom plot of Fig. S9a (previously Fig. S7a) is indeed the RMSD of the drug (in relation to the protein). We have clarified the legend with the following text (lines 1037-1038): ‘… or for the pentamidine molecule itself, i.e. in relation to the Cα of the channel (bottom).’
With regards the second comment, we assume the referee is referring to the light blue trace from Fig S9c. These data are actually for the monomeric channel rather than the tetramer. We apologise for not making this clearer in the legend. We have added the word ‘monomeric’ (line 1041).
Reviewer #3 (Public review):
Summary:
Recent studies have established that trypanocidal drugs, including pentamidine and melarsoprol, enter the trypanosomes via the glyceroaquaporin AQP2 (TbAQP2). Interestingly, drug resistance in trypanosomes is, at least in part, caused by recombination with the neighbouring gene, AQP3, which is unable to permeate pentamidine or melarsoprol. The effect of the drugs on cells expressing chimeric proteins is significantly reduced. In addition, controversy exists regarding whether TbAQP2 permeates drugs like an ion channel, or whether it serves as a receptor that triggers downstream processes upon drug binding. In this study the authors set out to achieve three objectives:
(1) to determine if TbAQP2 acts as a channel or a receptor,
We should clarify here that this was not an objective of the current manuscript as the transport activity has already been extensively characterised in the literature, as described in the introduction.
(2) to understand the molecular interactions between TbAQP2 and glycerol, pentamidine, and melarsoprol, and
(3) to determine the mechanism by which mutations that arise from recombination with TbAQP3 result in reduced drug permeation.
Indeed, all three objectives are achieved in this paper. Using MD simulations and cryo-EM, the authors determine that TbAQP2 likely permeates drugs like an ion channel. The cryo-EM structures provide details of glycerol and drug binding, and show that glycerol and the drugs occupy the same space within the pore. Finally, MD simulations and lysis assays are employed to determine how mutations in TbAQP2 result in reduced permeation of drugs by making entry and exit of the drug relatively more energy-expensive. Overall, the strength of evidence used to support the author's claims is solid.
Strengths:
The cryo-EM portion of the study is strong, and while the overall resolution of the structures is in the 3.5Å range, the local resolution within the core of the protein and the drug binding sites is considerably higher (~2.5Å).
I also appreciated the MD simulations on the TbAQP2 mutants and the mechanistic insights that resulted from this data.
Weaknesses:
(1) The authors do not provide any empirical validation of the drug binding sites in TbAQP2. While the discussion mentions that the binding site should not be thought of as a classical fixed site, the MD simulations show that there's an energetically preferred slot (i.e., high occupancy interactions) within the pore for the drugs. For example, mutagenesis and a lysis assay could provide us with some idea of the contribution/importance of the various residues identified in the structures to drug permeation. This data would also likely be very valuable in learning about selectivity for drugs in different AQP proteins.
On a philosophical level, we disagree with the requirement for ‘validation’ of a structure by mutagenesis. It is unclear what such mutagenesis would tell us beyond what was already shown experimentally through <sup>3</sup>H-pentamidine transport, drug sensitivity and lysis assays i.e. a given mutation will impact permeation to a certain extent. But on the structural level, what does mutagenesis tell us? If a bulky aromatic residue that makes many van der Waals interactions with the substrate is changed to an alanine residue and transport is reduced, what does this mean? It would confirm that the phenylalanine residue is very likely indeed making van der Waals contacts to the substrate, but we knew that already from the WT structure. And if it doesn’t have any effect? Well, it could mean that the van der Waals interactions with that particular residue are not that important or it could be that the substrate has changed its positions slightly in the channel and the new pose has similar energy of interactions to that observed in the wild type channel. Regardless of the result, any data from mutagenesis would be open to interpretation and therefore would not impact on the conclusions drawn in this manuscript. We might not learn anything new unless all residues interacting with the substrate are mutated, the structure of each mutant was determined and MD simulations were performed for all, which is beyond the scope of this work. Even then, the value for understanding clinical drug resistance would be limited, as this phenomenon has been linked to various chimeric rearrangements with adjacent TbAQP3 (references 12–15), each with a structure distinct from TbAQP2 with a single SNP. We also note that the recent paper by Chen et al. did not include any mutagenesis of the drug binding sites in TbAQP2 in their analysis of TbAQP2, presumably for similar reasons as discussed above.
(2) Given the importance of AQP3 in the shaping of AQP2-mediated drug resistance, I think a figure showing a comparison between the two protein structures/AlphaFold structures would be beneficial and appropriate
We agree that the comparison is of considerably interest and would contribute further to our understanding of the unique permeation capacities of TbAQP2. As such, we followed the reviewer’s suggestion and made an AlphaFold model of TbAQP3 and compared it to our structures of TbAQP2. The RMSD is 0.6 Å to the pentamidine-bound TbAQP2, suggesting that the fold of TbAQP3 has been predicted well, although the side chain rotamers cannot be assessed for their accuracy. Previous work has defined the selectivity filter of TbAQP3 to be formed by W102, R256, Y250. The superposition of the TbAQP3 model and the TbAQP2 pentamidine-bound structure shows that one of the amine groups is level with R256 and that there is a clash with Y250 and the backbone carbonyl of Y250, which deviates in position from the backbone of TbAQP2 in this region. There is also a clash with Ile252.
Although these observations are indeed interesting, on their own they are highly preliminary and extensive further work would be necessary to draw any convincing conclusions regarding these residues in preventing uptake of pentamidine and melarsoprol. The TbAQP3 AlphaFold model would need to be verified by MD simulations and then we would want to look at how pentamidine would interact with the channel under different experimental conditions like we have done with TbAQP2. We would then want to mutate to Ala each of the residues singly and in combination and assess them in uptake assays to verify data from the MD simulations. This is a whole new study and, given the uncertainties surrounding the observations of just superimposing TbAQP2 structure and the TbAQP3 model, we feel that, regrettably, this is just too speculative to add to our manuscript.
(3) A few additional figures showing cryo-EM density, from both full maps and half maps, would help validate the data.
Two new Supplementary Figures have been made, on showing the densities for each of the secondary structure elements (the new Figure S5) and one for the half maps showing the ligands (the new Figure S6). All the remaining supplementary figures have been renamed accordingly.
(4) Finally, this paper might benefit from including more comparisons with and analysis of data published in Chen et al (doi.org/10.1038/s41467-024-48445-4), which focus on similar objectives. Looking at all the data in aggregate might reveal insights that are not obvious from either paper on their own. For example, melarsoprol binds differently in structures reported in the two respective papers, and this may tell us something about the energy of drug-protein interactions within the pore.
We already made the comparisons that we felt were most pertinent and included a figure (Fig. 5) to show the difference in orientation of melarsoprol in the two structures. We do not feel that any additional comparison is sufficiently interesting to be included. As we point out, the structures are virtually identical (RMSD 0.6 Å) and therefore there are no further mechanistic insights we would like to make beyond the thorough discussion in the Chen et al paper.
Reviewer #1 (Recommendations for the authors):
(1) Line 65 - I don't think that the authors have tested binding experimentally, and so rather than 'still bind', I think that 'are still predicted to bind' is more appropriate.
Changed as suggested
(2) Line 69 - remove 'and'
Changed as suggested
(3) Line 111 - clarify that it is the protein chain which is 'identical'. Ligands not.
Changed to read ‘The cryo-EM structures of TbAQP2 (excluding the drugs/substrates) were virtually identical…
(4) Line 186 - make the heading of this section more descriptive of the conclusion than the technique?
We have changed the heading to read: ‘Molecular dynamics simulations show impaired pentamidine transport in mutants’
Reviewer #2 (Recommendations for the authors):
(1) Methods - a rate of 1 nm per ns is mentioned for pulling simulations, is that right?
Yes, for the generation of the initial frames for the umbrella sampling a pull rate of 1 nm/ns was used in either an upwards or downwards z-dimension
(2) Figure S9 and S10 have their captions swapped.
The captions have been swapped to their proper positions.
(3) Methods state "40 ns per window" yet also that "the first 50 ns of each window was discarded as equilibration".
Well spotted - this line should have read “the first 5 ns of each window was discarded as equilibration”. This has been corrected (line 541).
Reviewer #3 (Recommendations for the authors):
(1) Abstract, line 68-70: incomplete sentence.
The sentence has been re-written: ‘The structures of drug-bound TbAQP2 represent a novel paradigm for drug-transporter interactions and are a new mechanism for targeting drugs in pathogens and human cells.
(2) Line 312-313: The paper you mention here came out in May 2024 - a year ago. I appreciate that they reported similar structural data, but for the benefit of the readers and the field, I would recommend a more thorough account of the points by which the two pieces of work differ. Is there some knowledge that can be gleaned by looking at all the data in the two papers together? For example, you report a glycerol-bound structure while the other group provides an apo one. Are there any mechanistic insights that can be gained from a comparison?
We already made the comparisons that we felt were most pertinent and included a figure (Fig. 5) to show the difference in orientation of melarsoprol in the two structures. We do not feel that any additional comparison is sufficiently interesting to be included. As we point out, the structures are virtually identical (RMSD 0.6 Å) and therefore there are no further mechanistic insights we would like to make beyond the thorough discussion in the Chen et al paper.
(3) Similarly, you can highlight the findings from your MD simulations on the TbAQP2 drug resistance mutants, which are unique to your study. How can this data help with solving the drug resistance problem?
New drugs will need to be developed that can be transported by the mutant chimera AQP2s and the models from the MD simulations will provide a starting point for molecular docking studies. Further work will then be required in transport assays to optimise transport rather than merely binding. However, the fact that drug resistance can also arise through deletion of the AQP2 gene highlights the need for developing new drugs that target other proteins.
(4) A glaring question that one has as a reader is why you have not attempted to solve the structures of the drug resistance mutants, either in complex with the two compounds or in their apo/glycerol-bound form? To be clear, I am not requesting this data, but it might be a good idea to bring this up in the discussion.
TbAQP2 containing the drug-resistant mutants does not transport either melarsoprol or pentamidine (Munday et al., 2014; Alghamdi et al., 2020); there was thus no evidence to suggest that the mutant TbAQP2 channels could bind either drug. We therefore did not attempt to determine the structures of the mutant channels because we did not think that we would see any density for the drugs in the channel. Our MD data suggests that pentamidine binding affinity is in the range of 50-300 µM for the mutant TbAQP2, supporting the view that getting these structures would be highly challenging, but of course until the experiment is tried we will not know for sure.
We also do not think we would learn anything new about doing structures of the drug-free structures of the transport-negative mutants of TbAQP2. The MD simulations have given novel insights into why the drugs are not transported and we would rather expand effort in this direction and look at other mutants rather than expend further effort in determining new structures.
(5) Line 152-156: Is there a molecular explanation for why the TbAQP2 has 2 glycerol molecules captured in the selectivity filter while the PfAQP2 and the human AQP7 and AQP10 have 3?
The presence of glycerol molecules represents local energy minima for binding, which will depend on the local disposition of appropriate hydrogen bonding atoms and hydrophobic regions, in conjunction with the narrowness of the channel to effectively bind glycerol from all sides. It is noticeable that the extracellular region of the channel is wider in TbAQP2 than in AQP7 and AQP10, so this may be one reason why additional ordered glycerol molecules are absent, and only two are observed. Note also that the other structures were determined by X-ray crystallography, and the environment of the crystal lattice may have significantly decreased the rate of diffusion of glycerol, increasing the likelihood of observing their electron densities.
(6) I would also think about including the 8JY7 (TbAQP2 apo) structure in your analysis.
We included 8JY7 in our original analyses, but the results were identical to 8JY6 and 8JY8 in terms of the protein structure, and, in the absence of any modelled substrates in 8JY7 (the interesting part for our manuscript), we therefore have not included the comparison.
(7) I also think, given the importance of AQP3 in this context, it would be really useful to have a comparison with the AQP3 AlphaFold structure in order to examine why it does not permeate drugs.
We made an AlphaFold model of TbAQP3 and compared it to our structures of TbAQP2. The RMSD is 0.6 Å to the pentamidine-bound TbAQP2, suggesting that the fold of TbAQP3 has been predicted well, although the side chain rotamers cannot be assessed for their accuracy. Previous work has defined the selectivity filter of TbAQP3 to be formed by W102, R256, Y250. The superposition of the TbAQP3 model and the TbAQP2 pentamidine-bound structure shows that one of the amine groups is level with R256 and that there is a clash with Y250 and the backbone carbonyl of Y250, which deviates in position from the backbone of TbAQP2 in this region. There is also a clash with Ile252.
Although these observations are interesting, on their own they are preliminary in the extreme and extensive further work will be necessary to draw any convincing conclusions regarding these residues in preventing uptake of pentamidine and melarsoprol. The TbAQP3 AlphaFold model would need to be verified by MD simulations and then we would want to look at how pentamidine would interact with the channel under different experimental conditions like we have done with TbAQP2. We would then want to mutate to Ala each of the residues singly and in combination and assess them in uptake assays to verify data from the MD simulations. This is a whole new study and, given the uncertainties surrounding the observations of just superimposing TbAQP2 structure and the TbAQP3 model, we feel this is just too speculative to add to our manuscript.
(8) To validate the densities representing glycerol and the compounds, you should show halfmap densities for these.
A new figure, Fig S6 has been made to show the half-map densities for the glycerol and drugs.
(9) I would also like to see the density coverage of the individual helices/structural elements.
A new figure, Fig S5 has been made to show the densities for the structural elements.
(10) While the LigPlot figure is nice, I think showing the data (including the cryo-EM density) is necessary validation.
The LigPlot figure is a diagram (an interpretation of data) and does not need the densities as these have already been shown in Fig. 1c (the data).
(11) I would recommend including a figure that illustrates the points described in lines 123-134.
All of the points raised in this section are already shown in Fig. 2a, which was referred to twice in this section. We have added another reference to Fig.2a on lines 134-135 for completeness.
(12) Line 202: I would suggest using "membrane potential/voltage" to avoid confusion with mitochondrial membrane potential.
We have changed this to ‘plasma membrane potential’ to differentiate it from mitochondrial membrane potential.
(13) Figure 4: Label C.O.M. in the panels so that the figure corresponds to the legend.
We have altered the figure and added and explanation in the figure legend (lines 716-717):
‘Cyan mesh shows the density of the molecule across the MD simulation. and the asterisk shows the position of the centre of mass (COM).’
(14) Figure S2: Panels d and e appear too similar, and it is difficult to see the stick representation of the compound. I would recommend either using different colours or showing a close-up of the site.
We have clarified the figure by including two close-up views of the hot-spot region, one with melarsoprol overlaid and one with pentamidine overlaid
(15) Figure S2: Typo in legend: 8YJ7 should be 8JY7.
Changed as suggested
(16) Figure S3 and Figure S4: Please clarify which parts of the process were performed in cryoSPARC and which in Relion.
Figure S3 gives an overview of the processing and has been simplified to give the overall picture of the procedures. All of the details were included in the Methods section as other programmes are used, not just cryoSPARC and Relion. Given the complexities of the processing, we have referred the readers to the Methods section rather than giving confusing information in Fig. S3.
We have updated the figure legend to Fig. S4 as requested.
(17) Figure S9 and Figure S10: The legends are swapped in these two figures.
The captions have been swapped to their proper positions.
(18) For ease of orientation and viewing, I would recommend showing a vertical HOLE plot aligned with an image of the AQP2 pore.
The HOLE plot has been re-drawn as suggest (Fig. S2)
that individuals may belong to several discourse communities and (b) that individuals will vary in the number of discourse com- munities they belong to and hence in the number of genres they command.
discourse communities vary, but everyone belongs to something
hus, membership implies uptake of the informational opportunities. Individuals might pay an annual subscription to the Acoustical Society of America but if they never open any of its communications they can- not be said to belong to the discourse community, even though they are formally members of the society.
being active in the beliefs
A speech community is defined, then, tautologically but radically, as a community sharing knowledge of rules for the conduct and interpretation of speech.
not all speech communitys are the same
What can video ethnographic studies of family interactions in everyday, outdoor learning contexts (berry picking, fishing, forest walks, etc.) tell us about the multitude of ways that people go about making relations, or teaching and learning, about/with the natural world? What insights can we gain about learning by focusing on the organization of talk, action, and embodied movement in these learning environments?
This reminds me of my Gramma and my Mamaw, (her mom) who always took me on outings to the mountains, the beach, fishing and more because they both would always have a bag that we kept for trash. This bag was to make sure that we left the places we went to better than how we came across them. If that meant emptying our bag a couple of times then so be it but we never left trash if we came across something while we were out. My husband’s family was horrified that we picked up trash when we went out and just could not understand why we did. I taught this to my children and we all would forget sometimes to bring a bag then we would wash our finds that ended up in our pockets. It has become a bit of a laughing point because of all the little finds that come home with me. My son and I compare fishing hooks and lures that we find while fishing.
Moreover, increasing diversity in research endeavors can deepen our understanding of human potential and foster new forms of teaching and learning relationships that are emancipatory
Learning to think outside of the box for research can really give different perspectives about any subject and can be so liberating to pick things you would not normally learn about. In class I try to have the students learn about things they are interested in but do not have experience with. This way the students are not relying on ideas or information that they already know and have to go outside the comfort zone. We have also been doing this in the foods class I teach and it gives us so much more diversity.
If any person strike another on the head so that the brain appears, and the three bones which lie above the brain shall project, he shall be sentenced to 1200 denars, which make 30 shillings. 4. But if it shall have been between the ribs or in the stomach, so that the wound appears and reaches to the entrails, he shall be sentenced to 1200 denars-which make 30 shillings-besides five shillings for the physician's pay.
Severe injury to the stomach and head generates the same monetary penalty, which indicates that they are seen as equal in terms of losses. However, for an injury to the head, there is no extra penalty required for physician's pay. This is troubling as a head injury of this severity would most certainly give cause for medical treatment to at the very least treat the wound (in the likely case that there were no treatments for psychological or neurological damages). Perhaps they assumed that the person would succumb to their wounds in this case, but taking that perspective makes it difficult to rationalize them as equivalent losses. It is likely that an injury to the ribs or stomach might also cause the death of the individual during this time but it is strange that there is an acknowledgement of an attempt for treatment.
But if he shall have thrown him into a well or into the water, or shall have covered him with branches or anything else, to conceal him, he shall be sentenced to 24000 denars, which make 600 shillings.
Interesting shows a serious punishment for those who try to hide their crimes. Shows a likely level of leniency if one confessed to a crime and did not try and hide it.
If any one have slain a Roman who eats in the king's palace, and it have been proved on him, he shall be sentenced to 12000 denars, which make 300 shillings. 6. But if the Roman shall not have been a landed proprietor and table companion of the king, he who killed him shall be sentenced to 4000 denars, which make 100 shillings.
interesting that a Roman who owns land or is a table companion of the king is worth 3 times as much as a roman who is not one of the aforementioned things.
1 .If three men car off a free born girl, they shall be compelled to pay 30 shillings. 2. If there are more than three, each one shall pay five shillings.
Surprising. Why would the three men be required to pay 10 shillings each but if there are more than three they olny have to pay 5 each. The law makes no sense to me and is suprising.
2. But if he shall have thrown him into a well or into the water, or shall have covered him with branches or anything else, to conceal him, he shall be sentenced to 24000 denars, which make 600 shillings.
I find this law surprising, as it seems that hiding someone or a body is deemed much worse than if you just were to have killed someone. The punishment is triple the cost of normal murder.
3. But if a Frank have plundered a Roman, he shall be sentenced to 35 shillings.
I find this interesting, as it shows a lack of equality among the Franks and the Romans. Given that these are Frankish laws, it makes sense that the penalty towards them would be less compared to that of the average free man.
Elon Musk’s view expressed in that tweet is different than some of the ideas of the previous owners, who at least tried to figure out how to make Twitter’s algorithm support healthier conversation [k6].
This reminds me a lot of the original story of Justine Sacco's tweet. And as much as I vehemently disagree with Musk's views and rhetoric, him being open about the way the Twitter/X algorithm works is interesting to me. I previously said that social media doesn't benefit off of positive interactions, but rather being the paper on which arguments are written. And Musk outright states that, interaction, positive or negative, is interaction, and will boost content in that vein whether you like it or not, so as to try and elicit more participation from you.
There were at least two different mechanisms that S-C used to regulate the Power Space and I am unfamiliar with one of them. Start by taking off the bottom panel so you can see what's going on. Operate the power space while watching what is moving and then you should be able to understand what's involved. The system That i know switches out the regular escapement regulation (the dogs activated by key and spacebar linkages) for an independent one wherein the dogs are instead controlled by a fat rubber finger that gets diddled by a yoke that is powered by the otherwise free motion of the carriage. That's when it is working. Now, tho, it's not right. Most common fault is with the pivot for that linkage. See if that yoke feels sloppy. There is a white plastic screw with a divot in the inner end to hold and allow adjustment of the bearing of the yoke. That pivot screw is threaded through a hole in the frame and locked with a metal locknut and the thing loosens over the decades, allowing slop in controlling the dogs. If you're lucky the threads can be coaxed into holding a fresh adjustment. Do not force or overtighten it. Incidentally, the speed of the Power Space action can be adjusted by the position of that yoke hitting the rubber finger; that should not need adjustment, but keep it in mind. Your cause could be something else, but the normal operation of the escapement working with the keys and spacebar indicates that the escapement is basically OK. Cleaning never hurts, though.
https://www.reddit.com/r/typewriters/comments/1oi6808/space_runs_too_fast_with_loud_buzzing_sound_plz/ reply via u/ahelper
That is cultural practice. What do you do when someone comes over to your house? That is cultural practice. What do you do when you’re hungry? That is cultural practice.
I don't know why it took me this long to understand the fact that culture is literally in everything. It seems so normal to me but it may seem weird to other people from different cultures.
As adults, people often isolate themselves in a special room to brush their teeth in privacy. Even so, toothbrushing is a profoundly social act, relying on shared knowledge and observance of social norms for hygiene and health.
Brushing our teeth is a very unique action that humans take for hygiene because not many, if any, other animals brush their teeth. But we heavily rely on it every day to keep us keep and use it in our routines.
Of course, a wink can mean different things in different societies.
This reminded me of my great grandmother. She tends to joke and be silly often and when she does or even sometimes when shes not, she winks. About every time i see her, she is winking at me for something. I have never known anyone that does it as much as her and i believe it has to do with when she grew up because you dont see many people wink often today but in the 30s and 40s it was much more common
houses were rectangular buildings made of stone and clay with tiled roofs. Inside, a waist-high dividing wall marked off one-third of the house. This marked-off section, set lower than the rest of the house and paved with flagstones, was the stable, where animals were kept at night. A farming people, the Kabyle kept oxen, cows, donkeys, and mules.
It is interesting how there has been a change over time in the way we live and build out houses. Houses that would last decades used to be built out of clay and stones but now we have houses sometimes out of stone and brick but mostly wood and other various materials that are flimsier. Not to say houses aren't sturdy now but there is a change in the use in resources and materials as we've advanced in time.
Trump isn’t on the ballot in New Jersey this year, but he is one of the biggest forces in the state’s surprisingly competitive gubernatorial election.
Though not physically on the ballot, trump is heavily influencing this election.
The solution was for Fraser and his team to question every facet of their business
I have a personal belief that the answers to most questions are about 1 or 2 more "but why's" from finding a unique solution. This made me curious to see what other innovations could be uncovered if we just asked "why is it that way" to entrenced problems.
Open innovation can be organized into a more inclusive granting mechanism. In the past, nonprofits and other organizations would fund social enterprises by asking for a written proposal—but combining mentorship and crowdsourcing creates new opportunities and community solutions.
I can agree with this. I've done a kickstarter for some projects, and it led to me being able to build a community from my supporters.
Work with your team to generate 20 to 30
I saw many brainstorming techniques set 20 to 30 as an ideal number, but what's the difference between 10 and 20 to 30?
The solution was for Fraser and his team to question every facet of their business, including product packaging, pricing and advertising. The result was the world’s first baking soda and peroxide toothpaste, Mentadent, which was very successful.
I enjoyed this kind of thinking, every industry is tough to enter, but there usually are cracks within each industry where things can be improved. Looking at tings from this perspective allows you to find niche markets or discover a market that was alot bigger than you may have originally thought.
Picture prompts
I love this technique! Not only because it makes you think of an idea, but also because you have to think about how to draw it, and that gives you the opportunity to come up with even more ideas while you're drawing.
The facilitator tapes several pieces of paper to a wall. Each member of the group gets a marker. Participants write their ideas on a paper and then rotate, adding their thoughts
I like this idea but I wonder if it would bog down people who take longer to generate ideas. Not everyone works at the same pace, even in brainstorming. I know I would hope I was last in the order to make sure I had time to think.
Set a timer for five minutes and ask each participant to fill six to eight
The crazy eights activity seems useful, but I am would also go one step further and have the participants act in small teams, but while also avoiding co mingeling between teams. I think that ideas will come out in a "flow" that can chage direction based on things the participants may not even precieve. Seperating the teams would stop anyone person from influencing one another, even if it is accidental.
Worst ideas
I love that! A lot of times, it’s hard to immediately come up with what we want, but it’s easy to know what we want to avoid.
sketching technique that aims for quantity rather than quality; it’s about generating a vast number of ideas and is great for both designers and non-designers.
I question the emphasis on quantity because, if we have a handful of bad ideas, in what ways will they be useful for us? Maybe there us a reason why having a vast number of bad or mediocre ideas is helpful, but it is not clearly articulated in this piece.
They should consider everything that couldn’t work before you ask them “What can we do to make these ideas work better?”
I find this strategy very useful because, going back to the previous reading, this helps us eliminate the blinders by confronting the ideas we, deep down, know that will not work. It is, in a way, a goodbye ceremony, for ideas that we could hold dearly to our hearts but know that they don't appeal to a broad range of users and consumers.
Elite residences and temples were destroyed and burned during this period, suggesting extreme social unrest. Between 850 and 900, population dropped by 90%. People didn't die, though; they moved. Some to the north, others just away from cities and ceremonial culture.
It’s crazy how intense this time was! Elite homes and temples were burned down, showing there was major social unrest. Between 850 and 900, the population dropped by 90%, but most people didn’t die—they just left the cities and moved elsewhere to start new lives.
Courtesy of @Pelicram ❤ : Peli's Shellac Rescue Formula aka The Cowboy's Delight. This will help bring back a deeper black color shellaced panels which have been yellowed and damaged by UV over the years. With enough elbow grease it will remove the old shellac completely but it takes a very long time and you're likely to damage any decals present on the panel. In most cases the procedure described below will be sufficient to restore the appearance to an acceptable level. The recipe: 70% Light machine oil. 30% IPA (Isopropyl Alcohol) or White/Mineral Spirits. Ideally use an oil that is dissolved into the IPA/Mineral Spirits, if they settle into separate layers make sure you shake the mixture thoroughly before applying. Mix the oil and solvent in something like a dropper bottle or similar vessel for convenient application. Clean part with Fulgentin (Or general purpose cleaner of your choice) and wipe dry.,Apply oil/ipa mix to part and rub in lightly with clean microfiber cloth or shop towel. Use plenty of the mix, it should not feel dry.,Wipe with microfiber cloth after 15 minutes to get rid of any excess.,Do not apply any kind of wax (like Renessaince Wax) afterwards, from my testing it will bring back the haziness.
https://discord.com/channels/639936208734126107/639938269030907914/1302694827682697330
Pelicram's Shellac Rescue Formula aka The Cowboy's Delight.
This will help bring back a deeper black color shellaced panels which have been yellowed and damaged by UV over the years. With enough elbow grease it will remove the old shellac completely but it takes a very long time and you're likely to damage any decals present on the panel. In most cases the procedure described below will be sufficient to restore the appearance to an acceptable level.
The recipe: - 70% Light machine oil. - 30% IPA (Isopropyl Alcohol) or White/Mineral Spirits.
Ideally use an oil that is dissolved into the IPA/Mineral Spirits, if they settle into separate layers make sure you shake the mixture thoroughly before applying.
Mix the oil and solvent in something like a dropper bottle or similar vessel for convenient application.
- Clean part with Fulgentin (Or general purpose cleaner of your choice) and wipe dry.
- Apply oil/ipa mix to part and rub in lightly with clean microfiber cloth or shop towel. Use plenty of the mix, it should not feel dry.
- Wipe with microfiber cloth after 15 minutes to get rid of any excess.
- Do not apply any kind of wax (like Renessaince Wax) afterwards, from my testing it will bring back the haziness.
Most educators never open up a translanguaging space so that bilingual children can read themselves fully, as they do at home. This happens often even in dual-language bilingual classrooms, where the goal is supposed to be bilingualism and biliteracy
I think the distinction between bilingualism and translanguaging is important. Knowing multiple languages and have a comprehensive, culminating usage of them is different. School environments often encourage the usage of one or the other, but rarely both. Honestly, I didn't even know what translanguaging was until I took Education classes at UCI, and I think that is all the more reason to spread awareness of its benefits and foster it in students.
As a result, Gen Z borrowers have seen the steepest decline in credit scores of any age group this year. Their average FICO (Fair Isaac Corporation) score fell to 676 — well below the national average of 715
I don't really understand the logic of this. The story a man told in this article before this said he tried to get a credit card so that he could build his credit score and apply for apartments but when the price is so high to obtain a card and there as so many fees and taxes it makes it really hard for young people to get one. This really makes me realize I need to start building my credit as fast as possible.
In addition to the limited access to fi nancial aid opportunities, undocu-mented students are barred from participating in federally funded programs, such as TRIO and work-study. 3 Both of these programs are designed to assist low-income, fi rst-generation, and ethnic minority students. Because these programs receive federal funds, undocumented students are not entitled to participate. Despite the fact that an overwhelming majority of undoc-umented students fi t this description, they are ineligible for these critical services (Gonzales 2010). Additionally, exclusion from work-study limits students’ support systems on campus. Taken together, the inability to receive fi nancial aid and the exclusion from federally funded sources of support place undocumented students on a diffi cult path towards higher education
This section highlights how undocumented students are blocked from key support programs like TRIO, things like work-study, even though they often meet the same criteria as students who qualify. These programs are meant to help low-income, first-gen, and minority students, but because they’re federally funded, undocumented students are left out. Which sucks terribly. That means they miss out on both financial help and the chance to build support systems on campus. It’s so frustrating to see how students who need the most help are often the ones with the fewest resources and support. This problem we have to address together.
Now in her early 30s, Flor has been working for almost 20 years. She is isolated and under constant stress. Her undocumented status is a constant reminder of her limitations. Flor recalls, I’m obviously an older person now. I mean, I see things different today. Back then I wasn’t so much interested in being there, you know, in school. But when I think about it, there was no one there saying, “hey, I care about you and I want to help you stay in school”. I was needed by my family and I get that. I’d do anything for them, you know. Being in my situation I really didn’t see much of a future for myself. I wonder what would have happened to me if I had someone like that looking after me
This was interesting. Flor’s story shows how being undocumented can shape someone’s whole life, starting from school. She had to work from a young age to help her family, which made it hard to stay in school and feel supported. Looking back, she wishes someone had reached out and shown they had cared. Her words made me think about how many students feel alone and unseen, especially when they’re dealing with tough situations. As a future teacher, I want to help be that person who notices and supports students like Flor. Everyone deserves someone who believes in them and helps them see a beautiful future for themselves.
translanguagingas “the deployment of a speaker’s full linguis-tic repertoire without regard for watchful adher-ence to the socially and politically defined bound-aries of named
mixing languages or dialects not as an error, but smart way to use full language toolkit,
Lau is sometimes pre-sumed to have sanctioned the use of bilingualeducation, but it merely established the right ofnon-English-speaking children to receive accom-modations in learning English given its role asthe medium of instruction. Lau did not prescribebilingual education or a method of accommo-dation
accomodations for English proficiency reaffirm SAE as the norm
Reviewer #1 (Public review):
Summary:
Roseby and colleagues report on a body region-specific sensory control of the fly larval righting response, a body contortion performed by fly larvae to correct their posture when they find themselves in an inverted (dorsal side down) position. This is an important topic because of the general need for animals to move about in the correct orientation and the clever methodologies used in this paper to uncover the sensory triggers for the behavior. Several innovative methodologies are developed, including a body region-specific optogenetic approach along different axial positions of the larva, region-specific manipulation of surface contacts with the substrate, and a 'water unlocking' technique to initiate righting behaviors, a strength of the manuscript. The authors found that multidendritic neurons, particularly the daIV neurons, are necessary for righting behavior. The contribution of daIV neurons had been shown by the authors in a prior paper (Klann et al, 2021), but that study had used constitutive neuronal silencing. Here, the authors used acute inactivation to confirm this finding. Additionally, the authors describe an important role for anterior sensory neurons and a need for dorsal substrate contact. Conversely, ventral sensory elements inhibit the righting behavior, presumably to ensure that the ventral-side-down position dominates. They move on to test the genetic basis for righting behavior and, consistent with the regional specificity they observe, implicate sensory neuron expression of Hox genes Antennapedia and Abdominal-b in self-righting.
Strengths:
Strengths of this paper include the important question addressed and the elegant and innovative combination of methods, which led to clear insights into the sensory biology of self-righting, and that will be useful for others in the field. This is a substantial contribution to understanding how animals correct their body position. The manuscript is very clearly written and couched in interesting biology.
Limitations:
(1) The interpretation of functional experiments is complicated by the proposed excitatory and inhibitory roles of dorsal and ventral sensory neuron activity, respectively. So, while silencing of an excitatory (dorsal) element might slow righting, silencing of inputs that inhibit righting could speed the behavior. Silencing them together, as is done here, could nullify or mask important D-V-specific roles. Selective manipulation of cells along the D-V axis could help address this caveat.
(2) Prior studies from the authors implicated daIV neurons in the righting response. One of the main advances of the current manuscript is the clever demonstration of region-specific roles of sensory input. However, this is only confirmed with a general md driver, 190(2)80, and not with the subset-specific Gal4, so it is not clear if daIV sensory neurons are also acting in a regionally specific manner along the A-P axis.
(3) The manuscript is narrowly focused on sensory neurons that initiate righting, which limits the advance given the known roles for daIV neurons in righting. With the suite of innovative new tools, there is a missed opportunity to gain a more general understanding of how sensory neurons contribute to the righting response, including promoting and inhibiting righting in different regions of the larva, as well as aspects of proprioceptive sensing that could be necessary for righting and account for some of the observed effects of 109(2)80.
(4) Although the authors observe an influence of Hox genes in righting, the possible mechanisms are not pursued, resulting in an unsatisfying conclusion that these genes are somehow involved in a certain region-specific behavior by their region-specific expression. Are the cells properly maintained upon knockdown? Are axon or dendrite morphologies of the cells disrupted upon knockdown?
(5) There could be many reasons for delays in righting behavior in the various manipulations, including ineffective sensory 'triggering', incoherent muscle contraction patterns, initiation of inappropriate behaviors that interfere with righting sequencing, and deficits in sensing body position. The authors show that delays in righting upon silencing of 109(2)80 are caused by a switch to head casting behavior. Is this also the case for silencing of daIV neurons, Hox RNAi experiments, and silencing of CO neurons? Does daIII silencing reduce head casting to lead to faster righting responses?
(6) 109(2)80 is expressed in a number of central neurons, so at least some of the righting phenotype with this line could be due to silenced neurons in the CNS. This should at least be acknowledged in the manuscript and controlled for, if possible, with other Gal4 lines.
Other points
(7) Interpretation of roles of Hox gene expression and function in righting response should consider previous data on Hox expression and function in multidendritic neurons reported by Parrish et al. Genes and Development, 2007.
(8) The daIII silencing phenotype could conceivably be explained if these neurons act as the ventral inhibitors. Do the authors have evidence for or against such roles?
Reviewer #2 (Public review):
Summary
This work explores the relationship between body structure and behavior by studying self-righting in Drosophila larvae, a conserved behavior that restores proper orientation when turned upside-down. The authors first introduce a novel "water unlocking" approach to induce self-righting behavior in a controlled manner. Then, they develop a method for region-specific inhibition of sensory neurons, revealing that anterior, but not posterior, sensory neurons are essential for proper self-righting. Deep-learning-based behavioral analysis shows that anterior inhibition prolongs self-righting by shifting head movement patterns, indicating a behavioral switch rather than a mere delay. Additional genetic and molecular experiments demonstrate that specific Hox genes are necessary in sensory neurons, underscoring how developmental patterning genes shape region-specific sensory mechanisms that enable adaptive motor behaviors.
Strengths
The work of Roseby et al. does what it says on the tin. The experimental design is elegant, introducing innovative methods that will likely benefit the fly behavior community, and the results are robustly supported, without overstatement.
Weaknesses:
The manuscript is clearly written, flows smoothly, and features well-designed experiments. Nevertheless, there are areas that could be improved. Below is a list of suggestions and questions that, if addressed, would strengthen this work:
(1) Figure 1A illustrates the sequence of self-righting behavior in a first instar larva, while the experiments in the same figure are performed on third instar larvae. It would be helpful to clarify whether the sequence of self-righting movements differs between larval stages. Later on in the manuscript, experiments are conducted on first instar larvae without explanation for the choice of stage. Providing the rationale for using different larval stages would improve clarity.
(2) What was the genotype of the larvae used for the initial behavioral characterization (Figure 1)? It is assumed they were wild type or w1118, but this should be stated explicitly. This also raises the question of whether different wild-type strains exhibit this behavior consistently or if there is variability among them. Has this been tested?
(3) Could the observed slight leftward bias in movement angles of the tail (Figure 1I and S1) be related to the experimental setup, for example, the way water is added during the unlocking procedure? It would be helpful to include some speculation on whether the authors believe this preference to be endogenous or potentially a technical artifact.
(4) The genotype of the larvae used for Figure 2 experiments is missing.
(5) The experiment shown in Figure 2E-G reports the proportion of larvae exhibiting self-righting behavior. Is the self-righting speed comparable to that measured using the setup in Figure 1?
(6) Line 496 states: "However, the effect size was smaller than that for the entire multidendritic population, suggesting neurons other than the daIVs are important for self-righting". Although I agree that this is the more parsimonious hypothesis, an alternative interpretation of the observed phenomenon could be that the effect is not due to the involvement of other neuronal populations, but rather to stronger Gal4 expression in daIVs with the general driver compared to the specific one. Have the authors (or someone else) measured or compared the relative strengths of these two drivers?
(7) Is there a way to quantify or semi-quantify the expression of the Hox genes shown in Figure 6A? Also, was this experiment performed more than once (are there any technical replicates?), or was the amount of RNA material insufficient to allow replication?
(8) Since RNAi constructs can sometimes produce off-target effects, it is generally advisable to use more than one RNAi line per gene, targeting different regions. Given that Hox genes have been extensively studied, the RNAis used in Figure 6B are likely already characterized. If this were the case, it would strengthen the data to mention it explicitly and provide references documenting the specificity and knockdown efficiency of the Hox gene RNAis employed. For example, does Antp RNAi expression in the 109(2)80 domain decrease Antp protein levels in multidendritic anterior neurons in immunofluorescence assays?
(9) In addition to increasing self-righting time, does Antp downregulation also affect head casting behavior or head movement speed? A more detailed behavioral characterization of this genetic manipulation could help clarify how closely it relates to the behavioral phenotypes described in the previous experiments.
(10) Does down-regulation of Antp in the daIV domain also increase self-righting time?
A developmental continuum supports students as they move from concrete torepresentational to abstract reasoning.• Example: Understanding multiplication as “groups of” (concrete) leads to areamodels and arrays (representational), and eventually to symbolic work withvariables (abstract).1
YAY!!! Developmental in a good context. But also YAY for C-R-A. Hmm. Can my thing be doing this for higher levels?
Reviewer #1 (Public review):
The importance of RNA editing in producing protein diversity is a widespread process that can regulate how genes function in various cellular contexts. Despite the importance of the process, we still lack a thorough knowledge of the profile of RNA editing targets in known cells. Crane and colleagues take advantage of a recently acquired scRNAseq database for Drosophila type Ib and Is larval motoneurons and identify the RNA editing landscape that differs in those cells. They find both canonical (A --> I) and non-canonical sites and characterize the targets, their frequencies, and determine some of the "rules" that influence RNA editing. They compare their database with existing databases to determine a reliance on the most well-known deaminase enzyme ADAR, determine the activity-dependence of editing profiles, and identify editing sites that are specific to larval Drosophila, differing from adults. The authors also identify non-canonical editing sites, especially in the newly appreciated and identified regulator of synaptic plasticity, Arc1.
The paper represents a strong analysis of recently made RNAseq databases from their lab and takes a notable approach to integrate this with other databases that have been recently produced from other sources. One of the places where this manuscript succeeds is in a thorough approach to analyzing the considerable amount of data that is out there regarding RNAseq in these differing motoneurons, but also in comparing larvae to adults. This is a strong advance. It also enables the authors to begin to determine rules for RNA editing. From an analytical standpoint, this paper is a notable advance in seeking to provide a biological context for massive amounts of data in the field. Further, it addresses some biological aspects in comparing WT and adar mutants to assess one potential deaminase, addresses activity-dependence, and begins to reveal profiles of canonical and non-canonical editing.
Reviewer #3 (Public review):
Summary:
The study consists of extensive computational analyses of their previously released Patch-seq data on single MN1-Ib and MNISN-Is neurons. The authors demonstrate the diversity of A>I editing events at single-cell resolution in two different neuronal cell types, identifying numerous A>I editing events that vary in their proportion, including those that cause missense mutations in conserved amino acids. They also consider "noncanonical" edits, such as C>T and G>A, and integrate publicly available data to support these analyses.
In general, the study contains a valuable resource to assess RNA editing in single neurons and opens several questions regarding the diversity and functional implications of RNA editing at single-cell resolution. The conclusions from the study are generally supported by their data; however, the study is currently based on computational predictions and would therefore benefit from experimentation to support their hypotheses and demonstrate the effects of the editing events identified on neuronal function and phenotype.
Strengths:
The study uses samples that are technically difficult to prepare to assess cell-type-specific RNA editing events in a natural model. The study also uses public data from different developmental stages that demonstrate the importance of considering cell type and developmental stage-specific RNA regulation. These critical factors, particularly that of developmental timing, are often overlooked in mechanistic studies.
Extensive computational analysis, using public pipelines, suitable filtering criteria, and accessible custom code, identifies a number of RNA editing events that have the potential to impact conserved amino acids and have subsequent effects on protein function. These observations are supported through the integration of several public data sets to investigate the occurrence of the edits in other data sets, with many identified across multiple data sets. This approach allowed the identification of a number of novel A>I edits, some of which appear to be specific to this study, suggesting cell/developmental specificity, whilst others are present in the public data sets but went unannotated.
The study also considers the role of Adar in the generation of A>I edits, as would be expected, by assessing the effect of Adar expression on editing rates using public data from adar mutant tissue to demonstrate that the edits conserved between experiments are mainly Adar-sensitive. This would be stronger if the authors also performed Patch-seq experiments in adar mutants to increase confidence in the identified edit sites.
Weaknesses:
Whilst the study makes interesting observations using advanced computational approaches, it does not demonstrate the functional implications of the observed editing events. The functional impact of the edits is inferred from either the nature of the change to the coding sequence and the amino acid conservation, or through integration of other data sets. Although these could indeed imply function, further experimentation would be required to confirm such as using their Alphafold models to predict any changes in structure. This limitation is acknowledged by the authors, but the overall strength of the interpretation of the analysis could be softened to represent this.
The study uses public data from more diverse cellular populations to confirm the role of Adar in introducing the A>I edits. Whilst this is convincing, the ideal comparison to support the mechanism behind the identified edits would be to perform patch-seq experiments on 1b or 1s neurons from adar mutants. However, although this should be considered when interpreting the data, these experiments would be a large amount of work and beyond the scope of the paper.
By focusing on the potential impact of editing events that cause missense mutations in the CDS, the study may overlook the importance of edits in noncoding regions, which may impact miRNA or RNA-binding protein target sites. Further, the statement that noncanonical edits and those that induce silent mutations are likely to be less impactful is very broad and should be reconsidered. This is particularly the case when suggesting that silent mutations may not impact the biology. Given the importance of codon usage in translational fidelity, it is possible that silent mutations induced by either A>I or noncanonical editing in the CDS impact translation efficiency. Indeed, this could have a greater impact on protein production and transcript levels than a single amino acid change alone.
Author response:
Reviewer #1:
Indicated the paper provided a strong analysis of RNAseq databases to provide a biological context and resource for the massive amounts of data in the field on RNA editing. The reviewer noted that future studies will be important to define the functional consequences of the individual edits and why the RNA editing rules we identified exist. We address these comments below.
(1) The reviewer wondered about the role of noncanonical editing to neuronal protein expression.
Indeed, the role of noncanonical editing has been poorly studied compared to the more common A-to-I ADAR-dependent editing. Most non-canonical coding edits we found actually caused silent changes at the amino acid level, suggesting evolutionary selection against this mechanism as a pathway for generating protein diversity. As such, we suspect that most of these edits are not altering neuronal function in significant ways. Two potential exceptions to this were non-canonical edits that altered conserved residues in the synaptic proteins Arc1 and Frequenin 1. The C-to-T coding edit in the activity-regulated Arc1 mRNA that encodes a retroviral-like Gag protein involved in synaptic plasticity resulted in a P124L amino acid change (see Author response image 1 panel A below). ~50% of total Arc1 mRNA was edited at this site in both Ib and Is neurons, suggesting a potentially important role if the P124L change alters Arc1 structure or function. Given Arc1 assembles into higher order viral-like capsids, this change could alter capsid formation or structure. Indeed, P124 lies in the hinge region separating the N- and C-terminal capsid assembly regions (panel B) and we hypothesize this change will alter the ability of Arc1 capsids to assemble properly. We plan to experimentally test this by rescuing Arc1 null mutants with edited versus unedited transgenes to see how the previously reported synaptic phenotypes are modified. We also plan to examine the ability of the change to alter Arc1 capsid assembly in a collaboration using CyroEM.
Author response image 1.
A. AlphaFold predictions of Drosophila Arc1 and Frq1 with edit site noted. B. Structure of the Drosophila Arc1 capsid. Monomeric Arc1 conformation within the capsid is shown on the right with the location of the edit site indicated.
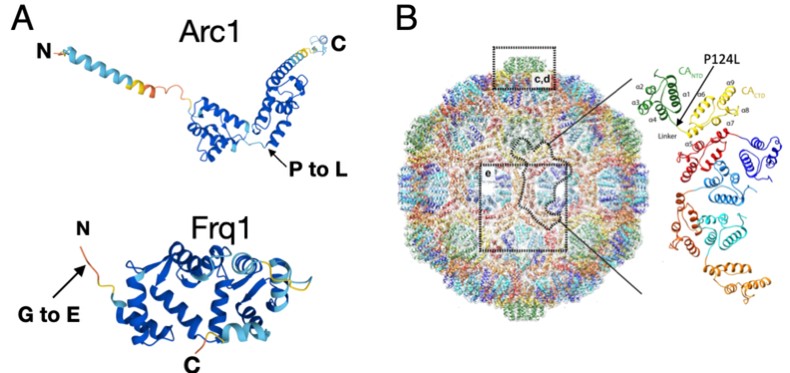
The other non-canonical edit (G-to-A) that stood out was in Frequenin 1 (Frq1), a multi-EF hand containing Ca<sup>2+</sup> binding protein that regulates synaptic transmission, that resulted in a G2E amino acid substitution (location within Frq1shown in panel A above). This glycine residue is conserved in all Frq homologs and is the site of N-myristoylation, a co-translational lipid modification to the glycine after removal of the initiator methionine by an aminopeptidase. Myristoylation tethers Frq proteins to the plasma membrane, with a Ca<sup>2+</sup>-myristoyl switch allowing some family members to cycle on and off membranes when the lipid domain is sequestered in the absence of Ca<sup>2+</sup>. Although the G2E edit is found at lower levels (20% in Ib MNs and 18% in Is MNs), it could create a pool of soluble Frq1 that alters it’s signaling. We plan to functionally assay the significance of this non-canonical edit as well. Compared to edits that alter amino acid sequence, determining how non canonical editing of UTRs might regulate mRNA dynamics is a harder question at this stage and will require more experimental follow-up.
(2) The reviewer noted the last section of the results might be better split into multiple parts as it reads as a long combination of two thoughts.
We agree with the reviewer that the last section is important, but it was disconnected a bit from the main story and was difficult for us to know exactly where to put it. All the data to that point in the paper was collected from our own PatchSeq analysis from individual larval motoneurons. We wanted to compare these results to other large RNAseq datasets obtained from pooled neuronal populations and felt it was best to include this at the end of the results section, as it no longer related to the rules of RNA editing within single neurons. We used these datasets to confirm many of our edits, as well as find evidence for some developmental and neuron-specific cell type edits. We also took advantage of RNAseq from neuronal datasets with altered activity to explore how activity might alter the editing machinery. We felt it better to include that data in this final section given it was not collected from our original PatchSeq approach.
Reviewer #2:
Noted the study provided a unique opportunity to identify RNA editing sites and rates specific to individual motoneuron subtypes, highlighting the RNAseq data was robustly analyzed and high-confidence hits were identified and compared to other RNAseq datasets. The reviewer provided some suggestions for future experiments and requested a few clarifications.
(1) The reviewer asked about Figure 1F and the average editing rate per site described later in the paper.
Indeed, Figure 1F shows the average editing rate for each individual gene for all the Ib and Is cells, so we primarily use that to highlight the variability we find in overall editing rate from around 20% for some sites to 100% for others. The actual editing rate for each site for individual neurons is shown in Figure 4D that plots the rate for every edit site and the overall sum rate for that neuron in particular.
(2) The reviewer also noted that it was unclear where in the VNC the individual motoneurons were located and how that might affect editing.
The precise segment of the larvae for every individual neuron that was sampled by Patch-seq was recorded and that data is accessible in the original Jetti et al 2023 paper if the reader wants to explore any potential anterior to posterior differences in RNA editing. Due to the technical difficulty of the Patch-seq approach, we pooled all the Ib and Is neurons from each segment together to get more statistical power to identify edit sites. We don’t believe segmental identify would be a major regulator of RNA editing, but cannot rule it out.
(3) The reviewer also wondered if including RNAs located both in the nucleus and cytoplasm would influence editing rate.
Given our Patch-seq approach requires us to extract both the cytoplasm and nucleus, we would be sampling both nuclear and cytoplasmic mRNAs. However, as shown in Figure 8 – figure supplement 3 D-F, the vast majority of our edits are found in both polyA mRNA samples and nascent nuclear mRNA samples from other datasets, indicating the editing is occurring co-transcriptionally and within the nucleus. As such, we don't think the inclusion of cytoplasmic mRNA is altering our measured editing rates for most sites. This may not be true for all non-canonical edits, as we did see some differences there, indicating some non-canonical editing may be happening in the cytoplasm as well.
Reviewer #3:
indicated the work provided a valuable resource to access RNA editing in single neurons. The reviewer suggested the value of future experiments to demonstrate the effects of editing events on neuronal function. This will be a major effort for us going forwards, as we indeed have already begun to test the role of editing in mRNAs encoding several presynaptic proteins that regulate synaptic transmission. The reviewer also had several other comments as discussed below.
(1) The reviewer noted that silent mutations could alter codon usage that would result in translational stalling and altered protein production.
This is an excellent point, as silent mutations in the coding region could have a more significant impact if they generate non-preferred rare codons. This is not something we have analyzed, but it certainly is worth considering in future experiments. Our initial efforts are on testing the edits that cause predictive changes in presynaptic proteins based on the amino acid change and their locale in important functional domains, but it is worth considering the silent edits as well as we think about the larger picture of how RNA editing is likely to impact not only protein function but also protein levels.
(2) The reviewer noted future studies could be done using tools like Alphafold to test if the amino acid changes are predicted to alter the structure of proteins with coding edits.
This is an interesting approach, though we don’t have much expertise in protein modeling at that level. We could consider adding this to future studies in collaboration with other modeling labs.
(3) The reviewer wondered if the negative correlation between edits and transcript abundance could indicate edits might be destabilizing the transcripts.
This is an interesting idea, but would need to be experimentally tested. For the few edits we have generated already to begin functionally testing, including our published work with editing in the C-terminus of Complexin, we haven’t seen a change in mRNA levels causes by these edits. However, it would not be surprising to see some edits reducing transcript levels. A set of 5’UTR edits we have generated in Syx1A seem to be reducing protein production and may be acting in such a manner.
(4) The reviewer wondered if the proportion of edits we report in many of the figures is normalized to the length of the transcript, as longer transcripts might have more edits by chance.
The figures referenced by the reviewer (1, 2 and 7) show the number of high-confidence editing sites that fall into the 5’ UTR, 3’ UTR, or CDS categories. Our intention here was to highlight that the majority of the high confidence edits that made it through the stringent filtering process were in the coding region. This would still be true if we normalized to the length of the given gene region. However, it would be interesting to know if these proportions match the expected proportions of edits in these gene regions given a random editing rate per gene region length across the Drosophila genome, although we did not do this analysis.
(5) The reviewer noted that future studies could expand on the work to examine miRNA or other known RBP binding sites that might be altered by the edits.
This is another avenue we could pursue in the future. We did do this analysis for a few of the important genes encoding presynaptic proteins (these are the most interesting to us given the lab’s interest in the synaptic vesicle fusion machinery), but did not find anything obvious for this smaller subset of targets.
(6) The reviewer suggested sequence context for Adar could also be investigated for the hits we identified.
We haven’t pursued this avenue yet, but it would be of interest to do in the future. In a similar vein, it would be informative to identify intron-exon base pairing that could generate the dsDNA template on which ADAR acts.
(7) The reviewer noted the disconnect between Adar mRNA levels and overall editing levels reported in Figure 4A/B.
Indeed, the lack of correlation between overall editing levels and Adar mRNA abundance has been noted previously in many studies. For the type of single cell Patch-seq approach we took to generate our RNAseq libraries, the absolute amount of less abundant transcripts obtained from a single neuron can be very noisy. As such, the few neurons with no detectable Adar mRNA are likely to represent that single neuron noise in the sampling. Per the reviewer’s question, these figure panels only show A-to-I edits, so they are specific to ADAR.
(8) The reviewer notes the scale in Figure 5D can make it hard to visualize the actual impact of the changes.
The intention of Figure 5D was to address the question of whether sites with high Ib/Is editing differences were simply due to higher Ib or Is mRNA expression levels. If this was the case, then we would expect to see highly edited sites have large Ib/Is TPM differences. Instead, as the figure shows, the vast majority of highly-edited sites were in mRNAs that were NOT significantly different between Ib and Is (red dots in graph) and are therefore clustered together near “0 Difference in TPMs”. TPMs and editing levels for all edit sites can be found in Table 1, and a visualization of these data for selected sites is shown in Figure 5E.
Some educators and administrators still see professional skillsas a bonus, or a logical outcome from learning technical skills.They also assume they’re too subjective to teach or measure(which we’ve proven is not the case thanks to tools like SJTs).But as this report has shown, the lack of professional skillsdevelopment has graduates struggling to communicate, adapt,and lead in today’s workforce—skills that are particularlyimportant in today’s AI-driven workforce.The Opportunity: Provide faculty and staff with professionaldevelopment that underscores the importance of professionalskills and equips them with effective methods to assess anddevelop these skills. By learning how to measure and developthese skills, faculty can better integrate professional skillsevaluation into coursework, and ensure graduates have thecompetencies employers demand
Difficult to assess (and impossible at scale) is proving to be a myth. It's doable, we just have to want to.
During the early Archaic period, Greek cemeteries became larger, but grave goods decreased.
citation
Author response:
The following is the authors’ response to the current reviews.
Reviewer #1 (Public review):
In this manuscript, Hoon Cho et al. present a novel investigation into the role of PexRAP, an intermediary in ether lipid biosynthesis, in B cell function, particularly during the Germinal Center (GC) reaction. The authors profile lipid composition in activated B cells both in vitro and in vivo, revealing the significance of PexRAP. Using a combination of animal models and imaging mass spectrometry, they demonstrate that PexRAP is specifically required in B cells. They further establish that its activity is critical upon antigen encounter, shaping B cell survival during the GC reaction. Mechanistically, they show that ether lipid synthesis is necessary to modulate reactive oxygen species (ROS) levels and prevent membrane peroxidation.
Highlights of the Manuscript:
The authors perform exhaustive imaging mass spectrometry (IMS) analyses of B cells, including GC B cells, to explore ether lipid metabolism during the humoral response. This approach is particularly noteworthy given the challenge of limited cell availability in GC reactions, which often hampers metabolomic studies. IMS proves to be a valuable tool in overcoming this limitation, allowing detailed exploration of GC metabolism.
The data presented is highly relevant, especially in light of recent studies suggesting a pivotal role for lipid metabolism in GC B cells. While these studies primarily focus on mitochondrial function, this manuscript uniquely investigates peroxisomes, which are linked to mitochondria and contribute to fatty acid oxidation (FAO). By extending the study of lipid metabolism beyond mitochondria to include peroxisomes, the authors add a critical dimension to our understanding of B cell biology.
Additionally, the metabolic plasticity of B cells poses challenges for studying metabolism, as genetic deletions from the beginning of B cell development often result in compensatory adaptations. To address this, the authors employ an acute loss-of-function approach using two conditional, cell-type-specific gene inactivation mouse models: one targeting B cells after the establishment of a pre-immune B cell population (Dhrs7b^f/f, huCD20-CreERT2) and the other during the GC reaction (Dhrs7b^f/f; S1pr2-CreERT2). This strategy is elegant and well-suited to studying the role of metabolism in B cell activation.
Overall, this manuscript is a significant contribution to the field, providing robust evidence for the fundamental role of lipid metabolism during the GC reaction and unveiling a novel function for peroxisomes in B cells.
Comments on revisions:
There are still some discrepancies in gating strategies. In Fig. 7B legend (lines 1082-1083), they show representative flow plots of GL7+ CD95+ GC B cells among viable B cells, so it is not clear if they are IgDneg, as the rest of the GC B cells aforementioned in the text.
We apologize for missing this item in need of correction in the revision and sincerely thank the reviewer for the stamina and care in picking this up. The data shown in Fig. 7B represented cells (events) in the IgD<sup>neg</sup> Dump<sup>neg</sup> viable lymphoid gate. We will correct this omission/blemish in the final revision that becomes the version of record.
Western blot confirmation: We understand the limitations the authors enumerate. Perhaps an RT-qPCR analysis of the Dhrs7b gene in sorted GC B cells from the S1PR2-CreERT2 model could be feasible, as it requires a smaller number of cells. In any case, we agree with the authors that the results obtained using the huCD20-CreERT2 model are consistent with those from the S1PR2-CreERT2 model, which adds credibility to the findings and supports the conclusion that GC B cells in the S1PR2-CreERT2 model are indeed deficient in PexRAP.
We will make efforts to go back through the manuscript and highlight this limitation to readers, i.e., that we were unable to get genetic evidence to assess what degree of "counter-selection" applied to GC B cells in our experiments.
We agree with the referee that optimally to support the Imaging Mass Spectrometry (IMS) data showing perturbations of various ether lipids within GC after depletion of PexRAP, it would have been best if we could have had a qRT2-PCR that allowed quantitation of the Dhrs7b-encoded mRNA in flow-purified GC B cells, or the extent to which the genomic DNA of these cells was in deleted rather than 'floxed' configuration.
While the short half-life of ether lipid species leads us to infer that the enzymatic function remains reduced/absent, it definitely is unsatisfying that the money for experiments ran out in June and the lab members had to move to new jobs.
Lines 222-226: We believe the correct figure is 4B, whereas the text refers to 4C.
As for the 1st item, we apologize and will correct this error.
Supplementary Figure 1 (line 1147): The figure title suggests that the data on T-cell numbers are from mice in a steady state. However, the legend indicates that the mice were immunized, which means the data are not from steady-state conditions.
We will change the wording both on line 1147 and 1152.
Reviewer #2 (Public review):
Summary:
In this study, Cho et al. investigate the role of ether lipid biosynthesis in B cell biology, particularly focusing on GC B cell, by inducible deletion of PexRAP, an enzyme responsible for the synthesis of ether lipids.
Strengths:
Overall, the data are well-presented, the paper is well-written and provides valuable mechanistic insights into the importance of PexRAP enzyme in GC B cell proliferation.
Weaknesses:
More detailed mechanisms of the impaired GC B cell proliferation by PexRAP deficiency remain to be further investigated. In minor part, there are issues for the interpretation of the data which might cause confusions by readers.
Comments on revisions:
The authors improved the manuscript appropriately according to my comments.
To re-summarize, we very much appreciate the diligence of the referees and Editors in re-reviewing this work at each cycle and helping via constructive peer review, along with their favorable comments and overall assessments. The final points will be addressed with minor edits since there no longer is any money for further work and the lab people have moved on.
The following is the authors’ response to the original reviews.
Reviewer #1 (Public review):
In this manuscript, Sung Hoon Cho et al. presents a novel investigation into the role of PexRAP, an intermediary in ether lipid biosynthesis, in B cell function, particularly during the Germinal Center (GC) reaction. The authors profile lipid composition in activated B cells both in vitro and in vivo, revealing the significance of PexRAP. Using a combination of animal models and imaging mass spectrometry, they demonstrate that PexRAP is specifically required in B cells. They further establish that its activity is critical upon antigen encounter, shaping B cell survival during the GC reaction.
Mechanistically, they show that ether lipid synthesis is necessary to modulate reactive oxygen species (ROS) levels and prevent membrane peroxidation.
Highlights of the Manuscript:
The authors perform exhaustive imaging mass spectrometry (IMS) analyses of B cells, including GC B cells, to explore ether lipid metabolism during the humoral response. This approach is particularly noteworthy given the challenge of limited cell availability in GC reactions, which often hampers metabolomic studies. IMS proves to be a valuable tool in overcoming this limitation, allowing detailed exploration of GC metabolism.
The data presented is highly relevant, especially in light of recent studies suggesting a pivotal role for lipid metabolism in GC B cells. While these studies primarily focus on mitochondrial function, this manuscript uniquely investigates peroxisomes, which are linked to mitochondria and contribute to fatty acid oxidation (FAO). By extending the study of lipid metabolism beyond mitochondria to include peroxisomes, the authors add a critical dimension to our understanding of B cell biology.
Additionally, the metabolic plasticity of B cells poses challenges for studying metabolism, as genetic deletions from the beginning of B cell development often result in compensatory adaptations. To address this, the authors employ an acute loss-of-function approach using two conditional, cell-type-specific gene inactivation mouse models: one targeting B cells after the establishment of a pre-immune B cell population (Dhrs7b^f/f, huCD20-CreERT2) and the other during the GC reaction (Dhrs7b^f/f; S1pr2-CreERT2). This strategy is elegant and well-suited to studying the role of metabolism in B cell activation.
Overall, this manuscript is a significant contribution to the field, providing robust evidence for the fundamental role of lipid metabolism during the GC reaction and unveiling a novel function for peroxisomes in B cells.
We appreciate these positive reactions and response, and agree with the overview and summary of the paper's approaches and strengths.
However, several major points need to be addressed:
Major Comments:
Figures 1 and 2
The authors conclude, based on the results from these two figures, that PexRAP promotes the homeostatic maintenance and proliferation of B cells. In this section, the authors first use a tamoxifen-inducible full Dhrs7b knockout (KO) and afterwards Dhrs7bΔ/Δ-B model to specifically characterize the role of this molecule in B cells. They characterize the B and T cell compartments using flow cytometry (FACS) and examine the establishment of the GC reaction using FACS and immunofluorescence. They conclude that B cell numbers are reduced, and the GC reaction is defective upon stimulation, showing a reduction in the total percentage of GC cells, particularly in the light zone (LZ).
The analysis of the steady-state B cell compartment should also be improved. This includes a more detailed characterization of MZ and B1 populations, given the role of lipid metabolism and lipid peroxidation in these subtypes.
Suggestions for Improvement:
B Cell compartment characterization: A deeper characterization of the B cell compartment in non-immunized mice is needed, including analysis of Marginal Zone (MZ) maturation and a more detailed examination of the B1 compartment. This is especially important given the role of specific lipid metabolism in these cell types. The phenotyping of the B cell compartment should also include an analysis of immunoglobulin levels on the membrane, considering the impact of lipids on membrane composition.
Although the manuscript is focused on post-ontogenic B cell regulation in Ab responses, we believe we will be able to polish a revised manuscript through addition of results of analyses suggested by this point in the review: measurement of surface IgM on and phenotyping of various B cell subsets, including MZB and B1 B cells, to extend the data in Supplemental Fig 1H and I. Depending on the level of support, new immunization experiments to score Tfh and analyze a few of their functional molecules as part of a B cell paper may be feasible.
Addendum / update of Sept 2025: We added new data with more on MZB and B1 B cells, surface IgM, and on Tfh populations.
GC Response Analysis Upon Immunization: The GC response characterization should include additional data on the T cell compartment, specifically the presence and function of Tfh cells. In Fig. 1H, the distribution of the LZ appears strikingly different. However, the authors have not addressed this in the text. A more thorough characterization of centroblasts and centrocytes using CXCR4 and CD86 markers is needed.
The gating strategy used to characterize GC cells (GL7+CD95+ in IgD− cells) is suboptimal. A more robust analysis of GC cells should be performed in total B220+CD138− cells.
We first want to apologize the mislabeling of LZ and DZ in Fig 1H. The greenish-yellow colored region (GL7<sup>+</sup> CD35<sup>+</sup>) indicate the DZ and the cyan-colored region (GL7<sup>+</sup> CD35<sup>+</sup>) indicates the LZ. Addendum / update of Sept 2025: We corrected the mistake, and added new experimental data using the CD138 marker to exclude preplasmablasts.
As a technical note, we experienced high background noise with GL7 staining uniquely with PexRAP deficient (Dhrs7b<sup>f/f</sup>; Rosa26-CreER<sup>T2</sup>) mice (i.e., not WT control mice). The high background noise of GL7 staining was not observed in B cell specific KO of PexRAP (Dhrs7b<sup>f/f</sup>; huCD20-CreER<sup>T2</sup>). Two formal possibilities to account for this staining issue would be if either the expression of the GL7 epitope were repressed by PexRAP or the proper positioning of GL7<sup>+</sup> cells in germinal center region were defective in PexRAPdeficient mice (e.g., due to an effect on positioning cues from cell types other than B cells). In a revised manuscript, we will fix the labeling error and further discuss the GL7 issue, while taking care not to be thought to conclude that there is a positioning problem or derepression of GL7 (an activation antigen on T cells as well as B cells).
While the gating strategy for an overall population of GC B cells is fairly standard even in the current literature, the question about using CD138 staining to exclude early plasmablasts (i.e., analyze B220<sup>+</sup> CD138<sup>neg</sup> vs B220<sup>+</sup> CD138<sup>+</sup>) is interesting. In addition, some papers like to use GL7<sup>+</sup> CD38<sup>neg</sup> for GC B cells instead of GL7<sup>+</sup> Fas (CD95)<sup>+</sup>, and we thank the reviewer for suggesting the analysis of centroblasts and centrocytes. For the revision, we will try to secure resources to revisit the immunizations and analyze them for these other facets of GC B cells (including CXCR4/CD86) and for their GL7<sup>+</sup> CD38<sup>neg</sup>. B220<sup>+</sup> CD138<sup>-</sup> and B220<sup>+</sup> CD138<sup>+</sup> cell populations.
We agree that comparison of the Rosa26-CreERT2 results to those with B cell-specific lossof-function raise a tantalizing possibility that Tfh cells also are influenced by PexRAP. Although the manuscript is focused on post-ontogenic B cell regulation in Ab responses, we hope to add a new immunization experiments that scores Tfh and analyzes a few of their functional molecules could be added to this B cell paper, depending on the ability to wheedle enough support / fiscal resources.
Addendum / update of Sept 2025: Within the tight time until lab closure, and limited $$, we were able to do experiments that further reinforced the GC B cell data - including stains for DZ vs LZ sub-subsetting - and analyzed Tfh cells. We were not able to explore changes in functional antigenic markers on the GC B or Tfh cells.
The authors claim that Dhrs7b supports the homeostatic maintenance of quiescent B cells in vivo and promotes effective proliferation. This conclusion is primarily based on experiments where CTV-labeled PexRAP-deficient B cells were adoptively transferred into μMT mice (Fig. 2D-F). However, we recommend reviewing the flow plots of CTV in Fig. 2E, as they appear out of scale. More importantly, the low recovery of PexRAP-deficient B cells post-adoptive transfer weakens the robustness of the results and is insufficient to conclusively support the role of PexRAP in B cell proliferation in vivo.
In the revision, we will edit the text and try to adjust the digitized cytometry data to allow more dynamic range to the right side of the upper panels in Fig. 2E, and otherwise to improve the presentation of the in vivo CTV result. However, we feel impelled to push back respectfully on some of the concern raised here. First, it seems to gloss over the presentation of multiple facets of evidence. The conclusion about maintenance derives primarily from Fig. 2C, which shows a rapid, statistically significant decrease in B cell numbers (extending the finding of Fig. 1D, a more substantial decrease after a bit longer a period). As noted in the text, the rate of de novo B cell production does not suffice to explain the magnitude of the decrease.
In terms of proliferation, we will improve presentation of the Methods but the bottom line is that the recovery efficiency is not bad (comparing to prior published work) inasmuch as transferred B cells do not uniformly home to spleen. In a setting where BAFF is in ample supply in vivo, we transferred equal numbers of cells that were equally labeled with CTV and counted B cells. The CTV result might be affected by lower recovered B cell with PexRAP deficiency, generally, the frequencies of CTV<sup>low</sup> divided population are not changed very much. However, it is precisely because of the pitfalls of in vivo analyses that we included complementary data with survival and proliferation in vitro. The proliferation was attenuated in PexRAP-deficient B cells in vitro; this evidence supports the conclusion that proliferation of PexRAP knockout B cells is reduced. It is likely that PexRAP deficient B cells also have defect in viability in vivo as we observed the reduced B cell number in PexRAP-deficient mice. As the reviewer noticed, the presence of a defect in cycling does, in the transfer experiments, limit the ability to interpret a lower yield of B cell population after adoptive transfer into µMT recipient mice as evidence pertaining to death rates. We will edit the text of the revision with these points in mind.
In vitro stimulation experiments: These experiments need improvement. The authors have used anti-CD40 and BAFF for B cell stimulation; however, it would be beneficial to also include antiIgM in the stimulation cocktail. In Fig. 2G, CTV plots do not show clear defects in proliferation, yet the authors quantify the percentage of cells with more than three divisions. These plots should clearly display the gating strategy. Additionally, details about histogram normalization and potential defects in cell numbers are missing. A more in-depth analysis of apoptosis is also required to determine whether the observed defects are due to impaired proliferation or reduced survival.
As suggested by reviewer, testing additional forms of B cell activation can help explore the generality (or lack thereof) of findings. We plan to test anti-IgM stimulation together with anti-CD40 + BAFF as well as anti-IgM + TLR7/8, and add the data to a revised and final manuscript.
Addendum / update of Sept 2025: The revision includes results of new experiments in which anti-IgM was included in the stimulation cocktail, as well as further data on apoptosis and distinguishing impaired cycling / divisions from reduced survival .
With regards to Fig. 2G (and 2H), in the revised manuscript we will refine the presentation (add a demonstration of the gating, and explicate histogram normalization of FlowJo).
It is an interesting issue in bioscience, but in our presentation 'representative data' really are pretty representative, so a senior author is reminded of a comment Tak Mak made about a reduction (of proliferation, if memory serves) to 0.7 x control. [His point in a comment to referees at a symposium related that to a salary reduction by 30% :) A mathematical alternative is to point out that across four rounds of division for WT cells, a reduction to 0.7x efficiency at each cycle means about 1/4 as many progeny.]
We will try to edit the revision (Methods, Legends, Results, Discussion] to address better the points of the last two sentences of the comment, and improve the details that could assist in replication or comparisons (e.g., if someone develops a PexRAP inhibitor as potential therapeutic).
For the present, please note that the cell numbers at the end of the cultures are currently shown in Fig 2, panel I. Analogous culture results are shown in Fig 8, panels I, J, albeit with harvesting at day 5 instead of day 4. So, a difference of ≥ 3x needs to be explained. As noted above, a division efficiency reduced to 0.7x normal might account for such a decrease, but in practice the data of Fig. 2I show that the number of PexRAP-deficient B cells at day 4 is similar to the number plated before activation, and yet there has been a reasonable amount of divisions. So cell numbers in the culture of mutant B cells are constant because cycling is active but decreased and insufficient to allow increased numbers ("proliferation" in the true sense) as programmed death is increased. In line with this evidence, Fig 8G-H document higher death rates [i.e., frequencies of cleaved caspase3<sup>+</sup> cell and Annexin V<sup>+</sup> cells] of PexRAP-deficient B cells compared to controls. Thus, the in vitro data lead to the conclusion that both decreased division rates and increased death operate after this form of stimulation.
An inference is that this is the case in vivo as well - note that recoveries differed by ~3x (Fig. 2D), and the decrease in divisions (presentation of which will be improved) was meaningful but of lesser magnitude (Fig. 2E, F).
Reviewer #2 (Public review):
Summary:
In this study, Cho et al. investigate the role of ether lipid biosynthesis in B cell biology, particularly focusing on GC B cell, by inducible deletion of PexRAP, an enzyme responsible for the synthesis of ether lipids.
Strengths:
Overall, the data are well-presented, the paper is well-written and provides valuable mechanistic insights into the importance of PexRAP enzyme in GC B cell proliferation.
We appreciate this positive response and agree with the overview and summary of the paper's approaches and strengths.
Weaknesses:
More detailed mechanisms of the impaired GC B cell proliferation by PexRAP deficiency remain to be further investigated. In the minor part, there are issues with the interpretation of the data which might cause confusion for the readers.
Issues about contributions of cell cycling and divisions on the one hand, and susceptibility to death on the other, were discussed above, amplifying on the current manuscript text. The aggregate data support a model in which both processes are impacted for mature B cells in general, and mechanistically the evidence and work focus on the increased ROS and modes of death. Although the data in Fig. 7 do provide evidence that GC B cells themselves are affected, we agree that resource limitations had militated against developing further evidence about cycling specifically for GC B cells. We will hope to be able to obtain sufficient data from some specific analysis of proliferation in vivo (e.g., Ki67 or BrdU) as well as ROS and death ex vivo when harvesting new samples from mice immunized to analyze GC B cells for CXCR4/CD86, CD38, CD138 as indicated by Reviewer 1. As suggested by Reviewer 2, we will further discuss the possible mechanism(s) by which proliferation of PexRAP-deficient B cells is impaired. We also will edit the text of a revision where to enhance clarity of data interpretation - at a minimum, to be very clear that caution is warranted in assuming that GC B cells will exhibit the same mechanisms as cultures in vitro-stimulated B cells.
Addendum / update of Sept 2025: We were able to obtain results of intravital BrdU incorporation into GC B cells to measure cell cycling rates. The revised manuscript includes these results as well as other new data on apoptosis / survival, while deleting the data about CD138 populations whose interpretation was reasonably questioned by the referees.
Reviewer #1 (Recommendations for the authors):
We believe the evidence presented to support the role of PexRAP in protecting B cells from cell death and promoting B cell proliferation is not sufficiently robust and requires further validation in vivo. While the study demonstrates an increase in ether lipid content within the GC compartment, it also highlights a reduction in mature B cells in PexRAP-deficient mice under steady-state conditions. However, the IMS results (Fig. 3A) indicate that there are no significant differences in ether lipid content in the naïve B cell population. This discrepancy raises an intriguing point for discussion: why is PexRAP critical for B cell survival under steady-state conditions?
We thank the referee for all their care and input, and we agree that further intravital analyses could strengthen the work by providing more direct evidence of impairment of GC B cells in vivo. To revise and improve this manuscript before creation of a contribution of record, we performed new experiments to the limit of available funds and have both (i) added these new data and (ii) sharpened the presentation to correct what we believe to be one inaccurate point raised in the review.
(A) Specifically, we immunized mice with a B cell-specific depletion of PexRAP (Dhrs7b<sup>D/D-B</sup> mice) and measured a variety of readouts of the GC B cells' physiology in vivo: proliferation by intravital incorporation of BrdU, ROS in the viable GC B cell gate, and their cell death by annexin V staining directly ex vivo. Consistent with the data with in vitro activated B cells, these analyses showed increased ROS (new - Fig. 7D) and higher frequencies of Annexin V<sup>+</sup> 7AAD<sup>+</sup> in GC B cells (GL7<sup>+</sup> CD38<sup>-</sup> B cell-gate) of immunized Dhrs7b<sup>D/D-B</sup> mice compared with WT controls (huCD20-CreERT2<sup>+/-</sup>, Dhrs7b<sup>+/+</sup>) (new - Fig. 7E). Collectively, these results indicate that PexRAP aids (directly or indirectly) in controlling ROS in GC B cells and reduces B cell death, likely contributing to the substantially decreased overall GC B cell population. These new data are added to the revised manuscript in Figure 7.
Moreover, in each of two independent experiments (each comprising 3 vs 3 immunized mice), BrdU<sup>+</sup> events among GL7<sup>+</sup> CD38<sup>-</sup> (GC B cell)-gated cells were reduced in the B cell-specific PexRAP knockouts compared with WT controls (new, Fig. 7F and Supplemental Fig 6E). This result on cell cycle rates in vivo is presented with caution in the revised manuscript text because the absolute labeling fractions were somewhat different in Expt 1 vs Expt 2. This situation affords a useful opportunity to comment on the culture of "P values" and statistical methods. It is intriguing to consider how many successful drugs are based on research published back when the standard was to interpret a result of this sort more definitively despite a merged "P value" that was not a full 2 SD different from the mean. In the optimistic spirit of the eLife model, it can be for the attentive reader to decide from the data (new, Fig. 7F and Supplemental Fig 6E) whether to interpret the BrdU results more strongly that what we state in the revised text.
(B) On the issue of whether or not the loss of PexRAP led to perturbations of the lipidome of B cells prior to activation, we have edited the manuscript to do a better job making this point more clear.
We point out to readers that in the resting, pre-activation state abnormalities were detected in naive B cells, not just in activated and GC B cells. In brief, the IMS analysis and LC-MS-MS analysis detected statistically significant differences in some, but not all, the ether phospholipids species in PexRAP deficient cells (some of which was in Supplemental Figure 2 of the original version).
With this appropriate and helpful concern having been raised, we realize that this important point merited inclusion in the main figures. We point specifically to a set of phosphatidyl choline ions shown in Fig. 3 (revised - panels A, B, D) of the revised manuscript (PC O-36:5; PC O-38:5; PC O-40:6 and -40:7).
For this ancillary record (because a discourse on the limitations of each analysis), we will note issues such as the presence of many non-B cells in each pixel of the IMS analyses (so that some or many "true positives" will fail to achieve a "significant difference") and for the naive B cells, differential rates of synthesis, turnover, and conversion (e.g., addition of another 2-carbon unit or saturation / desaturation of one side-chain). To the extent the concern reflects some surprise and perhaps skepticism that what seem relatively limited differences (many species appear unaffected, etc), we share in the sentiment. But the basic observation is that there are differences, and a reasonable connection between the altered lipid profile and evidence of effects on survival or proliferation (i.e., integration of survival and cell cycling / division).
Additionally, it would be valuable to evaluate the humoral response in a T-independent setting. This would clarify whether the role of PexRAP is restricted to GC B cells or extends to activated B cells in general.
We agree that this additional set of experiments would be nice and would extend work incrementally by testing the generality of the findings about Ab responses. The practical problem is that money and time ran out while testing important items that strengthen the evidence about GC B cells.
Finally, the manuscript would benefit from a thorough revision to improve its readability and clarity. Including more detailed descriptions of technical aspects, such as the specific stimuli and time points used in analyses, would greatly enhance the flow and comprehension of the study. Furthermore, the authors should review figure labeling to ensure consistency throughout the manuscript, and carefully cite the relevant references. For instance, S1PR2 CreERT2 mouse is established by Okada and Kurosaki (Shinnakasu et al ,Nat. Immunol, 2016)
We appreciate this feedback and comment, inasmuch as both the clarity and scholarship matter greatly to us for a final item of record. For the revision, we have given our best shot to editing the text in the hopes of improved clarity, reduction of discrepancies (helpfully noted in the Minor Comments), and further detail-rich descriptions of procedures. We also edited the figure labeling to give a better consistency. While we note that the appropriate citation of Shinnakasu et al (2016) was ref. #69 of the original and remains as a citation, we have rechecked other referencing and try to use citations with the best relevant references.
Minor Comments: The labeling of plots in Fig. 2 should be standardized. For example, in Fig. 2C, D, and G, the same mouse strain is used, yet the Cre+ mouse is labeled differently in each plot.
We agree and have tried to tighten up these features in the panels noted as well as more generally (e.g., Fig. 4, 5, 6, 7, 9; consistency of huCD20-CreERT2 / hCD20CreERT2).
According to the text, the results shown in Fig. 1G and H correspond to a full KO (Dhrs7b^f/f; Rosa26-CreERT2 mice). However, Fig. 1H indicates that the bottom image corresponds to Dhrs7b^f/f, huCD20-CreERT2 mice (Dhrs7bΔ/Δ -B).
We have corrected Fig. 1H to be labeled as Dhrs7b<sup>Δ/Δ</sup> (with the data on Dhrs7b<sup>Δ/Δ-B</sup> presented in Supplemental Figure 4A, which is correctly labeled). Thank you for picking up this error that crept in while using copy/paste in preparation of figure panels and failing to edit out the "-B"!
Similarly, the gating strategy for GC cells in the text mentions IgD− cells, while the figure legend refers to total viable B cells. These discrepancies need clarification.
We believe we located and have corrected this issue in the revised manuscript.
Figures 3 and 4. The authors claim that B cell expression of PexRAP is required to achieve normal concentrations of ether phospholipids.
Suggestions for Improvement:
Lipid Metabolism Analysis: The analysis in Fig. 3 is generally convincing but could be strengthened by including an additional stimulation condition such as anti-IgM plus antiCD40. In Fig. 4C, the authors display results from the full KO model. It would be helpful to include quantitative graphs summarizing the parameters displayed in the images.
We have performed new experiments (anti-IgM + anti-CD40) and added the data to the revised manuscript (new - Supplemental Fig. 2H and Supplemental Fig 6, D & F). Conclusions based on the effects are not changed from the original.
As a semantic comment and point of scientific process, any interpretation ("claim") can - by definition - only be taken to apply to the conditions of the experiment. Nonetheless, it is inescapable that at least for some ether P-lipids of naive, resting B cells, and for substantially more in B cells activated under the conditions that we outline, B cell expression of PexRAP is required.
With regards to the constructive suggestion about a new series of lipidomic analyses, we agree that for activated B cells it would be nice and increase insight into the spectrum of conditions under which the PexRAP-deficient B cells had altered content of ether phospholipids. However, in light of the costs of metabolomic analyses and the lack of funds to support further experiments, and the accuracy of the point as stated, we prioritized the experiments that could fit within the severely limited budget.
[One can add that our results provide a premise for later work to analyze a time course after activation, and to perform isotopomer (SIRM) analyses with [13] C-labeled acetate or glucose, so as to understand activation-induced increases in the overall To revise the manuscript, we did however extrapolate from the point about adding BCR cross-linking to anti-CD40 as a variant form of activating the B cells for measurements of ROS, population growth, and rates of division (CTV partitioning). The results of these analyses, which align with and thereby strengthen the conclusions about these functional features from experiments with anti-CD40 but no anti-IgM, are added to Supplemental Fig 2H and Supplemental Fig 6D, F.
Figures 5, 6, and 7
The authors claim that Dhrs7b in B cells shapes antibody affinity and quantity. They use two mouse models for this analysis: huCD20-CreERT2 and Dhrs7b f/f; S1pr2-CreERT2 mice.
Suggestions for Improvement:
Adaptive immune response characterization: A more comprehensive characterization of the adaptive immune response is needed, ideally using the Dhrs7b f/f; S1pr2-CreERT2 model. This should include: Analysis of the GC response in B220+CD138− cells. Class switch recombination analysis. A detailed characterization of centroblasts, centrocytes, and Tfh populations. Characterization of effector cells (plasma cells and memory cells).
Within the limits of time and money, we have performed new experiments prompted by this constructive set of suggestions.
Specifically, we analyzed the suggested read-outs in the huCD20-CreERT2, Dhrs7b<sup>f/f</sup> model after immunization, recognizing that it trades greater signal-noise for the fact that effects are due to a mix of the impact on B cells during clonal expansion before GC recruitment and activities within the GC. In brief, the results showed that
(a) the GC B cell population - defined as CD138<sup>neg</sup> GL7<sup>+</sup> CD38<sup>lo/neg</sup> IgD<sup>neg</sup> B cells - was about half as large for PexRAP-deficient B cells net of any early- or preplasmablasts (CD138<sup>+</sup> events) (new - Fig 5G);
(b) the frequencies of pre- / early plasmablasts (CD138<sup>+</sup> GL7<sup>+</sup> CD38<sup>neg</sup>) events (see new - Fig. 6H, I; also, new Supplemental Fig 5D) were so low as to make it unlikely that our data with the S1pr2-CreERT2 model (in Fig 7B, C) would be affected meaningfully by analysis of the CD138 levels;
(c) There was a modest decrease in centrocytes (LZ) but not centroblasts (DZ) (new - Fig 5H, I) - consistent with the immunohistochemical data of Supplemental Fig. 5A-C).
Because of time limitations (the "shelf life" of funds and the lab) and insufficient stock of the S1pr2-CreERT2, Dhrs7b<sup>f/f</sup> mice as well as those that would be needed as adoptive transfer recipients because of S1PR2 expression in (GC-)Tfh, the experiments were performed instead with the huCD20-CreERT2, Dhrs7b<sup>f/f</sup> model. We would also note that using this Cre transgene better harmonizes the centrocyte/centroblast and Tfh data with the existing data on these points in Supplemental Fig. 4.
(d) Of note, the analyses of Tfh and GC-Tfh phenotype cells using the huCD20-CreERT2 B cell type-specific inducible Cre system to inactivate Dhrs7b (new - Supplemental Fig 1G-I; which, along with new - Supplemental Fig 5E) provide evidence of an abnormality that must stem from a function or functions of PexRAP in B cells, most likely GC B cells. Specifically, it is known that the GC-Tfh population proliferates and is supported by the GC B cells, and the results of B cell-specific deletion show substantial reductions in Tfh cells (both the GC-Tfh gating and the wider gate for plots of CXCR5/PD-1/ fluorescence of CD4 T cells
Timepoint Consistency: The NP response (Fig. 5) is analyzed four weeks postimmunization, whereas SRBC (Supp. Fig. 4) and Fig. 7 are analyzed one week or nine days post-immunization. The NP system analysis should be repeated at shorter timepoints to match the peak GC reaction.
This comment may stem from a misunderstanding. As diagrammed in Fig. 5A, the experiments involving the NP system were in fact measured at 7 d after a secondary (booster) immunization. That timing is approximately the peak period and harmonizes with the 7 d used for harvesting SRBC-immunized mice. So in fact the data with each system were obtained at a similar time point. Of course the NP experiments involved a second immunization so that many plasma cell and Ab responses derived from memory B cells generated by the primary immunization. However, the field at present is dominated by the view that the vast majority of the GC B cells after this second immunization (which historically we perform with alum adjuvant) are recruited from the naive rather than the memory B cell pool. For the revised manuscript, we have taken care that the Methods, Legend, and Figure provide the information to readers, and expanded the statement of a rationale.
It may seem a technicality but under NIH regulations we are legally obligated to try to minimize mouse usage. It also behooves researchers to use funds wisely. In line with those imperatives, we used systems that would simultaneously allow analyses of GC B cells, identification of affinity maturation (which is minimal in our hands at a 7 d time point after primary NP-carrier immunization), and a switched repertoire (also minimal), and where with each immunogen the GC were scored at 7-9 d after immunization (9 d refers to the S1pr2-CreERT2 experiments). Apart from the end of funding, we feel that what little might be learned from performing a series of experiments that involve harvests 7 d after a primary immunization with NP-ovalbumin cannot well be justified.
In vitro plasma cell differentiation: Quantification is missing for plasma cell differentiation in vitro (Supp. Fig. 4). The stimulus used should also be specified in the figure legend. Given the use of anti-CD40, differentiation towards IgG1 plasma cells could provide additional insights.
As suggested by reviewer, we have added the results of quantifying the in vitro plasma cell differentiation in Supplemental Fig 6B. Also, we edited the Methods and Supplemental Figure Legend to give detailed information of in vitro stimulation.
Proliferation and apoptosis analysis: The observed defects in the humoral response should be correlated with proliferation and apoptosis analyses, including Ki67 and Caspase markers.
As suggested by the review, we have performed new experiment and analyzed the frequencies of cell death by annexin V staining, and elected to use intravital uptake of BrdU as a more direct measurement of S phase / cell cycling component of net proliferation. The new results are now displayed in Figure 5 and Supplemental Fig. 5.
Western blot confirmation: While the authors have demonstrated the absence of PexRAP protein in the huCD20-CreERT2 model, this has not been shown in GC B cells from the Dhrs7b f/f; S1pr2-CreERT2 model. This confirmation is necessary to validate the efficiency of Dhrs7b deletion.
We were unable to do this for technical reasons expanded on below. For the revision, we have edited in a bit of text more explicitly to alert readers to the potential impact of counter-selection on interpretation of the findings with GC B cells. Before entering the GC, B cells have undergone many divisions, so if there were major pre-GC counterselection, in all likelihood the GC B cells would PexRAP-sufficient. To recap from the original manuscript and the new data we have added, IMS shows altered lipid profiles in the GC B cells and the literature indicates that the lipids are short-lived, requiring de novo resynthesis. The BrdU, ROS, and annexin V data show that GC B cells are abnormal. Accordingly, abnormal GC B cells represent the parsimonious or straightforward interpretation of the new results with GC-Tfh cell prevalence.
While we take these findings together to suggest that counterselection (i.e., a Western result showing normal levels of PexRAP in the GC B cells) seems unlikely, it is formally possible and would mean that the in situ defects of GC B cells arose due to environmental influences of the PexRAP-deficient B cells during the developmental history of the WT B cells observed in the GC.
Having noted all that, we understand that concerns about counter-selection are an issue if a reader accepts the data showing that mutant (PexRAP-deficient) B cells tend to proliferate less and die more readily. Indeed, one can speculate that were we also to perform competition experiments in which the Ighb, Cd45.2 B cells (WT or Dhrs7b D/D) are mixed with equal numbers of Igha, Cd45.1 competitors, the differences would become much greater. With this in mind, Western blotting of flow-purified GC B cells might give a sense of how much counter-selection has occurred.
That said, the Westerns need at least 2.5 x 10<sup>6</sup> B cells (those in the manuscript used five million, 5 x 10<sup>6</sup>) and would need replication. Taken together with the observation that ~200,000 GC B cells (on average) were measured in each B cell-specific knockout mouse after immunization (Fig. 1, Fig 5) and taking into account yields from sorting, each Western would require some 20-25 tamoxifen-injected ___-CreERT2, Dhrs7b f/f mice, and about half again that number as controls. The expiry of funds prohibited the time and costs of generating that many mice (>70) and flow-purified GC B cells.
Figure 8
The authors claim that Dhrs7b contributes to the modulation of ROS, impacting B cell proliferation.
Suggestions for Improvement:
GC ROS Analysis: The in vitro ROS analysis should be complemented by characterizing ROS and lipid peroxidation in the GC response using the Dhrs7b f/f; S1pr2-CreERT2 model. Flow cytometry staining with H2DCFDA, MitoSOX, Caspase-3, and Annexin V would allow assessment of ROS levels and cell death in GC B cells.
While subject to some of the same practical limits noted above, we have performed new experiments in line with this helpful input of the reviewer, and added the helpful new data to the revised manuscript. Specifically, in addition to the BrdU and phenotyping analyses after immunization of huCD20-CreER<sup>T2</sup>, Dhrs7b<sup>f/f</sup> mice, DCFDA (ROS), MitoSox, and annexin V signals were measured for GC B cells. Although the mitoSox signals did not significantly differ for PexRAP-deficient GCB, the ROS and annexin V signals were substantially increased. We added the new data to Figure 5 and Supplemental Figure 5. Together with the decreased in vivo BrdU incorporation in GC B cells from Dhrs7b<sup>D/D-B</sup> mice, these results are consistent with and support our hypothesis that PexRAP regulates B cell population growth and GC physiology in part by regulating ROS detoxification, survival and proliferation of B cells.
Quantification is missing in Fig. 8E, and Fig. 8F should use clearer symbols for better readability.
We added quantification for Fig 8E in Supplemental Fig 6E, and edited the symbols in Fig 8F for better readability.
Figure 9
The authors claim that Dhrs7b in B cells affects oxidative metabolism and ER mass. The results in this section are well-performed and convincing.
Suggestion for Improvement:
Based on the results, the discussion should elaborate on the potential role of lipids in antigen presentation, considering their impact on mitochondria and ER function.
We very much appreciate the praise of the tantalizing findings about oxidative metabolism and ER mass, and will accept the encouragement that we add (prudently) to the Discussion section to make note of the points mentioned by the Reviewer, particularly now that (with their encouragement) we have the evidence that B cell-specific loss of PexRAP (with the huCD20-CreERT2 deletion prior to immunization) resulted in decreased (GC-)Tfh and somewhat lower GC B cell proliferation.
Reviewer #2 (Recommendations for the authors):
The authors should investigate whether PexRAP-deficient GC B cells exhibit increased mitochondrial ROS and cell death ex vivo, as observed in in vitro cultured B cells.
We very much appreciate the work of the referee and their input. We addressed this helpful recommendation, in essence aligned with points from Reviewer 1, via new experiments (until the money ran out) and addition of data to the manuscript. To recap briefly, we found increased ROS in GC B cells along with higher fractions of annexin V positive cells; intriguingly, increased mtROS (MitoSox signal) was not detected, which contrasts with the results in activated B cells in vitro in a small way. To keep the text focused and not stray too far outside the foundation supported by data, this point may align with papers that provide evidence of differences between pre-GC and GC B cells (for instance with lack of Tfam or LDHA in B cells).
It remains unclear whether the impaired proliferation of PexRAP-deficient B cells is primarily due to increased cell death. Although NAC treatment partially rescued the phenotype of reduced PexRAP-deficient B cell number, it did not restore them to control levels. Analysis of the proliferation capacity of PexRAP-deficient B cells following NAC treatment could provide more insight into the cause of impaired proliferation.
To add to the data permitting an assessment of this issue, we performed new experiments in which B cells were activated (BCR and CD40 cross-linking), cultured, and both the change in population and the CTV partitioning were measured in the presence or absence of NAC. The results, added to the revision as Supplemental Fig 6FH, show that although NAC improved cell numbers for PexRAP-deficient cells relative to controls, this compound did not increase divisions at all. We infer that the more powerful effect of this lipid synthesis enzyme is to promote survival rather than division capacity.
Primary antibody responses were assessed at only one time point (day 20). It would be valuable to examine the kinetics of antibody response at multiple time points (0, 1w, 2w, 3w, for example) to better understand the temporal impact of PexRAP on antibody production.
We thank the reviewer for this suggestion. While it may be that the kinetic measurement of Ag-specific antibody level across multiple time points would provide an additional mechanistic clue into the of impact PexRAP on antibody production, the end of sponsored funding and imminent lab closure precluded performing such experiments.
CD138+ cell population includes both GC-experienced and GC-independent plasma cells (Fig. 7). Enumeration of plasmablasts, which likely consists of both PexRAP-deleted and undeleted cells (Fig. 7D and E), may mislead the readers such that PexRAP is dispensable for plasmablast generation. I would suggest removing these data and instead examining the number of plasmablasts in the experimental setting of Fig. 4A (huCD20-CreERT2-mediated deletion) to address whether PexRAP-deficiency affects plasmablast generation.
We have eliminated the figure panels in question, since it is accurate that in the absence of a time-stamping or marking approach we have a limited ability to distinguish plasma cells that arose prior to inactivation of the Dhrs7b gene in B cells. In addition, we performed new experiments that were used to analyze the "early plasmablast" phenotype and added those data to the revision (Supplemental Fig 5D).
Author response:
The following is the authors’ response to the original reviews.
Reviewer #1 (Public review):
Summary:
The authors use the theory of planned behavior to understand whether or not intentions to use sex as a biological variable (SABV), as well as attitude (value), subjective norm (social pressure), and behavioral control (ability to conduct behavior), across scientists at a pharmacological conference. They also used an intervention (workshop) to determine the value of this workshop in changing perceptions and misconceptions. Attempts to understand the knowledge gaps were made.
Strengths:
The use of SABV is limited in terms of researchers using sex in the analysis as a variable of interest in the models (and not a variable to control). To understand how we can improve on the number of researchers examining the data with sex in the analyses, it is vital we understand the pressure points that researchers consider in their work. The authors identify likely culprits in their analyses. The authors also test an intervention (workshop) to address the main bias or impediments for researchers' use of sex in their analyses.
Weaknesses:
There are a number of assumptions the authors make that could be revisited:
(1) that all studies should contain across sex analyses or investigations. It is important to acknowledge that part of the impetus for SABV is to gain more scientific knowledge on females. This will require within sex analyses and dedicated research to uncover how unique characteristics for females can influence physiology and health outcomes. This will only be achieved with the use of female-only studies. The overemphasis on investigations of sex influences limits the work done for women's health, for example, as within-sex analyses are equally important.
The Sex and Gender Equity in Research (SAGER) guidelines (1) provide guidance that “Where the subjects of research comprise organisms capable of differentiation by sex, the research should be designed and conducted in a way that can reveal sex-related differences in the results, even if these were not initially expected.”. This is a default position of inclusion where the sex can be determined and analysis assessing for sex related variability in response. This position underpins many of the funding bodies new policies on inclusion.
However, we need to place this in the context of the driver of inclusion. The most common reason for including male and female samples is for those studies that are exploring the effect of a treatment and then the goal of inclusion is to assess the generalisability of the treatment effect (exploratory sex inclusion)(2). The second scenario is where sex is included because sex is one of the variables of interest and this situation will arise because there is a hypothesized sex difference of interest (confirmatory sex inclusion).
We would argue that the SABV concept was introduced to address the systematic bias of only studying one sex when assessing treatment effect to improve the generalisability of the research. Therefore, it isn’t directly to gain more scientific knowledge on females. However, this strategy will highlight when the effect is very different between male and female subjects which will potentially generate sex specific hypotheses.
Where research has a hypothesis that is specific to a sex (e.g. it is related to oestrogen levels) it would be appropriate to study only the sex of interest, in this case females. The recently published Sex Inclusive Research Framework gives some guidance here and allows an exemption for such a scenario classifying such proposals “Single sex study justified” (3).
We have added an additional paragraph to the introduction to clarify the objectives behind inclusion and how this assists the research process.
(2) It should be acknowledged that although the variability within each sex is not different on a number of characteristics (as indicated by meta-analyses in rats and mice), this was not done on all variables, and behavioral variables were not included. In addition, across-sex variability may very well be different, which, in turn, would result in statistical sex significance. In addition, on some measures, there are sex differences in variability, as human males have more variability in grey matter volume than females. PMID: 33044802.
The manuscript was highlighting the common argument used to exclude the use of females, which is that females are inherently more variable as an absolute truth. We agree there might be situations, where the variance is higher in one sex or another depending on the biology. We have extended the discussion here to reflect this, and we also linked to the Sex Inclusive Research Framework (3) which highlights that in these situations researchers can utlise this argument provided it is supported with data for the biology of interest.
(3) The authors need to acknowledge that it can be important that the sample size is increased when examining more than one sex. If the sample size is too low for biological research, it will not be possible to determine whether or not a difference exists. Using statistical modelling, researchers have found that depending on the effect size, the sample size does need to increase. It is important to bare this in mind as exploratory analyses with small sample size will be extremely limiting and may also discourage further study in this area (or indeed as seen the literature - an exploratory first study with the use of males and females with limited sample size, only to show there is no "significance" and to justify this as an reason to only use males for the further studies in the work.
The reviewer raises a common problem: where researchers have frequently argued that if they find no sex differences in a pilot then they can proceed to study only one sex. The SAGER guidelines (1), and now funder guidelines (4, 5), challenge that position. Instead, the expectation is for inclusion as the default in all experiments (exploratory inclusion strategy) to allow generalisable results to be obtained. When the results are very different between the male and female samples, then this can be determined. This perspective shift (2) requires a change in mindset and understanding that the driver behind inclusion is of generalisability not exploration of sex differences. This has been added to the introduction as an additional paragraph exploring the drivers behind inclusion.
We agree with the reviewer that if the researcher is interested in sex differences in an effect (confirmatory inclusion strategy, aka sex as a primary variable) then the N will need to be higher. However, in this situation, one, of course, must have male and female samples in the same experiment to allow the simultaneous exploration to assess the dependency on sex.
Reviewer #2 (Public review):
Summary:
The investigators tested a workshop intervention to improve knowledge and decrease misconceptions about sex inclusive research. There were important findings that demonstrate the difficulty in changing opinions and knowledge about the importance of studying both males and females. While interventions can improve knowledge and decrease perceived barriers, the impact was small.
Strengths:
The investigators included control groups and replicated the study in a second population of scientists. The results appear to be well substantiated. These are valuable findings that have practical implications for fields where sex is included as a biological variable to improve rigor and reproducibility.
Thank you for assessment and highlighting these strengths. We appreciate your recognition of the value and practical implications of this work.
Weaknesses:
I found the figures difficult to understand and would have appreciated more explanation of what is depicted, as well as greater space between the bars representing different categories.
We have improved the figures and figure legends to improve clarity.
Reviewer #3 (Public review):
Summary:
This manuscript aims to determine cultural biases and misconceptions in inclusive sex research and evaluate the efficacy of interventions to improve knowledge and shift perceptions to decrease perceived barriers for including both sexes in basic research.
Overall, this study demonstrates that despite the intention to include both sexes and a general belief in the importance of doing so, relatively few people routinely include both sexes. Further, the perceptions of barriers to doing so are high, including misconceptions surrounding sample size, disaggregation, and variability of females. There was also a substantial number of individuals without the statistical knowledge to appropriately analyze data in studies inclusive of sex. Interventions increased knowledge and decreased perception of barriers.
Strengths:
(1) This manuscript provides evidence for the efficacy of interventions for changing attitudes and perceptions of research.
(2) This manuscript also provides a training manual for expanding this intervention to broader groups of researchers.
Thank you for highlighting these strengths. We appreciate your recognition that the intervention was effect in changing attitudes and perception. We deliberately chose to share the material to provide the resources to allow a wider engagement.
Weaknesses:
The major weakness here is that the post-workshop assessment is a single time point, soon after the intervention. As this paper shows, intention for these individuals is already high, so does decreasing perception of barriers and increasing knowledge change behavior, and increase the number of studies that include both sexes? Similarly, does the intervention start to shift cultural factors? Do these contribute to a change in behavior?
Measuring change in behaviour following an intervention is challenging and hence we had implemented an intention score as a proxy for behaviour. We appreciate the benefit of a long-term analysis, but it was beyond the scope of this study and would need a larger dataset size to allow for attrition. We agree that the strategy implemented has weaknesses. We have extended the limitation section in the discussion to include these.
Reviewer #1 (Recommendations for the authors):
I would ask them to think about alternative explanations and ask for free-form responses, and to revise with the caveats written above - sample size does need to be increased depending on effect size, and that within sex studies are also important. Not all studies should focus on sex influences.
The inclusion of the additional paragraph in the introduction to clarify the objective of inclusion and the resulting impact on experimental design should address these recommendations.
We have also added the free-form responses as an additional supplementary file.
Reviewer #2 (Recommendations for the authors):
This is an important set of studies. My only recommendation to improve the data presentation so that it is clear what is depicted and how the analyses were conducted. I know it is in the methods, but reminding the reader would be helpful.
We have revisited the figures and included more information in the legends to explain the analysis and improve clarity.
Reviewer #3 (Recommendations for the authors):
There are parts in the introduction which read as contradictory and as such are confusing - for example, in the 3rd paragraph it states that little progress on sex inclusive research has been made, and in the following sentences it states that the proportion of published studies across sex has improved. The references in these two statements are from the same time range, so has this improved? Or not?
The introduction does include a summation statement on the position: “Whilst a positive step forward, this proportion still represents a minority of studies, and notably this inclusion was not associated with an increase in the proportion of studies that included data analysed by sex.” We have reworded the text to ensure it is internally consistent with this summary statement and this should increase clarity.
In discussing the results, it is sometimes confusing what the percentages mean. For example, "the researchers reported only conducting sex inclusive research in <=55% of their studies over the past 5 years (55% in study 1 general population and 35% study 2 pre-assessment)." Does that mean 55% of people are conducting sex inclusive research, or does this mean only half of their studies? These two options have very different implications.
We agree that the sentence is confusing and it has been reworded.
Addressing long-term assessments in attitude and action (ie, performing sex inclusive research) is a crucial addition, with data if possible, but at least substantive discussion.
We have add this to the limitation section in the discussion
One minor but confusing point is the analogy comparing sex inclusive studies with attending the gym. The point is well taken - knowledge is not enough for behavior change. However, the argument here is that to increase sex inclusive research requires cultural change. To go to the gym, requires motivation.This seems like an oranges-to-lemons comparison (same family, different outcome when you bite into it).
At the core, both scenarios involve the challenge of changing established habits and cultural norms in action based on knowledge (the right thing to do). The exercise scenario is a primary example provided by the original authors to describe how aspects of the theory of planned behaviour (perceived behavioural control, attitude, and social norms) may influence behavioural change. Understanding which of these aspects may drive or influence change is why we used this framework to understand our study population. We disagree that is an oranges-to-lemons comparison.
References
(1) Heidari S, Babor TF, De Castro P, Tort S, Curno M. Sex and Gender Equity in Research: rationale for the SAGER guidelines and recommended use. Res Integr Peer Rev. 2016;1:2.
(2) Karp NA. Navigating the paradigm shift of sex inclusive preclinical research and lessons learnt. Commun Biol. 2025;8(1):681.
(3) Karp NA, Berdoy M, Gray K, Hunt L, Jennings M, Kerton A, et al. The Sex Inclusive Research Framework to address sex bias in preclinical research proposals. Nat Commun. 2025;16(1):3763.
(4) MRC. Sex in experimental design - Guidance on new requirements https://www.ukri.org/councils/mrc/guidance-for-applicants/policies-and-guidance-forresearchers/sex-in-experimental-design/: UK Research and Innovation; 2022 [
(5) Clayton JA, Collins FS. Policy: NIH to balance sex in cell and animal studies. Nature. 2014;509(7500):282-3.
Author response:
The following is the authors’ response to the previous reviews
Reviewer #1 (Public review):
Summary:
Asthenospermia, characterized by reduced sperm motility, is one of the major causes of male infertility. The "9 + 2" arranged MTs and over 200 associated proteins constitute the axoneme, the molecular machine for flagellar and ciliary motility. Understanding the physiological functions of axonemal proteins, particularly their links to male infertility, could help uncover the genetic causes of asthenospermia and improve its clinical diagnosis and management. In this study, the authors generated Ankrd5 null mice and found that ANKRD5-/- males exhibited reduced sperm motility and infertility. Using FLAG-tagged ANKRD5 mice, mass spectrometry, and immunoprecipitation (IP) analyses, they confirmed that ANKRD5 is localized within the N-DRC, a critical protein complex for normal flagellar motility. However, transmission electron microscopy (TEM) and cryo-electron tomography (cryo-ET) of sperm from Ankrd5 null mice did not reveal significant structural abnormalities.
Strengths:
The phenotypes observed in ANKRD5-/- mice, including reduced sperm motility and male infertility, are conversing. The authors demonstrated that ANKRD5 is an N-DRC protein that interacts with TCTE1 and DRC4. Most of the experiments are well designed and executed.
Weaknesses:
The last section of cryo-ET analysis is not convincing. "ANKRD5 depletion may impair buffering effect between adjacent DMTs in the axoneme".
"In WT sperm, DMTs typically appeared circular, whereas ANKRD5-KO DMTs seemed to be extruded as polygonal. (Fig. S9B,D). ANKRD5-KO DMTs seemed partially open at the junction between the A- and B-tubes (Fig. S9B,D)." In the TEM images of 4E, ANKRD5-KO DMTs look the same as WT. The distortion could result from suboptimal sample preparation, imaging or data processing. Thus, the subsequent analyses and conclusions are not reliable.
Thank you for your valuable advice. To validate the results of cryo-ET, we carefully analyzed the TEM results (previously we only focused on the global "9+2" structure of the axial filament) and found that deletion of ANKRD5 resulted in both normal and deformed DMT morphologies, which was consistent with the results observed by cryo-ET. At the same time, we have added the corresponding text and picture descriptions in the article:
The text description we added is: “Upon re-examining the TEM data in light of the Cryo-ET findings, similar abnormalities were observed in the TEM images (Fig.4E, Fig. S10B). Notably, both intact and deformed DMT structures were consistently observed in both TEM and STA analyses, with the deformation of the B-tube being more obvious (Fig.4E, Fig. S10). ”
This paper still requires significant improvements in writing and language refinement. Here is an example: "While N-DRC is critical for sperm motility, but the existence of additional regulators that coordinate its function remains unclear" - ill-formed sentences.
We appreciate the reviewer’s valuable comment regarding the clarity of our writing. The sentence cited (“While N-DRC is critical for sperm motility, but the existence of additional regulators that coordinate its function remains unclear”) was indeed ill-formed. We have revised it to improve readability and precision. The corrected version now reads:“Although the N-DRC is critical for sperm motility, whether additional regulatory components coordinate its function remains unclear.” We have carefully re-examined the manuscript and refined the language throughout to ensure clarity and conciseness.
Reviewer #2 (Public review):
Summary:
The manuscript investigates the role of ANKRD5 (ANKEF1) as a component of the N-DRC complex in sperm motility and male fertility. Using Ankrd5 knockout mice, the study demonstrates that ANKRD5 is essential for sperm motility and identifies its interaction with N-DRC components through IP-mass spectrometry and cryo-ET. The results provide insights into ANKRD5's function, highlighting its potential involvement in axoneme stability and sperm energy metabolism.
Strengths:
The authors employ a wide range of techniques, including gene knockout models, proteomics, cryo-ET, and immunoprecipitation, to explore ANKRD5's role in sperm biology.
Weaknesses:
“Limited Citations in Introduction: Key references on the role of N-DRC components (e.g.,DRC2, DRC4) in male infertility are missing, which weakens the contextual background.”
We appreciate the reviewer’s valuable suggestion. To address this concern, we have added the following sentence in the Introduction:
“Recent mammalian knockout studies further confirmed that loss of DRC2 or DRC4 results in severe sperm flagellar assembly defects, multiple morphological abnormalities of the sperm flagella (MMAF), and complete male infertility, highlighting their indispensable roles in spermatogenesis and reproduction [31].”
This addition introduces up-to-date evidence on DRC2 and DRC4 functions in male infertility and strengthens the contextual background as recommended.
Reviewer #1 (Recommendations for the authors):
"Male infertility impacts 8%-12% of the global male population, with sperm motility defects contributing to 40%-50% of these cases [2,3]. " Is reference 3 proper? I don't see "sperm motility defects contributing to 40%-50%" of male infertility.
Thank you for identifying this issue. You are correct—reference 3 does not support the statement about sperm motility defects comprising 40–50% of male infertility cases; it actually states:
“Male factor infertility is when an issue with the man’s biology makes him unable to impregnate a woman. It accounts for between 40 to 50 percent of infertility cases and affects around 7 percent of men.”
This was a misunderstanding on my part, and I apologize for the oversight.
To correct this, we have replaced the statement with more accurate references:
PMID: 33968937 confirms:
“Asthenozoospermia accounts for over 80% of primary male infertility cases.”
PMID: 33191078 defines asthenozoospermia (AZS) as reduced or absent sperm motility and notes it as a major cause of male infertility.
We have updated the manuscript accordingly:
In the Significance Statement: “Male infertility affects approximately 8%-12% of men globally, with defects in sperm motility accounting for over 80% of these cases.”
In the Introduction: “Male infertility affects approximately 8% to 12% of the global male population, with defects in sperm motility accounting for over 80% of these cases[2,3].”
Thank you again for your careful review and for giving us the opportunity to improve the accuracy of our manuscript.
"Rather than bypassing the issue with ICSI, infertility from poor sperm motility could potentially be treated or even cured through stimulation of specific signaling pathways or gene therapy." Need references.
We appreciate the reviewer’s insightful comment. In response, we have added three supporting references to the relevant sentence.
The first reference (PMID: 39932044) demonstrates that cBiMPs and the PDE-10A inhibitor TAK-063 significantly and sustainably improve motility in human sperm with low activity, including cryopreserved samples, without inducing premature acrosome reaction or DNA damage. The second reference (PMID: 29581387) shows that activation of the PKA/PI3K/Ca²⁺ signaling pathways can reverse reduced sperm motility. The third reference (PMID: 33533741) reports that CRISPR-Cas9-mediated correction of a point mutation in Tex11<sup>PM/Y</sup> spermatogonial stem cells (SSCs) restores spermatogenesis in mice and results in the production of fertile offspring.
These references provide mechanistic support and demonstrate the feasibility of treating poor sperm motility through targeted pathway modulation or gene therapy, thus reinforcing the validity of our statement.
"Our findings indicate that ANKRD5 (Ankyrin repeat domain 5; also known as ANK5 or ANKEF1) interacts with N-DRC structure". The full name should be provided the first time ANKRD5 appears. Is ANKRD5 a component of N-DRC or does it interact with N-DRC?
We thank the reviewer for the valuable suggestion. In response, we have moved the full name “Ankyrin repeat domain 5; also known as ANK5 or ANKEF1” to the abstract where ANKRD5 first appears, and have removed the redundant mention from the main text.
Based on our experimental data, we consider ANKRD5 to be a novel component of the N-DRC (nexin-dynein regulatory complex), rather than merely an interacting partner. Therefore, we have revised the sentence in the main text to read:
“Here, we demonstrate that ANKRD5 is a novel N-DRC component essential for maintaining sperm motility.”
Fig 5E, numbers of TEM images should be added.
We thank the reviewer for the suggestion. We would like to clarify that Fig. 5E does not contain TEM images, and it is likely that the reviewer was referring to Fig. 4E instead.
In Fig. 4E, we conducted three independent experiments. In each experiment, 60 TEM cross-sectional images of sperm tails were analyzed for both Ankrd5 knockout and control mice.
The findings were consistent across all replicates.
We have updated the figure legend accordingly, which now reads:
“Transmission electron microscopy (TEM) of sperm tails from control and Ankrd5 KO mice. Cross-sections of the midpiece, principal piece, and end piece were examined. Red dashed boxes highlight regions of interest, and the magnified views of these boxed areas are shown in the upper right corner of each image. In three independent experiments, 20 sperm cross-sections per mouse were analyzed for each group, with consistent results observed.”
There are random "222" in the references. Please check and correct.
I sincerely apologize for the errors caused by the reference management software, which resulted in the insertion of random "222" and similar numbering issues in the reference list. I have carefully reviewed and corrected the following problems:
References 9, 11, 13, 26, 34, 63, and 64 had the number "222" mistakenly placed before the title; these have now been removed. References 15 and 18 had "111" incorrectly inserted before the title; this has also been corrected. Reference 36 had an erroneous "2" before the title and was found to be a duplicate of Reference 32; these have now been merged into a single citation. Additionally, References 22 and 26 were identified as duplicates of the same article and have been consolidated accordingly.
All these issues have been resolved to ensure the reference list is accurate and properly formatted.
Reviewer #2 (Recommendations for the authors):
The authors have already addressed most of the issues I am concerned about.
In addition, we have also corrected some errors in the revised manuscript:
(1) In Figure 3G, the y-axis label was previously marked as “Sperm count in the oviduct (10⁶)”, which has now been corrected to “Sperm count in the oviduct”.
(2) All p-values have been reformatted to italic lowercase letters to comply with the journal style guidelines.
Figure 6 Legend: A typographical error in the figure legend has been corrected. The text previously read “(A) The differentially expressed proteins of Ankrd5<sup>+/–</sup> and Ankrd5<sup>+/-</sup> were identified...”. This has now been amended to “(A) The differentially expressed proteins of Ankrd5<sup>+/–</sup> and Ankrd5<sup>+/–</sup> were identified...” to correctly represent the comparison between heterozygous and homozygous knockout groups.
In the original Figure 4E, we added a zoom-in panel to the image to show the deformed DMT.
Author response:
The following is the authors’ response to the previous reviews
Reviewer #2 (Public review):
Summary:
The paper describes the high-resolution structure of KdpFABC, a bacterial pump regulating intracellular potassium concentrations. The pump consists of a subunit with an overall structure similar to that of a canonical potassium channel and a subunit with a structure similar to a canonical ATP-driven ion pump. The ions enter through the channel subunit and then traverse the subunit interface via a long channel that lies parallel to the membrane to enter the pump, followed by their release into the cytoplasm.
The work builds on the previous structural and mechanistic studies from the authors' and other labs. While the overall architecture and mechanism have already been established, a detailed understanding was lacking. The study provides a 2.1 Å resolution structure of the E1-P state of the transport cycle, which precedes the transition to the E2 state, assumed to be the ratelimiting step. It clearly shows a single K+ ion in the selectivity filter of the channel and in the canonical ion binding site in the pump, resolving how ions bind to these key regions of the transporter. It also resolves the details of water molecules filling the tunnel that connects the subunits, suggesting that K+ ions move through the tunnel transiently without occupying welldefined binding sites. The authors further propose how the ions are released into the cytoplasm in the E2 state. The authors support the structural findings through mutagenesis and measurements of ATPase activity and ion transport by surface-supported membrane (SSM) electrophysiology.
Reviewer #3 (Public review):
Summary:
By expressing protein in a strain that is unable to phosphorylate KdpFABC, the authors achieve structures of the active wildtype protein, capturing a new intermediate state, in which the terminal phosphoryl group of ATP has been transferred to a nearby Asp, and ADP remains covalently bound. The manuscript examines the coupling of potassium transport and ATP hydrolysis by a comprehensive set of mutants. The most interesting proposal revolves around the proposed binding site for K+ as it exits the channel near T75. Nearby mutations to charged residues cause interesting phenotypes, such as constitutive uncoupled ATPase activity, leading to a model in which lysine residues can occupy/compete with K+ for binding sites along the transport pathway.
Strengths:
The high resolution (2.1 Å) of the current structure is impressive, and allows many new densities in the potassium transport pathway to be resolved. The authors are judicious about assigning these as potassium ions or water molecules, and explain their structural interpretations clearly. In addition to the nice structural work, the mechanistic work is thorough. A series of thoughtful experiments involving ATP hydrolysis/transport coupling under various pH and potassium concentrations bolsters the structural interpretations and lends convincing support to the mechanistic proposal. The SSME experiments are generally rigorous.
Weaknesses:
The present SSME experiments do not support quantitative comparisons of different mutants, as in Figures 4D and 5E. Only qualitative inferences can be drawn among different mutant constructs.
Thank you to both reviewers for your thorough review of our work. We acknowledge the limitations of SSME experiments in quantitative comparison of mutants and have revised the manuscript to address this point. In addition, we have included new ATPase data from reconstituted vesicles which we believe will help to strengthen our contention that both ATPase and transport are equally affected by Val496 mutations.
Reviewer #2 (Recommendations for the authors):
I have a minor editorial comment:
Perhaps I am confused. However, in reference to the text in the Results: "Our WT complex displayed high levels of K+-dependent ATPase activity and generated robust transport currents (Fig. 1 - figure suppl. 1).", I do not see either K+-dependency of ATPase activity nor transport currents in Fig. 1 - figure suppl. 1. Perhaps the text needs to be edited for clarity.
Thank you for pointing this out. This confusion was caused by our removal of a panel from the revised manuscript, which depicted K+-dependent transport currents. Although this panel is somewhat redundant, given inclusion of raw SSME traces from all the mutants, it has been replaced as Fig. 1 - figure supplement 1F, thus providing a thorough characterization of the preparation used for cryo-EM analysis and supporting the statement quoted by this reviewer.
Reviewer #3 (Recommendations for the authors):
The authors have provided a detailed description of the SSME data collection, and followed rigorous protocols to ensure that the currents measured on a particular sensor remained stable over time.
I still have reservations about the direct comparison of transport in the different mutants. Specifically, on page 6, the authors state that "The longer side chain of V496M reduces transport modestly with no effect on ATPase activity. V496R, which introduces positive charge, completely abolishes activity. V496W and V496H reduce both transport and ATPase activity by about half, perhaps due to steric hindrance for the former and partial protonation for the latter." And in figures 4D and 5B, by plotting all of the peak currents on the same graph, the authors are giving the data a quantitative veneer, when these different experiments really aren't directly comparable, especially in the absence of any controls for reconstitution efficiency.
In terms of overall conclusions, for the more drastic mutant phenotypes, I think it is completely reasonable to conclude that transport is not observed. But a 2-fold difference could easily result from differences in reconstitution or sensor preparation. My suggestion would be to show example traces rather than a numeric plot in 4D/5E, to convey the qualitative nature of the mutant-to-mutant comparisons, and to re-write the text to acknowledge the shortcomings of mutant-to-mutant comparisons with SSME, and avoid commenting on the more subtle phenotypes, such as modest decreases and reductions by about half.
Figure 4, supplement 1. What is S162D? I don't think it is mentioned in the main text.
We agree with the reviewer's point that quantitative comparison of different mutants by SSME is compromised by ambiguity in reconstitution. However, we do not think that display of raw SSME currents is an effective way to communicate qualitative effects to the general reader, given the complexity of these data (e.g., distinction between transient binding current seen in V496R and genuine, steady-state transport current seen in WT). So we have taken a compromise approach. To start, we have removed the transport data from the main figure (Fig. 4). Luckily, we had frozen and saved the batch of reconstituted proteoliposomes from Val496 mutants that had been used for transport assays. We therefore measured ATPase activities from these proteoliposomes - after adding a small amount of detergent to prevent buildup of electrochemical gradients (1 mg/ml decylmaltoside which is only slightly more than the critical micelle concentration of 0.87 mg/ml). Differences in ATPase activity from these proteoliposomes were very similar to those measured prior to reconstitution (i.e., data in Fig. 4d) indicating that reconstitution efficiencies were comparable for the various mutants. Furthermore, differences in SSME currents are very similar to these ATPase activities, suggesting that Val496 mutants did not affect energy coupling. These data are shown in the revised Fig. 4 - figure suppl. 1a, along with the SSME raw data and size-exclusion chromatography elution profiles (Fig. 4 - figure suppl. 1b-g). We also altered the text to point out the concern over comparing transport data from different mutants (see below). We hope that this revised presentation adequately supports the conclusion that Val496 mutations - and especially the V496R substitution - influence the passage of K+ through the tunnel without affecting mechanics of the ATP-dependent pump.
The paragraph in question now reads as follows (pg. 6-7, with additional changes to legends to Fig. 4 and Fig. 4 - figure suppl. 1):
"In order to provide experimental evidence for K+ transport through the tunnel, we made a series of substitutions to Val496 in KdpA. This residue resides near the widest part of the tunnel and is fully exposed to its interior (Fig. 4a). We made substitutions to increase its bulk (V496M and V496W) and to introduce charge (V496E, V496R and V496H). We used the AlphaFold-3 artificial intelligence structure prediction program (Jumper et al., 2021) to generate structures of these mutants and to evaluate their potential impact on tunnel dimensions. This analysis predicts that V496W and V496R reduce the radius to well below the 1.4 Å threshold required for passage of K+ or water (Fig. 4c); V496E and V496M also constrict the tunnel, but to a lesser extent. Measurements of ATPase and transport activity (Fig. 4d) show that negative charge (V496E) has no effect. The or a longer side chain of (V496M) reduces transport modestly with have no apparent effect on ATPase activity. V496R, which introduces positive charge, almost completely abolishes activity. V496W and V496H reduce both transport and ATPase activity by about half, perhaps due to steric hindrance for the former and partial protonation for the latter. Transport activity of these mutants was also measured, but quantitative comparisons are hampered by potential inconsistency in reconstitution of proteoliposomes and in preparation of sensors for SSME. To account for differences in reconstitution, we compared ATPase activity and transport currents taken from the same batch of vesicles (Fig. 4 - figure suppl. 1a). These data show that differences in ATPase activity of proteoliposomes was consistent with differences measured prior to reconstitution (Fig. 4d). Transport activity, which was derived from multiple sensors, mirrored ATPase activity, indicating that the Val496 mutants did not affect energy coupling, but simply modulated turnover rate of the pump."
S162D was included as a negative control, together with D307A. However, given the inactive mutants discussed in Fig. 5 (Asp582 and Lys586 substitutions), these seem an unnecessary distraction and have been removed from Fig. 4 - figure suppl. 1.
Building upon the foundational idea that self-sabotage is a misguided protective instinct, Brianna Wiest’s second major argument presents a radical and empowering framework for understanding our emotional lives. It posits that the very moments of emotional distress we strive to avoid—our triggers, our “negative” feelings, our moments of disproportionate reaction—are not random malfunctions of our psyche. They are, in fact, an exquisitely precise internal guidance system. These triggers are like flares shot up from the deepest, most wounded parts of ourselves, signaling exactly where we need to direct our attention, compassion, and healing efforts. In this view, emotions like anger, jealousy, fear, and sadness are not enemies to be conquered or suppressed; they are messengers carrying vital information. To learn their language is to gain access to the blueprint of our own inner mountain. Therefore, the path to self-mastery does not lie in building higher walls to protect ourselves from being triggered, but in learning to walk toward the trigger with curiosity and courage, understanding that it is the very key that will unlock the chains of our past and set us free.
Such a powerful line that holds strong elements of truth.
Note: This response was posted by the corresponding author to Review Commons. The content has not been altered except for formatting.
Learn more at Review Commons
We would like to thank the referees for their time and effort in giving feedback on our work, and their overall positive attitude towards the manuscript. Most of the referees' points were of clarifying and textual nature. We have identified three points which we think require more attention in the form of additional analyses, simulations or significant textual changes:
Within the manuscript we state that conserved non coding sequences (CNSs) are a proxy for cis regulatory elements (CREs). We proceed to use these terms interchangeably without explaining the underlying assumption, which is inaccurate. To improve on this point we ensured in the new text that we are explicit about when we mean CNS or CRE. Secondly, we added a section to the discussion (‘Limitations of CNSs as CREs’) dedicated to this topic. During stabilising selection (maintaining the target phenotype) DSD can occur fully neutrally, or through the evolution of either mutational or developmental robustness. We describe the evolutionary trajectories of our simulations as neutral once fitness mostly plateaued; however, as reviewer 3 points out, small gains in median fitness still occur, indicating that either development becomes more robust to noisy gene expression and tissue variation, and/or the GRNs become more robust to mutations. To discern between fully neutral evolution where the fitness distribution of the population does not change, and the higher-order emergence of robustness, we performed additional analysis of the given results. Preliminary results showed that many (near-)neutral mutations affect the mutational robustness and developmental robustness, both positively and negatively. To investigate this further we will run an additional set of simulations without developmental stochasticity, which will take about a week. These simulations should allow us to more closely examine the role of stabilising selection (of developmental robustness) in DSD by removing the need to evolve developmental robustness. Additionally, we will set up simulations in which we changed the total number of genes, and the number of genes under selection to investigate how this modelling choice influences DSD. In the section on rewiring (‘Network redundancy creates space for rewiring’) we will analyse the mechanism allowing for rewiring in more depth, especially in the light of gene duplications and redundancy. We will extend this section with an additional analysis aimed to highlight how and when rewiring is facilitated. We will describe the planned and incorporated revisions in detail below; we believe these have led to a greatly improved manuscript.
Kind regards,
Pjotr van der Jagt, Steven Oud and Renske Vroomans
Referee cross commenting (Reviewer 4)
Reviewer 3's concern about DSD resulting from stabilising selection for robustness is something I missed -- this is important and should be addressed.
We understand this concern, and agree that we should be more thorough in our analysis of DSD by assessing the higher-order effects of stabilising selection on mutational robustness and/or environmental (developmental) robustness (McColgan & DiFrisco 2024).
We will 1) extend our analysis of fitness under DSD by computing the mutational and developmental robustness (similar to Figure 2F) over time for a number of ancestral lineages. By comparing these two measures over evolutionary time we will gain a much more fine grained image of the evolutionary dynamics and should be able to find adaptive trends through gain of either type of robustness. Preliminary results suggest that during the plateaued fitness phase both mutational robustness and developmental robustness undergo weak gains and losses, likely due to the pleiotropic nature of our GPM. Collectively, these weak gains and losses result in the gain observed in Figure S3. So, rather than fully neutral we should discern (near-)neutral regimes in which clear adaptive steps are absent, but in which the sum of them is a net gain. These are interesting findings we initially missed, and give insights into how this high-dimensional fitness landscape is traversed, and will be included in a future revised version of the manuscript.
2) We will run extra simulations without stochasticity to investigate DSD in the absence of adaptation through developmental robustness, and include the comparison between these and our original simulations in a future revised version.
Finally 3) we will address stabilising selection more prominently in the introduction and discussion to accommodate these additional simulations.
Reviewer 3 suggests that the model construction may favor DSD because there are many genes (14) of which only two determine fitness. I agree that some discussion on this point is warranted, though I am not sure enough is known about "the possible difference in constraints between the model and real development" for such a discussion to be on firm biological footing. A genetic architecture commonly found in quantitative genetic studies is that a small number of genes have large effects on the phenotype/fitness, whereas a very large number of genes have effects that are individually small but collectively large (see, e.g. literature surrounding the "omnigenic model" of complex traits). Implementing such an architecture is probably beyond the scope of the study here. More generally, would be natural to assume that the larger the number of genes, and the smaller the number of fitness-determining genes, the more likely DSD / re-wiring is to occur. That being said, I think the authors' choice of a 14-gene network is biologically defensible. It could be argued that the restriction of many modeling studies to small networks (often including just 3 genes) on the ground of convenience artificially ensures that DSD will not occur in these networks.
The choice of 14 genes does indeed stem from a compromise between constraining the number of available genes, but at the same time allowing for sufficient degrees of freedom and redundancy. We have added a ‘modelling choices’ section in the discussion in which we address this point. Additionally, it is important to note that, while the fitness criterion only measures the pattern of 2 genes, throughout the evolutionary lineage additional genes become highly important for the fitness of an individual, because these genes evolved to help generate the target pattern (see for example Figure 4); the other genes indeed reflect reviewer 4’s point that most genes have a small effect. Crucially, we observe that even the genes and interactions that are important for fitness undergo DSD.
Nevertheless, we think it is interesting to investigate this point of the influence of this particular modelling choice on the potential for DSD, and have set up an extra set of simulations with fewer gene types, and one with additional fitness genes.
Furthermore, we discuss the choice of our network architecture more in depth in a discussion section on our modelling choices: ‘Modelling assumptions and choices’.
Reviewer 1
The observation of DSD in the computational models remains rather high-level in the sense that no motifs, mechanisms, subgraphs, mutations or specific dynamics are reported to be associated to it ---with the exception of gene expression domains overlapping. Perhaps the authors feel it is beyond this study, but a Results section with a more in-depth "mechanistic" analysis on what enables DSD would (a) make a better case for the extensive and expensive computational models and (b) would push this paper to a next level. As a starting point, it could be nice to check Ohno's intuition that gene duplications are a creative "force" in evolution. Are they drivers of DSD? Or are TFBS mutations responsible for the majority of cases?
We agree that some mechanistic analysis would strengthen the manuscript, and will therefore extend the section ‘Network redundancy creates space for rewiring’ to address how this redundancy is facilitated. For instance, in the rewiring examples given in Figure 4 we can highlight how this new interaction emerges, if this is through a gene mutation followed by rewiring and loss of a redundant gene, or if the gain, redundancy and loss are all on the level of TFBS mutations. Effectively we will investigate which route of the three in the following schematic is most prominent:
Additionally, we will do analysis on the different effects of the transcription dynamics for each of these routes. (note that this is not an exhaustive schematic, and combinations could be possible).
l171. You discuss an example here, would it be possible to generalize this analysis and quantify the amount of DSD amongst all cloned populations? And related question: of the many conserved interactions in Fig 4A, how many do the two clonal lineages share? None? All?
We agree that this is a good idea. In a new supplementary figure, we will show the number of times a conserved interaction gets lost, and a new interaction is gained as a metric for DSD in every cloned population.
The populations in Fig 4A are cloned at generation 50.000, any interaction starting before then and still present at a point in time is shared. Any interactions starting after 50.000 are unique (or independently gained at least).
- l269. What about phenotypic plasticity due to stochastic gene expression? Does it play a role in DSD in your model? I am thinking about https://pubmed.ncbi.nlm.nih.gov/24884746/ and https://pubmed.ncbi.nlm.nih.gov/21211007/
We agree that this is an interesting point which should be included into the discussion. Following the comments of reviewer 3 we have set up extra simulations to investigate this in more detail, we will make sure to include these citations in the revised discussion when we have the results of those simulations.
Reviewer 3
Issue One: Interpretation of fitness gains under stabilising selection
A central issue concerns how the manuscript defines and interprets developmental systems drift (DSD) in relation to evolution on the fitness landscape. The authors define DSD as the conservation of a trait despite changes in its underlying genetic basis, which is consistent with the literature. However, the manuscript would benefit from clarifying the relationship between DSD, genotype-to-phenotype maps, and fitness landscapes. Very simply, we can say that (i) DSD can operate along neutral paths in the fitness landscape, (ii) DSD can operate along adaptive paths in the fitness landscape. During DSD, these neutral or adaptive paths along the fitness landscape are traversed by mutations that change the gene regulatory network (GRN) and consequent gene expression patterns whilst preserving the developmental outcome, i.e., the phenotype. While this connection between DSD and fitness landscapes is referenced in the introduction, it is not fully elaborated upon. A complete elaboration is critical because, when I read the manuscript, I got the impression that the manuscript claims that DSD is prevalent along neutral paths in the fitness landscape, not just adaptive ones. If I am wrong and this is not what the authors claim, it should be explicitly stated in the results and discussed. Nevertheless, claiming DSD operates along neutral paths is a much more interesting statement than claiming it operates along adaptive paths. However, it requires sufficient evidence, which I have an issue with.
The issue I have is about adaptations under stabilising selection. Stabilising selection occurs when there is selection to preserve the developmental outcome. Stabilising selection is essential to the results because evolutionary change in the GRN under stabilising selection should be due to DSD, not adaptations that change the developmental outcome. To ensure that the populations are under stabilising selection, the authors perform clonal experiments for 100,000 generations for 8 already evolved populations, 5 clones for each population. They remove 10 out of 40 clones because the fitness increase is too large, indicating that the developmental outcome changes over the 100,000 generations. However, the remaining 30 clonal experiments exhibit small but continual fitness increases over 100,000 generations. The authors claim that the remaining 30 are predominantly evolving due to drift, not adaptations (in the main text, line 137: "indicating predominantly neutral evolution", and section M: "too shallow for selection to outweigh drift"). The author's evidence for this claim is a mathematical analysis showing that the fitness gains are too small to be caused by beneficial adaptations, so evolution must be dominated by drift. I found this explanation strange, given that every clone unequivocally increases in fitness throughout the 100,000 generations, which suggests populations are adapting. Upon closer inspection of the mathematical analysis (section M), I believe it will miss many kinds of adaptations possible in their model, as I now describe.
The mathematical analysis treats fitness as a constant, but it's a random variable in the computational model. Fitness is a random variable because gene transcription and protein translation are stochastic (Wiener terms in Eqs. (1)-(5)) and cell positions change for each individual (Methods C). So, for a genotype G, the realised fitness F is picked from a distribution with mean μ_G and higher order moments (e.g., variance) that determine the shape of the distribution. I think these assumptions lead to two problems.
The first problem with the mathematical analysis is that F is replaced by an absolute number f_q, with beneficial mutations occurring in small increments denoted "a", representing an additive fitness advantage. The authors then take a time series of the median population fitness from their simulations and treat its slope as the individual's additive fitness advantage "a". The authors claim that drift dominates evolution because this slope is lower than a drift-selection barrier, which they derive from the mathematical analysis. This analysis ignores that the advantage "a" is a distribution, not a constant, which means that it does not pick up adaptations that change the shape of the distribution. Adaptations that change the shape of the distribution can be adaptations that increase robustness to stochasticity. Since there are multiple sources of noise in this model, I think it is highly likely that robustness to noise is selected for during these 100,000 generations.
The second problem is that the mathematical analysis ignores traits that have higher-order effects on fitness. A trait has higher-order effects when it increases the fitness of the lineage (e.g., offspring) but not the parent. One possible trait that can evolve in this model with higher-order effects is mutational robustness, i.e., traits that lower the expected mutational load of descendants. Since many kinds of mutations occur in this model (Table 2), mutational robustness may be also evolving.
Taken together, the analysis in Section M is set up to detect only immediate, deterministic additive gains in a single draw of fitness. It therefore cannot rule out weak but persistent adaptive evolution of robustness (to developmental noise and/or to mutations), and is thus insufficient evidence that DSD is occurring along neutral paths instead of adaptive paths. The small but monotonic fitness increases observed in all 40 clones are consistent with such adaptation (Fig. S3). The authors also acknowledge the evolution of robustness in lines 129-130 and 290-291, but the possibility of these adaptations driving DSD instead of neutral evolution is not discussed.
To address the issue I have with adaptations during stabilising selection, the authors should, at a minimum, state clearly in their results that DSD is driven by both the evolution of robustness and drift. Moreover, a paragraph in the discussion should be dedicated to why this is the case, and why it is challenging to separate DSD through neutral evolution vs DSD through adaptations such as those that increase robustness.
[OPTIONAL] A more thorough approach would be to make significant changes to the manuscript by giving sufficient evidence that the experimental clones are evolving by drift, or changing the model construction. One possible way to provide sufficient evidence is to improve the mathematical analysis. Another way is to show that the fitness distributions (both without and with mutations, like in Fig. 2F) do not significantly change throughout the 100,000 generations in experimental clones. It seems more likely that the model construction makes it difficult to separate the evolution of robustness from evolution by drift in the stabilising selection regime. Thus, I think the model should be constructed differently so that robustness against mutations and noise is much less likely to evolve after a "fitness plateau" is reached. This could be done by removing sources of noise from the model or reducing the kinds of possible mutations (related to issue two). In fact, I could not find justification in the manuscript for why these noise terms are included in the model, so I assume they are included for biological realism. If this is why noise is included, or if there is a separate reason why it is necessary, please write that in the model overview and/or the methods.
We agree that we should be more precise about whether DSD operates along neutral vs adaptive paths in the fitness landscape, and have expanded our explanation of this distinction in the introduction. We also agree that it is worthwhile to distinguish between neutral evolution that does not change the fitness distribution of the population (either through changes in developmental or mutational robustness), higher-order evolutionary processes that increase developmental robustness, and drift along a neutral path in the fitness landscape towards regions of greater connectivity, resulting in mutational robustness (as described in Huynen et al., 1999). We have performed a preliminary analysis to identify changes in mutational robustness and developmental robustness over evolutionary time in the populations in which the maximum fitness has already plateaued. This analysis shows frequent weak gains and losses, in which clear adaptive steps are absent but a net gain can be seen in robustness, as consistent with higher-order fitness effects.
To investigate the role of stabilising selection more in depth we will run simulations without developmental noise in the form of gene expression noise and tissue connectivity variation, thus removing the effect of the evolution of developmental robustness. We will compare the evolutionary dynamics of the GRNs with our original set of simulations, and include both these types of analyses in a supplementary figure of the revised manuscript.
Furthermore, we now discuss the limitations of the mathematical analysis with regard to adaptation vs neutrality in our simulations, in the supplementary section.
Issue two: The model construction may favour DSD
In this manuscript, fitness is determined by the expression pattern of two types of genes (genes 12 and 13 in Table 1). There are 14 types of genes in total that can all undergo many kinds of mutations, including duplications (Table 2). Thus, gene regulatory networks (GRNs) encoded by genomes in this model tend to contain large numbers of interactions. The results show that most of these interactions have minimal effect on reaching the target pattern in high fitness individuals (e.g. Fig. 2F). A consequence of this is that only a minimal number of GRN interactions are conserved through evolution (e.g. Fig. 2D). From these model constructions and results from evolutionary simulations, we can deduce that there are very few constraints on the GRN. By having very few constraints on the GRN, I think it makes it easy for a new set of pattern-producing traits to evolve and subsequently for an old set of pattern-producing traits to be lost, i.e., DSD. Thus, I believe that the model construction may favour DSD.
I do not have an issue with the model favouring DSD because it reflects real multicellular GRNs, where it is thought that a minority fraction of interactions are critical for fitness and the majority are not. However, it is unknown whether the constraints GRNs face in the model are more or less constrained than real GRNs. Thus, it is not known whether the prevalence of DSD in this model applies generally to real development, where GRN constraints depend on so many factors. At a minimum, the possible difference in constraints between the model and real development should be discussed as a limitation of the model. A more thorough change to the manuscript would be to test the effect of changing the constraints on the GRN. I am sure there are many ways to devise such a test, but I will give my recommendation here.
[OPTIONAL] My recommendation is that the authors should run additional simulations with simplified mutational dynamics by constraining the model to N genes (no duplications and deletions), of which M out of these N genes contribute to fitness via the specific pattern (with M=2 in the current model). The authors should then test the effect of changing N and M independently, and how this affects the prevalence of DSD. If the prevalence of DSD is robust to changes in N and M, it supports the authors argument that DSD is highly prevalent in developmental evolution. If DSD prevalence is highly dependent on M and/or N, then the claims made in the manuscript about the prevalence of DSD must change accordingly. I acknowledge that these simulations may be computationally expensive, and I think it would be great if the authors knew (or devised) a more efficient way to test the effect of GRN constraints on DSD prevalence. Nevertheless, these additional simulations would make for a potentially very interesting manuscript.
We agree that these modelling choices likely influence the potential for DSD. We think that our model setup, where most transcription factors are not under direct selection for a particular pattern, more accurately reflects biological development, where the outcome of the total developmental process (a functional organism) is what is under selection, rather than each individual gene pattern. As also mentioned by the referee, in real multicellular development the majority of interactions is not crucial for fitness, similar to our model. We also observe that, as fitness increases, additional genes experience emergent selection for particular expression patterns or interaction structures in the GRN, resulting in their conservation. Nevertheless, we do agree that the effect of model construction on DSD is an unexplored avenue and this work lends itself to addressing this. We will run additional sets of simulations: one in which we reduce the size of the network (‘N’), and a second set where we double the number of fitness contributing genes (‘M’), and show the effect on the extent of DSD in a future supplementary figure.
Referee cross commenting (Reviewer 4)
Overall I agree with the comments of Reviewer 1, 2 and 3. I note that reviewers 1, 3, and 4 each pointed out the difficulties with assuming that CNSs = CREs, so this needs to be addressed. Two reviewers (3 and 4) also point out problems with equating bulk RNAseq with a conserved phenotype.
We agree that caution is warranted with the assumption of CNSs = CREs. We have added a section to the discussion in which we discuss this more thoroughly, see ‘Limitations of CNSs as CREs’ in the revised manuscript.
Additionally, we made textual changes to the statement of significance, abstract and results to better reflect when we talk about CNSs or CREs.
I agree with Reviewer 1's hesitancy about the rhetorical framing of the paper potentially generalising too far from a computational model of plant meristem patterning.
We agree that the title should reflect the scope of the manuscript, and our short title reflects that better than ubiquitous, which implies we investigated beyond plant (meristem) development. We have changed the title in the revised version, to ‘System drift in the evolution of plant meristem development’.
Reviewer 1
It is system drift, not systems drift (see True and Haag 2001). No 's' after system.
Thank you for catching this – we corrected this throughout.
- I am afraid I have a problem with the manuscript title. I think "Ubiquitoes" is misplaced, because it strongly suggests you have a long list of case studies across plants and animals, and some quantification of DSD in these two kingdoms. That would have been an interesting result, but it is not what you report. I suggest something along the lines of "System drift in the evolution of plant meristem development", similar to the short title used in the footer.
- Alternatively, the authors may aim to say that DSD happens all over the place in computational models of development? In that case the title should reflect that the claim refers to modeling. (But what then about the data analysis part?)
As remarked in the summary (point 2), we agree with this assessment and have changed the title to ‘System drift in the evolution of plant meristem development’’
Multiple times in the Abstract and Introduction the authors make statements on "cis-regulatory elements" that are actually "conserved non-coding sequences" (CNS). Even if it is not uncommon for CNSs to harbor enhancers etc., I would be very hesitant to use the two as synonyms. As the authors state themselves, sequences, even non-coding, can be conserved for many reasons other than CREs. I would ask the authors to support better their use of "CREs" or adjust language. As roughly stated in their Discussion (lines 310-319), one way forward could be to show for a few CNS that are important in the analysis (of Fig 5), that they have experimentally-verified enhancers. Is that do-able or a bridge too far?
We changed the text such that we use CNS instead of CRE when discussing the bioinformatic analysis. Additionally we added a section in the discussion to clarify the relationship between CNS and CRE.
line 7. evo-devo is jargon
We changed this to ‘…evolution of development (evo-devo) research…’
l9. I would think "using a computational model and data analysis"
Yes, corrected.
l13. Strictly speaking you did not look at CREs, but at conserved non-coding sequences.
Indeed, we changed this to CNS.
l14. "widespread" is exaggerated here, since you show for a single organ in a handful of plant species. You may extrapolate and argue that you do not see why it should not be widespread, but you did not show it. Or tie in all the known cases that can be found in literature.
We understand that ‘widespread’ seems to suggest that we have investigated a broader range of species and organs. To be more accurate we changed the wording to ‘prevalent’.
l16. "simpler" than what?
We added the example of RNA folding.
l27. Again the tension between CREs and non-coding sequence.
Changed to conserved non coding sequence.
l28. I don't understand the use of "necessarily" here.
This is indeed confusing and unnecessary, removed
l34-35. A very general biology statement is backed up by two modeling studies. I would have expected also a few based on comparative analyses (e.g., fossils, transcriptomics, etc).
We added extra citations and a discussion of more experimental work
l36. I was missing the work on "phenogenetic drift" by Weiss; and Pavlicev & Wagner 2012 on compensatory mutations.
Changed the text to:
This phenomenon is called developmental system drift (DSD) (True and Haag, 2001; McColgan and DiFrisco, 2024), or phenogenetic drift (Weiss and Fullerton, 2000), and can occur when multiple genotypes which are separated by few mutational steps encode the same phenotype, forming a neutral (Wagner, 2008a; Crombach et al., 2016); or adaptive path (Johnson and Porter, 2007; Pavlicev and Wagner, 2012) .
l38. Kimura and Wagner never had a developmental process in mind, which is much bigger than a single nucleotide or a single gene, respectively. First paper that I am aware of that explicitly connects DSD to evolution on genotype networks is my own work (Crombach 2016), since the editor of that article (True, of True and Haag 2001) highlighted that point in our communications.
Added citation and moved Kimura to the theoretical examples of protein folding DSD.
l40. While Hunynen and Hogeweg definitely studied the GP map in many of their works, the term goes back to Pere Alberch (1991).
Added citation.
l54-55. I'm missing some motivation here. If one wants to look at multicellular structures that display DSD, vulva development in C. elegans and related worms is an "old" and extremely well-studied example. Also, studies on early fly development by Yogi Jaeger and his co-workers are not multicellular, but at least multi-nuclear. Obviously these are animal-based results, so to me it would make sense to make a contrast animal-plant regarding DSD research and take it from there.
Indeed, DSD has been found in these species and we now reference some of this work; the principle is better known in animals. Nevertheless, within the theoretical literature there is a continuing debate on the importance/extent of DSD.
Changed text:
‘For other GPMs, such as those resulting from multicellular development, it has been suggested that complex phenotypes are sparsely distributed in genotype space, and have low potential for DSD because the number of neutral mutations anti-correlates with phenotypic complexity (Orr, 2000; Hagolani et al., 2021). On the other hand, theoretical and experimental studies in nematodes and fruit flies have shown that DSD is present in a phenotypically complex context (Verster et al., 2014; Crombach et al., 2016; Jaeger, 2018). It therefore remains debated how much DSD actually occurs in species undergoing multicellular development. DSD in plants has received little attention. One multicellular structure which …’
l66-86. It is a bit of a style-choice, but this is a looong summary of what is to come. I would not have done that. Instead, in the Introduction I would have expected a bit more digging into the concept of DSD, mention some of the old animal cases, perhaps summarize where in plants it should be expected. More context, basically.
We extended the paragraph on empirical examples of DSD by adding the animal cases and condensed our summary.
l108. Could you quantify the conserved interactions shared between the populations? Or is each simulation so different that they are pretty much unique?
Each simulation here is independent of the other simulations, so a per interaction comparison would be uninformative. After cloning they do share ancestry, but that is much later in the manuscript and here the quantification of the conserved interactions would be the inverse of the divergence as shown in, for instance Figure 3B.
l169. "DSD driving functional divergence" needs some context, since DSD is supposed to not affect function (of the final phenotype). Or am I misunderstanding?
This is indeed a confusing sentence. We mean to say that DSD allows for divergence to such an extent that the underlying functional pathway is changed. So instead of a mere substitution of the underlying network, in which the topology and relative functions stay conserved, a different network structure is found. We have modified the line to read “Taken together, we found that DSD can drive functional divergence in the underlying GRN resulting in novel spatial expression dynamics of the genes not directly under selection.”
l176. Say which interaction it is. Is it 0->8, as mentioned in the next paragraph?
It is indeed 0->8, we have clarified this in the text.
l197. Bulk RNAseq has the problem of averaging gene expression over the population of cells. How do you think that impacts your test for rewiring? If you would do a similar "bulk RNA" style test on your computational models, would you pick up DSD?
The rewiring is based on the CNSs, whereas the RNAseq is used as phenotype, so it does not impact the test for rewiring.
The averaging of bulk RNAseq does however, mean that we cannot show conservation/divergence of the phenotype within the tissues, only between the different tissues.
The most important implication of doing this in our model would be the definition of the ‘phenotype’ which undergoes DSD. Currently the phenotype is a gene expression pattern on a cellular level, for bulk RNA this phenotype would change to tissue-level gene expression.
This change in what we measure as phenotype implicates how we interpret our results, but would not hinder us in picking up DSD, it just has a different meaning than DSD on a cellular - and single tissue scale.
We added clarification of the roles of the datasets at the start of the paragraph.
‘The Conservatory Project collects conserved non-coding sequences (CNSs) across plant genomes, which we used to investigate the extent of GRN rewiring in flowering plants. Schuster et al. measured gene expression in different homologous tissues of several species via bulk RNAseq, which we used to test for gene expression (phenotype) conservation, and how this relates to the GRN rewiring inferred from the CNSs.’
l202. I do not understand the "within" of a non-coding sequence within an orthogroup. How are non-coding sequences inside an orthogroup of genes?
We clarify this sentence by saying ‘A CNS is defined as a non-coding sequence conserved within the upstream/downstream region of genes within an orthogroup’, to more clearly separate the CNS from the orthogroup of genes. We also updated Figure 5A to reflect this better.
l207-217. This paragraph is difficult to read and would benefit of a rephrasing. Plant-specific jargon, numbers do not add up (line 211), statements are rather implicit (9 deeply conserved CNS are the 3+6? Where do I see them in Fig 5B? And where do I see the lineage-specific losses?).
We added extra annotations to the figure to make the plant jargon (angiosperm, eudicot, Brassicaceae) clear, and show the loss more clearly in the figure. We also clarified the text by splitting up 9 to 3 and 6.
l223. Looking at the shared CNS between SEP1-2, can you find a TF binding site or another property that can be interpreted as regulatory importance?
Reliably showing an active TF binding site would require experimental data, which we don’t have. We do mention in the discussion the need for datasets which could help address this gap.
l225. My intuition says that the continuity of the phenotype may not be necessary if its loss can be compensated for somehow by another part of the organism. I.e., DSD within DSD. It is a poorly elaborated thought, I leave it here for your information. Perhaps a Discussion point?
Although very interesting we think this discussion might be outside of the scope of this work, and would benefit from a standalone discussion – especially since the capacity for such compensation might differ between animals and plants (which are more “modular” organisms). This is our interpretation:
First, let’s take a step back from ‘genotype’ and ‘phenotype’ and redefine DSD more generally: in a system with multiple organisational levels, where a hierarchical mapping between them exists, DSD is changes on one organisational level which do not alter the outcome of the ‘higher’ organisational level. In other words, DSD can exist any many-to-one mapping in which a set of many (which map to the same one) are within a certain distance in space, which we generally define as a single mutational step.
Within this (slightly) more general definition we can extend the definition of DSD to the level of phenotype and function, in which phenotype describes the ‘many’ layer, and multiple phenotypes can fulfill the same function. When we are freed from the constraint of ‘genotype’ and ‘phenotype’, and DSD is defined at the level of this mapping, than it becomes an easy exercise to have multiple mappings (genotype→phenotype→function) and thus ‘DSD within DSD’.
l233. "rarely"? I don't see any high Pearson distances.
True in the given example there are no high Pearson distances, however some of the supplementary figures do so rarely felt like the most honest description. We changed the text to refer to these supplementary figures.
Fig 4. Re-order of panels? I was expecting B at C and vice versa.
Agreed, we swapped the order of the panels
Fig 5B. Red boxes not explained. Mention that it is an UpSetplot?
We added clarification to the figure caption.
Fig 5D. It would be nice to quantify the minor and major diffs between orthologs and paralogs.
We quantify the similarities (and thus differences) in Figure F, but we do indeed not show orthologs vs paralogs explicitly. We have extended Figure F to distinguish which comparisons are between orthologs vs paralogs with different tick marks, which shows their different distributions quite clearly.
- l247. Over-generalization. In a specific organ of plants...
Changed to vascular plant meristem.
- l249. Where exactly is this link between diverse expression patterns and the Schuster dataset made? I suggest the authors to make it more explicit in the Results.
We are slightly overambitious in this sentence. The Schuster dataset confirms the preservation of expression where the CNS dataset shows rewiring. That this facilitates diversification of expression patterns in traits not under selection is solely an outcome of the computational model. We have changed the text to reflect this more clearly.
- l268. Final sentence of the paragraph left me puzzled. Why talk about opposite function?
The goal here was to highlight regulatory rewiring which, in the most extreme case, would achieve an opposite function for a given TF within development. We agree that this was formulated vaguely so we rewrote this to be more to the point.
These examples demonstrate that whilst the function of pathways is conserved, their regulatory wiring often is not.
- l269. What about time scales generated by the system? Looking at Fig 2C and 2D, the elbow pattern is pretty obvious. That means interactions sort themselves into either short-lived or long-lived. Worth mentioning?
Added a sentence to highlight this.
- l291. Evolution in a *constant* fitness landscape increases robustness.
Changed
- l296. My thoughts, for your info: I suspect morphogenesis as single parameters instead of as mechanisms makes for a brittle landscape, resulting in isolated parts of the same phenotype.
We agree, and now include citations to different models in which morphogenesis evolves which seem to display a more connected landscape.
Reviewer 2
Every computational model necessarily makes some simplifying assumptions. It would be nice if the authors could summarise in a paragraph in the Discussion the main assumptions made by their model, and which of those are most worth revisiting in future studies. In the current draft, some assumptions are described in different places in the manuscript, which makes it hard for a non-expert to evaluate the limitations of this model.
We added a section to the discussion: ‘Modelling assumptions and choices’
I did not find any mention of potential energetic constraints or limitations in this model. For example, I would expect high levels of gene expression to incur significant energy costs, resulting in evolutionary trade-offs. Could the authors comment on how taking energy limitations into account might influence their results?
This would put additional constraints on the evolution/fitness landscape. Some paths/regions of the fitness landscape which are currently accessible will not be traversable anymore. On the other hand, an energy constraint might reduce certain high fitness areas to a more even plane and thus make it more traversable. During analysis of our data there were no signs of extremely high gene expression levels.
Figure 3C lists Gene IDs 1, 2, 8, and 11, but the caption refers to genes 1, 2, 4, and 11.
Thank you for catching this.
Reviewer 3
The authors present an analysis correlating conserved non-coding sequence (CNS) composition with gene expression to investigate developmental systems drift. One flaw of this analysis is that it uses deeply conserved sequences as a proxy for the entire cis-regulatory landscape. The authors acknowledge this flaw in the discussion.
Another potential flaw is equating the bulk RNA-seq data with a conserved phenotype. In lines 226-227 of the manuscript, it is written that "In line with our computational model, we compared gene expression patterns to measure changes in phenotype." I am not sure if there is an equivalence between the two. In the computational model, the developmental outcome determining fitness is a spatial pattern, i.e., an emergent product of gene expression and cell interactions. In contrast, the RNA-seq data shows bulk measurements in gene expression for different organs. It is conceivable that, despite having very similar bulk measurements, the developmental outcome in response to gene expression (such as a spatial pattern or morphological shape) changes across species. I think this difference should be explicitly addressed in the discussion. The authors may have intended to discuss this in lines 320-326, although it is unclear to me.
It is correct that the CNS data and RNA-seq data has certain limitations, and the brief discussion of some of these limitations in lines 320-326 is not sufficient. We have been more explicit on this point in the discussion.
The gene expression data used in this study represents bulk expression at the organ level, such as the vegetative meristem (Schuster et al., 2024). This limits our analysis of the phenotypic effects of rewiring to comparisons between organs, which is different to our computational simulations where we look at within organ gene expression. Additionally, the bulk RNA-seq does not allow us to discern whether the developmental outcome of similar gene expression is the same in all these species. More fine-grained approaches, such as single-cell RNA sequencing or spatial transcriptomics, will provide a more detailed understanding of how gene expression is modulated spatially and temporally within complex tissues of different organisms, allowing for a closer alignment between computational predictions and experimental observations.
Can the authors justify using these six species in the discussion or the results? Are there any limitations with choosing four closely related and two distantly related species for this analysis, in contrast to, say, six distantly related species? If so, please elaborate in the discussion.
The use of these six species is mainly limited by the datasets we have available. Nevertheless, the combination of four closely related species, and two more distantly related species gives a better insight into the short vs long term divergence dynamics than six distantly related species would. We have noted this when introducing the datasets:
This set of species contains both closely (A. thaliana, A. lyrata, C. rubella, E. salsugineum) and more distantly related species (M. truncatula, B. distachyon), which should give insight in short and long term divergence.
In Figure S7, some profiles show no conservation across the six species. Can we be sure that a stabilising selection pressure conserves any CNSs? Is it possible that the deeply conserved CNSs mentioned in the main text are conserved by chance, given the large number of total CNSs? A brief comment on these points in the results or discussion would be helpful.
In our simulations, we find that even CREs that were under selection for a long time can disappear; however, in our neutral simulations, CREs were not conserved, suggesting that deep conservation is the result of selection. When it comes to CNSs, the assumption is that they often contain CREs that are under selection.We have added a more elaborate section on CNSs in the discussion. See ‘Limitations of CNSs as CREs’
Line 7-8: I thought this was a bit difficult to read. The connection between (i) evolvability of complex phenotypes, (ii) neutral/beneficial change hindered by deleterious mutations, and (iii) DSD might not be so simple for many readers, so I think it should be rewritten. The abstract was well written, though.
We made the connection to DSD and evolvability clearer and removed the specific mutational outcomes:
*A key open question in evolution of development (evo-devo) is the evolvability of complex phenotypes. Developmental system drift (DSD) may contribute to evolvability by exploring different genotypes with similar phenotypic outcome, but with mutational neighbourhoods that have different, potentially adaptive, phenotypes. We investigated the potential for DSD in plant development using a computational model and data analysis. *
Line 274 vs 276: Is there a difference between regulatory dynamics and regulatory mechanisms?
No, we should use the same terminology. We have changed this to be clearer.
Figure S4: Do you expect the green/blue lines to approach the orange line in the long term? In some clonal experiments, it seems like it will. In others, it seems like it has plateaued. Under continual DSD, I assume they should converge. It would be interesting to see simulations run sufficiently long to see if this occurs.
In principle yes, however this might take a considerable amount of time given that some conserved interactions take >75000 generations to be rewired.
Line 27: Evolutionarily instead of evolutionary?
Changed
Line 67-68: References in brackets?
Changed
Line 144: Capitalise "fig"
Changed
Fig. 3C caption: correct "1, 2, 4, 11" (should be 8)
Changed
Line 192: Reference repeated
Changed
Fig. 5 caption: Capitalise "Supplementary figure"
Changed
Line 277: Correct "A previous model Johnson.."
Changed
Line 290: Brackets around reference
Changed
Line 299: Correct "will be therefore be"
Changed
Line 394: Capitalise "table"
Changed
Line 449: Correct "was build using"
Changed
Fig. 5B: explain the red dashed boxes in the caption
Added explanation to the caption
Some of the Figure panels might benefit from further elaboration in their respective captions, such as 3C and 5F.
Improved the figure captions.
Reviewer 4
Statement of significance. The logical connection between the first two sentences is not clear. What does developmental system drift have to do with neutral/beneficial mutations?
This is indeed an unclear jump. Changed such that the connection between evolvability of complex phenotypes and DSD is more clear:
*A key open question in evolution of development (evo-devo) is the evolvability of complex phenotypes. Developmental system drift (DSD) contributes to evolvability by exploring different genotypes with similar phenotypic outcome, but with mutational neighbourhoods that have different, potentially adaptive, phenotypes..We investigated the potential for DSD in plant development using a computational model and data analysis. *
l 41 - "DSD is found to ... explain the developmental hourglass." Caution is warranted here. Wotton et al 2015 claim that "quantitative system drift" explains the hourglass pattern, but it would be more accurate to say that shifting expression domains and strengths allows compensatory regulatory change to occur with the same set of genes (gap genes). It is far from clear how DSD could explain the developmental hourglass pattern. What does DSD imply about the causes of differential conservation of different developmental stages? It's not clear there is any connection here.
We should indeed be more cautious here. DSD is indeed not in itself an explanation of the hourglass model, but only a mechanism by which the developmental divergence observed in the hourglass model could have emerged. As per Pavlicev and Wagner, 2012, compensatory changes resulting from other shifts would fall under DSD, and can explain how the patterning outcome of the gap gene network is conserved. However, this does not explain why some stages are under stronger selection than others. We changed the text to reflect this.
‘...be a possible evolutionary mechanism involved in the developmental hourglass model (Wotton et al., 2015; Crombach et al., 2016)...’
ll 51-53 - "Others have found that increased complexity introduces more degrees of freedom, allowing for a greater number of genotypes to produce the same phenotype and potentially allowing for more DSD (Schiffman and Ralph, 2022; Greenbury et al., 2022)." Does this refer to increased genomic complexity or increased phenotypic complexity? It is not clear that increased phenotypic complexity allows a greater number of genotypes to produce the same phenotype. Please explain further.
The paragraph discusses complexity in the GPM as a whole, where the first few examples in the paragraph regard phenotypic complexity, and the ones in l51-53 refer to genomic complexity. This is currently not clear so we clarified the text.
‘For other GPMs, such as those resulting from multicellular development, it has been suggested that complex phenotypes are sparsely distributed in genotype space, and have low potential for DSD because the number of neutral mutations anti-correlates with phenotypic complexity (Orr, 2000; Hagolani et al., 2021). Others have found that increased genomic complexity introduces more degrees of freedom, allowing for a greater number of genotypes to produce the same phenotype and potentially allowing for more DSD (Schiffman and Ralph, 2022; Greenbury et al., 2022).’
It was not clear why some gene products in the model have the ability to form dimers. What does this contribute to the simulation results? This feature is introduced early on, but is not revisited. Is it necessary?
*Fitness. The way in which fitness is determined in the model was not completely clear to me. *
Dimers are not necessary, but as they have been found to play a role in actual SAM development we added them to increase the realism of the developmental simulations. In some simulations the patterning mechanism involves the dimer, in others it does not, suggesting that dimerization is not essential for DSD.
We have made changes to the methods to clarify fitness.
Lines 103-104 say: "Each individual is assigned a fitness score based on the protein concentration of two target genes in specific regions of the SAM: one in the central zone (CZ), and one in the organizing center (OC)." How are these regions positionally defined in the simulation?
We have defined bounding boxes to define cells as either CZ, OC or both. We have added these bounds in the figure description and more clearly in the revised methods.
F, one reads (l. 385): "Fitness depends on the correct protein concentration of the two fitness genes in each cell, pcz and poc respectively." This sounds like fitness is determined by the state of all cells rather than the state of the two specific regions of the SAM. Please clarify.
A fitness penalty is given for incorrect expression so it is true that the fitness is determined by the state of all cells. We agree that it is phrased unclearly and have clarified this in the text.
The authors use conserved non-coding sequences as a proxy for cis-regulatory elements. More specification of how CNSs were assigned to an orthogroup seems necessary in this section. Is assignment based on proximity to the coding region? Of course the authors will appreciate that regulatory elements can be located far from the gene they regulate. This data showed extensive gains and losses of CNS. It might be interesting to consider how much of this is down to transposons, in which case rapid rearrangement is not unexpected. A potential problem with the claim that the data supports the simulation results follows from the fact that DSD is genetic divergence despite trait conservation, but conserved traits appear to have only been defined or identified in the case of the SEP genes. It can't be ruled out that divergence in CNSs and in gene expression captured by the datasets is driven by straightforward phenotypic adaptation, thus not by DSD. Further caution on this point is needed.
CNSs are indeed assigned based on proximity up to 50kb, the full methods are described in detail in Hendelman et al., (2021). CREs can be located further than 50kb, but evidence suggests that this is rare for species with smaller genomes.
In the cases where both gene expression and the CNSs diverged it can indeed not be ruled out that there has been phenotypic adaptation. We clarified in the text that the lower Pearson distances are informative for DSD as they highlight conserved phenotypes.
l. 290-291 - "However, evolution has been shown to increase mutational robustness over time, resulting in the possibility for more neutral change." It is doubtful that there is any such unrestricted trend. If mutational robustness only tended to increase, new mutations would not affect the phenotype, and phenotypes would be unable to adapt to novel environments. Consider rethinking this statement.
We have reformulated this statement, since it is indeed not expected that this trend is indefinite. Infinite robustness would indeed result in the absence of evolvability; however, it has been shown for other genotype-phenotype maps that mutational robustness, where a proportion of mutations is neutral, aids the evolution of novel traits. The evolution of mutational robustness also depends on population size and mutation rate. This trend will, most probably, also be stronger in modelling work where the fitness function is fixed, compared to a real life scenario where ‘fitness’ is much less defined and subject to continuous change. We added ‘constant’ to the fitness landscape to highlight this disparity.
ll. 316-317 "experimental work investigating the developmental role of CREs has shown extensive epistasis - where the effect of a mutation depends on the genetic background - supporting DSD." How does extensive epistasis support DSD? One can just as easily imagine scenarios where high interdependence between genes would prevent DSD from occurring. Please explain further.
We should be more clear. Experimental work has shown that the effect of mutating a particular CRE strongly depends on the genetic background, also known as epistasis. Counterintuitively, this indirectly supports the presence of DSD, since it means that different species or strains have slightly different developmental mechanisms, resulting in these different mutational effects. We have shown how epistatic effects shift over evolutionary time.
Overall I found the explanation of the Methods, especially the formal aspects, to be unclear at times and would recommend that the authors go back over the text to improve its clarity.
We rewrote parts of the methods and some of the equations to be more clear and cohesive throughout the text.
C. Tissue Generation. Following on the comment on fitness above, it would be advisable to provide further details on how cell positions are defined. How much do the cells move over the course of the simulation? What is the advantage of modelling the cells as "springs" rather than as a simple grid?
The tissue generation is purely a process to generate a database of tissue templates: the random positions, springs and voronoi method serve the purpose of having similar but different tissues to prevent unrealistic overfitting of our GRNs on a single topology. For each individual’s development however, only one, unchanging template is used. We clarified this in the methods.
E. Development of genotype into phenotype. The diffusion term in the SDE equations is hard to understand as no variable for spatial position (x) is included in the equation. It seems this equation should rather be an SPDE with a position variable and a specified boundary condition (i.e. the parabola shape). In eq. 5 it should be noted that the Wi are independent. Also please justify the choice of how much noise/variance is being stipulated here.
We have rewritten parts of this section for clarity and added citations.
F. Fitness function. I must say I found formula 7 to be unclear. It looks like fi is the fitness of cell(s) but, from Section G, fitness is a property of the individual. It seems formula 7 should define fi as a sum over the cell types or should capture the fitness contribution of the cell types.
Correct. We have rewritten this equation. We’ll define fi as the fitness contribution of a cell, F as the sum of fi, so the fitness of an individual, and use F in function 8.
What is the basis for the middle terms (fractions) in the equation? After plugging in the values for pcz and poc, this yields a number, but how does that number assign a cell to one of the types? If a reviewer closely scrutinizing this section cannot make sense of it, neither will readers. Please explain further.
The cell type is assigned based on the spatial location of the cell, and the correct fitness function for each of these cell types is described in this equation. We have clarified the text and functions.
A minor note: it would be best practice not to re-use variables to refer to different things within the same paper. For example p refers to protein concentration but also probability of mutation.
Corrected
Note: This preprint has been reviewed by subject experts for Review Commons. Content has not been altered except for formatting.
Learn more at Review Commons
In "Ubiquitous system drift in the evolution of development," van der Jagt et al. report a large-scale simulation study of the evolution of gene networks controlling a developmental patterning process. The 14-gene simulation shows interesting results: continual rewiring of the network and establishment of essential genes which themselves are replaced on long time scales. The authors suggest that this result is validated by plant genome and expression data from some public datasets. Overall, this study lends support to the idea that developmental system drift may be more pervasive in the evolution of complex gene networks than is currently appreciated.
I have a number of comments, mostly of a clarificatory nature, that the authors can consider in revision.
Statement of significance. The logical connection between the first two sentences is not clear. What does developmental system drift have to do with neutral/beneficial mutations?
l 41 - "DSD is found to ... explain the developmental hourglass." Caution is warranted here. Wotton et al 2015 claim that "quantitative system drift" explains the hourglass pattern, but it would be more accurate to say that shifting expression domains and strengths allows compensatory regulatory change to occur with the same set of genes (gap genes). It is far from clear how DSD could explain the developmental hourglass pattern. What does DSD imply about the causes of differential conservation of different developmental stages? It's not clear there is any connection here.
ll 51-53 - "Others have found that increased complexity introduces more degrees of freedom, allowing for a greater number of genotypes to produce the same phenotype and potentially allowing for more DSD (Schiffman and Ralph, 2022; Greenbury et al., 2022)." Does this refer to increased genomic complexity or increased phenotypic complexity? It is not clear that increased phenotypic complexity allows a greater number of genotypes to produce the same phenotype. Please explain further. 2. Model
It was not clear why some gene products in the model have the ability to form dimers. What does this contribute to the simulation results? This feature is introduced early on, but is not revisited. Is it necessary?
Fitness. The way in which fitness is determined in the model was not completely clear to me. Lines 103-104 say: "Each individual is assigned a fitness score based on the protein concentration of two target genes in specific regions of the SAM: one in the central zone (CZ), and one in the organizing center (OC)." How are these regions positionally defined in the simulation? In Methods section F, one reads (l. 385): "Fitness depends on the correct protein concentration of the two fitness genes in each cell, pcz and poc respectively." This sounds like fitness is determined by the state of all cells rather than the state of the two specific regions of the SAM. Please clarify. 3. Data
The authors use conserved non-coding sequences as a proxy for cis-regulatory elements. More specification of how CNSs were assigned to an orthogroup seems necessary in this section. Is assignment based on proximity to the coding region? Of course the authors will appreciate that regulatory elements can be located far from the gene they regulate. This data showed extensive gains and losses of CNS. It might be interesting to consider how much of this is down to transposons, in which case rapid rearrangement is not unexpected. A potential problem with the claim that the data supports the simulation results follows from the fact that DSD is genetic divergence despite trait conservation, but conserved traits appear to have only been defined or identified in the case of the SEP genes. It can't be ruled out that divergence in CNSs and in gene expression captured by the datasets is driven by straightforward phenotypic adaptation, thus not by DSD. Further caution on this point is needed. 4. Discussion
ll. 290-291 - "However, evolution has been shown to increase mutational robustness over time, resulting in the possibility for more neutral change." It is doubtful that there is any such unrestricted trend. If mutational robustness only tended to increase, new mutations would not affect the phenotype, and phenotypes would be unable to adapt to novel environments. Consider rethinking this statement.
ll. 316-317 "experimental work investigating the developmental role of CREs has shown extensive epistasis - where the effect of a mutation depends on the genetic background - supporting DSD." How does extensive epistasis support DSD? One can just as easily imagine scenarios where high interdependence between genes would prevent DSD from occurring. Please explain further. 5. Methods
Overall I found the explication of the Methods, especially the formal aspects, to be unclear at times and would recommend that the authors go back over the text to improve its clarity.
C. Tissue Generation. Following on the comment on fitness above, it would be advisable to provide further details on how cell positions are defined. How much do the cells move over the course of the simulation? What is the advantage of modelling the cells as "springs" rather than as a simple grid?
E. Development of genotype into phenotype. The diffusion term in the SDE equations is hard to understand as no variable for spatial position (x) is included in the equation. It seems this equation should rather be an SPDE with a position variable and a specified boundary condition (i.e. the parabola shape). In eq. 5 it should be noted that the Wi are independent. Also please justify the choice of how much noise/variance is being stipulated here.
F. Fitness function. I must say I found formula 7 to be unclear. It looks like fi is the fitness of cell(s) but, from Section G, fitness is a property of the individual. It seems formula 7 should define fi as a sum over the cell types or should capture the fitness contribution of the cell types.
What is the basis for the middle terms (fractions) in the equation? After plugging in the values for pcz and poc, this yields a number, but how does that number assign a cell to one of the types? If a reviewer closely scrutinizing this section cannot make sense of it, neither will readers. Please explain further.
A minor note: it would be best practice not to re-use variables to refer to different things within the same paper. For example p refers to protein concentration but also probability of mutation.
Referee cross-commenting
Overall I agree with the comments of Reviewer 1, 2 and 3. I note that reviewers 1, 3, and 4 each pointed out the difficulties with assuming that CNSs = CREs, so this needs to be addressed. Two reviewers (3 and 4) also point out problems with equating bulk RNAseq with a conserved phenotype.
I agree with Reviewer 1's hesitancy about the rhetorical framing of the paper potentially generalising too far from a computational model of plant meristem patterning.
Reviewer 3's concern about DSD resulting from stabilising selection for robustness is something I missed -- this is important and should be addressed.
Reviewer 3 suggests that the model construction may favor DSD because there are many genes (14) of which only two determine fitness. I agree that some discussion on this point is warranted, though I am not sure enough is known about "the possible difference in constraints between the model and real development" for such a discussion to be on firm biological footing. A genetic architecture commonly found in quantitative genetic studies is that a small number of genes have large effects on the phenotype/fitness, whereas a very large number of genes have effects that are individually small but collectively large (see, e.g. literature surrounding the "omnigenic model" of complex traits). Implementing such an architecture is probably beyond the scope of the study here. More generally, would be natural to assume that the larger the number of genes, and the smaller the number of fitness-determining genes, the more likely DSD / re-wiring is to occur. That being said, I think the authors' choice of a 14-gene network is biologically defensible. It could be argued that the restriction of many modeling studies to small networks (often including just 3 genes) on the ground of convenience artificially ensures that DSD will not occur in these networks.
I agree with the other reviewers on the overall positive assessment of the significance of the manuscript. There are many points to address and revise, but the core setup and result of this study is sound and should be published.
In "Ubiquitous system drift in the evolution of development," van der Jagt et al. report a large-scale simulation study of the evolution of gene networks controlling a developmental patterning process. The 14-gene simulation shows interesting results: continual rewiring of the network and establishment of essential genes which themselves are replaced on long time scales. The authors suggest that this result is validated by plant genome and expression data from some public datasets. Overall, this study lends support to the idea that developmental system drift may be more pervasive in the evolution of complex gene networks than is currently appreciated.
Note: This preprint has been reviewed by subject experts for Review Commons. Content has not been altered except for formatting.
Learn more at Review Commons
Summary:
This manuscript uses an Evo-Devo model of the plant apical meristem to explore the potential for developmental systems drift (DSD). DSD occurs when the genetic underpinnings of development change through evolution while reaching the same developmental outcome. The mechanisms underlying DSD are theoretically intriguing and highly relevant for our understanding of how multicellular species evolve. The manuscript shows that DSD occurs extensively and continuously in their evolutionary simulations whilst populations evolve under stabilising selection. The authors examine regulatory rewiring across plant angiosperms to link their theoretical model with real data. The authors claim that, despite the conservation of genetic wiring in angiosperm species over shorter evolutionary timescales, this genetic wiring changes over long evolutionary timescales due to DSD, which is consistent with their theoretical model.
Major comments:
I enjoyed reading the author's approach to understanding DSD and the link to empirical data. I think it is a very important line of investigation that deserves more theoretical and experimental attention. All the data and methods are clearly presented, and the software for the research is publicly available. Sufficient information is given to reproduce all results. However, I have two major issues relating to the theoretical part of the research.
Issue One: Interpretation of fitness gains under stabilising selection
A central issue concerns how the manuscript defines and interprets developmental systems drift (DSD) in relation to evolution on the fitness landscape. The authors define DSD as the conservation of a trait despite changes in its underlying genetic basis, which is consistent with the literature. However, the manuscript would benefit from clarifying the relationship between DSD, genotype-to-phenotype maps, and fitness landscapes. Very simply, we can say that (i) DSD can operate along neutral paths in the fitness landscape, (ii) DSD can operate along adaptive paths in the fitness landscape. During DSD, these neutral or adaptive paths along the fitness landscape are traversed by mutations that change the gene regulatory network (GRN) and consequent gene expression patterns whilst preserving the developmental outcome, i.e., the phenotype. While this connection between DSD and fitness landscapes is referenced in the introduction, it is not fully elaborated upon. A complete elaboration is critical because, when I read the manuscript, I got the impression that the manuscript claims that DSD is prevalent along neutral paths in the fitness landscape, not just adaptive ones. If I am wrong and this is not what the authors claim, it should be explicitly stated in the results and discussed. Nevertheless, claiming DSD operates along neutral paths is a much more interesting statement than claiming it operates along adaptive paths. However, it requires sufficient evidence, which I have an issue with. The issue I have is about adaptations under stabilising selection. Stabilising selection occurs when there is selection to preserve the developmental outcome. Stabilising selection is essential to the results because evolutionary change in the GRN under stabilising selection should be due to DSD, not adaptations that change the developmental outcome. To ensure that the populations are under stabilising selection, the authors perform clonal experiments for 100,000 generations for 8 already evolved populations, 5 clones for each population. They remove 10 out of 40 clones because the fitness increase is too large, indicating that the developmental outcome changes over the 100,000 generations. However, the remaining 30 clonal experiments exhibit small but continual fitness increases over 100,000 generations. The authors claim that the remaining 30 are predominantly evolving due to drift, not adaptations (in the main text, line 137: "indicating predominantly neutral evolution", and section M: "too shallow for selection to outweigh drift"). The author's evidence for this claim is a mathematical analysis showing that the fitness gains are too small to be caused by beneficial adaptations, so evolution must be dominated by drift. I found this explanation strange, given that every clone unequivocally increases in fitness throughout the 100,000 generations, which suggests populations are adapting. Upon closer inspection of the mathematical analysis (section M), I believe it will miss many kinds of adaptations possible in their model, as I now describe. The mathematical analysis treats fitness as a constant, but it's a random variable in the computational model. Fitness is a random variable because gene transcription and protein translation are stochastic (Wiener terms in Eqs. (1)-(5)) and cell positions change for each individual (Methods C). So, for a genotype G, the realised fitness F is picked from a distribution with mean μ_G and higher order moments (e.g., variance) that determine the shape of the distribution. I think these assumptions lead to two problems. The first problem with the mathematical analysis is that F is replaced by an absolute number f_q, with beneficial mutations occurring in small increments denoted "a", representing an additive fitness advantage. The authors then take a time series of the median population fitness from their simulations and treat its slope as the individual's additive fitness advantage "a". The authors claim that drift dominates evolution because this slope is lower than a drift-selection barrier, which they derive from the mathematical analysis. This analysis ignores that the advantage "a" is a distribution, not a constant, which means that it does not pick up adaptations that change the shape of the distribution. Adaptations that change the shape of the distribution can be adaptations that increase robustness to stochasticity. Since there are multiple sources of noise in this model, I think it is highly likely that robustness to noise is selected for during these 100,000 generations. The second problem is that the mathematical analysis ignores traits that have higher-order effects on fitness. A trait has higher-order effects when it increases the fitness of the lineage (e.g., offspring) but not the parent. One possible trait that can evolve in this model with higher-order effects is mutational robustness, i.e., traits that lower the expected mutational load of descendants. Since many kinds of mutations occur in this model (Table 2), mutational robustness may be also evolving. Taken together, the analysis in Section M is set up to detect only immediate, deterministic additive gains in a single draw of fitness. It therefore cannot rule out weak but persistent adaptive evolution of robustness (to developmental noise and/or to mutations), and is thus insufficient evidence that DSD is occurring along neutral paths instead of adaptive paths. The small but monotonic fitness increases observed in all 40 clones are consistent with such adaptation (Fig. S3). The authors also acknowledge the evolution of robustness in lines 129-130 and 290-291, but the possibility of these adaptations driving DSD instead of neutral evolution is not discussed. To address the issue I have with adaptations during stabilising selection, the authors should, at a minimum, state clearly in their results that DSD is driven by both the evolution of robustness and drift. Moreover, a paragraph in the discussion should be dedicated to why this is the case, and why it is challenging to separate DSD through neutral evolution vs DSD through adaptations such as those that increase robustness. [OPTIONAL] A more thorough approach would be to make significant changes to the manuscript by giving sufficient evidence that the experimental clones are evolving by drift, or changing the model construction. One possible way to provide sufficient evidence is to improve the mathematical analysis. Another way is to show that the fitness distributions (both without and with mutations, like in Fig. 2F) do not significantly change throughout the 100,000 generations in experimental clones. It seems more likely that the model construction makes it difficult to separate the evolution of robustness from evolution by drift in the stabilising selection regime. Thus, I think the model should be constructed differently so that robustness against mutations and noise is much less likely to evolve after a "fitness plateau" is reached. This could be done by removing sources of noise from the model or reducing the kinds of possible mutations (related to issue two). In fact, I could not find justification in the manuscript for why these noise terms are included in the model, so I assume they are included for biological realism. If this is why noise is included, or if there is a separate reason why it is necessary, please write that in the model overview and/or the methods.
Issue two: The model construction may favour DSD
In this manuscript, fitness is determined by the expression pattern of two types of genes (genes 12 and 13 in Table 1). There are 14 types of genes in total that can all undergo many kinds of mutations, including duplications (Table 2). Thus, gene regulatory networks (GRNs) encoded by genomes in this model tend to contain large numbers of interactions. The results show that most of these interactions have minimal effect on reaching the target pattern in high fitness individuals (e.g. Fig. 2F). A consequence of this is that only a minimal number of GRN interactions are conserved through evolution (e.g. Fig. 2D). From these model constructions and results from evolutionary simulations, we can deduce that there are very few constraints on the GRN. By having very few constraints on the GRN, I think it makes it easy for a new set of pattern-producing traits to evolve and subsequently for an old set of pattern-producing traits to be lost, i.e., DSD. Thus, I believe that the model construction may favour DSD. I do not have an issue with the model favouring DSD because it reflects real multicellular GRNs, where it is thought that a minority fraction of interactions are critical for fitness and the majority are not. However, it is unknown whether the constraints GRNs face in the model are more or less constrained than real GRNs. Thus, it is not known whether the prevalence of DSD in this model applies generally to real development, where GRN constraints depend on so many factors. At a minimum, the possible difference in constraints between the model and real development should be discussed as a limitation of the model. A more thorough change to the manuscript would be to test the effect of changing the constraints on the GRN. I am sure there are many ways to devise such a test, but I will give my recommendation here. [OPTIONAL] My recommendation is that the authors should run additional simulations with simplified mutational dynamics by constraining the model to N genes (no duplications and deletions), of which M out of these N genes contribute to fitness via the specific pattern (with M=2 in the current model). The authors should then test the effect of changing N and M independently, and how this affects the prevalence of DSD. If the prevalence of DSD is robust to changes in N and M, it supports the authors argument that DSD is highly prevalent in developmental evolution. If DSD prevalence is highly dependent on M and/or N, then the claims made in the manuscript about the prevalence of DSD must change accordingly. I acknowledge that these simulations may be computationally expensive, and I think it would be great if the authors knew (or devised) a more efficient way to test the effect of GRN constraints on DSD prevalence. Nevertheless, these additional simulations would make for a potentially very interesting manuscript.
Minor comments:
General Assessment:
This manuscript tackles a fundamental evolutionary problem of developmental systems drift (DSD). Its primary strength lies in its integrative approach, combining a multiscale evo-devo model with a comparative genomic analysis in angiosperms. This integrative approach provides a new way of investigating how developmental mechanisms can evolve even while the resulting phenotype is conserved. The details of the theoretical model are well defined and succinctly combined across scales. The manuscript employs several techniques to analyse the conservation and divergence of the theoretical model's gene regulatory networks (GRNs), which are rigorous yet easy to grasp. This study provides a strong platform for further integrative approaches to tackle DSD and multicellular evolution.
The study's main limitations are due to the theoretical model construction and the interpretation of the results. The central claim that DSD occurs extensively through predominantly neutral evolution is not sufficiently supported, as the analysis does not rule out an alternative: DSD is caused by adaptive evolution for increased robustness to developmental or mutational noise. Furthermore, constructing the model with a high-dimensional GRN space and a low-dimensional phenotypic target may create particularly permissive conditions for DSD, raising questions about the generality of the theoretical conclusions. However, these limitations could be resolved by changes to the model and further simulations, although these require extensive research. The genomic analysis uses cis-regulatory elements as a proxy for the entire regulatory landscape, a limitation the authors are aware of and discuss. The genomic analysis uses bulk RNA-seq as a proxy for the developmental outcome, which may not accurately reflect differences in plant phenotypes.
Advance:
The concept of DSD is well-established, but mechanistic explorations of its dynamics in complex multicellular models are still relatively rare. This study represents a mechanistic advance by providing a concrete example of how DSD can operate continuously under stabilising selection. I found the evolutionary simulations and subsequent analysis of mechanisms underlying DSD in the theoretical model interesting, and these simulations and analyses open new pathways for studying DSD in theoretical models. To my knowledge, the attempt to directly link the dynamics from such a complex evo-devo model to patterns of regulatory element conservation across a real phylogeny (angiosperms) is novel. However, I think that the manuscript does not have sufficient evidence to show a high prevalence of DSD through neutral evolution in their theoretical model, which would be a highly significant conceptual result. The manuscript does have sufficient evidence to show a high prevalence of DSD through adaptive evolution under stabilising selection, which is a conceptually interesting, albeit somewhat expected, result.
Audience:
This work will be of moderate interest to a specialised audience in the fields of evolutionary developmental biology (evo-devo), systems biology, and theoretical/computational biology. Researchers in these areas will be interested in the model and the dynamics of GRN conservation and divergence. The results may interest a broader audience across the fields of evolutionary biology and molecular evolution.
Expertise:
My expertise is primarily in theoretical and computational models of biology and biophysics. While I have sufficient background knowledge in bioinformatics to assess the logic of the authors' genomic analysis and its connection to their theoretical model, I do not have sufficient expertise to critically evaluate the technicalities of the bioinformatic methods used for the identification of conserved non-coding sequences (CNSs) or analysis of RNA-seq data. A reviewer with expertise in plant comparative genomics would be better suited to judge the soundness of these specific methods.
Note: This preprint has been reviewed by subject experts for Review Commons. Content has not been altered except for formatting.
Learn more at Review Commons
Summary:
In this manuscript, van der Jagt and co-workers present a computational model of the evolution of gene regulatory networks that underpin the development of shoot apical meristems in plants. They find evidence for conservation of a subset of regulatory interactions over many thousands of generations. They also show that after reaching a fitness plateau, the topology of regulatory interactions continues to evolve, giving rise to substantial differences in regulatory networks among cloned populations. Their model suggests that cis-regulatory rewiring is key for developmental evolution, and they reach a similar conclusion after analysing two empirical datasets covering six land plant species. Overall, I find that this study is excellently executed, its methodology sufficiently described, and that its claims are well-supported by the data presented.
Major comments:
Minor comments:
I have to note that my expertise is not in developmental systems drift, but I am generally interested in the evolution of complex phenotypes in response to various environmental pressures. Thus, I do not feel qualified to evaluate the novelty of this work, which I hope other reviewers have done. Nevertheless, I found this study very interesting and the manuscript generally easy to understand. I believe that this study will be of strong interest primarily (but not only) to evolutionary and systems biologists, regardless of the taxonomic group of their research focus.
Note: This preprint has been reviewed by subject experts for Review Commons. Content has not been altered except for formatting.
Learn more at Review Commons
# Summary
On the basis of computational modelling and bioinformatic data analysis, the authors report evidence for Developmental System Drift in the plant apical meristem (a plant stem cell tissue from which other tissues and organs grow, like shoots and roots). The modelling focuses on a general (shoot) apical meristem, the data analysis on the floral meristem. As a non-plant computational biologist, I was lacking some basic plant biology to immediately understand all the technical terms. It hindered a bit, but was not a show-stopper. That said, I interpret their study as follows.
In the computational modelling part, the authors take into account gene expression, protein complex formation, stochasticity (expression noise), tissue shape, etc. to do evolutionary simulations to obtain a "standard" gene expression pattern known from the shoot apical meristem. Next, they analyze the gene regulatory networks in terms of conserved regulatory interactions. They find two timescales, either interactions quickly turn-over or they are slowly replaced (because under selection). The slowly replaced interactions are important for the realization of the phenotype and their turnover (further explored in a separate set of "neutral evolution" simulations) is called DSD by the authors. The authors state that at the basis of DSD is overlap in gene expression domains, such that genes can take over from each other. Next, the authors analyze two public data sets to show that DSD-associated phenomena such as turn-over of (conserved) noncoding sequences and differences in gene expression patterns occur in plants.
Considering my limited amount of time and energy, I apologize in advance for stupidities and/or un-elegantly formulated sentences. I'll be happy to discuss with the authors about this work, it was a pleasant summer read!
Anton Crombach
Major comments
Minor comments
Statement of significance:
Abstract:
Introduction:
Results:
l233. "rarely"? I don't see any high Pearson distances.
Fig 4. Re-order of panels? I was expecting B at C and vice versa.
Discussion: - l247. Over-generalization. In a specific organ of plants...<br /> - l249. Where exactly is this link between diverse expression patterns and the Schuster dataset made? I suggest the authors to make it more explicit in the Results. - l268. Final sentence of the paragraph left me puzzled. Why talk about opposite function?<br /> - l269. What about phenotypic plasticity due to stochastic gene expression? Does it play a role in DSD in your model? I am thinking about https://pubmed.ncbi.nlm.nih.gov/24884746/ and https://pubmed.ncbi.nlm.nih.gov/21211007/ - l269. What about time scales generated by the system? Looking at Fig 2C and 2D, the elbow pattern is pretty obvious. That means interactions sort themselves into either short-lived or long-lived. Worth mentioning? - l291. Evolution in a constant fitness landscape increases robustness. - l296. My thoughts, for your info: I suspect morphogenesis as single parameters instead of as mechanisms makes for a brittle landscape, resulting in isolated parts of the same phenotype.
Methods: I have diagonally read through the Methods section, I did not have time to dig in. I hope another reviewer can compensate for me.
Nature and significance of advance
I find this study a strong contribution to the concept of DSD. It was good to see that colleagues have done the effort of making a convincing case for the presence of DSD in plants. This will be appreciated by the evo-devo community in general. On top of that, the computational modelling work is excellent and sets new standards that will be appreciated by computational colleagues. And I anticipate that the evolutionary biology community welcomes the extension of DSD to the plant kingdom; so far it has been dominated by animal studies.
I see two limitations: (1) almost no mechanistic explanation of what drives DSD in the simulations. (2) the Abstract, Introduction, etc. need some polishing to be better in line with the results reported.
Context of existing literature
Literature is very modeling focused, it could use some empirical support. Also, some literature on DSD is missing: Weiss 2005, Pavlicev 2012, "Older" C. elegans work by the group of Marie-Anne Felix. Probably some more recent empirical case studies have established DSD as well... I may not be aware, as I did not keep track of it.
What audience?
In no particular order: plant evolution, plant development, evo-devo, computational biology.
My field of expertise
My expertise: gene regulatory networks, evolution, development (in animals), computational modelling, bioinformatic data analysis (single cell omics).
Phylogenetic tree building is surely not my strength.
This is actually more generous than what many Europeans are taking home as part of their old-age pension benefits.
Most European earn less, during their working lifetimes and in retirement, but are not burdened by healthcare costs and the high cost of living in the US--which is the third highest worldwide, following Israel and Iceland.
eLife Assessment
In flies defective for axonal transport of mitochondria, the authors report the upregulation of one subunit, the beta subunit, of the heterotrimeric eIF2 complex via mass spectroscopy proteomics. Neuronal overexpression of eIF2β phenocopied aspects of neuronal dysfunction observed when axonal transport of mitochondria was compromised. Conversely, lowering eIF2β expression suppressed aspects of neuronal dysfunction. While these are intriguing and useful observations, technical weaknesses limit the interpretation. On balance, the evidence supporting the current claims is suggestive but incomplete, especially concerning the characterization of the eIF2 heterotrimer and the data regarding translational regulation.
Author response:
The following is the authors’ response to the original reviews.
Reviewer #1 (Recommendations for the authors):
I will address here just some minor changes that would improve understanding, reproducibility, or cohesion with the literature.
(1) It would be good to mention that the prostatic vesicle of this study is named vesicula granulorum in (Steniböck, 1966) and granule vesicle in (Hooge et al, 2007).
We have now included this (line 90 of our revised manuscript).
(2) A slightly more detailed discussion of the germline genes would be interesting. For example, a potential function of pa1b3-2 and cgnl1-2 based on the similarity to known genes or on the conserved domains.
Pa1b3-2 appears to encode an acetylhydrolase; cgnl1-2 is likely a cingulin family protein involved in cell junctions. However, given the evolutionary distance between acoels and model organisms in whom these genes have been studied, we believe it is premature to speculate on their function without substantial additional work. We believe this work would be more appropriate in a future publication focused on the molecular genetic underpinnings of Hofstenia’s reproductive systems and their development.
(3) It is mentioned that the animals can store sperm while lacking a seminal bursa "given that H. miamia can lay eggs for months after a single mating" (line 635) - this could also be self-fertilization, according to the authors' other findings.
We agree that it is possible this is self-fertilization, and we believe we have represented this uncertainty accurately in the text. However, we do not think this is likely, because self-fertilization manifests as a single burst of egg laying (Fig. 6D). We discuss this in the Results (line 540).
(4) A source should be given for the tree in Figure 7B.
We have now included this source (line 736), and we apologize for the oversight.
(5) Either in the Methods or in the Results section, it would be good to give more details on why actin and FMRFamide and tropomyosin are chosen for the immunohistochemistry studies.
We have now included more detail in the Methods (line 823). Briefly, these are previously-validated antibodies that we knew would label relevant morphology.
(6) In the Methods "a standard protocol hematoxylin eosin" is mentioned. Even if this is a fairly common technique, more details or a reference should be provided.
We have now included more detail, and a reference (lines 766-774).
(7) Given the historical placement of Acoela within Platyhelminthes and the fact that the readers might not be very familiar with this group of animals, two passages can be confusing: line 499 and lines 674-678.
We have edited these sentences to clarify when we mean platyhelminthes, which addresses this confusion.
(8) A small addition to Table S1: Amphiscolops langerhansi also presents asexual reproduction through fission ([1], cited in [2]]).
Thanks. We have included this in Table S1.
(a) Hanson, E. D. 1960. 'Asexual Reproduction in Acoelous Turbellaria'. The Yale Journal of Biology and Medicine 33 (2): 107-11.
(b) Hendelberg, Jan, and Bertil Åkesson. 1991. 'Studies of the Budding Process in Convolutriloba Retrogemma (Acoela, Platyhelminthes)'. In Turbellarian Biology: Proceedings of the Sixth International Symposium on the Biology of the Turbellaria, Held at Hirosaki, Japan, 7-12 August 1990, 11-17. Springer.
Reviewer #2 (Recommendations for the authors):
I do not have any major comments on the manuscript. By default, I feel descriptive studies are a critical part of the advancement of science, particularly if the data are of great quality - as is the case here. The manuscript addresses various topics and describes these adequately. My minor point would be that in some sections, it feels like one could have gone a bit deeper. I highlighted three examples in the weakness section above (deeper analysis of markers for germline; modes of oogenesis/spermatogenesis; or proposed model for sperm storage). For instance, ultrastructural data might have been informative. But as said, I don't see this as a major problem, more a "would have been nice to see".
We have responded to these points in detail above.
Reviewer #1 (Public review):
This study investigates the contribution of renal dysfunction to systemic and neuronal decline in Drosophila models of Gaucher disease (Gba1b mutants) and Parkinson's disease (Parkin mutants). While lysosomal and mitochondrial pathways are known drivers in these disorders, the role of kidney-like tissues in disease progression has not been well explored.
The authors use Drosophila melanogaster to model renal dysfunction, focusing on Malpighian tubules (analogous to renal tubules) and nephrocytes (analogous to podocytes). They employ genetic mutants, tissue-specific rescues, imaging of renal architecture, redox probes, functional assays, nephrocyte dextran uptake, and lifespan analyses. They also test genetic antioxidant interventions and pharmacological treatment.
The main findings show that renal pathology is progressive in Gba1b mutants, marked by Malpighian tubule disorganization, stellate cell loss, lipid accumulation, impaired water and ion regulation, and reduced nephrocyte filtration. A central theme is redox dyshomeostasis, reflected in whole-fly GSH reduction, paradoxical mitochondrial versus cytosolic redox shifts, reduced ROS signals, increased lipid peroxidation, and peroxisomal impairment. Antioxidant manipulations (Nrf2, Sod1/2, CatA, and ascorbic acid) consistently worsen outcomes, suggesting a fragile redox balance rather than classical oxidative stress. Parkin mutants also develop renal degeneration, with impaired mitophagy and complete nephrocyte dysfunction by 28 days, but their mechanism diverges from that of Gba1b. Rapamycin treatment rescues several renal phenotypes in Gba1b but not in Parkin, highlighting distinct disease pathways.
The authors propose that renal dysfunction is a central disease-modifying feature of Gaucher and Parkinson's disease models, driven by redox imbalance and differential engagement of lysosomal (Gba1b) vs. mitochondrial (Parkin) mechanisms. They suggest that maintaining renal health and redox balance may represent therapeutic opportunities and biomarkers in neurodegenerative disease. This is a significant manuscript that reframes GD/PD pathology through the lens of renal health. The data are extensive. However, several claims are ahead of the evidence and should be supported with additional experiments.
Major Comments:
(1) The abstract frames progressive renal dysfunction as a "central, disease-modifying feature" in both Gba1b and Parkin models, with systemic consequences including water retention, ionic hypersensitivity, and worsened neuro phenotypes. While the data demonstrates renal degeneration and associated physiological stress, the causal contribution of renal defects versus broader organismal frailty is not fully disentangled. Please consider adding causal experiments (e.g., temporally restricted renal rescue/knockdown) to directly establish kidney-specific contributions.
(2) The manuscript shows multiple redox abnormalities in Gba1b mutants (reduced whole fly GSH, paradoxical mitochondrial reduction with cytosolic oxidation, decreased DHE, increased lipid peroxidation, and reduced peroxisome density/Sod1 mislocalization). These findings support a state of redox imbalance, but the driving mechanism remains broad in the current form. It is unclear if the dominant driver is impaired glutathione handling or peroxisomal antioxidant/β-oxidation deficits or lipid peroxidation-driven toxicity, or reduced metabolic flux/ETC activity. I suggest adding targeted readouts to narrow the mechanism.
(3) The observation that broad antioxidant manipulations (Nrf2 overexpression in tubules, Sod1/Sod2/CatA overexpression, and ascorbic acid supplementation) consistently shorten lifespan or exacerbate phenotypes in Gba1b mutants is striking and supports the idea of redox fragility. However, these interventions are broad. Nrf2 influences proteostasis and metabolism beyond redox regulation, and Sod1/Sod2/CatA may affect multiple cellular compartments. In the absence of dose-response testing or controls for potential off-target effects, the interpretation that these outcomes specifically reflect redox dyshomeostasis feels ahead of the data. I suggest incorporating narrower interpretations (e.g., targeting lipid peroxidation directly) to clarify which redox axis is driving the vulnerability.
(4) This manuscript concludes that nephrocyte dysfunction does not exacerbate brain pathology. This inference currently rests on a limited set of readouts: dextran uptake and hemolymph protein as renal markers, lifespan as a systemic measure, and two brain endpoints (LysoTracker staining and FK2 polyubiquitin accumulation). While these data suggest that nephrocyte loss alone does not amplify lysosomal or ubiquitin stress, they may not fully capture neuronal function and vulnerability. To strengthen this conclusion, the authors could consider adding functional or behavioral assays (e.g., locomotor performance)
(5) The manuscript does a strong job of contrasting Parkin and Gba1b mutants, showing impaired mitophagy in Malpighian tubules, complete nephrocyte dysfunction by day 28, FRUMS clearance defects, and partial rescue with tubule-specific Parkin re-expression. These findings clearly separate mitochondrial quality control defects from the lysosomal axis of Gba1b. However, the mechanistic contrast remains incomplete. Many of the redox and peroxisomal assays are only presented for Gba1b. Including matched readouts across both models (e.g., lipid peroxidation, peroxisome density/function, Grx1-roGFP2 compartmental redox status) would make the comparison more balanced and strengthen the conclusion that these represent distinct pathogenic routes.
(6) Rapamycin treatment is shown to rescue several renal phenotypes in Gba1b mutants (water retention, RSC proliferation, FRUMS clearance, lipid peroxidation) but not in Parkin, and mitophagy is not restored in Gba1b. This provides strong evidence that the two models engage distinct pathogenic pathways. However, the therapeutic interpretation feels somewhat overstated. Human relevance should be framed more cautiously, and the conclusions would be stronger with mechanistic markers of autophagy (e.g., Atg8a, Ref(2)p flux in Malpighian tubules) or with experiments varying dose, timing, and duration (short-course vs chronic rapamycin).
(7) Several systemic readouts used to support renal dysfunction (FRUMS clearance, salt stress survival) could also be influenced by general organismal frailty. To ensure these phenotypes are kidney-intrinsic, it would be helpful to include controls such as tissue-specific genetic rescue in Malpighian tubules or nephrocytes, or timing rescue interventions before overt systemic decline. This would strengthen the causal link between renal impairment and the observed systemic phenotypes.