- May 2024
-
inst-fs-iad-prod.inscloudgate.net inst-fs-iad-prod.inscloudgate.net
-
A procedural error that may occur at any point during the IEP process is failure to involve parents.The Supreme Court’s decisions in Hendrick Hudson Central School District Board of Education v.Rowley (1982) and Endrew F. v. Douglas County School District (2017) emphasized the importanceof the collaboration between school personnel and a student’s parents throughout the IEP process—during the planning stages, development of the IEP, and the implementation of services andsupports—evidence that this procedural right is vigorously protected by the courts.2iris.peabody.vanderbilt.edu090519
I have only ever worked for the school I am at- so my outside experience with IEP's is limited to the way I was trained and any transfer students where I have had to review IEPs from other schools. One of the most common comments I have heard is that parents do not feel included in the IEP process and they mostly feel that during the IEP they are simply being told what will be done rather than having an active voice in the process.
-
-
accessmedicine-mhmedical-com.proxy.ub.umu.se accessmedicine-mhmedical-com.proxy.ub.umu.se
-
Ground substance of the ECM.
Tittar vi på grundsubstansen systematiskt kan vi hitta kollagen fibrer, elastiskt fiber, fibroblaster men även långa trådliknande strukturer. Dessa är hyaluronan-trådar och till sig har de olika proteoglykaner bundna till sig. Och varje proteoglykan monomer består av ett core protein och hit är GAGs bundna. Core proteinet är bundet till hyaluronanet med hjälp av link protein.
Allt detta syns väldigt tydligt i figur 5-16
-
mixture of three major kinds of macromolecules: glycosaminoglycans (GAGs), proteoglycans, and multiadhesive glycoproteins
Grundsubstans som är en del av det extracellulära matrix består huvudsakligen av tre typer av makromolekyler: Glykoaminoglykaner = GAGs, Proteoglykaner oc glykoproteiner som fungerar som vidhäftande punkter. Grundsubstans fyller utrymmet runtom cellerna och fibrerna i bindväven och bidrar till diffusion av små molekyler
-
-
www.biorxiv.org www.biorxiv.org
-
Author response:
The following is the authors’ response to the original reviews.
Reviewer #1 (Public Review):
Strengths:
The study was designed as a 6-month follow-up, with repeated behavioral and EEG measurements through disease development, providing valuable and interesting findings on AD progression and the effect of early-life choline supplantation. Moreover, the behavioral data that suggest an adverse effect of low choline in WT mice are interesting and important beyond the context of AD.
Thank you for identifying several strengths.
Weaknesses:
(1) The multiple headings and subheadings, focusing on the experimental method rather than the narrative, reduce the readability.
We have reduced the number of headings.
(2) Quantification of NeuN and FosB in WT littermates is needed to demonstrate rescue of neuronal death and hyperexcitability by high choline supplementation and also to gain further insights into the adverse effect of low choline on the performance of WT mice in the behavioral test.
We agree and have added WT data for the NeuN and ΔFosB analyses. These data are included in the text and figures. For NeuN, the Figure is Figure 6. For ΔFosB it is Figure 7. In brief, the high choline diet restored NeuN and ΔFosB to the levels of WT mice.
Below is Figure 6 and its legend to show the revised presentation of data for NeuN. Afterwards is the revised figure showing data for ΔFosB. After that are the sections of the Results that have been revised.
Author response image 1.
Choline supplementation improved NeuN immunoreactivity (ir) in hilar cells in Tg2576 animals. A. Representative images of NeuN-ir staining in the anterior DG of Tg2576 animals. (1) A section from a Tg2576 mouse fed the low choline diet. The area surrounded by a box is expanded below. Red arrows point to NeuN-ir hilar cells. Mol=molecular layer, GCL=granule cell layer, HIL=hilus. Calibration for the top row, 100 µm; for the bottom row, 50 µm. (2) A section from a Tg2576 mouse fed the intermediate diet. Same calibrations as for 1. (3) A section from a Tg2576 mouse fed the high choline diet. Same calibrations as for 1. B. Quantification methods. Representative images demonstrate the thresholding criteria used to quantify NeuN-ir. (1) A NeuN-stained section. The area surrounded by the white box is expanded in the inset (arrow) to show 3 hilar cells. The 2 NeuN-ir cells above threshold are marked by blue arrows. The 1 NeuN-ir cell below threshold is marked by a green arrow. (2) After converting the image to grayscale, the cells above threshold were designated as red. The inset shows that the two cells that were marked by blue arrows are red while the cell below threshold is not. (3) An example of the threshold menu from ImageJ showing the way the threshold was set. Sliders (red circles) were used to move the threshold to the left or right of the histogram of intensity values. The final position of the slider (red arrow) was positioned at the onset of the steep rise of the histogram. C. NeuN-ir in Tg2576 and WT mice. Tg2576 mice had either the low, intermediate, or high choline diet in early life. WT mice were fed the standard diet (intermediate choline). (1) Tg2576 mice treated with the high choline diet had significantly more hilar NeuN-ir cells in the anterior DG compared to Tg2576 mice that had been fed the low choline or intermediate diet. The values for Tg2576 mice that received the high choline diet were not significantly different from WT mice, suggesting that the high choline diet restored NeuN-ir. (2) There was no effect of diet or genotype in the posterior DG, probably because the low choline and intermediate diet did not appear to lower hilar NeuN-ir.

Author response image 2.
Choline supplementation reduced ∆FosB expression in dorsal GCs of Tg2576 mice. A. Representative images of ∆FosB staining in GCL of Tg2576 animals from each treatment group. (1) A section from a low choline-treated mouse shows robust ∆FosB-ir in the GCL. Calibration, 100 µm. Sections from intermediate (2) and high choline (3)-treated mice. Same calibration as 1. B. Quantification methods. Representative images demonstrating the thresholding criteria established to quantify ∆FosB. (1) A ∆FosB -stained section shows strongly-stained cells (white arrows). (2) A strict thresholding criteria was used to make only the darkest stained cells red. C. Use of the strict threshold to quantify ∆FosB-ir. (1) Anterior DG. Tg2576 mice treated with the choline supplemented diet had significantly less ∆FosB-ir compared to the Tg2576 mice fed the low or intermediate diets. Tg2576 mice fed the high choline diet were not significantly different from WT mice, suggesting a rescue of ∆FosB-ir. (2) There were no significant differences in ∆FosB-ir in posterior sections. D. Methods are shown using a threshold that was less strict. (1) Some of the stained cells that were included are not as dark as those used for the strict threshold (white arrows). (2) All cells above the less conservative threshold are shown in red. E. Use of the less strict threshold to quantify ∆FosB-ir. (1) Anterior DG. Tg2576 mice that were fed the high choline diet had less ΔFosB-ir pixels than the mice that were fed the other diets. There were no differences from WT mice, suggesting restoration of ∆FosB-ir by choline enrichment in early life. (2) Posterior DG. There were no significant differences between Tg2576 mice fed the 3 diets or WT mice.

Results, Section C1, starting on Line 691:
“To ask if the improvement in NeuN after MCS in Tg256 restored NeuN to WT levels we used WT mice. For this analysis we used a one-way ANOVA with 4 groups: Low choline Tg2576, Intermediate Tg2576, High choline Tg2576, and Intermediate WT (Figure 5C). Tukey-Kramer multiple comparisons tests were used as the post hoc tests. The WT mice were fed the intermediate diet because it is the standard mouse chow, and this group was intended to reflect normal mice. The results showed a significant group difference for anterior DG (F(3,25)=9.20; p=0.0003; Figure 5C1) but not posterior DG (F(3,28)=0.867; p=0.450; Figure 5C2). Regarding the anterior DG, there were more NeuN-ir cells in high choline-treated mice than both low choline (p=0.046) and intermediate choline-treated Tg2576 mice (p=0.003). WT mice had more NeuN-ir cells than Tg2576 mice fed the low (p=0.011) or intermediate diet (p=0.003). Tg2576 mice that were fed the high choline diet were not significantly different from WT (p=0.827).”
Results, Section C2, starting on Line 722:
“There was strong expression of ∆FosB in Tg2576 GCs in mice fed the low choline diet (Figure 7A1). The high choline diet and intermediate diet appeared to show less GCL ΔFosB-ir (Figure 7A2-3). A two-way ANOVA was conducted with the experimental group (Tg2576 low choline diet, Tg2576 intermediate choline diet, Tg2576 high choline diet, WT intermediate choline diet) and location (anterior or posterior) as main factors. There was a significant effect of group (F(3,32)=13.80, p=<0.0001) and location (F(1,32)=8.69, p=0.006). Tukey-Kramer post-hoc tests showed that Tg2576 mice fed the low choline diet had significantly greater ΔFosB-ir than Tg2576 mice fed the high choline diet (p=0.0005) and WT mice (p=0.0007). Tg2576 mice fed the low and intermediate diets were not significantly different (p=0.275). Tg2576 mice fed the high choline diet were not significantly different from WT (p>0.999). There were no differences between groups for the posterior DG (all p>0.05).”
“∆FosB quantification was repeated with a lower threshold to define ∆FosB-ir GCs (see Methods) and results were the same (Figure 7D). Two-way ANOVA showed a significant effect of group (F(3,32)=14.28, p< 0.0001) and location (F(1,32)=7.07, p=0.0122) for anterior DG but not posterior DG (Figure 7D). For anterior sections, Tukey-Kramer post hoc tests showed that low choline mice had greater ΔFosB-ir than high choline mice (p=0.0024) and WT mice (p=0.005) but not Tg2576 mice fed the intermediate diet (p=0.275); Figure 7D1). Mice fed the high choline diet were not significantly different from WT (p=0.993; Figure 7D1). These data suggest that high choline in the diet early in life can reduce neuronal activity of GCs in offspring later in life. In addition, low choline has an opposite effect, suggesting low choline in early life has adverse effects.”
(3) Quantification of the discrimination ratio of the novel object and novel location tests can facilitate the comparison between the different genotypes and diets.
We have added the discrimination index for novel object location to the paper. The data are in a new figure: Figure 3. In brief, the results for discrimination index are the same as the results done originally, based on the analysis of percent of time exploring the novel object.
Below is the new Figure and legend, followed by the new text in the Results.
Author response image 3.
Novel object location results based on the discrimination index. A. Results are shown for the 3 months-old WT and Tg2576 mice based on the discrimination index. (1) Mice fed the low choline diet showed object location memory only in WT. (2) Mice fed the intermediate diet showed object location memory only in WT. (3) Mice fed the high choline diet showed memory both for WT and Tg2576 mice. Therefore, the high choline diet improved memory in Tg2576 mice. B. The results for the 6 months-old mice are shown. (1-2) There was no significant memory demonstrated by mice that were fed either the low or intermediate choline diet. (3) Mice fed a diet enriched in choline showed memory whether they were WT or Tg2576 mice. Therefore, choline enrichment improved memory in all mice.

Results, Section B1, starting on line 536:
“The discrimination indices are shown in Figure 3 and results led to the same conclusions as the analyses in Figure 2. For the 3 months-old mice (Figure 3A), the low choline group did not show the ability to perform the task for WT or Tg2576 mice. Thus, a two-way ANOVA showed no effect of genotype (F(1,74)=0.027, p=0.870) or task phase (F(1,74)=1.41, p=0.239). For the intermediate diet-treated mice, there was no effect of genotype (F(1,50)=0.3.52, p=0.067) but there was an effect of task phase (F(1,50)=8.33, p=0.006). WT mice showed a greater discrimination index during testing relative to training (p=0.019) but Tg2576 mice did not (p=0.664). Therefore, Tg2576 mice fed the intermediate diet were impaired. In contrast, high choline-treated mice performed well. There was a main effect of task phase (F(1,68)=39.61, p=<0.001) with WT (p<0.0001) and Tg2576 mice (p=0.0002) showing preference for the moved object in the test phase. Interestingly, there was a main effect of genotype (F(1,68)=4.50, p=0.038) because the discrimination index for WT training was significantly different from Tg2576 testing (p<0.0001) and Tg2576 training was significantly different from WT testing (p=0.0003).”
“The discrimination indices of 6 months-old mice led to the same conclusions as the results in Figure 2. There was no evidence of discrimination in low choline-treated mice by two-way ANOVA (no effect of genotype, (F(1,42)=3.25, p=0.079; no effect of task phase, F(1,42)=0.278, p=0.601). The same was true of mice fed the intermediate diet (genotype, F(1,12)=1.44, p=0.253; task phase, F(1,12)=2.64, p=0.130). However, both WT and Tg2576 mice performed well after being fed the high choline diet (effect of task phase, (F(1,52)=58.75, p=0.0001, but not genotype (F(1,52)=1.197, p=0.279). Tukey-Kramer post-hoc tests showed that both WT (p<0.0001) and Tg2576 mice that had received the high choline diet (p=0.0005) had elevated discrimination indices for the test session.”
(4) The longitudinal analyses enable the performance of multi-level correlations between the discrimination ratio in NOR and NOL, NeuN and Fos levels, multiple EEG parameters, and premature death. Such analysis can potentially identify biomarkers associated with AD progression. These can be interesting in different choline supplementation, but also in the standard choline diet.
We agree and added correlations to the paper in a new figure (Figure 9). Below is Figure 9 and its legend. Afterwards is the new Results section.
Author response image 4.
Correlations between IIS, Behavior, and hilar NeuN-ir. A. IIS frequency over 24 hrs is plotted against the preference for the novel object in the test phase of NOL. A greater preference is reflected by a greater percentage of time exploring the novel object. (1) The mice fed the high choline diet (red) showed greater preference for the novel object when IIS were low. These data suggest IIS impaired object location memory in the high choline-treated mice. The low choline-treated mice had very weak preference and very few IIS, potentially explaining the lack of correlation in these mice. (2) There were no significant correlations for IIS and NOR. However, there were only 4 mice for the high choline group, which is a limitation. B. IIS frequency over 24 hrs is plotted against the number of dorsal hilar cells expressing NeuN. The dorsal hilus was used because there was no effect of diet on the posterior hilus. (1) Hilar NeuN-ir is plotted against the preference for the novel object in the test phase of NOL. There were no significant correlations. (2) Hilar NeuN-ir was greater for mice that had better performance in NOR, both for the low choline (blue) and high choline (red) groups. These data support the idea that hilar cells contribute to object recognition (Kesner et al. 2015; Botterill et al. 2021; GoodSmith et al. 2022).

Results, Section F, starting on Line 801:
“F. Correlations between IIS and other measurements
As shown in Figure 9A, IIS were correlated to behavioral performance in some conditions. For these correlations, only mice that were fed the low and high choline diets were included because mice that were fed the intermediate diet did not have sufficient EEG recordings in the same mouse where behavior was studied. IIS frequency over 24 hrs was plotted against the preference for the novel object in the test phase (Figure 9A). For NOL, IIS were significantly less frequent when behavior was the best, but only for the high choline-treated mice (Pearson’s r, p=0.022). In the low choline group, behavioral performance was poor regardless of IIS frequency (Pearson’s r, p=0.933; Figure 9A1). For NOR, there were no significant correlations (low choliNe, p=0.202; high choline, p=0.680) but few mice were tested in the high choline-treated mice (Figure 9B2).
We also tested whether there were correlations between dorsal hilar NeuN-ir cell numbers and IIS frequency. In Figure 9B, IIS frequency over 24 hrs was plotted against the number of dorsal hilar cells expressing NeuN. The dorsal hilus was used because there was no effect of diet on the posterior hilus. For NOL, there was no significant correlation (low choline, p=0.273; high choline, p=0.159; Figure 9B1). However, for NOR, there were more NeuN-ir hilar cells when the behavioral performance was strongest (low choline, p=0.024; high choline, p=0.016; Figure 9B2). These data support prior studies showing that hilar cells, especially mossy cells (the majority of hilar neurons), contribute to object recognition (Botterill et al. 2021; GoodSmith et al. 2022).”
We also noted that all mice were not possible to include because they died or other reasons, such a a loss of the headset (Results, Section A, Lines 463-464): Some mice were not possible to include in all assays either because they died before reaching 6 months or for other reasons.
Reviewer #2 (Public Review):
Strengths:
The strength of the group was the ability to monitor the incidence of interictal spikes (IIS) over the course of 1.2-6 months in the Tg2576 Alzheimer's disease model, combined with meaningful behavioral and histological measures. The authors were able to demonstrate MCS had protective effects in Tg2576 mice, which was particularly convincing in the hippocampal novel object location task.
We thank the Reviewer for identifying several strengths.
Weaknesses:
Although choline deficiency was associated with impaired learning and elevated FosB expression, consistent with increased hyperexcitability, IIS was reduced with both low and high choline diets. Although not necessarily a weakness, it complicates the interpretation and requires further evaluation.
We agree and we revised the paper to address the evaluations that were suggested.
Reviewer #1 (Recommendations For The Authors):
(1) A reference directing to genotyping of Tg2576 mice is missing.
We apologize for the oversight and added that the mice were genotyped by the New York University Mouse Genotyping core facility.
Methods, Section A, Lines 210-211: “Genotypes were determined by the New York University Mouse Genotyping Core facility using a protocol to detect APP695.”
(2) Which software was used to track the mice in the behavioral tests?
We manually reviewed videos. This has been clarified in the revised manuscript. Methods, Section B4, Lines 268-270: Videos of the training and testing sessions were analyzed manually. A subset of data was analyzed by two independent blinded investigators and they were in agreement.
(3) Unexpectedly, a low choline diet in AD mice was associated with reduced frequency of interictal spikes yet increased mortality and spontaneous seizures. The authors attribute this to postictal suppression.
We did not intend to suggest that postictal depression was the only cause. It was a suggestion for one of many potential explanations why seizures would influence IIS frequency. For postictal depression, we suggested that postictal depression could transiently reduce IIS. We have clarified the text so this is clear (Discussion, starting on Line 960):
If mice were unhealthy, IIS might have been reduced due to impaired excitatory synaptic function. Another reason for reduced IIS is that the mice that had the low choline diet had seizures which interrupted REM sleep. Thus, seizures in Tg2576 mice typically started in sleep. Less REM sleep would reduce IIS because IIS occur primarily in REM. Also, seizures in the Tg2576 mice were followed by a depression of the EEG (postictal depression; Supplemental Figure 3) that would transiently reduce IIS. A different, radical explanation is that the intermediate diet promoted IIS rather than low choline reducing IIS. Instead of choline, a constituent of the intermediate diet may have promoted IIS.
However, reduced spike frequency is already evident at 5 weeks of age, a time point with a low occurrence of premature death. A more comprehensive analysis of EEG background activity may provide additional information if the epileptic activity is indeed reduced at this age.
We did not intend to suggest that premature death caused reduced spike frequency. We have clarified the paper accordingly. We agree that a more in-depth EEG analysis would be useful but is beyond the scope of the study.
(4) Supplementary Fig. 3 depicts far more spikes / 24 h compared to Fig. 7B (at least 100 spikes/24h in Supplementary Fig. 3 and less than 10 spikes/24h in Fig. 7B).
We would like to clarify that before and after a seizure the spike frequency is unusually high. Therefore, there are far more spikes than prior figures.
We clarified this issue by adding to the Supplemental Figure more data. The additional data are from mice without a seizure, showing their spikes are low in frequency.
All recordings lasted several days. We included the data from mice with a seizure on one of the days and mice without any seizures. For mice with a seizure, we graphed IIS frequency for the day before, the day of the seizure, and the day after. For mice without a seizure, IIS frequency is plotted for 3 consecutive days. When there was a seizure, the day before and after showed high numbers of spikes. When there was no seizure on any of the 3 days, spikes were infrequent on all days.
The revised figure and legend are shown below. It is Supplemental Figure 4 in the revised submission.
Author response image 5.
IIS frequency before and after seizures. A. Representative EEG traces recorded from electrodes implanted in the skull over the left frontal cortex, right occipital cortex, left hippocampus (Hippo) and right hippocampus during a spontaneous seizure in a 5 months-old Tg2576 mouse. Arrows point to the start (green arrow) and end of the seizure (red arrow), and postictal depression (blue arrow). B. IIS frequency was quantified from continuous video-EEG for mice that had a spontaneous seizure during the recording period and mice that did not. IIS frequency is plotted for 3 consecutive days, starting with the day before the seizure (designated as day 1), and ending with the day after the seizure (day 3). A two-way RMANOVA was conducted with the day and group (mice with or without a seizure) as main factors. There was a significant effect of day (F(2,4)=46.95, p=0.002) and group (seizure vs no seizure; F(1,2)=46.01, p=0.021) and an interaction of factors (F(2,4)=46.68, p=0.002)..Tukey-Kramer post-hoc tests showed that mice with a seizure had significantly greater IIS frequencies than mice without a seizure for every day (day 1, p=0.0005; day 2, p=0.0001; day 3, p=0.0014). For mice with a seizure, IIS frequency was higher on the day of the seizure than the day before (p=0.037) or after (p=0.010). For mice without a seizure, there were no significant differences in IIS frequency for day 1, 2, or 3. These data are similar to prior work showing that from one day to the next mice without seizures have similar IIS frequencies (Kam et al., 2016).

In the text, the revised section is in the Results, Section C, starting on Line 772:
“At 5-6 months, IIS frequencies were not significantly different in the mice fed the different diets (all p>0.05), probably because IIS frequency becomes increasingly variable with age (Kam et al. 2016). One source of variability is seizures, because there was a sharp increase in IIS during the day before and after a seizure (Supplemental Figure 4). Another reason that the diets failed to show differences was that the IIS frequency generally declined at 5-6 months. This can be appreciated in Figure 8B and Supplemental Figure 6B. These data are consistent with prior studies of Tg2576 mice where IIS increased from 1 to 3 months but then waxed and waned afterwards (Kam et al., 2016).”
(5) The data indicating the protective effect of high choline supplementation are valuable, yet some of the claims are not completely supported by the data, mainly as the analysis of littermate WT mice is not complete.
We added WT data to show that the high choline diet restored cell loss and ΔFosB expression to WT levels. These data strengthen the argument that the high choline diet was valuable. See the response to Reviewer #1, Public Review Point #2.
• Line 591: "The results suggest that choline enrichment protected hilar neurons from NeuN loss in Tg2576 mice." A comparison to NeuN expression in WT mice is needed to make this statement.
These data have been added. See the response to Reviewer #1, Public Review Point #2.
• Line 623: "These data suggest that high choline in the diet early in life can reduce hyperexcitability of GCs in offspring later in life. In addition, low choline has an opposite effect, again suggesting this maternal diet has adverse effects." Also here, FosB quantification in WT mice is needed.
These data have been added. See the response to Reviewer #1, Public Review Point #2.
(7) Was the effect of choline associated with reduced tauopathy or A levels?
The mice have no detectable hyperphosphorylated tau. The mice do have intracellular A before 6 months. This is especially the case in hilar neurons, but GCs have little (Criscuolo et al., eNeuro, 2023). However, in neurons that have reduced NeuN, we found previously that antibodies generally do not work well. We think it is because the neurons become pyknotic (Duffy et al., 2015), a condition associated with oxidative stress which causes antigens like NeuN to change conformation due to phosphorylation. Therefore, we did not conduct a comparison of hilar neurons across the different diets.
(8) Since the mice were tested at 3 months and 6 months, it would be interesting to see the behavioral difference per mouse and the correlation with EEG recording and immunohistological analyses.
We agree that would be valuable and this has been added to the paper. Please see response to Reviewer #1, Public Review Point #4.
Reviewer #2 (Recommendations For The Authors):
There were several areas that could be further improved, particularly in the areas of data analysis (particularly with images and supplemental figures), figure presentation, and mechanistic speculation.
Major points:
(1) It is understandable that, for the sake of labor and expense, WT mice were not implanted with EEG electrodes, particularly since previous work showed that WT mice have no IIS (Kam et al. 2016). However, from a standpoint of full factorial experimental design, there are several flaws - purists would argue are fatal flaws. First, the lack of WT groups creates underpowered and imbalanced groups, constraining statistical comparisons and likely reducing the significance of the results. Also, it is an assumption that diet does not influence IIS in WT mice. Secondly, with a within-subject experimental design (as described in Fig. 1A), 6-month-old mice are not naïve if they have previously been tested at 3 months. Such an experimental design may reduce effect size compared to non-naïve mice. These caveats should be included in the Discussion. It is likely that these caveats reduce effect size and that the actual statistical significance, were the experimental design perfect, would be higher overall.
We agree and have added these points to the Limitations section of the Discussion. Starting on Line 1050: In addition, groups were not exactly matched. Although WT mice do not have IIS, a WT group for each of the Tg2576 groups would have been useful. Instead, we included WT mice for the behavioral tasks and some of the anatomical assays. Related to this point is that several mice died during the long-term EEG monitoring of IIS.
(2) Since behavior, EEG, NeuN and FosB experiments seem to be done on every Tg2576 animal, it seems that there are missed opportunities to correlate behavior/EEG and histology on a per-mouse basis. For example, rather than speculate in the discussion, why not (for example) directly examine relationships between IIS/24 hours and FosB expression?
We addressed this point above in responding to Reviewer #1, Public Review Point #4.
(3) Methods of image quantification should be improved. Background subtraction should be considered in the analysis workflow (see Fig. 5C and Fig. 6C background). It would be helpful to have a Methods figure illustrating intermediate processing steps for both NeuN and FosB expression.
We added more information to improve the methods of quantification. We did use a background subtraction approach where ImageJ provides a histogram of intensity values, and it determines when there is a sharp rise in staining relative to background. That point is where we set threshold. We think it is a procedure that has the least subjectivity.
We added these methods to the Methods section and expanded the first figure about image quantification, Figure 6B. That figure and legend are shown above in response to Reviewer #1, Point #2.
This is the revised section of the Methods, Section C3, starting on Line 345:
“Photomicrographs were acquired using ImagePro Plus V7.0 (Media Cybernetics) and a digital camera (Model RET 2000R-F-CLR-12, Q-Imaging). NeuN and ∆FosB staining were quantified from micrographs using ImageJ (V1.44, National Institutes of Health). All images were first converted to grayscale and in each section, the hilus was traced, defined by zone 4 of Amaral (1978). A threshold was then calculated to identify the NeuN-stained cell bodies but not background. Then NeuN-stained cell bodies in the hilus were quantified manually. Note that the threshold was defined in ImageJ using the distribution of intensities in the micrograph. A threshold was then set using a slider in the histogram provided by Image J. The slider was pushed from the low level of staining (similar to background) to the location where staining intensity made a sharp rise, reflecting stained cells. Cells with labeling that was above threshold were counted.”
(4) This reviewer is surprised that the authors do not speculate more about ACh-related mechanisms. For example, choline deficiency would likely reduce Ach release, which could have the same effect on IIS as muscarinic antagonism (Kam et al. 2016), and could potentially explain the paradoxical effects of a low choline diet on reducing IIS. Some additional mechanistic speculation would be helpful in the Discussion.
We thank the Reviewer for noting this so we could add it to the Discussion. We had not because we were concerned about space limitations.
The Discussion has a new section starting on Line 1009:
“Choline and cholinergic neurons
There are many suggestions for the mechanisms that allow MCS to improve health of the offspring. One hypothesis that we are interested in is that MCS improves outcomes by reducing IIS. Reducing IIS would potentially reduce hyperactivity, which is significant because hyperactivity can increase release of A. IIS would also be likely to disrupt sleep since it represents aberrant synchronous activity over widespread brain regions. The disruption to sleep could impair memory consolidation, since it is a notable function of sleep (Graves et al. 2001; Poe et al. 2010). Sleep disruption also has other negative consequences such as impairing normal clearance of A (Nedergaard and Goldman 2020). In patients, IIS and similar events, IEDs, are correlated with memory impairment (Vossel et al. 2016).
How would choline supplementation in early life reduce IIS of the offspring? It may do so by making BFCNs more resilient. That is significant because BFCN abnormalities appear to cause IIS. Thus, the cholinergic antagonist atropine reduced IIS in vivo in Tg2576 mice. Selective silencing of BFCNs reduced IIS also. Atropine also reduced elevated synaptic activity of GCs in young Tg2576 mice in vitro. These studies are consistent with the idea that early in AD there is elevated cholinergic activity (DeKosky et al. 2002; Ikonomovic et al. 2003; Kelley et al. 2014; Mufson et al. 2015; Kelley et al. 2016), while later in life there is degeneration. Indeed, the chronic overactivity could cause the degeneration.
Why would MCS make BFCNs resilient? There are several possibilities that have been explored, based on genes upregulated by MCS. One attractive hypothesis is that neurotrophic support for BFCNs is retained after MCS but in aging and AD it declines (Gautier et al. 2023). The neurotrophins, notably nerve growth factor (NGF) and brain-derived neurotrophic factor (BDNF) support the health of BFCNs (Mufson et al. 2003; Niewiadomska et al. 2011).”
Minor points:
(1) The vendor is Dyets Inc., not Dyets.
Thank you. This correction has been made.
(2) Anesthesia chamber not specified (make, model, company).
We have added this information to the Methods, Section D1, starting on Line 375: The animals were anesthetized by isoflurane inhalation (3% isoflurane. 2% oxygen for induction) in a rectangular transparent plexiglas chamber (18 cm long x 10 cm wide x 8 cm high) made in-house.
(3) It is not clear whether software was used for the detection of behavior. Was position tracking software used or did blind observers individually score metrics?
We have added the information to the paper. Please see the response to Reviewer #1, Recommendations for Authors, Point #2.
(4) It is not clear why rat cages and not a true Open Field Maze were used for NOL and NOR.
We used mouse cages because in our experience that is what is ideal to detect impairments in Tg2576 mice at young ages. We think it is why we have been so successful in identifying NOL impairments in young mice. Before our work, most investigators thought behavior only became impaired later. We would like to add that, in our experience, an Open Field Maze is not the most common cage that is used.
(5) Figure 1A is not mentioned.
It had been mentioned in the Introduction. Figure B-D was the first Figure mentioned in the Results so that is why it might have been missed. We now have added it to the first section of the Results, Line 457, so it is easier to find.
6) Although Fig 7 results are somewhat complicated compared to Fig. 5 and 6 results, EEG comes chronologically earlier than NeuN and FosB expression experiments.
We have kept the order as is because as the Reviewer said, the EEG is complex. For readability, we have kept the EEG results last.
(7) Though the statistical analysis involved parametric and nonparametric tests, It is not clear which normality tests were used.
We have added the name of the normality tests in the Methods, Section E, Line 443: Tests for normality (Shapiro-Wilk) and homogeneity of variance (Bartlett’s test) were used to determine if parametric statistics could be used. We also added after this sentence clarification: When data were not normal, non-parametric data were used. When there was significant heteroscedasticity of variance, data were log transformed. If log transformation did not resolve the heteroscedasticity, non-parametric statistics were used. Because we added correlations and analysis of survival curves, we also added the following (starting on Line 451): For correlations, Pearson’s r was calculated. To compare survival curves, a Log rank (Mantel-Cox) test was performed.
Figures:
(1) In Fig. 1A, Anatomy should be placed above the line.
We changed the figure so that the word “Anatomy” is now aligned, and the arrow that was angled is no longer needed.
In Fig. 1C and 1D, the objects seem to be moved into the cage, not the mice. This schematic does not accurately reflect the Fig. 1C and 1D figure legend text.
Thank you for the excellent point. The figure has been revised. We also updated it to show the objects more accurately.
Please correct the punctuation in the Fig. 1D legend.
Thank you for mentioning the errors. We corrected the legend.
For ease of understanding, Fig. 1C and 1D should have training and testing labeled in the figure.
Thank you for the suggestion. We have revised the figure as suggested.
Author response image 6.

(2) In Figure 2, error bars for population stats (bar graphs) are not obvious or missing. Same for Figure 3.
We added two supplemental figures to show error bars, because adding the error bars to the existing figures made the symbols, colors, connecting lines and error bars hard to distinguish. For novel object location (Fig. 2) the error bars are shown in Supp. Fig. 2. For novel object recognition, the error bars are shown in Supplemental Fig. 3.
(3) The authors should consider a Methods figure for quantification of NeuN and deltaFOSB (expansions of Fig. 5C and Fig. 6C).
Please see Reviewer #1, Public Review Point #2.
(4) In Figure 5, A should be omitted and mentioned in the Methods/figure legend. B should be enlarged. C should be inset, zoomed-in images of the hilus, with an accompanying analysis image showing a clear reduction in NeuN intensity in low choline conditions compared to intermediate and high choline conditions. In D, X axes could delineate conditions (figure legend and color unnecessary). Figure 5C should be moved to a Methods figure.
We thank the review for the excellent suggestions. We removed A as suggested. We expanded B and included insets. We used different images to show a more obvious reduction of cells for the low choline group. We expanded the Methods schematics. The revised figure is Figure 6 and shown above in response to Reviewer 1, Public Review Point #2.
(5) In Figure 6, A should be eliminated and mentioned in the Methods/figure legend. B should be greatly expanded with higher and lower thresholds shown on subsequent panels (3x3 design).
We removed A as suggested. We expanded B as suggested. The higher and lower thresholds are shown in C. The revised figure is Figure 7 and shown above in response to Reviewer 1, Public Review Point #2.
(6) In Figure 7, A2 should be expanded vertically. A3 should be expanded both vertically and horizontally. B 1 and 2 should be increased, particularly B1 where it is difficult to see symbols. Perhaps colored symbols offset/staggered per group so that the spread per group is clearer.
We added a panel (A4) to show an expansion of A2 and A3. However, we did not see that a vertical expansion would add information so we opted not to add that. We expanded B1 as suggested but opted not to expand B2 because we did not think it would enhance clarity. The revised figure is below.
Author response image 7.

(7) Supplemental Figure 1 could possibly be combined with Figure 1 (use rounded corner rat cage schematic for continuity).
We opted not to combine figures because it would make one extremely large figure. As a result, the parts of the figure would be small and difficult to see.
(8) Supplemental Figure 2 - there does not seem to be any statistical analysis associated with A mentioned in the Results text.
We added the statistical information. It is now Supplemental Figure 4:
Author response image 8.
Mortality was high in mice treated with the low choline diet. A. Survival curves are shown for mice fed the low choline diet and mice fed the high choline diet. The mice fed the high choline diet had a significantly less severe survival curve. B. Left: A photo of a mouse after sudden unexplained death. The mouse was found in a posture consistent with death during a convulsive seizure. The area surrounded by the red box is expanded below to show the outstretched hindlimb (red arrow). Right: A photo of a mouse that did not die suddenly. The area surrounded by the box is expanded below to show that the hindlimb is not outstretched.

The revised text is in the Results, Section E, starting on Line 793:
“The reason that low choline-treated mice appeared to die in a seizure was that they were found in a specific posture in their cage which occurs when a severe seizure leads to death (Supplemental Figure 5). They were found in a prone posture with extended, rigid limbs (Supplemental Figure 5). Regardless of how the mice died, there was greater mortality in the low choline group compared to mice that had been fed the high choline diet (Log-rank (Mantel-Cox) test, Chi square 5.36, df 1, p=0.021; Supplemental Figure 5A).”
Also, why isn't intermediate choline also shown?
We do not have the data from the animals. Records of death were not kept, regrettably.
Perhaps labeling of male/female could also be done as part of this graph.
We agree this would be very interesting but do not have all sex information.
B is not very convincing, though it is understandable once one reads about posture.
We have clarified the text and figure, as well as the legend. They are above.
Are there additional animals that were seen to be in a specific posture?
There are many examples, and we added them to hopefully make it more convincing.
We also added posture in WT mice when there is a death to show how different it is.
Is there any relationship between seizures detected via EEG, as shown in Supplemental Figure 3, and death?
Several mice died during a convulsive seizure, which is the type of seizure that is shown in the Supplemental Figure.
(9) Supplemental Figure 3 seems to display an isolated case in which EEG-detected seizures correlate with increased IIEs. It is not clear whether there are additional documented cases of seizures that could be assembled into a meaningful population graph. If this data does not exist or is too much work to include in this manuscript, perhaps it can be saved for a future paper.
We have added other cases and revised the graph. This is now Supplemental Figure 4 and is shown above in response to Reviewer #1, Recommendation for Authors Point #4.
Frontal is misspelled.
We checked and our copy is not showing a misspelling. However, we are very grateful to the Reviewer for catching many errors and reading the manuscript carefully.
(10) Supplemental Figure 4 seems incomplete in that it does not include EEG data from months 4, 5, and 6 (see Fig. 7B).
We have added data for these ages to the Supplemental Figure (currently Supplemental Figure 6) as part B. In part A, which had been the original figure, only 1.2, 2, and 3 months-old mice were shown because there were insufficient numbers of each sex at other ages. However, by pooling 1.2 and 2 months (Supplemental Figure 6B1), 3 and 4 months (B2) and 5 and 6 months (B3) we could do the analysis of sex. The results are the same – we detected no sex differences.
Author response image 9.
IIS frequency was similar for each sex. A. IIS frequency was compared for females and males at 1.2 months (1), 2 months (2), and 3 months (3). Two-way ANOVA was used to analyze the effects of sex and diet. Female and male Tg2576 mice were not significantly different. B. Mice were pooled at 1.2 and 2 months (1), 3 and 4 months (2) and 5 and 6 months (3). Two-way ANOVA analyzed the effects of sex and diet. There were significant effects of diet for (1) and (2) but not (3). There were no effects of sex at any age.
(1) There were significant effects of diet (F(2,47)=46.21, p<0.0001) but not sex (F(1,47)=0.106, p=0.746). Female and male mice fed the low choline diet or high choline diet were significantly different from female and male mice fed the intermediate diet (all p<0.05, asterisk).
(2) There were significant effects of diet (F(2,32)=10.82, p=0.0003) but not sex (F(1,32)=1.05, p=0.313). Both female and male mice of the low choline group were significantly different from male mice fed the intermediate diet (both p<0.05, asterisk) but no other pairwise comparisons were significant.
(3) There were no significant differences (diet, F(2,23)=1.21, p=0.317); sex, F(1,23)=0.844, p=0.368).
 The data are discussed the Results, Section G, tarting on Line 843:
In Supplemental Figure 6B we grouped mice at 1-2 months, 3-4 months and 5-6 months so that there were sufficient females and males to compare each diet. A two-way ANOVA with diet and sex as factors showed a significant effect of diet (F(2,47)=46.21; p<0.0001) at 1-2 months of age, but not sex (F1,47)=0.11, p=0.758). Post-hoc comparisons showed that the low choline group had fewer IIS than the intermediate group, and the same was true for the high choline-treated mice. Thus, female mice fed the low choline diet differed from the females (p<0.0001) and males (p<0.0001) fed the intermediate diet. Male mice that had received the low choline diet different from females (p<0.0001) and males (p<0.0001) fed the intermediate diet. Female mice fed the high choline diet different from females (p=0.002) and males (p<0.0001) fed the intermediate diet, and males fed the high choline diet difference from females (p<0.0001) and males (p<0.0001) fed the intermediate diet.
For the 3-4 months-old mice there was also a significant effect of diet (F(2,32)=10.82, p=0.0003) but not sex (F(1,32)=1.05, p=0.313). Post-hoc tests showed that low choline females were different from males fed the intermediate diet (p=0.007), and low choline males were also significantly different from males that had received the intermediate diet (p=0.006). There were no significant effects of diet (F(2,23)=1.21, p=0.317) or sex (F(1,23)=0.84, p=0.368) at 5-6 months of age.
-
eLife assessment
In this fundamental work, the authors demonstrated that maternal choline supplementation improved spatial memory, reduced hyperexcitability, and restored NeuN expression in a familial Alzheimer's disease mouse model. Interestingly, choline deficiency increased mortality, while paradoxically reduced hyperexcitability. Using behavior, electrophysiological, and histological measures, the authors present convincing evidence supporting the significant role of maternal choline supplementation in protecting hippocampal functions vulnerable to Alzheimer's disease.
-
Reviewer #1 (Public Review):
Summary:
Chartampila et al. describe the effect of early-life choline supplementation on cognitive functions and epileptic activity in a mouse model of Alzheimer's disease. The cognitive abilities were assessed by the novel object recognition test and the novel object location test, performed in the same cohort of mice at 3 months and 6 months of age. Neuronal loss was tested using NeuN immunoreactivity, and neuronal hyperexcitability was examined using FosB and video-EEG recordings, providing multi-level correlations between these different parameters.
Strengths:
The study was designed as a 6-month follow-up, with repeated behavioral and EEG measurements through disease development and multilevel correlations providing valuable and interesting findings on AD progression and the effect of early-life choline supplementation. Moreover, the behavioral data that suggest an adverse effect of low choline in WT mice are interesting and important also beyond the context of AD, highlighting the dramatic effect of diet on the phenotypes of animal models.
Weaknesses:
The readability could be improved.
-
-
social-media-ethics-automation.github.io social-media-ethics-automation.github.io
-
Jim Hollan and Scott Stornetta. Beyond being there. In Proceedings of the SIGCHI Conference on Human Factors in Computing Systems, CHI '92, 119–125. New York, NY, USA, June 1992.
Jim Hollan and Scott Stornetta's work "Beyond Being There," presented at the SIGCHI Conference on Human Factors in Computing Systems in 1992, discusses how communication technologies can be designed not merely to replicate face-to-face interactions but to create new forms of interaction that transcend the limitations of being physically present. They argued that the goal of communication technologies should be to provide interactions that are as meaningful and effective as being there in person, if not more so. This seminal paper introduced ideas that have influenced how we think about digital communication tools and their potential to enhance human collaboration. The concepts presented are foundational in fields like telepresence, virtual reality, and collaborative software, where the focus is on creating rich, engaging experiences that add unique value beyond simulating in-person interactions.
-
Jeremy Gray. Missing hiker rescued after Twitter user tracks him down using his last-sent photo. DPReview, April 2021. URL: https://www.dpreview.com/news/0703531833/missing-hiker-rescued-after-twitter-user-tracks-him-down-using-a-photo (visited on 2023-12-08).
I think this story shows how social media and digital technology can play a key role in emergency relief. Twitter users used the last photos sent by the missing person to determine his location, reflecting how modern technology is powering traditional search and rescue operations. Despite the success of the rescue, it has also sparked discussion about the balance between privacy and security. Sharing location-related photos or information can expose a person's location, and sometimes this can be risky.
-
GoFundMe
GoFundMe is the perfect example of crowdsourcing. This platform allows users to tell their stories about their hardships in order to receive donations from others. I do wonder what percentage the site gets from everything that is donated.
-
GoFundMe: #1 Fundraising Platform for Crowdfunding. URL: https://www.gofundme.com/ (visited on 2023-12-08).
GoFundMe is a popular crowdfunding platform that allows individuals, groups, and organizations to raise money for various causes. Users can share stories, set goals and accept donations.
-
Merriam-Webster. Definition of ad hoc. December 2023. URL: https://www.merriam-webster.com/dictionary/ad+hoc (visited on 2023-12-08).
From my understanding an ad hoc may be used to address a problem quickly. I have heard his before but never knew much about it. I feel like this would be very effective especially when testing software developments.
-
CSCW 2023: The 26th ACM Conference On Computer-Supported Cooperative Work And Social Computing. URL: https://cscw.acm.org/2023/ (visited on 2023-12-08).
The 26th ACM Conference on Computer-Supported Cooperative Work and Social Computing (CSCW 2023) is a significant event in the field of collaborative technology and social computing research. It provides a platform for researchers and practitioners to present their latest findings and innovations, fostering collaboration and discussion within the community. The conference covers a broad range of topics, including the design, implementation, and use of technologies that support collaborative work and social interaction among people.
-
Jim Hollan and Scott Stornetta. Beyond being there. In Proceedings of the SIGCHI conference on Human factors in computing systems - CHI '92, 119–125. Monterey, California, United States, 1992. ACM Press. URL: http://portal.acm.org/citation.cfm?doid=142750.142769 (visited on 2023-12-08), doi:10.1145/142750.142769.
I feel like they critique the then-common goal of striving to replicate in-person experiences through digital means, arguing instead for the development of systems that provide unique value not possible in direct human interactions. Their influential ideas push for a rethinking of how technology mediates communication, emphasizing innovation over mere imitation of physical presence.
-
Melanie Walsh and Quinn Dombrowski. Intro to Cultural & Analytics: Version 1.1.0. August 2021. URL: https://zenodo.org/record/4411250 (visited on 2023-12-08), doi:10.5281/ZENODO.4411250.
"Introduction to Cultural Analytics & Python" (Version 1.1.0) by Melanie Walsh and Quinn Dombrowski updates tools for analyzing cultural data using Python, including multilingual text analysis, Twitter API integration, and sentiment analysis, complemented by practical workbooks. Detail: The guide now includes notebooks for text analysis in multiple languages such as Chinese and Russian, broadening its linguistic applicability.
-
-
social-media-ethics-automation.github.io social-media-ethics-automation.github.io
-
16.2.1. Crowdsourcing Platforms
Crowdsourcing platforms are websites or services that gather information, ideas, or contributions from a large number of people, typically from the online community. These platforms can be used for various purposes, including innovation, problem-solving, funding, and gathering data or opinions.
-
You probably already have some ideas of how crowds can work together on things like editing articles on a site like Wikipedia or answer questions on a site like Quora, but let’s look at some other examples of how crowds can work together. Fold-It [p19] is a game that lets players attempt to fold proteins. At the time, researchers were having trouble getting computers to do this task for complex proteins, so they made a game for humans to try it. Researchers analyzed the best players’ results for their research and were able to publish scientific discoveries based on the contributions of players.
The example of Fold-It illustrates an innovative use of crowdsourcing where participants engage in a game to solve complex scientific problems, specifically protein folding. This approach taps into human problem-solving skills and creativity, which at the time surpassed the capabilities of computers in handling complex proteins. The data generated by top players not only contributed to scientific research but also led to published findings, demonstrating the potential of leveraging collective intelligence for scientific advancements.
-
-
laccmibridge.fiu.edu laccmibridge.fiu.edu
-
e authors illustrate how appropriateness-based approaches to language education are implicated in the reproduction of racialnormativity by expecting language-minoritized students to model their linguisticpractices after the white speaking subject despite the fact that the white listening sub-ject continues to perceive their language use in racialized ways.
this is how to annotate
-
-
inst-fs-iad-prod.inscloudgate.net inst-fs-iad-prod.inscloudgate.net
-
Students are increasinglydemanding access to learninganytime, anywhere
-
-
social-media-ethics-automation.github.io social-media-ethics-automation.github.io
-
Sometimes even well-intentioned efforts can do significant harm. For example, in the immediate aftermath of the 2013 Boston Marathon bombing, FBI released a security photo of one of the bombers and asked for tips. A group of Reddit users decided to try to identify the bomber(s) themselves. They quickly settled on a missing man (Sunil Tripathi) as the culprit (it turned out had died by suicide and was in no way related to the case), and flooded the Facebook page set up to search for Sunil Tripathi, causing his family unnecessary pain and difficulty. The person who set up the “Find Boston Bomber” Reddit board said “It Was a Disaster” but “Incredible” [p26], and Reddit apologized for online Boston ‘witch hunt’ [p27].
I think this incident underscores the potential dangers of online crowdsourcing and the spread of misinformation, even with good intentions. While the Reddit users may have genuinely wanted to help authorities, their actions led to serious consequences for an innocent individual and their family.
-
Social and political movements
Sometimes socail and political movement on the internet may not be a very succured way to operate. The information on the internet is very wide spreaded and may cause different problems. It would be better when transmitting secret infomration via other apporaches.
-
-
ir.healthpeak.com ir.healthpeak.com
-
During the third quarter, Healthpeak sold 9.1 million shares of common stock under the ATM equity offering program on a forward basis at an average price of approximately $35.60 per share(before underwriting discounts), which is expected to result in net proceeds of approximately $320 million
ATM
-
-
deepakchopra.medium.com deepakchopra.medium.com
-
If this sounds arcane, at the most basic level you are indisputably woven into the quantum field
-
-
www.shortform.com www.shortform.com
-
Explain your background and share some personal information. When you willingly share things about yourself, it minimizes opportunities for others to misinterpret your behaviors.
Do not keep to yourself too much try to express yourself or people will think you are hiding something. If you share things about yourself people will know you and others trying to bash you will fail.
-
-
Local file Local file
-
Powers of the National Telecommunications Commission
unsure of relevance
-
-
pressbooks.bccampus.ca pressbooks.bccampus.ca
-
Writing and reviewing website content
When writing effective website content, do we focus on the subject matter only or on certain keywords only that provide hits on search engines?
-
-
scholarship.law.wm.edu scholarship.law.wm.edu
-
judge worried about unconstrainedjudicial intuitions about what rights are fundamental could conclude that the DueProcess Clause protects only those liberties listed in the Bill of Rights.71
If I need more content, could rebut the idea that this is completely new by mentioning how the court has already done this all the time. Also could analyze each approach to fusion in the context of Disp Impact
-
-
manipulation.csail.mit.edu manipulation.csail.mit.edu
-
robot arm at full extension holding a milk jug might be very different than the motor commands required when it is unloaded in a vertical hanging position? Surprisingly, the required gains/commands might not be as different as one would think.
Could you explain this more? How are the motor commands the same and why?
-
-
social-media-ethics-automation.github.io social-media-ethics-automation.github.io
-
What do you think a social media company’s responsibility is for the crowd actions taken by users on its platform?
I believe social media companies have responsibility for crowd actions on their platform. I think companies should prioritize ethical considerations. The well-being of their users and society at large and taking steps to address any issues.
-
In what ways do you think you’ve participated in any crowdsourcing online?
One example I thought of when it comes to crowdsourcing is the use of google maps / Waze. On these apps I'm able to report anything by adding photos or leaving reviews. Everyone is able to access the same thing and make adjusts as needed. I think it's a great way to keep the public informed on map details!
-
-
inspiraku.id inspiraku.id
-
Komunikasi yang mengharu-biru. Masing-masing mengungkapkan rasa sedih sekaligus kenangan menyenangkan dengan Pak Pran semasa kegiatan PPG tahun lalu. Namun, menjelang askhir vc grup, Neng Lina menanyakan sesuatu yang selama ini kurang Aku kenang.
Berapa kalimat dalam paragraf ini? Apa makna VC dalam paragraf tersebut?
-
-
davidorban.com davidorban.com
-
Thank you Giulio for this stimulating exchange.
more meme-list than proper conversation.
-
ave a cosmic responsibility, as James Lovelock argued. In his latest book “Novacene: The Coming Age of Hyperintelligence”, Lovelock says that the new forms of digital life we are developing will replace us: first they will collaborate with us because they will need us, then they will take control of their evolution and leave us behind. They will be the ones to conquer the stars and bring the universe to life. I like to think that this is the destiny and will of the universe: that intelligent life expands faster than biological life can.
Prisco connects to [[Novacene by James Lovelock]] here wrt the evolutionary path any A(G)I will take. (Vgl [[AI begincondities en evolutie 20190715140742]] ) Leaves out [[AI heeft dezelfde natuurwetten 20190715135542]] btw which limits that evolutionary path, and AI might well be too bored because of it to do anything worthwile.
-
o the fact that we have not yet identified alien civilizations does not mean they do not exist, maybe they are just smarter than we think.
Prisco combines the 'they're here but we can't see it' and dark forest answers to [[Fermi Paradox 20201123150738]].
-
return
?
-
When I hear phrases that contain the words “Europe” or “regulator”, I think they are not worthy of being taken seriously by people like us who have more important things to do. They can try to regulate everything they want, but they will not succeed. The caravan passes anyway because there is a strong push behind it: economic interest, consumers’ desire to have certain tools,
The EU actually regulates out of economic interest. The internal market is their remit.
-
nd the philosophical conviction that all this must happen because it is aligned with the will of the universe.
oh dear. This is the second time he phrases his tech stance in religious terms.
-
This has led to absurd situations such as the ban on selling genetically modified rice in Africa and Asia, where it could prevent disease and blindness in millions of people. Rejecting the advantages of a technology for fear of risks is something we are already concretely experiencing.
-
to keep the Earth habitable and as close as possible to its natural state, we need precisely those technologies that radical environmentalists oppose, such as nuclear fusion or space flights.
the opposition I think is not to fusion tech nor space flight, but to positioning those two as catchall remedies making other actions unneeded. Other actions that are cheaper, have predictable impact in the short run, etc. It's not a 'plan' to ship rich people to Mars because Earth is becoming a mess. And saying such plans are bullshit is not opposition to space flight. Au contraire when it is space research that tells us so much about our environment. Fusion would be great but is a long way of, meaning energy usage reduction while switching to renewables is a viable strategy now, while fusion might be one in some undetermined time frame likely beyond the boundary of the current urgency.
-
The message of e/acc is this: let’s go full steam ahead in the development of increasingly powerful, general, and conscious artificial intelligences, up to superintelligences. This can only be the right path because it reflects the will of the universe. So far I perfectly agree with the philosophical approach of the e/acc movement.
E/Acc says invest more in AI limitlessly, as opposed to EA/Bostrom saying invest only in a specific circle of billionaire friends bc of the extinction level risk involved of AGI. And we need to do it, bc religious fervor 'it reflects the will of the universe'. Not convincing.
-
The term “effective accelerationism” was born as a play on words on “effective altruism” associated with Nick Bostrom’s Institute for the Future of Humanity
Ah, it is an intentional similiarity. An EA rebrand. Note that Bostrom got kicked out by Oxford, for running a 'philosophy' org without philosophers. Prisco about E/acc is very explicit in sketching out its provenance it seems, angling for both a specific audience I suppose and as a next culture war front hopeful (grift).
-
E/acc arises as a project to return to the technological optimism that characterized periods like the 60s and 90s of the last century, or the 20s. Spreading optimism is extremely important
'e/acc' is optimism Prisco says.
-
We have always done geo-engineering, from the prairies of Native Americans to European forests, from Indian to Chinese rice fields. Now that we can no longer deny our impact and the responsibility it entails, it’s time to open our eyes and consciously do geo-engineering.
This is odd. 'we have alway done geo-engineering in the sense that we had large scale negative impacts on the globe' unintentionally, so let's do it more and with more focused intention. The leap here is not in geo-engineering David, the leap is in thinking you are capable of seeing it through without externalisation. With a guy that says you can engineer yourself out of complex issues....
-
Giulio: I agree. E/acc arises as a reaction to these ideas, saying “let’s stop talking bullshit”.
Great stuff, if your world view is a response to something you abhor.
-
Can e/acc be seen as a response to radical environmentalism that aims for an uncontaminated planet, free from human influence, to the point of advocating degrowth or even the extinction of our species?
[[David Orban]] formulates a telling question here. The label again (e/acc e/yuck!) but putting up several straw men wrt the 'enemy' here 'radical environmentalism'.
-
Russian Cosmism
a spiritual stream w scientific and philosophical aspects. An early feeder into transhumanism.
-
Marinetti’s Italian Futurism
which descended into fascism quickly.10yrs after authoring the Futurist Manifesto he authored the Fascist Manifesto, and was a key figure in fascism in Italy. Agitated for Italy's involvement in WW1, died during WW2 in '44 of heart attack. Prisco is not concerned with the moral pedigree of things it seems. See photos https://www.zylstra.org/blog/2022/10/week-notes-22-39/ on flickr.
-
I left Italy and lived in various places, working at CERN, the European Space Agency, and various research centers. In 2005, I went freelance and have been working as an independent professional ever since
Prisco is of transhumanist bend, a into cryogenics. Resigned an ethics board as virtue signalling statement in 'the culture war'. The label itself is a red flag. https://giulioprisco.com/i-have-resigned-from-the-ieet-board-of-directors-793d10a10a8a
Wikipedia https://giulioprisco.com/i-have-resigned-from-the-ieet-board-of-directors-793d10a10a8a
Note he lists his 3yr work at CERN and later work at ESA to aid his tech credentials, but all that work lies 20-35 yrs in the past. It reads like a pretense to link his current stances to something of solid reputation.
-
extropianism of the 80s and 90s,
A techno-optimist / rationalist thing, connected to transhumanism and cryogenics.
-
“Tales of the Turing Church” and “Futurist Meditations on Space Flight”.
Book titles 2018 and 2021 by Giulio Prisco.
-
effective accelerationism (e/acc)
Is the analogue to EA on purpose? That would be a clear red flag.
-
using engineering to repair a complex system like our planet.
This sounds very problematic to me. Engineering is not meant for complex issues, it needs reductionism to complicated but highly predictable causal chains to be able to engineer it. Also wrt environment I don't see actual evidence of techno-optimism having had positive impact, let alone at geo-engineering scale. Environmental achievements wrt sulfur (acid rain), ozon (HFCs), living rivers (pesticides, discharges) etc. result from regulations limiting what engineers had previously introduced.
-
-
www.biorxiv.org www.biorxiv.org
-
Version 3 of this preprint has been peer-reviewed and recommended by Peer Community in Ecology.<br /> See the peer reviews and the recommendation.
-
-
blogs.baruch.cuny.edu blogs.baruch.cuny.eduUntitled2
-
expectedaquietweddinghighabovealostcityamarriagefobalanceonmyheadlikeaforestofsticks,apotofwater.Theceremonytastedofnothing
the speaker is saying that she hoped there'd be something “balanced” about the merger itself—perhaps in the sense that the families and cultures would get along in a sense.
-
{wantedtomarryacountrytake upariverforaveilsingintheJinnahGardensholdupmydream,trickyasasnake-charmer’ssnake.
The speaker would've preferred to marry Pakistan itself. Also, the two countries that are mentioned Pakistan and England there is immediately a kind of cultural disconnect.
-
-
social-media-ethics-automation.github.io social-media-ethics-automation.github.io
-
What social media (and other internet systems) have done is expand the options for how people can collaborate on tasks.
Although I do understand the importance of crowdsourcing and how it can be used for different viewpoints, I think it could get biased depending on who is involved which i think would make the piece less trustworthy
-
-
github.com github.com
-
About A basic fediverse blocklist for Mastodon admins to block the most well known sources of hate speech, harassment, etc.
-
-
distributed.press distributed.press
-
GardenFence to automatically block servers that have shown to be sources of hateful rhetoric, harassment, and spam.)
block some
-
Approve replies as comments
replies
-
Post to the Fediverse
Post to the Fediverse
part of POSSE
-
incorporate ActivityPub
activity pub
-
Social Inbox for the Decentralized Web
social inbox for DWEB
-
check out the auto-generated swagger interface.
-
“DWeb-ify” your site, you just need a Distributed.Press instance
instance => server?
-
make publishing fair, democratic, and dignified for all.
dignified for all
-
Distributed Press is an open source publishing tool for the World Wide Web and DWeb. It automates publishing and hosting content to the WWW that it seeds to Hypercore and IPFS.

embeded with social interactions
-
amplify free expression worldwide
amplify
-
-
www.v2ex.com www.v2ex.com
-
内网穿透建网站?
内网访问工具
-
-
api.distributed.press api.distributed.press
-
Distributed Press API
-
-
Local file Local file
-
fugitivity to interpretation t
Is this person smarter than me or do they have a thesaurus....harrumph...
-
an apologetic postscript
This is kinda iconic idk...
-
-
www.cpolar.com www.cpolar.com
-
Dify 开源大语言模型(LLM) 应用开发平台如何使用Docker部署与远程访问
dify 本地搭建,远程访问
-
-
-
Thisinterventionrecognizes students’ annotations as objectsopen tocontinuous development, engaging students to connect, analyze, and expand upon their ideasthrough the synthesis processes. Meanwhile, the synthesis products can be integratedinto otherlearning events, enriching the overall learning experiences.
How can AI be leveraged to support: (1) the process of synthesizing students' annotations, and (2) the use of these synthesis artifacts in subsequent in-class group discussions?
-
Supporting knowledge synthesis in social annotation activities
How to nurturing the continual advancement of students' ideas embedded in the social annotation platform in subsequent discourse activities, such as in-class discussions? We propose a knowledge synthesis intervention for students to create a synthesis of annotations and leverage the synthesis artifacts to facilitate ongoing group discussions.
Tags
Annotators
URL
-
-
www.sciencedirect.com www.sciencedirect.com
-
for - lebenswelt
-
-
academic.oup.com academic.oup.com
-
Since the main defining factor of a network is information, and as the amount of accessible information is constantly increasing, the main goal of the parties involved in a net-centric war is not to control the information itself but to rule and manipulate its nature.
Exploitation of information is ultimate goal in NCW
-
Informational support of war stops being a secondary supporting factor (as classic propaganda was), but becomes the raison d’etre of war. In essence, a war has become informational, [where] military operations have only a secondary supporting role
Narrative and information control is important, but is it really more important than military operations? The US had massive tech and information advantage over enemies in GWOT, but this made little difference in the end.
-
In net-centric war, reality is secondary in relation to virtual. The image is much more important than reality. Reality itself becomes real only after reports about it appear in the informational dimension, and therefore, the major factor is control of the informational dimension.
Perception > reality in NCW.
-
analysis of net-centric war should not be restricted just to the military realm.
Russian view of NCW extends beyond military realm
-
enhance the effectiveness of military units on the battlefield by increasing the efficiency of the collection, aggregation, analysis and communication of valuable and relevant data from a large number of sensors:
Risk of information overload and over-reliance on data
-
NCW focuses on the combat power that can be generated from the effective linking or networking of the warfighting enterprise. It is characterized by the ability of geographically dispersed forces (consisting of entities) to create a high level of shared battlespace awareness that can be exploited via self-synchronisation and other network-centric operations to achieve commanders’ intent.
NCW Definition (US DoD)
-
-
philarchive.org philarchive.org
-
for - lebenswelt - prescientific experience - Edmond Husserl - Josiah Royce
paper description - title - The World of Appreciation as Lebenswelt: The Value of Pre-scientific Experience in the Philosophy of Josiah Royce and Edmund Husserl - author - Massimo Cisternino - date - 2023 - journal - The Pluralist 18 (2):66-79 (2023)
-
-
www.biorxiv.org www.biorxiv.org
-
Author response:
The following is the authors’ response to the previous reviews.
We are pleased that Reviewer 3 has deemed our revisions satisfactory; below, we provide responses to the remaining Recommendations for the Authors from Reviewer 2.
Reviewer #2 (Recommendations For The Authors):
Minor corrections:
- Line 91: GWT should be GNWT
Fixed, thank you.
- Figure 2: fix the label "Participationcoefficient rank" (no space between Participation and coefficient)
Fixed, thank you for spotting.
- Line 317: Figure 2 should be Figure 3
Fixed, thank you.
- Line 360: Figure 4D, right?
Fixed, thank you. We also confirm that Figure 4 and its caption are correct. Under anaesthesia, many regions have more Integrated Information than during Recovery (red regions), but the only changes that are consistently observed across all three contrasts are the decreases.
- Line 375: Should be Figure 5A
Fixed, thank you.
- The recovery period of the anesthesia data is not described in Methods.
We have now added the missing information:
“Propofol was discontinued following the deep anaesthesia scan, and participants reached level 2 of the Ramsey scale approximately 11 minutes afterwards, as indicated by clear and rapid responses to verbal commands. This corresponds to the “recovery” period 176.”
We have also expanded our discussion on the interaction between information decomposition and measures of directionality:
“Indeed, transfer entropy can itself be decomposed into information-dynamic atoms through Partial Information Decomposition and Integrated Information Decomposition 33,34,49,151; ΦID can further decompose the Normalised Directed Transfer Entropy measure used by Deco et al 5, as recently demonstrated 152. We look forward to a more refined conceptualization of the synergistic workspace architecture that takes into account both information types and the directionality of information flow – especially in datasets with higher temporal resolution.”
-
eLife assessment
This article presents important results describing how the gathering, integration, and broadcasting of information in the brain changes when consciousness is lost either through anesthesia or injury. They provide convincing evidence to support their conclusions, although the paper relies on a single analysis tool (partial information decomposition) and could benefit from a clearer explication of its conceptual basis, methodology, and results. The work will be of interest to both neuroscientists and clinicians interested in fundamental and clinical aspects of consciousness.
-
Reviewer #2 (Public Review):
The authors analysed functional MRI recordings of brain activity at rest, using state-of-the-art methods that reveal the diverse ways in which information can be integrated in the brain. In this way, they found brain areas that act as (synergistic) gateways for the 'global workspace', where conscious access to information or cognition would occur, and brain areas that serve as (redundant) broadcasters from the global workspace to the rest of the brain. The results are compelling and are consistent with the already assumed role of several networks and areas within the Global Neuronal Workspace framework. Thus, in a way, this work comes to stress the role of synergy and redundancy as complementary information processing modes, which fulfill different roles in the bigger context of information integration.
In addition, to prove that the identified high-order interactions are relevant to the phenomenon of consciousness, the same analysis was performed in subjects under anesthesia or with disorders of consciousness (DOC), showing that indeed the loss of consciousness is associated with a deficient integration of information within the gateway regions.
-
Reviewer #3 (Public Review):
The work proposes a model of neural information processing based on a 'synergistic global workspace,' which processes information in three principal steps: a gatekeeping step (information gathering), an information integration step, and finally, a broadcasting step. They provided an interpretation of the reduced human consciousness states in terms of the proposed model of brain information processing, which could be helpful to be implemented in other states of consciousness. The manuscript is well-organized, and the results are important and could be interesting for a broad range of literature, suggesting interesting new ideas for the field to explore.
-
-
www.biorxiv.org www.biorxiv.org
-
Author response:
The following is the authors’ response to the original reviews.
Public Reviews:
Reviewer #1 (Public Review):
Summary:
In their manuscript, Yu et al. describe the chemotactic gradient formation for CCL5 bound to - i.e. released from - glycosaminoglycans. The authors provide evidence for phase separation as the driving mechanism behind chemotactic gradient formation. A conclusion towards a general principle behind the finding cannot be drawn since the work focuses on one chemokine only, which is particularly prone to glycan-induced oligomerisation.
Strengths:
The principle of phase separation as a driving force behind and thus as an analytical tool for investigating protein interactions with strongly charged biomolecules was originally introduced for protein-nucleic acid interactions. Yu et al. have applied this in their work for the first time for chemokine-heparan sulfate interactions. This opens a novel way to investigate chemokine-glycosaminoglycan interactions in general.
Response: Thanks for the encouragement of the reviewer.
Weaknesses:
As mentioned above, one of the weaknesses of the current work is the exemplification of the phase separation principle by applying it only to CCL5-heparan sulfate interactions. CCL5 is known to form higher oligomers/aggregates in the presence of glycosaminoglycans, much more than other chemokines. It would therefore have been very interesting to see, if similar results in vitro, in situ, and in vivo could have been obtained by other chemokines of the same class (e.g. CCL2) or another class (like CXCL8).
Response: We share the reviewer’s opinion that to investigate more molecules/cytokines that interact with heparan sulfate in the system should be of interesting. We expect that researchers in the field will adapt the concept to continue the studies on additional molecules. Nevertheless, our earlier study has demonstrated that bFGF was enriched to its receptor and triggered signaling transduction through phase separation with heparan sulfate (PMID: 35236856; doi: 10.1038/s41467-022-28765-z), which supports the concept that phase separation with heparan sulfate on the cell surface may be a common mechanism for heparan sulfate binding proteins. The comment of the reviewer that phase separation is related to oligomerization is demonstrated in (Figure 1—figure supplement 2C and D), showing that the more easily aggregated mutant, A22K-CCL5, does not undergo phase separation.
In addition, the authors have used variously labelled CCL5 (like with the organic dye Cy3 or with EGFP) for various reasons (detection and immobilisation). In the view of this reviewer, it would have been necessary to show that all the labelled chemokines yield identical/similar molecular characteristics as the unlabelled wildtype chemokine (such as heparan sulfate binding and chemotaxis). It is well known that labelling proteins either by chemical tags or by fusion to GFPs can lead to manifestly different molecular and functional characteristics.
Response: We agree with the reviewer that labeling may lead to altered property of a protein, thus, we have compared chemotactic activity of CCL5 and CCL5-EGFP (Figure 2—figure supplement 1). To further verify this, we performed additional experiment to compare chemotactic activity between CCL5 and Cy3-CCL5 (see Author response image 1). For the convenience of readers, we have combined the original Figure 2—figure supplement 1 with the new data (Figure R1), which replaced original Figure 2—figure supplement 1.
Author response image 1.
Chemotactic function of CCL5-EGFP and CCL5-Cy3. Cy3-Labeled CCL5 has similar activity as CCL5, 50 nM CCL5 or CCL5-Cy3 were added to the lower chamber of the Transwell. THP-1 cells were added to upper chambers. Data are mean ± s.d. n=3. P values were determined by unpaired two-tailed t-tests. NS, Not Significant.

Reviewer #2 (Public Review):
Although the study by Xiaolin Yu et al is largely limited to in vitro data, the results of this study convincingly improve our current understanding of leukocyte migration.
(1) The conclusions of the paper are mostly supported by the data although some clarification is warranted concerning the exact CCL5 forms (without or with a fluorescent label or His-tag) and amounts/concentrations that were used in the individual experiments. This is important since it is known that modification of CCL5 at the N-terminus affects the interactions of CCL5 with the GPCRs CCR1, CCR3, and CCR5 and random labeling using monosuccinimidyl esters (as done by the authors with Cy-3) is targeting lysines. Since lysines are important for the GAG-binding properties of CCL5, knowledge of the number and location of the Cy-3 labels on CCL5 is important information for the interpretation of the experimental results with the fluorescently labeled CCL5. Was the His-tag attached to the N- or C-terminus of CCL5? Indicate this for each individual experiment and consider/discuss also potential effects of the modifications on CCL5 in the results and discussion sections.
Response: We agree with the reviewer that labeling may lead to altered property of a protein, thus, we have compared chemotactic activity of CCL5 and CCL5-EGFP (Figure 2—figure supplement 1). To further verify this, we performed additional experiment to compare chemotactic activity between CCL5 and Cy3-CCL5 (see Author response image 1). For the convenience of readers, we have combined the original Figure 2—figure supplement 1 with the new data (Author response image 1), which replaced original Figure 2—figure supplement 1.
The His-tag is attached to the C-terminus of CCL5, in consideration of the potential impact on the N-terminus.
(2) In general, the authors appear to use high concentrations of CCL5 in their experiments. The reason for this is not clear. Is it because of the effects of the labels on the activity of the protein? In most biological tests (e.g. chemotaxis assays), unmodified CCL5 is active already at low nM concentrations.
Response: We agree with the reviewer that the CCL5 concentrations used in our experiments were higher than reported chemotaxis assays and also higher than physiological levels in normal human plasma. In fact, we have performed experiments with lower concentration of CCL5, where the effect of LLPS was not seen though the chemotactic activity of the cytokine was detected. Thus, LLPS-associated chemotactic activity may represent a scenario of acute inflammatory condition when the inflammatory cytokines can increase significantly.
(3) For the statistical analyses of the results, the authors use t-tests. Was it confirmed that data follow a normal distribution prior to using the t-test? If not a non-parametric test should be used and it may affect the conclusions of some experiments.
Response: We thank the reviewer for pointing out this issue. As shown in Author response table 1, The Shapiro-Wilk normality test showed that only two control groups (CCL5 and 44AANA47-CCL5+CHO K1) in Figure 3 did not conform to the normal distribution. The error was caused by using microculture to count and calculate when there were very few cells in the microculture. For these two groups, we re-counted 100 μL culture medium to calculate the number of cells. The results were consistent with the positive distribution and significantly different from the experimental group (Author response image 3). The original data for the number of cells chemoattractant by 500 nM CCL5 was revised from 0, 247, 247 to 247, 123, 370 and 500 nM 44AANA47 +CHO-K1 was revised from 1111, 1111, 98 to 740, 494, 617. The revised data does not affect the conclusion.
Author response table 1.
Table R1 Shapiro-Wilk test results of statistical data in the manuscript

Author response image 3.
Quantification of THP-1collected from the lower chamber. Data are mean ± s.d. n=3. P values were determined by unpaired two-tailed t-tests.

Recommendations for the authors:
Reviewer #1:
See the weaknesses section of the Public Review. In addition, the authors should discuss the X-ray structure of CCL5 in complex with a heparin disaccharide in comparison with their docked structure of CCL5 and a heparin tetrasaccharide.
Response: Our study, in fact, is strongly influenced by the report (Shaw, Johnson et al., 2004) that heparin disaccharide interaction with CCL5, which is highlighted in the text (page5, line100-102).
Reviewer #2:
(1) Clearly indicate in the results section and figure legends (also for the supplementary figures) which form and concentration of CCL5 is used.
Response: The relevant missing information is indicated across the manuscript.
(2) Clearly indicate which GAG was used. Was it heparin or heparan sulfate and what was the length (e.g. average molecular mass if known) or source (company?)?
Response: Relevant information is added in the section “Materials and Methods.
(3) Line 181: What do you mean exactly with "tiny amounts"?
Response: “tiny amounts” means 400 transfected cells. This is described in the section of Materials and Methods. It is now also indicated in the text and legend to the figure.
(4) Lines 216-217: This is a very general statement without a link to the presented data. No combination of chemokines is used, in vivo testing is limited (and I agree very difficult). You may consider deleting this sentence (certainly as an opening sentence for the Discussion).
Response: We appreciate very much for the thoughtful suggestion of the reviewer. This sentence is deleted in the revised manuscript.
(5) Why was 5h used for the in vitro chemotaxis assay? This is extremely long for an assay with THP-1 cells.
Response: We apologize for the unclear description. The 5 hr includes 1 hr pre- incubation of CCL5 with the cells enable to form phase separation. After transferring the cells into the upper chamber, the actual chemotactic assay was 4 hr. This is clarified in the Materials and Methods section and the legend to each figure.
(6) Define "Sec" in Sec-CCL5-EGFP and "Dil" in the legend of Figure 4.
Response: The Sec-CCL5-EGFP should be “CCL5-EGFP’’, which has now been corrected. Dil is a cell membrane red fluorescent probe, which is now defined.
(7) Why are different cell concentrations used in the experiment described in Figure 5?
Response: The samples were from three volunteers who exhibited substantially different concentrations of cells in the blood. The experiment was designed using same amount of blood, so we did not normalize the number of the cell used for the experiment. Regardless of the difference in cell numbers, all three samples showed the same trend.
(8) Check the text for some typos: examples are on line 83 "ratio of CCL5"; line 142 "established cell lines"; line 196 "peripheral blood mononuclear cells"; line 224 "to mediate"; line 226 "bind"; line 247 "to form a gradient"; line 248 "of the glycocalyx"; line 343 and 346 "tetrasaccharide"; line 409-410 "wild-type"; line 543 "on the surface of CHO-K1 and CHO-677"; line 568 "white".
Response: Thanks for the careful reading. The typo errors are corrected and Manuscript was carefully read by colleagues.
-
Reviewer #2 (Public Review):
Although the study by Xiaolin Yu et al is largely limited to in vitro data, the results of this study convincingly improve our current understanding of leukocyte migration.
(1) The conclusions of the paper are mostly supported by the data and in the revised manuscript clarification is provided concerning the exact CCL5 forms (without or with a fluorescent label or His-tag) and amounts/concentrations that were used in the individual experiments. This is important since it is known that modification of CCL5 at the N-terminus affects the interactions of CCL5 with the GPCRs CCR1, CCR3 and CCR5 and random labeling using monosuccinimidyl esters (as done by the authors with Cy-3) is targeting lysines. The revised manuscript more clearly indicates for each individual experiment which form is used. However, a discussion on the potential effects of the modifications on CCL5 in the results and discussion sections is still missing.<br /> (2) In general, authors used high concentrations of CCL5 in their experiments. In their reply to the comments they indicate that at lower CCL5 concentrations no LLPS is detected. This is important information since it may indicate the need for chemokine oligomerization for LLPS. This info should be added to the manuscript and comparison with for instance the obligate monomer CCL7 and another chemokine such as CXCL4 that easily forms oligomers may clarify whether LLPS is controlled by oligomerization.<br /> (3) Statistical analyses have been improved in the revised manuscript.
-
-
docdrop.org docdrop.org
-
THE ADMINISTRATION ALSO HAS BEEN PRETTY QUIET ABOUT THAT FACT. THEY ARE NOT EAGER TO TELL THAT. THEY ARE VERY WORRIED THAT ENVIRONMENTAL GROUPS
for - oil industry lobby - adjacency - wicked problem - climate crisis - fossil fuel lobby - 2024 US elections - citizen power
adjacency - between - wicked problem - climate crisis - energy industry lobby - 2024 US elections - adjacency relationship - US fossil fuel companies are making record profits under the Biden administration - The Biden administration is not bragging about this because it will hurt their re-election efforts with young people - The government is still under the power of the fossil fuel lobby - Michael Mann states that Trump 2024 win would spell disaster for the earth's climate system - It is clear however that this is a situation of the lesser of two evils - The Fossil fuel lobby has still hamstrung the Biden administration's efforts, introducing dangerous delay - The majority of citizens face the challenge that they are kept in precarity to the existing system - so are afraid to rock the boat - This is a wicked problem - A Biden 2024 win is a necessary but NOT a sufficient condition for avoiding planetary tipping points - What is needed is true citizen power, direct citizen action, not just voting
-
-
-
John Snow's 1854 dot map of cholera deaths
Add in cite/context of longer history of epidemiological charts: https://www.thelancet.com/journals/lancet/article/PIIS0140-6736(00)02442-9/abstract
-
-
dataxdesign.io dataxdesign.io
-
These numerous advances, across astronomy, physics, mathematics, biology, chemistry, and more, were bound together by their belief in the value of knowledge gained through empirical evidence—that is to say, through evidence gained through experimentation, observation, and other forms of direct sensory experience. Knowledge was no longer just handed down from the heavens, divinely received, but was something that could be directly perceived.
From RJ: "This is a broader history of science, which is only one ingredient into the history of modern visualization. Feels both incomplete and too much. e.g. If you want to discuss astronomical observations and data then it is not correct to start here."
-
the “most worthy” epidemiological maps
From Sari, revise to acknowledge earlier epidemiological maps, viz. https://www.thelancet.com/journals/lancet/article/PIIS0140-6736(00)02442-9/abstract
-
-
academic.oup.com academic.oup.com
-
Israeli–Arab conflict, where the purpose of Moscow’s subversion-war was ‘to continue in Palestine the economic and moral attrition [of the United States] that started in Vietnam’
Attacking enemy's moral legitimacy and casus belli--> turning enemy population against their government/against actions taken by government. This was not possible prior to instant mass media, international communication, and transnational information networks.
-
Today, however, in times of psychological war, neither victory in battle, nor territorial gains, are the goals themselves: their main value is in their psychological effects. [Therefore] one should think not about the destruction of an enemy’s manpower, but about the crushing of his psychological power.
This is difficult to define. What is the threshold for victory in this psychological war? How can victory be determined?
-
‘subversive’ type of warfare, Messner argued, is ‘psychological warfare aimed to conquer the mind and soul of people, [of] an attacked nation’
subversive warfare==psychological warfare on enemy domestic population
-
large number of seemingly unconnected confrontations, each one of which had broken out for different reasons (religious, racial, social, ethnic, tribal, ideological, political, etc.); however, they all shared ‘one mutual aim—the destruction of the World, which has become outdated and does not know how to exit the cul-de-sac that it [the world] created by itself’
Aim of post-WWII conflicts, though seemingly unrelated, was 'destruction of the world.' --> destruction/change of international system.
-
half-war—‘a covert participation in war or feud’
'Half war' sort of synonymous with proxy war?
-
‘aggressive-diplomacy’, which refers to an ‘enforced form of diplomacy’ when a country ‘does not break the (allegedly) peaceful coexistence with an unappeasable state, but [simultaneously] mobilises oppositionists and revolutionists within it by propaganda and bribery’
'Aggressive Diplomacy'
-
-
learn-eu-central-1-prod-fleet01-xythos.content.blackboardcdn.com learn-eu-central-1-prod-fleet01-xythos.content.blackboardcdn.com
-
hat is Globalisation?
Globalisation is an ongoing historical procedure that featuring activities of human being more influential internationally, the increment of interconnection, the quicken of the global circulation functioning, and the blending of local and global event.
-
-
www.edutopia.org www.edutopia.org
-
Being curious about a topic will make students dive deeper into questions
-
Students asking question with curiosity can create a deeper thought of the topic
-
-
www.biorxiv.org www.biorxiv.org
-
eLife assessment
This important study indicates a role for linker Histone H1 in protecting heterochromatic regions from certain types of repression. The experiments and data analysis that support the model for the role of linker Histone H1are solid, although additional experiments could provide a deeper mechanistic understanding. The study will be of broad interest to those interested in the role of chromatin in eukaryotic gene expression.
-
Reviewer #1 (Public Review):
In this study, the authors obtained multiple, novel and compelling datasets to better understand the relationship between histone H1 and RNA-directed DNA methylation in plants. Most of the authors' claims concerning H1 and RNA polymerase V (Pol V) are backed by convincing and independent lines of evidence. However, Pol V produces noncoding transcripts that act as scaffold RNAs, which AGO4-bound siRNAs recognize in plant chromatin to mediate RNA-directed DNA methylation. Detection of Pol V transcript products at the sites of Pol V redistribution in h1 mutants would significantly enhance the impact of this manuscript. Below I have listed several strengths and a weakness of the manuscript.
Strengths:
- The authors report high-quality NRPE1 ChIP-seq data, allowing them to directly test how and where Pol V occupancy depends on histone H1 function in Arabidopsis.<br /> - nrpe1 mutants generated via CRISPR/Cas9 in the h1 mutant background (nrpe1 h1.1-1 h1.2-1 triple mutants), allow the authors to study the role of Pol V in ectopic DNA methylation in H1-deficient plants.<br /> - Pol V recruitment via ZincFinger-DMS3 expression (a modified version of Pol V's DMS3 recruitment factor) sends Pol V to new genomic loci and thus provides the authors with an innovative dataset for understanding H1 function at these sites.
Weakness:
- The manuscript does not include detection or quantification of Pol V transcripts generated at ectopic sites in the h1 mutant background. Pol V encroachment into heterochromatin in the h1 mutant is indirectly shown by NRPE1-dependent methylation at such ectopic sites.
Previous studies have charted the relationship between H1 function and RNA-directed DNA methylation (RdDM) via analyses of Pol IV-dependent 24 nt siRNAs and factors that recruit Pol IV (Choi et al., 2021 and Papareddy et al., 2020). Harris and colleagues have extended this work and shown that histone H1 function also antagonizes Pol V occupancy in the context of constitutive heterochromatin. The authors thus provide important evidence to show that H1 limits the encroachment of both polymerases Pol IV and Pol V into plant heterochromatin.
-
Reviewer #2 (Public Review):
Summary:
The main conclusion of the manuscript is that the presence of linker Histone H1 protects Arabidopsis pericentromeric heterochromatic regions and longer transposable elements from encroachment by other repressive pathways. The manuscript focuses on the RNA-dependent DNA-methylation (RdDM) pathway but indirectly finds that other pathways must also be ectopically enriched.
Strengths:
The authors present diverse sets of genomic data comparing Arabidopsis wild-type and h1 mutant background allowing an analysis of differential recruitment of RdDM component NPRE1, which is related to changes in DNA methylation and H1 coverage. The manuscript also contains recruitment data for SUVH1 in wild-type and h1 mutant backgrounds.<br /> Furthermore, the authors make use of a line that recruits NRPE1 ectopically to show that H1 occupancy is not altered because of this recruitment. These data clearly show that there is a hierarchy in which DNA-methylation is impacted by presence of H1 while H1 distribution is independent of DNA-methylation.
Weaknesses:
The manuscript is driven by a strong and reasonable hypothesis that absence of H1 results increased access of chromatin binding factors and that this explains how the RdDM machinery is restricted from encroaching heterochromatic regions, which are particularly enriched in H1. Indeed, increased binding of NPRE1 at pericentromeric sites is observed; however, the major DNA-methylation changes at these sites are symmetric and not related to the RdDM pathway. Thus, the authors propose that many factors redistribute, which is again reasonable. The authors show redistribution of SUVH1 and relate their data to a previous report showing redistribution of the PcG machinery in H1 depletion mutants (Teano et al. in Cell reports (Volume 42, Issue 8, 29 August 2023), but the manuscript provides limited mechanistic insight as to why there is a strong increase in heterochromatin symmetric DNA-methylation.
-
Author response:
The following is the authors’ response to the original reviews.
Recommendations for the authors:
Reviewer #1 (Recommendations For The Authors):
Pg. 3 - lines 51-53: "Once established, the canonical RdDM pathway takes over, whereby small RNAs are generated by the plant-specific polymerase IV (Pol IV). In both cases, a second plant-specific polymerase, Pol V, is an essential downstream component." The authors' intro omits an important aspect of Pol V's function in RdDM, which is quite relevant to their study. Pol V transcribes DNA to synthesize noncoding RNA scaffolds, to which AGO4-bound 24 nt siRNAs are thought to base pair, leading to DRM2 recruitment for cytosine methylation near to these nascent Pol V transcripts (Wierzbicki et al 2008 Cell; Wierzbicki et al. 2009 Nat Genet). I recommend that the authors cite these key studies.
These citations have now been added (see line 57).
The authors provide compelling evidence that Pol V redistributes to ectopic heterochromatin regions in h1 mutants (e.g., Fig1a browser shot). Presumably, this would allow Pol V to transcribe these regions in h1 mutants, whereas it could not transcribe them in WT plants. Have the authors detected and/or quantified Pol V transcripts in the h1 mutant compared to WT plants at the sites of Pol V redistribution (detected via NRPE1 ChIP)?
Robust detection of Pol V transcripts can be experimentally challenging, and instead we quantify and detect NRPE1 dependent methylation at these regions (Fig 5), which occurs downstream of Pol V transcript production. However, we note detecting Pol V transcripts as a potential future direction in the discussion (see line 263).
Pg. 5 - lines 101-102: Figure 1e - "The preferential enrichment of NRPE1 in h1 was more pronounced at TEs that overlapped with heterochromatin associated mark, H3K9me2 (Fig. 1e). Was a statistical test performed to determine that the overall differences are significant only at TE sites with H3K9me2? Can the sites without H3K9me2 also be differentiated statistically?
Yes, there is a statistically significant difference between WT and h1 at both the H3K9me2 marked and unmarked TEs (Wilcoxon rank sum tests, see updated Fig 1e). The size of the effect is larger for the H3K9me2 marked TEs (median difference of 0.41 vs 0.16). Median values have now been added to the boxplots so that this is directly viewable to the reader (Fig 1e). This reflects the general increase in NRPE1 occupancy in h1 mutants through the genome, with the effect consistently stronger in heterochromatin. In our initial version of the manuscript, we summarise the effect as follows “We found that h1 antagonizes NRPE1 occupancy throughout the genome, particularly at heterochromatic regions” (previous version line 83, current version line 95). Although important exceptions exist (see Fig 5, NRPE1 and DNA methylation loss in h1), we now make this point even more explicit, and have updated the manuscript at several locations (abstract line 26, results line 245, discussion line 265).
Pg. 5 - lines 108-110: The authors state, "Importantly, we found no evidence for increased NRPE1 expression at the mRNA or protein level in the h1 mutant (Suppl. Fig. 2)." But the authors did observe reduced NRPE1 transcript levels in h1 mutants, in their re-analysis of RNA-seq data and reduced NRPE1 protein signals via western blot in (Suppl. Fig. 2), which should be reported here in the results.
As described further below, we reanalysed h1 RNA-seq from scratch, and see no evidence for significant differential gene expression of NRPE1. This table and analysis are now provided in Supplementary Table 1.
More importantly, the above logic about NRPE1 expression in h1 mutants assumes that NRPE1 is the stoichiometrically limiting subunit for Pol V assembly and function in vivo, but this is not known to be the case:
(1) While NRPE1's expression is somewhat reduced (and not increased) in h1 mutant plants, we cannot be certain that other genes influencing Pol V stability or recruitment are unaffected by h1 mutants. I thus recommend that the authors perform RT-qPCR directly on the WT and h1 mutant materials used in their current study, quantifying NRPE1, NRPE2, NRPE5, DRD1, DMS3, RDM1, SUVH2 and SUVH9 transcript levels.
(2) Normalizations used to compare samples should be included with RT-qPCR and western assays. An appropriate house-keeping gene like Actin2 or Ubiquitin could be used to normalize the RT-qPCR. Protein sample loading in Suppl. Fig. 2 could be checked by Coomassie staining and/or an antibody detection of a house-keeping protein.
We have now included a full re-analysis of h1 RNA-seq (data from Choi et al 2020) focusing on transcriptional changes of DNA methylation machinery genes in the h1 mutant. Of the 61 genes analysed, only AGO6 and AGO9 were found to be differentially expressed (2-3 fold upregulation). This analysis is now included as a table
(Supplementary Table 1). The western blot has been moved to Supplementary Fig 3 to now illustrate antibody specificity and H1 loss in the h1 mutant lines, so NRPE1 itself serves as a loading control (Supplementary Fig 3a).
Pg. 6 - lines 129-131: The authors state that "over NRPE1 defined peaks (where NRPE1 occupancy is strongest in WT) we observed no change in H1 occupancy in nrpe1 (Fig 2b). The results indicate that H1 does not invade RdDM regions in the nrpe1 mutant background." This conclusion assumes that the author's H1 ChIP is successfully detecting H1 occupancy. However, in Fig 2d there does not appear to be H1 enrichment or peaks as visualized across the 10766 ZF-DMS3 off-target loci, or even at the selected 451 ZFDMS3 off-target hyper DMRs, where the putative signal for H1 enrichment on the metaplot center is extremely weak/non-existent.
As a reference for H1 enrichment in chromatin (e.g., looking where H2A.W antagonizes H1 occupancy) one can compare analyses in Bourguet et al (2021) Nat Commun, involving co-authors of the current study. Bourguet et al (2021) Fig 5b show a metaplot of H1 levels centered on H2A.W peaks with H1 ChIP signal clearly tapering away from the metaplot center point peak. To my eye, the H1 ChIP metaplots for ZF-DMS3 offtarget loci in the current manuscript (Fig 2d) resemble "shuffled peaks" controls like those in Fig 5b of Bourguet et al (2021).
Can one definitively interpret Fig 2d as showing RdDM "not reciprocally affecting H1 localization" without first showing the specificity of the ChIP-seq results in a genotype where H1 occupancy changes? Alternatively, could this dataset be displayed with Deeptools heatmaps to strengthen the evidence that the authors are detecting H1 occupancy/enrichment genome-wide, before diving into WT/nrpe1 mutant analysis at ZF-DMS3 off-target loci?
This is an excellent suggestion from the reviewer. We have now included several analyses that assess and demonstrate the quality of our H1 ChIP-seq profiles. First, as suggested by the reviewer, we show that our H1 profiles peak over H2A.W enriched euchromatic TEs as defined by Bourguet et al, mirroring these published findings. Next, we investigated whether our H1 profiles match Teano’s recently described pattern over genes, confirming a similar pattern with 3’ enrichment of H1 over H3K27me3 unmarked genes. Furthermore, we show that the H1 peaks defined here are similarly enriched with GFP tagged H1.2 from the Teano et al. 2023 study. These analyses that validate the quality of our H1 ChIP-seq datasets and bolster the conclusion that NRPE1 redistribution does not affect H1 occupancy. These new analysis are now presented in Supplementary Figure 3 and see line 153.
Pg. 8 - lines 228-230: The authors state that, "As with NRPE1, SUVH1 increased in the h1 background significantly more in heterochromatin, with preferential enrichment over long TEs, cmt2 dependent hypo CHH DMRs, and heterochromatic TEs (Fig. 6b)."
Contrary to the above statement, the violin plots in Fig. 6c show SUVH1 occupancy increasing at euchromatic TEs in the h1 mutant. What statistical test allowed the authors to determine that the increase in h1 occurs "significantly more in heterochromatin"? The authors should critically interpret Fig. 6c and 6d, which are not currently referenced in the results section. More support is needed for the claim that SUVH1 specifically encroaches into heterochromatin in the h1 mutant, rather than just TEs generally (euchromatic and heterochromatic alike).
Similar to what we see for NRPE1, statistical tests that we have now performed show that SUVH1 is significantly enriched in h1 in all classes. Importantly however, the effect size is larger in all of the heterochromatin associated classes. We display these statistical tests and the median values on the plots so that effects are immediately viewable (see updated Fig 6).
In addition, the authors should verify that SUVH1-3xFLAG transgenes (in the WT and h1 mutant backgrounds, respectively) and endogenous Arabidopsis genes encoding the transcriptional activator complex (SUVH1-SUVH3-DNAJ1-DNAJ2) are not overexpressed in the h1 mutant vs. WT. Higher expression of SUVH1 or limiting factors in the larger complex could explain the observation of increased SUVH1 occupancy in the h1 background.
We do not see a difference in SUVH1/3/DNAJ1/2 complex gene expression in the h1 background (see Supplementary Table 1). However, we cannot rule out that that our SUVH1-FLAG line in h1 is more highly expressed than the corresponding SUVH1-FLAG line in WT. We now note this point in line 248.
Pg. 8 - lines 231-232: Here the authors make a sweeping conclusion about H1 demarcating, "the boundary between euchromatic and heterochromatic methylation pathways, likely through promoting nucleosome compaction and restricting heterochromatin access." I do not see how a H1 boundary between euchromatic and heterochromatic methylation pathways is revealed based on the SUVH1-3xFLAG occupancy data, which shows increased enrichment at every category interrogated in the h1 mutant (Fig 6b,c,d) and all along the baseline too in the h1 mutant browser tracks (Fig 6a). Can the authors provide more examples of this phenomenon (similar to Fig 6a) and better explain why their SUVH1-3xFLAG ChIP supports this demarcation model?
The general conclusion from SUVH1 about H1’s agnostic role in preventing heterochromatin access is now further supported from our findings with H3K27me3 (see Figure 6e and description from line 250). However, we agree that the demarcation model as initially presented was overly simplistic. This point was also raised by reviewer 2. We have removed the line highlighted by the reviewer in the revised version of the manuscript. In the revised version we clarify that H1 impedes RdDM and associated machinery throughout the genome (consistent with H1’s established broad occupancy across the genome) but this effect is most pronounced in heterochromatin, corresponding to maximal H1 occupancy (abstract line 26, results line 245, discussion line 265).
Corrections:
Pg. 8 - lines 226-227: "We therefore wondered whether complex's occupancy might also be affected by H1." The sentence contains a typo, where I assume the authors mean to refer to occupancy by the SUVH1-SUVH3-DNAJ1-DNAJ2 transcriptional activator complex. This needs to be specified more clearly.
The paragraph has been updated (see from line 237).
Pg. 13 - lines 393-405: There are minor errors in the capitalization of titles and author initials in the References. I recommend that the authors proofread all the references to eliminate these issues:
Thank you, these have been corrected.
Choi J, Lyons DB, Zilberman D. 2021. Histone H1 prevents non-cg methylation-mediated small RNA biogenesis in arabidopsis heterochromatin. Elife 10:1-24. doi:10.7554/eLife.72676 (...)
Du J, Johnson LM, Groth M, Feng S, Hale CJ, Li S, Vashisht A a., Gallego-Bartolome J, Wohlschlegel J a., Patel DJ, Jacobsen SE. 2014. Mechanism of DNA methylation-directed histone methylation by KRYPTONITE. Mol Cell 55:495-504. doi:10.1016/j.molcel.2014.06.009 (...)
Du J, Zhong X, Bernatavichute Y V, Stroud H, Feng S, Caro E, Vashisht A a, Terragni J, Chin HG, Tu A, Hetzel J, Wohlschlegel J a, Pradhan S, Patel DJ, Jacobsen SE. 2012. Dual binding of chromomethylase domains to H3K9me2-containing nucleosomes directs DNA methylation in plants. Cell 151:167-80. doi:10.1016/j.cell.2012.07.034
Reviewer #2 (Recommendations For The Authors):
As for a normal review, here are our major and minor points.
Major:
(1) Lines 38 to 45 of the introduction are important for the subsequent definition of heterochromatic and non-heterochromatic transposons, but the definition is ambiguous. Is heterochromatin defined by surrounding context such as pericentromeric position or is this an autonomous definition? Can a TE with the chromosomal arms be considered heterochromatic provided that it is long enough and recruits the right machinery? These cases should be more explicitly introduced. Ideally, a supplemental dataset should provide a key to the categories, genomic locations and overlapping TEs as they were used in this analysis, even if some of the categories were taken from another study.
We have now added all the regions used for analysis in this study to Supplementary Table 3.
(2) Line 80: This would be the first chance to cite Teno et al. and the "encroachment" of
PcG complexes to TEs in H1 mutants
Done - “H1 also plays a key role in shaping nuclear architecture and preventing ectopic polycomb-mediated H3K27me3 deposition in telomeres (Teano et al., 2023).” See line 83
(3) It is "only" a supplemental figure but S2 but it should still follow the rules: Indicate the number of biological replicates for the RNA-seq data, and perform a statistical test. In case of WB data, provide a loading control.
We are now using the western blot to illustrate antibody specificity and H1 loss in the h1 mutant lines, so NRPE1 itself serves as a loading control (Supplementary Fig 3a). For NRPE1 mRNA expression, we have now replaced this with a more comprehensive transcriptome analysis of methylation machinery in h1 (see Supplementary Table 1).
(4) Lines 115 to 124 and corresponding data: Here, the goal is to exclude other changes to heterochromatin structure other than "increased access" in H1 mutants; however, only one feature, H3K9me2, is tested. Testing this one mark does not necessarily prove that the nature of the chromatin does not change, e.g. H2A.W could be differently redistributed, DDM1 may change, VIM protein, and others. Either more comprehensive testing for heterochromatin markers should be performed, or the conclusions moderated.
We have moderated the text accordingly (see line 135).
(5) Lines 166ff and Figure 1, a bit out of order also Figure 5: The general hypothesis is that NRPE1 redistributes to heterochromatic regions in h1 mutants (as do other chromatin modifiers), but the data seem to only support a higher occurrence at target sites.
a. The way the NRPE1 data is displayed makes it seem like there is much more NRPE1 in the h1 samples, even at peaks that should not be recruiting more as they do not represent "long" TEs. It would be good to present more gbrowse shots of all peak classes.
We now clarify that h1 does result in a general increase of NRPE1 throughout the genome, but the effect is strongest at heterochromatin. In our initial version of the manuscript, we summarise the effect as follows “We found that h1 antagonizes NRPE1 occupancy throughout the genome, particularly at heterochromatic regions” (previous version line 83, current version line 95). We have modified the language at several locations throughout the manuscript to make this point more clearly (abstract line 26, results line 245, discussion line 265). We include several browser shots in Supp Fig. 8.
b. The data are "normalized" how exactly?
c. One argument of observing "gaining" and "losing" peaks is that there is redistribution of NRPE1 from euchromatic to heterochromatic sites. There should be an analysis and figure to corroborate the point (e.g. by comparing FRIP values). Figure 1b shows lower NRPE1 signals at the TE flanking regions. This could reflect a redistribution or a flawed normalization procedure.
The data are normalised using a standardised pipeline by log2 fold change over input, after scaling each sample by mapped read depth using the bamCompare function in deepTools. This is now described in detail in the Materials and Methods line 365, with full code and pipelines available from GitHub (https://github.com/Zhenhuiz/H1-restrictseuchromatin-associated-methylation-pathways-from-heterochromatic-encroachment).
d. Figure 1d and f show similar profiles comparing "long" and "short" TEs or "CMT2 dependent hypo-CHH" and "DRM2 dependent CHH". How do these categories relate to each other, how many fragments are redundant?
The short vs long TEs were defined in Liu et al 2018 (doi: 10.1038/s41477-017-0100-y) and the DMRs were defined in Zhang et al. 2018 (DOI: 10.1073/pnas.1716300115). There is likely to be some degree of overlap between the categories, but numbers are very different (short TEs (n=820), long TEs (n=155), drm2 DMRs (n=5534), CMT (n=21784)) indicating that the different categories are informative. We have now listed all the regions used for analysis in this study as in Supplementary Table 3.
e. The purpose of the data presented in Figure 1 b is to compare changes of NRPE1 association in H3K9me3 non-overlapping and overlapping TEs between wild-type and background, yet the figure splits the categories in two subpanels and does neither provide a fold-change number nor a statistical test of the comparison. As before, the figure does not really support the idea that NPRE1 somehow redistribute from its "normal" sites towards heterochromatin as both TE classes seem to show higher NRPE1 binding in h1 mutants.
There is a statistically significant difference between WT and h1 at both the H3K9me2 marked and unmarked TEs, however, the size of the effect is larger for the H3K9me2 marked TEs (median difference of 0.41 vs 0.16). Median values have now been added to the boxplots so that this is directly viewable to the reader (Fig 1e). Although important exceptions exist (see Fig 5 – regions that lose NRPE1 and DNA methylation), this reflects the general increase in NRPE1 occupancy in h1 mutants throughput the genome, with a consistently stronger effect in heterochromatin. As noted above, we have updated the manuscript to make this point more clearly (abstract line 26, results line 245, discussion line 265).
f. Panel g is the only attempt to corroborate the redistribution towards heterochromatic regions, but at this scale, the apparent reduction of binding in the chromosome arms may be driven by off-peak differences and normalization problems between different ChIP samples with different signal-to-noise-ratio.
We describe our normalisation and informatic pipeline in more detail in the Materials and Methods line 365. It is also important to note that the reduction is not only observed at the chromosomal level, but also at specific sites. We called differential peaks between WT and h1 mutant. The "Regions that gain NRPE1 in h1" peaks are more enriched in heterochromatic regions, while " Regions that lose NRPE1 in h1" peaks are more enriched outside heterochromatic regions.
g. Figure 5: how many regions gain vs lose NRPE1 in h1 mutants? If the "redistribution causes loss" scenario applies, the numbers should overall be balanced but that does not seem the case. The loss case appears to be rather exceptional judging from the zigzagging meta-plot. Are these sites related to the sites taken over by PcG-mediated repression in h1 mutants?
As described in line 222 (previous version of the manuscript line 206), there are 15,075 sites that gain and 1,859 sites that lose NRPE1 in h1. Comparing these sites to
H3K27me3 in the Teano et al. study was an excellent suggestion. We compared sites that gain NRPE1 to sites that gain H3K27me3 in h1, finding a statistically significant overlap (2.4 fold enrichment over expected, hypergeometric test p-value 2.1e-71). Reciprocally, sites that lose NRPE1 were significantly enriched for overlap with H3K27me3 loss regions (1.6 fold over expected, hypergeometric test p-value 1.4e-4). This indicates that RdDM and H3K27me3 patterning are similarly modulated by H1. To directly test this, we reanalysed the H3K27me3 ChIP-seq data from Teano et al., finding coincident gain and loss of H3K27me3 at sites that gain and lose NRPE1 in h1. These results are described from line 250 and in Fig 6e, which supports a general role for H1 in preventing heterochromatin encroachment.
(6) Lines 166ff and Figure 3: The data walk towards the scenario of pathway redistribution but actually find that RdDM plays a minor role overall as a substantial increase in heterochromatin regions occurs in all contexts and is largely independent of RdDM.
a. How exactly are DNA-methylation data converted across regions to reach a fraction score from 0 to 1? There is no explanation in the legend for the methods that allow to recapitulate.
We now explain our methods in full in the Materials and Methods and all the code for generating these has now been deposited on GitHub (https://github.com/Zhenhuiz/H1restricts-euchromatin-associated-methylation-pathways-from-heterochromaticencroachment). Briefly, BSMAP is used to calculate the number of reads that are methylated vs unmethylated on a per-cytosine basis across the genome. Next, the DNA methylation fraction in each region is calculated by adding all the methylation fractions per cytosine in a given window, and divided by the total number of cytosines in that same window (ie mC/(unmC+mC)) i.e. this is expressed as a fraction ranging from 0 to 1.
“0” indicates this region is not methylated, and “1” indicates this region is fully methylated (every cytosine is 100% methylated).
b. Kernel plots? These are slang for experts and should be better described. In addition, nothing is really concluded from these plots in the text, although they may be quite informative.
Kernel density plots show the proportion of TEs that gain or lose methylation in a particular mutant, rather than the overall average as depicted in the methylation metaplots above. We now describe the kernel density plots in more detail in the Figure 3 legend.
(7) Figure 4: This could be a very interesting analysis if the reader could actually understand it.
a. The legend is minimal. What is the meaning of hypo and hyper regions indicated to the right of Figure 4c?
b. The color scale represents observed/expected values. What exactly does this mean? Mutant vs WT?
c. Some comparisons in 4a are cryptic, e.g. h1 nrpe1 nrpe1 vs CHH?
d. Figure 4d focuses on a correlation square of relevance, but why? Interestingly the square does not correspond to any "hypo" or "hyper" label?
Thank you, we have revised Figure 4 and legend based on these suggestions to clarify all of the above.
(8) Lines 226 and Figure 6B. De novo (or increased) targeting of SUVH1 to heterochromatic sites in h1 mutants, similar to NRPE1, is used to support the argument that more access allows other chromatin modifiers to encroach. SUVH1 strongly depends on RdDM for its in vivo binding and may be the least conclusive factor to argue for a "general" encroachment mechanism.
We appreciate the reviewers point here. Something that is entirely independent of RdDM following the same pattern would be stronger evidence in favour of general encroachment. Excitingly, this is exactly what we provide evidence for when investigating the interrelationship with H3K27me3 and we appreciate the reviewer’s suggestion to check this! This data is now described in Figure 6e and line 250.
Minor:
(1) Line 23: "Loss of H1 resulted in heterochromatic TE enrichment by NRPE1." This does not seem right. NRPE enrichment as TEs
Modified, (line 26) thank you.
(2) Lines 73-74: The idea that DDM1 displaces H1 in heterochromatic TEs is somewhat counterintuitive to model that heterochromatic TEs are unavailable for RdDM because of the presence of H1. Is this displacement non-permanent and directly linked to interaction with CMT2/3 Met1?
This is a very good question and we agree with the reviewer that the effect of DDM1 may only be transient or insufficient to allow for full RdDM assembly, or indeed there may be a direct interaction between DDM1 and CMTs/MET1. During preparation of these revisions, a structure of Arabidopsis nucleosome bound DDM1 was published, which provides some insight by showing that DDM1 promotes DNA sliding. This is at least consistent with the idea of DDM1 causing transient / non-permanent displacement of H1 that would be insufficient for RdDM establishment. We incorporate discussion of these ideas at line 80.
(3) Line 85: A bit more background on the Reader activator complex should be given. In fact, the reader may not really care that it was more recently discovered (not really recent btw) but what does it actually do?
We have quite extensively reconfigured this paragraph to take into account our new finding with H3K27me3, such that there is less emphasis on the reader activator complex. The sentence now reads as follows:
“We found that h1 antagonizes NRPE1 occupancy throughout the genome, particularly at heterochromatic regions. This effect was not limited to RdDM, similarly impacting both the methylation reader complex component, SUVH1 (Harris et al., 2018) and polycomb-mediated H3K27me3 (Teano et al., 2023).” (line 95).
Also, when describing the experiment the results section (line 241), we now provide more background on SUVH1’s function.
(4) Lines 80-81: Since it is already shown that RdDM associated small RNAs are more enriched in h1 at heterochromatin, help us to know what is precisely the added value of studying the enrichment of NRPE1 at these sites.
Good point. We have the following line: ‘...small RNAs are not a direct readout of functional RdDM activity and Pol IV dependent small RNAs are abundant in regions of the genome that do not require RdDM for methylation maintenance and that do not contain Pol V (Stroud et al., 2014).’ (line 90)
(5) Line 99: This seems to be the only time where the connection between long TEs and heterochromatic regions is mentioned but no source is cited.
We have added the following appropriate citations: (Bourguet et al., 2021; Zemach et al., 2013). (line 110).
(6) Line 100: DMRs is used for the first time here without explanation and full text. The abbreviation is introduced later in the text (Line 187).
Thank you, we now describe DMRs upon first use, line 112.
(7) Figure 2: Panels 2 c and d should show metaplots for WT and transgenes in one panel. There is something seriously wrong with the normalization in d or the scale for left and right panel is not the same. Neither legend nor methods describe how normalization was performed.
Thank you for pointing this out, the figure has been corrected. We have updated the Materials and Methods (line 365) and have added codes and pipelines to GitHub to explain the normalisation procedure in more detail (https://github.com/Zhenhuiz/H1restricts-euchromatin-associated-methylation-pathways-from-heterochromaticencroachment).
-
-
storage.aprovatotal.com.br storage.aprovatotal.com.br
-
Esteroides
estrutura básica de quatro anéis de carbono.
-
-
www.biorxiv.org www.biorxiv.org
-
eLife assessment
This study presents a valuable new behavioral apparatus aimed at differentiating the strategies animals use to orient themselves in an environment. The evidence supporting the claims is solid, with statistical modeling of animal behavior. Overall, this study will attract the interest of researchers exploring spatial learning and memory.
-
Reviewer #1 (Public Review):
The authors design an automated 24-well Barnes maze with 2 orienting cues inside the maze, then model what strategies the mice use to reach the goal location across multiple days of learning. They consider a set of models and conclude that the animals begin with a large proportion of random choices (choices irrespective of the goal location), which over days of experience becomes a combination of spatial choices (choices targeted around the goal location) and serial choices (successive stepwise choices in a given direction). Moreover, the authors show that after the animal has many days of experience in the maze, they still often began each trial with a random choice, followed by spatial or serial choices.
This study is written concisely and the results are presented concisely. The best fit model provides valuable insight into how the animals solve this task, and therefore offers a quantitative foundation upon which tests of neural mechanisms of the components of the behavioral strategy can be performed. These tests will also benefit from the automated nature of the task.
-
Reviewer #2 (Public Review):
This paper uses a novel maze design to explore mouse navigation behaviour in an automated analogue of the Barnes maze. A major strength is the novel and clever experimental design which rotates the floor and intramaze cues before the start of each new trial, allowing the previous goal location to become the next starting position. The modelling sampling a Markov chain of navigation strategies is elegant, appropriate and solid, appearing to capture the behavioural data well. This work provides a valuable contribution and I'm excited to see further developments, such as neural correlates of the different strategies and switches between them.
-
Reviewer #3 (Public Review):
Strength:
The development of an automated Barnes maze allows for more naturalistic and uninterrupted behavior, facilitating the study of spatial learning and memory, as well as the analysis of the brain's neural networks during behavior when combined with neurophysiological techniques. The system's design has been thoughtfully considered, encompassing numerous intricate details. These details include the incorporation of flexible options for selecting start, goal, and proximal landmark positions, the inclusion of a rotating platform to prevent the accumulation of olfactory cues, and careful attention given to atomization, taking into account specific considerations such as the rotation of the maze without causing wire shortage or breakage. When combined with neurophysiological manipulations or recordings, the system provides a powerful tool for studying spatial navigation system.<br /> The behavioral experiment protocols, along with the analysis of animal behavior, are conducted with care, and the development of behavioral modeling to capture the animal's search strategy is thoughtfully executed. It is intriguing to observe how the integration of these innovative stochastic models can elucidate the evolution of mice's search strategy within a variant of the Barnes maze.
Comments on revised version:
The authors have addressed all the points I outlined in the previous round of review, resulting in significant improvements to the manuscript. However, I have one remaining comment. Given the updated inter-animal analysis (Supplementary Figure 8), it appears that male and female mice develop strategies differently across days. Male mice seem to progressively increase their employment of spatial strategy across days, at the expense of the random strategy. Conversely, female mice exhibit both spatial and serial strategies at their highest levels on day 2, with minimal changes observed on the subsequent days.<br /> These findings could alter the interpretation of Figure 5 and the corresponding text in the section "Evolution of search strategy across days".<br /> For instance, this statement on page 6 doesn't hold for female mice: "The spatial strategy was increased across days, ... largely at the expense of the random strategy."
-
Author response:
The following is the authors’ response to the original reviews.
We are very grateful to the reviewers for their constructive comments. Here is a summary of the main changes we made from the previous manuscript version, based on the reviewers’ comments:
(1) Introduction of a new model, based on a Markov chain, capturing within-trial evolution in search strategy .
(2) Addition of a new figure investigating inter-animal variations in search strategy.
(3) Measurement of model fit consistency across 10 simulation repetitions, to prevent the risk of model overfitting.
(4) Several clarifications have been made in the main text (Results, Discussion, Methods) and figure legends.
(5) We now provide processed data and codes for analyses and models at GitHub repository
(6) Simplification of the previous modeling. We realized that the two first models in the previous manuscript version were simply special cases of the third model. Therefore, we retained only the third model, which has been renamed as the ‘mixture model’.
(7) Modification of Figure 4-6 and Supplementary Figure 7-8 (or their creation) to reflect the aforementioned changes
Public Reviews:
Reviewer #1 (Public Review):
The authors design an automated 24-well Barnes maze with 2 orienting cues inside the maze, then model what strategies the mice use to reach the goal location across multiple days of learning. They consider a set of models and conclude that one of these models, a combined strategy model, best explains the experimental data.
This study is written concisely and the results presented concisely. The best fit model is reasonably simple and fits the experimental data well (at least the summary measures of the data that were presented).
Major points:
(1) One combined strategy (once the goal location is learned) that might seem to be reasonable would be that the animal knows roughly where the goal is, but not exactly where, so it first uses a spatial strategy just to get to the first vestibule, then switches to a serial strategy until it reaches the correct vestibule. How well would such a strategy explain the data for the later sessions? The best combined model presented in the manuscript is one in which the animal starts with a roughly 50-50 chance of a serial (or spatial strategy) from the start vestibule (i.e. by the last session before the reversal the serial and spatial strategies are at ~50-50m in Fig. 5d). Is it the case that even after 15 days of training the animal starts with a serial strategy from its starting point approximately half of the time? The broader point is whether additional examination of the choices made by the animal, combined with consideration of a larger range of possible models, would be able to provide additional insight into the learning and strategies the animal uses.
Our analysis focused on the evolution of navigation strategies across days and trials. The reviewer raises the interesting possibility that navigation strategy might evolve in a specific manner within each trial, especially on the later days once the environment is learned. To address this possibility, we first examined how some of the statistical distributions, previously analyzed across days, evolved within trials. Consistent with the reviewer’s intuition, the statistical distributions changed within trials, suggesting a specific strategy evolution within trials. Second, we developed a new model, where strategies are represented as nodes of a Markov chain. This model allows potential strategy changes after each vestibule visit, according to a specific set of transition probabilities. Vestibules are chosen based on the same stochastic processes as in the previous model. This new model could be fitted to the experimental distributions and captured both the within-trial evolution and the global distributions. Interestingly, the trials were mostly initiated in the random strategy (~67% chance) and to a lesser extent in the spatial strategy (~25% chance), but rarely in the serial strategy (~8% chance). This new model is presented in Figure 6.
(2) To clarify, in the Fig. 4 simulations, is the "last" vestibule visit of each trial, which is by definition 0, not counted in the plots of Fig. 4b? Otherwise, I would expect that vestibule 0 is overrepresented because a trial always ends with Vi = 0.
The last vestibule visit (vestibule 0 by definition) is counted in the plots of Fig.4b. We initially shared the same concern as the reviewer. However, upon further consideration, we arrived at the following explanation: A factor that might lead to an overrepresentation of vestibule 0 is the fact that, unlike other vestibules, it has to be contained in each trial, as trials terminated upon the selection of vestibule 0. Conversely, a factor that might contribute to an underrepresentation of vestibule 0 is that, unlike other vestibules, it cannot be counted more than once per trial. Somehow these two factors seem to counterbalance each other, resulting in no discernible overrepresentation or underrepresentation of vestibule 0 in the random process.
Reviewer #2 (Public Review):
This paper uses a novel maze design to explore mouse navigation behaviour in an automated analogue of the Barnes maze. Overall I find the work to be solid, with the cleverly designed maze/protocol to be its major strength - however there are some issues that I believe should be addressed and clarified.
(1) Whilst I'm generally a fan of the experimental protocol, the design means that internal odor cues on the maze change from trial to trial, along with cues external to the maze such as the sounds and visual features of the recording room, ultimately making it hard for the mice to use a completely allocentric spatial 'place' strategy to navigate. I do not think there is a way to control for these conflicts between reference frames in the statistical modelling, but I do think these issues should be addressed in the discussion.
It should be pointed out that all cues on the maze (visual, tactile, odorant) remained unchanged across trials, since the maze was rotated together with goal and guiding cues. Furthermore, the maze was equipped with an opaque cover to prevent mice from seeing the surrounding room (the imaging of mouse trajectories was achieved using infrared light and camera). It is however possible that some other cues such as room sounds and odors could be perceived and somewhat interfered with the sensory cues provided inside the maze. We have now mentioned this possibility in the discussion.
(2) Somewhat related - I could not find how the internal maze cues are moved for each trial to demarcate the new goal (i.e. the luminous cues) ? This should be clarified in the methods.
The luminous cues were fixed to the floor of the arena. Consequently, they rotated along with the arena as a unified unit, depicted in figure 1. We have added some clarifications in Figure 1 legend and methods.
(3) It appears some data is being withheld from Figures 2&3? E.g. Days 3/4 from Fig 2b-f and Days 1-5 on for Fig 3. Similarly, Trials 2-7 are excluded from Fig 3. If this is the case, why? It should be clarified in the main text and Figure captions, preferably with equivalent plots presenting all the data in the supplement.
The statistical distributions for all single days/trials are shown in the color-coded panels of Figure2&3. In the line plots of Figure2&3, we show only the overlay of 2-3 lines for the sake of clarity. The days/trials represented were chosen to capture the dynamic range of variability within the distributions. We have added this information in the figure legends.
(4) I strongly believe the data and code should be made freely available rather than "upon reasonable request".
Matrices of processed data and various codes for simulations and analyses are now available at https://github.com/ sebiroyerlab/Vestibule_sequences.
Reviewer #3 (Public Review):
Royer et al. present a fully automated variant of the Barnes maze to reduce experimenter interference and ensure consistency across trials and subjects. They train mice in this maze over several days and analyze the progression of mouse search strategies during the course of the training. By fitting models involving stochastic processes, they demonstrate that a model combined of the random, spatial, and serial processes can best account for the observed changes in mice's search patterns. Their findings suggest that across training days the spatial strategy (using local landmarks) was progressively employed, mostly at the expense of the random strategy, while the serial strategy (consecutive nearby vestibule check) is reinforced from the early stages of training. Finally, they discuss potential mechanistic underpinnings within brain systems that could explain such behavioral adaptation and flexibility.
Strength:
The development of an automated Barnes maze allows for more naturalistic and uninterrupted behavior, facilitating the study of spatial learning and memory, as well as the analysis of the brain's neural networks during behavior when combined with neurophysiological techniques. The system's design has been thoughtfully considered, encompassing numerous intricate details. These details include the incorporation of flexible options for selecting start, goal, and proximal landmark positions, the inclusion of a rotating platform to prevent the accumulation of olfactory cues, and careful attention given to atomization, taking into account specific considerations such as the rotation of the maze without causing wire shortage or breakage. When combined with neurophysiological manipulations or recordings, the system provides a powerful tool for studying spatial navigation system.
The behavioral experiment protocols, along with the analysis of animal behavior, are conducted with care, and the development of behavioral modeling to capture the animal's search strategy is thoughtfully executed. It is intriguing to observe how the integration of these innovative stochastic models can elucidate the evolution of mice's search strategy within a variant of the Barnes maze.
Weakness:
(1) The development of the well-thought-out automated Barnes maze may attract the interest of researchers exploring spatial learning and memory. However, this aspect of the paper lacks significance due to insufficient coverage of the materials and methods required for readers to replicate the behavioral methodology for their own research inquiries.
Moreover, as discussed by the authors, the methodology favors specialists who utilize wired recordings or manipulations (e.g. optogenetics) in awake, behaving rodents. However, it remains unclear how the current maze design, which involves trapping mice in start and goal positions and incorporating angled vestibules resulting in the addition of numerous corners, can be effectively adapted for animals with wired implants.
The reviewer is correct in pointing out that the current maze design is not suitable for performing experiments with wired implant, particularly due to the maze’s enclosed structure and the access to the start/goal boxes through side holes. Instead, pharmacogenetics and wireless approaches for optogenetic and electrophysiology would need to be used. We have now mentioned this limitation in the discussion.
(2) Novelty: In its current format, the main axis of the paper falls on the analysis of animal behavior and the development of behavioral modeling. In this respect, while it is interesting to see how thoughtfully designed models can explain the evolution of mice search strategy in a maze, the conclusions offer limited novel findings that align with the existing body of research and prior predictions.
We agree with the reviewer that our study is weakly connected to previous researches on hippocampus and spatial navigation, as it consists mainly of animal behavior analysis and modeling and addresses a relatively unexplored topic. We hope that the combination of our behavioral approach with optogenetic and electrophysiology will allow in the future new insights that are in line with the existing body of research.
(3) Scalability and accessibility: While the approach may be intriguing to experts who have an interest in or are familiar with the Barnes maze, its presentation seems to primarily target this specific audience. Therefore, there is a lack of clarity and discussion regarding the scalability of behavioral modeling to experiments involving other search strategies (such as sequence or episodic learning), other animal models, or the potential for translational applications. The scalability of the method would greatly benefit a broader scientific community. In line with this view, the paper's conclusions heavily rely on the development of new models using custom-made codes. Therefore, it would be advantageous to make these codes readily available, and if possible, provide access to the processed data as well. This could enhance comprehension and enable a larger audience to benefit from the methodology.
The current approach might indeed extend to other species in equivalent environments and might also constitute a general proof of principle regarding the characterization of animal behaviors by the mixing of stochastic processes. We have now mentioned these points in the discussion.
As suggest by the reviewer, we have now provided model/simulation codes and processed data to replicate the figures, at https://github.com/sebiroyerlab/Vestibule_sequences
(4) Cross-validation of models: The authors have not implemented any measures to mitigate the risk of overfitting in their modeling. It would have been beneficial to include at least some form of cross-validation with stochastic models to address this concern. Additionally, the paper lacks the presence of analytics or measures that assess and compare the performance of the models.
To avoid the risk of model overfitting, the most appropriate solution appeared to be repeating the simulations several times and examining the consistency of the obtained parameters across repetitions. For the mixture model, we now show in Supplementary figure 7 the probabilities obtained from 10 repetitions of the simulation. Similarly, for the Markov chain model, the probabilities obtained from 10 repetitions of the simulation are shown in Figure 6.
Regarding model comparison, we have simplified our mixture model into only one model, as we realized the 2 other models in the previous manuscript version were simply special cases of the 3rd model. Nevertheless, comparison was still needed for the estimation for the best value of N (the number of consecutive segments that a strategy lasts) in the mixture model. We now show the comparison of mean square errors obtained for different values of N, using t-test across 10 repetitions of the simulations (Figure 5c).
(5) Quantification of inter-animal variations in strategy development: It is important to investigate, and address the argument concerning the possibility that not all animals recruit and develop the three processes (random, spatial, and serial) in a similar manner over days of training. It would be valuable to quantify the transition in strategy across days for each individual mouse and analyze how the population average, reflecting data from individual mice, corresponds to these findings. Currently, there is a lack of such quantification and analysis in the paper.
We have added a figure (Supplementary figure 8) showing the mixture model matching analyses for individual animals. A lot of variability is indeed observed across animals, with some animals displaying strong preferences for certain strategies compare to others. The average across mouse population showed a similar trend as the result obtained with the pooled data.
Recommendations for the authors:
Summary of Reviewer Comments:
(1) In its present form, the manuscript lacks sufficient coverage of the materials and methods necessary for readers to replicate the behavioral methodology in their own research inquiries. For instance, it would be beneficial to clarify how the cues are rotated relative to the goal.
(2) The models may be over-fitted, leading to spurious conclusions, and cross-validation is necessary to rule out this possibility.
(3) The specific choice of the three strategies used to fit behavior in this model should be better justified, as other strategies may account for the observed behavior.
(4) The study would benefit from an analysis of behavior on an animal-by-animal basis, potentially revealing individual differences in strategies.
(5) Spatial behavior is not necessarily fully allocentric in this task, as only the two cues in the arena can be used for spatial orientation, unlike odor cues on the floor and sound cues in the room. This should be discussed.
(6) Making the data and code fully open source would greatly strengthen the impact of this study.
In addition, each reviewer has raised both major and minor concerns which should be addressed if possible.
Reviewer #1 (Recommendations For The Authors):
Minor points:
(1) Change "tainted" to "tinted" in Fig. 1a
(2) Should note explicitly in Fig. 2d that the goal is at vestibule 0, and also in the legend
(3) Fig. 3 legend should say "c-e)", not "c-f)"
(4) Supplementary Fig. 8 legend repeats "d)" twice
Reviewer #2 (Recommendations For The Authors):
Packard & McGaugh 1996 is cited twice as refs 5 and 14
Reviewer #3 (Recommendations For The Authors):
- Figure 3: Please correct the labels referenced as "c-f)" in the figure's legend.
- Rounding numbers issue on page 4: 82.62% + 17.37% equals 99.99%, not 100%.
We fixed all minor points. We are very thankful to the reviewers for their constructive comments.
-
-
academic.oup.com academic.oup.com
-
Indeed, even the US Department of Defense’s Dictionary of Military and Associated Terms does not list any definitions for hybrid warfare or hybrid threats
Important re: definition of HW, GZW, etc.
-
If we educate ourselves about how to better prepare for that messy grey phenomenon and avoid the Groznys, Mogadishus and Bint-Jbeils of our future, we will have taken great strides forward
Yet the US seems almost always drawn to unconventional conflicts like these, partly due to the military cultural mind-set and hubris. We believe these types of conflicts and battles (Mogadishus, Groznys, Gaza, Mosul, Kabul) can be fought and won 'our way,' but they rarely can.
-
In the US military mind-set, this technical romanticism in military affairs has shaped not only the understanding that warfare is a rivalry between technologies but also a pragmatic approach towards complicated issues, viewing them as problems that require engineering solutions
Much of this is not psychological as much as it is financial. Billions of dollars are made from this 'mindset'. This is also why military has embraced hybrid warfare--> creates constant need to invest billions into new technology regardless of its efficacy in combat
-
US military culture tends to view technology as a lodestar of military success, as ‘no nation in recent history has placed greater emphasis upon the role of technology in planning and waging war than the United States’
This reliance and belief in tech can obscure the actual threats. E.g. Betz article on Network-Centric Warfare
-
US Army’s textbook on strategy, published in 1936, simply states that: ‘Politics and strategy are radically and fundamentally things apart. Strategy begins where politics end. All that soldiers ask is that once the policy is settled, strategy and command shall be regarded as being in a sphere apart from politics.’
Another important quote
-
Unlike the classic Clausewitzian observation that ‘war is merely the continuation of policy by other means’,57Close many scholars have claimed that the US way of war has traditionally been built on the assumption that ‘war [is] not a continuation of political intercourse, but a symptom of its failure’.
Important quote on US way of war vs. Clausewitz
-
In its analysis of US military culture, the existing research repeatedly points to three principal characteristics: the aggressive and decisive employment of military personnel and firepower to conclude a given conflict as quickly as possible; heavy reliance on state-of-art technology; and the apolitical nature of the traditional US military mind-set, which gives ‘little regard to the non-military consequences of what they were doing’
US military culture is not suited to hybrid warfare. HW/unconventional wars are rarely quick, rarely won through sheer firepower, and depend on a range of non-military factors. This also kind of explains desperation and frustration US officials experience when faced with hybrid threats and thus the employment of excessive and extraordinary measures to achieve the quick victory (often illegal)
-
an additional reason for the success of hybrid warfare as a concept that allows for a greater understanding of the blending of the different modes of warfare: namely US military culture
US Military Culture--> another reason for success of HW Concept
-
third imperative for a successful operational approach in a hybrid war, according to Johnson, is that those fighting it ‘must avoid prescriptive or uniform measures across time and space’.
Then why is there so much theorizing on how to confront the vast spectrum of 'hybrid warfare' challenges? Is the goal of this theorizing not to develop 'uniform or prescriptive measures'?
-
First, he claims that the main aim of the operational art is to break the hybrid adversary’s inherent logic, rather than focusing on the physical destruction of its forces: ‘[It] must cognitively disrupt the hybrid threat’s logic in the forms of warfare it employs, rather than focusing on physical methods to counter the hybrid threat’s means and capabilities.’
Is Hybrid being substituted for insurgent?
-
focuses on the US experience in Vietnam, as well as the US intervention in Iraq as part of Operation Iraqi Freedom, in order to explore the implications of hybrid warfare for the operational art of warfare.
introspection would be more revealing than speculation on any mythical strengths of hybrid forces. the reason conventionally strong forces struggle against 'hybrid' opponents has less to do with the opponents advantages and more to do with bad strategy and understanding of the enemy
-
fifth principle of hybrid warfare, according to McCulloh, is that ‘a hybrid force contains both conventional and unconventional elements’ in terms of technologies, weapons and tactics.
Again, this is not unique to hybrid forces. Conventional militaries, esp. the US, have unconventional elements (SOFs, paramilitaries, etc.) as well.
-
concept of hybrid warfare was fundamental as they drew the attention of the American political establishment to the ongoing debate within academic and professionial military circiles.
Academic circles? Far more present in professional military circles than academic--> academia disputes these terms, professional military circles embrace them
-
second wave of publications sought to provide deeper insights into the concept of hybrid threats36Close and the implications of this concept for the rules of engagement
ROE and hybrid warfare--> what is a legitimate military target if the concept of warfare and warfighters goes beyond the battlefield and beyond soldiers?
-
Hoffman ensured that his concept would reach every corner of the professional military debate by publishing articles and manuscripts in a wide range of outlets, including Naval Institute Proceeding; Armed Forces Journal International; Defense News; Marine Corps Gazette; Small Wars Journal; Joint Force Quarterly; Strategic Forum; Orbis, and many others
All military funding or military-oriented publications, not academic or third-party. Terms like HW and GZW emerged in military echo chambers
-
hybrid warfare, unlike previous theories, offers an operationally applicable concept that directly addresses the evolving character of modern conflict from an explicitly military perspective.
By emphasizing how warfare is constantly changing and threats are emerging and evolving, military can cite HW as evidence for need for increased funding, expanded operational freedom (less oversight/restrictions), and expanded conception of 'state of war'.
-
The second characteristic that led Hoffman to refer to Hezbollah as a hybrid actor was the organisation’s simultaneous use of myriad technologies on the tactical, operational and strategic levels
Is this not the case for most relatively sophisticated armed forces? Especially given that Hez is effectively a state military (given Lebanese army weakness)
-
the true and most comprehensive prototype in his eyes was the Second Lebanon War, and specifically Hezbollah, which he describes as ‘the clearest example of a modern Hybrid challenger
Why, then, do many others point to China & Russia as cases of 'hybrid warfare' if Hez is most clear example? Is it simply that the US is not threatened by Hez and therefore it is not deemed a 'grey zone' threat warranting a classification?
-
-
academic-oup-com.proxy.library.nyu.edu academic-oup-com.proxy.library.nyu.edu
-
they also believed that a rearmed Germany, with fully restored sovereignty, was needed in order to lock the Federal Republic into the Western orbit and to shore up the government of pro-American Chancellor Konrad Adenauer
Another words, extending sovereignty, could also be seen not as a matter of principle or lofty, idealism or principle, but a pragmatic understanding of what it would take to secure the alliance of Germany, of course, at this point, it could be pointed out that ought implies can and that there are cultural preconditions that made this solution more possible than would be the case in other places of the world such as Afghanistan or rock Iraq. This is the American way
-
-
www.medrxiv.org www.medrxiv.org
-
eLife assessment
This study investigates a dietary intervention that employs a smartphone app to promote meal regularity, which may be useful. Despite no observed changes in caloric intake, the authors report significant weight loss. While the concept is very interesting and deserves to be studied due to its potential clinical relevance, the study's rigor needs to be improved, and is currently considered inadequate, notably for its reliance on self-reported food intake, a highly unreliable way to assess food intake. Additionally, the study theorizes that the intervention resets the circadian clock, but the study needs more reliable methods for assessing circadian rhythms, such as actigraphy.
-
-
-
1921 führt der Kosaken-Offizier Reza Khan einen Militärputsch an und macht sich zum Premierminister.
Hierbei erhielt er implizite Unterstützung der Briten. Zwar haben sie ihm weder befohlen, noch ihn genötigt zu putschen, jedoch wird berichtet, dass ihm sehr explizit kommuniziert worden sei, dass die Briten nicht intervenieren würden.
-
unterstützt vom schiitischen Klerus, der eine säkulare Republik verhindern will.
Sind hiermit die Osulis gemeint, die eine Herrschaft der Rechtsgelehrten errichten wollten?
-
-
www.biorxiv.org www.biorxiv.org
-
Author response:
The following is the authors’ response to the original reviews.
We are thankful to the reviewers and the editor for their detailed feedback, insightful suggestions, and thoughtful assessment of our work. Our point-by-point responses to the comments and suggestions are below.
The revised manuscript has taken into account all the comments of the three reviewers. Modifications include corrections to errors in spelling and unit notation, additional quantification, improvements to the clarity of the language in some places, as well as additional detail in the descriptions of the methods, and revisions to the figures and figure legends.
We have also undertaken additional analyses and added materials in response to reviewer suggestions. In brief:
In response to a suggestion from Reviewer #1, we added Figure 6-1 to show examples of the calcium traces of individual fish and individual ROIs from the condensed data in Figure 6. We revised Figure 7 as follows:
-
We added an analysis of the duration of the response to shock to address comments from Reviewers #2 and #3.
-
In response to Reviewer #3, we added histograms showing the distribution of the amplitudes of the calcium signals in the gsc2 and rln3a neurons to show, without relying on the detection of peaks in the calcium trace, that the rln3a neurons have more oscillations in activity.
We added Figure 8-2 in response to the suggestion from Reviewer #3 to analyze turning behavior in larvae with ablated rln3a neurons.
To address Reviewer #2’s suggestion to show how the ablated transgenic animals compare to the non-ablated transgenic animals of the same genotype, we have added this analysis as Figure 8-3.
A detailed point-by-point is as follows:
The reviewers agree that the study of Spikol et al is important, with novel findings and exciting genetic tools for targeting cell types in the nucleus incertus. The conclusions are overall solid. Results could nonetheless be strengthened by performing few additional optogenetic experiments and by consolidating the analysis of calcium imaging and behavioral recordings as summarized below.
(1) Light pulses used for optogenetic-mediated connectivity mapping were very long (5s), which could lead to non specific activation of numerous population of neurons than the targeted ones. To confirm their results, the authors should repeat their experiments with brief 5-50ms (500ms maximum) -long light pulses for stimulation.
As the activity of the gsc2 neurons is already increased by 1.8 fold (± 0.28) within the first frame that the laser is activated (duration ~200 msec), it is unlikely that that the observed response is due to non-specific activation induced by the long light pulse.
(2) In terms of analysis, the authors should improve :
a) The detection of calcium events in the "calcium trace" showing the change in fluorescence over time by detecting the sharp increase in the signal when intracellular calcium rises;
We have added an additional analysis to Figure 7 that does not rely on detection of calcium peaks. See response to Reviewer #3.
b) The detection of bouts in the behavioral recordings by measuring when the tail beat starts and ends, thereby distinguishing the active swimming during bouts from the immobility observed between bouts.
Our recordings capture the entire arena that the larva can explore in the experiment and therefore lack the spatial resolution to capture and analyze the tail beat. Rather, we measured the frequency and length of phases of movement in which the larva shows no more than 1 second of immobility. To avoid confusion with studies that measure bouts from the onset of tail movement, we removed this term from the manuscript and refer to activity as phases of movement.
(3) The reviewers also ask for more precisions in the characterization of the newly-generated knock-in lines and the corresponding anatomy as explained in their detailed reports.
Please refer to the point-by-point request for additional details that have now been added to the manuscript.
Reviewer #1 (Recommendations For The Authors):
The conclusions of this paper are mostly well supported by data, but some technical aspects, especially about calcium imaging and data analysis, need to be clarified.
(1) Both the endogenous gsc2 mRNA expression and Tg(gsc2:QF2) transgenic expression are observed in a neuronal population in the NI, but also in a more sparsely distributed population of neurons located more anteriorly (for example, Fig. 2B, Fig. 5A). The latter population is not mentioned in the text. It would be necessary to clarify whether or not this anterior population is also considered as the NI, and whether this population was included for the analysis of the projection patterns and ablation experiments.
The sparsely distributed neurons had been mentioned in the Results, line 134, but we have now added more detail. In line 328, we have clarified that: “As the sparsely distributed anterior group of gsc2 neurons (Fig. 2B, C) are anatomically distinct from the main cluster and not within the nucleus incertus proper, they were excluded from subsequent analyses.”
(2) Both Tg(gsc2:QF2) and Tg(rln3a:QF2) transgenic lines have the QF genes inserted in the coding region of the targeted genes. This probably leads to knock out of the gene in the targeted allele. Can the authors mention whether or not the endogenous expression of gsc2 and rln3a was affected in the transgenic larvae? Is it possible that the results they obtained using these transgenic lines are affected by the (heterozygous or homozygous) mutation of the targeted genes?
Figure 8-1 includes in situ hybridization for gsc2 and rln3a in heterozygous Tg(gsc2:QF2)c721; Tg(QUAS:GFP)c578 and Tg(rln3a:QF2; he1.1:YFP)c836; Tg(QUAS:GFP)c578 transgenic larvae.
The expression of gsc2 is unaffected in Tg(gsc2:QF2)c721; Tg(QUAS:GFP)c578 heterozygotes
(Fig. 8-1A), whereas the expression of rln3a is reduced in Tg(rln3a:QF2; he1.1:YFP)c836; Tg(QUAS:GFP)c578 heterozygous larvae (Fig. 8-1D), as mentioned in the legend for Figure 8-1. We confirmed these findings by comparing endogenous gene expression between transgenic and non-transgenic siblings that were processed for RNA in situ hybridization in the same tube.
The behavioral results we obtained are not due to rln3a heterozygosity because comparisons were made with sibling larvae that are also heterozygous for Tg(rln3a:QF2; he1.1:YFP)c836; Tg(QUAS:GFP)c578, as stated in the Figure 8 legend.
(3) Optogenetic activation and simultaneous calcium imaging is elegantly designed using the combination of the orthogonal Gal4/UAS and QF2/QUAS systems (Fig. 6). However, I have some concerns about the analysis of calcium responses from a technical point of view. Their definition of ΔF/F in this manuscript is described as (F-Fmin)/(Fmax-Fmin) (see line 1406). This is confusing because it is different from the conventional definition of ΔF/F, which is F-F0/F0, where F0 is a baseline GCaMP fluorescence. Their way of calculating the ΔF/F is inappropriate for measuring the change in fluorescence relative to the baseline signal because it rather normalizes the amplitude of the responses across different ROIs. The same argument applies to the analyses done for Fig. 7.
We have taken a careful look at our analyses and replotted the data using F-F0/F0. However, this only changes Y-axis values and does not change the shape of the calcium trace or the change in signal upon stimulation. Both metrics (F-F0/F0 and (F-Fmin)/(Fmax-Fmin)) adjust the fluorescence values of each ROI to its own baseline.
(4) The %ΔF/F plots shown in Fig.6 are highly condensed showing the average of different ROIs (cells) within one fish and then the average of multiple fish. It would be helpful to see example calcium traces of individual ROIs and individual fish to know the variability across ROIs and fish. Also, It would be helpful to know how much laser power (561 nm laser) was used to photostimulate ReaChR.
Laser power (5%) was added to the section titled Calcium Signaling in Methods.
In Figure 6, shading in the %ΔF/F plots (D, D’, E, E’, F, F’, G, G’, H, H’) represents the variability across ROIs, and the dot plots (D’’, E’’, F’’, G’’, H’’) show the variability across fish (where each data point represents an individual fish). We have now also added Figure 6-1 with examples of calcium traces from individual fish and individual ROIs.
(5) Some calcium traces presented in Fig. 6 (Fig. 6D, D', F, H, H') show discontinuous fluctuations at the onset and offset of the photostimulation period. Is this caused by some artifacts introduced by switching the settings for the photostimulation? The authors should mention if there are some alternative explanations for this discontinuity.
As noted by the reviewer, this artifact does result from switching the settings for photostimulation, which we mention in the legend for Figure 6.
(6) In the introduction, they mention that the griseum centrale is a presumed analogue of the NI (lines 74-75). It would be helpful for the readers to better understand the brain anatomy if the authors could discuss whether or not their findings on the gsc2 and rln3a NI neurons support this idea.
Our findings on the gsc2 and rln3a neurons support the idea that the griseum centrale of fish is the analogue of the mammalian NI. We have now edited the text in the third paragraph of the discussion, line 1271, to make this point more clearly: “By labeling with QUAS-driven fluorescent reporters, we determined that the anatomical location, neurotransmitter phenotype, and hodological properties of gsc2 and rln3a neurons are consistent with NI identity, supporting the assertion that the griseum centrale of fish is analogous to the mammalian NI. Both groups of neurons are GABAergic, reside on the floor of the fourth ventricle and project to the interpeduncular nucleus.”
Reviewer #2 (Recommendations For The Authors):
Major comments:
(1) Throughout the figures a need for more precision and reference in the anatomical evidence:
- Specify how many planes over which height were projected for each Z-projection in Figure 1,2,3, ....
We added this information to the last paragraph of the section titled Confocal Imaging within the Materials and Methods.
- Provide the rhombomere numbers, deliminate the ventricles & always indicate on the panel the orientation (Rostral Caudal, Left Right or Ventral Dorsal) for Figure 1 panels D-F , Figure 2-1B-G, Figure 2-2A-C in the adult brain, Figure 3.
We annotated Figures 2-1 and 2-2 as suggested. We also indicated the orientation (anterior to the top or anterior to the left) in all figure legends. For additional context on the position of gsc2 and rln3a neurons within the larval brain, refer to Fig. 1A-C’, Fig. 1-2A, Fig. 2, Fig. 4 and Fig. 5.
- Add close up when necessary: Figure 2-2A-C, specify in the text & in the figure where are the axon bundles from the gsc2+ neurons in the adult brain- seems interesting and is not commented on?
We added a note to the legend of Figure 2-2: Arrowheads in B and B’ indicate mApple labeling of gsc2 neuronal projections to the hypothalamus. We also refer to Fig 2-2B, B’ in the Results section titled Distinct Projection Patterns of gsc2 and rln3a neurons.
- keep the same color for one transgene within one figure: example, glutamatergic neurons should always be the same color in A,B,C - it is confusing as it is.
We have followed the reviewer’s suggestion and made the color scheme consistent in Figure 3.
- Movies: add the labels (which transgenic lines in which color, orientation & anatomical boundaries for NI, PAG, any other critical region that receives their projections and the brain ventricle boundaries) on the anatomical movies in supplemental (ex Movie 4-1 for gsc2 neurons and 4-2 for rln3 neurons: add cerebellum, IPN, raphe, diencephalon, and rostral and caudal hypothalamus, medulla for 4-1 as well as lateral hypothalamus and optic tectum for 42); add the ablated region when necessary.
We added more detail to the movie legends. Please refer to Figure 4 for additional anatomical details.
- for highlighting projections from NI neurons and distinguish them from the PAG neurons, the authors elegantly used 2 Photon ablation of one versus the other cluster: this method is valid but we need more resolution that the Z stacks added in supplemental by performing substraction of before and after maps.
We are not sure what the author meant by subtraction as there are no before and after images in this experiment. Larvae underwent ablation of cell bodies and were imaged one day later in comparison to unablated larvae.
In particular, it is not clear to me if both PAG and NI rln3a neurons project to medulla - can the authors specify this point & the comparison between intact & PAG vs NI ablation maps? The authors should resolve better the projections to all targeted regions of NI gsc2 neurons and differentiate them from other PAG gsc2 neurons, same for rln3a neurons.
We have clarified this point on line 549.
Make sure to mention in the result section the duration between ablation & observation that is key for the axons to degrade.
We always assessed degeneration of neuronal processes at 1-day post-ablation.
(“2) calcium imaging experiments:
a) with optogenetic connectivity mapping:
the authors combine an impressive diverse set of optogenetic actuators & sensors by taking advantage of the QUAS/QF2 and UAS/GAL4 systems to test connectivity from Hb-IPN onto gsc2 and rln3 neurons.
The experiments are convincing but the choice of the duration of the stimulation (5s) is not adequate to test for direct connectivity: the authors should make sure that response in gsc2 neurons is observed with short duration (50ms-1s max).
As noted above:
“As the activity of the gsc2 neurons is already increased by 1.8 fold (± 0.28) within the first frame that the laser is activated (duration ~200 msec), it is unlikely that that the observed response is due to non-specific activation induced by the long light pulse.”
note: Specify that the gsc2 neurons tested are in NI.
We have edited the text accordingly in the Results section titled Afferent input to the NI from the dHb-IPN pathway.
b) for the response to shock: in the example shown for rln3 neurons, the activity differs before and after the shock with long phases of inhibition that were not seen before. Is it representative? the authors should carefully stare at their data & make sure there is no difference in activity patterns after shock versus before.
We reexamined the responses for each of the rln3a neurons individually and confirmed that, although oscillations in activity are frequent, the apparent inhibition (excursions below baseline) are an idiosyncratic feature of the particular example shown.
(3) motor activity assay:
a) there seems to be a misconception in the use of the word "bout" to estimate in panels H and I bout distance and duration and the analysis should be performed with the criterion used by all in the motor field:
As we know now well based on the work of many labs on larval zebrafish (Orger, Baier, Engert, Wyart, Burgess, Portugues, Bianco, Scott, ...), a bout is defined as a discrete locomotor event corresponding to a distance swam of typically 1-6mm, bout duration is typically 200ms and larvae exhibit a bout every s or so during exploration (see Mirat et al Frontiers 2013; Marques et al Current Biology 2018; Rajan et al. Cell Reports 2022).
Since the larval zebrafish has a low Reynolds number, it does not show much glide and its movement corresponds widely to the active phase of the tail beats.
Instead of detecting the active (moving) frames as bouts, the authors however estimate these values quite off that indicate an error of calibration in the detection of a movement: a bout cannot last for 5-10s, nor can the fish swim for more than 1 cm per bout (in the definition of the authors, bout last for 5-10 s, and bout correspond to 10 cm as 50 cm is covered in 5 bouts).
The authors should therefore distinguish the active (moving) from inactive (immobile) phase of the behavior to define bouts & analyze the corresponding distance travelled and duration of active swimming. They would also benefit from calculating the % of time spent swimming in order to test whether the fish with ablated rln3 neurons change the fraction of the time spent swimming.
As noted above:
Our recordings capture the entire arena that the larva can explore in the experiment and therefore lack the spatial resolution to capture and analyze the tail beat. Rather, we measured the frequency and length of phases of movement in which the larva shows no more than 1 second of immobility. To avoid confusion with studies that measure bouts from the onset of tail movement, we removed this term from the manuscript and refer to activity as phases of movement.
Note that a duration in seconds is not a length and that the corresponding symbol for seconds in a scientific publication is "s" and not "sec".
We have corrected this.
b) controls in these experiments are key as many clutches differ in their spontaneous exploration and there is a lot of variation for 2 min long recordings (baseline is 115s). The authors specify that the control unablated are a mix of siblings; they should show us how the ablated transgenic animals compare to the non ablated transgenic animals of the same clutch.
The unablated Tg(gsc2:QF2)c721; Tg(QUAS:GFP)c578 and Tg(rln3a:QF2, he1.1:YFP)c836; Tg(QUAS:GFP)c578 larvae in the control group are siblings of ablated larvae. We repeated the analyses using either the Tg(gsc2:QF2)c721; Tg(QUAS:GFP)c578 or Tg(rln3a:QF2, he1.1:YFP)c836; Tg(QUAS:GFP)c578 larvae only as controls and added the results in Figure 8-3. Although the statistical power is slightly reduced due to a smaller number of samples in the control group, the conclusions are the same, as the behavior of Tg(gsc2:QF2)c721; Tg(QUAS:GFP)c578 and Tg(rln3a:QF2, he1.1:YFP)c836; Tg(QUAS:GFP)c578 unablated larvae is indistinguishable.
Minor comments:
(1) Anatomy :
-
Add precision in the anatomy in Figure 1:
-
Improve contrast for cckb.
The contrast is determined by the signal to background ratio from the fluorescence in situ hybridization. Increasing the brightness would increase both the signal and the background, as any modification must be applied to the whole image.
- since the number of neurons seems low in each category, could you quantify the number of rln3+, nmbb+, gsc2+, cckb+ neurons in NI?
Quantification of neuronal numbers has been added to the first Results section titled Identification of gsc2 neurons in the Nucleus Incertus, lines 219-224.
note: indicate duration for the integral of the DF/F in s and not in frames.
We have added this in the legends for Figures 6 and 7 and in Materials and Methods.
(2) Genetic tools:
To generate a driver line for the rln3+ neurons using the Q system, the authors used the promoter for the hatching gland in order to drive expression in a structure outside of the nervous system that turns on early and transiently during development: this is a very elegant approach that should be used by many more researchers.
If the her1 construct was integrate together with the QF2 in the first exon of the rln3 locus as shown in Figure 2, the construct should not be listed with a ";" instead of a "," behind rln3a:QF2 in the transgene name. Please edit the transgene name accordingly.
We have edited the text accordingly.
(3) Typos:
GABAergic neurons is misspelled twice in Figure 3.
Thank you for catching this. We have corrected the misspellings.
Reviewer #3 (Recommendations For The Authors):
- More analysis should be done to better characterize the calcium activity of gsc2 and rln3a populations. Specifically:
Spontaneous activity is estimated by finding peaks in the time-series data, but the example in Fig7 raises concerns about this process: Two peaks for the gsc2 cell are identified while numerous other peaks of apparently similar SNR are not detected. Moreover, the inset images suggest GCaMP7a expression might be weaker in the gsc2 transgenic and as such, differences in peak count might be related to the SNR of the recordings rather than underlying activity. Overall, the process for estimating spontaneous activity should be more rigorous.
To not solely rely on the identification of peaks in the calcium traces, we also plotted histograms of the amplitudes of the calcium signals for the rln3a and gsc2 neurons. The histograms show that the amplitudes of the rln3a calcium signals frequently occur at small and large values (suggesting large fluctuations in activity), whereas the amplitudes of the gsc2 calcium signals occur most frequently at median values. We added this analysis to a revised Figure 7.
Interestingly, there are a number of large negative excursions in the calcium data for the rln3a cell - what is the authors' interpretation of these? Could it be that presynaptic inhibition via GABA-B receptors in dIPN might influence dIPN-innervating rln3a neurons?
As noted above:
We reexamined the responses for each of the rln3a neurons individually and confirmed that, although oscillations in activity are frequent, the apparent inhibition (excursions below baseline) are an idiosyncratic feature of the particular example shown.
Regarding shock-evoked activity, the authors state "rln3a neurons showed ... little response to shock", yet the immediate response after shock appears very similar in gsc2 vs rln3a cells (approx 30 units on the dF/F scale). The subsequent time-course of the response is what appears to distinguish gsc2 versus rln3a; it might thus be useful to separately quantify the amplitude and decay time constant of the shock evoked response for the two populations.
The reviewer is correct that the difference between the gsc2 and rln3a neurons in the response to shock is dependent on the duration of time post-shock that is analyzed. Thus, the more relevant feature is the length of the response rather than the size. To reflect this, we compared the average length of responses for the gsc2 and rln3a neurons. We have now added this analysis to Figure 7 and updated the text accordingly.
- The difference in spontaneous locomotor behavior is interesting and the example tracking data suggests there might also be differences in turn angle distribution and/or turn chain length following rln3 NI ablations. I would recommend the authors consider exploring this.
Thank you for this suggestion. We wrote additional code to quantify turning behavior and found that larvae with rln3a NI neurons ablated do indeed have a statistically significant increase in turning compared to other groups. We now show this analysis as Figure 8-2 and we added an explanation of the quantification of turning behavior to the Methods section titled Locomotor assay.
- I didn't follow the reasoning in the discussion that activity of rln3a cells
may control transitions between phases of behavioral activity and inactivity. The events (at least those that are detected) in Fig7 occur with an average interval exceeding 30 s, yet swim bouts occur at a frequency around 1 Hz. The authors should clarify their hypothesis about how these disparate timescales might be connected.
As noted above:
Our recordings capture the entire arena that the larva can explore in the experiment and therefore lack the spatial resolution to capture and analyze the tail beat. Rather, we measure the frequency and length of phases of movement in which the larva shows no more than 1 second of immobility. To avoid confusion with studies that measure bouts from the onset of tail movement, we removed this term from the manuscript and refer to activity as phases of movement.
- Fig2-2:
Images are ordered from (A, B, C) anterior to (A', B', C') posterior.Its not clear what this means and images appear to be in sequence A, A', B, B'.... please clarify and consider including a cartoon of the brain in sagittal view showing location of sections indicated.
We clarified the text in the Figure 2-2 legend and added a drawing of the brain showing the location of the sections.
- In Fig7, why are 300 frames analyzed pre/post shock? Even for gsc2, the response appears complete in ~100 frames.
Reviewer #2 also pointed out that the difference between the gsc2 and rln3a neurons in the response to shock is dependent on the duration of time post-shock that is analyzed. Thus, the more relevant feature is the length of the response rather than the size. To reflect this, we compared the average length of response for the gsc2 and rln3a neurons and modified the text and Figure as described above.
- What are the large negative excursions in the calcium signal in the rln3a data (Fig7E)?
See response to Reviewer # 2, repeated below:
We looked through each of the responses of individual rln3a neuron and confirmed that, although oscillations in activity are frequent among the rln3a neurons, the apparent inhibition (excursions below baseline) are an idiosyncratic feature of the particular example shown.
- There are several large and apparently perfectly straight lines in the fish tracking examples (Fig8) suggestive of tracking errors (ie. where the tracked centroid instantaneously jumps across the camera frame). Please investigate these and include analysis of the distribution of swim velocities to support the validity of the tracking data.
The reason for this is indeed imperfect tracking resulting in frames in which the tracker does not detect the larva. The result is that the larva appears to move 1 cm or more in a single frame. However, analysis of the distribution of distances across all frames shows that these events (movement of 1 cm or more in a single frame) are rare (less than 0.04%), and there are no systematic differences that would explain the differences in locomotor behavior presented in Fig. 8. A summary of the data is as follows:
Controls: 0.0249% of distances 1 cm or greater gsc2 neurons ablated: 0.0302% of distances 1 cm or greater rln3a NI neurons ablated: 0.0287% of distances 1 cm or greater rln3a PAG neurons ablated: 0.0241% of distance 1 cm or greater
- Insufficient detail is provided in the methods about how swim bouts are detected (and their durations extracted) from the centroids tracking data. Please expand detail in this section.
We added an explanation to the Methods section titled Locomotor assay.
-
-
-
-
Revolution in Iran 1979 gab ihm nicht nur die Gelegenheit, die Theorie der „Herrschaft des Rechtsgelehrten“ (persisch velayat-e faqih) in die Praxis umzusetzen, sondern selbst als dieser Gelehrte zu fungieren.
Lustigerweise waren es doch ursprünglich die Akhbaris und Sheykhis, die eine Theokratie wollten. Gut, dass hier Herrschaft der Rechtsgelehrten steht, denn das ist sehr exakt. Iran ist keine Theokratie, zumindest nicht in der Form, wie Akhbaris und Sheykhis sich das vorgestellt hatten.
-
dass der führende Rechtsgelehrte seiner Zeit die Gläubigen bis zur ersehnten Wiederkehr des Imam Mahdi nicht nur religiös, sondern auch politisch anführen müsse.
Khomeinis Begründung für einen politischen Islam, knüpft sich an die Osulis an (oder?). Denn die sagten zunächst, die Wahrheit kann jede:r Muslim:in selbst finden, schränkten dann aber schnell ein, dass in Abwesenheit des verborgenen Imam nur die höchsten Gelehrten in der Lage dazu sind, diese Wahrheit durch ijtihad selbst zu finden.
Dem gegenüber stehen Sheykhis, Babis und Baha'is, die davon ausgehen, dass die OFfenbarung durch gewisse perfekte Menschen/Propheten weitergeht, es also keineswegs der Weg zur Wahrheit ist, alte Offenbarung wiederzukäuen, sondern vielmehr die aktuelle Offenbarung Urteile und Regeln liefert.
-
-
www.biorxiv.org www.biorxiv.org
-
Author response:
The following is the authors’ response to the original reviews.
eLife assessment:
This study uses carefully designed experiments to generate a useful behavioural and neuroimaging dataset on visual cognition. The results provide solid evidence for the involvement of higher-order visual cortex in processing visual oddballs and asymmetry. However, the evidence provided for the very strong claims of homogeneity as a novel concept in vision science, separable from existing concepts such as target saliency, is inadequate.
We appreciate the positive and balanced assessment from the reviewers. We agree that visual homogeneity is similar to existing concepts such as target saliency. We have tried our best to articulate our rationale for defining it as a novel concept. However, the debate about whether visual homogeneity is novel or related to existing concepts is completely beside the point, since that is not the key contribution of our study.
Our key contribution is our quantitative model for how the brain could be solving generic visual tasks by operating on a feature space. In the literature there are no theories regarding the decision-making process by which the brain could be solving generic visual tasks. In fact, oddball search tasks, same-different tasks and symmetry tasks are never even mentioned in the same study because it is tacitly assumed that the underlying processes are completely different! Our work brings together these disparate tasks by proposing a specific computation that enables the brain to solve both types of tasks and providing evidence for it. This specific computation is a well-defined, falsifiable model that will need to be replicated, elaborated and refined by future studies.
Public Reviews:
Reviewer #1 (Public Review):
Summary:
The authors define a new metric for visual displays, derived from psychophysical response times, called visual homogeneity (VH). They attempt to show that VH is explanatory of response times across multiple visual tasks. They use fMRI to find visual cortex regions with VH-correlated activity. On this basis, they declare a new visual region in the human brain, area VH, whose purpose is to represent VH for the purpose of visual search and symmetry tasks.
Thank you for your concise summary. We appreciate your careful reading and thoughtful and constructive comments.
Strengths:
The authors present carefully designed experiments, combining multiple types of visual judgments and multiple types of visual stimuli with concurrent fMRI measurements. This is a rich dataset with many possibilities for analysis and interpretation.
Thank you for your accurate assessment of the strengths of our study.
Weaknesses:
The datasets presented here should provide a rich basis for analysis. However, in this version of the manuscript, I believe that there are major problems with the logic underlying the authors' new theory of visual homogeneity (VH), with the specific methods they used to calculate VH, and with their interpretation of psychophysical results using these methods. These problems with the coherency of VH as a theoretical construct and metric value make it hard to interpret the fMRI results based on searchlight analysis of neural activity correlated with VH.
We appreciate your concerns, and have tried our best to respond to them fully against your specific concerns below.
In addition, the large regions of VH correlations identified in Experiments 1 and 2 vs. Experiments 3 and 4 are barely overlapping. This undermines the claim that VH is a universal quantity, represented in a newly discovered area of the visual cortex, that underlies a wide variety of visual tasks and functions.
We agree with you that the VH regions defined using symmetry task and search task do not overlap completely (as we have shown in Figure S13). However this is to be expected for several reasons. First, the images in the symmetry task were presented at fixation, whereas the images in the visual search task were presented peripherally. Second, the lack of overlap could be due to variations across individuals. Indeed, considerable individual variability has been observed in the location of category-selective regions such as VWFA (Glezer and Riesenhuber 2013) and FFA (Weiner and Grill-Spector, 2012). We propose that testing the same participants on both search and symmetry tasks would reveal overlapping VH regions. We now acknowledge these issues in the Results (p. 26).
Maybe I have missed something, or there is some flaw in my logic. But, absent that, I think the authors should radically reconsider their theory, analyses, and interpretations, in light of the detailed comments below, to make the best use of their extensive and valuable datasets combining behavior and fMRI. I think doing so could lead to a much more coherent and convincing paper, albeit possibly supporting less novel conclusions.
We appreciate your concerns. We have tried our best to respond to them fully against your specific concerns below.
THEORY AND ANALYSIS OF VH
(1) VH is an unnecessary, complex proxy for response time and target-distractor similarity. VH is defined as a novel visual quality, calculable for both arrays of objects (as studied in Experiments 1-3) and individual objects (as studied in Experiment 4). It is derived from a center-to-distance calculation in a perceptual space. That space in turn is derived from the multi-dimensional scaling of response times for target-distractor pairs in an oddball detection task (Experiments 1 and 2) or in a same-different task (Experiments 3 and 4).
The above statements are not entirely correct. Experiments 1 & 3 are oddball visual search experiments. Their purpose was to estimate the underlying perceptual space of objects.
Proximity of objects in the space is inversely proportional to response times for arrays in which they were paired. These response times are higher for more similar objects. Hence, proximity is proportional to similarity. This is visible in Fig. 2B as the close clustering of complex, confusable animal shapes.
VH, i.e. distance-to-center, for target-present arrays, is calculated as shown in Fig. 1C, based on a point on the line connecting the target and distractors. The authors justify this idea with previous findings that responses to multiple stimuli are an average of responses to the constituent individual stimuli. The distance of the connecting line to the center is inversely proportional to the distance between the two stimuli in the pair, as shown in Fig. 2D. As a result, VH is inversely proportional to the distance between the stimuli and thus to stimulus similarity and response times. But this just makes VH a highly derived, unnecessarily complex proxy for target-distractor similarity and response time. The original response times on which the perceptual space is based are far more simple and direct measures of similarity for predicting response times.
We agree that VH brings no explanatory power to target-present searches, since target-present response times are a direct estimate of target-distractor similarity. However, we are additionally explaining target-absent response times. Target-absent response times are well known to vary systematically with image properties, but why they do so have not been clear in the literature.
Our key conceptual advance lies in relating the neural response to a search array to the neural response of the constituent elements, and in proposing a decision variable using which participants can make both target-present and target-absent judgements on any search array.
(2) The use of VH derived from Experiment 1 to predict response times in Experiment 2 is circular and does not validate the VH theory.
The use of VH, a response time proxy, to predict response times in other, similar tasks, using the same stimuli, is circular. In effect, response times are being used to predict response times across two similar experiments using the same stimuli. Experiment 1 and the target present condition of Experiment 2 involve the same essential task of oddball detection. The results of Experiment 1 are converted into VH values as described above, and these are used to predict response times in Experiment 2 (Fig. 2F). Since VH is a derived proxy for response values in Experiment 1, this prediction is circular, and the observed correlation shows only consistency between two oddball detection tasks in two experiments using the same stimuli.
We agree that it would be circular to use oddball search times in Experiment 1 to explain only target-present search times in Experiment 2, since they basically involve the same searches. However, we are explaining both target-present and target-absent search times in a unified framework; systematic variations in target-absent search times have been noted in the literature but never really explained. One could still simply say that target-absent search times are some function of the target-present search times, but this still doesn’t provide an explanation for how participants are making target-present and absent decisions. The existing literature contains models for how visual search might occur for a specific target and distractor but does not elucidate how participants might perform generic visual search where target and distractors are not known in advance.
Our key conceptual advance lies in relating the neural response to a search array to the neural response of the constituent elements, and in proposing a decision variable using which participants can make both target-present and target-absent judgements on any search array.
(3) The negative correlation of target-absent response times with VH as it is defined for target-absent arrays, based on the distance of a single stimulus from the center, is uninterpretable without understanding the effects of center-fitting. Most likely, center-fitting and the different VH metrics for target-absent trials produce an inverse correlation of VH with target-distractor similarity.
We see no cause for concern with the center-fitting procedure, for several reasons. First, the best-fitting center remained stable despite many randomly initialized starting points. Second, the best-fitting center derived from one set of objects was able to predict the target-absent and target-present responses of another set of objects. Finally, the VH obtained for each object (i.e. distance from the best-fitting center) is strongly correlated with the average distance of that object from all other objects (Figure S1A). We have now clarified this in the Results (p. 11).
The construction of the VH perceptual space also involves fitting a "center" point such that distances to center predict response times as closely as possible. The effect of this fitting process on distance-to-center values for individual objects or clusters of objects is unknowable from what is presented here. These effects would depend on the residual errors after fitting response times with the connecting line distances. The center point location and its effects on the distance-to-center of single objects and object clusters are not discussed or reported here.
While it is true that the optimal center needs to be found by fitting to the data, there no particular mystery to the algorithm: we are simply performing a standard gradient-descent to maximize the fit to the data. We have described the algorithm clearly and are making our codes public. We find the algorithm to yield stable optimal centers despite many randomly initialized starting points. We find the optimal center to be able to predict responses to entirely novel images that were excluded during model training. We are making no assumption about the location of centre with respect to individual points. Therefore, we see no cause for concern regarding the center-finding algorithm.
Yet, this uninterpretable distance-to-center of single objects is chosen as the metric for VH of target-absent displays (VHabsent). This is justified by the idea that arrays of a single stimulus will produce an average response equal to one stimulus of the same kind. However, it is not logically clear why response strength to a stimulus should be a metric for homogeneity of arrays constructed from that stimulus, or even what homogeneity could mean for a single stimulus from this set. It is not clear how this VHabsent metric based on single stimuli can be equated to the connecting line VH metric for stimulus pairs, i.e. VHpresent, or how both could be plotted on a single continuum.
Most visual tasks, such as finding an animal, are thought to involve building a decision boundary on some underlying neural representation. Even visual search has been portrayed as a signal-detection problem where a particular target is to be discriminated from a distractor. However none of these formulations work in the case of generic visual tasks, where the target and distractor identities are unknown. We are proposing that, when we view a search array, the neural response to the search array can be deduced from the neural responses to the individual elements using well known rules, and that decisions about an oddball target being present or absent can be made by computing the distance of this neural response from some canonical mean firing rate of a population of neurons. This distance to center computation is what we denote as visual homogeneity. We have revised our manuscript throughout to make this clearer and we hope that this helps you understand the logic better.
It is clear, however, what should be correlated with difficulty and response time in the target-absent trials, and that is the complexity of the stimuli and the numerosity of similar distractors in the overall stimulus set. The complexity of the target, similarity with potential distractors, and the number of such similar distractors all make ruling out distractor presence more difficult. The correlation seen in Fig. 2G must reflect these kinds of effects, with higher response times for complex animal shapes with lots of similar distractors and lower response times for simpler round shapes with fewer similar distractors.
You are absolutely correct that the stimulus complexity should matter, but there are no good measures for stimulus complexity. But considering what factors are correlated with target-absent response times is entirely different from asking what decision variable or template is being used by participants to solve the task.
The example points in Fig. 2G seem to bear this out, with higher response times for the deer stimulus (complex, many close distractors in the Fig. 2B perceptual space) and lower response times for the coffee cup (simple, few close distractors in the perceptual space). While the meaning of the VH scale in Fig. 2G, and its relationship to the scale in Fig. 2F, are unknown, it seems like the Fig. 2G scale has an inverse relationship to stimulus complexity, in contrast to the expected positive relationship for Fig. 2F. This is presumably what creates the observed negative correlation in Fig. 2G.
Taken together, points 1-3 suggest that VHpresent and VHabsent are complex, unnecessary, and disconnected metrics for understanding target detection response times. The standard, simple explanation should stand. Task difficulty and response time in target detection tasks, in both present and absent trials, are positively correlated with target-distractor similarity.
Respectfully, we disagree with your assessment. Your last point is not logically consistent though: response times for target-absent trials cannot be correlated with any target-distractor similarity since there is no target in the first place in a target-absent array. We have shown that target-absent response times are in fact, independent of experimental context, which means that they index an image property that is independent of any reference target (Results, p. 15; Section S4). This property is what we define as visual homogeneity.
I think my interpretations apply to Experiments 3 and 4 as well, although I find the analysis in Fig. 4 especially hard to understand. The VH space in this case is based on Experiment 3 oddball detection in a stimulus set that included both symmetric and asymmetric objects. However, the response times for a very different task in Experiment 4, a symmetric/asymmetric judgment, are plotted against the axes derived from Experiment 3 (Fig. 4F and 4G). It is not clear to me why a measure based on oddball detection that requires no use of symmetry information should be predictive of within-stimulus symmetry detection response times. If it is, that requires a theoretical explanation not provided here.
We are using an oddball detection task to estimate perceptual dissimilarity between objects, and construct the underlying perceptual representation of both symmetric and asymmetric objects. This enabled us to then ask if some distance-to-center computation can explain response times in a symmetry detection task, and obtain an answer in the affirmative. We have reworked the text to make this clear.
(4) Contrary to the VH theory, same/different tasks are unlikely to depend on a decision boundary in the middle of a similarity or homogeneity continuum.
We have provided empirical proof for our claims, by showing that target-present response times in a visual search task are correlated with “different” responses in the same-different task, and that target-absent response times in the visual search task are correlated with “same” responses in the same-different task (Section S3).
The authors interpret the inverse relationship of response times with VHpresent and VHabsent, described above, as evidence for their theory. They hypothesize, in Fig. 1G, that VHpresent and VHabsent occupy a single scale, with maximum VHpresent falling at the same point as minimum VHabsent. This is not borne out by their analysis, since the VHpresent and VHabsent value scales are mainly overlapping, not only in Experiments 1 and 2 but also in Experiments 3 and 4. The authors dismiss this problem by saying that their analyses are a first pass that will require future refinement. Instead, the failure to conform to this basic part of the theory should be a red flag calling for revision of the theory.
We respectfully disagree – by no means did we dismiss this problem! In fact, we have explicitly acknowledged this by saying that VH does not explain all the variance in the response times, but nonetheless explains substantial variance and might form the basis for an initial guess or a fast response. The remaining variance might be explained by processes that involve more direct scrutiny. Please see Results, page 10 & 22.
The reason for this single scale is that the authors think of target detection as a boundary decision task, along a single scale, with a decision boundary somewhere in the middle, separating present and absent. This model makes sense for decision dimensions or spaces where there are two categories (right/left motion; cats vs. dogs), separated by an inherent boundary (equal left/right motion; training-defined cat/dog boundary). In these cases, there is less information near the boundary, leading to reduced speed/accuracy and producing a pattern like that shown in Fig. 1G.
The key conceptual advance of our study is that we show that even target/present, same/different or symmetry judgements can be fit into the standard decision-making framework.
This logic does not hold for target detection tasks. There is no inherent middle point boundary between target present and target absent. Instead, in both types of trials, maximum information is present when the target and distractors are most dissimilar, and minimum information is present when the target and distractors are most similar. The point of greatest similarity occurs at the limit of any metric for similarity. Correspondingly, there is no middle point dip in information that would produce greater difficulty and higher response times. Instead, task difficulty and response times increase monotonically with the similarity between targets and distractors, for both target present and target absent decisions. Thus, in Figs. 2F and 2G, response times appear to be highest for animals, which share the largest numbers of closely similar distractors.
Unfortunately, your logic does not boil down to any quantitative account, since you are using vague terms like “maximum information”. Further, any argument based solely on item similarity to explain visual search or symmetry responses cannot explain systematic variations observed for target-absent arrays and for symmetric objects, for the reasons below.
If target-distractor dissimilarity were the sole driver of response times, target-absent judgements should always take the longest time since the target and distractor have zero similarity, with no variation from one image to another. This account does not explain why target-absent response times vary so systematically.
Similarly, if symmetry judgements are solely based on comparing the dissimilarity between two halves of an object, there should be no variation in the response times of symmetric objects since the dissimilarity between their two halves is zero. However we do see systematic variation in the response times to symmetric objects.
DEFINITION OF AREA VH USING fMRI
(1) The area VH boundaries from different experiments are nearly completely non-overlapping.
In line with their theory that VH is a single continuum with a decision boundary somewhere in the middle, the authors use fMRI searchlight to find an area whose responses positively correlate with homogeneity, as calculated across all of their target present and target absent arrays. They report VH-correlated activity in regions anterior to LO. However, the VH defined by symmetry Experiments 3 and 4 (VHsymmetry) is substantially anterior to LO, while the VH defined by target detection Experiments 1 and 2 (VHdetection) is almost immediately adjacent to LO. Fig. S13 shows that VHsymmetry and VHdetection are nearly non-overlapping. This is a fundamental problem with the claim of discovering a new area that represents a new quantity that explains response times across multiple visual tasks. In addition, it is hard to understand why VHsymmetry does not show up in a straightforward subtraction between symmetric and asymmetric objects, which should show a clear difference in homogeneity. • Actually VHsymmetry is apparent even in a simple subtraction between symmetric and asymmetric objects (Figure S10). The VH regions identified using the visual search task and symmetry task have a partial overlap, not zero overlap as you are incorrectly claiming.
We have noted that it is not straightforward to interpret the overlap, since there are many confounding factors. One reason could simply be that the stimuli in the symmetry task were presented at fixation, whereas the visual search arrays contained items exclusively in the periphery. Another that the participants in the two tasks were completely different, and the lack of overlap is simply due to inter-individual variability. Testing the same participants in two tasks using similar stimuli would be ideal but this is outside the scope of this study. We have acknowledged these issues in the Results (p. 26) and in the Supplementary Material (Section S8).
(2) It is hard to understand how neural responses can be correlated with both VHpresent and VHabsent.
The main paper results for VHdetection are based on both target-present and target-absent trials, considered together. It is hard to interpret the observed correlations, since the VHpresent and VHabsent metrics are calculated in such different ways and have opposite correlations with target similarity, task difficulty, and response times (see above). It may be that one or the other dominates the observed correlations. It would be clarifying to analyze correlations for target-present and target-absent trials separately, to see if they are both positive and correlated with each other.
Thanks. The positive correlation between VH and neural response holds even when we do the analysis separately for target-present and -absent searches (correlation between neural response in VH region and visual homogeneity (n = 32, r = 0.66, p < 0.0005 for target-present searches & n = 32, r = 0.56, p < 0.005 for target-absent searches).
(3) The definition of the boundaries and purpose of a new visual area in the brain requires circumspection, abundant and convergent evidence, and careful controls.
Even if the VH metric, as defined and calculated by the authors here, is a meaningful quantity, it is a bold claim that a large cortical area just anterior to LO is devoted to calculating this metric as its major task. Vision involves much more than target detection and symmetry detection. The cortex anterior to LO is bound to perform a much wider range of visual functionalities. If the reported correlations can be clarified and supported, it would be more circumspect to treat them as one byproduct of unknown visual processing in the cortex anterior to LO, rather than treating them as the defining purpose for a large area of the visual cortex.
We totally agree with you that reporting a new brain region would require careful interpretation and abundant and converging evidence. However, this requires many studies worth of work, and historically category-selective regions like the FFA have achieved consensus only after they were replicated and confirmed across many studies. We believe our proposal for the computation of a quantity like visual homogeneity is conceptually novel, and our study represents a first step that provides some converging evidence (through replicable results across different experiments) for such a region. We have reworked our manuscript to make this point clearer (Discussion, p 32).
Reviewer #2 (Public Review):
Summary:
This study proposes visual homogeneity as a novel visual property that enables observers perform to several seemingly disparate visual tasks, such as finding an odd item, deciding if two items are the same, or judging if an object is symmetric. In Experiment 1, the reaction times on several objects were measured in human subjects. In Experiment 2, the visual homogeneity of each object was calculated based on the reaction time data. The visual homogeneity scores predicted reaction times. This value was also correlated with the BOLD signals in a specific region anterior to LO. Similar methods were used to analyze reaction time and fMRI data in a symmetry detection task. It is concluded that visual homogeneity is an important feature that enables observers to solve these two tasks.
Strengths:
(1) The writing is very clear. The presentation of the study is informative.
(2) This study includes several behavioral and fMRI experiments. I appreciate the scientific rigor of the authors.
We are grateful to you for your balanced assessment and constructive comments.
Weaknesses:
(1) My main concern with this paper is the way visual homogeneity is computed. On page 10, lines 188-192, it says: "we then asked if there is any point in this multidimensional representation such that distances from this point to the target-present and target-absent response vectors can accurately predict the target-present and target-absent response times with a positive and negative correlation respectively (see Methods)". This is also true for the symmetry detection task. If I understand correctly, the reference point in this perceptual space was found by deliberating satisfying the negative and positive correlations in response times. And then on page 10, lines 200-205, it shows that the positive and negative correlations actually exist. This logic is confusing. The positive and negative correlations emerge only because this method is optimized to do so. It seems more reasonable to identify the reference point of this perceptual space independently, without using the reaction time data. Otherwise, the inference process sounds circular. A simple way is to just use the mean point of all objects in Exp 1, without any optimization towards reaction time data.
We disagree with you since the same logic applies to any curve-fitting procedure. When we fit data to a straight line, we are finding the slope and intercept that minimizes the error between the data and the straight line, but we would hardly consider the process circular when a good fit is achieved – in fact we take it as a confirmation that the data can be fit linearly. In the same vein, we would not have observed a good fit to the data, if there did not exist any good reference point relative to which the distances of the target-present and target-absent search arrays predicted these response times.
In Section S1, we have already reported that the visual homogeneity estimates for each object is strongly correlated with the average distance of each object to all other objects (r = 0.84, p<0.0005, Figure S1). Second, to confirm that the results we obtained are not due to overfitting, we have already reported a cross-validation analysis, where we removed all searches involving a particular image and predicted these response times using visual homogeneity. This too revealed a significant model correlation confirming that our results are not due to overfitting.
(2) On page 11, lines 214-221. It says: "these findings are non-trivial for several reasons". However, the first reason is confusing. It is unclear to me why "it suggests that there are highly specific computations that can be performed on perceptual space to solve oddball tasks". In fact, these two sentences provide no specific explanation for the results.
We have now revised the text to make it clearer (Results, p. 11).
(3) The second reason is interesting. Reaction times in target-present trials can be easily explained by target-distractor similarity. But why does reaction time vary substantially across target-absent stimuli? One possible explanation is that the objects that are distant from the feature distribution elicit shorter reaction times. Here, all objects constitute a statistical distribution in the feature (perceptual) space. There is certainly a mean of this distribution. Some objects look like outliers and these outliers elicit shorter reaction times in the target-absent trials because outlier detection is very salient.
One might argue that the above account is merely a rephrasing of the idea of visual homogeneity proposed in this study. If so, feature saliency is not a new account. In other words, the idea of visual homogeneity is another way of reiterating the old feature saliency theory.
Thank you for this interesting point. We don’t necessarily see a contradiction. However, we are proposing a quantitative decision variable that the brain could be using to make target present/absent judgements.
(4) One way to reject the feature saliency theory is to compare the reaction times of the objects that are very different from other objects (i.e., no surrounding objects in the perceptual space, e.g., the wheel in the lower right corner of Fig. 2B) with the objects that are surrounded by several similar objects (e.g., the horse in the upper part of Fig. 2B). Also, please choose the two objects with similar distance from the reference point. I predict that the latter will elicit longer reaction times because they can be easily confounded by surrounding similar objects (i.e., four-legged horses can be easily confounded by four-legged dogs). If the density of object distribution per se influences the visual homogeneity score, I would say that the "visual homogeneity" is essentially another way of describing the distributional density of the perceptual space.
We agree with you, and we have indeed found that visual homogeneity estimates from our model are highly correlated with the average distance of an object relative to all other objects. However, we performed several additional experiments to elucidate the nature of target-absent response times. We find that they are unaffected by whether these searches are performed in the midst of similar or dissimilar objects (Section S4, Experiment S6), and even when the same searches are performed among nearby sets of objects with completely uncorrelated average distances (Section S4, Experiment S7). We have now reworked the text to make this clearer.
(5) The searchlight analysis looks strange to me. One can easily perform a parametric modulation by setting visual homogeneity as the trial-by-trial parametric modulator and reaction times as a covariate. This parametric modulation produces a brain map with the correlation of every voxel in the brain. On page 17 lines 340-343, it is unclear to me what the "mean activation" is.
We have done something similar. For each region we took the mean activation at each voxel as the average activation 3x3x3 voxel neighborhood in the brain, and took its correlation with visual homogeneity. We have now reworked this to make it clearer (Results, p. 16).
Minor points
(1) In the intro, it says: "using simple neural rules..." actually it is very confusing what "neural rules" are here. Better to change it to "computational principles" or "neural network models"??
We have now replaced this with “using well-known principles governing multiple object representations”.
(2) In the intro, it says: "while machine vision algorithms are extremely successful in solving feature-based tasks like object categorization (Serre, 2019), they struggle to solve these generic tasks (Kim et al., 2018; Ricci et al. 2021). These are not generic tasks. They are just a specific type of visual task-judging relationship between multiple objects. Moreover, a large number of studies in machine vision have shown that DNNs are capable of solving these tasks and even more difficult tasks. Two survey papers are listed here.
Wu, Q., Teney, D., Wang, P., Shen, C., Dick, A., & Van Den Hengel, A. (2017). Visual question answering: A survey of methods and datasets. Computer Vision and Image Understanding, 163, 21-40.
Małkiński, M., & Mańdziuk, J. (2022). Deep Learning Methods for Abstract Visual Reasoning: A Survey on Raven's Progressive Matrices. arXiv preprint arXiv:2201.12382.
Thank you for sharing these references. In fact, a recent study has shown that specific deep networks can indeed solve the same-different task (Tartaglini et al, 2023). However our broader point remains that the same-different or other such visual tasks are non-trivial for machine vision algorithms.
Reviewer #1 (Recommendations For The Authors):
Nothing to add to the public review. If my concerns turn out to be invalid, I apologize and will happily accept correction. If they are valid, I hope they will point toward a new version of this paper that optimizes the insights to be gained from this impressive dataset.
Reviewer #2 (Recommendations For The Authors):
My suggestions are as follows:
(1) Analyze the fMRI data using the parametric modulation approach first at the single-subject level and then perform group analysis.
To clarify, we have obtained image-level activations from each subject, and used it for all our analyses.
(2) Think about a way to redefine visual homogeneity from a purely image-computable approach. In other words, visual homogeneity should be first defined as an image feature that is independent of any empirical response data. And then use the visual homogeneity scores to predict reaction times.
While we understand what you mean, any image-computable representation such as from a deep network may carry its own biases and may not be an accurate representation of the underlying object representation. By contrast, neural dissimilarities in the visual cortex are strongly predictive of visual search oddball response times. That is why we used visual search oddball response times as a proxy for the underlying neural representation, and then asked whether some decision variable can be derived from this representation to explain both target present and absent judgements in visual search.
-
-
www.biorxiv.org www.biorxiv.org
-
Author response:
The following is the authors’ response to the original reviews.
eLife assessment
The authors provide convincing experimental evidence of extended motivational signals encoded in the mouse anterior cingulate cortex (ACC) that are implemented by the orbitofrontal cortex (OFC)-to-ACC signaling during learning. The results are valuable to the field of motivation and cognition. The experimental methods used were state-of-the-art. The manuscript would further benefit from theory-driven analyses to inform a mechanistic understanding, particularly for the single-cell calcium imaging results. These results will be of interest to those interested in cortical function, learning, and/or motivation.
We thank the reviewers for their thoughtful reading of our paper and providing constructive feedback. We have made the relevant changes to the manuscript to improve the writing and figures. We provide responses below to each of the reviewer’s comments.
Reviewer #1 (Public Review):
(1) An important conclusion (Figure 4) is that when mice are trained to run through no reward (N) cues in order to reach reward (R) cues, the OFC neurons projecting to ACC each respond to different specific events in a manner that ensures that collectively they tile the extended behavioural sequence. What I was less sure of was whether the ACC neurons do the same or not. Figure 3 suggests that on average ACC neurons maintain activity across N cues in order to get to R cues but I was not sure whether this was because all individual neurons did this or whether some had activity patterns like the OFC neurons projecting to ACC.
We agree that it remains uncertain what individual ACC neurons do during the extended behavioral sequence. We now include a few sentences in the discussion about what we hypothesize, as we did not perform the cellular resolution imaging to determine this:
“While we did not perform single-cell imaging of ACC in our task, we hypothesize that individual ACC neurons could encode the distribution of actions/opportunities47 (i.e. stop, run, lick, suppress lick) taken during R or N cues. ACC neurons could compute the relative value of the action taken such that more ACC neurons become recruited once mice learn to run out of N cues. The sustained increase in bulk ACC activity across N cue trials (Figure 2) could come from a stable sequence of individual neurons that encode the timescale of the actions taken. In this way, OFC projections would encode current motivation across N cues before learning, which then triggers ACC to compute the valuebased actions. Motivational signals in OFC would thus represent state since past rewards/goals, while in ACC these signals represent actions taken to pursue rewards/goals in the future.”
(2) Figure 1 versus Figure 2: There does not seem to be a particular motivation for whether chemogenetic inactivation or optogenetic inhibition were used in different experiments. I think that this is not problematic but, if I am wrong and there were specific reasons for performing each experiment in a certain way, then further clarification as to why these decisions were made would be useful. If there is no particular reason, then simply explaining that this is the case might stop readers from seeking explanations.
Thank you for this comment and we agree that clarification on this is important. We performed chemogenetic inhibition of ACC in Figure 1 to take a broad survey of behavioral effects throughout a 40-min long behavioral session, and performed optogenetic inhibition in Figure 2 because we wanted to restrict our inhibition to the few seconds of cue presentation during a behavioral session and across days. Furthermore, we wanted to combat any potential off-target effects that would come from repeated administration of CNO over the several days of training (Manvich et al 2018). We have included a couple sentences on page 4 to clarify this:
“We proceeded to test whether these motivation related signals in ACC are required for learning. To restrict our inhibition to cue presentation portions of our task, and combat any potential off-target effects of CNO31 from repeated administration across several days of training, we used optogenetic inhibition.”
(3) P5, paragraph 2. The authors argue that OFC and anteriomedial (AM) thalamic inputs into ACC are especially important for mediating motivation through N cues in order to reach R cues. Is this based on a statistical comparison between the activity in OFC or AM inputs as opposed to the other inputs?
We determined that OFC and AM thalamic inputs to ACC are particularly important by comparing the pre-cue activity in a reward-no reward-reward trial sequence (RNR; Figure 3B). Specifically, we performed paired t-tests comparing pre-cue activity between N and R cues, and found a statistically significant increase for R cues but only for the OFC and AM inputs, not for the BLA or LC inputs.
(4) P3, paragraph 2. Some papers by Khalighinejad and colleagues (eg Neuron 2020, Current Biology, 2022) might be helpful here in as much as they assess ACC roles in determining action frequency, initiation, and speed and mediating the relationship between reward availability and action frequency and speed.
We thank the reviewer for bringing these relevant papers to our attention. We have included these papers in our citations in this paragraph.
(5) Paragraph 1 "This learning is of a more deliberate, informed nature than habitual learning, as they are sensitive to the current value of outcomes and can lead to a novel sequence of actions for a desired outcome1-3." Should "they" be "it"?
This is correct, we have edited this in the manuscript.
Reviewer #2 (Public Review):
Impact:
The findings will be valuable for further research on the impact of motivational states on behaviour and cognition. The authors provided a promising concept of how persistent motivational states could be maintained, as well as established a novel, reproducible task assay. While experimental methods used are currently state-of-the-art, theoretical analysis seems to be incomplete/not extensive. We thank the reviewer for these comments. In our paper, we performed single-cell calcium imaging of OFC projection neurons to ACC to build a mechanistic understanding for the bulk ramp-like response we identified in these neurons with photometry. We identified ensembles of neurons that tile sequences of trials that match the bulk response, in particular a subset of neurons that are active at the time a reward (R) cue is reached after 2 no-reward (N) cues. We included a paragraph in the discussion to address future theory-driven analyses to address how computation is achieved by OFC projection neurons:
“We linked the ramp-like increase in neural activity in OFC to motivation, but several questions still remain about how motivation is computed and why it would be represented as a ramp. Motivation could be computed as a combination of several variables such as time since last reward, value of reward, and effort to reach future rewards. Future theorydriven analyses could determine how motivation is computed, and whether individual variables of time, value, and effort, are encoded as clusters of similar tuned neurons, or mixed and collectively represented at the population level. In either case, it is likely that a combined map of task space and value-information carried by OFC are being used to inform downstream regions, such as ACC, for adjusting behavior. ”
Reviewer #2 (Recommendations for the Authors):
Overall, the layout of the figures seems a little bit chaotic and makes it hard to understand the boundaries between panels.
We agree that the figure layout could be improved upon to aid the reader in moving from panel to panel. We have edited two of the main figures with layouts that are most irregular (Figures 2 and 4) to help with this.
Figures/text should include the promoters used for protein expression so that readers understand which cell types would be affected.
We have made sure to edit the figures to include the promoter of the viruses we used, and edited the text to include both the AAV serotype and promoter.
Discuss why it is necessary for multiple prefrontal areas to be involved in maintaining motivational signals.
We thank the reviewer for this comment. We believe that prefrontal areas would be recruited as tasks to study motivational states become more complex and require animals to keep track of task structure and perform value-guided actions. We have included a couple sentences in the final paragraph of the discussion about this:
“Our work showed the recruitment of multiple frontal cortical areas in this process, which is to be expected as animals are required to build, maintain, and use representations of task structure and value to drive learned, motivated behaviors47. Future work can build upon the task we developed here to determine how the frontal cortex maintains motivational states across many more cue-outcome associations, and how these associations may dynamically change across time48”.
Additionally, we included a short discussion on how in motivational signals differ between OFC and ACC in our work. We suggest OFC encodes current motivation before and after learning, which then leads ACC to represent learned actions taken and thus have a longer timescale motivational response (see response to Reviewer 1).
Minor: Page 4, Line 1: "increase" instead of "increases".
This is correct, we have edited this in the manuscript.
-
-
www.biorxiv.org www.biorxiv.org
-
eLife assessment
This study provides important insights into the role of neurexins as regulators of synaptic strength and timing at the glycinergic synapse between neurons of the medial nucleus of the trapezoid body and the lateral superior olive, key components of the auditory brainstem circuit involved in computing sound source location from differences in the intensity of sounds arriving at the two ears. Through an elegant combination of genetic manipulation, fluorescence in-situ hybridization, ex vivo slice electrophysiology, pharmacology and optogenetics, the authors provide compelling and rigorous evidence to support their claims. While further work is needed to reveal the mechanistic basis by which neurexins influence glycinergic neurotransmission, this work will be of interest to both auditory and synaptic neuroscientists.
-
Reviewer #1 (Public Review):
Jiang et al. demonstrated that ablating Neurexins results in alterations to glycinergic transmission and its calcium sensitivity, utilizing a robust experimental system. Specifically, the authors employed rAAV-Cre-EGFP injection around the MNTB in Nrxn1/2/3 triple conditional mice at P0, measuring Glycine receptor-dependent IPSCs from postsynaptic LSO neurons at P13-14. Notably, the authors presented a clear reduction of 60% and 30% in the amplitudes of opto- and electric stimulation-evoked IPSCs, respectively. Additionally, they observed changes in kinetics, alterations in PPR, and sensitivity to lower calcium and the calcium chelator, EGTA, indicating solid evidence for changes in presynaptic properties of glycinergic transmission.
Furthermore, the authors uncovered an unexpected increase in sIPSC frequency without altering amplitude. Although the precise mechanism remains unknown, the authors discussed this complex phenotype by considering various possibilities, including the potential scenario where the augmentation in synapses may result from Nrxn deletion rather than being a causal effect.
-
Reviewer #2 (Public Review):
Summary:
In this manuscript, Jiang et al., explore the role of neurexins at glycinergic MNTB-LSO synapses. The authors utilize elegant and compelling ex vivo slice electrophysiology to assess how the genetic conditional deletion of Nrxns1-3 impacts inhibitory glycinergic synaptic transmission and found that TKO of neurexins reduced electrically and optically evoked IPSC amplitudes, slowed optically evoked IPSC kinetics and reduced presynaptic release probability. The authors use classic approaches including reduced [Ca2+] in ACSF and EGTA chelation to propose that changes in these evoked properties are likely driven by the loss of calcium channel coupling. Intriguingly, while evoked transmission was impaired, the authors reported that spontaneous IPSC frequency was increased, due to an increase in the number of synapses in LSO. Overall, this manuscript provides important insight into the role of neurexins at the glycinergic MNTB-LSO synapse and further emphasizes the need for continued study of both the non-redundant and redundant roles of neurexins.
The authors have addressed all of my previous concerns.
-
Reviewer #3 (Public Review):
Summary:
The authors investigate the hypothesis that neurexins serve a crucial role as regulators of the synaptic strength and timing at the glycinergic synapse between neurons of the medial nucleus of the trapezoid body (MNTB) and the lateral superior olivary complex (LSO). It is worth mentioning that LSO neurons are an integration station of the auditory brainstem circuit displaying high reliability and temporal precision. These features are necessary for computing interaural cues to derive sound source location from comparing the intensities of sounds arriving at the two ears. In this context, the authors' findings build up according to the hypothesis first by displaying that neurexins were expressed in the MNTB at varying levels. They followed this up with deletion of all neurexins in the MNTB through the employment of a triple knock-out (TKO). Using electrophysiological recordings in acute brainstem slices of these TKO mice, they gathered solid evidence for the role of neurexins in synaptic transmission at this glycinergic synapse primarily by ensuring tight coupling of Ca2+ channels and vesicular release sites. Additionally, the authors uncovered a connection between the deletion of neurexins and a higher number of glycinergic synapses of TKO mice, for which they provided evidence in the form of immunostainings and related it to electrophysiological data on spontaneous release. Consequently, this investigation expands our knowledge on the molecular regulation of synaptic transmission at glycinergic synapses, as well as on the auditory processing at the level of the brainstem.
Strengths:
The authors demonstrate substantial results in support of the hypothesis of a critical role of neurexins for regulating glycinergic transmission in the LSO using various techniques. They provide evidence for the expression of neurexins in the MNTB and consecutively successfully generate and characterize the neurexin TKO. For their study on LSO IPSCs the authors transduced MNTB neurons by co-injection of virus carrying Cre and ChR2 and subsequently optogenetically evoke release of glycine. As a result, they observed a significant reduction in amplitude and significantly slower rise and decay times of the IPSCs of the TKO in comparison with control mice in which MNTB neurons were only transduced with ChR2. Furthermore, they observed an increased paired pulse ratio (PPR) of LSO IPSCs in the TKO mice, indicating lower release probability. Elaborating on the hypothesis that neurexins are essential for the coupling of synaptic vesicles to Ca2+ channels, the authors show lowered Ca2+ sensitivity in the TKO mice. Additionally, they reveal convincing evidence for the connection between the increased frequency of spontaneous IPSC and the higher number of glycinergic synapses of the LSO in the TKO mice, revealed by immunolabeling against the glycinergic presynaptic markers GlyT2 or VGAT.
Weaknesses:
A concern is on novelty as this work on the effects of pan-neurexin deletion in a glycinergic synapse is quite consistent with the authors prior work on glutamatergic synapses (Luo et al., 2020).
-
Author response:
The following is the authors’ response to the original reviews.
eLife assessment
This study provides important insights into the role of neurexins as regulators of synaptic strength and timing at the glycinergic synapse between neurons of the medial nucleus of the trapezoid body and the lateral superior olive, key components of the auditory brainstem circuit involved in computing sound source location from differences in the intensity of sounds arriving at the two ears. Through an elegant combination of genetic manipulation, fluorescence in-situ hybridization, ex vivo slice electrophysiology, pharmacology, and optogenetics, the authors provide convincing evidence to support their claims. While further work is needed to reveal the mechanistic basis by which neurexins influence glycinergic neurotransmission, this work will be of interest to both auditory and synaptic neuroscientists.
We appreciate the recognition of the significance of our study in shedding light on the role of neurexins in regulating synaptic strength and timing at the glycinergic synapse. Indeed, further investigations are warranted to delve deeper into the specific role of each different variant of neurexins in the future. We hope that our work will spark more interest and collaboration in unraveling the complexities of molecular codes of synaptic function.
Public Reviews:
Reviewer #1 (Public Review):
Jiang et al. demonstrated that ablating Neurexins results in alterations to glycinergic transmission and its calcium sensitivity, utilizing a robust experimental system. Specifically, the authors employed rAAV-Cre-EGFP injection around the MNTB in Nrxn1/2/3 triple conditional mice at P0, measuring Glycine receptor-dependent IPSCs from postsynaptic LSO neurons at P13-14. Notably, the authors presented a clear reduction of 60% and 30% in the amplitudes of opto- and electric stimulation-evoked IPSCs, respectively. Additionally, they observed changes in kinetics, alterations in PPR, and sensitivity to lower calcium and the calcium chelator, EGTA, indicating solid evidence for changes in presynaptic properties of glycinergic transmission.
Furthermore, the authors uncovered an unexpected increase in sIPSC frequency without altering amplitude. Despite the reduction in evoked IPSC, immunostaining revealed an increase in GlyT2 and VGAT in TKO mice, supporting the notion of an increase in synapse number. However, the reviewer expresses caution regarding the authors' conclusion that "glycinergic neurotransmission likely by promoting the synapse formation/maintenance, which is distinct from the phenotypes observed in glutamatergic and GABAergic neurons (Chen et al., 2017; Luo et al., 2021)", as outlined in lines 173-175. The reviewer suggests that this statement may be overstated, pointing out the authors' own discussion in lines 254-265, which acknowledges multiple possibilities, including the potential that the increase in synapses is a consequence rather than a causal effect of Nrxn deletion.
We appreciate the reviewer’s thoughtful evaluation of our study. We agree that our conclusion regarding the promotion of synapse formation/maintenance may have been overstated and recognize the need for a more nuanced interpretation of our findings. Accordingly, we have revised our interpretation by discussing carefully the various possibilities that may cause the observed increase in synapse number in line 256-266.
Reviewer #2 (Public Review):
Summary:
In this manuscript, Jiang et al., explore the role of neurexins at glycinergic MNTB-LSO synapses. The authors utilize elegant and compelling ex vivo slice electrophysiology to assess how the genetic conditional deletion of Nrxns1-3 impacts inhibitory glycinergic synaptic transmission and found that TKO of neurexins reduced electrically and optically evoked IPSC amplitudes, slowed optically evoked IPSC kinetics and reduced presynaptic release probability. The authors use classic approaches including reduced [Ca2+] in ACSF and EGTA chelation to propose that changes in these evoked properties are likely driven by the loss of calcium channel coupling. Intriguingly, while evoked transmission was impaired, the authors reported that spontaneous IPSC frequency was increased, potentially due to an increased number of synapses in LSO. Overall, this manuscript provides important insight into the role of neurexins at the glycinergic MNTP-LSO synapse and further emphasizes the need for continued study of both the non-redundant and redundant roles of neurexins.
We thank the reviewer for the strong comments and support of our work.
Strengths:
This well-written manuscript seamlessly incorporates mouse genetics and elegant ex vivo electrophysiology to identify a role for neurexins in glycinergic transmission at MNTB-LSO synapses. Triple KO of all neurexins reduced the amplitude and timing of evoked glycinergic synaptic transmission. Further, spontaneous IPSC frequency was increased. The evoked synaptic phenotype is likely a result of reduced presynaptic calcium coupling while the spontaneous synaptic phenotype is likely due to increased synapse numbers. While neuroligin-4 has been identified at glycinergic synapses, this study, to the best of my knowledge, is the first to study Nrxn function at these synapses.<br />
We again appreciate the positive feedback on the strengths of our study. We agree that the observed reduction in evoked synaptic transmission and the increase in spontaneous IPSC frequency provide intriguing insights into the function of neurexins in regulating glycinergic synaptic activity.
Weaknesses:
The data are compelling and report an intriguing functional phenotype. The role of Neurexins redundantly controls calcium channel coupling has been previously reported. Mechanistic insight would significantly strengthen this study.
We wholeheartedly agree with the reviewer that understanding how neurexins control calcium channel coupling at the presynaptic active zone is crucial for elucidating their role in synaptic transmission. While our current study has provided compelling evidence for the functional phenotypes of pan-neurexin deletion, we recognize the importance of investigating the underlying molecular mechanisms in future research. Exploring these mechanisms would undoubtedly enhance our understanding of neurexin function at various synapses and contribute to advancing the field.
The claim that triple KO of Nrxns from MNTB increases the number of synapses in LSO is not strongly supported.
We agree. Echoing the suggestion made by reviewer 1 (as mentioned above), we acknowledge that the claim regarding the increase in synapse numbers in the LSO following the triple knockout of neurexins from the MNTB was overstated. Consequently, we have revised our conclusions more carefully to reflect this adjustment.
Despite the stated caveats of measuring electrically evoked currents and the more robust synaptic phenotypes observed using optically evoked transmission, the authors rely heavily on electrical stimulation for most measurements.
We acknowledge that optogenetic stimulation offers crucial advantages, and we have provided a balanced discussion of the caveats associated with both methods in our manuscript. Additionally, we have conducted new optogenetic experiments specifically for measuring the paired-pulse ratio in control and Nrxn123 TKO mice. These results have been included as a new supplementary figure (Figure S2).
For experiments involving EGTA and low Ca2+ manipulations, we opted for electrical stimulation due to concerns regarding potential side effects of optogenetics, including the phototoxicity and photobleaching during prolonged light exposure.
The differential expression of individual neurexins might indicate that specific neurexins may dominantly regulate synaptic transmission, however, this possibility is not discussed in detail.
We thank the reviewer for bringing up this important point. The differential expression of individual neurexins indeed suggests that specific neurexins may play dominant roles in regulating synaptic transmission. While our study primarily focused on the collective impact of ablating all neurexins, we acknowledge the significance of exploring the specific contributions of individual neurexin isoforms in the future. Understanding the distinct roles of each neurexin isoform could provide valuable insights into the precise mechanisms underlying synaptic function and plasticity. We have added discussion in our revised manuscript Line223-230.
Reviewer #3 (Public Review):
Summary:
The authors investigate the hypothesis that neurexins serve a crucial role as regulators of the synaptic strength and timing at the glycinergic synapse between neurons of the medial nucleus of the trapezoid body (MNTB) and the lateral superior olivary complex (LSO). It is worth mentioning that LSO neurons are an integration station of the auditory brainstem circuit displaying high reliability and temporal precision. These features are necessary for computing interaural cues to derive sound source location from comparing the intensities of sounds arriving at the two ears. In this context, the authors' findings build up according to the hypothesis first by displaying that neurexins were expressed in the MNTB at varying levels. They followed this up with the deletion of all neurexins in the MNTB through the employment of a triple knock-out (TKO). Using electrophysiological recordings in acute brainstem slices of these TKO mice, they gathered solid evidence for the role of neurexins in synaptic transmission at this glycinergic synapse primarily by ensuring tight coupling of Ca2+ channels and vesicular release sites. Additionally, the authors uncovered a connection between the deletion of neurexins and a higher number of glycinergic synapses in TKO mice, for which they provided evidence in the form of immunostainings and related it to electrophysiological data on spontaneous release. Consequently, this investigation expands our knowledge on the molecular regulation of synaptic transmission at glycinergic synapses, as well as on the auditory processing at the level of the brainstem.
Strengths:
The authors demonstrate substantial results in support of the hypothesis of a critical role of neurexins for regulating glycinergic transmission in the LSO using various techniques. They provide evidence for the expression of neurexins in the MNTB and consecutively successfully generate and characterize the neurexin TKO. For their study on LSO IPSCs the authors transduced MNTB neurons by co-injection of virus-carrying Cre and ChR2 and subsequently optogenetically evoke release of glycine. As a result, they observed a significant reduction in amplitude and significantly slower rise and decay times of the IPSCs of the TKO in comparison with control mice in which MNTB neurons were only transduced with ChR2. Furthermore, they observed an increased paired pulse ratio (PPR) of LSO IPSCs in the TKO mice, indicating lower release probability. Elaborating on the hypothesis that neurexins are essential for the coupling of synaptic vesicles to Ca2+ channels, the authors show lowered Ca2+ sensitivity in the TKO mice. Additionally, they reveal convincing evidence for the connection between the increased frequency of spontaneous IPSC and the higher number of glycinergic synapses of the LSO in the TKO mice, revealed by immunolabeling against the glycinergic presynaptic markers GlyT2 or VGAT.
We thank the reviewer for the thoughtful and thorough evaluation of the significance of investigating the role of neurexins in glycinergic transmission at the MNTB-LSO synapse, particularly in the context of auditory processing and sound localization. The positive feedback is greatly appreciated.
Weaknesses:
The major concern is novelty as this work on the effects of pan-neurexin deletion in a glycinergic synapse is quite consistent with the authors' prior work on glutamatergic synapses (Luo et al., 2020). The authors might want to further work out novel aspects and strengthen the comparative perspective. Conceptually, the authors might want to be more clear about interpreting the results on the altered dependence of release on voltage-gated Ca2+ influx (Ca2+ sensitivity, coupling).
Regarding the reviewer’s concern about the novelty of our work, we acknowledge that our previous work has explored the effects of pan-neurexin deletion on glutamatergic synapses (Luo et al., 2020). However, we would like to point out that a novelty of our present study indeed stems from the exploration of how different types of synapses converge to employ the same mechanism of synaptic function, particularly in the context of neurexin-mediated regulation. Our previous study focused on glutamatergic synapses, the current study delves into the realm of glycinergic synapses, which represent a distinct population with unique properties and functions. Despite the differences between these synapse types, our findings reveal a commonality in the underlying mechanisms of synaptic regulation mediated by neurexins. This convergence of mechanisms across different synapse types highlights the fundamental role of neurexins in synaptic function and plasticity. By elucidating how neurexins regulate synaptic transmission at both excitatory and inhibitory synapses, we provide valuable insights into the general principles governing synaptic function. In addition, this comparative perspective may shed light on the complex interplay between excitatory and inhibitory neurotransmission, which is crucial for maintaining the balance of neuronal activity and network dynamics.
Recommendations for the authors:
Reviewer #1 (Recommendations For The Authors):
During the developmental period spanning P3-P12, the MNTB-LSO synapses undergo a transition from GABAergic to glycinergic transmission. It is well-established that Neurexin plays a role in modulating GABAergic transmission. In the authors' experimental system, AAV was injected at P0, likely impacting GABAergic transmission, including potentially influencing synapse number, before subsequently affecting glycinergic transmission. A thoughtful discussion of how the experimental interventions might have influenced this developmental process and glycinergic transmission would enhance the clarity and interpretation of their findings.
We thank the reviewer for raising the interesting topic of the transmitter switch during neurodevelopment. Strong evidence using gerbils and rats as animal models demonstrates that the MNTB-LSO synapses undergo a shift from GABAergic to glycinergic during the early development. However, in a more recent study by Friauf and colleagues (Fisher et al., 2019), patch-clamp recordings in acute mouse brainstem slices at P4-P11 combined with pharmacological blockade of GABAA receptors and/or glycine receptors clearly demonstrated no GABAergic synaptic component on LSO principal neurons, suggesting the transmitter subtype switch may be species different. We add a discussion in our revision to clarify this topic.
Reviewer #2 (Recommendations For The Authors):
The data are compelling and report an intriguing functional phenotype. Mechanistic insight into how this phenotype manifests would significantly strengthen this study. For example, which neuroligin is found at these MNTB-LSO synapses?
We agree that investigating the underlying molecular mechanisms, particularly the specific function of each variant of neurexins and their respective ligands on the postsynaptic neurons, is crucial. Exploring these mechanisms, which extend beyond the scope of our current study, would undoubtedly enhance our understanding of neurexin function at various synapses and foster advancements in the field.
Does the TKO alter the ability of MNTB inputs to induce AP firing in LSO neurons?
Activation of the MNTB inputs does not directly induce AP firing in LSO neurons, because the MNTB-LSO synapses are glycinergic and serve to inhibit neuronal activity.
We think the reviewer was to ask whether pan-neurexin deletion in the MNTB neurons alter their ability to impact the firing of LSO neurons. Indeed, the weakening of glycinergic transmission due to pan-neurexin ablation in MNTB neurons could potentially alter the excitation-inhibition (E/I) balance, thereby impacting the overall excitability of LSO neurons. We have conducted preliminary experiments to investigate this aspect and found that the E/I balance at LSO neurons was notably increased in TKO mice. We are currently preparing a manuscript to comprehensively address the role of neurexins at the auditory circuit and behavior levels.
Additional calcium measurements using GECIs would provide insight into whether nanodomain calcium or total calcium is altered at these synapses.
We appreciate the valuable suggestion provided by the reviewer. However, distinguishing between Ca2+ nanodomain and Ca2+ microdomain using Ca2+ imaging techniques requires advanced systems such as two-photon STED microscopy, which are beyond the scope of our current research.
It is unclear why fluorescence intensity is quantified instead of the number of synaptic clusters in LSO. In addition to changes in synapse numbers, fluorescent intensity can indicate a number of other possible morphological changes.
We appreciate the valuable suggestion from the reviewer. We have re-analyzed our imaging data to compare synaptic density. The results, as included in Fig.3f and 3h, confirm an increase in the number of glycinergic synapses after pan-neurexin deletion.
The most robust synaptic phenotypes were produced by measuring light-evoked oIPSCs and the authors acknowledge that electrically-evoked eIPSCs might be contaminated by uninfected fibers or by other sources of glycinergic inputs. I suggest that IPSC PPRs, EGTA, and low Ca2+ experiments be performed using optogenetics.
As discussed in our response to Public Reviews, we acknowledge that optogenetic stimulation offers crucial advantages, and we have provided a balanced discussion of the caveats associated with both methods in our manuscript. Additionally, following the reviewer’s suggestion, we have conducted new optogenetic experiments specifically for measuring the paired-pulse ratio in control and Nrxn123 TKO mice. We included this new dataset in supplementary Figure S2, which is consistent with our result obtained with electrically fiber stimulation.
For experiments involving EGTA and low Ca2+ manipulations, we opted for electrical stimulation due to major concerns regarding potential side effects of optogenetics, including the phototoxicity and photobleaching during prolonged light exposure.
It is sometimes confusing which type of evoked stimulation is being used (e.g. PPR, EGTA, and low Ca2+ experiments). To aid in the interpretations of these experiments, it would help to clarify.
We appreciate the reviewer's suggestion regarding the clarity of the evoked stimulation methods used in our experiments. We have revised the manuscript to provide clearer descriptions of the specific types of evoked stimulation employed in each experiment. Thank you for guiding towards this clarification.
The comparisons to Chen et al 2017 and the senior author's 2020 paper seem disjointed and do not contribute to the findings, which alone, are quite interesting. Given the prevailing notion that neurexins control different synaptic properties depending on the brain region and/or synapse studied, is it surprising that the findings observed here differ from previous studies of different synapses (glutamatergic and GABAergic)?
By comparing previous studies at different types of neurons/synapses, our findings reveal a commonality in the underlying mechanisms of synaptic regulation mediated by neurexins. This convergence of mechanisms across different synapse types highlights the fundamental role of neurexins in synaptic function and plasticity. In addition, this comparative perspective may shed light on the complex interplay between excitatory and inhibitory neurotransmission, which is crucial for maintaining the balance of neuronal activity and network dynamics.
Despite Nrxn3 being the most abundant Nrxn mRNA in MNTB neurons, the possible contributions of this highly expressed protein are not discussed.
We thank the reviewer for bringing up this important point. The differential expression of individual neurexins indeed suggests that specific neurexins may play dominant roles in regulating synaptic transmission. While our study primarily focused on the collective impact of ablating all neurexins, we acknowledge the significance of exploring the specific contributions of individual neurexin isoforms in the future. Understanding the distinct roles of each neurexin isoform could provide valuable insights into the precise mechanisms underlying synaptic function and plasticity. We have added discussion in our revised manuscript Line223-230.
Reviewer #3 (Recommendations For The Authors):
• There are several instances of spaces missing and typos, please carefully check the manuscript.
We greatly appreciate the reviewer's helpful feedback on the text that could be clarified or improved. We have meticulously edited the manuscript to address these concerns.
• While studying the properties of IPSC, apart from optogenetic stimulation, the authors performed experiments with electrical fiber stimulation. Their findings showed a slightly significant reduction of the IPSC amplitude and no effect on the IPSCs kinetics when comparing the TKO and control. One weakness is the discrepancy between the results from the optogenetic and fiber stimulation experiments, which the authors contribute to inefficient transfection in the fiber stimulation experiments. The authors state that they tried to optimize their protocols for virus injection protocols. However, they do not elaborate on how the transfection rates could be improved in the discussion section. Moreover, it would be good to further address the reasons for the difference in amplitude between the control IPSCs in the optogenetic and fiber stimulation experiments.
Echoing the suggestion by Reviewer 2 (see above), we acknowledge that optogenetic stimulation offers certain advantages, and we have provided a balanced discussion of the caveats associated with both methods in our manuscript. In addition, we have performed a new set of optogenetic experiment for the paired-pulse ratio measurement in control and Nrxn123 TKO mice and included as a new figure in supplementary figure S2.
For experiments involving EGTA and low Ca2+ manipulations, we opted for electrical stimulation due to major concerns regarding potential side effects of optogenetics, including the phototoxicity and photobleaching during prolonged light exposure.
We added the detail of virus injection strategy that optimized the transfection rates in the method section “To enhance virus infection efficiency, we decreased the dosage per injection while increasing the frequency of injections. Additionally, we ensured the pipette remained immobilized for 20-30 seconds to guarantee virus absorption at injection sites. As a result of this strategy, we estimated that the vast majority of MNTB neurons were inoculated by AAVs.” See line288-290.
• Abstract: "ablation of all neurexins in MNTB neurons reduced not only the amplitude but also altered the kinetics of the glycinergic synaptic transmission at LSO neurons."
Changed as suggested.
• Consider revising to "The synaptic dysfunctions primarily resulted from an altered dependence of release on voltage-gated Ca2+ influx."
We appreciate the reviewer's suggestion, which helps improve the clarity of our manuscript. We have revise the phrasing as follows: "The synaptic dysfunctions primarily resulted from an impaired calcium sensitivity of release and a loosened coupling between voltage-gated calcium channels and synaptic vesicles."
• Line 39 should be vertebrates.
Revised as suggested.
• Line 49 it would sound better to say "which further points to the diverse actions of neurexins in specific neurons."
Revised as suggested.
• Line 60 - this paragraph could include information about GABA signaling from the MNTB to the LSO, because on line 113 you mention LSO neurons receive inhibitory GABAergic/glycinergic inputs, but when you do not mention blocking of GABA currents to isolate the glycinergic ones.
We thank the reviewer for the thoughtful and detailed suggestion. We revised the text in line 60 to “In the mature mammalian auditory brainstem” and in line 113, we removed GABAergic to emphasize the nature of glycinergic synapse, particularly in the mouse brainstem where no GABAergic components are found (Fisher et al., 2019).
• Line 72/73 it should be adeno-associated virus; line 73: "combining this with the RNAScope technique" sounds better.
Changed as suggested.
• Line 91 using the RNAScope technique; lines 97, 119 as a control; line 108 the functional organization.<br />
Changed as suggested.
• Line 113 should be a pharmacological approach; line 122 optogenetically evoked.
Changed as suggested.
• Line 132, 160: the control.
Changed as suggested.
• Line 147 thus were infected; line 148 likely to be present but were obscured .
Changed as suggested.
• Line 154 which has been routinely used.
Changed as suggested.
• Line 155 It is not supposed to be Figure 2h but 2i; following that Figure 2i should be 2j; in my opinion, Figure 2i does not display a strong depression for the TKO mice.
Changed as suggested.
• Line 171 a better flow is achieved by saying: together these data show.
Changed as suggested.
• EC50 rather than IC50 of [Ca2+].
Changed as suggested.
• 180 it is better to say "we approached the matter by..."; line 183 while recording;
Changed as suggested.
• Line 203 were much stronger than the effect at control synapses; line 206 tightly clustering.
Changed as suggested.
• Line 212 sounds like they provide evidence for retina and spinal cord as well, should be made clear.
Changed as suggested.
• Line 289 previously.
Changed as suggested.
• Line 295 should be 30 min.
Changed as suggested.
• Line 336, 337 confocal microscope.
Changed as suggested.
• Please provide the number of data points also in figure captions or in the results section.
Added in the captions as suggested.
• Line 533, a better phrasing would be: the blocking effect of 0.2 mM Ca on IPSC amplitude.
Changed as suggested.
• Explain either in the methods or result section how was the EC50 of Ca2+ calculated.
Added in the methods as suggested.
-
-
hu.wikipedia.org hu.wikipedia.org
-
Apollón ikertestvére
-
Órion
-
Arethusza
Siracusa- kút
-
-
en.wikipedia.org en.wikipedia.org
-
Spleen et Idéal (Spleen and Ideal) Tableaux parisiens (Parisian Scenes) Le Vin (Wine) Fleurs du mal (Flowers of Evil) Révolte (Revolt) La Mort (Death)
6 parts of Les Fleurs du Mal
-
Voyage to Cythera is a part of this collection? Also published in 1857.
-
Les Fleurs du mal (.mw-parser-output .IPA-label-small{font-size:85%}.mw-parser-output .references .IPA-label-small,.mw-parser-output .infobox .IPA-label-small,.mw-parser-output .navbox .IPA-label-small{font-size:100%}French pronunciation: [le flœʁ dy mal]; English: The Flowers of Evil) is a volume of French poetry by Charles Baudelaire.
-
-
academic.oup.com academic.oup.com
-
the 2005 NDS outlined an approach required to deal with ‘unconventional challenges and strategic uncertainty’ and ‘prepare the Department of Defence to meet 21st-century challenges’.92Close Divided into three main sections (‘America’s Security in the 21st Century’, ‘A Defence Strategy for the 21st Century’ and ‘Desired Capabilities and Attributes’), the NDS outlines ‘an active, layered approach to the defence of the [US] nation and its interests’
NDS 2005--Rumsfeld
-
have not suggested that it is a new phenomenon. Instead, by observing and analysing the history of warfare, Huber tried to find similar patterns in which regular and irregular forces have been employed simultaneously: ‘because fortified compound warfare allows operators to fight and win, in almost every historical case, with conventional force ratios that would otherwise appear to be hopelessly inferior, it is likely to be encountered often in the future.’
Same can be said for any of the other sub-conventional warfare nomenclatures--> means and tools may change over time with technology, but fundamental features of different types don't throughout history
-
In fortified compound warfare, in addition to the two main components of warfare (a regular force and an irregular force), a regular force will also have access to a ‘safe haven’ and will be allied with a major power.
"Fortified Compound Warfare"
-
Compound warfare is the simultaneous use of a regular or main force and an irregular or guerrilla force against an enemy
Much more similar to the idea of hybrid warfare/irregular warfare
-
fourth-generation warfare ‘seems likely to be widely dispersed and largely undefined; the distinction between war and peace will be blurred to vanishing point’
I.e. Gray Zone Warfare
-
It took hundreds of years for the first-generation warfare to evolve. Second-generation warfare evolved and peaked in the 100 years between Waterloo and Verdun. Third-generation came to maturity in less than 25 years. Clearly, 3GW cannot be the leading edge of war over 60 years later
Exponential evolution of nature of warfare. Changing at an increasingly rapid pace; each generation shorter than the last
-
Each generation reached deeper into the enemy’s territory in an effort to defeat him. If 4GW is a logical progression, it must reach much deeper into the enemy’s forces in seeking victory … 4GW has in fact evolved to focus deeply in the enemy’s rear. It focuses on direct destruction of the enemy’s political will to fight
Far beyond the battlefield. geographically and temporally
-
Since then, the nature of warfare has transformed via three main generations: (1) manpower, (2) fire-power, (3) manoeuvre. In the late twentieth century, warfare developed into the fourth generation: ‘an evolved form of insurgency that employs all available networks—political, economic, social, military—to convince an opponent’s decision-makers that their strategic goals are either unachievable or too costly’
4TH GEN WARFARE (4GW)
-
-
www.biorxiv.org www.biorxiv.org
-
Author response:
The following is the authors’ response to the original reviews.
eLife assessment
This study provides important evidence supporting the ability of a new type of neuroimaging, OPM-MEG system, to measure beta-band oscillation in sensorimotor tasks on 2-14 years old children and to demonstrate the corresponding development changes, since neuroimaging methods with high spatiotemporal resolution that could be used on small children are quite limited. The evidence supporting the conclusion is solid but lacks clarifications about the much-discussed advantages of OPM-MEG system (e.g., motion tolerance), control analyses (e.g., trial number), and rationale for using sensorimotor tasks. This work will be of interest to the neuroimaging and developmental science communities.
We thank the editors and reviewers for their time and comments on our manuscript. We have responded in detail to the comments, on a point-by-point basis, below. Included in our responses (and our revised manuscript) are additional analyses to control for trial count, clarification of the advantages of OPM-MEG, and justification of our use of sensory (as distinct from motor) stimulation. In what follows, our responses are in bold typeface; additions to our manuscript are in bold italic typeface.
Reviewer #1 (Public Review):
Summary:
Compared with conventional SQUID-MEG, OPM-MEG offers theoretical advantages of sensor configurability (that is, sizing to suit the head size) and motion tolerance (the sensors are intrinsically in the head reference frame). This study purports to be the first to experimentally demonstrate these advantages in a developmental study from age 2 to age 34. In short, while the theoretical advantages of OPM-MEG are attractive - both in terms of young child sensitivity and in terms of motion tolerance - neither was in fact demonstrated in this manuscript. We are left with a replication of SQUID-MEG observations, which certainly establishes OPM-MEG as "substantially equivalent" to conventional technology but misses the opportunity to empirically demonstrate the much-discussed theoretical advantages/opportunities.
Thank you for reviewing our manuscript. We agree that our results demonstrate substantial equivalence with conventional MEG. However, as mentioned by Reviewer 3, most past studies have “focused on older children and adolescents (e.g., 9-15 years old)” whereas our youngest group is 25 years. We believe that by obtaining data of sufficient quality in these age groups, without the need for any restriction of head movement, we have demonstrated the advantage of OPM-MEG. We now have made this clear in our discussion:
“…our primary aim was to test the feasibility of OPM-MEG for neurodevelopmental studies. Our results demonstrate we were able to scan children down to age 2 years, measuring high-fidelity electrophysiological signals and characterising the neurodevelopmental trajectory of beta oscillations. The fact that we were able to complete this study demonstrates the advantages of OPM-MEG over conventional-MEG, the latter being challenging to deploy across such a large age range…”
Strengths:
A replication of SQUID-MEG observations, which certainly establishes OPM-MEG as "substantially equivalent" to conventional technology but misses the opportunity to empirically demonstrate the much-discussed theoretical advantages/opportunities.
As noted above the demonstration of equivalence was one of our primary aims. We have elaborated further on the advantages below.
Weaknesses:
The authors describe 64 tri-axial detectors, which they refer to as 192 channels. This is in keeping with some of the SQUID-MEG description, but possibly somewhat disingenuous. For the scientific literature, perhaps "64 tri-axial detectors" is a more parsimonious description.
The number of channels in a MEG system refers to the number of independent measurements of magnetic field. This, in turn, tells us the number of degrees of freedom in the data that can be exploited by algorithms like signal space separation or beamforming. E.g. the MEGIN (cryogenic) MEG system has 306 channels, 102 magnetometers and 204 planar gradiometers. Sensors are constructed as “triple sensor elements” with one magnetometer and 2 gradiometers (in orthogonal orientations) centred on a single location. In our system, each sensor has three orthogonal metrics of magnetic field which are (by definition) independent. We have 64 such sensors, and therefore 192 independent channels – indeed when implementing algorithms like SSS we have shown we can exploit this number of degrees of freedom.1 192 channels is therefore an accurate description of the system.
A small fraction (<20%) of trials were eliminated for analysis because of "excess interference" - this warrants further elaboration.
We agree that this is an important point. We now state in our methods section:
“…Automatic trial rejection was implemented with trials containing abnormally high variance (exceeding 3 standard deviations from the mean) removed. All experimental trials were also inspected visually by an experienced MEG scientist, to exclude trials with large spikes/drifts that were missed by the automatic approach. In the adult group, there was a significant overlap between automatically and manually detected bad trials (0.7+-1.6 trials were only detected manually). In the children 10.0 +-9.4 trials were only detected manually)…”
We also note that the other reviewers and editor questioned whether the higher rejection rate in children had any bearing on results. This is an extremely important question. In revising the manuscript this has also been taken into account with all data reanalysed with equal trial counts in children and adults. Results are presented in Supplementary Information Section 5.
Figure 3 shows a reduced beta ERD in the youngest children. Although the authors claim that OPMMEG would be similarly sensitive for all ages and that SQUID-MEG would be relatively insensitive to young children, one trivial counterargument that needs to be addressed is that OPM has NOT in fact increased the sensitivity to young child ERD. This can possibly be addressed by analogous experiments using a SQUID-based system. An alternative would be to demonstrate similar sensitivity across ages using OPM to a brain measure such as evoked response amplitude. In short, how does Figure 3 demonstrate the (theoretical) sensitivity advantage of OPM MEG in small heads ?
We completely understand the referees’ point – indeed the question of whether a neuromagnetic effect really changes with age, or apparently changes due to a drop in sensitivity (caused by reduced head size or - in conventional MEG and fMRI - increased subject movement) is a question that can be raised in all neurodevelopmental studies.
Our authors have many years’ experience conducting studies using conventional MEG (including in neurodevelopment) and agreed that the idea of scanning subjects down to age two in conventional MEG would not be practical; their heads are too small and they typically fail to tolerate an environment where they are forced to remain still for long periods. Even if we tried a comparative study using conventional MEG, the likely data exclusion rate would be so high that the study would be confounded. This is why most conventional MEG studies only scan older children and adolescents. For this reason, we cannot undertake the comparative study the reviewer suggests. There are however two reasons why we believe sensitivity is not driving the neurodevelopmental effects that we observe:
Proximity of sensors to the head:
For an ideal wearable MEG system, the distance between the sensors and the scalp surface (sensor proximity) would be the same regardless of age (and size), ensuring maximum sensitivity in all subjects. To test how our system performed in this regard, we undertook analyses to compute scalp-to-sensor distances. This was done in two ways:
(1) Real distances in our adaptable system: We took the co-registered OPM sensor locations and computed the Euclidean distance from the centre of the sensitive volume (i.e. the centre of the vapour cell) to the closest point on the scalp surface. This was measured independently for all sensors, and an average across sensors calculated. We repeated this for all participants (recall participants wore helmets of varying size and this adaptability should help minimise any relationship between sensor proximity and age).
(2) Simulated distances for a non-adaptable system: Here, the aim was to see how proximity might have changed with age, had only a single helmet size been used. We first identified the single example subject with the largest head (scanned wearing the largest helmet) and extracted the scalpto-sensor distances as above. For all other subjects, we used a rigid body transform to co-register their brain to that of the example subject (placing their head (virtually) inside the largest helmet). Proximity was then calculated as above and an average across sensors calculated. This was repeated for all participants.
In both analyses, sensor proximity was plotted against age and significant relationships probed using Pearson correlation.
In addition, we also wanted to probe the relation between sensor proximity and head circumference. Head circumference was estimated by binarising the whole head MRI (to delineate volume of the head), and the axial slice with the largest circumference around was selected. We then plotted sensor proximity versus head circumference, for both the real (adaptive) and simulated (nonadaptive) case (expecting a negative relationship – i.e. larger heads mean closer sensor proximity). The slope of the relationship was measured and we used a permutation test to determine whether the use of adaptable helmets significantly lowered the identified slope (i.e. do adaptable helmets significantly improve sensor proximity in those with smaller head circumference).
Results are shown in Figure R1. We found no measurable relationship between sensor proximity and age (r = -0.195; p = 0.171) in the case of the real helmets (panel A). When simulating a non-adaptable helmet, we did see a significant effect of age on scalp-to-sensor distance (r = -0.46; p = 0.001; panel B). This demonstrates the advantage of the adaptability of OPM-MEG; without the ability to flexibly locate sensors, we would have a significant confound of sensor proximity.
Plotting sensor proximity against head circumference we found a significant negative relationship in both cases (r = -0.37; p = 0.007 and r = -0.78; p = 0.000001); however, the difference between slopes was significant according to a permutation test (p < 0.025) suggesting that adaptable has indeed improved sensor proximity in those with smaller head circumference. This again shows the benefits of adaptability to head size.
Author response image 1.
Scalp-to-sensor distance as a function of age (A/B) and head circumference (C/D). A and C show the case for the real helmets; B and D show the simulated non-adaptable case.

In sum, the ideal wearable system would see sensors located on the scalp surface, to get as close as possible to the brain in all subjects. Our system of multiple helmet sizes is not perfect in this regard (there is still a significant relationship between proximity and head circumference). However, our solution has offered a significant improvement over a (simulated) non-adaptable system. Future systems should aim to improve even further on this, either by using additively manufactured bespoke helmets for every subject (this is a gold standard, but also costly for large studies), or potentially adaptable flexible helmets.
Burst amplitudes:
The reviewer suggested to “demonstrate similar sensitivity across ages using OPM to a brain measure”. We decided not to use the evoked response amplitude (as suggested), since this would be expected to change with age. Instead, we used the amplitude of the bursts.
Our manuscript shows a significant correlation between beta modulation and burst probability – implying that the stimulus-related drop in beta amplitude occurs because bursts are less likely to occur. Further, we showed significant age-related changes in both beta amplitude and burst probability leading to a conclusion that the age dependence of beta modulation was caused by changes in the likelihood of bursts (i.e. bursts are less likely to ’switch off’ during sensory stimulation in children). We have now extended these analyses to test whether burst amplitude also changes significantly with age – we reasoned that if burst amplitude remained the same in children and adults, this would not only suggest that beta modulation is driven by burst probability (distinct from burst amplitude), but also show directly that the beta effects we see are not attributable to a lack of sensitivity in younger people.
We took the (unnormalized) beamformer projected electrophysiological time series from sensorimotor cortex and filtered it 5-48 Hz (the motivation for the large band was because bursts are known to be pan-spectral and have lower frequency content in children; this band captures most of the range of burst frequencies highlighted in our spectra). We then extracted the timings of the bursts, and for each burst took the maximum projected signal amplitude. These values were averaged across all bursts in an individual subject, and plotted for all subjects against age.
Author response image 2.
Beta burst amplitude as a function of age; A) shows index finger simulation trials; B shows little finger stimulation trials. In both case there was no significant modulation of burst amplitude with age.

Results (see Figure R2) showed that the amplitude of the beta burst showed no significant age-related modulation (R2 = 0.01, p = 0.48 for index finger and R2 = 0.01, p = 0.57 for the little finger). This is distinct from both burst probability and task induced beta modulation. This adds weight to the argument that the diminished beta modulation in children is not caused by a lack of sensitivity to the MEG signal and supports our conclusion that burst probability is the primary driver of the agerelated changes in beta oscillations.
Both of the above analyses have been added to our supplementary information and mentioned in the main manuscript. The first shows no confound of sensor proximity to the scalp with age in our study. The second shows that the bursts underlying the beta signal are not significantly lower amplitude in children – which we reasoned they would be if sensitivity was diminished at younger ages. We believe that the two together suggest that we have mitigated a sensitivity confound in our study.
The data do not make a compelling case for the motion tolerance of OPM-MEG. Although an apparent advantage of a wearable system, an empirical demonstration is still lacking. How was motion tracked in these participants?
We agree that this was a limitation of our experiment.
We have the equipment to track motion of the head during an experiment, using IR retroreflective markers placed on the helmet and a set of IR cameras located inside the MSR. However, the process takes a long time to set up, it lacks robustness, and would have required an additional computer (the one we typically use was already running the somatosensory stimulus and video). When the study was designed, we were concerned that the increased set up time for motion tracking would cause children to get bored, and result in increased participant drop out. For this reason we decided not to capture motion of the head during this study.
With hindsight this was a limitation which – as the reviewer states – makes us unable to prove that motion robustness was a significant advantage for this study. That said, during scanning there was both a parent and an experimenter in the room for all of the children scanned, and anecdotally we can say that children tended to move their head during scans – usually to talk to the parent. Whilst this cannot be quantified (and is therefore unsatisfactory) we thought it worth mentioning in our discussion, which reads:
“…One limitation of the current study is that practical limitations prevented us from quantitatively tracking the extent to which children (and adults) moved their head during a scan. Anecdotally however, experimenters present in the room during scans reported several instances where children moved, for example to speak to their parents who were also in the room. Such levels of movement could not be tolerated in conventional MEG or MRI and so this again demonstrates the advantages afforded by OPM-MEG…”
As a note, empirical demonstrations of the motion tolerance of OPM-MEG have been published previously: Early demonstrations included Boto et al. 2 who captured beta oscillations in adults playing a ball game and Holmes et al. who measured visual responses as participants moved their head to change viewing angle3. In more recent demonstrations, Seymour et al. measured the auditory evoked field in standing mobile participants4; Rea et al. measured beta modulation as subjects carried out a naturalistic handwriting task5 and Holmes et al measured beta modulation as a subject walked around a room.6
Furthermore, while the introduction discusses at some length the phenomenon of PMBR, there is no demonstration of the recording of PMBR (or post-sensory beta rebound). This is a shame because there is literature suggesting an age-sensitivity to this, that the optimal sensitivity of OPM-MEG might confirm/refute. There is little evidence in Figure 3 for adult beta rebound. Is there an explanation for the lack of sensitivity to this phenomenon in children/adolescents? Could a more robust paradigm (button-press) have shed light on this?
We understand the question. There are two limitations to the current study in respect to measuring the PMBR:
Firstly, sensory tasks generally do not induce as strong a PMBR as motor tasks and with this in mind a stronger rebound response could have been elicited using a button press. However, it was our intention to scan children down to age 2 and we were sceptical that the youngest children would carry out a button press as instructed. For this reason we opted for entirely passive stimulation, requiring no active engagement from our participants. The advantages of this was a stimulus that all subjects could engage with. However, this was at the cost of a diminished rebound.
The second limitation relates to trial length. Multiple studies have shown that the PMBR can last over ~10 s 7,8. Indeed, Pfurtscheller et al. argued in 1999 that it was necessary to leave 10 s between movements to allow the PMBR to return to a true baseline9, though this has rarely been adhered to in the literature. Here, we wanted to keep recordings short for the comfort of the younger participants, so we adopted a short trial duration. However, a consequence of this short trial length is that it becomes impossible to access the PMBR directly; one can only measure beta modulation with the task. This limitation has now been addressed explicitly in our discussion:
“…this was the first study of its kind using OPM-MEG, and consequently aspects of the study design could have been improved. Firstly, the task was designed for children; it was kept short while maximising the number of trials (to maximise signal to noise ratio). However, the classical view of beta modulation includes a PMBR which takes ~10 s to reach baseline following task cessation7–9. Our short trial duration therefore doesn’t allow the rebound to return to baseline between trials, and so conflates PMBR with rest. Consequently, we cannot differentiate the neural generators of the task induced beta power decrease and the PMBR; whilst this helped ensure a short, child friendly task, future studies should aim to use longer rest windows to independently assess which of the two processes is driving age related changes…”
Data on functional connectivity are valuable but do not rely on OPM recording. They further do not add strength to the argument that OPM MEG is more sensitive to brain activity in smaller heads - in fact, the OPM recordings seem plagued by the same insensitivity observed using conventional systems.
Given the demonstration above that bursts are not significantly diminished in amplitude in children relative to adults; and further given the demonstrations in the literature (e.g. Seedat et al.10) that functional connectivity is driven by bursts, we would argue that the effects of connectivity changing with age are not related to sensitivity but rather genuinely reflect a lack of coordination of brain activity.
The discussion of burst vs oscillations, while highly relevant in the field, is somewhat independent of the OPM recording approach and does not add weight to the OPM claims.
We agree that the burst vs. oscillations discussion does not add weight to the OPM claims per se. However, we had two aims of our paper, the second being to “investigate how task-induced beta modulation in the sensorimotor cortices is related to the occurrence of pan-spectral bursts, and how the characteristics of those bursts change with age.” As the reviewer states, this is highly relevant to the field, and therefore we believe adds impact, not only to the paper, but also by extension to the technology.
In short, while the theoretical advantages of OPM-MEG are attractive - both in terms of young child sensitivity and in terms of motion tolerance, neither was in fact demonstrated in this manuscript. We are left with a replication of SQUID-MEG observations, which certainly establishes OPM-MEG as "substantially equivalent" to conventional technology but misses the opportunity to empirically demonstrate the much-discussed theoretical advantages/opportunities.
We thank the referee for the time and important contributions to this paper. We believe the fact that we were able to record good data in children as young as two years old was, in itself, an experimental realisation of the ‘theoretical advantages’ of OPM-MEG. Our additional analyses, inspired by the reviewers comments, help to clarify the advantages of OPM-MEG over conventional technology. The reviewers’ insights have without doubt improved the paper.
Reviewer #2 (Public Review):
Summary:
The authors introduce a new 192-channel OPM system that can be configured using different helmets to fit individuals from 2 to 34 years old. To demonstrate the veracity of the system, they conduct a sensorimotor task aimed at mapping developmental changes in beta oscillations across this age range. Many past studies have mapped the trajectory of beta (and gamma) oscillations in the sensorimotor cortices, but these studies have focused on older children and adolescents (e.g., 9-15 years old) and used motor tasks. Thus, given the study goals, the choice of a somatosensory task was surprising and not justified. The authors recorded a final sample of 27 children (2-13 years old) and 24 adults (21-34 years) and performed a time-frequency analysis to identify oscillatory activity. This revealed strong beta oscillations (decreases from baseline) following the somatosensory stimulation, which the authors imaged to discern generators in the sensorimotor cortices. They then computed the power difference between 0.3-0.8 period and 1.0-1.5 s post-stimulation period and showed that the beta response became stronger with age (more negative relative to the stimulation period). Using these same time windows, they computed the beta burst probability and showed that this probability increased as a function of age. They also showed that the spectral composition of the bursts varied with age. Finally, they conducted a whole-brain connectivity analysis. The goals of the connectivity analysis were not as clear as prior studies of sensorimotor development have not conducted such analyses and typically such whole-brain connectivity analyses are performed on resting-state data, whereas here the authors performed the analysis on task-based data. In sum, the authors demonstrate that they can image beta oscillations in young children using OPM and discern developmental effects.
Thank you for this summary and for taking the time to review our manuscript.
Strengths:
Major strengths of the study include the novel OPM system and the unique participant population going down to 2-year-olds. The analyses are also innovative in many respects.
Thank you – we also agree that the major strength is in the unique cohort.
Weaknesses:
Several weaknesses currently limit the impact of the study.
First, the choice of a somatosensory stimulation task over a motor task was not justified. The authors discuss the developmental motor literature throughout the introduction, but then present data from a somatosensory task, which is confusing. Of note, there is considerable literature on the development of somatosensory responses so the study could be framed with that.
We completely understand the referee’s point, and we agree that the motivation for the somatosensory task was not made clear in our original manuscript.
Our choice of task was motivated completely by our targeted cohort; whilst a motor task would have been our preference, it was generally felt that making two-year-olds comply with instructions to press a button would have been a significant challenge. In addition, there would likely have been differences in reaction times. By opting for a passive sensory stimulation we ensured compliance, and the same stimulus for all subjects. We have added text on this to our introduction as follows:
“…Here, we combine OPM-MEG with a burst analysis based on a Hidden Markov Model (HMM) 10–12 to investigate beta dynamics. We scanned a cohort of children and adults across a wide age range (upwards from 2 years old). Because of this, we implemented a passive somatosensory task which can be completed by anyone, regardless of age…”
We also state in our discussion:
“…here we chose to use passive (sensory) stimulation. This helped ensure compliance with the task in subjects of all ages and prevented confounds of e.g. reaction time, force, speed and duration of movement which would be more likely in a motor task.7,8 However, there are many other systems to choose and whether the findings here regarding beta bursts and the changes with age also extend to other brain networks remains an open question.…”
Regarding the neurodevelopmental literature – we are aware of the literature on somatosensory evoked responses – particularly median nerve stimulation – but we can find little on the neurodevelopmental trajectory of somatosensory induced beta oscillations (the topic of our paper). We have edited our introduction as follows:
“…All these studies probed beta responses to movement execution; in the case of tactile stimulation (i.e. sensory stimulation without movement) both task induced beta power loss, and the post stimulus rebound have been consistently observed in adults9,13–18. Further, beta amplitude in sensory cortex has been related to attentional processes19 and is broadly thought to carry top down top down influence on primary areas20. However, there is less literature on how beta modulation changes with age during purely sensory tasks.…”
We would be keen for the reviewer to point to any specific papers in the literature that we may have missed.
Second, the primary somatosensory response actually occurs well before the time window of interest in all of the key analyses. There is an established literature showing mechanical stimulation activates the somatosensory cortex within the first 100 ms following stimulation, with the M50 being the most robust response. The authors focus on a beta decrease (desynchronization) from 0.3-0.8 s which is obviously much later, despite the primary somatosensory response being clear in some of their spectrograms (e.g., Figure 3 in older children and adults). This response appears to exhibit a robust developmental effect in these spectrograms so it is unclear why the authors did not examine it. This raises a second point; to my knowledge, the beta decrease following stimulation has not been widely studied and its function is unknown. The maps in Figure 3 suggest that the response is anterior to the somatosensory cortex and perhaps even anterior to the motor cortex. Since the goal of the study is to demonstrate the developmental trajectory of well-known neural responses using an OPM system, should the authors not focus on the best-understood responses (i.e., the primary somatosensory response that occurs from 0.0-0.3 s)?
We understand the reviewer’s point. The original aim of our manuscript was to investigate the neurodevelopmental trajectory of beta oscillations, not the evoked response. In fact, the evoked response in this paradigm is complicated by the fact that there are three stimuli in a very short (<500 ms) time window. For this reason, we prefer the focus of our paper to remain on oscillations.
Nevertheless, we agree that not including the evoked responses was a missed opportunity. We have now added evoked responses to our analysis pipeline and manuscript. As surmised by the reviewer, the M50 shows neurodevelopmental changes (an increase with age). Our methods section has been updated accordingly and Figure 3 has been modified. The figure and caption are copied below for the convenience of the reviewer.
Author response image 3.
Beta band modulation with age: (A) Brain plots show slices through the left motor cortex, with a pseudo-T-statistical map of beta modulation (blue/green) overlaid on the standard brain. Peak MNI coordinates are indicated for each subgroup. Time frequency spectrograms show modulation of the amplitude of neural oscillations (fractional change in spectral amplitude relative to the baseline measured in the 2.5-3 s window). Vertical lines indicate the time of the first braille stimulus. In all cases results were extracted from the location of peak beta desynchronisation (in the left sensorimotor cortex). Note the clear beta amplitude reduction during stimulation. The inset line plots show the 4-40 Hz trial averaged phase-locked evoked response, with the expected prominent deflections around 20 and 50 ms. (B) Maximum difference in beta-band amplitude (0.3-0.8 s window vs 1-1.5 s window) plotted as a function of age (i.e., each data point shows a different participant; triangles represent children, circles represent adults). Note significant correlation (𝑅2 \= 0.29, 𝑝 = 0.00004 *). (C) Amplitude of the P50 component of the evoked response plotted against age. There was no significant correlation (𝑅2 \= 0.04, 𝑝 = 0.14 ). All data here relate to the index finger stimulation; similar results are available for the little finger stimulation in Supplementary Information Section 1.

Regarding the developmental effects, the authors appear to compute a modulation index that contrasts the peak beta window (.3 to .8) to a later 1.0-1.5 s window where a rebound is present in older adults. This is problematic for several reasons. First, it prevents the origin of the developmental effect from being discerned, as a difference in the beta decrease following stimulation is confounded with the beta rebound that occurs later. A developmental effect in either of these responses could be driving the effect. From Figure 3, it visually appears that the much later rebound response is driving the developmental effect and not the beta decrease that is the primary focus of the study. Second, these time windows are a concern because a different time window was used to derive the peak voxel used in these analyses. From the methods, it appears the image was derived using the .3-.8 window versus a baseline of 2.5-3.0 s. How do the authors know that the peak would be the same in this other time window (0.3-0.8 vs. 1.0-1.5)? Given the confound mentioned above, I would recommend that the authors contrast each of their windows (0.3-0.8 and 1.0-1.5) with the 2.5-3.0 window to compute independent modulation indices. This would enable them to identify which of the two windows (beta decrease from 0.3-0.8 s or the increase from 1.0-1.5 s) exhibited a developmental effect. Also, for clarity, the authors should write out the equation that they used to compute the modulation index. The direction of the difference (positive vs. negative) is not always clear.
We completely understand the referee’s point; referee 1 made a similar point. In fact, there are two limitations of our paradigm regarding the measurement of PMBR versus the task-induced beta decrease:
Firstly, sensory tasks generally do not induce as strong a PMBR as motor tasks and with this in mind a stronger rebound response could have been elicited using a button press. However, as described above it was our intention to scan children down to age 2 and we were sceptical that the youngest children would carry out a button press as instructed.
The second limitation relates to trial length. Multiple studies have shown that the PMBR can last over ~10 s7,8. Indeed, Pfurtscheller et al. argued in 1999 that it was necessary to leave 10 s between movements to allow the PMBR to return to a true baseline9 Here, we wanted to keep recordings relatively short for the younger participants, and so we adopted a short trial duration. However, a consequence of this short trial length is that it becomes impossible to access the PMBR directly because the PMBR of the nth trial is still ongoing when the (n+1)th trial begins. Because of this, there is no genuine rest period, and so the stimulus induced beta decrease and subsequent rebound cannot be disentangled. This limitation has now been made clear in our discussion as follows:
“…this was the first study of its kind using OPM-MEG, and consequently aspects of the study design could have been improved. Firstly, the task was designed for children; it was kept short while maximising the number of trials (to maximise signal to noise ratio). However, the classical view of beta modulation includes a PMBR which takes ~10 s to reach baseline following task cessation7–9. Our short trial duration therefore doesn’t allow the rebound to return to baseline between trials, and so conflates PMBR with rest. Consequently, we cannot differentiate the neural generators of the task induced beta power decrease and the PMBR; whilst this helped ensure a short, child friendly task, future studies should aim to use longer rest windows to independently assess which of the two processes is driving age related changes…”
To clarify our method of calculating the modulation index, we have added the following statement to the methods:
“The beta modulation index
 was calculated using the equation
  , where
  , and
, and  are the average Hilbert-envelope-derived amplitudes in the stimulus (0.3-0.8s), post-stimulus (1-1.5s) and baseline (2.5-3s) windows, respectively.”
Another complication of using a somatosensory task is that the literature on bursting is much more limited and it is unclear what the expectations would be. Overall, the burst probability appears to be relatively flat across the trial, except that there is a sharp decrease during the beta decrease (.3-.8 s). This matches the conventional trial-averaging analysis, which is good to see. However, how the bursting observed here relates to the motor literature and the PMBR versus beta ERD is unclear.
Again, we agree completely; a motor task would have better framed the study in the context of existing burst literature – but as mentioned above, making 2-year-olds comply with the instructions for a motor task would have been difficult. Interestingly in a recent paper, Rayson et al. used EEG to investigate burst activity in infants (9 and 12 months) and adults during observed movement execution, with results showing stimulus induced decrease in beta burst rate at all ages, with the largest effects in adults21. This paper was not yet published when we submitted our article but does help us to frame our burst results since there is strong agreement between their study and ours. We now mention this study in both our introduction and discussion.
Another weakness is that all participants completed 42 trials, but 19% of the trials were excluded in children and 9% were excluded in adults. The number of trials is proportional to the signal-to-noise ratio. Thus, the developmental differences observed in response amplitude could reflect differences in the number of trials that went into the final analyses.
This is an important observation and we thank the reviewer for raising the issue. We have now re-analysed all of our data, removing trials in the adults such that the overall number of trials was the same as for the children. All effects with age remained significant. We chose to keep the Figures in the main manuscript with all good trials (as previously) and present the additional analyses (with matched trial numbers) in supplementary information. However, if the reviewer feels strongly, we could do it the other way around (there is very little difference between the results).
Reviewer #3 (Public Review):
This study demonstrated the application of OPM-MEG in neurodevelopment studies of somatosensory beta oscillations and connections with children as young as 2 years old. It provides a new functional neuroimaging method that has a high spatial-temporal resolution as well wearable which makes it a new useful tool for studies in young children. They have constructed a 192-channel wearable OPM-MEG system that includes field compensation coils which allow free head movement scanning with a relatively high ratio of usable trials. Beta band oscillations during somatosensory tasks are well localized and the modulation with age is found in the amplitude, connectivity, and panspectral burst probability. It is demonstrated that the wearable OPM-MEG could be used in children as a quite practical and easy-to-deploy neuroimaging method with performance as good as conventional MEG. With both good spatial (several millimeters) and temporal (milliseconds) resolution, it provides a novel and powerful technology for neurodevelopment research and clinical applications not limited to somatosensory areas.
We thank the reviewer for their summary, and their time in reviewing our manuscript.
The conclusions of this paper are mostly well supported by data acquired under the proper method. However, some aspects of data analysis need to be improved and extended.
(1) The colour bars selected for the pseudo-T-static pictures of beta modulation in Figures 2 and 3, which are blue/black and red/black, are not easily distinguished from the anatomical images which are grey-scale. A colour bar without black/white would make these figures better. The peak point locations are also suggested to be marked in Figure 2 and averaged locations in Figure 3 with an error bar.
Thank you for this comment which we certainly agree with. The colour scheme used has now been changed to avoid black. We have also added peak locations.
(2) The data points in plots are not constant across figures. In Figures 3 and 5, they are classified into triangles and circles for children and adults, but all are circles in Figures 4 and 6.
Thank you! We apologise for the confusion. Data points are now consistent across plots.
(3) Although MEG is much less susceptible to conductivity inhomogeneity of the head than EEG, the forward modulating may still be impacted by the small head profile. Add more information about source localization accuracy and stability across ages or head size.
This is an excellent point. We have added to our discussion relating to the accuracy of the forward model.
“…We failed to see a significant difference in the spatial location of the cortical representations of the index and little finger; there are three potential reasons for this. First, the system was not designed to look for such a difference – sensors were sparsely distributed to achieve whole head coverage (rather than packed over sensory cortex to achieve the best spatial resolution in one area22). Second, our “pseudo-MRI” approach to head modelling (see Methods) is less accurate than acquisition of participantspecific MRIs, and so may mask subtle spatial differences. Third, we used a relatively straightforward technique for modelling magnetic fields generated by the brain (a single shell forward model). Although MEG is much less susceptible to conductivity inhomogeneity of the head than EEG, the forward model may still be impacted by the small head profile. This may diminish spatial resolution and future studies might look to implement more complex models based on e.g. finite element modelling23. Finally, previous work 24 suggested that, for a motor paradigm in adults, only the beta rebound, and not the power reduction during stimulation, mapped motortopically. This may also be the case for purely sensory stimulation. Nevertheless, it remains the case that by placing sensors closer to the scalp, OPM-MEG should offer improved spatial resolution in children and adults; this should be the topic of future work…”
Recommendations for the authors:
Reviewer #2 (Recommendations For The Authors):
Major items to further test include the differing number of trials, the windowing issue, and the focus on motor findings in the intro and discussion. First, I would recommend the authors adjust the number of trials in adults to equate them between groups; this will make their developmental effects easier to interpret.
Thank you for raising this important point. This has now been done and appears in our supplementary information as discussed above.
Second, to discern which responses are exhibiting developmental effects, the authors need to contrast the 0.3-0.8 window with the later window (2.5-3.0), not the window that appears to have the PMBR-like response. This artificially accentuates the response. I also think they should image the 1.0-1.5 vs 2.5-3.0s window to determine whether the response in this time window is in the same location as the decrease and then contrast this for beta differences.
We completely understand this point, which relates to separating the reduction in beta amplitude during stimulation and the rebound post stimulation. However, as explained above, doing so unambiguously would require the use of much longer trials. Here we were only able to measure stimulus induced beta modulation (distinct from the separate contributions of the task induced beta power reduction and rebound). It may be that future studies, with >10 s trial length, could probe the role of the PMBR, but such studies require long paradigms which are challenging to implement with children.
Third, changing the framing of the study to highlight the somatosensory developmental literature would also be an improvement.
We have added to our introduction a stated in the responses above.
Finally, the connectivity analysis on data from a somatosensory task did not make sense given the focus of the study and should be removed in my opinion. It is very difficult to interpret given past studies used resting state data and one would expect the networks to dynamically change during different parts of the current task (i.e., stimulation versus baseline).
We appreciate the point regarding connectivity. However, it was our intention to examine the developmental trajectory of beta oscillations, and a major role of beta oscillations is in mediating connectivity. It is true that most studies are conducted in the resting state (or more recently – particularly in children – during movie watching). The fact that we had a sensory task running is a confound; nevertheless, the connectivity we derived in adults bears a marked similarity to that from previous papers (e.g. 25) and we do see significant changes with age. We therefore believe this to be an important addition to the paper and we would prefer to keep it.
References
(1) Holmes, N., Bowtell, R., Brookes, M. J. & Taulu, S. An Iterative Implementation of the Signal Space Separation Method for Magnetoencephalography Systems with Low Channel Counts.
Sensors 23, 6537 (2023).
(2) Boto, E. et al. Moving magnetoencephalography towards real-world applications with a wearable system. Nature (2018) doi:10.1038/nature26147.
(3) Holmes, M. et al. A bi-planar coil system for nulling background magnetic fields in scalp mounted magnetoencephalography. NeuroImage 181, 760–774 (2018).
(4) Seymour, R. A. et al. Using OPMs to measure neural activity in standing, mobile participants. NeuroImage 244, 118604 (2021).
(5) Rea, M. et al. A 90-channel triaxial magnetoencephalography system using optically pumped magnetometers. annals of the new york academy of sciences 1517, https://doi.org/10.1111/nyas.14890 (2022).
(6) Holmes, N. et al. Enabling ambulatory movement in wearable magnetoencephalography with matrix coil active magnetic shielding. NeuroImage 274, 120157 (2023).
(7) Pakenham, D. O. et al. Post-stimulus beta responses are modulated by task duration. NeuroImage 206, 116288 (2020).
(8) Fry, A. et al. Modulation of post-movement beta rebound by contraction force and rate of force development. Human Brain Mapping 37, 2493–2511 (2016).
(9) Pfurtscheller, G. & Lopes da Silva, F. H. Event-related EEG/MEG synchronization and desynchronization: Basic principles. Clin Neurophysio 110, 1842–1857 (1999).
(10) Seedat, Z. A. et al. The role of transient spectral ‘bursts’ in functional connectivity: A magnetoencephalography study. NeuroImage 209, 116537 (2020).
(11) Baker, A. P. et al. Fast transient networks in spontaneous human brain activity. eLife 2014, 1867 (2014).
(12) Vidaurre, D. et al. Spectrally resolved fast transient brain states in electrophysiological data. NeuroImage 126, 81–95 (2016).
(13) Gaetz, W. & Cheyne, D. Localization of sensorimotor cortical rhythms induced by tactile stimulation using spatially filtered MEG. NeuroImage 30, 899–908 (2006).
(14) Cheyne, D. et al. Neuromagnetic imaging of cortical oscillations accompanying tactile stimulation. Cognitive Brain Research 17, 599–611 (2003).
(15) van Ede, F., Jensen, O. & Maris, E. Tactile expectation modulates pre-stimulus β-band oscillations in human sensorimotor cortex. NeuroImage 51, 867–876 (2010).
(16) Salenius, S., Schnitzler, A., Salmelin, R., Jousmäki, V. & Hari, R. Modulation of Human Cortical Rolandic Rhythms during Natural Sensorimotor Tasks. NeuroImage 5, 221–228 (1997).
(17) Cheyne, D. O. MEG studies of sensorimotor rhythms: A review. Experimental Neurology 245, 27–39 (2013).
(18) Kilavik, B. E., Zaepffel, M., Brovelli, A., MacKay, W. A. & Riehle, A. The ups and downs of beta oscillations in sensorimotor cortex. Experimental Neurology 245, 15–26 (2013).
(19) Bauer, M., Oostenveld, R., Peeters, M. & Fries, P. Tactile Spatial Attention Enhances Gamma-Band Activity in Somatosensory Cortex and Reduces Low-Frequency Activity in Parieto-Occipital Areas. J. Neurosci. 26, 490–501 (2006).
(20) Barone, J. & Rossiter, H. E. Understanding the Role of Sensorimotor Beta Oscillations. Frontiers in Systems Neuroscience 15, (2021).
(21) Rayson, H. et al. Bursting with Potential: How Sensorimotor Beta Bursts Develop from Infancy to Adulthood. J Neurosci 43, 8487–8503 (2023).
(22) Hill, R. M. et al. Optimising the Sensitivity of Optically-Pumped Magnetometer Magnetoencephalography to Gamma Band Electrophysiological Activity. Imaging Neuroscience (2024) doi:10.1162/imag_a_00112.
(23) Stenroos, M., Hunold, A. & Haueisen, J. Comparison of three-shell and simplified volume conductor models in magnetoencephalography. NeuroImage 94, 337–348 (2014).
(24) Barratt, E. L., Francis, S. T., Morris, P. G. & Brookes, M. J. Mapping the topological organisation of beta oscillations in motor cortex using MEG. NeuroImage 181, 831–844 (2018).
(25) Rier, L. et al. Test-Retest Reliability of the Human Connectome: An OPM-MEG study. Imaging Neuroscience (2023) doi:10.1162/imag_a_00020.
-
Reviewer #3 (Public Review):
This study demonstrated the application of OPM-MEG in neurodevelopment studies of somatosensory beta oscillations and connections with children as young as 2 years old. It provides a new functional neuroimaging method which has high spatial-temporal resolution as well wearable which makes it a new useful tool for studies in young children. They have constructed a 192-channel wearable OPM-MEG system includes field compensation coils which allows free head movement scanning with relatively high ratio of usable trials. Beta band oscillations during somatosensory tasks are well localized and the modulation with age are found in the amplitude, connectivity, and pan-spectral burst probability. It is demonstrated that the wearable OPM-MEG could be used in children as a quite practical and easy to deploy neuroimaging method with performance as good as conventional MEG. With both good spatial (several millimeter) and temporal (milliseconds) resolution, it provides a novel and powerful technology to neurodevelopment research and clinical application not limited to somatosensory areas.
The conclusions of this paper are mostly well supported by data acquired under proper method.
-
eLife assessment
This study provides important evidence supporting the ability of a new type of neuroimaging, OPM-MEG system, to measure beta-band oscillation in sensorimotor tasks in 2-14 years old children and to demonstrate the corresponding development changes, since neuroimaging methods with high spatiotemporal resolution that could be used on small children are quite limited. The evidence supporting the conclusion is compelling. This work will be of interest to the neuroimaging and developmental science communities.
-
-
www.biorxiv.org www.biorxiv.org
-
Note: This response was posted by the corresponding author to Review Commons. The content has not been altered except for formatting.
Learn more at Review Commons
Reply to the reviewers
We would like to thank the three reviewers for their time and effort, the constructive criticism, and suggestions to improve the quality of the manuscript. Below, we address the points raised by providing further clarifications or revising the manuscript as indicated.
__Reviewer #1 (Evidence, reproducibility and clarity (Required)): __
This study investigates mitochondrial and apicoplast division and distribution during the life cycle of Plasmodium falciparum. Utilizing the MitoRed reporter line for fluorescent mitochondrial marking and employing high-resolution 3D imaging techniques, including FIB-SEM, the research unveils the dynamics of these essential organelles across various stages of the parasite's development. The authors' work marks a significant step forward in understanding the cellular biology of Plasmodium falciparum, offering novel insights into the dynamics of mitochondrial and apicoplast division. By addressing the additional comments and incorporating recent findings and clarifications, the research not only underscores the complexity of these processes but also situates the study within the continuum of apicomplexan parasite research.
Major comments: • Suitability of Reporter Line for Oocyst Development: The conclusion regarding the limitations of the MitoRed line for oocyst development stages prompts a discussion on alternative approaches, such as mito trackers, to validate observations in these stages. In the current state, it is difficult to conclude whether the data presented are only true for this specific transgenic line.
We agree with the reviewer that the lack of MitoRed salivary gland sporozoites indeed hints to a developmental issue and therefore interpretation of mitochondrial morphology in oocyst stages should be done carefully. Although we would like to verify these observations with a wild-type line, there are several complications with using a MitoTracker staining. Firstly, a general staining procedure will also highlight the much larger and more abundant host mitochondria thus complicating both the actual imaging and interpretation of the data. Secondly, our own data presented in this manuscript demonstrated that MitoTracker stainings of blood-stage parasites should be considered with great care and it remains to be tested whether mosquito-stage parasite viability and mitochondrial morphology remain unaffected. Thirdly, mosquito experiments are time intensive and costly and we lack the time and funding to expand on this part of the work. We therefore decided to move the oocyst data to the supplement and added additional qualifiers for interpretation to the text.
Line 578: “Although these mitochondrial observations should be interpreted with care since oocysts did not form salivary gland populating sporozoites and might therefore not be representing healthy oocysts, in P. berghei liver-stage schizonts, a very similar mitochondrial organization was observed in sub-compartments created by large membrane invaginations.”
To conclude, we think it is important to be open about the limitations of the MitoRed line and discuss this in the paper to provide a balanced view for others that might want to use this line in the future. At the same time, we think that the observation of the mitochondrial organization centers and the great similarity with mitochondrial organization in liver- and blood-stage schizonts offers tentative support for a biologically relevant phenotype and gives new insights that we would like to share in this manuscript, provided that they are interpreted with care.
-
Analysis of Mitochondrion and Apicoplast Association with CPs: Could the author elaborate on how their statistical power and image data support assertions of random association between organelles and CPs (line 438-439) and the dynamic nature of Mito-CP interactions (line 504)? In addition, could the authors comment/discuss their findings regarding the distance between Mito-Api compared to the one reported in Figure S2 of Sun et al. preprint: bioRxiv 2022.09.14.508031; doi: https://doi.org/10.1101/2022.09.14.508031
We would like to clarify the point that the reviewer raises. Although we indeed observed that the distances between the CP-mito are significantly smaller compared to CP-apicoplast in schizont 1 in Figure 7, we do not think that there is interaction between the mitochondrion and CPs. In schizont 3-6, the apicoplast shows close apposition with CPs over the complete length of the apicoplast/with all apicoplast fragments and the distances between CPs and apicoplast range from 0-150 nm, therefore we think there is CP-apicoplast interaction. The distance between CPs and mitochondrion is much larger in all schizonts with an average of 500-600 nm, except for schizont 6 where the CP-mito distances become smaller due to the alignment of the mitochondrion with the apicoplast. Still the CP-mito distance is significantly bigger in schizont 6 compared to CP-apicoplast. Therefore, we do not think there are mito-CP interactions in any of the schizont stages. To clarify this in the text, we added the following sentences:
Line 483: “Although the distances between the mitochondrion and CPs (average 616 nm, SD 235 nm) in this early schizont are significantly smaller than the apicoplast-CPs distances (average 1350 nm, SD 260 nm), there is no direct interaction between the mitochondrion and CPs since the smallest CP-mitochondrion distance measured is 332 nm. The significant difference can be explained by the fact that the apicoplast is located in the center of the parasite, while the mitochondrion is larger and stretched throughout the whole cell leading to coincidental closer proximity to the peripheral CPs.”
We have also added extra comparisons of CP-apicoplast and CP-mitochondrion distances to the text to support this (Line 483-503).
We thank the reviewer for their suggestion of comparison with the data from Sun et al. The EM tomography data in that paper are indeed of much higher resolution and hint at physical interaction between the membranes of the mitochondrion and apicoplast. We have added the following sentences to the discussion:
Line 612: “EM tomography data from Sun et al. show there are hints of connecting structures between the mitochondrion and apicoplast in areas where the distance between the organelles is very small and similar to the distance between the inner and outer membranes of the organelles themselves in merozoites, suggesting physical link between the organelles.”
• Incorporation of Recent Findings into Schematic Models: I recommend the authors modify their current model in Figure 8 to reflect on recent findings on CP outer domain contact with the parasite plasma membrane (PPM) post-mitosis as demonstrated by Liffner et al. PMID: 38108809.
We agree with the reviewer that the data from Liffner et al. suggest contact of the outer CP with the PPM, however, we think ExM data should be interpreted with some care. Contact sites are strictly defined as an area where membranes of two organelles are in close proximity to each other, while there is no membrane fusion, there are tethering forces (protein-lipid or protein-protein interaction), and fulfill a specific function (PMID:30894536). The ExM data do not have the resolution to define the CP-PPM appositions as contact sites. Although we indeed see closeness of the CPs and the PPM in our FIB-SEM data, we do not see evidence of a physical contact between the two. Therefore, for this proposed model, we would keep the focus on the division and segregation of the two endosymbiotic organelles.
Minor comments: • Reference to WHO Report: The manuscript cites malaria incidence and mortality data from an older WHO report. Given the availability of the 2022 WHO reports, authors should update the text and citation (line 36).
Changed accordingly.
-
Clarification of Host: The term "its mitochondrion" (line 42) should be specified as "human mitochondrion" to clearly distinguish between the two different hosts.
We changed “The malaria parasite harbors a unique mitochondrion that differs greatly from its host mitochondrion” to “The malaria parasite harbors a unique mitochondrion that differs greatly from the human mitochondrion”.
-
Terminology of Parasite Development Stages: The usage of "schizogony" to describe division processes in liver and mosquito stages could be misleading due to the distinct process of endopolygeny nuclear-like division observed during sporogony (line 56; PMID: 31805442). I would recommend the authors use a more general language, such as cell division.
Changed accordingly.
-
Prior Research on CP and Apicoplast Association: The observation of centriolar plaques (CPs) associating with the apicoplast (line 91) has precedents in the study of other apicomplexan parasites, such as Sarcosystis (PMID: 16079283). Acknowledging and discussing these findings would contextualize the current study within the broader range of the most commonly studied apicomplexan parasites.
We thank the reviewer for this suggestion and added the following sentence and citation to the discussion:
Line 646: ”In other apicomplexan parasites, such as Toxoplasma gondii and Sarcocystis neurona, centrosomes have also been indicated to be involved in apicoplast organization and distribution during cell division.”
-
Depth of Imaging Data: Could the authors indicate the width of their z-stack, for instance, in Figure 1? I would also suggest the authors use hours of post-infection (h.p.i) for clarity (lines 234-254) to aid comprehension by a broader audience as they do later in the manuscript.
As suggested we added the depth and interval ranges of the Z-stacks are added to the legends of Figures 1, 2, 3, and 5.
It is common practice to describe the oocyst stages by days instead of hours post infection (of the mosquito; also referred to as days after feeding) as the development takes ~2 weeks. Later in the manuscript, we refer to the development of asexual blood stages, a ~48h cycle, which is commonly referred to by hours post invasion (of the red blood cell). Sticking to common practices in the field, we have decided leave the time indications used unaltered.
-
Visualization of Mitochondrial Structures: Suggestions to include or reference images of bulbous mitochondrial structures (line 445) directly in the main text or within key figures (e.g., Figure 6) would help the reader understand what and where are these bulbous structures.
Arrows are added to Figure 6 to indicate bulins.
-
Organelle Communication and Division Mechanisms: The discussion of bulbous invagination structures (buildings) (line 469) and their role in organelle division is interesting; could it be also for organelle communication or storage? Can the authors expand the discussion about it?
We have indeed wondered and discussed possible functions of these bulins extensively. While roles in organelle communication or storage are other interesting theories that also crossed our minds, the timing of appearance, the precise location of the bulins at the entrance of developing merozoites at the stage where bulins are most abundant, and their morphological features together to us strongly suggest a link to (mitochondrial) fission, via membrane remodeling and/or the distribution of certain components, such as mitochondrial DNA, proteins, or protein complexes. We would like to keep the focus of the paper at mitochondrial and apicoplast fission and as such we discuss various observations within this context. Discussing all our observations within the wider context of Plasmodium biology would be lead to overly long and unfocused paper and hence we would like to leave these discussions for other manuscripts with a different focus.
Reviewer #1 (Significance (Required)):
The study is a significant contribution to the field of parasitology, particularly in understanding the cellular biology of Plasmodium falciparum. The development of the MitoRed reporter line is a notable advancement, allowing for the real-time visualization of mitochondrial dynamics. This tool could be invaluable for future studies exploring parasite biology's intricacies and identifying new antimalarial drug targets. Furthermore, while the study provides detailed insights into the division and distribution of mitochondria and apicoplasts, the molecular mechanisms underlying these processes remain to be fully elucidated. Specifically, the role of specific proteins in mediating these divisions and the potential interplay between mitochondrial and apicoplast dynamics during parasite development warrant further investigation.
Reviewer #2 (Evidence, reproducibility and clarity (Required)):
During its development and growth, the human malaria parasite P. falciparum needs to guarantee that cellular organelles, including the mitochondrion and the apicoplast, will be divided and segregated correctly into the daughter parasites. However, the details and mechanisms of these processes are not clear. Here, authors provide a description of mitochondrial replication and segregation in P. falciparum schizonts, gametocytes and oocysts. They generated a reporter cell line by attaching mScarlet red fluorescent protein to the mitochondrial heat shock protein 70-3 and used high-resolution 3D-imaging and focused ion beam scanning electron microscopy to study mitochondrion dynamics in the asexual, gametocytes and mosquito stages. The authors found that in schizonts, the mitochondrion forms a cartwheel structure at the end of early segmentation stage with full division occurring only at a late stage of schizogony. Apicoplast division happens after nuclear division but is complete before nuclear division is completed. Authors also found apicoplast but not mitochondrion is associated with centriolar plaque (analogue of centrosome in P. falciparum) during the schizogony. At the end, authors proposed their model of nuclei, mitochondrial and apicoplast division in the asexual stage schizogony. This well-written manuscript provides insights on mitochondrion and apicoplast fission in P. falciparum blood stage schizogony and mitochondrion dynamic in the blood, gametocytes and mosquito stages. Questions and suggestions are below:
Major comments The marker line forms mature oocysts but does not produce salivary gland sporozoites. This phenotype needs to be explained more clearly. Are sporozoites produced in the midgut, are they released into the hemocoel?
For clarity, we have expanded our explanation of this phenotype and indicated the limitations of the tool in lines 250-259:
“While several free sporozoites were observed in dissected midguts and salivary glands on day 16 (data not shown), we never observed an oocyst containing fully mature sporozoites with a divided mitochondrion or an infected salivary gland on day 16 and 21 after infection. This indicates that sporozoites are produced and released into the hemocoel, however, they have a health defect that prevents them from infecting the salivary glands. Possibly the mitochondrial marker or the integration in the SIL7 locus causes issues for sporozoite development. We conclude that the MitoRed line is a great tool for mitochondrial visualization in asexual blood stages, gametocytes stages, and mosquito stages up until late oocysts (Supplemental Information S1) but that for studies later in the life cycle other tools need to be developed and tested.”
Does introduction of an exogenous copy of HSP70 influence total HSP70 expression in the parasite, and can this cause the observed defect in sporozoite production? Did authors try to tag the endogenous HSP70 to see if it's a suitable reporter?
For clarity, as we describe in the paper (e.g. lines 113-117) we did not express an additional copy of HSP70-3 but merely fused its promoter region and mitochondrial targeting sequence without any further functional domains to mScarlet. This is a strategy that has been employed with great success to study mitochondrial biology in all life-cycle stages of P. berghei (PMID:29669282). While we cannot formally exclude that the use of a second copy of the HSP70-3 promoter could somehow influence the expression of the endogenous copy, it seems rather unlikely. A plethora of promoters of a wide variety of genes have been used for transgenic expression of e.g. drug cassettes and other fluorescent markers in a multitude of studies and to the best of our knowledge there are no reports of this ever interfering with endogenous expression levels. Although we think it would be interesting to know what exactly causes the defective sporozoite production, this information will not add to our understanding of mitochondrial dynamics in mosquito stages and hence beyond the scope of this study (see also our responses to the previous comment and the first comment of reviewer 1).
Did authors compare the growth of the reporter parasite line to wild-type in gametocytes and oocysts?
Typically, conversion rates of gametocyte inductions are highly variable even within the same experiment. MitoRed gametocytes have been induced in at least five independent experiments. Although we have not performed a direct quantification of gametocyte conversion or growth rates between MitoRed and NF54 WT parasites, stage V male and female MitoRed gametocytes developed normally demonstrating no morphological aberrations in each of these experiments within the expected 12-day time frame, similarly as WT parasites, assessed by light microscopy. As we found no indications for a developmental phenotype deviating from what is commonly observed for wild-type parasites as is shown in supplemental figure S3. We have added comparison of exflagellation events in MitoRed vs WT parasites to figure S4, showing no significant difference and indicating formation of healthy male gametes. Normal healthy of MitoRed gametocytes is further supported by the fact that these parasites infect mosquitos.
A direct comparison of the growth of MitoRed with WT in oocyst stages is challenging, since infections can show high variance. In addition, these experiments are very costly and time intensive. As we focused our work on blood-stage development and because there are limitations in the use of MitoRed when studying subsequent mosquito- and liver-stage development as discussed above and in the manuscript, we decided not to invest our limited resources for a direct comparison with WT, reserving such a comparison for future transgenic lines that present no obvious developmental defects.
In figure 1A and Methods, are all MitoTracker stains incubated at 100 nM for 30 minutes? Did authors try to optimize the conditions to improve quality Mitotracker staining can be improved?
Indeed, all MitoTracker stains were performed at 100 nM, except for the Rhodamin123 used for life imaging. In the past, we have performed several pilot experiments to optimize staining conditions of which 100nM for 30 min most consistently resulted in sufficiently bright yet specific signals. Notably, this is the MitoTracker concentration that is described most frequently in other papers. The use of a lower concentration might indeed improve the mitochondrial morphology in MitoTracker stained parasites, however, for the scope of this paper we wanted to compare our new mitochondrial marker with the most commonly used MitoTracker staining conditions. Combined with the fact that MitoTrackers are toxic at low concentrations, we preferred to step away from MitoTracker when looking at mitochondrial division, to ensure we are looking at biologically relevant mitochondria.
In figure 1B, can authors replace the figures for the first ring? The parasite does not seem healthy and the scale bar is shorter than the others. Can authors define DIC in the legend?
Change accordingly.
In figure 8, it looks like some apicoplasts are not associated with the CP, contrary to what is stated in the text, for eg the one at the 7 o'clock position in stage 3.
It is indeed difficult to find an angle of visualization that shows clearly that all CPs associate with the apicoplast, a common challenge when trying to visualize 3D data in a 2D space. However, in the 3D animated movies that are provided with the manuscript, the reader can observe this association more clearly, as the organelles rotate slowly so that all angles can be observed. We therefore think that these movies are indispensable to demonstrate and clarify things that are difficult to extract from still, non-rotating image.
The Discussion should mention the failure in generating sporozoites from this reporter line Can authors discuss the SIL7 locus as the site of integration, in the context of potential effect of its disruption on sporozoite production.
In the discussion, we briefly mention the limitation of the use of MitoRed. We have now also added a reference to the more extensive discussion of this phenotype in the supplemental information and included an additional sentence in the results section to indicate the limitations. As indicated in response to previous comments, we think it is important to discuss these limitations as well as present the observations we made during oocyst development but to compartmentalize these to an extended, supplementary section. This allows us to keep the focus on fission during blood-stage schizogony and not make the discussion overly lengthy.
Authors should explain criteria for identifying organelles in FIB-SEM images eg mitochondria, apicoplast etc.
We added to following sentence to clarify how we identified the mitochondrion and apicoplast in the FIB-SEM images (lines 387-389):
"The mitochondrion and apicoplast can be recognized by their tubular shape in addition to the double membrane of the mitochondrion and the thicker appearance of the four membranes of the apicoplast.”
FIB-SEM images show other prominent organelles in these images (dense granules? hemozoin crystals?). It would be helpful for reader orientation and greater appreciation of the work if these organelles were marked as well.
We agree with the reviewer it would be an interesting addition to visualize other organelles, such as e.g. dense granules, rhoptries, and IMC, to learn more about general organellar biology of the parasite. However, segmentation of these organelles requires the training of a new deep learning model and/or the manual segmentation of +400 image slices per parasite. This is unfortunately not feasible for us. However, the dataset is going to be available online and we encourage researchers to revisit and reuse the dataset for their own research questions.
Minor comments The format of blood, mosquito and liver stage is not consistent. Eg. in line 17, 22, 56 and 65. Some has a dash line while some doesn't.
We use hyphens (dashes are longer and used between clauses/sentences) as appropriate. That is, when we use “blood-stage” as a compound adjective as in “the blood-stage parasites are” but not when using “stages” as the noun as “the blood stages are”. We have double-checked the entire manuscript once more to ensure correct hyphenation throughout.
In line 36, numbers of cases and death by malaria are by estimation.
Changed accordingly
Can authors define Plasmodium falciparum as P. falciparum in line 37?
It is common practice to write the full name of a species at first mention in the main body of a manuscript (not including the abstract).
The sentence in line 57-59 is confusing. At the end of schizogony, the daughter merozoite/sporozoite has one mitochondrion but it's multiple in the parasite.
We adapted the sentence so it will be clearer to the reader that the parasite has a single mitochondrion that divides into multiple fragments during cell division:
“During P. falciparum cell division, the single parasite mitochondrion needs to be properly divided and distributed among the daughter cells.”
Can authors specify which mitochondrial dyes are toxic in line 76?
We have included the following sentence to clarify:
“However, eight of these dyes were tested in a drug screen all showing IC50 values below 1mM with three, Mito Red, DiOC6, and Rhodamine B being highly active against P. falciparum with IC50 values below 30 nM14,15.”
In line 115, can authors indicate the Gene ID for PfNF54? Can authors define the reported parasite line as MitoRed here instead of line 125?
Although we indeed used NF54 as the parental strain for the MitoRed line, we think the 3D7 gene ID is more useful in this context. The 3D7 genome is used as the reference genome by the entire field and it is much better annotated than the NF54 genome. Furthermore, the genomes are not all too different to start with, as 3D7 is a subclone of the NF54 line.
In line 134 and 540, use punctate instead of 'punctuated'?
Changed accordingly.
In line 161 to 163, can authors also cite ref 19?
Reference 19 (now 20) is cited in line 163 precluding the need for an additional citation in the next sentence.
In line 174, pH change can also trigger gametocytes activation.
Changed accordingly.
In Figure S4, please indicate the percentage of parasites having close apposition of mitochondrion to axonemes.
When we revisited our images to check what percentage of parasites have close appositions of the mitochondrion and the axonemes, we found that in all exflagellating parasites that were analyzed there is close apposition or overlap between the mitochondrial and the tubulin signal. We changed the text to reflect this:
Line 189: “We found close apposition of the dispersed mitochondria to the axonemal tubulin in all 19 exflagellating males that were analyzed (Figure S4B, S4C).”
Line 237 to 239, please clarify why authors think there is one fragment in mitochondrial.
We have added the following sentence to clarify:
Line 239: “Segmentation of the fluorescent signal based on manual thresholding indicated that the mitochondrion consisted of one continuous structure.”
In line 259, the ookinete stage is II to IV.
Stage indications have been corrected.
In line 281, please define RBC.
Changed accordingly.
In figure 5A, please provide a scale bar for the original and reconstructed image. Should the unit of fragment volume be um3 but not um?
We have added scale bars to the original fluorescent images and the unit has been changed to mm3. Unfortunately, it is not really appropriate to provide a 2D scale bar with a 3D image, since this will not take the depth of your image into account, unless an orthographic projection is used. Objects that are more to the front are visualized slightly bigger than things in the back and therefore a scale bar would not help for interpreting the size of the depicted objects.
Can author do a statistical analysis in Fig 5B and 5C to show the stage at which the majority of nuclei and mitochondria divide?
Changed accordingly.
In figure 5D, the labels on Y axis are not the same size.
The two different sizes were used intentionally to show clearly it is a logarithmic instead of a linear scale.
In figure 6, what's the green black color organelle in the first column (like the organelle showing up as 4 in the first one, at 1/2/6/8 o'clock)? Can authors provide annotations of organelles using arrows at least in the supplementary?
We have added annotations of the RBC, food vacuole, rhoptries, parasite membrane and parasitophorous vacuole membrane to the micrograph images in Figure 6 and the Table S3.
In line 717, the font of ul is not consistent with others like line 691.
Changed accordingly
In line 731, 37 {degree sign}C.
Changed accordingly
Reviewer #2 (Significance (Required)):
The mitochondria of human malaria parasite Plasmodium falciparum differs from the host's and is an intriguing drug target. During the asexual blood stage replication, parasite mitochondrial elongates to form a branched network and undergoes rapid fissions to be distributed properly imto daughter merozoites. However, the details of these processes are unknown. In this study, authors use confocal microscopy and FIB-SEM to describe the dynamics of mitochondrial division in the asexual schizont stage, gametocytes and oocysts.
Reviewer #3 (Evidence, reproducibility and clarity (Required)):
Summary The authors developed a new reporter parasite line that can facilitates the study of mitochondria cell biology in sexual and asexual stages of Plasmodium falciparum. This strategy gets around the need for antibodies or MitoTracker, that could be toxic in some parasite stages. The authors further provided new insights into how mitochondria divide and interacts with both apicoplast and centriolar plaques (CPs) using informative and cutting-edge imaging. The study showed that mitochondria get segregated during cellular division in a cartwheel model and aligns with the apicoplast. Finally, they highlight a potential unique association between CPs and apicoplast in the later stages of schizogony that might contributes to apicoplast segregation.
Major comments: 1. The authors should provide a positive control in the form of another mitochondrial marker to validate that the signal provided by the fluorescent parasite is specific to mitochondria. They could try to tag a well-known mitochondria protein in the reported cell line and compare the signal using antibody stain.
Although we agree with the reviewer that a co-localization of the mitochondrial marker with a tagged mitochondrial protein would verify the mitochondrial localization of the marker, we do think that the co-localization with MitoTracker (Figure 1 and Figure S2) is a good validation method. MitoTracker is a widely used and accepted mitochondrial dye to stain mitochondria in Plasmodium species and other eukaryotes. We believe that the co-localization of our mitochondrial marker with several MitoTracker dyes is enough to prove mitochondrial localization.
There should be more rigour in the observations: the authors should provide quantification of how many parasites/fields were analysed and the percentage of observations described in Figure 2. Was this data consistent in different parasites/experiments? How many times were the experiment repeated?
To provide more rigor we have included a more detailed description of the number of experiments, the number of parasites imaged, and the percentage of parasites with the described observation:
Line 159: “For each stage, between 11-19 parasites were imaged over two independent experiments and described observations were consistent over all analyzed parasites.”
Line 181: “While this particular activation experiment was performed on a gametocyte culture that did not exflagellate for unclear reasons, it was repeated twice, and very similar results were found in exflagellating males (n=19) (Figure 2C).”
Line 189: “We found close apposition of the dispersed mitochondria to the axonemal tubulin in all 19 exflagellating males that were analyzed (Figure S4).”
More rigour is required also in the analysis of oocyst: what was the criteria to define 'large oocysts' (lines 241-242)? How many oocysts were analysed?
We have added estimated diameters of the oocyst to provide more defined criteria:
Line 238: “At day 7, small oocysts (~10 mm diameter) were observed with a branched mitochondrial network stretched out throughout the cell (Figure 3C).”
Line 241: “Day 10 oocysts were much larger (~35 mm diameter) and the mitochondrial mesh-like network appeared more organized, also localizing to areas directly below the oocyst wall (Figure 3D).”
Line 243: “Some large oocysts (~70 mm diameter) showed a highly organized mitochondrial network, where mitochondrial branches were organized in a radial fashion around a central organizational point (Figure 3E, S5A).”
Line 247: “Some smaller oocysts (~35 mm diameter) at day 13 showed structures that looked like beginning MOCs (Figure S5B).”
Finally figure 5 also lacks rigour: How were the fragments quantified? How many times were the experiment repeated? Is there any statistical difference in different parasite stages? To clarify how mitochondrial fragments were quantified, we added the following sentences to the materials and methods section:
Line 765: “3D visualization and quantifications were done in Arivis 4D Vision software. For mitochondrial measurements, threshold-based segmentation was used. For nuclei, blob-finder function was used for segmentation. Number of segmented objects and volume of objects was determined by Arivis software.”
The experiment was repeated twice, and the second independent experiment, which shows the same mitochondrial division stages, is added to the supplement (Figure S7). We added the following sentence to the text for clarification (Line 310):
“These mitochondrial division stages were confirmed in a second, independent 3D imaging experiment (Figure S7).”
Statistical analysis between different parasite stages was performed and added to Figure 5.
Minor comments: 1. Error bars in Fig S1. should be in a different colour from the line graph (eg. black or white).
Changing the color of the error bars made the figure less clear to interpret, due to their small size. We therefore decided to leave the image unaltered.
Scale bar in Fig 2D is missing.
As indicated in response to reviewer 2, unfortunately, it is not really appropriate to provide a 2D scale bar with a 3D image, since this will not take the depth of your image into account. That is, things that are more to the front are visualized slightly bigger than things in the back and therefore a scale bar would not help for interpreting the size of the depicted objects.
In Fig 4. a square dotted line should be placed to represent the GAP45 crop area.
Changed accordingly.
In Table S3 the authors should provide a colour legend and highlight mitochondria in the micrographs.
Color legend and annotations of RBC, food vacuole, rhoptries, parasite membrane and parasitophorous vacuole membrane have been added to the table.
Lines 282-286. The authors should try to hypothesize why MitoRed does not work for live imaging during schizogony
Despite several attempts to improve imaging conditions to prevent this, including, reduced laser power, increase time interval, better temperature control, and gassing of the imaging chamber with low oxygen mixed gas, parasites remained unhealthy. In the discussion, we hypothesize that the mitochondrial marker might cause parasites to be unhealthy due to phototoxicity.
In Fig. 6B parasite is misspelled
Changed accordingly.
Reviewer #3 (Significance (Required)):
Significance
The current paper provides a significant advance in the study of mitochondria cell biology in P. falciparum. The authors used a new strategy for mitochondria visualization that works well in most of parasite stages, enabling them to described in detail mitochondria and apicoplast division that can be used as guideline for future work. The limitation of this study, is a lack of mechanisms that might explain the reported observations, which leaves the discussion somewhat speculative.
-
-
Note: This preprint has been reviewed by subject experts for Review Commons. Content has not been altered except for formatting.
Learn more at Review Commons
Referee #3
Evidence, reproducibility and clarity
Summary
The authors developed a new reporter parasite line that can facilitates the study of mitochondria cell biology in sexual and asexual stages of Plasmodium falciparum. This strategy gets around the need for antibodies or MitoTracker, that could be toxic in some parasite stages. The authors further provided new insights into how mitochondria divide and interacts with both apicoplast and centriolar plaques (CPs) using informative and cutting-edge imaging. The study showed that mitochondria get segregated during cellular division in a cartwheel model and aligns with the apicoplast. Finally, they highlight a potential unique association between CPs and apicoplast in the later stages of schizogony that might contributes to apicoplast segregation.
Major comments:
- The authors should provide a positive control in the form of another mitochondrial marker to validate that the signal provided by the fluorescent parasite is specific to mitochondria. They could try to tag a well-known mitochondria protein in the reported cell line and compare the signal using antibody stain.
- There should be more rigour in the observations: the authors should provide quantification of how many parasites/fields were analysed and the percentage of observations described in Figure 2. Was this data consistent in different parasites/experiments? How many times were the experiment repeated?
- More rigour is required also in the analysis of oocyst: what was the criteria to define 'large oocysts' (lines 241-242)? How many oocysts were analysed?
- Finally figure 5 also lacks rigour: How were the fragments quantified? How many times were the experiment repeated? Is there any statistical difference in different parasite stages?
Minor comments:
- Error bars in Fig S1. should be in a different colour from the line graph (eg. black or white).
- Scale bar in Fig 2D is missing.
- In Fig 4. a square dotted line should be placed to represent the GAP45 crop area.
- In Table S3 the authors should provide a colour legend and highlight mitochondria in the micrographs.
- Lines 282-286. The authors should try to hypothesize why MitoRed does not work for live imaging during schizogony
- In Fig. 6B parasite is misspelled
Significance
The current paper provides a significant advance in the study of mitochondria cell biology in P. falciparum. The authors used a new strategy for mitochondria visualization that works well in most of parasite stages, enabling them to described in detail mitochondria and apicoplast division that can be used as guideline for future work.
The limitation of this study, is a lack of mechanisms that might explain the reported observations, which leaves the discussion somewhat speculative.
-
Note: This preprint has been reviewed by subject experts for Review Commons. Content has not been altered except for formatting.
Learn more at Review Commons
Referee #2
Evidence, reproducibility and clarity
During its development and growth, the human malaria parasite P. falciparum needs to guarantee that cellular organelles, including the mitochondrion and the apicoplast, will be divided and segregated correctly into the daughter parasites. However, the details and mechanisms of these processes are not clear. Here, authors provide a description of mitochondrial replication and segregation in P. falciparum schizonts, gametocytes and oocysts. They generated a reporter cell line by attaching mScarlet red fluorescent protein to the mitochondrial heat shock protein 70-3 and used high-resolution 3D-imaging and focused ion beam scanning electron microscopy to study mitochondrion dynamics in the asexual, gametocytes and mosquito stages. The authors found that in schizonts, the mitochondrion forms a cartwheel structure at the end of early segmentation stage with full division occurring only at a late stage of schizogony. Apicoplast division happens after nuclear division but is complete before nuclear division is completed. Authors also found apicoplast but not mitochondrion is associated with centriolar plaque (analogue of centrosome in P. falciparum) during the schizogony. At the end, authors proposed their model of nuclei, mitochondrial and apicoplast division in the asexual stage schizogony. This well-written manuscript provides insights on mitochondrion and apicoplast fission in P. falciparum blood stage schizogony and mitochondrion dynamic in the blood, gametocytes and mosquito stages. Questions and suggestions are below:
Major comments
The marker line forms mature oocysts but does not produce salivary gland sporozoites. This phenotype needs to be explained more clearly. Are sporozoites produced in the midgut, are they released into the hemocoel?
Does introduction of an exogenous copy of HSP70 influence total HSP70 expression in the parasite, and can this cause the observed defect in sporozoite production? Did authors try to tag the endogenous HSP70 to see if it's a suitable reporter?
Did authors compare the growth of the reporter parasite line to wild-type in gametocytes and oocysts? In figure 1A and Methods, are all MitoTracker stains incubated at 100 nM for 30 minutes? Did authors try to optimize the conditions to improve quality Mitotracker staining can be improved? In figure 1B, can authors replace the figures for the first ring? The parasite does not seem healthy and the scale bar is shorter than the others. Can authors define DIC in the legend? In figure 8, it looks like some apicoplasts are not associated with the CP, contrary to what is stated in the text, for eg the one at the 7 o'clock position in stage 3. The Discussion should mention the failure in generating sporozoites from this reporter line Can authors discuss the SIL7 locus as the site of integration, in the context of potential effect of its disruption on sporozoite production. Authors should explain criteria for identifying organelles in FIB-SEM images eg mitochondria, apicoplast etc. FIB-SEM images show other prominent organelles in these images (dense granules? hemozoin crystals?). It would be helpful for reader orientation and greater appreciation of the work if these organelles were marked as well.
Minor comments
The format of blood, mosquito and liver stage is not consistent. Eg. in line 17, 22, 56 and 65. Some has a dash line while some doesn't. In line 36, numbers of cases and death by malaria are by estimation. Can authors define Plasmodium falciparum as P. falciparum in line 37? The sentence in line 57-59 is confusing. At the end of schizogony, the daughter merozoite/sporozoite has one mitochondrion but it's multiple in the parasite. Can authors specify which mitochondrial dyes are toxic in line 76? In line 115, can authors indicate the Gene ID for PfNF54? Can authors define the reported parasite line as MitoRed here instead of line 125? In line 134 and 540, use punctate instead of 'punctuated'? In line 161 to 163, can authors also cite ref 19? In line 174, pH change can also trigger gametocytes activation. In Figure S4, please indicate the percentage of parasites having close apposition of mitochondrion to axonemes. Line 237 to 239, please clarify why authors think there is one fragment in mitochondrial. In line 259, the ookinete stage is II to IV. In line 281, please define RBC. In figure 5A, please provide a scale bar for the original and reconstructed image. Should the unit of fragment volume be um3 but not um? Can author do a statistical analysis in Fig 5B and 5C to show the stage at which the majority of nuclei and mitochondria divide? In figure 5D, the labels on Y axis are not the same size. In figure 6, what's the green black color organelle in the first column (like the organelle showing up as 4 in the first one, at 1/2/6/8 o'clock)? Can authors provide annotations of organelles using arrows at least in the supplementary? In line 717, the font of ul is not consistent with others like line 691. In line 731, 37 {degree sign}C.
Significance
The mitochondria of human malaria parasite Plasmodium falciparum differs from the host's and is an intriguing drug target. During the asexual blood stage replication, parasite mitochondrial elongates to form a branched network and undergoes rapid fissions to be distributed properly imto daughter merozoites. However, the details of these processes are unknown. In this study, authors use confocal microscopy and FIB-SEM to describe the dynamics of mitochondrial division in the asexual schizont stage, gametocytes and oocysts.
-
Note: This preprint has been reviewed by subject experts for Review Commons. Content has not been altered except for formatting.
Learn more at Review Commons
Referee #1
Evidence, reproducibility and clarity
This study investigates mitochondrial and apicoplast division and distribution during the life cycle of Plasmodium falciparum. Utilizing the MitoRed reporter line for fluorescent mitochondrial marking and employing high-resolution 3D imaging techniques, including FIB-SEM, the research unveils the dynamics of these essential organelles across various stages of the parasite's development. The authors' work marks a significant step forward in understanding the cellular biology of Plasmodium falciparum, offering novel insights into the dynamics of mitochondrial and apicoplast division. By addressing the additional comments and incorporating recent findings and clarifications, the research not only underscores the complexity of these processes but also situates the study within the continuum of apicomplexan parasite research.
Major comments:
- Suitability of Reporter Line for Oocyst Development: The conclusion regarding the limitations of the MitoRed line for oocyst development stages prompts a discussion on alternative approaches, such as mito trackers, to validate observations in these stages. In the current state, it is difficult to conclude whether the data presented are only true for this specific transgenic line.
- Analysis of Mitochondrion and Apicoplast Association with CPs: Could the author elaborate on how their statistical power and image data support assertions of random association between organelles and CPs (line 438-439) and the dynamic nature of Mito-CP interactions (line 504)? In addition, could the authors comment/discuss their findings regarding the distance between Mito-Api compared to the one reported in Figure S2 of Sun et al. preprint: bioRxiv 2022.09.14.508031; doi: https://doi.org/10.1101/2022.09.14.508031
- Incorporation of Recent Findings into Schematic Models: I recommend the authors modify their current model in Figure 8 to reflect on recent findings on CP outer domain contact with the parasite plasma membrane (PPM) post-mitosis as demonstrated by Liffner et al. PMID: 38108809.
Minor comments:
- Reference to WHO Report: The manuscript cites malaria incidence and mortality data from an older WHO report. Given the availability of the 2022 WHO reports, authors should update the text and citation (line 36).
- Clarification of Host: The term "its mitochondrion" (line 42) should be specified as "human mitochondrion" to clearly distinguish between the two different hosts.
- Terminology of Parasite Development Stages: The usage of "schizogony" to describe division processes in liver and mosquito stages could be misleading due to the distinct process of endopolygeny nuclear-like division observed during sporogony (line 56; PMID: 31805442). I would recommend the authors use a more general language, such as cell division.
- Prior Research on CP and Apicoplast Association: The observation of centriolar plaques (CPs) associating with the apicoplast (line 91) has precedents in the study of other apicomplexan parasites, such as Sarcosystis (PMID: 16079283). Acknowledging and discussing these findings would contextualize the current study within the broader range of the most commonly studied apicomplexan parasites.
- Depth of Imaging Data: Could the authors indicate the width of their z-stack, for instance, in Figure 1? I would also suggest the authors use hours of post-infection (h.p.i) for clarity (lines 234-254) to aid comprehension by a broader audience as they do later in the manuscript.
- Visualization of Mitochondrial Structures: Suggestions to include or reference images of bulbous mitochondrial structures (line 445) directly in the main text or within key figures (e.g., Figure 6) would help the reader understand what and where are these bulbous structures.
- Organelle Communication and Division Mechanisms: The discussion of bulbous invagination structures (buildings) (line 469) and their role in organelle division is interesting; could it be also for organelle communication or storage? Can the authors expand the discussion about it?
Significance
The study is a significant contribution to the field of parasitology, particularly in understanding the cellular biology of Plasmodium falciparum. The development of the MitoRed reporter line is a notable advancement, allowing for the real-time visualization of mitochondrial dynamics. This tool could be invaluable for future studies exploring parasite biology's intricacies and identifying new antimalarial drug targets. Furthermore, while the study provides detailed insights into the division and distribution of mitochondria and apicoplasts, the molecular mechanisms underlying these processes remain to be fully elucidated. Specifically, the role of specific proteins in mediating these divisions and the potential interplay between mitochondrial and apicoplast dynamics during parasite development warrant further investigation.
-
-
en.wikipedia.org en.wikipedia.org
-
A Space-based architecture (SBA) is an approach to distributed computing systems where the various components interact with each other by exchanging tuples or entries via one or more shared spaces.
Exchanging messages
Transition form Actor Model to Human Actor Models
from-"No to SQL? Anti-database movem…" (natishalom.typepad.com)
-
-
natishalom.typepad.com natishalom.typepad.com
-
Space Based Architecture (SBA). The Actor model that was introduced with new functional languages like Scala and Erlang is built into the SBA model, with the difference that in SBA, actors can share state and pass events by references, and thus avoid the overhead of copying the data with every transaction.
Space Based Architector (SBA)
-
“No to SQL? Anti-database movement gains steam”
No SQL Anti-(SQL)-databases
15 years later No Databse per se Anti-Database The Network became the computer
time for the Network to become the Datanse
-
-
www.radiofrance.fr www.radiofrance.fr
-
www.radiofrance.fr www.radiofrance.fr
-
jaimemonecolepublique.fr jaimemonecolepublique.fr
-
Il va de soi que toutes les actions prévues durant letemps scolaire sont obligatoires pour les élèves.Article D321-6« L'enseignant de la classe est responsable del'évaluation régulière des acquis de l'élève. Lesreprésentants légaux sont tenus périodiquementinformés des résultats et de la situation scolaire deleur enfant. Si l'élève rencontre des difficultésimportantes d'apprentissage, un dialogue renforcéest engagé avec ses représentants légaux au plustard à la fin du deuxième trimestre ou du premiersemestre et, le cas échéant, un dispositifd'accompagnement pédagogique estimmédiatement mis en place au sein de la classeL’échéance de la fin du deuxième trimestre ou dupremier semestre est fixée pour engager le dialoguerenforcé avec les représentants légaux sur lesdispositifs nécessaires à la prise en charge de ladifficulté de l’élève. Il est bien évident que lesenseignants n’attendent pas la fin du deuxièmetrimestre ou du premier semestre pour engager ledialogue avec les familles en cas de difficultésd’apprentissage d’un élève.Le conseil des maîtres devient décisionnaire enmatière de redoublement. Pour rappel, actuellement,
- les mesures de remédiations ne sont pas obligatoires, il faut que la famille l'accepte
- devoirs faits ne l'était pas non plus jusqu'à il y a peu
-
-
link-springer-com.soton.idm.oclc.org link-springer-com.soton.idm.oclc.org
-
游说者还试图影响法官的任命([ 33 , 34 ], 258),他们提交法庭之友简报[ 35 ],如果法官有可能修改不受欢迎的法律,他们会利用法院作为挑战政策的手段。当游说者以法庭之友的身份出现时,他们的目标就是司法程序,就像他们瞄准政策程序一样,试图将结果拉向他们的方向。如果他们想改变一项政策,他们就会参与进来,并主张任命具有相似政治偏好的法官,这些法官预计会以游说者认为有利的方式做出判决。这对民主意味着什么?如果法院始终如一地解释规范,则法官(例如最高法院或宪法法院)或单一法官(例如高级国家或州法院)的构成中存在强烈的意识形态偏见,可能会损害公民对执行平等分配权利的信任。特定经济或社会群体的青睐。
如何影响决策
-
-
www.biorxiv.org www.biorxiv.org
-
Author response:
The following is the authors’ response to the original reviews.
eLife assessment
This important study investigates the transcriptional changes in neurons that underlie loss of learning and memory with age in C. elegans, and how cognition is maintained in insulin/IGF-1-like signaling mutants. The presented evidence is convincing, utilizing a cutting-edge method to isolate neurons from worms for genomics that is clearly conveyed with a rigorous experimental approach. Overall, this study supports that older daf-2 worms maintain cognitive function via mechanisms that are unique from younger wild type worms, which will be of interest to neuroscientists and researchers studying ageing.
Thank you, we appreciate the positive comments.
Public Reviews:
Reviewer #1 (Public Review):
The authors perform RNA-seq on FACS-isolated neurons from adult worms at days 1 and 8 of adulthood to profile the gene expression changes that occur with cognitive decline. Supporting data are included indicating that by day 7 of adulthood, learning and memory are reduced, indicating that this time point or after represents cognitively aged worms. Neuronal identity genes are reduced in expression within cognitively aged worms, whereas genes involved in proteostasis, transcription/chromatin, and stress response are elevated. A number of specific examples are provided, representing markers of specific neuronal subtypes, and correlating expression changes to the erosion of particular functions (e.g. motor neurons, chemosensory neurons, aversive learning neurons, etc).
To investigate whether the upregulation of genes in neurons with age is compensatory or deleterious, the authors reduced the expression of a set of three significantly upregulated genes and performed behavioral assays in young adults. In each case, reduction of expression improved memory, consistent with a model in which age-associated increases impair neuronal function. This claim would be bolstered by an experiment elevating the expression of these genes in young neurons, which should reduce the learning index if the hypothesis is correct.
This is an interesting suggestion. Our long-term goal is to find ways to improve memory, and to better understand the “rules” that might govern changes with age. In this case, were interested in addressing the hypothesis that genes that rise with age must be compensatory, which is a frequently stated theory that is not often tested. Here we showed that knocking down three genes that are upregulated in aged animals improved memory; our results suggest that the wild-type functions of these genes are likely deleterious for learning and memory functions, and further, that their increased expression with age is not a compensatory function. Certainly for future work, it might be interesting to better understand how and why these specific genes have a deleterious function that increases with age, and whether that function is different in younger animals where they are not highly expressed.
The authors then characterize learning and memory in wild-type, daf-2, and daf-2/daf-16 worms with age and find that daf-2 worms have an extended ability to learn for approximately 10 days longer than wild types. This was daf-16 dependent. Memory was extended in daf-2 as well, and strikingly, daf-2;daf-16 had no short-term memory even at day 1. Transcriptomic analysis of FACS-sorted neurons was performed on the three groups at day 8. The authors focus their analysis on daf-2 vs. daf-2;daf-16 and present evidence that daf-2 neurons express a stress-resistance gene program. One question that remains unanswered is how well the N2 and daf-2;daf-16 correlate overall, and are there differences? This may be informative as wild type and daf-2;daf-16 mutants are not phenotypically identical when it comes to memory, and there may be differences that can be detected despite the overlap in the PCA. This analysis could reveal the daf-16 targets involved in memory.
Re. daf-2;daf-16 vs N2: This is a good suggestion. Our analysis in Fig. S5 showed that the daf-2 vs N2 comparison shows similar results with the daf-2 vs daf-16;daf-2 comparison, but some additional genes are differentially expressed. Interestingly, the daf-2 vs N2 comparison shows that the bZip transcription factors are upregulated in daf-2 compared with N2 worms (Fig. S6f). This may indicate that additional transcription factors are controlled by the daf-2 mutation in the nervous system in addition to the DAF-16/FOXO transcription factor.
Author response image 1.

We also identified the differentially expressed genes in the Day 8 neuronal daf-16;daf-2 to N2 comparison, as the reviewer is asking about. The samples from different genotypes do separate from one another in the PCA plot, indicating there are differences between daf-16,daf-2 and N2 neurons. However, the difference is smaller and there are fewer genes differentially expressed between daf-16;daf-2 and N2: only 38 genes are significantly higher in daf-16;daf-2, and only 53 genes are significantly higher in N2 (log2FC > 0.5, p-adj<0.05). The genes higher in N2 are enriched in endopeptidase inhibitors, and the genes higher in daf-16;daf-2 are not enriched in any gene ontology terms. These results indicate that there are some differences between daf-16;daf-2 and N2 neurons, which correlates with the behavioral differences we see, but the difference is small compared to daf-2 neurons. We have added these data to the paper (Fig. S4e,f); thank you for the suggestion.
The authors tested eight candidate genes that were more highly expressed in daf-2 neurons vs. daf-2;daf-16 and showed that reduction of 2 and 5 of these genes impaired learning and memory, respectively, in daf-2 worms. This finding implicates specific neuronal transcriptional targets of IIS in maintaining cognitive ability in daf-2 with age, which, importantly, are distinct from those in young wild type worms.
Reviewer #2 (Public Review):
Weng et al. perform a comprehensive study of gene expression changes in young and old animals, in wild-type and daf-2 insulin receptor mutants, in the whole animal, and specifically in the nervous system. Using this data, they identify gene families that are correlated with neuronal ageing, as well as a distinct set of genes that are upregulated in neurons of aged daf-2 mutants. This is particularly interesting as daf-2 mutants show both extended lifespans and healthier neurons in aged animals, reflected by better learning/memory in older animals compared with wild-type controls. Indeed, the knockdown of several of these upregulated genes resulted in poorer learning and memory. In addition, the authors showed that several genes upregulated during ageing in wild-type neurons also contribute to learning and memory; specifically knockdown of these genes in young animals resulted in improved memory. This indicates that (at least in this small number of cases), genes that show increased transcript levels with age in the nervous system somehow suppress memory, potentially by having damaging effects on neuronal health.
Finally, from a resource perspective, the neuronal transcriptome provided here will be very useful for C. elegans researchers as it adds to other existing datasets by providing the transcriptome of older animals (animals at day 8 of adulthood) and demonstrating the benefits of performing tissue-specific RNAseq instead of whole-animal sequencing.
Thank you!
The work presented here is of high quality and the authors present convincing evidence supporting their conclusions.
Thanks!
I only have a few comments/suggestions:
(1) Do the genes identified to decrease learning/memory capacity in daf-2 animals (Figure 4d/e) also impact neuronal health? daf-2 mutant worms show delayed onset of age-related changes to neuron structure (Tank et al., 2011, J Neurosci). Does knockdown of the genes shown to affect learning also affect neuron structure during ageing, potentially one mechanism through which they modulate learning/memory?
Thank you for this suggestion, which would be good for a future direction, particularly for genes that might have some relationship to previously-identified cellular structural process. The genes we tested here include dod-24, alh-2, mtl-1, F08H9,4, C44B7.5, hsp-12.3, hsp-12.6, and cpi-1, which are related to stress response, proteolysis inhibitor, metabolic, and innate immunity GO categories, thus associated with stress resistance, proteolysis, lipid metabolism processes; none are obvious choices for morphological effects.
However, it is worth noting that learning and memory decline much faster (Days 4-8) than morphological differences are observed (generally after Day 12-15). Moreover, those morphological differences have been studied primarily in mechanosensory neurons (touch neurons) rather than the chemosensory neurons that are involved in learning and memory, so additional genes may be required for those differences that we were not focusing on in thisi study.
(2) The learning and memory assay data presented in this study uses the butanone olfactory learning paradigm, which is well established by the same group. Have the authors tried other learning assays when testing for learning/memory changes after the knockdown of candidate genes? Depending on the expression pattern of these genes, they may have more or less of an effect on olfactory learning versus for example gustatory or mechanosensory-based learning.
The reason that we use the butanone olfactory learning paradigm is because it is more similar to learning of information (neutral odorant association with positive cue (food)) – the kind of memory we would like to preserve in humans - rather than a stress-induced memory, such as starvation or pathogenesis-associated aversive learning paradigms, which are more like PTSD. (There is likely to be quite a bit of overlap in mechanism, however, including the role of genes such as magi-1 and casy-1, so it would not be surprising if many of these genes also were required for other learning paradigms.)
(3) I have a comment on the 'compensatory vs dysregulatory' model as stated by the authors on page 7. I understand that this model presents the two main options, but perhaps this is slightly too simplistic: the gene expression that rises during ageing may be detrimental for memory (= dysregulatory), but at the same time may also be beneficial for other physiological roles in other tissues (=compensatory).
This is a good point, and we made the clarification that in the text: “There may be other scenarios in which a gene with multiple functions may be detrimental for some behaviors but beneficial for other physiological roles.”
Reviewer #3 (Public Review):
Summary:
In this manuscript, Weng et al. detect a neuron-specific transcriptome that regulates aging. The authors first profile neuron-specific responses during aging at a time point where a loss in memory function is present. They discover signatures unique to neurons which validate their pipeline and reveal the loss of neuron identity with age. For example, old neurons reduce the expression of genes related to synaptic function and neuropeptide signaling and increase the expression of chromatin regulators, insulin peptides, and glycoproteins. The authors discover the detrimental effect of selected upregulated genes (utx-1, ins-19, and nmgp-1) by knocking them down in the whole body and detecting improvement of short memory functions. They then use their pipeline to test neuronal profiles of long-lived insulin/IGF mutants. They discover that genes related to stress response pathways are upregulated upon longevity (e.g. dod-24, F08H9.4) and that they are required for improved neuron function in long-lived individuals.
Strengths:
Overall, the manuscript is well-written, and the experiments are well-described. The authors take great care to explain their reasoning for performing experiments in a specific way and guide the reader through the interpretation of the results, which makes this manuscript an enjoyable and interesting read. Using neuron-specific transcriptomic analysis in aged animals the authors discover novel regulators of learning and memory, which underlines the importance of cell-specific deep sequencing. The time points of the transcriptomic profiling are elegantly chosen, as they coincide with the loss of memory and can be used to specifically reveal gene expression profiles related to neuron function. The authors showcase on the dod-24 example how powerful this approach is. In long-lived insulin/IGF-1 receptor mutants body-wide dod-24 expression differs from neuron-specific profiles. Importantly, the depletion of dod-24 has an opposing effect on lifespan and learning memory. The dataset will provide a useful resource for the C. elegans and aging community.
Thank you, we do hope people will find the data useful.
Weaknesses:
While this study nicely describes the neuron-specific profiles, the authors do not test the relevance in a tissue-specific way. It remains unclear if modifying the responses only in neurons has implications for either memory or potentially for lifespan. The authors point to this in the text and refer to tissue-specific datasets. However, it is possible that the tissue-specific profile changes with age. The authors should consider mining publicly available cell-specific aging datasets and performing neuron-specific RNAi to test the functional relevance of the neuron-specific response. This would strengthen the importance of cell-specific profiling.
Thank you for your suggestions. As we have mentioned in the text, our candidate genes are either (1) only expressed in the neurons (alh-2 and F08H9.4), or they are only more highly expressed in daf-2 compared to wild type only in the nervous system (C44B7.5 or dod-24). Thus, the effect we see from knocking down these genes in daf-2 are likely neuron-specific. Additionaly, we performed our assays with neuron-sensitive RNAi strain CQ745: daf-2(e1370) III; vIs69 [pCFJ90(Pmyo-2::mCherry + Punc-119::sid-1)] V. It has been previously shown that neuronal expression of sid-1 decreases non-neuronal RNAi, suggesting that neurons expressing transgenic sid-1(+) served as a sink for dsRNA (Calixto et al., 2010). Thus, this neuron-sensitive RNAi is likely neuron-specific and our results is unlikely from knocking down these genes in non-neuronal tissues. However, we do acknowledge this issue.
To identify the expression pattern of these genes in a more cell-specific way in the adults, we examined the expression of our candidate genes that affected learning and memory, namely dod-24, F08H9.4, C44B7.9, alh-2, and mtl-1, in the Calico database (Roux et al., 2023). From that database, we can see that dod-24 is mainly expressed in the PHC and PVM neurons, and F08H9.4 is largely expressed in various neurons. Both have only slight expression outside the nervous system. C44B7.5 and mtl-1 are more broadly expressed, but C44B7.5 was not found to be differentially expressed in other tissues in daf-2, and mtl-1 only had a slight effect on learning and memory. Perhaps due to their sequencing depth and detection limit, Roux et al. didn’t detect alh-2 expression anywhere in their data.
Thus, the neuron-specific expression and daf-2 differential expression pattern of these genes indicate that the learning and memory improvement in aged daf-2 is unlikely due to neuronal non-autonomous effects.
To better address this concern (that for the genes that we found only expressed in the neurons, the neuron-confined expression may change with age) we examined the expression pattern change of these genes with age. As is shown below, from the Calico database, we can see that the expression in the nervous system persists, and even slightly increases, with age, thus age-related expression pattern change is not a concern to our analysis.
Author response image 2.

Author response image 3.

Recommendations for the authors:
Reviewer #1 (Recommendations For The Authors):
Most of my comments are in the public section. A few additional recommendations for the authors regarding the formatting/presentation:
The presentation of Figure S6e-h in the introduction is somewhat confusing and feels out of order. If presented first, it should be S1. Otherwise, discussion of this figure should go at the end of the results section or in the discussion if appropriate.
Thank you for pointing this out. We have moved the discussion of this figure to the Discussion section.
I do not see Figure S5 described in the text.
Good catch, thank you. We have added the descriptions for Figure S5 in the text.
In general, check the figures, figure legends, and how they are referenced in the text, particularly the supplemental figures and legends.
Minor comments:
There is a typo in the Figure 4 legend: Neuronal IIX should be IIS.
Thanks for pointing this out. We have corrected it in the text.
Reviewer #2 (Recommendations For The Authors):
• There are multiple instances throughout the manuscript where there are statements in brackets that provide justification or explanation for some of the approaches used. There is no reason for 'side note' brackets to be used. I suggest removing them and incorporating these statements into the narrative.
Thank you, we have now incorporated these points into the main text.
• Introduction: page 4 "here we RNA-sequenced FACS-isolated neurons" should be "here we performed RNA sequencing on FACS-isolated neurons...".
Thank you, we have changed the text accordingly.
• Figure 2A: I do not understand the legend for this panel "Tissue Query for wild-type genes expressed at higher levels in aged worms show lower nervous system and neuron prediction score." Please clarify.
We have clarified the Figure 2A legend:
(A) Tissue prediction score for wild-type genes expressed at higher levels in aged worms.
• Page 8: "We previously observed that loss of single genes that play a role in complex behaviors like learning and memory can have a large impact on function 60, unlike the additive roles of longevity-promoting genes 11." - a large impact on what function?
Thank you for noting, we have clarified it in the text accordingly:
“We previously observed that for genes that play a role in complex behaviors like learning and memory, the loss of single genes can have a large impact on these complex behaviors 60, unlike the additive roles of longevity-promoting genes 11.”
• Next line "Therefore, one mechanism by which wild-type worms lose their function with age..." - again, what function?
Thank you for noting this, we have clarified the text to say we refer to the learning and memory functions.
• Page 9: "Thus, daf-2 mutants maintain their higher cognitive quality of life longer than wild-type worms, while daf-16;daf-2 mutants spend their whole lives without memory ability (Figure 3d), in contrast to claims that daf-2 mutants are less healthy than wild-type or daf-16 worms23." - since ref 23 did not perform any learning/memory tests, the definition of 'health' in ref 23 is different to 'cognitive health' as studied here. So the findings in this study are not 'in contrast' to ref 23 but rather add to these findings.
Learning and memory ability is an important function for a healthy individual, thus we would assert that indeed, cognitive health is an important part of the “health” of daf-2 worms. In ref 23, Bansal et al. claim that daf-2 worms are less healthy without assessing their learning and memory ability; their lack of data is an insufficient reason for us to remove our statement, as cognitive health is part of healthspan. Here we find that the “learning span” of daf-2 lasts at least proportionally if not longer than that of wild type. We have also previously shown that daf-2 worms also have longer maximum velocity span with age (Hahm et al., 2015), in direct contrast with Bansal et al.’s claim that daf-2 worms move less well and thus are less healthy – daf-2 worms simply stop sooner when presented with food and switch to feeding, due to their higher odr-10 levels. The Bansal paper continues to be frequently cited as finding that daf-2 mutants are less healthy than wild type, a claim for which we can still find no experimental evidence to support. Therefore, it is important that we make the point that daf-2 worms have extended cognitive health, which is part of health span.
• Page 13: I feel like the sentence "Furthermore, memory maintenance with age might require additional functions that were not previously uncovered in analyses of young animals" is both vague (what functions are referred to?) and a little bit obvious (obvious that age-related changes would not be revealed in analyses of young animals). Perhaps rephrase to make the desired point clearer?
We have clarified the sentence in the text:
“Furthermore, memory maintenance with age might require additional genes that function in promoting stress resistance and neuronal resilience, which were not previously uncovered in analyses of young animals.”
-
eLife assessment
This fundamental study investigates the transcriptional changes in neurons that underlie loss of learning and memory with age in C. elegans, and how cognition is maintained in insulin/IGF-1-like signaling mutants. The presented evidence is compelling, utilizing a cutting-edge method to isolate neurons from worms for genomics that is clearly conveyed with a rigorous experimental approach. Overall, this study supports that older daf-2 worms maintain cognitive function via mechanisms that are unique from younger wild type worms, which will be of great interest to neuroscientists and researchers studying ageing.
-
Reviewer #1 (Public Review):
The authors perform RNA-seq on FACS isolated neurons from adult worms at days 1 and 8 of adulthood to profile the gene expression changes that occur with cognitive decline. Supporting data are included indicating that by day 7 of adulthood, learning and memory are reduced, indicating that this timepoint or after represents cognitively aged worms. Neuronal identity genes are reduced in expression within the cognitively aged worms, whereas genes involved in proteostasis, transcription/chromatin, and the stress response are elevated. A number of specific examples are provided, representing markers of specific neuronal subtypes, and correlating expression changes to the erosion of particular functions (e.g. motor neurons, chemosensory neurons, aversive learning neurons, etc).
To investigate whether upregulation of genes in neurons with age is compensatory or deleterious, the authors reduced expression of a set of three significantly upregulated genes and performed behavioral assays in young adults. In each case, reduction of expression improved memory, consistent with a model in which age-associated increases impair neuronal function.
The authors then characterize learning and memory in wild type, daf-2, and daf-2/daf-16 worms with age and find that daf-2 worms have an extended ability to learn for approximately 10 days longer that wild types. This was daf-16 dependent. Memory was extended in daf-2 as well, and strikingly, daf-2;daf-16 had no short term memory even at day 1. Transcriptomic analysis of FACS-sorted neurons was performed on the three groups at day 8. The authors focus their analysis on daf-2 vs. daf-2;daf-16 and present evidence that daf-2 neurons express a stress-resistance gene program. They also find small differences between the N2 and daf-2;daf-16 neurons, which correlate with the observed behavioral differences, though these differences are modest.
The authors tested eight candidate genes that were more highly expressed in daf-2 neurons vs. daf-2;daf-16 and showed that reduction of 2 and 5 of these genes impaired learning and memory, respectively, in daf-2 worms. This finding implicates specific neuronal transcriptional targets of IIS in maintaining cognitive ability in daf-2 with age, which, importantly, are distinct from those in young wild type worms.
Overall, this is a strong study with rigorously performed experiments. The authors achieved their aim of identifying transcriptional changes in neurons that underlie loss of learning and memory in C. elegans, and how cognition is maintained in insulin/IGF-1-like signaling mutants.
-
Reviewer #2 (Public Review):
Weng et al. perform a comprehensive study of gene expression changes in young and old animals, in wild-type and daf-2 insulin receptor mutants, in the whole animal and specifically in the nervous system. Using this data, they identify gene families that are correlated with neuronal ageing, as well as a distinct set of genes that are upregulated in neurons of aged daf-2 mutants. This is particularly interesting as daf-2 mutants show both extended lifespan and healthier neurons in aged animals, reflected by better learning/memory in older animals compared with wild-type controls. Indeed, knockdown of several of these upregulated genes resulted in poorer learning and memory. In addition, the authors showed that several genes upregulated during ageing in wild-type neurons also contribute to learning and memory; specifically, knockdown of these genes in young animals resulted in improved memory. This indicates that (at least in this small number of cases), genes that show increased transcript levels with age in the nervous system somehow suppress memory, potentially by having damaging effects on neuronal health.
Finally, from a resource perspective, the neuronal transcriptome provided here will be very useful for C. elegans researchers as it adds to other existing datasets by providing the transcriptome of older animals (animals at day 8 of adulthood) and demonstrating the benefits of performing tissue-specific RNAseq instead of whole-animal sequencing.
The work presented here is of high quality and the authors present convincing evidence supporting their conclusions. I only have a few comments/suggestions:
(1) Do the genes identified to decrease learning/memory capacity in daf-2 animals (Figure 4d/e) also impact neuronal health? daf-2 mutant worms show delayed onset of age-related changes to neuron structure (Tank et al., 2011, J Neurosci). Does knockdown of the genes shown to affect learning also affect neuron structure during ageing, potentially one mechanism through which they modulate learning/memory?
(2) The learning and memory assay data presented in this study uses the butanone olfactory learning paradigm, which is well established by the same group. Have the authors tried other learning assays when testing for learning/memory changes after knockdown of candidate genes? Depending on the expression pattern of these genes, they may have more or less of an effect on olfactory learning versus for e.g. gustatory or mechanosensory-based learning.
(3) A comment on the 'compensatory vs dysregulatory' model as stated by the authors on page 7 - I understand that this model presents the two main options, but perhaps this is slightly too simplistic: gene expression that rises during ageing may be detrimental for memory (= dysregulatory), but at the same time may also be beneficial other physiological roles in other tissues (=compensatory).
Comments on revised version:
I am satisfied with how the authors have addressed all my comments/suggestions.
-
Reviewer #3 (Public Review):
Summary
In this manuscript, Weng et al. identify the neuron specific transcriptome that impacts age dependent cognitive decline. The authors design a pipeline to profile neurons from wild type and long-lived insulin receptor/IGF-1 mutants using timepoints when memory functions are declining. They discover signatures unique to neurons which validates their approach. The authors identify that genes related to neuronal identity are lost with age in wild type worms. For example, old neurons reduce the expression of genes linked to synaptic function and neuropeptide signaling and increase the expression of chromatin regulators, insulin peptides and glycoproteins. Depletion of selected genes which are upregulated in old neurons (utx-1, ins-19 and nmgp-1) leads to improved short memory function. This indicates that some genes that increase with age have detrimental effects on learning and memory. The pipeline is then used to test neuronal profiles of long-lived insulin/IGF-1 daf-2 mutants. Genes related to stress response pathways are upregulated in long lived daf-2 mutants (e.g. dod-24, F08H9.4) and those genes are required for improved neuron function.
Strengths
The manuscript is well written, and the experiments are well described. The authors take great care to explain their reasoning for performing experiments in a specific way and guide the reader through the interpretation of the results, which makes this manuscript an enjoyable and interesting read. The authors discover novel regulators of learning and memory using neuron-specific transcriptomic analysis in aged animals, which underlines the importance of cell specific deep sequencing. The timepoints of the transcriptomic profiling are elegantly chosen, as they coincide with the loss of memory and can be used to specifically reveal gene expression profiles related to neuron function. The authors discuss on the dod-24 example how powerful this approach is. In daf-2 mutants whole-body dod-24 expression differs from neuron specific profiles, which underlines the importance of precise cell specific approaches. This dataset will provide a very useful resource for the C. elegans and aging community as it complements existing datasets with additional time points and neuron specific deep profiling.
Weakness
This study nicely describes the neuron specific profiles of aged long-lived daf-2 mutants. Selected neuronal genes that were upregulated in daf-2 mutants (e.g. F08H9.4, mtl-1, dod-24, alh-2, C44B7.5) decreased learning/memory when knocked down. However, the knock down of these genes was not specific to neurons. The authors use a neuron-sensitive RNAi strain to address this concern and acknowledge this caveat in the text. While it is likely that selected candidates act only in neurons it is possible that other tissues participate as well.
-
-
www.thebernician.net www.thebernician.net
-
The Bernician In Voluntary Association I Trust
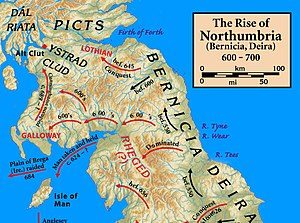
-
-
-
Résumé de la vidéo [00:00:00][^1^][1] - [00:25:59][^2^][2]:
Cette vidéo présente une conférence sur le thème "Vivre son adolescence dans un monde en crise", organisée par la CAF de la Vienne. Le modérateur, Romain Mudrac, introduit la soirée et annonce que le Professeur Ludovic Jquel, expert en psychiatrie de l'enfant et de l'adolescent, donnera une conférence de 45 minutes suivie d'une session de questions-réponses. Le président du conseil d'administration de la CAF, Omar MBA, souligne l'importance de soutenir les adolescents dans une société incertaine. Le Professeur Jquel discute ensuite des défis de l'adolescence, de la puberté, et de l'impact des crises mondiales sur les jeunes.
Points forts: + [00:00:00][^3^][3] Introduction de la conférence * Présentation du thème et des intervenants * Importance de l'adolescence dans le développement * Objectif de la soirée : réflexion et échange + [00:06:00][^4^][4] Intervention du Professeur Jquel * Discussion sur la fabrication d'un adolescent * Impact des crises mondiales sur les jeunes * Importance de comprendre et d'accompagner les adolescents + [00:14:27][^5^][5] La puberté et ses défis * Changements corporels et psychologiques * Différences entre les filles et les garçons * Gestion de l'image corporelle et de l'estime de soi + [00:22:19][^6^][6] Alimentation et adolescence * Influence des habitudes alimentaires sur la santé * Rôle de l'industrie alimentaire dans les choix des adolescents * Conseils pour une alimentation équilibrée pendant la croissance Résumé de la vidéo [00:26:00][^1^][1] - [00:51:34][^2^][2]:
Cette vidéo explore les défis de l'adolescence dans un monde en crise, en se concentrant sur les bouleversements corporels et neurologiques que les adolescents subissent. Elle aborde la manière dont ces changements influencent leur comportement, leur identité et leur interaction avec la société.
Points forts: + [00:26:00][^3^][3] Les changements physiques * Croissance et différences individuelles * Harcèlement lié à la stigmatisation de la différence * Métamorphose corporelle et sentiment d'être disproportionné + [00:31:03][^4^][4] Développement neurologique * Amélioration de la vitesse de transmission nerveuse * Élagage neuronal et instabilité émotionnelle * Maturité du cortex préfrontal vers 25 ans + [00:39:01][^5^][5] Influence de l'environnement social * Impact des stimulations et expositions environnementales * Évolution des vulnérabilités et des symptômes * Effets des réseaux sociaux et de la technologie sur les adolescents + [00:45:41][^6^][6] Conséquences de l'évolution sociétale * Exposition précoce aux écrans et sites pornographiques * Changements dans les structures familiales * Importance de l'individualité et du groupe pendant l'adolescence Résumé de la vidéo [00:51:36][^1^][1] - [01:18:50][^2^][2]:
Cette vidéo explore les défis de l'adolescence dans un monde en crise, en mettant l'accent sur la relation entre les adolescents et leurs parents, la gestion des émotions, et l'impact des technologies et des médias sociaux sur le développement des jeunes.
Points forts: + [00:51:36][^3^][3] Les marques et la pression sociale * Les adolescents subissent la pression des marques et des coûts associés * La relation parent-enfant peut être affectée par ces pressions * Les parents doivent naviguer dans ces défis tout en soutenant leurs enfants + [00:55:14][^4^][4] La distance émotionnelle à l'adolescence * L'adolescence transforme les parents autant que les adolescents * La nécessité de l'indépendance crée une tension émotionnelle * Les adolescents ont besoin de leurs parents tout en cherchant à s'en détacher + [01:00:19][^5^][5] La créativité et la destructivité chez les adolescents * Les adolescents possèdent une créativité et une destructivité notables * Trouver un équilibre entre ces deux aspects est crucial * Les parents doivent encourager la créativité tout en gérant les comportements destructeurs + [01:07:39][^6^][6] L'impact des écrans et des médias sociaux * Les écrans occupent une place importante dans la vie des adolescents * Les parents doivent comprendre l'usage des écrans et ne pas diaboliser la technologie * Il est essentiel d'équilibrer le temps passé devant les écrans avec d'autres activités Résumé de la vidéo [01:18:53][^1^][1] - [01:45:14][^2^][2]:
La vidéo aborde les défis auxquels sont confrontés les adolescents dans un monde en crise, en se concentrant sur l'impact des technologies et des médias sociaux sur leur développement et leur bien-être. Elle souligne la distorsion de la réalité causée par les images retouchées et les attentes irréalistes, ainsi que les effets néfastes de l'exposition précoce à la pornographie et à la sexualité violente. Le conférencier discute également des troubles de l'adaptation et des troubles structurels chez les adolescents, et présente des stratégies pour aborder ces problèmes avec eux.
Points saillants: + [01:19:00][^3^][3] Impact des médias sociaux * Distorsion de la réalité et attentes irréalistes * Effets sur l'identification et l'imitation * Influence sur l'image de soi et la perception des autres + [01:20:10][^4^][4] Exposition à la pornographie * Accès précoce et fréquent via les smartphones * Contenus violents et impact sur le développement psychosexuel * Risque de passage à l'acte et de troubles du comportement + [01:26:01][^5^][5] Santé mentale des adolescents * Répartition des adolescents selon leur bien-être * Présentation des troubles adaptatifs et structurels * Importance de comprendre la logique du développement pour le soin + [01:37:46][^6^][6] Filtrage parental et éducation * Rôle des parents comme filtre face aux stimulis environnementaux * Difficultés liées à l'insécurité et à l'angoisse actuelles * Importance de la communication et de la vérification des informations Résumé de la vidéo [01:45:15][^1^][1] - [02:10:46][^2^][2]:
Cette partie de la vidéo aborde les défis de l'adolescence dans un monde en crise, en mettant l'accent sur l'impact des médias sociaux et la nécessité d'un libre arbitre éclairé. L'intervenant discute de la manière dont les plateformes comme TikTok influencent les jeunes, souvent de manière prédatrice, exploitant leur vulnérabilité. Il souligne l'importance du rôle parental dans la communication et la critique constructive pour aider les adolescents à naviguer dans cet environnement numérique complexe. La vidéo explore également les concepts de l'effort et de l'individualisme dans la société contemporaine, ainsi que les défis liés au logement et à l'emploi qui prolongent la période de l'adolescence.
Points saillants: + [01:45:15][^3^][3] L'impact des médias sociaux * Influence des plateformes comme TikTok * Vulnérabilité et exploitation des adolescents * Importance de l'éducation au libre arbitre + [01:52:02][^4^][4] Le rôle des parents * Communication et lien avec les adolescents * Encouragement de la pensée critique * Adaptation de la parentalité à l'environnement numérique + [01:57:01][^5^][5] Les défis sociétaux * Crise de l'emploi et problèmes de logement * Prolongation de l'adolescence * Nécessité d'accompagnement et de soutien + [02:01:12][^6^][6] La société et l'individualisme * Évolution du concept d'effort * Individualisme et compétition sociale * Importance de la créativité et de l'espérance Résumé de la vidéo [02:10:49][^1^][1] - [02:19:36][^2^][2] : La vidéo aborde la vie des adolescents dans un monde en crise, en mettant l'accent sur l'importance de l'adaptation aux nouvelles technologies et l'optimisme face aux défis. Elle souligne la nécessité d'une approche préventive en psychiatrie de l'enfant et de l'adolescent, l'importance de la communication et de l'implication des adolescents dans leur développement, et le rôle essentiel des relations humaines.
Points forts : + [02:10:49][^3^][3] Adaptation aux nouvelles technologies * Importance de l'apprivoisement des technologies * Utilité de l'intelligence artificielle en psychiatrie * Approches modélisantes complexes en psychiatrie + [02:12:02][^4^][4] Approche préventive en psychiatrie * Prévention et intervention précoces * Dépistage précoce des troubles psychiatriques * Importance de ne pas développer les troubles + [02:13:46][^5^][5] Communication avec les adolescents * Encouragement des échanges entre parents et adolescents * Adaptation du message et de la communication * Implication des adolescents dans leur développement + [02:16:39][^6^][6] Rôle des relations humaines * Défis posés par les réseaux sociaux et les interactions numériques * Nécessité de la valeur ajoutée parentale face au numérique * Importance de l'expérience et de l'esprit critique en éducation
-
-
mariellelassche.nl mariellelassche.nl
-
Dit spel van veraf en dichtbij speelt de Franse Rococoschilder Jean-Antoine Watteau (1684-1721) ook met de toeschouwer. Bij hem gaat het echter niet om het mythologische verhaal op zich. Zijn eiland is een metafoor in een allegorie op de liefde. We zien een paradijselijke scene waarin verliefde stelletjes alleen nog maar aandacht hebben voor elkaar
-
Een eiland kunnen we alleen bereiken over het water of door de lucht. We gaan van de ene wereld naar de ander waardoor we een gevoel van afstand ervaren, zelfs als we het al aan de overkant zien liggen. Dat is net als met de liefde: soms heel dichtbij, maar gevoelsmatig ver weg of zelfs onbereikbaar
An island can be symbolic for something that is within reach, but not quite so. It is an idyllic representation. Love, as well.
-
Volgens een populaire legende was het de geboorteplaats van Afrodite.
-
Een pelgrimstocht naar het eiland Cythera
-
-
trustoverip.github.io trustoverip.github.io
-
Without the entropy provided the UUID, u, field, an adversary may be able to reconstruct the block contents merely from the SAID of the block and the Schema of the block using a rainbow or dictionary attack on the set of field values allowed by the Schema
I.e., knowing a schema makes it possible to derive content from its hash.
-
-
www.theguardian.com www.theguardian.com
-
-
github.com github.com
-
A preconfigured instance which allows developers to "test drive" OrbitDB.
test drive OrbitDB
-
-
www.theguardian.com www.theguardian.com
-
-
www.biorxiv.org www.biorxiv.org
-
Author response:
The following is the authors’ response to the original reviews.
Public Reviews:
Reviewer #1 (Public Review):
Summary:
Protein conformational changes are often critical to protein function, but obtaining structural information about conformational ensembles is a challenge. Over a number of years, the authors of the current manuscript have developed and improved an algorithm, qFit protein, that models multiple conformations into high resolution electron density maps in an automated way. The current manuscript describes the latest improvements to the program, and analyzes the performance of qFit protein in a number of test cases, including classical statistical metrics of data fit like Rfree and the gap between Rwork and Rfree, model geometry, and global and case-by-case assessment of qFit performance at different data resolution cutoffs. The authors have also updated qFit to handle cryo-EM datasets, although the analysis of its performance is more limited due to a limited number of high-resolution test cases and less standardization of deposited/processed data.
Strengths:
The strengths of the manuscript are the careful and extensive analysis of qFit's performance over a variety of metrics and a diversity of test cases, as well as the careful discussion of the limitations of qFit. This manuscript also serves as a very useful guide for users in evaluating if and when qFit should be applied during structural refinement.
Reviewer #2 (Public Review):
Summary
The manuscript by Wankowicz et al. describes updates to qFit, an algorithm for the characterization of conformational heterogeneity of protein molecules based on X-ray diffraction of Cryo-EM data. The work provides a clear description of the algorithm used by qFit. The authors then proceed to validate the performance of qFit by comparing it to deposited X-ray entries in the PDB in the 1.2-1.5 Å resolution range as quantified by Rfree, Rwork-Rfree, detailed examination of the conformations introduced by qFit, and performance on stereochemical measures (MolProbity scores). To examine the effect of experimental resolution of X-ray diffraction data, they start from an ultra high-resolution structure (SARS-CoV2 Nsp3 macrodomain) to determine how the loss of resolution (introduced artificially) degrades the ability of qFit to correctly infer the nature and presence of alternate conformations. The authors observe a gradual loss of ability to correctly infer alternate conformations as resolution degrades past 2 Å. The authors repeat this analysis for a larger set of entries in a more automated fashion and again observe that qFit works well for structures with resolutions better than 2 Å, with a rapid loss of accuracy at lower resolution. Finally, the authors examine the performance of qFit on cryo-EM data. Despite a few prominent examples, the authors find only a handful (8) of datasets for which they can confirm a resolution better than 2.0 Å. The performance of qFit on these maps is encouraging and will be of much interest because cryo-EM maps will, presumably, continue to improve and because of the rapid increase in the availability of such data for many supramolecular biological assemblies. As the authors note, practices in cryo-EM analysis are far from uniform, hampering the development and assessment of tools like qFit.
Strengths
qFit improves the quality of refined structures at resolutions better than 2.0 A, in terms of reflecting true conformational heterogeneity and geometry. The algorithm is well designed and does not introduce spurious or unnecessary conformational heterogeneity. I was able to install and run the program without a problem within a computing cluster environment. The paper is well written and the validation thorough.
I found the section on cryo-EM particularly enlightening, both because it demonstrates the potential for discovery of conformational heterogeneity from such data by qFit, and because it clearly explains the hurdles towards this becoming common practice, including lack of uniformity in reporting resolution, and differences in map and solvent treatment.
Weaknesses
The authors begin the results section by claiming that they made "substantial improvement" relative to the previous iteration of qFit, "both algorithmically (e.g., scoring is improved by BIC, sampling of B factors is now included) and computationally (improving the efficiency and reliability of the code)" (bottom of page 3). However, the paper does not provide a comparison to previous iterations of the software or quantitation of the effects of these specific improvements, such as whether scoring is improved by the BIC, how the application of BIC has changed since the previous paper, whether sampling of B factors helps, and whether the code faster. It would help the reader to understand what, if any, the significance of each of these improvements was.
Indeed, it is difficult (embarrassingly) to benchmark against our past work due to the dependencies on different python packages and the lack of software engineering. With the infrastructure we’ve laid down with this paper, made possible by an EOSS grant from CZI, that will not be a problem going forward. Not only is the code more reliable and standardized, but we have developed several scientific test sets that can be used as a basis for broad comparisons to judge whether improvements are substantial. We’ve also changed with “substantial improvement” to “several modifications” to indicate the lack of comparison to past versions.
The exclusion of structures containing ligands and multichain protein models in the validation of qFit was puzzling since both are very common in the PDB. This may convey the impression that qFit cannot handle such use cases. (Although it seems that qFit has an algorithm dedicated to modeling ligand heterogeneity and seems to be able to handle multiple chains). The paper would be more effective if it explained how a user of the software would handle scenarios with ligands and multiple chains, and why these would be excluded from analysis here.
qFit can indeed handle both. We left out multiple chains for simplicity in constructing a dataset enriched for small proteins while still covering diversity to speed the ability to rapidly iterate and test our approaches. Improvements to qFit ligand handling will be discussed in a forthcoming work as we face similar technical debt to what we saw in proteins and are undergoing a process of introducing “several modifications” that we hope will lead to “substantial improvement” - but at the very least will accelerate further development.
It would be helpful to add some guidance on how/whether qFit models can be further refined afterwards in Coot, Phenix, ..., or whether these models are strictly intended as the terminal step in refinement.
We added to the abstract:
“Importantly, unlike ensemble models, the multiconformer models produced by qFit can be manually modified in most major model building software (e.g. Coot) and fit can be further improved by refinement using standard pipelines (e.g. Phenix, Refmac, Buster).”
and introduction:
“Multiconformer models are notably easier to modify and more interpretable in software like Coot12 unlike ensemble methods that generate multiple complete protein copies(Burnley et al. 2012; Ploscariu et al. 2021; Temple Burling and Brünger 1994).”
and results:
“This model can then be examined and edited in Coot12 or other visualization software, and further refined using software such as phenix.refine, refmac, or buster as the modeler sees fit.”
and discussion
“qFit is compatible with manual modification and further refinement as long as the subsequent software uses the PDB standard altloc column, as is common in most popular modeling and refinement programs. The models can therefore generally also be deposited in the PDB using the standard deposition and validation process.”
Appraisal & Discussion
Overall, the authors convincingly demonstrate that qFit provides a reliable means to detect and model conformational heterogeneity within high-resolution X-ray diffraction datasets and (based on a smaller sample) in cryo-EM density maps. This represents the state of the art in the field and will be of interest to any structural biologist or biochemist seeking to attain an understanding of the structural basis of the function of their system of interest, including potential allosteric mechanisms-an area where there are still few good solutions. That is, I expect qFit to find widespread use.
Reviewer #3 (Public Review):
Summary:
The authors address a very important issue of going beyond a single-copy model obtained by the two principal experimental methods of structural biology, macromolecular crystallography and cryo electron microscopy (cryo-EM). Such multiconformer model is based on the fact that experimental data from both these methods represent a space- and time-average of a huge number of the molecules in a sample, or even in several samples, and that the respective distributions can be multimodal. Different from structure prediction methods, this approach is strongly based on high-resolution experimental information and requires validated single-copy high-quality models as input. Overall, the results support the authors' conclusions.
In fact, the method addresses two problems which could be considered separately:
- An automation of construction of multiple conformations when they can be identified visually;
- A determination of multiple conformations when their visual identification is difficult or impossible.
We often think about this problem similarly to the reviewer. However, in building qFit, we do not want to separate these problems - but rather use the first category (obvious visual identification) to build an approach that can accomplish part of the second category (difficult to visualize) without building “impossible”/nonexistent conformations - with a consistent approach/bias.
The first one is a known problem, when missing alternative conformations may cost a few percent in R-factors. While these conformations are relatively easy to detect and build manually, the current procedure may save significant time being quite efficient, as the test results show.
We agree with the reviewers' assessment here. The “floor” in terms of impact is automating a tedious part of high resolution model building and improving model quality.
The second problem is important from the physical point of view and has been addressed first by Burling & Brunger (1994; https://doi.org/10.1002/ijch.199400022). The new procedure deals with a second-order variation in the R-factors, of about 1% or less, like placing riding hydrogen atoms, modeling density deformation or variation of the bulk solvent. In such situations, it is hard to justify model improvement. Keeping Rfree values or their marginal decreasing can be considered as a sign that the model is not overfitted data but hardly as a strong argument in favor of the model.
We agree with the overall sentiment of this comment. What is a significant variation in R-free is an important question that we have looked at previously (http://dx.doi.org/10.1101/448795) and others have suggested an R-sleep for further cross validation (https://pubmed.ncbi.nlm.nih.gov/17704561/). For these reasons it is important to get at the significance of the changes to model types from large and diverse test sets, as we have here and in other works, and from careful examination of the biological significance of alternative conformations with experiments designed to test their importance in mechanism.
In general, overall targets are less appropriate for this kind of problem and local characteristics may be better indicators. Improvement of the model geometry is a good choice. Indeed, yet Cruickshank (1956; https://doi.org/10.1107/S0365110X56002059) showed that averaged density images may lead to a shortening of covalent bonds when interpreting such maps by a single model. However, a total absence of geometric outliers is not necessarily required for the structures solved at a high resolution where diffraction data should have more freedom to place the atoms where the experiments "see" them.
Again, we agree—geometric outliers should not be completely absent, but it is comforting when they and model/experiment agreement both improve.
The key local characteristic for multi conformer models is a closeness of the model map to the experimental one. Actually, the procedure uses a kind of such measure, the Bayesian information criteria (BIC). Unfortunately, there is no information about how sharply it identifies the best model, how much it changes between the initial and final models; in overall there is not any feeling about its values. The Q-score (page 17) can be a tool for the first problem where the multiple conformations are clearly separated and not for the second problem where the contributions from neighboring conformations are merged. In addition to BIC or to even more conventional target functions such as LS or local map correlation, the extreme and mean values of the local difference maps may help to validate the models.
We agree with the reviewer that the problem of “best” model determination is poorly posed here. We have been thinking a lot about htis in the context of Bayesian methods (see: https://www.ncbi.nlm.nih.gov/pmc/articles/PMC9278553/); however, a major stumbling block is in how variable representations of alternative conformations (and compositions) are handled. The answers are more (but by no means simply) straightforward for ensemble representations where the entire system is constantly represented but with multiple copies.
This method with its results is a strong argument for a need in experimental data and information they contain, differently from a pure structure prediction. At the same time, absence of strong density-based proofs may limit its impact.
We agree - indeed we think it will be difficult to further improve structure prediction methods without much more interaction with the experimental data.
Strengths:
Addressing an important problem and automatization of model construction for alternative conformations using high-resolution experimental data.
Weaknesses:
An insufficient validation of the models when no discrete alternative conformations are visible and essentially missing local real-space validation indicators.
While not perfect real space indicators, local real-space validation is implicit in the MIQP selection step and explicit when we do employ Q-score metrics.
Recommendations for the authors:
Reviewer #1 (Recommendations For The Authors):
A point of clarification: I don't understand why waters seem to be handled differently in for cryo-EM and crystallography datasets. I am interested about the statement on page 19 that the Molprobity Clashscore gets worse for cryo-EM datasets, primarily due to clashes with waters. But the qFit algorithm includes a round of refinement to optimize placement of ordered waters, and the clashscore improves for the qFit refinement in crystallography test cases. Why/how is this different for cryo-EM?
We agree that this was not an appropriate point. We believe that the high clash score is coming from side chains being incorrectly modeled. We have updated this in the manuscript and it will be a focus of future improvements.
Reviewer #2 (Recommendations For The Authors):
- It would be instructive to the reader to explain how qFit handles the chromophore in the PYP (1OTA) example. To this end, it would be helpful to include deposition of the multiconformer model of PYP. This might also be a suitable occasion for discussion of potential hurdles in the deposition of multiconformer models in the PDB (if any!). Such concerns may be real concerns causing hesitation among potential users.
Thank you for this comment. qFit does not alter the position or connectivity of any HETATM records (like the chromophore in this structure). Handling covalent modifications like this is an area of future development.
Regarding deposition, we have noted above that the discussion now includes:
“qFit is compatible with manual modification and further refinement as long as the subsequent software uses the PDB standard altloc column, as is common in most popular modeling and refinement programs. The models can therefore, generally also be deposited in the PDB using the standard deposition and validation process.”
Finally, we have placed all PDBs in a Zenodo deposition (XXX) and have included that language in the manuscript. It is currently under a separate data availability section (page XXX). We will defer to the editor as to the best header that should go under.
- It may be advisable to take the description of true/false pos/negatives out of the caption of Figure 4, and include it in a box or so, since these terms are important in the main text too, and the caption becomes very cluttered.
We think adding the description of true/false pos/negatives to the Figure panel would make it very cluttered and wordy. We would like to retain this description within the caption. We have also briefly described each in the main text.
- page 21, line 4: some issue with citation formatting.
We have updated these citations.
- page 25, second paragraph: cardinality is the number of members of a set. Perhaps "minimal occupancy" is more appropriate.
Thank you for pointing this out. This was a mistake and should have been called the occupancy threshold.
- page 26: it's - its
Thank you, we have made this change.
- Font sizes in Supplementary Figures 5-7 are too small to be readable.
We agree and will make this change.
Reviewer #3 (Recommendations For The Authors):
General remarks
(1) As I understand, the procedure starts from shifting residues one by one (page 4; A.1). Then, geometry reconstruction (e.g., B1) may be difficult in some cases joining back the shifted residues. It seems that such backbone perturbation can be done more efficiently by shifting groups of residues ("potential coupled motions") as mentioned at the bottom of page 9. Did I miss its description?
We would describe the algorithm as sampling (which includes minimal shifts) in the backbone residues to ensure we can link neighboring residues. We agree that future iterations of qFit should include more effective backbone sampling by exploring motion along the Cβ-Cα, C-N, and (Cβ-Cα × C-N) bonds and exploring correlated backbone movements.
(2) While the paper is well split in clear parts, some of them seem to be not at their right/optimal place and better can be moved to "Methods" (detailed "Overview of the qFit protein algorithm" as a whole) or to "Data" missed now (Two first paragraphs of "qFit improves overall fit...", page 8, and "Generating the qFit test set", page 22, and "Generating synthetic data ..." at page 26; description of the test data set), At my personal taste, description of tests with simulated data (page 15) would be better before that of tests with real data.
Thank you for this comment, but we stand by our original decision to keep the general flow of the paper as it was submitted.
(3) I wonder if the term "quadratic programming" (e.g., A3, page 5) is appropriate. It supposes optimization of a quadratic function of the independent parameters and not of "some" parameters. This is like the crystallographic LS which is not a quadratic function of atomic coordinates, and I think this is a similar case here. Whatever the answer on this remark is, an example of the function and its parameters is certainly missed.
We think that the term quadratic programming is appropriate. We fit a function with a loss function (observed density - calculated density), while satisfying the independent parameters. We fit the coefficients minimizing a quadratic loss. We agree that the quadratic function is missing from the paper, and we have now included it in the Methods section.
Technical remarks to be answered by the authors :
(1) Page 1, Abstract, line 3. The ensemble modeling is not the only existing frontier, and saying "one of the frontiers" may be better. Also, this phrase gives a confusing impression that the authors aim to predict the ensemble models while they do it with experimental data.
We agree with this statement and have re-worded the abstract to reflect this.
(2) Page 2. Burling & Brunger (1994) should be cited as predecessors. On the contrary, an excellent paper by Pearce & Gros (2021) is not relevant here.
While we agree that we should mention the Burling & Brunger paper and the Pearce & Gros (2021) should not be removed as it is not discussing the method of ensemble refinement.
(3) Page 2, bottom. "Further, when compared to ..." The preference to such approach sounds too much affirmative.
We have amended this sentence to state:
“Multiconformer models are notably easier to modify and more interpretable in software like Coot(Emsley et al. 2010) unlike ensemble methods that generate multiple complete protein copies(Burnley et al. 2012; Ploscariu et al. 2021; Temple Burling and Brünger 1994).”
“The point we were trying to make in this sentence was that ensemble-based models are much harder to manually manipulate in Coot or other similar software compared to multiconformer models. We think that the new version of this sentence states this point more clearly.”
(4) Page 2, last paragraph. I do not see an obvious relation of references 15-17 to the phrase they are associated with.
We disagree with this statement, and think that these references are appropriate.
“Multiconformer models are notably easier to modify and more interpretable in software like Coot12 unlike ensemble methods that generate multiple complete protein copies(Burnley et al. 2012; Ploscariu et al. 2021; Temple Burling and Brünger 1994).”
(5) Page 3, paragraph 2. Cryo-EM maps should be also "high-resolution"; it does not read like this from the phrase.
We agree that high-resolution should be added, and the sentence now states:
“However, many factors make manually creating multiconformer models difficult and time-consuming. Interpreting weak density is complicated by noise arising from many sources, including crystal imperfections, radiation damage, and poor modeling in X-ray crystallography, and errors in particle alignment and classification, poor modeling of beam induced motion, and imperfect detector Detector Quantum Efficiency (DQE) in high-resolution cryo-EM.”
(6) Page 3, last paragraph before "results". The words "... in both individual cases and large structural bioinformatic projects" do not have much meaning, except introducing a self-reference. Also, repeating "better than 2 A" looks not necessary.
We agree that this was unnecessary and have simplified the last sentence to state:
“With the improvements in model quality outlined here, qFit can now be increasingly used for finalizing high-resolution models to derive ensemble-function insights.”
(7) Page 3. "Results". Could "experimental" be replaced by a synonym, like "trial", to avoid confusing with the meaning "using experimental data"?
We have replaced experimental with exploratory to describe the use of qFit on CryoEM data. The statement now reads:
“For cryo-EM modeling applications, equivalent metrics of map and model quality are still developing, rendering the use of qFit for cryo-EM more exploratory.”
(8) Page 4, A.1. Should it be "steps +/- 0.1" and "coordinate" be "coordinate axis"? One can modify coordinates and not shift them. I do not understand how, with the given steps, the authors calculated the number of combinations ("from 9 to 81"). Could a long "Alternatively, ...absent" be reduced simply to "Otherwise"?
We have simplified and clarified the sentence on the sampling of backbone coordinates to state:
“If anisotropic B-factors are absent, the translation of coordinates occurs in the X, Y, and Z directions. Each translation takes place in steps of 0.1 along each coordinate axis, extending to 0.3 Å, resulting in 9 (if isotropic) or to 81 (if anisotropic) distinct backbone conformations for further analysis.”
(9) Page 6, B.1, line 2. Word "linearly" is meaningless here.
We have modified this to read:
“Moving from N- to C- terminus along the protein,”
(10) Page 9, line 2. It should be explained which data set is considered as the test set to calculate Rfree.
We think this is clear and would be repetitive if we duplicated it.
(11) Page 9, line 7. It should be "a valuable metric" and not "an"
We agree and have updated the sentence to read:
“Rfree is a valuable metric for monitoring overfitting, which is an important concern when increasing model parameters as is done in multiconformer modeling.”
(12) Page 10, paragraph 3. "... as a string (Methods)". I did not find any other mention of this term "string", including in "Methods" where it supposed to be explained. Either this should be explained (and an example is given?), or be avoided.
We agree that string is not necessary (discussing the programmatic datatype). We have removed this from the sentence. It now reads:
“To quantify how often qFit models new rotameric states, we analyzed the qFit models with phenix.rotalyze, which outputs the rotamer state for each conformer (Methods).”
(13) Page10, lines 3-4 from bottom. Are these two alternative conformations justified?
We are unsure what this is referring to.
(14) Page 12, Fig. 2A. In comparison with Supplement Fig 2C, the direction of axes is changed. Could they be similar in both Figures?
We have updated Supplementary Figure 2C to have the same direction of axes as Figure 2A.
(15) Page 15, section's title. Choose a single verb in "demonstrate indicate".
We have amended the title of this section to be:
“Simulated data demonstrate qFit is appropriate for high-resolution data.”
(16) Page 15, paragraph 2. "Structure factors from 0.8 to 3.0 A resolution" does not mean what the author wanted apparently to tell: "(complete?) data sets with the high-resolution limit which varied from 0.8 to 3.0 A ...". Also, a phrase of "random noise increasing" is not illustrated by Figs.5 as it is referred to.
We have edited this sentence to now read:
“To create the dataset for resolution dependence, we used the ground truth 7KR0 model, including all alternative conformations, and generated artificial structure factors with a high resolution limit ranging from 0.8 to 3.0 Å resolution (in increments of 0.1 Å).”
(17) Page 15, last paragraph is written in a rather formal and confusing way while a clearer description is given in the figure legend and repeated once more in Methods. I would suggest to remove this paragraph.
We agree that this is confusing. Instead of create a true positive/false positive/true negative/false negative matrix, we have just called things as they are, multiconformer or single conformer and match or no match. We have edited the language the in the manuscript and figure legends to reflect these changes.
(18) Page 16. Last two paragraphs start talking about a new story and it would help to separate them somehow from the previous ones (sub-title?).
We agree that this could use a subtitle. We have included the following subtitle above this section:
“Simulated multiconformer data illustrate the convergence of qFit.”
(19) Page 20. "or static" and "we determined that" seem to be not necessary.
We have removed static and only used single conformer models. However, as one of the main conclusions of this paper is determining that qFit can pick up on alternative conformers that were modeled manually, we have decided to the keep the “we determined that”.
(20) Page 21, first paragraph. "Data" are plural; it should be "show" and "require"
We have made these edits. The sentence now reads:
“However, our data here shows that not only does qFit need a high-resolution map to be able to detect signal from noise, it also requires a very well-modeled structure as input.”
(21) Page 21, References should be indicated as [41-45], [35,46-48], [55-57]. A similar remark to [58-63] at page 22.
We have fixed the reference layout to reflect this change.
(22) Page 21, last paragraph. "Further reduce R-factors" (moreover repeated twice) is not correct neither by "further", since here it is rather marginal, nor as a goal; the variations of R-factors are not much significant. A more general statement like "improving fit to experimental data" (keeping in mind density maps) may be safer.
We agree with the duplicative nature of these statements. We have amended the sentence to now read:
“Automated detection and refinement of partial-occupancy waters should help improve fit to experimental data further reduce Rfree15 and provide additional insights into hydrogen-bond patterns and the influence of solvent on alternative conformations.”
(23) Page 22. Sub-sections of "Methods" are given in a little bit random order; "Parallelization of large maps" in the middle of the text is an example. Put them in a better order may help.
We have moved some section of the Methods around and made better headings by using an underscore to highlight the subsections (Generating and running the qFit test set, qFit improved features, Analysis metrics, Generating synthetic data for resolution dependence).
(24) Page 24. Non-convex solution is a strange term. There exist non-convex problems and functions and not solutions.
We agree and we have changed the language to reflect that we present the algorithm with non-convex problems which it cannot solve.
(25) Page 26, "Metrics". It is worthy to describe explicitly the metrics and not (only) the references to the scripts.
For all metrics, we describe a sentence or two on what each metric describes. As these metrics are well known in the structural biology field, we do not feel that we need to elaborate on them more.
(26) Page 26. Multiplying B by occupancy does not have much sense. A better option would be to refer to the density value in the atomic center as occ*(4*pi/B)^1.5 which gives a relation between these two entities.
We agree and have update the B-factor figures and metrics to reflect this.
(27) Page 40, suppl. Fig. 5. Due to the color choice, it is difficult to distinguish the green and blue curves in the diagram.
We have amended this with the colors of the curves have been switched.
(28) Page 42, Suppl. Fig. 7. (A) How the width of shaded regions is defined? (B) What the blue regions stand for? Input Rfree range goes up to 0.26 and not to 0.25; there is a point at the right bound. (C) Bounds for the "orange" occupancy are inversed in the legend.
(A) The width of the shaded region denotes the standard deviations among the values at every resolution. We have made this clearer in the caption
(B) The blue region denotes the confidence interval for the regression estimate. Size of the confidence interval was set to 95%. We have made this clearer in the caption
(C) This has been fixed now
The maximum R-free value is 0.2543, which we rounded down to 0.25.
(29) Page 43. Letters E-H in the legend are erroneously substituted by B-E.
We apologize for this mistake. It is now corrected.
-
Reviewer #3 (Public Review):
Summary:
The authors address a very important issue of going beyond a single-copy model obtained by the two principal experimental methods of structural biology, macromolecular crystallography and cryo electron microscopy (cryo-EM). Such multiconformer model is based on the fact that experimental data from both these methods represent a space- and time-average of a huge number of the molecules in a sample, or even in several samples, and that the respective distributions can be multimodal. Differently from structure prediction methods, this approach is strongly based on accurate high-resolution experimental information and requires validated single-copy high-quality models as input. In overall, the results support the authors' conclusions.
In fact, the method addresses two problems which could be considered separately:
- an automation of construction of multiple conformations when they can be identified visually;<br /> - a determination of multiple conformations when their visual identification is difficult or impossible.
The former is a known problem, when missing alternative conformations may cost a few percent in R-factors. While these conformations are relatively easy to detect and build manually, the current procedure may save significant time being quite efficient, as the test results show. It is an indisputably useful tool for such a goal. The second problem is important from the physical point of view and has been considered first thirty years ago by Burling & Brünger. The manuscript does not specify clearly how much the current tool addresses the second case. To model such maps, the authors introduced errors in structure factors, however, being independent, as in this work, such errors, even quite high, may leave the maps reasonably well interpretable. Obviously, it is impossible to model all kinds of errors and this modeling of noise is appreciated but it would helpful for understanding if the manuscript shows, for example, the worst map when the procedure was successful.
The new procedure deals with a second-order variation in the R-factors, of about 1% or less, like placing riding hydrogen atoms, modeling density deformation or variation of the bulk solvent. In such situations, it is hard to justify model improvement. Keeping Rfree values or their marginal decreasing can be considered as a sign that the model does not overfit data but hardly as a strong argument in favor of the model.
In general, global targets are less appropriate for this kind of problems and local characteristics may be better indicators. Improvement of the model geometry is a good choice. Indeed, yet Cruickshank (1956) showed that averaged density images may lead to a shortening of covalent bonds when interpreting such maps by a single model. However, a total absence of geometric outliers is not necessarily required for the structures solved at a high resolution where diffraction data should have a more freedom to place the atoms where the experiments "see" them.
The key local characteristic for multicomformer models is a closeness of the model map to the experimental one. Actually, the procedure uses a kind of such measure, the Bayesian information criteria (BIC). Unfortunately, the manuscript does not describe how sharply it identifies the best model and how much it changes between the initial and final models; in general, there is no feeling about its values. The Q-score (page 17) can be an appropriate tool for the first problem where the multiple conformations and individual atomic images are clearly separated and not for the second problem where the contributions from neighboring conformations and atoms are merged. In addition to BIC or to even more conventional global target functions such as LS or map correlation, the extreme values of the local difference maps may help to validate, or not, the model.
This described method with the results presented is a strong argument for a need in experimental data and information they contain, differently from a pure structure prediction. This tool is important to produce user-unbiased multiconformer models rapidly and automatically. At the same time, absence of strong density-based validation components may limit its impact.
Strengths:<br /> Addressing an important problem and automatisation of model construction for alternative conformations using high-resolution experimental data.
Weaknesses:<br /> An insufficient validation of the models when no discrete alternative conformations visible and insufficiency of local real-space validation indicators.
-
eLife assessment
This work describes important updates to qFit, the state-of-the art tool for modeling alternative conformations of protein molecules based on high resolution X-ray diffraction or Cryo-EM data. The authors provide some convincing analyses of qFit's performance in selected test cases. This manuscript will be of interest to structural biologists and protein biochemists, since the adoption of qFit in structural refinement may lead to new mechanistic insights into protein function.
-
Reviewer #1 (Public Review):
Summary:
Protein conformational changes are often critical to protein function, but obtaining structural information about conformational ensembles is a challenge. Over a number of years, the authors of the current manuscript have developed and improved an algorithm, qFit protein, that models multiple conformations into high resolution electron density maps in an automated way. The current manuscript describes the latest improvements to the program, and analyzes the performance of qFit protein in a number of test cases, including classical statistical metrics of data fit like Rfree and the gap between Rwork and Rfree, model geometry, and global and case-by-case assessment of qFit performance at different data resolution cutoffs. The authors have also updated qFit to handle cryo-EM datasets, although the analysis of its performance is more limited due to a limited number of high-resolution test cases and less standardization of deposited/processed data.
Strengths:
The strengths of the manuscript are the careful and extensive analysis of qFit's performance over a variety of metrics and a diversity of test cases, as well as careful discussion of the limitations of qFit. This manuscript also serves as a very useful guide for users in evaluating if and when qFit should be applied during structural refinement.
-
Reviewer #2 (Public Review):
Summary
The manuscript "Uncovering Protein Ensembles: Automated Multiconformer Model building for X-ray Crystallography and Cryo-EM" by Wankowicz et al. describes updates to qFit, an algorithm for the characterization of conformational heterogeneity of protein molecules based on X-ray diffraction of Cryo-EM data. The work provides a clear description of the algorithm used by qFit. The authors then proceed to validate the performance of qFit by comparing to deposited X-ray entries in the PDB in the 1.2-1.5 Å resolution range as quantified by Rfree, Rwork-Rfree, detailed examination of the conformations introduced by qFit, and performance on stereochemical measures (MolProbity scores). To examine the effect of experimental resolution of X-ray diffraction data, they start from an ultra high-resolution structure (SARS-CoV2 Nsp3 macrodomain) to determine how the loss of resolution (introduced artificially) degrades the ability of qFit to correctly infer the nature and presence of alternate conformations. The authors observe a gradual loss of ability to correctly infer alternate conformations as resolution degrades past 2 Å. The authors repeat this analysis for a larger set of entries in a more automated fashion and again observe that qFit works well for structures with resolutions better than 2 Å, with a rapid loss of accuracy at lower resolution. Finally, the authors examine the performance of qFit on cryo-EM data. Despite a few prominent examples, the authors find only a handful (8) of datasets for which they can confirm a resolution better than 2.0 Å. The performance of qFit on these maps is encouraging and will be of much interest because cryo-EM maps will, presumably, continue to improve and because of the rapid increase in the availability of such data for many supramolecular biological assemblies. As the authors note, practices in cryo-EM analysis are far from uniform, hampering the development and assessment of tools like qFit.
Strengths
qFit improves the quality of refined structures at resolutions better than 2.0 A, in terms of reflecting true conformational heterogeneity and geometry. The algorithm is well-designed and does not introduce spurious or unnecessary conformational heterogeneity. I was able to install and run the program without a problem within a computing cluster environment. The paper is well-written and the validation thorough.<br /> I found the section on cryo-EM particularly enlightening, both because it demonstrates the potential for discovery of conformational heterogeneity from such data by qFit, and because it clearly explains the hurdles towards this becoming common practice, including lack of uniformity in reporting resolution, and differences in map and solvent treatment.
Weaknesses
Due to limitations of past software engineering, the paper lacks a careful comparison to past versions of qFit. In light of the extensive assessment of the current version of qFit, this is a minor concern.
Although qFit can handle supramolecular assemblies and bound organic molecules, analysis in the manuscript is limited to single-chain X-ray structures. I look forward to demonstration of its utility in such cases in future work.
Appraisal & Discussion
Overall, the authors convincingly demonstrate that qFit provides a reliable means to detect and model conformational heterogeneity within high-resolution X-ray diffraction datasets and (based on a smaller sample) in cryo-EM density maps. This represents the state of the art in the field and will be of interest to any structural biologist or biochemist seeking to attain an understanding of the structural basis of the function of their system of interest, including potential allosteric mechanisms-an area where there are still few good solutions. That is, I expect qFit to find widespread use.
-
-
www.theguardian.com www.theguardian.com
-
-
math.libretexts.org math.libretexts.org
-
𝔽[𝑧]F[z]\mathbb{F}[z] forms a vector space over 𝔽
The fact that a polynomial q(z) might not be linear is irrelevant to whether the set of all polynomials 𝔽[z] forms a vector space over 𝔽.
Here's why 𝔽[z] forms a vector space over 𝔽, regardless of individual polynomial degrees:
Vector Space Requirements
A vector space is a set of elements (vectors) along with two operations: addition of vectors and multiplication of vectors by scalars (from a field). This set and its operations must satisfy a list of axioms. The key axioms include:
- Closure under addition: The sum of any two polynomials is another polynomial.
- Associativity of addition: (p + q) + r = p + (q + r) for all polynomials p, q, r.
- Commutativity of addition: p + q = q + p for all polynomials p, q.
- Existence of a zero vector: The zero polynomial (all coefficients 0) acts as an additive identity.
- Existence of additive inverses: For every polynomial p, there exists a polynomial -p such that p + (-p) = 0 (the zero polynomial).
- Closure under scalar multiplication: Multiplying a polynomial by a scalar from 𝔽 results in another polynomial.
- Associativity of scalar multiplication: a(bp) = (ab)p for all scalars a, b in 𝔽 and all polynomials p.
- Distributivity of scalar multiplication over vector addition: a(p + q) = ap + aq for all scalars a in 𝔽 and all polynomials p, q.
- Distributivity of scalar multiplication over field addition: (a + b)p = ap + bp for all scalars a, b in 𝔽 and all polynomials p.
- Identity element of scalar multiplication: 1p = p for the scalar 1 in 𝔽 and all polynomials p.
Why 𝔽[z] Satisfies the Axioms
- Polynomials are Closed under Addition and Scalar Multiplication: When you add two polynomials or multiply a polynomial by a scalar, the result is always another polynomial with coefficients in 𝔽.
- Associativity, Commutativity, Distributivity: These properties follow directly from the properties of addition and multiplication in the field 𝔽.
- Zero Vector and Additive Inverses: The zero polynomial exists and for every polynomial, there's a corresponding polynomial with the signs of all coefficients flipped, which acts as the additive inverse.
Example (from the original text):
p(z) = 5z + 1q(z) = 2z^2 + z + 1
We can see:
(p + q)(z) = 2z^2 + 6z + 2(This is another polynomial)(2p)(z) = 10z + 2(This is another polynomial)
Conclusion
The linearity of any individual polynomial within 𝔽[z] does not impact the fact that 𝔽[z] as a whole satisfies the axioms of a vector space over 𝔽. The vector space structure comes from how the polynomials interact with each other through addition and scalar multiplication, not from the degree of individual polynomials.
-
-
-
How to do most anything with your Helia node

-
-
docs.ipfs.tech docs.ipfs.tech
-
install IPFS
-
IPFS Helia
Helia
-
command-line version of IPFS
no GUI
-
Get Started
IPFS
-
-
bobjessop.wordpress.com bobjessop.wordpress.com
-
Luhmann cites Edgar Morin (1980: 44) on ecological dominance, i.e., an ecological relation wherein some systems may be dominant but where none dominates (Luhmann 1987: 109-110; 1990a: 147-8).
Luhmann meminjam Edgar Morin tentang dominasi ekologis. Bahwa dalam relasi ekologis sebagian sistem mungkin dominan tapi tidak mendominasi.
-
Ecological dominance is a contingent emergent relationship between two or more systems rather than a naturally necessary property of a single system. Thus a given functional system can be more or less ecologically dominant, its dominance may vary across different systems in its environment and/or with changing circumstances, and the continuation of any dominance will depend on the development of the ecosystem as a whole.[2] So there is no ‘last instance’ in relations of ecological dominance. But, given that the capitalist economy is structurally coupled to other operationally autonomous systems and to the lifeworld (and these to each other too), we can ask which, if any, of them could become ecologically dominant. There are seven analytically distinct, but empirically interrelated, aspects of the social (as opposed to biological) world that affect a system’s potential in this regard (see Table 1). Considered in these terms, the capitalist economy, with its distinctive, self-valorizing logic, tends to have just those properties that favour ecological dominance.
Dominasi Ekologis

-
