p.s. Want the visual map? You'll find a full FieldNote Sketch Summary of this inside the 'hidden' layer. Click this highlight to see the synthesis, share it with someone you know needs it and save a copy for yourself.
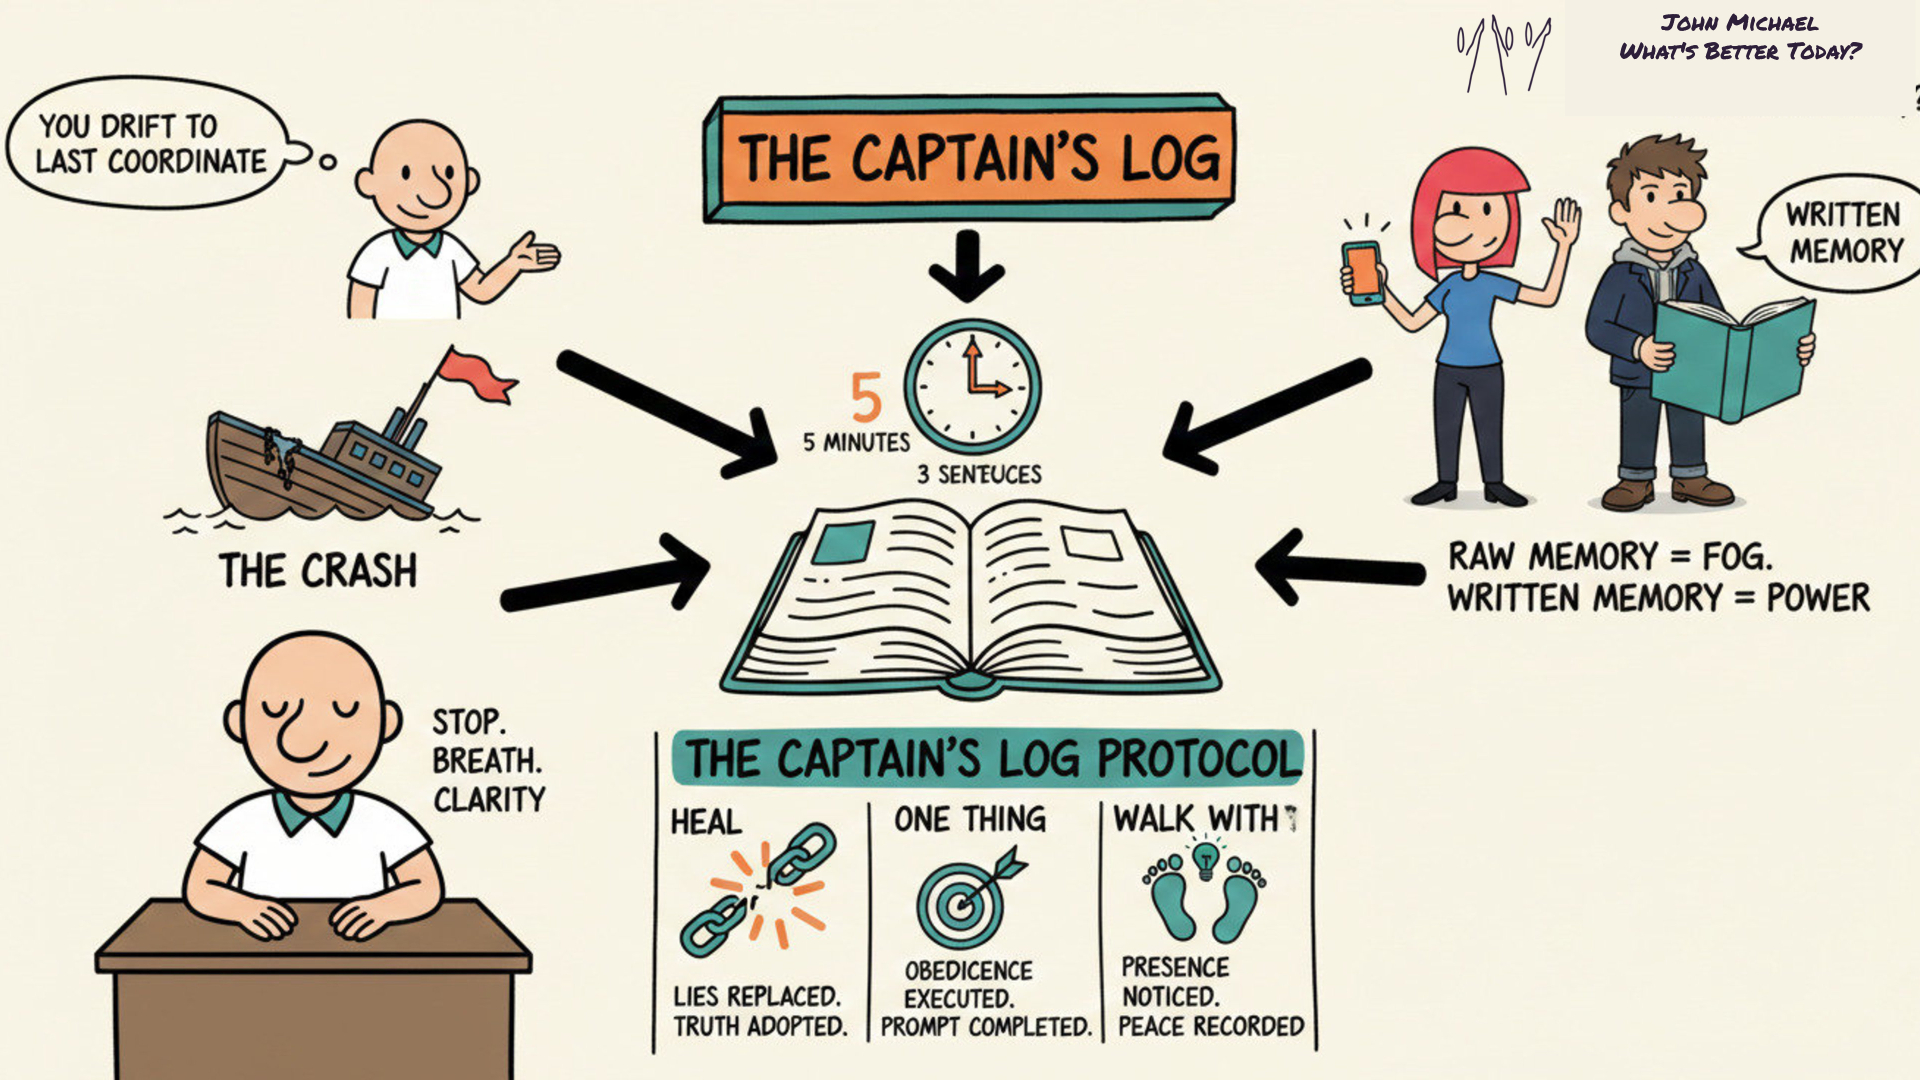 Download this SketchNote for your own notes and to share