RRID:AB_1128570
DOI: 10.1002/2211-5463.70195
Resource: RRID:AB_1128570
Curator: @scibot
SciCrunch record: RRID:AB_1128570
RRID:AB_1128570
DOI: 10.1002/2211-5463.70195
Resource: RRID:AB_1128570
Curator: @scibot
SciCrunch record: RRID:AB_1128570
RRID:AB_11168976
DOI: 10.1002/2211-5463.70195
Resource: (GeneTex Cat# GTX128091, RRID:AB_11168976)
Curator: @scibot
SciCrunch record: RRID:AB_11168976
RRID:AB_141708
DOI: 10.1002/2211-5463.70195
Resource: (Molecular Probes Cat# A-21206, RRID:AB_2535792)
Curator: @scibot
SciCrunch record: RRID:AB_2535792
RRID:SCR_003070
DOI: 10.1002/1878-0261.70256
Resource: ImageJ (RRID:SCR_003070)
Curator: @scibot
SciCrunch record: RRID:SCR_003070
RRID:AB_10865889
DOI: 10.1002/1878-0261.70256
Resource: RRID:AB_10865889
Curator: @scibot
SciCrunch record: RRID:AB_10865889
RRID:AB_955439
DOI: 10.1002/1878-0261.70256
Resource: (Abcam Cat# ab6789, RRID:AB_955439)
Curator: @scibot
SciCrunch record: RRID:AB_955439
RRID:SCR_008520
DOI: 10.1002/1878-0261.70256
Resource: FlowJo (RRID:SCR_008520)
Curator: @scibot
SciCrunch record: RRID:SCR_008520
RRID:AB_2534072
DOI: 10.1002/1878-0261.70256
Resource: (Thermo Fisher Scientific Cat# A-11004, RRID:AB_2534072)
Curator: @scibot
SciCrunch record: RRID:AB_2534072
RRID:AB_2338535
DOI: 10.1002/1878-0261.70256
Resource: (Jackson ImmunoResearch Labs Cat# 115-055-071, RRID:AB_2338535)
Curator: @scibot
SciCrunch record: RRID:AB_2338535
RRID:SCR_008567
DOI: 10.1002/1878-0261.70256
Resource: Statistical Analysis System (RRID:SCR_008567)
Curator: @scibot
SciCrunch record: RRID:SCR_008567
RRID:AB_331284
DOI: 10.1002/1878-0261.70256
Resource: (Cell Signaling Technology Cat# 3033, RRID:AB_331284)
Curator: @scibot
SciCrunch record: RRID:AB_331284
RRID:AB_11174537
DOI: 10.1002/1878-0261.70256
Resource: RRID:AB_11174537
Curator: @scibot
SciCrunch record: RRID:AB_11174537
RRID:AB_561111
DOI: 10.1002/1878-0261.70256
Resource: (Cell Signaling Technology Cat# 2859, RRID:AB_561111)
Curator: @scibot
SciCrunch record: RRID:AB_561111
RRID:AB_395843
DOI: 10.1002/1878-0261.70256
Resource: (BD Biosciences Cat# 555450, RRID:AB_395843)
Curator: @scibot
SciCrunch record: RRID:AB_395843
RRID:CVCL_0291
DOI: 10.1002/1878-0261.70256
Resource: (RRID:CVCL_0291)
Curator: @scibot
SciCrunch record: RRID:CVCL_0291
RRID:AB_10859369
DOI: 10.1002/1878-0261.70256
Resource: (Cell Signaling Technology Cat# 8242, RRID:AB_10859369)
Curator: @scibot
SciCrunch record: RRID:AB_10859369
RRID:AB_10694498
DOI: 10.1002/1878-0261.70256
Resource: (Cell Signaling Technology Cat# 4590, RRID:AB_659820)
Curator: @scibot
SciCrunch record: RRID:AB_659820
RRID:CVCL_0248
DOI: 10.1002/1878-0261.70256
Resource: (RRID:CVCL_0248)
Curator: @scibot
SciCrunch record: RRID:CVCL_0248
BDSC:747
DOI: 10.64898/2026.03.04.709556
Resource: RRID:BDSC_747
Curator: @maulamb
SciCrunch record: RRID:BDSC_747
BDSC:6639
DOI: 10.64898/2026.03.04.709556
Resource: RRID:BDSC_6639
Curator: @maulamb
SciCrunch record: RRID:BDSC_6639
BDSC:5698
DOI: 10.64898/2026.03.04.709556
Resource: RRID:BDSC_5698
Curator: @maulamb
SciCrunch record: RRID:BDSC_5698
BDSC:5626
DOI: 10.64898/2026.03.04.709556
Resource: RRID:BDSC_5626
Curator: @maulamb
SciCrunch record: RRID:BDSC_5626
BDSC:55124
DOI: 10.64898/2026.03.04.709556
Resource: RRID:BDSC_55124
Curator: @maulamb
SciCrunch record: RRID:BDSC_55124
BDSC:35496
DOI: 10.64898/2026.03.04.709556
Resource: RRID:BDSC_35496
Curator: @maulamb
SciCrunch record: RRID:BDSC_35496
BDSC:34055
DOI: 10.64898/2026.03.04.709556
Resource: RRID:BDSC_34055
Curator: @maulamb
SciCrunch record: RRID:BDSC_34055
RRID:1118849-3
DOI: 10.3389/fncel.2026.1800565
Resource: RRID:AB_304558
Curator: @evieth
SciCrunch record: RRID:AB_304558
RRID:1-9
DOI: 10.3389/fncel.2026.1800565
Resource: RRID:AB_2927389
Curator: @evieth
SciCrunch record: RRID:AB_2927389
RRID:GR3393951-1
DOI: 10.3389/fncel.2026.1800565
Resource: RRID:AB_2737414
Curator: @evieth
SciCrunch record: RRID:AB_2737414
RRID:IMSR_JAX:003802Common
DOI: 10.1007/s00262-026-04381-4
Resource: RRID:IMSR_JAX:003802
Curator: @evieth
SciCrunch record: RRID:IMSR_JAX:003802
The natural reactor of Oklo has been used to check if the atomic fine-structure constant α might have changed over the past 2 billion years. That is because α influences the rate of various nuclear reactions. For example, 149Sm captures a neutron to become 150Sm, and since the rate of neutron capture depends on the value of α, the ratio of the two samarium isotopes in samples from Oklo can be used to calculate the value of α from 2 billion years ago. Several studies have analysed the relative concentrations of radioactive isotopes left behind at Oklo, and most have concluded that nuclear reactions then were much the same as they are today, which implies that α was the same too.
what a gift to natural history.
In 1956, Kuroda was the first to propose that natural self-sustaining nuclear chain reactions were possible. Such a reactor was discovered in September 1972 in the Oklo Mines of Gabon.
goat
work-in.progress-👀view
decentralised, privacy-preserving, and collectively owned.
DECENTralized is a decent move away from centralized
If we could combine with value aligned infrastructure constellations that are themselves are - Commons based, - Peer produced, - auto - nomous - poietic
permanent, evergreen and co-evolving through open interplay
Permanent and Distributed
Open infrastructure for training AI as a public good
could be a contribution to provide - means of training AI that re - privacy preserving, and collectively owned
as AI for Human InterIntellect Augmentation
💻/asus/🧊/me/📓/2026/04/18
“Loan” is a perfectly legitimate verb, but lots of people wrinkle their noses at it, so either brace yourself for the nose wrinkling or go with “lend,” it’s up to you.8I see no reason to spell either “doxing” or “vaxing” with two x’s.9 If we could all preserve “criterion” as the singular and “criteria” as the plural, I’d take it as a great personal kindness. The noun is “prophecy”; the verb is “prophesy.”
ik mag een mening hebben
ja je mag een mening hebben. je mag die ook voor je houden en mensen er niet mee lastig vallen.
nergens stond dat het niet de bedoeling was om het kunstwerk op te eten
the belgians will come and eat everything
Subject & verb must always agree Adjectives appear in the royal order Apostrophes never make words plural Non-parallel structure stops the reader Modifiers should be closest to the word they are modifying Punctuation must end a sentence in body text Don’t add periods to other punctuation Never triple a contraction
the magpie had knocked a fledgling blackbird from its nest, probably to feed to its own young
donald trump
Enjambment is the continuation of a sentence or clause across a poetic line break.
I believe somebody else mentioned this in class. This technique is used in Ashberry's piece, where a sentence is continued after a line break. This makes it so the sentence can have two meanings, where you can read it as a continuation, or a new statement.
and that from the point or cape of Florida, there was a continued range of mountains through Cuba, Hispaniola, Porto rico, Martinique, Guadaloupe, Barbadoes, and Trinidad, till it reached the coast of America
an interesting antiquated use of america here, and one of the first times i've even seen him use the word. this is interesting.
And with what execration should the statesman be loaded, who permitting one half the citizens thus to trample on the rights of the other, transforms those into despots, and these into enemies, destroys the morals of the one part, and the amor patriæ of the other.
well observed
Sarah treated the internal felt of her typewriter by spraying it down with white distilled vinegar. This kills any living molds, etc. Vodka is also good for removing scents on typewriters (and vintage bags).
The variable line spacer is inside the platen of a Hermes 3000.
The carriage of the H3K comes off with the removal of two bolts.
For rust removal Sarah starts with a wire brush then does PB Blaster for more.
Replace rusted springs.
Fingernail polish for a H3K:<br /> - Sally Hansen Insta-Dry line "Time is Money" (discontinued?) - Expressie Essie quick dry "In the Modem" (closest in her opinion) - Sinful Colors Eucalypta - Blank Beauty (color match to Hermes Ambassador) - Orly (meh, too green)
The case doesn't remove intuitively.
(b) Administrative members (Bylaw 3) who hold Captain rank or above maintain CC participation at the tier appropriate to their rank, provided they meet the 60% vote participation threshold.
Somewhat duplicative of Bylaw 3, Section 4(c), but also creates an impression of a difference for CC membership of Commander-ranked Administrative members which is not reflected in anything else in Bylaw 3.
Is this intentional?
must pass before proceeding to practical
Given that I am, as of this writing, an example of an exception to this rule, is it worth it to add a 5(d)(3) that explains the EC's ability to waive the written prerequisite (but not the written requirement) in extraordinary circumstances? I do not see space for that exception elsewhere in these Bylaws.
If all commanding officers deny placement, the returning member is deemed no longer in good standing and is expelled.
Redundant to the second half of Section 5(d), another reason to change the language there.
Section 7 — Placement After Return
Possible to streamline by combining with Section 5 as a general "Fleet Placement" section.
If all commanding officers deny placement, the member retains the right to remain on their current ship. A member who has no current ship and is denied by all commanding officers is deemed no longer in good standing and is expelled from the community.
The rest of Section 5 contemplates no other means by which a transfer may occur than by voluntary request of the transferring member. This section creates an impression that upon a transfer request the original CO can revoke permission to stay aboard the originating ship. Consider alternative language:
"At all times until a transfer is approved and confirmed by a receiving commanding officer, the member retains the right to remain on their current ship."
For involuntary transfers as a disciplinary matter, it should either be its own point or it should be moved to a more detailed section on discipline—which the Bylaws here do not currently contain.
Article 8: Discipline
Sections 1, 2, and 5 make sense for the Constitution. Sections 3, 4, 6, and 7 should be moved to a Bylaw and provided greater detail and explanation. As it stands, this feels a bit too crunchy for a Constitution, but maybe not detailed enough on process.
Captains and above: Leave may not exceed 24 consecutive months.
My understanding is that no one's leave can exceed 24 consecutive months under current policy. This (in connection with the language in Section 3(a) below) suggests that for more junior officers, indefinite leave is permitted. Is that the correct intention? I only ask because it is not included in the "Changed" summary above.
provided they renew annually
See annotation on Section 2(d) above.
(b) If the CC requests the EC to participate in a CC vote as advisors, the EC may not subsequently veto the outcome of that vote.
So, my understanding from this is that the CC can overrule the EC by asking the EC to provide non-binding participation in a CC vote? If not, this language should be adjusted.
discipline officers
In light of Section 2, this could be problematic. I'm reading this as a 30-day delay in EC action, before we get to emergency authority, and then indefinite delay thereafter. Disciplinary functions should be available, and if the highest ranking active officer (HRAO) cannot be trusted to carry out discipline it probably needs to be done. Perhaps by an emergency committee called by the HRAO?
Questions about how to interpret this Constitution are resolved by the Executive Council.
I think this sentence is sufficient. There's no need for an appeal for a non-binding advisory opinion; in practice the interpretation of the Constitution would come up through a Captain, into the CC, and then to the EC. I don't see much value in going back down to the CC for dicta.
The United States is one of the few countries in the world that puts to death both children and those with intellectual disabilities. The other five countries in the world that execute their children are Iran, Nigeria, Pakistan, Saudi Arabia, and Yemen.
This is a crazy bullet to include and not elaborate on. What is this bullet referencing. It's not referencing abortion or the death penalty. If someone knows what this is in reference to, or knows what book or survey this was originally stated in please leave a comment.
It is reasonable in principle; the question is how it is feasible. Most of what "the FSF does" is done by volunteers. Would you like to help?
Over the course of 2014, 2015, and 2016, I tried working with RMS to get him to patch things up with Miguel and issue a revised edict on the use of .NET and (ridiculously enough) the entirety of the C# programming language.
He hemmed and hawed and over the course of those conversations even suggested that Microsoft re-releasing .NET under the Apache license might not even be sufficient for him to retract the fatwa.
I suggest that someone take RMS's statement here as a mandate to declare that .NET is now hereby recognized by the FSF as sufficiently free, to prepare "GNU .NET Runtime", "GNU Mono" packages, and announce a victory for free software.
VXL. Just take graduate courses in your year 3. Any graduate credits unused for your bachelor’s deg
asdasd
The subject (students), An action verb (what they will do), A criterion (how well they must do it), A context or condition, and A timeframe.
As a 5th grade math teacher I use the learning objective as a chance to expose my students to terminology and definitions that are intertwined with the lesson. I feel this helps to engage students with the expectation and goal of what is to be learned in the coming lesson. As well as a way to learn new vocabulary, because many of my students are English language learners. When creating a learning outcome objective I use a very similar 5 step outline presented to me during my time in undergraduate, while creating copious amounts of lessons plans. I find a key aspect of creating a comprehensible learning objectives that will engage, is to use student friendly language and key, but limited new terms that connect with the lesson. - Lily Walsh
world escalates with you as new threats match your rising power.
This is what I'm talking about in the above comment. Except, of course, this is in reverse. It highlights how the so called negative effects can be thematically appropriate.
When something is taken away, it should change the shape of play rather than simply shrink it.
I think a little bit of shrinking of scope is appropriate. But I suppose you could say that if you do it right, it's only really shrinking in the sense that. You are effecting the theme of the game effectively.
Her college was so fashion-conscious, she said, that all the girls had pocket-book covers made out of the same material as their dresses, so each time they changed their clothes they had a matching pocket-book.
Shows how the colleges in the 1950's were presented.
9.4 Memo to Janice (draft)
Chris, I let u handle this - what info u need to make decisions form her.
10. What we're asking FOMO (the risk-appetite questionnaire)
i think we decided not to do this
500 free identity-verifications per month on Order Form B
it's in form b, in the executed agreement! "The Platform Fee includes 500 new End User KYC completions per month. User Onboarding Fees for completions beyond 500 per month are billed per Schedule 3. User Application Fees apply to all KYC initiations per Schedule 3."
Proposed narrative for the conversation:
he knows we are thinking about launching in 2 phases, he saw that, didn't disagree
Our current process for a limit-increase request: Google form → Lucas logs it → Janice reviews over email → Zsuzs approves → someone executes
definitely should reform but this is not true actually, janice reviews, zsuzs is not pat of compliance anymore
She is a contractor working 10-19 hours per week
nope, full-time
supporting signal
we could also think about other signals we saw Bridge utilizing: monitoring IP addresses, if suddenly there's a change, block the pmt for manual review
Paid by FOMO on 2026-04-01 via Mercury ACH.
no, the implementation fee was paid, not the reserve!
Zsuzs
All these tasks I believe belong to Laurence, not me
Phase 1 launch framed as "limited testing with tighter rules
We should define this. Should be volume plus time base in my opinion.
Should it be min. 60days? and volume and txn number?
supporting signal
Should we consider other supporting signals?
E.g. how long FOMO user + FOMO volume/activity
I think the biggest - worst risk is new users signing up to FOMO just to abuse this ACH debit feature. We could definitely stop this. I'm not sure how to solve technically but could we create tags where fomo gives us info on a user per a frameowrk we create?
she's a 10-19 hrs/week contracto
no, she is not, she is full time. but still, we should try to avoid manual decisioning
$50K reserve
not reserve, FOMO paid the first part of the implementation fee
Platen repair experiment… This platen on a Royal Arrow was badly cracked with large chunks missing. So, having nothing to lose, I took some black Flexseal paste and filled it in like spackle. Of course, I applied way too much and ended up sanding most of it off before applying 240 grit sand paper to the entire platen via my drill. It’s smooth to the touch, not perfect, but passed the typing test with all letters clear and neat.
https://www.facebook.com/groups/1794856020751839/posts/4419835824920499/
College research should be driven by open-ended questions that seek to expose real issues or problems occurring in the daily lives of a particular group of people or populations. The questions you ask should not be structured in a way that they seek one correct answer, per se, but rather perspectives or experiences of scholars that have come before you
Open ended questions truly are how you learn!
https://www.facebook.com/reel/1455604339371283
JHoff Art painting the plastic key caps on a typewriter keyboard and repainting them with letter-based corporate logos.
John Waters on AI, LA’s pros and cons, and why he thinks laughter can bring the country together<br /> by [[Monica Bushman]] in LAist<br /> accessed on 2026-04-17T10:32:00
But I want AI to cure cancer. I want AI to cure AIDS. I want AI to cure COVID. I want AI for science, and I'm all for it, if that works.
John Waters is interested in AI for use in science.
This seems to track with Harari's perspective that self-correcting systems have more value.
What’s more intriguing to me, is to go to that edge where you can't walk and have both sides laugh with you, and at themself first, and then that's change. That's the only way we're gonna solve this. That's the only way we're gonna bring the country together. And maybe we should have sex with each other. Maybe every Proud Boy should have sex with antifa.
“I go to heavy metal concerts. I'm always going to things to spy on young people,” Waters said. “I'm always watching. All writers watch all the time.”
Note: This response was posted by the corresponding author to Review Commons. The content has not been altered except for formatting.
Learn more at Review Commons
This manuscript reports that undesired insertion of the plasmid backbone, including vector sequences not intended to be part of the genome edit, occurs at high frequency during CRISPR/Cas9-mediated HDR in Drosophila. We document this phenomenon across multiple independent genome editing projects, using three different plasmid backbones and targeting distinct genomic loci, demonstrating that it is not an isolated or project-specific artefact. We further introduce pVID, a new donor vector incorporating a ZsGreen negative selection marker that allows straightforward identification and exclusion of lines carrying undesired insertions, providing a practical solution to avoid this genome editing issue.
In response to the reviewers' comments, we have revised the manuscript to: (i) correct and contextualise prior descriptions of this problem, incorporating the references suggested by Reviewer 2; (ii) add a table summarising gRNA characteristics for all editing projects; (iii) expand the discussion of the underlying DNA repair mechanisms, the potential influence of Cas9 source choice, and the relevance of the findings beyond Drosophila; (iv) confirm the stability of problematic template vector insertions across multiple generations; and (v) improve figure clarity, correct typographical errors, and clarify several passages flagged by the reviewers. All responses are described in detail below.
Reviewer 1
Major Comment 1 — DNA repair pathways underlying backbone capture • I think the authors should discuss potential DNA repair pathways (e.g., NHEJ, MMEJ) underlying plasmid backbone capture in more detail. Did you check for knockouts within your screened transformants? That could provide insight into the underlying mechanisms.
Response: We screened humanized TDP-43 line for tbph knockouts, since our aim was to fully knock out the Drosophila gene and insert the human ortholog. However, we did not screen any of the other lines described in the manuscript for indels caused by NHEJ, since the dsRed selection we employed would not enable us to recover lines without insertion events. We hypothesise that one of the two gRNAs used being more inefficient than the other causes a single homologous recombination event and insertion of the vector template. However, the underlying mechanism is still unclear, and could be caused by NHEJ, HDR or a combination of these mechanisms as has previously observed (44). We have expanded on potential mechanisms inducing HDR template vector insertion events in the discussion of the revised manuscript.
Major Comment 2 — gRNA characteristics and design parameters • It would be important to describe gRNA characteristics and general design parameters (GC content, distance from cut to intended edit, homology arm length) and analyze whether these correlate with correct HDR vs. plasmid insertion. A table summarizing these details could help reveal potential trends.
Response: At the reviewers suggestion, we have added a table (Table 1) describing the all the characteristics of the gRNAs further in the material and method section. Unfortunately though, no commonality was immediately apparent to us.
Major Comment 3 — Single versus dual gRNA strategies • Did the authors consider exploring whether using a single gRNA reduces backbone insertion frequency compared to dual-gRNA strategies? I understand that two gRNAs are needed for your strategy, but it would be interesting to know whether these outcomes are linked to the dual-gRNA design.
Response: As stated in the discussion, we theorize that perhaps one of the two gRNAs used in our strategies cuts more efficiently and thereby causes a single homologous recombination event and insertion of the vector template. It is possible that originally using a strategy with only one gRNA could cause less insertion of the vector template, however this may be at the cost of gene editing efficiency. Indeed, when Ge et al (17) compared using one versus two gRNAs to induce HDR, they observed more reliable repair events when two gRNAs were used.
Major Comment 4 — Stability of backbone insertions across generations • Did you evaluate whether backbone insertions are stable across generations or prone to rearrangement?
Response: We did keep several of the lines reported in this paper stably across multiple generations, and we have added this observation to the manuscript
Major Comment 5 — Broader applicability in non-model organisms and therapeutic settings • A broader discussion of the potential applications of this approach in non-model insects, mammalian cells, or therapeutic settings where HDR is inefficient would be valuable.
Response: While we only investigated this effect in the creation of CRISPR/Cas9 Drosophila melanogaster models, it is very possible that this could also affect other model organisms or cells. We encourage the use of HDR template negative selection markers in all uses of HDR-mediated CRISPR/Cas9 genome editing.
Major Comment 6 — Cas9 promoter and expression level • The authors also mentioned using a validated Cas9 line (ref #23). What promoter drives Cas9 expression in this line? Did you consider testing different promoters? Since timing of Cas9 expression can be critical, promoter choice may have influenced the results and should be discussed.
Response: We used the nos promoter for the expression of Cas9, as this promoter is expressed in germ cells and is known to have better efficiency than the other germline promotor like vasa (Port et al 2014, Ref #23). However, it is conceivable that the high Cas9 concentration in this line could induce a higher rate of double stranded breaks and thus template vector insertion. We agree it would be interesting to test other Cas9 sources, though this would likely come at the cost of overall editing efficiency. As we describe, the use of pVID now allows negative selection against HDR template vector insertion even with this Cas9 source. We have expanded upon the potential use of other Cas9 sources in the revised discussion.
Reviewer 2
Major comments
None
Minor Comment 1 — Line 38: prior descriptions of backbone insertion in Drosophila Line 38: "this type of unwanted template vector insertion in the case of Drosophila genome editing has to our knowledge not been previously described." Insertion of vector sequences after CRISPR editing in Drosophila and strategies to mitigate such events have been previously described in multiple studies. The authors need to incorporate these into their manuscript. https://doi.org/10.1242/bio.20147682, https://doi.org/10.1080/19336934.2020.1832416, https://doi.org/10.1534/g3.116.032557.
Response: We are very grateful to the reviewer for pointing out these prior observations of vector insertion events of which we were not aware. This prior work has now been fully incorporated and referenced in the revised manuscript, and we have removed this erroneous statement. We feel this manuscript validates and quantifies the extent of HDR template insertion across multiple genome editing strategies and templates plus, with pVID, provides a solution to this vexing problem.
Minor Comment 2 — Line 79: PAM sequence sentence I have difficulties understanding the following sentence: Line 79: "At this location, on both sides of the insertion, the PAM sequence of the target region was edited to match the PAM sequence of the template donor plasmid." I assume what is meant here is that in the donor vector the PAM sequence was mutated to prevent recutting, but that means this sequence is no longer a PAM. Please rephrase for added clarity.
Response: The PAM sequence was indeed edited in the template donor plasmid to prevent re-cutting, and we are referring to this edited version of the PAM sequence in this sentence. We edited this sentence this to clarify that the PAM sequences have been edited.
Minor Comment 3 — Figure 2: panel D arrangement In Figure 2 panel D is arranged between panels E and F.
Response: Thank you for pointing this out. We have corrected this error.
Minor Comment 4 — Primer positions in figures In Figure 2 it would be useful to also indicate the position of the primers used in 2d in the schematic in 2e. The same applies to Fig. 3a and 4a.
Response: We have added the position of the primers in figure 2. Since the primers are targeting the backbone of the plasmid commonly in all projects included in this manuscript, we have chosen to only include one figure of this (figure 2).
Minor Comment 5 — Lines 89–90: duplicated sentence Lines 89, 90: Duplication of the same sentence.
Response: Thank you, we have corrected this mistake.
Minor Comment 6 — VGAT editing: consecutive editing and sgRNA placement Editing of the VGAT gene: In this case correct editing and plasmid insertions could be found on the same chromosomes. This might be caused by concatemer formation of repair intermediates (as has been described in multiple systems) or by consecutive editing events. Can you please specify whether the donor vector was designed to prevent consecutive editing? I'm also a bit confused about the locations of the sgRNA target sites according to Fig. 3a. It appears that part of the insertion (i.e. the ALFA tag) was encoded on the homology arm and not between the target sites. While such strategies have been described, they are often avoided as the efficiency of insertion decreases with increasing distance to the cut site. Was it not possible to us a sgRNA better matching the insertion cassette?
Response: For Vgat genome editing, we followed an existing strategy that has been proven effective, reusing the same gRNAs and overall approach to replace the 9×V5 tag with a 1×ALFA tag (Certel et al. 2022, Ref #28)
Minor Comment 7 — Line 133: mini-white marker unreliability Line 133: Please describe why the mini-white marker was unreliable.
Response: In our first design of the pVID vector, we used mini-white as the negative selection marker. However in a number of white eyed lines, we could still confirm the undesired insertion of the HDR template vector. We speculate that expression of mini-white (which we confirmed was not mutated) was repressed in these lines by an unknown mechanism. Since (Nyberg et al. 2020 , Ref #35) also proposed using mini-white as a negative vector selection marker, we wanted to mention this problem with mini-white negative selection, though we remain unsure of the exact cause. In any case, the use of exogenous ZsGreen in pVID as described in the manuscript fully resolved the issue allowing reliable detection of template vector insertion events as we describe.
Minor Comment 8 — Line 161: "varying frequency" Not sure I understand the sentence in line 161: If 54% of lines had vector insertion, what does the "varying frequency" refer to?
Response: We have edited this sentence to clarify that 54% of lines had vector insertion.
Minor Comment 9 — pVID availability in methods Consider highlighting the availability of pVID also in the methods section that described this plasmid.
Response: This has been added to the methods section.
Reviewer 3 No edits suggested.
We thank Reviewer 3 for their positive assessment of the manuscript and for confirming that no revisions are required.
Note: This preprint has been reviewed by subject experts for Review Commons. Content has not been altered except for formatting.
Learn more at Review Commons
The manuscript by Highly frequent undesired insertional mutagenesis during Drosophila genome editing by Kallstig et al. revolves around Homology-Directed Repair (HDR) and the surprisingly high frequency of plasmid backbone insertions into the genome.
In brief, the authors describe three independent experiments in which the intended homology regions were inserted together with plasmid backbone sequences into the Drosophila genome. Each experiment was designed with a slightly different setup: the first aimed to generate a humanized version of the TAR DNA-binding protein 43 (hTDP-43), while the second introduced an alpha tag into the Vesicular GABA transporter (VGAT) gene. In the first experiment, the pCR4 vector served as the backbone, whereas the second experiment relied on the pHSG298 vector. Both experiments resulted in relatively high frequencies of incorrectly edited genomes - 18% and even 66%, respectively. The authors hypothesized that the rate of undesired events could be even higher if the targeted gene is non-essential. To test this, the third experiment focused on mutagenesis of the Glutamate Receptor IIA (GluRIIA) gene, which is homozygous viable even in protein-null mutants. Indeed, the frequency of incorrect edits was approximately 11:1 (more than 90%). These findings suggest that plasmid backbone insertion is a common and important issue in HDR-based genome editing in Drosophila.
To address this problem, the authors designed a new vector. While the classical eye color marker (e.g., dsRED) serves for positive identification of HDR recombination, a second fluorescent marker (ZsGreen), encoded in the plasmid backbone and also expressed in the compound eye, enables clear detection of undesired plasmid backbone insertions.
The study is clearly written, and the plasmids are sufficiently well described in the figures. The reproducibility is somewhat limited by the use of different plasmids in combination with different target genes. Nevertheless, the number of analyzed insertions was high enough to convincingly illustrate the issue.
I find this manuscript to be a valuable description of an existing problem, together with a potentially efficient method for detecting undesired plasmid insertions. From an experimental perspective, I consider the comparison of three different vector backbones combined with different target genes to be rather difficult. On the other hand, as an experimental biologist, I completely understand the logic and the history of the problem-solving process. Undesired insertions were identified by different approaches (PCR and sequencing), and the authors clearly kept this issue in mind. When the problem persisted in the second experiment, and was even more pronounced in the third experiment (involving a non-lethal gene), they developed a vector that makes the screening process more efficient. Altogether this is a valuable technical study worth of reporting.
Note: This preprint has been reviewed by subject experts for Review Commons. Content has not been altered except for formatting.
Learn more at Review Commons
Summary In this manuscript Källstig, Ruchti, McCabe and colleagues report frequent undesired editing outcomes after CRISPR gene knock-ins in Drosophila. Using Cas9 for the targeted induction of DNA double strand breaks and plasmids with long homology arms as donor molecules, they find that the whole plasmid inserts with high frequency at multiple loci. To detect such events they generate a plasmid with a dominant marker encoded on the plasmid backbone, which can be used to enrich for correct insertions by negative selection.
Major comments
Minor comments
Line 38: "this type of unwanted template vector insertion in the case of Drosophila genome editing has to our knowledge not been previously described." Insertion of vector sequences after CRISPR editing in Drosophila and strategies to mitigate such events have been previously described in multiple studies: https://doi.org/10.1242/bio.20147682, https://doi.org/10.1080/19336934.2020.1832416, https://doi.org/10.1534/g3.116.032557. The authors need to incorporate these into their manuscript.
I have difficulties understanding the following sentence: Line 79: "At this location, on both sides of the insertion, the PAM sequence of the target region was edited to match the PAM sequence of the template donor plasmid." I assume what is meant here is that in the donor vector the PAM sequence was mutated to prevent recutting, but that means this sequence is no longer a PAM. Please rephrase for added clarity.
In Figure 2 panel D is arranged between panels E and F.
In Figure 2 it would be useful to also indicate the position of the primers used in 2d in the schematic in 2e. The same applies to Fig. 3a and 4a.
Lines 89, 90: Duplication of the same sentence.
Editing of the VGAT gene: In this case correct editing and plasmid insertions could be found on the same chromosomes. This might be caused by concatemer formation of repair intermediates (as has been described in multiple systems) or by consecutive editing events. Can you please specify whether the donor vector was designed to prevent consecutive editing? I'm also a bit confused about the locations of the sgRNA target sites according to Fig. 3a. It appears that part of the insertion (i.e. the ALFA tag) was encoded on the homology arm and not between the target sites. While such strategies have been described, they are often avoided as the efficiency of insertion decreases with increasing distance to the cut site. Was it not possible to us a sgRNA better matching the insertion cassette?
Line 133: Please describe why the mini-white marker was unreliable.
Not sure I understand the sentence in line 161: If 54% of lines had vector insertion, what does the "varying frequency" refer to?
Consider highlighting the availability of pVID also in the methods section that described this plasmid.
This manuscript describes vector backbone insertions as a frequent complication of CRISPR knock-in experiments in Drosophila and introduces a cloning vector with a selectable marker on the plasmid backbone that allows counter selection of such undesired events. The manuscript is very well written and the experiments are overall well designed.
Insertion of vector sequences during homologous recombination (often referred to as "ends-in" recombination events) has been described on multiple occasions in a wide variety of model systems. Also in Drosophila, the system used here, such events have been described by multiple groups (see comments above). Furthermore, plasmids designed to allow to counter select for such events have also been described previously (e.g. Addgene plasmids 157991, 80801).
In summary, this manuscript highlights once more an important complication in genome engineering experiments, but does not significantly advance the knowledge in the field beyond the existing literature and the described plasmid is largely redundant with preexisting plasmids designed for the same purpose. While this overall severely limits the significance of this work, it does provide important replication of previous work.
Note: This preprint has been reviewed by subject experts for Review Commons. Content has not been altered except for formatting.
Learn more at Review Commons
CRISPR/Cas9 genome editing has improved the ability to introduce precise genetic modifications in multiple organisms such as Drosophila melanogaster. By coupling Cas9-induced double-strand breaks with homology-directed repair (HDR), researchers can replace, insert, or delete genomic sequences with high specificity.
In this work, the authors explore significant concerns about the fidelity and outcomes of HDR-based editing. They identify a recurring issue since unintended insertions of the entire donor template vector into the genome was observed. These undesired events are observed across multiple genes, indicating that the problem is not locus- or construct-specific. These insertions can occur at high frequencies, complicating efforts to establish accurate transgenic lines. They not only mask intended edits but may also introduce unpredictable phenotypes unrelated to the desired genetic modification.
The authors addressed the problem of frequent donor plasmid insertions during CRISPR/Cas9 HDR in Drosophila by redesigning their HDR template vectors. They incorporated a GFP marker into the plasmid backbone alongside a DsRed cassette. This design allowed them to distinguish correct HDR events, which carried only DsRed, from aberrant plasmid integrations, which carried both DsRed and GFP. By screening flies for marker expression, they could rapidly identify and exclude incorrect insertions.
Please, see below my comments:
This paper will appeal primarily to researchers in the fields of functional genomics, insect genetics, and genome engineering, particularly those working with Drosophila or other model organisms where CRISPR/Cas9 is widely used. It is also of interest to scientists engaged in vector biology, agricultural pest control, and translational applications of genome editing, as the findings touch on broader issues of editing accuracy and unintended repair outcomes.
The main advance of the study is the clear demonstration that unintended donor plasmid backbone insertions are not rare artifacts, but frequent and systematic events during CRISPR/Cas9-mediated HDR in Drosophila. By integrating a GFP marker into the plasmid backbone alongside the intended DsRed marker, the authors provide a straightforward and practical method to identify, separate, and exclude these erroneous events. This approach both highlights the hidden pitfalls of HDR-based editing and offers an effective solution, thereby improving the reliability of CRISPR applications. Beyond Drosophila, the work advances the field by underscoring the need for careful design and validation of donor constructs, with potential implications for genome editing strategies in other organisms where HDR efficiency and fidelity remain key challenges.
https://yukon-outfitters.com/products/scout-sling-pack?variant=42977841479848<br /> Scout Sling Pack<br /> $ 49.99 USD
These Writing Devices Changed How I Write (7 Tested)<br /> by BYOK
Getty Center in Los Angeles Is Closing for Year of Renovations - The New York Times<br /> by [[Matt Stevens]]<br /> accessed on 2026-04-17T10:02:41
Herbert Gross' complex variables course is a delight to follow even for those already familiar with the material https://youtube.com/playlist?list=PLD971E94905A70448
via u/innovatedname at https://www.reddit.com/r/math/comments/1shlljv/20th_century_math_explainers/
There's an amazing and very large list of Open University courses by T. K. Finchley here https://tkfinchley.com/ou-maths-courses/. I particular recommend their course OU M335/M386/M435 Metric and Topological Spaces and Geometric Topology. Just wonderful pedagogy
via u/dnrlk at https://www.reddit.com/r/math/comments/1shlljv/20th_century_math_explainers/
OLIVETTI'S ONE SPANISH PLANT TO CLOSE AT COST OF 185 JOBS - Tech Monitor<br /> by [[CBR Staff Writer]]<br /> accessed on 2026-04-17T09:50:16
no typewriters at this factory closing in 1996...
“Raffaella della Olga: Typescripts,” the artist’s first solo museum show brings together her artist’s books, mesmerizing typed paintings, and striking cut-fabric works. Her work is accompanied by rare and artist’s books from the Clark library, spanning the late nineteenth century to the present, which reflect the typewriter’s still-vivid potential as a creative tool. “Raffaella della Olga: Typescripts” is open through May 31, 2026.
The advice in your last picture is spot on. I have had success with #0000 steel wool and metal polish in particular.
Advice for polishing and cleaning up nickel plating
via Erik Bruchez https://www.facebook.com/groups/705152958470148/posts/1230905545894884/
Others recommend penetrating oil or WD-40 in combination with 0000 steel wool which should be enough to remove corrosion, but not damage the nickel plating.
I've also seen Marty Morren suggest 0000 inside Dremel tools for dealing with nickel plated key rings.
ne reason for ETA’s limited impact, despite the horrific scale and widepublic impact of its killing sprees, was that most Basques identified neitherwith its means nor with its end
violence for the sake of violence
This did not prevent ETA from assassinating Franco’sPrime Minister (Admiral Luis Carrero Blanco) in Madrid on December 20th1973, or killing twelve civilians in a bomb attack in the capital nine monthslater. Nor did the execution of five ETA gunmen in September 1975, shortlybefore Franco’s death, have any moderating impact upon the group’sactivities.
good stats to show crisis of sociap peace
verything distinctively Basque was aggressively repressed throughoutthe Franco years: language, customs, politics.
people were angred that, in a time when self-expression was encouraged, their identity was being squashed!
The Basque country of northern Spain had always been a particular target ofFranco’s ire: partly because of its identification with the Republican cause inthe Spanish Civil War, partly because the Basques’ longstanding demand tobe recognized as different ran counter to the deepest centralizing instinctsand self-ascribed, state-preserving role of the Spanish officer corps
stemmed from old grievances that flared to life in the 70s
Analyse des Zones Grises de l'Information : Désinformation, Régulation et Défis Sociétaux
Ce document de synthèse s'appuie sur les auditions menées par la mission d'information du Sénat sur les médias en ligne et la manipulation de l'opinion.
Les experts Gérald Bronner, Haude Favre et Thomas Huchon y dressent un constat alarmant : la dérégulation du marché de l'information, couplée à l'hyper-modernité des plateformes numériques, menace les fondements de la délibération démocratique.
Les points saillants de cette analyse incluent :
L'échec de la régulation spontanée : Contrairement aux espoirs des Lumières, le libre marché des idées ne favorise pas naturellement la vérité ; le "vrai" ne peut plus se défendre seul face à la "pensée paresseuse" (lazy thinking).
Le rôle pivot des plateformes : Celles-ci ne doivent plus être considérées comme de simples hébergeurs ("tuyaux"), mais comme des médias éditant des contenus via des algorithmes opaques.
Un modèle économique toxique : La désinformation est un secteur d'activité lucratif, financé indirectement par la publicité programmatique de grandes marques et soutenu par l'économie de l'attention.
Une vulnérabilité démographique inattendue : Si les jeunes sont exposés, les adultes de plus de 25 ans sont les principaux vecteurs de diffusion des fausses informations (88 % du volume).
L'urgence d'une réponse systémique : La solution réside dans un triptyque mêlant rapport de force législatif avec les plateformes, éducation aux médias (EMI) et stimulation de la pensée analytique.
--------------------------------------------------------------------------------
Typologie de l'information problématique
Gérald Bronner distingue trois phénomènes essentiels pour caractériser les "zones grises" :
Désinformation : Diffusion volontaire et intentionnelle de fausses informations à des fins de manipulation (ex : ingérences étrangères).
Mésinformation : Diffusion de fausses informations en toute sincérité, par croyance.
Malinformation : Utilisation d'informations vraies mais détournées ou présentées de façon parcellaire pour imposer une lecture unique et idéologique d'une situation complexe.
L'ouverture du marché des idées, autrefois entravé par des tutelles religieuses ou philosophiques, a abouti à une dérégulation totale.
Cette situation crée une asymétrie majeure :
Ces comptes sont souvent occupés par des profils radicaux (antivax, conspirationnistes, extrémistes) qui bénéficient d'une visibilité disproportionnée par rapport à leur représentativité réelle.
--------------------------------------------------------------------------------
Le "Lazy Thinking" (Pensée Paresseuse)
Le facteur prédictif principal de l'adhésion à la désinformation est l'avarice cognitive.
L'esprit humain privilégie les propositions intellectuellement satisfaisantes plutôt que les vérités complexes.
Les algorithmes exploitent cette faille en favorisant :
Facebook a, par exemple, valorisé cinq fois plus les réactions "colère" que les simples "likes".
Thomas Huchon souligne que les plateformes numériques remplissent les trois fonctions d'un média :
Éditorialisation : Le contenu affiché est personnalisé et trié par des algorithmes.
Diffusion d'information : Elles sont la source principale d'accès au monde pour des millions de citoyens.
Monétisation : Elles tirent profit de ces deux premières opérations.
En conséquence, le statut d'hébergeur dont elles bénéficient est jugé obsolète et frauduleux.
--------------------------------------------------------------------------------
Le business lucratif du faux
La désinformation est décrite par Haude Favre comme un véritable "secteur d'activité".
Ce marché est alimenté par :
La publicité programmatique : Des algorithmes placent des publicités de grandes marques ou d'organismes publics sur des sites complotistes ou haineux sans que les annonceurs en aient conscience.
Le manque d'incitation à la propreté publicitaire : Les agences de publicité et les marques hésitent à investir dans des outils de filtrage (comme SmarterAds ou les listes d'exclusion) par souci de coût.
Chiffres clés : La publicité sur les sites de désinformation a pu représenter jusqu'à 2,6 milliards de dollars par an.
Le coût global de la désinformation pour les entreprises occidentales en 2024 est estimé à plus de 400 milliards de dollars.
Cas d'étude : L'affaire des punaises de lit (2023)
Cette opération d'influence russe a illustré l'impact économique direct de la désinformation.
Six entreprises majeures (SNCF, RATP, Air France, groupes de cinémas) ont vu leur chiffre d'affaires impacté par une psychose artificielle créée par des services de renseignement étrangers.
--------------------------------------------------------------------------------
La désinformation ne reste pas confinée à la sphère numérique.
Elle produit des effets physiques :
Thomas Huchon témoigne d'une agression physique grave par un ancien proche radicalisé.
Destabilisation du socle épistémique : Sans accord sur l'existence d'un réel commun (ex: réalité du virus COVID-19), aucune politique publique rationnelle n'est possible.
Adhésion croissante : 37 % des Français déclarent adhérer à au moins une théorie du complot.
Contrairement aux idées reçues, les jeunes ne sont pas les principaux diffuseurs de fake news.
Les moins de 25 ans ne représentent que 12 % de la diffusion.
Les plus de 50 ans sont plus susceptibles de partager des contenus faux, car leurs convictions sont plus ancrées et ils sont moins habitués à la manipulation technique des outils.
--------------------------------------------------------------------------------
Application stricte du DSA (Digital Services Act) : Imposer des amendes allant jusqu'à 6 % du chiffre d'affaires mondial et forcer l'accès aux données pour les chercheurs.
Algorithme chronologique : Obliger les plateformes à proposer un flux sans intervention algorithmique pour restaurer le libre arbitre (ex : jurisprudence récente aux Pays-Bas contre Instagram).
Responsabilisation des annonceurs : Intégrer la lutte contre la désinformation dans les politiques RSE des entreprises.
Distinction EMI et Esprit Critique : L'éducation aux médias (EMI) enseigne la compréhension de l'environnement, tandis que le développement de l'esprit critique stimule la métacognition (prendre conscience de ses propres biais).
Formation tout au long de la vie : Étendre ces formations au monde du travail et à la formation continue, et non les limiter au cadre scolaire.
Mesure de l'impact : Systématiser les pré-tests et post-tests pour évaluer l'efficacité réelle des interventions pédagogiques.
Le débat sur la labellisation reste ouvert :
Risques : Un label "venant d'en haut" pourrait être contre-productif et alimenter la défiance.
Opportunités : Un système inspiré du "Nutriscore" pour l'information sanitaire ou des critères déontologiques (plutôt qu'éditoriaux) pourrait améliorer la lisibilité pour le citoyen.
--------------------------------------------------------------------------------
« La terrible nouvelle que le monde contemporain nous livre c’est que non, le vrai ne peut pas se défendre tout seul. » — Gérald Bronner
« Ce ne sont pas des tuyaux, ce sont des médias. [...] Ils nous ont privés de notre libre arbitre. » — Thomas Huchon
« Les associations [d'éducation aux médias] sont en train de mourir faute de moyens, alors que nous sommes submergés d'appels de parents et de professeurs démunis. » — Haude Favre
« Bien informés, ils seront des citoyens ; mal informés, ils redeviendront des sujets. » — Thomas Huchon (citant Alfred Sauvy)
Hamilton Typewriter Company opens at Cotton Factory, reviving vintage craft<br /> CHCH News on 2026-03-28
This might be the case not just for developmentof political attitudes in the US South but also in other arenaswithin American politics and elsewhere in the world
I'm not sure American has an institution as prevalent as slavery
an im-pact on political habit whose influence has not worn awayeven yet.
But 150 years later, good god that's depressing
As affirmative support, we showed that greaterprevalence of slavery predicts more conservative (for manyyears more Democratic) presidential vote shares, higher ratesof radical violence, and decreased wealth concentrated inblack farms in the decades after Reconstruction
The system was never in doubt
(i) partisan identification,(ii) attitudes on affirmative action, (iii) levels of racial re-sentment, and (iv) attitudes toward blacks
Directly, not just through institutions
What these correlations show is that children withracially conservative parents in 1965 are more likely to beracially conservative themselves at least through age 50,which is evidence of intergenerational socialization.
Lowkey how is this possible, maybe only people that stay in the south
which measured the racial attitudes of anational probability sample of high school senior studentsin 1965 along with their parents
The data that exists is so fucking cool
10 percentage point increase in proportion slave leads to a1.8 percentage point drop in the percent of whites whoidentify as Democrat today (95% confidence interval:[22.7, 21.0]). Where mechanization grew rapidly, with0.06 more tractors per 100,000 acres (90th percentile), thesame change in proportion slave leads to only a 0.2 per-centage point decrease in the percent Democrat (95%confidence interval: [21.1, 0.06]).
There is an economic story that some counties dodge with mechanization
the incentives for whites tointerfere in the labor market with such tactics should lessen
The economic incentives
in comparison to white farmers, blackfarmers in former high-slave areas were significantly worseoff than those in other areas of the South. They were morelikely to be under tenancy agreements and less likely to owntheir own farm.
The perpetuation of slavery in places that had high levels of population antebellum had greater racism afterwards
is greater in counties that had highslave proportions in 1860,
The political resentment, although they must be controlling for population size
but also to suppresstheir mobility and wages
This is a rehash of Du Bois
does not trace itsorigins to this time period.
Happens after the civil war
In both states,perhaps surprisingly, there is little evidence of a strongrelationship between slavery and vote choice, even in anelection that focused so heavily on the issue.
I wonder if this was just because the populations were not that politically active
differences in white viewsappear to organize around the density of slavery more stronglyafter the Civil War.
When the economic and political salience is heightened
suggesting that there is some decay in these geographicallybased relationships over time
But I also think that there is some floor where racial attitudes will always exist
they were threat-ening because they were an important provider of labor and,in the post-emancipation environment, they could leave.
It's an economic story
poor whites were complicitwith the landowning elite and would engage in and supportviolent acts toward blacks, even though such violence couldpresumably also lower white wages
Acting against their interest to maintain racial hierarchy
emancipation brought blacks some freedomover the amount of labor they supplied, and many ex-slaveschose to work for themselves rather than for the white rulingclass
And so they were to be economically controlled
evidence for intergenerational transmission of racialattitudes.
This is the part I'm most skeptical about, personal passing down as opposed to organizations
institutionalpath dependence and intergenerational socialization
The organizations and people passing down values
bypromoting racially targeted violence, anti-black norms, and,to the extent legally possible, racist institutions.
I mean partly the story is just that this also still exists today. Slavery –> redemption –> Jim Crow, the line is pretty clear
Proportion slave, 1860
Stays the same
the effects are in the oppositedirection as statistical discrimination theory would predict.
Don't discriminate against the poor
discrimination against blacks because they are, on average,poorer than whites
I mean one thing worth noting is even when it is not direct, the legacy of slavery is so freaking pervasive
butthose differences are fairly constant across proportion slavein the county.
The slave counties would not have systematically different populations today
For geographic sorting to explain our results, patterns ofmobility into (and out of ) the former slaveholding areaswould have to differ from non-slaveholding areas
Would have to specific to those counties
Proportion slave, direct effect
If this was working through population today this table would not have significant results
Indeed, the correlationbetween percent slave in 1860 and percent black in 2000 is0.77
That's just lowkey crazy
Cotton suitability
The effects of slavery itself are still prevelant
Second, because counties may have had different norms aboutrace, we include controls for (vi) the proportion of total pop-ulation in 1860 that is free black.
These aren't the best proxies
but we use the differ-ence in case slavery has an overall effect on racial groupthermometer ratings
Just hate the world overall more
but may also reflect beliefs on policy issuesclosely related to race, including redistribution
i.e. being a republican means hating welfare
for example, income gaps betweenblacks and whites, urban-rural differences, and other con-textual and individual-level factors
maybe legacy of slavery but not direct
should have decayed more) in areaswhere the incentives for anti-black attitudes faded earlier
What is the timeline for complete escape
ntergenerational socialization
See previous articles we've read
reacted more sharply toemancipation by curtailing blacks’ rights and oppressing newlyfreedmen and their mobility
At the time, and the answer is its naive to think those feelings just went away
the historical persistence of attitudes orig-inating in slavery and (ii) contemporary factors, includingcontemporary demographics and geographic mobility.
Of course in reality somewhere in the middle
if the politics of the South revolves aroundany single theme, it is that of the role of the black belts”
Black population is concentrated here
makingour position quite distinct from much of the existing publicopinion literature.
Parents are just socializing their kids
abruptly increasing black wages, raising la-bor costs, and threatening the viability of the Southern plan-tation economy
In other words, back towards slavery attitudes still exist today
Du Bois (1935)
read this
that un-dermined Southern whites’ political and economic power.
It started as a "racial threat" but then it just exists in the minds of these Americans for generations afterwards
We show thatthese differences are robust to accounting for a variety offactors, including geography and mid-nineteenth-centuryeconomic and social conditions.
Not just an economic thing
weshow that whites who currently live in counties that hadhigh concentrations of slaves in 1860 are today on averagemore conservative and express colder feelings toward Af-rican Americans than whites who live elsewhere in theSouth.
So is this the more rural places, the isolation through generations I suspect is also not good
which in turn have been passeddown locally across generations
Interested in the mechanism of how this works
Following the Civil War, Southern whites faced political and economicincentives to reinforce existing racist norms and institutions to maintain control over the newly freed African Americanpopulation.
Du Bois
Whites who currently live in Southern counties that had highshares of slaves in 1860 are more likely to identify as a Republican, oppose affirmative action, and express racial re-sentment and colder feelings toward blacks
This is a famous paper, whose results I have heard before
Sappiamo quanto sia importante
TEST 3
Dalle cime delle Dolomiti
TEST2
n ecosistema di bene
TEST
Hallo
manca la didascalia
The SWAR framework is a methodologically sound response to a genuine gap in the field and treating AI tool evaluation as a platform trial rather than a one-time benchmark exercise is exactly the right conceptual move.
One aspect that could be further developed in the full protocol concerns the operational rules governing interim analyses. Specifically, it would be valuable to clarify whether tool removal will follow pre-specified stopping criteria (analogous to O'Brien-Fleming bounds in adaptive clinical trials) or whether decisions will rest primarily with the Adjudication and Data Monitoring Committee. In platform trials, this distinction is foundational: pre-specified rules protect against decision bias and enhance reproducibility, while discretionary adjudication offers flexibility but may introduce subjectivity that is difficult to audit retrospectively.
Making this explicit — perhaps through a decision framework or stopping rule table within the protocol — would not only strengthen methodological transparency but also make the CESAR blueprint easier to replicate by other review teams seeking to adopt this approach.
Dear authors, this is a minor but meaningful addition that could significantly increase the protocol's utility as a field-wide standard.
Congratulations to the entire CESAR team for a genuinely innovative contribution to evidence synthesis methodology. The field needed this. 👏
Vanessa Bertolucci
队列粒度负载均衡(4.x 默认策略)
==一个队列一个消费者== [如果其中一个消费者挂掉,消费者组内的其他消费者接替挂掉的消费者继续消费]
Cavallino Bianco Val Gardena - Dolomiti
Da Val Gardena si va a capo
East Nashville gifted with free sidewalk poetry<br /> News Channel 5 Nashville, TN
Controllare claim (c'è solo panoramica)
Lino, compagno di AVVENTURE
Lino e Valli, compagni di... (guarda sito online di Caorle) controllare anche testo sotto.
POST Go live: inserire CTA di caorle o ortisei
It is impossible for me to isolate when exactly it was that I first learned of the 1811 German Coast Uprising.
testy
For Backwater Truths, my continued artistic aesthetic requires of me the practice of working with Black Indigenous queer technologies and histories; technologies that disrupt white dominant concepts of time, gender, borders, and extreme systems of punishment that have altered a natural order. In understanding the reimagination of the backwaters, the aesthetics that became relevant for the foundation of this work are Kevin Quashie’s use of Black aliveness, Katherine McKittrick’s context of Black cartographies, and Leanne Betasamosake Simpson’s context of layering.
test
are
is
eLife Assessment
This is a valuable study that investigates the role of the long non-coding RNA Dreg1 for the development, differentiation, or maintenance of group 2 ILC (ILC2). The authors generate Dreg1-/- mice and show a reduction of group 2 innate lymphoid cells (ILC2). However, the strength of evidence supporting the impact of Dreg1 on Gata3 expression, a transcription factor required for ILC2 cell fate decisions, and the cell-intrinsic requirement of Dreg1 for ILC2 remain incomplete. This study will be of interest to immunologists.
Reviewer #1 (Public review):
Summary:
This study examines the role of the long non-coding RNA Dreg1 in regulating Gata3 expression and ILC2 development. Using Dreg1 deficient mice, the authors show a selective loss of ILC2s but not T or NK cells, suggesting a lineage-specific requirement for Dreg1. By integrating public chromatin and TF-binding datasets, they propose a Tcf1-Dreg1-Gata3 regulatory axis. The topic is relevant for understanding epigenetic regulation of ILC differentiation.
Strengths:
(1) Clear in vivo evidence for a lineage-specific role of Dreg1.
(2) Comprehensive integration of genomic datasets.
(3) Cross-species comparison linking mouse and human regulatory regions.
Weaknesses:
(1) Mechanistic conclusions remain correlative, relying on public data.
(2) Lack of direct chromatin or transcriptional validation of Tcf1-mediated regulation.
(3) Human enhancer function is not experimentally confirmed.
(4) Insufficient methodological detail and limited mechanistic discussion.
Comments on revisions:
The authors have provided clear evidence that Dreg1 is necessary for ILC2 development, but their refusal to perform any mechanistic experiment remains a significant weakness. While their appeal to the 3Rs and the use of public datasets is noted, re-analyzing external data from heterogeneous sources cannot substitute for direct, internal validation of the Tcf1-Dreg1-Gata3 axis in their specific knockout model. This is particularly problematic because ILC2 progenitors, though rare, can be isolated from bone marrow, especially since assays like CUT&Tag and others are specifically designed for low cell numbers. By relying on public T-cell CRISPR screens to justify human ILC2 functions, the authors are substituting cross-cell-type correlation for definitive functional proof. Consequently, the manuscript currently describes a discovery of necessity without providing a verified molecular mechanism, which should be more explicitly reflected in the title and conclusions.
Reviewer #2 (Public review):
The authors investigate the role of the long non-coding RNA Dreg1 for the development, differentiation or maintenance of group 2 ILC (ILC2). Dreg1 is encoded close to the Gata3 locus, a transcription factor implicated in the differentiation of T cells and ILC, and in particular of type 2 immune cells (i.e., Th2 cells and ILC2). The center of the paper is the generation of a Dreg1-deficient mouse. The role of Dreg1 in ILC2 was documented by mixed bone marrow experiments. While Dreg1-/- mice did not show any profound ab T or gd T cell, ILC1, ILC3 and NK cell phenotypes, ILC2 frequencies were reduced in various organs tested (small intestine, lung, visceral adipose tissue). In the bone marrow, immature ILC2 or ILC2 progenitors were reduced whereas a common ILC progenitor was overrepresented suggesting a differentiation block. Using ATAC-seq, the authors find the promoter of Dreg1 is open in early lymphoid progenitors and the acquisition of chromatin accessibility downstream correlates with increased Dreg1 expression in ILC2 progenitors. Examining publicly available Tcf1 CUT&Run data, they find that Tcf1 was specifically bound to the accessible sites of the Dreg1 locus in early innate lymphoid progenitors. Finally, the syntenic region in the human genome contains two non-coding RNA genes with an expression pattern resembling mouse Dreg1.
The topic of the manuscript is interesting. The article is focused on the first description of the Dreg1 knockout mouse and the specific effect of Dreg1 deficiency on ILC2 development.
(1) The data of how Dreg1 contributes to the differentiation and or maintenance of ILC2 is not addressed at a very definitive level. Does Dreg1 affect Gata3 expression, mRNA stability or turnover in ILC2? Previous work of the authors indicated that knock-down of Dreg1 does not affect Gata3 expression (PMID: 32970351). The current data (Figure 2H) showed small differences in Gata3 expression in CHILP which were, however, not statistically significant. No differences were found in ILCP and ILC2P.
(2) How Dreg1 exactly affects ILC2 differentiation remains unclear.
Author response:
The following is the authors’ response to the original reviews
Public Reviews:
Reviewer #1 (Public review):
Summary:
This study examines the role of the long non-coding RNA Dreg1 in regulating Gata3 expression and ILC2 development. Using Dreg1-deficient mice, the authors show a selective loss of ILC2s but not T or NK cells, suggesting a lineage-specific requirement for Dreg1. By integrating public chromatin and TF-binding datasets, they propose a Tcf1-Dreg1-Gata3 regulatory axis. The topic is relevant for understanding epigenetic regulation of ILC differentiation.
Strengths:
(1) Clear in vivo evidence for a lineage-specific role of Dreg1.
(2) Comprehensive integration of genomic datasets.
(3) Cross-species comparison linking mouse and human regulatory regions.
Weaknesses:
(1) Mechanistic conclusions remain correlative, relying on public data.
We agree that the mechanistic conclusions are of our study are indeed correlative and we mention this in the discussion. The primary work of the study is the discovery of Dreg1's necessity for ILC2 development via the new knockout mouse model. Re-analysing good quality publicly available data on rare cell populations is an appropriate approach and in line with DORA guidelines for ethical research.
(2) Lack of direct chromatin or transcriptional validation of Tcf1-mediated regulation.
The most appropriate way to examine direct Tcf1 target genes in primary cells is to examine the association of Tcf1 binding with the changes that occur in Tcf1-bound genes after Tcf7 knockout. By analysing publicly available data on ILC progenitors we indeed did this. We revealed that Tcf1 bound to Dreg1 and that Dreg1 was not expressed when Tcf1 was knocked out in ILC progenitors. In addition we examined H3K27ac at the Dreg1 locus in the same ILC progenitors to demonstrate that Tcf1 appears to be important for decorating the Dreg1 gene with this histone modification. We believe that this analysis is sufficient to conclude that Tcf1 is required for the expression of Dreg1 in ILC progenitors.
(3) Human enhancer function is not experimentally confirmed.
We agree that the potential human enhancer of GATA3 we identified has not been confirmed in human ILC. However, a previous study showed clear evidence that this region has GATA3 enhancer activity in human T cells. Therefore, while not specific to ILC2s the region where the DREG1 homologues lie does indeed harbour enhancer activity.
(4) Insufficient methodological detail and limited mechanistic discussion.
We have now made the changes suggested by the reviewer to both the methods/figure legends and also the discussion.
Reviewer #1 (Recommendations for the authors):
The authors generated Dreg1-deficient mice and demonstrated that loss of this locus selectively reduces ILC2s but not T or NK cells, indicating a lineage-specific requirement for Dreg1 in ILC development. By analyzing publicly available chromatin accessibility and transcription factor-binding datasets, they link Dreg1 expression to Tcf1-dependent chromatin activation and extend their findings to human data by identifying a syntenic GATA3 enhancer that produces homologous Dreg lncRNAs in ILC2s. While the study addresses an interesting question, most of the mechanistic interpretations rely heavily on publicly available datasets rather than the authors' own functional evidence. To establish causality and reinforce the overall conclusions, I provide below some comments and suggestions for additional experiments and clarifications that would considerably strengthen the manuscript.
(1) In Figure 3, the authors use public datasets to argue that Tcf1 regulates Dreg1 expression by modulating chromatin accessibility and H3K27ac at its locus. However, since these data are derived from heterogeneous external sources, the conclusions remain associative. To better support causality, the authors should generate matched datasets from their own sorted progenitor populations and perform CUT&Tag for Tcf1 and H3K27ac in wild-type and Tcf7 knockout progenitors to directly test whether Tcf1 binding establishes an active chromatin state at Dreg1. Also, complementing this with nascent RNA or pre-mRNA quantification would link chromatin activation to transcriptional output. These experiments are technically feasible in progenitors and would substantially strengthen the claim that Tcf1 directly drives Dreg1 activation during ILC development.
We believe that utilising publicly available data sufficiently answers this question while also adhering to ethical considerations. The ILC populations used to produce the publicly available data were akin to those we examined in our analyses, and the data was of sufficient quality. Moreover, they enable us to access data from Tcf1-deficient mice. Redoing large-scale chromatin profiling on rare cell types would require hundreds of mice to achieve sufficient cell numbers. Repeating this solely for “originality” contradicts the 3Rs principles (replacement, reduction, refinement) if high quality public data already exists and we feel will require years of redundant work. In addition, we believe the fact that the data derive from heterogenous external sources, yet align well, only strengthen our conclusions. We have now added mention to our use of publicly available data in the discussion.
(2) In Figure 4, the authors provide correlative evidence from public datasets suggesting that the human region syntenic to the murine Dreg1 locus acts as a distal enhancer of GATA3 and gives rise to two ILC2-specific lncRNAs. To substantiate this claim, the authors should perform CUT&Tag for H3K27ac in human ILC2s to confirm enhancer activation and use 3C or HiChIP to demonstrate physical interaction with the GATA3 promoter. These experiments should be doable by fusing pooled ILC2 samples and would provide more direct evidence that this region actively regulates GATA3 expression.
Assessing the activity of a distal enhancer region on its target gene in primary human cells is extremely difficult, due to a number of technical and biological complications such as enhancer redundancy. This is why we chose to reanalyse an extensive enhancer deletion screen performed in human T cells by Chen et al., AJHG 2023. This analysis clearly showed deletion of the region we identified as harbouring Dreg1 homologues affected GATA3 expression, thus confirming its enhancer activity. While we agree with the reviewer that specific profiling of human ILC populations for H3K27ac and 3D genome architecture would provide further correlative evidence this will be a time-consuming and costly endevour with human material and ultimately the definitive proof in ILCs would require specific deletion of this region in ILC2s. We have mentioned this caveat in the discussion.
(3) Several figure legends lack essential methodological details. Figure 1 should specify how NK and ILC populations were gated, including intermediate steps and markers used. The same applies to Supplementary Figure 1, and particularly to Supplementary Figure 2, where gating strategies for progenitors are shown but not explained. Figure 2 should also indicate that these analyses were performed in bone marrow. Clearer legends are crucial for interpreting and reproducing the data.
We have made the suggested changes.
(4) It is also unclear throughout the manuscript whether the authors performed any ATACseq experiments themselves or relied entirely on public datasets. This information should be stated explicitly in the main text and figure legends, not only in the Methods section. Similarly, the source of the ChIPseq or CUT&Run datasets should be clearly indicated alongside the relevant figures.
We apologise for not making this clearer and have now clearly articulated if the data was public in the text.
(5) As the authors themselves suggest, performing experiments that selectively suppress Dreg1 transcription using antisense oligonucleotides or CRISPR interference at the Dreg1 promoter would provide more valuable mechanistic insights. Conducting these experiments in their own system would allow them to determine whether Dreg1 functions through its RNA product or as a DNA enhancer element, thereby strengthening the causal link between Dreg1 activity and Gata3 regulation.
We agree with the reviewer, however, this, in our opinion is beyond the scope of this manuscript. The strength of this manuscript lies in the findings from the novel Dreg1 knockout mouse strain. Future studies will focus on understanding how Dreg1 influences Gata3 expression.
(6) The discussion would benefit from a clearer and more integrated explanation of how Dreg1 fits into the transcriptional network that controls ILC2 differentiation. The authors could elaborate on whether Dreg1 fine-tunes Gata3 expression or functions as part of a regulatory loop with Tcf1, and better explain how this mechanism might be conserved in humans. In addition, the authors should explicitly acknowledge the limitations of relying on publicly available datasets and emphasize the need for direct experimental validation to support their mechanistic interpretation.
We have now made these suggested inclusions.
Reviewer #2 (Public review):
The authors investigate the role of the long non-coding RNA Dreg1 for the development, differentiation, or maintenance of group 2 ILC (ILC2). Dreg1 is encoded close to the Gata3 locus, a transcription factor implicated in the differentiation of T cells and ILC, and in particular of type 2 immune cells (i.e., Th2 cells and ILC2). The center of the paper is the generation of a Dreg1-deficient mouse. While Dreg1-/- mice did not show any profound ab T or gd T cell, ILC1, ILC3, and NK cell phenotypes, ILC2 frequencies were reduced in various organs tested (small intestine, lung, visceral adipose tissue). In the bone marrow, immature ILC2 or ILC2 progenitors were reduced, whereas a common ILC progenitor was overrepresented, suggesting a differentiation block. Using ATAC-seq, the authors find that the promoter of Dreg1 is open in early lymphoid progenitors, and the acquisition of chromatin accessibility downstream correlates with increased Dreg1 expression in ILC2 progenitors. Examining publicly available Tcf1 CUT&Run data, they find that Tcf1 was specifically bound to the accessible sites of the Dreg1 locus in early innate lymphoid progenitors. Finally, the syntenic region in the human genome contains two non-coding RNA genes with an expression pattern resembling mouse Dreg1.
The topic of the manuscript is interesting. However, there are various limitations that are summarized below.
(1) The authors generated a new mouse model. The strategy should be better described, including the genetic background of the initially microinjected material. How many generations was the targeted offspring backcrossed to C57BL/6J?
The mice were backcrossed for at least 2 generations to C57BL/6. This information is now included in the methods section.
(2) The data is obtained from mice in which the Dreg1 gene is deleted in all cells. A cell-intrinsic role of Dreg1 in ILC2 has not been demonstrated. It should be shown that Dreg1 is required in ILC2 and their progenitors.
We now provide new mixed bone marrow irradiation chimera data that shows that the effect is intrinsic to Dreg1-deficient ILC2 cells (Figure 1F and Supplementary Figure 1E-G).
(3) The data on how Dreg1 contributes to the differentiation and or maintenance of ILC2 is not addressed at a very definitive level. Does Dreg1 affect Gata3 expression, mRNA stability, or turnover in ILC2? Previous work of the authors indicated that knockdown of Dreg1 does not affect Gata3 expression (PMID: 32970351).
We have indeed shown that Dreg1-deficient ILC2P have reduced levels of Gata3 (Figure 2H) however we have not determined the exact mechanisms by which Dreg1 controls ILC2 development.
(4) How Dreg1 exactly affects ILC2 differentiation remains unclear.
We agree with the reviewer, however, this article is focused on the first description of the Dreg1 knockout mice and the surprisingly specific effect on ILC2 development.
Reviewer #2 (Recommendations for the authors):
(1) Relating to point 2 of public review:
It should be shown that Dreg1 is required in ILC2 and their progenitors. Mixed bone marrow chimeras would be an adequate strategy.
We have now done this and clearly showed that the effect is intrinsic to Dreg1-deficient ILC2s.
(2) Relating to point 3 of public review:
Minimally, Gata3 expression should be analyzed in ILC2, ILC2P, and the ILC progenitors by qRT-PCR and antibody stain.
We have indeed shown reduced Gata3 levels by antibody stain in Figure 2H.
(3) Relating to point 4 of public review:
The manuscript would benefit from additional data studying ILC2 differentiation in (competitive) adoptive transfer experiments or using in vitro differentiation assays.
We have performed the mixed bone marrow chimera experiments which are testing the competitiveness of Dreg1-deficient bone barrow with control wildtype. In this case the WT ILC2s outcompeted the Dreg1-deficient ILC2s for the same niche.
eLife Assessment
This important study investigated whether the nuclear receptor Nur77 is regulated by a non-canonical mechanism of ligand-induced disruption of its interaction with RXRg, similar to the family member Nurr1. The overall evidence is compelling. This manuscript will be of interest to scientists focusing on mechanisms of transcriptional regulation.
Reviewer #1 (Public review):
Summary:
This foundational study builds on prior work from this group to reveal the complexities underlying ligand-dependent RXRγ-Nur77 heterodimer formation, offering a compelling re-evaluation of their earlier conclusions. The Authors examine how a library of RXR ligands influences the biophysical, structural, and functional properties of Nur77. They find that although the Nur77-RXRγ heterodimer shares notable functional similarities with the Nurr1-RXRα complex, it also exhibits unique features - notably, both dimer dissociation and classical agonist-driven activities. This work advances our understanding of the nuanced behaviors of nuclear receptor heterodimers, which have important implications for health and disease.
Strengths:
(1) Builds on previous work by providing a comprehensive analysis that examines whether Nur77-RXRγ heterodimer formation parallels that of the Nurr1-RXRα complex.
(2) Systematic evaluation of a library of RXR ligands provides a broad survey of functional outputs.
(3) Careful reanalysis of previous work sheds new light on how NR4A heterodimers function.
Weaknesses:
(1) Some conclusions appear overstated or are not well substantiated by the work presented. It's unclear how the data support a non-classical mode of agonism, for example, based on the data shown.
(2) Some assays have relatively few replicates, with only two in some cases.
Comments on revisions:
I'm satisfied with the revised version.
Reviewer #2 (Public review):
Summary:
This study explores the mechanisms by which binding of the nuclear receptor RXRg regulates its heterodimeric partner Nur77. Previously, this group made the interesting discovery that ligand-dependent activation of RXRg bound to a related partner, Nurr1, does not occur through a classical pharmacological mechanism but through agonist-dependent dissociation of the complex through disruption of their ligand binding domain (LBD) interactions. Here, they revisit this paradigm with Nur77. In contrast to Nurr1, the authors do not have the reagents to clearly support a role for LBD dissociation. Following from the model of partial ligand-dependent dissociation of the LBD heterodimer, the experimental data (NMR, ITC, SEC) are interesting and quite complex.
Strengths:
The authors do a rigorous job of describing the data and providing possible interpretations and caveats. Revisiting the analysis of Nurr1, they identify the crucial role that selective Nurr1-RXRg agonists played in supporting the LBD dissociation model; without analogous compounds for the Nur77-RXRg complex, it is difficult to invoke this mechanism. Interestingly, treatment with the Nurr1-RXRg selective agonist HX600 suggests it can induce some LBD dissociation. Therefore, there may be some similarities between regulation of Nurr1 and Nur77 by RXRg.
Weaknesses:
Despite evidence supporting a partial role for RXRg LBD dissociation as a mechanism to activate Nur77, other data demonstrate that a fundamentally different regulatory mechanism likely exists in the Nur77-RXRg complex that involves the RXRg disordered NTD. The decision to describe further study of this as outside the scope of this work is unfortunate, as it closed off an avenue that could have provided fruitful data informing the apparently distinct regulatory mechanisms of the Nur77-RXRg complex. Given the uncertainty in the importance of the partial roles of the pharmacological mechanism, LBD dissociation, and the RXRg NTD, this study may have limited impact on the field.
Comments on revisions:
I'm satisfied with the revision.
Author response:
The following is the authors’ response to the original reviews
Public Reviews:
Reviewer #1 (Public review):
Summary:
This foundational study builds on prior work from this group to reveal the complexities underlying ligand-dependent RXRγ-Nur77 heterodimer formation, offering a compelling re-evaluation of their earlier conclusions. The authors examine how a library of RXR ligands influences the biophysical, structural, and functional properties of Nur77. They find that although the Nur77-RXRγ heterodimer shares notable functional similarities with the Nurr1-RXRα complex, it also exhibits unique features, notably, both dimer dissociation and classical agonist-driven activities. This work advances our understanding of the nuanced behaviors of nuclear receptor heterodimers, which have important implications for health and disease.
Strengths:
(1) Builds on previous work by providing a comprehensive analysis that examines whether Nur77-RXRγ heterodimer formation parallels that of the Nurr1-RXRα complex.
(2) Systematic evaluation of a library of RXR ligands provides a broad survey of functional outputs.
(3) Careful reanalysis of previous work sheds new light on how NR4A heterodimers function.
We thank the reviewer for recognizing our work as foundational. In the nuclear receptor field, current understanding of ligand-regulated nuclear receptor activity is based largely on ligand-dependent coregulator recruitment preferences; for example, agonists enhance coactivator recruitment to activate transcription. Building on our recent study of Nurr1-RXRα, the present work suggests that activation of the evolutionarily related NR4A-RXR heterodimer Nur77-RXRγ by RXR ligands is also consistent with a non-classical activation mechanism involving heterodimer dissociation.
Weaknesses:
(1) Some conclusions appear overstated or are not well substantiated by the work presented. It's unclear how the data support a non-classical mode of agonism, for example, based on the data shown.
We thank the reviewer for this important point. We did not intend to claim that Nur77-RXRγ activation is explained exclusively by a non-classical mode of agonism. Rather, our interpretation was that the data are consistent with two possible, non-mutually exclusive mechanisms: (1) a classical pharmacological mechanism involving ligand-dependent coregulator recruitment; and (2) a non-classical mechanism involving ligand-binding domain (LBD) heterodimer dissociation, as we previously described for Nurr1-RXRα. This differs from our prior eLife study of Nurr1-RXRα, in which the data supported the LBD heterodimer dissociation model but not the classical pharmacological model.
In our revised manuscript, we clarify two points that are important for interpreting the Nur77-RXRγ data. First, several experimental limitations of the Nur77-RXRγ studies reduced the extent to which the mechanism could be resolved as rigorously as in our earlier Nurr1-RXRα study. Second, and more importantly, the currently available ligand set lacks Nur77-RXRγ-selective agonists. This limits our ability to determine whether LBD heterodimer dissociation is the sole or principal mechanism of activation, or instead one of several contributing mechanisms.
Taken together, these results support LBD heterodimer dissociation as a plausible and experimentally observable component of Nur77-RXRγ activation and, therefore, as a candidate shared activation mechanism for NR4A-RXR heterodimers. At the same time, because the quantitative evidence is less definitive than in the Nurr1-RXRα system, we agree that conclusions regarding Nur77-RXRγ should be stated more cautiously. This caution is reflected in both the title of our manuscript (“Towards a unified mechanism…”) and the language used throughout the text.
(2) Some assays have relatively few replicates, with only two in some cases.
We thank the reviewer for their attention to experimental rigor. For some assays, the findings were reproduced in two independent experiments, which we considered sufficient to confirm the presence and reproducibility of the effects observed in those particular assay formats. In the original manuscript, we used a general statement in the figure legends (“representative of two or more independent experiments”) across all assay data. In the revised manuscript, we now specify the number of independent experimental replicates for each assay in the corresponding figure legends to improve transparency.
Reviewer #2 (Public review):
Summary:
This study explores the mechanisms by which binding of the nuclear receptor RXRg regulates its heterodimeric partner Nur77. Previously, this group made the interesting discovery that ligand-dependent activation of RXRg bound to a related partner, Nurr1, does not occur through a classical pharmacological mechanism but through agonist-dependent dissociation of the complex through disruption of their ligand binding domain (LBD) interactions. Here, they revisit this paradigm with Nur77. In contrast to Nurr1, the authors do not have the reagents to clearly support a role for LBD dissociation. Following the model of partial ligand-dependent dissociation of the LBD heterodimer, the experimental data (NMR, ITC, SEC) are interesting and quite complex.
Strengths:
The authors do a rigorous job of describing the data and providing possible interpretations and caveats. Revisiting the analysis of Nurr1, they identify the crucial role that selective Nurr1-RXRg agonists played in supporting the LBD dissociation model; without analogous compounds for the Nur77-RXRg complex, it is difficult to invoke this mechanism. Interestingly, treatment with the Nurr1-RXRg selective agonist HX600 suggests it can induce some LBD dissociation. Therefore, there may be some similarities between the regulation of Nurr1 and Nur77 by RXRg.
We thank the reviewer for this thoughtful and balanced summary of our work. We appreciate the reviewer’s recognition of both our prior findings in the Nurr1-RXRα system and the interesting, but more complex, experimental behavior observed here for Nur77-RXRγ. We agree that the absence of Nur77-RXRγ-selective agonists currently limits how definitively the contribution of LBD dissociation can be resolved, and we have revised the manuscript to make this point more explicit and to further temper our conclusions accordingly.
Weaknesses:
Despite evidence supporting a partial role for RXRg LBD dissociation as a mechanism to activate Nur77, other data demonstrate that a fundamentally different regulatory mechanism likely exists in the Nur77-RXRg complex that involves the RXRg disordered NTD. The decision to describe further study of this as outside the scope of this work is unfortunate, as it closed off an avenue that could have provided fruitful data informing the apparently distinct regulatory mechanisms of the Nur77-RXRg complex. Given the uncertainty in the importance of the partial roles of the pharmacological mechanism, LBD dissociation, and the RXRg NTD, this study may have limited impact on the field.
We thank the reviewer for this thoughtful point. We agree that the RXRγ NTD likely contributes to regulation of Nur77-RXRγ transcription, and that our truncation data suggest that regions outside the LBD can influence transcriptional output. At present, however, the effect of RXRγ NTD truncation is not sufficiently mechanistically resolved to distinguish among several plausible explanations.
For example, the RXRγ NTD has been implicated in phase separation and biomolecular condensate formation in cells (PubMed ID 40392852, 40420113, 33971237, 31881311), and perturbing these properties (via RXRγ NTD truncation) could indirectly affect Nur77-RXRγ transcriptional activity. In addition, NTDs of nuclear receptors can participate in coactivator or corepressor interactions (PubMed ID 24284822), raising the possibility that removal of the RXRγ NTD alters transcription by changing recruitment of regulatory factors rather than by directly informing the LBD-centered mechanism examined here. We will clarify in the revised manuscript that these possibilities remain unresolved and represent important directions for future study.
We also agree that defining how multiple RXRγ domains contribute to Nur77-RXRγ regulation would be valuable for the field. However, the focus of the present study is narrower: to test whether, as in our previous eLife study of Nurr1-RXRα, RXR ligands can influence heterodimer function through effects on LBD-LBD interactions. Because the available data do not yet allow a mechanistic dissection of the RXRγ NTD contribution, we believe that a definitive analysis of this question would require a separate set of experiments beyond the scope of the present work. We have revised the manuscript to better acknowledge this limitation and to frame the conclusions accordingly.
Recommendations for the authors:
Reviewer #1 (Recommendations for the authors):
Overall, this is a compelling body of work. Additional summary statements and clearer transitions would be helpful throughout.
Here are some points that should be addressed or at least discussed by the authors:
(1) It is unclear in the luciferase assays whether the truncated proteins are functional or not. Were there Western blots or other assays run to confirm protein concentrations?
We thank the reviewer for this point. We did not perform Western blotting or other assays to confirm equivalent expression levels of the truncated RXRγ constructs, and we agree that this is a limitation of the luciferase assay data. As a result, the transcriptional effects observed with the truncation constructs should be interpreted cautiously.
With that said, the increased transcriptional activity observed upon deletion of the RXRγ NTD/AF-1 region suggests that this region may exert a repressive effect on Nur77-RXRγ transcription. This effect could reflect multiple, non-mutually exclusive mechanisms, including altered phase separation or condensate-related properties of RXRγ, or altered recruitment of transcriptional coregulators through the NTD. Because our truncation strategy does not distinguish among these possibilities, we do not believe these data allow a definitive mechanistic interpretation of the NTD contribution.
We have revised the manuscript to clarify this limitation. We also note that the primary focus of the present study is the role of ligands in modulating Nur77-RXRγ function through LBD-mediated interactions, in direct comparison with our previous Nurr1-RXRα study. A more complete mechanistic dissection of how RXRγ domain architecture influences Nur77-RXRγ transcription will require future work.
(2) Why does the Nur77 construct lacking the NTD show increased luciferase activity?
Please see our response above to Reviewer 2’s Public Review, which also addresses this point.
(3) A case is made for the Nur77 LBD driving the activity, but it also could be inferred that the DBD is driving based on the data shown in Figure 1.
We thank the reviewer for this point. We agree that the Nur77 DBD is required for binding to NBRE response elements, and we did not intend to suggest otherwise. The experimental approach in Figure 1 was not designed to dissect the relative contributions of Nur77 domains, since Nur77 was tested only in its full-length form. Instead, the purpose of this experiment was to examine how truncation of RXRγ domains affects Nur77-RXRγ transcriptional activity, in direct comparison with our prior eLife study of Nurr1-RXRα, where RXRα domain truncations helped define the importance of RXR-LBD-mediated regulation. We will revise the text to clarify that Figure 1 does not distinguish whether Nur77 DBD-dependent DNA binding is necessary, but instead addresses whether the pattern of RXRγ domain dependence is consistent with an LBD-centered mechanism of ligand-regulated heterodimer function.
(4) It is stated that the HX600 coactivator recruitment requires further study. Why wasn't it studied here?
We thank the reviewer for this point. The primary focus of this study was to determine how RXR ligands influence Nur77-RXRγ heterodimer activity, particularly in relation to ligand-dependent effects on heterodimer function. A more detailed analysis of HX600-dependent coactivator recruitment would require a broader mechanistic investigation of RXRα and RXRγ homodimer pharmacology and RXR-specific coregulator interactions, which extends beyond the central scope of the present manuscript. We agree that this is an important question and view it as a valuable direction for future work.
(5) Figure 3B, the shifts in monomer populations, error bars aren't shown, the biggest shift is from 0.2 to 0.6, is that statistically meaningful?
We thank the reviewer for this point. The reviewer is correct that error bars were not shown for Figure 3B. These NMR measurements were performed once (n=1), and therefore the shifts in monomer populations shown in Figure 3B cannot be assessed statistically. Because these studies required substantial NMR instrument time and isotopically labeled protein at high concentration, we were not able to perform experimental replicates for this dataset. We have revised the figure legend to explicitly state that these data were collected from a single experiment and have tempered the corresponding language in the manuscript accordingly.
(6) Some ligands are shown in the figures but don't appear to be discussed in the text (at least that I can find), such as SR11237.
We thank the reviewer for pointing this out. We used a panel of 14 commercially available RXR ligands with different pharmacological properties to probe Nur77-RXRγ function, as in our previous Nurr1-RXRα study. In the text, we emphasized ligands that were most informative for the mechanistic conclusions, rather than discussing every compound individually. SR11237, for example, behaved similarly to the broader group of RXR agonists and was therefore shown as part of the full ligand panel but not specifically highlighted in the text. We will clarify this in the revised manuscript.
(7) There is a sentence in the discussion that says "these observations implicate that although RXRg LBD provides the protein-protein interaction interface to bind Nur77...." the authors did not show enough data to support this claim. It should be bolstered.
We thank the reviewer for this point. We agree that this statement was stronger than was warranted by the data presented. Our intent was not to claim that the present study definitively establishes the RXRγ LBD as the sole or fully defined protein-protein interaction interface for Nur77 binding. Rather, based on the domain truncation data together with our prior Nurr1-RXRα study, we intended this statement as a working interpretation consistent with an LBD-centered mechanism. In our revised manuscript, we have softened this language to avoid overstating the conclusion and clarified that the current data support, but do not definitively prove, a role for the RXRγ LBD in mediating functionally relevant interaction with Nur77.
Reviewer #2 (Recommendations for the authors):
Even though this study is not able to make definitive claims about the mechanism(s) of activation of Nur77 in the Nur77-RXRg complex, the work presented here is rigorous and solidly interpreted. Identifying differences between Nurr1 and Nur77 regulation is important, and the work here shows that selective agonists are essential for supporting the non-canonical mechanism they identified before. Although they address potential implications of NTD regulation in the discussion, it feels like a lot of insight into Nur77 regulation is being missed. However, it is clear that addressing this experimentally would require substantially more work. I don't have any specific recommendations. Given current limitations on funding, I think it's fine to focus on the work completed with the acceptance that it likely limits the impact of the work on the field.
We thank the reviewer for this thoughtful and balanced assessment of our work. The goal of this manuscript was to test whether the LBD heterodimer dissociation mechanism that we previously reported for Nurr1-RXRα may represent a conserved feature of NR4A-RXR heterodimers by extending these studies to Nur77-RXRγ. We agree that understanding the role of the RXRγ NTD in Nur77-RXRγ regulation is important and potentially highly informative. At the same time, resolving that question experimentally would require a distinct and more extensive set of studies beyond the scope of the present work. We have therefore chosen to focus this manuscript on the completed LBD-centered studies, while acknowledging that this narrower scope may limit the broader impact of the work.
Minor points:
(1) Without page and line numbers, it is not easy to point out specific text. On the bottom of page 6 of the document, there are two references to Figure 3a, and the arrows that help illustrate RXRg LBD-dependent CSPs; the second figure callout should describe the blue arrow, I believe.
Thank you, we made this change.
(2) Bottom of page 8, "...revealed two compounds [that] standout..."
Thank you, we made this change.
Zig distributes its toolchain as a Python package, which is built on the assumption that virtually all computers already have a Python distribution of some kind.
That's a stupid assumption.
Many computers that don't have a (pre-installed) Python distribution do have access to a (pre-installed) implementation of the World Wide Wruntime.
It would be logical to at least attempt to target it.
eLife Assessment
This study investigates trial-by-trial intra- and inter-cortical interactions in the visual cortex of the mouse and the monkey. The authors find that activity in one layer (in mice) or one area (in monkeys) can partially predict neural activity in another layer or area on the single-trial level in different experimental contexts. This valuable finding expands previously known contributions of stimulus-independent downstream activity to neural responses in the visual cortex by demonstrating how these change under varying visual stimuli as well as in the absence of visual stimulation. While the methodology is solid, the juxtaposition of mouse and monkey data from different modalities and at difference scales limits the interpretability of the observations and forces superficial comparisons. More in-depth focus on either data set in isolation may reveal more nuanced understanding of cortical interactions rather than trying to draw parallels between very different datasets.
Reviewer #1 (Public review):
Summary:
In this study, the authors evaluated inter-areal interactions in different types of neuronal recordings, timescales, and species". The method consists of computing the variance explained by a linear decoder that attempts to predict individual neural responses (firing rates) in one area based on neural responses in another area.
The authors apply the method to previously published calcium imaging data from layer 4 and layers 2/3 of 4 mice, and simultaneously recorded Utah array spiking data from areas V1 and V4 of 3 monkeys. They report distributions over "variance explained" numbers for several combinations: from mouse V1 L4 to mouse V1 L2/3, from L2/3 to L4, from monkey V1 to monkey V4, and from V4 to V1. For their monkey data, they also report the corresponding results for different temporal shifts. Overall, they find the expected results: responses in each of the two neural populations are predictive of responses in the other, more so when the stimulus is not controlled than when it is, and with sometimes different results for different stimulus classes (e.g., gratings vs. natural images).
Strengths:
(1) use of existing data
(2) addresses an interesting question
Weaknesses:
The data and analysis results are presented in a way that invites direct comparison between mouse L4<->L2/3 variance explained numbers, and monkey V1<->V4 variance explained numbers. This comparison is highly problematic and can't be taken at face value as the authors themselves clearly acknowledge in the Discussion and reply to the reviews. The datasets simply differ in too many aspects. If the goal of the authors is not to compare, then the analyses should be presented separately, allowing for a more detailed analysis of each (also see below).
Understanding which patterns in the data are robust and which are idiosyncratic to individual animals/recordings is complicated by the fact that some figures appear to show a single mouse and some averages over all four mice with no indication over whether the results are consistent across mice. For the monkey results, all figures in the main text appear to only show a single monkey, with the other two monkey results in the SI. Again, it is not clearly presented and discussed which aspects of the results are robust, and which differ between monkeys.
Furthermore, there are literally dozens of statistical comparisons between various conditions and metrics in the main figures without them being sufficiently organized around robust new insights, that will likely replicate, and that can inform our understanding of the underlying processes, or constrain computational models.
Reviewer #2 (Public review):
Summary:
In this work the authors investigated the extent of shared variability in cortical population activity in the visual cortex in mice and macaques under conditions of spontaneous activity and visual stimulation. They argue that by studying the average response to repeated presentations of sensory stimuli, investigators are discounting the contribution of variable population responses that can have significant impact at the single trial level. They hypothesized that, because these fluctuations are to some degree shared across cortical populations depending on the sources of these fluctuations and the relative connectivity between cortical populations within a network, one should be able to predict the response in one cortical population given the response of another cortical population on a single trial, and the degree of predictability should vary with factors such as retinotopic overlap, visual stimulation, and the directionality of canonical cortical circuits.
To test this, the authors analyzed previously collected and publicly available datasets and data recorded themselves. These include calcium imaging of the primary visual cortex in mice and electrophysiology recordings in V1 and V4 of macaques under different conditions of visual stimulation. The strength of this data is that it includes simultaneous recordings of hundreds of neurons across cortical layers or areas and under different conditions of sensory stimulation and behavioral state. However, the weaknesses of calcium dynamics (which has lower temporal resolution and misses some non-linear dynamics in cortical activity) and multi-unit envelope activity and LFPs (which reflects fluctuations in population activity rather than the variance in individual unit spike trains), underestimates the variability of individual neurons which may vary widely in their participation in shared sources of variance.
From their analysis, they found that there was significant predictability of activity between layer II/III and layer IV responses in mice and V1 and V4 activity in macaques, although the specific degree of predictability varied somewhat with the condition of the comparison and with differences in the quality of recordings between the datasets. The authors deployed a variety of analytic controls and explored a variety of comparisons that are both appropriate and convincing that there is a significant degree of predictability in population responses at the single trial level consistent with their hypothesis. This demonstrates that a significant fraction of cortical responses to stimuli are not due solely to the feedforward response to sensory input, and if we are to understand the computations that take place in cortex, we must also understand how sensory responses interact with other sources of activity in cortical networks. Overall, this work highlights that, beyond the traditionally studied average evoked responses considered in systems neuroscience, there is a significant contribution of shared variability in cortical populations that may contextualize sensory representations depending on a host of factors that may be independent from the sensory signals being studied.
Strengths:
This work considers a variety of conditions that may influence the relative predictability between cortical populations, including receptive field overlap, latency that may reflect feed-forward or feedback delays, and stimulus type and sensory condition. Their analytic approach is well designed and statistically rigorous. They acknowledge the limitations of the data and do not over-interpret their findings.
Weaknesses:
The different recording modalities between species and scales (within vs. across cortical areas) limit the interpretability of the inter-species comparisons, and while this is not the stated goal of the authors, the juxtaposition of these two datasets invites comparison.
Reviewer #3 (Public review):
Neural activity in visual cortex has primarily been studied in terms of responses to external visual stimuli. While the variability of neural inputs to a visual area are known to also influence visual responses, the contribution of this stimulus independent component to overall visual responses has not been well characterized.
In this study, the authors analyze datasets from both mice (a previous V1 Ca++ imaging study) and monkeys (data from a previous study and new large-scale electrophysiological recordings from V1-V4). Using regression models, they examine the predictability of neural activity between Layer 4 and Layer 2/3 in mice and between V1 and V4 in monkeys. Their main finding is that significant predictions are possible even in the absence of visual input, highlighting the influence of stimulus independent downstream activity on neural responses. These findings can inform future modeling work of neural responses in visual cortex to account for such non-visual influences.
The authors perform a thorough analysis comparing regression-based predictions for a wide variety of combinations of stimulus conditions and directions of influence. While many of the predictability pattens are largely in line with expectations (eg., downstream layers/areas predicting upstream activity), it is valuable to have these relationships quantified as the authors have done here. Predictability also depended on stimulus type, but these dependencies were not consistent across animals, making it difficult to draw general conclusions. Finally, they show robust predictions even during spontaneous activity which are only partially accounted for by available behavioral metrics. Together, these analyses provide a valuable quantification of stimulus-independent components of visual cortical activity and their potential role in shaping sensory responses.
Author response:
The following is the authors’ response to the original reviews
Reviewer #1 (Public review):
We truly appreciate all the effort that the reviewer put into reading and understanding our work. With a total of 37 excellent questions, this is one of the most thorough reviews that we have received in a long time.
R1.0: Summary:
In this study, the authors propose a "unifying method to evaluate inter-areal interactions in different types of neuronal recordings, timescales, and species". The method consists of computing the variance explained by a linear decoder that attempts to predict individual neural responses (firing rates) in one area based on neural responses in another area.
The authors apply the method to previously published calcium imaging data from layer 4 and layers 2/3 of 4 mice over 7 days, and simultaneously recorded Utah array spiking data from areas V1 and V4 of 1 monkey over 5 days of recording. They report distributions over "variance explained" numbers for several combinations: from mouse V1 L4 to mouse V1 L2/3, from L2/3 to L4, from monkey V1 to monkey V4, and from V4 to V1. For their monkey data, they also report the corresponding results for different temporal shifts. Overall, they find the expected results: responses in each of the two neural populations are predictive of responses in the other, more so when the stimulus is not controlled than when it is, and with sometimes different results for different stimulus classes (e.g., gratings vs. natural images).
Strengths:
(1) Use of existing data.
(2) Addresses an interesting question.
R1.1: Unfortunately, the method falls short of the state of the art: both generalized linear models (GLMs), which have been used in similar contexts for at least 20 years (see the many papers, both theoretical and applied to neural population data, by e.g. Simoncelli, Paninsky, Pillow, Schwartz, and many colleagues dating back to 2004), and the extension of Granger causality to point processes (e.g. Kim et al. PLoS CB 2011). Both approaches are substantially superior to what is proposed in the manuscript, since they enforce non-negativity for spike rates (the importance of which can be seen in Figure 2AB), and do not require unnecessary coarse-graining of the data by binning spikes (the 200 ms time bins are very long compared to the time scale on which communication between closely connected neuronal populations within an area, or between related areas, takes place).
First, a few points of clarification.
(i) We worked with two-photon calcium imaging data (mice), and with the envelope of multi-unit activity (monkeys). While both of these types of signals are strongly correlated with spikes, neither of them can be truly considered to be a point process.
(ii)The reviewer points to Figure 2AB. The signals that we worked with can be negative. The black traces are the actual signals and show clear negative bouts, especially noticeable in the middle panel in Figure 2B. Of course, this does not mean that there are negative spike rates. This has to do with the way the data are normalized and not with the specific prediction method. However, the reviewer is correct in stating that the method that we used could also yield negative values even for non-negative spike rates.
(iii) We did not bin the macaque data into 200-ms time bins, but rather 25-ms time bins (line 548, Figure 1B legend). Additionally, we have now performed additional analyses with different window sizes, showing that the conclusions still hold (see Supplemental Figure 4 and lines 139-143).
To further address the reviewer’s question, we implemented a Poisson GLM enforcing non-negativity on macaque MUAe data (without spontaneous activity subtraction, ensuring strictly positive values; lines 135-139, Supplemental Figure 1M). The model did not improve predictions over ridge regression, confirming our methodological choice. This method is not directly applicable to mouse calcium data, since the activity after baseline subtraction can be negative.
We did not use Granger or any other causality methods. The question of causality is certainly important, and there are multiple methods developed to assess causality in neural signals. We do not make any claims about causality in our study. A rigorous evaluation of causality is an interesting line of research for future work.
R1.2: In terms of analysis results, the work in the manuscript presents some expected and some less expected results. However, because the monkey data are based on only one monkey (misleadingly, the manuscript consistently uses the plural ‘monkeys’), none of the results specific to that monkey, nor the comparison of that one monkey to mice, are supported by robust data.
We have now added data from 2 additional monkeys, including:
(i) A second monkey (monkey “A”) from the same dataset (Chen et al., 2020), which includes all activity types except the lights off condition (lines 90-96, 120-132, 159, 161, 171, 183-185, 188-194, 200-203, 228-237, 254-258, 292-296, 334-342, 351-353, 358-364, 374-378, 387-393, 400-408, 414, 417-421, 539-540, 544-545, 680-681, 696-698; Supplemental figures 1-6, 8, 11, 12, and 13; Table 2).
(i) We collected new neural activity from one additional monkey (monkey “D”) in collaboration with the Ponce lab (lines 90-96, 120-130, 132-134, 163-164, 228-235, 237-243, 292-296, 351-353, 374-378, 387-389, 539-540, 553-560, 696-698; Supplemental figures 1-2, 4, 6, 9, 11, and 12; Table 2). The new data include responses to the same checkerboard and gray screen images as the original dataset, along with responses during lights-off conditions.
R1.3: One of the main results for mice (bimodality of explained variance values, mentioned in the abstract) does not appear to be quantified or supported by a statistical test.
We have now formally quantified the bimodality of the relationship between one-vs-rest correlation and inter-laminar explained variance (EV) in mice using Hartigan’s dip test, applied to neurons with EV>0.4. The test confirmed significant bimodality in two of the three mice (MP031 and MP032: p<0.001; MP033: p=0.687). These results are now included in the Results section (lines 307-311) and shown in Supplemental Figure 7A,D. In datasets that did not show bimodality by visual inspection (macaque recordings), the same test yielded non-significant results (e.g., p=0.994), confirming that the statistical analysis distinguishes between bimodal and unimodal cases.
R1.4: Moreover, the two data sets differ in too many aspects to allow for any conclusions about whether the comparisons reflect differences in species (mouse vs. monkey), anatomy (L2/3-L4 vs. V1-V4), or recording technique (calcium imaging vs. extracellular spiking).
We also agree with this comment. Our goal is not to provide any direct quantitative comparison between the two species. We emphasize (lines 494-497) that the experiments in the two species differ along multiple dimensions, including: (i) differences in recording modalities (calcium vs. electrophysiology), (ii) associated differences in temporal resolution, neuronal types, and SNR, (iii) cortical targets (layers vs. areas), (iii) sample size, (iv) stimuli, (v) task conditions. In the revised manuscript, we also emphasized that the aim of this work is to investigate inter-areal interactions within each species rather than to draw quantitative comparisons between species (lines 497-499).
Reviewer #1 (Recommendations for the authors):
R1.5 In the analysis of directionality, you stated that subsampling was done randomly. Presumably, there could be multiple subsamples that fulfill the control of split-trial r. Are you only showing results from one subsample or multiple subsamples?
We show the median from 10 subsample permutations. This is now clarified in line 621.
R1.6 About the measurement 1-vs-rest r2. Understanding the definition is important for interpreting the results, but the definition was not clearly written. In lines 195-196, could you be more clear about whether the correlation is between the predicted neuron and other neurons in the predicted population or between the predicted neuron and the mean activity of the predictor population? Also, in line 212, why do you call this self-consistency? Isn't this a correlation between a neuron and the others?
The 1-vs-rest r<sup>2</sup> value, or self-consistency, is the correlation calculated for each neuron i and does not involve other neurons. Let  indicate the response 𝑟 of neuron i during trial t (t=1,..., T where T is the total number of trials). For a given trial t, we compute the average activity of the neuron excluding this trial:
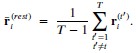
Throughout, the superscript (rest)means “all repetitions excluding repeat 𝑡”. The one-vs-rest correlation for the held-out repetition 𝑡 is:
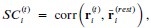
We then average these correlations across all held-out repetitions:
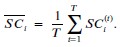
We now clarify this in the text (lines 304-306 and lines 642-647).
R1.7 In Figure 6 G and I. The "all" condition contains more neurons than either of the other two. In this case, is this comparison fair or meaningful?
The reviewer is also correct here. The comparisons between the <10% and >80% groups contain the same number of predictor neurons, and those are fair comparisons. The “all” condition contains more predictor neurons, and, therefore, those comparisons are not fair. We clarified this point in lines 360-364.
We included the “all” condition here because we think that it is an instructive sanity check in terms of reporting how EV changes with more neurons, and also in terms of understanding why the EV values in the other two conditions are lower. Expanding on this point with a little bit of philosophy, ultimately, when considering a neuron in area B (e.g., V4) and the contributions from neurons in another area A (e.g., V1), one would like to have access to all the inputs (e.g., all the neurons in V1 that are monosynaptically connected to the target neuron in area V4). We do not have access to this type of information, and we do not make any claims about monosynaptic connectivity, let alone exhaustive sampling of inputs to a given neuron. The “all” condition merely provides a quantitative illustration of the fact that EV increases with the number of predictor neurons. This observation may be considered to be somewhat trivial, but it should be pointed out that the conclusion relies on the input neurons sharing information with the target neurons (e.g., perhaps one may not be able to predict V4 activity very well from the responses of millions of neurons in the cerebellum).
R1.8 I believe the results section can be improved by adding some interpretation after each finding.
We thank the reviewer for the suggestion. We generally like to separate results from interpretation. However, to honor the suggestion, we added brief interpretations throughout the results section (lines 142-143, 171-173, 272-273, 279-281, 331-333, and 361-364) and expanded on the interpretations in the Discussion section.
R1.9 Line 52 - 74: It would be better to be more specific about what kind of neuronal interactions, e.g., noise correlation, synchrony, etc.
We added a clarification on the types of interactions we study in lines 68-73.
R1.10 Line 81. Something seems to be missing after "5500". 5500 trials? Neurons?
We thank the reviewer for pointing this out. The number refers to neurons (fixed in line 87).
R1.11 Line 94. The readers would appreciate more explanation of the method.
We have expanded on the explanation, as suggested (lines 106-107).
R1.12 Line 104. The fraction of visually responsive neurons seems to be small. Is this typically for mouse V1? Would this fraction be higher if you also used the peak, as you did for macaque data in your SNR calculation (line 412)? And what is this number for the recorded L4?
The reviewer correctly points out the small number of visually responsive neurons.
We note that we now refer to the subset of neurons used for prediction analyses as visually reliable (VR) neurons (lines 115-116, 125-126, 178-179, 183-184, 211-212, 214-216, 217-226, 283-286), defined conservatively as neurons with SNR > 2 computed from the mean across all stimuli (not the peak to any one stimulus) and split-half reliability >0.8 (Methods, lines 569–590). This choice emphasizes neurons that are consistently informative over the full stimulus set.
Regarding the question of how typical the number of responsive neurons in mice is, the fraction of “responsive” neurons in mouse V1 varies widely depending on the definition and stimulus set but the fractions are substantially lower than those reported in monkeys (with different methods). For those of us more used to the macaque neurophysiology literature, this has been one of the biggest surprises coming from work in rodents. Many studies report a sizable group of non-responsive neurons in mouse V1 (e.g., as little as 37% percent of V1 neurons being responsive in at least 25% of the trials according to de Vries et al., Nat Neur, 2020). Our fraction of visually responsive neurons is small because it couples a conservative SNR metric with a high trial-reliability threshold.
As the reviewer notes, a peak-based metric based on any stimulus would be a less conservative criterion that would increase the fraction of neurons labeled responsive.
R1.13 Line 113. Why not also give an exact percentage number?
We have given the exact percentage number (lines 125-126).
R1.14 Line 128. Is this just because L2/3 has more neurons? If so, then isn't this trivial?
Our intention was to illustrate the best prediction performance we could get in either direction, which means including all L2/3 neurons. We have reworded our text to clarify (lines 149-151).
R1.15 Line 134. Isn't this expected? Since V1 have more units than V4?
The reviewer is correct. As discussed in R1.7 in mice, we sought to report the best prediction performances in either direction. We have edited our text for clarity (lines 149-151).
R1.16 Line 165-168. What's the logical connection between these two sentences? If the former is true, we should expect to see differences. Also, why the same population? Shouldn't you include non-visual neurons?
The two sentences in question are: “The difference in predictability in the absence of a stimulus could in principle change according to the directionality in inter-laminar interactions.” and, “There was no statistically significant difference in the EV fraction between laminar directions (L4→L2/3 vs. L2/3→L4) using the same control population as in Figure 3B (Figure 5A-C and Figure Supplement 2H).”. The key point here was to control for similar reliability values in order to make fair comparisons. We have added an additional comparison between directionalities focusing on nonvisual neurons (SNR<2 & r<0.8), and have also found no statistically significant difference between direction of predictability (Supplemental Figure 3A, right, lines 221-224).
R1.17 Table 2. The information of which session corresponds to which experiment can be put in the table, which would be easier to read.
We have added which sessions correspond to which experiments in Table 2.
R1.18 Figure 1, Captions for panel c and d. I don't see any colored arrows in the figure.
We removed the color descriptions (Figure 1C-D).
R1.19 Figures 3, 4, and others. The annotations of "n.s." are very hard to see.
We changed the color so that it is easier to see now (Figures 3, 4, 6, and Supplementary Figures 1-4, 6, and 8-10).
R1.20 Figure 5, panel A. The legend is too small.
We increased the legend size (Figure 5A).
R1.21 Figure S5, panel D. Why are some of the data points connected?
The paired connections are illustrated specifically in the highly predictable neurons to highlight the two separate distributions of neurons. One group, the highly predictable and highly reliable group, maintains its inter-laminar predictability after projecting out the “non-visual” activity (lines 327-330), whereas the highly predictable yet unreliable group shows a sharp decrease in inter-areal predictability, which corroborates the idea of non-visual components influencing neurons in mouse V1, as shown by Stringer et al. 2019b and consistent with our results.
R1.22 l.91 "Ope" -> open?
We fixed the typo (line 100).
R1.23 Fig. 3C+D: Why is only one session used for this?
One session was used to illustrate the distribution of split-half reliability values per area. Figure 3D contains information about all 5 stimulus sessions (see legend to Figure 3D).
R1.24 "Even without controlling for the number of predictors or their respective split-half correlation values (627-688 sites in V1, 86-115 sites in V4), we found better predictability in the V1 to V4 direction than the reverse ( 𝑝 < 0.001, Figure Supplement 2I)." -> What does "even" mean here? Isn't this simply the null result if there is no true difference and the real reason the authors controlled for size?
The reviewer’s understanding is correct. We have edited our text for clarity (lines 157-160)
R1.25 "We could predict V1 and V4 activity across all stimulus types ( 𝑝 < 0.001, paired permutation test of prediction vs. shuffled frames prediction)." -> better than chance? For all neurons on average? What does this mean? Isn't it trivial and 100% expected that neural activity in the visual cortex is above chance related to the visual input?
We stated that sites in V1 and V4 could predict each other across all stimulus types before describing the differences between them. We agree that this observation is to be expected and indicated so now in the text (lines 185-186).
R1.26 "The predictability was the highest in both directions for neuronal activity in response to a full field checkerboard images (Figure 4D). In the V1 → V4 direction, the EV fraction was higher when predicting a slow-moving small thin bar compared to a fast-moving large thick bar (Figure 4D, left), whereas the opposite was true for the V4 → V1 direction (Figure 4D, right)." -> What does this mean? Is this expected or not? Under what theories of cortical processing?
The differences between EV prediction directions (V1→V4: slow thin bars > fast thick bars; V4→V1: fast thick bars > slow thin bars) could be because V4 responses are more reliable for the slow thin bars whereas V1 responses are more reliable for the fast thick bars (Supplemental Figure 5H–I). To account for this possibility, we controlled for differences in target-related properties by regressing out covariates like SNR, split-half correlation, and variance. In monkey L, regressing out reliability/drive within direction using these covariates, the V4→V1 bar difference between slow thin bars and fast thick bars was not significant and the difference in the V1→V4 difference direction was reduced (Supplemental Figure 5K, lines 198-203). This suggests that the asymmetry primarily reflects stimulus‑dependent reliability of the target population rather than a strong directional selectivity.
To the best of our knowledge, there are no clear predictions that match these observations from existing theories of visual cortical processing, especially given the paucity of computational models that include stimulus velocity when describing the responses in area V4. There has been extensive work on theories of surround suppression, but it seems unlikely that the thick bars would elicit surround suppression given the size of the V4 receptive fields. Many current computational models that aim to fit the responses of neurons in the visual cortex use neural networks that take an image as visual input and yield activations. Most of these models do not incorporate stimulus movement, and even those that do incorporate stimulus dynamics, only indirectly map onto interlaminar stimulus transformations or even between-area stimulus transformations. We hope that the results in this manuscript will help inspire and constrain better models of visual cortical processing.
R1.27 Shouldn't all the predictability analysis be done conditioned on the stimulus in order to tell us more than the trivial "both V1 and V3, or L2/3 and L4, are driven by visual inputs"? (The spontaneous activity analyses are essentially that, for a small subset of the stimuli.)
The key goal of this study is to quantify inter-areal interactions both under visual input and without visual input. This type of analysis is important because inter-areal interactions may depend both on visual inputs but also on neuronal inputs that are not triggered by visual signals. For example, extensive work in mice has now shown that neuronal responses in V1 depend on an animal’s running speed, independently of any visual input. Even within the visual input conditions, we present analyses where we shuffle trial order (e.g., Figure 7, Supplementary Figure 11) to estimate the contribution of trial-by-trial variations that are independent of visual inputs and other analyses where we project out non-visual activity (e.g., Supplementary Figure 7).
R1.28 "In visually responsive neurons, there was a significant reduction in EV during gray screen compared to visual stimulus presentation" -> perfectly expected. But the report-worthy result here is how much is left, not whether EV is decreased!
We have changed the wording on the results to highlight the sustained predictability (lines 211-212). It is important to note that, although the reduction in EV during gray screen may be expected, this observation does not hold for all neurons. In fact, there are some neurons for which the EV during visual presentation is comparable to that during gray screen (Figure 5B,C,E: neurons that lie on the diagonal line).
R1.29 "Similar to the conclusions drawn from the mouse data, the predictability of neuronal activity was higher in response to stimulus presentation than to gray screen presentations" -> Really? Conditioned on stimulus, or explainable by the well-known fact that both V1 and V4 are visually driven?
As discussed in R1.28, in mice, there are many neurons where the EV during gray screen is comparable to that during stimulus presentation. In monkeys, most sites were visually driven. As the reviewer points out, we expected that EV during stimulus presentation would be higher than during gray screen; this observation is a reasonable sanity check. The difference between unshuffled trials and shuffled trials (Figure 7, Supplementary Figure 11) provides an estimate of the interactions that are not purely explained by visual inputs alone in monkeys.
R1.30 "Unlike the mouse, macaque correlation of visual predictability between stimulus presentation and spontaneous activity was high across all types of spontaneous conditions" -> Why? Is this simply explainable by a lower mean response in the spontaneous condition in the mouse? Are these mouse and monkey experiments truly comparable? Isn't it surprising that spontaneous activity in the monkey visual cortex compared to evoked activity is higher than in the mouse?
With respect to the question of whether spontaneous activity (or stimulus-evoked activity) in monkeys is higher than in the mouse, it is difficult to make these comparisons. We emphasize in the text the multiple differences between the experiments in both species. Our goal is not to perform any quantitative comparison across species (see R1.4). We changed the wording to remove any inference of comparison between species (lines 248-250).
R1.31 Occasionally imprecise presentation. Ex "To further examine the non-stimulus driven component, we reasoned that if the shared information between areas were strictly driven by the visual stimulus, then using the activity of a stimulus presentation repeat to one specific image could be used to predict the responses to any other stimulus repeat of the same image. On the other hand, if the shared activity does not have any stimulus-response information, then the prediction model would not work when considering responses across repeated presentations of identical stimuli in different trials. To test these two opposing ideas, we compared the inter-areal prediction EV fractions using unshuffled versus shuffled trials." -> Sets up two extreme strawmen (100% driven by stimulus vs 0% driven by stimulus). What does "model would not work" mean? EV=0? Hypotheses not ideas.
Our intent was to set up two extreme hypotheses, not to claim that neurons must fall exclusively into one or the other. The two extremes help better interpret the results.
The reviewer indicates that these are straw-man hypotheses. This may well be the case. But note the responses to R1.12, R1.27, R1.28, and R1.29. The reviewer seems to assume that all or most neurons in the visual cortex should be mostly or exclusively driven by visual stimuli.
We also replaced “ideas” with “hypotheses”, as suggested. We have expanded the discussion of these points in the manuscript (lines 480-493). Many neurons occupy intermediate positions between these two extreme hypotheses. We clarified that “model would not work” refers to prediction accuracy approaching chance (EV ≈ 0).
R1.32 "In both species and in both directions, inter-areal prediction EV fraction persisted (𝑝 < 0.001," Doesn't persist mean EV is unchanged? But the test is EV>0 or not in both cases.
We meant that EV values remained significantly above chance, not that they were unchanged. The statistical test was indeed whether EV > 0 as the reviewer indicated. We have revised the text accordingly (lines 375-380).
R1.33 "In mice, neurons showed a bimodal distribution in terms of their response predictability in shuffled and unshuffled trials" -> I don't see any bimodality in the figure, nor is there a statistical test provided for bimodality.
In Figure 7C, a group of neurons lay essentially along the horizontal axis, whereas the other group is dispersed closer to the diagonal line. Specifically, the neurons that lay on the horizontal axis are also the ones whose responses are best predicted during gray screen activity. We have changed the text to clarify this point (lines 380-382).
R1.34 "In the macaque V4 → V1 direction, there was a large proportion of neurons with peak EV when considering 25 ms to 50 ms offsets in the positive direction (i.e., V4 after V1, Figure 7I, right)." -> So what does this mean? Is this compatible with anything we know? This is the anti-causal direction so some kind of explanation would be warranted.
In the V4→V1 panel, a positive offset means we use V4 at t+Δt to predict V1 at t (and conversely in the V1→V4 panel). Therefore, the fact that the peak EV occurs at +10–20 ms indicates that V1 leads V4 by ~10–20 ms: in other words, V1’s earlier response best predicts V4’s slightly later response. This observation is not anti-causal, but rather it is consistent with the canonical largely feed-forward V1→V4 latency (e.g., Schmolesky et al., 1998 among many others). We clarified this in text (lines 400-404).
R1.35 L. 307: "In monkeys," plural!?
While this was not correct in the original version, we have now added data from two more monkeys.
R1.36 L. 313: "we observed an approximately bimodal distribution of neuronal responses, with a large subset of neurons that do not show reliable responses to visual stimuli both in L4 and L2/3" -> where?
The bimodal distribution can be appreciated in Figure 6B (1-vs-rest r2, third panel, note neurons along the y-axis, see also R1.33) and Supplementary Figure 7B (lines 307-312). Additionally, as stated in R1.3, we have now formally quantified the bimodality of the relationship between one-vs-rest correlation and inter-laminar explained variance (EV) in mice using Hartigan’s dip test (lines 310-313); see also Supplementary Figure 7A,D. In datasets that did not show bimodality by visual inspection (macaque recordings) the same test yielded non-significant results, confirming that the statistical analysis distinguishes between bimodal and unimodal cases.
R1.37 Random subsampling to control for population size done with how many subsamples? How are they combined? Variability across subsamples interpreted how?
We performed 10 permutations and used the median distributions across permutations (line 621).
Reviewer #2 (Public Review):
R2.0: “Summary:
In this work, the authors investigated the extent of shared variability in cortical population activity in the visual cortex in mice and macaques under conditions of spontaneous activity and visual stimulation. They argue that by studying the average response to repeated presentations of sensory stimuli, investigators are discounting the contribution of variable population responses that can have a significant impact at the single trial level. They hypothesized that, because these fluctuations are to some degree shared across cortical populations depending on the sources of these fluctuations and the relative connectivity between cortical populations within a network, one should be able to predict the response in one cortical population given the response of another cortical population on a single trial, and the degree of predictability should vary with factors such as retinotopic overlap, visual stimulation, and the directionality of canonical cortical circuits.”
R2.1: To test this, the authors analyzed previously collected and publicly available datasets. These include calcium imaging of the primary visual cortex in mice and electrophysiology recordings in V1 and V4 of macaques under different conditions of visual stimulation. The strength of this data is that it includes simultaneous recordings of hundreds of neurons across cortical layers or areas. However, the weaknesses of calcium dynamics (which has lower temporal resolution and misses some non-linear dynamics in cortical activity) and multi-unit envelope activity (which reflects fluctuations in population activity rather than the variance in individual unit spike trains), underestimate the variability of individual neurons. The authors deploy a regression model that is appropriate for addressing their hypothesis, and their analytic approach appears rigorous and well-controlled.
We agree with these points, and we discuss these specific limitations in capturing the variability of individual neurons in the Discussion section (lines 500-504). We have now also added analyses based on local field potentials (LFP). LFPs do not directly reflect the activity of individual neurons either.
R2.2: From their analysis, they found that there was significant predictability of activity between layer II/III and layer IV responses in mice and V1 and V4 activity in macaques, although the specific degree of predictability varied somewhat with the condition of the comparison with some minor differences between the datasets. The authors deployed a variety of analytic controls and explored a variety of comparisons that are both appropriate and convincing that there is a significant degree of predictability in population responses at the single trial level consistent with their hypothesis. This demonstrates that a significant fraction of cortical responses to stimuli is not due solely to the feedforward response to sensory input, and if we are to understand the computations that take place in the cortex, we must also understand how sensory responses interact with other sources of activity in cortical networks. However, the source of these predictive signals and their impact on function is only explored in a limited fashion, largely due to limitations in the datasets. Overall, this work highlights that, beyond the traditionally studied average evoked responses considered in systems neuroscience, there is a significant contribution of shared variability in cortical populations that may contextualize sensory representations depending on a host of factors that may be independent of the sensory signals being studied.
We agree that these datasets do not lend themselves well to directly separating and quantifying all the different sources of the predictive signals. We expand on this point in the Discussion section (lines 509-511).
R2.3: The different recording modalities and comparisons (within vs. across cortical areas) limit the interpretability of the inter-species comparisons.
We also agree with this comment. We emphasize that our goal is not to attempt a direct quantitative comparison across species (lines 497-499).
R2.4: Strengths:
This work considers a variety of conditions that may influence the relative predictability between cortical populations, including receptive field overlap, latency that may reflect feed-forward or feedback delays, and stimulus type and sensory condition. Their analytic approach is well-designed and statistically rigorous. They acknowledge the limitations of the data and do not over-interpret their findings.
Weaknesses:
The different recording modalities and comparisons (within vs. across cortical areas) limit the interpretability of the inter-species comparisons.The mechanistic contribution of known sources or correlates of shared variability (eye movements, pupil fluctuations, locomotion, whisking behaviors) were not considered, and these could be driving or a reflection of much of the predictability observed and explain differences in spontaneous and visual activity predictions.
We have expanded on the Discussion section to explicitly state the points raised by the reviewer (lines 494-509).
In mice, we have now also analyzed a separate dataset in which behavioral measurements were available, including running speed and facial motion (FaceMap SVDs). We used these to build behavioral-only and combined models to predict neural activity. We found that behavioral variables explained a modest but consistent portion of the variance across both spontaneous and stimulus conditions (Supplementary Figure 10A,C, lines 268-273).
For the macaque data, we analyzed pupil size as the only available behavioral measure in the macaque dataset. We focused specifically on the “resting state, eyes open” condition, where both neural activity and pupil measurements were available. Using ridge regression, we assessed the extent to which pupil size predicted neural activity in V1 and V4. Pupil size alone explained only a small fraction of the variance (Supplementary Figure 10E, lines 274-276).
R2.5: Previous work has explored correlations in activity between areas on various timescales, but this work only considered a narrow scope of timescales.
Without going into specifics about the numbers, it is hard to fully address this question. As the reviewer noted in R2.1, the mouse data analyzed here do not lend themselves to evaluating predictability on scales of tens of milliseconds. In the macaque data, we have now conducted additional analyses where we binned the activity across a range of bin sizes (10 ms to 200 ms). The new analyses are shown in Supplementary Figure 4, and described in lines 140-143, 160-163.
R2.6: The observation that there is some degree of predictability is not surprising, and it is unclear whether changes in observed predictability with analysis conditions are informative of a particular mechanism or just due to differences in the variance of activity under those conditions. Some of these issues could be addressed with further analysis, but some may be due to limitations in the experimental scope of the datasets and would require new experiments to resolve.
First, we note that several of the analyses and comparisons are within conditions and not across conditions, where by “condition” we mean the presence or absence of a stimulus or different stimuli (e.g., Figures 3, 5, 6, 7, Supplementary Figures 3-4, 7–13).
Second, we note that our mouse preprocessing standardized responses by spontaneous mean and SD per neuron, controlling baseline scale across conditions (lines 535-538). Because of this standardization, spontaneous traces have unit scale (mean = 0, SD = 1).
To test whether differences in variance underlie our findings, we calculated the variance for both species. For mice, we computed variance across repeats (visual) and across timepoints (lines 286-291). For the macaque moving-bar sessions, we computed variance across the concatenated held-out samples pooling timepoints, repeats, and bar identities (lines 291-292).
The V4 population showed a higher overall variance distribution compared to the V1 population (Supplementary Figure 2I-J), and L2/3 variance was also overall higher than L4 (Supplementary Figure 2D-E). We also see a modest monotonic relationship between EV fraction and this variance (mouse visual: Spearman ρ = 0.43–0.52, p < 0.001; macaque stimulus responses: ρ = 0.50–0.56, p < 0.001; macaque gray-screen responses: ρ = 0.38, p < 0.001, Figure 6A,D), indicating variance contributes to (but is not the primary driver of) EV prediction fraction. We then adjusted for variance by fitting, within each stimulus condition, a linear regression of EV on variance (excluding shuffled-control rows) and conducted all comparisons on the resulting residual EV values, thereby isolating effects not attributable to variance (see Supplementary Figure 3E-G, lines 165-171).
Reviewer #2 (Recommendations for the authors):
R2.7 Overall I found this manuscript to be very clearly written and the results compelling, although I found myself wanting a little more. I believe these datasets also include information about eye movements, pupil diameter, and maybe locomotion and whisking in the rodent work. I think it could be informative to ask the degree to which the predictability, particularly during the spontaneous activity, is attributable to these other known sources of variance in trial-by-trial measures. My concern is that during visual stimulation, the space of cortical responses is limited to a very narrow scope (observing a visual stimulus during fixation) whereas spontaneous activity includes a broader range of possibilities (different states of arousal, eye movement).
We analyzed the role of behavioral variables that could explain the neural activity in mouse V1 (including the variables suggested by the reviewer, running speed, facemap SVDs). The open dataset authors warned not to use pupil size since in the dark, the measurements were not accurate. In terms of the contribution to the predictability of mouse V1 activity, these behavioral variables showed a weak yet significant contribution (Supplementary Figure 10A,C, lines 260-270).
R2.8 By controlling for eye movements or pupil diameter during spontaneous measurements, would you improve your measure of predictability?
When predicting neural activity in the lights-off eyes open condition, combining neural data of the predictor population with information of pupil size did not result in a statistically significant increase in EV fraction when predicting the target population (Supplementary Figure 10E, lines 276-278).
R2.9 Also, there is work that shows feed-forward correlations between V1 and higher visual areas are observed in higher frequency activity, whereas feedback is associated with lower frequency activity. If you compared your predictability measure over bandpasses with different timescales, would you find the direction of V1-V4 interactions changes consistent with this previous work?
To address this question, we extended our analyses to the local field potential signals (LFPs) in monkeys, using band-limited LFP power (2–12, 12–30, 30–45, 55–95 Hz). We reran the lag sweep analyses (10-ms steps; 200-ms windows slid every 10 ms) in both directions. The Gamma band showed a feed-forward signature in the early evoked period: the V1→V4 predictability peaked at negative offsets (∼10–30ms; V1 leads), and the V4→V1 predictability peaked at positive offsets, consistent with previous findings. The results for low and beta frequency bands are also presented in the text (Supplemental Figure 13, lines 412-423).
Reviewer #3 (Public review):
R3.0: Neural activity in the visual cortex has primarily been studied in terms of responses to external visual stimuli. While the noisiness of inputs to a visual area is known to also influence visual responses, the contribution of this noisy component to overall visual responses has not been well characterized.
In this study, the authors reanalyze two previously published datasets - a Ca++ imaging study from mouse V1 and a large-scale electrophysiological study from monkey V1-V4. Using regression models, they examine how neural activity in one layer (in mice) or one cortical area (in monkeys) predicts activity in another layer or area. Their main finding is that significant predictions are possible even in the absence of visual input, highlighting the influence of non-stimulus-related downstream activity on neural responses. These findings can inform future modeling work of neural responses in the visual cortex to account for such non-visual influences.
R3.1: "A major weakness of the study is that the analysis includes data from only a single monkey. This makes it hard to interpret the data as the results could be due to experimental conditions specific to this monkey, such as the relative placement of electrode arrays in V1 and V4."
We have now added the second monkey (monkey “A”) from the same dataset (Chen et al., 2020), which includes all activity types except the lights-off condition. In addition, we collected new neural activity from one additional monkey (monkey “D”) in collaboration with the Carlos Ponce lab (monkey A: seelines 90-96, 120-132, 159, 161, 171, 183-185, 188-194, 200-203, 228-237, 254-258, 292-296, 334-342, 351-353, 358-364, 374-378, 387-393, 400-408, 414, 417-421, 539-540, 544-545, 680-681, 696-698; Supplemental Figures 1-6, 8, 11, 12, and 13; monkey D: see lines 90-96, 120-130, 132-134, 163-164, 228-235, 237-243, 292-296, 351-353, 374-378, 387-389, 539-540, 553-560, 696-698; Supplemental Figures 1-2, 4, 6, 9, 11, and 12. The conclusions for the new monkeys are qualitatively similar to the ones reported previously. The main quantitative differences are due to the very large difference in the number of predictor sites (Table 2, lines 127-134).
R3.2: The authors perform a thorough analysis comparing regression-based predictions for a wide variety of combinations of stimulus conditions and directions of influence. However, the comparison of stimulus types (Figure 4) raises a potential concern. It is not clear if the differences reported reflect an actual change in predictive influence across the two conditions or if they stem from fundamental differences in the responses of the predictor population, which could in turn affect the ability to measure predictive relationships. The authors do control for some potential confounds such as the number of neurons and self-consistency of the predictor population. However, the predictability seems to closely track the responsiveness of neurons to a particular stimulus. For instance, in the monkey data, the V1 neuronal population will likely be more responsive to checkerboards than to single bars. Moreover, neurons that don't have the bars in their RFs may remain largely silent. Could the difference in predictability be just due to this? Controlling for overall neuronal responsiveness across the two conditions would make this comparison more interpretable.
First, we note that several of the analyses and comparisons are within conditions and not across conditions, where by “condition” we mean the presence or absence of a stimulus or different stimuli (e.g., Figures 3, 5, 6, 7, Supplementary Figures 3-4, 7-13).
In Figure 4, differences in target-population responsiveness could influence predictability across stimulus types, as the reviewer points out. We therefore controlled for this by modeling EV as a function of the following neuron properties: split-half r, SNR, one-vs-rest r^2, and response variance. Regression was performed within each direction, where we then used residuals for inference_._ When comparing residuals, the predictability of checkerboard responses remained statistically higher than the predictability of the responses to moving bars (p<0.001, permutation test, Supplementary Figure 5K, lines 196-203), suggesting that the differences in predictability cannot be exclusively attributed to differences in the target population neuronal properties.
CARABID.E.
CARABIDÆ
7 Refer
agregar las referencias
o (???) bajo el Assumption 1 de y tiene actividad finita de saltos, λ=∫Eλ(dx)<∞. Supongamos que el proceso X satisface el modelo (???) bajo el Assumption 1 de y tiene actividad finita de saltos, λ=∫Eλ(dx)<∞. Considérese un régimen asintótico de alta frecuencia en el que Δn→0 y T=nΔn→∞ cuando
revisar
eLife Assessment
This valuable work identifies a subpopulation of neurons in the larval zebrafish pallium that responds differentially to varying threat levels, potentially mediating the categorization of negative valence. The evidence supporting these claims is solid; however, the study would be strengthened by more sophisticated analyses of functional imaging results, behavioral confirmation of stimulus valence, and further evidence linking the functionally distinct clusters to their molecular identity. This work will be of interest to systems neuroscientists investigating the circuit-level encoding of emotion and defensive behavior.
Reviewer #1 (Public review):
Summary:
This study presents a map of neurons responding to aversive stimuli in zebrafish and suggests that the regions containing these neurons are homologous to mammalian brain areas involved in aversive processing. Specifically, this study found that neurons in a part of the pallium, the homolog of the amygdala, responded vigorously to strongly noxious and fully looming stimuli, but not to the milder cues. In contrast, neurons in another part of the pallium responded to all of these stimuli. The findings provide valuable insights into the neural mechanisms underlying negative-valence computation in zebrafish.
Strengths:
This study performed whole-brain functional imaging using two-photon light-sheet microscopy and identified the activity of individual neurons in awake zebrafish. This technique is highly valuable and will be broadly applicable to future studies aimed at elucidating the neural mechanisms underlying zebrafish behavior at single-neuron resolution.
Weaknesses:
Although this study reports neuronal responses to aversive stimuli, it did not directly assess how aversive these stimuli were for zebrafish. In general, studies of this kind quantify the aversiveness of test stimuli by measuring behavioral indices such as avoidance or escape responses. The present study states that "neurons responded vigorously to strongly noxious and fully looming stimuli, but not to milder cues." However, the authors did not provide behavioral evidence demonstrating that the stimuli were indeed aversive or that the so-called milder cues were perceived as less aversive by the animals. Without a behavioral measure of aversiveness, it is difficult to determine whether the reported neural responses reflect negative-valence processing, rather than general sensory salience or stimulus intensity.
Reviewer #2 (Public review):
Summary:
The authors aim to map neurons encoding negative valence at the whole-brain scale in larval zebrafish. Using two-photon light-sheet imaging combined with various aversive stimuli, they visualize and quantify stimulus-evoked neural responses, identify the anatomical locations of responsive neurons, and explore the possibility of genetically accessing Rl neurons that respond preferentially to strongly noxious stimuli.
Strengths:
The major strength of this study lies in its use of two-photon light-sheet imaging, which provides a system-level characterization of neuronal response to aversive stimuli. The authors systematically compare multiple classes of aversive stimuli (heat, electric shock, looming, etc.), showing that strongly threatening stimuli converge on a compact neuronal population in the Rl, supporting the robustness of the finding. Finally, the identification of Tiam2a expression in these neurons provides a potential genetic handle for future functional studies.
Weaknesses:
The main weakness of the study is the lack of causal evidence supporting the functional role of the identified neurons. Without optogenetic, chemogenetic, or ablation experiments, it is difficult to determine whether these neurons are required for or sufficient to encode negative valence. In addition, the study does not include positive-valence or neutral stimuli controls, making it difficult to distinguish whether the observed neural responses reflect valence per se or more general downstream response such as motor output. Finally, the lack of behavioral readouts limits the ability to directly link the identified neural populations to defensive behaviors.
Reviewer #3 (Public review):
Overview and Strengths:
Accurate evaluation of threat levels allows animals to determine whether to escape. The precise mechanism underlying threat evaluation remains unclear. Smith et al. identified a cluster of neurons in the zebrafish rostrolateral dorsal pallium (Rl) that respond differentially to varying levels of negative-valence stimuli.
This work leverages the small size and optical transparency of the larval zebrafish, using two-photon selective plane illumination microscopy to assay the response of pallial neurons to various negative-valence stimuli. Interestingly, unlike the ventromedial pallium and habenula, which responded to all stimuli tested, neurons in the Rl were activated by a selection of stimuli representing relatively higher levels of threats. By leveraging a zebrafish brain atlas, the authors identified a transgenic line labeling a tiam2a+ cluster of neurons that appears to be the activated population in the Rl. Together, these results demonstrate a subpopulation of pallial neurons that likely categorizes the strength of negative valence in larval zebrafish.
The primary conclusions of this work are well supported by the data. The identification of a neuronal cluster that may underlie the categorization of threat-associated sensory stimuli is significant. Furthermore, this study generates a high-quality functional imaging dataset using cutting-edge microscopy, setting the foundation for understanding the neuronal encoding of emotions in zebrafish.
Results from this work set the stage to answer further exciting questions: How do tiam2a+ Rl neurons modulate the activity of the hindbrain escape circuit? What is the functional role of the Rl population inhibited by threat stimuli? Computationally, how does Rl integrate sensory signals and classify threat levels? How does the activity of Rl change in the context of habituation and conditioning? Future work may use more nuanced stimuli and combine new genetic tools, behavioral recording, and circuit-level analysis to systematically reveal how emotions modulate defensive behaviors.
Weaknesses:
The impact of this work could be further enhanced by incorporating more sophisticated data analysis and by more clearly anchoring the findings within the known framework of zebrafish defensive behavior.
(1) The authors performed statistical analyses across six ROIs per experiment in Figures 1E/J, 3E/J, and 6B/D/F. This increases the probability of Type I errors. Applying multiple comparison corrections would mitigate this concern. Given that most stimuli (except for the "IR heating") are non-directional, the authors may consider first testing for the response symmetry following each stimulus and then combining ROIs from the two hemispheres to calculate a single averaged measurement per region per fish for comparisons of regional dF/F.
(2) I found the topographical mapping of activated and inhibited ROIs very informative. There appear to be two subpopulations of Rl: a posterior-medial population often activated by negative valence stimuli, and an anterior-lateral population that is frequently inhibited. I wonder if it is possible to decode the valence or category of a stimulus based on the topography and response profiles of these neurons? These results would provide additional evidence for the Rl's roles of threat evaluation.
(3) Findings in this paper, especially differential responses of the Rl to full and partial looming, deserve an expanded discussion. The authors should better anchor these findings to established literature to emphasize their significance in the Discussion. For example, how might this potential categorization mechanism contribute to, or differ from, the mechanisms underlying habituation (Fotowat & Engert, 2023, eLife); what are the possible connections between the pallium and the hindbrain escape circuits that could relay these Rl signals (Kunst et al., 2019, Curr Biol)?
(4) The authors make conservative claims associating the tiam2a+ cluster with Rl neurons activated by noxious stimuli, and their data support this conclusion. However, this link could be further strengthened by testing whether the tiam2a+ cluster shows differential responses to full vs partial looming. This could be achieved by performing pERK staining following the stimulus paradigm. While future tools may allow for direct functional imaging of this population, I believe such experiments are beyond the scope of this paper.
(5) Figure 1E/J, Figure 3E/J: Please clarify whether the dashed red vertical lines indicate the onset or the offset of the stimuli. Additionally, different time windows were used for AUC calculations across these experiments; the authors should provide a rationale for these varying windows in the Results or Methods.
salto compensado
enlace
o(S
espacio
(EDE-S)
ajustar la sigla que concuerde con las anteriores
semimartingala
cita a capítulo anterior
legal-entities needs work done for user management