10,000 Matching Annotations
  1. Last 7 days
    1. HHyena:ecosistema Contexto del investigador Mi proceso de investigación responde en este caso a un diálogo entre la pregunta principal de investigación, el proyecto de doctorado con un método de investigación creación —cabe aclarar que al hacer una cotutela en diferentes departamentos y/o facultades además de países distinto— entre la PUJ y la JLU se generan tensiones sobre qué investigar y cómo hacerlo. Temporalidades Escuelas de Verano Coloquios Publicaciones Momentos de la investigación Revisión de literatura Trabajo de campo Metodología recolección de datos preanálisis de datos Resultados Discusión Conclusión y recomendaciones Referencias bibliográficas Anéxos/ apéndices Revisión de literatura

      Hola Emilio! Me gusta este esquema que has estructurado. En principio me habia hecho la idea de elaborar un esquema como este con las orientaciones de la clase, pero ahora me siento frustrada porque no le he logrado.

    1. lei

      Os casos de contratação por tempo determinado deve ser prevista em <u>lei ordinária</u>. Não há razão para se exigir lei complementar para regulamentação da contratação por tempo determinado. Nesse sentido:


      • Informativo 1162
      • ADI 7057 / CE
      • Órgão julgador: Tribunal Pleno
      • Relator(a): Min. DIAS TOFFOLI
      • Julgamento: 06/12/2024 (Virtual)
      • Ramo do Direito: Administrativo
      • Matéria: Agente Público; Contratação Temporária; Requisitos; Agente Socioeducativo; Regulamentação; Lei Complementar Estadual

      Contratação temporária em âmbito estadual e sua regulamentação por lei complementar

      Resumo - É inconstitucional — pois viola o princípio da simetria e o princípio democrático — norma de Constituição estadual que <u>exige a edição de lei complementar</u> para a regulamentação dos casos de contratação por tempo determinado para atender a necessidade temporária de excepcional interesse público.

      • São inconstitucionais — pois não observam o princípio do concurso público (CF/1988, art. 37, II) nem os requisitos para a contratação temporária (CF/1988, art. 37, IX) — as Leis Complementares cearenses nº 163/2016, nº 169/2016 e nº 228/2020, que autorizam, por tempo determinado e para atender a necessidade temporária e de excepcional interesse público, a admissão de profissionais para a execução de atividades técnicas especializadas no âmbito do Sistema Estadual de Atendimento Socioeducativo.

      • Ao tratar do instituto da contratação temporária, a Constituição Federal não determinou que sua regulamentação fosse realizada por meio de lei complementar (1).

      • De acordo com a jurisprudência desta Corte (2), exigir lei complementar em situações para as quais a Constituição Federal não a previu restringe o arranjo democrático-representativo por ela estabelecido.

      • Para que se considere válida a contratação temporária, exige-se que: i) os casos excepcionais estejam previstos em lei; ii) o prazo de contratação seja predeterminado; iii) a necessidade seja temporária; iv) o interesse público seja excepcional; v) a necessidade de contratação seja indispensável, sendo vedada a contratação para os <u>serviços ordinários permanentes</u> do Estado, e que <u>devam estar sob o espectro das contingências normais</u> da Administração (3).

      • Na espécie, as Leis Complementares cearenses nº 163/2016 e nº 169/2016, embora estabeleçam prazo predeterminado para a contratação, visando realização de um objetivo público de grande relevância, não tratam de situação excepcional, porquanto a busca pelo aprimoramento dos serviços para melhor servir à sociedade é inerente à Administração Pública.

      • Ademais, os anexos dessas normas demonstram tratar-se de diversas funções da estrutura administrativa do Sistema Estadual de Atendimento Socioeducativo que deveriam ter sido preenchidas por detentores de cargos públicos, tendo em vista a natureza ordinária e permanente das atividades.

      • Por sua vez, a Lei Complementar nº 228/2020, editada no contexto da pandemia da Covid-19, apontou que a necessidade temporária da contratação compreenderia o período necessário à realização de concurso público para o provimento de cargos efetivos. Entretanto, o certame somente foi lançado em abril de 2024, quase oito anos após a criação, pela Lei estadual nº 16.040/2016, da Superintendência do Sistema Estadual de Atendimento Socioeducativo. A perpetuação dessas contratações pretensamente de caráter temporário evidencia a inércia administrativa em regularizar a estrutura de pessoal daquela superintendência.

      • Com base nesses e em outros entendimentos, o Plenário, por maioria, julgou parcialmente procedente ação para: (i) declarar a inconstitucionalidade da expressão “complementar” do art. 154, inciso XIV, da Constituição do Estado do Ceará, com efeito ex nunc, para que a decisão, no ponto, produza efeitos a partir da publicação da ata deste julgamento; e (ii) declarar a inconstitucionalidade das Leis Complementares estaduais nº 163/2016; nº 169/2016; e nº 228/2020, garantindo-se a vigência das contratações temporárias celebradas com base nos citados diplomas, até que expirem os prazos de duração, após o que deverá o Estado do Ceará preencher os quadros de seu Sistema Estadual de Atendimento Socioeducativo com servidores aprovados em concurso público.

  2. www.planalto.gov.br www.planalto.gov.br
    1. não se aplica

      A regra geral é a aprovação tácita para o silêncio administrativo em analisar, no prazo legal, o requerimento para exercício de atividade econômica.

      No entanto, uma exceção é quando o requerente é agente público ou possui vínculo de parentesco com agente público. Ou seja, nessa circunstância, inexiste aprovação tácita.

    1. Las estructuras secundarias que forman los ARNlnc son complejas e importantes para su función, lo cual les permite su unión con RNA o DNA a través de apareamiento de bases; también interactúan con proteínas a través de reconocimiento de la secuencia del RNA con una fracción de la estructura proteica; también pueden actuar como escalafones para permitir la interacción de múltiples proteínas, lo que resulta en la reunión de factores que de otra manera no podrían interactuar, con lo cual se favorece o inhibe la expresión génica (figura 8-8). A pesar de que sólo una fracción pequeña (cerca de 5%) de ARNlnc se ha caracterizado de forma funcional, el rango de procesos biológicos en los que se conoce que están involucrados está creciendo continuamente; algunos de éstos tienen implicaciones importantes en procesos fisiológicos y patológicos. Dentro de los primeros se encuentra la inactivación del cromosoma X en el sexo femenino, la regulación de la respuesta inmune, la diferenciación celular; respecto a los procesos patológicos, existe evidencia sobre su participación en diferentes tipos de cáncer, diabetes, fibrosis hepática, entre otras enfermedades. ++ Algunos de los mecanismos en los que participa el ARNlnc en la regulación génica son los siguientes: modificación de histonas y del estado de la cromatina: los ARNlnc se unen a complejos proteicos que modifican la cromatina, por ejemplo, complejos que metilan la histona H3. También se unen a proteínas represoras, activadoras, factores transcripcionales y factores de corte y empalme de genes. De igual forma, actúan para guiar proteínas a sus blancos o como peldaños que unen complejos proteicos en loci específicos. Existen datos acerca de su función como esponjas o a través de apareamiento de bases con miARN al inhibir su procesamiento a miARN maduros.

      Este tema de los ARN largos no codificantes (lncRNA) es de lo más avanzado en biología molecular actual, Gaby. Básicamente, son los "directores de orquesta" del genoma: no se convierten en proteínas, pero le dicen a todas las demás moléculas qué hacer.

      Aquí te resumo los puntos clave de tu texto para que los entiendas de forma sencilla:

      1. ¿Qué son? (Sus "credenciales") Tamaño: Tienen más de 200 nucleótidos (son grandes).

      Aspecto: Engañan a la célula porque parecen un ARNm normal (tienen su Cap 5', su cola Poli-A y sufren splicing), pero no codifican proteínas.

      Especificidad: Son muy "especiales"; no están en todas las células igual, sino que aparecen en momentos específicos (control temporal) y en células específicas.

      1. ¿Cómo funcionan? (Sus 4 roles principales) El texto menciona que actúan de varias formas gracias a su estructura compleja:

      Como Guías: Se pegan a una proteína y la llevan de la mano hasta el lugar exacto del ADN donde debe trabajar.

      Como Escalafones (Andamios): Sirven como una plataforma donde varias proteínas se sientan juntas para poder interactuar entre ellas. Sin el lncRNA, estas proteínas estarían perdidas por la célula y no se encontrarían.

      Como "Esponjas": Se pegan a los microARN (miARN) y los atrapan. Al "secuestrarlos", evitan que los miARN destruyan a otros mensajes. Es un guardaespaldas de los ARNm.

      Control de la Cromatina: Se unen a complejos que metilan histonas (como la H3). Esto decide si el ADN se enrolla (se apaga) o se desenrolla (se enciende).

      1. Importancia Médica (¿Por qué te lo preguntan en medicina?) Tu texto destaca procesos vitales donde los lncRNA son los protagonistas:

      Inactivación del cromosoma X: En las mujeres, uno de los dos cromosomas X debe "apagarse" para no tener doble dosis de genes. Un lncRNA llamado Xist es el encargado de cubrir todo ese cromosoma y silenciarlo.

      Diferenciación celular: Ayudan a que una célula madre sepa si debe ser neurona o hepatocito.

      Patologías: Si estos lncRNA fallan o se expresan de más, pueden causar cáncer (ayudando a que los tumores crezcan), diabetes o fibrosis hepática.

    2. Interrupción de la traducción ++ El proceso de síntesis de proteínas es automático, esto es, una vez iniciado debe terminarse. En casos especiales, un proceso denominado recodificación traduccional puede alterar el proceso de traducción. Los tipos de recodificación observados con más frecuencia son los cambios en el marco de lectura y se observan sobre todo en virus; los retrovirus lo hacen de manera ordinaria. Estos virus producen un solo mRNA del cual se sintetizan tanto las proteínas de la cápside (proteínas Gag) como sus enzimas (transcriptasa inversa, integrasas, proteasa y proteínas Pol). Como los virus necesitan más proteínas Gag que Pol provocan un ajuste en su mRNA e inducen la formación de un codón de terminación al finalizar la región Gag, con lo cual se asegura que sólo se produzcan las proteínas de esta región y se elimina de manera temporal la síntesis de las proteínas Pol. ++ En fecha reciente, se han descrito otros mecanismos de control de la expresión de genes: la presencia de moléculas de RNA complementarias al mRNA que, al unirse a él, bloquean su transcripción. A este tipo de estrategias se les conoce como RNA antisentido o RNA de interferencia y regulan la expresión de algunos genes tanto en células procariotas como eucariotas (véase el capítulo 28, Terapia génica). Este mecanismo se describió inicialmente en organismos inferiores, pero ahora se sabe que funciona en la mayoría de los organismos. Los estudios experimentales con este tipo de moléculas administradas de forma exógena son de gran interés, ya que el bloqueo en la síntesis de una determinada proteína permite entender su funcionamiento completo y comprender de forma más integral su función en los procesos evolutivos. Se cree que las primeras células carecían de DNA y proteínas y sólo contenían RNA. Estas células primitivas utilizaban el mecanismo antisentido para regular sus funciones (cuadro 8-1).
      1. Recodificación Traduccional (El "Resbalón" del Ribosoma) Normalmente, el ribosoma lee de 3 en 3 letras sin saltarse ninguna. Pero en los virus (como el VIH), esto cambia:

      El Problema: El virus tiene un solo mensaje (mRNA) pero necesita fabricar dos cosas: la "carcasa" (Gag) y las "herramientas" (Pol).

      La Trampa: Al final de la instrucción para la carcasa (Gag), hay un "punto de alto" (codón de terminación).

      El Ajuste: El virus manipula al ribosoma para que, la mayoría de las veces, se detenga ahí y solo haga la carcasa. Pero a veces, hace que el ribosoma se "resbale" (cambio de marco de lectura), ignore el "alto" y siga de largo para fabricar las herramientas (Pol).

      Resultado: Así el virus se asegura de tener muchas carcasas y solo unas cuantas herramientas.

      1. RNA Antisentido (La "Cinta Adhesiva") Este es un mecanismo de bloqueo físico usando otra molécula de ARN.

      ¿Cómo funciona? La célula fabrica una cadena de ARN que es exactamente la imagen en espejo (complementaria) del mRNA que quiere silenciar.

      La Unión: Al ser complementarias, se pegan como un imán.

      El Bloqueo: Esto forma una doble hélice de ARN. El ribosoma no puede "leer" una doble hélice; es como si le pusieras cinta adhesiva a un código de barras. El escáner (ribosoma) simplemente no puede pasar.

      1. RNA de Interferencia (El "Triturador") Es una evolución del sistema anterior. No solo bloquea al ribosoma, sino que le avisa a la célula que ese mensaje debe ser destruido.

      Uso en Medicina: Como mencionaste, los científicos usan esto para apagar genes específicos. Si inyectamos este ARN "espejo", podemos detener la producción de una proteína que esté causando una enfermedad.

      Dato Curioso: Se cree que las primeras células (antes de que existiera el ADN) ya usaban este sistema para controlarse a sí mismas.

      En resumen, lo que tu texto explica es:

      Virus: Engañan al ribosoma para que se resbale y lea más de lo que debe.

      Antisentido/Interferencia: Usan una cadena "espejo" para tapar o destruir el mensaje y que nadie pueda leerlo.

    3. Nivel de degradación del mRNA ++ Los mRNA en células bacterianas son muy inestables; su vida media es de pocos minutos. En células eucarióticas el mRNA es más estable, de alrededor de 30 min, aunque existen otros con vidas medias más largas, por ejemplo, el de la β-globina tiene una vida media de 10 h. Los mRNA más inestables a menudo codifican para proteínas reguladoras cuya síntesis cambia rápidamente ante un estímulo. La inestabilidad de estos mRNA se debe a que su secuencia rica en A y U en la región 3′ no traducida (UTR) acelera la eliminación de la cola de poli-A y, por ende, la degradación del mRNA. Otros mRNA se reconocen en sus extremos 3′ UTR por endonucleasas que cortan el mRNA. Sin embargo, la estabilidad de un mRNA cambia en respuesta a señales extracelulares. ++ Por ejemplo, el mRNA que codifica para las histonas, en la fase S del ciclo celular, periodo en el que se sintetiza el DNA y se requiere de nuevas histonas para su empaquetamiento, tiene una vida media de 1 h; cuando termina la fase S, los mRNA se degradan en pocos minutos. De igual forma, si la síntesis de DNA se inhibe con algún fármaco, la acumulación de histonas libres induce la degradación de su mRNA. Por ello, la degradación del mRNA depende de las señales que actúen en su extremo 3′, en el cual se encuentra la cola de poli-A. +++ Cola de poli-A ++ La adición de la cola de poli-A a un mRNA recién sintetizado ocurre en organismos eucariotas y se lleva a cabo en el núcleo. Su longitud es variada y cuenta con un promedio de 200 nucleótidos. Una vez en el citoplasma, esta cola se acorta con el tiempo. No se han observado colas de menos de 30 adeninas, lo que sugiere que este es el tamaño mínimo requerido para mantener la estabilidad del mRNA

      . La Cola de Poli-A: El "Escudo Protector" Imagina que la cola de Poli-A es como la mecha de una bomba.

      Sale del núcleo con unos 200 nucleótidos de largo.

      Cada vez que un ribosoma lee el mensaje, o simplemente con el paso del tiempo, la cola se va haciendo más cortita.

      El límite crítico: Como bien notaste, cuando llega a menos de 30 adeninas, el escudo se rompe. En ese momento, las enzimas del citoplasma destruyen el cuerpo del mRNA en segundos.

    4. Proteínas inhibidoras de la traducción ++ La expresión de un gen puede inhibirse si la traducción se bloquea mediante la unión de proteínas inhibidoras en el extremo 5´ del mRNA cerca del sitio de inicio de la traducción. Este tipo de mecanismo se llama control negativo de la traducción.

      Este mecanismo es la forma que tiene la célula de decir: "Tengo el mensaje listo, pero prohíbo leerlo". Es un control muy drástico y rápido porque actúa directamente sobre el ribosoma.

      Aquí te explico cómo funciona este control negativo y por qué es tan importante:

      1. El "Bloqueo" Físico Imagina que el ribosoma es un escáner que necesita pasar por encima del código de barras (el extremo 5' y el AUG) para empezar a trabajar.

      Una proteína inhibidora se pega justo en esa zona del mRNA (la región líder o 5' UTR).

      Al estar ahí sentada, actúa como un "obstáculo" o una barrera física.

      El ribosoma llega, choca con la proteína y no puede encontrar el codón de inicio. Resultado: El mRNA se queda flotando en el citoplasma, pero no produce ni una sola proteína.

    5. Adición de grupos químicos a proteínas ++ Otro mecanismo por el cual se puede regular la expresión de un gen es la adición de diferentes grupos químicos a cualquiera de los aminoácidos que conforman una proteína. Sin la adición de estos compuestos la proteína no será una proteína madura y funcional. Entre las adiciones más comunes se encuentran las acetilaciones, las carboxilaciones, las metilaciones, las hidroxilaciones y las fosforilaciones.

      osforilación: El "Interruptor" MaestroEs la adición de un grupo fosfato ($PO_4^{3-}$) a aminoácidos como la serina, treonina o tirosina.Enzimas: Las encargadas son las quinasas (lo pegan) y las fosfatasas (lo quitan).Función: Activa o desactiva proteínas al instante. Es la base de la comunicación celular (señalización).2. Acetilación y Metilación: El Control del ADNAunque ocurren en muchas proteínas, son famosísimas en las histonas (las proteínas que enrollan el ADN).Acetilación: Generalmente "abre" la cromatina para que los genes se puedan leer.Metilación: Puede activar o silenciar genes dependiendo de dónde se pegue.3. Hidroxilación: La Fuerza del ColágenoConsiste en añadir un grupo hidroxilo ($-OH$).Ejemplo médico: Es vital para el colágeno. Sin vitamina C (cofactor), la enzima no puede hidroxilar la prolina del colágeno, las fibras no se trenzan bien y da escorbuto (encías sangrantes, debilidad).4. Carboxilación: La Coagulación SangrientaSe añade un grupo carboxilo ($-COOH$).Ejemplo médico: Es esencial para los factores de coagulación (como la protrombina). Este proceso necesita vitamina K. Si no hay carboxilación, los factores no pueden unirse al calcio y no puedes dejar de sangrar.

    6. Nivel de la traducción ++ La traducción comienza cuando la subunidad pequeña del ribosoma reconoce el codón de inicio (AUG) en el mRNA. Los nucleótidos vecinos participan en este reconocimiento, en el que se encuentra la secuencia Shine-Dalgarno en mRNA procariotas y la secuencia Kozak en eucariotas (véase el capítulo 7). Si el reconocimiento es deficiente, la subunidad ribosómica ignorará el primer codón AUG y saltará hasta el segundo o el tercero. Este fenómeno, conocido como búsqueda de escape, es una estrategia para producir dos o más proteínas diferentes en su extremo aminoterminal a partir de un mismo mRNA. ++ En mRNA virales, la traducción se realiza usando este tipo de mecanismos. Estos mRNA cuentan con secuencias de nucleótidos específicas, llamadas sitios internos, que el ribosoma no reconoce; la traducción se inicia en el segundo codón AUG.

      filtro" antes de que la proteína sea una realidad física. Lo que describes es fascinante porque demuestra que el ribosoma no es una máquina ciega que solo lee lo que le dan; en realidad, tiene un sistema de "escaneo" muy sofisticado que decide dónde y cómo empezar a trabajar.Aquí te detallo los puntos clave de este nivel de control:1. El Reconocimiento del "Inicio" (AUG)El codón AUG (Metionina) es la señal de salida, pero el ribosoma necesita un "contexto" para saber que ese es el AUG correcto y no uno cualquiera que anda por ahí en medio del mensaje.En Procariotas (Bacterias): Usan la secuencia Shine-Dalgarno. Está un poquito antes del AUG y ayuda a que el ribosoma se "estacione" exactamente donde debe.En Eucariotas (Nosotros): Usamos la secuencia Kozak ($ACCAUGG$). Si las letras alrededor del AUG son las correctas, el ribosoma se detiene y empieza la traducción con fuerza.

      1. Búsqueda de Escape (Leaky Scanning) Este es un mecanismo de "todo o nada". Si la secuencia Kozak es "débil" (no tiene las letras perfectas), el ribosoma puede pasar de largo.

      ¿Qué pasa entonces? El ribosoma ignora el primer AUG y sigue buscando hasta encontrar un segundo o tercer AUG más adelante.

      El resultado: Se producen proteínas con diferentes extremos amino-terminales. La proteína que empieza en el segundo AUG será un poco más corta que la que empezó en el primero. Esto permite que un solo mRNA genere versiones de la misma proteína con funciones ligeramente distintas (por ejemplo, una que se queda en el citoplasma y otra que se va a la mitocondria).

    7. Nivel de transporte del mRNA al citoplasma ++ Transporte del núcleo al citoplasma. El RNA, como cualquier otra molécula que sale del núcleo, lo hace a través del complejo de poro. Para poder salir del núcleo, el RNA sufre tres modificaciones importantes: la adición del nucleótido modificado 7 metilgualnosina en el extremo 5′, la adición de la cola de Poli-A en el extremo 3′ y la eliminación de los intrones (splicing). ++ Cuando una molécula de mRNA cruza por un poro nuclear y se introduce en el citoplasma, se encuentra con los ribosomas, que la traducen en una cadena polipeptídica. Si el mRNA codifica para una proteína de secreción o de membrana, la presencia de un péptido señal en la región aminoterminal determina su transporte hacia el retículo endoplásmico. La célula reconoce este péptido tan pronto como sale del ribosoma; entonces, el complejo formado por el ribosoma, el mRNA y la proteína naciente se dirige a la membrana del retículo endoplásmico, donde la cadena polipeptídica terminará de sintetizarse. En otros casos, la proteína entera es sintetizada por ribosomas libres en el citosol, y señales en su estructura la dirigen al sitio en la célula en la cual se necesita.

      Este nivel de control es fundamental porque actúa como la "aduana celular". No importa qué tan bien se haya transcrito un gen; si el mensaje no puede salir del núcleo o no llega a la "fábrica" correcta (el ribosoma), la proteína nunca existirá.

      Aquí te detallo los puntos clave de este proceso para que los tengas bien organizados:

      1. El Pasaporte del mRNA (Control de Salida) El núcleo es muy estricto. El complejo del poro nuclear (NPC) no deja salir cualquier cadena de ARN. Solo permite el paso a los que tienen sus tres sellos de calidad:

      Cap 5' (7-metilguanosina): Es la "cabeza" que el poro reconoce para dejarlo pasar.

      Cola Poli-A: Le da estabilidad y dirección.

      Ausencia de intrones: Si el splicing no se ha completado, unas proteínas llamadas "vigilantes" mantienen al ARN retenido en el núcleo.

      1. El Destino: ¿Ribosomas Libres o Retículo Endoplásmico (RE)? Una vez en el citoplasma, el mRNA se encuentra con los ribosomas. Aquí es donde se decide dónde trabajará la proteína final:

      A. Proteínas de "Exportación" o Membrana (Ruta del RE) Si la proteína va a ser enviada fuera de la célula (como la insulina) o se va a quedar en la membrana, tiene un Péptido Señal al principio (extremo amino-terminal).

      En cuanto sale ese pedacito de proteína del ribosoma, una partícula llamada SRP (Partícula Reconocedora de la Señal) lo atrapa.

      Todo el "combo" (Ribosoma + mRNA + Proteína naciendo) se mueve hacia el Retículo Endoplásmico Rugoso.

      La proteína se termina de fabricar "inyectándose" directamente dentro del RE.

      B. Proteínas de "Uso Interno" (Citocromo, Hemoglobina, etc.) Si no tiene ese péptido señal, los ribosomas se quedan flotando libres en el citosol.

      La proteína se termina de armar ahí mismo.

      Otras señales (como la señal de localización nuclear o la señal mitocondrial) le dirán a la proteína terminada a dónde ir (al núcleo, a la mitocondria, a los peroxisomas, etc.).

    8. Edición del RNA ++ Este tipo de control postranscripcional se refiere a la modificación en una o más bases en la secuencia del mRNA maduro que provoca cambios en el mensaje original. La modificación más frecuente es el cambio de citocina por uracilo, con lo que la secuencia original se altera hasta en 50%. El proceso de edición del mRNA es limitado en mamíferos y sólo se ha observado en los genes de ApoB y de la proteína del canal de calcio en el cerebro. En el primer caso, una citocina se cambia por un uracilo, con lo que se genera un codón de terminación prematuro que produce una versión truncada de la proteína. En el segundo caso, se cambia un nucleótido a la mitad de la molécula de mRNA; esto origina el reemplazo de un aminoácido por otro, lo que altera la permeabilidad del canal de calcio.

      La edición del ARN es uno de los mecanismos más curiosos porque es como si la célula tuviera un "corrector de textos" que cambia letras específicas después de que el mensaje ya está escrito y procesado.

      Como bien mencionas, esto no cambia el ADN, sino el mensaje (ARNm), lo que permite que un mismo gen fabrique proteínas con funciones totalmente distintas o incluso con tamaños diferentes.

      1. El caso de la Apolipoproteína B (ApoB): El "Punto Final" prematuro Este es el ejemplo más famoso de desaminación de citocina.

      En el Hígado: El gen se transcribe normalmente y produce una proteína larga llamada ApoB-100, que es esencial para transportar colesterol (VLDL y LDL).

      En el Intestino: Existe una enzima específica (la citidina desaminasa). Esta enzima busca un codón específico (CAA, que codifica para el aminoácido glutamina) y cambia la Citocina (C) por un Uracilo (U).

      El resultado: El codón CAA se convierte en UAA. En el código genético, UAA es un codón de paro (STOP).

      Consecuencia: La síntesis se detiene a la mitad, creando la ApoB-48 (llamada así porque tiene el 48% del tamaño de la original), que sirve para transportar grasas de la dieta (quilomicrones).

    9. Nivel del procesamiento del transcrito primario de RNA ++ Durante la transcripción, en organismos eucariotas se producen RNA precursores llamados transcritos primarios o pre-mRNA, posteriormente procesados para producir una molécula de mRNA madura a través del proceso de corte y empalme (splicing). El transcrito primario es alrededor de 10 veces más grande que el mRNA maduro. En este procesamiento, los intrones se eliminan del transcrito dejando exclusivamente los exones, para constituir un mRNA maduro. Un mismo transcrito primario puede procesarse de diversas formas, lo que da lugar a diferentes mRNA y, por lo tanto, a diferentes cadenas polipeptídicas. ++ Algunos genes presentan secuencias ambiguas; éstos son regiones que en unos tejidos se consideran exones y en otros, intrones, por lo que en cada tejido se realiza un procesamiento diferente conocido como procesamiento alternativo o splicing alternativo, que origina en cada uno de ellos mRNA y proteínas diferente

      Gracias al splicing alternativo, el cuerpo humano puede fabricar cerca de 100,000 proteínas distintas usando solo unos 20,000 genes.

      El proceso de quitar intrones y pegar exones lo hace una máquina molecular llamada Espliceosoma (Spliceosome). Su trabajo es ser extremadamente preciso; si se equivoca por una sola letra (nucleótido), cambia toda la lectura y la proteína no sirve.

      ¿Por qué pasa esto? Porque hay proteínas llamadas activadores o represores de splicing que son diferentes en cada tejido. En el cerebro, una proteína puede "esconder" el exón 2 para que el espliceosoma no lo vea y lo corte junto con los intrones.

    10. Atenuación de la transcripción ++ En organismos procarióticos, como las bacterias, la expresión de ciertos genes es inhibida por la terminación prematura de la transcripción, un fenómeno conocido como atenuación de la transcripción. En este proceso, la cadena de RNA recién sintetizada adopta una estructura que interactúa con la RNA polimerasa, impide su avance e interrumpe la transcripción. Cuando la célula requiere la proteína codificada por este gen, algunas proteínas reguladoras se unen a la cadena naciente de RNA y reacomodan su estructura, con lo que se permite la restauración de la transcripción y, por lo tanto, la producción de una molécula de mRNA completa. ++ La atenuación de la transcripción en eucariotas puede ocurrir por distintos mecanismos. En células infectadas por adenovirus o retrovirus (por ejemplo, el virus de inmunodeficiencia humana, VIH), las proteínas que se ensamblan en el promotor determinan si la RNA polimerasa puede truncar la transcripción. Estas proteínas pueden ser diferentes en distintas células y la célula puede controlar el nivel de atenuación de un gen en particular.
      1. En Procariotas: El "Nudo" en la cuerdaEn las bacterias, la transcripción (hacer ARN) y la traducción (hacer proteína) ocurren al mismo tiempo y en el mismo lugar. Esto permite que pase algo muy loco:El Freno: Mientras la ARN polimerasa va fabricando el ARN, esa cadenita de ARN se dobla sobre sí misma y forma una estructura de "pasador" o "horquilla" (stem-loop).El Resultado: Esa estructura es tan estorbosa que hace que la ARN polimerasa se "tropiece" y se suelte del ADN antes de terminar el gen. Resultado: ARN incompleto = No hay proteína.El Interruptor: Si la célula sí necesita la proteína, una proteína reguladora se pega al ARN, evita que se haga el nudo y la polimerasa sigue de largo.2. En Eucariotas y Virus (como el VIH): El control de calidadAquí la cosa cambia porque el núcleo separa la transcripción de la traducción. El ejemplo del VIH es el más famoso para entender esto:La Polimerasa "Floja": A veces, la ARN polimerasa II empieza a transcribir el gen del virus, pero se "cansa" rápido y se suelta después de haber hecho apenas unos pocos nucleótidos. Esto es la atenuación.La Proteína Salvador (Ejemplo: Tat en VIH): El virus fabrica una proteína llamada Tat. Esta proteína se une a una estructura del ARN naciente (llamada TAR).El "Empujón": Al unirse, Tat recluta a otras proteínas que le dan "superpoderes" a la polimerasa (la fosforilan), haciendo que ahora sea muy eficiente y no se suelte hasta terminar todo el genoma viral.Diferencias clave para tu examen:CaracterísticaProcariotas (Bacterias)Eucariotas / VirusMecanismo principalEstructuras de "horquilla" en el ARN (Symmetry/Loops).Proteínas que ayudan a la polimerasa a no soltarse (Elongación).SincroníaOcurre mientras el ribosoma está leyendo el ARN.Ocurre totalmente en el núcleo antes de salir al citoplasma.FunciónAhorrar energía si ya hay suficiente producto (ej. Triptófano).Controlar qué tan "fuerte" se expresa un gen en distintos tejidos.
    11. Dedos de cinc ++

      El átomo de cinc funciona como el "pegamento" o el "clavo" que mantiene unidas a la hélice y a la hoja beta. Sin el cinc, la proteína se desmoronaría y perdería su forma, por lo que no podría unirse al ADN.

    12. Hélice-asa-hélice

      Una hélice alfa corta: Una espiral de aminoácidos pequeña.

      Un asa (o lazo): Un tramo de aminoácidos flexible que conecta las dos hélices (como el cable de unos audífonos).

      Una hélice alfa larga: Otra espiral, pero más grande, que es la que tiene "los dedos" para tocar y reconocer las bases del ADN.

    1. 278Dædalus, the Journal of the American Academy of Arts & SciencesThe Turing Trap: The Promise & Peril of Human-Like Artificial IntelligenceIn 1988, robotics researcher Hans Moravec noted that “it is comparatively easyto make computers exhibit adult level performance on intelligence tests or play-ing checkers, and difficult or impossible to give them the skills of a one-year-oldwhen it comes to perception and mobility.”33 But I would argue that in many do-mains, Moravec was not nearly ambitious enough. It is often comparatively easierfor a machine to achieve superhuman performance in new domains than to matchordinary humans in the tasks they do regularly.Humans have evolved over millions of years to be able to comfort a baby, nav-igate a cluttered forest, or pluck the ripest blueberry from a bush. These tasksare difficult if not impossible for current machines. But machines excel when itcomes to seeing X-rays, etching millions of transistors on a fragment of silicon, orscanning billions of webpages to find the most relevant one. Imagine how feebleand limited our technology would be if past engineers set their sights on merelymatching human-levels of perception, actuation, and cognition.Augmenting humans with technology opens an endless frontier of new abili-ties and opportunities. The set of tasks that humans and machines can do togetheris undoubtedly much larger than those humans can do alone (Figure 1). Machinescan perceive things that are imperceptible to humans, they can act on objects inways that no human can, and, most intriguingly, they can comprehend things thatare incomprehensible to the human brain. As Demis Hassabis, CEO of DeepMind,put it, the AI system “doesn’t play like a human, and it doesn’t play like a program.It plays in a third, almost alien, way . . . it’s like chess from another dimension.”34Computer scientist Jonathan Schaeffer explains the source of its superiority: “I’mabsolutely convinced it’s because it hasn’t learned from humans.”35 More funda-mentally, inventing tools that augment the process of invention itself promises toexpand not only our collective abilities, but to accelerate the rate of expansion ofthose abilities.What about businesspeople? They often find that substituting machinery forhuman labor is the low-hanging fruit of innovation. The simplest approach is toimplement plug-and-play automation: swap in a piece of machinery for each taska human is currently doing. That mindset reduces the need for more radical chang-es to business processes.36 Task-level automation reduces the need to understandsubtle interdependencies and creates easy A-B tests, by focusing on a known taskwith easily measurable performance improvement.Similarly, because labor costs are the biggest line item in almost every company’sbudget, automating jobs is a popular strategy for managers. Cutting costs–whichcan be an internally coordinated effort–is often easier than expanding markets.Moreover, many investors prefer “scalable” business models, which is often a syn-onym for a business that can grow without hiring and the complexities that entails.But here again, when businesspeople focus on automation, they often set outto achieve a task that is both less ambitious and more difficult than it need be.151 (2) Spring 2022279Erik BrynjolfssonTo understand the limits of substitution-oriented automation, consider a thoughtexperiment. Imagine that our old friend Dædalus had at his disposal an extreme-ly talented team of engineers 3,500 years ago and built human-like machines thatfully automated every work-related task that his fellow Greeks were doing.9 Herding sheep? Automated.9 Making clay pottery? Automated.9 Weaving tunics? Automated.9 Repairing horse-drawn carts? Automated.9 Incense and chanting for victims of disease? Automated.The good news is that labor productivity would soar, freeing the ancientGreeks for a life of leisure. The bad news is that their living standards and healthoutcomes would come nowhere near matching ours. After all, there is only somuch value one can get from clay pots and horse-drawn carts, even with unlimit-ed quantities and zero prices.In contrast, most of the value that our economy has created since ancient timescomes from new goods and services that not even the kings of ancient empireshad, not from cheaper versions of existing goods.37 In turn, myriad new tasks areFigure 1Opportunities for Augmenting Humans Are Far Greater thanOpportunities to Automate Existing TasksNew Tasks ThatHumans Can Do withthe Help of MachinesTasks ThatHumans Can DoHuman TasksThat MachinesCould Automate280Dædalus, the Journal of the American Academy of Arts & SciencesThe Turing Trap: The Promise & Peril of Human-Like Artificial Intelligencerequired: fully 60 percent of people are now employed in occupations that did notexist in 1940. 38 In short, automating labor ultimately unlocks less value than aug-menting it to create something new.At the same time, automating a whole job is often brutally difficult. Every jobinvolves multiple different tasks, including some that are extremely challengingto automate, even with the cleverest technologies. For example, AI may be able toread mammograms better than a human radiologist, but it is not very good at theother twenty-six tasks associated with the job, according to O-NET, such as com-forting a concerned patient or coordinating on a care plan with other doctors.39My work with Tom Mitchell and Daniel Rock on the suitability for machine learn-ing analyzed 950 distinct occupations. We found that machines could perform atleast some tasks in most occupations, but zero in which machine learning coulddo 100 percent of the tasks.40The same principle applies to the more complex production systems that in-volve multiple people working together.41 To be successful, firms typically need toadopt a new technology as part of a system of mutually reinforcing organizationalchanges. 42 Consider another thought experiment: Imagine if Jeff Bezos had “au-tomated” existing bookstores by simply replacing all the human cashiers with ro-bot cashiers. That might have cut costs a bit, but the total impact would have beenmuted. Instead, Amazon reinvented the concept of a bookstore by combining hu-mans and machines in a novel way. As a result, they offer vastly greater productselection, ratings, reviews, and advice, and enable 24/7 retail access from the com-fort of customers’ homes. The power of the technology was not in automating thework of humans in the existing retail bookstore concept but in reinventing andaugmenting how customers find, assess, purchase, and receive books and, in turn,other retail goods.Third, policy-makers have also often tilted the playing field toward automat-ing human labor rather than augmenting it. For instance, the U.S. tax code cur-rently encourages capital investment over investment in labor through effectivetax rates that are much higher on labor than on plants and equipment.43Consider a third thought experiment: Two potential ventures each use AI tocreate $1 billion of profits. If one of them achieves this by augmenting and em-ploying a thousand workers, the firm will owe corporate and payroll taxes, whilethe employees will pay income taxes, payroll taxes, and other taxes. If the secondbusiness has no employees, the government may collect the same corporate taxes,but no payroll taxes and no taxes paid by workers. As a result, the second businessmodel pays far less in total taxes.This disparity is amplified because the tax code treats labor income moreharshly than capital income. In 1986, top tax rates on capital income and laborincome were equalized in the United States, but since then, successive changeshave created a large disparity, with the 2021 top marginal federal tax rates on labor151 (2) Spring 2022281Erik Brynjolfssonincome of 37 percent, while long capital gains have a variety of favorable rules, in-cluding a lower statutory tax rate of 20 percent, the deferral of taxes until capitalgains are realized, and the “step-up basis” rule that resets capital gains to zero,wiping out the associated taxes, when assets are inherited.The first rule of tax policy is simple: you tend to get less of whatever you tax.Thus, a tax code that treats income that uses labor less favorably than income de-rived from capital will favor automation over augmentation. Treating both busi-ness models equally would lead to more balanced incentives. In fact, given thepositive externalities of more widely shared prosperity, a case could be made fortreating wage income more favorably than capital income, for instance by expand-ing the earned income tax credit.44 It is unlikely that any government official candefine in advance exactly which technologies and innovations augment humansrather than merely substitute for them; indeed, most technologies have elementsof each and the outcome depends a great deal on how they are deployed. Thus,rather than prescribe or proscribe specific technologies, a broad-based set of in-centives can gently nudge technologists and managers toward augmentation onthe margin, much as carbon taxes encourage myriad types of cleaner energy orresearch and development tax credits encourage greater investments in research.Government policy in other areas could also do more to steer the economy clearof the Turing Trap. The growing use of AI, even if only for complementing work-ers, and the further reinvention of organizations around this new general-purposetechnology imply a great need for worker training or retraining. In fact, for eachdollar spent on machine learning technology, companies may need to spend ninedollars on intangible human capital.45 However, education and training sufferfrom a serious externality issue: companies that incur the costs to train or retrainworkers may reap only a fraction of the benefits of those investments, with therest potentially going to other companies, including competitors, as these work-ers are free to bring their skills to their new employers. At the same time, work-ers are often cash- and credit-constrained, limiting their ability to invest in theirown skills development. 46 This implies that government policy should directlyprovide education and training or provide incentives for corporate training thatoffset the externalities created by labor mobility. 47In sum, the risks of the Turing Trap are increased not by just one group in oursociety, but by the misaligned incentives of technologists, businesspeople, andpolicy-makers.T he future is not preordained. We control the extent to which AI either ex-pands human opportunity through augmentation or replaces humansthrough automation. We can work on challenges that are easy for ma-chines and hard for humans, rather than hard for machines and easy for humans.The first option offers the opportunity of growing and sharing the economic pie282Dædalus, the Journal of the American Academy of Arts & SciencesThe Turing Trap: The Promise & Peril of Human-Like Artificial Intelligenceby augmenting the workforce with tools and platforms. The second option risksdividing the economic pie among an ever-smaller number of people by creatingautomation that displaces ever-more types of workers.While both approaches can and do contribute to productivity and progress,technologists, businesspeople, and policy-makers have each been putting a fingeron the scales in favor of replacement. Moreover, the tendency of a greater concen-tration of technological and economic power to beget a greater concentration ofpolitical power risks trapping a powerless majority into an unhappy equilibrium:the Turing Trap.The backlash against free trade offers a cautionary tale. Economists have longargued that free trade and globalization tend to grow the economic pie through thepower of comparative advantage and specialization. They have also acknowledgedthat market forces alone do not ensure that every person in every country willcome out ahead. So they proposed a grand bargain: maximize free trade to max-imize wealth creation and then distribute the benefits broadly to compensate anyinjured occupations, industries, and regions. It has not worked as they had hoped.As the economic winners gained power, they reneged on the second part of the bar-gain, leaving many workers worse off than before.48 The result helped fuel a popu-list backlash that led to import tariffs and other barriers to free trade. Economistswept.Some of the same dynamics are already underway with AI. More and moreAmericans, and indeed workers around the world, believe that while the technolo-gy may be creating a new billionaire class, it is not working for them. The more tech-nology is used to replace rather than augment labor, the worse the disparity may be-come, and the greater the resentments that feed destructive political instincts andactions. More fundamentally, the moral imperative of treating people as ends, andnot merely as means, calls for everyone to share in the gains of automation.The solution is not to slow down technology, but rather to eliminate or reversethe excess incentives for automation over augmentation. A good start would be toreplace the Turing Test, and the mindset it embodies, with a new set of practicalbenchmarks that steer progress toward AI-powered systems that exceed anythingthat could be done by humans alone. In concert, we must build political and eco-nomic institutions that are robust in the face of the growing power of AI. We canreverse the growing tech backlash by creating the kind of prosperous society thatinspires discovery, boosts living standards, and offers political inclusion for ev-eryone. By redirecting our efforts, we can avoid the Turing Trap and create pros-perity for the many, not just the few.151 (2) Spring 2022283Erik Brynjolfssonauthor’s noteThe core ideas in this essay were inspired by a series of conversations with JamesManyika and Andrew McAfee. I am grateful for valuable comments and sugges-tions on this work from Matt Beane, Seth Benzell, Avi Goldfarb, Katya Klinova, Ale-na Kykalova, Gary Marcus, Andrea Meyer, Dana Meyer, and numerous participantsat seminars at the Stanford Digital Economy Lab and the University of TorontoCreative Destruction Lab, but they should not be held responsible for any errors oropinions in the essay.about the authorErik Brynjolfsson is the Jerry Yang and Akiko Yamazaki Professor and SeniorFellow at the Institute for Human-Centered AI and Director of the Digital Econ-omy Lab at Stanford University. He is also the Ralph Landau Senior Fellow at theInstitute for Economic Policy Research and Professor by Courtesy at the Gradu-ate School of Business and Department of Economics at Stanford University; and aResearch Associate at the National Bureau of Economic Research. He is the authoror coauthor of seven books, including Machine, Platform, Crowd: Harnessing Our Digi-tal Future (2017), The Second Machine Age: Work, Progress, and Prosperity in a Time of Bril-liant Technologies (2014), and Race against the Machine: How the Digital Revolution Is Acceler-ating Innovation, Driving Productivity, and Irreversibly Transforming Employment and the Econ-omy (2011) with Andrew McAfee, and Wired for Innovation: How Information TechnologyIs Reshaping the Economy (2009) with Adam Saunders.endnotes1 Alan Turing, “Computing Machinery and Intelligence,” Mind 59 (236): 433–460, https://doi.org/10.1093/mind/LIX.236.433. An earlier articulation of this test comes from Des-cartes in The Discourse, in which he wrote,If there were machines which bore a resemblance to our bodies and imitated ouractions as closely as possible for all practical purposes, we should still have twovery certain means of recognizing that they were not real men. The first is thatthey could never use words, or put together signs, as we do in order to declare ourthoughts to others. . . . Secondly, even though some machines might do some thingsas well as we do them, or perhaps even better, they would inevitably fail in others,which would reveal that they are acting not from understanding.2 Carolyn Price, “Plato, Opinions and the Statues of Daedalus,” OpenLearn, updatedJune 19, 2019, https://www.open.edu/openlearn/history-the-arts/philosophy/plato-opinions-and-the-statues-daedalus; and Andrew Stewart, “The Archaic Period,” PerseusDigital Library, http://www.perseus.tufts.edu/hopper/text?doc=Perseus:text:1999.04.0008:part=2:chapter=1&highlight=daedalus.3 “The Origin of the Word ‘Robot,’” Science Friday, April 22, 2011, https://www.sciencefriday.com/segments/the-origin-of-the-word-robot/.4 Millions of people are now working alongside robots. For a recent survey on the diffusionof robots, AI, and other advanced technologies in the United States, see Nikolas Zolas,284Dædalus, the Journal of the American Academy of Arts & SciencesThe Turing Trap: The Promise & Peril of Human-Like Artificial IntelligenceZachary Kroff, Erik Brynjolfsson, et al., “Advanced Technologies Adoption and Useby U.S. Firms: Evidence from the Annual Business Survey,” NBER Working Paper No.28290 (Cambridge, Mass.: National Bureau of Economic Research, 2020).5 Apologies to Arthur C. Clarke.6 See, for example, Daniel Zhang, Saurabh Mishra, Erik Brynjolfsson, et al., “The AI Index2021 Annual Report,” arXiv (2021), esp. chap. 2, https://arxiv.org/abs/2103.06312. Inregard to image recognition, see, for instance, the success of image recognition systemsin Olga Russakovsky, Jia Deng, Hao Su, et al., “Imagenet Large Scale Visual Recogni-tion Challenge,” International Journal of Computer Vision 115 (3) (2015): 211–252. A broadarray of business application is discussed in Erik Brynjolfsson and Andrew McAfee,“The Business of Artificial Intelligence,” Harvard Business Review (2017): 3–11.7 See, for example, Hubert Dreyfus, What Computers Can’t Do (Cambridge, Mass.: MIT Press,1972); Nils J. Nilsson, “Human-Level Artificial Intelligence? Be Serious!” AI Magazine26 (4) (2005): 68; and Gary Marcus, Francesca Rossi, and Manuela Veloso, “Beyondthe Turing Test,” AI Magazine 37 (1) (2016): 3–4.8 Nilsson, “Human-Level Artificial Intelligence?” 68.9 John Searle was the first to use the terms strong AI and weak AI, writing that with weak AI,“the principal value of the computer . . . is that it gives us a very powerful tool,” whilestrong AI “really is a mind.” Ed Feigenbaum has argued that creating such intelligenceis the “manifest destiny” of computer science. John R. Searle, “Minds, Brains, and Pro-grams,” Behavioral and Brain Sciences 3 (3) (1980): 417–457.10 However, this does not necessarily mean living standards would rise without bound.In fact, if working hours fall faster than productivity rises, it is theoretically possible,though empirically unlikely, that output and consumption (other than leisure time)would fall.11 See, for example, Robert M. Solow, “A Contribution to the Theory of Economic Growth,”The Quarterly Journal of Economics 70 (1) (1956): 65–94.12 See, for example, Daron Acemoglu, “Directed Technical Change,” Review of EconomicStudies 69 (4) (2002): 781–809.13 See, for instance, Erik Brynjolfsson and Andrew McAfee, Race Against the Machine: Howthe Digital Revolution Is Accelerating Innovation, Driving Productivity, and Irreversibly TransformingEmployment and the Economy (Lexington, Mass.: Digital Frontier Press, 2011); and DaronAcemoglu and Pascual Restrepo, “The Race Between Machine and Man: Implicationsof Technology for Growth, Factor Shares, and Employment,” American Economic Review108 (6) (2018): 1488–1542.14 For instance, the real wage of a building laborer in Great Britain is estimated to havegrown from sixteen times the amount needed for subsistence in 1820 to 167 times thatlevel by the year 2000, according to Jan Luiten Van Zanden, Joerg Baten, Marco Mirad’Ercole, et al., eds., How Was Life? Global Well-Being since 1820 (Paris: OECD Publishing,2014).15 For instance, a majority of aircraft on U.S. Navy aircraft carriers are likely to be un-manned. See Oriana Pawlyk, “Future Navy Carriers Could Have More Drones ThanManned Aircraft, Admiral Says,” Military.com, March 30, 2021. Similarly, companieslike Kittyhawk have developed pilotless aircraft (“flying cars”) for civilian passengers.151 (2) Spring 2022285Erik Brynjolfsson16 Loukas Karabarbounis and Brent Neiman, “The Global Decline of the Labor Share,” TheQuarterly Journal of Economics 129 (1) (2014): 61–103; and David Autor, “Work of the Past,Work of the Future,” NBER Working Paper No. 25588 (Cambridge, Mass.: National Bu-reau of Economic Research, 2019). For a broader survey, see Morgan R. Frank, DavidAutor, James E. Bessen, et al., “Toward Understanding the Impact of Artificial Intelli-gence on Labor,” Proceedings of the National Academy of Sciences 116 (14) (2019): 6531–6539.17 Daron Acemoglu and David Autor, “Skills, Tasks and Technologies: Implications forEmployment and Earnings,” Handbook of Labor Economics 4 (2011): 1043–1171.18 Seth G. Benzell and Erik Brynjolfsson, “Digital Abundance and Scarce Architects:Implications for Wages, Interest Rates, and Growth,” NBER Working Paper No. 25585(Cambridge, Mass.: National Bureau of Economic Research, 2021).19 Prasanna Tambe, Lorin Hitt, Daniel Rock, and Erik Brynjolfsson, “Digital Capital andSuperstar Firms,” Hutchins Center Working Paper #73 (Washington, D.C.: HutchinsCenter at Brookings, 2021), https://www.brookings.edu/research/digital-capital-and-superstar-firms.20 There is some evidence that capital is already becoming an increasingly good substitutefor labor. See, for instance, the discussion in Michael Knoblach and Fabian Stöckl,“What Determines the Elasticity of Substitution between Capital and Labor? A Litera-ture Review,” Journal of Economic Surveys 34 (4) (2020): 852.21 See, for example, Tyler Cowen, Average Is Over: Powering America beyond the Age of the GreatStagnation (New York: Penguin, 2013). Or more provocatively, Yuval Noah Harari,“The Rise of the Useless Class,” Ted Talk, February 24, 2017, https://ideas.ted.com/the-rise-of-the-useless-class/.22 Anton Korinek and Joseph E. Stiglitz, “Artificial Intelligence and Its Implications for In-come Distribution and Unemployment,” in The Economics of Artificial Intelligence, ed. AjayAgrawal, Joshua Gans, and Avi Goldfarb (Chicago: University of Chicago Press, 2019),349–390.23 Erik Brynjolfsson and Andrew McAfee, “Artificial Intelligence, for Real,” Harvard BusinessReview, August 7, 2017.24 Robert D. Putnam, Our Kids: The American Dream in Crisis (New York: Simon and Schuster,2016) describes the negative effects of joblessness, while Anne Case and Angus Deaton,Deaths of Despair and the Future of Capitalism (Princeton, N.J.: Princeton University Press,2021) documents the sharp decline in life expectancy among many of the same people.25 Simon Smith Kuznets, Economic Growth and Structure: Selected Essays (New York: W. W.Norton & Co., 1965).26 Friedrich August Hayek, “The Use of Knowledge in Society,” The American Economic Review35 (4) (1945): 519–530.27 Erik Brynjolfsson, “Information Assets, Technology and Organization,” ManagementScience 40 (12) (1994): 1645–1662, https://doi.org/10.1287/mnsc.40.12.1645.28 For instance, in the year 2000, an estimated 85 billion (mostly analog) photos were tak-en, but by 2020, that had grown nearly twenty-fold to 1.4 trillion (almost all digital)photos.286Dædalus, the Journal of the American Academy of Arts & SciencesThe Turing Trap: The Promise & Peril of Human-Like Artificial Intelligence29 Andrew Ng, “What Data Scientists Should Know about Deep Learning,” speech pre-sented at Extract Data Conference, November 24, 2015, https://www.slideshare.net/ExtractConf/andrew-ng-chief-scientist-at-baidu (accessed September 9, 2021).30 Sanford J. Grossman and Oliver D. Hart, “The Costs and Benefits of Ownership: A The-ory of Vertical and Lateral Integration,” Journal of Political Economy 94 (4) (1986): 691–719; and Oliver D. Hart and John Moore, “Property Rights and the Nature of the Firm,”Journal of Political Economy 98 (6) (1990): 1119–1158.31 Erik Brynjolfsson and Andrew Ng, “Big AI Can Centralize Decisionmaking and Power.And That’s a Problem,” MILA-UNESCO Working Paper (Montreal: MILA-UNESCO,2021).32 “Simon Electronic Brain–Complete History of the Simon Computer,” History Com-puter, January 4, 2021, https://history-computer.com/simon-electronic-brain-complete-history-of-the-simon-computer/.33 Hans Moravec, Mind Children: The Future of Robot and Human Intelligence (Cambridge,Mass.: Harvard University Press, 1988).34 Will Knight, “Alpha Zero’s ‘Alien’ Chess Shows the Power, and the Peculiarity, of AI,”Technology Review, December 2017.35 Richard Waters, “Techmate: How AI Rewrote the Rules of Chess,” Financial Times, Janu-ary 12, 2018.36 Matt Beane and Erik Brynjolfsson, “Working with Robots in a Post-Pandemic World,”MIT Sloan Management Review 62 (1) (2020): 1–5.37 Timothy Bresnahan and Robert J. Gordon, “Introduction,” The Economics of New Goods(Chicago: University of Chicago Press, 1996).38 David Autor, Anna Salomons, and Bryan Seegmiller, “New Frontiers: The Origins andContent of New Work, 1940–2018,” NBER Preprint, July 26, 2021.39 David Killock, “AI Outperforms Radiologists in Mammographic Screening,” NatureReviews Clinical Oncology 17 (134) (2020), https://doi.org/10.1038/s41571-020-0329-7.40 Erik Brynjolfsson, Tom Mitchell, and Daniel Rock, “What Can Machines Learn, andWhat Does It Mean for Occupations and the Economy?” AEA Papers and Proceedings(2018): 43–47.41 Erik Brynjolfsson, Daniel Rock, and Prasanna Tambe, “How Will Machine LearningTransform the Labor Market?” Governance in an Emerging New World (619) (2019), https://www.hoover.org/research/how-will-machine-learning-transform-labor-market.42 Paul Milgrom and John Roberts, “The Economics of Modern Manufacturing: Technol-ogy, Strategy, and Organization,” American Economic Review 80 (3) (1990): 511–528.43 See Daron Acemoglu, Andrea Manera, and Pascual Restrepo, “Does the U.S. Tax CodeFavor Automation?” Brookings Papers on Economic Activity (Spring 2020); and Daron Ace-moglu, ed., Redesigning AI (Cambridge, Mass.: MIT Press, 2021).44 This reverses the classic result suggesting that taxes on capital should be lower than taxeson labor. Christophe Chamley, “Optimal Taxation of Capital Income in General Equi-librium with Infinite Lives,” Econometrica 54 (3) (1986): 607–622; and Kenneth L. Judd,“Redistributive Taxation in a Simple Perfect Foresight Model,” Journal of Public Econom-ics 28 (1) (1985): 59–83.151 (2) Spring 2022287Erik Brynjolfsson45 Tambe et al., “Digital Capital and Superstar Firms.”46 Katherine S. Newman, Chutes and Ladders: Navigating the Low-Wage Labor Market (Cam-bridge, Mass.: Harvard University Press, 2006).47 While the distinction between complements and substitutes is clear in economic theory,it can be trickier in practice. Part of the appeal of broad training and/or tax incentives,rather than specific technology mandates or prohibitions, is that they allow technol-ogies, entrepreneurs, and, ultimately, the market to reward approaches that augmentlabor rather than replace it.48 See David H. Autor, David Dorn, and Gordon H. Hanson, “The China Shock: Learningfrom Labor-Market Adjustment to Large Changes in Trade,” Annual Review of Economics8 (2016): 205–240.
    1. O human child!

      Why didn't the faeries simply say child? The specification of human implies that the child's humanity is what they were seeking. perhaps it was something they themselves did not possess.

    1. Against the medicine or any allergic molecule that hasalready been used in some way, the body has formedan antibody called "IgE" specific to thatmolecule(antigen).

      Daha önce herhangi bir şekilde kullanılan ilaç ya da alerjiye neden olan bir moleküle karşı, vücut o moleküle (antijene) özgü “IgE” adı verilen bir antikor oluşturmuştur.

    Annotators

    1. Consultad la previsión meteorológica el día anterior. Si la previsión es mala, estudiad alternativas de fechas o frente a la imposibilidad de transformar la entrevista a un formato tradicional en interior. Enviad un recordatorio a la persona participante para confirmar los detalles del encuentro y evitad ausencias, sobre todo en el caso de haberla agendado con bastante antelación. Antes de iniciar la caminata, comprobad que todos los aparatos de grabación y el móvil estén funcionando correctamente. Ropa y calzado cómodos, dado que se estará caminando durante el transcurso de la entrevista. Delimitad un perímetro claro por el que se camina, y controlar no saliros de los límites establecidos. Dentro de estos, mantened la libertad de la persona entrevistada para vagar. Estad preparados para los cambios inesperados durante el trayecto y para la posibilidad de que se incorpore alguna persona, ruidos u otras interrupciones durante la caminada. Generad una conversación de confianza fluida y natural. El movimiento puede ayudar a ello. Si usáis vídeo, hay que asegurar su buen uso. Una vez finalizada la entrevista, reiterad las gracias a la persona participante tras la entrevista, mantened los canales abiertos de comunicación y, cuando sea posible, compartid los resultados relevantes del estudio

      empezar siempre en infinitivo y usar el impersonal

    1. Asegurad una representación fiel de la comunidad, involucrando a grupos normalmente infrarrepresentados. Estableced una primera ronda para que todas las personas participantes tengan la oportunidad de aportar a la dinámica. Definid si implementaréis pautas de participación, como establecer un número máximo de iconos o elementos por persona o definir categorías mínimas requeridas. Reconoced y valorad el conocimiento y la experiencia de las comunidades, evitando la imposición de perspectivas externas o narrativas dominantes. Si surgen aportaciones contradictorias, documentad y reconoced los diferentes puntos de vista. Estas diferencias pueden explorarse con más profundidad en otra sesión o registrarse como parte del proceso de mapeo. Asignad a uno o más participantes para documentar el proceso, asegurando que se conserven todas las ideas, los debates y los resultados visuales. Proporcionad apoyo técnico si es necesario. Compartid los hallazgos con los participantes

      iniciar siempre en infinitivo: Asegurar; Establecer; etc

    1. Identificación de actores clave: reconocer a las personas y grupos con mayor influencia en el contexto analizado. Mapeo de redes y relaciones: comprender las conexiones existentes entre los actores y cómo estas pueden facilitar o dificultar la implementación de proyectos comunitarios. Detección de conflictos y alianzas: permite visualizar tensiones o posibles colaboraciones entre los diferentes actores. Diseño de estrategias de intervención: basado en el análisis del sociograma, se pueden definir acciones para fortalecer relaciones, mitigar conflictos o mejorar la cohesión social. Monitoreo de cambios en el espacio social analizado: al aplicarlo en diferentes momentos, se pueden observar dinámicas en las interacciones y evaluar la evolución de los procesos comunitarios.

      empezar siempre con infinitivo : Identificar; Mapear; detectar...etc

    1. Photovoice: los diagnósticos comunitarios sobre problemáticas urbanas permiten que los habitantes capturen imágenes que reflejan sus percepciones y experiencias del entorno estudiado, facilitando la identificación de problemáticas como la falta de infraestructura, la inseguridad o la degradación del entorno desde una perspectiva vivencial.

      borrar

    1. Recordar que no todas las personas tenemos por qué aplicar las mismas herramientas. Si se considera que estas herramientas no son las idóneas, pero tienen valor, se puede contar con otros estudiantes o profesionales que puedan ayudar en el trabajo de campo.

      borrar

    1. On 2021-12-25 08:38:40, user Eslam Maher wrote:

      The authors investigate whether Machine Learning (ML) algorithms fare better compared to traditional Cox models in big data. They selected Glioblastoma and gliosarcoma from SEER as the basis of their data set. There are two main points that are worth considering here, (1) statistical, and (2) clinical.

      (1) a- Glioblastomas are relatively rare diseases, therefore, readers need to bare in mind that the hypothesis studied here may not be relevant to their work that is usually mono-institutional or multi-institutional. Unlike the huge SEER database, we never actually have such numbers at hand to analyze in survival models.

      There is no doubt that Cox would outperform ML models in smaller samples. ML is gaining popularity in the medical community that is hugely inflated and unnecessary.

      b- Unlike ML approaches, the performance of Cox models is heavily dependent on its assumptions. This includes the proportionality of hazards between levels of a given variable, which the authors do not seem to have investigated this assumption before running the model.

      Another assumption is how the model was selected in the first place. The authors say they have run Cox univariably to decide upon the variables that would be used in the final mode. It is unclear whether a "significant" variable is considered as such at 5% alpha. Regardless of the alpha level, automated stepwise methods are notorious, this is because they are very popular among physicians and not professional statisticians and epidemiologists. Stepwise methods do not allow modelers to think about the model at hand. Plus, some causal variables may not be statistically significant, while some nuisance variables may be coincidentally significant due to high N. Automated regression using p-values is a bad idea because it also ignores multiplicity problems.

      (2) a- 22.6% of the cases included had no surgery, how then were they diagnosed as glioblastomas if no tissue samples were available? It is unclear if surgeries comprised craniotomies and biopsies or the former alone.

      b- All glioblastomas and gliosarcomas are grade IV tumors, however, for some reason, grade is a variable included in the models with levels of grade I, II, III, and IV!

      c- Reference categories in the authors' models were selected alphabetically rather than clinically. For Site, there are 14 levels using ICD-O classifications. Such classifications are not meant for clinical correlations. For example, all Lobar sites (frontal, pariental, occipital etc) are part of the Cerebrum. There are only 2 cases available for cauda equina glioblastomas, which is nonsensical to include as a separate level in the model (which puts more constraints in the model's degrees of freedom while also resulting in unstable ratios).

      d- Finally, the median survival for glioblastoma patients as noted by the authors was eight months. Looking for model accuracy at 120 months is just insane.

      This would have a been a neat paper had the authors run a proper Cox model rather than run a straw man, and designed their study with a neuro-oncologist. Even then, please note that this preprint is concerned with the performace of these models IN BIG DATA only, so do not extrapolate to the data you are routinely working with.

    1. On 2019-11-30 17:00:40, user Guyguy wrote:

      EVOLUTION OF THE EPIDEMIC IN THE PROVINCES OF NORTH KIVU AND ITURI AT NOVEMBER 27, 2019

      Thursday, November 28, 2019<br /> • Since the beginning of the epidemic, the cumulative number of cases is 3,309, of which 3,191 are confirmed and 118 are probable. In total, there were 2,201 deaths (2,083 confirmed and 118 probable) and 1077 people healed.<br /> • 443 suspected cases under investigation;<br /> • 5 new confirmed cases, including:<br /> o 4 in Ituri in Mandima;<br /> o 1 in North Kivu in Mabalako;<br /> • 2 new deaths of confirmed cases, including:<br /> o 2 new community deaths in Ituri in Mandima;<br /> o No deaths among confirmed cases in CTEs;<br /> • No cured person has emerged from CTEs;<br /> • No health worker is among the new confirmed cases. The cumulative number of confirmed / probable cases among health workers is 163 (5% of all confirmed / probable cases), including 41 deaths.

      NEWS

      Three members of the Ebola Virus Epidemic response killed during an attack in Biakato, Ituri

      • Following the attack on the sub-coordination of the Biakato response in Ituri on the night of Wednesday 27th to Thursday 28 November 2019, three members of the Ebola response teams in this sector lost their lives ;<br /> • It is a provider and a driver of the vaccination committee and another driver;<br /> • In addition to these three deaths, there are 7 wounded and 6 others with psychological disorders and extensive material damage.<br /> • A good number of these teams from Biakato were evacuated in three waves to Goma. As soon as they arrived, they were greeted by a coordination team led by Prof. Steve Ahuka, general coordinator, who also visited the wounded before going to inquire about the security conditions and accommodation of evacuees. He did not fail to comfort them.

      VACCINATION

      • The vaccination commission is in mourning. A service provider and a driver of his team were killed on the night of Wednesday 27 November 2019 following attacks at the Biakato base in Ituri;<br /> • 2nd day without vaccination activity with the 2nd J & J vaccine following the disorders initiated by young people related to the security situation in Beni;<br /> • 724 people were vaccinated, until Tuesday, November 26, 2019, with the 2nd Ad26.ZEBOV / MVA-BN-Filo vaccine (Johnson & Johnson) in the two health zones of Karisimbi in Goma;<br /> • Since the start of vaccination on August 8, 2018 with the rVSV-ZEBOV vaccine, 255,373 people have been vaccinated;<br /> • Approved October 22, 2019 by the Ethics Committee of the School of Public Health of the University of Kinshasa and October 23, 2019 by the National Ethics Committee, the second vaccine, called Ad26.ZEBOV / MVA-BN -Filo, is produced by Janssen Pharmaceuticals for Johnson & Johnson;<br /> • This new vaccine is in addition to the first, the rVSV-ZEBOV, vaccine used until then (since August 08, 2018) in this epidemic manufactured by the pharmaceutical group Merck, after approval of the Ethics Committee on May 20, 2018. has recently been pre-qualified for registration.

      MONITORING AT ENTRY POINTS

      • Sanitary control activities are disrupted in the towns of Beni and Butembo in North Kivu province following demonstrations by the population which decries killings of civilians;<br /> • Since the beginning of the epidemic, the total number of travelers checked (temperature measurement ) at the sanitary control points is 121,159,810 ;<br /> • To date, a total of 109 entry points (PoE) and sanitary control points (PoCs) have been set up in the provinces of North Kivu and Ituri to protect the country's major cities and prevent the spread of the epidemic in neighboring countries.

      As a reminder, the recommendations of the MULTISECTORAL COMMITTEE OF THE RESPONSE TO EBOLA VIRUS DISEASE are as follows:

      1. Follow basic hygiene practices, including regular hand washing with soap and water or ashes;
      2. If an acquaintance from an epidemic area comes to visit you and is ill, do not touch her and call the North Kivu Civil Protection toll-free number;
      3. If you are identified as a contact of an Ebola patient, agree to be vaccinated and followed for 21 days;
      4. If a person dies because of Ebola, follow the instructions for safe and dignified burials. It is simply a funeral method that respects funerary customs and traditions while protecting the family and community from Ebola contamination.
      5. For all health professionals, observe the hygiene measures in the health centers and declare any person with symptoms of # Ebola (fever, diarrhea, vomiting, fatigue, anorexia, bleeding).<br /> If all citizens respect these health measures recommended by the Secretariat, it is possible to quickly end this 10th epidemic.
    2. On 2019-11-19 17:15:54, user Guyguy wrote:

      EPIDEMIOLOGICAL SITUATION OF THE EVOLUTION OF THE EBOLA VIRUS DISEASE EPIDEMIC IN THE PROVINCES OF NORTH KIVU AND ITURI IN THE DEMOCRATIC REPUBLIC OF THE CONGO AT NOVEMBER 17, 2019

      Monday, November 18, 2019

      • Since the beginning of the epidemic, the cumulative number of cases is 3,296, of which 3,178 are confirmed and 118 are probable. In total, there were 2,196 deaths (2,078 confirmed and 118 probable) and 1,070 people healed.<br /> • 407 suspected cases under investigation;<br /> • 4 new confirmed cases in North Kivu, including 2 in Mabalako, 1 in Beni and 1 in Oicha;<br /> • 1 new death of confirmed cases, including:<br /> o 1 new community death in North Kivu in Oicha;<br /> o No new deaths among confirmed cases in CTEs;<br /> • No cured person has emerged from CTEs;<br /> • No health worker is among the new confirmed cases. The cumulative number of confirmed / probable cases among health workers is 163 (5% of all confirmed / probable cases), including 41 deaths;

      NEWS

      NOTHING TO REPORT

      VACCINATION

      • 147 people were vaccinated, until Saturday, November 16, 2019, with the 2nd Ad26.ZEBOV / MVA-BN-Filo vaccine (Johnson & Johnson) in the two health zones of Karisimbi in Goma;

      • Since the start of vaccination on August 8, 2018 with the rVSV-ZEBOV vaccine, 253,545 people have been vaccinated;

      • Approved October 22, 2019 by the Ethics Committee of the School of Public Health of the University of Kinshasa and October 23, 2019 by the National Ethics Committee, the second vaccine, called Ad26.ZEBOV / MVA-BN -Filo, is produced by Janssen Pharmaceuticals for Johnson & Johnson;

      • This new vaccine is in addition to the first, the rVSV-ZEBOV, vaccine used until then (since August 08, 2018) in this epidemic manufactured by the pharmaceutical group Merck, after approval of the Ethics Committee on May 20, 2018. has recently been approved.

      MONITORING AT ENTRY POINTS

      • New positive case among Mukulya Checkpoint alerts in Beni, North Kivu. It is a lifeless body of a 35-year-old man from Oicha for burial at Kabasha in Butembo;<br /> • Since the beginning of the epidemic, the total number of travelers checked (temperature rise) at the sanitary control points is 117,987,763 ;

      • To date, a total of 112 entry points (PoE) and sanitary control points (PoCs) have been set up in the provinces of North Kivu and Ituri to protect the country's major cities and prevent the spread of the epidemic in neighboring countries.

      As a reminder, the recommendations of the MULTISECTORAL COMMITTEE OF THE RESPONSE TO EBOLA VIRUS DISEASE are as follows:

      1. Follow basic hygiene practices, including regular hand washing with soap and water or ashes;
      2. If an acquaintance from an epidemic area comes to visit you and is ill, do not touch her and call the North Kivu Civil Protection toll-free number;
      3. If you are identified as a contact of an Ebola patient, agree to be vaccinated and followed for 21 days;
      4. If a person dies because of Ebola, follow the instructions for safe and dignified burials. It is simply a funeral method that respects funerary customs and traditions while protecting the family and community from Ebola contamination.
      5. For all health professionals, observe the hygiene measures in the health centers and declare any person with symptoms of Ebola (fever, diarrhea, vomiting, fatigue, anorexia, bleeding).<br /> If all citizens respect these health measures recommended by the Secretariat, it is possible to quickly end this 10th epidemic.
    3. On 2020-01-07 12:53:20, user Guyguy wrote:

      EVOLUTION OF THE EPIDEMIC IN THE PROVINCES OF NORTH KIVU AND ITURI ON 05 JANUARY 2020

      Monday, January 06, 2020

      • Since the start of the epidemic, the cumulative number of cases has been 3,390, including 3,272 confirmed and 118 probable. In total, there were 2,233 deaths (2,115 confirmed and 118 probable) and 1,114 people healed;<br /> • 373 suspected cases under investigation;<br /> • 2 new confirmed cases in Ituri in Mambasa;<br /> • No new deaths among the confirmed cases, including:<br /> o No community deaths have been recorded;<br /> o No death among the confirmed cases;<br /> • No healed person has left the CTE;<br /> • No health worker is among the new confirmed cases. The cumulative number of confirmed / probable cases among health workers is 164 (approximately 5% of all confirmed / probable cases), including 41 deaths;<br /> • Mambasa again reported a confirmed case after 66 days of silence.

      NEWS<br /> Organization of an evaluation session of awareness-raising activities in the Malepe health area in Beni<br /> • The sub-coordination of the response to the Ebola virus disease epidemic organized this Monday 06 December 2020 an evaluation session of awareness-raising activities in the Malepe health area in Beni;<br /> • According to the Coordinator of this Sub-coordination, Dr. Pierre-Céleste Adikey, this evaluation aims to intensify surveillance around visitors and raise alerts. These strategies, he said, will strengthen measures to protect the City against any possible reinfection of the City;<br /> • On this occasion, it was announced the resumption of free healthcare within the Malepe health center with the support of the NGO ALIMA which, from now on, provides drugs for the free care of the sick;<br /> • In addition, the Ebola Treatment Center (CTE) in Mangina unloaded the first eight Ebola winners in 2020 on Monday. These survivors, who were reintegrated into their respective communities, notably in Aloya / Canteen, testified to good care within this CTE.

      VACCINATION<br /> • 4,802 people were vaccinated, until January 2, 2020, with the 2nd vaccine Ad26.ZEBOV / MVA-BN-Filo (Johnson & Johnson) in the two health areas from Karisimbi to Goma;<br /> • Since the start of vaccination on August 8, 2018 with the rVSV-ZEBOV vaccine, 261,596 people have been vaccinated;<br /> • Approved on October 22, 2019 by the Ethics Committee of the School of Public Health at the University of Kinshasa and on October 23, 2019 by the National Ethics Committee, the second vaccine, called Ad26.ZEBOV / MVA-BN -Filo, is produced by Janssen Pharmaceuticals for Johnson & Johnson;<br /> • This new vaccine complements the first, rVSV-ZEBOV, a vaccine used until then (since August 08, 2018) in this epidemic manufactured by the pharmaceutical group Merck, after approval by the Ethics Committee on May 20, 2018. It was recently pre-qualified for certification.

      ENTRY POINT SURVEILLANCE<br /> • Since the start of the epidemic, the total number of travelers checked (temperature measurement ) at health checkpoints has been 135,503,900 ;<br /> • To date, a total of 109 entry points (PoE) and health control points (PoC) have been established in the provinces of North Kivu and Ituri in order to protect the country's major cities and avoid the spread of the epidemic in neighboring countries.

      As a reminder, the recommendations of the MULTISECTORAL COMMITTEE OF THE EBOLA VIRUS DISEASE RESPONSE are as follows:

      1. Respect basic hygiene measures, in particular regular hand washing with water and soap or ash;
      2. If an acquaintance from an epidemic area comes to visit you and that he is sick, do not touch him and call the toll-free number for civil protection in North Kivu;
      3. If you are identified as a contact with an Ebola patient, agree to be vaccinated and followed for 21 days;
      4. If someone dies due to Ebola, follow the guidelines for dignified and secure burials. It is simply a mode of burial that respects funeral customs and traditions while protecting the family and the community from Ebola contamination.
      5. For all health professionals, observe hygiene measures in health centers and report any sick person showing symptoms of Ebola (fever, diarrhea, vomiting, fatigue, anorexia, bleeding).<br /> If all citizens respect these health measures recommended by the Secretariat, it is possible to quickly end this 10th epidemic.
    1. On 2025-11-30 17:00:32, user Cyril Burke wrote:

      RESPONSE TO REVIEWER #2<br /> June 27, 2022<br /> Reviewer #2: Thank-you for the opportunity to review this work which highlights the importance of monitoring serum creatinine over time and how this can be a useful tool in detecting possible CKD. This is an important topic as the use of sCr on its own is certainly under-utilized and changes are often missed because they don’t fall into a predefined category.<br /> Thank you for considering our manuscript and for your detailed comments.

      MAJOR CONCERNS

      A. “Choi- rates of ESRD in Black and White Veterans” doesn’t fit with the rest of the paper including the title; the introduction and conclusion also don’t adequately address this portion of the paper. It feels disjointed from the main point of discussion which is the use of sCr in screening “pre-CKD”. This section and discussion should be removed and possibly considered for another type of publication.<br /> We have attempted to clarify this inclusion. This manuscript could be divided into three or four short papers, increasing the likelihood that any one of them would be read. However, different groups tend to read papers about screening for kidney impairment, racial disparities, cofactors in modeling physiologic parameters, or policy proposals to encourage best practices. Despite the appeal of perhaps three or four publications, we decided to tell a complete story in a single paper, but we are open to suggestions.

      Black Americans suffer three times the kidney failure of White Americans. Other minority groups also have excessive rates of kidney disease. However, analysis of Veterans Administration interventions can bring that ratio close to one, similar interventions might also reduce to parity the risk for Hispanic, Asian, Native Americans, and others. Within-individual referencing should allow better monitoring of all patients and help to reveal the circumstances and novel kidney toxins that lead to progressive kidney decline. The ability to identify a healthy elderly cohort with essentially normal kidneys would help to calibrate expectations for all. Better modeling of GFR should help everyone, too.

      Over eight decades, anthropologists have had little scholarly success in diminishing the inappropriate use of ‘race’. Keeping these parts together may be no more successful, but we feel compelled to try.

      B. Cases 1 - 3, (lines 93 – 122): where are these cases from? There is no mention of ethics to publish these patient results, which appears to be a clear ethics violation. If so, these cases should be removed and patient consent and ethical approval obtained to publish them.<br /> The authors describe the reasons for not obtaining an ethics waiver for this secondary data analysis. Despite this, the relative ease of obtaining an ethics waiver for secondary data analysis usually means that this is done regardless.<br /> We take patient privacy seriously and have completely de-identified the Case data, as required by Privacy Act regulations. We understand that no authorization or waiver was necessary. We discussed the issues with an IRB representative, reviewed the relevant regulations, and confirmed no need for formal review of a secondary analysis of already publicly available IRB-approved data or of completely de-identified clinical data collected in the course of a treating relationship.

      IRBs have a critical role to play, but many (including ours) are overworked. We understand the impulse authors feel to gain IRB approval even when the regulations clearly do not required it. As we discuss in the revision, there is a more significant matter that IRBs could help to resolve if they have the resources to do so. For all of these reasons, and even though we, too, felt the urge to obtain IRB approval, we resisted adding “just a little more” to their work.

      C. The message of the article and data representation is unclear: do the authors wish to show that sCr is superior to eGFR in this “pre-CKD” stage, should both be used together? Do the authors wish to convey that a “creatinine blind range” does not exist? Or is the aim to demonstrate that continuous variables should not be interpreted in a categorical manner?<br /> Our interest is detection and prevention of progression of early kidney injury at GFRs above 60 mL/min – a range in which eGFR is especially unreliable. We have advanced the best argument we can to detect changes in sCr while kidney injury is still limited and perhaps reversible. If experience reveals that some avoidable exposure(s) begins the decline, then clinicians might alert patients and thereby reduce kidney disease. How best to use longitudinal sCr remains to be determined from experience. However, our message is that early changes in sCr can provide early warning of a decline in glomerular filtration. We are confident that clinicians can learn to separate other factors that may alter sCr, as we do for many other tests.

      MINOR CONCERNS<br /> ABSTRACT<br /> A. Vague. Doesn’t give a clear picture of the study<br /> We have tried to clarify the title and abstract and are open to further suggestions.

      INTRODUCTION<br /> B. 51 – 57: needs to state that these stats are from e.g. the US. The authors should consider adding international statistics to complement those from the US.<br /> We have updated the statistics on death rates from kidney disease to include US and global data.

      C. 68: reference KDIGO guidelines, state year<br /> We now reference the KDIGO 2012 guidelines.

      D. 75 – 77: is this reference of the New York Times the most appropriate?<br /> We have expanded this section with peer-reviewed, scholarly references. However, we found Hodge’s summary of the issue succinct and hence potentially more persuasive for some than decades of scholarly references that have had limited or no effect in the clinic.

      E. 82: within-individual variation not changes (this is repetition of the point made in lines 425 – 427, but should match the language)<br /> We have matched the language.

      F. 82 – 84: reference? If this is a question it should be presented as such<br /> We have attempted to clarify this statement.

      G. 84: “normal GFR above 60” = guidelines (including KDIGO) do not refer to 60 as normal GFR, 60 – 89 is mildly decreased. (see line 126)<br /> We agree and have corrected the language.

      H. 93: avoid the use of emotive words such as apparently (also in line 428)<br /> We wanted to emphasize appearance without proof and have made these changes.

      I. 94: “Not meeting KDIGO guidelines”: KDIGO 2.1.3 includes a drop in category (including those with GFR >90). This would appear to include some of the cases listed. Additionally, albuminuria should have been measured for case 2 and 3.<br /> We have clarified that cases may or may not fit KDIGO categories, though that question will frequently arise in evaluating sCr changes. Where available, we have added urine protein and/or albumin results to the Cases.

      J. 97: “progressive loss of nephrons equivalent to one kidney”: this is based on a single creatinine measurement.<br /> Since the original submission, we discovered for this Case (now Patient 3) early serum creatinine results and notes indicating a six-month period off thiazide diuretic. This data clarified the baseline and showed a remarkable effect of thiazide diuretic on sCr. We have added follow-up sCr results and details of thiazide use to the ASC chart.

      K. 93 – 122: Could any of these shifts be explained by changes in creatinine methodology or standardization of assays, especially over 15 – 20 years (major differences between assays existed before standardization and arguably still exist with certain methods).<br /> It would be useful to see a comparison between serial sCr and eGFR measurements on the same figure. There appears to be significant (possibly more pronounced) changes when eGFR is used. As line 87 mentions changes in eGFR may be as useful (and in some situations more useful) than changes in sCr alone.

      It would be helpful to have a chronology from each local laboratory with the date of every change in creatinine assay or standardization. However, any single shift draws attention but does not necessarily indicate significant change in glomerular filtration. After one or several incremental increases, over at least three months, the sCr pattern may meet the reference change value (RCV) that signals significant change. In the future, from age 20 or so, a patient’s medical record should retain the full range of the longitudinal sCr for true baseline comparison.

      As noted in the revised manuscript, Rule et al showed that there is measurable nephrosclerosis even in the youngest kidney donors, suggesting that some injuries (perhaps exposure to dietary toxins) may begin in childhood and that early preventive counseling may be worthwhile. Experience will show whether this can slow progression to CKD. As we note, quoting Delanaye, sCr accounts for virtually 100% of the variability in eGFR equations based on sCr (eGFRcr), and these equations add their own uncertainties, so no, we do not believe that eGFR is more useful than sCr when GFR is above 60 mL/min and possibly much lower as well.

      We have added eGFR results to the ASC charts (in blue), though availability was somewhat limited.

      L. 127 – 142: should there be separate charts for males and females, the differences in creatinine between males and females needs to be discussed somewhere in the paper.

      We do not think there should be separate charts for men and women based on size. The role of sex in eGFR equations is mainly based on the presumption that the average woman has less muscle mass than the average man. Clinicians care for individuals, not averages, and this sweeping generalization that increases agreement of the average of a population introduces unacceptable inaccuracy to individual care. Within-individual comparison eliminates the need for assumptions on relative size or muscle mass. Major changes in an individual’s muscle mass will usually be evident to the clinician who can adjust for them.

      However, reports suggest significant influence of sex hormones on renal function, including effects of estrogen and estrogen receptors, such as reducing kidney fibrosis, increasing lupus nephritis, and increasing CKD after bilateral oophorectomy. The mechanism of these effects and how they might be incorporated into eGFR estimating equations is unclear, but the effort may benefit from a more individualized approach with focus on a measurand rather than matching population-based averages of a quantity value (calculated from measurands).

      M. Similarly, is this suitable for all ages?<br /> We think so. Another sweeping generalization based on age merely introduces another inaccuracy which complicates the task of clinicians caring for individuals. Older persons have varying health, athleticism, muscle mass, dietary preferences, etc. Rule et al reported that biopsies of about 10% of older kidney donors had no nephrosclerosis. Within-individual comparison eliminates the need for assumptions on relative muscle mass or inevitable senescent decline in nephron number. We substitute the assumption that any change in an individual’s muscle mass will be evident and can be accounted for. A seemingly ubiquitous risk factor, or factors, starts injuring kidneys at a young age, which we may yet identify.

      N. 162 – 163: rephrase<br /> Done.

      METHODS<br /> O. 185 – 193: aim belongs in the introduction, can be adjusted to complement paragraph 178 – 182.<br /> Reorganized and rewritten.

      P. 196 – 205: reference sources

      References provided.

      Q. 224 – 247: not in keeping with the rest of the article or title and conclusion

      We have revised and restructured this section.

      RESULTS<br /> R. If eGFR is treated as a continuous variable does inverted sCr still have higher accuracy?<br /> We believe so. Serum creatinine is a measurand and reflects the total sum of physiologic processes, known and unknown. In contrast, eGFR equations yield a quantity value, calculated from a measurand and dependent on the assumptions and approximations incorporated by their authors. The eGFR equations are thus necessarily less accurate than the measurands they are derived from, in this case, sCr. In a hyperbolic relationship, as the independent variable drops below one and approaches zero, the effect is to amplify the inaccuracy of the independent variable in the dependent variable. By avoiding the mathematical inverting, the data suggest that direct use of sCr is far more practical for pre-CKD.

      S. As mentioned, the section on ESRD in black and white veterans doesn’t fit in with the rest of the article.<br /> We have revised, reorganized, and rewritten. We also outlined our rationale above.

      DISCUSSION<br /> T. As mentioned, section 4.1 doesn’t fit in with the rest of the article. As the authors note the correlation between illiteracy and CKD is likely not causal.<br /> See above.

      U. 387: erroneous creatinine blind range. The data presented does not show this is erroneous there is still a relative blind range. A distinction must be made between a population level “blind range” and an individual patient’s serial results. The data and figure 4 in particular demonstrate the lack of predictive ability of sCr above 40ml/min compared to below 40ml/min at a population level. For an individual patient this “blind range” is more relative, and a change in sCr even within the normal range may be predictive. (Note: the terminology “blind range” is problematic).<br /> We agree. On reading closer, Shemesh et al call attention to “subtle changes” in serum creatinine even though they had access only to the uncompensated Jaffe assay, so their recommendation to monitor sCr is even more forceful, today, due to more accurate and standardized creatinine assays. We have attempted to clarify this in the manuscript.

      V. 399 – 400: “rose slowly at first and then more rapidly as mGFR decreased below 60” this refers to a relative blind range. Whether these slow initial changes can be distinguished from analytical and intra-individual variation is the question that needs to be answered before we can say a “blind-range” doesn’t exist for an individual patient.

      We appreciate this observation. We believe longitudinal sCr is worth adopting to gain insights into individual sCr patterns, which may reveal early changes in GFR, among other influences on sCr. This is a low-cost, potentially high-impact population health measure, and there seems little risk in trying it because many clinicians already use components of the process.

      W. 425 - 432: sCr is indeed very useful when baseline measurements are available. eGFR remains useful when baseline sCr is not available or when large intervals between measurements are found.<br /> As Delanaye et al noted, virtually 100% of the variability in longitudinal eGFR is due to sCr, so we understand that the errors in eGFR can be (and usually are) greater than but cannot be less than those in sCr.

      X. 425: low analytical variation- if enzymatic methods are used<br /> Lee et al suggest that even the compensated Jaffe method provides some accuracy and reproducibility, which may allow longitudinal tracking of sCr even where more modern assays are as yet unavailable.

      Y. 428: avoid the use of “apparently”<br /> Done.

      Z. 430: reference 56 compares sCr and sCysC with creatinine clearance NOT with mGFR, this does not prove that mGFR has greater physiologic variability. Creatinine clearance is known to be highly variable (partially due to two sources of variability in the measurements of creatinine: serum and urine).<br /> The creatinine clearance is another form of mGFR, and our understanding of it begins with the units: if the clearance or removal of creatinine were being measured, the units should be umoles/minute, but they are mL/min. “Clearance” is an old concept coined by physiologists to describe many substances, such as urea, glucose, amino acids, and other metabolites. Since creatinine is mostly not reabsorbed and is only slightly secreted in the tubules, the “creatinine clearance” became a measure of GFR. The ratio of urine Creatinine to serum Creatinine is simply a factor for how much the original glomerular filtrate then gets concentrated (typically about 100-fold) by the kidney. Since the assumption is that the timed urine was once the rate of glomerular filtrate production, the creatinine clearance is a measure of the GFR.

      Creatinine clearance has some inaccuracies based on tubular secretion, but also has some advantages: blood concentrations are essentially constant during urine collection, no need for exogenous administration, and reliable measurements in serum and urine. The methods that we often call mGFR also have problems, including unverifiable assumptions about distributions, dilutional effects, and others we cite in the text. None of these are direct measures of GFR. Due to changes in remaining nephrons, even true GFR itself is not strictly proportional to the lost number of functional nephrons, which seems the ultimate measure of CKD that Rule et al estimated from biopsy material.

      AA. The limitations of sCr for screening should also be discussed: differences in performance and acceptability between enzymatic and Jaffe methods (still widely used in certain parts of the world), the effect of standardizing creatinine assays (an important initiative but one that could also produce shifts in results around the time of standardization- see cases), low InIx means that once-off values are exceedingly difficult to interpret, is a single raised creatinine value predictive (or should there be evidence of chronicity): similarly are there effects from protein rich meals, etc (The influence of a cooked-meat meal on estimated glomerular filtration rate. Annals of Clinical Biochemistry. 2007;44(1):35-42. doi:10.1258/000456307779595995)<br /> We have added discussion of additional references on reproducibility of sCr assays and discuss dietary meat and, in Part Three, possible dietary kidney toxins.

      CONCLUSION<br /> BB. The discussion recommends using SCr above eGFR while the conclusion recommends the NKF-ASN eGFR for use in pre-CKD and ASC charts. While the use of both together in a complementary fashion is understandable- this needs to be congruent with the discussion, aims and results.<br /> We have rewritten this section. We would welcome any further recommendations.

      Cyril O. Burke III, MD, FACP

    2. On 2025-11-30 23:44:45, user Cyril Burke wrote:

      [Note: This is the second of several rounds of review of an earlier version of our combined manuscript, aiming to reduce ‘racial’ disparity in kidney disease. The comments were kindly offered by nephrologists, through a medical journal, and we remain grateful to them for the time and care they gave to improve our manuscript.

      We removed identifying features and included our responses, at the end of this comment. The changing title and line numbers refer to earlier versions.]

      August 3, 2022<br /> Dear Dr. Burke III,

      REDACTED.

      Reviewer #1: Cyril O Burke III et al submit a revised version of their intriguing , unusual paper.

      Overall, the paper remains extremely lengthy (the total , including clean and track versions and reply to reviewers is close to 200 pages !!) , whereas it contains relatively little original data.

      The authors speculate and comment a lot (and most of these speculations/comments will hardly be understandable by the expected audience, primary care physicians), and this will in addition distract the reader from the main key message (which is right in the opinion of this reviewer (see first round of review) and warrants more attention and studies.

      The race part is irrelevant for the key point (race does not change over time, and thus is not relevant when looking at longitudinal serum creatinine or eGFR) and should be deleted in the opinion of this reviewer. In this respect, I completely agree with the comment of reviewer 2 in the first round.

      I can not resist quoting here the reply of the authors to reviewer 2. “This manuscript could be divided into three or four short papers, increasing the likelihood that any one of them would be read. However, different groups tend to read papers about screening for kidney impairment, racial disparities, cofactors in modeling physiologic parameters, or policy proposals to encourage best practices. Despite the appeal of perhaps three or four publications, we decided to tell a complete story in a single paper, but we are open to suggestions.”

      My reply to their reply: nobody would read the current paper , even partially. Shorten, shorten, shorten please and focus on the key message.

      Reviewer #2: Thank-you, once again, for the opportunity to review this lengthy “thesis-style” manuscript which discusses some important often over-looked topics. The under-use of serial creatinine measurements and over-reliance on often erroneous eGFR measurements is an important point which is easily missed by healthcare workers with potentially serious consequences. Likewise, the misuse of racial constructs in medicine (and elsewhere) is an important point.

      I am satisfied with this re-submission and the changes which have been made to the original manuscript.

      Minor points:<br /> 431: “creatinine inhibits several membrane transporters”. = Cimetidine

      502: “Because mGFRs have population variation as wide as sCr, with much greater physiologic variability compared to the relatively stable sCr and serum cystatin C”<br /> As mentioned previously the cited article compares the variability of sCr and cystatin C with CrCl, I agree with the authors that CrCl is a form of mGFR, however, probably one of the poorer forms and not what a reader will think of when mGFR is mentioned. In our current age of medicine when we talk about mGFR CrCl is seldom included, studies reviewing methods of mGFR will seldom include CrCl, however CrCl may be compared to one of the mGFR methods. Likewise, if a patient is sent for a mGFR, a CrCl will not be performed. In our current age of medicine mGFR refers to methods such as the clearance of iohexol, iothalamate, Cr-EDTA, inulin, DTPA, etc; the authors themselves mention this (line 539 – 540). I fully agree with the authors that mGFR is FAR from perfect and has many inaccuracies and imprecisions (which are often overlooked)- these are well published, some of which are cited in this manuscript. If the authors wish to use the current study as a source they should state the findings in a way that cannot be misinterpreted. For example: “CrCl has much greater physiologic variability than sCr and cystatin C …” – in this case the reader can determine for themselves whether they would use CrCl as a surrogate for mGFR. Alternatively, adjust the statement and use another source which has shown the variability that exists with what we currently refer to as mGFR method.

      670 – 719: As the authors specifically discuss age it would be prudent to briefly mention the short-comings, or considerations for interpretation, of serial creatinine measurements at a very young age which generally rise until late adolescence when steady muscle mass is achieved. Also note changes in creatinine and GFR from birth till 2 – 3 years.

      783 – 784: Consider re-wording the grammar makes this sentence difficult to read

      959 – 968: Note, editing has not been accepted (tracked changes still shown)

      1116 - 1121: “Using the opioid crisis as an example…. in, for example, the opioid crisis” – same sentence

      RESPONSE TO REVIEWERS:<br /> September 17, 2022<br /> Longitudinal creatinine, not ‘race’, signals pre-chronic kidney disease and decline in glomerular filtration rate

      We again greatly appreciate the reviewers for offering detailed comments and guidance, which we have endeavored to incorporate as best we could.

      Comments to the Author<br /> Reviewer #1: Cyril O Burke III et al submit a revised version of their intriguing, unusual paper.<br /> 1. Overall, the paper remains extremely lengthy (the total, including clean and track versions and reply to reviewers is close to 200 pages !!), whereas it contains relatively little original data.<br /> The authors speculate and comment a lot (and most of these speculations/comments will hardly be understandable by the expected audience, primary care physicians), and this will in addition distract the reader from the main key message (which is right in the opinion of this reviewer (see first round of review) and warrants more attention and studies.<br /> The race part is irrelevant for the key point (race does not change over time, and thus is not relevant when looking at longitudinal serum creatinine or eGFR) and should be deleted in the opinion of this reviewer. In this respect, I completely agree with the comment of reviewer 2 in the first round.<br /> I can not resist quoting here the reply of the authors to reviewer 2.<br /> "This manuscript could be divided into three or four short papers, increasing the likelihood that any one of them would be read. However, different groups tend to read papers about screening for kidney impairment, racial disparities, cofactors in modeling physiologic parameters, or policy proposals to encourage best practices. Despite the appeal of perhaps three or four publications, we decided to tell a complete story in a single paper, but we are open to suggestions."<br /> My reply to their reply: nobody would read the current paper, even partially. Shorten, shorten, shorten please, and focus on the key message.<br /> We fundamentally agree and have worked to shorten the text; to clarify our understanding that ‘race’ may change with time, location, and self-identification; and to add a Table of Contents to make the Parts more accessible to interested readers. We comment a lot because, in highly racialized societies, like the US [1,2], it can be difficult to see beyond ‘race’ without explicit speculation about other possible explanations for difference, which we understand, may or may not pan out under investigation. One hope is that all clinicians will pursue explanations other than ‘race’, but this seems unlikely. Busy medical researchers have little time to develop expertise outside their area of interest, which may explain why ‘Commentary’ and ‘Perspective’ articles have failed to inspire an ethical ban on the misuse of ‘race’ in medical research, journals, clinics, and elsewhere [3]. We do not know whether a suite of articles can meaningfully contribute to ending misuse of ‘race’, where so many scholarly articles have failed, but after perceiving little change over four decades, trying something completely different seemed (almost) rational.

      1. Nunez-Smith M, Curry LA, Bigby J, Berg D, Krumholz HM, Bradley EH. Impact of race on the professional lives of physicians of African descent. Ann Intern Med. 2007 Jan 2;146(1):45-51. doi: 10.7326/0003-4819-146-1-200701020-00008. PMID: 17200221.

      2. Betancourt JR, Reid AE. Black physicians' experience with race: should we be surprised? Ann Intern Med. 2007 Jan 2;146(1):68-9. doi: 10.7326/0003-4819-146-1-200701020-00013. PMID: 17200226.

      3. McFarling UL. Troubling podcast puts JAMA, the ‘voice of medicine,’ under fire for its mishandling of race. Stat News. 2021 April 6 [Cited 2022 August 31]. Available from: https://www.statnews.com/2021/04/06/podcast-puts-jama-under-fire-for-mishandling-of-race/ <br /> Reviewer #2: Thank-you, once again, for the opportunity to review this lengthy “thesis-style” manuscript which discusses some important often over-looked topics. The under-use of serial creatinine measurements and over-reliance on often erroneous eGFR measurements is an important point which is easily missed by healthcare workers with potentially serious consequences. Likewise, the misuse of racial constructs in medicine (and elsewhere) is an important point.<br /> Thank you for again giving time for helpful criticism and comments on our manuscript.

      A. I am satisfied with this re-submission and the changes which have been made to the original manuscript.<br /> Minor points:<br /> B. 431: “creatinine inhibits several membrane transporters”. = Cimetidine<br /> Corrected.

      C. 502: “Because mGFRs have population variation as wide as sCr, with much greater physiologic variability compared to the relatively stable sCr and serum cystatin C”<br /> As mentioned previously the cited article compares the variability of sCr and cystatin C with CrCl, I agree with the authors that CrCl is a form of mGFR, however, probably one of the poorer forms and not what a reader will think of when mGFR is mentioned. In our current age of medicine when we talk about mGFR CrCl is seldom included, studies reviewing methods of mGFR will seldom include CrCl, however CrCl may be compared to one of the mGFR methods. Likewise, if a patient is sent for a mGFR, a CrCl will not be performed. In our current age of medicine mGFR refers to methods such as the clearance of iohexol, iothalamate, Cr-EDTA, inulin, DTPA, etc; the authors themselves mention this (line 539 – 540). I fully agree with the authors that mGFR is FAR from perfect and has many inaccuracies and imprecisions (which are often overlooked)- these are well published, some of which are cited in this manuscript. If the authors wish to use the current study as a source they should state the findings in a way that cannot be misinterpreted. For example: “CrCl has much greater physiologic variability than sCr and cystatin C …” – in this case the reader can determine for themselves whether they would use CrCl as a surrogate for mGFR. Alternatively, adjust the statement and use another source which has shown the variability that exists with what we currently refer to as mGFR method.<br /> We appreciate this comment and have both added another reference and added to the text an argument for reconsidering creatinine clearance. Many hospitals and some countries lack the resources for advanced mGFR filtration markers, which are only used for research or for screening related to kidney transplants. However, most laboratories have the tools for ‘quick-creatinine clearance’ (quick-CrCl), which may be an acceptable alternative to the classic mGFRs. If confirmed, a simple and affordable quick-CrCl might allow hospitals and laboratories worldwide an alternative measurement requiring fewer assumptions for another aspect of glomerular filtration.

      D. 670 – 719: As the authors specifically discuss age it would be prudent to briefly mention the short-comings, or considerations for interpretation, of serial creatinine measurements at a very young age which generally rise until late adolescence when steady muscle mass is achieved. Also note changes in creatinine and GFR from birth till 2 – 3 years.<br /> We have added a brief discussion of the diagnosis of CKD in infants, children, and adolescents.

      E. 783 – 784: Consider re-wording, the grammar makes this sentence difficult to read<br /> Done.

      F. 959 – 968: Note, editing has not been accepted (tracked changes still shown).<br /> Done.

      G. 1116 - 1121: “Using the opioid crisis as an example…. in, for example, the opioid crisis” – same sentence.<br /> Rewritten.

      We thank you.

    3. On 2025-12-01 00:37:35, user Cyril Burke wrote:

      [Note: This is the fourth of several rounds of review of an earlier version of our combined manuscript, aiming to reduce ‘racial’ disparity in kidney disease. The comments were kindly offered by nephrologists, through a medical journal, and we remain grateful to them for the time and care they gave to improve our manuscript.

      We removed identifying features and included our response, at the end. The changing title and line numbers refer to earlier versions.]

      January 4, 2023

      Dear Dr. Burke III,

      REDACTED.

      Editor: Unfortunately, the re-re-revised manuscript is not improved. The authors have declined to shorten the paper, despite repeated requests by both reviewers and the editor. As such, the paper is not fit for publication in its current format. This is pity as there are some valid points within the manuscript, although some others are debatable and not backed up by good scientific evidence.

      REDACTED.

      Reviewer #1: I greatly regret that the next round of revision (R3!) does not take into account the key suggestion of the previous round, to concentrate on part 1 and drastically shorten the paper

      Reviewer #2: Thank-you for the opportunity to review this manuscript.

      The manuscript raises some important points with regards to the use of serum creatinine in the diagnosis and monitoring of kidney disease, as well as important considerations about race.<br /> As the authors acknowledge the manuscript remains too lengthy for consideration as a research article. Unfortunately, the authors have declined to shorten the manuscript as recommended by the reviewers and editor.

      RESPONSE TO EDITOR AND REVIEWERS

      January 16, 2023

      Early detection of kidney injury by longitudinal creatinine to end racial disparity in chronic kidney disease: The impact of race corrections for individuals, clinical care, medical research, and social justice

      We write to appeal the rejection of our manuscript. We were grateful for constructive comments from the Academic Editor and Reviewers and incorporated almost all of their suggestions, some itemized below. We were pleased that Reviewer #2 and Reviewer #1 recommended publication in the second and third [journal] decisions, respectively. But we were surprised by this rejection.

      ‘Race’ has been central to our manuscript from the original submission because discussing ‘race’ is essential to reduce ‘racial’ disparity in kidney care. Kidney failure is three times more common in Black than White Americans. As anthropologists have known and shown for more than a century, but biologists and physicians have been slow to acknowledge, biological ‘race’ is scientifically invalid and should be irrelevant. However, in the United States, ‘race’ is uniquely defined, ubiquitously applied, and often presumed to have a biological basis in medical research. A key point in our paper, based on our clinical observations and data reanalysis, is that race corrections add further harm to medical care by obscuring the causes of disparities and delaying or derailing the search for real underlying cofactors, especially in nephrology [1,2].

      For this reason, we disagree with suggestions to slice the article into two or more separate publications (the long-known practice of “salami science” or publishing of the “smallest publishable unit”). Separating the data from the take-home message would undermine the overview we are trying to provide for [journal] readers.

      Below, we highlight some excerpts from the [journal] decisions, adding our commentary.

      1. Eneanya ND, Boulware LE, Tsai J, Bruce MA, Ford CL, Harris C, et al. Health inequities and the inappropriate use of race in nephrology. Nat Rev Nephrol. 2022 Feb;18(2):84-94. doi: 10.1038/s41581-021-00501-8. Epub 2021 Nov 8. PMID: 34750551; PMCID: PMC8574929.

      2. Norris KC, Williams SF, Rhee CM, Nicholas SB, Kovesdy CP, Kalantar-Zadeh K, et al. Hemodialysis Disparities in African Americans: The Deeply Integrated Concept of Race in the Social Fabric of Our Society. Semin Dial. 2017 May;30(3):213-223. doi: 10.1111/sdi.12589. Epub 2017 Mar 9. PMID: 28281281; PMCID: PMC5418094.

      1. (4/1/2022): Revision required

      Reviewer #1 wrote: <br /> …a somewhat unusual paper, devoted to a topic of potential major clinical relevance, and as yet understudied….

      Reviewer #2 wrote: <br /> “Choi- rates of ESRD in Black and White Veterans” doesn’t fit with the rest of the paper including the title; the introduction and conclusion also don’t adequately address this portion of the paper. It feels disjointed from the main point of discussion which is the use of sCr in screening “pre-CKD”. This section and discussion should be removed and possibly considered for another type of publication….

      We understood Reviewer #2 as indicating the reanalysis of Choi needed better integration with other Parts of the manuscript or had to be cut. This interpretation was validated by Reviewer #2’s response to our major revision (see below).

      2. (8/3/2022): Revision required

      The Academic Editor wrote:<br /> The revised manuscript only partially addresses the critiques raised by the Reviewers. ….the authors need to address all the minor points highlighted by Reviewer 2.

      Reviewer #1 wrote: <br /> …the main key message (which is right in the opinion of this reviewer (see first round of review) and warrants more attention and studies.

      Reviewer #1 wrote: <br /> The race part is irrelevant for the key point (race does not change over time, and thus is not relevant when looking at longitudinal serum creatinine or eGFR) and should be deleted in the opinion of this reviewer.

      On ‘race’, we strongly disagree. ‘Racial’ disparity will continue until we talk about ‘race’. For the major revision, we made clearer the connection between our two data reanalyses (of Shemesh et al and Choi et al). Social ‘race’ in the US differs from social ‘race’ anywhere else, yet these are rarely compared, so an international audience objecting to discussion of ‘race’ often has no idea what ‘race’ means in the US. ‘Race’ is fraught, and to advocate change requires more words than to acquiesce to current practices (i.e., banning discussion of ‘race’ favors the status quo).

      Reviewer #2 wrote: <br /> Thank-you, once again, for the opportunity to review this lengthy “thesis-style” manuscript which discusses some important often over-looked topics. The under-use of serial creatinine measurements and over-reliance on often erroneous eGFR measurements is an important point which is easily missed by healthcare workers with potentially serious consequences. Likewise, the misuse of racial constructs in medicine (and elsewhere) is an important point. I am satisfied with this re-submission and the changes which have been made to the original manuscript.

      Reviewer #2 acknowledged the changes and recommended publication.

      3. (10/10/2022): Revision required

      The Academic Editor wrote: <br /> The re-revised manuscript is further improved.... I could offer you the possibility to shorten the manuscript just focusing on what you define “Part One” plus “section A of Part Two”. You can briefly address the “race” issue in the discussion…

      The Academic Editor seems not to appreciate that ‘race’ is a central topic in our manuscript, as evidenced by our secondary data reanalysis of Choi. As we noted earlier, publishing our manuscript in two or more separated Parts would make the reader work to reassemble them. Cutting Choi and briefly addressing ‘race’ would not allow the quality of argument needed to address ‘racial’ disparity in kidney failure, and would fundamentally shift our paper to focus purely on nephrology. For the topic to be complete, our data must be assessed in terms of its meaning for ‘racial’ disparities that are currently widespread in medical practice.

      Reviewer #1 wrote: <br /> As part one is important and should trigger further studies, after reading the comments of reviewer 2 , I am ready to recommend acceptance.

      Reviewer #1 recommended the second revision for publication.

      Reviewer #2 wrote: <br /> Once again, this reviewer in no way questions the often-overlooked inaccuracies in mGFR methods. However, the authors cannot quote a well conducted review which shed light on the methodological bias and imprecision which exists between mGFR methods and claim that this methodological bias is “physiologic variability”. The authors should review: Rowe, Ceri, et al. "Biological variation of measured and estimated glomerular filtration rate in patients with chronic kidney disease." Kidney international 96.2 (2019): 429-435. Intra-individual variation (CVI) for serum creatinine ranges from around 2.8 – 8.5% while cystatin C ranges from around 3.9 – 8.6%, inter-individual variation (CVG) of serum creatinine: 7.0 – 17.4% and cystatin C: 12 – 15.1%. Biological variation (CVI and CV¬G) are not the same as analytical variation, which also exists for serum creatinine and cystatin C. The author’s statement is not backed up by scientific evidence.

      Reviewer #2 provided a key reference, leading to our addition to the next revision of an important section on “gold standards” and Bland-Altman plots.

      Reviewer #2 wrote:<br /> Instead of drastically shortening the manuscript the authors have added to the length thereof.... This reviewer has chosen not to provide further comment on the new additions to the manuscript”....

      …the main point of the article, although difficult to decipher, is highly relevant.

      We wonder if the paragraphs were somehow mixed up, because the tone of this comment is different and Reviewer #2 had recommended publication in the earlier Decision and had just recommended a key reference, above.

      4. (1/4/2023): Rejection

      The Academic Editor wrote: <br /> Unfortunately, the re-re-revised manuscript is not improved…<br /> The Academic Editor’s idea of improvement appears limited to breaking the manuscript into several parts. We had hoped that clear improvements might be persuasive, including a major section on “gold standards” (inspired by Reviewer #2’s reference), reorganization for readability, revision of the Table of Contents, and others, but as noted above, we could not accept the offer to publish a radically altered message.

      The Academic Editor wrote: <br /> …despite repeated requests by both reviewers…

      Reviewer #2 then Reviewer #1 had approved the manuscript for publication.

      The Academic Editor wrote: <br /> …there are some valid points within the manuscript, although some others are debatable and not backed up by good scientific evidence.

      We worked to not overstate our evidence. Regarding the data from over 2 million veterans of Choi et al (in Part 3) our reanalysis stated: “The sample size was very small—only 15 data points—because Choi broke (dichotomized) the continuous raw data into five data segments… therefore, the precision of this result may not hold up with replication. However…”. We also wrote addressing this concern (in Revision 2, Part 3) and updated the sentence (in Revision 3, Part 4): “…we discuss… some novel or speculative GFR cofactors…. These require further study, and some may prove insignificant.”

      Moreover, “good scientific evidence” is hard to define and extensively debated by methodologists, but the Academic Editor isn’t entirely wrong. The evidence we provided is more of a demonstration than new scientific evidence, which is both a strength and a limitation. The “gold standard scientific approach” would be to test all our claims analytically in new samples of data, which is far beyond the scope of this project, so the Academic Editor isn’t wrong about that—some claims are debatable and are not backed up by good scientific evidence. The analytic methodologies we used were far from conventional, but that was the point—to identify areas of misconception open to debate, and to shed new light on them in an innovative way. Were these not debatable points, there would be no need for an alternative approach.

      REDACTED.

      We could argue that our paper effectively employs science, but on this issue, it seems more relevant to note that ours is clearly about ways to improve the base of academic knowledge—refining scientific process through better understanding of science, so this criticism seems inconsistent with [REDACTED] and detracts from the nuance that is a strength of our manuscript.

      Nevertheless, we remain interested in incorporating feedback and ask whether the Reviewers could briefly list the points they believe are debatable and not backed up by good scientific evidence, which would allow us to address those points and either provide better evidence or state why the current evidence is weak.

      Reviewer #1 wrote: <br /> I greatly regret that the next round of revision (R3!) does not take into account the key suggestion of the previous round, to concentrate on part 1 and drastically shorten the paper.

      As we noted, the research part of the manuscript comes first, in Parts 1 to 3. Busy readers can stop before Parts 4 and 5, but we believe these data and discussions need to be kept together.

      Reviewer #2 wrote: <br /> The manuscript raises some important points with regards to the use of serum creatinine in the diagnosis and monitoring of kidney disease, as well as important considerations about race.

      As the authors acknowledge the manuscript remains too lengthy for consideration as a research article. Unfortunately, the authors have declined to shorten the manuscript as recommended by the reviewers and editor.….

      It is unclear what changed the mind of Reviewer #2, who recommended publication after the major revision and inspired the important section on “gold standards”—a clear improvement that we found satisfying.

      Reviewer #2 references our comment sent in our last Response to the Reviewers: “…our manuscript may no longer be a good fit for [the journal]”, which was our most polite way of declining the Academic Editor’s offer to publish only part of our manuscript, narrowly focused on Nephrology or Laboratory Medicine. Our goal is to keep the manuscript intact.

      In summary, the Academic Editor and Reviewers have not offered good scientific evidence for cutting a manuscript that lengthened to address their many thoughtful suggestions, nor against discussing ‘race’ as central to American ‘racial’ disparities in kidney failure. REDACTED.

      THEREFORE: For all the above reasons, we request reconsideration of the decision against publication.

      Thank you for considering this appeal.

      Sincerely,

      Cyril O. Burke III

    1. On 2021-01-27 10:19:32, user Fred wrote:

      I am not convinced of the data. Eg for Germany it is presumed that only about 1 of 10 infections is detected. The data I know from Germany say this number ist only 2-4 . So the IFR for Germany would not be O.2% but at least o.4 or even near to 1 %

    1. On 2020-03-26 02:27:01, user Cristian Orrego wrote:

      Its a small sample, right, but it doesnt seem to unvalidate the study. The only thing that i think in this case (if i read it right) that could be wrongly interpreted would be the conclusion. Because the sample of the sick people was obtained in the hospitals, so maybe the O type doesnt have less chance to get the virus, but insted it has less probabilities of develop synthoms that get people into the hospitals. So maybe the virus attack them (O type) with less severity. New studies should get infected people from random tested people among the general population to confirm if the O type gets lower rates of infection or the O type gets lower rates of worsening sympthoms once infected.

    2. On 2020-04-15 18:32:13, user Jaime Navarro wrote:

      There is a significant flaw in this paper's claim that Type A blood types are more susceptible to CoViD-19, and type O are less. In that the paper does not address the susceptibility of those with type B or AB blood. If as the paper suggests type O blood sees the virus as a type A antigen and so attacks the virus. Shouldn't the same happen in patients with Type B or AB? After all they would have antibodies to type A the same as type O people would.

    3. On 2020-03-26 07:52:06, user M.E.Valentijn wrote:

      Has anyone been able to verify their source claiming 33% prevalence of Type O in the general population? I can't find the journal that's cited for that, and a newer article says 30.2% for Han Chinese, not the nearly 34% claimed here. Though that's Han Chinese in general, not just in Wuhan. Can't find their other sources for normal blood types in the area either.

    4. On 2020-04-25 18:13:47, user Pavel Valerjevich Voronov wrote:

      What I do afraid - delays with vaccine because not taking that study in to account. Imagine, if they inject vaccine to mostly O- subjects, having promising results, move forward, then it "accidentally" won't work with others. Vaccines must be evaluated with A+ recipients at first, I suspect. Or at least blood type should be taken in consideration while results evaluation - A+ MUST be present. Even if this study is not finished - such testing approach shouldn't be harmful.

    5. On 2020-05-28 14:09:42, user steve mike wrote:

      I'd like to clarify a few major misconceptions people seem to have taken away with regards to this study.

      All of the people observed in the study were positive for Corvid-19, the disease caused by the novel corona virus, ergo, a lot of people with type O blood can and do contract Corvid-19

      The study says it got the patient test results from three hospitals, but it does not say if the patents in question were hospitalized.This is huge, because, for example, lets say all the people who are A blood type in the study had a mild case of the illness, and all the type O patients were on ventilators.In that case, yes, type O is statistically less likely to get sick from corvid-19, but more likely to get life threateningly ill.

    6. On 2020-03-19 18:32:34, user Travis Pendell wrote:

      Im far from a dr, but this doesnt mean that those with type o are less likely to get/carry it, but rather tgey are less likely to need blood tranfusions? This is based on how much blood was used? Type o just doesnt get it as bad... as often?... based on this right?

    7. On 2020-04-07 09:11:10, user Pavel Valerjevich Voronov wrote:

      Could anybody send me a link to a study that confirms widely supported claim that elderly people or ones with pre-existing health conditions more at risk? How come that it was widely accepted (is it also accepted by WHO?) without any links even to pre prints (maybe I missing this)? When in Iran 100 year old recover and those w/o pre-conditions in USA suddenly die? This study look like saying otherwise (at least it was so in v1). Please give me a link.

    8. On 2020-03-27 20:21:49, user Jessa Elizabeth wrote:

      Yes but out of all those test how many tested positive with a RH -. I ask bc my bf has it, A+, I have A- and did not get it, living in the same house. My daughter is O- and did not get it either. My dad has it, A+, and my friends husband has it A+ both infected but the wife is A- like me and didn't catch it. Just curious on if that plays a part?

    9. On 2020-03-25 15:31:18, user Sinai Immunol Review Project wrote:

      These authors compared the ABO blood group of 2,173 patients with RT-PCR-confirmed COVID-19 from hospitals in Wuhan and Shenzhen with the ABO blood group distribution in unaffected people in the same cities from previous studies (2015 and 2010 for Wuhan and Shenzhen, respectively). They found that people with blood group A are statistically over-represented in the number of those infected and who succumb to death while those with blood group O are statistically underrepresented with no influence of age or sex.

      This study compares patients with COVID-19 to the general population but relies on data published 5 and 10 years ago for the control. The mechanisms that the authors propose may underlie the differences they observed require further study.

      Risk stratification based on blood group may be beneficial for patients and also healthcare workers in infection control. Additionally, investigating the mechanism behind these findings could lead to better developing prophylactic and therapeutic targets for COVID-19.

    10. On 2020-04-03 03:05:56, user Philomena Okeke wrote:

      I like more studies and research to be done on this.If group A+ are vulnerable then they should be protected from this Coronavirus.The B and O should really help especially the 0 group. I am sure that more researchers need to provide more evidence on this critical issues. <br /> Thanks

    11. On 2020-04-13 08:45:15, user Alberto Villena wrote:

      Please, have a look to this preprint: Lianne Abrahams, 2020: Covid-19: acquired acute porphyria hypothesis. https://osf.io/4wkfy/<br /> "Macaques infected with SARS-CoV-2 also have<br /> decreased red blood cell numbers (Munster 2020) and susceptibility to<br /> SARS-CoV-2 appears to be determined by blood group; blood group A is most<br /> affected whereas blood group O seems to be protected (Yang 2020). This finding<br /> is concordant with previous studies showing that susceptibility to the 2003<br /> strain of SARS-CoV was determined by blood group (Guillon 2008)."

    12. On 2020-05-30 02:40:13, user M Del wrote:

      If you look at the data table from the study of NY Columbia university the mortality rate is higher for blood type O+ median age 54.8 was 12.4% of the infected and for blood type A+ median age 61.8 it was 12% of the infected , type O has less positive cases compared to the representation of percentage of population but mortality was a little higher even when they were younger.

    13. On 2020-04-23 15:54:21, user MacS wrote:

      Didn't notice this was discussed already so adding to the fray. It's well known and accepted Type O blood is also less susceptible to Malaria ( https://www.sciencedaily.co... "https://www.sciencedaily.com/releases/2015/03/150309124113.htm)") And for what it is worth, we know the Malaria drug has decent favorable results. I don't see the WHO drawing on this correlation in their study of COVID19 although they are or should have the goods on the blood type difference with Malaria and should be taking all of this into consideration in countries in Africa that have now acquired a larger group of Type 'O' blood (herd immunity?)

    14. On 2020-03-20 16:43:20, user Cathy Gansen wrote:

      The final conclusion doesn't seem right based on the reported stats. Or am I reading it incorrectly? Conclusion says: "CONCLUSION People with blood group A have a significantly higher risk for acquiring COVID-19 compared with non-A blood groups, whereas blood group O has a significantly lower risk for the infection compared with non-O blood groups." However, their stat summary is: "MAIN OUTCOME MEASURES Detection of ABO blood groups, infection occurrence of SARS-CoV-2, and patient death RESULTS The ABO group in 3694 normal people in Wuhan showed a distribution of 32.16%, 24.90%, 9.10% and 33.84% for A, B, AB and O, respectively, versus the distribution of 37.75%, 26.42%, 10.03% and 25.80% for A, B, AB and O, respectively, in 1775 COVID-19 patients from Wuhan Jinyintan Hospital." Stats indicate that AB has the lowest, not O. Is this a typo?

    1. On 2021-01-17 01:45:40, user Oguzhan Alagoz wrote:

      AN updated version of this paper is published by Annals of Internal Medicine:<br /> https://www.acpjournals.org...

      Full updated citation is:<br /> Alagoz, O., Sethi, A. K., Patterson, B. W., Churpek, M., & Safdar, N. Effect of Timing of and Adherence to Social Distancing Measures on COVID-19 Burden in the United States: A Simulation Modeling Approach. Annals of internal medicine, M20-4096.

    1. On 2023-05-18 18:59:30, user Dave Fuller wrote:

      Please add peer-reviewed citation as:

      Wahid KA, Lin D, Sahin O, Cislo M, Nelms BE, He R, Naser MA, Duke S, Sherer MV, Christodouleas JP, Mohamed ASR, Murphy JD, Fuller CD, Gillespie EF. Large scale crowdsourced radiotherapy segmentations across a variety of cancer anatomic sites. Sci Data. 2023 Mar 22;10(1):161. doi: 10.1038/s41597-023-02062-w. PMID: 36949088; PMCID: PMC10033824.

      Thanks!

    1. On 2024-05-01 03:00:07, user Bernadette wrote:

      Firstly my thanks to each one of you. This paper gives me hope that diagnostic and treatment guidelines for ‘TSW’ can be developed. I have a H/O of 70+ years of skin problems. Having struggled for 4 years with skin rashes which present to me, and to a Sydney based GP with an interest in TSW, as being consistent with TSW, I have experienced the frustration of presenting to dermatologists who say TSW is not an ‘accepted’ skin condition even though I have experienced and photographed my red sleeve, elephant skin on my ankles and wrists, non stop oozing on my face, neck and ears, non stop skin flaking, hair loss, heat, pain and intense itching. I have experienced the isolation and depression too often associated with this condition. Recently I have focused on managing heavy staph and fungal concentrations and have seen significant improvements. So I’m hoping this paper will act as a catalyst for a comprehensive focus on TSW so that we, those affected, can access medical expertise without running the gauntlet of being dismissed and belittled. Again. Thank you.

    1. On 2021-09-16 18:50:38, user pedro alvaro Szasz wrote:

      the results of the survey conclude about a very low efficiency of coronavac above 90 years<br /> and also a small decrease for vaxzevria<br /> death protection efficiency <br /> age Vaxzevria Coronavac<br /> 70-79 90% 77%<br /> 80-89 89% 67%

      =90 65% 33%

      these results are not consistent with real numbers<br /> a simple comparison of deaths by age and month shows that is not such decrease on efficiency:

      next table shows the figures for January 2021 (where there are no vaccine) and in May and June and July, where almost all people above 70 has complete his immunization process:

      Brazil- Covid19 deaths by month and age <br /> age absolute values % relative to january values <br /> -----------------------month----------------- -----------------month---------------------- <br /> <60 jan may jun jul jan may jun jul<br /> 70-79 8337 8168 6239 4375 100% 52.5% 74.8% 52.5%<br /> 80-89 6325 5057 5082 3378 100% 53.4% 80.3% 53.4%

      =90 2050 1576 1472 1199 100% 58.5% 71.8% 58.5%

      great majority og people above 90 years has taken coronavac in february, <br /> If efficiency against death on thiis group were just 33% (or 67% of deaths) against 67% (or 33% of deaths for youngers, these figures should apear in may, June an july with relative death index ( relative ti=o january) twice times bigger( than the young group ( 70-89)

      what we see is tha the figures are more or less the same and just a small increase on the older group(>90) that seems to be small decrease on efficiency with time (the older where vacinated before.

    1. On 2020-06-04 15:25:54, user Andy Loveman wrote:

      what other factors were considered: prevalence of O-type, A-type in the population at large; and underlying health factors compared in both groups?

    2. On 2020-06-09 20:00:05, user Anne Smith wrote:

      I'm blood group O. That should require two of the same allele. The article reports an association between ARDS and a specific SNP, but all of the discussion in the paper is about the relationship between major blood group and chance of ARDS. At 23andme, for rs657152, on a ABO gene, my genotype is A/C. My first question is how is that even possible, since if this SNP determines blood group and I'm type O I should have either two A's or two C's. Second, I and many others would really think you to present the odds of specific variants on rs657142 and ARDS! For two A's, two C's, and one of each.

    1. On 2020-09-21 08:43:03, user ?????? ??????????? wrote:

      The simplicity of the model, together with its generalization, are the<br /> advantages over complex models. Do you know that W. O. Kermack and A. G. McKendrick model can be reduced to the Verhulst equation?

    1. On 2021-05-25 06:21:14, user japhetk wrote:

      The clinical site of this trial defines case as following and positive serology alone should be counted as a case. But instead in this manuscript, positive serology is not counted as a case.

      Positive serology is greater in BCG group (7/148) compared with placebo (2/153). But in the result this is apparently not counted as a case as BCG group has only 2 cases.

      If my under standing is correct, this is not a proper research, not to mention. I would like an explanation.

      Primary Outcome Measures :<br /> Positive for the respiratory <br /> questionnaire consisted of questions concerning the appearance of <br /> symptoms possibly, probably and/or definitively related to COVID-19 on <br /> visit 3. [ Time Frame: Visit 3 (90 +/- 5 days) ]

      This is set on visit 3 (90 ± 5 days from the date of visit 1). The two <br /> groups of vaccination are compared for the primary endpoints which is <br /> composite. Patients who meet any of the following will be considered to <br /> meet the primary endpoint:

      O Positive for the respiratory questionnaire endpoint when at least one of the following <br /> combination is met either at visit 2 and/or at visit 3:

      -One situation definitively related to COVID-19<br /> -All four questions of symptoms possibly related to COVID-19<br /> -At least two questions of symptoms possibly related to COVID-19 as well as need for admission at the emergency department of any hospital and/or need for intake of <br /> antibiotics<br /> -At least four questions of symptoms probably related to COVID-19 one of which is "need foradmission at the emergency department of any hospital and/or need for <br /> intake of antibiotics"

      OPositive IgG or IgM antibodies against SARS-CoV-2

    1. On 2021-04-12 14:22:11, user Okan Bulut wrote:

      Our study has been accepted for publication in the Journal of Mixed Methods Research. Please see the full citation, including the title change for our study below:

      Poth, C., Bulut, O., Aquilina, A., & Otto, S. (In press). Using data mining for rapid complex case study descriptions: Example of public health briefings during the onset of the COVID-19 pandemic. Journal of Mixed Methods Research.

    1. On 2021-11-06 19:24:57, user Eleutherodactylus Sciagraphus wrote:

      : This preprint includes data from human subjects that are under ethical scrutiny. The<br /> majority of patients enrolled were not informed nor agreed on participating in the study. The Brazilian National Comission forResearch Ethics (CONEP) has been bypassed, documents have been tampered, and the situation is now under investigation.

      References supporting this statement (both in English and in Portuguese):<br /> https://brazilian.report/li...<br /> https://www.emergency-live....<br /> https://www.dire.it/14-10-2...<br /> https://www.matinaljornalis...<br /> https://g1.globo.com/rs/rio...

    1. On 2020-09-30 15:25:51, user Sinai Immunol Review Project wrote:

      Very interesting paper!

      Main Findings<br /> In this preprint, Zietz and Tatonetti explore the relationship between blood type and risk of SARS-CoV-2 infection, disease severity, and mortality. Using data from the electronic health records (EHR) of 1,559 patients who presented with suspected COVID-19 (with only 682 who tested SARS-CoV-2 positive) at New York Presbyterian Hospital (NYP), they analyzed four outcome pairs. Two pairs were used to test risk for infection: i) positive for infection vs negative for infection and ii) positive for infection vs general patient population. Another pair was used to test for infection severity: iii) positive patients intubated (179) vs positive patients not intubated. The last pair was used to test risk of infection-related death: iv) deceased vs surviving patients. As a measure of exposure, they used ABO blood type (A, B, AB, or O) alone or with Rh factor. In total, they generated eight contingency tables, two for each outcome pair, one with Rh and one without. Blood type was found to be significantly associated with SARS-CoV-2 infectivity after chi-squared analysis of positively vs negatively tested patients (p=0.006 for ABO system and p=0.031 for ABO+Rh system). To identify specific blood types that may predict viral test outcomes, they specifically tested each blood type against those of a different blood type for all four outcome pairs tested in the chi-squared analysis. Fisher-exact test showed that a significantly higher proportion of patients with the blood type A tested positive for the virus, and a lower proportion of patients with O and AB tested positive (p=0.009, 0.036, 0,033 respectively). When the Rh factor was included in the analysis, Rh-positive patients with the blood type A were at a 38.2% higher risk for testing positive (p=0.004), while those with the blood type O were at a 21.0% lower risk (p=0.024). Furthermore, they performed a meta-analysis by pooling data from NYP and Zhao et al’s data from China, which substantiated the findings on blood types A and O in a random-effects analysis that compared the positively infected patients with the general populations of NYP (USA), Wuhan, and Shenzhen (China) (OR=1.164, p=0.0291, for A, and OR=0.7252, p=0.0012 for O). This analysis also revealed a new increased risk of testing positive for those with blood type B (OR=1.1101, p=0.0361). Logistic regression models confirmed that although other risk factors such as diabetes, age, and obesity correlate with certain blood types, adding the blood type as a variable to the model significantly strengthens the prediction for SARS-CoV-2 positive versus negative outcome. On the other hand, blood type was not found to be a risk factor for disease severity or mortality in any of the analyses.

      Limitations<br /> The study should be considered in the context of its limitations. Firstly, blood type-disease association was significant when comparing patients who tested positively for COVID-19 to those who tested negative, but the result was not replicated when comparing positively-tested patients to the general patient population. As the authors note, only a specific population received testing for COVID-19 while the majority of the patients in the EHR system were never tested, which could explain the discrepancy. Another related limitation is that the sample meant to be representative of the general population consisted only of people in NYP’s EHR database, which may be biased toward a specific population, and it is therefore unclear if the results would replicate in another cohort. Additionally, the finding that AB blood type is associated with lower risk of infection can only be taken as preliminary; the sample size was quite small (only 4.4% of the cohort had that blood type), and the result was not replicated in the meta-analysis with the data from China. Furthermore, the analyses that included Rh factor, the sample sizes for all Rh-negative subtypes were also small, and there were no patients with AB-negative blood who tested positive for the virus. This highlights the necessity for larger cohorts from multiple sites, but the preliminary results are promising.

      Significance<br /> This preprint on NYP patients supports the previous results by Zhao et al on Chinese Wuhan and Shenzen patients that showed that individuals with the blood type A are at a greater risk of testing positive while those with type O are at a lower risk. As the authors reported, blood type distribution is different in NYP than in China, this substantiates their results and indicates it may be replicable in other geographical and ethnic populations despite blood type heterogeneity. Furthermore, they provide a more detailed picture through a meta-analysis with both NYP and China data, and include the Rh factor in the NYP analysis. Notably, they introduce new findings: a decreased risk for testing positive for those with AB blood in the NYP-only analysis, and an increased risk in those with blood type B in the pooled analysis. With the use of convalescent serum as a disease therapeutic, the knowledge that those with A-positive and B blood types may be at an increased risk of contracting COVID-19 can help ensure that sufficient amounts of plasma donors are compatible with that blood type. Finally, the study shows that blood type is not a significant predictor of disease prognosis in those infected with SARS-CoV-2, highlighting the need for other immunological and serological predictors of disease severity and mortality.

      Credit<br /> Reviewed by Miriam Saffern as part of a project by students, postdocs and faculty at the Immunology Institute of the Icahn School of Medicine, Mount Sinai.

    1. On 2025-04-29 13:39:34, user Guignabert wrote:

      Dear Dr. Sajid Shahul and colleagues, <br /> Reference 3 is incorrect and should be replaced with the following: Guignabert C, Savale L, Boucly A, Thuillet R, Tu L, Ottaviani M, Rhodes CJ, De Groote P, Prévot G, Bergot E, Bourdin A, Howard LS, Fadel E, Beurnier A, Roche A, Jevnikar M, Jaïs X, Montani D, Wilkins MR, Sitbon O, Humbert M. Serum and Pulmonary Expression Profiles of the Activin Signaling System in Pulmonary Arterial Hypertension. Circulation. 2023 Jun 13;147(24):1809-1822. doi:10.1161/CIRCULATIONAHA.122.061501. Epub 2023 Apr 25. PMID: 37096577. <br /> Thank you.

    1. On 2020-04-24 06:11:48, user JM V wrote:

      Oh, and for people who compare this to the flu, here is some lowballing of the disease:<br /> ~5 times higher expected infection fatality rate<br /> ~5 times higher expected infection rate w/o control measures<br /> Multiply those out for me please.<br /> I think that is a comparison.

    1. On 2023-12-19 12:39:03, user Christos Proukakis wrote:

      Response to: “Is Gauchian genotyping of GBA1 variants reliable?”

      Marco Toffoli1,2, Anthony HV Schapira1,2, Fritz J Sedlazeck2,3,4, Christos Proukakis1,2 *

      1. Department of Clinical and Movement Neurosciences, Queen Square Institute of Neurology, University College London, UK
      2. Aligning Science Across Parkinson’s (ASAP) Collaborative Research Network, Chevy Chase, MD 20815, USA
      3. Human Genome Sequencing Center, Baylor College of Medicine, Houston, TX, USA
      4. Department of Molecular and Human Genetics, Baylor College of Medicine, TX, USA

      * To whom correspondence should be addressed: c.proukakis@ucl.ac.uk

      We recently described two methods for GBA1 analysis, which is hampered by the adjacent highly homologous pseudogene: Gauchian, a novel algorithm for analysis of short-read WGS, and targeted long-read sequencing 1. Tayebi et al have applied the former to WGS from 95 individuals, and compared it to Sanger sequencing 2. They report concordant genotypes in 85, while 11 had discrepant calls (we note that this leads to a total of 96). In addition, they report 28 false Gauchian calls in 1000 Genomes Project (1kGP) samples. Gauchian was developed because the homology of the GBA region requires a short read variant caller that does not rely solely on read alignments, and can identify specific variants known to be pathogenic. To understand the cause of these discrepancies, we reviewed their data, and conclude that they are mis-interpreting Gauchian results in 8 of the 11 discrepant samples, and incorrectly using Gauchian to analyze low-coverage 1kGP samples.

      Among the 11 (11.5%) samples with inconsistent calls with Sanger (Table 1), four (Pat_08, Pat_26, Pat_28 and Pat_58) were not called as the variants are not on Gauchian’s target list, which includes all ClinVar variants in December 2021. These variants, and any others, can be easily added (see Supplementary Information). Three other samples (Pat_75, Pat_76 and Pat_79) had low data quality resulting in large variation in sequencing depth across the genome, as shown by the median absolute deviation (MAD) of genome coverage: 0.269, 0.128 and 0.127 (three highest values among all samples). Gauchian recommends trusting calls in samples with MAD values <0.11, and produces a warning message if this is exceeded. In all three samples, the GBA1+GBAP1 copy number was a no-call (marked as “None” in the output file), indicating that Gauchian could not determine the copy number due to high coverage variation. Variants were not called because no further analysis was done beyond copy number calling. These should not be viewed as false negatives, as the warning message and the report of no-calls should prompt the user to obtain higher quality data or consider alternative sequencing. Among the remaining 4 samples with inconsistent results: Pat_03 had a Gauchian call of heterozygosity for p.Asn409Ser, while Sanger reports this as homozygous. Review of the IGV trace (Tayebi et al. Supp Figure 1) shows that at least 10 reads (around a fifth of the total) have the reference base, and therefore it is hard to conclude this is homozygous. Review of the Sanger trace (not provided) could determine whether there is a low peak representing the reference allele. We cannot provide a conclusion, and additional analysis is recommended. Mosaicism could be a plausible explanation, and this has been reported in GBA1 3,4, albeit not at this position. Pat_47 had a false negative p.Leu483Pro call. Pat_16 was indeed wrongly genotyped as homozygous for p.Asn409Ser, related to the adjacent c.1263del+RecTL deletion. Pat_92 had all expected variants called, but the heterozygous p.Asp448His was mis-genotyped as homozygous. In summary, there is one false negative and two wrongly genotyped variants (heterozygous variants called homozygous). Gauchian’s precision is therefore 98.9% (175 out of 177 calls are correct). Its allele-level recall/sensitivity is 99.4% after excluding alleles not on Gauchian’s target list, and samples which could not be analyzed due to high coverage variation. Alternatively, it can be calculated as 97.2% if only samples with high coverage variation are excluded, 96.2% if only alleles not on the target list are excluded, and 94.1% if all these samples are considered .

      Tayebi et al. concluded that Gauchian is not able to call recombinant variants without providing orthogonal evidence. In Pat_95, Pat_71 and Pat_16, they examined alignments in IGV and reported absence of supporting reads for Gauchian calls, but all recombinant alleles called by Gauchian were consistent with Sanger. This highlights that read mapping in this region is unreliable (variant supporting reads may align to the pseudogene), making interpretation of alignments in IGV very challenging. Gauchian is designed to untangle ambiguous alignments, locally phase haplotypes and make correct calls. Particularly, in Pat_95, they claimed that Gauchian called the expected RecNciI variant but got the mechanism of the recombinant allele wrong (gene conversion vs. gene fusion). This claim appears to be based on incorrect interpretation of IGV alignments, i.e. seeing 3’ UTR mismatches associated with GBAP1 does not necessarily indicate gene fusion, as they can be misalignments, or even part of the gene conversion. The RecNciI in Pat_95 is a gene conversion, as indicated by the normal copy number between GBAP1 and GBA1. Tayebi et al. claimed that this is a gene fusion without orthogonal evidence. In addition, they claimed that Gauchian misreported copy numbers in Pat_92, Pat_42 and Pat_72, again without orthogonal evidence. We validated Gauchian copy number gains by digital PCR in four cases 1. While particular recombinants could be prone to erroneous copy number calling, we do not know what “other techniques'' identified a different copy number in Pat_92. Orthogonal validation using digital PCR would resolve this. Finally, it is true that Gauchian does not have all possible recombinants on its target list, as it is designed to focus on recombinant variants in exons 9-11, because others are rare and detectable with standard callers.

      Tayebi et al. reported 4 samples where Gauchian missed variants in GRCh38 compared to GRCh37. Among these, two (Pat_35, Pat_75) were due to incorrect alignment settings that resulted in abnormally low mapping quality throughout the region. It is likely that ALT-aware alignment was on for all samples except these two. The remaining two (Pat_16, Pat_78) reflected an area of improvement for Gauchian to better call p.Asn409Ser, which is not a GBAP1-like variant, and can thus be called well by standard callers.

      We reported Gauchian calls of 1000 Genomes Project (1kGP) samples, validating some by targeted long reads 1. Gauchian called zero samples with biallelic variant in exons 9-11. However, Tayebi et al. reported a completely different set of Gauchian calls in the same samples (in their Table 4). This was caused by incorrect use of Gauchian on old low coverage WGS (median coverage <10X, https://ftp.1000genomes.ebi... "https://ftp.1000genomes.ebi.ac.uk/vol1/ftp/phase3/data/)"), rather than 30X (https://ftp-trace.ncbi.nlm.... "https://ftp-trace.ncbi.nlm.nih.gov/1000genomes/ftp/1000G_2504_high_coverage/data/)").

      We are grateful to Tayebi et al for assessing Gauchian analysis of this very challenging gene 2, but note that most discrepancies were due to incorrect use or misinterpretation of results. “No call” samples due to inadequate data quality cannot be considered false negative, as no calls are provided, and warnings of noisy coverage are given where applicable. Samples with inadequate coverage should obviously be avoided, as Gauchian is expected to perform at coverage >30X. Gauchian does not call variants not on its target list, which can be expanded. We provide updated recall (99.4%) and precision (98.9%) values. We have not seen any evidence of the alleged inability of Gauchian to call recombinant variants, and would welcome orthogonal copy number assessment of discrepancies. We show that Gauchian can be used for GBA1 assessment when coverage and data quality are adequate. We do note a limitation in genotyping p.Asn409Ser, a non-recombinant variant that can be called by standard variant callers, which we recommend running together with Gauchian for a complete call set. Finally, in clinical cases where absolute certainty is required, Sanger sequencing could be considered, with targeted long read sequencing another option 1,5–7.

      Table 1. Details on the 11 samples where Gauchian and Sanger are inconsistent.

      Gauchian calls Sanger Assessment,Tayebi et al. Our assessmentSample Copy Number of GBA1 and GBAP1 GBAP1-like variant in exons 9-11 Other unphased variants Genotype Prediction

      Pat_08 4 None p.Asn409Ser p.Asn409Ser/p.Gln389Ter False Negative Missed variant is not on Gauchian's target list

      Pat_28 4 None p.Arg535His p.Arg535His/Cys381Tyr False Negative Missed variant is not on Gauchian's target list

      Pat_58 4 None p.Asn409Ser, p.Arg296Ter p.Asn409Ser, p.Arg296Ter, c.203delC False Negative Missed variant is not on Gauchian's target list

      Pat_26 4 None p.Asn409Ser p.Asn409Ser/p.Arg502Cys False Negative Missed variant is not on Gauchian's target list.

      Tayebi et al.’s Supplementary Figure 1 shows no variant at p.Arg502Cys (c.1504C>T), but a different variant at the neighboring position, p.Arg502His (c.1505G>A), which is not on Gauchian's target list.

      Pat_75 None (No Call) NA NA p.Arg502Cys/p.Arg159Trp Missed Copy number is a no-calldue to high variation in depth so no further variant calling was performed. Coverage MAD 0.269

      Pat_76 None (No Call) NA NA p.Asn409Ser/p.Asn409Ser Missed Copy number is a no-call due to high variation in depth so no further variant calling was performed. Coverage MAD 0.128

      Pat_79 None (No Call) NA NA p.Leu483Pro/p.Arg502Cys Missed Copy number is a no-call due to high variation in depth so no further variant calling was performed. Coverage MAD 0.127

      Pat_03 4 None p.Asn409Ser p.Asn409Ser/p.Asn409Ser False Negative Gauchian call is supported by reads, see Tayebi et al.’s Supplementary Figure 1.

      Pat_47 4 None p.Asn409Ser p.Asn409Ser/p.Leu483Pro False Negative True false negative

      Pat_16 3 c.1263del+RecTL/ p.Asn409Ser, p.Asn409Ser p.Asn409Ser, c.1263del+RecTL False Positive Heterozygous p.Asn409Ser misgenotyped as homozygous as Gauchian did not know the exact breakpoint of the c.1263del+RecTL deletion, which is very close to p.Asn409Ser.

      Pat_92 7 p.Asp448His/p.Leu483Pro,p.Asp448His p.Asp448His/ p.Leu483Pro+Rec7 False Negative There is no false negative. Rec7 is reflected in the copy number call (copy number gain). This GBAP1 duplication does not have any functional impact on GBA, so Gauchian does not report it as a GBA variant. Heterozygous p.Asp448His misgenotyped as homozygous.

      Acknowledgements

      We are grateful to Xiao Chen and Michael Eberle for helpful comments. They are former employees of Illumina and current employees of Pacific Biosciences. This research was funded in in part by Aligning Science Across Parkinson's [Grant numbers 000430 and 000420] through the Michael J. Fox Foundation for Parkinson's Research (MJFF).

      Competing interests

      FJS receives research support from PacBio and Oxford Nanopore. AHVS has received consulting fees from AvroBio, Auxilius, Coave, Destin, Enterin, Escape Bio, Genilac, and Sanofi and speaking fees from Prada Foundation.

      Supplementary Information

      Add new variants to Gauchian’s config file

      The four new variants can be added to Gauchian’s config file as follows.

      For hg38, add the following lines to gauchian/data/GBA_target_variant_38.txt

      chr1 155236304 A GBAP G c.1165C>T(p.Gln389Ter)<br /> chr1 155236327 T GBAP C c.1142G>A(p.Cys381Tyr)<br /> chr1 155239989 CGGGGGT GBAP CGGGGGGT c.203delC(p.Thr69fs)

      Add the following line to gauchian/data/GBA_target_variant_homology_region_38.txt<br /> chr1 155235195 T 155214568 C c.1505G>A(p.Arg502His)

      For GRCh37, add the following lines to gauchian/data/GBA_target_variant_37.txt<br /> 1 155206095 A GBAP G c.1165C>T(p.Gln389Ter)<br /> 1 155206118 T GBAP C c.1142G>A(p.Cys381Tyr)<br /> 1 155209780 CGGGGGT GBAP CGGGGGGT c.203delC(p.Thr69fs)

      Add the following line to gauchian/data/GBA_target_variant_homology_region_37.txt<br /> 1 155204986 T 155184359 C c.1505G>A(p.Arg502His)

      Bibliography

      1. Toffoli, M. et al. Comprehensive short and long read sequencing analysis for the Gaucher and Parkinson’s disease-associated GBA gene. Commun. Biol. 5, 670 (2022).

      2. Tayebi, N., Lichtenberg, J., Hertz, E. & Sidransky, E. Is Gauchian genotyping of GBA1 variants reliable? medRxiv (2023) doi:10.1101/2023.10.26.23297627.

      3. Filocamo, M. et al. Somatic mosaicism in a patient with Gaucher disease type 2: implication for genetic counseling and therapeutic decision-making. Blood Cells Mol. Dis. 26, 611–612 (2000).

      4. Hagege, E. et al. Type 2 Gaucher disease in an infant despite a normal maternal glucocerebrosidase gene. Am. J. Med. Genet. A 173, 3211–3215 (2017).

      5. Pachchek, S. et al. Accurate long-read sequencing identified GBA1 as major risk factor in the Luxembourgish Parkinson’s study. npj Parkinsons Disease 9, 156 (2023).

      6. Graham, O. E. E. et al. Nanopore sequencing of the glucocerebrosidase (GBA) gene in a New Zealand Parkinson’s disease cohort. Parkinsonism Relat. Disord. 70, 36–41 (2020).

      7. Leija-Salazar, M. et al. Evaluation of the detection of GBA missense mutations and other variants using the Oxford Nanopore MinION. Mol. Genet. Genomic Med. 7, e564 (2019)

    1. On 2021-12-13 19:29:22, user Surya wrote:

      Dear researchers,

      It's stated in the text that : "However, a 1-42 day risk interval was also used, since this interval is often used in vaccine safety studies of GB S and other outcome."; also the text states "Results were similar when excluding Brighton level 4 cases and when using a 42-day risk window, with incidence rates ranging from 1.1 t o 2.1."

      I'm wondering why the results of SCRI are not shown for the 42 days window at risk and mRNA vaccines.

    1. On 2021-11-07 19:23:55, user Eleutherodactylus Sciagraphus wrote:

      It is relevant to note that this preprint (along with other two from the same group) includes data from human subjects that are under ethical scrutiny. The majority of patients enrolled were not informed nor agreed on participating in the study. The Brazilian National Comission for Research Ethics (CONEP) has been bypassed and is now investigating this case.

      https://brazilian.report/li...<br /> https://www.emergency-live....<br /> https://www.dire.it/14-10-2...<br /> https://www.matinaljornalis...<br /> https://g1.globo.com/rs/rio...

    1. On 2020-03-30 21:04:58, user Sinai Immunol Review Project wrote:

      Keywords<br /> death biomarkers, cardiac damage, Troponin, Blood type, respiratory failure, hypertension

      Summary<br /> This is a retrospective study involving 101 death cases with COVID-19 in Wuhan Jinyintan Hospital. The aim was to describe clinical, epidemiological and laboratory features of fatal cases in order to identify the possible primary mortality causes related to COVID-19.

      Among 101 death cases, 56.44% were confirmed by RT-PCR and 43.6% by clinical diagnostics. Males dominated the number of deaths and the average age was 65.46 years. All patients died of respiratory failure and multiple organs failure, except one (acute coronary syndrome). The predominant comorbidities were hypertension (42.57%) and diabetes (22.77%). 25.74% of the patients presented more than two underlying diseases. 82% of patients presented myocardial enzymes abnormalities at admission and further increase in myocardial damage indicators with disease progression: patients with elevated Troponin I progressed faster to death. Alterations in coagulation were also detected. Indicators of liver and kidney damage increased 48 hours before death. The authors studied the deceased patients’ blood type and presented the following results: type A (44.44%), type B (29.29%), type AB (8.08%) and type O (18.19%), which is inconsistent with the distribution in Han population in Wuhan.

      Clinical analysis showed that the most common symptom was fever (91.9%), followed by cough and dyspnea. The medium time from onset of symptoms to acute respiratory distress syndrome (ARDS) development was 12 days. Unlike SARS, only 2 patients with COVID-19 had diarrhea. 98% presented abnormal lung imaging at admission and most had double-lung abnormalities. Related to the laboratorial findings some inflammatory indicators gradually increased during the disease progression, such as IL-6 secretion in the circulation, procalcitonin (PCT) and C-reactive protein (CRP), while platelets numbers decreased. The authors also reported an initial lymphopenia that was followed by an increase in the lymphocytes numbers. Neutrophil count increased with disease progression.

      The patients received different treatments such as antiviral drugs (60.40%), glucocorticoids, thymosin and immunoglobulins. All patients received antibiotic treatment and some received antifungal drugs. All patients received oxygen therapy (invasive or non-invasive ones).

      Limitations<br /> This study involves just fatal patients, lacking comparisons with other groups of patients e.g. patients that recovered from COVID-19. The authors didn’t discuss the different approaches used for treatments and how these may affect the several parameters measured. The possible relationship between the increase of inflammatory indicators and morbidities of COVID-19 are not discussed.

      Relevance<br /> This study has the largest cohort of fatal cases reported so far. The authors show that COVID-19 causes fatal respiratory distress syndrome and multiple organ failure. This study highlights prevalent myocardial damage and indicates that cardiac function of COVID-19 patients should be carefully monitored. The data suggest that Troponin I should be further investigated as an early indicator of patients with high risk of accelerated health deterioration. Secondary bacterial and fungal infections were frequent in critically ill patients and these need to be carefully monitored in severe COVID-19 patients. Differences in blood type distribution were observed, suggesting that type A is detrimental while type O is protective – but further studies are needed to confirm these findings and elucidate if blood type influences infection or disease severity. Several inflammatory indicators (neutrophils, PCT, CRP and IL-6, D-dimer) increased according to disease severity and should be assessed as biomarkers and to better understand the biology of progression to severe disease.<br /> Reviewed as part of a project by students, postdoctoral fellows and faculty at the Immunology Institute of the Icahn School of Medicine at Mount Sinai

    1. On 2020-04-24 01:46:41, user Mike wrote:

      Note: the original version has been previously discussed at length. medrxiv is redirecting that paper to v2 (this paper), making those comments are no longer available. This is a link to those comments: https://disqus.com/home/dis...

      Below is my original comment with updates for this version of the paper


      This was certainly an interesting paper. They’ve done a lot of work and the findings are notable. IMHO it warrants as much attention as the original pro-HCQ study via Dr. Raoult (~3/15). While it is entertaining, I will add that it is not conclusive, nor without fault. A double-blind study is still required.

      It is important to note that this is version 2 of a previously released paper and it is much the same, with no major differences in the conclusions reached compared to v1. Therefore, my previous comment still holds true. Below I’ve included them followed by a new list of observations.

      Observations/Questions (updated)

      1. "hydroxychloroquine, with or without azithromycin, was more likely to be prescribed to patients with more severe disease” (p.12)<br /> 2. “as expected, increased mortality was observed in patients treated with hydroxychloroquine, both with and without azithromycin” (p.12) — I assume it’s expected because the patients given drugs were in a more severe state (and more likely die regardless of treatment)<br /> 3. "we cannot rule out the possibility of selection bias or residual confounding” (p.13)<br /> 4. demographic: 100% male, 66% black, median age ~70 (59 youngest); (Table 2, p.17)<br /> 5. uses PSM, which despite a common practice, could be considered controversial (https://gking.harvard.edu/f... "https://gking.harvard.edu/files/gking/files/psnot.pdf)")<br /> 6. Unless I missed it, I didn't see any specifics about how the treatments were administered.<br /> - How long before death were patients treated?<br /> - What was the quantity/frequency/duration of the treatments?<br /> - Were the treatments consistent between hospitals?<br /> 7. The rate of ventilation was less in HC+AZ (half of the HC and no-HC rates). Why was that? What does that suggest?<br /> 8. Although they were statistically insignificant, what was the result of the 17 women not included in the study?<br /> 9. Why does the paper seem to address political points? It seems like the Abstract is editorialized, which I'm not used to. The result seems to address topical issues of the times, having awareness of other similar studies being conducted, rather than a standalone independent study of its own. I interpret this as potential for some analysis/deciphering bias. I don't mind in the Discussion sentence as it's normal, I'm just not as accustomed to seeing it in the Abstract.

      New List of Observations

      1. There seems to be some bias in the number of healthy people with no-HC treatment, but left in the study. Those people are going to be unlikely to die to begin with. This is not a comparison of apples to apples.??

      To clarify:<br /> ?- Dramatic difference in percentage of people people that had fever temperatures (38.1-39.0ºC / 100.58-102.2ºF); HC:11.3%, HC+AZ:11.5%, no-HC:7.6%. There’s ~4% difference between treated and untreated fever temps (more likely to die) in favor of untreated cohort. ?<br /> - Compare that with the percentage of people that had normal temperatures (35-37ºC/95-98.6ºF);HC:56.7%, HC+AZ:52.2%, no-HC:61.4%. There’s a 5-9% difference between treated and untreated normal temps (likely to not die) in favor of untreated cohort.

      ??So in this study, there was a larger proportion of people that did not have fevers, suggesting the data may be padded. In absolute numbers it's approx. a 40 person swing, which is a fairly large percentage in such a small study/survey. Similar observations are for systolic blood pressure and breaths per minute. There appears to be more healthy people? again.

      2. Creatinine is created when muscles breakdown creatine. It’s a waste product removed by the kidneys. Levels are elevated when the kidneys begin to fail. Notice, there’s a much larger presence in the HC-groups, which suggests there was a larger percentage of these patients experiencing kidney failure.?

      3. There are an awful lot of missing data in solely the no-HC group for statistically significant criteria. For instance Erythrocytes (red blood cells that transport oxygen), there 11.4% (!) missing in no-HC patients, yet that category has a P-value of 0.001 (<0.05 is statistically significant).??

      Hermatocrit is the same way (missing 11.4% for no-HC). It’s also related to red blood cells, it is the ratio of red blood cells to the blood volume. Same missing amount for Leukocytes (white blood cells) test. And also Lymphocytes —white blood cells in lymphatic system, which transports fatty acids from the digestive system and white blood cells from the lymph nodes into the bones— not only has a lot of missing data, but the disproportional low count (<800 per mm^3) may warrant further investigation.

      4. Even looking at the statistically significant Cerebrovascular disease, there are a much larger percentage of HC-only patients per its cohort.?

      5. Table 4 describes a greater percentage of people using HC+AZ being discharged (recovering) w/o ventilation; 5% more than no-HC patients. Keep in mind that 30% of the no-HC patients were given AZ.

    2. On 2020-04-28 00:30:59, user Mark Reeder wrote:

      I am advocating that the authors, in the interest of public health, fill in the blanks of the following statement:<br /> "It was found that ___ of the 7 patients reclassified from the 'No HC' to the HC group (after ventilation began) died. Likewise, ___ of the 12 patients reclassified form the 'No HC group' into the 'HC+AZ' group died."<br /> Based on a comparison of Tables 4 and 3, the first blank must be either 6 or 7 whereas the second blank must be between 7 and 12, inclusive.

      If the groups are compared based on whether they were given the drug(s) PRIOR to ventilation or prior to discharge, the HC+AZ is better by either a 20% margin over the 'No HC' group or by a FACTOR of 6. <br /> To wit, let's assume that all 12 of reclassified as HC+AZ died. That would mean that only 2 in the original HC+AZ group died. Since we have no idea when the HC+AZ drug was administered to those who died without ventilation, a fair comparison would show that HC+AZ, one might justifiably count only the 2/90 (2.2%) in that group (excluding deaths w/o vent.) as having had HC+AZ early enough in treatment. It would also mean that 3+(6 or 7) + 12 out of 162 (13.6%, also excluding deaths prior to ventilation) eventually died. <br /> This would be a huge difference with HC+AZ coming out as a terrific alternative (factor of 6 better) if given early enough. By the same logic (pre-vent treatment only, excluding non-vent deaths), the worst case for HC+AZ would still mean a 20% IMPROVEMENT over the control group! <br /> But we cannot know unless the authors (or others) are ethical and transparent enough complete the sentence above. Even if they disagree with the foregoing analysis, what is the downside in providing those numbers?<br /> I understand the difficulty of dealing with imperfect data. But for that very reason, good science demands that all information be placed on the table.

    1. On 2021-03-22 17:45:56, user Steen Hvass Ingwersen wrote:

      This is an interesting study addressing the relationship btw Ct-values for positive covid-19 tests for an individual and the risk of transmission to other individuals at the point of testing.<br /> However, a number of assumptions behind the study are not fulfilled and so, in my opinion the conclusions need major revision.<br /> The reliability of every model is dependent on the assumptions behind the model. Some of these are:<br /> • It is assumed, that the person with the “primary test” has infected the secondarily infected individuals. This is not necessarily the case based on the way data has been compiled. Only the sequence of testing has been taken into account. Other possibilities than the assumed would have been possible:<br /> o The primarily and secondarily infected individuals were infected by the same third individual outside their household.<br /> o The primary case was infected by the secondary case but was classified as primary because this individual was the first to be tested within the household<br /> o The secondary case was infected by the primary case but this happened at an earlier point than the time of testing. Thus would likely have been associated with a lower Ct-value (and thus a higher viral load) than the one obtained in the test.<br /> • It is furthermore assumed that all individuals within a household went in strict quarantaine immediately after the primary positive test result. This was not necessarily the case. <br /> All the above-mentioned sources of misclassification move the relationship between the Ct-value and the risk of transmisssion in the same direction: towards higher Ct-values being associated with transmission risk. <br /> The estimate in the study was that a Ct-value of 38 was associated with 8% probability of transfection. As shown above, this value was overestimated, and there was no attempt to evaluate the degree of bias for the estimate in the study. For this reason, this estimate should be removed from the paper.

    1. On 2020-05-15 08:15:51, user Ron Sills wrote:

      Maybe they should look into the anti-h factor in the blood type or bombay and para-bombay influence on the infection rate and mortality rate. That might better explain the minor differences in percentage rates for the O blood group.

    1. On 2020-08-20 18:06:49, user PB wrote:

      For campus opening in the US at present, the analysis in this manuscript is irrelevant. This analysis assumes a single starting infection in a completely susceptible (i.e. uninfected) population. A rough but reasonable order-of-magnitude estimate (but see https://mggg.github.io/esti... ) suggests that in a population of 10K student-age people in California, we would expect O(100) students who would test positive on day 1 if tests were available. That is, the outbreak is already there! It arrives with the students. The idea that it can be controlled with a single round of entrance testing is also wrong. Assuming 85% sensitivity (the value used by these authors, which is very optimistic but not crazy high), the test would catch 85 of those 100 positives, but miss 15. Again, the outbreak is already there. The analysis in this manuscript may be reasonable, but for managing campus infection in the US at the moment, it simply addresses the wrong question.

    1. On 2021-08-26 05:56:47, user William Brooks wrote:

      This is an interesting paper that fails to find an effect of early bar/restaurant closures during Japan's second state of emergency (SoE). However, I think it has several limitations.

      1) Were early closures actually justified?

      The authors fail to point out that the SoE started one week after the effective reproduction number (Rt) had peaked and 2/3 days after it had gone under 1 throughout Japan [1, slides 17-18], so the SOE was unnecessary for preventing the "collapse of the medical system", which was the government's justification. Also, the early closure of bars/restaurants in Tokyo/Osaka prior to the SoE didn't stop Rt increasing during the second half of December exactly the same as in the rest of Japan without early closures [1, slides 19-20]. This isn't surprising since even the extreme lockdowns in Peru and Argentina couldn't counteract seasonal rises in Covid infections [2].

      Furthermore, even if there were statistically significant reductions in self-reported coughs and sore throats, do the authors think these could justify the negative effects on employment, firm exit, and mental health mentioned in Introduction?

      2) Why suggest capacity limits but not ventilation improvements?

      In addition to early closures, the Japanese government also recommends mask-wearing while dining out (which is unlikely to be effective [3] [4]) and the use of plastic partitioning in restaurants/bars (which may actually increase infection risk [5]). The authors suggest capacity limits, but this doesn't solve the socioeconomic impacts mentioned in Introduction. Fortunately, even modest improvements in ventilation may be as effective as high-quality R95 masks [4], so investments in improved ventilation/air-purification could be a better solution.

      [1] https://www.mhlw.go.jp/cont...<br /> [2] https://www.scirp.org/pdf/o...<br /> [3] https://doi.org/10.7326/M20...<br /> [4]https://aip.scitation.org/d...<br /> [5] https://doi.org/10.1101/202...

    1. On 2020-12-11 00:19:16, user lbaustin wrote:

      Please provide a better reference for Otros, T. O. et al. (2020) ‘Nutrición Hospitalaria’, pp. 0–3 I was unable to find this article. Which volume and issue number? Could you be referring to <br /> Macaya F, Espejo Paeres C, Valls A, Fernández-Ortiz A, González del Castillo J, Martín-Sánchez J, et al. Interaction between age and vitamin D deficiency in severe COVID-19 infection. Nutr Hosp [Internet]. 2020 [cited 2020 Oct 25]; Available from: https://www.nutricionhospit...

    1. On 2023-12-26 14:48:44, user Donald R. Forsdyke wrote:

      LATE ONSET POST-VACCINATION MYOCARDITIS

      The acceleration of SARS-CoV-2 vaccine research post-2020 was so rapid that preprint postings became the norm for many of us working in the field. This preprint of Watson et al. (1) describing 3 case histories is in line with previous preprints describing single case histories (2, 3). It now appears that late-onset post-vaccination myocarditis in elderly subjects can be either overt (symptomatic; 1, 2) or cryptic (not symptomatic; 3).

      The cases described here (1) developed symptoms of myocarditis several weeks after vaccination and a few weeks after initiating anti-PD-1 treatment (Immune checkpoint blockade; ICB). The latter would have decreased constraints on autoimmune phenomena. The reported period following vaccination prior to symptom onset, coincides with that reported early in the pandemic by Guatam et al. (2) for a subject with a previous cardiac condition (prior morbidity). It also concides with the post-vaccination periods that preceded protracted, yet asymptomatic, transient dips in blood pressure (BP) in a normal subject, which has been attributed to myocarditis (3).

      In the latter case, an episode of cardiac fibrillation during a run, prompted a retrospective analysis of blood pressure (BP) readings for the period when five sequential anti-SARS-CoV-3 vaccinations has been given (3). This resulted in the unexpected discovery of the extreme BP dips that progressively increased in extent with successive vaccinations. A cause-and-effect relationship was evident. The myocarditis was cryptic and was deemed likely to remain so, unless the subject had made excessive demands on cardiac function (e.g., vigorous exercise). Alternatively, the delicate balance between normal immunity and autoimmunity might have been shifted as in (1), or a comorbidity might have emerged as in (2).

      The present preprint begins by stating that association between vaccination and myocarditis is rare and affects younger subjects (1). The other preprints suggest the existence of a vulnerable population-subset that may include many elderly subjects and may be less rare than is generally understood. A “crowd sourcing” follow up has been suggested (3,4).

      1.Watson RA, Ye W, Taylor CA, Jungkurth E, Cooper R, Tong O, et al. Severe acute myositis and myocarditis upon initiation of six-weekly Pembrolizumab post-COVID-19 mRNA vaccination. medRxiv 2023; doi.org/10.1101/2023.11.24....<br /> 2.Gautam N, Saluja P, Fudim M, Jambhekar K, Pandey T, Al'Aref S. A late presentation of COVID-19 vaccine-induced myocarditis. Cureus 2021; 13: e17890.<br /> 3.Forsdyke DR. Cryptic evidence on underreporting of mRNA vaccine-induced cardiomyositis in the elderly: a need to modify antihypertensive therapy. Qeios Here<br /> 4.Forsdyke DR. Physician-scientist-patients who barketh not. The quantified self movement and crowd-sourcing research. J Eval Clin Pract 2015; 21: 1024–1027.

    1. On 2024-04-25 03:20:17, user Lena Palaniyappan wrote:

      Very interesting work. We observed a similar 'amelioration' effect using a cross-sectional design a few years ago (Guo et al., 2016). Since then we made several cross-sectional and a few longitudinal observations supporting the possibility of compensation and reorganisation after first episode psychosis (Palaniyappan et al., 2019a; 2019b), including one with the largest untreated sample we could access at that time (Li et al., 2022). These observations compel us to spare more efforts to understand the compensatory processes in psychosis (Palaniyappan et al, 2017, Palaniyappan & Sukumar 2020, Palaniyappan, 2021; 2023).

      Guo S, Palaniyappan L, Liddle PF, Feng J. Dynamic cerebral reorganization in the pathophysiology of schizophrenia: a MRI-derived cortical thickness study. Psychological medicine. 2016 Jul;46(10):2201-14.

      Li M, Deng W, Li Y, Zhao L, Ma X, Yu H, Li X, Meng Y, Wang Q, Du X, Sham PC. Ameliorative patterns of grey matter in patients with first-episode and treatment-naïve schizophrenia. Psychological Medicine. 2023 Jun;53(8):3500-10.

      Palaniyappan L. Progressive cortical reorganisation: a framework for investigating structural changes in schizophrenia. Neuroscience & Biobehavioral Reviews. 2017 Aug 1;79:1-3.

      Palaniyappan L, Das TK, Winmill L, Hough M, James A, Palaniyappan L. Progressive post-onset reorganisation of MRI-derived cortical thickness in adolescents with schizophrenia. Schizophr Res. 2019a Jun 1;208:477-8.

      Palaniyappan L, Hodgson O, Balain V, Iwabuchi S, Gowland P, Liddle P. Structural covariance and cortical reorganisation in schizophrenia: a MRI-based morphometric study. Psychological Medicine. 2019b Feb;49(3):412-20.

      Palaniyappan L, Sukumar N. Reconsidering brain tissue changes as a mechanistic focus for early intervention in psychiatry. Journal of psychiatry & neuroscience: JPN. 2020 Nov;45(6):373.

      Palaniyappan L. The neuroscience of early intervention: Moving beyond our appeals to fear. Australian & New Zealand Journal of Psychiatry. 2021;55(10):942-943.

    1. On 2020-06-23 16:30:13, user Sinai Immunol Review Project wrote:

      Systems-level immunomonitoring from acute to recovery phase of severe COVID-19<br /> Rodriguez et al. medRxiv [@doi:10.1101/2020.06.03.20121582]

      Keywords<br /> • COVID-19<br /> • cytokines<br /> • immunomonitoring

      Main Findings<br /> In this preprint, Rodriguez et al. performed longitudinal, systems-level immunomonitoring on blood from 39 COVID-19 patients using mass cytometry (CyTOF) and Olink to better understand the mechanisms behind hyperinflammation in severe COVID-19. 17 subjects were inpatient; 22 were recovered patients. CyTOF was used to track immune cell populations over time while Olink was used to measure 180 plasma biomarkers from the acute disease phase and recovery. Importantly, none of the 39 patients in this study received any immunomodulatory therapies and therefore the data reflect the natural course of COVID-19 disease.

      Several immune cell populations changed with COVID-19 disease progression. Neutrophils rose during the acute phase and decreased with recovery; in contrast, eosinophils, basophils, and all dendritic cell subsets all increased with recovery. Total CD4 and CD8 T-cells peaked at about 2 weeks into disease progression, with the largest increases seen in proportion of CD127+ CD4+ memory T-cells and CD57+ CD8+ memory T-cells. <br /> To further study the phenotype of the increased eosinophils seen with disease recovery, the authors used Partition-based graph abstraction to analyze changes in eosinophils on a single cell level. The authors report a transient expansion of CD62L+ eosinophils coinciding with IFN levels on days 2-6.

      To determine the immunological correlates with IgG response, the authors used a mixed effect model using immune cell proportions and levels of plasma protein biomarkers. IFNg, IL-6, CXCL10, CSF-1 and MCP-2 negatively correlated with IgG response while CXCL6, CD6, SPRY2, CD16- basophils and CD16+ basophils positively correlated with IgG response. <br /> Next, the authors built a multiomic trajectory of recovery using multiomics factor analysis. This analysis identified decreasing levels of IL-6, MCP-3, KRT19, CXCL10, AREG, and IFNg with recovery while classical monocytes, non-classical monocytes, CD56dim NK cells, eosinophils, and gD T-cells increased with recovery.

      Limitations<br /> Though the authors do a good job of balancing the sex ratio in their patient population, age ranges between symptomatic patients (40-77 yo) vs recovered patients (28-68 yo) may be contributing to immune phenotype. Median age of each group should be provided. While the authors state that the study captures longitudinal immune monitoring from acute to recovery phase, it is unclear which of the symptomatic patients, if any, were monitored through actual recovery. The authors’ claims would be better supported with paired analysis of symptomatic patients during their hospital course with the same patients after recovery, rather than a separate cohort of recovered patients.

      The changes in immune cell populations over time reported in Fig. 3 would benefit from statistical analysis to denote which changes are statistically significant. Indeed, several of the trends reported, such as total CD4+ T-cells, CD127+ memory CD4+ T-cells and CD57+ CD8+ T-cells seem to be driven only by a few patients.

      Previous work by Mesnil et al. 2016, as cited by the authors, report that CD62L+ lung resident eosinophils suppress excess Th2 inflammation after house dust mite (HDM) challenge in mice and have a more regulatory phenotype than CD62L- inflammatory eosinophils [1]. Here, Rodriguez et al. suggest that this increase in CD62L+ eosinophils may contribute to lung hyperinflammation in acute respiratory distress syndrome (ARDS) in COVID-19. While more studies are needed to address this potential contribution, one suggestion would be to see if there are differences in the number and phenotype of CD62L+ eosinophils between the ICU and non-ICU patients in Rodriguez et al.’s cohort. While it is possible the increased number of CD62L+ eosinophils may contribute to hyperinflammation, the more regulatory phenotype of CD62L+ eosinophils as reported by Mesnil et al. may instead point to a role for suppression rather than contribution to lung hyperinflammation.

      In all analyses conducted, further stratification by ICU vs non-ICU patients may also be informative.

      Significance<br /> This preprint provides system-wide longitudinal analysis of plasma biomarkers and immune cell populations from a cohort of inpatients with severe COVID-19. Because the patients were untreated with any immunomodulatory drugs, the authors are able to describe trends through the natural progression of COVID-19 in patients who ultimately recover.

      Specifically, CD62L+ eosinophils are found to be expanded in the blood corresponding to a period of lung hyperinflammation in severe disease. Additionally, a higher abundance of circulating basophils is correlated to increased anti-SARS-COV-2 IgG response. Both findings warrant further investigation into the previously undescribed role of both eosinophils and basophils in COVID-19.

      Furthermore, the authors show that biomarkers such as IFNg, CXCL10, and IL-6 negatively correlate with both humoral response and recovery. The negative correlation with IL-6 and IgG response is particularly surprising, given that IL-6 has been shown to promote antibody production in B-cells [2]. Moreover the authors cite Denzel et al. 2008, which shows that basophils with antigen bound to their surface enhance antibody production through IL-6, yet in this study basophils and IL-6 negatively correlate at recovery [3]. These findings further highlight the importance of studying the role of inflammatory cytokines in both the development of severe disease and recovery.

      References

      1. Mesnil C, Raulier S, Paulissen G, et al. Lung-resident eosinophils represent a distinct regulatory eosinophil subset. J Clin Invest. 2016;126(9):3279-3295.

      2. Dienz O, Eaton SM, Bond JP, et al. The induction of antibody production by IL-6 is indirectly mediated by IL-21 produced by CD4+ T cells. J Exp Med. 2009;206(1):69-78.

      3. Denzel A, Maus UA, Rodriguez Gomez M, et al. Basophils enhance immunological memory responses. Nat Immunol. 2008;9(7):733-742.

      Credit<br /> Reviewed by Steven T. Chen and Alexandra Tabachnikova as part of a project by students, postdocs and faculty at the Immunology Institute of the Icahn School of Medicine, Mount Sinai.

    1. On 2020-04-12 13:04:20, user japhetk wrote:

      I think BCG studies' conclusions came from spurious correlations regardless of BCG has an effect or not.<br /> Anyway, now data from South America and Africa keeps coming and although, it may depend on the methods of analyses, my analyses show already the number death 13 days after the 100th case, and whether BCG is currently done is no longer significantly associated without correcting anything (p = 0.291, ANOVA).And after the number of tourists, population,total GDP, temperature of March, ratio of 65 years or older are corrected the associations show get even weaker (P = 0.621, ANCOVA).Among these covariates, the number of tourists has a robust significant effect on the number of deaths 13 days after the 100th case (0.00016), and the ratio of 65 years or older and population have significant effects, too (P= 0.024, 0.05, respectively). Total GDP (not GDP per capita) and the number of tourists have a close relationship (r = 0.82). <br /> The date when the 100th case was detected show more robust relationship with the BCG policy (currently performed or not), but after the correction of abovementioned covariates, this association also became insignificant )(p= 0.167). But this kind of relationship with the date of 100th case is seen in the case of variables that are specifically associated with Western countries, such as the consumption of wine)(the consumption of wine per capita shows robust association with the date of the 100th case after correction of population (p = 0.0002, more wine, the faster the detection of 100th case). <br /> So, my guess is that this spurious correlation mainly came from the fact the countries which abandaned BCG policies are more developed and more popular from tourists (which increased the faster and more and multiple spread of the virus) and also show greater aging (which increased the risk) and also they locate in western countries which were confident of their medical system and which were away from Asia and which were less alert to this infectious disease from China. The habit of wearing mask, hug, handshake or religious ceremonies might affect, too. <br /> In the cruise ship Diamond Princess, Japanese who were put in the same ship with Westerners show greater mortality rate than Westerners. And in a lot of Western European countries, the risk population (elderly) has experiences of BCG (they are classified as "past BCG", but in fact most of risk populations are experienced with BCG). So, the BCG hypothesis is not consistent with these facts, either. <br /> I am not saying BCG doesn't work, I am saying you cannot conclude anything from these uncontrolled studies which lacks in numerous potential confounding variables. Just let's wait for results of RCTs.

      Here's my data if I haven't made any mistakes.You can see the apparent little association with BCG policy and number of the death (13 days after the 100th case) as of 11th April.

      O Iran 291<br /> X Spain 288<br /> O China 259<br /> X Italy 233<br /> O Turkey 214<br /> O Algeria 130<br /> X United Kingdom 103<br /> O Indonesia 102<br /> O Brazil 92<br /> X France 91<br /> X Netherlands 76<br /> X United States 69<br /> O Dominican Republic 68<br /> X Ecuador 62<br /> O Portugal 60<br /> O Morocco 59<br /> O Philippines 54<br /> O Ukraine 45<br /> O Iraq 42<br /> O South Korea 35<br /> X Switzerland 33<br /> O Argentina 31<br /> O Egypt 30<br /> O Panama 30<br /> O India 29<br /> O Mexico 29<br /> X Canada 27<br /> O Hungary 26<br /> O Honduras 24<br /> O Peru 24<br /> O Romania 24<br /> O Albania 22<br /> O Greece 22<br /> O Ireland 22<br /> O Tunisia 22<br /> X Luxembourg 22<br /> O Bosnia and Herzegovina 21<br /> X Belgium 21<br /> O Burkina Faso 19<br /> O Macedonia 17<br /> X Andorra 17<br /> O Colombia 16<br /> O Poland 16<br /> O Afghanistan 15<br /> O Cuba 15<br /> O Moldova 15<br /> O Pakistan 13<br /> X Denmark 13<br /> O Bulgaria 10<br /> O Malaysia 10<br /> O Russia 10<br /> X Lebanon 10<br /> X Sweden 10<br /> O Lithuania 9<br /> O Mauritius 9<br /> O Azerbaijan 8<br /> X Austria 8<br /> X Israel 8<br /> O Chile 7<br /> O Kazakhstan 7<br /> O Venezuela 7<br /> X Australia 7<br /> O Croatia 6<br /> O Ghana 6<br /> O Japan 6<br /> O Thailand 6<br /> X Czech Republic 6<br /> X Norway 6<br /> O Jordan 5<br /> O South Africa 5<br /> O Sri Lanka 5<br /> O Taiwan 5<br /> O United Arab Emirates 5<br /> X Germany 5<br /> X Slovenia 5<br /> O Saudi Arabia 4<br /> O Uruguay 4<br /> O Armenia 3<br /> O Cote d'Ivoire 3<br /> O Uzbekistan 3<br /> X Finland 3<br /> O Costa Rica 2<br /> O Oman 2<br /> O Senegal 2<br /> O Estonia 1<br /> X New Zealand 1<br /> O Cambodia 0<br /> O Kuwait 0<br /> O Latvia 0<br /> O Malta 0<br /> O Qatar 0<br /> O Singapore 0<br /> O Vietnam 0<br /> X Slovakia 0

    1. On 2021-11-06 19:21:58, user Eleutherodactylus Sciagraphus wrote:

      This preprintincludes data from human subjects that are under ethical scrutiny. The <br /> majority of patients enrolled were not informed nor agreed onparticipating in the study. The Brazilian National Comission forResearch Ethics (CONEP) has been bypassed, documents have been tampered, and the situation is now under investigation.

      References supporting this statement (both in English and in Portuguese):

      https://brazilian.report/li...

      https://www.emergency-live....

      https://www.dire.it/14-10-2...

      https://www.matinaljornalis...

      https://g1.globo.com/rs/rio...

    1. On 2020-03-30 14:10:51, user Sinai Immunol Review Project wrote:

      Study description: Data analyzed from 52 COVID-19 patients admitted and then discharged with COVID-19. Clinical, laboratory, and radiological data were longitudinally recorded with illness time course (PCR + to PCR-) and 7 patients (13.5%) were readmitted with a follow up positive test (PCR+) within two weeks of discharge.

      Key Findings:

      At admission:<br /> o The majority of patients had increased CRP at admission (63.5%).<br /> o LDH, and HSST TNT were significantly increased at admission. <br /> o Radiographic signs via chest CT showed increased involvement in lower lobes: right lower lobe (47 cases, 90.4%), left lower lobe (37 cases, 71.2%).<br /> o GGO (90.4%), interlobular septal thickening (42.3%), vascular enlargement (42.3%), and reticulation (11.5%) were most commonly observed.

      After negative PCR test (discharge):<br /> o CRP levels decreased lymphocyte counts (#/L) increased significantly (CD3+, CD3+/8+ and CD3+/4+) after negative PCR.<br /> o Consolidation and mixed GGO observed in longitudinal CT imaging w different extents of inflammatory exudation in lungs, with overall tendency for improvement (except 2/7 patients that were readmitted after discharge with re-positive test) after negative PCR.

      Seven patients repeated positive RT-PCR test and were readmitted to the hospital (9 to 17 day after initial discharge):<br /> o Follow up CT necessary to monitor improvement during recovery and patients with lesion progression should be given more attention.<br /> o Dynamic CT in addition to negative test essential in clinical diagnosis due to nasal swab PCR sampling bias (false-negatives).<br /> o Increase in CRP occurred in 2 readmitted patients (and decr. in lymphocytes in one patient), but was not correlated with new lesions or disease progression vs. improvement (very low N).<br /> o Patients readmitted attributed to false-negative PCR vs. re-exposure.

      Importance: Study tracked key clinical features associated with disease progression, recovery, and determinants of clinical diagnosis/management of COVID-19 patients.

      Critical Analysis: Patients sampled in this study were generally younger (65.4% < 50 yrs) and less critically ill/all discharged. Small number of recovered patients (N=18). Time of follow up was relatively short. Limited clinical information available about patients with re-positive test (except CRP and lymph tracking).

    1. On 2022-03-04 05:05:06, user Satwant Kumar wrote:

      The research community has gained valuable data from this multi-site project. In comparison to ATLAS v1.2, ATLAS v2.0 represents a significant upgrade.<br /> However, a quantitative evaluation of the level of disagreement between human raters in segmenting lesions of different sizes should be provided. <br /> Rationale: We recently trained segmentation models on ATLAS v2.0 and examined their predictions and errors. We found that the model is both over- and under-predicting lesions. We believe the error arises from inconsistent manual labeling in the ATLAS v2 dataset. Below are a few examples. If the labels are in fact inconsistent, the model cannot explain beyond a certain upper bound. If the disagreement between human raters is reported, we could estimate that upper bound and report the "explained explainable variance" for our segmentation models. <br /> Examples of model (a deep convolutional network) prediction on the validation set (5-fold CV). Before training and testing, the brains were extracted (skull-removed). Images are plotted in MNI152 space and 8 mm spacing is used to visualize axial (transverse) sections:

      https://www.dropbox.com/s/f...<br /> https://www.dropbox.com/s/0...<br /> https://www.dropbox.com/s/o...<br /> https://www.dropbox.com/s/q...

      Satwant Kumar, MBBS, PhD,<br /> UT Austin

    1. On 2020-04-16 14:40:22, user David Steadson wrote:

      The paper reports "Observed cumulative death counts are illustrated as circles (O) and amount to 62 by the 25th of March, 2020"

      As of April 15 2020, the Swedish Public Health Authority is reporting cumulative deaths of 106 as of that date.

    1. On 2020-08-14 20:52:35, user Pavel Valerjevich Voronov wrote:

      For those, who started to incorrectly interpret this study. It seems that it doesn't show how severe illness is for Rh- based on data analyzed. As my assumption stands based on other two related clinical studies - Rh-, especially O- and A- have usually mild symptoms and recover easily. BUT this oneactually shows interesting fact - because for O- and A- sickness is light they MIGHT transmit the disease not knowing anything about it or recover silently without any side effects. That what I see as a reason why covid spread is higher in countries with more Rh- population. If you badly sick - most likely you're at home or in the hospital, isolated. Thus, not spreading the "bug".

    1. On 2021-02-10 18:47:50, user moshkreit wrote:

      This study does not show anything until the authors release the details of the age distribution for the two groups. W/o that, UC groups could have 10 people above 75, mitigated by 10 younger people to keep the mean in check. Naturally, a group with people over 75 would have more subjects at risk at day 26 than a group where the oldest subject is only 71.

  3. stylo.ecrituresnumeriques.ca stylo.ecrituresnumeriques.ca
    1. Rappels

      Tu peux ajouter des informations concernant Digital Services Act, adopté par l’Union européenne sous présidence française. Qui est une réglementation européenne visant à encadrer les plateformes en ligne, en imposant plus de transparence sur la modération des contenus et la responsabilité des services numériques. Il y a quelques informations que tu peux utiliser à partir de cet article : "Chapitre 25. Les contenus haineux sur Internet" Par Cédric. O. (sur Cairn)

    1. hamartomatous proliferation

      Hamartomatous proliferation, tıpta hamartom benzeri doku çoğalması anlamına gelir.

      Anlamı: Hamartom: Normalde o bölgede bulunan doku elemanlarının düzensiz ve aşırı çoğalmasıyla oluşan iyi huylu (benign) kitle Proliferation: hücre/doku çoğalması

    Annotators

    1. Ionos-ceo Achim Weiß positioneert het product nadrukkelijk breed: van mkb tot publieke sector. Daarbij draait het niet alleen om functionaliteit, maar ook om jurisdictie, governance en controle over de eigen infrastructuur.

      Look closer at Ionos company. [[Ionos o]] and their collab with [[Nextcloud o]]

    1. Author response:

      The following is the authors’ response to the previous reviews.

      Public Reviews:

      Reviewer #2 (Public review):

      In the manuscript Ruhling et al propose a rapid uptake pathway that is dependent on lysosomal exocytosis, lysosomal Ca2+ and acid sphingomyelinase, and further suggest that the intracellular trafficking and fate of the pathogen is dictated by the mode of entry. Overall, this is manuscript argues for an important mechanism of a 'rapid' cellular entry pathway of S.aureus that is dependent on lysosomal exocytosis and acid sphingomyelinase and links the intracellular fate of bacterium including phagosomal dynamics, cytosolic replication and host cell death to different modes of uptake. 

      Key strength is the nature of the idea proposed, while continued reliance on inhibitor treatment combined with lack of phenotype / conditional phenotype for genetic knock out is a major weakness. 

      In the revised version, the authors perform experiments with ASM KO cells to provide genetic evidence of the role for ASM in S. aureus entry through lysosomal modulation. The key additional experiment is the phenotype of reduced bacterial uptake in low serum, but not in high serum conditions. The authors suggest this could be due to the SM from serum itself affecting the entry. While this explanation is plausible, prolonged exposure of cells to low serum is well documented to alter several cellular functions, particularly in the context of this manuscript, lysosomal positioning, exocytosis and Ca2+ signaling. A better control here could be WT cells grown in low serum.

      As the reviewer suggested, we did culture both, WT control cells as well as ASM knock-outs, under low serum conditions before conducting the invasion assays. Hence, the detected effects on S. aureus invasion must be caused by lack of functional ASM in the mutant.

      We apologize that this did not become evident from the manuscript’s text. We thus included a change in line 259 which now reads:

      ”To test whether FBS confounded our invasion experiments, we cultivated WT as well as ASM K.O. cells in medium with reduced FBS concentration (1%) and determined the S. aureus invasion efficiency (Figure 2I).”

      If SM in serum can interfere, why do they see such pronounced phenotype on bacterial entry in WT cells upon chemical inhibition?

      We explain the differences between inhibitor-treated WT cells and ASM K.O.s by the severe accumulation of SM upon genetic ablation of ASM. We demonstrated this by HPLC-MS/MS measurements in Figure 2L. If cells were cultured in 10% FBS, an ASM K.O. resulted in approx. 4-times higher levels of cellular SM C18:0 when compared to WT cells, while amitriptyline treatment of WT cells had no effect, and ARC39 treatment increased SM C18:0 levels only by 2-fold. This likely results from different durations of SM accumulation in the cell pools which is caused either by complete absence of ASM (in case of the ASM K.O.) or only in the hour-range upon treatment with the inhibitors.

      Under low serum conditions, the severe SM C18:0 accumulation in the ASM K.O. was found decreased (from 4-fold to 2-fold when compared to WT cells; Figure 2M). Here, the WT cells used as reference also were cultured in the same manner as the ASM K.O. A similar pattern was observed for other SM species (Supp. Figure 3). This correlates with the S. aureus invasion phenotype in ASM K.O.: under high serum conditions (and resulting in severe SM accumulation) we did not detect an invasion defect, while under low serum conditions (resulting in only moderate SM accumulation) S. aureus invasion was reduced in the knock-outs when compared to WT cells cultured in the same conditions, respectively.

      While the authors argue a role for undetectable nano-scale Cer platforms on the cell surface caused by ASM activity, results do not rule out a SM independent role in the cellular uptake phenotype of ASM inhibitors.

      Since the comments starting with the line above are identical to the previous comments by the reviewer, we assume that these points of criticism still resound with the Reviewer, although we had agreed previously with the reviewer that we do not show formation of ceramide-enriched platforms, we had changed the manuscript accordingly in the previous revision round already (see also our comment below).

      The authors have attempted to address many of the points raised in the previous revision. While the new data presented provide partial evidence, the reliance on chemical inhibitors and lack of clear results directly documenting release of lysosomal Ca2+, or single bacterial tracking, or clear distinction between ASM dependent and independent processes dampen the enthusiasm.

      We continue to share the reviewer’s desire to discriminate between ASM-dependent and ASMindependent processes, but the simultaneous occurrence of multiple pathways of bacterial uptake is currently the limiting factor and technological challenge in our laboratory, since these events happen rapidly. We do hope that we or others will be able to address these limitations in the future, for instance with the technologies suggested by the reviewer.

      I acknowledge the author's argument of different ASM inhibitors showing similar phenotypes across different assays as pointing to a role for ASM, but the lack of phenotype in ASM KO cells is concerning. The author's argument that altered lipid composition in ASM KO cells could be overcoming the ASMmediated infection effects by other ASM-independent mechanisms is speculative, as they acknowledge, and moderates the importance of ASM-dependent pathway. The SM accumulation in ASM KO cells does not distinguish between localized alterations within the cells. If this pathway can be compensated, how central is it likely to be ? 

      We here want to elaborate again, since our revision experiments demonstrate the ASM-dependency of the rapid uptake under low serum conditions – see also above. We were convinced that the genetic evidence of an S. aureus invasion phenotype in ASM K.O.s under these conditions would eliminate the reviewer’s concern about the role of ASM during the bacterial invasion (see also above). Our lipidomics data of ASM K.O.s cultured in 1% and 10% FBS (Figure 2, M, Supp. Figure 3) and inhibitor-treated WT cells (Figure 2L, Supp. Figure 3) show a correlation between SM accumulation and the invasion phenotype observed by us.

      We agree with the reviewer, however, that it remains elusive why changes in the sphingolipidome increase ASM-independent S. aureus internalization by host cells. One explanation is a dysfunction of the lipid raft-associated protein caveolin-1 upon strong SM accumulation, which was previously shown to appear in ASM-deficient cells (1, 2). A lack of caveolin-1 results in strongly increased host cell entry of S. aureus in certain cell types (3, 4). In other cell types, such as A549 cells, S. aureus invades in an αtoxin and caveolin-1 dependent fashion (5). It will be interesting to study, to what extent such processes as described by Goldmann and colleagues will depend on ASM. However, a characterization of the mechanism behind these observations requires further experimentation and is beyond the scope of the current manuscript. 

      As to the centrality of the pathway: we cannot and do not make any assumptions on the centrality of the pathway and its importance in vivo. As scientists we were intrigued by our finding of an ASM dependent uptake pathway for S. aureus – especially its speed. In different as of yet still unidentified host cell types or cell lines such a pathway may pose a major entry point for pathogens. Alternatively, we may have identified an ASM-dependent mode of receptor uptake, with which the bacteria “piggyback” into the cells.

      The authors allude to lower phagosomal escape rate in ASM KO cells compared to inhibitor treatment, which appears to contradict the notion of uptake and intracellular trafficking phenotype being tightly linked. As they point out, these results might be hard to interpret.

      We again want to add that we measured phagosomal escape of S. aureus in WT and ASM K.O. cells cultured in 1% FBS (low serum conditions) and compared it to escape rates obtained with host cells cultured in 10% FBS. Again, we infected cells for 10 or 30 min and determined the escape rates 3h p.i. However, the results are similar to escape rates determined with 10% FBS (see Author response image 1). This was addressed already during the manuscript’s first revision. We found that escape rates of S. aureus were significantly decreased in absence of ASM regardless of the FBS concentration in the medium.

      Author response image 1.

      We therefore think that prolonged absence of ASM has additional side effects. For instance, certain endocytic pathways could be up- or down-regulated to adapt for the absence of ASM or could be affected by other changes in the lipidome (that can be minimized but not completely prevented by culturing cells in 1% FBS). This could, for instance, affect maturation of S. aureus-containing phagosomes and hence phagosomal escape.

      As it is currently unclear in how far the prolonged absence of ASM activity affects cellular processes, we think other experiments investigating the role of ASM-dependent invasion for phagosomal escape are more reliable. Most importantly, bacteria that enter host cell early during infection (and thus, predominantly via the “rapid” ASM-dependent pathway) possess lower phagosomal escape rates than bacteria that entered host cells later during infection (Figure 5, D and E). This is confirmed by higher escapes rates upon blocking ASM-dependent invasion with Vacuolin-1 (Figure 4E) and three different ASM inhibitors (Figure 4C and D). We further demonstrate that sphingomyelin on the plasma membrane during invasion influences phagosomal escape, while sphingomyelin levels in the phagosomal membrane did not change phagosomal escape (Figure5 a and b). This is summarized in Figure 5F.

      Could an inducible KD system recapitulate (some of) the phenotype of inhibitor treatment? If S. aureus does not escape phagosome in macrophages, could it provide a system to potentially decouple the uptake and intracellular trafficking effects by ASM (or its inhibitor treatment) ?

      Knock-downs in our laboratory are based on the vector pLVTHM(6). Inducible knock-downs in the cells would require the introduction of an inducible Tet<sup>on</sup> system, which the cells currently do not harbor.

      However, it needs to be stated that for optimal gene knock-downs, the induction of this system has to be performed by doxycycline supplementation in the medium for 7 days thus leading to several days of growth of the cells, which will allow the cells to adapt their lipid metabolism thus reflecting a situation that we encounter for the K.O.s.

      ASM-dependent uptake of S. aureus in macrophages has been demonstrated before (7). However, the course of infection in macrophages differs from non-professional phagocytes (8). E.g. in macrophages, S. aureus replicates within phagosomes, whereas in non-professional phagocytes replicates in the host cytosol. Absence of ASM therefore may influence the intracellular infection of macrophages with S. aureus in a distinct manner.

      The role of ASM on cell surface remains unclear. The hypothesis proposed by the authors that the localized generation of Cer on the surface by released ASM leads to generation of Cer-enriched platforms could be plausible, but is not backed by data, technical challenges to visualize these platforms notwithstanding. These results do not rule out possible SM independent effects of ASM on the cell surface, if indeed the role of ASM is confirmed by controlled genetic depletion studies.

      We agree with the reviewer that we do not show generation of ceramide-enriched platforms (see also above). We thus already had changed Figure 6F in the revised manuscript to make clear that it remains elusive whether ceramide-enriched platforms are formed. We also had added a sentence to the discussion (line 615) to emphasize that the existence of these microdomains is still debated in lipid research.

      We think that the following observations support SM-dependent effects of ASM during S. aureus invasion:

      (i) Reduced invasion upon removing SM from the plasma membrane (Figure 2N, Supp. Figure 2M)

      (ii) Increased invasion in TPC1 and Syt7 K.O. (Figure 2, P) in presence of exogenously added SMase.

      However, we agree with the reviewer that we do not directly demonstrate ASM-mediated SM cleavage during S. aureus invasion. Hence, we had added a sentence to the discussion that mentions a possible SM-independent role of ASM for invasion (line 556) that reads:

      “Since it remains elusive to which extent ASM processes SM on the plasma membrane during S. aureus invasion, one may speculate that ASM could also have functions other than SM metabolization during host cell entry of the pathogen. However, we did not detect a direct interaction between S. aureus and ASM in an S. aureus-host interactome screen (9).”

      The reviewer acknowledges technical challenges in directly visualizing lysosomal Ca2+ using the methods outlined. Genetically encoded lysosomal Ca2+ sensor such as Gcamp3-ML1 might provide better ways to directly visualize this during inhibitor treatment, or S. aureus infection. 

      We again thank the reviewer for this suggestion. We already had included the following section in our discussion (then: line 593): “Since fluorescent calcium reporters allow to monitor this process microscopically, future experiments may visualize this process in more detail and contribute to our understanding of the underlying signaling. mechanisms.”

      References for the purpose of this response letter:

      (1) Rappaport, J., C. Garnacho, and S. Muro, Clathrin-mediated endocytosis is impaired in type AB Niemann-Pick disease model cells and can be restored by ICAM-1-mediated enzyme replacement. Mol Pharm, 2014. 11(8): p. 2887-95.

      (2) Rappaport, J., et al., Altered Clathrin-Independent Endocytosis in Type A Niemann-Pick Disease Cells and Rescue by ICAM-1-Targeted Enzyme Delivery. Mol Pharm, 2015. 12(5): p. 1366-76.

      (3) Hoffmann, C., et al., Caveolin limits membrane microdomain mobility and integrin-mediated uptake of fibronectin-binding pathogens. J Cell Sci, 2010. 123(Pt 24): p. 4280-91.

      (4) Tricou, L.-P., et al., Staphylococcus aureus can use an alternative pathway to be internalized by osteoblasts in absence of β1 integrins. Scientific Reports, 2024. 14(1): p. 28643.

      (5) Goldmann, O., et al., Alpha-hemolysin promotes internalization of Staphylococcus aureus into human lung epithelial cells via caveolin-1- and cholesterol-rich lipid rafts. Cell Mol Life Sci, 2024. 81(1): p. 435.

      (6) Wiznerowicz, M. and D. Trono, Conditional suppression of cellular genes: lentivirus vectormediated drug-inducible RNA interference. J Virol, 2003. 77(16): p. 8957-61.

      (7) Li, C., et al., Regulation of Staphylococcus aureus Infection of Macrophages by CD44, Reactive Oxygen Species, and Acid Sphingomyelinase. Antioxid Redox Signal, 2018. 28(10): p. 916-934.

      (8) Moldovan, A. and M.J. Fraunholz, In or out: Phagosomal escape of Staphylococcus aureus. Cell Microbiol, 2019. 21(3): p. e12997.

      (9) Rühling, M., et al., Identification of the Staphylococcus aureus endothelial cell surface interactome by proximity labeling. mBio, 2025. 0(0): p. e03654-24.

    1. Author Response:

      The following is the authors’ response to the original reviews.

      Public Reviews:

      Reviewer #1 (Public review):

      (1) The study does not explore or discuss how oral ingestion of Nora virus leads to the colonization of stem cells, which are located basally in the gut. This mechanism should be discussed.

      We have added an additional paragraph (4th) in the Discussion dealing with this issue and are further discussing the consequences of RNAi potentially not being functional in progenitor cells in the paragraph on antiviral responses.

      (2) The authors fail to detect Dicer-GFP fusion protein expression in stem cells, a finding that could explain why the virus persists in these cells. Further investigation is needed to determine whether RNAi functions are effective in stem cells compared to enterocytes. For clarification, the authors could cross esg-Gal4 UAS-GFP and Myo-Gal4 UAS-GFP with UAS GFP-RNAi and/or express a Dicer-GFP construct under a stem cell-specific driver.

      Actually, it is well-known in the Drosophila literature on the intestinal epithelium that RNAi functions well in progenitor cells as the technique has been widely used to understand the control of stem cell division and differentiation in tens of articles. We provide here just a few examples: Jiang et al., Nat Commun (2025) https://doi.org/10.1038/s41467-024-55255-1; Zhai et al., PLoS Genetics (2017) https://doi.org/10.1371/journal.pgen.1006854; Wu et al., https://doi.org/10.1371/journal.pgen.1009649.

      (3) The presentation of experimental parameters (e.g., pathogen type, temperature, time points) should be improved in the results section and at the top of the figures to enhance clarity. Additionally, details regarding the mode of oral infection (continuous exposure vs. single feeding on a filter) should be specified. Given that fly stock flipping frequency influences microbiota load (as noted in Broderick et al.), this should be reported, especially for lifespan studies.

      P. aeruginosa oral infection was always by continuous exposure, as detailed in the Mat.& Meth. section. Nora infection was done by exposure to the viral solution for 24h, as detailed in Mat. & Meth. The flipping frequency had also been reported in that section.

      (4) To confirm that enterocyte colonization requires stem cell proliferation and differentiation, the authors should analyze Nora virus localization in JAK-STAT-deficient flies infected with bacteria or toxicants. This would help determine whether the virus can infect enterocytes in the absence of enterocyte differentiation, but stimulation of stem cells.

      We now provide these data (pictures and quantification) in Fig.7 G-H and discuss them in the main text.

      (5) The study does not discuss the spatial distribution of Nora virus infection along the gut. Specifically, it remains unclear whether viral colonization is higher in gut regions R2 and R3, which contain proliferative stem cells. Addressing this could provide valuable insights into the virus's infection dynamics.

      We have now specified that Nora virus was detected only in the posterior midgut; we are now also providing a schematic illustration in Fig. S5J.

      Recommendations for the authors:

      Major Suggestion

      See weaknesses section for key areas requiring improvement.

      Minor Suggestions

      (1) Line 79: Mention Nox in the text. Key references on Nox include Jones (2013), Iatsenko (2018), and Patel (2016).

      Done.

      (2) Line 92: The long list of publications is unnecessary and can be shortened.

      We are not sure that many investigators are aware of the scope of our studies on host-pathogen relationships and this is the adequate place for a reminder.

      (3) Line 196: Cite Choi et al. (Aging Cell, 2008; 7:318-334. doi: 10.1111/j.1474- 9726.2008.00380.x) for the initial work on gut dysplasia during aging. However, note that dysbiosis in aging is demonstrated in Buchon et al. (2009, Genes and Development) and other studies.

      Done.

      (4) Line 265: It would be interesting to clarify whether the shortened lifespan of Norainfected flies after a clean injury is dependent on the microbiota.

      The shortened life span of Nora-infected flies is not due to the injury as demonstrated in Fig. S4F. Hence, the shortened lifespan is differentially affected by the microbiota according to nutrition conditions as documented in Fig. 3D-E.

      (5) Line 285: Clarify what is meant by "polyubiquitin promoter"-do the authors mean a ubiquitous Gal4 driver? Specify the Gal4 lines used in the result section.

      Done. The construct is a direct fusion of the ubiquitin p63E promoter to the Dicer-fluorescent protein sequences as described in Girardi et al., Sci Rep, 2015.

      (6) Line 347: Indicate the references aligning with the most recent studies on this topic.

      Done.

      (7) Line 373 and elsewhere: Mention studies that have shown the microbiota influence on lifespan, in relation to dietary richness.

      Done.

      (8) Line 588: Provide details on the method used for hemolymph collection.

      Done.

      (9) Line 964: Clarify the phrase "as previously shown"-where in this paper was it demonstrated?

      The legends have been rewritten and the phrase has been deleted.

      (10) Line 987: In "survival of non-infested with PA14," explicitly mention Nora to distinguish between different infections.

      Done.

      Figures & Experimental Details

      (11) Figures: Improve figure legends or add information at the top of figures, specifying:

      Number of flies used to monitor Nora virus titer.

      Temperature conditions. o Age of flies used in experiments.

      Done.

      (12) Figure 2E: The lifespan of Nora-negative flies appears very short. Was this lifespan assay conducted at 29{degree sign}C? What was the fly stock flipping rate?

      Correct, it was 29°C. As described in the Material and Methods section, the flies were flipped every two (29°C) to four days (25°C).

      (13) Figure 4C: Improve labeling on the plate for better clarity.

      Done.

      (14) Figure 6C: The figure legend on the right is difficult to interpret. Clarify what "+" indicates and explicitly write out the genotype. Is NP identical to NPG4G80?

      Done. NP is the NP1 driver. We usually use it in a version that also includes a Gal80<sup>ts</sup> transgene to express the gene of interest only at the adult stage.

      (15) Dissection Details: Clearly state which part of the gut was dissected-midgut, entire gut, {plus minus} Malpighian tubules. This should be specified in the results section.

      Done (no Malpighian tubules nor crop) for RTqPCR analyses.

      (16) Clean Injury: Provide more details in the results section regarding the injury site and needle size.

      Done.

      (17) Use "Abx" instead of "AntiB," as the former is more commonly recognized.

      Done.

      Reviewer #2 (Public review):

      The title does not seem to be fully supported by the data. While the authors convincingly show the increased sensitivity to Pseudomonas infection, effects on another tested bacterium, Serratia marcescens, were not significantly different between Nora-virus-infected and noninfected flies. Thus, effects of 'intestinal infection' seem to be too broad a claim.

      We agree with the reviewer and have accordingly modified the title, which now explicitly refers to P. aeruginosa.

      Also, whether the Nora virus increases sensitivity to oxidative stress is not so clear to me: the figure that supports this claim is the survival assay of Figure 5F. However, the difference in survival between control and paraquat-treated Nora (-) flies seems to be in the same order as between control and paraquat-treated Nora (+) flies. Rather, cause and effect seem to be the reverse: paraquat increases ISC proliferation, higher viral loads, and consequently shorter survival. I suggest rephrasing the title and conclusions accordingly.

      While we usually just directly compare Nora (+) vs. Nora (-) flies with the same conditions, we note that the difference of survival between control and paraquat-treated Nora (-) flies is of about 9 days, based on LT50 values whereas it is of 8 days for Nora(+) flies. This difference is of about two days when comparing Nora (+) to Nora (-) flies exposed to paraquat. Thus, Nora does contribute to an increased sensitivity to oxidative stress likely by the process highlighted by the reviewer and also by its own detrimental action on the homeostasis of the intestinal epithelium and associated disruption of its barrier function.

      Quantification of immunofluorescence microscopy is missing, rendering the images somewhat anecdotal. Quantification should be provided. It will then also be of interest to quantify the number of Nora (+) cells, and the Nora virus levels per infected cell (e.g. Figure 5H). Also, the claim that the Nora virus initially infects ISC and later (upon stress) infects enterocytes requires quantification.

      Missing quantifications of pictures have been added: Figs. S5E and 7H. We are not sure we understand the reviewer comment on “Nora virus levels per infected cell”: the signal we are seeing may correspond to aggregates of the virus and would be impossible to quantify reliably, e.g., in the right-most panel of Fig. 5H. Fig. 5I clearly shows that no Nora is detected in enterocytes of young 5-day-old flies in the absence of infectious or xenobiotic challenge.

      Genetic support for the role of the JAK-STAT pathway in driving ISC proliferation and supporting Nora virus replication is convincing. It would also be of interest to analyze other pathways implicated in ISC proliferation (e.g. JNK, EGFR), especially given the observations of Nigg et al, showing an involvement of STING/NF-kB and EGFR pathway in driving intestinal phenotypes of Drosophila A virus-infected flies (doi: 10.1016/j.cub.2024.05.009).

      We agree with the reviewer that these would be interesting experiments to perform, especially in the light of one hypothesis that antiviral defenses may prevent the initial infection of enterocytes as discussed at length in our updated discussion on host antiviral defenses. However, we are currently unable to perform additional experiments and leave it to other interested investigators studying antiviral innate immunity to address these questions. In this work, we used the interference with the JAK-STAT pathway as a second tool to block the division of ISCs.

      Figure 5E: An intriguing observation is that GFP:Dicer2 seems to be unstable in Nora virusinfected cells. Here, GFP control driven by the same driver line would be required to confidently conclude that this is due to an effect on Dicer-2 specifically.

      Actually, this experiment was not performed using the Gal4-UAS system but a direct fusion. We do know that GFP is stable when expressed in enterocytes, e.g., Lee et al., Cell Host&Microbe (2016) DOI: 10.1016/j.chom.2016.10.010.

      Legends are mostly conclusive, and essential information about the experimental setup is missing in the captions of multiple figures, making the interpretation of the data difficult. See my private recommendations for suggestions to improve the data presentation.

      Done.

      Recommendations for the authors:

      Suggestions for the presentation of the data:

      (1) I found the names Ore-R(SC) and Ore-R(SM) for noninfected vs infected Ore-R flies not very intuitive. I suggest renaming them into something that makes the infection status clear.

      These notations refer to two distinct sub-strains that may reflect different origins with some likely genetic drift accounting for the distinct properties of the two sub-strains. As the ORE-R (SM) have different infection status: infested, cleaned, re-infected, we fear that this would not clarify the matter. Of note, ORE-R(SC) are refractory to Nora virus infection (Fig. S1I).

      (2) Please define the number of flies analyzed for survival assays in the legends.

      Done.

      (3) The authors provide conclusions in most of the figure legends, without providing an explanation of the experiment that was done. Conclusions should be used sparingly, if at all, in legends. Also, relevant information is often missing in the legends (time points after infection, Figure 2E food source, etc.). I suggest the authors carefully double-check their legends and rephrase the conclusive legends with descriptive ones.

      Done. The figure legends have been rewritten.

      (4) Several of the legends indicate that 'data represent the mean of biological triplicates' however some panels do not represent triplicates (e.g. Figure 1C-E). Please correct.

      Done.

      (5) Legends: which multiple comparison test was used for ANOVA?

      Done. Tukey’s post-hoc test was used for direct comparisons.

      (6) Line 888: black arrows are not shown in the figure.

      Corrected.

      (7) Figure 1F: legend on the figure seems incorrect (all are labeled Nora (+)); likewise for Figure 2C (all labeled Nora (-)).

      Corrected.

      (8) Materials and methods: please describe how the Nora virus antibody was raised (and specify on line 271 what viral protein is recognized).

      Done. As the whole virus was used for immunization, we cannot state which specific viral proteins are detected by the antibody.

      (9) Please define what is presented in the box plots (mean, range, whiskers, individual data points).

      Done.

      (10) Figure 4 and associated text (line 221): a brief explanation of the Smurf assay would be useful.

      Done.

      (11) Figure 4C: I did not find the picture of the agar plate informative, as similar information is conveyed in Figure 4D. Also, the labelling cannot be clearly read.

      Figure 4D provides a quantification of panel C. The readability has been improved.

      (12) Figure 4C: It is suggested that Nora-positive, smurf-negative flies were analyzed, but from Figure 4B it seems that these do not exist. Please explain.

      The data in Fig. 4B do not represent absolute numbers but percentages. Thus, there were at most 50% of SMURF-positive flies at the time of the assay, the rest being Smurf-negative yet Nora-positive.

      (13) The abbreviations PA14 and Db11 are used in several figures. I would suggest defining the abbreviation in the legend to facilitate interpretation.

      Done.

      (14) Figure 5A/5G: the Nora virus RNA levels in this figure are dramatically lower than the levels in other figure panels. Please check/correct.

      Done. The reviewer is indeed correct: we have forgotten to write that for these two panels, the loads are relative and not absolute as is the case in other panels. 5A: the load in whole flies was taken to be 1; 5G: untreated Nora-positive flies were taken to be 1.

      (15) Figure 6A: total number of AporTag positive cells are reported. Were the same number of total cells analyzed? Please define.

      We have not counted all of the cells in each midgut but provide the number of ApopTag positive cells per midgut. We thus make the assumption that the overall number of midgut cells is not varying much from one midgut to the other. Visual inspection of DAPI-stained nuclei did not reveal any obvious change in the density of enterocyte nuclei as illustrated in Fig. S6 (we guess that everyone in the field is making the same assumption when counting mitotic ISCs with PHH3 staining).

      (16) Figure 6C: I find the shades of blue difficult to distinguish and suggest to us other colors.

      Done.

      (17) There seems to be a large mismatch between the percentage of Nora virus-positive cells in Figures 5C, 6H and the images of Figures 5G and 5H. Why?

      We think there might be a mistake with the Figure numbers cited by the referee. We guess the point the referee was trying to raise is the difference of perceived Nora virus burden between Fig. 5H and Fig. 6G, a quite valid point. For Fig. 5H, we had measured the Nora-virus load by RTqPCR (Fig. 5G, relative burden) but had not quantified the images. This is now done and shown in Fig. 5I. In Fig. 5H, young flies were used and hence there was no Nora virus detected in ECs, as now quantified in Fig. 5I. For Fig. 6G, we had to use 30-day old intestines to be able to observe Nora virus in the enterocytes of the controls. We have now included this important point in the main text and in the Figure legends.

      (18) The Title of the legend in Figure 7 is not supported by the data as 'spread through the intestine' has not been analyzed. Please adjust.

      Done.

      (19) All figures in which ANOVA is used: I assume that anything not labeled with an asterisk was found to be non-significant? If so, this should be indicated in the manuscript.

      Actually, we have not highlighted obvious differences to maintain clarity (e.g., Fig. 1E between uncured Ore-R(SM) and cured Ore-R(SC). We thus have underlined the biologically relevant differences in the panels. The interested readr can refer to the primary data that are accessible on a data repository.

      (20) Figure 7C: the authors may want to contrast their finding that Upd3 was not upregulated in Nora virus-infected flies (in the absence of PA14) with the findings of Kuyateh et al, who did report upregulation of Upd3 (https://doi.org/10.3390/v15091849).

      We thank the reviewer for pointing out this study we were unaware of. We would like to point out that this article is difficult to follow as it is not 100% clear in which of the analyzed studies the induction of upd3 was observed and which exact experimental conditions were followed, e.g., young or old flies, whole flies or gut… We have looked in more detail at ref. 133 of this article, which refers to an unpublished study from the Hultmark laboratory that is however available online: (https://www.diva-portal.org/smash/record.jsf?aq2=%5B%5B%5D%5D&c=15&af=%5B%5D&searchType=SIMPLE&sortOrder2=title_sort_asc&query=Nora+virus&language=en&pid=diva2%3A1045375&aq=%5B%5B%5D%5D&sf=all&aqe=%5B%5D&sortOrder=author_sort_asc&onlyFullText=false&noOfRows=50&dswid=4587).

      In that study, flies were “infected” with Nora virus by expressing a cDNA clone injected into embryos. The problem is that for some unknown reasons the authors used Relish mutant flies. It is thus difficult to conclude as these flies are defective for the IMD and Sting pathways whereas our flies are wild-type. We were also interested to read that genes involved in midgut stem cells differentiation were expressed in flies harboring Nora virus, which is in keeping with the data of the present study. However, it is difficult to discuss this when we know little on the background of the studies analyzed by Kuyateh et al, in as much as our Discussion is already rather long.

      (21) Figure 7E: are the differences between control and Dome/Stat knockdown flies significantly different for Nora (+) flies (in the absence of Pseudomonas)? This is not clear from the data presentation.

      The answer to the question is positive: the JAK-STAT pathway also contributes to the maintenance of intestinal epithelium homeostasis in the absence of bacterial infection, that is presumably basal conditions. We have modified Fig. 7E to include more comparisons.

      Textual suggestions:

      (22) Line 25 strives > thrives

      Done.

      (23) Lines 150- 152, etc are not very informative. Also, some of the viruses analyzed are not "known contaminating viruses", but viruses used experimentally (VSV, IIV6, CrPV). I suggest adjusting the phrasing.

      Done.

      (24) Line 862: weaker fitness > lower fitness.

      Done.

      (25) Virology terms:

      (a) I suggest not using the term titer for qPCR readouts (which do not involve titration). Viral RNA level or viral RNA load would be more appropriate.

      Done.

      (b) I would propose rephrasing the Y-axis label of Figure 1C, E to Nora RNA load (same for other figures showing viral RNA).

      Done.

      (c) Infested: rather use the more accurate term infected.

      Done.

      (d) Contamination: rather use the term infection.

      We have modified some but not all occurrences of this word. We believe that it is important to use the word contamination when referring to enterocytes: the enterocytes are not infected by Nora; rather, differentiated infected ISCs become contaminated enterocytes. Infection refers to an active process whereas contamination refers to a state.

      (e) Proliferation: rather use the term replication.

      According to our US-English dictionary, proliferation refers to the “rapid reproduction of a cell, part, or organism”, which is the meaning we intend. Replication does not have this notion of speed of reproduction.

      (f) Drosophila should not be italicized in Drosophila A virus, following the ICTV convention that a "virus name should never be italicized, even when it includes the name of a host species or genus" https://ictv.global/faq/names.

      Done.

      (26) Line 873-975: please rephrase the legend of Figure 1F as the current one is not informative.

      Done.

      (27) Line 934: I suggest moving the justification of the time point chosen "= LT50 on the survival test in 935 Fig. 2E" to the main text.

      Done.

      (28) Line 936: with drop > with a drop.

      No longer relevant.

      (29) Line 940-941: the grammar of the sentence does not seem to be correct as it suggests that SDS induces Diptericin expression.

      No longer relevant.

      (30) Line 952-953; line 980: please correct mismatch singular/plural (antibody have, inhibition do).

      Done.

      (31) Line 422: "It will be interesting to determine whether the absence of a Dcr2 fluorescent proteins fusions in progenitor cells that we report in this study rules out a role for the RNAi pathway in intestinal host defense against the Nora virus". It would be of interest to discuss this finding in the context that virus-derived Nora virus siRNAs can be easily detected and that the viruses encode an RNAi antagonist (doi: 10.1371/journal.ppat.1002872).

      Done. We have updated the Discussion and propose a model whereby RNAi would prevent primary infection of enterocytes and then virus replication in proliferating progenitor cells would allow the virus to effectively inhibit the RNAi machinery when the infected progenitor cells become enterocytes.

      (32) Line 159: Nora virus phenotypes differ between laboratories. I would be interested to read the authors' speculations on why this would be the case.

      Our work shows that the effects of Nora virus depend significantly on several parameters we have identified: nutrition quality, age, exposure to abiotic or biotic stresses, and fly genotypes with the existence of Nora-refractory strains. These parameters as well as potential differences between laboratories are actually discussed in the second paragraph of the Discussion.

      (32) Line 175: capitalization of ORE-R vs Ore-R at other places in the manuscript.

      Done.

      (33) Line 185-194: PA14 and Pseudomonas are used interchangeably. Perhaps it is clearer to stick to a single term for consistency.

      PA14 is one clinical strain used to study P. aeruginosa. There are many others such as PAO1, which is also widely used. We have decided to write P. aeruginosa PA14 the first time we are using it in each figure legend, and use only PA14 afterwards.

      Reviewer #3 (Public review):

      The claim that Dcr2 is not abundant in ISCs because the protein is not stable is logically consistent and reasonable. Perhaps I missed this, but the authors could additionally knock down or use somatic CRISPR to delete Dcr2 in ISCs to test whether a lack of Dcr2 underlies sensitivity. In this experiment, the expectation would be that depleting Dcr2 in ISCs genetically would make little difference to susceptibility overall compared to controls. This is not an essential experiment request.

      We agree with the reviewer that these would be interesting experiments to perform. However, we are currently unable to perform additional experiments and leave it to other interested investigators studying antiviral innate immunity to address these questions dealing with the specific steps of RNA interference that may be missing in progenitor cells.

      Recommendations for the authors:

      (1) Line 206-207 and 214-216: the order of ideas presented here is unintuitive. In Lines 206207, it is said that ABX treatment had no effect, which is counterintuitive to the nature of infection susceptibility. But this is resolved in Lines 214-216 when the reader realizes that S3G is fed on a sucrose solution, and so likely microbiota-depleted. Perhaps more could be said to clarify this in the main text, and/or swap the order of these observations so a casual reader is not confused about the nature and extent of the microbiota contributing to the sensitivity of Nora-infected flies.

      As suggested by the reviewer, we have clarified the text with respect to the food source and microbiota load; we emphasize that the microbiota plays a protective role in Nora-negative flies fed on sucrose solution even though the microbiota load is very low under these conditions. Of note, the microbiota is not depleted in sucrose-fed Nora-positive flies: we suspect that delaminating enterocytes may actually provide directly or more likely indirectly (peritrophic matrix) nutrients for the microbiota.

      (2) Line 262-265: the text may be a bit exaggerated given only 3 pathogens tested, one of which was a fungal natural infection breaching the cuticle and largely bypassing the gut. This could be re-phrased.

      The important point is that uninfected Nora-positive flies die with a LT50 of about 10 days even when noninfected; it has nothing to do with the number of pathogens tested. Thus, any infection that causes death with kinetics in this range may be misinterpreted in the absence of a relevant uninjured or clean injury control.

      (3) Line 379-382: I don't know if citing Schissel et al. is needed here. This paper's methods and data are highly problematic, as mentioned by the authors. This is not a highly cited paper, nor does it add value to the present discussion to cite it only to discredit it. Perhaps this can be left out and the field can move on quietly - naturally, this choice is the present authors', and this is just my view.

      We have actually cited this article at two other places and thus had not cited it “only to discredit it”. We have nevertheless removed the lines as suggested by the reviewer.

      (4) Line 404: perhaps clarify "Interestingly, mammalian stem cells..."

      Done.

      (5) Line 455: my understanding of digital PCR is that it is highly useful for detecting rare variants but not particularly better than qPCR for estimating loads/titres? This is not to say dPCR is worse, just that dPCR and primer-specific RT + qPCR are comparable if load/titre is desired. For instance, Qiagen actually recommends qPCR over dPCR specifically (and pretty much exclusively) for gene expression: https://www.qiagen.com/us/applications/digitalpcr/beginners/dpcr-vs-qpcr.

      (6) Perhaps Line 455 could drop the advocacy for digital PCR? I agree using dissected guts, or seemingly aged individuals per Figure 3B(?), is a valuable thing to point out. Maybe the aged individuals point could be added here? I guess the idea behind dissected guts is to have samples enriched in Nora virus.

      Cleaning Nora-positive strains is really difficult and we suspect that as long as there is one viral particle left, it may be sufficient to re-ignite the contamination of the strain. Our own experience with digital PCR on the expression of AMP-like molecules in the head of flies is that we found the approach to be more sensitive than classical RTqPCR (Xu et al., EMBO Rep, 2023).

    1. Author Response:

      (1) Clarification of the distinction between resting-state trait measures and ongoing neural dynamics

      All the Reviewers commented that this study provides a useful characterization of the relationship between trait-based resting-state neural dynamics and behavioral measures. At the same time, we agree that including ongoing EEG dynamics during task performance would have added important complementary information. In particular, task-related EEG would allow a more direct characterization of the relationship between ongoing neural activity and behavioral indices at the single trial level, thereby helping to clarify the role of ongoing neural dynamics in evidence accumulation and perceptual decision-making. It would also enable testing how pre-stimulus alpha oscillations and aperiodic activity dynamically influence temporal integration, serial dependence, and confidence on a trial-by-trial basis.

      However, we would like to emphasize that the primary aim of the present study was to investigate trait-level resting-state neural dynamics, which are known to be relatively stable and consistent within individuals, such as individual alpha frequency (e.g., Grandy et al., 2013; Wiesman & Wilson, 2019; Gray & Emmanouil, 2020) and aperiodic neural dynamics (Demuru and Fraschini, 2020; Pathania et al., 2021; Euler et al., 2024), and to examine whether these stable neural characteristics predict behavioral measures indexing temporal perception. Accordingly, the present study was designed to address how stable individual differences in resting-state neural dynamics shape temporal performance, rather than within-task neural fluctuations during the temporal task. We agree that combining resting-state and task-related EEG would be a valuable direction for future work, but this lies beyond the scope of the current dataset, as EEG was not recorded during task performance. Furthermore, we agree with the Reviewers that some of the wording in the Discussion can be clarified to emphasize the trait-level, rather than trial-level, nature of the task and potential interpretations.

      Additionally, we agree that the relationship between eyes-open (EO) and eyes-closed (EC) resting-state EEG, and their differential associations with behavior, warrants further discussion. In our data, EO resting-state activity emerged as a stronger predictor of behavioral performance than EC. Conceptually, resting-state EO and EC should not be considered interchangeable measures of the same underlying neural activity, but rather as related yet distinct brain states, with overlapping neural generators expressed under different state constraints. EC is typically associated with stronger posterior alpha activity and a more internally oriented mode, whereas EO reflects a more visually engaged and vigilant state, closer to the conditions under which perceptual judgments are formed. This may explain why, in our findings, brain–behavior associations are more evident in EO, consistent with the greater similarity between the EO condition and the task context. In this sense, EO may emphasize exteroceptive processing and visual readiness, whereas EC reflects a more internally oriented configuration. This difference in functional weighting could account for the stronger behavioral correlations observed in EO in the present study. The distinction between these resting states has been emphasized in previous EEG and neuroimaging work showing differences in power, topography, and large-scale network organization (e.g., Marx et al., 2004). Additionally, these state-related differences may reflect physiological changes related to sensory processing (El Boustani et al., 2009) and arousal (Lendner et al., 2020). Accordingly, the present dissociation may arise because EO provides a resting-state measure that is more proximal to the sensory and excitability conditions engaged during task performance (for similar findings, see also Deodato and Melcher, 2024). However, we agree with the reviewers that further clarification of these state-related differences is warranted. In the revised manuscript, we will (i) expand the Discussion to more clearly articulate the conceptual distinction between EO and EC and their expected links to perceptual and confidence measures, (ii) systematically describe EO–EC differences across all EEG measures analyzed, and (iii) quantify the relationship between EO and EC indices to directly assess the extent to which they share trait-like variance across individuals.

      In the revised manuscript, we will clarify these points by adjusting the text, strengthening the conceptual framing, and expanding the Discussion, including a more detailed outline of future research directions.

      (2) Functional interpretation of psychometric measures

      The Reviewers raised an important point regarding the interpretation of the psychometric parameters investigated in our study. In particular, we agree that the slope of a binary psychometric function does not provide a direct measure of sensory temporal resolution or perceptual sensitivity, and that our original wording may have overstated this interpretation. Rather, the slope reflects the steepness of the transition between response categories and indexes overall behavioural variability, which can arise from multiple sources, including variability in sensory encoding, decision criteria, and occasional response errors (e.g., Wichmann and Hill 2001; Prins 2012).

      We therefore agree that interpreting steeper slopes as necessarily reflecting “temporal precision” may be overly specific, and that there are other possible interpretations. In the revised manuscript, we will adopt more cautious terminology and describe the slope more generally as indexing behavioral variability in the transition between perceptual reports, which may reflect a combination of sensory and decisional factors. Importantly, our results demonstrate robust relationships between neural measures and the consistency or sharpness of perceptual categorization, rather than uniquely isolating sensory temporal resolution. While, in standard psychophysical frameworks, the slope is related to internal variability in the sensory representation, this relationship depends on model assumptions and does not uniquely isolate sensory precision (e.g., Prins, 2016). Following the reviewers’ suggestion, we will also refine our psychometric modeling by incorporating a lapse parameter. We agree with the Reviewer that accounting for occasional stimulus-independent errors (e.g., lapses) can improve parameter estimation and prevent biases in slope and threshold estimates when lapse rates are implicitly fixed to zero (Wichmann & Hill, 2001). In the revised manuscript, we will therefore (i) clarify the terminology used to describe psychometric parameters and (ii) report additional analyses including lapse rates.

      In addition, we agree that complementary modeling approaches could help disentangle perceptual and decisional contributions to the observed effects by providing access to latent parameters of perceptual decision-making. For example, within a signal detection framework, one could test whether EEG measures relate to perceptual sensitivity versus decision criterion, while sequential sampling models such as the diffusion model (e.g., Ratcliff and McKoon, 2008) could assess whether neural measures are associated with parameters such as drift rate, decision boundary, starting bias, or trial-to-trial variability. However, several characteristics of the present paradigm limit the direct applicability of these approaches. First, the task relies on a continuous manipulation of sensory evidence across stimulus durations (ISIs), and behavioral responses are summarized through psychometric functions rather than modeled at the single-trial level. As a result, the current framework does not provide direct access to trial-by-trial latent decision variables required by these models. Second, reaction times were not collected, which constrains the application of sequential sampling models that rely on joint modeling of accuracy and response times. Finally, while the task involves categorical judgments (integration vs. segregation), it does not include explicit signal-absent or catch trials, which can help constrain sensitivity and criterion estimates within classical signal detection formulations. Despite these limitations, we agree that these approaches could still provide useful insights. In the revised manuscript, we will explore whether alternative modeling approaches (e.g., signal detection-based metrics or Bayesian psychometric modeling) can help further characterize the contributions of perceptual sensitivity, decision criterion, and response variability to our behavioral measures. While these analyses will necessarily remain exploratory given the structure of the current dataset, they may provide initial insights into whether the observed effects reflect perceptual or decisional dynamics. A more definitive dissociation, however, is beyond the scope of the present study and will be an important direction for future work.

      (3) Control analyses and robustness of EEG–behavior relationships

      The Reviewers raised interesting points regarding the interpretation of our control analyses and the potential influence of stimulus structure on the observed EEG–behavior relationships. We agree that these aspects require clarification and additional analyses to strengthen the robustness of our findings.

      First, regarding the control analyses across frequency bands, we acknowledge that while our main analyses appropriately dissociate oscillatory and aperiodic components using spectral parameterization, the control analyses were based on conventional band-power measures. As correctly noted by the reviewers, band-limited power estimates can be influenced by the aperiodic background, which complicates the interpretation of null effects in the other frequency bands. In the revised manuscript, we will address this issue by extending our spectral parameterization approach to these control analyses. Specifically, we will recompute band-specific measures after removing the aperiodic component, allowing a clearer comparison across frequency bands and a more robust assessment of the specificity of alpha-related effects. Preliminary analyses suggest that these updated results are likely to be consistent with our initial findings, thereby reinforcing the robustness of the reported effects.

      Another important point raised by the reviewers concerns the temporal structure of the stimulus stream. We agree that the continuous alternation of Gabor stimuli at varying durations introduces quasi-periodic stimulation rates that may induce entrainment of neural oscillations. Notably, some inter-stimulus intervals correspond to frequencies within the alpha range, which raises the possibility that the observed relationship between resting alpha frequency and integration thresholds may not solely reflect intrinsic sampling speed, but could also be influenced by the degree of alignment between an individual’s alpha rhythm and the temporal structure of the stimulus. As highlighted in prior work (e.g., Gulbinaite et al., 2017; Keitel et al., 2019; Gallina et al., 2023; Duecker et al., 2024), rhythmic stimulation in the alpha range can interact with intrinsic alpha oscillations and modulate both neural and perceptual processing. Although our study does not include EEG recordings during task performance and therefore cannot directly assess stimulus-locked responses or neural entrainment, we agree that this factor should be explicitly considered in the interpretation of our findings. To address this point, in the revised manuscript we will perform additional control analyses to assess the robustness of the observed relationships while accounting for potential rhythmic stimulation confounds. Specifically, we will explore whether the strength of behavioral effects and their relationship with EEG measures depends on the alignment between each participant’s individual alpha frequency and the effective stimulation rate induced by the stimulus presentation. In addition, we will test whether the association between resting-state alpha frequency and behavioral measures is disproportionately driven by stimulus durations corresponding to alpha-range temporal frequencies. These analyses will help determine whether the observed effects primarily reflect intrinsic sampling properties or are modulated by resonance-like interactions between endogenous rhythms and stimulus timing. We will also address all additional recommendations raised by the reviewers in the revised manuscript.

      References

      Demuru, M., & Fraschini, M. (2020). EEG fingerprinting: Subject-specific signature based on the aperiodic component of power spectrum. Computers in Biology and Medicine, 120, 103748.

      Deodato, M., & Melcher, D. (2024). Correlations between visual temporal resolution and individual alpha peak frequency: Evidence that internal and measurement noise drive null findings. Journal of Cognitive Neuroscience, 36(4), 590-601.

      Duecker, K., Doelling, K. B., Breska, A., Coffey, E. B., Sivarao, D. V., & Zoefel, B. (2024). Challenges and Approaches in the Study of Neural Entrainment. Journal of Neuroscience, 44(40).

      El Boustani, S., Marre, O., Béhuret, S., Baudot, P., Yger, P., Bal, T., ... & Frégnac, Y. (2009). Network-state modulation of power-law frequency-scaling in visual cortical neurons. PLoS computational biology, 5(9), e1000519.

      Euler, M. J., Vehar, J. V., Guevara, J. E., Geiger, A. R., Deboeck, P. R., & Lohse, K. R. (2024). Associations between the resting EEG aperiodic slope and broad domains of cognitive ability. Psychophysiology, 61(6), e14543.

      Gallina, J., Marsicano, G., Romei, V., & Bertini, C. (2023). Electrophysiological and Behavioral Effects of Alpha-Band Sensory Entrainment: Neural Mechanisms and Clinical Applications. Biomedicines, 11(5), 1399.

      Grandy, T. H., Werkle‐Bergner, M., Chicherio, C., Schmiedek, F., Lövdén, M., & Lindenberger, U. (2013). Peak individual alpha frequency qualifies as a stable neurophysiological trait marker in healthy younger and older adults. Psychophysiology, 50(6), 570-582.

      Gray, M. J., & Emmanouil, T. A. (2020). Individual alpha frequency increases during a task but is unchanged by alpha‐band flicker. Psychophysiology, 57(2), e13480.

      Gulbinaite, R., Van Viegen, T., Wieling, M., Cohen, M. X., & VanRullen, R. (2017). Individual alpha peak frequency predicts 10 Hz flicker effects on selective attention. Journal of Neuroscience, 37(42), 10173-10184.

      Keitel, C., Keitel, A., Benwell, C. S., Daube, C., Thut, G., & Gross, J. (2019). Stimulus-driven brain rhythms within the alpha band: The attentional-modulation conundrum. Journal of Neuroscience, 39(16), 3119-3129.

      Lendner, J. D., Helfrich, R. F., Mander, B. A., Romundstad, L., Lin, J. J., Walker, M. P., ... & Knight, R. T. (2020). An electrophysiological marker of arousal level in humans. elife, 9, e55092.

      Marx, E., Deutschländer, A., Stephan, T., Dieterich, M., Wiesmann, M., & Brandt, T. (2004). Eyes open and eyes closed as rest conditions: impact on brain activation patterns. Neuroimage, 21(4), 1818-1824.

      Pathania, A., Euler, M. J., Clark, M., Cowan, R. L., Duff, K., & Lohse, K. R. (2022). Resting EEG spectral slopes are associated with age-related differences in information processing speed. Biological Psychology, 168, 108261.

      Prins, N. (2012). The psychometric function: The lapse rate revisited. Journal of Vision, 12(6), 25-25.

      Prins, N. (2016). Psychophysics: a practical introduction. Academic Press.

      Ratcliff, R., & McKoon, G. (2008). The diffusion decision model: theory and data for two-choice decision tasks. Neural computation, 20(4), 873-922.

      Wichmann, F. A., & Hill, N. J. (2001). The psychometric function: I. Fitting, sampling, and goodness of fit. Perception & psychophysics, 63(8), 1293-1313.

      Wiesman, A. I., & Wilson, T. W. (2019). Alpha frequency entrainment reduces the effect of visual distractors. Journal of cognitive neuroscience, 31(9), 1392-1403.

    1. A frequent alteration was to replace the longitudinal, east-west axis o f the rectangularplan o f a Gothic building by an emphasis on the short, north-south axis, by placing anelaborate pulpit in the middle o f the north wall and orientating the fixed seating to focusupon it, as in the Dordrecht church illustrated in figure 3.5. The Gothic chevet o f theformerly Roman Catholic church was either filled with seating or largely ignored, thefixed altar removed. Examples o f churches where this took place include Tzum,Buitenpost, and Huizinge.133 Larger buildings were sometimes subdivided or partsdemolished to create suitably centralised plans. On the exterior. Gothic stone mullionedlancet windows might be removed and replaced by Classicising round-headed windows,made in wood and painted white. The change demonstrated the replacement o f medievalRoman Catholicism by the Classicism o f the Early Church, representing modern,reformed Protestant Calvinism that could be recognised and understood without anyknowledge o f architectural theor

      Repurposing of buildings!

    2. The mechanism o f the transfer o f architectural ideas from the rural vernacular to chapelsgiven by Jones is that the experience o f early congregations o f meeting in bams andcottages, either because of persecution or lack o f funds to build a chapel, later influencedthe form o f their chapels when they came to build them.

      But, it was not just these rual style chapels that were built, and increasingly we see the gothic adopted, especially in urban areas

    3. ostly in the ancient churches inthe rural areas, whilst Nonconformity could accommodate 73.8% o f the population.25This was a pattern that was repeated, though not to such an extreme, in other areas whererapid industrialisation had led to urbanisation in previously sparsely populated areas,rendering inadequate the provision o f Anglican parish churches. This reasoning has beenused to support the theory that it was the lack o f provision by the Anglican Church thatlead to a rapid increase in the increase in the numbers o f Dissenters. Again, this serves tocriticise the Anglican Church whilst emphasising the differences between it and Dissentand Nonconformity.

      Interesting! Good statistics and shows how dissenting churches adopted the gothic design!

    Annotators

    1. Mary E Sesto, Curtis B Irwin, Karen B Chen, Amrish O Chourasia, and Douglas A Wiegmann. 2012. Effect of touch screen button size and spacing on touch characteristics of users with and without disabilities. Human Factors: The Journal of the Human Factors and Ergonomics Society 54, 3 (2012), 425–436.

      any bibliographic entry relating to older adults

  4. www.planalto.gov.br www.planalto.gov.br
    1. no

      Art. 167. São vedados: (Regra de Ouro)

      [...]

      III - a realização de operações de créditos que excedam o montante das despesas de <u>capital</u>, ressalvadas as autorizadas mediante créditos suplementares ou especiais com finalidade precisa, aprovados pelo Poder Legislativo por maioria absoluta;

      Ou seja, pelo texto constitucional, é proibido a contratação de operação de crédito que ultrapasse o total de despesa de capital.


      • Informativo 1051
      • ADI 5683 / RJ
      • Órgão julgador: Tribunal Pleno
      • Relator(a): Min. LUÍS ROBERTO BARROSO
      • Julgamento: 20/04/2022 (Virtual)
      • Ramo do Direito: Constitucional, Administrativo, Financeiro
      • Matéria: Processo Legislativo; Privatização; Serviços Públicos; Finanças Públicas

      Processo legislativo para a autorização de alienação de ações de empresa estatal e obtenção de crédito para o custeio de despesas correntes de estado-membro

      Resumo - Não podem ser realizadas junto a instituições financeiras <u>estatais</u> operações financeiras com a finalidade de obtenção de crédito para pagamento de pessoal ativo, inativo e pensionista, dos estados, do Distrito Federal e dos municípios.

      • Observa-se que a “regra de ouro” das finanças públicas versada no art. 167, III, da CF/1988 (1), segundo a qual o ente público não deve se endividar mais que o necessário para realizar suas despesas de capital, não impede a contratação de operações de crédito para o custeio de despesas correntes. O estado pode financiar suas despesas de capital mediante receitas de operações de crédito, desde que estas não excedam o montante das despesas de capital. Isso deverá ser observado pelo chefe do Poder Executivo quando fizer a operação financeira autorizada por lei.

      • Ademais, o art. 167, X, da CF (2) não proíbe a concessão de empréstimos para pagamento de pessoal. O dispositivo veda, contudo, que os empréstimos realizados junto a instituições financeiras dos governos federal e estaduais sejam utilizados para aquele fim. Impede-se, portanto, a alocação das receitas obtidas com instituições financeiras estatais para o custeio de pessoal ativo e inativo. Por oportuno, nada impede a realização de empréstimos com instituições financeiras <u>privadas</u> para pagamento de despesas com pessoal, porquanto a proibição não as alcança.

      • Por fim, sob o aspecto formal, em especial sobre eventual desrespeito ao devido processo legislativo, a norma estadual impugnada não possui qualquer vício a comprometer sua constitucionalidade.

      • No caso, o Estado do Rio de Janeiro aprovou lei ordinária que autoriza o Poder Executivo a alienar ações representativas do capital social da Companhia Estadual de Águas e Esgotos – CEDAE, como meio de garantia para obtenção de empréstimo para o pagamento da folha dos servidores ativos, inativos e pensionistas.

      • Com esses entendimentos, o Plenário, por maioria, confirmando a medida cautelar concedida, julgou parcialmente procedente pedido formulado em ação direta de inconstitucionalidade para dar interpretação conforme à CF/1988 ao art. 2º, § 2º, da Lei 7.529/2017 do Estado do Rio de Janeiro. Vencido o ministro André Mendonça.

    1. "Parece simples. Mas é uma daquelas coisas que depois que você tem, não consegue imaginar a casa sem." Se o cliente parecer surpreso ou não conhecer aspiração central: Explore mais: 'É um dos itens menos visíveis do projeto, mas um dos mais impactantes no dia a dia.' Não entre em especificações técnicas — fique no benefício.

      Não trazer o cliente para os fundos da empresa para mostrar onde fica o motor. O ambiente não condiz com o showroom e também pode pegar algum colaborador desprevinido.

    2. ▸ PELÍCULA INTELIGENTE [ Aponte para o vidro da sala ] "Agora, imagine que essa reunião é confidencial." [ Pressione e segure a tecla. A película fica opaca. ] "Um toque longo. Privacidade total. Sem cortina, sem perstore, sem obra." [ Pausa para impacto. ] "E quando acabar a reunião:" [ Pressione novamente. A película volta ao transparente. ] "Tudo integrado. Tudo numa tecla."

      Vamos continuar falando da película mesmo não querendo mais vender? se sim, não é importante adicionar essa observação no roteiro? porque é um ponto que brilha os olhos das pessoas e não ter vai gerar frustraçao.

    3. Se ele parecer muito técnico e falar em marcas/especificações: Validamos o conhecimento dele, mas redirecionamos: 'A gente vai falar sobre isso, mas primeiro quero te mostrar o que faz sentido sentir.'

      Acho péssimo essas frases que tão toda hora querendo ir pro inspiracional. Parece forçado.

    4. Se ele mencionar experiência ruim com automação anterior: Dizemos: 'Isso acontece muito. A diferença nossa é a filosofia de implantação — você vai entender isso agora na prática.'

      Não falar mal sobre outras empresas e outros tipos de automação quando o cliente começar a puxar isso. Dá a sensação de falta de profissionalismo.

    1. Cada sistema que instalamos vai estar presente no café da manhã de domingo da família, nas festas de aniversário, nas reuniões com amigos no espaço gourmet, nos momentos em que a família curte o que conquistou. Nós somos parte dos momentos mais especiais da vida das pessoas — e isso nos dá uma responsabilidade enorme. Essa responsabilidade é enorme. E nós a abraçamos com orgulho.

      acho repetitivo, eu tiraria essa parte toda.

    2. A Meraki nasceu de uma ideia simples, mas profunda: fazer as coisas com alma. Desde o primeiro dia, a nossa missão foi construir uma empresa onde cada cliente fosse tratado como o bem mais precioso que temos. Uma empresa onde cada colaborador levantasse de manhã feliz de ir trabalhar — apaixonado pelo que faz, orgulhoso do lugar onde está. Não é fácil. Nada que vale a pena é fácil. Mas ao longo dos nossos projetos, com quase 50 clientes e 100% de satisfação, nós provamos que esse padrão é possível. E é exatamente isso que este documento representa: o compromisso de manter esse padrão vivo, independentemente de quantas pessoas integrarem o nosso time. Este não é um documento de regras. É um espelho. É o que somos, o que acreditamos e o que nunca abriremos mão — mesmo que custe um cliente ou um projeto. A Meraki é uma empresa jovem. Como toda empresa em crescimento, enfrentamos desafios reais — e continuaremos enfrentando. Não vamos fingir que não existem. Mas este não é o lugar para falar sobre eles, porque aqui o que importa é como respondemos: com determinação, com trabalho honesto e com os valores que estão escritos nestas páginas.

      A Meraki nasceu de uma ideia simples, mas profunda: fazer as coisas com alma.

      Desde o primeiro dia, nossa missão foi construir uma empresa onde cada cliente fosse tratado como o bem mais precioso que temos. Um lugar onde cada colaborador acorde com vontade de trabalhar, apaixonado pelo que faz e orgulhoso de onde está.

      Não é fácil. Nada que realmente vale a pena é. Mas, ao longo dos nossos projetos, com quase 50 clientes e 100% de satisfação, provamos que esse padrão é possível. É exatamente isso que este documento representa: o compromisso de mantê-lo vivo, independentemente de quantas pessoas integrem o nosso time.

      Este não é um documento de regras. É um espelho. Reflete o que somos, no que acreditamos e aquilo de que nunca abriremos mão, mesmo que isso custe um cliente ou um projeto.

      A Meraki é uma empresa jovem. Como toda empresa em crescimento, enfrentamos desafios reais e continuaremos enfrentando. Não vamos ignorá-los. Mas este não é o espaço para detalhá-los. Aqui, o que importa é como respondemos: com determinação, trabalho honesto e os valores que guiam cada uma das nossas decisões.

    3. Ao integrar a equipe da Meraki Automação, você não está apenas assumindo um cargo. Você está abraçando um jeito de ser. Este documento não substitui seu contrato de trabalho. Mas representa algo mais importante: o contrato moral que nos une como time. O compromisso de que, independentemente do dia, do projeto ou da dificuldade, vamos sempre fazer o que é certo.

      Ao integrar a equipe da Meraki Automação, você não está apenas assumindo um cargo. Está abraçando uma forma de pensar, agir e se posicionar.

      Este documento não substitui o seu contrato de trabalho. Representa algo mais profundo: o compromisso que nos une como time.

      Independentemente do dia, do projeto ou da dificuldade, fazemos o que é certo.

    4. A Meraki é generosa com erros de quem está aprendendo. Mas é intransigente com comportamentos que ferem os nossos valores. As seguintes situações são consideradas gravíssimas e podem resultar em desligamento imediato: Qualquer forma de desrespeito ao cliente — resposta ríspida, descaso, ignorar mensagens, deixar sem retorno. Desonestidade com clientes, colegas ou a empresa — mentiras sobre prazos, produtos, custos ou problemas. Falta grave de comprometimento — não entregar o que prometeu, desaparecer sem aviso, negligenciar responsabilidades. Maltratar qualquer pessoa no ambiente de trabalho, independentemente do cargo ou função. Reagir agressivamente ou com grosseria a situações de pressão ou conflito. Comprometer a imagem da Meraki com clientes, parceiros ou no ambiente público, incluindo redes sociais.

      A Meraki é generosa com erros de quem está em processo de aprendizado. Mas é intransigente com comportamentos que ferem os nossos valores.

      As situações abaixo são consideradas gravíssimas e podem resultar em desligamento imediato:

      Qualquer forma de desrespeito ao cliente, incluindo respostas ríspidas, descaso, falta de retorno ou negligência no atendimento.

      Desonestidade com clientes, colegas ou com a empresa, como omissões ou informações incorretas sobre prazos, produtos, custos ou problemas.

      Falta de comprometimento, evidenciada por não cumprir o que foi acordado, ausentar-se sem comunicação ou negligenciar responsabilidades.

      Tratar qualquer pessoa com desrespeito no ambiente de trabalho, independentemente do cargo ou função.

      Reagir com agressividade ou falta de controle em situações de pressão ou conflito.

      Comprometer a imagem da Meraki perante clientes, parceiros ou em ambientes públicos, incluindo redes sociais.

    5. O que acontece dentro da Meraki define o que o cliente percebe lá fora. Times que se respeitam, comunicam bem e apoiam uns aos outros entregam projetos melhores. Sempre. Tratamos cada colega com o mesmo respeito que damos ao nosso melhor cliente. Compartilhamos conhecimento. Aqui não existe "meu segredo profissional". Quando alguém erra, ajudamos a corrigir — sem julgamento, sem constrangimento. Quando alguém entrega bem, reconhecemos. Em público. Sem economia. Problemas internos são resolvidos internamente, com maturidade e diálogo direto. Pedimos ajuda quando precisamos. Não existe fraqueza em reconhecer um limite.

      O que acontece dentro da Meraki define o que o cliente percebe lá fora.

      Times que se respeitam, se comunicam com clareza e se apoiam entregam projetos melhores. Sempre.

      Tratamos cada colega com o mesmo respeito que dedicamos ao nosso melhor cliente.

      Compartilhamos conhecimento com abertura. Aqui, não existem segredos individuais, apenas evolução coletiva.

      Quando alguém erra, apoiamos a correção com respeito e responsabilidade.

      Quando alguém entrega bem, reconhecemos com clareza e sem reservas.

      Problemas internos são resolvidos com maturidade, diálogo direto e senso de responsabilidade.

      Pedimos ajuda quando necessário. Reconhecer limites faz parte de quem busca excelência.

    6. Recebe o cliente como se ele fosse o único cliente que temos. Faz o cliente se sentir especial, cuidado e bem-vindo desde o primeiro segundo. Antecipa necessidades. Não espera o cliente pedir — percebe e age. Cuida de cada detalhe: pontualidade, aparência, comunicação e ambiente.

      Recebe cada cliente com a atenção de quem entende que aquele momento é único.

      Faz com que se sinta genuinamente bem-vindo, cuidado e valorizado desde o primeiro contato.

      Antecipa necessidades, percebe antes de ser solicitado e age com naturalidade.

      Cuida de cada detalhe, da pontualidade à aparência, da comunicação ao ambiente.

    7. Como Especialista Ouve mais do que fala. Entende o projeto antes de propor soluções. Fala com autoridade técnica, mas em linguagem que o cliente entende. Não empurra nada. Ajuda o cliente a escolher a solução certa para ele. Conhece profundamente o que oferece. Estudamos continuamente.

      Ouve mais do que fala e compreende o projeto antes de propor qualquer solução.

      Se comunica com autoridade técnica, em uma linguagem clara e acessível ao cliente.

      Não impõe escolhas. Orienta com critério, ajudando o cliente a chegar à melhor decisão.

      Domina o que oferece e está em constante evolução. O estudo contínuo faz parte do nosso padrão.

    8. Na Meraki, não se pede reconhecimento. Não se pede aumento. Não se pede promoção. O caminho é outro: você surpreende, cria, vai além do que foi contratado e além do que foi solicitado. Quando você faz isso, a Meraki nota — e age. A empresa quer melhorar a vida de todos que estão com ela, e fica muito feliz em promover e reconhecer quem merece.

      Na Meraki, reconhecimento não se pede. Ele é construído.

      O caminho é outro: surpreender, criar e ir além do que foi contratado e do que foi solicitado.

      Quando isso acontece, a Meraki reconhece e age. Queremos melhorar a vida de todos que caminham conosco e valorizamos, com consistência, aqueles que se destacam.

    9. Não existe jeito certo de fazer algo errado. Errado é errado. Certo é certo. A Meraki só faz as coisas do jeito certo. E quando você olha para o que fez e ainda pergunta "será que está bom?" — pode ter certeza: não está. Quando você faz algo realmente bom, você simplesmente olha, admira e se dá os parabéns. Você não pergunta.

      Não existe forma certa de fazer o que está errado. Errado é errado. Certo é certo.

      Na Meraki, fazemos sempre do jeito certo.

      Se, ao olhar para o que foi feito, ainda existe dúvida, é porque não está no padrão que buscamos. Quando algo está realmente bom, isso é evidente. Não exige validação.

    10. O problema pode não ter sido causado por nós. Mas a responsabilidade de resolver é nossa. Se o marceneiro errou e isso impacta o nosso projeto e o nosso cliente, nós ajudamos a resolver — sem reclamar, sem resmungar, sem procurar culpados. A Meraki é uma empresa que resolve.

      O problema pode não ter sido causado por nós, mas a responsabilidade de resolver é nossa.

      Se um erro de terceiros impacta o nosso projeto ou o nosso cliente, assumimos a frente e conduzimos a solução, sem reclamações, sem ruídos e sem buscar culpados.

      A Meraki é uma empresa que resolve.

    11. Na Meraki, ninguém maltrata ninguém. Do auxiliar de pedreiro ao arquiteto, do estagiário ao diretor, do cliente ao parceiro — todos merecem e recebem o mesmo respeito. Comportamento negativo gera ação corretiva, não reação negativa. Reagir mal é sinal de imaturidade. Resolver com elegância é o nosso padrão.

      Na Meraki, respeito não é opcional. É padrão.

      Do auxiliar de obra ao arquiteto, do estagiário ao diretor, do cliente ao parceiro, todos são tratados com o mesmo nível de consideração.

      Comportamentos inadequados são tratados com postura e responsabilidade, nunca com reações impulsivas. Perder o controle é falta de maturidade. Resolver com elegância é o que nos define.

    12. A verdade nem sempre é confortável de dizer. Mas é sempre o melhor caminho. Com clientes, com colegas, com parceiros e com sócios: falamos a verdade, assumimos os erros e não escondemos problemas. Uma mentira dita hoje pode custar muito mais amanhã.

      A verdade nem sempre é confortável, mas é sempre o melhor caminho. Com clientes, colegas, parceiros e sócios, falamos com transparência, assumimos erros e não escondemos problemas. Uma mentira dita hoje pode custar muito mais amanhã.

    13. O Cliente é o Nosso Bem Mais Precioso O cliente está no centro de tudo que fazemos. Desde o primeiro contato até a entrega final, cada interação deve ser tratada com o mesmo cuidado de quem recebe uma pessoa especial em casa. Temos hoje quase 50 clientes e 100% de satisfação — e isso não é coincidência. É compromisso.

      O cliente está no centro de tudo o que fazemos. Do primeiro contato à entrega final, cada interação deve ser conduzida com o cuidado de quem recebe alguém especial em casa. Hoje, somamos quase 50 clientes e 100% de satisfação. Isso não é coincidência. É compromisso.

    14. A Meraki atua no mercado de controlar experiências residenciais e corporativas — com foco em integração completa de áudio, vídeo, iluminação, climatização, rede estruturada e serviços. Mais do que tecnologia, entregamos conforto, sofisticação e a sensação de que tudo funciona exatamente como deveria — sem esforço, sem preocupação. Isso é o que fazemos. Isso é quem somos.

      A Meraki atua no mercado de controle de experiências residenciais e corporativas, com foco na integração completa de áudio, vídeo, iluminação, climatização, rede estruturada e serviços.

      Mais do que tecnologia, entregamos conforto, sofisticação e a sensação de que tudo funciona exatamente como deveria, sem esforço e sem preocupação.

      Isso é o que fazemos. Isso é quem somos.

    1. El operón lac también se encuentra bajo control positivo,

      control negativo: es por la proteina represora que boquea la transcripcion, cuando no hay lactosa

      control positivo: es por una proteina activadora (proteina activadora por catabolito o CAP) que va a ayudar a que la arn polimerasa se acelere y transcriba mas rapido (cuaando hay glucosa baja )

    2. operón inducible, en el cual la presencia de una sustancia metabólica fundamental (en este caso la lactosa o alolactosa) induce la transcripción de genes estructurales

      necesita de una enzima para inducir a transcripcion

    3. se une a la proteína represora y (2) evita su unión al operador (O). (3) Sin el represor en la vía, la RNA polimerasa se une al promotor (P) y transcribe los genes estructurales.

      SIN EL REPRESOR ES QUE SE DA LA TRANSCRIPCION

      1. Represor se encuentra bloqueando siempre
      2. aparece la lactosa y al unirse al represor, este cambia de forma
      3. el represor se cae
      4. comienza la transcripcion
    4. Las células que forman parte de un organismo multicelular contienen un juego idéntico de genes, a pesar de obvias diferencias en cuanto a su tamaño y forma. La información genética presente en todas las células puede compararse a un archivo de planos para construir un edificio gigante de propósitos múltiples. En momentos distintos se necesitarán todos los planos, pero se consultará sólo a un grupo pequeño de ellos durante la construcción de algún piso o estancia precisos.

      aunq todas las cel tienen la misma info cada una de las celulas va a encender la parte que necesitara

    1. extends from the 3rd molar toothto the tongue frenulum

      Bu bezin ağız tabanındaki uzantısını tarif ediyor. Arkada 3. azı dişinden (yirmi yaş dişi hizasından) başlayıp, önde dil bağına (dilin altındaki o ince dikey perdeye) kadar uzandığını anlatıyor.

    2. The sublingual salivary gland opens to theplica sublingualis with rhinivus ducts.

      "Extends from the 3rd molar tooth to the tongue frenulum": Bu bezin ağız tabanındaki uzantısını tarif ediyor. Arkada 3. azı dişinden (yirmi yaş dişi hizasından) başlayıp, önde dil bağına (dilin altındaki o ince dikey perdeye) kadar uzandığını anlatıyor.

    Annotators

    1. indevidamente recebeu um imóvel

      Recebeu imóvel indevidamente: - Se há alienação de boa-fé = responde o alienante pela quantia recebida; - Se há alienação de má-fé = responde pelo valor do imóvel + perdas e danos.

    1. Author Response:

      The following is the authors’ response to the original reviews.

      eLife Assessment

      This article presents valuable findings on how the timing of cooling affects the timing of autumn bud set in European beech saplings. The study leverages extensive experimental data and provides an interesting conceptual framework of the various ways in which warming can affect bud set timing. The support for the findings is incomplete, though extra justifications of the experimental settings, clarifications of the interpretation of the results, and alternative statistical analyses can make the conclusions more robust.

      We thank the editors and reviewers for their expert assessment of our findings and their interest in our conceptual framework. Below we respond to the specific reviewer and editor comments.

      Public Reviews:

      Reviewer #1 (Public review):

      Summary:

      This study provided key experimental evidence for the "Solstice-as-PhenologySwitch Hypothesis" through two temperature manipulation experiments.

      Strengths:

      The research is data-rich, particularly in exploring the effects of pre- and postsolstice cooling, as well as daytime versus nighttime cooling, on bud set timing, showcasing significant innovation. The article is well-written, logically clear, and is likely to attract a wide readership.

      Thank you for your generous description of our study and the manuscript.

      Weaknesses:

      However, there are several issues that need to be addressed.

      (1) In Experiment 1, significant differences were observed in the impact of cooling in July versus August. July cooling induced a delay in bud set dates that was 3.5 times greater in late-leafing trees compared to early-leafing ones, while August cooling induced comparable advances in bud set timing in both early- and late-leafing trees.

      The study did not explain why the timing (July vs. August) resulted in different mechanisms. Can a link be established between phenology and photosynthetic product accumulation? Additionally, can the study differentiate between the direct warming effect and the developmental effect, and quantify their relative contributions?

      We thank the reviewer for pointing out that we could improve our explanation of the different responses to July and August cooling in experiment 1. Whilst we incorporated this in the conceptual model and the figure caption (Fig. 1b), we now also address this topic in more depth in the discussion section, focussing on daylength and photosynthetic assimilation as the possible mediators of this change in responses (L350-371).

      For the early-season development effect vs the late-season temperature effect we can use the leaf-out day-of-year (as a proxy for development), and the summer cooling treatments (direct temperature effect) to assess the relative importance of these two components of our model. We have now included a variance partitioning analysis following this logic, see L246-252 for methods, L278-281 for results.

      (2) The two experimental setups differed in photoperiod: one used a 13-hour photoperiod at approximately 4,300 lux, while the other used an ambient day length of 16 hours with a light intensity of around 6,900 lux. What criteria were used to select these conditions, and do they accurately represent real-world scenarios? Furthermore, as shown in Figure S1, significant differences in soil moisture content existed between treatments - could this have influenced the conclusions?

      This question may reflect a misunderstanding regarding the light availability that we hope to address with improved clarification. The duration and intensity of the lighting in these experiments was always set to reflect the average conditions experienced in Zurich for those respective times of the year. Day length in spring is shorter than it is in summer, so the durations were simply adjusted to reflect this reality. The 13-hour, 4,300 lux conditions in experiment 1 were only for the April-May period, when we reduced developmental rates for the late-leafing trees (L125-129). In July, the photoperiod was set to 16 hours and light intensity was approximately 7,300 lux (L150-154). This is equitable to experiment 2–when treatments were applied in June and July–where photoperiod was 16 hours and light intensity approximately 6,900 lux (L206-207). These conditions reflect the average daylengths in Zurich, and the maximum light intensity output by the chambers.

      As mentioned in our initial author response, we do not think small differences in soil moisture levels should influence our conclusions. All pots were watered sufficiently to avoid water deficit, and all efforts were made to minimise differences in water availability. A Tukey honest significant difference test showed that only one treatment pair (6 - Late_July_Extreme vs. 7 - Early_August_Moderate, difference = 6%, p < 0.05) had significantly different soil water content, a pair whose responses are not compared. We have added words to this effect in the figure legend of Fig. S1.

      (3) The authors investigated how changes in air temperature around the summer solstice affected primary growth cessation, but the summer solstice also marks an important transition in photoperiod. How can the influence of photoperiod be distinguished from the temperature effect in this context?

      We agree that photoperiod likely plays a central role. Our conceptual model (Fig. 1) explicitly incorporates photoperiod as the framework within which temperature responses are regulated (L72-75, L627-629 & L638-641). The Solstice-as-Phenology-Switch hypothesis assumes that the annual progression of daylength sets the physiological “window” for trees’ responsiveness to temperature. Our experiments therefore focused on how temperature responses differ before versus after the solstice, while recognising that this reversal is likely enabled by the photoperiod signal. In other words, photoperiod provides the regulatory backdrop, and our results identify how diel and seasonal temperature cues are interpreted within that photoperiodic framework.

      (4) The study utilized potted trees in a controlled environment, which limits the generalization of the results to natural forests. Wild trees are subject to additional variables, such as competition and precipitation. Moreover, climate differences between years (2022 vs. 2023) were not controlled. As such, the conclusions may be overgeneralized to "all temperate tree species", as the experiment only involved potted European beech seedlings. The discussion would benefit from addressing species-specific differences.

      We agree that extrapolation from our experiments on Fagus sylvatica to other species and natural forests requires caution. However, it is precisely the controlled nature of our design that allowed us to isolate the precise mechanisms that appear to underpin the solstice switch, highlighting the role of diel and seasonal temperature variation. In natural systems, additional variables such as competition, precipitation, and soil heterogeneity can strongly influence phenology, but they also make it difficult to disentangle causal mechanisms. By minimising these confounding factors, our experiment provided a clear test of how temperature before and after the solstice regulates growth cessation.

      To acknowledge the limitation, we have toned down statements about generalisation (e.g. “likely generalisable” to “other temperate tree species may display similarities”; L409-411) and explicitly call for follow-up studies across species and forest contexts (L413–414). At the same time, we highlight that our findings align with independent evidence from manipulative experiments, satellite observations, flux measurements, and ground-based phenology, which suggests the mechanisms we report may extend beyond the specific populations studied here.

      Reviewer #2 (Public review):

      In 'Developmental constraints mediate the summer solstice reversal of climate effects on European beech bud set', Rebindaine and co-authors report on two experiments on Fagus sylvatica where they manipulated temperatures of saplings between day and night and at different times of year. I enjoyed reading this paper and found it well written. I think the experiments are interesting, but I found the exact methods somewhat extreme compared to how the authors present them. Further, given that much of the experiment happened outside, I am not sure how much we can generalize from one year for each experiment, especially when conducted on one population of one species. I next expand briefly on these concerns and a few others.

      Thank you for the kind comments. We appreciate your concerns regarding the severity of our treatments and the generalisability of our results, and you can find our detailed responses below.

      Concerns:

      (1) As I read the Results, I was surprised the authors did not give more information on the methods here. For example, they refer to the 'effect of July cooling' but never say what the cooling was. Once I read the methods, I feared they were burying this as the methods feel quite extreme given the framing of the paper. The paper is framed as explaining observational results of natural systems, but the treatments are not natural for any system in Europe that I have worked in. For example, a low of 2 {degree sign}C at night and 7 {degree sign}C during the day through the end of May and then 7/13 {degree sign}C in July is extreme. I think these methods need to be clearly laid out for the reader so they can judge what to make of the experiment before they see the results.

      We understand the concern regarding the structure of the manuscript and note that the methods section was moved to the end of the paper in accordance with eLife’s recommended formatting. We have now moved the methods section before the results to ensure that readers are familiar with the treatments before encountering the outcomes.

      We recognise that our temperature treatments were severe and do not mimic real world scenarios. They were deliberately designed to create large contrasts in developmental rates, thereby maximising our ability to detect the mechanisms underpinning the solstice switch. For example, the severe cooling between 4 April and 24 May was specifically designed to slow spring development as much as possible without damaging the plants (L129-L133). We have added text in the Methods to clarify this aim (L129-131 & L156-161).

      Regarding presentation, treatment details are now described in both the Methods and the relevant figure legends. Given this structure, we have chosen not to restate the full treatment conditions in the main Results text to avoid repetition.

      (2) I also think the control is confounded with the growth chamber experience in Experiment 1. That is, the control plants never experience any time in a chamber, but all the treatments include significant time in a chamber. The authors mention how detrimental chamber time can be to saplings (indeed, they mention an aphid problem in experiment 2), so I think they need to be more upfront about this. The study is still very valuable, but again, we may need to be more cautious in how much we infer from the results.

      We appreciate the reviewer’s concern about the potential confounding effect of chamber exposure in experiment 1. We have now discussed this limitation more explicitly, adding further explanation to the Methods (L146-148) and Discussion (L345-346).

      Note that chamber-related problems (e.g. aphid infestations) primarily occurred under warm chamber conditions, whereas our experiment 1 cooling treatments maintained low temperatures that suppressed such issues. This means that an equivalent “warm chamber control” could have been associated with its own artefacts, as trees kept under warm chamber conditions would have been exposed to additional stressors that were not present under natural growing conditions. To address this point, we included a chamber control in experiment 2. While aphid abundance was indeed higher in the warm chamber controls, chamber exposure itself had no detectable effect on autumn phenology. This suggests that the main findings of experiment 1 are unlikely to be artefacts of chamber conditions (L141145).

      Nevertheless, we agree that chamber exposure remains a potential limitation of experiment 1, which requires clear acknowledgement. We now state this more explicitly in the manuscript while also emphasising that our results are supported by experiment 2 and by converging lines of external evidence.

      (3) I suggest the authors add a figure to explain their experiments, as they are very hard to follow. Perhaps this could be added to Figure 1?

      We have now added figures to the methods section to depict the experimental timelines and settings more clearly (Figs. 2 and 3).

      (4) Given how much the authors extrapolate to carbon and forests, I would have liked to see some metrics related to carbon assimilation, versus just information on timing.

      We agree that including more data on photosynthetic assimilation would be valuable for interpreting phenological responses. Indeed, it was our intention to collect this information. However, unfortunately, we experienced technical challenges with the equipment available to us during the experimental period, which prevented us from collecting a full dataset. Nevertheless, we were able to obtain measurements during pre-solstice cooling (now presented as Fig. S12, including data for all treatments), which show that cooling treatments strongly reduced assimilation rates compared to controls. Importantly, these strong reductions occurred across all cooling treatments, yet their phenological outcomes differed markedly, demonstrating that assimilation alone cannot explain the observed responses. As we discuss, our findings are consistent with previous manipulative and observational studies reporting a weak role of late-season assimilation in controlling autumn phenology.

      (5) Fagus sylvatica is an extremely important tree to European forests, but it also has outlier responses to photoperiod and other cues (and leafs out very late), so using just this species to then state 'our results likely are generalisable across temperate tree species' seems questionable at best.

      We agree that Fagus sylvatica has a stronger photoperiod dependence than many other European tree species. As we note in our response to Reviewer 1 (comment 4), our findings align with previous research across temperate northern forests. Within our framework, interspecific variation in leaf-out timing would not alter the overall response pattern, though it could shift the specific timing of effect reversals. For example, earlier-leafing species may approach completion of development sooner and thus show sensitivity to late-season cooling earlier than F. sylvatica. Nevertheless, we acknowledge the importance of not overstating generality. We have therefore revised the manuscript to phrase conclusions more cautiously (L409411) and highlight the need for further research across species (L413–414).

      (6) Another concern relates to measuring the end of season (EOS). It is well known that different parts of plants shut down at different times, and each metric of end of season - budset, end of radial expansion, leaf coloring, etc - relates to different things. Thus, I was surprised that the authors ignore all this complexity and seem to equate leaf coloring with budset (which can happen MONTHS before leaf coloring often) and with other metrics. The paper needs a much better connection to the physiology of end of season and a better explanation for the focus on budset. Relatedly, I was surprised that the authors cite almost none of the literature on budset, which generally suggests it is heavily controlled by photoperiod and population-level differences in photoperiod cues, meaning results may be different with a different population of plants.

      We thank the reviewer for pointing out that our discussion of the responses of different EOS metrics needs more clarity. We agree with much of this perspective, and we have added an additional analysis of leaf chlorophyll content data to use leaf discolouration as an alternative EOS marker (L179-195 for methods, L296-311 for results). On this we would like to make two important points:

      Firstly, we agree that bud set often occurs before leaf discolouration, although this can depend on which definition of leaf discolouration is used. In experiment 1, bud set occurred on average on day-of-year (DOY) 262 and leaf senescence (50% loss of leaf chlorophyll) occurred on DOY 320. However, we do not necessarily agree that this excludes the combined discussion of bud set and leaf senescence timing. Whilst environmental drivers can affect parts of plants differently, often responses from different end-of-season indicators (e.g. bud set and loss of leaf chlorophyll) are similar, even if only directionally. Figure S11 shows how, across both experiments, treatment effects were tightly conserved (R<sup>2</sup> = 0.49) amongst the two phenometrics. In accordance with these revisions, we have updated the manuscript title to “Developmental constraints mediate the summer solstice reversal of climate effects on the autumn phenology of European beech” (L1-2).

      Secondly, shifts in bud set timing remain the primary focus of the manuscript as these shifts are of direct physiological relevance to plant development and dormancy induction, whereas leaf discolouration may simply follow bud set as a symptom of developmental completion. This is supported by our results, which show stronger responses of bud set than leaf senescence (Figs. 4 & 5 vs. Figs. S9 & S10).

      Following the reviewer’s suggestion, we have included more references on the topic of bud set and its environmental controls. The reviewer rightly stresses that photoperiod is considered the most important factor. As mentioned above (see Reviewer 1 comment 3), photoperiod is therefore key in our conceptual model. However, the responses we observed in F. sylvatica cannot be explained by photoperiod alone. For example, in experiment 1, July cooling delayed the autumn phenology of late-leafing trees but had negligible impact on early-leafing trees, even though both experienced the exact same photoperiod. Moreover, in experiment 2, day, night and full-day cooling showed substantial variations in their effects despite equal photoperiod across the climate regimes. This is why we suggest that the annual progression of photoperiod modulates the responses to temperature variations instead of eliciting complete control.

      (7) I didn't fully see how the authors' results support the Solstice as Switch hypothesis, since what timing mattered seemed to depend on the timing of treatment and was not clearly related to the solstice. Could it be that these results suggest the Solstice as Switch hypothesis is actually not well supported (e.g., line 135) and instead suggest that the pattern of climate in the summer months affects end-of season timing?

      We interpret this concern as relating to the flexibility in reversal timing that we observed. Importantly, the Solstice-as-Phenology-Switch hypothesis does not assume that the reversal is fixed to June 21. Rather the hypothesis implies that reversal occurs around the solstice, when photoperiod cues cause tree individuals to shift from accelerating to decelerating their seasonal development. Our conceptual model (Fig. 1) explicitly incorporates this flexibility by showing how the timing of the reversal depends on developmental speed: Individuals that develop more slowly (or leaf out later) cross the compensatory point later in the summer, whereas fast developing individuals reach it earlier.

      Our experiments support this framework: pre-solstice full-day cooling delayed bud set, whereas post-solstice full-day cooling advanced it, with differences between early- and late-developing individuals consistent with the model. Moreover, the contrasting impacts of daytime vs. night time cooling demonstrate how diel conditions can further shape when the reversal is expressed. Thus, rather than contradicting the Solstice-as-Phenology-Switch hypothesis, our findings reinforce it and extend it by showing how flexibility arises from interactions between developmental progression, diel temperature responses, and photoperiod.

      We have added an additional section in the Discussion that elaborates on how our results support the Solstice-as-Phenology-Switch hypothesis (L416-432).

      Recommendations for the authors:

      Reviewing Editor (Recommendations for the authors):

      (1) The current strength of evidence is incomplete. Extra justifications of the experimental settings, clarifications of the interpretation of the results, and alternative statistical analyses could make the conclusions more solid.

      We agree with the vast majority of the reviewer comments and have made the relevant edits. We believe that these have dramatically improved the clarity of the manuscript. The revised analyses have not changed our conclusions, though we have toned down generalisations.

      (2) The Solstice as Switch hypothesis is about the effect of temperature warming. However, the two experiments did not simulate warming but rather cooling. Although a temperature difference can be obtained compared to the control in both cases, the impacts on plant physiology and phenology should still be different between the two scenarios.

      Thank you for raising this point, which requires clearer communication in our manuscript. The Solstice-as-Phenology-Switch hypothesis posits that changes in temperature before and after the summer solstice have opposite effects on the autumn phenology of northern forest trees. While the hypothesis has most often been framed in terms of warming, the underlying mechanism concerns whether development is accelerated or slowed relative to ambient conditions. In essence, we are exploring the effect of changes in temperature – not warming per se. In warmer springs, development begins earlier and/or proceeds faster, while in colder springs the opposite occurs; the same logic applies to post-solstice conditions. We have extended our explanation in the Introduction (L69-71).

      In our experiments, we applied cooling to create strong contrasts in developmental rates without damaging the trees. These treatments allow us to test the direction of phenological responses relative to ambient conditions. Thus, although we used cooling rather than warming, the results are directly informative for the Solstice-as Switch framework, which concerns the relative effect of temperature changes rather than the absolute direction of manipulation.

      (3) The number of groups for bud type and summer temperature treatment is too small to be used as a random effect; it would be more appropriate to treat them as fixed-effect terms.

      We have revised the analysis to include bud type as a fixed effect. There are only very minor numerical adjustments (e.g. rounding to 4.8 days instead of 4.9, see L271) and inferences are not altered. We also report the bud type effects for experiment 1 (L262-266) and experiment 2 (L292-293)

      (4) Please add more clarifications for Figure 4 about what this figure is for and how you derived this figure, whether the data were from your experiments or others.

      We have rewritten the caption for Figure 6 (Fig. 4 in the previous manuscript) to clarify where the data came from and how the figure was generated (L687-693). This figure serves as a visual guide to aid the understanding of the processes that may govern the patterns we have observed. Figure 6a uses data from previous studies on diel patterns in F. sylvatica, specifically growth (Zweifel et al., 2021) and photosynthetic assimilation rates (Urban et al., 2014). To aid visualisation, we linearly interpolated between measurements points, converted the values to a relative percentage (compared to observed maximum), and then smoothed the resulting curves. Based on the evidence from experiment 2, we suggest there may be a temperature threshold below which overwintering responses (e.g. bud set) are induced in F. sylvatica. Figure 6b depicts a theoretical diel pattern of this potential threshold. In simple terms, the threshold must be lower at night because nights are typically colder than days.

      Reviewer #2 (Recommendations for the authors):

      (1) How can a bud type -- which is apical or lateral -- be a random effect? The model needs to try to estimate a variance for each random effect, so doing this for n=2 is quite odd to me. I think the authors should also report the results with bud type as fixed, or report the bud types separately.

      See point (3) in reviewing editor’s recommendations for the authors.

      (2) Could the authors move the methods earlier and remind readers of them in the results?

      We have addressed this issue, please see detailed response under reviewer 2’s concerns.

      Urban O, Klem K, Holišová P, Šigut L, Šprtová M, Teslová-Navrátilová P, Zitová M, Špunda V, Marek MV, Grace J. 2014. Impact of elevated CO2 concentration on dynamics of leaf photosynthesis in Fagus sylvatica is modulated by sky conditions. Environmental Pollution 185: 271–280.

      Zweifel R, Sterck F, Braun S, Buchmann N, Eugster W, Gessler A, Häni M, Peters RL, Walthert L, Wilhelm M, et al. 2021. Why trees grow at night. New Phytologist 231: 2174–2185.

    1. ÁPICE

      Trocar essa escrita pelo logo da meraki, vou enviar o caminho aqui.

      '/Users/allyssonmoura/Documents/INSTITUCIONAL/01 — Identidade de Marca/Logos PNG/S°mbolo2.png'

    Annotators

    1. macronutrients

      Hola, en la lectura esta el cuadro en inglés y me di a la tarea de traducirlo. Se los comparto por si también les cuesta trabajo el inglés ;)

      • Dopamina (Motivación y recompensa) Promueve el entusiasmo, el placer y el impulso cuando se mantiene en niveles saludables. Temas de contenido saludables: aprendizaje, creatividad y motivación. Efectos de niveles poco saludables: distracción, impulsividad e inquietud. Temas de contenido poco saludables: gratificación instantánea, contenido sensacionalista y contenido altamente estimulante. Recomendación: busca recompensas regulares pero moderadas y evita la sobreestimulación para mantener la motivación y el disfrute de las actividades cotidianas.
      • Serotonina (Regulación y estabilidad del estado de ánimo) Favorece la positividad, la estabilidad emocional y el bienestar general. Temas de contenido saludables: noticias positivas, felicidad y relajación. Efectos de niveles poco saludables: pesimismo, desregulación del estado de ánimo y mayor sensibilidad emocional. Temas de contenido poco saludables: pesimismo, decepción y controversia. Recomendación: interactúa con contenido que fomente el bienestar y evita la exposición excesiva a contenido negativo para cultivar una perspectiva positiva y resiliencia emocional.
      • Oxitocina (Vínculo social y respuestas emocionales) Refuerza la confianza, la empatía y la conexión con otras personas. Temas de contenido saludables: interacciones sociales positivas, conexión y comunidad. Efectos de niveles poco saludables: soledad, inseguridad y escepticismo. Temas de contenido poco saludables: desconfianza, hostilidad y soledad. Recomendación: consume contenido que fortalezca los vínculos sociales y evita temas que refuercen el aislamiento, la traición o el abandono.
      • Cortisol (Respuesta al estrés) Contribuye al enfoque, la resiliencia y el equilibrio cuando se mantiene bajo control. Temas de contenido saludables: humor, optimismo y bienestar. Efectos de niveles poco saludables: irritabilidad, ansiedad y agotamiento. Temas de contenido poco saludables: urgencia constante, conflicto y contenido de alta intensidad. Recomendación: equilibra el consumo de contenido estresante con prácticas que fomenten la calma para prevenir el estrés crónico.
      • Adrenalina (Respuesta de lucha o huida) Genera alerta, energía y preparación para la acción. Temas de contenido saludables: aventura, logro y trabajo en equipo. Efectos de niveles poco saludables: estrés, saturación y pánico. Temas de contenido poco saludables: crisis, amenazas y peligro constante. Recomendación: evita la exposición continua a contenido de alta adrenalina y equilibra la estimulación con momentos de descanso y relajación.
    1. Edit Profile by Clients — Auto-creation of Action Items:

      Editing Profile: jobs need to have a locked in item - once sent o government for process or past the MTL deadline the job info cannot change.

      all other :trigger auto-creation of an Action Item for MTL to review and approve changes.

    1. Author response:

      The following is the authors’ response to the original reviews.

      It is important to make a few key points about our work. First, our paper is largely a computational biophysics paper, augmented by experimental results. Generally speaking, computational biophysics work intends to achieve one of two things (or both). One is to provide more molecular level insight into various behaviors of biomolecular systems that have not been (or cannot be) provided by qualitative experimental results alone. The second general goal of computational biophysics it to formulate new hypotheses to be tested subsequently by experiment. In our paper, we have achieved both of these goals and then confirmed the key computational results by experiment.

      eLife Assessment

      This study investigates how the HIV inhibitor lenacapavir influences capsid mechanics and interactions with the nuclear pore complex. It provides important insights into how drug-induced hyperstabilization of the viral shell can compromise its structural integrity during nuclear entry. While the modeling is technically sophisticated and the results are promising, some mechanistic interpretations rely on assumptions embedded in the simulations, leaving parts of the evidence incomplete.

      Given our response below, regarding the rigor and “completeness” of our work, we do not feel that an editorial judgement of “leaving parts of the evidence incomplete” is justified.

      We also note that another recent experimental paper has validated essentially every prediction made in our eLife paper: https://www.biorxiv.org/content/10.64898/2026.01.05.697065v1

      We thus disagree that the evidence we have presented in our paper is incomplete.

      Public Reviews:

      Reviewer #1 (Public review):

      The paper from Hudait and Voth details a number of coarse-grained simulations as well as some experiments focused on the stability of HIV capsids in the presence of the drug lenacapavir. The authors find that LEN hyperstabilizes the capsid, making it fragile and prone to breaking inside the nuclear pore complex.

      I found the paper interesting. I have a few suggestions for clarification and/or improvement. 

      (1) How directly comparable are the NPC-capsid and capsid-only simulations? A major result rests on the conclusion that the kinetics of rupture are faster inside the NPC, but are the numbers of LENs bound identical? Is the time really comparable, given that the simulations have different starting points? I'm not really doubting the result, but I think it could be made more rigorous/quantitative.

      We note (also in the manuscript) that it is difficult to compare the timescales obtained from coarse-grained MD simulations and experiments (“real time”) given that, by design, the CG simulations are accelerated to greatly enhance sampling. However, we can qualitatively compare the timescales of different CG simulations (without directly comparing the corresponding experimental timescales).

      We agree with the reviewer that the starting point of NPC-capsid and capsid-only simulations is different, as is the biological environment in which the rupture occurs. When analyzing the NPC-only and capsid-only simulations, what was striking to us was that at the NPC the capsid-LEN complex ruptures in a multicomponent environment, where several FG-NUPs compete to displace the LENs. It is well established in experiments that LEN has a detrimental effect on capsid integrity.

      In Figure 2, we plot the number of LEN molecules as a function of CG simulation time. The initial capsid-LEN complex was equilibrated without NPC and then placed at the cytoplasmic end of the NPC for docking. The number of LEN molecules for the capsid-only simulations and the NPC-docked simulations is nearly identical, and an insignificant number of LEN molecules unbind at the NPC. Hence, we added the following clarification:

      Page 10, paragraph 11

      “Note that the number of LEN molecules bound to the capsid for the free capsid and NPCdocked capsids are nearly identical. Hence, the disparity in timescale of lattice rupture is not only because of the effect of LEN on capsid lattice properties.”

      Is the time really comparable, given that the simulations have different starting points?

      Yes, the CG timescales of both the NPC and freely diffusing capsid unbiased simulations are comparable, since they were done using identical simulation settings.

      (2) Related to the above, it is stated on page 12 that, based on the estimated free-energy barrier, pentamer dissociation should occur in ~10 us of CG time. But certainly, the simulations cover at least this length of time?

      Our implicit solvent CG MD simulations are designed to access timescales far beyond the capabilities of the fully atomistic simulations. We reiterate here that it is difficult to directly compare the timescales obtained from CG MD simulations and experiments.

      As described in the text, there are 12 pentamers in the capsid (7 in the wide end and 5 in the narrow end). For the narrow end to rupture, all 5 pentamers should progressively dissociate. In our unbiased simulations (Fig. S5), in 25 us of CG time, we observe (partial) dissociation of one or two pentamers. Hence, our unbiased CG simulation timescales were not long enough to observe rupturing of the narrow end.

      (3) At first, I was surprised that even in a CG simulation, LEN would spontaneously bind to the correct site. But if I read the SI correctly, LEN was parameterized specifically to bind to hexamers and not pentamers. This is fine, but I think it's worth describing in the main text.

      We modified (see below) the main text to include the details.

      Page 4, paragraph 1

      “We model LEN and CA interactions such that LEN molecules can only bind to CA hexamers, and all interactions to CA pentamers are turned off, as in experiments, CA selectively associates with hexamers (25, 36).”

      Reviewer #2 (Public review):

      Here, Hudait et al. use CG modeling to investigate the mechanism by which Lenacapavir (LEN) treats HIV capsids that dock to the nuclear pore complex (NPC). However, the manuscript fails to present meaningful findings that were previously unreported in the literature and is thus of low impact. Many claims made in the manuscript are not substantiated by the presented data. Key mechanistic details that the work purports to reveal are artifacts of the parameterization choices or simulation/analysis design, with the simulations said to reveal details that they were specifically biased to reproduce. This makes the manuscript highly problematic, as its contributions to the literature would represent misconceptions based on oversights in modeling and thus mislead future readers. 

      We strongly disagree with these statements, and they do not reflect the facts. We provide a rebuttal to these statements in the “Author Response” statements below.

      (1) Considering the literature, it is unclear that the manuscript presents new scientific discoveries. The following are results from this paper that have been previously reported:

      (a) LEN-bound capsid can dock to the nuclear pore (Figure 2; see e.g. 10.1016/j.cell.2024.12.008 or 10.1128/mbio.03613-24). 

      (b) NUP98 interacts with the docked capsid (Figure 2; see e.g. 10.1016/j.virol.2013.02.008 or 10.1038/s41586-023-06969-7 or 10.1016/j.cell.2024.12.008). 

      (c) LEN and NUP98 compete for a binding interface (Figure 2; see e.g. 10.1126/science.abb4808 or 10.1371/journal.ppat.1004459). 

      (d) LEN creates capsid defects (Figure 3 and 5, see e.g. 10.1073/pnas.2420497122). 

      (e) RNP can emerge from a damaged capsid (Figure 3 and 5; see e.g. 10.1073/pnas.2117781119 or 10.7554/eLife.64776). 

      (f) LEN hyperstabilizes/reduces the elasticity of the capsid lattice (Figure 6; see e.g. 10.1371/journal.ppat.1012537). 

      The goal of our simulations (in combination with experiments from the Pathak group) is to provide molecular-level insight into the sequence of events of NPC docking of capsid and the effect of LEN binding leading to sequential dissociation of pentamers and leading to rupturing of the narrow end of the cone-shaped capsid. We also compare the events leading to capsid rupture at the NPC with the same for a freely diffusing capsid, akin to that in cytoplasm. The reviewer should carefully read the abstract of our paper. In fact, the above are all papers that present qualitative experimental results that help validate our model, but they do not provide details on the molecule-scale events. For example, the paper (10.1073/pnas.2420497122 written by our coauthors in the Pathak group) is extensively used to compare the behavior of LEN-bound capsid in the cytoplasm.

      (2) The mechanistic findings related to how these processes occur are problematic, either based on circular reasoning or unsubstantiated, based on the presented data. In some cases, features of parameterization and simulation/analysis design are erroneously interpreted as predictions by the CG models. 

      We strongly disagree with this assessment. Our CG NPC model is largely a “bottomup” model derived from molecular scale interactions sampled in atomistic simulations (see our previous paper in PNAS https://doi.org/10.1073/pnas.2313737121). The reviewer appears to be ignorant of the “bottom-up” approach based on rigorous statistical mechanics to derive moleculescale model (please refer to a detailed review on bottom-up coarse-graining: J. Chem. Theory. Comput., 2022, 18. 5759-5791).

      Using the “bottom-up” CG model of the NPC, we predicted several molecular-level details of capsid import and docking to the NPC. Our key predictions were that there is an intrinsic capsid lattice elasticity and also the pleomorphic nature of the NPC channel is key for successful capsid docking https://doi.org/10.1073/pnas.2313737121). Our computational predictions have benn, for example, validated in a recently published paper by an experimental group: Hou, Z., Shen, Y., Fronik, S. et al. HIV-1 nuclear import is selective and depends on both capsid elasticity and nuclear pore adaptability. Nat Microbiol 10, 1868–1885 (2025). https://doi.org/10.1038/s41564025-02054-z). Our work is an excellent example of how systematically derived “bottom-up” CG models can accurately predict molecular details of complex biological processes.

      We have now added the following statement:

      Page 3, Paragraph 1

      “Importantly, the computational predictions of capsid docking to the NPC central channel have been recently validated in a HIV-1 core import at the NPC using cryo-ET (33), demonstrating how systematically derived “bottom-up” CG models can accurately predict molecular details of complex biomolecular processes.”

      (a) Claim: LEN-bound capsids remain associated with the NPC after rupture. CG simulations did not reach the timescale needed to demonstrate continued association or failure to translocate, leaving the claim unsubstantiated.

      The reviewer fails to recognize that the statement is based on the experimental results of LEN-bound capsid that remains bound to the NPC after rupture and fails to translocate to the nuclear side (from the Pathak group in the section “Ruptured LEN-viral complexes remain bound to the NPC”). The Reviewers’ comment is incorrect. 

      (b) Claim: LEN contributes to loss of capsid elasticity. The authors do not measure elasticity here, only force constants of fluctuations between capsomers in freely diffusing capsids. Elasticity is defined as the ability of a material to undergo reversible deformation when subjected to stress. Other computational works that actually measure elasticity (e.g., 0.1371/journal.ppat.1012537) could represent a point of comparison but are not cited. The changes in force constants in the presence of LEN are shown in Figure 6C, but the text of the scale bar legend and units of k are not legible, so one cannot discern the magnitude or significance of the change.

      The concept of elasticity can extend down to the mesoscopic scale. Many examples can be found in the large number of elastic network models (ENMs) of proteins published by many authors. The reviewer also fails to comprehend the meaning of the effective spring constants in the HeteroENM model and how they relate to the response of the capsid to stress (e.g., in the NPC). Note, in the NPC central channel, the capsid encounters several nucleoporins (including disordered FG Nucleoporins that not have specific interactions to rest of the proteins), and also a confined environment. This environment can exert inward stress to the capsid, which is also reflected in stress on the capsid lattice. Furthermore, the cited computational AFM studies are very far from a realistic in vivo or even in vitro set of conditions. In contrast, our study presents a realistic environment which the capsid will encounter in NPC, and then these predictions are validated by experimental results.

      (c) Claim: Capsid defects are formed along striated patterns of capsid disorder. Data is not presented that correlates defects/cracks with striations. 

      We presented the data of formation of striated patterns of lattice stress in the capsid that runs from capsid narrow end to the wide end in coarse-grained model (https://doi.org/10.1073/pnas.2313737121), and atomistic model (https://doi.org/10.1073/pnas.2117781119). Both of our papers are extensively cited in the current manuscript. Also, when the capsid is ruptured, one cannot visualize the striated patterns.

      (d) Claim: Typically 1-2 LEN, but rarely 3 bind per capsid hexamer. The authors state: "The magnitude of the attractive interactions was adjusted to capture the substoichiometric binding of LEN to CA hexamers (Faysal et al., 2024). ... We simulated LEN binding to the capsid cone (in the absence of NPC), which resulted in a substoichiometric binding (~1.5 LEN per CA hexamer), consistent with experimental data (Singh et al., 2024)." This means LEN was specifically parameterized to reproduce the 1-2 binding ratio per hexamer apparent from experiments, so this was a parameterization choice, not a prediction by CG simulations as the authors erroneously claim: "This indicates that the probability of binding a third LEN molecule to a CA hexamer is impeded, likely due to steric effects that prevent the approach of an incoming molecule to a CA hexamer where 2 LEN molecules are already associated. ... Approximately 20% of CA hexamers remain unoccupied despite the availability of a large excess of unbound LEN molecules. This suggests a heterogeneity in the molecular environment of the capsid lattice for LEN binding." These statements represent gross over-interpretation of a bias deliberately introduced during parameterization, and the "finding" represents circular reasoning. Also, if "steric effects" play any role, the authors could analyze the model to characterize and report them rather than simply speculate.

      Reviewer comment: “This means LEN was specifically parameterized to reproduce the 1-2 binding ratio per hexamer apparent from experiments, so this was a parameterization choice, not a prediction by CG simulations as the authors erroneously claim.” – This comment by reviewer is deeply flawed and we strongly disagree. In our CG model there is no restriction on the number of LEN molecules that can bind to a CA hexamer. We again restate that, the experimental results on LEN binding to CA hexamers and inability of LEN to bind to pentamers were used as no allatom (AA) forcefield yet exists.

      The steric effect of the lack of third LEN binding to a hexamer is a likely hypothesis (which one is allowed to make). More importantly, an investigation of the steric effect of LEN binding to the CA hexamer is not the main goal of the manuscript.

      (e) Claim: Competition between NUP98 and LEN regulates capsid docking. The authors state: "A fraction of LEN molecules bound at the narrow end dissociate to allow NUP98 binding to the capsid ... Therefore, LEN can inhibit the efficient binding of the viral cores to the NPC, resulting in an increased number of cores in the cytoplasm." Capsid docking occurs regardless of the presence of LEN, and appears to occur at the same rate as the LEN-free capsid presented in the authors' previous work (Hudait &Voth, 2024). The presented data simply show that there is a fluctuation of bound LEN, with about 10 fewer (<5%) bound at the end of the simulation than at the beginning, and the curve (Figure 2A) does not clearly correlate with increased NUP98 contact. In that case, no data is shown that connects LEN binding with the regulation of the docking process. Further, the two quoted statements contradict each other. The presented data appear to show that NUP outcompetes LEN binding, rather than LEN inhibiting NUP binding. The "Therefore" statement is an attempt to reconcile with experimental studies, but is not substantiated by the presented data.

      We disagree with this spurious statement, and we see no real contradiction. We have now added a minor clarification that LEN can inhibit efficient capsid binding at significantly high concentration.

      Page 6, Paragraph 1

      “Therefore, at significantly high concentration LEN can inhibit the efficient binding of the viral cores to the NPC, resulting in an increased number of cores in the cytoplasm.”

      (f) Claim: LEN binding leads to spontaneous dissociation of pentamers. The CG simulation trajectories show pentamer dissociation. However, it is quite difficult to believe that a pentamer in the wide end of the capsid would dissociate and diffuse 100 nm away before a hexamer in the narrow end (previously between two pentamers and now only partially coordinated, also in a highly curved environment, and further under the force of the extruding RNA) would dissociate, as in Figure 2B. A more plausible explanation could be force balance between pent-hex versus hex-hex contacts, an aspect of CG parameterization. No further modeling is presented to explain the release of pentamers, and changes in pent-hex stiffness are not apparent in the force constant fluctuation analysis in Figure 6C.

      This is both a misrepresentation of the simulations and a failure to understand them (as well as the supporting experiments) on the part of the reviewer. In the presence of LEN, the hexameric lattice is hyperstabilized. In contrast, the pentamers are not. As a consequence, the pentamers are dissociated. The pentamers at the narrow end are dissociated first, due to high curvature. The reviewer, from a point of being uninformed, simply speculates on what they think should happen. Moreover, as emphasized earlier and which the reviewer fails to comprehend is that ours is a “bottom-up CG model” so it predicts, not builds in, these effects.

      (g) Claim: WTMetaD simulations predict capsid rupture. The authors state: "In WTMetaD simulations, we used the mean coordination number (Figure S6) between CA proteins in pentamers and in hexamers as the reaction coordinate." This means that the coordination number, the number of pent-hex contacts, is the bias used to accelerate simulation sampling. Yet the authors then interpret a change in coordination number leading to capsid rupture as a discovery, representing a fundamental misuse of the WTMetaD method. Changes in coordination number cannot be claimed as an emergent property when they are in fact the applied bias, when the simulation forced them to sample such states. The bias must be orthogonal to the feature of interest for that feature to be discoverable. While the reported free energies are orthogonal to the reaction coordinate, the structural and stepwise-mechanism "findings" here represent circular reasoning.

      Unfortunately, the reviewer appears to be quite uninformed on the WTMetaD method and what it does. The chosen collective variable (CV) in our case is the coordination variable and the MetaD samples along that variable (the conditional free energy) as it is designed to do. The reviewer may wish to educate themself by reading Dama et al (https://doi.org/10.1103/PhysRevLett.112.240602). We also note that “emergent properties” are not along some other, uncoupled coordinate.

      (3) Another major concern with this work is the excessive self-citation, and the conspicuous lack of engagement with similar computational modeling studies that investigate the HIV capsid and its interactions with LEN, capsid mechanical properties relevant to nuclear entry, and other capsidNPC simulations (e.g., 10.1016/j.cell.2024.12.008 and 10.1371/journal.ppat.1012537). Other such studies available in the literature include examination of varying aspects of the system at both CG and all-atom levels of resolution, which could be highly complementary to the present work and, in many cases, lend support to the authors' claims rather than detract from them. The choice to omit relevant literature implies either a lack of perspective or a lack of collegiality, which the presentation of the work suffers from. Overall, it is essential to discuss findings in the context of competing studies to give readers an accurate view of the state of the field and how the present work fits into it. It is appropriate in a CG modeling study to discuss the potential weaknesses of the methodology, points of disagreement with alternative modeling studies, and any lack of correlation with a broader range of experimental work. Qualitative agreement with select experiments does not constitute model validation. 

      We disagree with this statement and point out where we have cited other work, including the ones mentioned above. However, our CG model is a largely bottom-up CG model which differs from other more ad hoc CG approaches (and some well-known CG models). We do not wish to emphasize the obvious flaws in those other CG approaches and models, since that is not the focus of our manuscript.

      (4) Other critiques, questions, concerns:

      (a) The first Results sub-heading presents "results", complete with several supplementary figures and a movie that are from a previous publication about the development of the HIV capsid-NPC model in the absence of LEN (Hudait &Voth, 2024). This information should be included as part of the introduction or an abbreviated main-text methods section rather than being included within Results as if it represents a newly reported advancement, as this could be misleading. 

      The movie in question (capsid docking to NPC without LEN) is essential for comparison of LEN-binding dynamics. Different from our previous paper, we simulated significantly longer timescales of capsid docking and performed several additional analyses that is relevant to this paper. Moreover, the first section of the result is titled “Coarse-grained modeling and simulation”, hence we only present a summary of the CG models and key validation steps in this section.

      (b) The authors say the unbiased simulations of capsid-NPC docking were run as two independent replicates, but results from only one trajectory are ever shown plotted over time. It is not mentioned if the time series data are averaged or smoothed, so what is the shadow in these plots (e.g., Figures 1,2, and Supplementary Figure 5)?

      These simulations are the average from two replicas. “For all the plots, the solid lines are the mean values calculated from the time series of two independent replicas, and the shaded region is the standard deviation at each timestep.” This was mentioned in the original figure caption.

      (c) Why do the insets showing LEN binding in Figure 2A look so different from the models they are apparently zoomed in on? Both instances really look like they are taken from different simulation frames, rather than being a zoomed-in view.

      It is difficult to discern a high curvature region of the capsid due to object overlap of different regions of the capsid. This is likely a case of “perspective distortion” in image processing.

      (d) What are the sudden jerks apparent in the SI movies? Perhaps this is related to the rate at which trajectory frames are saved, but occasionally, during the relatively smooth motion of the capsidNPC complex, something dramatic happens all of a sudden in a frame. For example, significant and apparently instantaneous reorientation of the cone far beyond what preceding motions suggest is possible (SI movie 2, at timestamp 0.22), RNP extrusion suddenly in a single frame (SI movie 2, at timestamp 0.27), and simultaneous opening of all pentamers all at once starting in a single frame (SI movie 2, at timestamp 0.33). This almost makes the movie look generated from separate trajectories or discontinuous portions of the same trajectory. If movies have been edited for visual clarity (e.g., to skip over time when "nothing" is happening and focus on the exciting aspects), then the authors should state so in the captions. 

      This is due to the rate at which trajectory frames are saved for movie generation for faster processing of the movies. We added the following in movie caption: 

      “The movie frames correspond to snapshots every 250000 𝜏<sub>CG</sub>.” 

      (e) Figure 3c presents a time series of the degree of defects at pent-hex and hex-hex interfaces, but I do not understand the normalization. The authors state, "we represented the defects as the number of under-coordinated CA monomers of the hexamers at the pentamer-hexamer-pentamer and hexamer-hexamer interface as N_Pen-Hex and N_Hex-Hex ... Note that in N_Pen-Hex and N_Hex-Hex are calculated by normalizing by the total number of CA pentamer (12) and hexamer rings (209) respectively." Shouldn't the number of uncoordinated monomers be normalized by the number of that type of monomer, rather than the number of capsomers/rings? E.g., 12*5 and 209*6, rather than 12 and 209?

      We prefer to continue with the current normalization, since typically in the HIV-1 literature capsids are represented as a collection of hexamers and pentamers (rather than total number of CA monomers).

      (f) The authors state that "Although high computational cost precluded us from continuing these CG MD simulations, we expect these defects at the hexamer-hexamer interface to propagate the high curvature ends of the capsid." The defects being reported are apparently propagating from (not towards) the high curvature ends of the capsid. 

      We corrected the statement as follows:

      “Although high computational cost precluded us from continuing these CG MD simulations, we expect these defects at the hexamer-hexamer interface to propagate from the high curvature to low curvature end of the capsid.”

      (g) The first half of the paper uses the color orange in figures to indicate LEN, but the second half uses orange to indicate defects, and this could be confusing for some readers. Both LEN and "defects" are simply a cluster of spheres, so highlighted defects appear to represent LEN without careful reading of captions.

      We only show LEN in Figure 1, and in rest of the figures the bound LEN molecules are not shown for clarity. The defects are shown in a darker shade of orange (amber). 

      (h) SI Figure S3 captions says "The CA monomers to which at least one LEN molecule is bound are shown in orange spheres. The CA monomers to which no LEN molecule is bound are shown in white spheres. " While in contradiction, the main-text Fig 2 says "The CA monomers to which at least one LEN molecule is bound are shown in white spheres. The CA monomers to which no LEN molecule is bound are shown in orange spheres. " One of these must be a typo.

      We have corrected the erroneous caption in Fig. S3. The color scheme in Fig. 2 and Fig. S3 are now consistent.

      (i) The authors state that: "CG MD simulations and live-cell imaging demonstrate that LEN-treated capsids dock at the NPC and rupture at the narrow end when bound to the central channel and then remain associated to the NPC after rupture." However, the live cell imaging data do not show where rupture occurs, such that this statement is at least partially false. It is also unclear that CG simulations show that cores remain bound following rupture, given that simulations were not extended to the timescale needed to observe this, again rendering the statement partially false.

      We modified the statement as follows:

      “CG MD simulations complemented by the outcome of live-cell imaging demonstrate that LENtreated capsids dock at the NPC and rupture at the narrow end when bound to the central channel and then remain associated with the NPC after rupture.”

      (j) The authors state: "We previously demonstrated that the RNP complex inside the capsid contributes to internal mechanical strain on the lattice driven by CACTD-RNP interactions and condensation state of RNP complex (Hudait &Voth, 2024). " In that case, why do the present CG models detect no difference in results for condensed versus uncondensed RNP?

      In our previous paper, the difference from condensation state of RNP complex appear only in the pill-shaped capsid, and not in the cone-shaped capsid. In this manuscript, we only investigated the cone-shaped capsid.

      (k) The authors state: "The distribution demonstrates that the binding of LEN to the distorted lattice sites is energetically favorable. Since LEN localizes at the hydrophobic pocket between two adjoining CA monomers, it is sterically favorable to accommodate the incoming molecule at a distorted lattice site. This can be attributed to the higher available void volume at the distorted lattice relative to an ordered lattice, the latter being tightly packed. This also allows the drug molecule to avoid the multitude of unfavorable CA-LEN interactions and establish the energetically favorable interactions leading to a successful binding event. " What multitude of unfavorable interactions are the authors referring to? Data is not presented to substantiate the claim of increased void volume between hexamers in the distorted lattice. Capsomer distortion is shown as a schematic in Figure 6A rather than in the context of the actual model.

      “What multitude of unfavorable interactions are the authors referring to?” We have now added the following sentence to clarify

      “Here we denote unfavorable CA-LEN interactions as all interactions other than the electrostatic and van der Waal interactions that lead to CA-LEN binding (17).”

      “In the distorted lattice, there is an increase of void volume is based on standard solid-state physics understanding. We added the word “likely” in the statement. “. This can likely be attributed to the higher available void volume at the distorted lattice relative to an ordered lattice, the latter being tightly packed (41).”

      Moreover, in one of our previous manuscripts, we established that compressive or expansive strain induces more closely packed or expanded lattice (A. Yu et al., Strain and rupture of HIV-1 capsids during uncoating. Proceedings of the National Academy of Sciences 119, e2117781119 (2022)).

      (l) The authors state that "These striated patterns also demonstrate deviations from ideal lattice packing. " What does ideal lattice packing mean in this context, where hexamers are in numerous unique environments in terms of curvature? What is the structural reference point?

      The ideal lattice packing definition is provided in our previous manuscripts: 1. A. Yu et al., Strain and rupture of HIV-1 capsids during uncoating. Proceedings of the National Academy of Sciences 119, e2117781119 (2022), 2. A. Hudait, G. A. Voth, HIV-1 capsid shape, orientation, and entropic elasticity regulate translocation into the nuclear pore complex. Proceedings of the National Academy of Sciences 121, e2313737121 (2024).

      These manuscripts are cited in the previous statement. The ideal lattice packing is defined based on lattice separations in each core (in cryo-ET and atomistic simulations) using a local order parameter, which measures the near-neighbor contacts of a particle. Moreover, the ideal packing reference is calculated from all available capsid shapes (cone, ellipsoid, and tubular), and takes into account different curvatures.

      (m) If pentamer-hexamer interactions are weakened in the presence of LEN, why are differences at these interfaces not apparent in the Figure 6C data that shows stiffening of the interactions between capsomer subunits?

      We have added a statement as follows:

      “Based on our analysis, we hypothesize that LEN binding hyperstabilzes the CA hexamerhexamer interactions relative to CA hexamer-pentamer interaction.”

      (n) The authors state: "Lattice defects arising from the loss of pentamers and cracks along the weak points of the hexameric lattice drive the uncoating of the capsid." The word rupture or failure should be used here rather than uncoating; it is unclear that the authors are studying the true process of uncoating and whether the defects induced by LEN binding relate in any way to uncoating. 

      We have now changed “uncoating” to “rupture” throughout the manuscript.

      (o) The authors state: " LEN-treated broken cores are stabilized by the interaction with the disordered FG-NUP98 mesh at the NPC." But no data is presented to demonstrate that capsid stability is increased by NUP98 interaction. In fact, the presented data could suggest the opposite since capsids in contact with NUP98 in the NPC appeared to rupture faster than freely diffusing capsids.

      We have modified the statement as follows

      “We hypothesize that LEN-treated broken cores are stabilized by the interaction with the disordered FG-NUP98 mesh at the NPC.”

      (p) The authors state: "LEN binding stimulates similar changes in free capsids, but they occur with lower frequency on similar time scales, suggesting that the cores docked at the NPC are under increased stress, resulting in more frequent weakening of the hexamer-pentamer and hexamerhexamer interactions, as well as more nucleation of defects at the hexamer-hexamer Interface. ... Our results suggest that in the presence of the LEN, capsid docking into the NPC central channel will increase stress, resulting in more frequent breaks in the capsid lattice compared to free capsids." The first is a run-on sentence. The results shown support that LEN stimulates changes in free capsids to happen faster, but not more frequently. The frequency with which an event occurs is separate from the speed with which the event occurs.

      We have fixed the run-on sentence.

      The results shown support that LEN stimulates changes in free capsids to happen faster, but not more frequently. The frequency with which an event occurs is separate from the speed with which the event occurs.

      We disagree with the reviewer. The statement was intended to provide a comparison between free capsid and NPC-bound capsid.

      (q) The authors state: "A possible mechanistic pathway of capsid disassembly can be that multiple pentamers are dissociated from the capsid sequentially, and the remaining hexameric lattice remains stabilized by bound LEN molecules for a time, before the structural integrity of the remaining lattice is compromised." This statement is inconsistent with experimental studies that say LEN does not lead to capsid disassembly, and may even prevent disassembly as part of its disruption of proper uncoating (e.g., 10.1073/pnas.2420497122 previously published by the authors).

      We disagree with the interpretation of the reviewer. Our interpretation based on our results is LEN binding accelerates capsid rupture (from pentamer-rich high curvature ends), and the rest of the broken hexameric lattice is hyperstabilized. Ultimately, lattice rupture will lead to release the RNP, and hence the intended goal of the drug is achieved.

      (r) Finally, it remains a concern with the authors' work that the bottom-up solvent-free CG modeling software used in this and supporting works is not open source or even available to other researchers like other commonly used molecular dynamics software packages, raising significant questions about transparency and reproducibility.

      The simulations were performed in LAMMPS, which is open source. This software is already stated in the Methods. Input data is provided upon request.

      Recommendations for the authors:

      Reviewer #1 (Recommendations for the authors):

      (1) Figure 1: In part B, it appears the middle panel was screenshotted from a ppt, given the red line underneath Lenacapavir. You can export it to an image instead.

      The figure is fixed.

      (2) Figure 6: In part A, the LEN_d in the graph is illegible. Also, in the panel next to it, it also appears to have been screenshotted from a ppt.

      The figure is fixed.

      (3) Page 6: There's an errant quotation mark at the end of a paragraph.

      Removed the errant quotation

      Reviewer #2 (Recommendations for the authors):

      The code used to perform bottom-up solvent-free CG modeling simulations is not made available.

      This is not true. LAMMPS was used as stated in Methods.

    1. eLife Assessment

      This is an important study that takes a key step towards understanding developmental disorders linked to mutations in the O-GlcNAc transferase enzyme by generating a mouse model harboring the C921Y mutation. While the mechanisms remain open, the study thoroughly examines behavioral and anatomical differences in these mice and provides convincing evidence for behavioral hyperactivity and learning/memory deficits, as well as phenotypic differences in skull and brain formation. This study will be of interest to those studying neurodevelopmental disorders and associated mechanisms.

    2. Reviewer #1 (Public review):

      This study established a C921Y OGT-ID mouse model, systematically demonstrating in mammals the pathological link between O-GlcNAc metabolic imbalance and neurodevelopmental disorders (cortical malformation, microcephaly) as well as behavioral abnormalities (hyperactivity, impulsivity, learning/memory deficits). Researchers comprehensively assessed the model phenotype through integrated multi-level analysis methods, including long-term behavioral monitoring, high-resolution brain structural imaging (micro-CT and MRI), histopathology, and quantitative proteomics.

      The core strength of this study lies in its multimodal experimental design. The evidence chain spanning in vivo behavior, brain structure, and molecular characteristics demonstrates high consistency and correlation. Of particular note is the combination of non-invasive behavioral tracking with quantitative neuroimaging techniques, providing objective validation for the observed phenotypes. The findings support the authors' core conclusion: O-GlcNAc homeostasis imbalance correlates with neurodevelopmental deficits, including structural abnormalities in specific brain regions and altered cognitive behaviors. Furthermore, this model reproduces certain clinical features observed in human patients.

      Nevertheless, several avenues remain open for further exploration. For instance, sample sizes in certain omics analyses remain relatively small, and investigations into downstream molecular mechanisms are still confined to the level of correlation-direct causal validation through genetic or pharmacological interventions is still required. Furthermore, as this model focuses on a single recurrent mutation, the generalizability of its findings to other OGT-ID variants remains to be verified.

      It provides the first actionable vertebrate model for neurodevelopmental disorders with unclear mechanisms, filling a critical gap in this field. The multidimensional research methods established in the paper-such as the digital behavioral phenotyping workflow-also offer valuable references for related disease studies.

    3. Reviewer #2 (Public review):

      Summary:

      The authors are trying to understand why certain mutants of O-GlcNAc transferase (OGT) appear to cause developmental disorders in humans. As an important step towards that goal, the authors generated a mouse model with one of these mutations that disrupts OGT activity. They then go on to test these mice for behavioral differences, finding that the mutant mice exhibit some signs of hyperactivity and differences in learning and memory. They then examine alterations to the structure of the brain and skull, and again find changes in the mutant mice that have been associated with developmental disorders. Finally, they identify proteins that are up or down regulated between the two mice as potential mechanisms to explain the observations.

      Strengths:

      The major strength of this manuscript is the creation of this mouse model, as a key step in beginning to understand how OGT mutants cause developmental disorders. This line will prove important for not only the authors but other investigators as well, enabling the testing of various hypotheses and potentially treatments. The experiments are also rigorously performed and the conclusions are well supported by the data.

      Weaknesses:

      The only weakness is a lack of mechanistic insight. However, this certainly may come in the future through more targeted experimentation using this mouse model. I do not recommend that these experiments need to be performed in this manuscript.

      Comments on revisions:

      The authors have addressed all of my suggestions proactively.

    4. Author Response:

      The following is the authors’ response to the original reviews.

      Public Reviews:

      Reviewer #1 (Public review):

      This study established a C921Y OGT-ID mouse model, systematically demonstrating in mammals the pathological link between O-GlcNAc metabolic imbalance and neurodevelopmental disorders (cortical malformation, microcephaly) as well as behavioral abnormalities (hyperactivity, impulsivity, learning/memory deficits). However, critical flaws in the current findings require resolution to ensure scientific rigor.

      The most concerning finding appears in Figure S12. While Supplementary Figure S12 demonstrates decreased OGA expression without significant OGT level changes in C921Y mutants via Western blot/qPCR, previous reports (Florence Authier, et al., Dis Model Mech. 2023) described OGT downregulation in Western blot and an increase in qPCR in the same models. The opposite OGT expression outcomes in supposedly identical mouse models directly challenge the model's reliability. This discrepancy raises serious concerns about either the experimental execution or the interpretation of results. The authors must revalidate the data with rigorous controls or provide a molecular biology-based explanation.

      We thank the reviewer for their time and effort in improving the quality of our manuscript.

      We would like to point out that the results presented in the previous Fig. S12 (now Fig. S13) are from different ages of the mice and restricted to the prefrontal cortex, compared to the previous report (Florence Authier, et al., Dis Model Mech. 2023) where we showed OGT and OGA mRNA/protein expression in total brain homogenates. In this previous study, we observed a significant reduction in OGT protein levels while OGT mRNA levels were significantly increased in the brains of 3 months old mutant C921Y compared to WT controls. However, in our current study (Figure S12, now S13), OGA and OGT mRNA/protein expression have been a) restricted to the pre-frontal cortex and b) are from 4 months old male mice. Therefore, a direct comparison of findings from total brain vs. prefrontal cortex would be speculative. In our present work, OGT protein levels are not changed in the pre-frontal cortex, while OGT mRNA levels are increased (similarly to the total brain data), albeit not significantly.

      It is plausible that the different levels of OGT protein expression in total brain (previous study) and prefrontal cortex (current study) potentially reflect regional differences in the regulation of OGT protein levels/stability, since OGT mRNA levels are increased in both cases. This notion is also supported by additional analyses in three other brain regions (hippocampus, striatum and cerebellum) and these data are now included in Figures S13 and S14.

      A few additional comments to the author may be helpful to improve the study.

      Major

      (1) While this study systematically validated multi-dimensional phenotypes (including neuroanatomical abnormalities and behavioral deficits) in OGT C921Y mutant mice, there is a lack of relevant mechanisms and intervention experiments. For example, the absence of targeted intervention studies on key signaling pathways prevents verification of whether proteomics-identified molecular changes directly drive phenotypic manifestations.

      We agree with the reviewer that the suggested experiments would further strengthen our work. However, the extensive nature of the suggested studies would result in considerable delay in sharing this work with the scientific and patient communities. Nevertheless, we appreciate the reviewers’ comment and will continue to work along these lines, and report in a follow up manuscript in the future.

      (2) Although MRI detected nodular dysplasia and heterotopia in the cingulate cortex, the cellular basis remains undefined. Spatiotemporal immunofluorescence analysis using neuronal (NeuN), astrocytic (GFAP), and synaptic (Synaptophysin) markers is recommended to identify affected cell populations (e.g., radial glial migration defects or intermediate progenitor differentiation abnormalities).

      Following the reviewers’ suggestion, we have performed additional analyses to identify the cellular composition of the observed nodular dysplasia using neuronal and glial markers. These new analyses indicate that the nodular collections in the layers II/III were predominantly neurons, for example see cresyl violet (Fig. 6E). Moreover, we have also performed immunofluorescence imaging using NeuN and GFAP (Fig. 6G-H), which reflect that the dystrophic collections are predominantly neurons. To further corroborate these findings, we have also performed multiplex IHC analyses, presented in Fig. S12, which indicate that: i) the nodular cortical malformations were populated by neurons and oligodendrocytes and ii) predominantly affected layers II-V, as reflected by the distribution of neuronal markers Reelin and POU class 3 homeobox 2 (POU3F2), and collectively (Fig. 6 and Fig. S12) reflect neuronal disorganisation due to migration defects rather than differentiation defects. We appreciate the reviewers’ suggestion to perform spatiotemporal analyses of these cellular features; however, tissue from defined stages of development is not available. 

      (3) While proteomics revealed dysregulation in pathways including Wnt/β-catenin and mTOR signaling, two critical issues remain unresolved: a) O-GlcNAc glycoproteomic alterations remain unexamined; b) The causal relationship between pathway changes and O-GlcNAc imbalance lacks validation. It is recommended to use co-immunoprecipitation or glycosylation sequencing to confirm whether the relevant proteins undergo O-GlcNAc modification changes, identify specific modification sites, and verify their interactions with OGT.

      We agree with the referee that these experiments would further strenghten the work. However, we respectfully point out that the inference that altered proteins must themselves be O-GlcNAc modified is not necessarily correct. For instance, O-GlcNAcylation of unknown protein kinase X, E3 ligase/DUB, Y or transcription factor Z could indirectly affect these pathways/proteins. Nevertheless, we have performed further experiments to explore whether Wnt/β-catenin and mTOR signalling are functionally affected, as pointed out by the referee. In the qPCR analyses, we did not observe significant changes in expression of Wnt target genes (Cdkn1a, Ccnd1, Myc, Ramp3, Tfrc), neither in protein levels of key proteins involved in Wnt/β-catenin (non-phosphorylated β-catenin) and mTOR (phosphorylated rpS6) signalling by western blots (data not shown). These results suggest that both pathways are not functionally deregulated in prefrontal cortex of adult OGT<sup>C921Y</sup> mice to a significant extent.

      (4) Given that OGT-ID neuropathology likely originates embryonically, we recommend serial analyses from E14.5 to P7 to examine cellular dynamics during critical corticogenesis phases.

      We appreciate the reviewers’ suggestion to perform spatiotemporal analyses of these cellular dynamics; however, tissue from defined stages of development is not available. As stated above, we want to share our current findings with the scientific and patient communities in a timely manner, and the suggested experiments could form the foundation of a follow up study in the future.

      (5) The interpretation of Figure 8A constitutes overinterpretation. Current data fail to conclusively demonstrate impairment of OGT's protein interaction network and lack direct evidence supporting the proposed mechanisms of HCF1 misprocessing or OGA loss.

      Thank you for the comment. To avoid misleading the readers, we have removed panel A from the previous version of Figure 8 and updated the version of record.

      Reviewer #2 (Public review):

      Summary:

      The authors are trying to understand why certain mutants of O-GlcNAc transferase (OGT) appear to cause developmental disorders in humans. As an important step towards that goal, the authors generated a mouse model with one of these mutations that disrupts OGT activity. They then go on to test these mice for behavioral differences, finding that the mutant mice exhibit some signs of hyperactivity and differences in learning and memory. They then examine alterations to the structure of the brain and skull and again find changes in the mutant mice that have been associated with developmental disorders. Finally, they identify proteins that are up- or down-regulated between the two mice as potential mechanisms to explain the observations.

      Strengths:

      The major strength of this manuscript is the creation of this mouse model, as a key step in beginning to understand how OGT mutants cause developmental disorders. This line will prove important for not only the authors but other investigators as well, enabling the testing of various hypotheses and potentially treatments. The experiments are also rigorously performed, and the conclusions are well supported by the data.

      Weaknesses:

      The only weakness identified is a lack of mechanistic insight. However, this certainly may come in the future through more targeted experimentation using this mouse model.

      We agree with the reviewer that the suggested experiments would further strengthen our work. However, the extensive nature of the suggested studies would result in considerable delay in sharing this work with the scientific and patient communities. Nevertheless, we appreciate the reviewers’ comment and will continue to work along these lines, and report in a follow up manuscript in the future.

      Recommendations for the authors:

      Editor's note:

      Should you choose to revise your manuscript, if you have not already done so, please include full statistical reporting including exact p-values wherever possible alongside the summary statistics (test statistic and df) and, where appropriate, 95% confidence intervals. These should be reported for all key questions and not only when the p-value is less than 0.05 in the main manuscript.

      Statistics including exact p-values have been included in the main text for all key questions where appropriate.

      Reviewer #1 (Recommendations for the authors):

      (1) In Figure 1F, the y-axis labels and scale values are partially obscured by graphical elements, compromising accurate interpretation of the data range.

      Panel 1F has been adjusted to make the y-axis label visible.

      (2) Regarding the histological analyses in Figure 6, the current H&E staining and Luxol Fast Blue myelin staining results lack age-matched wild-type control samples processed in parallel, which undermines experimental comparability. To enhance methodological rigor, control group staining results should be displayed adjacent to each experimental group image.

      The original Figure 6 already contained comparison between WT and OGT<sup>C921Y</sup> tissues. The Figure has been updated with additional data from the WT and C921Y mutant groups shown side by side.

      Reviewer #2 (Recommendations for the authors):

      (1) I believe that Figures S1 and S2 were switched during the submission. The legends are correct, so the authors should just be careful with the order when they upload the final versions.

      Figures S1 and S2 have been re-ordered.

      (2) On page 18, the authors state, "Although no significant changes in the expression of OGT were observed in OGTC921Y cortex (Figure S12A, C), there was a significant increase in OGT/OGA protein ratio in OGTC921Y mice (Fig. S12D). As a functional consequence, global O-GlcNAcylation of proteins in the brain was drastically impaired in the OGTC921Y brain compared to WT (Figure S12E, F).

      To me, this statement suggests that the incorrect ratio of OGT to OGA is responsible for the altered O-GlcNAc levels. I think this is missing important information. The authors are, I'm sure, aware that OGT and OGA expression is linked to O-GlcNAc levels. I think it would be better to describe the situation here as the tissue attempting to respond to lower OGT activity by lowering OGA levels. However, the tissue is not fully successful, resulting in lower overall O-GlcNAc levels as seen by RL2. If the difference were only driven by the OGT/OGA ratio, one would expect increased O-GlcNAc levels due to decreased OGA. I think it is important to point out more details here for non-expert readers.

      Thank you for the insightful comment, we have included these aspects in the revised text, please see page 20.

      (3) I am a little surprised that the authors did not explore differences in O-GlcNAc-modified proteins through a more targeted enrichment of these proteins for analysis of potential modification differences, in addition to just changes in protein abundance.

      We agree that these experiments would further strengthen the work. However, it is not known yet whether OGT-CDG is caused by loss of O-GlcNAc modification on specific proteins or due to as yet to decipher mechanisms (e.g. OGT interactome, HCF1 processing, feedback on OGA levels) which we are not able to confirm in the current manuscript. Therefore, as a starting point, we have performed whole proteome analysis to establish candidate hypothesis which could lead to discovering cellular and molecular mechanisms underlying OGT-CDG. Lastly, we appreciate the reviewers’ comment and will continue to work along these lines, and report in a follow up manuscript in the future.

    1. 通过对这些参数的系统优化,可以实现对最终缺陷结构的精确控制,既能阐明潜在的缺陷形成机制,又能获得理想的材料性能。

      Y. Luo , S. Bag , O. Zaremba , A. Cierpka , J. Andreo , S. Wuttke , P. Friederich and M. Tsotsalas , MOF Synthesis Prediction Enabled by Automatic Data Mining and Machine Learning, Angew. Chem., Int. Ed., 2022, 61 , e202200242 通过自动数据挖掘与机器学习实现 MOF 合成预测

    2. Furthermore, temperature has been unequivocally linked to defect generation, which likely stems from the thermally induced instability of Zr-O bonds between modulators and inorganic metal-oxo clusters at elevated temperatures. Consequently, higher temperatures correlate with fewer defects, thereby facilitating the detachment of modulator-capped ligands from the inorganic clusters.42,43 Following such detachment, terephthalic acid (BDC) ligands can coordinate with Zr nodes, leading to a reduction in structural defects.42

      温度与缺陷生成明确相关,这很可能源于高温下调节剂与无机金属-氧簇之间 Zr-O 键的热诱导不稳定性。因此,较高温度对应较少缺陷,从而促进调节剂封端配体从无机簇上脱离。随后,对苯二甲酸(BDC)配体可与 Zr 节点配位,导致结构缺陷减少 42.C. S. Cox , E. Slavich , L. K. Macreadie , L. K. McKemmish and M. Lessio , Understanding the Role of Synthetic Parameters in the Defect Engineering of UiO-66: A Review and Meta-analysis, Chem. Mater., 2023, 35 , 3057 —3072 43。X. Qiu and R. Wang , From construction strategies to applications: Multifunctional defective metal-organic frameworks, Coord. Chem. Rev., 2025, 526 , 216356

    3. 通过结合光谱分析与理论计算,Tan 等人发现了 UiO-66 中涉及氢键羧酸与 H 2 O 物种的独特缺陷补偿机制 41

      这反映了不同竞争物种在缺陷调控中的协同作用,然而,竞争物种间的协同机制仍不明确。 K. Tan , H. Pandey , H. Wang , E. Velasco , K.-Y. Wang , H.-C. Zhou , J. Li and T. Thonhauser , Defect Termination in the UiO-66 Family of Metal–Organic Frameworks: The Role of Water and Modulator, J. Am. Chem. Soc., 2021, 143 , 6328 —6332

    4. H 2 O/HCl 调节剂展现出竞争性成核/生长效应 39 ,而双组分体系(如 H 2 O/乙酸)则能通过协同缺陷放大实现 hcp 相形成。 40

      双组分调节 M. A. Artsiusheuski , N. P. M. Casati , A. H. Clark , M. Nachtegaal , R. Verel , J. A. van Bokhoven and V. L. Sushkevich , Controlling the Mechanism of Nucleation and Growth Enables Synthesis of UiO-66 Metal–Organic Framework with Desired Macroscopic Properties, Angew. Chem., Int. Ed., 2024, e202415919 40.X. Chen , Y. Lyu , Z. Wang , X. Qiao , B. C. Gates and D. Yang , Tuning Zr12O22 Node Defects as Catalytic Sites in the Metal–Organic Framework hcp UiO-66, ACS Catal., 2020, 10 , 2906 —2914

    5. 缺陷工程通过可控缺陷(如缺失簇/配体)策略性地引入介孔(2–50 nm),实现拓扑相变(例如 UiO-66 中从 fcu 到 reo 结构)和分级孔隙结构

      A. Jrad , G. Al Sabeh , K. Hannouche , R. Al Natour , O. Haidar , H. Sammoury , M. N. Ahmad and M. Hmadeh , Critical Role of Defects in UiO-66 Nanocrystals for Catalysis and Water Remediation, ACS Appl. Nano Mater., 2023, 6 , 18698 —18720

    6. However, conventional MOFs like ZIF-8, UiO-66-NH2 and MIL-100(Fe)—widely studied for QNs' adsorption26–29—often suffer from limited micropores (<10 Å) and/or narrow pore apertures due to short ligand constraints,30 hindering mass transport of bulky pharmaceuticals.

      26.L. Zhou , N. Li , G. Owens and Z. Chen , Simultaneous removal of mixed contaminants, copper and norfloxacin, from aqueous solution by ZIF-8, Chem. Eng. J., 2019, 362 , 628 —637 27.G. Chaturvedi , A. Kaur , A. Umar , M. A. Khan , H. Algarni and S. K. Kansal , Removal of fluoroquinolone drug, levofloxacin, from aqueous phase over iron based MOFs, MIL-100(Fe), J. Solid State Chem., 2020, 281 , 121029 28.R. Yu and Z. Wu , High adsorption for ofloxacin and reusability by the use of ZIF-8 for wastewater treatment, Microporous Mesoporous Mater., 2020, 308 , 110494 29.X. Fang , S. B. Wu , Y. H. Wu , W. Yang , Y. L. Li , J. Y. He , P. D. Hong , M. X. Nie , C. Xie , Z. J. Wu , K. S. Zhang , L. T. Kong and J. H. Liu , High-efficiency adsorption of norfloxacin using octahedral UIO-66-NH2 nanomaterials: Dynamics, thermodynamics, and mechanisms, Appl. Surf. Sci., 2020, 518 , 146226 30.H. Wang , X. Pei , M. J. Kalmutzki , J. Yang and O. M. Yaghi , Large Cages of Zeolitic Imidazolate Frameworks, Acc. Chem. Res., 2022, 55 , 707 —721

    7. Metal–organic frameworks (MOFs), crystalline porous materials formed by coordinated assembly of metal clusters and organic ligands,17

      C. S. Diercks , M. J. Kalmutzki , N. J. Diercks and O. M. Yaghi , Conceptual Advances from Werner Complexes to Metal–Organic Frameworks, ACS Cent. Sci., 2018, 4 , 1457 —1464

    1. 如图 1a 所示,基于配体功能化策略,将带有吸电子基团(2-氟对苯二甲酸)的有机配体引入 Ce-UiO-66 的组装中,这有望增加 Ce-UiO-66 的缺陷密度和活性位点。扫描电子显微镜(SEM)观察表明,如图 1b 和 1c 所示,CUH 和 CUF 催化剂呈现出不规则的八面体形状,与 UiO-66 的结构原型相似[14]。此外,如图 1d 和 1e 所示,CUF 催化剂的尺寸大于 CUH 催化剂。通过 HR-TEM 图像进一步获得了 CUH 和 CUF 催化剂的缺陷结构信息。如图 S1 所示,CUH 催化剂中相邻 Ce-oxo 节点的距离均匀,而由于有机连接体的部分缺失(用黄色圆圈标记),CUF 催化剂中相邻 Ce-oxo 节点的规则距离被破坏,表明 CUF 催化剂中存在结构缺陷。 基于理想的 Ce-UiO-66-X 晶体结构(Ce 6 (OH) 4 O 4 (BDC-X) 6 ),Ce-UiO-66 中铈与有机连接体的理想摩尔比为 6:6,催化剂中铈和有机连接体的含量通过 ICP-OES(表 S1)和定量 1 H NMR 谱(图 S2a 和 S2b)结果进行量化。如图 1f 所示,CUH 催化剂的缺陷密度为 8.3%,而 CUF 催化剂的缺陷密度为 17.3%,这表明在 Ce-UiO-66 催化剂的组装过程中引入 2-氟对苯二甲酸能够产生更多缺陷。

      表征

    2. CUH 的 XRD 图谱(图 2a)显示出尖锐的反射峰,位于 7.2°、8.3°和 24.8°的衍射峰分别对应于 UiO-66(CCDC 编号 1036904)的(111)、(200)和(600)晶面[20]。对于 CUF 催化剂,其 XRD 图谱与 CUH 催化剂高度吻合。采用小角散射(SAXS)技术研究了 XRD 衍射峰位置的变化。如图 S3a 所示,观察到对应于催化剂(111)和(200)晶面的清晰圆环,而 CUF 催化剂中(111)和(200)晶面的峰位置向较低角度偏移(见图 S3b),这表明使用 2-氟对苯二甲酸替代对苯二甲酸配体导致了晶面间距的对称性扩张。图 2b 展示了 CUH 和 CUF 催化剂的 FTIR 光谱。CUH 位于 1567 cm⁻¹和 1386 cm⁻¹处的峰分别对应于有机连接基团羧酸官能团的反对称和对称伸缩振动[21]。 此外,在 CUH 和 CUF 催化剂中观察到的 1500 cm⁻¹处的峰可归属于配位金属中心的 Ce-O 伸缩振动和 Ce-O-C 振动[18]。对于 CUF 催化剂,位于 940 cm⁻¹和 1245 cm⁻¹的新峰归因于 2-氟对苯二甲酸中 C-F 基团的振动[22]、[23]。采用 X 射线光电子能谱(XPS)进一步研究催化剂的元素组成。如图 S4 所示,XPS 谱图证实了 CUH 和 CUF 催化剂中存在 Ce、O 和 C 元素,而 Ce 的含量低于 CUH(见表 S2),这与 ICP-OES 结果一致。在 CUF 催化剂中观察到一个对应于 F 元素的新峰,这可能与 2-氟对苯二甲酸的存在有关。此外,CUF 的元素分布图(图 S5)显示 Ce、O、F 和 C 元素均匀分布,进一步证实了 2-氟对苯二甲酸成功引入 CUF 催化剂,并可作为连接核心簇的配位位点。

      继续表征

    3. 如图 3a 所示,Ce 的高分辨率 XPS 谱图可分解为 Ce 3d 5/2 和 Ce 3d 3/2 的自旋轨道劈裂,其中包含 Ce 3+ 和 Ce 4+ 的八个峰。Ce 3+ 和 Ce 4+ 的含量通过相对峰面积计算得出,结果展示于图 3a。CUF 催化剂表现出比 CUH 催化剂更高的 Ce 3+ 含量,同时 CUF 催化剂中部分 Ce 3d 的结合能向高能方向偏移约 0.2 eV,这表明 2-氟对苯二甲酸中高电负性的 F 元素加剧了催化剂表面的电荷失衡与不饱和化学键。催化剂的氧谱可分为位于 529.6–530.7 eV 的晶格氧(O L )、位于 531.4–532.2 eV 的羧酸铈键(Ce–O–C)中化学吸附氧(O C )与吸附氧、以及位于 532.2–533.5 eV 的羟基氧(O OH )[27], [28]。图 3b 显示 CUF 催化剂中化学吸附氧的浓度低于 CUH 催化剂,这归因于补偿性 Ce 3+ 的增加。 高浓度的化学吸附氧因其高反应活性对催化反应产生积极影响,促进了活性氧物种的生成[29]。此外,CUH 和 CUF 催化剂的 C 1s 光谱如图 S6 和图 S7a 所示。位于 284.8 eV 和 288.8 eV 的峰分别归属于 C–C/C = C 和 O-C = O(羰基和羧基),而 CUF 的 C 1s 光谱中在 287.1 eV 处出现的新峰对应于共价 C-F 键[30, 31]。在图 S7b 中,687.2 eV 和 684.8 eV 的结合能分别对应于共价 C-F 键和半离子型 C-F 键[32, 33]。苯环的π电子对 C-F 键的贡献调节了 C–F 键长,导致 C–F 键呈现离子特性,与共价 C-F 相比具有更高的催化活性[32]。

      机理以及苯Π电子导致C-F的离子性

    1. fixada
      • Tarifa = Fixada pela proposta vencedora da licitação;

      • <u>Revisão</u> da tarifa = regras previstas em lei, contrato e edital


      Observação: - Reitere-se que não é o Poder Concedente quem fixa o preço da tarifa. É a melhor proposta, selecionada pelo processo licitatório, que estabelece e fixa o preço da tarifa.

      • Com efeito, a preservação da tarifa se dará mediante as regras previstas em lei, contrato e edital.
    1. I've had the same issue after taking mine completely apart. I can see the the a is too high, and the o and p are too low. This will happen the the type guide isn't in the correct position, and on your machine, it looks like it needs to be adjusted to the right, to bring the left side of the kb down, and the right side up. It's a fiddly process, and a small adjustment makes a big difference, so take it slow. Use the q and p keys as they are further apart on the segment. Give it a try and come back here to show the results.

      via u/guneeyoufix at https://www.reddit.com/r/typewriters/comments/1s6irjx/can_someone_help_me_with_unaligned_letters_on_my/

      as a reply to u/Fit_Artichoke_8668 with respect to unaligned letters on a Corona 3 typewriter. The typing line of the lowercase was very wavy (up and down), so not simply a case of on feet or motion.

    1. t 0 lb ac-1 y-1, o

      With the bug fixes, this difference is now small enough that it rounds to zero.

      crop removal = 3.72<br /> 20% reduction = 3.68

    Annotators

    1. B+树的高度在3层时存储的数据可能已达千万级别,但对于跳表而言同样去维护千万的数据量那么所造成的跳表层数过高而导致的磁盘io次数增多,也就是使用B+树在存储同样的数据下磁盘io次数更少。

      B+树 (B+ Tree):以节省空间、减少磁盘I/O为设计目标。通过高扇出(每个节点存很多键)来降低树的高度,非常适合磁盘或SSD等慢速存储。

      跳表 (Skip List):以实现简单、写入性能高为目标。它不介意用更多内存(存储大量指针)来换取O(log n)的查询速度和简单的实现,因此非常适合Redis这种全内存数据库。

    1. La llamé preguntando si existe tinta o papel que pueda afectar la mente. Quizás piensa que estoy loco. Quizás lo estoy.

      Es estupendo que haga referencia a esto pero no dice nada de que le colgó porque le dio vergüenza. Personalmente me parece relevante.

  5. Mar 2026
    1. Author response:

      The following is the authors’ response to the original reviews.

      Public Reviews:

      Reviewer #1 (Public review):

      Lipid transfer proteins (LTPs) play a crucial role in the intramembrane lipid exchange within cells. However, the molecular mechanisms that govern this activity remain largely unclear. Specifically, the way in which LTPs surmount the energy barrier to extract a single lipid molecule from a lipid bilayer is not yet fully understood. This manuscript investigates the influence of membrane properties on the binding of Ups1 to the membrane and the transfer of phosphatidic acid (PA) by the LTP. The findings reveal that Ups1 shows a preference for binding to membranes with positive curvature. Moreover, coarse-grained molecular dynamics simulations indicate that positive curvature decreases the energy barrier associated with PA extraction from the membrane. Additionally, lipid transfer assays conducted with purified proteins and liposomes in vitro demonstrate that the size of the donor membrane significantly impacts lipid transfer efficiency by Ups1-Mdm35 complexes, with smaller liposomes (characterized by high positive curvature) promoting rapid lipid transfer.

      This study offers significant new insights into the reaction cycle of phosphatidic acid (PA) transfer by Ups1 in mitochondria. Notably, the authors present compelling evidence that, alongside negatively charged phospholipids, positive membrane curvature enhances lipid transfer - an effect that is particularly relevant at the mitochondrial outer membrane. The experiments are technically robust, and my primary feedback pertains to the interpretation of specific results.

      (1) The authors conclude from the lipid transfer assays (Figure 5) that lipid extraction is the rate-limiting step in the transfer cycle. While this conclusion seems plausible, it should be noted that the authors employed high concentrations of Ups1-Mdm35 along with less negatively charged phospholipids in these reactions. This combination may lead to binding becoming the rate-limiting factor. The authors should take this point into consideration. In this type of assay, it is challenging to clearly distinguish between binding, lipid extraction, and membrane dissociation as separate processes.

      We have included a detailed consideration of this issue on page 11 of the revised manuscript.

      (2) The authors should discuss that variations in the size of liposomes will also affect the distance between them at a constant concentration, which may affect the rate of lipid transfer. Therefore, the authors should determine the average size and size distribution of liposomes after sonication (by DLS or nanoparticle analyzer, etc.)

      We have included DLS measurements for all lipid sizes (page 6) (SupFig. 2A). Due to the sensitivity of the intensity distribution in DLS measurements by larger particles, we also conducted cryo-EM analysis of vesicles with different sizes (page 6) (SupFig. 2B).

      We also now discuss the challenges posed by a fixed membrane-binding surface, which can lead to variations in vesicle spacing when using liposomes of different sizes and its possible influence on the interpretation of results (page 10-11).

      (3) The authors use NBD-PA in the lipid transfer assays. Does the size of the donor liposomes affect the transfer of NBD-PA and DOPA similarly? Since NBD-labeled lipids are somewhat unstable within lipid bilayers (as shown by spontaneous desorption in Figure 5B), monitoring the transfer of unlabeled PA in at least one setting would strengthen the conclusion of the swap experiments.

      To experimentally address this comment, we explored several different approaches. We first performed transfer experiments using unlabelled lipids, following the general procedures described in the manuscript. After the transfer reaction, we attempted to separate donor and acceptor vesicles by centrifugation and subsequently analyzed the samples by high-resolution mass spectrometry and thin-layer chromatography. Despite considerable effort, we were not able to reliably separate the differently sized liposomes. In particular, small liposomes proved difficult to handle during centrifugation, which is a well-known challenge (Kučerka et al. 1994, BBA; Boucrot et al. 2012, Cell). In addition, liposomes exhibited a tendency to cross-link in the presence of protein, further complicating the separation. Even if this separation step were straightforward, an important limitation of such an approach is that it is very difficult to monitor lipid transfer with sufficient time resolution. Much of the relevant activity occurs within the first 20–30 seconds, and precise interruption at defined time points would be essential.

      We therefore set out to establish a fluorescence-based assay that would allow us to follow lipid transfer in real time. For this, we adapted a dequenching-type assay based on a PE coupled fluorescein dye, whose fluorescence is quenched in the proximity of negative charges (e.g., negatively charged lipid headgroups). In principle, this assay should allow us to monitor the movement of negatively charged PA lipids away from donor membranes. Although a fluorescein-based passive lipid-transfer assay has been described previously (Richens et al., 2017), it is used only rarely in the lipid-transfer field. While establishing this assay, we encountered several technical challenges. For example, immediately after protein addition, fluorescence intensity changed in unexpected ways that could not be attributed to lipid transfer. Such effects have been reported in the literature (Wall et al., 1995) and are most likely caused by changes in membrane charge density upon protein binding. After extensive fine -tuning of the experimental conditions and careful evaluation of the data, we were ultimately able to demonstrate that lipid-transfer rates are significantly higher with smaller than with larger liposomes. These results confirm our initial observations, and importantly, they were obtained using unlabelled PA.

      The revised manuscript now includes this independent lipid-transfer assay demonstrating the transfer of non-labelled PA (page 11) (SupFig. 4).

      (4) The present study suggests that membrane domains with positive curvature at the outer membrane may serve as starting points for lipid transport by Ups1-Mdm35. Is anything known about the mechanisms that form such structures? This should be discussed in the text.

      We included a detailed consideration of this interesting point in the discussion section on page 13-14.

      Reviewer #2 (Public review):

      Summary:

      Lipid transfer between membranes is essential for lipid biosynthesis across different organelle membranes. Ups1-Mdm35 is one of the best-characterized lipid transfer proteins, responsible for transferring phosphatidic acid (PA) between the mitochondrial outer membrane (OM) and inner membrane (IM), a process critical for cardiolipin (CL) synthesis in the IM. Upon dissociation from Mdm35, Ups1 binds to the intermembrane space (IMS) surface of the OM, extracts a PA molecule, re-associates with Mdm35, and moves through the aqueous IMS to deliver PA to the IM. Here, the authors analyzed the early steps of this PA transfer - membrane binding and PA extraction - using a combination of in vitro biochemical assays with lipid liposomes and purified Ups1-Mdm35 to measure liposome binding, lipid transfer between liposomes, and lipid extraction from liposomes. The authors found that membrane curvature, a previously overlooked property of the membrane, significantly affects PA extraction but not PA insertion into liposomes. These findings were further supported by MD simulations.

      Strengths:

      The experiments are well-designed, and the data are logically interpreted. The present study provides an important basis for understanding the mechanism of lipid transfer between membranes.

      Weaknesses:

      The physiological relevance of membrane curvature in lipid extraction and transfer still remains open.

      We thank the reviewer for the constructive feedback on our work. We agree that the physiological relevance of membrane curvature in lipid extraction and transfer remains an open question. Our data show that Ups1 binding to native-like OM membranes under physiological pH conditions is curvature-dependent, supporting the idea that this mechanism may optimize lipid transfer in vivo. While the intricate biophysical basis of this behaviour can only be dissected in vitro, these findings offer valuable insight into how curvature may functionally regulate Ups1 activity in the cellular context. To directly test this, it will be important in future studies to identify Ups1 mutants that lack curvature sensitivity and assess their performance in vivo, which will help clarify the physiological importance of this mechanism.

      Reviewer #3 (Public review):

      The manuscript by Sadeqi et al. studies the interactions between the mitochondrial protein Ups1 and reconstituted membranes. The authors apply synthetic liposomal vesicles to investigate the role of pH, curvature, and charge on the binding of Ups1 to membranes and its ability to extract PA from them. The manuscript is well written and structured. With minor exceptions, the authors provide all relevant information (see minor points below) and reference the appropriate literature in their introduction. The underlying question of how the energy barrier for lipid extraction from membranes is overcome by Ups1 is interesting, and the data presented by the authors could offer a valuable new perspective on this process. It is also certainly a challenging in vitro reconstitution experiment, as the authors aim to disentangle individual membrane properties (e.g., curvature, charge, and packing density) to study protein adsorption and lipid transfer. I have one major suggestion and a few minor ones that the authors might want to consider to improve their manuscript and data interpretation:

      Major Comments:

      The experiments are performed with reconstituted vesicles, which are incubated with recombinant protein variants and quantitatively assessed in flotation and pelleting assays. According to the Materials and Methods section, the lipid concentration in these assays is kept constant at 5 µM. However, the authors change the size of the vesicles to tune their curvature. Using the same lipid concentration but varying vesicle sizes results in different total vesicle concentrations. Moreover, larger vesicles (produced by freeze-thawing and extrusion) tend to form a higher proportion of multilamellar vesicles, thus also altering the total membrane area available for binding. Could these differences in the experimental system account for the variation in binding? To address this, the authors would need to perform the experiments either under saturated (excess protein) conditions or find an experimental approach to normalize for these differences.

      To experimentally address this comment, we have conducted a detailed structural analysis of liposomes of different sizes using cryo-EM to determine the degrees of multi-lamellarity and to estimate how much membrane surface is available for protein binding. We found that while indeed as expected liposomes extruded through a 400 nm sized filter showed about 75 % of the initially calculated membrane surface is still available (SupFig. 3A). For 50 nm extruded liposomes, this number went up to about 93 % and for sonicated liposomes the number was about 94 %. Given the fact that we found about 70 % binding of Ups1 to sonicated liposomes, while this number went down to about 40 % with 50 nm liposomes and to about 30 % for 400 nm extruded liposomes, we can rule out that the effects we observe are due to an increased or decreased available membrane binding area.

      Additionally, we performed experiments with increasing amounts of lipids to analyse the impact of lipid concentration on Ups1 membrane binding, when comparing 400 nm extruded liposomes with sonicated liposomes. Interestingly, while we do observe an increased binding of Ups1 to sonicated liposomes with concentrations varying between 2.5 mM to 10 mM no major increase in binding was observed with 400 nm extruded liposomes. Ups1 membrane binding to sonicated liposomes highly exceeded binding to 400 nm extruded liposomes under all tested conditions (page 7) (SupFig. 3B).

      Recommendations for the authors:

      Reviewer #2 (Recommendations for the authors:):

      (1) Figures 1, 2, and 3 - In the flotation assays, the Ups1-containing fractions differ between experiments. The presence of liposomes in these fractions should be confirmed, for example, by fluorescence measurements. In relation to this, the broad low MW bands in Supplementary Figure 3 may reflect liposomes (mixed micelles of lipids and SDS?), as their fractionation patterns coincide with those of Ups1 at pH 5.5 -6.7 but deviate at pH 7.0 and 7.5. Could the authors clarify this discrepancy?

      Flotation profiles vary with changing conditions of the experiment. We have included a picture of a gel showing the Coomassie staining and the fluorescence of the used lipids side by side to show that the protein bands co-migrate together with liposomes (SupFig. 5). 

      (2) Figures 2, 3, and 5 - The sizes of the liposomes (400 nm and 50 nm) should be experimentally confirmed, e.g., by dynamic light scattering (DLS).

      We have included DLS measurements confirming the differences of liposome sizes. Please see answer to point 2 of Reviewer 1.

      (3) Figure 4C - The free energy landscape for different phospholipids is interesting. What about other acidic phospholipids, such as PS?

      This is indeed an interesting point. Our molecular dynamics simulations show that PE has a similar free energy landscape to PA while PC is significantly different. This might point into the direction that the headgroup size plays a major role. For intra-mitochondrial PS transport a specific protein complex consisting of Ups2/Mdm35 has been identified, and it will be an interesting question for future studies if PS transfer is regulated by similar factors.

      (4) Supplementary Figure 2 - The deformation of liposomes by Ups1 is interesting. Does this depend on the presence of PA or other acidic phospholipids?

      We asked ourself the same question throughout the project. As pointed out in the manuscript, the membrane-deforming activity of Ups1 is relatively mild when compared to proteins found for example in endocytosis. This made a proper static analysis challenging. We weren’t able to unambiguously show whether other acidic phospholipids showed comparable effects to PA.

      (5) It may not be easy to assess experimentally, but the OM in mitochondria should have scramblase activity. Then, such scramblase activity could influence the observed effects of membrane curvature on Ups1-mediated PA transfer.

      (6) It would be helpful to discuss this possibility in the manuscript.

      In the revised version of the manuscript, we now discuss the existence of scramblases, such as Sam50 and VDAC, in the outer mitochondrial membrane with regard to their likely effect on membrane packing (page 13 - 14). As for a co-reconstitution experiment we considered the in vitro analysis of the impact that a scramblase in liposomes might have on lipid transfer outside the scope of this study. 

      (7) Figure 6 is not referenced in the main text.

      Thank you, this oversight was corrected.

      (8) The non-abbreviated forms of LUV and SUV should be defined in the text upon first use.

      We now include a definition in the manuscript.

      (9) The term "transfer velocity" would be better expressed as "transfer rate".

      We agree, and we changed the wording accordingly.

      Reviewer #3 (Recommendations for the authors):

      (1) As flotation assays are a central technique of the study, readers who are not familiar with this method could benefit from a few explanatory sentences and appropriate references in the introduction section.

      Figure 1B now contains an updated version of a cartoon outlining the flotation assay and a description in the manuscript (page 4) that should make it easier to understand the assay. We have also included a direct reference within the methods section to a paper describing this assay in more detail.

      (2) Related to the major point, but also to improve the manuscript overall, the authors could add DLS (for size distribution and zeta potential) and cryo-EM (for multilamellarity analysis) data. This would aid future efforts to reproduce their observations.

      In the revised version of the manuscript we include DLS and zeta potential measurements as well as a detailed analysis of liposome multilamellarity by cryo-EM (also see answer to point 2 by Reviewer 1) (SupFig. 2A & B; SupFig. 3E).

      (3) Could the authors state the specific zeta potentials of the negatively charged (under varying pH) and neutral liposomes and relate these to natural membranes?

      We have included zeta potential measurements of differently charged liposomes in and changed the text accordingly (page 8) (SupFig. 3E).

      (4) Changes in pH affect several characteristics of membranes (including lipid dipoles, charge, packing density, fluidity, and phase separation), particularly charge density. This experimental system does not allow all of these factors to be disentangled and studied separately. Some of the observations presented in Figures 2 and 5 could also be explained by these effects.

      The effects of pH on various membrane properties, such as lipid headgroup dipoles, lipid packing, interfacial tension, and others, are well described in the literature. For example, it was implied that increasing pH leads to phosphatidic acid (PA) becoming more negatively charged when in proximity to phosphatidylethanolamine (PE). We already discuss this effect in the manuscript, as our observation that Ups1 binding to membranes depends on negatively charged lipids but nevertheless increases with decreasing pH is unexpected.

      As pointed out, many of the parameters mentioned above are beyond control in our assays, and a systematic analysis of each of these factors with respect to Ups1 membrane binding and lipid transfer would be well beyond the scope of this manuscript. We have therefore included a passage discussing this issue in more detail (page 4-5).

      (5) Is the curvature simulated in the theoretical models comparable to the curvature of the liposome systems (e.g., a sphere of 100 nm diameter)?

      The simulated curvature spans a defined range, with the highest curvature corresponding to vesicles with diameters of approximately 15 nm. This corresponds reasonably well to the vesicle size distribution as analyzed by cryo-EM.

      Reference

      Connerth, M., Tatsuta, T., Haag, M., Klecker, T., Westermann, B., & Langer, T. (2012). Intramitochondrial transport of phosphatidic acid in yeast by a lipid transfer protein. Science, 338(6108), 815-818. https://doi.org/10.1126/science.1225625

      Lu, J., Chan, C., Yu, L., Fan, J., Sun, F., & Zhai, Y. (2020). Molecular mechanism of mitochondrial phosphatidate transfer by Ups1. Commun Biol, 3(1), 468. https://doi.org/10.1038/s42003-020-01121-x

      Miliara, X., Garnett, J. A., Tatsuta, T., Abid Ali, F., Baldie, H., Perez-Dorado, I., Simpson, P., Yague, E., Langer, T., & Matthews, S. (2015). Structural insight into the TRIAP1/PRELI-like domain family of mitochondrial phospholipid transfer complexes. EMBO Rep, 16(7), 824-835. https://doi.org/10.15252/embr.201540229

      Miliara, X., Tatsuta, T., Berry, J. L., Rouse, S. L., Solak, K., Chorev, D. S., Wu, D., Robinson, C. V., Matthews, S., & Langer, T. (2019). Structural determinants of lipid specificity within Ups/PRELI lipid transfer proteins. Nat Commun, 10(1), 1130. https://doi.org/10.1038/s41467-019-09089-x

      Miliara, X., Tatsuta, T., Eiyama, A., Langer, T., Rouse, S. L., & Matthews, S. (2023). An intermolecular hydrogen-bonded network in the PRELID-TRIAP protein family plays a role in lipid sensing. Biochim Biophys Acta Proteins Proteom, 1871(1), 140867. https://doi.org/10.1016/j.bbapap.2022.140867

      Potting, C., Tatsuta, T., Konig, T., Haag, M., Wai, T., Aaltonen, M. J., & Langer, T. (2013). TRIAP1/PRELI complexes prevent apoptosis by mediating intramitochondrial transport of phosphatidic acid. Cell Metab, 18(2), 287-295. https://doi.org/10.1016/j.cmet.2013.07.008

      Richens, J. L., Tyler, A. I. I., Barriga, H. M. G., Bramble, J. P., Law, R. V., Brooks, N. J., Seddon, J. M., Ces, O., & O'Shea, P. (2017). Spontaneous charged lipid transfer between lipid vesicles. Sci Rep, 7(1), 12606. https://doi.org/10.1038/s41598-017-12611-0

      Wall, J., Golding, C. A., Van Veen, M., & O'Shea, P. (1995). The use of fluoresceinphosphaCdylethanolamine (FPE) as a real-time probe for peptide-membrane interactions. Mol Membr Biol, 12(2), 183-192. https://doi.org/10.3109/09687689509027506

      Watanabe, Y., Tamura, Y., Kawano, S., & Endo, T. (2015). Structural and mechanistic insights into phospholipid transfer by Ups1-Mdm35 in mitochondria. Nat Commun, 6, 7922. https://doi.org/10.1038/ncomms8922

    1. Art. 1.238

      Usucapião regular: 15 anos, independentemente de título. Não é pré-requisito a inexistência de qualquer outra propriedade.

      No entanto, reduzir-se-á para 10 anos a prescrição aquisitiva se o imóvel for utilizado para a moradia habitual da família ou se for realizado obra ou serviço de caráter produtivo.

    2. condição

      Condição é o elemento acidental no negócio jurídico, que subordina, no plano eficacial, o efeito do negócio jurídico a evento futuro e incerto. Portanto, é cláusula voluntária e acessória, pois depende exclusivamente da vontade das partes e não é imposta por lei senão por convenção.


      Classificação das condições quanto à origem da condição:

      • Condições causais ou casuais – são aquelas que têm origem em eventos naturais, em fatos jurídicos stricto sensu. Exemplo: alguém se compromete a vender um bem a outrem caso chova.

      • Condições potestativas – são aquelas que dependem do elemento volitivo, da vontade humana, sendo pertinente a seguinte subclassificação:

        • Condições simplesmente ou meramente potestativas – dependem das vontades intercaladas de duas pessoas, sendo totalmente lícitas. Exemplo: alguém institui uma liberalidade a favor de outrem, dependente de um desempenho artístico (v.g. cantar em um espetáculo).

        • Condições puramente potestativas – dependem de uma vontade unilateral, sujeitando-se ao puro arbítrio de uma das partes (art. 122 do CC, parte final). São ilícitas, segundo esse mesmo dispositivo. Exemplo: dou-lhe um veículo, se eu quiser.

      • Maria Helena Diniz aponta ainda a <u>condição promíscua</u>, como aquela “que se caracteriza no momento inicial como potestativa, vindo a perder tal característica por fato superveniente, alheio à vontade do agente, que venha a dificultar sua realização. Por exemplo, ‘dar-lhe-ei um carro se você, campeão de futebol, jogar no próximo torneio’. Essa condição potestativa passará a ser promíscua se o jogador vier a se machucar” (Dicionário jurídico..., 2005, tomo I, p. 902).

      • Condições mistas – são aquelas que dependem, ao mesmo tempo, de um ato volitivo, somado a um evento natural. Exemplo: dou-lhe um veículo se você cantar amanhã, desde que esteja chovendo durante o espetáculo.

      (TARTUCE, Flávio. Direito Civil Vol.1 - 21ª Edição 2025. 21. ed. Rio de Janeiro: Forense, 2025. E-book. p.406.)

    1. Por exemplo, ao usar métodos como Array.prototype.map()o que retorna o construtor padrão, você deseja que esses métodos retornem um Arrayobjeto pai, em vez do MyArrayobjeto. O Symbol.speciessímbolo permite
    1. bajo incertidumbre

      A manera de observación: En este capítulo incluyes conceptos y definiciones que obligan a pensar que trabajas con modelos aleatorios y con incertidumbre, sin embargo, en tu resumen o abstract, mencionas que se trabajarán modelos deterministas. Allí veo una inconsistencia.

    1. Very frequently the nomination goes to the man withan “O” at the beginning or end of his name rather than to an indi-vidual who might make a good officcholder on other and perhapsmore significant grounds.

      represent

    1. Reviewer #2 (Public review):

      Summary:

      To investigate the detachment and reattachment kinetics of kinesin-1, 2, and 3 motors against loads oriented parallel to the microtubule, the authors used a DNA tensiometer approach comprising a DNA entropic spring attached to the microtubule on one end and a motor on the other. They found that for kinesin-1 and kinesin-2, the dissociation rates at stall were smaller than the detachment rates during unloaded runs. With regard to the complex reattachment kinetics found in the experiments, the authors argue that these findings were consistent with a weakly-bound 'slip' state preceding motor dissociation from the microtubule. The behavior of kinesin-3 was different and (by the definition of the authors) only showed prolonged "detachment" rates when disregarding some of the slip events. The authors performed stochastic simulations that recapitulate the load-dependent detachment and reattachment kinetics for all three motors. They argue that the presented results provide insight into how kinesin-1, -2, and -3 families transport cargo in complex cellular geometries and compete against dynein during bidirectional transport.

      Strengths:

      The present study is timely, as significant concerns have been raised previously about studying motor kinetics in optical (single-bead) traps where significant vertical forces are present. Moreover, the obtained data are of high quality, and the experimental procedures are clearly described.

      Weaknesses:

      However, in the present version of the manuscript, the conclusions drawn from the experiments, the overall interpretation of the results, and the novelty over previous reports appear less clear.

      Major comments:

      (1) The use of the term "catch bond" is misleading, as the authors do not really mean consistently a catch bond in the classical sense (i.e., a protein-protein interaction having a dissociation rate that decreases with load). Instead, what they mean is that after motor detachment (i.e., after a motor protein dissociating from a tubulin protein), there is a slip state during which the reattachment rate is higher as compared to a motor diffusing in solution. While this may indeed influence the dynamics of bidirectional cargo transport (e.g., during tug-of-war events), the used terms (detachment (with or without slip?), dissociation, rescue, ...) need to be better defined and the results discussed in the context of these definitions. It is very unsatisfactory at the moment, for example, that kinesin-3 is at first not classified as a catch bond, but later on (after tweaking the definitions) it is. In essence, the typical slip/catch bond nomenclature used for protein-protein interaction is not readily applicable for motors with slippage.

      (2) The authors define the stall duration as the time at full load, terminated by >60 nm slips/detachments. Isn't that a problem? Smaller slips are not detected/considered... but are also indicative of a motor dissociation event, i.e., the end of a stall. What is the distribution of the slip distances? If the slip distances follow an exponential decay, a large number of short slips are expected, and the presented data (neglecting those short slips) would be highly distorted.

      (3) Along the same line: Why do the authors compare the stall duration (without including the time it took the motor to reach stall) to the unloaded single motor run durations? Shouldn't the times of the runs be included?

      (4) At many places, it appears too simple that for the biologically relevant processes, mainly/only the load-dependent off-rates of the motors matter. The stall forces and the kind of motor-cargo linkage (e.g., rigid vs. diffusive) do likely also matter. For example: "In the context of pulling a large cargo through the viscous cytoplasm or competing against dynein in a tug-of-war, these slip events enable the motor to maintain force generation and, hence, are distinct from true detachment events." I disagree. The kinesin force at reattachment (after slippage) is much smaller than at stall. What helps, however, is that due to the geometry of being held close to the microtubule (either by the DNA in the present case or by the cargo in vivo) the attachment rate is much higher. Note also that upon DNA relaxation ,the motor is likely kept close to the microtubule surface, while, for example, when bound to a vesicle, the motor may diffuse away from the microtubule quickly (e.g., reference 20).

      (5) Why were all motors linked to the neck-coil domain of kinesin-1? Couldn't it be that for normal function, the different coils matter? Autoinhibition can also be circumvented by consistently shortening the constructs.

      (6) I am worried about the neutravidin on the microtubules, which may act as roadblocks (e.g. DOI: 10.1039/b803585g), slip termination sites (maybe without the neutravidin, the rescue rate would be much lower?), and potentially also DNA-interaction sites? At 8 nM neutravidin and the given level of biotinylation, what density of neutravidin do the authors expect on their microtubules? Can the authors rule out that the observed stall events are predominantly the result of a kinesin motor being stopped after a short slippage event at a neutravidin molecule?

      (7) Also, the unloaded runs should be performed on the same microtubules as in the DNA experiments, i.e., with neutravidin. Otherwise, I do not see how the values can be compared.

      (8) If, as stated, "a portion of kinesin-3 unloaded run durations were limited by the length of the microtubules, meaning the unloaded duration is a lower limit." corrections (such as Kaplan-Meier) should be applied, DOI: 10.1016/j.bpj.2017.09.024.

      (9) Shouldn't Kaplan-Meier also be applied to the ramp durations ... as a ramp may also artificially end upon stall? Also, doesn't the comparison between ramp and stall duration have a problem, as each stall is preceded by a ramp ...and the (maximum) ramp times will depend on the speed of the motor? Kinesin-3 is the fastest motor and will reach stall much faster than kinesin-1. Isn't it obvious that the stall durations are longer than the ramp duration (as seen for all three motors in Figure 3)?

      (10) It is not clear what is seen in Figure S6A: It looks like only single motors (green, w/o a DNA molecule) are walking ... Note: the influence of the attached DNA onto the stepping duration of a motor may depend on the DNA conformation (stretched and near to the microtubule (with neutravidin!) in the tethered case and spherically coiled in the untethered case).

      (11) Along this line: While the run time of kinesin-1 with DNA (1.4 s) is significantly shorter than the stall time (3.0 s), it is still larger than the unloaded run time (1.0 s). What do the authors think is the origin of this increase?

      (12) "The simplest prediction is that against the low loads experienced during ramps, the detachment rate should match the unloaded detachment rate." I disagree. I would already expect a slight increase.

      (13) Isn't the model over-defined by fitting the values for the load-dependence of the strong-to-weak transition and fitting the load dependence into the transition to the slip state?

      (14) "When kinesin-1 was tethered to a glass coverslip via a DNA linker and hydrodynamic forces were imposed on an associated microtubule, kinesin-1 dissociation rates were relatively insensitive to loads up to ~3 pN, inconsistent with slip-bond characteristics (37)." This statement appears not to be true. In reference 37, very similar to the geometry reported here, the microtubules were fixed on the surface, and the stepping of single kinesin motors attached to large beads (to which defined forces were applied by hydrodynamics) via long DNA linkers was studied. In fact, quite a number of statements made in the present manuscript have been made already in ref. 37 (see in particular sections 2.6 and 2.7), and the authors may consider putting their results better into this context in the Introduction and Discussion. It is also noteworthy to discuss that the (admittedly limited) data in ref. 37 does not indicate a "catch-bond" behavior but rather an insensitivity to force over a defined range of forces.

    2. Author response:

      Reviewer 1 (Public review):

      (1) Figure 1B shows the PREDICTED force-extension curve for DNA based on a worm-like chain model. Where is the experimental evidence for this curve? This issue is crucial because the F-E curve will decide how and when a catch-bond is induced (if at all it is) as the motor moves against the tensiometer. Unless this is actually measured by some other means, I find it hard to accept all the results based on Figure 1B.

      The Worm-Like-Chain model for the elasticity of DNA was established by early work from the Bustamante lab (Smith et al., 1992)  and Marko and Siggia (Marko and Siggia, 1995), and was further validated and refined by the Block lab (Bouchiat et al., 1999; Wang et al., 1997). The 50 nm persistence length is the consensus value, and was shown to be independent of force and extension in Figure 3 of Bouchiat et al (Bouchiat et al., 1999). However, we would like to stress that for our conclusions, the precise details of the Force-Extension relationship of our dsDNA are immaterial. The key point is that the motor stretches the DNA and stalls when it reaches its stall force. Our claim of the catch-bond character of kinesin is based on the longer duration at stall compared to the run duration in the absence of load. Provided that the motor is indeed stalling because it has stretched out the DNA (which is strongly supported by the repeated stalling around the predicted extension corresponding to ~6 pN of force), then the stall duration depends on neither the precise value for the extension nor the precise value of the force at stall.

      (2) The authors can correct me on this, but I believe that all the catch-bond studies using optical traps have exerted a load force that exceeds the actual force generated by the motor. For example, see Figure 2 in reference 42 (Kunwar et al). It is in this regime (load force > force from motor) that the dissociation rate is reduced (catch-bond is activated). Such a regime is never reached in the DNA tensiometer study because of the very construction of the experiment. I am very surprised that this point is overlooked in this manuscript. I am therefore not even sure that the present experiments even induce a catch-bond (in the sense reported for earlier papers).

      It is true that Kunwar et al measured binding durations at super-stall loads and used that to conclude that dynein does act as a catch-bond (but kinesin does not) (Kunwar et al., 2011). However, we would like to correct the reviewer on this one. This approach of exerting super-stall forces and measuring binding durations is in fact less common than the approach of allowing the motor to walk up to stall and measuring the binding duration. This ‘fixed trap’ approach has been used to show catch-bond behavior of dynein (Leidel et al., 2012; Rai et al., 2013) and kinesin (Kuo et al., 2022; Pyrpassopoulos et al., 2020). For the non-processive motor Myosin I, a dynamic force clamp was used to keep the actin filament in place while the myosin generated a single step (Laakso et al., 2008). Because the motor generates the force, these are not superstall forces either.

      (3) I appreciate the concerns about the Vertical force from the optical trap. But that leads to the following questions that have not at all been addressed in this paper:

      (i) Why is the Vertical force only a problem for Kinesins, and not a problem for the dynein studies?

      Actually, we do not claim that vertical force is not a problem for dynein; our data do not speak to this question. There is debate in the literature as to whether dynein has catch bond behavior in the traditional single-bead optical trap geometry - while some studies have measured dynein catch bond behavior (Kunwar et al., 2011; Leidel et al., 2012; Rai et al., 2013), others have found that dynein has slip-bond or ideal-bond behavior (Ezber et al., 2020; Nicholas et al., 2015; Rao et al., 2019). This discrepancy may relate to vertical forces, but not in an obvious way.

      (ii) The authors state that "With this geometry, a kinesin motor pulls against the elastic force of a stretched DNA solely in a direction parallel to the microtubule". Is this really true? What matters is not just how the kinesin pulls the DNA, but also how the DNA pulls on the kinesin. In Figure 1A, what is the guarantee that the DNA is oriented only in the plane of the paper? In fact, the DNA could even be bending transiently in a manner that it pulls the kinesin motor UPWARDS (Vertical force). How are the authors sure that the reaction force between DNA and kinesin is oriented SOLELY along the microtubule?

      We acknowledge that “solely” is an absolute term that is too strong to describe our geometry. We will soften this term in our revision to “nearly parallel to the microtubule”. In the Geometry Calculations section of Supplementary Methods, we calculate that if the motor and streptavidin are on the same protofilament, the vertical force will be <1% of the horizontal force. We also note that if the motor is on a different protofilament, there will be lateral forces and forces perpendicular to the microtubule surface, except they are oriented toward rather than away from the microtubule. The DNA can surely bend due to thermal forces, but because inertia plays a negligible role at the nanoscale (Howard, 2001; Purcell, 1977), any resulting upward forces will only be thermal forces, which the motor is already subjected to at all times.

      (4) For this study to be really impactful and for some of the above concerns to be addressed, the data should also have included DNA tensiometer experiments with Dynein. I wonder why this was not done?

      As much as we would love to fully characterize dynein here, this paper is about kinesin and it took a substantial effort. The dynein work merits a stand-alone paper.

      While I do like several aspects of the paper, I do not believe that the conclusions are supported by the data presented in this paper for the reasons stated above.

      The three key points the reviewer makes are the validity of the worm-like-chain model, the question of superstall loads, and the role of DNA bending in generating vertical forces. We hope that we have fully addressed these concerns in our responses above.

      Reviewer #2 (Public review):

      Major comments:

      (1) The use of the term "catch bond" is misleading, as the authors do not really mean consistently a catch bond in the classical sense (i.e., a protein-protein interaction having a dissociation rate that decreases with load). Instead, what they mean is that after motor detachment (i.e., after a motor protein dissociating from a tubulin protein), there is a slip state during which the reattachment rate is higher as compared to a motor diffusing in solution. While this may indeed influence the dynamics of bidirectional cargo transport (e.g., during tug-of-war events), the used terms (detachment (with or without slip?), dissociation, rescue, ...) need to be better defined and the results discussed in the context of these definitions. It is very unsatisfactory at the moment, for example, that kinesin-3 is at first not classified as a catch bond, but later on (after tweaking the definitions) it is. In essence, the typical slip/catch bond nomenclature used for protein-protein interaction is not readily applicable for motors with slippage.

      We appreciate the reviewer’s point and we will work to streamline and define terms in our revision.

      (2) The authors define the stall duration as the time at full load, terminated by >60 nm slips/detachments. Isn't that a problem? Smaller slips are not detected/considered... but are also indicative of a motor dissociation event, i.e., the end of a stall. What is the distribution of the slip distances? If the slip distances follow an exponential decay, a large number of short slips are expected, and the presented data (neglecting those short slips) would be highly distorted.

      The reviewer brings up a good point that there may be undetected slips. To address this question, we plotted the distribution of slip distances for kinesin-3, which by far had the most slip events. As the reviewer suggested, it is indeed an exponential distribution. Our preliminary analysis suggests that roughly 20% of events are missed due to this 60 nm cutoff. This will change our unloaded duration numbers slightly, but this will not alter our conclusions.\

      (3) Along the same line: Why do the authors compare the stall duration (without including the time it took the motor to reach stall) to the unloaded single motor run durations? Shouldn't the times of the runs be included?

      The elastic force of the DNA spring is variable as the motor steps up to stall, and so if we included the entire run duration then it would be difficult to specify what force we were comparing to unloaded. More importantly, if we assume that any stepping and detachment behavior is history independent, then it is mathematically proper to take any arbitrary starting point (such as when the motor reaches stall), start the clock there, and measure the distribution of detachments durations relative to that starting point.

      More importantly, what we do in Fig. 3 is to separate out the ramps from the stalls and, using a statistical model, we compute a separate duration parameter (which is the inverse of the off-rate) for the ramp and the stall. What we find is that the relationship between ramp, stall, and unloaded durations is different for the three motors, which is interesting in itself.

      (4) At many places, it appears too simple that for the biologically relevant processes, mainly/only the load-dependent off-rates of the motors matter. The stall forces and the kind of motor-cargo linkage (e.g., rigid vs. diffusive) do likely also matter. For example: "In the context of pulling a large cargo through the viscous cytoplasm or competing against dynein in a tug-of-war, these slip events enable the motor to maintain force generation and, hence, are distinct from true detachment events." I disagree. The kinesin force at reattachment (after slippage) is much smaller than at stall. What helps, however, is that due to the geometry of being held close to the microtubule (either by the DNA in the present case or by the cargo in vivo) the attachment rate is much higher. Note also that upon DNA relaxation, the motor is likely kept close to the microtubule surface, while, for example, when bound to a vesicle, the motor may diffuse away from the microtubule quickly (e.g., reference 20).

      We appreciate the reviewer’s detailed thinking here, and we offer our perspective. As to the first point, we agree that the stall force is relevant and that the rigidity of the motor-cargo linkage will play a role. The goal of the sentence on pulling cargo that the reviewer highlights is to set up our analysis of slips, which we define as rearward displacements that don’t return to the baseline before force generation resumes. We agree that force after slippage is much smaller than at stall, and we plan to clarify that section of text. However, as shown in the model diagram in Fig. 5, we differentiate between the slip state (and recovery from this slip state) and the detached state (and reattachment from this detached state). This delineation is important because, as the reviewer points out, if we are measuring detachment and reattachment with our DNA tensiometer, then the geometry of a vesicle in a cell will be different and diffusion away from the microtubule or elastic recoil perpendicular to the microtubule will suppress this reattachment.

      Our evidence for a slip state in which the motor maintains association with the microtubule comes from optical trapping work by Tokelis et al (Toleikis et al., 2020) and Sudhakar et al (Sudhakar et al., 2021). In particular, Sudhakar used small, high index Germanium microspheres that had a low drag coefficient. They showed that during ‘slip’ events, the relaxation time constant of the bead back to the center of the trap was nearly 10-fold slower than the trap response time, consistent with the motor exerting drag on the microtubule. (With larger beads, the drag of the bead swamps the motor-microtubule friction.) Another piece of support for the motor maintaining association during a slip is work by Ramaiya et al. who used birefringent microspheres to exert and measure rotational torque during kinesin stepping (Ramaiya et al., 2017). In most traces, when the motor returned to baseline following a stall, the torque was dissipated as well, consistent with a ‘detached’ state. However, a slip event is shown in S18a where the motor slips backward while maintaining torque. This is best explained by the motor slipping backward in a state where the heads are associated with the microtubule (at least sufficiently to resist rotational forces). Thus, we term the resumption after slip to be a rescue from the slip state rather than a reattachment from the detached state.

      To finish the point, with the complex geometry of a vesicle, during slip events the motor remains associated with the microtubule and hence primed for recovery. This recovery rate is expected to be the same as for the DNA tensiometer. Following a detachment, however, we agree that there will likely be a higher probability of reattachment in the DNA tensiometer due to proximity effects, whereas with a vesicle any elastic recoil or ‘rolling’ will pull the detached motor away from the microtubule, suppressing reattachment. We plan to clarify these points in the text of the revision.

      (5) Why were all motors linked to the neck-coil domain of kinesin-1? Couldn't it be that for normal function, the different coils matter? Autoinhibition can also be circumvented by consistently shortening the constructs.

      We chose this dimerization approach to focus on how the mechoanochemical properties of kinesins vary between the three dominant transport families. We agree that in cells, autoinhibition of both kinesins and dynein likely play roles in regulating bidirectional transport, as will the activity of other regulatory proteins. The native coiled-coils may act as as ‘shock absorbers’ due to their compliance, or they might slow the motor reattachment rate due to the relatively large search volumes created by their long lengths (10s of nm). These are topics for future work. By using the neck-coil domain of kinesin-1 for all three motors, we eliminate any differences in autoinhibition or other regulation between the three kinesin families and focus solely on differences in the mechanochemistry of their motor domains.

      (6) I am worried about the neutravidin on the microtubules, which may act as roadblocks (e.g. DOI: 10.1039/b803585g), slip termination sites (maybe without the neutravidin, the rescue rate would be much lower?), and potentially also DNA-interaction sites? At 8 nM neutravidin and the given level of biotinylation, what density of neutravidin do the authors expect on their microtubules? Can the authors rule out that the observed stall events are predominantly the result of a kinesin motor being stopped after a short slippage event at a neutravidin molecule?

      We will address these points in our revision.

      (7) Also, the unloaded runs should be performed on the same microtubules as in the DNA experiments, i.e., with neutravidin. Otherwise, I do not see how the values can be compared.

      We will address this point in our revision.

      (8) If, as stated, "a portion of kinesin-3 unloaded run durations were limited by the length of the microtubules, meaning the unloaded duration is a lower limit." corrections (such as Kaplan-Meier) should be applied, DOI: 10.1016/j.bpj.2017.09.024.

      (9) Shouldn't Kaplan-Meier also be applied to the ramp durations ... as a ramp may also artificially end upon stall? Also, doesn't the comparison between ramp and stall duration have a problem, as each stall is preceded by a ramp ...and the (maximum) ramp times will depend on the speed of the motor? Kinesin-3 is the fastest motor and will reach stall much faster than kinesin-1. Isn't it obvious that the stall durations are longer than the ramp duration (as seen for all three motors in Figure 3)?

      The reviewer rightly notes the many challenges in estimating the motor off-rates during ramps. To estimate ramp off-rates and as an independent approach to calculating the unloaded and stall durations, we developed a Markov model coupled with Bayesian inference methods to estimate a duration parameter (equivalent to the inverse of the off-rate) for the unloaded, ramp, and stall duration distributions. With the ramps, we have left censoring due to the difficulty in detecting the start of the ramps in the fluctuating baseline, and we have right censoring due to reaching stall (with different censoring of the ramp duration for the three motors due to their different speeds). The Markov model assumes a constant detachment probability and history independence, and thus is robust even in the face of left and right censoring (details in the Supplementary section). This approach is preferred over Kaplan-Meier because, although these non-parametric methods make no assumptions for the distribution, they require the user to know exactly where the start time is.

      Regarding the potential underestimate of the kinesin-3 unloaded run duration due to finite microtubule lengths. The first point is that the unloaded duration data in Fig. 2C are quite linear up to 6 s and are well fit by the single-exponential fit (the points above 6s don’t affect the fit very much). The second point is that when we used our Markov model (which is robust against right censoring) to estimate the unloaded and stall durations, the results agreed with the single-exponential fits very well (Table S2). For instance, the single-exponential fit for the kinesin-3 unloaded duration was 2.74 s (2.33 – 3.17 s 95% CI) and the estimate from the Markov model was 2.76 (2.28 – 3.34 s 95% CI). Thus, we chose not to make any corrections due to finite microtubule lengths.

      (10) It is not clear what is seen in Figure S6A: It looks like only single motors (green, w/o a DNA molecule) are walking ... Note: the influence of the attached DNA onto the stepping duration of a motor may depend on the DNA conformation (stretched and near to the microtubule (with neutravidin!) in the tethered case and spherically coiled in the untethered case).

      In Figure S6A kymograph, the green traces are GFP-labeled kinesin-1 without DNA attached (which are in excess) and the red diagonal trace is a motor with DNA attached. There are also two faint horizontal red traces, which are labeled DNA diffusing by (smearing over a large area during a single frame). Panel S6B shows run durations of motors with DNA attached. We agree that the DNA conformation will differ if it is attached and stretched (more linear) versus simply being transported (random coil), but by its nature this control experiment is only addressing random coil DNA.

      (11) Along this line: While the run time of kinesin-1 with DNA (1.4 s) is significantly shorter than the stall time (3.0 s), it is still larger than the unloaded run time (1.0 s). What do the authors think is the origin of this increase?

      Our interpretation of the unloaded kinesin-DNA result is that the much slower diffusion constant of the DNA relative to the motor alone enables motors to transiently detach and rebind before the DNA cargo has diffused away, thus extending the run duration. In contrast, such detachment events for motors alone normally result in the motor diffusing away from the microtubule, terminating the run. This argument has been used to reconcile the longer single-motor run lengths in the gliding assay versus the bead assay (Block et al., 1990). Notably, this slower diffusion constant should not play a role in the DNA tensiometer geometry because if the motor transiently detaches, then it will be pulled backward by the elastic forces of the DNA and detected as a slip or detachment event. We will address this point in the revision.

      (12) "The simplest prediction is that against the low loads experienced during ramps, the detachment rate should match the unloaded detachment rate." I disagree. I would already expect a slight increase.

      Agreed. We will change this text to: “The prediction for a slip bond is that against the low loads experienced during ramps, the detachment rate should be equal to or faster than the unloaded detachment rate.”

      (13) Isn't the model over-defined by fitting the values for the load-dependence of the strong-to-weak transition and fitting the load dependence into the transition to the slip state?

      Essentially, yes, it is overdefined, but that is essentially by design and it is still very useful. Our goal here was to make as simple a model as possible that could account for the data and use it to compare model parameters for the different motor families. Ignoring the complexity of the slip and detached states, a model with a strong and weak state in the stepping cycle and a single transition out of the stepping cycle is the simplest formulation possible. And having rate constants (k<sub>S-W</sub> and k<sub>slip</sub> in our case) that vary exponentially with load makes thermodynamic sense for modeling mechanochemistry (Howard, 2001). Thus, we were pleasantly surprised that this bare-bones model could recapitulate the unloaded and stall durations for all three motors (Fig. 5C-E).

      (14) "When kinesin-1 was tethered to a glass coverslip via a DNA linker and hydrodynamic forces were imposed on an associated microtubule, kinesin-1 dissociation rates were relatively insensitive to loads up to ~3 pN, inconsistent with slip-bond characteristics (37)." This statement appears not to be true. In reference 37, very similar to the geometry reported here, the microtubules were fixed on the surface, and the stepping of single kinesin motors attached to large beads (to which defined forces were applied by hydrodynamics) via long DNA linkers was studied. In fact, quite a number of statements made in the present manuscript have been made already in ref. 37 (see in particular sections 2.6 and 2.7), and the authors may consider putting their results better into this context in the Introduction and Discussion. It is also noteworthy to discuss that the (admittedly limited) data in ref. 37 does not indicate a "catch-bond" behavior but rather an insensitivity to force over a defined range of forces.

      The reviewer misquoted our sentence. The actual wording of the sentence was: “When kinesin-1 was connected to micron-scale beads through a DNA linker and hydrodynamic forces parallel to the microtubule imposed, dissociation rates were relatively insensitive to loads up to ~3 pN, inconsistent with slip-bond characteristics (Urbanska et al., 2021).” The sentence the reviewer quoted was in a previous version that is available on BioRxiv and perhaps they were reading that version. Nonetheless, in the revision we will note in the Discussion that this behavior was indicative of an ideal bond (not a catch-bond), and we will also add a sentence in the Introduction highlighting this work.

      Reviewer #3 (Public review):

      The authors attribute the differences in the behaviour of kinesins when pulling against a DNA tether compared to an optical trap to the differences in the perpendicular forces. However, the compliance is also much different in these two experiments. The optical trap acts like a ~ linear spring with stiffness ~ 0.05 pN/nm. The dsDNA tether is an entropic spring, with negligible stiffness at low extensions and very high compliance once the tether is extended to its contour length (Fig. 1B). The effect of the compliance on the results should be addressed in the manuscript.

      This is an interesting point. To address it, we calculated the predicted stiffness of the dsDNA by taking the slope of theoretical force-extension curve in Fig. 1B. Below 650 nm extension, the stiffness is <0.001 pN/nM; it reaches 0.01 pN/nM at 855 nm, and at 960 nm where the force is 6 pN the stiffness is roughly 0.2 pN/nm. That value is higher than the quoted 0.05 pN/nm trap stiffness, but for reference, at this stiffness, an 8 nm step leads to a 1.6 pN jump in force, which is reasonable. Importantly, the stiffness of kinesin motors has been estimated to be in the range of 0.3 pN (Coppin et al., 1996; Coppin et al., 1997). Granted, this stiffness is also nonlinear, but what this means is that even at stall, our dsDNA tether has a similar predicted compliance to the motor that is pulling on it. We will address this point in our revision.  

      Compared to an optical trapping assay, the motors are also tethered closer to the microtubule in this geometry. In an optical trap assay, the bead could rotate when the kinesin is not bound. The authors should discuss how this tethering is expected to affect the kinesin reattachment and slipping. While likely outside the scope of this study, it would be interesting to compare the static tether used here with a dynamic tether like MAP7 or the CAP-GLY domain of p150glued.

      Please see our response to Reviewer #2 Major Comment #4 above, which asks this same question in the context of intracellular cargo. We plan to address this in our revision. Regarding a dynamic tether, we agree that’s interesting – there are kinesins that have a second, non-canonical binding site that achieves this tethering (ncd and Cin8); p150glued likely does this naturally for dynein-dynactin-activator complexes; and we speculated in a review some years ago (Hancock, 2014) that during bidirectional transport kinesin and dynein may act as dynamic tethers for one another when not engaged, enhancing the activity of the opposing motor.

      In the single-molecule extension traces (Figure 1F-H; S3), the kinesin-2 traces often show jumps in position at the beginning of runs (e.g., the four runs from ~4-13 s in Fig. 1G). These jumps are not apparent in the kinesin-1 and -3 traces. What is the explanation? Is kinesin-2 binding accelerated by resisting loads more strongly than kinesin-1 and -3?

      Due to the compliance of the dsDNA, the 95% limits for the initial attachment position are +/- 290 nm (Fig. S2). Thus, some apparent ‘jumps’ from the detached state are expected. We will take a closer look at why there are jumps for kinesin-2 that aren’t apparent for kinesin-1 or -3.

      When comparing the durations of unloaded and stall events (Fig. 2), there is a potential for bias in the measurement, where very long unloaded runs cannot be observed due to the limited length of the microtubule (Thompson, Hoeprich, and Berger, 2013), while the duration of tethered runs is only limited by photobleaching. Was the possible censoring of the results addressed in the analysis?

      Yes. Please see response to Reviewer #2 points (8) and (9) above.

      The mathematical model is helpful in interpreting the data. To assess how the "slip" state contributes to the association kinetics, it would be helpful to compare the proposed model with a similar model with no slip state. Could the slips be explained by fast reattachments from the detached state?

      In the model, the slip state and the detached states are conceptually similar; they only differ in the sequence (slip to detached) and the transition rates into and out of them. The simple answer is: yes, the slips could be explained by fast reattachments from the detached state. In that case, the slip state and recovery could be called a “detached state with fast reattachment kinetics”. However, the key data for defining the kinetics of the slip and detached states is the distribution of Recovery times shown in Fig. 4D-F, which required a triple exponential to account for all of the data. If we simplified the model by eliminating the slip state and incorporating fast reattachment from a single detached state, then the distribution of Recovery times would be a single-exponential with a time constant equivalent to t<sub>1</sub>, which would be a poor fit to the experimental distributions in Fig. 4D-F.

      We appreciate the efforts and helpful suggestions of all three reviewers and the Editor.

      References:

      Block, S.M., L.S. Goldstein, and B.J. Schnapp. 1990. Bead movement by single kinesin molecules studied with optical tweezers. Nature. 348:348-352.

      Bouchiat, C., M.D. Wang, J. Allemand, T. Strick, S.M. Block, and V. Croquette. 1999. Estimating the persistence length of a worm-like chain molecule from force-extension measurements. Biophys J. 76:409-413.

      Coppin, C.M., J.T. Finer, J.A. Spudich, and R.D. Vale. 1996. Detection of sub-8-nm movements of kinesin by high-resolution optical-trap microscopy. Proc Natl Acad Sci U S A. 93:1913-1917.

      Coppin, C.M., D.W. Pierce, L. Hsu, and R.D. Vale. 1997. The load dependence of kinesin's mechanical cycle. Proc Natl Acad Sci U S A. 94:8539-8544.

      Ezber, Y., V. Belyy, S. Can, and A. Yildiz. 2020. Dynein Harnesses Active Fluctuations of Microtubules for Faster Movement. Nat Phys. 16:312-316.

      Hancock, W.O. 2014. Bidirectional cargo transport: moving beyond tug of war. Nat Rev Mol Cell Biol. 15:615-628.

      Howard, J. 2001. Mechanics of Motor Proteins and the Cytoskeleton. Sinauer Associates, Inc., Sunderland, MA. 367 pp.

      Kunwar, A., S.K. Tripathy, J. Xu, M.K. Mattson, P. Anand, R. Sigua, M. Vershinin, R.J. McKenney, C.C. Yu, A. Mogilner, and S.P. Gross. 2011. Mechanical stochastic tug-of-war models cannot explain bidirectional lipid-droplet transport. Proc Natl Acad Sci U S A. 108:18960-18965.

      Kuo, Y.W., M. Mahamdeh, Y. Tuna, and J. Howard. 2022. The force required to remove tubulin from the microtubule lattice by pulling on its alpha-tubulin C-terminal tail. Nature communications. 13:3651.

      Laakso, J.M., J.H. Lewis, H. Shuman, and E.M. Ostap. 2008. Myosin I can act as a molecular force sensor. Science. 321:133-136.

      Leidel, C., R.A. Longoria, F.M. Gutierrez, and G.T. Shubeita. 2012. Measuring molecular motor forces in vivo: implications for tug-of-war models of bidirectional transport. Biophys J. 103:492-500.

      Marko, J.F., and E.D. Siggia. 1995. Stretching DNA. Macromolecules. 28:8759-8770.

      Nicholas, M.P., F. Berger, L. Rao, S. Brenner, C. Cho, and A. Gennerich. 2015. Cytoplasmic dynein regulates its attachment to microtubules via nucleotide state-switched mechanosensing at multiple AAA domains. Proc Natl Acad Sci U S A. 112:6371-6376.

      Purcell, E.M. 1977. Life at low Reynolds Number. Amer J. Phys. 45:3-11.

      Pyrpassopoulos, S., H. Shuman, and E.M. Ostap. 2020. Modulation of Kinesin's Load-Bearing Capacity by Force Geometry and the Microtubule Track. Biophys J. 118:243-253.

      Rai, A.K., A. Rai, A.J. Ramaiya, R. Jha, and R. Mallik. 2013. Molecular adaptations allow dynein to generate large collective forces inside cells. Cell. 152:172-182.

      Ramaiya, A., B. Roy, M. Bugiel, and E. Schaffer. 2017. Kinesin rotates unidirectionally and generates torque while walking on microtubules. Proc Natl Acad Sci U S A. 114:10894-10899.

      Rao, L., F. Berger, M.P. Nicholas, and A. Gennerich. 2019. Molecular mechanism of cytoplasmic dynein tension sensing. Nature communications. 10:3332.

      Smith, S.B., L. Finzi, and C. Bustamante. 1992. Direct mechanical measurements of the elasticity of single DNA molecules by using magnetic beads. Science. 258:1122-1126.

      Sudhakar, S., M.K. Abdosamadi, T.J. Jachowski, M. Bugiel, A. Jannasch, and E. Schaffer. 2021. Germanium nanospheres for ultraresolution picotensiometry of kinesin motors. Science. 371.

      Toleikis, A., N.J. Carter, and R.A. Cross. 2020. Backstepping Mechanism of Kinesin-1. Biophys J. 119:1984-1994.

      Urbanska, M., A. Ludecke, W.J. Walter, A.M. van Oijen, K.E. Duderstadt, and S. Diez. 2021. Highly-Parallel Microfluidics-Based Force Spectroscopy on Single Cytoskeletal Motors. Small. 17:e2007388.

      Wang, M.D., H. Yin, R. Landick, J. Gelles, and S.M. Block. 1997. Stretching DNA with optical tweezers. Biophys J. 72:1335-1346.

    1. Briefing : Les compétences psychosociales en milieu scolaire — Enjeux, cadres et perspectives neuroscientifiques

      Résumé exécutif

      Ce document de synthèse analyse les interventions et les réflexions issues du séminaire dirigé par Pascale Haag (EHESS) et Stéphanie Dubal (CNRS) sur les compétences psychosociales (CPS) en milieu scolaire.

      L'enjeu central est de dépasser la simple acquisition de "soft skills" pour explorer comment les CPS peuvent transformer le système éducatif.

      Les points clés sont les suivants :

      • Diversité des cadres : Le concept oscille entre des objectifs de santé publique (bien-être), d'éducation (apprentissage socio-émotionnel) et d'économie (employabilité via l'OCDE).

      • Critique idéologique : Une vigilance est nécessaire face à l'instrumentalisation néolibérale des CPS, qui risque d'individualiser des problèmes structurels et de dépolitiser l'éducation en évacuant l'esprit critique.

      • Apport des neurosciences : La "résonance" (pédagogique et neuronale) et l'engagement civique sont identifiés comme des leviers majeurs de la plasticité cérébrale et de la construction identitaire à l'adolescence.

      • Innovation pédagogique : Le modèle des "écoles laboratoires" (Laboratory Schools) est proposé pour combler le fossé entre la recherche et la pratique enseignante.

      --------------------------------------------------------------------------------

      1. Cadres conceptuels et terminologie

      Les compétences psychosociales, souvent désignées sous l'acronyme CPS en France ou SEL (Social Emotional Learning) dans le monde anglo-saxon, font l'objet de plusieurs classifications majeures :

      Comparaison des référentiels principaux

      | Organisme | Focus Principal | Définition / Objectif | | --- | --- | --- | | OMS (1994) | Santé et adaptation | Capacité à répondre efficacement aux défis de la vie quotidienne. Liste de 10 compétences (ex: pensée critique, gestion du stress). | | CASEL | Éducation (SEL) | Processus d'acquisition de connaissances et d'attitudes pour développer des identités saines et des décisions responsables. | | OCDE | Économie et employabilité | Compétences non cognitives liées aux résultats socio-économiques. Basé sur le modèle du "Big Five" (Océan). | | Santé Publique France | Promotion de la santé | Référentiel de 21 compétences divisées en catégories cognitives, émotionnelles et sociales. |

      Le modèle "Océan" (Big Five) de l'OCDE

      L'OCDE structure les CPS autour de cinq traits de personnalité :

      • Ouverture d'esprit.

      • Conscienciosité (précision, rigueur).

      • Extraversion.- Agréabilité (sociabilité).

      • Névrosisme (propension aux affects négatifs).

      --------------------------------------------------------------------------------

      2. Analyse critique et enjeux sociopolitiques

      Le séminaire souligne un paradoxe : si les CPS visent l'épanouissement, elles peuvent aussi devenir des outils de contrôle social.

      • Individualisation des problèmes structurels : En demandant aux élèves de "gérer leurs émotions" ou de "faire preuve de résilience", l'institution risque de faire peser sur l'individu la responsabilité de s'adapter à un environnement délétère (précarité, dysfonctionnements systémiques) sans questionner les causes sociales.

      • Disparition de l'esprit critique : Pascale Haag note que dans certains référentiels modernes, la dimension de "pensée critique" (pourtant présente chez l'OMS en 1994) s'efface au profit de la capacité à collaborer, transformant potentiellement les élèves en "bons petits soldats" du néolibéralisme.

      • Vision anthropocentrée : Les cadres actuels se concentrent sur les interactions humaines, oubliant souvent la relation au monde vivant et à la nature (crise environnementale).

      • Compétences des enseignants : Le focus est souvent mis sur les élèves, négligeant les CPS des enseignants eux-mêmes, dont la posture et la capacité de régulation modèlent directement le climat de classe.

      --------------------------------------------------------------------------------

      3. La résonance : Entre sociologie et neurosciences

      Le concept de résonance, théorisé par Hartmut Rosa, sert de pont entre la transformation sociale et les mécanismes cérébraux.

      Les quatre axes de résonance (H. Rosa)

      • Horizontal : Relations entre personnes (famille, amitié, politique).

      • Diagonal : Relation aux objets et activités régulières (école, sport).

      • Vertical : Relation à la nature, l'histoire ou la spiritualité (sentiment océanique).

      • Par rapport à soi : Accord avec son propre corps et sa psyché.

      Résonance et mécanismes cérébraux

      Stéphanie Dubal établit un parallèle avec la résonance neuronale :

      • Neurones miroirs : Activation interne lors de l'observation de l'action ou de l'émotion d'autrui, base de l'empathie.

      • Synchronie cérébrale : Les activités cérébrales de l'enseignant et de l'élève se synchronisent durant les discussions actives et les moments de réflexion conjointe.

      Cette synchronie est corrélée à la qualité de la relation et aux performances académiques.

      • L'état de "Flow" : Un état d'équilibre optimal (implication sans effort, attention élevée) qui nécessite l'absence de peur et de jugement pour se manifester.

      --------------------------------------------------------------------------------

      4. Engagement civique et développement de l'identité

      Les travaux de l'équipe de Mary Helen Immordino-Yang démontrent que la manière dont les adolescents pensent le monde impacte physiquement leur cerveau.

      • Pensée concrète vs Pensée transcendée :

      • Pensée concrète : Expliquer un crime par des émotions incontrôlées.

      • Pensée transcendée : Analyser la violence via les cycles familiaux, l'histoire sociale et les systèmes de croyances.

      • Impact biologique : La pensée transcendée (abstraite et réflexive) favorise la maturation des réseaux exécutifs et peut provoquer un épaississement cortical.

      • Facteur de résilience : Ce type de raisonnement civique agit comme un bouclier contre les effets délétères du stress social (comme la violence communautaire), favorisant une meilleure satisfaction de vie à l'âge adulte.

      --------------------------------------------------------------------------------

      5. Vers une transformation des pratiques : Les "Laboratory Schools"

      Pour dépasser le clivage entre recherche et enseignement, Pascale Haag a fondé une école inspirée de John Dewey (le modèle des Laboratory Schools) :

      • Collaboration organique : Les chercheurs travaillent au quotidien avec les enseignants, évitant le modèle où le chercheur "collecte des données et repart".

      • Recherche-action : L'objectif est de produire des connaissances tout en visant une transformation sociale immédiate.

      • Obstacles institutionnels : En France, le recrutement des enseignants à l'ancienneté freine la création de tels établissements dans le public, car ces projets nécessitent des profils spécifiques, volontaires pour confronter leur pratique au regard de la recherche.

      Citation marquante : "La première compétence psychosociale avant toutes les autres, c'est l'esprit critique. [...] On ne peut pas parler de justice sans avoir un minimum d'esprit critique." — Pascale Haag

    1. Protein phosphorylation prediction analysis suggested that the substitution of L320 to S creates a new potential phosphorylation site (Supplementary Figure S2). We tested whether changing L320 to phospho-mimetic (L320D o

      [Paragraph-level] PMCID: PMC5491373 Section: RESULTS PassageIndex: 19

      Evidence Type(s): Functional

      Summary: Evidence Type: Functional | Mutation: L320S | Summary: The substitution of L320 to S alters the molecular function of PTEN by creating a new potential phosphorylation site, which affects its stability and localization. Evidence Type: Functional | Mutation: L320A | Summary: The introduction of L320A into PTENA4 does not affect the strong inhibition of membrane and nuclear localization, indicating a functional role in PTEN's behavior. Evidence Type: Functional | Mutation: L320D | Summary: The phospho-mimetic mutation L320D does not show instabilities similar to those seen in PTENL320S, suggesting a functional difference in protein behavior. Evidence Type: Functional | Mutation: L320E | Summary: Similar to L320D, the phospho-mimetic mutation L320E does not exhibit instabilities like PTENL320S, indicating its functional impact on PTEN.

      Gene→Variant (gene-first): 4734:L320 4734:L320A 4734:L320D 4734:L320E 4734:L320S

      Genes: 4734

      Variants: L320 L320A L320D L320E L320S

    1. Within the entire MDS cohort, by univariate analysis (Supplementary Table 2), the following parameters were associated with worse outcomes: higher BM blasts percentage; lower hemoglobin, platelet and MCV; prior history o

      [Paragraph-level] PMCID: PMC10015977 Section: RESULTS PassageIndex: 21

      Evidence Type(s): Prognostic

      Summary: Evidence Type: Prognostic | Mutation: K700E | Summary: The presence of the SF3B1 K700E mutation is associated with worse overall survival (OS) outcomes in the MDS cohort, indicating its role as an independent prognostic factor.

      Gene→Variant (gene-first): 23451:K700E

      Genes: 23451

      Variants: K700E

    2. Therapy-related MDS cases were distributed equally between K700E and non-K700E groups. Within low-grade MDS (MDS-SLD, MDS-MLD and MDS-RS), we excluded therapy-related MDS cases due to a relatively higher representation o

      [Paragraph-level] PMCID: PMC10015977 Section: RESULTS PassageIndex: 19

      Evidence Type(s): Prognostic

      Summary: Evidence Type: Prognostic | Mutation: K700E | Summary: The K700E mutation in SF3B1 is associated with significantly better overall survival (OS) compared to SF3B1 wild-type MDS, indicating its potential prognostic value in disease outcomes.

      Gene→Variant (gene-first): 23451:K700E

      Genes: 23451

      Variants: K700E

    1. To highlight the differences in proliferation assays between Ba/F3 cells driven by the EGFR-D770>GY mutant and the more typical EGFR-A767_V769dupASV mutant, we show the dose-response curve for increasing concentrations o

      [Paragraph-level] PMCID: PMC8700411 Section: RESULTS PassageIndex: 6

      Evidence Type(s): Predictive, Oncogenic

      Summary: Evidence Type: Predictive | Mutation: V769dupASV | Summary: The V769dupASV mutation is associated with a higher IC50 for afatinib and dacomitinib, indicating a correlation with resistance to these therapies. Evidence Type: Oncogenic | Mutation: V769dupASV | Summary: The V769dupASV mutation is implicated in driving proliferation in Ba/F3 cells, suggesting its role in tumor development or progression.

      Gene→Variant (gene-first): 1956:V769dupASV

      Genes: 1956

      Variants: V769dupASV

    1. {x − y = −13x + y = 9 (1)o bien 3x + 2y − z = 12x − 2y + 4z = −2−x + 12 y − z = 0(2)Utilizando una notación más general, otros sistemas de ecuaciones lineales podrían serx1 + 2x2 = 7x2 − 7x3 + x4 = 8x1 + 5x4 = 10(3)x1 + 5x2 = 0x1 − 3x2 = 0x1 = 6(4)De los ejemplos anteriores se pueden concluir ciertas características de los sistemas de ecua-ciones lineales:1. Las variables (incógnitas) del problema siempre aparecen “elevadas” a la po-tencia 1 y nunca elevadas a otra potencia: por ejemplo, una ecuación como x2 +y = 0no es aceptable como ecuación lineal porque la variable x aparece elevada al cuadrado.2. No aparecen “términos mixtos” en las ecuaciones: por ejemplo, una ecuación comox + 3xy − 5y = 0 no va a ser considerada una ecuación lineal porque si bien todas lasvariables están elevadas a la potencia 1 se tiene un término mixto 3xy que hace que laecuación no se considere lineal.3. No hay relación entre el número de ecuaciones del sistema y el número deincógnitas: Por ejemplo, en (1) y (2) se tienen sistemas de ecuaciones lineales con tantasincógnitas como ecuaciones (dos en el primer caso y tres en el segundo caso) mientras queen (3) hay cuatro incógnitas y tres ecuaciones (es decir, más incógnitas que ecuaciones) yen (4) hay dos incógnitas y tres ecuaciones (es decir, más ecuaciones que incógnitas).4. El sistema de ecuaciones puede ser consistente o inconsistente: Es decir, puedeser que el sistema posea solución o no la posea. Por ejemplo, pronto se verá que la soluciónde (1) es x = 2, y = 3 mientras que (4) no tiene solución pues sustituyendo x1 = 6 enlas otras dos ecuaciones se tiene{6 + 5x2 = 06 − 3x2 = 0 lo cual da x2 = −65 y x2 = 2 y esto esimposible.8

      Profe me explica aqui porfa

    1. Author response:

      The following is the authors’ response to the original reviews.

      Public Reviews:

      Reviewer #1 (Public review):

      (1) Figure 1B shows the PREDICTED force-extension curve for DNA based on a worm-like chain model. Where is the experimental evidence for this curve? This issue is crucial because the F-E curve will decide how and when a catch-bond is induced (if at all it is) as the motor moves against the tensiometer. Unless this is actually measured by some other means, I find it hard to accept all the results based on Figure 1B.

      The Worm-Like-Chain model for the elasticity of DNA was established by early work from the Bustamante lab (Smith et al., 1992) and Marko and Siggia (Marko and Siggia, 1995), and was further validated and refined by the Block lab (Bouchiat et al., 1999; Wang et al., 1997). The 50 nm persistence length is the consensus value, and was shown to be independent of force and extension in Figure 3 of Bouchiat et al (Bouchiat et al., 1999). However, we would like to stress that for our conclusions, the precise details of the Force-Extension relationship of our dsDNA are immaterial. The key point is that the motor stretches the DNA and stalls when it reaches its stall force. Our claim of the catch-bond character of kinesin is based on the longer duration at stall compared to the run duration in the absence of load. Provided that the motor is indeed stalling because it has stretched out the DNA (which is strongly supported by the repeated stalling around the predicted extension corresponding to ~6 pN of force), then the stall duration depends on neither the precise value for the extension nor the precise value of the force at stall.

      (2) The authors can correct me on this, but I believe that all the catch-bond studies using optical traps have exerted a load force that exceeds the actual force generated by the motor. For example, see Figure 2 in reference 42 (Kunwar et al). It is in this regime (load force > force from motor) that the dissociation rate is reduced (catch-bond is activated). Such a regime is never reached in the DNA tensiometer study because of the very construction of the experiment. I am very surprised that this point is overlooked in this manuscript. I am therefore not even sure that the present experiments even induce a catch-bond (in the sense reported for earlier papers).

      It is true that Kunwar et al measured binding durations at super-stall loads and used that to conclude that dynein does act as a catch-bond (but kinesin does not) (Kunwar et al., 2011). However, we would like to correct the reviewer on this one. This approach of exerting super-stall forces and measuring binding durations is in fact less common than the approach of allowing the motor to walk up to stall and measuring the binding duration. This ‘fixed trap’ approach has been used to show catch-bond behavior of dynein (Leidel et al., 2012; Rai et al., 2013) and kinesin (Kuo et al., 2022; Pyrpassopoulos et al., 2020). For the non-processive motor Myosin I, a dynamic force clamp was used to keep the actin filament in place while the myosin generated a single step (Laakso et al., 2008). Because the motor generates the force, these are not superstall forces either.

      (3) I appreciate the concerns about the Vertical force from the optical trap. But that leads to the following questions that have not at all been addressed in this paper:

      (i) Why is the Vertical force only a problem for Kinesins, and not a problem for the dynein studies?

      Actually, we do not claim that vertical force is not a problem for dynein; our data do not speak to this question. There is debate in the literature as to whether dynein has catch bond behavior in the traditional single-bead optical trap geometry - while some studies have measured dynein catch bond behavior (Kunwar et al., 2011; Leidel et al., 2012; Rai et al., 2013), others have found that dynein has slip-bond or ideal-bond behavior (Ezber et al., 2020; Nicholas et al., 2015; Rao et al., 2019). This discrepancy may relate to vertical forces, but not in an obvious way.

      (ii) The authors state that "With this geometry, a kinesin motor pulls against the elastic force of a stretched DNA solely in a direction parallel to the microtubule". Is this really true? What matters is not just how the kinesin pulls the DNA, but also how the DNA pulls on the kinesin. In Figure 1A, what is the guarantee that the DNA is oriented only in the plane of the paper? In fact, the DNA could even be bending transiently in a manner that it pulls the kinesin motor UPWARDS (Vertical force). How are the authors sure that the reaction force between DNA and kinesin is oriented SOLELY along the microtubule?

      We acknowledge that “solely” is an absolute term that is too strong to describe our geometry. We softened this term in our revision to “nearly parallel to the microtubule” (Line 464). In the Geometry Calculations section of Supplementary Methods, we calculate that if the motor and streptavidin are on the same protofilament, the vertical force will be <1% of the horizontal force. We also note that if the motor is on a different protofilament, there will be lateral forces and forces perpendicular to the microtubule surface, except they are oriented toward rather than away from the microtubule. The DNA can surely bend due to thermal forces, but because inertia plays a negligible role at the nanoscale (Howard, 2001; Purcell, 1977), any resulting upward forces will only be thermal forces, which the motor is already subjected to at all times.

      (4) For this study to be really impactful and for some of the above concerns to be addressed, the data should also have included DNA tensiometer experiments with Dynein. I wonder why this was not done?

      As much as we would love to fully characterize dynein here, this paper is about kinesin and it took a substantial effort. The dynein work merits a stand-alone paper.

      While I do like several aspects of the paper, I do not believe that the conclusions are supported by the data presented in this paper for the reasons stated above.

      The three key points the reviewer makes are the validity of the worm-like-chain model, the question of superstall loads, and the role of DNA bending in generating vertical forces. We hope that we have fully addressed these concerns in our responses above.

      Reviewer #2 (Public review):

      Major comments:

      (1) The use of the term "catch bond" is misleading, as the authors do not really mean consistently a catch bond in the classical sense (i.e., a protein-protein interaction having a dissociation rate that decreases with load). Instead, what they mean is that after motor detachment (i.e., after a motor protein dissociating from a tubulin protein), there is a slip state during which the reattachment rate is higher as compared to a motor diffusing in solution. While this may indeed influence the dynamics of bidirectional cargo transport (e.g., during tug-of-war events), the used terms (detachment (with or without slip?), dissociation, rescue, ...) need to be better defined and the results discussed in the context of these definitions. It is very unsatisfactory at the moment, for example, that kinesin-3 is at first not classified as a catch bond, but later on (after tweaking the definitions) it is. In essence, the typical slip/catch bond nomenclature used for protein-protein interaction is not readily applicable for motors with slippage.

      We acknowledge that our treatment of kinesin-3 was confusing. In response, we deleted any reference to kinesin-3 catch-bond in the Results section, and restricted it to the Discussion where it is interpretation. In Line 635 in the Discussion, we softened the statement of catch-bond activity to “…all three dominant kinesin transport families display catch-bond like behavior at stall…”. We acknowledge that, classically, the catch/slip bond nomenclature refers to simple protein-protein interactions and is easier to interpret there. However, the term ‘catch-bond’ has been used in the literature for myosin, dynein and kinesin, and thus we feel that it is sufficiently established to use it here.

      (2) The authors define the stall duration as the time at full load, terminated by >60 nm slips/detachments. Isn't that a problem? Smaller slips are not detected/considered... but are also indicative of a motor dissociation event, i.e., the end of a stall. What is the distribution of the slip distances? If the slip distances follow an exponential decay, a large number of short slips are expected, and the presented data (neglecting those short slips) would be highly distorted.

      The reviewer brings up a good point that there may be undetected slips. To address this question, we plotted the distribution of slip distances for kinesin-3, which by far had the most slip events. As the reviewer suggested, it is indeed an exponential distribution, and we calculated a corrected kinesin-3 stall duration due to these undetected slips. This data and analysis are included as a new Supplementary Figure S8. In the main text on Lines 283-293 we included the following text:

      “It was notable that the kinesin-3 stall durations at high load are longer than the ramp durations at low load, because this indicates that the kinesin-3 off-rate slows with increasing load. However, because kinesin-3 had the most slip events at stall, we were concerned that there may be undetected slip events below the 60 nm threshold of detection that led to an overestimation of the kinesin-3 stall duration. To test this hypothesis, we plotted the distribution of kinesin-3 slip distances at stall, fit an exponential, and calculated the fraction of missed slip events (Fig. S8). From this analysis, we calculated a correction factor of 1.42 that brought the kinesin-3 stall duration down 1.33 s. Notably, this stall duration value is still well above the kinesin-3 ramp duration value of 0.75 s in Fig. 3C and thus does not qualitatively change our conclusions.”

      We thank the reviewer for this suggestion.

      (3) Along the same line: Why do the authors compare the stall duration (without including the time it took the motor to reach stall) to the unloaded single motor run durations? Shouldn't the times of the runs be included?

      The elastic force of the DNA spring is variable as the motor steps up to stall, and so if we included the entire run duration then it would be difficult to specify what force we were comparing to unloaded. More importantly, if we assume that any stepping and detachment behavior is history independent, then it is mathematically proper to take any arbitrary starting point (such as when the motor reaches stall), start the clock there, and measure the distribution of detachments durations relative to that starting point. More importantly, what we do in Fig. 3 is to separate out the ramps from the stalls and, using a statistical model, we compute a separate duration parameter (which is the inverse of the off-rate) for the ramp and the stall. What we find is that the relationship between ramp, stall, and unloaded durations is different for the three motors, which is interesting in itself.

      (4) At many places, it appears too simple that for the biologically relevant processes, mainly/only the load-dependent off-rates of the motors matter. The stall forces and the kind of motor-cargo linkage (e.g., rigid vs. diffusive) do likely also matter. For example: "In the context of pulling a large cargo through the viscous cytoplasm or competing against dynein in a tug-of-war, these slip events enable the motor to maintain force generation and, hence, are distinct from true detachment events." I disagree. The kinesin force at reattachment (after slippage) is much smaller than at stall. What helps, however, is that due to the geometry of being held close to the microtubule (either by the DNA in the present case or by the cargo in vivo) the attachment rate is much higher. Note also that upon DNA relaxation, the motor is likely kept close to the microtubule surface, while, for example, when bound to a vesicle, the motor may diffuse away from the microtubule quickly (e.g., reference 20).

      We appreciate the reviewer’s detailed thinking here, and we offer our perspective. As to the first point, we agree that the stall force is relevant and that the rigidity of the motor-cargo linkage will play a role. The goal of the sentence on pulling cargo that the reviewer highlights is to set up our analysis of slips, which we define as rearward displacements that don’t return to the baseline before force generation resumes. We revised this sentence to the following: “In the context of pulling a large cargo through the viscous cytoplasm or competing against dynein in a tug-of-war, these slip events enable the motor to continue generating force after a small rearward displacement, rather than fully detaching and ‘resetting’ to zero load.” (Line 339-342)

      It should be noted that, as shown in the model diagram in Fig. 5, we differentiate between the slip state (and recovery from this slip state) and the detached state (and reattachment from this detached state). This delineation is important because, as the reviewer points out, if we are measuring detachment and reattachment with our DNA tensiometer, then the geometry of a vesicle in a cell will be different and diffusion away from the microtubule or elastic recoil perpendicular to the microtubule will suppress this reattachment.

      Our evidence for a slip state in which the motor maintains association with the microtubule comes from optical trapping work by Tokelis et al (Toleikis et al., 2020) and Sudhakar et al (Sudhakar et al., 2021). In particular, Sudhakar used small, high index Germanium microspheres that had a low drag coefficient. They showed that during ‘slip’ events, the relaxation time constant of the bead back to the center of the trap was nearly 10-fold slower than the trap response time, consistent with the motor exerting drag on the microtubule. (With larger beads, the drag of the bead swamps the motor-microtubule friction.) Another piece of support for the motor maintaining association during a slip is work by Ramaiya et al. who used birefringent microspheres to exert and measure rotational torque during kinesin stepping (Ramaiya et al., 2017). In most traces, when the motor returned to baseline following a stall, the torque was dissipated as well, consistent with a ‘detached’ state. However, a slip event is shown in S18a where the motor slips backward while maintaining torque. This is best explained by the motor slipping backward in a state where the heads are associated with the microtubule (at least sufficiently to resist rotational forces). Thus, we term the resumption after slip to be a rescue from the slip state rather than a reattachment from the detached state.

      To finish the point, with the complex geometry of a vesicle, during slip events the motor remains associated with the microtubule and hence primed for recovery. This recovery rate is expected to be the same as for the DNA tensiometer. Following a detachment, however, we agree that there will likely be a higher probability of reattachment in the DNA tensiometer due to proximity effects, whereas with a vesicle any elastic recoil or ‘rolling’ will pull the detached motor away from the microtubule, suppressing reattachment. To address this point, we added in the Discussion on lines 654-656:

      “Additionally, any ‘rolling’ of a spherical cargo following motor detachment will tend to suppress the motor reattachment rate.”

      (5) Why were all motors linked to the neck-coil domain of kinesin-1? Couldn't it be that for normal function, the different coils matter? Autoinhibition can also be circumvented by consistently shortening the constructs.

      We chose this dimerization approach to focus on how the mechoanochemical properties of kinesins vary between the three dominant transport families. We agree that in cells, autoinhibition of both kinesins and dynein likely play roles in regulating bidirectional transport, as will the activity of other regulatory proteins. The native coiled-coils may act as ‘shock absorbers’ due to their compliance, or they might slow the motor reattachment rate due to the relatively large search volumes created by their long lengths (10s of nm). These are topics for future work. By using the neck-coil domain of kinesin-1 for all three motors, we eliminate any differences in autoinhibition or other regulation between the three kinesin families and focus solely on differences in the mechanochemistry of their motor domains.

      (6) I am worried about the neutravidin on the microtubules, which may act as roadblocks (e.g. DOI: 10.1039/b803585g), slip termination sites (maybe without the neutravidin, the rescue rate would be much lower?), and potentially also DNA-interaction sites? At 8 nM neutravidin and the given level of biotinylation, what density of neutravidin do the authors expect on their microtubules? Can the authors rule out that the observed stall events are predominantly the result of a kinesin motor being stopped after a short slippage event at a neutravidin molecule?

      (7) Also, the unloaded runs should be performed on the same microtubules as in the DNA experiments, i.e., with neutravidin. Otherwise, I do not see how the values can be compared.

      To address the question of neutravidin acting as a roadblock, we did the following. Because of the sequence of injections used to assemble the tensiometer in the flow cell, there are often some residual GFP-kinesin motors that aren’t attached to DNA and thus serve as internal controls for unloaded motility on the neutravidin-functionalized Mt. We quantified the run durations of these free kinesin-GFP and found that their run duration was 0.92 s (95% CI: 0.79 to 1.04 by MEMLET). This is slightly lower but not statistically different from the 1.04 s [0.78, 1.31] on control microtubules in Fig 2A. This result is included in Figure S6 in the revised manuscript.

      We don’t have a precise estimate for the amount of neutravidin on the microtubules. Based on Fig. 3C of Korten and Diez (Korten and Diez, 2008), the reduction in the unloaded run duration that we see corresponds to a ~2% biotinylation ratio. We polymerize Mt with 10% biotinylated tubulin and add 8 nM neutravidin to the flow cell, so in principle the microtubules could be 10% biotin-streptavidin coated. However, there are a number of uncertainties that push this estimate lower – a) the precise degree of biotinylation, b) whether the %biotinylated tubulin in polymerized microtubules is lower than the mixing ratio due to unequal incorporation, and 3) what fraction of the biotinylated tubulin are occupied by the neutravidin when using this neutravidin flow-in method. Thus, our best estimate is ~2% biotin-streptavidin functionalization.

      The ramp durations in Fig. 3 provide another argument that biotinylated microtubules are not affecting the motors. Compared to unloaded durations for each motor, the kinesin-1 ramps were longer, the kinesin-2 ramps were the same, and the kinesin-3 ramps were shorter duration. That argues against any systematic effect of biotinylation on motor run durations, with the caveat that family-dependent differences could in principle be masking an effect. The fact that ramp durations aren’t systematically longer or shorter than the unloaded run durations also argues that the stalls we see, which are at the expected extension length of the dsDNA, are not caused by neutravidin roadblocks.

      The final point the reviewer brings up is whether neutravidin may be contributing to the rescues from slips events that we observe. This is difficult to fully rule out. However, because the unloaded run durations aren’t significantly altered by the biotin-streptavidin on the microtubules, we don’t expect the rescue events following a slip to be significantly affected. In principle, we could systematically increase and decrease the biotinylation and see whether the slip rescues change, but we haven’t done this.

      (8) If, as stated, "a portion of kinesin-3 unloaded run durations were limited by the length of the microtubules, meaning the unloaded duration is a lower limit." corrections (such as Kaplan-Meier) should be applied, DOI: 10.1016/j.bpj.2017.09.024.

      (9) Shouldn't Kaplan-Meier also be applied to the ramp durations ... as a ramp may also artificially end upon stall? Also, doesn't the comparison between ramp and stall duration have a problem, as each stall is preceded by a ramp ...and the (maximum) ramp times will depend on the speed of the motor? Kinesin-3 is the fastest motor and will reach stall much faster than kinesin-1. Isn't it obvious that the stall durations are longer than the ramp duration (as seen for all three motors in Figure 3)?

      The reviewer rightly notes the many challenges in estimating the motor off-rates during ramps. To estimate ramp off-rates and as an independent approach to calculating the unloaded and stall durations, we developed a Markov model coupled with Bayesian inference methods to estimate a duration parameter (equivalent to the inverse of the off-rate) for the unloaded, ramp, and stall duration distributions. With the ramps, we have left censoring due to the difficulty in detecting the start of the ramps in the fluctuating baseline, and we have right censoring due to reaching stall (with different censoring of the ramp duration for the three motors due to their different speeds). The Markov model assumes a constant detachment probability and history-independence, and thus is robust even in the face of left and right censoring (details in the Supplementary section). This approach is preferred over Kaplan-Meier because, although non-parametric methods such as K-M make no assumptions for the distribution, they require the user to know exactly where the start time is.

      Regarding the potential underestimate of the kinesin-3 unloaded run duration due to finite microtubule lengths. The first point is that the unloaded duration data in Fig. 2C are quite linear up to 6 s and are well fit by the single-exponential fit (the points above 6 s don’t affect the fit very much). The second point is that when we used our Markov model (which is robust against right censoring) to estimate the unloaded and stall durations, the results agreed with the single-exponential fits very well (Table S2). Specifically, the single-exponential fit for the kinesin-3 unloaded duration was 2.74 s (2.33 – 3.17 s 95% CI) and the estimate from the Markov model was 2.76 (2.28 – 3.34 s 95% CI). Thus, we chose not to make any corrections to the kinesin-3 unloaded run durations due to finite microtubule lengths. To address this point in the revision, we added the following note in Table S2: “* Because the Markov-Bayesian model, which is unaffected by left and right censoring of data gave same unloaded run durations for kinesin-3 as the MEMLET fit, we did not the kinesin-3 unloaded run durations for any right censoring due to finite microtubule lengths.” We also added the following point in the legend of Fig. S1: “A fraction of kinesin-3 unloaded run durations were limited by the length of the microtubules, but fitting to a model that took into account missed events gave a similar mean duration as an exponential fit, and so no correction was made (Table S2).”

      (10) It is not clear what is seen in Figure S6A: It looks like only single motors (green, w/o a DNA molecule) are walking ... Note: the influence of the attached DNA onto the stepping duration of a motor may depend on the DNA conformation (stretched and near to the microtubule (with neutravidin!) in the tethered case and spherically coiled in the untethered case).

      In Figure S6 kymograph, the green traces are GFP-labeled kinesin-1 without DNA attached (which are in excess) and the red diagonal trace is a motor with DNA attached. We clarified this in the revised Figure S6 legend. We agree that the DNA conformation will differ if it is attached and stretched (more linear) versus simply being transported (random coil), but by its nature this control experiment is only addressing random coil DNA.

      (11) Along this line: While the run time of kinesin-1 with DNA (1.4 s) is significantly shorter than the stall time (3.0 s), it is still larger than the unloaded run time (1.0 s). What do the authors think is the origin of this increase?

      We addressed this point in lines 200-212 of the revised manuscript:

      “We carried out two additional control experiments. First, to confirm that the neutravidin used to link the DNA to the microtubule wasn’t affecting kinesin motility, we analyzed the run durations of kinesin-1 motors on neutravidin-coated microtubules and found no change compared to unlabeled microtubules (Fig. S6). Second, we measured the run duration of kinesin-1 linked to a DNA tether that was not bound to the microtubule and thus was being transported (Fig. S6). The kinesin-DNA run duration was 1.40 s, longer than the 1.04 s of motors alone (Fig. 2A). We interpret this longer duration to reflect the slower diffusion constant of the dsDNA relative to the motor alone, which enables motors to transiently detach and rebind before the DNA cargo has diffused away, thus extending the run duration (Block et al., 1990). Notably, this slower diffusion constant should not play a role in the DNA tensiometer geometry because if the motor transiently detaches, it will be pulled backward by the elastic forces of the DNA and detected as a slip or detachment event.“

      (12) "The simplest prediction is that against the low loads experienced during ramps, the detachment rate should match the unloaded detachment rate." I disagree. I would already expect a slight increase.

      Agreed. We changed this text (Lines 265-267) to: “The prediction for a slip bond is that against the low loads experienced during ramps, the detachment rate should be equal to or faster than the unloaded detachment rate.”

      (13) Isn't the model over-defined by fitting the values for the load-dependence of the strong-to-weak transition and fitting the load dependence into the transition to the slip state?

      Essentially, yes, it is overdefined, but that is essentially by design and the model is still very useful. Our goal here was to make as simple a model as possible that could account for the data and use it to compare model parameters for the different motor families. Ignoring the complexity of the slip and detached states, a model with a strong and weak state in the stepping cycle and a single transition out of the stepping cycle is the simplest formulation possible. And having rate constants (k<sub>S-W</sub> and k<sub>slip</sub> in our case) that vary exponentially with load makes thermodynamic sense for modeling mechanochemistry (Howard, 2001). Thus, we were pleasantly surprised that this bare-bones model could recapitulate the unloaded and stall durations for all three motors (Fig. 5C-E).

      (14) "When kinesin-1 was tethered to a glass coverslip via a DNA linker and hydrodynamic forces were imposed on an associated microtubule, kinesin-1 dissociation rates were relatively insensitive to loads up to ~3 pN, inconsistent with slip-bond characteristics (37)." This statement appears not to be true. In reference 37, very similar to the geometry reported here, the microtubules were fixed on the surface, and the stepping of single kinesin motors attached to large beads (to which defined forces were applied by hydrodynamics) via long DNA linkers was studied. In fact, quite a number of statements made in the present manuscript have been made already in ref. 37 (see in particular sections 2.6 and 2.7), and the authors may consider putting their results better into this context in the Introduction and Discussion. It is also noteworthy to discuss that the (admittedly limited) data in ref. 37 does not indicate a "catch-bond" behavior but rather an insensitivity to force over a defined range of forces.

      The reviewer misquoted our sentence. The actual wording of the sentence was: “When kinesin-1 was connected to micron-scale beads through a DNA linker and hydrodynamic forces parallel to the microtubule imposed, dissociation rates were relatively insensitive to loads up to ~3 pN, inconsistent with slip-bond characteristics (Urbanska et al., 2021).” The sentence the reviewer quoted was in a previous version that is available on BioRxiv and perhaps they were reading that version. Nonetheless, in the Discussion of the revision, we added text to note that this behavior is indicative of an ideal bond (not a catch-bond) on Lines 480-483: “When kinesin-1 was connected to micron-scale beads through a DNA linker and hydrodynamic forces parallel to the microtubule imposed, dissociation rates were relatively insensitive to loads up to ~3 pN, inconsistent with slip-bond characteristics and instead characteristic of an ideal-bond.” We also added a sentence in the Introduction highlighting this work, Lines 84-87: “Fourth, when kinesin-1 was connected to a bead through a micron-long segment of DNA and hydrodynamic forces were imposed on the bead, motor interaction times were insensitive to hindering loads up to 3 pN, indicative of an ideal-bond.”

      Reviewer #3 (Public review):

      The authors attribute the differences in the behaviour of kinesins when pulling against a DNA tether compared to an optical trap to the differences in the perpendicular forces. However, the compliance is also much different in these two experiments. The optical trap acts like a ~ linear spring with stiffness ~ 0.05 pN/nm. The dsDNA tether is an entropic spring, with negligible stiffness at low extensions and very high compliance once the tether is extended to its contour length (Fig. 1B). The effect of the compliance on the results should be addressed in the manuscript.

      This is an interesting point. We added the following paragraph in Lines 101-111 in the Geometry Consideration section of the Supplementary Methods.

      “Another consideration when comparing the DNA tensiometer to optical trap measurements is the relative stiffness of the trap and dsDNA. Optical trap stiffnesses are generally in the range of 0.05 pN/nm [12,13]. To calculate the predicted stiffness of the dsDNA spring, we computed the slope of theoretical force-extension curve in Fig. 1B. The stiffness is highly nonlinear and is <0.001 pN/nM below 650 nm extension. At the predicted stall force of 6 pN (960 nm extension), the dsDNA stiffness ~0.2 pN/nm, which is stiffer than most optical traps, but it is similar to the estimated 0.3 pN/nm stiffness of kinesin motors themselves[12,13]. An 8 nm step at this stiffness leads to a 1.6 pN jump in force, so it is reasonable to expect that motors are dynamically stepping at stall. Therefore, there is no reason to expect that stiffness differences between optical traps and the dsDNA spring are affecting the motor detachment kinetics.”

      Compared to an optical trapping assay, the motors are also tethered closer to the microtubule in this geometry. In an optical trap assay, the bead could rotate when the kinesin is not bound. The authors should discuss how this tethering is expected to affect the kinesin reattachment and slipping. While likely outside the scope of this study, it would be interesting to compare the static tether used here with a dynamic tether like MAP7 or the CAP-GLY domain of p150glued.

      Please see our response to Reviewer #2 Major Comment #4 above, which asks this same question in the context of intracellular cargo. In response to the point from Reviewer #3, we added the following sentence on Lines 654-656: “Additionally, any ‘rolling’ of a spherical cargo following motor detachment will tend to suppress the motor reattachment rate.”

      Regarding a dynamic tether, we agree that’s interesting – there are kinesins that have a second, non-canonical binding site that achieves this tethering (e.g. ncd and Cin8); p150glued likely does this naturally for dynein-dynactin-activator complexes; and we speculated in a review some years ago (Hancock, 2014) that during bidirectional transport kinesin and dynein may act as dynamic tethers for one another when not engaged, enhancing the activity of the opposing motor.

      In the single-molecule extension traces (Figure 1F-H; S3), the kinesin-2 traces often show jumps in position at the beginning of runs (e.g., the four runs from ~4-13 s in Fig. 1G). These jumps are not apparent in the kinesin-1 and -3 traces. What is the explanation? Is kinesin-2 binding accelerated by resisting loads more strongly than kinesin-1 and -3?

      We agree that at first glance those jumps are puzzling. To investigate this question the first thing we did was to go back to our tensiometer dataset and look systematically at jumps for all three motors. We found roughly 4-6 large jumps like these for all three motors (kinesin-1: 250 +/- 99 nm (mean +/- SD; N=5); kinesin-2: 249 +/- 165 nm (N=6); kinesin-3: 490 +/- 231 nm (N=4)). Thus, although the apparent jumps may be more pronounced due to the specific rebinding kinetics of kinesin-2, this behavior is not unique to this motor. (Note that the motor binding position distribution in Fig. S2 is taken from initial binding positions that follow a clear period of detachment; thus, not all jumps are captured there.)

      Our interpretation is that these apparent jumps are simply a reflection of the long length and high compliance of the dsDNA tether. For instance, below 650 nm extension the stiffness, k <0.001 pN/nM (see Reviewer #3, point #1 above). Thus, we expect large fluctuations of the tethered motor when not bound to the microtubule. One reason that these events look like ‘jumps’ is that the sub-ms fluctuations during detached periods are not captured by the ~25 fps movies (40 ms frame acquisition time). Instead, the fitted Qdot position represents the average position during the acquisition window. Actually, due to these rapid fluctuations (and the limited depth of the TIRF illumination field) the position often can’t be determined during these periods of fluctuation (e.g. see gaps at ~2.5 s, 11 s and 24 s in Fig. 1F).

      When comparing the durations of unloaded and stall events (Fig. 2), there is a potential for bias in the measurement, where very long unloaded runs cannot be observed due to the limited length of the microtubule (Thompson, Hoeprich, and Berger, 2013), while the duration of tethered runs is only limited by photobleaching. Was the possible censoring of the results addressed in the analysis?

      Yes. Please see response to Reviewer #2 points (8) and (9) above.

      The mathematical model is helpful in interpreting the data. To assess how the "slip" state contributes to the association kinetics, it would be helpful to compare the proposed model with a similar model with no slip state. Could the slips be explained by fast reattachments from the detached state?

      In the model, the slip state and the detached states are conceptually similar; they only differ in the sequence (slip to detached) and the transition rates into and out of them. The simple answer is: yes, the slips could be explained by fast reattachments from the detached state. In that case, the slip state and recovery could be called a “detached state with fast reattachment kinetics”. However, the key data for defining the kinetics of the slip and detached states is the distribution of Recovery times shown in Fig. 4D-F, which required a triple exponential to account for all of the data. If we simplified the model by eliminating the slip state and incorporating fast reattachment from a single detached state, then the distribution of Recovery times would be a single-exponential with a time constant equivalent to t<sub>1</sub>, which would be a poor fit to the experimental distributions in Fig. 4D-F.

      Recommendations for the authors: 

      Reviewing Editor Comments:

      The reviewers are in agreement with the motivation and approach of this study. The use of DNA tethers is an important advance in tethering motor proteins to gain insight into how motors respond to load. However, all 3 reviewers express reservations on how well the results support the claims. In particular, the use of the term catch bond was problematic, with Reviewer #2 suggesting some alternative nomenclature. Reviewer #1 expressed concern with experimental evidence for the predicted force-extension curve shown in Figure 1. I agree with the reviewers that additional experimental evidence would be required to conclude the catch-bond detachment kinetics of kinesin.

      Recommendations for the authors:

      Reviewer #2 (Recommendations for the authors):

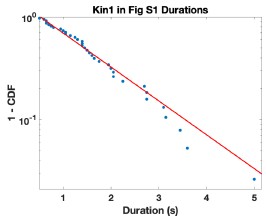
      (1) By eye, the run lengths, e.g., of kin-1 look very long in Figure S1 ... certainly above the expected 1 µm. Please check and comment.

      We agree that the long runs do stick out by eye in this figure. To address this point, we analyzed the run lengths and run times from the kymograph shown in Fig. S1. Fitting the run duration distribution gave t = 1.31 s with a 95% CI of 0.96 to 1.67. This is slightly longer than the 1.04 s duration in Fig. 2A, but the 95% CI include this population mean, and so the S1 data are not statistically significantly different. The run time distribution from the S1 kymograph is given in Author response image 1.

      Author response image 1.

      (2) The upper right kymograph in Figure 4A does not show a motor return to the baseline. Also, the scale bars, etc., are unreadable. Please modify.

      Our purpose for showing the kymographs in Fig. 4A was to show the specific features of slips and fast and slow reattachment. Because we blew up the kymographs to show those specific features, it precluded us from showing the entire return to baseline. As suggested, we magnified the scale bars and the labels on the kymograph labels to make them readable.

      Reviewer #3 (Recommendations for the authors):

      (1) The frequent references to 95% confidence intervals disrupt the flow of the text. Perhaps the confidence intervals could be listed in a table rather than in the body of the text.

      We deleted those from the text; they are shown in Fig. 2D and listed in Table S2.

      We appreciate the efforts and helpful suggestions of all three reviewers and the Editor.

      References

      Block, S.M., L.S. Goldstein, and B.J. Schnapp. 1990. Bead movement by single kinesin molecules studied with optical tweezers. Nature. 348:348-352.

      Bouchiat, C., M.D. Wang, J. Allemand, T. Strick, S.M. Block, and V. Croquette. 1999. Estimating the persistence length of a worm-like chain molecule from force-extension measurements. Biophys J. 76:409-413.

      Ezber, Y., V. Belyy, S. Can, and A. Yildiz. 2020. Dynein Harnesses Active Fluctuations of Microtubules for Faster Movement. Nat Phys. 16:312-316.

      Hancock, W.O. 2014. Bidirectional cargo transport: moving beyond tug of war. Nat Rev Mol Cell Biol. 15:615-628.

      Howard, J. 2001. Mechanics of Motor Proteins and the Cytoskeleton. Sinauer Associates, Inc., Sunderland, MA. 367 pp.

      Korten, T., and S. Diez. 2008. Setting up roadblocks for kinesin-1: mechanism for the selective speed control of cargo-carrying microtubules. Lab Chip. 8:1441-1447.

      Kunwar, A., S.K. Tripathy, J. Xu, M.K. Mattson, P. Anand, R. Sigua, M. Vershinin, R.J. McKenney, C.C. Yu, A. Mogilner, and S.P. Gross. 2011. Mechanical stochastic tug-ofwar models cannot explain bidirectional lipid-droplet transport. Proc Natl Acad Sci U S A. 108:18960-18965.

      Kuo, Y.W., M. Mahamdeh, Y. Tuna y J. Howard. 2022. The force required to remove tubulin from the microtubule lattice by pulling on its alpha-tubulin C-terminal tail. Nature communications. 13:3651.

      Laakso, J.M., J.H. Lewis, H. Shuman, and E.M. Ostap. 2008. Myosin I can act as a molecular force sensor. Science. 321:133-136.

      Leidel, C., R.A. Longoria, F.M. Gutierrez, and G.T. Shubeita. 2012. Measuring molecular motor forces in vivo: implications for tug-of-war models of bidirectional transport. Biophys J. 103:492-500.

      Marko, J.F., and E.D. Siggia. 1995. Stretching DNA. Macromolecules. 28:8759-8770.

      Nicholas, M.P., F. Berger, L. Rao, S. Brenner, C. Cho, and A. Gennerich. 2015. Cytoplasmic dynein regulates its attachment to microtubules via nucleotide state-switched mechanosensing at multiple AAA domains. Proc Natl Acad Sci U S A. 112:63716376.

      Purcell, E.M. 1977. Life at low Reynolds Number. Amer J. Phys. 45:3-11.

      Pyrpassopoulos, S., H. Shuman, and E.M. Ostap. 2020. Modulation of Kinesin's Load-Bearing Capacity by Force Geometry and the Microtubule Track. Biophys J. 118:243253.

      Rai, A.K., A. Rai, A.J. Ramaiya, R. Jha, and R. Mallik. 2013. Molecular adaptations allow dynein to generate large collective forces inside cells. Cell. 152:172-182.

      Ramaiya, A., B. Roy, M. Bugiel, and E. Schaher. 2017. Kinesin rotates unidirectionally and generates torque while walking on microtubules. Proc Natl Acad Sci U S A. 114:10894-10899.

      Rao, L., F. Berger, M.P. Nicholas, and A. Gennerich. 2019. Molecular mechanism of cytoplasmic dynein tension sensing. Nature communications. 10:3332.

      Smith, S.B., L. Finzi, and C. Bustamante. 1992. Direct mechanical measurements of the elasticity of single DNA molecules by using magnetic beads. Science. 258:11221126.

      Sudhakar, S., M.K. Abdosamadi, T.J. Jachowski, M. Bugiel, A. Jannasch, and E. Schaher. 2021. Germanium nanospheres for ultraresolution picotensiometry of kinesin motors. Science. 371.

      Toleikis, A., N.J. Carter, and R.A. Cross. 2020. Backstepping Mechanism of Kinesin-1. Biophys J. 119:1984-1994.

      Urbanska, M., A. Ludecke, W.J. Walter, A.M. van Oijen, K.E. Duderstadt, and S. Diez. 2021. Highly-Parallel Microfluidics-Based Force Spectroscopy on Single Cytoskeletal Motors. Small. 17: e2007388.

      Wang, M.D., H. Yin, R. Landick, J. Gelles, and S.M. Block. 1997. Stretching DNA with optical tweezers. Biophys J. 72:1335-1346.

    1. Revisión de literatura

      Interesante el inventario o censo de revistas que presentas, sin embargo, podrías explicar qué herramientas analógicas o digitales usas o cuáles son tus flujos de trabajo para sistematizar lo que vas encontrando en ellas

    1. lo que estoy describiendo es una robotización del lenguaje o simplemente la adquisición de un dialecto nuevo. Los humanos siempre hemos aprendido a pensar con nuestras herramientas: la escritura misma transformó la memoria, la imprenta transformó la argumentación, el hipertexto está transformando la lectura no lineal.

      Es imposible luchar contra el cambio, el que no se adapta perece. Pero también es necesario saber hasta qué punto cambiamos sin perder la esencia de los que somos. La memoria no se acabó con la escritura, ni la argumentación con la imprenta. ¿Será que la escritura en un futuro cercano dejará definitivamente de ser manual y lineal para estar completamente mediada por la tecnología y la hipertextualidad?

    2. Hoy, cuando leo un libro físico y quiero subrayar algo relevante, siento una fricción que antes no existía. No puedo hacer clic, no puedo etiquetar, no puedo conectar ese subrayado con otro nodo de mi red de conocimiento. La lectura analógica, lejos de sentirse liberadora, empieza a sentirse incompleta. Y cuando escribo a lápiz, hay una voz en algún lugar de mi cabeza que recuerda que esa escritura tendrá que ser transcrita, digitalizada, que es trabajo doble.

      Leer libros físicos parece haber dejado de tener tanta utilidad en este tipo de trabajos. Para cuentos, novelas o poemas está perfecto, pero claramente para investigación es mucho más útil leer en digital, porque se puede ir leyendo, subrayando y anotando todo en el mismo soporte.

    1. Durante estas revisiones voy tomando notas y redactando reflexiones generalmente en Microsoft Word y Excel

      Compañera Catalina, en este aspecto tenemos algo en común, y es, que yo tambien hago anotaciones de manera literal de documentos en PDF y luego hago reflexiones acerca de esas anotaciones, incluso las voy conectando con entrevistas, situciones y experiencias vividas en la cotidianidad, justamente para volver a ellas cuando estoy escribiendo algun articulo o para la presentacion del Estado del Arte. Bueno, esto hive en realidad para la maestria...

    2. Estas conversaciones normalmente las grabo en video como avances para el rodaje, ya que me pueden servir después como material de apoyo en la edición.

      ¿Gestionas los permisos de grabaciones mientras dichas grabaciones avanzan, o lo haces retroactivamente mirando cuáles son las que finalmente "sobreviven" al proceso de edición a la pieza final?

    3. Durante estas revisiones voy tomando notas y redactando reflexiones generalmente en Microsoft Word y Excel y a mano en cuadernos y libretas. Esta revisión consume una gran cantidad de tiempo.

      Cómo mantienes esas anotaciones en Word vinculadas a sus fuentes originales (texto en análogo o digital, audio, vídeo, etc)

    1. Habían muchas. Entre las que encontre había una que prometía articularse con Zotero y era obsidian. Entre las características que me entusiasmaron de este software se destaca el uso de MarkDown un formato de texto plano que garantizaría que mis notas no dependieran de ningún software, por otro lado es multiplataforma, que para este caso implica que puede funcionar en linux, windows, ios, y android, lo que quiere decir, que puedo anotar en el celular, en mi tableta, en mi PC de escritorio, o en mi portatil, incluso, si llegara a pasar algo extraordinario que me obligara a usar algún dispositivo de la malevola empresa de la manzana, ahí también funcionaría.

      Me interesa mucho esta parte. He intentado usar obsidian. como parte de estos enrarecimientos que intento tener en el contexto de la clase y que puedan serme útiles, pero descargué el programa, vi mil vídeos de youtube pero ni siquiera pude llegar a la parte de crear como una carpeta. Me frustó mucho eso, porque todos los tutoríales mostraban formas distintas de ingreso.

    2. el tiro de gracia ocurrio cuando me frustraba por querer hacer mamarrachos, creo que muchos, incluyendo la mayoría de artistas, necesitamos la posibilidad de procesar nuestros pensamientos de manera gráfica, bocetear, o en sentido más general mamarrachear.

      De acuerdo, creo que el hacer bocetación sobre el escrito permite entrelazar otras formas del pensamiento para que no queden netamente en lo textual.

    1. Revisión de literatura

      Interesante el inventario o censo de revistas que presentas, sin embargo, podrías explicar qué herramientas analógicas o digitales usas o cuáles son tus flujos de trabajo para sistematizar lo que vas encontrando en ellas

    1. En ocasiones escribo pequeños resúmenes en forma de párrafos cortos;

      Bueno compañera Paola, mas o menos estamos conectadas en esta practica, pero yo en vez de hacer resumenes, copio la idea del documento PDF donde estoy leyendo, que normalmente son articulos o libros en internet, y los copio en el esquema en documento word que he diseñado como mi practica de anotaciones para recordar ideas.