15-pax training plus ~4 counsellor rooms in the CBD.
15-pax group training tables, up to 40-pax lecture capacity. ~2 formal counsellor rooms (capacity for 4 counsellors) located in the CBD, 400m from Central Station.
15-pax training plus ~4 counsellor rooms in the CBD.
15-pax group training tables, up to 40-pax lecture capacity. ~2 formal counsellor rooms (capacity for 4 counsellors) located in the CBD, 400m from Central Station.
Speaking: a smaller current line, but one you’ve told me you’d like to grow.
Public Speaking - ongoing positioning of Leigh as a thought leader on organisational responses to individuals and their mental health amid the challenges of the modern corporate environement.
Disability sector training and placements for NDIS providers, both staff and clients.
Disability sector staff MHFA training and on-site counselling for NDIS participants and their support team members.
Schools training.
(this is just one sector of clientele especially attracted to MHFA training/courses, not meaningful to mention here)
Critical incident response, construction sites especially, post-suicide / accidental death / injury.
Critical Incident responses, supporting workgroups and individuals in the aftermath of traumatic events, especially post-suicide / accidental death / injury.
Corporate workshops in the Brené Brown vein: vulnerability, communication, breaking down team barriers.
Bespoke Corporate Workshops that develop individual performance within team settings. Where Leigh's professional expertise, based on decades of experience, is offered at a premium.
A six-hour corporate executive course, workplace MHFA-adjacent. The Working Mind, when licensing lets you market it.
The Working Mind - A six-hour corporate executive course, workplace MHFA-adjacent. First-mover as accredited trainer, soon to be rolled-out nation-wide.
Insurance company supervision for staff in claims-heavy roles
Insurance sector support, including MHFA training, professional supervision, and Critical Incident responses for staff working across high-stress evironments.
Professional supervision for social workers, psychologists, allied health.
Professional Supervision for human services workers, members of the public service, and education, and private sector managers.
at the Collective Wellbeing Hub and online
Collective Wellbeing Hub is defunct since 2023, was a failed partnership between Leigh and another school mum, lots of bitterness, still healing, best to avoid all reference!
post-incident response on construction sites
support and responses to Critical Incidents
in the vein of Brené Brown
executive workshops where your professional expertise attracts a premium (Leigh is sensitive/critical of Brene)
l
I believe this should be uppercase 'L'
M=1
I believe this should be M_L = 1 or M = 2.
M=1,
I believe this should be M_L = 0 or M = 2.
l
I believe this should be uppercase 'L'
h l v
I believe this should be uppercase 'L'
f l
I believe this should be uppercase 'L'
(l)
I believe this should be uppercase 'L'
l is
I believe this should be uppercase 'L'
González-Bustamante, B., & Olivares, A. (2016). Cambios de gabinete y supervivencia de los ministros en Chile durante los gobiernos de la Concertación (1990-2010). Colombia internacional, (87), 81-108.
Cita trabajo 1
URL slug
URL slug rule * Only fragment * Key trigger words only separated by hyphens * Only change slugs when article is not live then you can republish (as it may break links in beacon)
Title rules
Title Rules:
Start it with an action word that describes the action the client would be doing or search for how to do.
Never match the title of previous article
Content principles
Content Guidelines:
Structure
Structure:
personal
Put your personal touch on the saved replies so the sound more genuine, authentic and personalize to the client.
mood
Tone: * Mirror the mood of the client and try to match their emotion * Do as much as you can to resolve the issue. Do all the heavy lifting for the client * Switch it up so you dont sound repetitive and monotone.
Browser tools are different from adding elements to AI chat. Element selection lets you manually pick page elements as context for a chat prompt. Browser tools let agents autonomously interact with web pages to complete tasks.
I took a look at the article about trolling slang and I thought it was interesting that this source explains how the meaning of “troll” has changed over time. Originally, trolling online was sometimes seen as more of an inside joke or prank, but now it is often connected to harassment and cyberbullying. I found it interesting about how its severity has taken on new levels as of more recently. I also found it surprising how the article connected trolling to psychology and online anonymity, because people often act differently online when they feel anonymous.
As such, the sense of‘limitless indebtedness’ towards parents has diminished, replaced by a focus on mutualgratitude and support, creating a two-way exchange of care
Example of power dynamics changing within a culture, more towards and egalitarian outlook of the "filial piety" value.
the disparities between rural and urban life that hadbecome ingrained in her during her years in the city.
Exemplifies cultures within cultures. Danlu seemingly assimilated into a "city" culture during her time there but after returning, she may be considered an outside group to the "rural" culture.
While ’98 was the top season of McGwire’s career, Sosa would go on to have a much better — dare I even say all-time great caliber? — year in 2001, with 10.1 WAR. But both players were extremely productive during the period in and around 1998.
Noting that Sammy Sosa's best season was 2001 with 10.1 WAR, much better than his more famous 6.8 WAR season in 1998.
I am advocating for writers to prevent themselves from becoming AI.
Encouraging book reviewers to bring some originality to their reviews.
In what would be his final postgame press conference, he chided critical fans by comparing them to passengers who fled the Titanic, a literal sinking ship.
On a poor analogy by former Louisville basketball coach Kenny Payne.
While the Ketogenic Diet (KD) has emerged as a potential therapeutic strategy for glioma (the most common neuroepithelial brain tumor), its underlying mechanisms have remained elusive. This study investigates the "gut-brain axis"—specifically the "microbiota-SCFAs-microglia" signaling pathway—to determine how gut microbiota and microbial metabolites mediate KD’s anti-glioma effects.
This research delineates a novel neuro-immune-metabolic mechanism where KD exerts its anti-cancer efficacy by modulating the gut microbiome. The findings strongly suggest that microbiome-targeted interventions—whether through strict dietary regimens like KD to enrich A. muciniphila, direct probiotic supplementation of R. faecis, or exogenous administration of butyrate—represent highly promising and actionable strategies for personalized glioma therapy.
(Zeisel et al., 2018), published in Cell, presents a comprehensive transcriptomic census of the adolescent mouse nervous system. By analyzing approximately 500,000 single cells, the researchers established a high-resolution molecular atlas and a data-driven taxonomy for the mammalian nervous system.
To manage the scale and complexity of the data, the authors developed Cytograph, an automated analysis pipeline:
The study organized the nervous system into a hierarchy based on three interacting principles:
The researchers identified four primary categories of genes that distinguish neuronal types:
Conclusion: This resource provides a foundational map for understanding the molecular logic of the brain. The full dataset, taxonomy, and "report cards" for each cell type are interactively available at mousebrain.org.
These markers were used to distinguish the GL261-GSC tumor cells from the healthy brain environment and define their stemness or malignancy.
The study highlights these markers to prove the model's ability to simulate how GBM integrates into the host brain's neural circuitry.
Kainate type: Grik2.
Neuron-Glioma Synapsis Mediators: Dlg4 (PSD95), Homer1, and Nlgn3 (Neuroligin-3). Nlgn3 was explicitly found to be upregulated by the TME interaction.
These markers defined the various immune populations and their functional state within the tumor microenvironment.
The paper identifies these as potential targets for immunotherapy within this specific mouse model.
Used in spatial transcriptomics to define "healthy brain parenchyma" vs. the tumor.
based on the average expression of 250 genes in each chromosomal region4,31
They seem to use the moving average window size as a reference. Which means, the inferCNV tool calculates the mean expression of all cells in the sample and subtract it. If the sample is 80% tumor, the "baseline" is essentially the tumor itself, making it impossible to see the actual CNVs.
astrocyte markers (GFAP, Aqp4 and Aldh1l1)
In Zeisel 2018, the cluster ACMB corresponds to Dorsal midbrain Myoc-expressing astrocyte-like, with marker set: [Myoc Gfap Slc36a2 Aqp4 C4b] And there is no Aldh1l1 in any marker sets.
I'm highly skeptical that this paper didn't use Zeisel 2018 marker sets.
neuron markers (Calb1, Slc17a7 and Gabra1)
in Zeisel et al. (2018), the neuron markers (cluster TEGLU7, called Excitatory neurons, cerebral cortex) are: A830009L08Rik,Gm12371,Lamp5,Calb1,Dact2
Marriage of adolescent girls in Nigeria reduced by 80% by ‘big push’ intervention
GM’s failure to consider its stakeholders
This can make or break your business. If you make the mistake like this and you lose trust from your consumers, things can go downhill fast.
There are no shortcuts. Imperfection, self-doubt, and mistakes are part of the process.
You must learn from your ethical failures over time if you want to create success for yourself and others within your organization.
Ethical professionals work for companies whose values align with their own. How
This reminds me of culture on any team/workplace. You must surround yourself and others with people that are aligned and focused on the same goals.
At the RBA’s press conference on Tuesday announcing the – Monetary Policy Decision – the Governor said that: … when governments are spending a lot of money and we’re running up against capacity constraints, then they do need to think about whether or not there’s ways they can help the inflation problem by looking for ways to constrain demand. Next week, the Treasurer will deliver his annual fiscal statement outlining spending and tax initiatives for 2026-27.
Jesus
“hedonic calculus”
This is very interesting. Almost an "analytical" way of measuring how ethical you are.
greatest happiness for the greatest number
Key to utilitarianism. Focal point of the reading.
the means become a way of life
It is not just about reaching goals or the outcome, it is about discipline and building character along the way.
practices. A single standard of business behavior that emphasizes respect and good service appeals to all.
Changing your moral compass for certain situations is detrimental to respecting others and doing good service.
Butanalogy can also operate in mutual alignment1 analogies to reveal commonalities thatwere previously not obvious in either analog.
Projecting information from a well-understood domain can lend structure to an unfamiliar domain, as in:The mitochondria are the power supply for a cell.
Analogy is often thought of chiefly as a way to transfer knowledge from one situationto another, and indeed, it often serves that function.
We illustrate ourpoints with examples from adults and children, including examples from language evolu-tion, and across both perceptual and conceptual domains.
We propose that—bothin the history of language and in children’s learning—analogical processes are a majorway in which new relational abstractions are acquired
But the ear-lier we go in development, the less able children are to comprehend verbal explanationsof abstract ideas. In contrast, there is evidence that analogical comparison and abstractionprocesses are present in 7–9-month-old infants, and even earlier (Anderson, Chang, Hes-pos, & Gentner, under review; Ferry, Hespos, & Gentner, 2015).
Relational categories have been the focus of much recent research (Asmuth &Gentner, 2017; Gentner, 2005; Gentner & Kurtz, 2005; Goldwater & Markman, 2011;Markman & Stilwell, 2001; Ross & Murphy, 1999), in part because of their importantrole in conceptual learning and education (Goldwater & Schalk, 2016).
For example, carnivore andherbivore are abstract relational categories, while canine and feline are abstract entity cat-egories.
Relational cate-gories are categories for which the basis for membership is participation in a commonrelational structure; thus, they differ from the more studied entity categories, such as tulipand spoon, whose members share many intrinsic properties.
Our main focus is on relational abstractions, includingprinciples, rules, and schemas, as well as abstract relational categories.
For example, causal system is more abstract than posi-tive feedback system, which in turn is more abstract than the specific positive feedbacksystem by which the melting of polar ice causes lower reflectance of the sun’s heat, lead-ing in turn to more rapid melting.
Wetake the process of abstraction to be one of decreasing the specificity (and therebyincreasing the scope) of a concept.
Many such abstractions are expressed as rela-tional categories—categories like evidence, counterfactual, and proportion, and on a moremundane level, bargain, ally, and rescue.
Theassertions that make up abstract knowledge are variously referred to as schemas, rules,abstractions, principles, or overhypotheses
Abstract structured knowledge is a key feature of higher order cognition (Gentner &Medina, 1998; Hummel, 2011; Markman, 1999; Tenenbaum & Griffiths, 2001).
it is not enough to consider the distribution of examples given to learn-ers; one must consider the processes learners are applying
Wepropose that analogical generalization drives much of this early learning and allows children togenerate new abstractions from experience
contrary to the general assumption,maximizing variability is not always the best route for maximizing generalization and transfer
The Mystery of Patrick Moore's Woodstock Typewriter<br /> by [[Robert Messenger]] for oz.Typewriter<br /> accessed on 2026-05-08T13:19:49
Users of Woodstock typewriters included: - Robert Bloch<br /> - Howard Fast<br /> - Alger Hiss (1929 standard #230099)<br /> - Sir Patrick Moore<br /> - J.C. Oldfield (editor of the Associated Press's London bureau, 1930s)<br /> - Gordon Parks
eLife Assessment
This work provides an important modeling-based framework for understanding the processes of temporal integration in the claustrum. These mechanisms could support a broader range of integrative brain function. The manuscript presents solid evidence for how claustrum may integrate temporal disparate signals via a novel computational phenomenon with neural dynamics evolving along neural trajectories as opposed to settling into fixed-point attractor states.
Reviewer #1 (Public review):
Summary:
In this manuscript, the authors investigate how the anterior claustrum may integrate temporally separated task-relevant signals to guide behavior in a delayed escape paradigm. Because in vivo neural recordings from claustrum during this task are extremely limited-comprising single-trial data with small neuronal samples-the authors adopt a modeling-driven approach. They train recurrent neural networks (RNNs) using only behavioral data (escape latency) to reproduce task performance and then analyze the internal dynamics of the trained networks. Within these networks, they identify a subset of units whose activity exhibits persistent responses and strong correlations with behavior, which the authors label as "claustrum-like." Using dimensionality reduction, decoding, and information-theoretic analyses, they argue that these units dynamically integrate conditioned stimulus (CS) and door-opening signals via nonlinear, trajectory-based population dynamics rather than fixed-point attractor states.
To bridge model predictions and biology, the authors complement the modeling with in vitro slice experiments demonstrating recurrent excitatory connectivity and prolonged activity in the anterior claustrum that depends on glutamatergic transmission. They further compare latent neural trajectories derived from previously published in vivo claustrum recordings to those observed in the RNN, reporting qualitative similarities. Based on these results, the authors propose that the claustrum implements temporal signal integration through recurrent excitatory circuitry and dynamic population trajectories, potentially supporting broader theories of integrative brain function.
Strengths:
This study addresses an important and challenging problem: how to infer population-level computation in a brain structure for which in vivo data are sparse and experimentally constrained. The authors are commendably transparent about these limitations and seek to overcome them through a principled modeling framework. The integration of behavioral modeling, RNN analysis, and slice electrophysiology is ambitious and technically sophisticated.
Several aspects stand out as strengths. First, the behavioral RNN is carefully trained and interrogated using a rich set of modern analytical tools, including cross-temporal decoding, trajectory analysis, and partial information decomposition, providing multiple complementary views of network dynamics. Second, the slice experiments convincingly demonstrate recurrent excitatory connectivity in anterior claustrum, lending biological plausibility to the model's reliance on recurrent dynamics. Third, the manuscript is clearly written, logically organized, and conceptually engaging, and it offers a coherent mechanistic hypothesis that could guide future large-scale recording experiments.
Importantly, the work has significant heuristic value: rather than merely fitting data, it attempts to generate testable computational ideas about claustral function in a regime where direct empirical access is currently limited.
Weaknesses:
Despite these strengths, the manuscript suffers from a recurring and substantial conceptual issue: systematic over-interpretation of model-data correspondence. While the modeling results are potentially insightful, the extent to which they are presented as recapitulating real claustral neural mechanisms goes beyond what the available data can support.
A fundamental limitation is that the RNN is trained solely on behavioral output, without being constrained by neural data at either single-unit or population levels. As a result, the internal network dynamics are underdetermined and non-unique. Many distinct internal solutions could plausibly generate identical behavior. However, the manuscript frequently treats the specific internal solution discovered in the RNN as if it were a close approximation of the actual claustrum circuit.
This issue is compounded by the sparse nature of the in vivo data used for comparison. The GPFA-based trajectory analyses rely on pseudo-populations and single-trial recordings, yet are interpreted as evidence for robust population-level dynamics. Because neurons were not recorded simultaneously, the inferred trajectories necessarily lack true population covariance and shared trial-to-trial variability, limiting their interpretability as genuine population dynamics. Similarly, conclusions about trajectory-based versus attractor-based computation are drawn almost exclusively from model analyses and then generalized to the biological system.
Overall, while the modeling framework is appropriate as a hypothesis-generating tool, the manuscript repeatedly crosses the line from proposing plausible mechanisms to asserting explanatory or even causal equivalence between the model and the brain. This undermines the otherwise strong contributions of the work.
Below are several specific points that warrant further clarification or revision:
(1) Tone of model-data correspondence
Numerous statements describe the RNN as "closely mimicking," "recapitulating," or being "nearly identical" to claustral neural dynamics, sometimes extending to claims about causal relationships between neural activity and behavior. Given that neural data were not used to train the model, and that only a small subset of trained networks showed the reported dynamics, these statements should be substantially softened throughout the manuscript. The RNN should be framed as providing one possible computational realization consistent with existing data, not as a close instantiation of the biological circuit.
(2) Non-uniqueness of RNN solutions
The fact that only a small fraction of trained networks exhibited "claustrum-like" clusters deserves deeper discussion. This observation raises the possibility that the identified solution is fragile or highly specific rather than canonical. The authors should explicitly discuss the non-uniqueness of internal solutions in behavior-trained RNNs, including the range of alternative network dynamics that can reproduce the same behavior. In particular, it should be clarified why the specific network exhibiting "claustrum-like" clusters is informative about claustral computation, rather than representing one arbitrary solution among many.
(3) GPFA trajectory comparisons
The qualitative similarity between RNN trajectories and GPFA-derived trajectories from sparse in vivo data is interesting but insufficient to support claims of robustness or population-level structure. Statements suggesting that these patterns are unlikely to arise from noise or random fluctuations are not justified given the single-trial, pseudo-population nature of the data. Either additional quantitative controls should be added, or the interpretation should be substantially tempered.
(4) Scope of functional claims
The discussion connecting the findings to broad theories of claustral function, global workspace, or consciousness extends well beyond the data presented. These speculative links should be clearly labeled as such and significantly reduced in strength and prominence.
The manuscript repeatedly describes the delayed escape task as an "inference-based behavioral paradigm" and states that animals "infer that a value-neutral alternative space is likely to be safer" when the CS is presented in a novel environment. While I appreciate that the US-CS association was established in a different context and that the CS is then presented in a new environment, I am not convinced that the current behavioral evidence uniquely supports an inference interpretation.
First, it is not clear that this task is widely recognized in the literature as a canonical inference task, in the sense of, for example, sensory preconditioning, transitive inference, or model-based inference paradigms. Rather, the observed effect-that CS animals escape faster to a neutral compartment than neutral-CS controls-can be parsimoniously interpreted in terms of generalized threat value, heightened fear/anxiety, or a bias toward avoidance/escape under elevated threat, without requiring an explicit inferential step about the specific safety of the alternative compartment. The fact that no prior training is needed is compatible with flexible generalization, but does not by itself demonstrate inference in a more formal computational sense.
Second, the inference claim becomes central to the manuscript's conceptual framing (e.g., the idea that rsCla supports "inference-based escape"), yet the behavioral analyses presented here and in the cited prior work do not clearly rule out simpler accounts. Clarifying this distinction would help avoid overstating both the inferential nature of the behavior and the specific role of rsCla and the RNN's "claustrum-like" cluster in supporting inference per se, as opposed to more general integration of threat-related signals with an opportunity for escape.
This manuscript presents an interesting and potentially valuable modeling-based framework for thinking about temporal integration in the claustrum, supported by solid slice physiology. However, in its current form, it overstates the degree to which the proposed RNN dynamics reflect actual claustral neural mechanisms. With substantial revision-especially a more cautious interpretation of model-data similarity and a clearer articulation of modeling limitations-the study could make a meaningful contribution as a hypothesis-generating work rather than a definitive mechanistic account.
Comments on revisions:
The authors have carefully addressed the concerns raised in the initial review. In particular, the manuscript has been substantially improved in terms of tone, conceptual clarity, and the interpretation of the modeling results. The revised version now presents a well-balanced and appropriately framed account of the work.
The study offers a compelling and useful hypothesis-generating framework for understanding temporal integration in the claustrum, and I support its publication. As a minor point, given the acknowledged limitations of pseudo-population and single-trial data, it would be preferable to slightly soften a few remaining statements that describe trajectory structure as directly "reflecting" population-level dynamics (e.g., using "consistent with" instead).
Reviewer #2 (Public review):
This manuscript reports the behavior of a computational model of rat claustral neurons during the performance of a behavioral task known as the delayed escape task (in this reviewer's understanding, this behavioral task was created and implemented by this group only). These authors have argued in a prior manuscript (Han et al.) that a group of neurons located "rostral to striatum" are part of the claustrum. The group names the region the "rostral to striatum claustrum." Additionally, in the Han et al. paper, the authors argue that these cells are responsible for maintaining a signal that lasts through the delay period.
The main findings of the current paper are:
(1) The authors have built a model network that was trained to show firing similar to what was reported for rats in their prior paper.
(2) The authors' analysis of model behavior is used to suggest that the model network recapitulates biological activity, including the existence of a cluster of cells mainly responsible for the delay period firing.
(3) The authors offer evidence from patch clamp recordings for excitatory interconnections among claustral neurons that are an essential feature of the model network.
A major value of the computational network is that "trials" of the network can be performed. In experiments on animals, only single trials can be used.
Concerns:
(1) This paper is based on behavioral results and neural recordings from their prior paper (Han et al.), but data, e.g. in figure 1, are not clearly identified as new or as coming from that source. Figure 1A, for example, appears to be taken directly from Han et al. No methods are given in this manuscript for the behavioral testing or the in vivo electrophysiology.
(2) Many other details are unclear. Examples include model training, the weight matrices and how these changed with training (p. 13), the equations 2 and 3 (p. 13), the sources for the constants in the equations (p. 14), the methods (anesthesia, stereotaxic coordinates, injection specifics and details for "sparse expression") for the ChrimsonR injections.
(3) The explorations of model behavior are a catalog of everything tried rather than an organized demonstration of what the model can and cannot do. The figures could be reduced in number to emphasize the key comparisons of the different clusters and the model's behavior under different conditions intended to "test" the model.
(4) On page 6, the E-E connectivity is argued from Shelton et al. (2025) and against Kim et al. (2016), but ignores Orman (2015), which to this reviewer's knowledge was the first to demonstrate such connectivity, including the long duration events and impact of planes of section.
(5) Whereas the authors are entitled to their own opinion of prior work (references 3-8), it is inappropriate to misrepresent prior work as only demonstrating a "limited function" of claustum. Additional papers by Mathur's group and Citri's group are ignored.
In summary, the authors have made a computational model that recapitulates the firing of a subset of potentially claustral neurons during a particular behavioral task (delayed escape is certainly not the only behavior that involves claustrum - see e.g., attention, salience, sleep). If the conclusion is that excitatory claustral cells must be connected to other excitatory claustral cells, such a conclusion is not new and the electrophysiological E-E metrics are not well quantified (e.g., connectivity frequency, strength of connection). If the model is intended to predict how claustrum might accomplish any other task, there is insufficient detail to evaluate the model beyond the evidence that the model creates a subset of cells that can sustain firing during the delay period in the delayed escape task.
All relevant work must be appropriately cited throughout the manuscript.
Comments on revisions:
The authors have adequately addressed the concerns that were raised in response to the first version of the manuscript.
Author response:
The following is the authors’ response to the original reviews
Public Reviews:
Reviewer #1 (Public review):
We thank the reviewer for their constructive and insightful comments and agree with the importance of the points raised. We recognize that aspects of our original presentation may have been unclear or overly strong in their interpretation. We have therefore revised the manuscript to clarify our intended scope, moderate our claims, and strengthen the analysis. In the second paragraph of the Discussion, we have explicitly acknowledged the concerns raised by the reviewer and outlined how they have been addressed in the revised manuscript. Our detailed responses are provided below.
(1) Tone of model-data correspondence
Numerous statements describe the RNN as "closely mimicking," "recapitulating," or being "nearly identical" to claustral neural dynamics, sometimes extending to claims about causal relationships between neural activity and behavior. Given that neural data were not used to train the model, and that only a small subset of trained networks showed the reported dynamics, these statements should be substantially softened throughout the manuscript. The RNN should be framed as providing one possible computational realization consistent with existing data, not as a close instantiation of the biological circuit
We agree with the reviewer’s comment. The expressions noted by the reviewer (e.g., closely mimicked, nearly identical, recapitulate) will be replaced with alternative wording that conveys a more moderate meaning (Line 16-17, 65-66, 83, 96, 120, 212).
(2) Non-uniqueness of RNN solutions
The fact that only a small fraction of trained networks exhibited "claustrum-like" clusters deserves deeper discussion. This observation raises the possibility that the identified solution is fragile or highly specific rather than canonical. The authors should explicitly discuss the non-uniqueness of internal solutions in behavior-trained RNNs, including the range of alternative network dynamics that can reproduce the same behavior. In particular, it should be clarified why the specific network exhibiting "claustrum-like" clusters is informative about claustral computation, rather than representing one arbitrary solution among many.
As the reviewer pointed out, behaviorally trained RNNs can admit multiple internal solutions that produce the same behavioral output, and we acknowledge the non-uniqueness of such internal solutions. However, we do not interpret the fact that only a subset of trained RNNs exhibit dynamics similar to those observed in the claustrum as evidence that this solution is fragile. Notably, the claustrum-like dynamics emerged spontaneously during training and were not explicitly enforced. Furthermore, our finding suggests that the emergence of this particular dynamical regime depends on relatively specific structural constraints.
Our criterion for selecting RNNs that could inform the computational principles of the claustrum was their ability to reproduce the behavioral and physiological observations obtained in the delayed escape experiments. RNNs that were excluded may reflect information-processing strategies used by other brain regions or may rely on artificial logical structures. The computational demand of the task, which integrates temporally separated signals, naturally drives convergence toward networks with recurrent excitatory connectivity capable of maintaining persistent activity. Indeed, all networks that exhibited a claustrum-like cluster shared a common structural feature: strong recurrent excitatory connectivity within Cluster 1. This property is consistent with biological characteristics observed in the slice experiments shown in Fig 2.
Importantly, the computational principles derived from this RNN were found to be quantitatively consistent with in vivo single-neuron activity patterns. Specifically, analysis using an eigenvalue-based metric (λ<sub>3</sub>/Σλ) revealed the same directional effect in both the RNN and the claustrum neuron data. In addition, a leave-one-neuron-out analysis showed that this pattern was broadly distributed across in vivo claustral neurons rather than being driven by a small subset (see Fig. 4).
Taken together, these convergent lines of evidence suggest that the computational model is not simply one arbitrary solution among many possible alternatives, but rather implements a computational principle that may underlie claustral functions.
(3) GPFA trajectory comparisons
The qualitative similarity between RNN trajectories and GPFA-derived trajectories from sparse in vivo data is interesting but insufficient to support claims of robustness or population-level structure. Statements suggesting that these patterns are unlikely to arise from noise or random fluctuations are not justified, given the single-trial, pseudo-population nature of the data. Either additional quantitative controls should be added, or the interpretation should be substantially tempered.
As the reviewer pointed out, the GPFA trajectory comparison presented in the original manuscript remained largely qualitative, and we agree that this alone was insufficient to establish robustness or provide convincing evidence for population-level structure. In the revised manuscript, we have therefore added the requested quantitative analysis (see Fig. 4).
Before describing the analysis, we would like to clarify several methodological limitations associated with pseudopopulation and single-trial data. GPFA estimates latent trajectories based on assumptions about covariance structure among neurons and temporal smoothness. In pseudopopulation datasets, the true simultaneously recorded covariance structure cannot be fully reconstructed, which is an inherent limitation. Because our dataset is based on single trials, the analysis does not directly exploit trial-to-trial variability. Nevertheless, the estimation of the latent space still depends on the covariance structure among real claustral neurons, suggesting that the inferred trajectories remain tied to biologically meaningful population dynamics.
Accordingly, the quantitative metric we introduce is not entirely independent of the GPFA estimation step. Rather, it is intended to evaluate the geometric structure of the single-trial latent trajectories estimated by GPFA. We acknowledged this limitation in the revised manuscript.
Specifically, for the biological data, we reanalyzed the GPFA-derived latent trajectories in PCA space and computed an eigenvalue-based metric (λ<sub>3</sub>/Σλ). For each of the 20 time bins, we applied a sliding window of 10 bins and calculated the covariance matrix within that window. The eigenvalues of PC1, PC2, and PC3 were then obtained, and the third eigenvalue (λ<sub>3</sub>) was normalized by the total variance (Σλ = λ<sub>1</sub> + λ<sub>2</sub> + λ<sub>3</sub>). This metric quantifies the degree to which the trajectory locally deviates from a planar structure that can be explained by two dominant axes. An increase in λ<sub>3</sub>/Σλ indicates that the population-state trajectory forms a higher-dimensional geometric structure beyond a simple two-dimensional combination.
For the RNN data, in contrast, the activity of all units can be observed simultaneously and sufficient trial repetitions are available. Therefore, GPFA was not applied; instead, PCA was performed directly on the population activity for each trial. We then computed an average trajectory across trials and applied the same λ<sub>3</sub>/Σλ metric. Thus, although the initial dimensionality reduction steps differ between the two systems, the definition and calculation of the final quantitative metric are identical. The focus of the comparison is therefore not the dimensionality reduction technique itself, but the geometric dimensional structure of the population trajectories evolving over time.
Importantly, within the biological dataset, the GPFA estimation procedure, preprocessing steps, pseudopopulation construction, subsampling strategy, temporal alignment criteria, and smoothing parameters were applied identically across conditions. Likewise, the same analysis pipeline was used for all conditions in the RNN. If structural biases had been introduced during covariance estimation or dimensionality reduction, they would be expected to affect all conditions within each system similarly. Nevertheless, the λ<sub>3</sub>/Σλ value was consistently and significantly higher in the CS condition than in the Neutral condition, and this directional pattern was observed in both the RNN and the claustral neuron data. This suggests that the effect reflects condition-specific differences in population dynamical structure rather than artifacts arising from a particular dimensionality reduction method.
To further test whether the observed effect might be driven by a small subset of neurons or specific neuron combinations, we performed a leave-one-neuron-out analysis on the claustrum dataset. Recomputing λ<sub>3</sub>/Σλ while removing one neuron at a time showed that, in the CS group, most neurons contributed relatively evenly to this metric, whereas the Neutral group did not show such a distributed contribution pattern. This indicates that the observed three-dimensional structure is not driven by a few outlier neurons or incidental covariance patterns, but rather reflects an organized population-level phenomenon.
If the result were primarily due to structural artifacts introduced by the pseudopopulation construction or dimensionality reduction procedures, it would be unlikely for consistent selective differences to repeatedly emerge between conditions under identical analysis pipelines. The consistently higher λ<sub>3</sub>/Σλ values observed in the CS condition therefore provide indirect support that this pattern reflects condition-specific population dynamics rather than estimation bias.
Taken together, these results suggest that the observed three-dimensional structure reflects condition-specific population dynamics rather than analysis artifacts. The fact that the same quantitative metric yields consistent effects in both the RNN and claustral data further strengthens the correspondence between the two systems.
(4) Scope of functional claims
The discussion connecting the findings to broad theories of claustral function, global workspace, or consciousness extends well beyond the data presented. These speculative links should be clearly labeled as such and significantly reduced in strength and prominence.
We agree with the reviewer and stated that references to these theories are speculative, while substantially reducing both their emphasis and prominence in the manuscript (Line 444-446, 451).
(5) Comment on Conceptual Interpretation of the Behavioral Paradigm:
The manuscript repeatedly describes the delayed escape task as an "inference-based behavioral paradigm" and states that animals "infer that a value-neutral alternative space is likely to be safer" when the CS is presented in a novel environment. While I appreciate that the US-CS association was established in a different context and that the CS is then presented in a new environment, I am not convinced that the current behavioral evidence uniquely supports an inference interpretation.
First, it is not clear that this task is widely recognized in the literature as a canonical inference task, in the sense of, for example, sensory preconditioning, transitive inference, or model-based inference paradigms. Rather, the observed effect-that CS animals escape faster to a neutral compartment than neutral-CS controls-can be parsimoniously interpreted in terms of generalized threat value, heightened fear/anxiety, or a bias toward avoidance/escape under elevated threat, without requiring an explicit inferential step about the specific safety of the alternative compartment. The fact that no prior training is needed is compatible with flexible generalization, but does not by itself demonstrate inference in a more formal computational sense.
Second, the inference claim becomes central to the manuscript's conceptual framing (e.g., the idea that rsCla supports "inference-based escape"), yet the behavioral analyses presented here and in the cited prior work do not clearly rule out simpler accounts. Clarifying this distinction would help avoid overstating both the inferential nature of the behavior and the specific role of rsCla and the RNN's "claustrum-like" cluster in supporting inference per se, as opposed to more general integration of threat-related signals with an opportunity for escape.
We agree with the reviewer’s concern. First, we referred to the delayed escape behavioral task as “a behavioral paradigm that requires integration of temporally separated task-relevant signals.” (Line 7-8). We also removed references to the term inference throughout the manuscript (Line 46, 51, 67, 397).
Reviewer #2 (Public review):
We sincerely thank the reviewer for their constructive and insightful comments. Through the revision process, the manuscript has been substantially improved, with increased reproducibility, more appropriate acknowledgment of prior work, and a clearer and more logical presentation of the study.
(1) This paper is based on behavioral results and neural recordings from their prior paper (Han et al.), but data, e.g., in Figure 1, are not clearly identified as new or as coming from that source. Figure 1A, for example, appears to be taken directly from Han et al. No methods are given in this manuscript for the behavioral testing or the in vivo electrophysiology.
We agree with the reviewer that this distinction should be made clearer. In the original manuscript, we indicated in the Figure 1 legend that panels A, D, E, F, and L (left) were reproduced from Han et al. (2024). To further clarify this point, we explicitly noted this distinction again in the main text (Line 74, 85). In addition, we described the behavioral experiments and in vivo electrophysiological recordings performed in Han et al. (2024) in the Methods section and include the appropriate citation (Line 463-530).
(2) Many other details are unclear. Examples include model training, the weight matrices and how these changed with training (p. 13), equations 2 and 3 (p. 13), the sources for the constants in the equations (p. 14), the methods (anesthesia, stereotaxic coordinates, injection specifics and details for "sparse expression") for the ChrimsonR injections.
We agree with the reviewer’s comment and have revised the manuscript to provide a more detailed description of the model training procedure, weight initialization, and parameter selection.
We expanded the explanation of the model training procedure and weight initialization. Specifically, the recurrent (W<sub>rec</sub>) and output (W<sub>out</sub>) weight matrices were initialized using a Glorot normal distribution with a standard deviation of  to ensure stable signal propagation during early training. In addition, we now explicitly describe the training algorithm and optimization procedure. The network was trained using the Adam optimizer implemented in TensorFlow (v2.1.0) with a batch size of 256 for 1.2 million training iterations, minimizing the per-trial loss function defined in the manuscript. We also explicitly stated how Dale’s principle was maintained throughout training: rows in W_out corresponding to inhibitory units were zeroed out, and recurrent weights were continuously constrained so that excitatory and inhibitory neurons preserved their respective positive and negative synaptic projections. To illustrate how the weight structure evolved during training, we explicitly reference Figure 2A, which visualizes the final mean inter-cluster synaptic weights and highlights the strong recurrent connectivity that emerged within Cluster 1. Regarding Equations 2 and 3 and their constants, we clarified that the target escape times used to anchor the network were based on experimentally measured behavioral latencies (48.7 s for the CS-present condition and 111.3 s for the CS-absent condition). Furthermore, the regularization coefficients (λ = 0.01 and λ<sub>FR</sub> = 0.95) were selected through a grid search procedure to maintain biologically plausible firing rates while preventing overfitting.
We detailed the surgical procedures that were previously omitted. This includes the specific anesthesia protocol (sodium pentobarbital, 50 mg/kg, i.p.), stereotaxic mounting, and the exact coordinates for the rsCla (AP +2.95, ML ±1.95, DV -3.85 mm). To define "sparse expression," we specified that the AAV was diluted 1:4 in sterile saline. Finally, we included the precise injection parameters: delivery at 20 nL/min via a pressure injection system, with the pipette left in place for 10 minutes post-infusion to ensure adequate diffusion. (Line 635, 636-639, 641-643). We have added these contents in the Methods section.
(3) The explorations of model behavior are a catalog of everything tried rather than an organized demonstration of what the model can and cannot do. The figures could be reduced in number to emphasize the key comparisons of the different clusters and the model's behavior under different conditions, intended to "test" the model.
We agree with the reviewer’s comment and have reorganized the figures to focus on the key results. Specifically, we separated the original figures so that they correspond to (1) Presentation of an RNN model consistent with the results of actual claustral recordings, (2) identification of dimensionality-reduced population activity patterns in the model, (3) comparison of these patterns with population activity patterns derived from recorded claustral neurons, (4) proposal of a nonlinear integration mechanism, and (5) the suggestion that such integration may be implemented through dynamic coding. Using this figure organization, we first identify RNN models trained on behavioral metrics whose dynamics are consistent with experimental claustral recordings. We then compare the dimensionality-reduced population activity patterns of these models with those derived from recorded claustral neurons to evaluate their biological plausibility. After selecting the models that satisfy this criterion, we perform further analyses that would be difficult to achieve using real neural recordings alone. These analyses ultimately allow us to propose dynamic coding exhibiting nonlinear integration as a plausible computational mechanism.
(4) On page 6, the E-E connectivity is argued from Shelton et al. (2025) and against Kim et al. (2016), but ignores Orman (2015), which, to this reviewer's knowledge, was the first to demonstrate such connectivity, including the long-duration events and impact of planes of section.
We agree with the reviewer’s suggestion and will include a reference to Orman (2015). We have clarified that neuronal activity can persist for extended periods and that such persistent activity has been observed in claustral slices prepared at a specific slicing angle (Line 144).
(5) Whereas the authors are entitled to their own opinion of prior work (references 3-8), it is inappropriate to misrepresent prior work as only demonstrating a "limited function" of claustrum. Additional papers by Mathur's group and Citri's group are ignored.
We agree with the reviewer’s comment and have revised the relevant sentences in the Introduction section. We also included and acknowledged the contributions of previous studies by the Mathur group and the Citri group by adding additional references to their works (Line 36, 429).
In summary, the authors have made a computational model that recapitulates the firing of a subset of potentially claustral neurons during a particular behavioral task (delayed escape is certainly not the only behavior that involves claustrum - see e.g., attention, salience, sleep). If the conclusion is that excitatory claustral cells must be connected to other excitatory claustral cells, such a conclusion is not new, and the electrophysiological E-E metrics are not well quantified (e.g., connectivity frequency, strength of connection). If the model is intended to predict how the claustrum might accomplish any other task, there is insufficient detail to evaluate the model beyond the evidence that the model creates a subset of cells that can sustain firing during the delay period in the delayed escape task.
All relevant work must be appropriately cited throughout the manuscript.
Regarding the E–E metric, we obtained the following result. When including recordings in which the whole-cell recording could not be completed, optogenetically evoked responses were observed in 38 out of 43 patched cells. This suggests that approximately 90% of the cells receive intra-claustral excitatory input. However, the current dataset does not allow us to quantify the connection probability or the strength of these connections.
As the reviewer pointed out, the RNN developed in this study is specifically designed for the delayed escape task, and we do not intend to claim direct generalization to other proposed functions of the claustrum, such as attention, salience, or sleep. The goal of this study is to computationally characterize the temporal integration mechanism of the claustrum observed in this specific task. We have included this in the Discussion section. In the second paragraph of the Discussion, we have explicitly acknowledged the concerns raised by the reviewer and outlined how they have been addressed in the revised manuscript.
"Add to our standard" 按钮放 Coaching Highlights 旁 K3 0.5-1 周纯 UI recommendation loop MVP,0 ML 🟠 1 月内
什么价值?
AI agent 卡片 gallery 模式(每个 agent = 卡 + 状态 + stat)
Sale related, not relevant right now
Pain-sidebar landing 模式(7 痛点 + 7 demo card)⭐⭐⭐
需要等产品核心数据准确,功能出来可以去做UI页面。如果产品没问题预计6月中上旬做
抄 — 健身轻量版
这个该如何做?
Customer-defined gold standards(客户编辑评分标准)
这个表达不太清楚,价值在哪里?
https://typewriterdatabase.com/1914-woodstock-4.20964.typewriter
The Woodstock No. 4 had a custom typewriter eraser holder mounted on top of the typewriter.

phenomenographic approach
A phenomenographic approach is an elaborate qualitative research method used to map the different ways people experience, conceptualize, or understand a specific instance of the world.
Research and evaluation priorities — Which specific papers, issues, or research questions should The Unjournal prioritize for expert evaluation as part of the CM cost viability Pivotal Question? What new research (e.g., TEA reviews, production cost benchmarks, expert elicitation)92For context on what's already been identified: see the workshop reading list → and the UJ CM research scoping on Coda → or data would most reduce remaining uncertainty? [pre-session note]93David Manheim (Technion/ALTER, participated in May 6 pre-session) suggested we also consider: AI-powered and robotics-driven advances in manufacturing and bioengineering that may spill over from other fields, and scenarios where non-chicken species (salmon, veal) become the viable CM product first. [Suggested discussants]Suggested discussants:Matt McNulty (Tufts CCA) — strategic view of research priorities from an academic CM centerElliot Swartz (GFI) — has systematically mapped CM research gaps; knows what evidence would most shift the cost pictureJakub Kozlowski (model developer) — knows where the model's input uncertainties are largest; can specify what data would most tighten them
Eliot: Feed conversion ratio, taste studies on inclusion rates, actual cost of equipment, capital needs; scale out or up?
"We know more about media costs already"
What would commercially viable CM production actually require; on what horizon; and what does industry experience suggest about the factors beyond production cost that determine whether a CM business can sustain itself? Price parity63Parity could be with conventional meat, a hybrid product (cells + plant-based inputs), or a niche premium product. The relevant cost target differs significantly between these cases. is not the only route; hybrid products, niche markets, or differentiated positioning64Consumer acceptance, regulatory pathways, and market positioning are important questions that may be covered in other workshops or projects. But these routes to viability are relevant context for understanding what cost targets need to be reached. are also paths. Discussion space — unfold & annotate via Hypothes.isPaths to commercial viability — discussion spaceUse #question to flag something for verbal discussion during the session.Requirements for viability by 2036 [?]65What needs to be true — technically, financially, or politically — for CM to reach viability by 2036?Hybrid/niche paths [?]66Are hybrid products or niche markets a more realistic near-term path than full cost parity with conventional meat?Lessons from company challenges [?]67What do recent company difficulties teach us about what viability requires beyond production cost; including return on R&D investment?Other (S2 viability) — annotate here to add a point not covered aboveQuestions for discussants — annotate here to surface your question during the session[how this works]68Annotate this page via the Hypothes.is sidebar to leave a question or comment. Add #question to flag it for verbal discussion; #zoom for immediate Zoom chat attention. Reply to or +1 existing annotations; use @ to flag a specific person (who already commented on the page). Key uncertainties and research gaps [note]69These questions connect to S3: how should today's ground-truth from S2 shift our priors on CM's cost trajectory and AW funding value? [Suggested discussants]Suggested discussants:Matt McNulty (Tufts CCA) — strategy & operations at academic CM center; systematic view of where evidence is thinnestElliot Swartz (GFI) — wants to discuss modeling_hack + tea_review; GFI systematically identifies high-value research gaps
European space agency tender for CM in 2021!!
cost cascade
GM cells are very practical. But we should not forget that primary, freshly isolated cells will have alot of advantages: they are always there fresh, you dont really need -80C freezers, which are expensive to buy and to run, you dont need alot of research to establish them, and almost no QC before you can use them, and customer acceptance is higher. Is there a TEA on that?
CDMO cost reality [?]59
20-25K per week for normal 200l bioprocesss -- JM ... maybe 15k with discounts. [Jordi's quick take]
S1 claims: push-back from practice [?]54Which S1 technical claims do you push back on from production experience; how cost-relevant is the gap?
An industry practitioner says: Focus on what is practical, where can I produce it, what will it cost
Achievable densities
Is the bioreactor density assuming a single-cell suspension system? If a "classical" stirred tank bioreactor is used, there is likely a different max cell density for that than a custom reactor meant for adherent cell culture.
hydrolysate viability
Biggest questions for me is whether the hydrolysates can meet nutritional needs for high density growth in suspension settings, and whether this is actually more economically-efficient than using purified nutrients. Still more work to do to prove this out, but the early proof-of-concepts that Aleksandra showed & the circular approaches are quite exciting
Other (Cell lines) — annotate here to add a point not covered above
Maybe also just worth flagging that genetic editing is great and maybe even necessary in order to make cells suitable for cultivated meat bioprocesses, but it can introduce a big metabolic burden to the cells that impact growth rate/differentiation if you ask them to do too many things at once. The cell has to make tradeoffs and sometimes engineering causes unexpected downstream cascades that maybe need to be considered? I agree though, adaptation and engineering will be needed (possibly in conjunction) for cultivated meat cell lines.
Regulatory
EU Scienctific Funds are not very open to proposals containing gene editing for food industry - from my feeling. Do you have other information? #question
Cell line choic
Oana suggested that embryonic stem cells would have a consumer acceptance problem. I don't quite see why that would be (animal welfare wise, isn't it just a few cells here as the starter, not many calves)? #question ... would it otherwise be high-value
pb_glossary id=”996″]purgatory [/pb_glossary
Error to fix
He is flanked on either side by members of his court: on the right by those who fight (two members of the nobility who carry a sword, a lance and shield) and, on the left, by those who pray (two members of the clergy who hold books).
Parallels the mosaics at San Vitale, Ravenna.
CORRESPONDENCE MANAGEMENT THE ANSWER TO CUTTING CORRESPONDENCE COSTS<br /> by [[CIA Reading Room]]<br /> accessed on 2026-05-08T10:40:59<br /> cia-rdp74-00005r000200120008-2<br /> November 1954
t is a rather bizarre sort of prestige to value evidence of less experience, but that’s exactly what unaccented language is. A middle- to upper-class white American who travels nowhere and learns nothing of consequence can still sound perfectly prestigious merely by speaking their natural English variety. We actually prefer (or privilege) the appearance of ignorance.
i must reread this passage (unclear of the meaning) completely over my head here
Hello, thanks for doing this research! I noticed that the source code mentioned in the manuscript at https://github.com/HickeyLab/Segmentation_Comparison results in a 404 (not found) at the moment (5/8/26), and could be a private repository. Could I ask for open access to this resource to help understand the content of the manuscript? Thank you!
Sa démarche laisse cependant en partie de côté le caractère profondément problématique de la transformation dans la nature même du lien social impliqué par le « moment robotique » et la démultiplication des avatars et des vies virtuelles.
Limite tout à fait intéressante
expériences psychologiques in situ
Ici également, les expériences psychologiques in situ étaient-elles déployées en laboratoire ? Comment ? De quoi les participants étaient-ils informés ?
la simulation du lien social peut nous suffire, montrant ainsi que l’inanimé ne souffre d’aucun préjugé dans notre rapport à l’autre.
Nous pouvons interroger cette opinion. L'inanimé (la machine) ne souffre d'aucun préjugés est encore à prouvé. Aujourd'hui à l'ère de ChatGPT nous aperçevons déjà les multiples biais de l'intelligence artificielle façonnée par des données issues d'humains. Il est possible que le/la créateur(trice) de ces outils inanimés, ici le Furby, ai retranscrit sans le vouloir ou au contraire de manière volontaire des idées, préjugés et biais personnels. De plus le fait d'affirmer que la simulation du lien sociale peut nous suffire a ses limites : elle peut ne pas suffire à certain(e)s, et la machine n'a pas le vécu et l'empathie d'un humain.
rien ne vient entraver le transfert ou la rage
Le transfert fait référence au courant psychanalytique et ce phénomène psychologique n'est pas prouvé scientifiquement.
L’analyse de l’auteure est particulièrement pertinente lorsqu’elle interroge les différents phénomènes humains qui disparaissent avec cette connectivité omniprésente, en s’appuyant sur Emmanuel Lévinas pour rappeler l’importance de la voix ou du face-à-face, ou sur la tradition psychanalytique, dont elle se revendique.
Opinion, ce n'est pas factuel et ça oriente l'opinion du lecteur.
machines à maximiser
Qu'en est-il des cultures hors Occident ? Est-ce que ce phénomène de multitasking et le rythme guidé par la technologie existent ou s'expriment de la même manière ? Quels déterminants mènent à cela ?
les robots y sont en effet ceux qui nous ramèneraient vers le réel
Cela semble être paradoxal
remède à un problème social de départ
Remède ou cache misère ? La solution ne serait-elle pas de sensibiliser les humains à l'importance de prendre de soin des personnes âgées ? Les maisons de retraites ne devraient-elles pas bénéficier d'un financement à la hauteur de leur mission sociale ? Un robot peut-il vraiment prendre soin des personnes âgées ? Quelles sont les conséquences psychologiques d'un contact prolongé avec un robot associé à un contact restreint avec un adulte ?
le célèbre Tamagochi sert à illustrer le processus de deuil que connaissent les enfants pour des vies artificielles
Est-ce une interprétation ou est-ce un élément rapporté par un ou plusieurs enfants participant aux recherches de l'auteure ?
contribue à donner un aspect romancé à la recherche, qui rend la lecture de l’ouvrage dynamique
Ici l'auteure choisit de parler de son expérience subjective, cela peut mener à des arguments rhétoriques (logos) parmi de solides arguments épistémiques issues de ses recherches et expérimentations. Cela peut avoir plusieurs effets sur le lecteur qui pourra par exemple généraliser l'expérience subjective de l'auteure, ou encore arrêter sa lecture dans le cas d'un lecteur très rationnel et raisonnable qui jugerait l'ouvrage comme peu sérieux.
Partant de l’idée que les ordinateurs sont des objets d’un genre nouveau, car ils disposent de dimensions psychologiques tout en étant de simples choses (p. 57), l’auteure va mettre en évidence la relation émotionnelle pouvant lier humains et machines, à travers les figures de robots comme le My Real Baby, le Furby ou le Tamagochi
Intéressant, à voir sur quoi se base l'étude et sa validité
Super interesting results! In our Chlamydomonas study (https://doi.org/10.1091/mbc.E22-09-0443) we found that endocytic pits/dots (actin-rich and arp2/3 dependent) were also inhibited by pitstop2 to inhibit clathrin-mediated endocytosis upon acute onset of ciliogenesis, which obviously could be cell-type specific differences or due to drug specificity issues. In your study, while here it does appear that clathirin appears dispensable for ciliogenesis, I wonder how much membrane flux happens from compensating sources when one internalization route is blocked?... especially since you see an increase in ciliiogenesis upon dominant negative EPS15 and dynamin-2 expression.
Alphabet
Example
eLife Assessment
This important advancement in the field of neurotransmission delivers a novel toolkit for in vivo visualization of vesicular transporters for ACh, GABA, glutamate and monoamines in C. elegans. With the application of newly developed neuron-specific knockout methods for these vesicular transporters, the results convincingly demonstrate that over 10% of the neurons studied show transporter co-expression that may be correlated with co-transmission. These findings and toolkit will be of interest towards the study of neural circuit function.
Reviewer #1 (Public review):
Summary:
This study presents a novel toolkit for visualizing and manipulating neurotransmitter-specific vesicles in C. elegans neurons, addressing the challenge of tracking neurotransmitter dynamics at the level of individual synapses. The authors engineered endogenously tagged vesicular transporters for glutamate, GABA, acetylcholine, and monoamines, enabling cell-specific labeling while maintaining physiological function. Additionally, they developed conditional knockout strains to disrupt neurotransmitter synthesis in single neurons. The study reveals that over 10% of neurons in C. elegans exhibit co-transmission, with a detailed case study on the ADF sensory neuron, where serotonin and acetylcholine are trafficked in distinct vesicle pools. The approach provides a powerful platform for studying neurotransmitter identity, synaptic architecture, and co-transmission.
Strengths:
(1) This toolkit offers a generalizable framework that can be applied to other model organisms, advancing the ability to investigate synaptic plasticity and neural circuit logic with molecular precision.
(2) The use of this toolkit, the authors uncover molecular heterogeneity at individual synapses, revealing co-transmission in over 10% of neurons, and offers new insights into neurotransmitter trafficking and synaptic plasticity, advancing our understanding of synaptic organization.
Weaknesses:
(1) While the article introduces valuable tools for visualizing neurotransmitter vesicles in vivo, the core techniques are based on previously established methods. The study does not present significant technological breakthroughs, limiting the novelty of the methodological advancements.
(2) The article does not fully explore the potential implications or the underlying mechanisms governing this process, while the discovery of co-transmission in over 10% of neurons is an intriguing finding. A deeper investigation into the functional uniqueness and interactions of neurotransmitters released from individual co-transmitting neurons-perhaps through case study example-would strengthen the study's impact.
Comments on revisions:
I have no further questions regarding this work. I would like to congratulate the authors on the forthcoming publication of their manuscript. This study presents a versatile methodological framework with strong potential to advance the field of neuroscience, particularly in dissecting neural circuit function and neurotransmission dynamics in vivo.
Reviewer #2 (Public review):
Summary:
In this manuscript, the authors developed fluorescent reporters to visualize the subcellular localization of vesicular transporters for glutamate, GABA, acetylcholine, and monoamines in vivo. They also developed cell-specific knockout methods for these vesicular transporters. To my knowledge, this is the first comprehensive toolkit to label and ablate vesicular transporters in C. elegans. They carefully and strategically designed the reporters, and clearly explained the rationale behind their construct designs. Meanwhile, they used previously established functional assays to confirm that the reporters are functional. They also tested and confirmed the effect of cell-specific and pan-neuronal knockout of several of these transporters.
Strengths:
The tools developed are versatile: they generated both green and red fluorescent reporters for easy combination with other reporters; they established the method for cell-type specific KO to analyze function of the neurotransmitter in different cell types. The reagents allow visualization of specific synapses among other processes and cell bodies. In addition, they also developed a binary expression method to detect co-transmission "We reasoned that if two neurotransmitters were co-expressed in the same neuron, driving Flippase under the promoter of one transmitter would activate the conditional reporter-resulting in fluorescence-only in cells also expressing a second neurotransmitter identity". Overall, this is a versatile and valuable toolkit with well-designed and carefully validated reagents. This toolkit will likely be widely used by the C. elegans community.
Comments on revisions:
The authors addressed my questions in the revised manuscript.
Reviewer #3 (Public review):
Summary:
Cuentas-Condori et al. generate cell-specific tools for visualizing the endogenous expression of, as well as knocking out, four different classes of neurotransmitter vesicular transporters (glutamatergic, cholinergic, gabaergic and monoaminergic) in C. elegans. They then use these tools in an intersectional strategy to provide evidence for the co-expression of these transporters in individual neurons, suggesting co-transmission of the associated neurotransmitters.
Strengths:
A major strength of the work is the generation of several endogenous tools that will be of use to the community. Additionally, this adds to accumulating evidence of co-transmission of different classes of neurotransmitters in the nervous system.
Another strength is the comparison to previously published single cell sequencing data and other previously published data.
Weaknesses:
Co-expression of these transporters is not in and of itself sufficient to establish neurotransmitter co-release, but this caveat is acknowledged by the authors.
Comments on revisions:
The authors have addressed all of my previous concerns.
Author response:
The following is the authors’ response to the original reviews.
Public Reviews:
Reviewer #1 (Public review):
Summary:
This study presents a novel toolkit for visualizing and manipulating neurotransmitterspecific vesicles in C. elegans neurons, addressing the challenge of tracking neurotransmitter dynamics at the level of individual synapses. The authors engineered endogenously tagged vesicular transporters for glutamate, GABA, acetylcholine, and monoamines, enabling cell-specific labeling while maintaining physiological function. Additionally, they developed conditional knockout strains to disrupt neurotransmitter synthesis in single neurons. The study reveals that over 10% of neurons in C. elegans exhibit co-transmission, with a detailed case study on the ADF sensory neuron, where serotonin and acetylcholine are trafficked in distinct vesicle pools. The approach provides a powerful platform for studying neurotransmitter identity, synaptic architecture, and co-transmission.
Strengths:
(1) This toolkit offers a generalizable framework that can be applied to other model organisms, advancing the ability to investigate synaptic plasticity and neural circuit logic with molecular precision.
(2) Through the use of this toolkit, the authors uncover molecular heterogeneity at individual synapses, revealing co-transmission in over 10% of neurons, and offer new insights into neurotransmitter trafficking and synaptic plasticity, advancing our understanding of synaptic organization.
Weaknesses:
(1) While the article introduces valuable tools for visualizing neurotransmitter vesicles in vivo, the core techniques are based on previously established methods. The study does not present significant technological breakthroughs, limiting the novelty of the methodological advancements.
The reviewer is correct that this study does not introduce fundamentally new molecular or imaging techniques. Rather, the goal of this work is to establish a generalizable and experimentally validated framework for investigating neurotransmission in vivo at single-cell resolution. To achieve this, we deliberately integrate robust and well-established approaches, including CRISPR-based genome engineering, endogenous tagging, intersectional labeling strategies, and behavioral genetics, into a unified toolkit that enables questions that were previously difficult to address in intact animals.
The novelty of the work therefore lies not in the invention of individual technologies, but in their systematic integration, functional validation, and deployment to reveal new biological insights, such as the prevalence and spatial organization of co-transmission in vivo.
(2) The article does not fully explore the potential implications or the underlying mechanisms governing this process, while the discovery of co-transmission in over 10% of neurons is an intriguing finding. A deeper investigation into the functional uniqueness and interactions of neurotransmitters released from individual co-transmitting neurons - perhaps through case study examples - would strengthen the study's impact.
We agree with the reviewer that this study does not exhaustively explore the functional implications or mechanisms of co-transmission. The primary goal of this work is to introduce and share a validated set of strains that enable monitoring and cell-specific disruption of the major neurotransmitter systems in C. elegans, using molecular components that are broadly conserved across species. By establishing this toolkit, we aim to enable the mechanistic, single-cell analyses of co-transmitting neurons that extend beyond the scope of the present study but represent important next steps for the field.
Reviewer #2 (Public review):
Summary:
In this manuscript, the authors developed fluorescent reporters to visualize the subcellular localization of vesicular transporters for glutamate, GABA, acetylcholine, and monoamines in vivo. They also developed cell-specific knockout methods for these vesicular transporters. To my knowledge, this is the first comprehensive toolkit to label and ablate vesicular transporters in C. elegans. They carefully and strategically designed the reporters and clearly explained the rationale behind their construct designs. Meanwhile, they used previously established functional assays to confirm that the reporters are functional. They also tested and confirmed the effect of cell-specific and pan-neuronal knockout of several of these transporters.
Strengths:
The tools developed are versatile: they generated both green and red fluorescent reporters for easy combination with other reporters; they established the method for cell-typespecific KO to analyze the function of the neurotransmitter in different cell types. The reagents allow visualization of specific synapses among other processes and cell bodies. In addition, they also developed a binary expression method to detect co-transmission "We reasoned that if two neurotransmitters were co-expressed in the same neuron, driving Flippase under the promoter of one transmitter would activate the conditional reporter - resulting in fluorescence - only in cells also expressing a second neurotransmitter identity". Overall, this is a versatile and valuable toolkit with well-designed and carefully validated reagents. This toolkit will likely be widely used by the C. elegans community.
Weaknesses:
The authors evaluated the positions of fluorescent puncta by visually comparing their positions with the positions of synapses indicated by EM reconstruction. It would provide stronger supportive evidence if the authors also examined co-localization of these reporters with well-established synaptic reporters previously published by their lab, such as reporters that label presynaptic sites of AIY interneurons.
We have now included images of the synaptic vesicle marker RAB-3 in neurons like ASE (new Figure S2) and RIB (new Figure S4D). We mention in the text that the patterns observed with VGLUT/EAT-4 (in Figure 2E) and VGAT/UNC-47 (Figure 3D) are like those observed in the Rab3 images (Figure S2 and S4D, now discussed in lines 180-182 and line 244, respectively), supporting labeling of presynaptic vesicles.
Additionally, we now show that in the ADF neuron, a mutant for the conserved presynaptic kinesin KIF1A, results in the accumulation of VACh/UNC-17 and VMAT/CAT-1 in the cell soma and the elimination of the signal from the ADF axon (new Figure 7D-D’). These results are also consistent with the idea that these labeled transporters localize to synaptic vesicles that fail to be transported into the axon in the absence of a functional KIF1A/UNC-104 protein (lines 408-411).
This toolkit will likely be widely used by the C. elegans community. To facilitate the adoption of the approach and method by worm labs, the authors should include their plan for the dissemination of all of the reagents included in the kit, along with all of the associated information, including construct sequences and the protocols for their use.
We thank the reviewer or this suggestion, and in response we now: (1) have deposited all strains that we developed in this study to the Caenorhabditis Genetics Center, (2) have created a public website with sequences and genotyping information for each allele developed (https://www.intralab.app/research-papers/cuentas-condori_etal-2026) and(3) have named the tool kit, SynaptoTagMe, and included the name in the title and in the text. We also added the information of the public website to the main text (lines 140-142) and methods section (lines 540-542).
Reviewer #3 (Public review):
Summary:
Cuentas-Condori et al. generate cell-specific tools for visualizing the endogenous expression of, as well as knocking out, four different classes of neurotransmitter vesicular transporters (glutamatergic, cholinergic, GABAergic, and monoaminergic) in C. elegans. They then use these tools in an intersectional strategy to provide evidence for the coexpression of these transporters in individual neurons, suggesting co-transmission of the associated neurotransmitters.
Strengths:
A major strength of the work is the generation of several endogenous tools that will be of use to the community. Additionally, this adds to accumulating evidence of co-transmission of different classes of neurotransmitters in the nervous system.
Weaknesses:
A weakness of the study is a lack of comparison to previously published single-cell sequencing data. These tools are alternatively described in the manuscript as superior to the sequencing data and as validation of the sequencing data, but neither claim can be assessed without knowing how they compare and contrast to that data. It is thus not clear to what extent the conclusions of this paper are an advance over what could be determined from the sequencing data on its own. Finally, some technical considerations should be discussed as potential caveats to the robustness of their intersectional strategy for concluding that certain genes are indeed co-expressed. Overall, claims about cotransmission should be tempered by the caveats presented in the discussion, suggesting that co-expression of these transporters is not in and of itself sufficient for neurotransmitter release.
To clarify, we do not claim that our tools are superior to single-cell sequencing data. Rather, we view the characterization of neurotransmitter identity as an iterative process of discovery and validation across complementary approaches. Moreover, while this study provides an additional lens through which to examine neurotransmitter identity, its primary advance is not in redefining transmitter identity per se, but in establishing a toolkit that enables direct, in vivo monitoring and manipulation of neurotransmitter use at single-cell resolution.
We do agree on the importance of explicitly comparing our findings with prior studies. In the revised manuscript we have therefore strengthened this integration by:
(1) Revising Figure S9 and its legend to indicate the source of information for each neuron;
(2) Adding a new Table 3 summarizing neurons consistently reported to have co-transmission potential;
(3) Adding a new Table 4 listing neurons previously suggested to be co-transmitter neurons but not consistently supported across datasets;
(4) Revising the Results to clarify these comparisons (lines 372-374 and 381-383); and
(5) Incorporating this discussion into the main text (lines 482–488).
In the Discussion we also now acknowledge technical caveats of the intersectional strategy, emphasizing that co-expression of vesicular transporters indicates co-transmission potential but is not, on its own, sufficient evidence of functional co-release (lines 482–488).
Recommendations for the authors:
Reviewer #1 (Recommendations for the authors):
(1) The design of different recombination sites for the transporters is a key strength of this paper. While the authors have provided justification and validation for the chosen sites, it would be valuable to know whether alternative insertion sites were tested as controls. A comparative analysis of multiple sites would provide important insights, especially for the design of similar sites in other proteins or in mammalian systems.
Our paper lists all the sites tested for labeling each synaptic vesicle transporter. To summarize this information, we have added Table 5 in the Methods section (line 591).
(2) Given the endogenous nature of the transporter design, it would be interesting to know if the authors have observed dynamic vesicle trafficking to explain the partial overlap shown in Figure 7. A dynamic approach could better capture the potential synergism and heterogeneity of co-transmission. I recommend that the authors try time-lapse imaging to explore this dynamic process further.
We agree that dynamic imaging approaches, including time-lapse analysis of vesicle trafficking, represent an exciting avenue to further investigate the spatial and temporal organization of co-transmission. Such experiments are part of ongoing work in our laboratory and will be the focus of future studies aimed at dissecting the dynamic regulation of transmitter-specific vesicle populations in vivo.
(3) The paper identifies co-transmission across a significant proportion of neurons, but the functional implications and interactions of neurotransmitters released from individual cotransmitting neurons are not fully explored. A case study focusing on the uniqueness and interactions of neurotransmitter release in these neurons would provide further clarity on the biological relevance of co-transmission.
We agree with the reviewer on the importance of dissecting the functional implications of co-transmission and understanding how different neurotransmitters interact within individual co-transmitting neurons in vivo. The primary goal of this study is to establish and share tools that enable such investigations, and we anticipate that future work, using these reagents, will examine the functional roles of co-transmission on a neuron-by-neuron basis in the future.
(4) Minor Comments:
(a) Figure S1D: The label "eat-4" in the eat-4::GFP image appears in italics.
We have corrected this.
(b) Figure 2C: The figure legend is missing the statistical significance notation (*** p).
We have corrected this.
(c) Figure 2D: The scale bar should be labeled as 10 μm.
We have added the label.
(d) Figure S4B: The image quality could be improved for better clarity.
We have replaced the image.
(e) Figure S8: The figure legend formatting needs attention, and the scale bar is missing in Figure S8C.
We have added panel labels and the scale bar.
Reviewer #3 (Recommendations for the authors):
(1) A comparison of the results generated in this paper to the Cengen data (or other previously published data) would greatly strengthen the paper. Figure S7 seems to be a compilation of several different data sets, but this is very unclear if so, and there is no indication of which neurons are from which data, and whether there is any conflicting evidence (or what cutoffs were used to determine co-expression from Cengen). If there are indeed conflicting results, the ramifications should be discussed. Finally, given the caveat introduced in the discussion regarding the I2 neuron not expressing GABA synthesis or reuptake machinery, a more thorough analysis of which neurons identified here do or don't express other relevant genes may be warranted.
In the revised version, we have added Tables 3 and 4 to explicitly compare our findings with CeNGEN and prior studies. Table 3 lists neurons consistently reported across independent datasets to have co-transmission potential, while Table 4 highlights neurons that have been suggested, but not consistently supported, across studies. We now also provide explicit references for each neuron in these tables and have clarified data sources and annotations in the legend to Figure S7 (now Figure S9). These additions are intended to make points of agreement and discrepancy across datasets transparent and to better contextualize our findings within existing resources.
(2) The intersectional strategy used to identify co-expression of different transporters has some caveats that should be discussed. Specifically, removing the entire open reading frame of the eat-4 gene (as opposed to employing a T2A strategy) could potentially also remove some negative regulatory elements (for example, located within introns), leading to the inappropriate expression of the fluorescent reporter. This should at least be mentioned as a potential caveat.
We have added this caveat into the discussion section (lines 511-513).
(3) The colocalization experiments performed in Figure 7 seem to rely on the use of a transgenic allele (syb7882) that was not previously validated for functionality. This is only a problem because: a) another allele with a constitutive mRuby in the same position (ot907) did not seem to be fully functional in the thrashing assays (Figure S4F), and thus it is at least conceivable that the differences in localization are due to the non-functional transporters being relegated to compartments destined for degradation. Validating this strain (after panneuronal Flippase expression) in the thrashing assay would dispel this concern.
We have performed thrashing assays with allele syb7882 (UNC-17::mRuby3 GLP-on) (new Figure S6), in which we find that labeling UNC-17 with C. elegans-optimized mRuby3 (driven by pan-cellular Flippase) results in animals whose thrashing behavior is indistinguishable from that of wild-type animals. This result is consistent with the idea that the distinct subsynaptic localizations observed between VMAT/CAT-1 and VAChT/UNC-17 in ADF neurons arise from endogenous cellular subsynaptic organization programs.
We additionally note that allele ot907 labels UNC-17 with mKate2, not mRuby3, and that this allele is different from wild type animals in a thrashing assay (Figure S5F). The syb7882 allele that we generated labels UNC-17 with mRuby3 and is not different from wild type in a thrashing assay. We are unsure as to these distinct phenotypes between ot907 and syb7882, but note that in addition to the use of different fluorescent proteins, each allele also employs distinct linker sequences between UNC-17 and the fluorescent protein (new Figure S6). We now explain this difference in the figure legend of Figure S5 (lines 1184-1189).
Minor comments:
(1) Is there a difference between the strains imaged in Figures 3D and S3D? If so, this is not clear. If not, why are they shown twice, and why do they look so different from each other?
We have replaced panel S3D with an endogenous RAB-3::mScarlet marker in RIB neurons to show that the localization of this synaptic vesicle marker parallels the punctated pattern of UNC-47::gfp11x3 reconstituted specifically in RIB neurons. See new panel S4D and line 244.
But to explain, GFP1-10 is expressed with an extrachromosomal array, which drives variable expression of the array and can explain the difference.
(2) Strains are alternatively denoted by their effect in the main figures, and by their allele names in the supplementary figures. This can be confusing when trying to compare data between the two figures (e.g., Figures 4C and S4F). Perhaps adding the allele names as parentheticals in the main figure might help.
We have modified the paper to include the name of the alleles used in the panels of the main figures. Additionally, we now mention the specific alleles used for the functional assays in the figure legends.
(3) To better understand the ramifications and efficiency of the cat-1 FLP-mediated removal (Figure 5E), it would be interesting to compare it directly to the ADF-specific removal of tph-1 referenced in the text.
We agree that a direct comparison between the FLP-mediated removal of cat-1 and ADFspecific removal of tph-1 would be informative for assessing the efficiency and functional consequences of these manipulations. These experiments represent an interesting direction for future work, and we plan to pursue such comparisons in subsequent studies.
(4) ADF seems to express very low levels of cho-1 (reuptake transporter), based on the images in Figure S8. Does it express higher levels of cha-1 (synthesis)?
We have not directly compared the relative expression levels of cho-1 and cha-1 in ADF neurons in this study. Such quantitative comparisons of synthesis and reuptake machinery represent an interesting direction for future work but fall beyond the scope of the present manuscript.
eLife Assessment
In this important study, the authors used a zebrafish model and scRNAseq analysis to show that a subset of keratinocytes within melanoma microenvironment highly up-regulate Twist and undergo Epithelial-Mesenchymal Transition (EMT). Surprisingly, when overexpressing Twist in keratinocytes, the resulting alteration in keratinocytes is inhibitory for melanoma invasion in both zebrafish and human cell culture models. The results are supported by convincing experimental data that provide new insights into the interactions between melanoma cells and their environment.
Reviewer #1 (Public review):
Summary:
Ma et al. show that melanoma cells induce an EMT-like state in nearby keratinocytes and that when this state is induced experimentally by Twist-overexpression the resulting alteration in keratinocytes is inhibitory for melanoma invasion. These conclusions are based on experiments in vivo with zebrafish and, in vitro, with human cells. The work is carefully done and provides new insights into the interactions between melanoma cells and their environment.
Strengths:
Use of both zebrafish and human cells adds confidence that findings are relevant to human melanomas while also further demonstrating utility of the zebrafish system for discovering important new features of melanoma biology that could ultimately have clinical impacts. The work also combines a nice suite of approaches including different models for induced melanomagenesis in zebrafish, single cell RNA-sequencing, and more. Some of the final observations are intriguing as well, especially the possibility of EMT induced melanocyte-keratinocyte interactions via Jam3 expression; it will be interesting to see if these is indeed a mechanism for restraining melanoma invasion. The paper is clearly written and the inferences appropriate for the results obtained. Overall the work makes a solid contribution to our understanding of important, but too often neglected, roles of the tumor microenvironment in promoting or inhibiting tumor progression and outcome.
Weaknesses:
No critical weaknesses noted.
Comments on revisions:
The authors have adequately addressed my comments and concerns.
Reviewer #2 (Public review):
Summary:
Manuscript by Ma et. al. utilizes a zebrafish melanoma model, single-cell RNA sequencing (scRNA-seq), a mammalian in vitro co-culture system, and quantitative PCR (Q-PCR) gene expression analysis to investigate the role keratinocytes might play within the melanoma microenvironment. Convincing evidence is presented from scRNA-seq analysis showing that a small cluster of melanoma-associated keratinocytes upregulate the master EMT regulator, transcription factor, Twist1a. To investigate how Twist-expressing keratinocytes might influence melanoma development, the authors use an in vivo zebrafish model to induce melanoma initiation while overexpressing Twist in keratinocytes through somatic transgene expression. This approach reveals that Twist overexpression in keratinocytes suppresses invasive melanoma growth. Using a complementary in vitro human cell line co-culture model, the authors demonstrate reduced migration of melanoma cells into the keratinocyte monolayer when keratinocytes overexpress Twist. Further scRNA-seq analysis of zebrafish melanoma tissues reveal that, in the presence of Twist-expressing keratinocytes, subpopulations of melanoma cells show altered gene expression, with one unique melanoma cell cluster appearing more terminally differentiated. The authors use computational methods to predict putative receptor-ligand pairs that might mediate the interaction between Twist-expressing keratinocytes and melanoma cells. Finally the authors established that similar keratinocyte phentypical changes also occurs in human melanoma tissues, setting a scene for future clinically relevant studies.
Strengths:
The scRNA-seq approach reveals a small proportion of keratinocytes undergoing EMT within melanoma tissue. The use of a zebrafish somatic transgenic model to study melanoma initiation and progression provides an opportunity to manipulate host cells within the melanoma microenvironment and evaluate their impact on tumour progression. Solid data demonstrate that Twist-expressing keratinocytes can constrain melanoma invasive development in vivo and reduce melanoma cell migration in vitro, establishing that Twist-overexpressing keratinocytes can suppress at least one aspect of tumour progression. Using GeoMX spatial transcriptomics platform to interrogate a series of early melanoma precursor lesions, enabled the authors to demonstrate similar EMT phenotype in keratinocytes also occurs in humans.
Weaknesses:
Due to limitations of the current model, no EMT marker gene expression was examined in melanoma tissue sections to determine the proportion and localization of Twist+ve keratinocytes within the melanoma microenvironment. However the authors compensated this through using spatial transcriptomics platform to interrogate a series of early melanoma precursor lesions in humans.
Due to technical limitations, it remain to be determined whether blocking EMT through down-regulation of Twist in keratinocytes may influence melanoma development.
Due to technical limitations, none of the gene expression changes detected through Q-PCR or scRNA-seq were examined using immunostaining or in situ hybridization, hence cellular resolution spatial information is lacking.
Overall, the data presented in this report draw attention to a less-studied host cell type within the tumour microenvironment, the keratinocytes, which, similar to well-studied immune cells and fibroblasts, could play important roles in either promoting or constraining melanoma development. Counterintuitively, the authors show that Twist-expressing EMT keratinocytes can constrain melanoma progression. While the detailed mechanisms remain to be uncovered, this is an exciting new line of research that warrant future studies.
Comments on revisions:
The authors have provided additional evidence to support their original conclusions, and the inclusion of spatial transcriptomic analysis using human samples strengthens the study. I did not identify any further issues that require attention.
Reviewer #3 (Public review):
Summary:
In this study the authors use the zebrafish model and in vitro co-cultures with human cell lines, to study how keratinocytes modulate the early stages of melanoma development/migration. The authors demonstrate that keratinocytes undergo an EMT-like transformation in the presence of melanoma cells which lead to a reduction in melanoma cell migration. This EMT transformation occurs via Twist; and resulted in an improvement in OS in zebrafish melanoma models. Authors suggest that the limitation of melanoma cell migration by Twist-overexpressing keratinocytes was through altered cell-cell interactions (Jam3b) that caused a physical blockage of melanoma cell migration.
Strengths:
Authors describe a new cross-talk between melanoma and its major initial microenvironment: the keratinocytes and how instructed by melanoma cells keratinocytes undergo an EMT transformation, which then controls melanoma migration.<br /> Overall, the paper is very well written, and the results are clearly organized and presented.
Weaknesses:
(1) To really show their last point it would be important to CRISPR KO Jam3b in melanoma with twist OE keratinocytes, in vivo or in vitro.
(2) Use of patient biopsies from early-stage melanomas vs healthy tissue to assess if there is a similar alteration of morphology of adjacent keratinocytes and increase in vimentin in human samples would strengthen the author's findings.
(3) Characterise better the cell-cell junctions and borders between cells (melanoma/ keratinocytes) with cellular and sub-cellular resolution. Since melanocytes can "touch" with their dendrites ~40 keratinocytes - can authors expand and explain better their model? Can this explain that in some images we cannot observe a direct interface between the cells?
Comments on revisions:
The authors answered most of the concerns raised.
Author response:
The following is the authors’ response to the original reviews.
Public Reviews:
Reviewer #1 (Public review):
Summary:
Ma et al. show that melanoma cells induce an EMT-like state in nearby keratinocytes and that when this state is induced experimentally by Twist-overexpression the resulting alteration in keratinocytes is inhibitory for melanoma invasion. These conclusions are based on experiments in vivo with zebrafish and, in vitro, with human cells. The work is carefully done and provides new insights into the interactions between melanoma cells and their environment.
We appreciate your support for our overall conclusions.
Strengths:
The use of both zebrafish and human cells adds confidence that findings are relevant to human melanomas while also further demonstrating the utility of the zebrafish system for discovering important new features of melanoma biology that could ultimately have clinical impacts. The work also combines a nice suite of approaches including different models for induced melanomagenesis in zebrafish, single-cell RNA-sequencing, and more. Some of the final observations are intriguing as well, especially the possibility of EMT-induced melanocyte-keratinocyte interactions via Jam3 expression; it will be interesting to see if this is indeed a mechanism for restraining melanoma invasion. The paper is clearly written and the inferences are appropriate for the results obtained. Overall the work makes a solid contribution to our understanding of important, but too often neglected, roles of the tumor microenvironment in promoting or inhibiting tumor progression and outcome.
Weaknesses:
No critical weaknesses were noted.
Reviewer #2 (Public review):
Summary:
The manuscript by Ma et. al. utilizes a zebrafish melanoma model, single-cell RNA sequencing (scRNA-seq), a mammalian in vitro co-culture system, and quantitative PCR (Q-PCR) gene expression analysis to investigate the role keratinocytes might play within the melanoma microenvironment. Convincing evidence is presented from scRNA-seq analysis showing that a small cluster of melanoma-associated keratinocytes upregulates the master EMT regulator, transcription factor, Twist1a. To investigate how Twist-expressing keratinocytes might influence melanoma development, the authors use an in vivo zebrafish model to induce melanoma initiation while overexpressing Twist in keratinocytes through somatic transgene expression. This approach reveals that Twist overexpression in keratinocytes suppresses invasive melanoma growth. Using a complementary in vitro human cell line co-culture model, the authors demonstrate reduced migration of melanoma cells into the keratinocyte monolayer when keratinocytes overexpress Twist. Further scRNA-seq analysis of zebrafish melanoma tissues reveals that in the presence of Twist-expressing keratinocytes, subpopulations of melanoma cells show altered gene expression, with one unique melanoma cell cluster appearing more terminally differentiated. Finally, the authors use computational methods to predict putative receptor-ligand pairs that might mediate the interaction between Twist-expressing keratinocytes and melanoma cells.
Strengths:
The scRNA-seq approach reveals a small proportion of keratinocytes undergoing EMT within melanoma tissue. The use of a zebrafish somatic transgenic model to study melanoma initiation and progression provides an opportunity to manipulate host cells within the melanoma microenvironment and evaluate their impact on tumour progression. Solid data demonstrate that Twist-expressing keratinocytes can constrain melanoma invasive development in vivo and reduce melanoma cell migration in vitro, establishing that Twist-overexpressing keratinocytes can suppress at least one aspect of tumour progression.
Weaknesses:
While the scRNA-seq analysis of melanoma tissue and RT-PCR analysis of EMT gene expression in isolated keratinocytes provide evidence that a subpopulation of host keratinocytes upregulates Twist and other EMT marker genes and potentially undergoes EMT, the in vivo evidence for keratinocyte EMT within the melanoma microenvironment is based on cell morphology in a single image without detailed characterization and quantification. No EMT marker gene expression was examined in melanoma tissue sections to determine the proportion and localization of Twist+ve keratinocytes within the melanoma microenvironment.
We agree this needed better support. To address this, we have collaborated with the Sorger lab who has performed Spatial Transcriptomics on early human melanoma samples (n=8 samples). The advantage of this method is that they can dissect microregions of interest (MRs) RNA-seq to discern keratinocytes vs. melanocytes. We queried regions that had higher or lower numbers of atypical melanocytes in these biopsies with our TAK or TWIST signature. While the normal sample had no enrichment, we found that a subset of the human samples had evidence of these signatures in the keratinocytes, particularly the ones which had a higher proportion of atypical melanocytes. These data support our model that early melanomas enact an EMT like program in a subset of nearby keratinocytes.
The scRNA-seq UMAP suggests the proportion of EMT keratinocytes within the melanoma microenvironment is very small, raising questions about their precise location and significance within the tumour microenvironment. Although both in vivo and in vitro evidence demonstrates that Twist-expressing keratinocytes can suppress melanoma progression, the conditions modelled by the authors involve over-expression of Twist in all keratinocytes, which do not naturally occur within the melanoma microenvironment and, therefore, might not be relevant to naturally occurring melanoma progression. The author did not test whether blocking EMT through down-regulation of Twist in keratinocytes may influence melanoma development, which would establish the role of Twist expression keratinocytes in the melanoma microenvironment.
We entirely agree, and ideally would do the exact experiment you suggested, which is to knockout TWIST in the keratinocytes using CRISPR and see how this affects the tumor phenotype. However, despite our best efforts, we do not yet have an efficient method for performing knockouts in the tumor microenvironment. If we used standard 1-cell embryo transgenic approaches with a krt4-Cas9, this would severely disrupt skin development in the whole animal, and would be viable. Theoretically, we could do this with TEAZ, but we have found that the expression of Cas9 in the microenvironment (i.e. under a krt4 promoter) is relatively inefficient. For example, we tried a krt4-Cas9 coupled with an sgRNA against GFP (as a test of the system) and this did not work well. Thus, a major goal for future studies is to develop a technology that would allow us to do this exact experiment. Finally, we do not have enough cells present in the sections to answer the question of whether the EMT keratinocytes are associated with certain melanoma cell states (i.e. proliferative, invasive), although we agree this would be an important question for future studies.
To address the potential mechanism by which Twist-expressing keratinocytes suppress melanoma progression, a second scRNA-seq analysis was conducted. However, this analysis is not adequately presented to provide strong evidence for proposed mechanisms for how Twist-expressing keratinocytes suppress melanoma cell invasion. CellChat analysis was used to attempt to identify receptor-ligand pairs that might mediate keratinocyte-melanoma cell interaction, but the interactions between tumour-associated keratinocytes (TAK) and melanoma cells were not included in the analysis. Furthermore, although genetic reporters were used to label both keratinocytes and melanoma cells, no images showing the detailed distribution and positional information of these cells within melanoma tissue are presented in the report. None of the gene expression changes detected through Q-PCR or scRNA-seq were validated using immunostaining or in situ hybridization.
As noted above, we have now added human biopsy samples from the Sorger lab to our analysis, showing that the TAK/TWIST keratinocytes occur directly adjacent to the atypical melanocytes in these samples. While these early melanomas are quite difficult to obtain (most samples are used for diagnostic purposes), this provides further support to our zebrafish models.
Overall, the data presented in this report draw attention to a less-studied host cell type within the tumour microenvironment, the keratinocytes, which, similar to well-studied immune cells and fibroblasts, could play important roles in either promoting or constraining melanoma development.
Counterintuitively, the authors show that Twist-expressing EMT keratinocytes can constrain melanoma progression. While the detailed mechanisms remain to be uncovered, this is an interesting observation.
Reviewer #3 (Public review):
Summary:
In this study the authors use the zebrafish model and in vitro co-cultures with human cell lines, to study how keratinocytes modulate the early stages of melanoma development/migration. The authors demonstrate that keratinocytes undergo an EMT-like transformation in the presence of melanoma cells which leads to a reduction in melanoma cell migration. This EMT transformation occurs via Twist; and resulted in an improvement in OS in zebrafish melanoma models. Authors suggest that the limitation of melanoma cell migration by Twist-overexpressing keratinocytes was through altered cell-cell interactions (Jam3b) that caused a physical blockage of melanoma cell migration.
Strengths:
The authors describe a new cross-talk between melanoma and its major initial microenvironment: the keratinocytes and how instructed by melanoma cells keratinocytes undergo an EMT transformation, which then controls melanoma migration. Overall, the paper is very well written, and the results are clearly organized and presented.
Weaknesses:
(1) To really show their last point it would be important to CRISPR KO Jam3b in melanoma with twist OE keratinocytes, in vivo or in vitro.
The CellChat data suggest that Jam3b is likely important in melanoma development, as it has been shown to be important in melanocyte development (Eom, Dev Biol 2021). Studying this specifically in melanoma progression is an area of ongoing study in our lab, and we have begun to generate the Jam3b knockouts as you suggested. Since this set of experiments is quite extensive, we feel this set of data deserves a separate manuscript, which we hope to complete in the near future.
(2) The use of patient biopsies from early-stage melanomas vs healthy tissue to assess if there is a similar alteration of morphology of adjacent keratinocytes and an increase in vimentin in human samples would strengthen the author's findings.
As noted above, we have now added human biopsy samples from the Sorger lab to our analysis, showing that the TAK/TWIST keratinocytes occur directly adjacent to the atypical melanocytes in these samples. While these early melanomas are quite difficult to obtain (most samples are used for diagnostic purposes), this provides further support to our zebrafish models.
(3) The cell-cell junctions and borders between cells (melanoma/ keratinocytes) should be characterized better, with cellular and sub-cellular resolution. Since melanocytes can "touch" with their dendrites ~40 keratinocytes - can authors expand and explain better their model? Can this explain that in some images we cannot observe a direct interface between the cells?
We have now added higher resolution images of these junctions. Our overall hypothesis, related to point (2) above, is that Jam3b mediates these junctions between melanoma cells and keratinocytes, which is why we are now pursuing this in a followup study.
Recommendations for the authors:
Reviewer #1 (Recommendations for the authors):
(1) Please say a little more about any phenotypes that might have been evident inTwist-overexpression fish in the absence of melanomas, and clarify in the text that these were mosaic animals, as a first (incorrect) reading left the impression that stablelines had been made.
In these experiments, we co-injected the melanoma plasmids along with the krt4-TWIST plasmids, creating mosaic animals. Because of this, we did not have a way of specifically looking at the effect of TWIST in the absence of melanoma. We agree this needs better clarification and have added this to the Results.
(2) Violin plot colors in main and Supplementary Figures tend to obscure data points. Colors for keratinocyte clusters are not discernible in Figure 4C.
We have remade the plots in a different color scheme to try and make these stand out more easily.
(3) Clarify that N-cadherin = cdh2 in Figure 1
We have fixed this in the legend for Figure 1.
(4) Clarify the relationship between keratinocytes highlighted in Figure 2B and used for Hallmark expression in Figure 2B, and those analyzed for expression of candidate genes in Figure 2E. The last shows many NKC whereas whereas even the larger group circled in Figure 2B as keratinocytes seems to have far fewer cells, unless massively overplotted. Is the rest of that cluster in Fig. 2B keratinocytes as well?
In the analysis in Figure 2E, we first calculated genes differentially expressed in the TAK vs. NKCs (found in Figure 2B). We used those genes as input into GSEA analysis, which showed enrichment for EMT programs specifically in the TAKs. We recognize that the number of TAKs is relatively small (compared to all of the other cells in the single-cell UMAP) but that is the most we were able to get from this particular scRNA run, because the melanoma cells naturally make up the vast majority of the cells in the 10X run. This is why we performed downstream mechanistic analysis (in the rest of the paper) to ensure this result was not an artifact of a small number of TAKs.
(5) Define "NES" in the Figure 2 legend.
NES indicates “Normalized Enrichment Score”, a standard output of GSEA. This has been added to the legend.
(6) Indicate how many control vs. Twist+ fish were found to have invasive vs non-invasive tumors upon histological examination. Were tumors in the latter fish always contained within the epidermis proper, or did some extend deeper if given enough time?
In the histology analysis, we used n=3 control fish and n=3 TWIST overexpressing fish. Main Figure 3 shows n=1 of these fish from each group, and the other n=2 from each is shown in Supplemental Figure 1. In this cohort (taken at 26 weeks), all of the TWIST tumors were contained within the epidermis, but we did not let them grow longer to see if (given enough time) they could have invaded below this. Around 26 weeks, the survival decreased so made this an unfeasible experiment at later time points. We have added a statement about this to the Results section.
Reviewer #2 (Recommendations for the authors):
Going through the data presented in the figures, here are my comments:
(1) Figure 1: To strengthen the evidence that keratinocytes in the melanoma microenvironment undergo EMT, it would be beneficial to provide immunostaining or in situ data for EMT marker genes within melanoma tissue sections co-stained with a keratinocyte marker (such as an anti-GFP antibody).
We agree this type of analysis is an important validation of our findings. Doing this in zebrafish tumors is difficult, as human/mouse antibodies for EMT marker genes typically do not work in fish. In addition, we felt that validating our results in human melanomas would make our findings more generalizable. Therefore, we established a collaboration with Peter Sorger’s lab, who have been performing high-resolution spatial transcriptomics on early melanoma samples from humans. While these are difficult to attain (since most early lesions are processed for clinical diagnosis) they have a collection of n=8 samples that they subjected to GeoMX spatial analysis. In this method, the samples are first stained with antibodies to definitively mark keratinocytes (PANCK) vs. melanoma cells (SOX10) and all samples are reviewed by expert pathologists. From this, microregions (MRs) of interest are selected to then undergo RNA-seq. After control analysis to ensure both keratinocytes and melanocytes were present in the samples, they then used our TAK or TWIST signatures as a query. Both signatures were enriched in the keratinocytes adjacent to early melanomas, but not in normal skin samples or in samples with few atypical melanocytes. This provides further evidence that the altered keratinocytes we see in our fish are present and enriched in human biopsy specimens.
(2) Figure 2: In panel B, the UMAP shows the separation of single cells, and keratinocytes are circled. However, there are two clusters of keratinocytes, and the graph does not indicate which cluster represents tumour-associated keratinocytes (TAKs) versus normal keratinocytes (NKCs). The two clusters also appear to differ in abundance, so it would be helpful to report the proportion of keratinocytes that are TAKs undergoing EMT, according to the individual dots in Figure 2E. In Figure 2E,TAKs seem to have very few cells compared to the other clusters. Given the relatively small number of EMT-TAKs detected in the single-cell RNA-seq data, I wonder how much direct influence these cells could exert on the bulk of melanoma cells in vivo.The evidence would be strengthened if an IHC analysis could show the location of Twist-expressing keratinocytes within the melanoma microenvironment and whether they are associated with certain melanoma cell markers but not others (i.e., markers indicating different differentiation states of melanoma cells). To further support the role of Twist-expressing keratinocytes in the melanoma microenvironment, it would be beneficial to perform a knockout (KO) of Twist in keratinocytes within the melanoma microenvironment.
In Figure 2B, we agree that the color scheme made it difficult to discern TAKs vs. NKCs.
We have changed the color scheme to make this more clear.
The number of TAKs undergoing EMT is relatively small, and this is why we performed the overexpression studies of TWIST in order to expand the field of keratinocytes undergoing EMT. To get at the question of whether these are really important in tumor initiation and progression, we ideally would do the exact experiment you suggested, which is to knockout TWIST in the keratinocytes using CRISPR and see how this affects the tumor phenotype. However, despite our best efforts, we do not yet have an efficient method for performing knockouts in the tumor microenvironment. If we used standard 1-cell embryo transgenic approaches with a krt4-Cas9, this would severely disrupt skin development in the whole animal, and would not be expected to be viable. Theoretically, we could do this with TEAZ, but we have found that the expression of Cas9 in the microenvironment (i.e. under a krt4 promoter) is relatively inefficient. For example, we tried a krt4-Cas9 coupled with an sgRNA against GFP (as a test of the system) and this did not work well. Thus, a major goal for future studies is to develop a technology that would allow us to do this exact experiment. Finally, we do not have enough cells present in the sections to answer the question of whether the EMT keratinocytes are associated with certain melanoma cell states (i.e. proliferative, invasive), although we agree this would be an important question for future studies.
(3) Figure 4: Co-culture results show that melanoma cells migrate further on a control HaCaT cell monolayer compared to a TWIST-overexpressing HaCaT cell monolayer. While this phenotype might support the conclusion that TWIST-expressing keratinocytes reduce melanoma cell invasion, it should be interpreted with caution. The data can be interpreted as TWIST-HaCaT cells inhibiting melanoma cell migration; however, an alternative explanation cannot be ruled out. For example, wild-type HaCaT cells might provide a suitable substrate for melanoma cells to migrate, whereas TWIST-HaCaT cells lack this property. To address this, the baseline melanoma cell migration should be established in this assay by coating the plate with cells from the same melanoma cell line and allowing melanoma cells from the flipped cover slip to migrate out.
We have performed the experiment you suggested using Hs.294T and SKMEL2 cells and provided this as a new Supplemental Figure 2. This demonstrated that the melanoma cells in this context could indeed migrate out of the coverslip at baseline. Thus, it is possible, as you indicated, that the phenotype we have observed might be due to something lacking in the TWIST keratinocytes that promotes migration. Since we cannot differentiate between these two possibilities (i.e. that TWIST KCs actively inhibit migration vs. lacking something that promotes migration), we have modified the text to indicate both of these possible mechanisms could be at play.
(4) In the representative images shown in the figure, it appears that both HaCaT cells and melanoma cells in the upper and lower panels are at very different densities."Contact inhibition" and "cell sorting" are well-known phenomena in tissue-cultured cells, so when cells are seeded at different densities, their ability to move away from the initial location could vary. From the Materials and Methods section, it is unclear why cell densities are drastically different in the images presented. Images in the upper panel show both melanoma cells and keratinocytes at lower densities, and in the TWIST group, melanoma cells under the cover slip appear to aggregate into clusters with TWIST-expressing keratinocytes surrounding each aggregated cluster. This suggests that cell sorting might be occurring, potentially mediated by cadherins or Eph-ephrins.
We recognized this discrepancy as well. In the setup of the experiment, we seeded the exact same number of cells for both the Hs.294T (Figure 4E) and SKMEL2 (Figure 4G) experiment. But when we took the images after 20 hours of co-culture, it was clear that the HaCat densities were different, as seen in the figures. We suspect this might be because these two melanoma cells may secrete different factors (i.e. growth factors) that impact upon HaCat proliferation, adhesion or cell sorting. Despite this, in terms of the ability of the melanoma cells to migrate into the HaCATs, we saw similar results across both experiments, suggesting that it is not HaCAT density alone that explains the results. But we agree we need to clarify this point about cell density more clearly in the manuscript, and we have amended the Discussion to indicate the above points.
(5) Figure 5: Single-cell RNA-seq analysis comparing cells from control melanomas with cells from melanomas developed in a Twist-expressing keratinocyte background could provide valuable information on how melanoma cells alter their phenotype and how Twist-expressing keratinocytes respond to melanoma development. However, the information presented in the manuscript is not persuasive in this regard (appears to be minimal).
(a) In Figure 5C, the differences between melanoma cells in a control background versus those in a Twist-expressing keratinocyte background include cells from more than one unique cluster, but most of the different clusters are not discussed, except for one prominent cluster indicated by an arrow.
The reason we pointed out that one cluster is that it was the major thing that was different in the control melanomas vs. the TWIST melanomas. To better clarify this point, we have made a new Supplemental Figure 3 comparing the clusters in each situation: 7 in the control melanomas vs. 8 in the TWIST melanomas (Supp. Figure 3d). To then better understand the nature of the TWIST melanomas, we performed Gene Set Enrichment Analysis (GSEA) compared to the control melanomas. Interestingly, this revealed a striking enrichment for pathways related to oxidative phosphorylation using both GO and Hallmark terms. Because we had previously shown that melanoma cells with high ox-phos are typically in the more melanocytic and less invasive state (Lumaquin-Yin, Nature Communications 2023), we therefore analyzed our TWIST melanomas by comparing this unique cluster to the well-annotated melanoma cell state signatures from Tsoi et al (Cancer Cell, 2018). This showed that most of the TAKs and TWIST-KCs were in the melanocytic/transitory cluster, which are thought to be the least invasive of all the melanoma cell states. Thus, it seems likely that high levels of TWIST in the keratinocytes induces a low invasion state in the melanoma cells. We have added this data and interpretation to the Results and Discussion sections of the manuscript.
(b) In Figure 5D, it is unclear whether TAKs include both wild-type keratinocytes and Twist-expressing keratinocytes.
We oversimplified this plot for the sake of visualization, but realize that in doing so we obscured some important details. In the plot, we separate normal keratinocytes (NKCs) vs. tumor associated keratinocytes (TAKs). TAKs are, by definition, TWIST<sup>hi</sup>/EMT<sup>hi</sup> and represent upregulation of endogenous TWIST. In contrast, when we force overexpression of TWIST in the keratinocytes, then we see an entirely new cluster appear, as expected.
(c) In Figure 5F, TAKs are interacting with melanoma cells so it is unclear why the CellChat analysis did not include TAKs.
This was an oversight on our part, and the Figure has now been corrected to include this. TAKs in both the control and TWIST melanomas have numerous interaction partners, whereas the TWIST-KCs have relatively fewer and more specific interactions.
(d) Finally, Figure 5G needs clearer labelling,currently unclear which gene is expressed by the sender and which is by the receiver.
This has been clarified in Figure 5F with specific indicators of “sender” vs. “receiver”.
Reviewer #3 (Recommendations for the authors):
(1) Figure 1E - in this figure, it is possible to observe the altered morphology of keratinocytes but these cells are not in the vicinity of the melanoma cells - can authors please make a zoom-in in the region of the interface? And quantify the distance between cells - at least the image they show looks like the cells that are mostly de-formed are far away from the melanoma but perhaps was just this example....please clarify. Or there are patches of keratinocytes that go through EMT and others that maintain their epithelial structure?
We have now added zoom-in images of the interface (Figure 1E). In nearly all sections examined, some keratinocytes maintain their hexagonal normal epithelial structure, but the majority of the cells appear altered. We have attempted to quantify this effect, along with the distance between cells with this EMT-like morphology, but have not found a reliable method given the heterogeneity across samples. That is why we instead chose to quantify the EMT-like keratinocytes (what we refer to as TAKs) using single-cell RNA seq, which showed that 32% of the population had the TAK signature, whereas 68% resembled normal keratinocytes. We feel this is more quantitative than imaging alone.
This data has been added to the Results section.
(2) Figure 3B - could not find the number of fish analyzed.
This was an oversight on our part. We studied n=135 control melanomas vs. n=118
TWIST melanomas. This data has now been added to Figure 3B.
(3) Figure 3D - missing a graph with quantification and zoom images in the tail keratinocytes/ melanoma interface.
In this particular cohort of animals, we unfortunately did not specifically track body vs. fin melanomas, so we are not able to quantify this.
(4) Figure 4 - it would be nice again to have a zoom-in to observe the interface of cells- maybe use a phalloidin staining to visualize better how cells are touching each other.
We have added a zoom in image of the interface to the image (Figure 4E). We have very much wanted to do immunohistochemistry (not just for phalloidin, but for other markers as well) on these coverslip co-cultures and have tried, but we have not been successful. This is likely because the assay requires plastic plates, which are incompatible with doing this, but agree that getting this to work would be an important area for future development.
(5) I believe the paper deserves a last figure - with the model.
We agree and this has now been added as Figure 7.
a
a1
anchor
anchor2
anchor
anchor1
eLife Assessment
This important work advances our understanding of the single neuron coding types in the mouse gustatory cortex and the functional roles of these neurons for perceptual decision-making. The conclusions are based on compelling evidence from rigorous behavioral experiments, high-density electrophysiology, sophisticated data analysis, and neural network modeling with in silico perturbations of functionally-identified units. This work will be of broad interest to systems neuroscientists.
Reviewer #1 (Public review):
The manuscript provides several important findings that advance our current knowledge about the function of the gustatory cortex (GC). The authors used high density electrophysiology to record neural activity during a sucrose/NaCl mixture discrimination task. They observed population-based activity capable of representing different mixtures in a linear fashion during the initial stimulus sampling period as well as representing the behavioral decision (i.e., lick left or right) at a later time point. Analyzing this data at the single neuron level, they observed functional subpopulations capable of encoding the specific mixture (e.g., 45/55), tastant (e.g., sucrose), and behavioral choice (e.g., lick left). To test the functional consequences of these subpopulations, they built a recurrent neural network model in order to "silence" specific functional subpopulations of GC neurons. The virtual ablation of these functional subpopulations altered virtual behavioral performance in a manner predicted by the subpopulation's presumed contribution.
Strengths:
Building a recurrent neural network model of the gustatory cortex allows the impact of the temporal sequence of functionally identifiable populations of neurons to be tested in a manner not otherwise possible. Specifically, the author's model links neural activity at the single neuron and population level with perceptual ability. The electrophysiology methods and analyses used to shape the network model are appropriate. Overall, the conclusions of the manuscript are well supported.
Weaknesses:
One minor weakness is the mismatch between the neural analyses and behavioral data. Neural analyses (i.e. population activity trajectories) indicate a separation of the neural activity associated with each mixture. Given this analysis, one might expect the psychometric curve to have a significantly steeper slope. One potential explanation is the concentration of the stimuli utilized in the mixture discrimination task. The authors utilize equivalent concentrations, rather than intensity matched concentrations. In this case, a single stimulus can (theoretically) dominant the perception of a mixture resulting in a biased behavioral response despite accurate concentration coding. Given the difficulty of iso-intensity matching concentrations, this concern is not paramount.
Reviewer #2 (Public review):
Lang et al. investigate the contribution of individual neuronal encoding of specific task features to population dynamics and behavior. Using a taste based decision-making behavioral task with electrophysiology from the mouse gustatory cortex and computational modeling, the authors reveal that neurons encoding sensory, perceptual, and decision-related information with linear and categorical patterns are essential for driving neural population dynamics and behavioral performance. Their findings suggest that individual linear and categorical coding units have a significant role in cortical dynamics and perceptual decision-making behavior.
Overall, the experimental and analytical work is of very high quality, and the findings are of great interest to the taste coding field, as well as to the broader systems neuroscience field.
I initially had some suggestions for further analyses to clarify the contribution of constrained and unconstrained units. In the revised version, the authors have performed all the suggested analyses, further strengthening their conclusions.
Reviewer #3 (Public review):
Primary taste cortex neurons show a variety of dynamic response profiles during taste decision making tasks, reflecting both sensory and decision variables. In the present study, Lang et al., set out to determine how neurons with distinct response profiles contribute to perceptual decisions about taste stimuli.
The methods with regard to the behavioral task and electrophysiological recordings/data analysis are straightforward, solid and appropriate. The computational model is presented in a clear and conceptually intuitive manner, although the details are outside of my area of expertise.
The experimental design features a simple 2-alternative forced choice task that yielded clear psychometric curves across a range of stimuli. In vivo recordings were performed using neuropixels and yielded an appropriate sample of single neuron responses. The strength of the model lies in the fact that it consists of single neurons whose response profiles mimic those recorded in vivo, and allows neuron-selective manipulation.
By virtually lesioning specific subsets of neurons in the network, the authors demonstrate that a relatively small populations of neurons with specific tuning profiles were sufficient to produce the observed neural dynamics and behavioral responses. This effect was selective as lesioning other responsive neurons did not affect overall response dynamics or performance.
These findings provide new insight into the relation between the response profiles of single neurons in sensory cortex, their population-level activity dynamics, and the perceptual decisions they inform.
The approach is particularly innovative as it uses computational modeling to target functionally-defined "cell types", which cannot necessarily be targeted by more conventional genetic approaches.
Author response:
The following is the authors’ response to the original reviews.
Reviewer #1 (Public review):
This manuscript provides several important findings that advance our current knowledge about the function of the gustatory cortex (GC). The authors used high-density electrophysiology to record neural activity during a sucrose/NaCl mixture discrimination task. They observed population-based activity capable of representing different mixtures in a linear fashion during the initial stimulus sampling period, as well as representing the behavioral decision (i.e., lick left or right) at a later time point. Analyzing this data at the single neuron level, they observed functional subpopulations capable of encoding the specific mixture (e.g., 45/55), tastant (e.g., sucrose), and behavioral choice (e.g., lick left). To test the functional consequences of these subpopulations, they built a recurrent neural network model in order to "silence" specific functional subpopulations of GC neurons. The virtual ablation of these functional subpopulations altered virtual behavioral performance in a manner predicted by the subpopulation's presumed contribution.
Strengths:
Building a recurrent neural network model of the gustatory cortex allows the impact of the temporal sequence of functionally identifiable populations of neurons to be tested in a manner not otherwise possible. Specifically, the author's model links neural activity at the single neuron and population level with perceptual ability. The electrophysiology methods and analyses used to shape the network model are appropriate. Overall, the conclusions of the manuscript are well supported.
Weaknesses:
One potential concern is the apparent mismatch between the neural and behavioral data. Neural analyses indicate a clear separation of the activity associated with each mixture that is independent of the animal's ultimate choice. This would seemingly indicate that the animals are making errors despite correctly encoding the stimulus. Based solely on the neural data, one would expect the psychometric curve to be more "step-like" with a significantly steeper slope. One potential explanation for this observation is the concentration of the stimuli utilized in the mixture discrimination task. The authors utilize equivalent concentrations, rather than intensity-matched concentrations. In this case, a single stimulus can (theoretically) dominate the perception of a mixture, resulting in a biased behavioral response despite accurate concentration coding at the single neuron level. Given the difficulty of isointensity matching concentrations, this concern is not paramount. However, the apparent mismatch between the neural and behavioral data should be acknowledged/addressed in the text.
We thank the Reviewer for the insightful comments and thoughtful suggestions. Our electrophysiological recordings show that GC dynamically encodes stimulus concentration of mixture elements, dominant perceptual quality, and decisions of directional lick. With regard to the encoding of mixtures, the clear separation of activity associated with each mixture (Figure 3) is present at a trial-averaged pseudo-population level, and average activities associated with more similar, intermediate mixtures are closer to each other in this space. At a single trial level activities evoked by similar, intermediate mixtures are much harder to separate. This increased similarity can lead to behavioral errors resulting from either incorrect encoding of the stimulus or from the inability to interpret the stimulus to guide the correct decision. The psychometric function, which shows that more distinct stimuli (100/0 vs 0/100) lead to fewer mistakes than more ambiguous, intermediate mixtures (55/45 vs 55/45), is consistent with the increased ambiguity of responses to intermediate mixtures.
The Reviewer is correct that there could be a slight mismatch in the perceived intensity of the mixture components. This mismatch could be the reason for the slight asymmetry in our psychometric function (Figure 1B). However, it is not uncommon for mice in these 2AC tasks to also have a motor laterality bias in their responses that manifests itself for the more ambiguous stimuli. We chose not to model this bias given its subtlety and its unknown origin. Rather, we chose to model an ideal scenario in which stimuli have matched intensity and no motor bias exists. In the revised manuscript we discuss this issue.
Reviewer #1 (Recommendations for the authors):
(1) The apparent mismatch between neural and behavioral data. I am providing more details in this section to hopefully better illustrate my concern.
(a) Based on the author's psychometric curve, sucrose appears to be a more salient signal causing the behavior to be shifted (e.g., a 50/50 mixture results in a >60% predicted behavioral performance). If both sucrose and salt were intensity-matched, a 50/50 mixture should result in a behavioral performance near 50%. The increased salience of sucrose could cause the animals to have lower overall performance despite accurate neural encoding. Alternatively, certain animals could display a strong side bias, skewing the data slightly. These issues have seemingly been fixed in the model data, which displays a more balanced psychometric curve. Accordingly, the model data seemingly displays a larger shift in error trials as compared to correct trials (Figure 6A).
The reviewer is correct in observing that the average experimental psychometric curve in Figure 1B shows a slight shift in favor of the sucrose side with a 50/50 mixture. We fit psychometric curves to each session and the mean value of P(Sucrose choice | Stimulus = 50/50) across sessions was significantly different from 0.5 (one-sample t-test, p = 0.003), with 5 probabilities below 0.5 and 18 above it.
This slight bias could be attributed to a slight mismatch in the perceived intensity of the mixture components and/or lateral motor biases. In any case, it is subtle and its origins were not a focus of this study.
Models were not trained to match the animals’ psychometric curves, but rather to choose correctly in an ideal scenario where stimuli have matched intensities. This explains why the model simulations lack the bias observed in animal behavior data.
We do not believe that there is a mismatch between the experimental behavioral and neural data, as trial-averaged pseudo-population trajectories are farther in neural space for more discriminable stimuli and closer in neural space for more similar stimuli, consistent with behavioral performance that is high for more discriminable stimuli and low for more similar stimuli. Moreover, as the model also shows, a clear separation of trial-averaged trajectories still results in a sigmoidal performance function for trial-to-trial behavior.
Finally, subtle behavioral biases would not necessarily be expected to appear in our dPCA analyses since we used this technique to find a single axis that best separates all stimuli conditions regardless of choice when the pseudo-population data are projected upon it. Additional modes of activity that explain less overall variance might better reflect biases.
(b) Although I am not an expert at these analyses, I wonder whether the elevated bump (i.e., >0) in Figure 3C of the 55/45 mixture that occurs early in the stimulus presentation further supports the hypothesis mentioned above and could indicate an early signal of salience/increased intensity?
The reviewer is correct that the 55/45 trajectory features a brief positive wave right after stimulus delivery before going negative. While this may be related to stimuli not being explicitly balanced for intensity, it could also reflect a signal related to ambiguity or balanced mixtures. We are hesitant to interpret this positive deflection as conclusive evidence of a bias in neural activity, given its short duration and the natural variability of neural signals.
(2) The increase in step-perception neurons after the decision period is confusing (Figure 4C). The text states (line 246) "the analysis reveals a small and time-invariant proportion of step-perception neurons". However, the proportion doubles after the decision-making process, which is seemingly a significant change. Why does this occur? This observation is noticeably missing from the network data. Could it be attributed to a mislabeling of "step-choice" neurons, given the correlation between the left/right decision and sweet/salty? Either way, it is very noticeable and should be addressed.
We cannot be sure of the reason for the increase in step-perception neurons after decisions. One possibility is that they are acting as feedback for learning, encoding the percept to compare with choice and outcome to improve performance. The model, which presumably learns the task differently from the animals, does not seem to leverage this signal for its own learning. We have modified the text, now referring to a “small but consistently present proportion” of step-perception neurons, and included this proposed explanation in the Discussion.
(3) Optional: I think the authors are missing an opportunity to analyze the temporal aspect of this multiplex code using their network-based modeling approach. A significant proportion of neurons fall into different categories (i.e., step-perception/linear, etc.) at different time points. However, the virtual ablation experiments remove any neuron that falls into one of these categories at any time. By limiting the cell-specific virtual ablation to specific time windows, you could (I think) provide stronger evidence for the temporal sequence of the encoding of these perceptual aspects.
This was an excellent suggestion for an additional modeling experiment, so we performed it. A new supplemental figure (Figure S8) and additional text in the revised manuscript showcase the results. In summary:
In terms of behavioral results, ablating the linear coding units in the beginning (that is, silencing all units that are labeled linear in any bin within the first 1.2 s after stimulus onset for the entirety of the 1.2 s) significantly reduces performance, as does ablating the step-perception or step-choice coding units at the end (1.2 s prior to choice). The remaining combinations of coding type and timing of the ablation do not affect performance.
Regarding the dynamics of coding types (compare Figure 7A), stimulus coding activity was significantly blunted only by ablating the linear coding units in the beginning, whereas choice coding activity was diminished by ablating the choice coding units at the end or by ablating the linear coding units at either the beginning or the end.
Reviewer #2 (Public review):
Lang et al. investigate the contribution of individual neuronal encoding of specific task features to population dynamics and behavior. Using a taste-based decision-making behavioral task with electrophysiology from the mouse gustatory cortex and computational modeling, the authors reveal that neurons encoding sensory, perceptual, and decision-related information with linear and categorical patterns are essential for driving neural population dynamics and behavioral performance. Their findings suggest that individual linear and categorical coding units have a significant role in cortical dynamics and perceptual decision-making behavior.
Overall, the experimental and analytical work is of very high quality, and the findings are of great interest to the taste coding field, as well as to the broader systems neuroscience field.
I have a couple of suggestions to further enhance the authors' important conclusions:
My main comment is the distinction between constrained and unconstrained units. The authors train a small percentage of units to match the real neural data (constrained units), and then find some unconstrained units that are similar to the real neural data and some that are not. As far as I could tell, the relative fraction of constrained and unconstrained units in the trained RNN is not reported; I assume the constrained ones are a much smaller population, but this is unclear. The selection of different groups of neurons for the RNN ablation experiments appears to be based on their response profiles only. Therefore, if I understood correctly, both constrained and unconstrained units are ablated together for a given response category (e.g., linear or step-perception). It would be useful, therefore, to separately compare the effects of constrained vs. unconstrained RNN units.
We thank the Reviewer for the constructive feedback. The Reviewer is correct that ablations were carried out with respect to response categories only and included both constrained and unconstrained units.
The ratio of total units to constrained units was fixed at 5.88, thus constrained units were ~17% of the network and unconstrained units were ~83%. This value is specified in the Methods (RNN: Components and dynamics), but we have reported it in the Results of the revised manuscript for clarity.
We have also edited the Methods because they wrongly stated that the ratio of unconstrained (rather than total) units to constrained units was 5.88.
Specifically:
(1) For the analyses in the initial version of the manuscript, the authors should specify how many units in each ablation category are constrained and unconstrained.
In the revised manuscript, we have specified the fractions of constrained and unconstrained units within each response category. For convenience, they are reported here: linear = 194 constrained and 691 unconstrained units; step-perception = 147 constrained and 840 unconstrained units; step-choice = 129 constrained and 814 unconstrained units; “other” = 353 constrained and 1739 unconstrained units.
(2) The authors should repeat Figure 6, but only for unconstrained units to test how much of the effects in the initial version of Figure 6 are driven by constrained vs. unconstrained RNN units.
In the revised version we have included two additional supplemental figures (Figures S5-6) where the analyses of Figure 6 are carried out separately for constrained and unconstrained units. In short, the results for the constrained units strongly resemble those for the experimental data, while the results for the unconstrained units strongly resemble those for all model units.
(3) The authors should repeat Figure 7, but performing ablations separately on the constrained and unconstrained units to examine how the network behaves in each case and the resulting "behavioral" effect.
The revised version includes a supplemental figure (Figure S7) with the results of these additional ablation simulations.
In summary:
In terms of behavioral performance, the prior results showing that ablating linear, step-perception, or step-choice units significantly impairs performance, while ablating “other” has no significant effect, hold even if ablation is restricted to only constrained or only unconstrained units. There is a significant main effect of constrained vs unconstrained; on average, ablating the unconstrained population impairs performance more, most likely due to their larger population size.
In terms of dynamics, to impair stimulus coding by ablating step-choice units, you must ablate them all; to impair stimulus coding by ablating linear or step-perception units, however, ablating just the unconstrained ones suffices. As before, ablating linear, step-perception, or step-choice units significantly impairs choice coding activity, while ablating “other” units does not; these results hold even if ablation is restricted to only constrained or only unconstrained units. Finally, there is again a significant main effect of constrained vs unconstrained; on average, ablating the unconstrained population impairs dynamics more, most likely due to the larger population size.
Reviewer #2 (Recommendations for the authors):
(1) In addition to panel 5B, it would be informative to show data from individual mice and the corresponding RNNs trained on each mouse, to assess how closely they match. If available, including one representative example of a good match and one of a less accurate match would help the reader get a better sense of the data.
Figure 5B shows the average behavioral performance of the model. Individual models were not trained directly on the psychometric curves of experimental sessions; they were trained to perform the task correctly. After successful training, model simulations were run with input noise to be able to produce a sigmoidal psychometric curve. However, although the input noise was tuned to capture the overall correct rate of the corresponding experimental session, we did not attempt to match the details of the psychometric curve. See also the next reply.
(2) In addition to panel 5C, it would be useful to add examples of experimentally observed PSTHs and the corresponding activity trajectory for the units in the RNN trained to match them, for all the other coding patterns (step-perception and step-choice).
We note that the PSTH in 5C is not an example of a linear coding unit as the Reviewer implies, but simply one with a good fit, and here the model’s output was produced in the absence of input noise. In order to classify step-perception and step-choice responses one needs error trials, but the model was trained without this input noise that induces errors (and produces a sigmoidal psychometric function) to match experimental PSTHs from correct trials only. Post-training simulations were then run with input noise to induce error trials, and model unit response profiles were classified based on this. However, there is no guarantee that error trials in the model match the error trials in the experiment; therefore, step-perception and step-choice units in the model may or may not be step-perception and step-choice units in the data. Despite this limitation, the revised manuscript includes additional examples, in Figure S2, of experimentally observed PSTHs and their corresponding model activity, to supplement Figure 5C and provide a better sense of the goodness-of-fit.
(3) Electrophysiological data in Figure 2 - It would be helpful to provide statistics on how many neurons change their activity in each session.
In the revised manuscript we have included across-session statistics for proportions of neurons that are taste-responsive and that show decision preparatory activity. We have also included tables (Tables S1 and S3) with the numbers of neurons that are taste-responsive and that show preparatory activity for each session in the experimental and model data.
(4) Peak auROC selection - How was the peak auROC selected? Selecting only one bin for the peak could be potentially problematic and may result in the incorrect identification of an outlier that does not faithfully represent the neuron's overall activity. The peak selection could instead be based on several consecutive bins showing a consistent trend. If this approach was already implemented, the authors should explicitly describe it in the Methods section.
Peak auROC was selected from a single bin (with average duration about 50ms). While it is true that this may result in outlier neurons that transiently prefer one stimulus strongly but more consistently prefer the other, we opted for a simple criterion to sort the neurons into two categories for visualization. Adopting more stringent criteria that consider multiple bins may result in neurons that cannot be placed in either category, and we wanted a way to examine the entire pseudo-population. Also, the entire auROC trace is visualized in the heatmap, so potential outliers are not hidden and can be assessed by eye.
Reviewer #3 (Public review):
Primary taste cortex neurons show a variety of dynamic response profiles during taste decision-making tasks, reflecting both sensory and decision variables. In the present study, Lang et al. set out to determine how neurons with distinct response profiles contribute to perceptual decisions about taste stimuli.
The methods, with reference to the behavioral task and electrophysiological recordings/data analysis, are straightforward, solid, and appropriate. The computational model is presented in a clear and conceptually intuitive manner, although the details are outside of my area of expertise.
The experimental design features a simple 2-alternative forced-choice design that yielded clear psychometric curves across a range of stimuli. In vivo recordings were performed using Neuropixels and yielded an appropriate sample of single neuron responses. The strength of the model lies in the fact that it consists of single neurons whose response profiles mimic those recorded in vivo, and allows neuron-selective manipulation.
By virtually lesioning specific subsets of neurons in the network, the authors demonstrate that a relatively small population of neurons with specific tuning profiles was sufficient to produce the observed neural dynamics and behavioral responses. This effect was selective as lesioning other responsive neurons did not affect overall response dynamics or performance.
These findings provide new insight into the relation between the response profiles of single neurons in sensory cortex, their population-level activity dynamics, and the perceptual decisions they inform.
The approach is particularly innovative as it uses computational modeling to target functionally-defined "cell types", which cannot necessarily be targeted by more conventional genetic approaches.
We thank the Reviewer for the positive assessment of our study.
Reviewer #3 (Recommendations for the authors):
(1) Introduction: I'm missing a clearly stated specific hypothesis and what is predicted on the basis of that hypothesis. What is the alternative?
The null hypothesis is that single neuron activity patterns, even when clearly structured, do not matter for population activity or behavior. Alternatively, they do matter for these phenomena, and our model supports the alternative hypothesis. We have made this hypothesis clearer in the Introduction.
(2) Discussion: Much of the text is a recap of the Introduction and Results sections. Please elaborate on the specific insights gained from the findings. The idea that tuned neurons in the sensory cortex are the basis for perception and perceptual decisions concerning the features being represented by those neurons is generally accepted. What the present study adds to this insight could be described more explicitly. On the other hand, the idea that small populations of tuned neurons are responsible for perception of taste/perceptual decisions about taste appears in contrast with previous accounts where stimulus features/decisions are reflected in correlated changes in activity across distributed populations of taste cortical neurons, including ones that are not necessarily tuned or even overtly responsive. How do the present findings relate to this idea?
This is a very good point about reconciling these findings with past ones that have focused on coordinated changes across ensembles of neurons, i.e., metastable dynamics of internal (hidden) states. There is a brief mention of metastability toward the end of the Discussion, but we agree it deserves elaboration.
This work does emphasize single unit activity, but in the context of, and as relevant to, population activity. We believe that the findings and frameworks of previous studies and those presented here are compatible rather than mutually exclusive. There is no reason why neurons with the coding patterns we studied here cannot coordinate with others to participate in the formation of different metastable states. The question of which—neurons with specific response profiles, or ensemble activity patterns that may involve these neurons?—is necessary and sufficient for producing perception and behavior during the mixture-based decision-making task is interesting but rather difficult to answer because of the single units’ contribution to both alternatives. One would need to utilize a manipulation that disrupts ensemble coordination without disrupting single unit activity to differentiate between them. We have made these points clearer in the Discussion.
(3) Results: RNNs were based on data from single sessions -- how many neurons of each tuning type were observed in each session? In particular, there were 23 sessions but only 25 neurons total tuned to choice, suggesting that modelled choice neurons were based on ~1 neuron.
The revised manuscript includes the session-by-session breakdown of response types for both experiment and model in two supplementary tables (Tables S2 and S4). We note that there are 25 neurons tuned to choice during the last 500 ms of the trial prior to decision, but 114 out of 626 neurons in total are tuned to choice in some time bin in the experimental data.
(4) Minor: Indicate the time windows used for analysis of stimulus sampling, delay, and choice on the figures.
The revised manuscript now includes the illustration of sampling and delay windows in Figure 2C-D, since we averaged the values over these windows for use in a 2-way ANOVA. All other figures either are associated with bin-by-bin analyses and have the first central and lateral licks (T and D) indicated, or have the time windows specified (e.g., Figure 4B, which uses [T, T + 0.5 s] and [D - 0.5 s, D]).
eLife Assessment
This study presents valuable findings on the physiological and computational underpinnings of the accumulation of intermittent glimpses of sensory evidence. The evidence supporting the claims of the authors is solid, although a more exhaustive characterisation of how the different signals interact would have strengthened the study. The work will be of interest to cognitive and systems neuroscientists working on decision-making.
Reviewer #1 (Public review):
Summary:
This paper characterises the physiological and computational underpinnings of the accumulation of intermittent glimpses of sensory evidence, with a focus on the centroparietal positivity and motor beta lateralization. The main finding is that the centroparietal positivity builds up during evidence accumulation but falls back to baseline during gaps, while motor beta lateralization maintains a continuous a sustained representation throughout the gap and until response.
Strengths:
- Elegant combination of electroencephalography and computational modelling.
- Innovative task design, including parametric manipulation of gap duration.
- The authors describe results of two separate experiments, with very similar results, in effect providing an internal replication.
Weaknesses:
- A direct characterization of how the centroparietal positivity and motor beta lateralization interact is missing, which limits the novelty. In their reply to reviewers, the authors argue that the signal-to-noise ratio of EEG signals is insufficient for such analyses at the single-trial level. If so, a binned or trial-averaged approach could still be attempted.
- An exhaustive characterisation of sensors and frequency bands is also missing. In their reply to reviewers, the authors suggest that this would detract from their hypothesis-driven focus. I disagree: the main hypothesis and figures could remain centred on the centroparietal positivity and motor beta lateralization, with a more comprehensive mapping of sensors and frequencies placed in supplementary material. Since the purpose of the paper is to examine EEG-based decision signals in a novel behavioural context, a broader characterisation of the underlying EEG landscape would seem appropriate.
Reviewer #2 (Public review):
Summary:
This manuscript examines decision-making in a context where the information for the decision is not continuous, but separated by a short temporal gap. The authors use a standard motion direction discrimination task over two discrete dot motion pulses (but unlike previous experiments, fill the gaps in evidence with 0-coherence random dot motion of differently coloured dots). Previous studies using this task (Kiani et al., 2013; Tohidi-Moghaddam et al., 2019; Azizi et al., 2021; 2023) or other discrete sample stimuli (Cheadle et al., 2014; Wyart et al., 2015; Golmohamadian et al., 2025) have shown decision-makers to integrate evidence from multiple samples (although with some flexible weighting on each sample). In this experiment, decision-makers tended not to use the second motion pulse for their decision. This allows the separation of neural signatures of momentary decision-evidence samples from the accumulated decision-evidence. In this context, classic electroencephalography signatures of accumulated decision-evidence (central-parietal positivity) are shown to reflect the momentary decision-evidence samples.
Strengths:
The authors present an excellent analysis of the data in support of their findings. In terms of proportion correct, participants show poorer performance than predicted if assuming both evidence samples were integrated perfectly. A regression analysis suggested a weaker weight on the second pulse, and in line with this, the authors show an effect of the order of pulse strength that is reversed compared to previous studies: A stronger second pulse resulted in worse performance than a stronger first pulse (this is in line with the visual condition reported in Golmohamadian et al., 2025). The authors also show smaller changes in electrophysiological signatures of decision-making (central parietal positivity, and lateralised motor beta power) in response to the second pulse. The authors describe these findings with a computational model which allows for early decision-commitment, meaning the second pulse is ignored on the majority of trials. The model-predicted electrophysiological components describe the data well. In particular, this analysis of model-predicted electrophysiology is impressive in providing simple and clear predictions for understanding the data.
Weaknesses:
Some readers may be left questioning why behaviour in this experiment is so different from previous experiments which use almost exactly the same design (Kiani et al., 2013; Tohidi-Moghaddam et al., 2019; Azizi et al., 2021; 2023). Overall performance in this experiment was much worse than previous experiments: Participants achieved ~85% correct following 400 ms of 33 - 45% coherent motion. In previous work, performance was ~90% correct following 240ms of 12.8% coherent motion. A second weakness is that, while the authors present a model which describes the data based on pre-mature decision-commitment, they do not examine explanations from the existing literature, that evidence is flexibly weighted, and do not provide any analyses which could be used to compare these descriptions. While their model can describe the data in this manuscript, it cannot explain the data from previous experiments showing a stronger weight on the second pulse.
Author response:
The following is the authors’ response to the original reviews.
Public Reviews:
Reviewer #1 (Public review):
Summary:
This paper aims to characterise the physiological and computational underpinnings of the accumulation of intermittent glimpses of sensory evidence.
Strengths:
(1) Elegant combination of electroencephalography and computational modelling.
(2) The authors describe results of two separate experiments, with very similar results, in effect providing an internal replication.
(3) Innovative task design, including different gap durations.
Weaknesses:
(1) The authors introduce the CPP as tracking an intermediary (motor-independent) evidence integration process, and the MBL as motor preparation that maintains a sustained representation of the decision variable. It would help if the authors could more directly and quantitatively assess whether their current data are in line with this. That is, do these signals exhibit key features of evidence accumulation (slope proportional to evidence strength, terminating at a common amplitude that reflects the bound)? Additionally, plotting these signals report locked (to the button press) would help here. What do the results mean for the narrative of this paper?
The reviewer is correct that properties such as temporal slope scaling with evidence strength and stereotyped threshold-like amplitude were key in establishing that the CPP reflects evidence accumulation in conventional continuous-stimulus tasks, and its motor independence was demonstrated in how it exhibited the same evidence-dependent dynamics in the absence of motor requirements (e.g. O'Connell et al 2012). We agree that it is of interest to check any such properties that can be feasibly tested in the current, distinct task context of intermittent evidence with delayed responses. Given the way in which participants performed our delayed-response task, sometimes terminating decisions early, it is in the CPP-P1 that conventional patterns of coherence-dependence in slope and amplitude would be expected. Indeed, we found that the CPP-P1 reached higher amplitudes (Fig. 3A, Author response image 1) and exhibited a steeper build up in high- compared to low-coherence trials (Author response image 1). The slope and amplitude profile of the CPP-P2 is complex due to the variability in baseline activity across our various delay conditions and the bounded process that participants engaged in, but it is still consistent with an accumulation process. Our simulations provide a full account of how an accumulating signal could produce the observed results.
Author response image 1.
Grand-averaged (± sem) CPP-P1 traces in both experiments (top). Bottom boxplot graphs indicate the average slope computed as the slope between 0.2 s post P1 onset (when CPP begins its buildup) and the time when peak amplitude was reached within the [0.4-0.6s] interval, computed for each subject individually. Red crosses indicate outliers, computed as values exceeding 1.5 times the interquartile range away from the bottom or top of the box. Grey lines indicate single subject estimates, and asterisks reflect the significance of paired ttests for the estimated slope and amplitude effects; **p<0.01, *p<0.05. H = high coherence, L = low coherence.
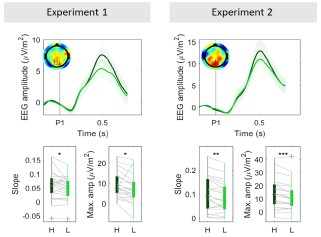
Like in other delayed-response tasks (Twomey et al 2016; McCone et al 2026), we observe here that the CPP peaks and falls well before the response is cued or indeed executed (here, in fact peaking and falling for each individual pulse). Thus, its pre-response dynamics will not relate to stimulus-driven evidence accumulation in the way they do in immediate response contexts (e.g. O’Connell et al. 2012; Steinemann et al. 2018). We therefore do not analyse response-aligned CPPs in the experiment.
As to the intermediary role we have interpreted for the CPP, in addition to the local pulse driven peak-and-fall dynamics compared to the sustained profiles of motor preparation signals, we can point to the obvious temporal delay between the signals, where evidence-dependent buildup in the CPP substantially precedes that of motor preparation, as observed in all previous studies comparing the two (e.g. Kelly & O'Connell 2013).
(2) The novelty of this work lies partly in the aim to characterize how the CPP and MBL interact (page 5, line 3-5). However, this analysis seems to be missing. E.g., at the single-trial level, do relatively strong CPP pulses predict faster/larger MBL? The simulations in Figure 5 are interesting, but more could be done with the measured physiology.
As exemplified in the extant EEG-decision literature, the low signal-to-noise ratio of EEG is such that attempts are seldom made to link two EEG signals on a single-trial basis, and studies instead favour testing single-trial relationships between each individual EEG signal and behaviour, or, most commonly, comparing patterns of variation in the EEG signals across experimental conditions (e.g. difficulty). Accordingly, here we show that trials with high coherence P1 evoked 1) higher CPP amplitudes (Fig. 3A,C), and 2) stronger MBL (Fig. S2 & S3). Further, we showed that particularly high CPP amplitudes following the first pulse led to stronger weights on choice for the first pulse (Fig. S11), which could only be mediated by the motor system.
(3) The focus on CPP and MBL is hypothesis-driven but also narrow. Since we know only a little about the physiology during this "gaps" task, have the authors considered computing TFRs from different sensor groupings (perhaps in a supplementary figure?).
While we agree that it might be interesting to explore frequency bands and sensors more broadly, we feel that such an exploration would detract from the hypothesis-driven focus on how prominent, well-characterised decision signals in the brain behave in a context where evidence is presented in an atypical, seldom-studied manner, namely in the form of temporally separate pulses. Our aim was not to explore whole-brain dynamics that might be engaged during the task, but rather to get a better understanding of the functional roles of the neural processes underlying the CPP and MBL during decision making. Providing a detailed description of whole-scalp responses is thus beyond the scope of this paper, but given that all data will be made publicly available this can be pursued in future work and by other researchers.
(4) The idea of a potential bound crossing during P1 is elegant, albeit a little simplistic. I wonder if the authors could more directly show a physiological signature of this. For example, by focusing on the MBL or occipital alpha split by the LL, LH, HL and HH conditions, and showing this pulse- as well as report-locked. Related, a primacy effect can also be achieved by modelling (i) self-excitation of the current one-dimensional accumulator, or (ii) two competing accumulators that produce winner-take-all dynamics. Is it possible to distinguish between these models, either with formal model comparison or with diagnostic physiological signatures?
In addition to the CPP amplitude effects we report in the main paper, the reviewer is correct that pulse-locked MBL can also provide a physiological signature of the greater number of pulse-1 bound crossings when that pulse is high-coherence. This is shown in Figure S3, where we see this coherence-dependent effect consistently across all gap durations and both experiments. Figure S2 also shows that the MBL step-change after P2 is greater in P1-low coherence trials in Experiment 1, as predicted by the bound-crossing account, and consistent with the CPP findings. We note that this effect appears absent in Experiment 2, but this is likely because the greater proportion of shorter gap durations (0, .12, .36s) mean that updates following P2 are likely to still capture P1-driven changes, due to signal-transmission delays. Please also note that Fig. S2 and S3 have been updated from the previous version, because while revising the paper we noticed a mistake whereby we were plotting alpha band power (813Hz) rather than the intended beta (13-30Hz). The results remain qualitatively unchanged. Although there isn’t sufficient single-trial signal-to-noise ratio to be able to categorise individual trials as having crossed a threshold or not, this is strong evidence in support of the coherence dependent amplitudes of the CPP and motor updates. Analyzing beta locked to the report would not be informative in this case because of the delayed reporting structure of the task and the threshold-crossing relationship beta exhibits with response execution (O’Connell et al. 2012). That is, beta will reach the same amplitude immediately prior to the response regardless of whether or not decisions were terminated during P1. Instead, we believe that the empirical CPP-P2 traces we show provide direct evidence that the second pulse was not fully integrated in all trials, and as our modelling confirms, this is consistent with bound crossings occurring sometimes before P2. First, the fact that CPP-P2 amplitudes were overall lower than CPP-P1 amplitudes mirrors the behavioural observation that the first pulse had a stronger weight on choice than the second one. Second, we show that trials where the CPP was particularly high after the first pulse were also trials where P1 also exerted a particularly strong influence on choice (see Fig. S11), further validating the idea that higher CPP amplitudes are directly related to behaviour.
Regarding self-excitation (SE) and winner-take-all competition (WTAC), these could indeed contribute to the behavioural primacy effects, but they would not detract from our central finding that the CPP does not encode a sustained representation of a decision variable, but rather reflects two rounds of evidence accumulation feeding into a single decision process. Further, it is not immediately clear whether/how these alternative models might also account for the CPP-P1/CPP-P2 results as simply as our bounded model does. While it might be theoretically possible for SE/WTAC models to explain 1) why the CPP-P2 is generally lower than the CPP-P1 across conditions, and 2) why the maximum CPP-P2 amplitudes in P1-high trials are smaller than in P1-low trials, these patterns of results are not an immediate consequence of standard implementations. Further, while the question of whether the accumulation process is perfect integration or involves SE or WTAC is certainly of additional interest, given that this is a delayed response task and does not provide information on termination timing through RT distributions, arbitrating between these modes of integration would not be straightforward with the current data.
(5) The way the authors specify the random effects of the structure of their mixed linear models should be specified in more detail. Now, they write: "Where possible, we included all main effects of interest as random effects to control for interindividual variability." This sounds as if they started with a model with a full random effect structure and dropped random components when the model would not converge. This might not be sufficiently principled, as random components could be dropped in many different orders and would affect the results. Do all main results hold when using classical random effects statistics on subject-wise regression coefficients?
The equations in the paper include the full details of the random effects structure we used for each model. We note that only two of our four equations did not include a full random effect structure, indeed due to convergence issues. We have now fit these models with a maximal random effects structure (i.e. including all fixed effects as random effects as well) with the ‘bobyqa’ optimiser. This resulted in singular fits for both Eq. 2 (Exp. 1 and Exp. 2) and Eq. 3 (Exp. 2 only). Following previous suggestions, we used a weakly informative wishart prior (Chung et al. 2015) to regularise the random effects covariance matrix using the blme package (Chung et al. 2013), which resolved the singular fit problem. However, the model still produced convergence warnings in some models. To assess these models’ robustness, we compared the fixed effect parameter estimates across multiple optimisers, as suggested by the lme4 developers (see lm4 documentation). Parameter estimates across optimisers rarely deviated by more than one decimal point across 6 optimisers (see Bates et al. 2011), and we thus concluded the model estimates were robust and convergence warnings were a false positive, a known issue in lme4. For all models in the paper, we report the parameters estimated using the “bobyqa” optimiser. All main inferential results remain unchanged (except for one interaction that was not of interest in Exp. 1), and the estimated slopes and statistical results for all models have been updated in the manuscript. We also included all these details in the manuscript.
Reviewer #2 (Public review):
Summary:
This manuscript examines decision-making in a context where the information for the decision is not continuous, but separated by a short temporal gap. The authors use a standard motion direction discrimination task over two discrete dot motion pulses (but unlike previous experiments, fill the gaps in evidence with 0-coherence random dot motion of differently coloured dots). Previous studies using this task (Kiani et al., 2013; Tohidi-Moghaddam et al., 2019; Azizi et al., 2021; 2023) or other discrete sample stimuli (Cheadle et al., 2014; Wyart et al., 2015; Golmohamadian et al., 2025) have shown decision-makers to integrate evidence from multiple samples (although with some flexible weighting on each sample). In this experiment, decision-makers tended not to use the second motion pulse for their decision. This allows the separation of neural signatures of momentary decision-evidence samples from the accumulated decision-evidence. In this context, classic electroencephalography signatures of accumulated decision-evidence (central-parietal positivity) are shown to reflect the momentary decision-evidence samples.
Strengths:
The authors present an excellent analysis of the data in support of their findings. In terms of proportion correct, participants show poorer performance than predicted if assuming both evidence samples were integrated perfectly. A regression analysis suggested a weaker weight on the second pulse, and in line with this, the authors show an effect of the order of pulse strength that is reversed compared to previous studies: A stronger second pulse resulted in worse performance than a stronger first pulse (this is in line with the visual condition reported in Golmohamadian et al., 2025). The authors also show smaller changes in electrophysiological signatures of decision-making (central parietal positivity and lateralised motor beta power) in response to the second pulse. The authors describe these findings with a computational model which allows for early decision-commitment, meaning the second pulse is ignored on the majority of trials. The model-predicted electrophysiological components describe the data well. In particular, this analysis of model-predicted electrophysiology is impressive in providing simple and clear predictions for understanding the data.
Weaknesses:
Some readers may be left questioning why behaviour in this experiment is so different from previous experiments, which use almost exactly the same design (Kiani et al., 2013; TohidiMoghaddam et al., 2019; Azizi et al., 2021; 2023). The authors suggest this may be due to the staircase procedure used to calibrate the coherence of (single-pulse) dot motion stimuli for individuals at the start of the experiment. But it remains unclear why overall performance in this experiment is so bad. Participants achieved ~85% correct following 400 ms of 33 - 45% coherent motion. In previous work, performance was ~90% correct following 240ms of 12.8% coherent motion. It seems odd that adding the 0% coherent motion in the temporal gaps would impair performance so greatly, given it was clearly colour-coded. There is a lack of detail about the stimulus presentation parameters to understand whether visual processing explains the declined performance, or if there is a more cognitive/motivational explanation.
We thank the reviewer for highlighting this. We apologise for not providing full details about the visual display, which we have included now.
The moving dots were presented centrally on the monitor, at a 5 degree aperture, and moving at a speed of 5 degrees/second. The monitor refresh rate was 60Hz for 19 participants and 85Hz for 3 participants in Experiment 1, while it was 85Hz for 19 participants and 60Hz for 2 participants in Experiment 2. Dot density in our task was similar to previous studies (16.7 dots/degree/s<sup>2</sup>, as in Kiani & Shadlen 2013; Tohidi-Moghaddam et al. 2019; Azizi et al. 2021, 2023). However, in contrast to previous studies, we did not include any feedback on a trial-bytrial basis, instead only providing feedback at the end of each block indicating the average accuracy. This would have made it harder for participants to continually assess how well they were performing and to adjust their strategies (e.g. increase their bound for better accuracy) accordingly. We agree that the inclusion of 0% coherence dots during the gap between pulses is unlikely to have caused the participants’ relatively low overall performance, especially since we did not find accuracy to be overall lower for longer 0%-coherence gaps.
Further, as the reviewer notes, we used a staircasing procedure at the beginning of the experiment which used only single pulses of evidence. This may have encouraged participants to set a bound that can usually be reached by one pulse, and the resultant early terminations meant that they seldom used the full 400ms of evidence that were available to them. In fact, we would like to thank the reviewer for pointing out Golmohamadian et al., 2025, which used a similar variable delays task structure but with different visual stimuli. They, like us, trained on a single-pulse task version and omitted trial-by-trial feedback in the main task, and, also like us, reported a stronger choice reliance on pulse-1. This suggests that these two factors may suffice to induce a primacy rather than a recency effect.
There are other reasons why performance may have been different in our task compared to previous studies. For example, our task included a lead-in period that was longer than in previous studies and contained 0%-coherence dots, in order to minimise interfering VEP components (the lead in period was between 700 to 1050ms in our study, compared to 200– 500 ms in Kiani & Shadlen 2013; Tohidi-Moghaddam et al. 2019 & Azizi et al. 2023, and 400 -1000 ms in Azizi & Ebrahimpour 2021). This longer and visually explicit preparation period may have acted as a warning cue, allowing participants to fully prepare before the first pulse, and again making it easier for them to hit a bound with only that information.
We have added a more detailed discussion about how our stimuli and the task characteristics may have resulted in a substantially different performance in our task compared to previous studies in the discussion section.
Recommendations for the authors:
Reviewing Editor:
Please consider the following reviewer suggestions for how to strengthen the evidence for your central claims, which could translate into an improved assessment of the "strength of evidence".
Apart from these useful suggestions, I had some concerns about scholarship, because the list of studies currently cited in your introduction is exclusively from your group, while one of the phenomena of interest - motor beta power lateralization (MBL) in decision-making - has been widely studied by several groups, using also other techniques.
I was wondering why you chose not to cite the ample MEG evidence for the role of MBL in decision-making. This has been shown both in classical random dot motion tasks (Donner et al, Curr Biol, 2009; de Lange et al, J Neurosci, 2013; Pape et al, Nat Commun, 2016; Urai et al, Nat Commun, 2022) as well as in tasks involving discrete evidence samples (Wilming et al, Nat Commun, 2020; Murphy et al, Nat Neurosci, 2021). Another relevant EEG study is by Ian Gould et al, J Neurosci, 2010. There is also quite a bit of monkey LFP work (mainly by Saskia Haegens) on choice-selective beta power in the motor system of the macaque, although the link to the lateralized beta power suppression in your work and the above human E/MEG studies remains a bit elusive. I feel it would be important to provide a more balanced reflection of the existing literature on this phenomenon.
We thank the editor for this fair comment, and we apologise for having provided a too narrow, EEG-centric view of the literature, arising from our interest in the CPP component which hasn’t yet been characterised in MEG or LFPs. We have now substantially expanded the introduction to provide a more balanced and comprehensive overview of the literature.
Reviewer #1 (Recommendations for the authors):
(1) The diffusion model needs to be explained in more detail. For example, it should be explicitly stated that the model was fit to only choices, as most readers would expect reaction times. Further, it needs to be started if the model was fit separately for each subject or in one go to the group-level data. If the former, it is important to add error bars of the betweensubjects variability (in simulated and empirical data) to Figure 4A. If the latter, it would be important to determine uncertainty using bootstrapping.
The original model was fit to grand-average data, as stated in the methods section. To assess between-subjects variability, we have re-fitted the model to each individual subject, for each experiment. The average of the individually-estimated model parameters closely recapitulated the values obtained from the fit to grand-averaged data (Fig. S12). We then simulated N = 10000 trials for each individual, and we report the grand-averaged results with error bars indicating the standard error of the mean as a supplementary figure (Fig. S13). The results replicate the ones reported in the main manuscript. We have also made it explicit that the models are fit to accuracy data but not RT.
(2) The authors write numerous times that the MBL exhibits an "evidence-dependent" buildup. However, should this not be "choice-dependent"? In Figure 2A, one can clearly see that the sign of MBL follows choice and not objective evidence.
We thank the reviewer for this comment. By evidence-dependent, we mean that lateralisation towards the correct response is strongest in high-coherence trials (see Fig. S2, S3). This is indeed because the sign of MBL is choice-dependent, and participants are less likely to make mistakes in high-coherence trials. We have added a clarification sentence in the text.
(3) It would aid readability to add sub-conclusions at the end of each Results section.
We have added clarifications where needed.
(4) In Figure 1B, I cannot see a dashed line for the HL condition. I understand that it must lie under the LH condition, but it would be good to show it separately.
We thank the reviewer for this comment. Since we cannot show both lines separately without additional panels, given the HL and LH lines perfectly overlap, we indicate at the end of the caption that this is the case as follows: “Note that a perfect accumulator predicts identical accuracies for the HL and LH conditions, and therefore the two lines overlap.”
(5) In Figure 4B, is the horizontal dashed line important? It is confusing because the legend incorrectly states that this is "data".
Thanks for this observation - it was only there to indicate a 50% as a benchmark to assess how frequent early terminations are, but we agree that it was unnecessary and potentially confusing, so we have removed it from the plot.
Reviewer #2 (Recommendations for the authors):
(1) The authors should more directly address how behaviour in their task differs quite substantially from previous experiments with very similar designs (including why such high coherence levels are required, over a longer duration, to reach overall worse performance). Some readers may also be interested in a broader discussion of how decision-makers may use flexible weights when integrating evidence across samples over time. While the explanation of bounded accumulation is convincing in this context, Tsetsos et al., (2012) suggest recency effects (as in Cheadle et al., 2014; Wyart et al., 2015) cannot be explained by bounded accumulation, but rather integration leak. Other factors may include stimulus consistency (Glickman et al., 2022) or even choice consistency across decisions (Bronfman et all., 2015). Golmohamadian et al., 2025 demonstrated flexibility in decision strategies across sensory modalities.
As we described above, we have added some more detailed explanation about why it might be the case that behaviour in our study differs from previous reports using similar tasks. We agree that the reversed pulse-reliance in our study compared to others presents an opportunity to discuss flexibility in decision strategy and so we have now added a broader discussion on different patterns of integration in various task contexts. We thank the reviewer for pointing out Golmohamadian et al., 2025, as they, like us, trained on a single-pulse task version and omitted trial-by-trial feedback in the main task, and, like us, reported a stronger choice reliance on pulse-1.
(2) Another open question is how central parietal positivity reflects an accumulation signal in the case of continuous evidence, but reflects momentary evidence in the case of discrete evidence samples. If, in both cases, the parietal evidence is passed along to motor processes for bounded decision commitment, how do motor processes deal with the changes in what is represented? Can the relationship between MBL and CPP in the model-simulated data shed some light on this? Specifically, how is the 0-gap condition treated in this simulation (which shows only 1 CPP peak but with a longer time to decay) compared to non-zero gap conditions (which show 2 peaks)?
This is a very interesting and important point, and we thank the reviewer for raising it. We believe that the CPP in our intermittent-dots task reflects dot-motion evidence integration in the same way as in conventional continuous evidence tasks, building at an evidence dependent rate (see Author response image 1), with the only difference being that integration processes can be turned “on” or “off” depending on whether evidence is present, and can thus be temporally split into multiple “rounds” of accumulation when there is a gap.
Our model simulations assume that evidence integration is triggered by the dots turning yellow, indicating the presence of evidence, and feeds continuously to the motor system in these periods. However, it is switched off either when 1) a bound has been hit, or 2) the dots turn blue again, at which point the CPP falls (see various rates of signal decay in Fig. S7). The reason the CPP continues longer before it peaks and falls in the zero-gap condition, by this account, is because there is no dot-colour change at the end of pulse-1 to switch it off, and thus the accumulation process continues until either a bound is hit, or the yellow dots turn blue after pulse-2. When there is a non-zero gap, despite the CPP being switched off, the decision variable itself remains encoded at the motor level so that no information is lost. This requires that the same instruction that turns-off the CPP must also break or pause the flow from the CPP to the motor level and allow it to hold its current level until either a second pulse resumes a feed from a newly-triggered CPP, or response execution is cued. Thus, in our account, the accumulation process underlying the CPP in our intermittent-evidence task is identical to conventional continuous-evidence tasks, but since it can be turned “on” and “off” as a function of whether or not evidence is clearly present or absent, produces two “rounds” of integration in non-zero gap conditions. The motor process also receives a feed from the CPP as in conventional continuous-evidence tasks, but with this feed similarly gated by the presence of evidence.
A slightly different and perhaps more challenging question (which the reviewer was perhaps alluding to) relates to tasks where evidence comes not in short noisy snippets, but rather as static tokens (e.g. Wyart et al. 2012, 2015; Murphy et al. 2021; Parés-Pujolràs et al. 2025). In these instances, the CPP exhibits transient evoked responses to each token, which scale with the belief updates resulting from it (Parés-Pujolràs et al. 2025). However, it remains unclear whether these transient potentials reflect a temporally-evolving integration process to compute the appropriate belief update afforded by that token in the context of a particular task, or rather reflect the output of such a process. The former account would be similar to our interpretation of the transient deflections observed in this gaps task, which we believe capture the same temporal integration processes as those commonly observed in conventional continuous noisy stimuli paradigms, only short-lived. The latter account would instead be specific to low-noise stimuli like tokens, where the computations required for belief updating may not require a temporally-extended integration process, but rely on different mechanisms to compute belief updates (e.g. prior-based modulations of sensory encoding, attention or neural gain). These questions remain open for future investigation.
(3) From what I understand, the model suggests all-or-none integration of the second pulse: either the bound has not been reached and the pulse is perfectly integrated, or the bound has been reached and so the pulse is not integrated. The CPP amplitude at pulse 2 is therefore determined not only by the strength of the evidence at pulse 2 but also by the proportion of trials where the evidence is not ignored: CPP at pulse 2 is of lower amplitude because it is calculated as an average across trials where it is either similar to CPP at pulse 1 or otherwise completely absent. Another explanation for the lower average amplitude is that all trials have a smaller amplitude (somewhat different from the main conclusions of the paper). It would be nice to show the dichotomy predicted by the model in the empirical data. I'm thinking of something similar to this 'bifurcation' analysis from Sergent et al., 2021. Or more simply, estimates of CPP amplitude from single trials (perhaps an average over a short window around the peak) should be more variable at pulse 2, with some reaching similar amplitudes to pulse 1, and many close to baseline, whereas at pulse 1, there should be a more uniform cluster of amplitudes. If all CPP peak amplitudes were lower, would this motivate a model comparison where, for example, additional evidence from the second pulse was down-weighted according to certainty following the first pulse (leading to all trials down-weighting the second pulse)? This could link in nicely with some of the more nuanced analyses related to attention in the supplementary figures.
We thank the reviewer for this insightful comment, which will help us clarify how our model works. The integration of the second pulse does not work in an all-or-none manner. In our model, the accumulation stops whenever a bound is reached at the downstream motor level. This can happen 1) at some point during the 1st pulse (no integration of pulse 2 at all), 2) during the 2nd pulse (partial integration of pulse 2, until the bound is hit), or 3) not crossed at all (full integration of pulse 2). Our model thus allows for partial integration of the second pulse rather than all-or-none. Author response image 2 shows 3 example trials that illustrate how the model works. The CPP amplitudes at pulse 2 are thus determined by two main factors: 1) whether or not accumulation of P2 is precluded by an earlier bound crossing in P1 (if it is, the CPP amplitude is assumed to equal 0), and 2) whether and when accumulation ended if it did take place. Our interpretation is that, given that trials where pulse 1 was low coherence were 1) less likely to terminate early (Fig. 4B) and 2) had achieved lower levels of accumulated evidence (Fig. 4C), the LL and LH conditions are linked to a higher proportion of trials where accumulation at pulse 2 does occur, and it lasts for a longer amount of time because the distance required to reach a bound is longer than in their pulse 1 high-coherence counterparts. We have clarified this point in the results section describing the model.
The reviewer notes: “Another explanation for the lower average amplitude is that all trials have a smaller amplitude (somewhat different from the main conclusions of the paper)”. However, our interpretation in fact predicts that the vast majority of trials should indeed exhibit smaller amplitudes. That can again be explained by the three trial types mentioned above. Unlike in CPP-P1, there would be a majority of trials where integration does not occur at all. Only trials where evidence was at least partially integrated during P2 would be predicted to have CPPP2 amplitudes that are overall positive, and even in those instances, average amplitudes would be overall lower than CPP-P1 in trials that terminated early, because of the lower distance remaining to be covered before hitting a bound. Author response image 2 illustrates this point. Thus, the prediction regarding how CPP amplitude variance or distribution shape would compare between P1 and P2 is less straightforward than if it were all-or-none on P2, not to mention the fact that EEG noise would likely drown-out distributional features like this. We therefore focus on a comparison of the means, for which our model has the clear prediction that most trials should exhibit lower CPP-P2 amplitudes. To assess whether empirical observations meet this prediction, and following the reviewer’s suggestion, we extracted the mean amplitudes around 0.45-0.55s after P1 and P2, for each single trial. CPP-P2 data were baselined using the amplitude 100 ms before P2 onset, as in Fig. S5 - note that this is likely to introduce spurious drifts due to overlapping potentials from P1, but given that grand averaged traces still qualitatively captured the key effects we assume it is a valid approach. We then pooled CPP-P1 and CPP-P2 amplitudes across pulses, and z-scored them for each participant separately. In both experiments, in a majority of participants (Exp. 1: 16/22, Exp. 2: 17/21) the median z-CPP-P1 amplitude was higher than that of z-CPP-P2. Author response image 3 illustrates the pooled distributions.
Author response image 2.
Decision variable simulations illustrating sample single trials (top) and CPP traces averaging data across conditions and N = 1000 trials (bottom), using model fits from Exp 2, in the long gap condition. Overlaid text indicates the percentage of trials in each subset, for each condition. The horizontal line indicates the bound; shaded areas indicate pulse presentation times. A. The bound was hit during P1, and therefore no further accumulation occurred during P2. B. The bound was hit during P2, and therefore P2 was only partially accumulated, C. No bound was hit, and therefore all evidence from P2 was accumulated.
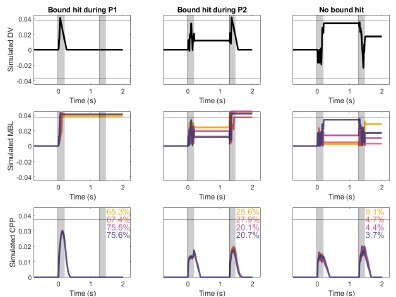
Author response image 3.
Pooled CPP–P1 and CPP-P2 amplitudes [450-550ms post-pulse] distributions, normalised within-participant, and baselined 100ms before pulse onset. In both experiments, CPP-P2 amplitudes had a lower median (vertical line) normalised amplitude than CPP-P1.
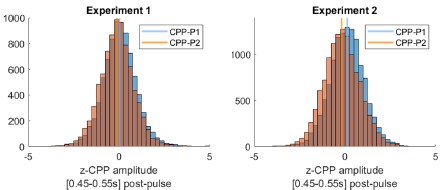
(4) A minor note: Full details of stimulus presentation (size, number of dots, dot size, speed, lifetime) would be appreciated.
Thank you - we have now provided these details in the methods section (see also reply to public reviews above).
(5) Are the authors sure they want to use this 'Gaps task' name? It seems a bit strange to introduce this name in this context, where there isn't really a 'Gap' (random dot motion fills the gap). A reader could get the impression the name was given in the Kiani et al., 2013 study (page 3, paragraph 1: "This scenario has begun to be studied using an intermittent- evidence or "gaps" task (Kiani et al., 2013) ...") but this is not true, Kiani et al. never use the term "Gaps task", nor has any other study since (as far as I know).
We thank the reviewer for noting this oversight on our part - we have now made it clear that “gaps task” is the way we refer to the task originally developed by Kiani et al. 2013 in the introduction. We have decided to still use this name because it is a convenient proxy, in the understanding that “gap” refers to a “gap” in coherent motion as in Kiani et al (2013), albeit not a proper blank as in the original implementation.
eLife Assessment
This valuable cross-sectional longitudinal study leverages high-definition transcranial direct current stimulation to the left dorsolateral prefrontal cortex to examine its effect on procrastination behavior over an extended time span. The cross-sectional longitudinal study provided evidence for how stimulating DLPFC impacts reveal-world procrastination behavior. Support for the conclusions is incomplete owing to missing information about the analyses, and results, as well as some potential alternative interpretations.
Reviewer #1 (Public review):
Summary:
The authors report the results of a tDCS brain stimulation study (verum vs sham stimulation of left DLPFC; between-subjects) in 46 participants, using an intense stimulation protocol over 2 weeks, combined with an experience-sampling approach, plus follow-up measures after 6 months.
Strengths:
The authors are studying a relevant and interesting research question using an intriguing design, following participants quite intensely over time and even at a follow-up time point. The use of an experience-sampling approach is another strength of the work.
Comments on revisions:
Overall, I think the authors made many improvements to their manuscript. There are, however, still a number of concerns that first need to be addressed, since it is still not currently possible to fully evaluate the analyses, results, and conclusions presented in the paper. I list these points below:
(1) The authors still use causal language where they must not use causal language. This is true for many places in the manuscript; I am highlighting here just a few places, but the authors nevertheless have to go carefully through the whole manuscript to change these instances.
Some examples:
(a) In response to my comment (1) in the previous round, where the authors adjusted their text, the authors still use causal language in their last sentence "... procrastination behavior has been observed to impair general health..." Unless the cited study truly allowed causal conclusions, the causal language should be removed here as well.
(b) The authors still make (causal) claims about the involvement of self-control in their observed results. To reiterate from the previous round of revisions: The authors cannot make any strong claims about the role of self-control processes because they do not directly measure self-control nor do they directly manipulate self-control or have a design that would rule out alternative mechanisms other than self-control. Therefore, their claims about self-control have to be toned down. It is laudable that the authors have added a statement towards the end of their discussion about not being able to make strong conclusions about the role of self-control. But the authors need to use similar careful wording not just at the end of the discussion but throughout the manuscript.
(i) In the abstract, the authors use the formulation "...conceptualized roles of self-control on procrastination..." -- this wording is still too strong, suggesting that you actually studied self-control.
(ii) In the introduction (page 4, lines162-169), the way the authors formulate these sentences suggests that they directly measured self-control. Again, the authors need to make it explicit that they are not directly measuring self-control but its hypothesized down-stream consequences on valuations/behavior.
(iii) In the discussion, for example, on page 11, lines 555 and following, the authors write:
"One major contribution this study has made is to disentangle the neurocognitive mechanism of procrastination by demonstrating that self-control could increase task-outcome value so as to reduce procrastination."
Again, please be aware that you are NOT demonstrating that self-control does anything, since you only measure procrastination rates, outcome values, and task aversiveness. It is possible that mechanisms other than self-control might be relevant for this. Perhaps neuromodulation directly increases outcome values, without involvement of self-control processes. You simply cannot know that and therefore you cannot make those claims in the form that you are making them. You can write that the observed results are consistent with the idea that neuromodulation might have had an effect on self-control and this in turn might have affected outcome values. But you also need to make it explicit that, to substantiate these claims, you would need more direct evidence that indeed self-control was involved. These more careful formulations would not at all reduce the value of your work, but indeed they would rather demonstrate your carefulness in interpreting the results you obtained.
(2) I am still puzzled by the power analysis. In the text, you write that a sample size of 18 participants (i.e., 9 per group) would be sufficient to achieve 80% power. I still feel this seems far too optimistic and hard to believe, but that is not my point here. While in the text, you write that you need 18 participants, the G*power output seems to suggest a sample size of 34, not 18. Why this contradiction? Or is it not contradictory? If it is not, then please explain it more fully.
(3) I have several comments about the mixed-effects analysis.
First of all, I want to thank the authors for adding more details, things have become much clearer now. However, I still have a few questions and comments related to these analyses:
(a) The variable Emotions was within-subjects, as far as I understood. Accordingly, Emotions should most likely be modelled with random slopes varying over participants (in addition to being modelled as a fixed effect).
(b) The analyses still cannot fully be evaluated as I cannot access the scripts and data. The authors mention that the scripts and data should be available via a link they provide (https://doi.org/10.57760/sciencedb.35140). However, when I try to access these materials via this link, no page opens; it seems the link is dead?
(c) What are the results and conclusions if you do not include the covariates of no interest? I.e., please re-run your main models without age, gender, SES, Emotions.
(d) The authors mention that they use GLMMs, which would suggest generalized mixed-effects models, but they do not describe what family/distribution they used. Since they mention lmerTest and seem to report F-tests, my guess is that they used Gaussian models. However, both their DVs (procrastination rates and their ratings) are bounded variables and at least procrastination rates hit the lower boundary. That can mean that their analyses suffer from inflated Type 1 and/or Type 2 rates. Therefore, please repeat the analyses with an appropriate generalized mixed-effects model (perhaps a beta regression type of model?).
(e) When reporting the results of the mixed-effects models, the authors report the regression coefficient, standard error, DFs and p value, but not the actual test statistic. Please add the information about the test statistic and report all degrees of freedom (in case of F tests that would be the degrees of freedom of the test and the residual degrees of freedom).
(f) Thank you for adding the analysis where you remove the last two sessions. But currently you present them in the manuscript without explaining/motivating why you do this. Please add this motivation, as otherwise it will be puzzling for the reader why you conduct these analyses.
(4) Mediation analysis
In your manuscript, you present some mediation analyses. Please be aware that such mediation analyses cannot establish causality and they suffer from extremely high Type 1 error rates (see, e.g., https://datacolada.org/103).
My suggestion would be to completely remove all mediation analyses. However, if you want to keep them, then you need to be extremely careful in how you present the results. You need to explicitly mention that you cannot derive any causal conclusions from them and that simulation studies have shown that such mediation analyses suffer from extremely high Type 1 errors.
As an example (but the mediation results are mentioned in several places, for example, also in the abstract):
On page 10, lines 501-503: What you can causally conclude is that neuromodulation affects your measured variables (outcome values, procrastination rates, task aversiveness), but you cannot conclude that the effect of neuromodulation on procrastination rates causally operates via outcome values. Thus, please adjust the formulation accordingly. The same applies to the mediation section that follows right afterwards (page 10, lines 505-522).
(5) In the introduction, the authors introduce several theoretical procrastination frameworks (TMT, mood repair, TDM). Do the results of the current paper help to decide which framework might be the most appropriate, at least for the authors data set? It might be of interest to address this explicitly.
(6) The language is sometimes hard to understand and seems in quite some places grammatically incorrect. Thus, I think the paper would profit very much from thorough English proofreading.
.
Leiser, Stephanie, Shu Wang, and James Tatum. “A Twenty-Year Review of Flint’s Financial Condition.” Center for Local, State, and Urban Policy, 2020. https://closup.umich.edu/research/fiscal-health-reports/twenty-year-review-flints-financial-condition.
.
Leiser, Stephanie, Shu Wang, and James Tatum. “A Twenty-Year Review of Flint’s Financial Condition.” Center for Local, State, and Urban Policy, 2020. https://closup.umich.edu/research/fiscal-health-reports/twenty-year-review-flints-financial-condition.
.
Kupi.com. “History of Flint – Vehicle City Origins & Industry,” 2016. https://www.kupi.com/en-ae/explore/united-states/flint/history.
.
Foote, Aaron C, and Cedric de Leon. “Origins of the Flint Water Crisis: Uneven Development, Urban Political Ecology, and Racial Capitalism.” City & Community 22, no. 4 (October 23, 2023). https://doi.org/10.1177/15356841231207626.
“social responsibility of a business is to increase its profits.”
Friedman's article is interesting because profits are what keeps a business upright, but if you are not also helping the greater good, you aren't doing your job to the fullest.
Ethical acts are generally considered voluntary and personal—often based on our perception of or stand on right and wrong.
personal character is vital for good ethics. You can get by in life without consequences, but it does not mean you are living totally ethically if you aren't a good person.
eLife Assessment
This study provides valuable insights with convincing evidence detailing altered tactile perception in a mouse model of ASD (Fmr1 mice), paralleling sensory abnormalities in Fragile X and autism. Its main strength lies in the use of a novel and quantitative tactile categorization task and the careful dissection of behavioral performance across training and difficulty levels, suggesting that deficits may stem from an interaction between sensory and cognitive processes. The behavioral experiments are well executed and set the stage for subsequent mechanistic, causal, and computational approaches. The work is relevant to those interested in autism, cognition, and/or sensory processing.
Reviewer #1 (Public review):
[Editors' note: this version has been assessed by the Reviewing Editor without further input from the original reviewers. The authors have addressed the comments raised in the previous round of review.]
Summary:
This study addresses the important question of how top-down cognitive processes affect tactile perception in autism - specifically, in the Fmr1-/y genetic mouse model of autism. Using a 2AFC tactile task in behaving mice, the study investigated multiple aspects of perceptual processing, including perceptual learning, stimulus categorization and discrimination, as well as the influence of prior experience and attention.
Strengths:
The experiments seem well performed, with interesting results. Thus, this study can/will advance our understanding of atypical tactile perception and its relation to cognitive factors in autism.
Reviewer #2 (Public review):
Summary:
This manuscript presents a tactile categorization task in head-fixed mice to test whether Fmr1 knockout mice display differences in vibrotactile discrimination using the forepaw. Tactile discrimination differences have been previously observed in humans with Fragile X Syndrome, autistic individuals, as well as mice with loss of Fmr1 across multiple studies. The authors show that during training, Fmr1 mutant mice display subtle deficits in perceptual learning of "low salience" stimuli, but not "high salience" stimuli, during the task. Following training, Fmr1 mutant mice displayed an enhanced tactile sensitivity under low-salience conditions but not high-salience stimulus conditions. The authors suggest that, under 'high cognitive load' conditions, Fmr1 mutant mouse performance during the lowest indentation stimuli presentations was affected, proposing an interplay of sensory and cognitive system disruptions that dynamically affect behavioral performance during the task.
Strengths:
The study employs a well-controlled vibrotactile discrimination task for head-fixed mice, which could serve as a platform for future mechanistic investigations. By examining performance across both training stages and stimulus "salience/difficulty" levels, the study provides a more nuanced view of how tactile processing deficits may emerge under different cognitive and sensory demands.
Weaknesses:
The study is primarily descriptive. The authors collect behavioral data and fit simple psychometric functions, but provide no neural recordings, causal manipulations, or computational modeling. Without mechanistic evidence, the conclusions remain speculative.
Reviewer #3 (Public review):
Summary:
Developing consistent and reliable biomarkers is critically important for developing new pharmacological therapies in autism spectrum disorders (ASDs). Altered sensory perception is one of the hallmarks of autism and has been recently added to DSM-5 as one of the core symptoms of autism. Touch is one of the fundamental sensory modalities, yet it is currently understudied. Furthermore, there seems to be a discrepancy between different studies from different groups focusing on tactile discrimination. It is not clear if this discrepancy can be explained by different experimental setups, inconsistent terminology, or the heterogeneity of sensory processing alterations in ASDs. The authors aim to investigate the interplay between tactile discrimination and cognitive processes during perceptual decisions. They have developed a forepaw-based 2-alternative choice task for mice and investigated tactile perception and learning in Fmr1-/y mice
Strengths:
There are several strengths of this task: translational relevance to human psychophysical protocols, including controlled vibrotactile stimulation. In addition to the experimental setup, there are also several interesting findings: Fmr1-/y mice demonstrated choice consistency bias, which may result in impaired perceptual learning, and enhanced tactile discrimination in low-salience conditions, as well as attentional deficits with increased cognitive load. The increase in the error rates for low salience stimuli is interesting. These observations, together with the behavioral design, may have a promising translational potential and, if confirmed in humans, may be potentially used as biomarkers in ASD.
Author response:
The following is the authors’ response to the original reviews.
eLife Assessment
This study provides valuable insights with solid evidence into altered tactile perception in a mouse model of ASD (Fmr1 mice), paralleling sensory abnormalities in Fragile X and autism. Its main strength lies in the use of a novel tactile categorization task and the careful dissection of behavioral performance across training and difficulty levels, suggesting that deficits may stem from an interaction between sensory and cognitive processes. However, while the experiments are well executed, the reported effects are subtle and sometimes non-significant. The interpretation of results may be overextended given the nature of the data (solely behavioral), the reliance on repeated d′ measures may obfuscate some of the results without clearer psychometric or regressionbased analyses, and the absence of mechanistic, causal, or computational approaches limits the strength of the broader conclusions. The work will be relevant to those interested in autism, cognition, and/or sensory processing.
We thank the editors for their positive assessment of the data quality and the novelty of our behavioral task, and for pointing out the limitations inherent in behavioral studies.
We would like to clarify one important point regarding the use of d′ measures. While d′ was included to quantify sensitivity, our conclusions are not based solely on repeated d′ measures. In addition to d′, we analyzed raw behavioral data (correct and incorrect choice rates), and categorization performance was assessed using psychometric curves fitted with logistic regression models. These complementary analyses provide converging evidence and ensure that our interpretations are supported by multiple robust measures.
In the revised manuscript, we have further strengthened the analyses by including additional regression-based assessments, reporting effect sizes for subtle effects, and refining the statistical methods for clarity and transparency.
We fully acknowledge that this work is behavioral and does not directly reveal the underlying neural mechanisms. Nonetheless, the translational framework we have developed establishes a robust foundation for future studies. This platform can be directly applied in clinical research on autism and other neuropsychiatric conditions involving sensory-cognitive interactions, and provides a solid basis for subsequent mechanistic, causal, or computational investigations to uncover the neural circuits mediating these effects.
We greatly appreciate the editors’ and reviewers’ guidance and believe the revisions have clarified and strengthened the manuscript.
Public Reviews:
Reviewer #1 (Public review):
Summary:
This study addresses the important question of how top-down cognitive processes affect tactile perception in autism - specifically, in the Fmr1-/y genetic mouse model of autism. Using a 2AFC tactile task in behaving mice, the study investigated multiple aspects of perceptual processing, including perceptual learning, stimulus categorization and discrimination, as well as the influence of prior experience and attention.
We appreciate the reviewer’s statement highlighting the importance of our study.
Strengths:
The experiments seem well performed, with interesting results. Thus, this study can/will advance our understanding of atypical tactile perception and its relation to cognitive factors in autism.
We thank the reviewer for recognizing the quality of our experiments and the relevance of our findings for understanding tactile perception and cognition in autism.
Weaknesses:
Certain aspects of the analyses (and therefore the results) are unclear, which makes the manuscript difficult to understand. Clearer presentation, with the addition of more standard psychometric analyses, and/or other useful models (like logistic regression) would improve this aspect. The use of d' needs better explanation, both in terms of how and why these analyses are appropriate (and perhaps it should be applied for more specific needs rather than as a ubiquitous measure).
We thank the reviewer for these constructive comments. We acknowledge that aspects of the analyses were previously difficult to follow, and we have reworked the Results section to improve clarity and transparency.
We would like to emphasize that all d′ measures are complemented by analyses of raw response rates (correct and incorrect choices), ensuring that our interpretations are not solely dependent on this metric. In addition, we applied standard psychometric analyses wherever possible. For the training phase, only two stimulus amplitudes were presented, which precluded the construction of full psychometric curves; however, for the categorization phase, psychometric analyses were feasible and are reported in Figure 3. Specifically, psychometric functions were fitted to the data using logistic regression, allowing us to estimate both categorization bias (threshold) and precision (slope) across stimulus intensities. These analyses revealed no evidence of categorization bias or precision in Fmr1<sup>-/y</sup> mice across stimulus strengths.
Following the reviewer’s suggestion, we have also added general linear model analyses that account for trial history, providing a complementary perspective on decision-making dynamics. Finally, while the calculation of d′ is detailed in the Methods, we have revised the Results to clearly explain its use and appropriateness in each relevant analysis.
These revisions aim to provide a clearer, more comprehensive picture of the data while ensuring that all conclusions are supported by multiple complementary measures.
Reviewer #2 (Public review):
Summary:
This manuscript presents a tactile categorization task in head-fixed mice to test whether Fmr1 knockout mice display differences in vibrotactile discrimination using the forepaw. Tactile discrimination differences have been previously observed in humans with Fragile X Syndrome, autistic individuals, as well as mice with loss of Fmr1 across multiple studies. The authors show that during training, Fmr1 mutant mice display subtle deficits in perceptual learning of "low salience" stimuli, but not "high salience" stimuli, during the task. Following training, Fmr1 mutant mice displayed an enhanced tactile sensitivity under low-salience conditions but not high-salience stimulus conditions. The authors suggest that, under 'high cognitive load' conditions, Fmr1 mutant mouse performance during the lowest indentation stimuli presentations was affected, proposing an interplay of sensory and cognitive system disruptions that dynamically affect behavioral performance during the task.
Strengths:
The study employs a well-controlled vibrotactile discrimination task for head-fixed mice, which could serve as a platform for future mechanistic investigations. By examining performance across both training stages and stimulus "salience/difficulty" levels, the study provides a more nuanced view of how tactile processing deficits may emerge under different cognitive and sensory demands.
We thank the reviewer for emphasizing the strengths of our task design and analysis approach, and we appreciate that the potential of this platform for future mechanistic investigations is recognized.
Weaknesses:
The study is primarily descriptive. The authors collect behavioral data and fit simple psychometric functions, but provide no neural recordings, causal manipulations, or computational modeling. Without mechanistic evidence, the conclusions remain speculative.
We thank the reviewer for the careful reading of our manuscript and for these constructive comments. We agree that our study is purely behavioral, and we appreciate the opportunity to clarify the scope and interpretation of our findings. The primary goal of this work was to characterize behavioral patterns during tactile discrimination and categorization in a translationally relevant mouse model of autism.
Although we did not include direct neural recordings, causal manipulations, or computational modeling, our analyses combining choice behavior, sensitivity measures from signal detection theory, psychometric curves, and regression-based models of trial history provide a detailed and robust characterization of perceptual learning, stimulus discrimination, categorization, and the interplay of cognitive processes with tactile perception. The manuscript has been revised to explicitly state that our conclusions are behavioral, emphasizing that this work establishes a foundation for future studies aimed at elucidating the neural and circuit mechanisms underlying these sensory–cognitive interactions.
Second, the authors repeatedly make strong claims about "categorical priors," "attention deficits," and "choice biases," but these constructs are inferred indirectly from secondary behavioral measures. Many of the effects are based on non-significant trends, and alternative explanations (such as differences in motivation, fatigue, satiety, stereotyped licking, and/or reward valuation) are not considered.
Alternative explanations for our findings including differences in motivation, fatigue, satiety, stereotyped licking, or reward valuation were carefully considered. As described in the Methods, only testing sessions with >70% correct performance on the training stimuli (12 µm and 26 µm) were included, excluding sessions with reduced motivation, fatigue, satiety, or stereotyped licking that could confound performance on low- or high-salience stimuli.
Although differences in reward valuation could affect learning speed, we observed no genotype differences in training duration (Fig. 1B-D, Fig. S1C-D). Sessions with disengagement were analyzed only during epochs of active task performance (information added to the revised Methods section, lines 619-620). Reward-driven choice biases were unlikely, as no genotype differences were observed in categorization bias (Fig. 3F) and GLM analyses confirmed that previous reward outcome did not affect current choices (Fig. 4D).
Finally, altered reward valuation could increase miss rates. Elevated miss rates in Fmr1<sup>-/y</sup> mice were restricted to the lowest-intensity stimulus (12 µm) under high cognitive load, demonstrating a salience- and context-specific effect inconsistent with generalized motivational or reward deficits. The Discussion has been updated to clarify these points and delimit the scope of our interpretations (lines 483-499).
Third, the mapping of the behavioral results onto high-level cognitive constructs is tenuous and overstated. The authors' interpretations suggest that they directly tested cognitive theories such as Load Theory, Adaptive Resonance Theory, or Weak Central Coherence. However, the experiments do not manipulate or measure variables that would allow such theories to be tested. More specific comments are included below.
This was not done intentionally. References to Load Theory were meant to provide conceptual inspiration for assessing attention in high cognitive load conditions during categorization, rather than to indicate a formal test. Moreover, we do not claim to have tested the Weak Central Coherence theory, although our results suggest reduced facilitation of across- category discrimination. Finally, we agree that citing Adaptive Resonance Theory, which is grounded in artificial neural network models, could be misleading, and we have revised the text accordingly.
(1) The authors employ a two-choice behavioral task to assess forepaw tactile sensitivity in Fmr1 knockout mice. The data provide an interesting behavioral observation, but it is a descriptive study. Without mechanistic experiments, it is difficult to draw any conclusions, especially regarding top-down or bottom-up pathway dysfunctions. While the task design is elegant, the data remain correlational and do not advance our mechanistic understanding of Fmr1-related sensory and/or cognitive alterations.
We thank the reviewer for this comment and agree that our study is purely behavioral and does not provide direct mechanistic evidence for top-down pathway dysfunction. In the first version of the manuscript, the term “top-down” was used at the behavioral level, referring to the influence of higher-order cognitive processes (e.g., categorization, attention, sensory and choice history integration) on tactile perception, rather than to imply specific neural circuits.
We acknowledge that identifying the neural pathways underlying these effects would require extensive mechanistic experiments, including identifying the specific top-down pathway that modulates the influence of categorization on discrimination without directly altering categorization itself and performing pathway-specific recordings and manipulations. Such work represents a substantial mechanistic research program beyond the scope of the present study.
To clarify that our study does not provide insights into the neural underpinnings of the studied behavioral processes, we have revised the manuscript, removing the term “top-down” or replacing it with “higher-order processes” where appropriate. We also explicitly noted that future work using neural recordings or causal manipulations will be needed to uncover the neural underpinnings of these behavioral phenomena (lines 508-510).
(2) The conclusions hinge on speculative inferences about "reduced top-down categorization influence" or "choice consistency bias," but no neural, circuit-level, or causal manipulations (e.g., optogenetics, pharmacology, targeted lesions, modeling) are used to support these claims. Without mechanistic data, the translational impact is limited.
We recognize that terms such as “reduced top-down categorization influence” and “choice consistency bias” are derived from behavioral observations. However, we respectfully note that these behavioral inferences are widely used in clinical studies to characterize cognitive tendencies (Soulières et al., 2007; Feigin et al., 2021) and are not inherently speculative.
The translational impact of our work lies in the development of a robust behavioral platform that allows precise dissection of tactile perception and cognitive influences in a manner directly comparable to clinical studies. While we agree that neural, circuit-level, or causal manipulations would provide valuable mechanistic insight, the current study establishes a foundational behavioral framework that can guide and inform future investigations into the underlying neurobiological substrates.
To ensure clarity, we have revised the manuscript throughout to explicitly indicate that all conclusions are based on behavioral measures and do not imply mechanistic evidence.
(3) Statistical analysis:
(a) Several central claims are based on "trends" rather than statistically significant effects (e.g., reduced task sensitivity, reduced across-category facilitation). Building major interpretive arguments on non-significant findings undermines confidence in the conclusions.
We chose to present both statistically significant effects and trends to ensure transparency and to highlight that commonly used aggregate measures, such as d′, can sometimes obscure meaningful underlying patterns. In the text, p-values between 0.05 and 0.1 are described as trends without over-interpreting their significance. To further support interpretation, we have now computed effect sizes (Hedges’ g) for all subtle effects. In the revised manuscript, all interpretations of non-significant effects have been reworded to avoid overstatement.
(b) The n number for both genotypes should be increased. In several experiments (e.g., Figure 1D, 2E), one animal appears to be an outlier. Considering the subtle differences between genotypes, such an outlier could affect the statistical results and subsequent interpretations.
The number of mice used per genotype is consistent with standard practices in behavioral studies of sensory processing. To complement statistical analyses and account for small sample sizes, we have calculated effect sizes (Hedges’ g) for all subtle or trend-level effects (p ≈ 0.05–0.1), providing a measure of effect magnitude independent of sample size.
As the reviewer correctly noted, no animals were excluded as outliers, since observed variability reflects true biological differences rather than experimental or technical errors. In the revised manuscript, we re-examined all datasets for potential outliers, and when identified, analyses were performed both with and without the data point. Any results sensitive to single animals are explicitly reported. This procedure is now detailed in the Methods section (lines 675-679).
(c) The large number of comparisons across salience levels, categories, and trial histories raises concern for false positives. The manuscript does not clearly state how multiple comparisons were controlled.
We thank the reviewer for highlighting this important point. To control for false positives arising from multiple comparisons, we applied the Bonferroni correction. This information has been added to the Methods section (line 682) to ensure transparency and reproducibility of all statistical tests.
(d) The data in Figure 5, shown as separate panels per indentation value, are analyzed separately as t-tests or Mann-Whitney tests. However, individual comparisons are inappropriate for this type of data, as these are repeated stimulus applications across a given session. The data should be analyzed together and post-hoc comparisons reported. Given the very subtle difference in miss rates across control and mutant mice for 'low-salience' stimulus trials, this is unlikely to be a statistically meaningful difference when analyzed using a more appropriate test.
We thank the reviewer for raising this point, as this was not done intentionally. In the revised manuscript, miss rates for high- and low-salience stimuli were reanalyzed using a mixedeffects linear model, which appropriately accounts for repeated measurements within sessions (Fig. 5; Results section: lines 320-340). This analysis confirmed that Fmr1<sup>-/y</sup> mice exhibit increased miss rates specifically at the 12 µm amplitude, with the effect disappearing at higher low-salience amplitudes (18 µm). Post-hoc comparisons with Bonferroni correction revealed a strong trend for increased misses at 12 µm (T-test: t = -2.8437, p = 0.058, Hedge’s g = 1.23), while no significant differences were found at other amplitudes. The Methods section has been updated to detail this statistical approach for analyzing miss rates (lines 686687).
(4) Emphasis on theoretical models:
The paper leans heavily on theories such as Adaptive Resonance Theory, Load Theory of Attention, and Weak Central Coherence, but the data do not actually test these frameworks in a rigorous way. The discussion should be reframed to highlight the potential relevance of these frameworks while acknowledging that the current data do not allow them to be assessed.
As mentioned above, our goal was not to directly test theoretical frameworks such as Adaptive Resonance Theory, Load Theory of Attention, or Weak Central Coherence, but rather to provide a context for interpreting our behavioral findings. In the revised manuscript, we have removed references to the Load Theory from the Results section and reframed the Discussion to emphasize that our results are consistent with certain predictions from these cognitive theories, without implying that the experiments directly assessed them. This clarifies that the interpretations are based on observed behavioral patterns, while still acknowledging the potential relevance of these frameworks to better understand tactile perception and cognition in autism.
Reviewer #3 (Public review):
Summary:
Developing consistent and reliable biomarkers is critically important for developing new pharmacological therapies in autism spectrum disorders (ASDs). Altered sensory perception is one of the hallmarks of autism and has been recently added to DSM-5 as one of the core symptoms of autism. Touch is one of the fundamental sensory modalities, yet it is currently understudied. Furthermore, there seems to be a discrepancy between different studies from different groups focusing on tactile discrimination. It is not clear if this discrepancy can be explained by different experimental setups, inconsistent terminology, or the heterogeneity of sensory processing alterations in ASDs. The authors aim to investigate the interplay between tactile discrimination and cognitive processes during perceptual decisions. They have developed a forepaw-based 2-alternative choice task for mice and investigated tactile perception and learning in Fmr1-/y mice.
Strengths:
There are several strengths of this task: translational relevance to human psychophysical protocols, including controlled vibrotactile stimulation. In addition to the experimental setup, there are also several interesting findings: Fmr1-/y mice demonstrated choice consistency bias, which may result in impaired perceptual learning, and enhanced tactile discrimination in low-salience conditions, as well as attentional deficits with increased cognitive load. The increase in the error rates for low salience stimuli is interesting. These observations, together with the behavioral design, may have a promising translational potential and, if confirmed in humans, may be potentially used as biomarkers in ASD.
We appreciate the reviewer’s positive assessment regarding our study’s translational value and the importance of our behavioral findings.
Weaknesses:
Some weaknesses are related to the lack of the original raster plots and density plots of licks under different conditions, learning rate vs time, and evaluation of the learning rate at different stages of learning. Overall, these data would help to answer the question of whether there are differences in learning strategies or neural circuit compensation in Fmr1-/y mice. It is also not clear if reversal learning is impaired in Fmr1-/y mice.
We thank the reviewer for these helpful suggestions. We agree that visualizing behavioral patterns, such as raster and density plots of licks, as well as learning rate over time, provides additional insights into learning dynamics. In response, we have added these analyses to the revised manuscript (Fig. S1, Fig. S2), which illustrate both individual and group-level learning trajectories and trial-by-trial licking patterns.
There was no assessment of reversal learning in Fmr1<sup>-/y</sup> mice in this study. While this is an interesting and important question, and is motivated by previous preclinical and clinical findings, it falls outside the scope of the current manuscript.
Recommendations for the authors:
Reviewer #1 (Recommendations for the authors):
Main Comments
(1) This study addresses the important question of how top-down cognitive processes affect tactile perception in autism - specifically, in the Fmr1-/y genetic mouse model of autism vs. WT controls. Using a 2AFC tactile task in behaving mice, the study investigated multiple aspects of perceptual processing, including perceptual learning, stimulus categorization and discrimination, as well as the influence of prior experience and attention. The experiments seem well performed, with interesting results. I found certain aspects of the analysis not clearly explained, which made it difficult at times to understand.
Please see specific details in the comments below.
(2) To measure sensitivity, the authors present many comparisons of d' - sometimes between pairs of stimuli (or sometimes even for a single stimulus level).
(a) Firstly, the calculation of d' for a single stimulus value is unclear (because the same proportion of high/low choices for a given stimulus can result from shifts in bias/criterion).
We agree with the reviewer that calculating d′ for a single stimulus conflates sensitivity with response bias/criterion differences. For this reason, the panels showing d′ for individual stimulus amplitudes during training (Fig. 1F and 1G in the original manuscript) have been removed from the manuscript.
In addition, we revised our d’ (Fig. 1E) and criterion calculations (Fig. 2A), treating the high amplitude stimuli as “signal” and low amplitude stimuli as “noise”, based on the Signal Detection Theory. The formulas used in the revised manuscript take into account correct responses during high amplitude stimuli and wrong responses during low amplitude stimuli to calculate the sensitivity and bias of the mice during discrimination in the training period.
Sensitivity (d′) is now computed as:
d' = z(lick right|high amplitude stimulus) - z(lick right|low amplitude stimulus)
and the criterion (c) as:
c = −1/2 × [z(lick right / high amplitude) + z(lick right / low amplitude)]
(b) Secondly, while calculating d' makes sense for comparing two stimulus levels (like in the training condition), in the test condition (with a spread of stimuli), this becomes a little tedious - at times difficult to follow and unclear.
I would have thought that sensitivity (at least for overall performance) would be better compared using data from all the stimuli - e.g. either using:
(i) the sigma of the psychometric curve (although the downside of that approach is that it ignores history effects), or
(ii) a logistic regression for the choices, given the stimuli, where the weights assigned to the stimulus magnitude indicate sensitivity (the advantage of that approach is that history effects, like the previous trials/choices can be used as regressors in the model). Accordingly, it can simultaneously also quantify the history effects. This could even be expanded to a GLMM (mixed effects for different mice).
We thank the reviewer for this very valuable feedback. Indeed, during the testing phase, we calculated sensitivity d’ to probe the overall categorization sensitivity (Fig. 3H).
(i) This analysis was only complementary to the psychometric curves (fitted on the rightward lick rate for each stimulus amplitude using a general linear model – Fig. 3A). As the reviewer proposes, we had calculated the sigma of the psychometric curve (Fig. 3G, slope) to assess categorization precision. Sensitivity calculations have also now been revised using the aforementioned formula (d' = z(lick right|high amplitude stimulus) - z(lick right|low amplitude stimulus).
(ii) To incorporate history effects, we implemented generalized linear models (GLMs) with a binomial link function to predict high-salience licks (right-lick choices) based on the current stimulus, trial history, genotype, and their interactions. A main-effects model included current stimulus, previous stimulus, previous outcome, previous choice, and genotype, followed by interaction terms to assess genotype-specific modulation of history effects. These analyses are now presented in the new Figure 6.
The resulting coefficients are shown in Fig. 6A. As expected, decisions were primarily driven by current stimulus amplitude (Fig. 6A, B). Both genotypes displayed a tendency to repeat previous choices (Fig. 6A, C), while previous reward outcomes did not influence current choice (Fig. 6A, D). Notably, stimulus amplitude history showed genotype-specific effects: WT mice were negatively influenced by the previous stimulus, whereas Fmr1<sup>-/y</sup> mice remained unaffected (Fig. 6A, E).
To clearly visualize these findings, we plotted psychometric curves and marginal effects accounting for current stimulus, previous choice, previous outcome, and previous stimulus (Fig. 6B-E). These analyses are now fully integrated into the Methods (lines 688-702), Results (Fig. 6, lines 341-369), and Discussion (lines 469-479) sections of the revised manuscript.
(3) I find some of the terminology used confusing/misleading:
(a)The term "Categorization thresholds" can be misleading - in psychometric curves, "thresholds" often refer to the sigma (SD) of the fitted curve used to measure sensitivity (inversely related). Here, I think that the meaning is in terms of the PSE/ criterion. Perhaps the terminology can be improved to prevent confusion on this matter. E.g., I think that here the authors mean a measure of bias/criterion/PSE or similar. Correct? Not really a perceptual "threshold".
We thank the reviewer for pointing this out. In our analysis, the term “threshold” referred to the inflection point (i.e., the midpoint parameter μ) of the fitted logistic psychometric function used to categorize high- versus low-amplitude stimuli. We termed it “threshold” in the categorization of high and low amplitude stimuli. We agree with the reviewer that we could also use the term “Categorization bias”. We originally opted to avoid this term, not to confuse the readers when referring to the criterion (signal detection theory) as “response bias”. However, seeing as the term “threshold” may be confusing as well, we adopted the term “Categorization bias” in the updated version of the manuscript (lines 282, 284, 637-638, 785, Fig. 3F).
(b) Similarly, I think that "Categorization accuracy" can be misleading when describing the slope of the psychometric curve. Performance could have a steep slope but still be quite inaccurate (e.g., if there is a big bias). Perhaps "precision" is a better description of the slope?
We thank the reviewer for this suggestion. The slope of the psychometric curve is often referred to as “sensitivity” in the literature (Carandini and Churchland, 2014), but in our original manuscript we used the term “accuracy” to avoid confusion with the d′ measure from signal detection theory. We have revised the manuscript and Figures with the term “precision” as the reviewer suggested (lines 282, 284, 637-638, 786, Fig. 3G).
Minor Comments
(1) Abstract: "determines how autistic individuals engage" - there are other factors too. So, I think that "determines" is a little strong. Perhaps "influences" is more appropriate.
We have incorporated the reviewer’s suggestion (line 7).
(2) Figure 1 F, G. On the one hand, d' is defined as "sensitivity (d') in discriminating between high- and low-salience stimuli" - that seems to make sense. But then d' is also calculated and presented for each salience level on its own. How was this done? Namely, percent correct (or proportion of choices high/low salience) could be affected by criterion shifts as well as sensitivity. This makes calculating the d' for a single (low or high) salience stimulus ambiguous. So, how do these authors make this conclusion?
We agree that calculating d′ for a single stimulus amplitude is ambiguous, because the resulting value conflates true stimulus sensitivity with shifts in response bias or criterion. Consequently, all analyses and figures reporting d′ for individual high- or low-salience stimuli (e.g., Figures 1F and 1G) have been removed from the revised manuscript.
In the updated analyses, d′ is calculated only across high- versus low-salience stimuli, following standard Signal Detection Theory procedures, ensuring that it reflects true discriminability between the two categories (Methods, line 631; Figure 1E).
(3) "Our results showed comparable correct choice rates in Fmr1-/y and WT mice (Fig. 1H), for both high- and low-salience stimuli (Fig. S1C-D). In contrast, Fmr1-/y mice presented a significantly higher rate of incorrect choices (Fig. 1I)." - aren't correct choices and incorrect choices complementary (i.e., 1-x) in a 2AFC? How is this possible?
We thank the reviewer for pointing this out. Correct and incorrect choices are complementary at the single-trial level if miss trials are excluded. However, in our analyses, correct and incorrect choice rates were calculated by normalizing the number of correct or incorrect responses to the total number of trials (including misses), which breaks this complementarity and contributes to the differences observed in Fig. 1H–I. This was clarified in the Methods section (lines 616-617). Moreover, incorrect responses were less frequent than correct ones and are thought to reflect lapses, response bias, and impulsive responding rather than sensory performance, making them more sensitive to genotype-dependent differences in behavioral control. Based on this concept, we further examined whether incorrect choices were preferentially associated with specific stimulus amplitudes and assessed response bias and prior effects.
(4) The conclusion that "they showed a strong trend toward reduced sensitivity for lowsalience stimuli (Fig. 1G)" has a confound - it could be that there was a criterion shift (rather than differences in sensitivity)?
We agree with the reviewer that the previously reported trend in sensitivity for low-salience stimuli could reflect a criterion shift rather than true differences in sensory sensitivity. Because sensitivity estimates for individual stimulus amplitudes are not well-defined in a 2AFC framework, we have removed the sensitivity calculations for high- and low-salience stimuli considered independently. Instead, we now present salience-specific differences using correct and incorrect response rates for each stimulus amplitude, which more directly capture performance differences without assuming changes in sensory sensitivity (Fig. 1G-I, S1E-F).
(5) Figure 3D, E - I stumbled over this in comparison to Figure 3B, C. That is because (a) In D and E, the authors compare right-lick responses (reporting high salience) to stimuli of 12 μm and 14 μm amplitude (Figure 3D) and low-salience lick rates for the same (Figure 3E). I would have thought that these approaches are simply complementary (1-x) - see related minor question above/below. So, what is the advantage of presenting them both?
We presented both panels to clarify the source of the observed differences in performance. Specifically, showing right-lick responses (reporting high-salience choices) alongside low salience lick rates allows us to distinguish whether reduced high-salience reporting arises from an actual shift in choice (e.g., increased leftward licking) versus an increase in miss trials at the lowest amplitude (12 µm). By presenting both, we can demonstrate that the effect is primarily driven by an increase in leftward choices rather than by missed responses, providing a more precise interpretation of behavioral changes. The complementary analysis for leftward choices has now been moved to the supplemental material (Fig. S5A) and the reason for this analysis has been clarified in the Results (lines 275-276).
(b) In B and C, the authors compare two differences in stimulus magnitude (2 and 4 μm), but in Figure 3D and E, only one difference (2 μm) from two perspectives. I was expecting a comparison with stimuli differing by 4 μm in amplitude (comparable to the high stimulus comparison of 26 μm vs. 22 μm stimuli).
We have indeed analyzed the 12 μm versus 16 μm stimulus pair, which corresponds to a 4 μm difference and is reliably discriminated by both genotypes. In the original manuscript, we did not include this comparison because of the differences already seen at a 2 μm amplitude difference. Based on the reviewer’s suggestion, we have now included the 12 μm vs. 16 μm comparison in the revised manuscript (Results, lines 270-272; Fig. 3E) to provide a complementary perspective consistent with the high-salience comparisons (26 μm vs. 22 μm).
(c) "Sensitivity d' for high- and low-salience stimuli was calculated based on the Correct and Incorrect choice rate for high- and low-salience stimuli respectively." How were trials for which the animal did not respond taken into account? Were these part of the denominator? Or were these excluded when calculating proportions? (related to the Q regarding Figure 3 D,E above).
Indeed, the Miss trials were part of the denominator. This is now clarified in the Methods section (line 631).
(d) "c = d'(high)- d'(low)." - I did not understand this fully. There were several high and several slow stimuli - so how were these calculated? Pooled for high and pooled for low? Per stimulus difference?
This was indeed calculated for pooled high and low amplitudes during testing. In the revised manuscript, criterion c has been recalculated based on the average correct high rate (for stimuli of 20-26 µm amplitude) and average incorrect low rate (for stimuli of 12-18 µm amplitude), using the same formula as in the analysis of the training dataset:
c = −1/2 × [z(lick right / high amplitude) + z(lick right / low amplitude)]
Pooling across amplitudes allows us to obtain a single summary measure of response bias toward the right lickport, independent of stimulus discriminability. This approach is consistent with standard signal detection theory practices when multiple stimulus levels are present.
If the inter-trial interval is 5-10s, how is a 5s timeout a punishment?
The 5 s timeout serves as a punishment by temporarily delaying access to the next trial and potential reward, thereby reducing the overall reward rate. Even though the inter-trial interval (ITI) varies between 5 and 10 s, the timeout increases the effective delay before the next opportunity to earn a reward, discouraging incorrect responses. This is consistent with standard operant conditioning procedures, where brief timeouts act as negative consequences without being overly severe. Across most trials, the timeout effectively reduces expected reward rate, though its impact is minimal when the ITI is already long.
Reviewer #2 (Recommendations for the authors):
Task-related questions:
(1) What evidence is there that the 40 Hz, 12 μm stimulus is "low salience: while the 40 Hz, 26 μm stimulus is "high salience"? This seems like an arbitrary distinction without showing sensitivity curves across a group of animals. Better definitions of the stimuli and the actual forces applied are necessary.
We thank the reviewer for this comment. Based on our previous work (Semelidou et al., bioRxiv; Accepted in Advanced Science), both the 40 Hz, 12 µm and 40 Hz, 26 µm stimuli are clearly suprathreshold. In the present study, however, stimulus salience is defined in a relative and operational manner within this suprathreshold range.
Specifically, analysis of miss trials (Fig. S3E) shows that the 40 Hz, 12 μm stimulus consistently elicited a higher proportion of missed responses compared to the 40 Hz, 26 μm stimulus across animals, indicating lower behavioral performance for the lower-amplitude stimulus. We therefore refer to the 12 μm stimulus as “low salience” and the 26 μm stimulus as “high salience” to denote relative differences in perceptual strength and attentional engagement within the suprathreshold range, rather than differences in detectability or absolute sensory sensitivity. This definition has been clarified in the Methods (lines 583-587) and Results sections (lines 115-119; lines 225-227).
(2) Sensitivity curves/detection thresholds for each mouse should be included in the study.
We thank the reviewer for this suggestion. Sensitivity curves and detection thresholds for low-amplitude and low-frequency vibrotactile forepaw stimulation have been systematically characterized in our previous study (Semelidou et al., bioRxiv, Accepted in Advanced Science). In that work, we demonstrated that stimuli with similar amplitudes and even lower frequency (10Hz) than those used in the present study are reliably detectable by mice, confirming that both the 40 Hz, 12 µm and 40 Hz, 26 µm stimuli fall within the suprathreshold range.
Because the goal of the present study was not to determine absolute detection thresholds but rather to examine discrimination and categorization performance within a suprathreshold range, we did not re-establish full psychometric detection curves for each mouse.
We have clarified this rationale in the revised manuscript (Results, lines 108-113; Methods, lines: 577-579).
(3) What force is being applied during stimulus presentations? 12 or 26 μm does not provide enough information about the stimuli applied. What are the physical parameters of the indenter? What material, what tip size?
Vibrotactile stimuli were delivered to the forepaw via a piezoelectric actuator. A 12.7 mm stainless steel post (ThorLabs) was mounted on the actuator vertically and a 0.6 mm stainless steel rod (ThorLabs) was clamped horizontally onto this post. The horizontal rod served as the contact bar on which the animal rested its right forepaw.
Stimuli were sinusoidal vibrations at 40 Hz with peak-to-peak displacements of 12 μm (low salience) or 26 μm (high salience). The actuator displacement was calibrated prior to experiments to ensure accurate vibration amplitudes.
Animals were positioned in the setup to ensure stable and consistent forepaw contact with the rod delivering the vibration. Pilot experiments with an extra sensor to monitor forepaw placement confirmed that the mice did not remove their forepaws from the bar before stimulus delivery. All this information is now added in the Methods section (lines 552-555, 580-582).
(4) Only one vibration stimulus was used (40 Hz) - this preferentially activates specific subsets of low-threshold mechanoreceptors and not others. A range of vibrotactile stimuli (with varying frequencies) would be more useful. From this limited range of stimuli, it is difficult to assess whether the findings would extrapolate to other types of stimuli.
We agree that using a single vibration frequency limits the generalization of our findings across the full range of mechanoreceptor subtypes and vibrotactile stimulus conditions. In the present study, we deliberately focused on amplitude discrimination within the flutter range (<50 Hz), as this frequency preferentially activates subsets of low-threshold mechanoreceptors relevant for flutter perception and is commonly used in clinical studies of tactile amplitude discrimination (Puts et al., 2014, 2017; Asaridou et al., 2022). By holding frequency constant and varying only amplitude, we were able to isolate amplitude-dependent perceptual and decision-making processes while minimizing frequency-dependent variability and to facilitate direct translational comparisons with human studies using similar flutter stimuli.
We acknowledge, however, that extending the paradigm to additional, high frequencies would help determine whether the observed effects generalize across mechanoreceptor channels. We have now added this point as a future direction in the Discussion section (lines 510-514).
(5) The methods indicate that during the implementation of the water-restriction protocol, mice had access to a solid water supplement in their home cage. How did they control for how much water supplement was consumed by each mouse before the testing sessions?
We thank the reviewer for raising this point. The solid water supplement was divided into premeasured individual portions, and each mouse received its allotted amount only after the daily training/testing session. Daily body weight measurements were used to monitor hydration and ensure that all animals maintained stable body weight. If necessary, supplemental water was adjusted to maintain animals within the approved weight range. This procedure is now described in the Methods section (line 567-571).
(6) A control version of the test, perhaps using a different sensory modality, would be useful for making conclusions.
We agree that testing other sensory modalities would provide a useful control for assessing the generalizability of the observed effects. However, in the present study, we intentionally focused on the tactile modality, as touch has been shown to play a critical role in autism across sexes and predict other core behavioral symptoms. This makes touch particularly relevant for investigating translational mechanisms in this model.
By specifically targeting tactile perception, we aimed to investigate the link between sensory discrimination, decision-making, and cognitive modulation within a modality that is strongly implicated in autism. Previous studies in autistic individuals have demonstrated similar interactions between cognitive processes and perceptual decision-making in the visual domain, suggesting that such effects may not be modality-specific. Nevertheless, extending this paradigm to additional sensory systems would be valuable to directly test whether comparable cognitive influences on perception generalize across modalities. We have now incorporated this perspective as a future direction in the Discussion section (lines 514-518).
Reviewer #3 (Recommendations for the authors):
There are several questions:
(1) It is important to show stimulus intensity-response curves representing tactile responses for both WT and Fmr1-/y mice.
We thank the reviewer for this important comment. Detection sensitivity curves for lowamplitude and low-frequency vibrotactile stimulation of the forepaw have been characterized in detail in our previous study (Semelidou et al., bioRxiv; now accepted in Advanced Science). In that work, we showed that stimuli at or above 8 µm amplitude and 10Hz frequency are reliably detected by both WT and Fmr1<sup>-/y</sup> mice.
Based on these findings, the current study employed vibrotactile stimuli at a higher frequency (40 Hz) and amplitudes of 12 µm and above, ensuring that all stimuli were well within the suprathreshold range for both genotypes. This experimental choice was made to specifically probe discrimination, categorization, and decision-making processes, rather than basic sensory detection. As a result, the behavioral effects reported here cannot be attributed to differences in stimulus detectability.
We have clarified this rationale in the revised manuscript to make explicit that the absence of full intensity-response curves in the current study reflects a deliberate focus on suprathreshold perceptual and cognitive processes rather than sensory threshold differences (Results, lines 108-113; Methods, lines: 577-579).
(2) There is no difference in the time it takes to learn the task between WT and Fmr1-/y mice. But how does the learning rate curve look? Is there a difference in the slope between WT and Fmr1-/y early vs late into learning?
We thank the reviewer for this suggestion. To directly address whether learning dynamics differed between genotypes, we analyzed learning curves across training.
We first computed the correct choice rate per day for each animal (Fig. S2A) and fit a mixedeffects model including training day, genotype, and their interaction. This analysis revealed no genotype differences in baseline performance or learning rate with minimal Genotype × Day interaction (Fig. S2A-top, Fig. S2C).
We additionally computed the slope of the learning curve for each individual, which also showed no difference across genotypes (Fig. S2B). In addition, within-animal day-to-day performance variability was also comparable across groups (Fig. S2A-bottom, S2D).
These analyses indicate that WT and Fmr1<sup>-/y</sup> mice exhibit similar learning trajectories during training. The learning curves are now included in Figure S2, described in the Results (lines 140–151) and detailed in the Methods (lines 644-658).
(3) It would be useful to see raster plots of licks for different trials and the corresponding lick density plots for early vs late trials.
We thank the reviewer for this suggestion. To visualize trial-by-trial behavior, we included example lick traces from an early 100-trial session and a late 100-trial session, alongside the corresponding raster plots of licks (Fig. S1A–B).
(4) Consistent with the first question, examples of intermediate learning stages would help gain more insight into how both WT and Fmr1-/y mice learn.
In line with the reviewer’s suggestion, we examined whether WT and Fmr1<sup>-/y</sup> mice showed different performance during intermediate stages of learning. To this end, we defined the middle three days of the training period of each animal as the intermediate learning phase. We compared both the mean correct-choice rate and individual learning slopes across this interval. Statistical analyses revealed no significant genotype differences in either measure, indicating comparable performance and learning dynamics during the intermediate phase of training (lines 152-156).
(5) How does the learning rate change with increased cognitive load for both WT and Fmr1-/y mice?
We thank the reviewer for this question. While our experimental design did not include a manipulation of cognitive load during the learning phase itself, we assessed whether increased cognitive load affected performance by analyzing behavior on the first day of testing, when animals were required to categorize and discriminate among a larger set of stimuli compared to training.
Using performance on the training stimuli during this first testing session as a proxy, we found no significant difference between WT and Fmr1<sup>-/y</sup> mice in correct choice rate (Author response image 1). This indicates that increased cognitive load did not differentially affect performance on familiar stimuli across genotypes at this stage.
Because this analysis does not reflect learning rate per se, but rather performance under increased task demands after learning had already occurred, we did not incorporate it into the main Results section. Instead, it is presented here to directly address the reviewer’s question.
Author response image 1.
Correct choice rate for the 12 µm and 26 µm stimuli during the first day of testing when the cognitive load is high.
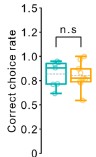
(6) How does the learning rate change if the sensory stimuli are more challenging for both WT and Fmr1-/y to detect?
We thank the reviewer for this question. In the present study, animals were deliberately trained using well-separated, suprathreshold low- and high-salience stimuli to ensure reliable stimulus detection and to avoid confounding learning rate with perceptual difficulty or discrimination limits.
A recent study (Heimburg et al., 2025) has shown that learning is slower when the difference between the two training stimuli is reduced. Based on these results, we would expect that decreasing the separation between low- and high-salience stimuli would similarly increase training duration for both WT and Fmr1<sup>-/y</sup> mice, since our results do not indicate any discrimination or categorization deficits in the mouse model of autism. However, directly testing how stimulus difficulty modulates learning rate would require a dedicated manipulation of stimulus spacing during training and was beyond the scope of the current study.
Editor's note:
Should you choose to revise your manuscript, if you have not already done so, please include full statistical reporting including exact p-values wherever possible alongside the summary statistics (test statistic and df) and, where appropriate, 95% confidence intervals.
These should be reported for all key questions and not only when the p-value is less than 0.05 in the main manuscript.
Note: This response was posted by the corresponding author to Review Commons. The content has not been altered except for formatting.
Learn more at Review Commons
__ __We thank all reviewers for the valuable feedback and critical insight on our study. We acknowledge the concern that the manuscript, in its initial form, appeared descriptive and did not provide the mechanistic insight inferred from the current data. In the revised manuscript, we will (i) more clearly delineate what mechanistic inferences can be drawn from the existing data, (ii) expand our discussion of the caspase-independent mechanisms, and (iii) incorporate additional experiments/analyses aimed at identifying downstream effectors that mediate the observed phenotypes. In this revision plan, we have included six new figures addressing some of the major issues raised by reviewers.
Summary: This study claims that beyond its canonical anti-apoptotic function, MCL-1 has essential non-apoptotic roles in human neurodevelopment. Pharmacologic inhibition of MCL-1 in human neural stem cells disrupts mitochondrial inner membrane architecture by destabilizing cristae and the OPA1-MICOS complex, leading to swollen mitochondria with disorganized cristae. These structural defects impair fatty acid oxidation and lipid droplet homeostasis, linking cristae integrity to metabolic competence. Independently of apoptosis or proliferation, MCL-1 inhibition selectively depletes intermediate neural progenitors, indicating a direct role in lineage progression. Overall, the work positions MCL-1 as a key regulator of mitochondrial structure-metabolism coupling that instructs neural progenitor identity and human neurogenesis.
Overall: The study does a good job of using (in most assays) caspase inhibition (e.g., QVD treatment) to block apoptotic responses induced by MCL-1 inhibition. As a result, many of the phenotypes caused by inhibition are likely to be independent of caspase activation. As a result, this manuscript would be of interest to researchers that study the topics of the BCL-2 family and cell death signaling, mitochondrial bioenergetics and dynamics, neurodevelopment, and cellular metabolism. However, as currently presented the manuscript is only descriptive and lacks mechanistic insight.
We thank Reviewer 1 for the insightful evaluation of our work. We are encouraged that the reviewer finds the study relevant to investigators in the fields of BCL-2 family biology, mitochondrial dynamics and bioenergetics, neurodevelopment, and cellular metabolism. We also thank the reviewer for pointing out the need to increase the mechanistic insight of our findings. As mentioned above, in the revised manuscript, we are proposing to address this.
Major Concerns:
1) The authors only use a single MCL-1 inhibitor and never use other non-targeting BH3-mimetics (such as venetoclax) as negative controls. This seems like a missed opportunity to demonstrate that the phenotypes observed are MCL-1 dependent.
This is an excellent point. We will include venetoclax (ABT-199) to examine their effect on intermediate progenitors (TBR2 +) and early born neurons (BIII tubulin +).
2) There is no mechanism proposed in this study other than reliance upon QVD as not affecting the phenotypes. As submitted, the manuscript only can speculate that these phenotypes are due to non-apoptotic roles of MCL-1 inhibition. The authors have missed an opportunity to explore MCL-1's non-apoptotic functions directly.
Mechanistically, we propose MCL-1 is acting in 2 ways: 1) as we show in our data, MCL-1 inhibition causes disruption of the mitochondrial cristae, altering the microenvironment for fatty acid oxidation, and 2) as seen in cancer cells, MCL-1 inhibitors may also displace ACSL1 from the mitochondria.
In the past few weeks, since receiving the initial reviews, we have focused on testing the 2nd possibility, since the accumulation of lipids was also seen in cancer cells (see PMID: 38503284). We have successfully generated stable ACSL1:HaloTag expressing hESCs (Figure 1A for reviewers). Our findings included here, ACSL1 is displaced from the mitochondria by MCL-1 inhibition in NPCs (Figures 1B-C for reviewers).
Other concerns exist that weaken the impact of the study.
Figure #
Volume
Surface Area
Fig 1B (MCL-1i only, avg values)
Increase (avg vol)
increase (avg)
Supp Fig 2B (MCL-1i+QVD)
no change
no change
Supp Fig 2A (MCL-1i only, max/min values)
increase (max vol)
no change (max)
For clarity, we will move Supplementary Fig 2A into Supplementary Fig 1.
Figure 2 would benefit from evidence that caspase inhibition does not repress the phenotype on mitochondrial cristae morphology (volume and area). Furthermore, the FIB-SEM data are very hard to appreciate as the size precludes visualization of individual mitochondria.
While we included the visualization of the segmented mitochondria and cristae (Figure 2C), as well as snapshots through the z-stack for segmented cristae only (Figure 2E) and segmented mitochondria separately (Supp Figure 3A) in the original manuscript, we are also now attaching the FIB-SEM 3D reconstruction videos (New Supplementary Videos 1-2 for reviewers) (1. Mito and cristae, 2. Cristae only, 3. Mito only) for ease of visualization purposes.
Figure 3 reports that MIC60 and OPA1 appear to be downregulated in response to MCL-1 inhibition, but these appear to be more significant only when QVD is added. Why would the phenotype be obscured in the non-QVD setting (Fig. 2B&C). How does MCL-1 inhibition lead to changes in MIC60/MICOS/OPA1? This seems quite preliminary at this point.
In Figures 3B and 3C, we report decreased protein levels of short-form OPA1 and MIC10 only, not MIC60. We argue that our data with QVD shows that the cell death function of MCL-1 (i.e., inhibiting cell death effectors from initiating the caspase cascade) is not the main trigger of the phenotypes we report (cristae dysregulation and fatty acid oxidation disruption), however, cells without a functional cristae and/or defects in FAO, may not be able to survive long-term. Thus, QVD treatment preserves these cells that may not survive the dismantling of such an essential structure. To confirm this, we have performed immunofluorescence of cleaved caspase 3 (Figure 5 for reviewers). These results show that indeed MCL-1 inhibition at the time points of our study doesn’t result in increased activation of Caspase-3. We reported similar results of MCL-1 inhibition in oligodendrocyte precursor cells (Gil and Hanna et al., Glia, 2025, PMID: 41420072)
The loss of MIC60 and OPA1 should repress electron transport chain function, are such impacts observed in the cultured cells? This could be shown by assessing oxygen consumption, etc. Such data would enhance the authors' conclusion that MCL-1 inhibition leads to defects in mitochondrial physiology*. *
We completely agree with this comment by Reviewer 1. In our revision, we will include an assessment of mitochondrial oxygen consumption rate, using the Seahorse analyzer (mitochondrial stress test), of NPCs treated with MCL-1i. Preliminary data (n=3) are currently presented as Figure 3 for reviewers. Interestingly, these data show a more nuanced cellular response. Consistent with our conclusion that MCL-1 inhibition does not cause apoptotic cell death, MCL-1i did not affect mitochondrial respiration at baseline. The specific deficits appear in spare respiratory capacity and maximal respiration, meaning cells can sustain routine mitochondrial function but lose the ability to respond to increased energetic demand. This suggests MCL-1 loss creates a mitochondrial reserve deficiency rather than a generalized bioenergetic failure. The results with caspase inhibitors show a near-zero OCR across both 24h and 48h timepoints, and significant reductions in maximal respiration, spare respiratory capacity, and non-mitochondrial OCR. Remarkably, these conditions are not detrimental to newborn neurons, as shown in Figure 7. This is very interesting because it suggests that, under severe bioenergetic failure, neural stem cells (PAX6+) can differentiate into newborn neurons in a TBR2-independent manner. More relevant to this study, our results unequivocally demonstrate that TBR2-positive cells depend on the non-apoptotic function of MCL-1
In Figure 4, the differences between transcripts (qPCR data) and protein (immunoblot) data are often confusing and not well explained. Why do the authors propose that mRNA expression is decreasing whereas the protein expression is increasing? Example CPT1. Furthermore, it is unclear what these data mean functionally? Is this reflective of enhanced lipid oxidation or simply a response to inhibition of fatty acid oxidation? Clarification of the impact of these findings is necessary.
We agree with Reviewer 1 that the results could be hard to interpret. However, the effects of MCL-1 inhibitors on the transcription of fatty acid oxidation genes have been widely cited by the work of Opferman and Walensky (PMID: 36198266). We speculate that the effects on transcription are triggered by mitochondrial signaling. The mechanistic insight into this phenomenon would be an interesting next step.
In the case of CPT1, we addressed this comment and found that the difference is due to differential expression of isoforms The RT-qPCR shown in Figure 4, is on CPT1c, whereas the western blot is on CPT1a. Unfortunately, after trying several products, we determined that there are no good antibodies for CPT1c. Thus, since we can’t compare gene and protein expression, we will include CPT1a RT-qPCR data to complement the western blot.
The increase in lipid droplet number induced by MCL-1 inhibition has been previously documented, but it is unclear whether this increase is related to an inability to oxidize lipid (defective fatty acid oxidation) that leads to increases in the cellular abundance or whether this indicates that MCL-1 inhibition leads to enhanced storage. Do other inhibitors of fatty acid oxidation lead to similar increases in lipid droplet size and abundance? Does QVD inhibition affect this phenotype?
This is a great point raised by Reviewer 1, and one we have also wondered about. We conducted an experiment using C16 BODIPY to address this point (Figure 6 for Reviewers). We observed no changes in C16 lipid droplet accumulation in count, volume, or surface area when cells were treated with MCL-1 inhibitor for 24 hours total with or without a starvation period in the last 6 hours of treatment. However, we observed significant pan-lipid droplet accumulation in the same conditions. This contrast suggests that FAO of exogenous LC-fatty acids is not reliant on MCL-1. This finding does not discount from the requirement of MCL-1 for other FAO processes especially given the major limitation of how much C16 BODIPY (fluorescent palmitate) can be administered to the cells (10µM) which was 10-fold less than what we exogenously supplied to the cells for the pan-BODIPY experiment (100µM, see Figure 5). It is entirely possible that this small dose was not enough to detect any lipid droplet accumulation.
We have now also included experiments using etomoxir and perhexiline to assess their effects on TBR2/PAX6 (Figure 2 for reviewers). The results indicate that inhibiting the FAO pathway does not fully mimic the effects of MCL-1i on TBR2. However, we show that MCL-1i displaces ACSL1 from the mitochondria, a step that is upstream of CPT1/2. We suggest a model in which the coordinated non-apoptotic function of MCL-1 at the outer mitochondrial membrane promotes ACSL1 activity and, in the inner mitochondrial membrane, regulates mitochondrial cristae morphology. While our data point to this model, we are limited by the tools to investigate it further, but it will be a great direction for future experiments.
For Figure 6, while these data may be very meaningful, as presented they are very hard to appreciate. Insets that show the neuronal populations would help to convey the point that the differentiation is impacted. Also, are there other methods that could confirm these observations (qPCR to show changes in differentiation).
We agree with Reviewer 1. In the new version of the manuscript, we will include panels that zoom into the cell populations we quantified. The current panels will go to a new Supplemental figure. We will also add the TUBB3 to the qPCR panel in the new version.
Figure 7 is also very hard to appreciate. What is the reader to see? Can these be quantified? It seems that QVD may be rescuing in this figure, does this suggest that MCL-1 inhibition might be inducing death. All of this needs to be quantified.
We will provide quantification of BIII tubulin branching, and it will be included next to the images provided.
BCL-XL has also been implicated in affecting mitochondrial electron transport chain function (See PMID: 19255249, 21926988, 21987637). Can BCL-XL inhibitors affect any of the phenotypes associated here?
We will include experiments to test the effect of BCL-2 and BCL-XL inhibitors on TBR2 cells to address this comment.
Please be carefully avoid using the term "MCL-1 loss", when talking about pharmacological inhibition. Only genetic ablation (e.g. knockout, silencing, etc.) should be termed loss.
We have now removed the reference to MCL-1 loss in line 199.
__*Reviewer #1 (Significance (Required)):
The study advances in human cells the impacts of MCL-1 inhibition. They replicate many impacts previously observed in mouse systems and refine analyses to impacts on MICOS complex, lipid droplet storage, and neuronal differentiation. While these findings are important and would be well received by a wide audience, the study fails to provide almost any mechanistic insight into how these phenotypes are being induced. The only common theme is that blocking caspase activation in many assays fails to block the phenotype.
*__
__Reviewer #2_ (Evidence, reproducibility and clarity (Required)): _*
Summary: This manuscript by Hanna et al. investigates non-apoptotic roles of MCL-1 in human neural stem cells and connects MCL-1 inhibition to mitochondrial cristae formation and beta-oxidation. Connecting these roles to brain development, the authors also show a reduction in the number of progenitor cells upon MCL-1 inhibition, independently of caspase activity. Throughout their work, the authors make use of an impressive array of imaging techniques. While the methods used offer sufficient evidence to connect MCL-1 inhibition to cristae architecture, the mechanistic underpinnings of this effect remain unexplored. *__
We thank Reviewer 2 for the thoughtful and positive assessment of our manuscript. We appreciate the reviewer’s recognition that our study reveals non-apoptotic roles of MCL-1 in human neural stem cells. We are also grateful for the acknowledgment of the imaging approaches employed, which allowed us to connect MCL-1 function to cristae architecture with multiple complementary techniques. We acknowledge the reviewer’s point that the mechanistic basis by which MCL-1 influences cristae structure remains insufficiently defined. In the revised manuscript, we will clarify the limitations of the current data, expand our discussion of potential mechanisms, and incorporate additional analyses to identify downstream effectors that mediate these structural and metabolic changes.
Major comments:
- In Fig. 1B, the very same representative images are shown for both conditions (DMSO and S63845) at 48 hours.
We deeply appreciate Reviewer 2 for catching this unintentional duplication that occurred during figure preparation. We have now corrected this issue.
- For Western Blot analysis, it looks like the authors only quantified the band density of their proteins of interest without considering varying levels of control protein (Actin) levels. Normalizing the protein levels to actin would account for any differences in loaded protein amounts (although a Ponceau staining might be preferable still to exclude this). This is especially relevant for Fig. 4E, where actin levels visibly differ between the conditions.
All WB quantifications were normalized to Actin (this detail is now added to the y-axis of all band density graphs and figure legends). In addition, we will transform the data to a logarithmic scale to “normalize” for gel-to-gel variability.
- The authors offer evidence that MCL-1 inhibition impedes proteolytic cleavage of OPA1-L into the OPA-1-S isoforms, yet do not explore the mechanism behind this. Since OPA1 is cleaved by both OMA1 and YME1L, determination of the levels of these proteases could help shed some light on the mechanism leading to cristae reorganization.
We will follow up on Reviewer 2's comment with a WB analysis of OMA1 and YMEL in cells treated with an MCL-1 inhibitor.
- Generally speaking, while the authors show all those effects (cristae defects, FAO dysfunction) upon MCL-1 inhibition, it would be interesting to see whether any of those effects can be rescued by blocking FA import e.g. through carnitine palmitoyl- transferase 1a (CPT1a) inhibition with etomoxir to understand if they are downstream of altered Fa supply. This could affect cristae morphology through altered Cardiolipin biogenesis.
This is an excellent point, which was also raised by reviewer 1. We have now included experiments using etomoxir and perhexiline to assess their effects on TBR2/PAX6 (Figure 2 for Reviewers). As mentioned above, the results indicate that inhibiting the FAO pathway does not fully mimic the effects of MCL-1i on TBR2. However, we show that MCL-1i displaces ACSL1 from the mitochondria, a step that is upstream of CPT1 and 2. We suggest a model in which the coordinated non-apoptotic function of MCL-1 at the outer mitochondrial membrane promotes ACSL1 activity and, in the inner mitochondrial membrane, regulates mitochondrial cristae morphology. While our data point to this model, we are limited by the tools to investigate it further, but it will be a great direction for future experiments. The suggestion of Reviewer 2 that the effects on FAO could impact cardiolipin biogenesis is a very exciting possibility. However, difficult to test with the tools available.
- In line 262 the authors discuss that mitochondria lose metabolic function upon MCL-1 inhibition. This claim would require additional experiments. While the authors look at lipid droplet accumulation and FAO enzymes, there are many more aspects to mitochondrial metabolic function that should be investigated. While measuring the oxygen consumption rate via Seahorse might require additional resources (optional), measurements of ATP production, ROS generation or determination of the mitochondrial membrane potential should be feasible.
We fully agree with Reviewer 2's comment, which was also raised by Reviewer 1. In our revision, we will include an assessment of the mitochondrial oxygen consumption rate of NPCs treated with MCL-1i, measured using the Seahorse analyzer (mitochondrial stress test). These data are presented as Figure 3 for reviewers. Interestingly, these data show a more nuanced cellular response. While MCL-1i does not globally collapse mitochondrial respiration at baseline, the specific deficits appear in spare respiratory capacity and maximal respiration, meaning cells can sustain routine mitochondrial function but lose the ability to respond to increased energetic demand. This suggests MCL-1 loss creates a mitochondrial reserve deficiency rather than a generalized bioenergetic failure. The results with caspase inhibitors show a near-zero OCR across both 24h and 48h timepoints, and significant reductions in maximal respiration, spare respiratory capacity, and non-mitochondrial OCR. These conditions are detrimental for TBR2-positive NPCs (Figure 6) , but not for newborn neurons (Figure 7).
- While the authors "propose a model in which MCL-1 associates with MICOS", they do not offer direct scientific to support this hypothesis. Co-immunoprecipitation experiments or e.g. proximity ligation assays would better support the proposed model.
We agree with this statement. Preliminary, we have performed proximity ligation assays and immunoprecipitation analyses to test for this interaction (see below and ____Figure 4 for reviewers), and the results indicate an interaction, albeit very weak. In the revised version of the manuscript, we will attempt to repeat these experiments with MCL-1i.
- While Fig. 7 shows representative images, quantification e.g. for the truncation of neuronal processes is missing.
We will provide quantification of BIII tubulin branching, which will be included alongside the images provided.
- In lines 219f. the authors state that they "observed a significant downregulation of PAX6 and EOMES at 24 hours that was not rescued by QVD co-treatment". While there is still a trend towards a downregulation, there is no statistical significance anymore. In fact, PAX6 levels almost mirror those of SOX2 which is not described as "downregulated" by the authors. In order to be more consistent, I would suggest rephrasing this part, or at least reword it to be less absolute.
In the new version, we will clarify that while QVD rescued TBR2 and PAX6 transcript levels at 24h, it did not rescue them at 48h. We will also mention the downregulation of SOX2 at 48h that persists with co-treatment.
- Brinkmann et al. (2025) also investigated cristae structure upon MCL-1 deletion in vivo and found no effect when MCL-1 was replaced with other Bcl-2 family members. It would be interesting to combine MCL-1 inhibition with overexpression of MCL-1 versus BCL-XL to reconsolidate some of the discrepant findings.
While this is a great suggestion for future studies, there are some complications. Specifically, it is likely that the inhibitor may also target the overexpressed MCL-1 and thus, a mutant form is needed.
To address this, we generated a Flag-tagged MCL-1 construct with a mutated BH3 domain, previously described by Kotschy et al. Nature 2016. We validated the construct in HeLa cells, but unfortunately the mutant protein appears to be significantly less stable than the WT construct, complicating analysis of this experiment.
Minor comments:
- In Supp. Fig. 1C the MCL-1 protein is shown both to run above 37kDa (upper panel) and below 37 kDa (lower panel). Could the authors please comment on why this is the case?
The observed variation is caused by drift in the gel during electrophoresis. In Fig 1C, the protein ladder is on the edge of the gel, whereas in Fig 1E, the protein ladder is in the middle of the gel, and the last sample is on the edge and also exhibits edge drift.
- In line 64 of the introduction the authors mention clinical trials yet do not give a citation for these trials making it hard to judge whether the content of these trials is actually related to the brain.
This information is anecdotal, based on an Amgen press release.
- MCL-1 as well as ACSL-1 are sometimes written without the hyphen both in the text and figures.
We will carefully check the manuscript before submission.
- Lines 92-94 and 106-108 essentially highlight the same existing knowledge gap. Maybe the content of these two paragraphs could be combined in order to avoid repetition.
We thank Reviewer 2 for this suggestion. We will do this in the new version of the manuscript.
- In Fig. 1A, the authors provide a schematic for their experimental design. While the figure legend is very thorough, some of this information (like the days of collection) could also be included in the figure itself. The same is true for schematics in the following figures.
We agree with this and will incorporate the suggestion in the new version.
- Fig. 2A includes a typo (analyze) but would maybe also be more suitable for the supplement figures or could even be combined with Fig. 1A as not much new content is added.
We already incorporated these changes in the new version of the manuscript.
- Regarding statistical analysis, could the authors please comment on why they did not consider one-sample t-tests suitable for the cases where control values were set at 1 (e.g. Fig. 4B, C for the relative expression).
This is a valid suggestion. We will rerun RT-qPCR data using a one-sample t-test.
- In lines 247f. the authors state that "inhibition of MCL-1 leads to [...] and disassembly of the MICOS complex as well as OPA1". This sounds like OPA1 is still cleaved upon MCL-1, which is not at all what the authors showed and further discuss. Rewording of the sentence would help in avoiding any misunderstandings.
We agree with this comment and have now reworded the paragraph: “Inhibition of MCL-1 leads to structural collapse of the cristae likely due to the possible disassembly of the MICOS complex, as suggested by decreased MIC10 levels, and interruption of OPA1 cleavage, as suggested by decreased short-form OPA1, two scaffolds required for cristae maintenance.”
- In lines 210f. the authors state that "quantitative imaging increased the average and maximum volume of lipid droplets". While there is definitely a trend towards an increase for the maximum volume, the increase is in fact not statistically significant. This should be reflected in the wording.
We have reworded this to “Quantitative imaging revealed a significant increase in average lipid droplet volume and a trending increase in maximum volume of lipid droplets.”
- In Fig. 6 the overlap between TBR2 and PAX6 is hard to judge when printed out. Including a zoom-in may make it easier to judge.
We agree with Reviewer 2. In the new version of the manuscript, we will include panels that zoom into the cell populations we quantified. The current panels will go to a new Supplemental figure. We will also add the TUBB3 to the qPCR panel in the new version.
- In Fig. 7 the color-coding is listed in the figure legend but is missing from the figure itself. If the authors could include this, as they did for the other figures, it would further improve this figure.
We agree. We have specified the channel color in the new figure.
- Line 238 should reference Fig. 7A, as Fig 7B does not exist.
Thanks for catching this. It is already corrected
- In the figure legends the authors state that biological replicates were used. Were technical replicates also performed?
Yes, technical replicates were performed for RT-qPCR.
Reviewer #2 (Significance (Required)):____ Significance
The authors make use of a wide array of imaging techniques to further elucidate non-apoptotic roles of MCL-1. The study has the potential to offer new insights into mitochondrial biology on the level of basic research rather than translational. While the methods used offer sufficient evidence to connect MCL-1 inhibition to cristae architecture, the mechanistic underpinnings of this effect remain unexplored. Nevertheless, the study offers additional knowledge on the role of MCL-1 in human neural stem cells, whereas previous research mostly focused on cardiomyocytes or cancer cells.
Reviewer #3____ (Evidence, reproducibility and clarity (Required)):
Summary: ____ In this study, Gama et al. describe a non-canonical role for the anti-apoptotic protein Myeloid Cell Leukemia-1 (MCL-1) in mitochondrial cristae organization and suggest a role of MCL-1 in regulating metabolism and neuronal differentiation. Using fluorescence microscopy imaging and electron microscopy, the authors show changes to mitochondrial morphology upon treatment with MCL-1 inhibitor S63845. MCL-1 inhibition results in altered protein and transcript levels of some key proteins involved in mitochondrial cristae organization and fatty acid metabolism. While some of the findings are interesting and indeed point towards a non-canonical role of MCL-1, several key conclusions of the authors are not sufficiently supported by the data shown in the manuscript.
We thank Reviewer 3 for the careful evaluation of our manuscript. We appreciate the reviewer’s recognition that our study identifies a potential non-canonical role for MCL-1 in mitochondrial cristae organization, metabolism, and neuronal differentiation. As with Reviews 1 and 2, we are encouraged that the reviewer finds these observations interesting and suggestive of previously unappreciated functions for MCL-1. We agree that stronger evidence is required to firmly link MCL-1 inhibition to specific changes in MICOS organization and metabolic regulation. In the revised manuscript, we will (i) more clearly distinguish between observations and mechanistic inferences, (ii) temper conclusions where appropriate, and (iii) incorporate additional analyses and controls to better substantiate the proposed model.
Major comments:
The authors show no data on the viability of the cells in response to the MCL-1 inhibitor. To exclude secondary effects of the inhibitor, at least some of the results should be validated with an MCL-1 knock down.
We will include this experiment in our revised manuscript. To check the effects of MCL-1 knockdown on TBR2 positive cells, we tested 5 different ASOs for MCL-1. Knockdown efficiency with ASOs was very low (on average In Figure 1, the authors show immunofluorescence data of mitochondria and nucleus staining and conclude that MCL-1 inhibition alters mitochondrial morphology. Based on the images shown in Fig. 1, I do not think that individual mitochondria can be segmentd to measure their volume and length. In addition, some metrics such as mitochondrial content are not explained in the text or methods.
We can achieve mitochondrial segmentation with a SoRa Spinning Disk Confocal Microscope, which has a lateral (XY) resolution of approximately 120 nm to 150 nm and an axial (Z) resolution of approximately 300 nm–320 nm. All images are first denoised prior to sharpening using the Richardson-Lucy deconvolution algorithm. Additionally, the FIB-SEM data are consistent with the IF data (both show increase in mitochondrial volume and surface area).
We agree with Reviewer 3 that we need to explain some metrics in the revised version. We will specify the meaning of mitochondrial content (count of all mitochondria in FOV, not normalized to Hoechst).
In Fig. 2 B-D, the authors show TEM and FIB-SEM imaging to demonstrate alterations in the cristae architecture upon treatment with MCL-1 inhibitor. However, based on the images shown, it looks that cristae area and density is reduced under S63845 treatment in TEM images, while the FIB-SEM data come to the opposite conclusion. In addition, the quantification of cristae volume quantified as cristae volume in percentage is unclear to me.
We apologize for the confusion. No conclusions about the cristae area and density were made using the TEM data, because TEM data represent a single snapshot section of a mitochondrion without a discernible orientation. Cristae from TEM were described as “aberrant” and preliminarily revealed changes in cristae and were followed up with FIB-SEM, 3D reconstruction of intact mitochondria, and quantification of volume.
In the new version of the manuscript, we will specify that the cristae volume is normalized to the volume of its respective mitochondria (i.e., how much of the mitochondrial volume is attributed to cristae).
The change in CPT1/2 protein levels (Fig. 4) is interesting but does not directly proof that fatty acid oxidation is altered, as concluded by the authors. For this, the authors would need to directly measure fatty acid oxidation for example using Seahorse or metabolic tracing experiments. Also, to prove that the MCL-1 inhibition affects neural differentiation through fatty acid oxidation, a rescue experiment should be performed through CPT1 overexpression.
We agreed that this is an important point. We have optimized the fatty acid oxidation test using Seahorse and will make sure to include it in the revised version of the manuscript.
In Figure 6, the authors show decreased intermediate progenitor cells after MCL-1 inhibition by immunofluorescence staining. I am not convinced that this can be concluded from the data shown, since the concentration of intermediate progenitor cells is very close to the noise levels. Since the MCL-1 treated cells look much less sparse, I don't think the percentages can be compared (total counts are between 2-20). Although this data might give some indication that differentiation could be impaired, the measured effect could be very well due to lower viability of the cells. The authors need to control for this or come up with a different method for measuring differentiation.
The number of TBR2 is low, but we disagree with the reviewer’s assessment of noise levels. We focused on cells expressing only TBR2 and rigorously examined this population of cells. The percentages are compared to account for the lower density of the MCL-1i-treated cultures, as the IPC counts are normalized to the Hoechst total cell count within the FOV. Moreover, the immunofluorescence images are complemented with RT-qPCR, which shows significant downregulation of EOMES (gene encoding TBR2).
Figure 7 is missing quantification
We will include this quantification in the revised version of the manuscript.
Reviewer #3 (Significance (Required)):
General assessment____: The manuscript reports an interesting finding, which suggest a non-canonical role of MCL-1 in mitochondrial remodeling, regulation of fatty acid oxidation and neuronal fate. While this finding would be highly interesting and relevant, the presented data do not sufficiently support this conclusion. Further experiments would have to be performed to proof causality. ____ Advance: Should the authors manage to proof their hypothesis by additional experiments, this would indeed advance the field on mitochondrial remodeling and its effect on neuronal differentiation by
identifying a novel molecular player. ____ Audience: mitochondrial biology, cell biology, developmental neuroscience Own expertise: mitochondrial biology, cell biology, advanced imaging techniques
Note: This preprint has been reviewed by subject experts for Review Commons. Content has not been altered except for formatting.
Learn more at Review Commons
Summary:
In this study, Gama et al. describe a non-canonical role for the anti-apoptotic protein Myeloid Cell Leukemia-1 (MCL1) in mitochondrial cristae organization and suggest a role of MCL1 in regulating metabolism and neuronal differentiation. Using fluorescence microscopy imaging and electron microscopy, the authors show changes to mitochondrial morphology upon treatment with MCL1 inhibitor S63845. MCL1 inhibition results in altered protein and transcript levels of some key proteins involved in mitochondrial cristae organization and fatty acid metabolism. While some of the findings are interesting and indeed point towards a non-canonical role of MCL1, several key conclusions of the authors are not sufficiently supported by the data shown in the manuscript.
Major comments:
General assessment: The manuscript reports an interesting finding, which suggest a non-canonical role of MCL1 in mitochondrial remodeling, regulation of fatty acid oxidation and neuronal fate. While this finding would be highly interesting and relevant, the presented data do not sufficiently support this conclusion. Further experiments would have to be performed to proof causality.
Advance: Should the authors manage to proof their hypothesis by additional experiments, this would indeed advance the field on mitochondrial remodeling and its effect on neuronal differentiation by identifying a novel molecular player.
Audience: mitochondrial biology, cell biology, developmental neuroscience
Own expertise: mitochondrial biology, cell biology, advanced imaging techniques
Note: This preprint has been reviewed by subject experts for Review Commons. Content has not been altered except for formatting.
Learn more at Review Commons
Summary:
This manuscript by Hanna et al. investigates non-apoptotic roles of MCL-1 in human neural stem cells and connects MCL-1 inhibition to mitochondrial cristae formation and beta-oxidation. Connecting these roles to brain development, the authors also show a reduction in the number of progenitor cells upon MCL-1 inhibition, independently of caspase activity. Throughout their work, the authors make use of an impressive array of imaging techniques.While the methods used offer sufficient evidence to connect MCL-1 inhibition to cristae architecture, the mechanistic underpinnings of this effect remain unexplored.
Major comments:
Minor comments:
The authors make use of a wide array of imaging techniques to further elucidate non-apoptotic roles of MCL-1. The study has the potential to offer new insights into mitochondrial biology on the level of basic research rather than translational. While the methods used offer sufficient evidence to connect MCL-1 inhibition to cristae architecture, the mechanistic underpinnings of this effect remain unexplored. Nevertheless, the study offers additional knowledge on the role of MCL-1 in human neural stem cells, whereas previous research mostly focused on cardiomyocytes or cancer cells.
Note: This preprint has been reviewed by subject experts for Review Commons. Content has not been altered except for formatting.
Learn more at Review Commons
Summary: This study claims that beyond its canonical anti-apoptotic function, MCL-1 has essential non-apoptotic roles in human neurodevelopment. Pharmacologic inhibition of MCL-1 in human neural stem cells disrupts mitochondrial inner membrane architecture by destabilizing cristae and the OPA1-MICOS complex, leading to swollen mitochondria with disorganized cristae. These structural defects impair fatty acid oxidation and lipid droplet homeostasis, linking cristae integrity to metabolic competence. Independently of apoptosis or proliferation, MCL-1 inhibition selectively depletes intermediate neural progenitors, indicating a direct role in lineage progression. Overall, the work positions MCL-1 as a key regulator of mitochondrial structure-metabolism coupling that instructs neural progenitor identity and human neurogenesis.
Overall: The study does a good job of using (in most assays) caspase inhibition (e.g., QVD treatment) to block apoptotic responses induced by MCL-1 inhibition. As a result, many of the phenotypes caused by inhibition are likely to be independent of caspase activation. As a result, this manuscript would be of interest to researchers that study the topics of the BCL-2 family and cell death signaling, mitochondrial bioenergetics and dynamics, neurodevelopment, and cellular metabolism. However, as currently presented the manuscript is only descriptive and lacks mechanistic insight.
Major Concerns:
1) The authors only use a single MCL-1 inhibitor and never use other non-targeting BH3-mimetics (such as venetoclax) as negative controls. This seems like a missed opportunity to demonstrate that the phenotypes observed are MCL-1 dependent.
2) There is no mechanism proposed in this study other than reliance upon QVD as not affecting the phenotypes. As submitted, the manuscript only can speculate that these phenotypes are due to non-apoptotic roles of MCL-1 inhibition. The authors have missed an opportunity to explore MCL-1's non-apoptotic functions directly.
Other concerns exist that weaken the impact of the study.
The study advances in human cells the impacts of MCL-1 inhibition. They replicate many impacts previously observed in mouse systems and refine analyses to impacts on MICOS complex, lipid droplet storage, and neuronal differentiation. While these findings are important and would be well received by a wide audience, the study fails to provide almost any mechanistic insight into how these phenotypes are being induced. The only common theme is that blocking caspase activation in many assays fails to block the phenotype.
eLife Assessment
Du et al. present a valuable study examining neural activation in medial prefrontal cortex (mPFC) subpopulations projecting to the basolateral amygdala (BLA) and nucleus accumbens (NAc) during behavioral tasks assessing anxiety, social preference, and social dominance. The strength of the evidence linking in vivo neural physiology to behavioral outcomes was considered solid; however, the slice electrophysiology data and their interpretation were less well received. Overall, the reviewers felt that the revised work provides insight into how distinct mPFC→BLA and mPFC→NAc pathways influence anxiety, exploration, and social behaviors.
Reviewer #1 (Public review):
Summary:
It is well known that neurons in the medial prefrontal cortex (mPFC) are involved in higher cognitive functions such as executive planning, motivational processing and internal state mediated decision-making. These internal states often correlate with the emotional states of the brain. While several studies point to the role of mPFC in regulating behavior based on such emotional states, the diversity of information processing in its sub-populations remains a less explored territory. In this study, the authors try to address this gap by identifying and characterizing some of these sub-populations in mice using a combination of projection-specific imaging, function-based tagging of neurons, multiple behavioral assays and ex-vivo patch clamp recordings.
Strengths:
The authors targeted mPFC projections to the nucleus accumbens (NAc) and basolateral amygdala (BLA). Using the open field task (OFT), the authors identified four relevant behavioral states as well as neurons active while the animal was in the center region ("center-ON neurons"). By characterizing single unit activity and using dimensionality reduction, the authors show differentiated coding of behavioral events at both the projection and functional levels. They further substantiate this effect by showing higher sensitivity of mPFC-BLA center-ON neurons during time spent in the open arms of the elevated plus maze (EPM). The authors then pivoted to the three-chamber social interaction (SI) assay to show the different subsets of neurons encode preference of social stimulus over non-social. This reveals an interesting diversity in the function of these sub-populations on multiple levels. Lastly, the authors used the tube test as a manipulation of the anxiety state of mice and compared behavioral differences before/after in the OFT and social interaction tasks. This experiment revealed that "losers" of the tube test spend less time in the center of the open field while "winners" show a stronger preference for the familiar mouse over the object. Using patch-clamp experiments, the authors also found that "winners" exhibit stronger synaptic transmission in the mPFC-NAc projection while "losers" exhibit stronger synaptic transmission in the mPFC-BLA projection. Given the popularity of the tube test assay in rank determination, this provides useful insights into possible effects on anxiety levels and synaptic plasticity. Overall, the many experiments performed by the authors reveal interesting differences in mPFC neurons relative to their involvement in high or low anxiety behaviors, social preference and social rank.
Weaknesses:
The authors have addressed all comments.
Reviewer #2 (Public review):
Summary:
The goal of this proposal was to understand how two separate projection neurons from the medial prefrontal cortex, those innervating the basolateral amygdala (BLA ) and nucleus accumbens (NAc), contribute to the encoding of emotional behaviors. The authors record the activity of these different neuron classes across three different behavioral environments. They propose that, although both populations are involved in emotional behavior, the two populations have diverging activity patterns in certain contexts. A subset of projections to the NAc appear particularly important for social behavior. They then attempt to link these changes to the emotional state of the animal and changes in synaptic connectivity.
Strengths:
The behavioral data builds on previous studies of these projection neurons supporting distinct roles in behavior and extend upon previous work by looking at the heterogeneity within different projection neurons across contexts, this is important to understand the "neural code" within the PFC that contributes to such behaviours and how it is relayed to other brain structures.
Weaknesses:
The diversity of neurons mediating these projections and their targeting within the BLA and NAc is not explored. These are not homogeneous structures and so one possibility is that some of the diversity within their findings may relate to targeting of different sub-structures within BLA or NAc or the diversity of projection neuron subtypes that mediate these pathways. This is an important future direction for this work but does not detract from the main finding as reported. The electrophysiological data in Figure 7 have some experimental confounds that makes their interpretation challenging.
Comments on revisions:
The authors have improved the manuscript somewhat by refining their description of the results. However, the normalized EPSC experiments still do not make much sense. If you have a higher light intensity or LED duration the curve of the EPSC response will saturate earlier. Similarly, if you are in a highly, or poorly labeled slice or subregion of a slice then you will see responses emerge at different intensities based on the number of synapses labelled. There is no standardization in the way these experiments were performed, so performing some arbitrary post hoc normalisation does not correct for this. Similarly, they also place the fibreoptic manually above the slice each time. This makes it much harder to determine the actual light intensity delivered to the slice on a cell by cell and group by group basis.
I have reduced my public statement from significant experimental confounds, to some experimental confounds. But the way the experiments were performed does not allow the normalized data to really be interpretable. They still argue that normalized EPSCs are relatively larger. I don't even really understand what this means biologically.
The subsequent rise/decay and other measures is now better described. However, they note that the decay constant is larger. This means that the kinetics are slower, not enhanced, as they describe.
Author response:
The following is the authors’ response to the previous reviews
We sincerely thank the editors and reviewers for their careful evaluation and constructive feedback, which has helped us substantially improve the clarity and rigor of the manuscript. In the revised version, we have clarified the interpretation of the electrophysiological experiments, corrected the labeling of recorded signals as light evoked EPSCs, and removed statements implying differences in absolute synaptic strength. To address concerns about the interpretation of Fig. 7, we have added quantitative analyses of EPSC kinetics and revised the text to focus on synaptic response dynamics rather than amplitude differences. We have also removed analyses that could cause confusion and expanded the Methods section to provide additional experimental details, including the optogenetic stimulation configuration in slice recordings. Together, these revisions strengthen the interpretation of the electrophysiological results and improve the overall clarity and transparency of the study.
Public Reviews:
Reviewer #1 (Public review):
Weakness:
The authors focused primarily on female mice limiting generalizability and leaving the readers with questions about the impact of sex differences on their results. The tube test is used as a manipulation of the "emotional state" in several of the experiments. While the authors show the changes to corticosterone levels as a consequence of win/loss in the tube test, stronger claims might be made with comparisons to other gold standard stressors such as forced social defeat or social isolation.
We thank the reviewer for these thoughtful comments.
First, we acknowledge that the present study was conducted primarily in female mice, which may limit the generalizability of the findings. Female mice were selected to reduce variability associated with male aggression and housing-related stress, which can complicate behavioral assays such as social interaction and dominance testing. While focusing on a single sex allowed us to maintain experimental consistency across multiple behavioral paradigms, we agree that sex differences could influence the neural circuits underlying emotional and social behaviors. We have now added a statement in the Discussion acknowledging this limitation and noting that future studies will be necessary to determine whether similar circuit mechanisms operate in male mice.
Second, we appreciate the reviewer’s suggestion regarding the use of other stress paradigms. In this study, the tube test was used primarily to establish social dominance relationships between paired mice rather than as a classical stress-induction paradigm. Nevertheless, we observed measurable physiological changes associated with repeated win/loss outcomes, including alterations in corticosterone levels in brain lysates of loser mice after repeated tube-test competitions. Notably, repeated win/loss outcomes in the tube test were associated with significant increases in corticosterone levels in loser mice, indicating that the paradigm produced measurable physiological responses consistent with stress-related processes. These findings suggest that repeated social competition in this context can induce transient physiological and behavioral changes associated with social hierarchy. We agree that paradigms such as chronic social defeat stress or social isolation represent well-established models for inducing sustained stress responses. We have therefore revised the manuscript to clarify that the tube test in our study serves as a model of social competition and rank establishment rather than a canonical stress paradigm, and we highlight the comparison with other stress models as an important direction for future work.
Recommendations for the authors:
Reviewer #2 (Recommendations for the authors):
In relation to figure 7. Their response does not really clarify the issue:
(a) They argue that they are not making claims about synapse strength. However they still state "In the mPFC→NAc pathway, blue light stimulation evoked larger excitatory postsynaptic currents (EPSCs) in winner mice compared to losers (Fig. 7E). This suggests stronger synaptic transmission in winners' mPFC→NAc circuits. " They don't show this, they just show that normalized to some arbitrary value the responses of the earlier durations is higher or lower, which is very hard to interpret.
They argue in the rebuttal that the aim of this is to highlight response kinetics, but these are not quantified or discussed in any way.
We thank the reviewer for this helpful comment. We agree that the normalized input output curves shown in the original submission did not allow conclusions about absolute synaptic strength, and we also acknowledge that response kinetics were not previously quantified despite being mentioned in the rebuttal.
To address both concerns, we have revised Fig. 7 and added quantitative analyses of EPSC kinetics. Specifically, we measured the rise and decay slopes of light-evoked EPSCs recorded in postsynaptic neurons within the NAc and BLA of winner and loser mice. In the mPFC→BLA pathway, both the EPSC rise and decay slopes were significantly increased in loser mice compared with winners (rise slope: p = 0.0138; decay slope: p = 0.0392), suggesting enhanced synaptic responsiveness and faster charge transfer kinetics in BLA neurons of losers. In contrast, in the mPFC→NAc pathway, both mEPSC rise and decay slopes were not significantly different between groups.
These results provide a quantitative characterization of synaptic response dynamics and reveal pathway-specific differences in synaptic properties associated with social hierarchy. Importantly, this analysis does not rely on amplitude normalization and therefore allows a more interpretable comparison of synaptic response profiles between groups. We have updated Fig. 7 and the corresponding Results section to include these analyses.
(b) They still haven't labeled the responses correctly. The responses in figure 7 are not "voltage spikes" but light-evoked EPSCs.
We apologize for the incorrect terminology. All instances of “voltage spikes” have been corrected to “light-evoked EPSCs” in the figure legends and text.
(c) They argue that responses do not vary across experiments/slices because they use a constant viral injection volume targeted to the same co-ordinates and identical placement of the fiber and recording location. While I am sure they aim to do that, it is almost impossible to ensure that this was identical across experiments and that the degree of opsin labelling in their slices was the same (See for example Mao et al., 2011 PMID: 21982373 who pioneer the approach of using within slice comparisons to account for this). If I understand their explanation of their strategy correctly, the authors own rebuttal highlights this point, they seem to have needed to vary the LED duration by an order of magnitude (1-10ms) to ensure reliable responses across experiments, even for the same projection.
We thank the reviewer for raising this important point. We agree that it is not possible to ensure identical opsin expression or light delivery across experiments. We have revised the manuscript to explicitly acknowledge this limitation and clarify that normalization was used to mitigate, but not eliminate, inter-slice variability. We now avoid any interpretation that relies on absolute response amplitude across animals.
Regarding “LED duration variability (1-10 ms)”, we agree that the need to adjust stimulation duration reflects variability in effective opsin activation across slices. We now clarify this point in the Methods and Results and emphasize that stimulation parameters were optimized to reliably evoke responses rather than to equate absolute light input across experiments.
Importantly, our main conclusions do not rely on absolute EPSC amplitude comparisons. Instead, they are supported by analyses that are less sensitive to variability in opsin expression or light delivery, including EPSC kinetics (rise and decay slopes), paired-pulse ratio measurements, and AMPA/NMDA ratios. These complementary measures provide a more robust characterization of synaptic properties across conditions.
(d) Similarly in Fig S6 it is unclear what they are showing. The Y axis is still labeled in pA, yet they claim this is an action potential? Also this analysis is rather irrelevant to the data shown in figure 7 as the pathway between PFC and BLA/NAc is not preserved.
We thank the reviewer for pointing out the lack of clarity in Fig. S6. We agree that it does not directly inform the interpretation of Fig. 7 and may cause confusion. To improve the clarity and focus of the manuscript, we have therefore removed Fig. S6 from the revised manuscript. The removal of this supplementary figure does not affect the main conclusions of the study.
(e) It now also seems that these experiments were performed by placing a fiber optic into the slice to elicit responses. This should be detailed in the methods.
We thank the reviewer for noting this omission. We have added a detailed description of fiber-optic placement within the slice for optogenetic stimulation to the Methods section. Specifically, we clarify that blue light was delivered through a fiber optic positioned above the recorded slice to activate ChR2-expressing mPFC axon terminals within the BLA or NAc. The placement of the fiber relative to the recorded neurons and the stimulation parameters are now explicitly described in the revised Methods section.
.
Cassano, Graham, and Terressa A. Benz. “Introduction: Flint and the Racialized Geography of Indifference.” Critical Sociology 45, no. 1 (March 12, 2018): 25–32. https://doi.org/10.1177/0896920517753697.
.
Davey, Monica. “Flint Officials Are No Longer Saying the Water Is Fine.” The New York Times, October 8, 2015, sec. U.S. https://www.nytimes.com/2015/10/08/us/reassurances-end-in-flint-after-months-of-concern.html.
jlorenz. “Health Officials Release Findings of Flint Rash Report Study - City of Flint.” City of Flint, August 23, 2016. https://www.cityofflint.com/health-officials-release-findings-of-flint-rash-report-study/.
Olugbenga Okunade. “The Flint Water Crisis and the Perpetuation of Environmental Racism in Flint, Michigan (2014–2018).” Journal of African American Studies 28, no. 3 (September 9, 2024). https://doi.org/10.1007/s12111-024-09666-5.
Scott, Atkinson, and Monica Davey. “5 Charged with Involuntary Manslaughter in Flint Water Crisis.” The New York Times, June 14, 2017. https://www.nytimes.com/2017/06/14/us/flint-water-crisis-manslaughter.html.
eLife Assessment
This manuscript examines the evolution of molluscan shells using single-cell analyses of the adult mantle of Crassostrea gigas and compares these data with previous datasets from embryonic and larval stages of this species and other spiralians. The authors provide important support for a scenario in which secretory cells are broadly conserved across spiralians, and the incorporation of lineage-restricted genes contributes to the evolution of molluscan shells. While some of the conclusions of the authors are convincing, many aspects of the manuscript remain incomplete and could be improved, especially aspects of cell-type classification and validation.
Reviewer #1 (Public review):
Summary:
This manuscript examines the evolution of molluscan shells using single-cell analyses of the adult mantle of Crassostrea gigas and compares these data with previous datasets from embryonic and larval stages of this species and other spiralians. The authors provide support for a scenario in which secretory cells are broadly conserved across spiralians, and the incorporation of lineage-restricted genes contributes to the evolution of molluscan shells.
Strengths:
High-quality datasets for mantle tissue in Crassostrea gigas and thorough comparisons with existing datasets for this species and other spiralians. Balanced discussion.
Weaknesses:
No major weaknesses. The analyses follow fairly standard approaches in the field that have been previously applied and developed in similar systems.
Reviewer #2 (Public review):
Summary:
Bai et al. present in their study three single-cell RNA seq datasets derived from gastrulae, trochophores, and adults of the bivalve Crassostrea gigas. While a dataset on the oyster trochophore has already been published previously (Piovani et al. 2023), the gastrula and adult datasets have not been published yet. The authors conclude that cell types secreting the oyster shell valves use a genetic repertoire that is also used by epithelial and secretory cell types of very different spiralians, such as annelids, chaetognaths and flatworms.
Strengths:
The study provides new single-cell datasets from multiple developmental stages of an oyster, offering a valuable resource for the field. It takes a broad comparative approach using state-of-the-art techniques across diverse animal groups and addresses an important question regarding the origin and evolution of shell-forming cell types.
Weaknesses & suggestions to improve the manuscript:
(1) Validation of cell types
Cell type identities are not convincingly validated. Although the authors cite previous studies (l. 92), the referenced marker genes are largely not used, and the cited works do not provide sufficient spatial validation. Without in situ data, the inferred locations of cell types (e.g. Figure 2A) are not supported. Spatial validation of marker genes (e.g. via HCR) is essential, particularly for a study addressing shell field evolution. In addition, the gastrula dataset is not meaningfully analyzed, and its inclusion remains unclear.
(2) Robustness of cell type classification
Several proposed cell types may not represent distinct entities (not individuated) but rather reflect over-clustering. Marker genes are often not specific and are shared across clusters (e.g. Sec1/Sec2), making it difficult to distinguish cell types reliably.
(3) Comparative analysis of secretory cells
The comparative framework is not sufficiently supported. Secretory cells are highly diverse, and without proper validation, their comparison across taxa is not meaningful. The transcription factor analysis is limited, as only a few genes are shared and many are inconsistently expressed (Figure 3E). The conclusion of a conserved regulatory program across spiralians is therefore overstated.
(4) Clarity and interpretation of results
Results are at times difficult to follow and remain superficial. Marker genes are insufficiently annotated (especially for Crassostrea), and comparisons across taxa lack functional interpretation. Unvalidated and heterogeneous cell types are grouped together, and transcriptional similarities are overinterpreted. Overall, key conclusions are not adequately supported by the presented data.
Reviewer #3 (Public review):
Summary:
This manuscript by Bai et al. reports single-cell transcriptomics of the oyster mantle to elucidate the respective contributions of ancient conserved programmes and lineage-specific genes to the origin of the molluscan shell. The authors compare their dataset with other oyster larval datasets as well as data from other organisms (annelids, chaetognaths) and find evidence of evolutionary conservation and functional similarity with secretory cell types. They also observe that cells involved in secreting the larval skeleton express predominantly recent genes, whereas the adult skeleton-secreting programme is evolutionarily more conserved.
Strengths:
The manuscript is well written and clearly presented, and the results are interesting, particularly the distinction between larval and adult skeleton secretion, which is placed in a thoughtful evolutionary context.
Weaknesses:
(1) My main concern is that the authors rely primarily on previous studies for the experimental and functional characterisation of the identified cell types. The cited papers (Piovani, 2023 and de la Forest Divonne et al., 2025) deal with distinct stages or tissues (larvae and hemocytes, respectively), which limits their direct relevance. The authors also cite other papers for in situ expression data; it would be helpful to summarise somewhere (e.g. in a table) which genes have been experimentally characterised and what their expression domains are, or alternatively to provide HCR or in situ staining on the mantle. For instance, what is the rationale for the claim that proliferative cells give rise to the mantle? The trajectory inference approach used (Monocle) would likely yield a similar result regardless of the reference cell type, so additional justification is needed.
(2) More broadly, I find that the functional properties of the identified cell types and their relationship to the expressed genes deserve more detailed discussion. For example, at L100, several genes are mentioned, but their functional roles are not discussed. Similarly, the basis for annotating the proliferative cells is not explained. How was gene orthology assessed? Throughout the manuscript, vertebrate-style gene names are used without explicitly establishing orthology status in oyster, which should be addressed.
(3) More detail is needed on the methods and quality control for the single-cell data. The authors should clarify that the platform used (BMKMANU) is a droplet-based technology comparable in principle to Drop-seq. BMKMANU is not widely used in the field. How does it compare to 10x Genomics in terms of sensitivity and cell recovery? The authors appear to use the 10x Chromium cellranger pipeline for data analysis, which suggests compatibility, but this should be stated explicitly. Additionally, no information is provided on the number of sequencing runs or biological replicates, nor on how reproducible the results are across samples.
(4) A limitation of the phylostratigraphic analysis is that it is restricted to mantle tissue, making it difficult to place the results in a whole-organism context. How do the age profiles of mantle-expressed genes compare to those of more evolutionarily conserved tissues, such as the nervous system? I appreciate the methodological and experimental constraints, but this is a genuine limitation of the study. The authors could at least discuss it explicitly, and ideally consider generating a broader single-cell atlas of the oyster to provide this comparative baseline.
(5) Have the authors considered the potential importance of lineage-specific gene duplication? It is well established that spiralians, including oysters, have undergone extensive lineage-specific duplication of transcription factors such as homeobox genes, and many structural shell-associated proteins may similarly have been duplicated. This could be relevant to interpreting both the phylostratigraphic results and the expansion of secretory gene families.
Author response:
Public Reviews:
Reviewer #1 (Public review):
Summary:
This manuscript examines the evolution of molluscan shells using single-cell analyses of the adult mantle of Crassostrea gigas and compares these data with previous datasets from embryonic and larval stages of this species and other spiralians. The authors provide support for a scenario in which secretory cells are broadly conserved across spiralians, and the incorporation of lineage-restricted genes contributes to the evolution of molluscan shells.
Strengths:
High-quality datasets for mantle tissue in Crassostrea gigas and thorough comparisons with existing datasets for this species and other spiralians. Balanced discussion.
Weaknesses:
No major weaknesses. The analyses follow fairly standard approaches in the field that have been previously applied and developed in similar systems.
We thank the reviewer for the positive evaluation of our work. We are encouraged that the reviewer finds our conclusions balanced and the analyses appropriate. Although no major concerns were raised, we will incorporate clarifications and improvements prompted by the other reviewers to further strengthen the manuscript.
Reviewer #2 (Public review):
Weaknesses:
(1) Validation of cell types
Cell type identities are not convincingly validated. Although the authors cite previous studies (l. 92), the referenced marker genes are largely not used, and the cited works do not provide sufficient spatial validation. Without in situ data, the inferred locations of cell types (e.g. Figure 2A) are not supported. Spatial validation of marker genes (e.g. via HCR) is essential, particularly for a study addressing shell field evolution. In addition, the gastrula dataset is not meaningfully analyzed, and its inclusion remains unclear.
We thank the reviewer for this important comment regarding cell type validation. In the previous version of the manuscript, we provided a detailed compilation of referenced marker genes from previous studies in Supplementary File 2. It is possible that, due to an incorrect or unclear reference in the main text, this information was not readily accessible. We will correct and clarify these citations in the revised manuscript to ensure that these resources are clearly presented.
We agree that spatial validation would provide important support for cell type identities. In the revised version, we will strengthen this aspect by selecting more specific marker genes for each SEC cluster and performing fluorescence in situ hybridisation (FISH) to validate their spatial localization.
Regarding the gastrula dataset, our original intention was to investigate the developmental transition of shell gland-related cell populations from gastrula to trochophore stages. However, following the reviewer’s suggestion and considering the limited interpretability of the gastrula dataset in its current form, we agree that its inclusion does not substantially strengthen the study. We therefore plan to remove the gastrula dataset from the revised manuscript, and instead focus on the trochophore stage as a representative developmental stage for larval shell formation, enabling a clearer comparison between larval and adult shell-forming cell populations. We note that this change does not affect the main conclusions of the study. In addition, we will curate a refined set of experimentally supported marker genes, and provide an updated supplementary table summarizing detailed information, including cell type annotations, literature sources, and experimental validation methods.
(2) Robustness of cell type classification
Several proposed cell types may not represent distinct entities (not individuated) but rather reflect over-clustering. Marker genes are often not specific and are shared across clusters (e.g. Sec1/Sec2), making it difficult to distinguish cell types reliably.
In the revised manuscript, we will refine marker gene selection by prioritizing genes with higher specificity and stronger discriminatory power to improve the robustness of cell type identification. To further support cell identity assignment, we will select representative marker genes for SEC clusters and perform FISH to validate their spatial localization. These revisions will lead to a more robust and conservative interpretation of cell populations.
(3) Comparative analysis of secretory cells
The comparative framework is not sufficiently supported. Secretory cells are highly diverse, and without proper validation, their comparison across taxa is not meaningful. The transcription factor analysis is limited, as only a few genes are shared and many are inconsistently expressed (Figure 3E). The conclusion of a conserved regulatory program across spiralians is therefore overstated.
We agree that secretory cell types are highly diverse across spiralians and that cross-species comparisons require careful interpretation. In the revised manuscript, we will adopt a more cautious framework, highlight partial conservation of regulatory program alongside functional convergence in secretory processes. We also will strengthen the comparative framework by integrating functional annotations, which may provide complementary support beyond individual gene overlaps. Importantly, we will improve the reliability of oyster SEC annotations through FISH-based spatial validation, thereby increasing confidence in cross-species comparisons. These revisions will provide a more balanced and biologically grounded interpretation of secretory cell evolution across spiralians.
(4) Clarity and interpretation of results
Results are at times difficult to follow and remain superficial. Marker genes are insufficiently annotated (especially for Crassostrea), and comparisons across taxa lack functional interpretation. Unvalidated and heterogeneous cell types are grouped together, and transcriptional similarities are overinterpreted. Overall, key conclusions are not adequately supported by the presented data.
In the revised manuscript, we will re-evaluate marker gene annotations to ensure support from existing experimental evidence. For SEC populations, we will validate representative markers using FISH. We will also expand the functional annotation of marker genes and strengthen cross-species comparisons. In addition, we will substantially revise the Results and Discussion sections to improve clarity and depth, reduce overinterpretation of transcriptional similarities, and ensure that all conclusions are more tightly aligned with the strength of the supporting evidence.
Reviewer #3 (Public review):
Weaknesses:
(1) My main concern is that the authors rely primarily on previous studies for the experimental and functional characterisation of the identified cell types. The cited papers (Piovani, 2023 and de la Forest Divonne et al., 2025) deal with distinct stages or tissues (larvae and hemocytes, respectively), which limits their direct relevance. The authors also cite other papers for in situ expression data; it would be helpful to summarise somewhere (e.g. in a table) which genes have been experimentally characterised and what their expression domains are, or alternatively to provide HCR or in situ staining on the mantle. For instance, what is the rationale for the claim that proliferative cells give rise to the mantle? The trajectory inference approach used (Monocle) would likely yield a similar result regardless of the reference cell type, so additional justification is needed.
We agree that our reliance on previous studies for functional and experimental characterization requires clearer justification and integration. In the revised manuscript, we will compile a new supplementary table summarizing marker genes with available experimental validation, including their associated cell types, literature sources, and experimental methods. For SEC populations, we will select representative marker genes and perform FISH to validate their spatial localization, thereby providing independent support for cell identity.
Regarding trajectory inference, we agree that methods such as Monocle are sensitive to assumptions. We will clarify the rationale for root cell selection, test alternative root assignments to assess robustness, and revise our interpretation to avoid strong lineage claims. Rather than stating that proliferative cells give rise to mantle cells, we will describe the observed trajectory as being consistent with a potential developmental relationship, while acknowledging that this does not constitute direct evidence of lineage progression.
(2) More broadly, I find that the functional properties of the identified cell types and their relationship to the expressed genes deserve more detailed discussion. For example, at L100, several genes are mentioned, but their functional roles are not discussed. Similarly, the basis for annotating the proliferative cells is not explained. How was gene orthology assessed? Throughout the manuscript, vertebrate-style gene names are used without explicitly establishing orthology status in oyster, which should be addressed.
We thank the reviewer for this important comment. In the revised manuscript, we will expand the functional interpretation of key genes by incorporating available literature and, where possible, functional annotations. We will also clarify the basis for cell type annotation and explicitly describe the criteria used, including for proliferative cell populations (e.g. cell proliferation-associated markers).
Regarding gene annotation, gene names in oyster were assigned based on sequence similarity searches against the eggNOG database. In the revised manuscript, we will provide a comprehensive supplementary table linking gene IDs to their annotations, along with the corresponding database sources. In addition, we will clearly describe how orthology relationships were assessed, including the methods and criteria used (e.g. sequence similarity searches and orthology databases). Throughout the revised manuscript, we will ensure that the use of vertebrate-style gene names is accompanied by appropriate annotation information and does not imply unsupported one-to-one orthology relationships.
(3) More detail is needed on the methods and quality control for the single-cell data. The authors should clarify that the platform used (BMKMANU) is a droplet-based technology comparable in principle to Drop-seq. BMKMANU is not widely used in the field. How does it compare to 10x Genomics in terms of sensitivity and cell recovery? The authors appear to use the 10x Chromium cellranger pipeline for data analysis, which suggests compatibility, but this should be stated explicitly. Additionally, no information is provided on the number of sequencing runs or biological replicates, nor on how reproducible the results are across samples.
In the revised manuscript, we will expand the Methods section to provide a clearer and more detailed description of the experimental and analytical procedures. BMKMANU is a droplet-based single-cell RNA-seq platform, conceptually comparable to Drop-seq and similar in principle to 10x Chromium. We will also explicitly state that the data generated are compatible with the Cell Ranger pipeline, which was used for downstream processing and analysis. Although BMKMANU is less widely used than 10x Genomics platforms, it has been successfully applied in several recent studies (e.g. Li et al., 2024: https://doi.org/10.1007/s11427-023-2548-3; Li et al., 2025: https://doi.org/10.1038/s41559-025-02642-6; Wei et al., 2024: https://doi.org/10.1038/s41467-024-46780-0), demonstrating its applicability for single-cell transcriptomic analyses across different biological systems. Regarding platform performance, based on technical information provided by the manufacturer, BMKMANU shows comparable sensitivity and cell capture efficiency to 10x Genomics platforms (http://www.biomarker.com.cn/zhizao/dg1000danxibao). In this study, the mantle sample was obtained from a single individual oyster and processed in a single sequencing run, without batch effects introduced by multiple runs. We will clearly state this in the revised manuscript. In addition, we will provide detailed quality control metrics, including the number of cells retained, gene detection rates, and filtering criteria.
(4) A limitation of the phylostratigraphic analysis is that it is restricted to mantle tissue, making it difficult to place the results in a whole-organism context. How do the age profiles of mantle-expressed genes compare to those of more evolutionarily conserved tissues, such as the nervous system? I appreciate the methodological and experimental constraints, but this is a genuine limitation of the study. The authors could at least discuss it explicitly, and ideally consider generating a broader single-cell atlas of the oyster to provide this comparative baseline.
We agree that restricting the phylostratigraphic analysis to mantle tissue represents a limitation when attempting to place our findings in a whole-organism evolutionary context. In the revised manuscript, we will explicitly acknowledge this limitation and expand the Discussion to address how gene age profiles in mantle tissue may differ from those in more evolutionarily conserved tissues. In particular, we will clarify that the enrichment of younger, lineage-specific genes observed in shell-forming cells may reflect tissue-specific functional specialization, and therefore should not be directly generalized to other cell types.
We acknowledge that a broader single-cell atlas spanning multiple tissues would provide an important comparative baseline for interpreting gene age patterns across the organism. While generating such a dataset is beyond the scope of the present study, we will highlight this as an important direction for future research.
(5) Have the authors considered the potential importance of lineage-specific gene duplication? It is well established that spiralians, including oysters, have undergone extensive lineage-specific duplication of transcription factors such as homeobox genes, and many structural shell-associated proteins may similarly have been duplicated. This could be relevant to interpreting both the phylostratigraphic results and the expansion of secretory gene families.
We thank the reviewer for this insightful suggestion. Lineage-specific gene duplication is likely to play an important role in shaping both transcription factor repertoires and shell-associated gene families in spiralians, including oysters. In the revised manuscript, we will incorporate a discussion of lineage-specific duplication, particularly in relation to transcription factors and biomineralization-related proteins. We will also, where feasible, explore its potential contribution to our observations and highlight how such duplications may drive the expansion and diversification of secretory gene families.
eLife Assessment
This study presents a valuable perspective on platelet-mediated fibrin compaction, proposing that fibrin fibers undergo "winding" or coiling, an intriguing framework with potential implications for thrombosis and clot mechanics. However, the evidence supporting an active platelet-driven winding mechanism remains incomplete, relying largely on correlative observations without direct or quantitative validation of the proposed dynamics. Overall, the work is thought-provoking and of clear interest to the field, but stronger mechanistic evidence will be required to substantiate the central claims.
Reviewer #1 (Public review):
This paper reports a previously unrecognized mechanism by which platelets compact fibrin fibers during clot retraction. Rather than simply pulling on fibers, the authors propose that platelets generate swirling motions that wind and loop fibrin into dense structures.
While the results are intriguing, the underlying physical mechanism remains unexplained. In particular, it is unclear how platelets generate swirling motion capable of inducing fibrin coiling, especially when suspended in 3d fibrin mesh. This raises concerns about the conclusions. Also, does fibrin have inherent chirality or structural asymmetry that could promote coiling independently of platelet activity? Furthermore, platelet retraction typically involves platelet aggregation rather than isolated cells, and it is unclear how fibrin coiling would proceed in clustered platelets.
Reviewer #2 (Public review):<br /> <br /> Summary:
Grichine et al. investigate platelet-mediated fibrin compaction using human donor platelets and propose a novel mechanistic model in which platelets generate contractile forces and wind fibrin fibers into compact coiled structures. Using a combination of 2D spread assays, 3D clot imaging via expansion microscopy, live-cell imaging, and computational modelling, the authors present evidence of cage-like fibrin architectures, coiled-fibre morphologies, and platelet-centred "rosette" structures present during fibre compaction. They further suggest that actomyosin-driven cytoskeletal dynamics, potentially involving rotational or swirling motion, underlie this proposed winding mechanism, analogous to DNA looping and compaction. The study addresses an important and longstanding question in thrombosis and hemostasis and offers a conceptually novel perspective on clot compaction.
Strengths:
The integration of multiple imaging modalities is a notable strength of this paper. In particular, the 2D fiber-retraction assay provides a useful model for understanding the spatio-temporal dynamics of platelet-mediated fibrin compaction, which can be applied to other systems and may yield detailed mechanistic insights into biological processes. The live-imaging approaches are particularly well executed and offer valuable dynamic insight.
Weaknesses:
The primary weakness of this paper lies in its descriptive nature and its reliance on correlative rather than causal evidence. Several interpretations are not uniquely supported by the data presented. For example, the categorisation of fibrin accumulation in 2D assays as "fiber winding" and "fibre compaction" remains descriptive without establishing winding as a mechanism. Alternative mechanisms, such as circular bundling, stacked fibers under tension, or fibrin crosslinking-induced aggregation, are neither excluded nor investigated. Although the authors present compelling live imaging, establishing winding as a dynamic phenotype would require quantitative analyses, such as measuring angular velocities and coiling rates. The use of a second fluorophore-labelled fibrin population could further strengthen evidence for rotational dynamics. Similarly, the inference of rotational contractility or actomyosin "swirling", based on chiral actin organisation and blebbistatin treatment, is not sufficiently supported to conclude that platelets actively wind or loop fibrin fibers. The mathematical model, while complementary and well-constructed, relies on multiple assumptions and lacks predictive validation.
Appraisal:
While the authors successfully document intriguing fibrin architectures and provide a compelling descriptive framework, they do not fully demonstrate a mechanistic model of active fibrin winding by platelets. The conclusions regarding platelet-driven winding and rotational dynamics are not sufficiently supported by direct or quantitative evidence. To substantiate these claims, the study would benefit from experiments that directly link platelet dynamics to fibrin organisation, including coordinated measurements of platelet motion and fibre rearrangement. As it stands, the results are suggestive but do not definitively support the proposed mechanism.
Discussion and Impact:
Despite these limitations, the study addresses an important question in thrombosis and hemostasis and introduces a potentially impactful conceptual framework for understanding clot compaction. The imaging approaches and datasets presented will be valuable to the community, particularly for researchers interested in platelet mechanics and fibrin organisation. However, the overall impact will depend on whether the proposed mechanism can be more rigorously validated. In its current form, the study presents an interesting and thought-provoking model, but would benefit from either stronger experimental support for the proposed mechanisms or a more cautious interpretation of the findings.
Reviewer #3 (Public review):
Summary:
This work aims to understand the mechanisms that platelets use to interact with and compact fibrin fibers during clot formation. This is an important process during wound healing, and recent work has demonstrated that platelets play a critical role in generating the force required to drive the accumulation of fibrin. The authors argue that current models are insufficient to account for the observed reduction in clot volume and propose that platelets actively 'wind up' these fibers by undergoing myosin-dependent rotation. While interesting, the experiments performed by the authors do not directly test this mechanism, and further evidence is required to support their claims.
Weaknesses:
(1) The motivation to switch from the system used in Figures 1 and 2 to the '2D fiber-retraction assay' is not clear. While the authors state that this system has 'reduced complexity', the differences between these assays appear to disrupt the 'cage-like' organization of fibrin around platelets shown in Figures 1 and 2 (compare images in Figure 2 with those in Figure 4). An in-depth comparison of two methods is needed to support the conclusions from the 2D system. Furthermore, the change in plasma volume (Figure 2 vs Figure 7) should also be tested - the authors state that this increases fibrin fiber formation, but this is not quantified or demonstrated in the figures. Notably, this appears to change the morphology of the fibrin fibers shown (comparing Figure 2 and Figure 7).
(2) It is unclear how the classification of platelets as 'fiber-winding' versus 'fiber compaction' differs in Figure 2. The criteria used for these classifications should be stated. Further, it seems premature to characterize fibers as wound without having established this earlier in the manuscript.
(3) Is the 'gearwheel' different from the 'cage' of fibrin fibers? They appear similar, but it is difficult to distinguish between them with only qualitative descriptions of these phenotypes.
(4) The quantification of platelet extensions in Figure 9 is confusing. While those in 9A are clear, those in 9B are not. For instance, what is the difference between #7 and #8 in the middle panel of 9B? It does not seem like #8 is labeling an extension.
(5) It is unclear what the modeling accomplishes, as there is no comparison between the results of these simulations and their experiments.
(6) The data presented in Figure 12 provides the most direct support for their mechanism, but falls short of directly testing their claims. These experiments should be repeated to include blebbistatin to test the contribution of myosin and include quantitative rather than qualitative comparisons of these experiments.
Author response:
Public Reviews:
Reviewer #1 (Public review):
This paper reports a previously unrecognized mechanism by which platelets compact fibrin fibers during clot retraction. Rather than simply pulling on fibers, the authors propose that platelets generate swirling motions that wind and loop fibrin into dense structures.
While the results are intriguing, the underlying physical mechanism remains unexplained. In particular, it is unclear how platelets generate swirling motion capable of inducing fibrin coiling, especially when suspended in 3d fibrin mesh. This raises concerns about the conclusions.
We explained our hypothesis concerning the physical mechanism of how platelets may generate the swirling motion, lines 200-215 and in the discussion under "ideas and speculations". We will provide, however, a more detailed explanation about this process in the revised version.
The reviewer is right, it is difficult to imagine how platelets in a 3D fibrin mesh can accumulate fibers at the base of their extensions to form a cage-like fiber organisation around the center of the platelets. We therefore developed the 2D fiber-retraction assay, which we believe provides important insights for the coiled fiber accumulations above spread platelets in the 2D situation but also provides a framework for interpreting similar processes that may occur within a 3D clot. In response, we will place greater emphasis on clarifying and strengthening the comparison between the potential mechanistic aspects in the 2D and 3D assays, in order to better support our proposed model.
Also, does fibrin have inherent chirality or structural asymmetry that could promote coiling independently of platelet activity?
Yes, double stranded fibrin protofibrils have a helical twist [1]. Furthermore, a clot formed in the absence of platelets and other cellular components shows intrinsic tensile forces [2]. However, we show that inhibition of actomyosin actions prevents fibrin fiber accumulation in the 2D fiber-retraction assay providing evidence that platelet actions are necessary to observe the coiled fibers above spread platelets.
Furthermore, platelet retraction typically involves platelet aggregation rather than isolated cells, and it is unclear how fibrin coiling would proceed in clustered platelets.
Under the in vitro fiber retraction conditions used in our study (constrained or unconstrained clots or even in the 2D assay) individual platelets are homogenously distributed within the forming clot or on the coverslip. Therefore, there are no big platelet aggregates or clusters of platelets under our experimental conditions and the results can only demonstrate how individual platelets act on the fibrin fibers. We will emphasize this point in the revised version.
Reviewer #2 (Public review):
Summary:
Grichine et al. investigate platelet-mediated fibrin compaction using human donor platelets and propose a novel mechanistic model in which platelets generate contractile forces and wind fibrin fibers into compact coiled structures. Using a combination of 2D spread assays, 3D clot imaging via expansion microscopy, live-cell imaging, and computational modelling, the authors present evidence of cage-like fibrin architectures, coiled-fibre morphologies, and platelet-centred "rosette" structures present during fibre compaction. They further suggest that actomyosin-driven cytoskeletal dynamics, potentially involving rotational or swirling motion, underlie this proposed winding mechanism, analogous to DNA looping and compaction. The study addresses an important and longstanding question in thrombosis and hemostasis and offers a conceptually novel perspective on clot compaction.
Strengths:
The integration of multiple imaging modalities is a notable strength of this paper. In particular, the 2D fiber-retraction assay provides a useful model for understanding the spatio-temporal dynamics of platelet-mediated fibrin compaction, which can be applied to other systems and may yield detailed mechanistic insights into biological processes. The live-imaging approaches are particularly well executed and offer valuable dynamic insight.
Weaknesses:
The primary weakness of this paper lies in its descriptive nature and its reliance on correlative rather than causal evidence. Several interpretations are not uniquely supported by the data presented. For example, the categorisation of fibrin accumulation in 2D assays as "fiber winding" and "fibre compaction" remains descriptive without establishing winding as a mechanism.
In the revised version, we will avoid the terms fiber winding/compaction when introducing the 2D fiber-retraction assay (figure 3) to better align with the level of evidence, since coiled fibers cannot be distinguished in this figure. However, coiled fibers above spread platelets are clearly visible in figure 4 and 8 and dynamic fiber rotations or winding are observed in figure 12 and video 9. These observations will be presented more cautiously, as indicative rather than definitive evidence of a winding mechanism.
Alternative mechanisms, such as circular bundling, stacked fibers under tension, or fibrin crosslinking-induced aggregation, are neither excluded nor investigated.
For fibrin fiber bundling, staggered or crosslinked protofilaments no platelet actions are necessary as described previously [2, 3] . Since we observed a clear difference between +/- blebbistatin conditions in the 2D fiber-retraction assay, the fiber compaction we observe depends on platelet actions. Consequently, we consider these alternative mechanisms unlikely based on our data. This will be stated explicitly in the results section.
Although the authors present compelling live imaging, establishing winding as a dynamic phenotype would require quantitative analyses, such as measuring angular velocities and coiling rates.
We will incorporate quantitative measurements to complement the observations obtained from live imaging. It is important to note, however, that angular velocities and coiling rates are likely influenced by the number of fiber–fiber contacts present at the time coiling occurs. Specifically, an increased number of contacts is expected to elevate tension within the network, thereby modulating the forces generated by platelets and, consequently, affecting both velocity and coiling dynamics.
The use of a second fluorophore-labelled fibrin population could further strengthen evidence for rotational dynamics.
These live videos are quite difficult to acquire because of the following reasons:
Small platelet size
Heterogeneity of platelets within the population (10 d half-life, old platelets may not be able to compact fibers efficiently).
The speed of the process and the time needed to adjust parameters for image acquisition, necessitates an arbitrary choice of the acquisition window and only one acquisition (90 min) per sample preparation is possible.
Furthermore, the laser induced illumination can perturb the observed processes. We therefore use high-spatial-resolution 3D confocal time-lapse imaging, performed in photon-counting mode with very low laser excitation.
For these reasons, the use of additional markers would be technically challenging and could perturb the delicate equilibrium and dynamics of the process under investigation.
Similarly, the inference of rotational contractility or actomyosin "swirling", based on chiral actin organisation and blebbistatin treatment, is not sufficiently supported to conclude that platelets actively wind or loop fibrin fibers.
Importantly, in the 2D fiber-retraction assay, we do not propose that the rotational actomyosin activity leads to a contractility of the platelets which would allow fiber retraction. Rather, we suggest that cytoskeletal actomyosin swirling (as demonstrated for nucleated cells by Bershadsky's team) can induce rotational dragging of extracellular bound fibrin fibers around the pseudonucleus of spread platelets thereby promoting accumulation of fibrin fibers. Consistent with this interpretation, inhibition of myosin by blebbistatin prevents the accumulation of fibrin fibers above spread platelets in the 2D fiber-retraction assay (Fig. 3).
The mathematical model, while complementary and well-constructed, relies on multiple assumptions and lacks predictive validation.
We thank the reviewer for this insightful comment and acknowledge that the proposed model relies on several important assumptions. In our view, the most significant assumption is that integrin molecules undergo rotational downstream motion as a consequence of their coupling to the swirling cytoskeleton. To assess the necessity and impact of these assumptions, we will perform additional calculations and include the results in the Supplementary Information. These analyses will also provide further validation of the proposed model and underlying mechanism. At the same time, it is important to emphasize that the primary purpose of the model was to examine whether the hypothetical swirling dynamics of the cytoskeleton, together with the associated receptors, could in principle reproduce the experimentally observed fibrin organization.
Appraisal:
While the authors successfully document intriguing fibrin architectures and provide a compelling descriptive framework, they do not fully demonstrate a mechanistic model of active fibrin winding by platelets. The conclusions regarding platelet-driven winding and rotational dynamics are not sufficiently supported by direct or quantitative evidence. To substantiate these claims, the study would benefit from experiments that directly link platelet dynamics to fibrin organisation, including coordinated measurements of platelet motion and fibre rearrangement. As it stands, the results are suggestive but do not definitively support the proposed mechanism.
Discussion and Impact:
Despite these limitations, the study addresses an important question in thrombosis and hemostasis and introduces a potentially impactful conceptual framework for understanding clot compaction. The imaging approaches and datasets presented will be valuable to the community, particularly for researchers interested in platelet mechanics and fibrin organisation. However, the overall impact will depend on whether the proposed mechanism can be more rigorously validated. In its current form, the study presents an interesting and thought-provoking model, but would benefit from either stronger experimental support for the proposed mechanisms or a more cautious interpretation of the findings.
We agree that the proposed mechanism requires further validation. In the revised manuscript, we will therefore present a more cautious and explicitly hypothesis-driven interpretation of the mechanism. We hope that the publication of our observations will be of interest to researchers in the field of thrombosis and clot mechanics who possess the specialized tools and expertise necessary to rigorously evaluate and either substantiate or refute the proposed mechanistic model.
Reviewer #3 (Public review):
Summary:
This work aims to understand the mechanisms that platelets use to interact with and compact fibrin fibers during clot formation. This is an important process during wound healing, and recent work has demonstrated that platelets play a critical role in generating the force required to drive the accumulation of fibrin. The authors argue that current models are insufficient to account for the observed reduction in clot volume and propose that platelets actively 'wind up' these fibers by undergoing myosin-dependent rotation. While interesting, the experiments performed by the authors do not directly test this mechanism, and further evidence is required to support their claims.
Weaknesses:
(1) The motivation to switch from the system used in Figures 1 and 2 to the '2D fiber-retraction assay' is not clear. While the authors state that this system has 'reduced complexity', the differences between these assays appear to disrupt the 'cage-like' organization of fibrin around platelets shown in Figures 1 and 2 (compare images in Figure 2 with those in Figure 4). An in-depth comparison of two methods is needed to support the conclusions from the 2D system.
We agree that the cage-like fibrin organization around platelets is disrupted in the 2D fiber-retraction assay when platelets are completely spread on the coverslip before they have encountered fibrin fibers (Fig. 4). However, some platelets form the same number of extensions as platelets in a 3D clot (Fig. 9 A, B) and are not completely spread on the glass surface. For these platelets a cage-like fibrin organisation is retained under the 2D conditions (Fig. 5 and 6). However, the fiber density at the base of the bulbs is higher in the 2D assay than under the constrained 3D clot retraction conditions (Fig. 1C and Fig. 2), probably because in the 2D condition the fibers are less constrained and readily available for compaction.
Furthermore, the change in plasma volume (Figure 2 vs Figure 7) should also be tested - the authors state that this increases fibrin fiber formation, but this is not quantified or demonstrated in the figures. Notably, this appears to change the morphology of the fibrin fibers shown (comparing Figure 2 and Figure 7).
We thank the reviewer for raising this point. We would like to clarify that Figure 2 and Figure 7 correspond to two distinct experimental setups: the constrained clot retraction assay (Figure 2) and the 2D fiber-retraction assay (Figure 7). As such, they are not directly comparable. We understand, however, that the reviewer is likely referring to the apparent differences between Figures 3–6 (lower plasma volume, higher fiber density) and Figures 7–8 (higher plasma volume, lower apparent fiber density).
The reduced number of visible fibers in the latter condition is not solely a consequence of plasma volume per se, but rather results from the formation of a labile fibrin gel at higher plasma concentrations, which is lost during the fixation and aspiration steps. This effect was initially observed across samples from two donors with differing plasma fibrinogen levels. In one case, an unusually low fibrinogen concentration allowed the addition of higher plasma volumes without inducing gel formation. In contrast, in the other sample, a more typical fibrinogen level resulted in gel formation under the same conditions.
Importantly, we performed all experiments using matched donor plasma and platelets. As a result, the precise fibrinogen concentration could not be determined prior to experimentation. Nonetheless, post hoc measurements confirmed that fibrinogen levels in most donor samples fell within the normal physiological range, which allowed us to always use the same plasma volumes for low and high plasma concentrations (4ul/ml PBS and 7 ul/ml PBS, respectively) except for one donor as mentioned above.
(2) It is unclear how the classification of platelets as 'fiber-winding' versus 'fiber compaction' differs in Figure 2. The criteria used for these classifications should be stated. Further, it seems premature to characterize fibers as wound without having established this earlier in the manuscript.
The reviewer probably refers to figure 3 and he is right; it is premature to mention fiber winding at this stage of the results section (see our response to reviewer #2). In the revised version, we will therefore present the criteria used to classify the different degrees of fiber accumulations without referring to fiber winding.
(3) Is the 'gearwheel' different from the 'cage' of fibrin fibers? They appear similar, but it is difficult to distinguish between them with only qualitative descriptions of these phenotypes.
The "gearwheel" is observed for completely spread platelets in the 2D fiber-retraction assay and a figure illustrating our hypothetical speculations to compare the 2D gearwheel with the 3D clot situation is presented in the discussion under the "Ideas and Speculations" paragraph (Fig. 13). We will give a more comprehensive explanation in the revised version.
(4) The quantification of platelet extensions in Figure 9 is confusing. While those in 9A are clear, those in 9B are not. For instance, what is the difference between #7 and #8 in the middle panel of 9B? It does not seem like #8 is labeling an extension.
For the platelet shown in the middle panel of Figure 9B, the extensions cannot be clearly distinguished in the MIP (Maximum Intensity Projection) image because extension #8 is positioned above extension #7 and is therefore superimposed in the projection. However, the two extensions can be differentiated when examining the 3D image stack (Video 4). As indicated in the figure legend, the number of extensions was determined manually by scrolling through the z-stack image sequence. In the revised version, we will also define the abbreviation “MIP” as Maximum Intensity Projection.
(5) It is unclear what the modeling accomplishes, as there is no comparison between the results of these simulations and their experiments.
We thank the reviewer for this valuable concern. We chose not to combine the experimental fibrin organization and the modeling results within the same figure panel, as the resulting image would be too complex and difficult to interpret. However, we will provide a more detailed comparison between the experimental observations and the modeling results in the Results section. It is also important to emphasize that the comparison between the model and the experimental data was intended to be primarily qualitative rather than quantitative.
(6) The data presented in Figure 12 provides the most direct support for their mechanism, but falls short of directly testing their claims. These experiments should be repeated to include blebbistatin to test the contribution of myosin and include quantitative rather than qualitative comparisons of these experiments.
As mentioned already above, these live videos are quite tricky to acquire because of the following reasons:
Small platelet size
Heterogeneity of platelets within the population (10 d half-life, old platelets may not be able to compact fibers efficiently).
The speed of the process and the time required to optimize imaging parameters, necessitate the selection of an arbitrary acquisition window. Consequently, only a single acquisition of approximately 90 min can be performed per sample preparation, with no guarantee that relevant platelet-fibrin interactions can be acquired in the acquisition window.
Furthermore, after blood donation, the first sample is usually ready to be acquired around 3 pm, acquisition time 90 min. At least 10 successful acquisitions per condition would be required to ensure statistical robustness, but maximal 4 can be acquired per donor, because platelet samples start to deteriorate within twelve hours after blood donation.
Taken together, the intrinsic heterogeneity of the platelet population, the low likelihood of capturing informative events, and the limited availability of suitable imaging resources at our institute render a robust and quantitative comparison between conditions with and without blebbistatin extremely challenging, if not impractical, within a reasonable timeframe.
t
Typo here
SpaceXAI has signed an agreement with Anthropic to provide access to Colossus 1
🥹
❤️🔥🇺🇸❤️🔥
Micro-economie
neo-klassieken
клиентам через амбассадоров
Заменить амбассадоров на курьеров
Note: This response was posted by the corresponding author to Review Commons. The content has not been altered except for formatting.
Learn more at Review Commons
Reviewer 1
Point
Summary
Response
1.1
Overall, the study lacks well-controlled experiments comparing hypoxia induced by DMOG with hypoxia induced by 1% O₂ for assessing ERα occupancy throughout.
To assess whether DMOG-induced changes in ERα occupancy reflect bona fide hypoxia, we measured ERα binding by ChIP-qPCR under 1% oxygen over 48 hours, compared to normoxic (21% oxygen) cells and input controls in matched cells at the GREB1 and TFF1 loci. Our findings demonstrate that 1% oxygen treatment recapitulates the ERα binding changes observed with DMOG, at the time points of our RNA-seq experiments.
We have included these results in __Figure 1F __of the preliminary revision of the manuscript.
1.2
Lack of evidence for other co-transcription factors impact under hypoxia HIF's in Fig1.
We thank the reviewer for this comment. We have clarified that motif enrichment analysis is included to characterise the sequence context of ERα binding sites and to confirm enrichment of known ER-associated motifs (e.g. EREs), rather than to infer functional involvement of additional transcription factors under hypoxia. Corresponding interpretative statements have been removed from the Results and restricted to the Discussion.
1.3
Lack of evidence for DMOG induce HIF protein expression in MCF7 cells.
To confirm DMOG induces HIF-protein expression we have analysed HIF1α and HIF2α protein levels by western blot. We have included these in __Supplementary Figure S1A __within the preliminary revision to address this concern.
1.4
Figure 1: ATAC-seq was performed under 1% O₂, whereas ChIP-seq was conducted with DMOG treatment, making these conditions not directly comparable.
We acknowledge that the ERα ChIP-seq (DMOG) and ATAC-seq datasets were generated under different conditions and are therefore not directly comparable. To address this, we have performed ChIP-qPCR under bona fide hypoxia (1% oxygen) at canonical ERα target loci (TFF1 and GREB1), demonstrating that the directionality of ERα binding changes observed with DMOG is recapitulated under physiological hypoxia. These data provide a direct comparison of ERα occupancy across conditions and support the use of DMOG as a proxy for hypoxia in our ChIP-seq experiments.
If requested, we are willing to perform ATAC-seq at 16 h under 1% oxygen. However, because the original dataset was generated under 0.1% oxygen, and canonical ERα-bound sites show minimal accessibility changes under severe hypoxia, we anticipate limited additional insight from repeating this experiment.
1.5a
Figure S1: ERα ChIP lacks estradiol (E2) treatment in MCF7 cells with or without DMOG.
The statement that the ERα ChIP samples lack estrogen treatment is incorrect. Estradiol was not an experimental variable and cells were intentionally maintained under estrogen-rich conditions to preserve tumour-relevant ERα activity.
We have now clarified within the preliminary revision by stating that cells were routinely cultured in “estrogen-rich Dulbecco’s Modified Eagle Medium” in the methods section, and clarified the use of estrogen-rich conditions in the Figure S1 legend.
1.5b
The single-gene examples of DMOG effects shown in Fig. S1A are not significant.
The peak illustrated in Figure S1A (now Figure S1D) __is intended to provide a visual confirmation of peak calling and enrichment patterns underlying the genome-wide redistribution observed in __Figure 1. The peak was called by the MACS2 pipeline (code available from https://doi.org/10.5281/zenodo.17221105) with a log10(q-value) = 268.5, which passes the MACS2 cut-off q
1.6a
Fig. S2 lacks 1% O₂ conditions,
We wish to clarify that Figure S2 (now Figure S4) serves as quality control specifically for the DMOG-treated ChIP-seq dataset presented in Figure 1C. The purpose of the plot is to visualize unfiltered motif enrichment to confirm that the identified peaks represent bona fide ERα binding events within the DMOG condition. Motif enrichment under a 1% oxygen environment would not provide this validation. In all cases the ERE is the most significantly enriched motif.
With respect to ERα binding under 1% oxygen, we have now assessed this via targeted ChIP-qPCR validation (Figure 1F).
1.6b
Fig. S3 lacks DMOG-induced HIF factor assessments.
The DMOG-induced changes in HIF1α and HIF2α expression are shown in the__ Figure S1__ of this revision proposal and have been incorporated into the manuscript as part of the changes described in response 1.3.
1.7a
Figure S4: Estradiol (E2) treatment is missing from the controls, and the figure labeling is of poor quality.
We have substantially improved the labelling of Figure S4, now__ Figure S6.__
Additionally, we have clarified that all samples were cultured in estrogen-rich media and treated with either vehicle control or 100 nM fulvestrant; thus estrogen is present in all conditions including the controls.
1.7b
Hypoxic conditions for assessing ER status and appropriate controls are also lacking.
We agree that monitoring ERα stability under hypoxic conditions is essential.
We provided a western blot assessment of ERα protein levels at 0, 8 and 48 hours of treatment with 1% oxygen or DMOG, compared to normoxic controls, included as Supplementary Figures S1B, C in the preliminary revision.
These demonstrate the cells remain positive for ERα protein expression at 0, 8 and 48h.
1.8
Figure S5: The description of fulvestrant treatments under hypoxic conditions is unclear.
We thank the reviewer for this comment. To clarify the experimental design, we now signpost the reader in the figure legend of Figure S5 (now S7) to the schematic diagram provided in Figure 3B, and provide a summary stating the experiment employed a factorial design combining a 96-hour fulvestrant treatment with exposure to 1% oxygen for the final 48 hours.**
1.9
Supplemental legends: These require major revision; they are of poor quality and lack statistical details and references to biological replicates.
We have extensively revised all supplementary figure legends to ensure clarity and precision.
1.10
Overall comparisons throughout the manuscript are weak; the figures appear sloppy and lack sufficient effort in presentation.
Following this comment, we carefully reviewed the presentation of all figures throughout the manuscript. We improved the organisation and labelling of the Supplementary Figures to facilitate clearer comparison of the data. In particular, full western blots are now clearly annotated and supplementary legends have been expanded to provide sufficient context for each figure to be interpreted independently.
1.11
i) In general, the manuscript in its present form does not greatly contribute from published work as the ERα cistrone is well documented work studied for its role in regulating gene expression, particularly in ERα-positive breast cancer.
ii) Additionally, a lack of a thorough comparison between DMOG and or 1 %oxygen induce hypoxia in the MCF7 ER+ model, diminished initial interest in the manuscript.
iii) The lack of considering estradiol exposure under hypoxic conditions with either 1%oxygen and or DMOG also limits relevance to patients with ER+ BrCa.
iv) The ERα epigenomic profile has been extensively studied including work under hypoxic conditions.
i) We respectfully disagree that the manuscript does not extend prior work. Despite extensive characterisation of ERα, its role in shaping hypoxia-driven transcription in ER+ breast cancer has not been defined. Here, we identify an ERα-dependent hypoxic response (EDHR), demonstrating a reciprocal interaction between hypoxia and ERα activity.
ii) In revision, we address concerns regarding DMOG by validating ERα binding under 1% oxygen using ChIP-qPCR thereby confirming our result in bona fide hypoxia. Additionally, all RNA-seq and functional assays, including ENaC targeting, were performed under 1% oxygen in the original manuscript.
iii) All experiments were conducted under estrogen-complete conditions, now explicitly clarified, reflecting tumour-relevant ERα activity.
iv) Together, these data establish a reciprocal interaction between ERα and hypoxia and uncover a targetable vulnerability in hypoxic ER+ breast cancer, linking transcriptional regulation to therapeutic opportunity.
Reviewer 2
No.
Summary
Response
General Comments
2.1
ENAC is proposed as a therapeutic vulnerability based on amiloride sensitivity assays. Additional experiments are required, such as western blot validation of ENaC regulation under hypoxia and loss-of-function approaches to assess its contribution to the phenotype.
We agree that further validation of ENaC involvement would strengthen this observation. We will assess ENaC protein levels under 1% hypoxia ± fulvestrant by western blot and perform siRNA-mediated depletion of ENaC subunits to test their contribution to the hypoxia-specific amiloride-sensitive phenotype by viability assay (see also response 3.3).
2.2
Fulvestrant is used to dissect ERa dependency. However, as a SERD, it may alter chromatin and transcription independently of a simple loss of ERα. Addition control would strengthen interpretation.
The experimental design already controls for potential fulvestrant-specific transcriptional effects, as all four conditions (± hypoxia, ± fulvestrant) were included. EDHR genes were defined based on induction under hypoxia, loss of this induction following ERα degradation, and absence of residual hypoxic induction in the presence of fulvestrant. Consistent with this, SCNN1B and SCNN1G do not show significant fulvestrant-responsive changes under normoxia (Figure 5C,D).
We also note that fulvestrant has been shown to induce minimal global chromatin remodelling (Guan et al., 2019), supporting its use to assess ERα dependency without broadly confounding chromatin accessibility; this reference is now included in the manuscript.
2.3
The molecular mechanism by which ERα modulates the hypoxic transcriptome, specifically how ERα and HIF pathways converge at ENAC loci should be more studied.
We further examined the potential convergence of ERα and hypoxic signalling at the ENaC loci (included as __Figure 5E __in the revision proposal) showing genome browser views of the SCNN1G and SCNN1B loci, highlighting hypoxia-induced HIF1α binding and ERα association at these sites.
To further support this, we will perform RT-qPCR validation of SCNN1G and SCNN1B expression following treatment ± IOX5 and ± fulvestrant. IOX5 is a selective PHD inhibitor that stabilises HIF proteins, enabling us to assess the contribution of HIF signalling independently of other oxygen-dependent effects associated with hypoxia.
2.4
In addition, to assess the relevance of this work for luminal breast cancer and ERα expression, specific validation in TNBC should be performed
To assess the clinical relevance of SCNN1B and SCNN1G in ER-positive and ER-negative subgroups, we performed Cox proportional hazards analyses in TCGA and METABRIC cohorts individually, including ER status and stratifying by ER-positive and ER-negative cases (Figure 6C). These analyses support the association of SCNN1G with poorer relapse-free survival specifically in ER-positive patients.
2.5
The authors should provide RT-qPCR validation of the key EDHR genes, especially since this signature is later used for downstream analyses.
We agree that independent validation would strengthen these findings. We will perform RT-qPCR validation of key EDHR genes (including SCNN1B and SCNN1G) under ± hypoxia and ± fulvestrant conditions to confirm ERα-dependent hypoxic induction.
Limitations
2.6
Reprogramming of the ERα cistrome under cellular stress is well documented. The study extends these ideas but does not clearly demonstrate a new mechanistic paradigm, particularly because the EDHR is defined primarily through omics approaches without strong mechanistic validation. In addition, we have to keep in mind that the study uses DMOG to model hypoxia-driven chromatin changes, but DMOG inhibits many 2-oxoglutarate-dependent dioxygenases non-selectively.
This makes it difficult to attribute ERα cistrome reprogramming specifically to hypoxia, rather than to broad off-target effects. The transcriptomic dataset is more convincing by need the validation suggested previously.
While ERα cistrome reprogramming has been described, our study demonstrates a reciprocal interaction in which ERα not only responds to hypoxia but actively shapes hypoxia-driven transcription, defining an ERα-dependent hypoxic response (EDHR).
We acknowledge the limitations of DMOG and have addressed this by validating key ERα binding events under bona fide hypoxia (1% oxygen) using ChIP–qPCR, confirming our findings under physiological conditions (response 1.1).
To further strengthen mechanistic insight, we will assess the requirement for HIF stabilisation using the selective PHD inhibitor IOX5, combined with RT-qPCR analysis of SCNN1G and SCNN1B ± IOX5 ± fulvestrant (response 2.3 and 2.5). In addition, we will validate the functional relevance of ENaC through protein-level analysis and siRNA-mediated depletion, as described in__ response 2.1.__
Together, these additions address concerns regarding DMOG specificity and provide further support for a functional interaction between ERα and hypoxic signalling.
Audience
2.7
Given its reliance on omics datasets and preliminary functional assays, the paper will likely appeal to a specialized audience in transcriptional regulation, hypoxia signalling, and ER+ breast cancer biology. However, the limited mechanistic depth and uncertain translational relevance due to the lack of in vivo validation, may reduce its impact for broader oncology or therapeutic-development audiences. Without stronger validation, the findings may be perceived as niche and mainly of interest to researchers focused on ERα chromatin dynamics rather than to the wider cancer research community.
The study incorporates multiple layers of human relevance, including spatial transcriptomic analyses demonstrating enrichment of EDHR within hypoxic tumour regions and survival analyses linking EDHR and ENaC expression to clinical outcome.
In revision, we address the reviewer’s concerns through targeted validation (ChIP-qPCR in hypoxia, western blotting, and RT–qPCR). Together, these additions strengthen the mechanistic and translational relevance of the study.
Reviewer 3
No.
Summary
Response
Major comments
3.1
The DMOG ChIP-seq provides a valuable first look at ERα redistribution. Since DMOG inhibits both HIF hydroxylases and oxygen-dependent demethylases, the driver of the observed changes remains ambiguous. It would help to include either ERα ChIP-seq under bona fide hypoxia or a selective PHD inhibitor condition (for example IOX5, as you discuss) to separate HIF stabilisation from broad demethylase inhibition. If ChIP-seq is not feasible, a brief ATAC validation at a small panel of gained and lost loci would still increase confidence.
We acknowledge that mimetics of hypoxia can introduce off-target effects. To address this, we have validated our ERα ChIP-seq findings using ChIP-qPCR at representative loci (TFF1 and GREB1), demonstrating consistent changes in ERα binding under bona fide hypoxia (1% oxygen) (now included in Figure 1F).
As acknowledged by the reviewer, ChIP-seq under these conditions is likely not feasible due to cell number constraints. We are willing to undertake ATAC-seq if required (as stated in response 1.1); however, we do not feel it would directly address ERα occupancy at these loci. We therefore consider our targeted ChIP-qPCR to be the most appropriate approach to validate ERα redistribution under hypoxia.
3.2a
The factorial RNA-seq is well designed and the attenuation analyses are clear. The EDHR selection is stringent and reproducible across two ER+ lines.
To support the claim of ERα dependence mechanistically, a small number of targeted perturbations would go far. For example,
i) confirm EDHR induction for SCNN1B and SCNN1G in hypoxia with and without fulvestrant by RT-qPCR
We agree that targeted validation would strengthen the mechanistic support for ERα dependence. We will perform RT-qPCR validation of SCNN1B and SCNN1G under hypoxia ± fulvestrant to confirm ERα-dependent hypoxic induction (see also response 2.5).
3.2b
ii) test whether short-term ERα knockdown reproduces the effect.
ERα dependency is already assessed through fulvestrant-mediated degradation within the factorial design, which provides a well-established and direct approach to evaluate ERα function. As EDHR genes are defined by loss of hypoxic induction following ERα degradation, this constitutes a robust assessment of ERα-dependent effects.
We will therefore focus on orthogonal validation through RT-qPCR (response__ 2.5__), together with additional mechanistic and functional analyses using IOX5 and ENaC perturbation (responses 2.1 and 2.3), rather than introducing an ERα knockdown approach, although we would consider this if required.
3.2c
iii) A complementary test with a HIF-1α or HIF-2α knockdown at one time point would help position EDHR relative to HIF.
This request aligns with point 2.3, which addresses the convergence of ERα and HIF signalling. While HIF knockdown under hypoxia would assess necessity, we will instead assess the contribution of HIF signalling using the selective PHD inhibitor IOX5, as this allows us to isolate HIF stabilisation from broader hypoxia-associated effects and avoids additional perturbation associated with transfection-based approaches. We will perform RT-qPCR analysis of SCNN1B and SCNN1G following treatment ± IOX5 ± fulvestrant to determine whether HIF stabilisation is sufficient to support ERα-dependent induction of EDHR genes.
3.3
The amiloride result is intriguing and consistent with a hypoxia-specific dependency. Because amiloride is pleiotropic, it would strengthen the conclusion to add one genetic and one pharmacological specificity control. A brief SCNN1B or SCNN1G knockdown in hypoxia should phenocopy the viability effect if ENaC contributes. In parallel, testing benzamil at sub-micromolar doses would provide a more ENaC-selective pharmacological readout. These can be performed in MCF7 and, resources permitting, in T47D.
To address the reviewer’s concern regarding pleiotropic effects, we propose (aligning with our__ response to 2.1__) to apply siRNA-mediated knockdown of SCNN1B and SCNN1G under hypoxia to determine whether this reproduces our observed viability effect, thereby providing direct evidence for ENaC involvement.
We agree that additional pharmacological validation could further support specificity, and would consider inclusion of a more ENaC-selective inhibitor if required.
3.4
The RFS associations for
SCNN1B and SCNN1G are compelling. It would be helpful to report whether the associations persist in a multivariable model that at least includes ER status, grade and nodal status where available, or to state clearly when this is not possible across merged datasets. Even a sensitivity analysis in TCGA with ER+ cases only would contextualise the hazard ratios.
We have analysed TCGA and METABRIC cohorts individually using Cox proportional hazards models, as this functionality is not available for merged datasets in KMplot. ER status was included in the models, and analyses were additionally stratified by ER-positive and ER-negative subgroups. The number of relapse events per subgroup is approximately 40; therefore, additional covariates such as grade and nodal status were not included given the limited number of events per model.
Within ER-positive patients, high SCNN1G expression is associated with poorer relapse-free survival (TCGA HR 1.45, p = 0.0027), while SCNN1B shows a similar trend that does not reach statistical significance. These analyses are presented in Figure 6C and in the results section of the preliminary revision, and support the findings from the Kaplan–Meier analysis.
3.5
The spatial association of EDHR with EMT hotspots is a nice piece of the story. A short clarification of how spot-level cell type composition was handled will help readers interpret proximity results. If cell type deconvolution scores are available in the source dataset, adding a sentence on whether EDHR enrichment tracks tumour epithelial content would be useful.
Spatial cell type composition and spot annotations were used as provided in the SpottedPy dataset, based on Cell2location-derived deconvolution scores and STARCH tumour annotations, without additional re-estimation.
To address the reviewer’s suggestion, we examined the relationship between EDHR enrichment and epithelial content and observed no significant correlation at the neighbourhood level.
These points have now been clarified in the manuscript.
3.6
Data processing for ChIP-seq and RNA-seq is documented and accessions are provided. The RNA-seq includes n=3 per condition, which is appropriate, and the correlation and LFC analyses are clearly presented. For the amiloride assay, the two-way ANOVA with interaction is appropriate; please add the exact n and whether experiments were independently repeated, and include the underlying values in a source table for transparency. These are small presentational edits rather than new experiments.
In the preliminary revision we have added a statement to the amiloride assay figure (Figure 6D) clarifying that n = 3 independent biological replicates were performed per condition. In addition, we now provide the underlying numerical values for this assay in Table S11.
3.7
A small, hypothesis-driven mechanistic link from EDHR to ENaC function would substantially elevate impact without becoming a long project. For example, testing whether hypoxia increases amiloride-sensitive Na⁺ current in MCF7 and whether fulvestrant abrogates that increase would directly connect the transcriptional and functional observations. If available, patch-clamp or a simple SBFI-based Na⁺ imaging readout could suffice.
We agree that directly linking EDHR to ENaC channel activity would further strengthen the mechanistic connection. We will prioritise genetic validation of ENaC function through siRNA-mediated depletion (response 2.1), which directly tests the requirement for ENaC in the hypoxia-specific viability phenotype.
We are willing to explore the feasibility of measuring the amiloride-sensitive Na+ currents under normoxia and acute hypoxia (via perfusion of cells with bathing solution bubbled with nitrogen during recording) ± fulvestrant to further connect hypoxic regulation to channel activity.
Minor Comments
3.8
Please show representative ERα ChIP-seq browser snapshots for at least one gained, one conserved and one lost locus alongside input for both conditions.
We have now included representative ERα ChIP-seq browser snapshots for gained, conserved, and lost loci, together with input controls for both conditions, in Figure S3 of the revised manuscript.
3.9
In Figure 1D, the ATAC-seq comparison uses 0.1% O₂ for 48 h while the RNA-seq uses 1% O₂. Briefly justify the choice and discuss any expected differences.
We thank the reviewer for this point. The ATAC-seq dataset was generated under 0.1% oxygen in the original study, whereas RNA-seq experiments in this work were performed at 1% oxygen to reflect tumour-relevant hypoxic conditions. The more severe hypoxia used for ATAC-seq would be expected to maximise detection of chromatin accessibility changes. Despite this, chromatin accessibility changes were limited, with ERα binding occurring predominantly at pre-accessible regions. This has now been clarified in the manuscript.
3.10
In the Methods for spatial analyses, specify the thresholds for hotspot calling and how the neighbourhood radius was chosen.
The neighbourhood parameter was set to 8, corresponding to the immediate neighbouring spots in Visium data, consistent with package guidance. We have clarified this in the manuscript text.
3.11
For the EDHR heatmap, consider marking the 14 consensus genes and indicating which belong to the ENaC module to aid readability.
We have marked the 14 EDHR consensus genes and indicated the ENaC module in the revised heatmap to aid readability.
3.12
Please report exact sample sizes and replicate numbers in all figure legends and provide a single table with all statistical tests, n, and p values.
We have reported exact sample sizes and replicate numbers in all relevant figure legends and included Table S11 summarising all statistical tests, sample sizes (n), and p values.
3.13
A schematic summarising the experimental timelines for ChIP-seq, RNA-seq and viability would help orient readers.
We have added timelines for these experiments as requested.
3.14
Minor copyedits: consistent formatting of O₂, gene symbols and reagent catalogue numbers.
We have standardised oxygen notation throughout the manuscript to use “oxygen” in the main text and “O2” where appropriate (e.g. figures).
Reagent catalogue numbers have now been standardised for consistency of presentation in the revised manuscript.
Gene and protein nomenclature were already formatted according to accepted conventions and were verified for consistency.
3.15
The manuscript is well referenced. Where you contrast your findings with long-term CoCl₂ hypoxia, a sentence on why acute DMOG and short-term 1% O₂ may reveal different ERα behaviours would help position the novelty.
We thank the reviewer for this suggestion. We have expanded the manuscript to clarify that acute hypoxia (1% oxygen) and DMOG treatment capture early, dynamic hypoxic responses, in contrast to chronic CoCl2 exposure, which reflects longer-term adaptation. This distinction is relevant to tumour biology, where hypoxia is often transient due to unstable vascularisation. The following statement has been added to the manuscript:
“In addition to such chronic hypoxic adaptation, tumour hypoxia can also be dynamic, with cells experiencing acute or transient hypoxic exposure due to unstable vascularisation; an established contributor to tumour progression (Liu et al, 2022a; Koh & Powis, 2012). Thus, in contexts where both signalling pathways remain active, the dependence of the hypoxic response on ERα in ER+ cells has not been previously characterised.”
Primary Limitations
3.16
DMOG vs hypoxia in the cistrome experiment,
To address concerns regarding the use of DMOG, we have validated key ERα binding events from the ChIP-seq dataset by ChIP–qPCR at the TFF1 and GREB1 loci under bona fide hypoxia (1% oxygen) in biological triplicate__ (Figure 1F)__. These data demonstrate consistent changes in ERα binding under hypoxia, supporting that the DMOG-induced redistribution reflects hypoxia-driven changes.
3.17
the absence of direct HIF or cofactor perturbations
We acknowledge the absence of direct HIF perturbation. To address this, we will assess the contribution of HIF signalling through stabilisation approaches, including RT-qPCR analysis of SCNN1B and SCNN1G ± IOX5 ± fulvestrant (response 3.2), to determine whether HIF activation is sufficient to support ERα-dependent induction.
3.18
and the pleiotropy of amiloride.
To address the potential pleiotropy of amiloride, we will perform siRNA-mediated knockdown of SCNN1G and SCNN1B to provide independent validation of ENaC-dependent effects (response 3.3).
Note: This preprint has been reviewed by subject experts for Review Commons. Content has not been altered except for formatting.
Learn more at Review Commons
Summary
This study explores how hypoxia reshapes ERα signalling in ER-positive breast cancer and whether this cross-talk exposes targetable vulnerabilities. The authors first map ERα binding in MCF7 cells after dioxygenase inhibition with DMOG and observe a genome-wide redistribution with enrichment of ERE, FOXA1 and AP-1 motifs at gained sites while chromatin accessibility at these loci appears unchanged in public ATAC-seq after hypoxia. They then perform RNA-seq in MCF7 and T47D using a factorial design that combines fulvestrant-mediated ERα degradation with 1% O₂ to define an ERα-dependent hypoxia response (EDHR). A 14-gene consensus EDHR signature includes ENaC regulatory subunits SCNN1B and SCNN1G, whose higher expression is associated with poorer RFS in ER+ cohorts. Functionally, amiloride increases viability in normoxia but reduces viability under hypoxia in MCF7 across a dose range. Spatial transcriptomics from ER+ tumours shows EDHR expression enriched at the margins of hypoxia and estrogen-hallmark regions and adjacent to EMT hotspots. Raw data and code availability are stated for the central datasets and accessions are provided. Together the results argue that ERα helps organise a distinct hypoxic programme and suggest a context-specific sensitivity to ENaC inhibition.
Major comments
The paper addresses a timely question with a clear narrative arc and brings together ChIP-seq, RNA-seq, pharmacology, survival analysis and spatial transcriptomics. The EDHR concept is interesting and the ENaC angle is original. The work is already strong and with a few targeted additions and clarifications it can be made more persuasive without becoming a new project.
1) The DMOG ChIP-seq provides a valuable first look at ERα redistribution. Since DMOG inhibits both HIF hydroxylases and oxygen-dependent demethylases, the driver of the observed changes remains ambiguous. It would help to include either ERα ChIP-seq under bona fide hypoxia or a selective PHD inhibitor condition (for example IOX5, as you discuss) to separate HIF stabilisation from broad demethylase inhibition. If ChIP-seq is not feasible, a brief ATAC validation at a small panel of gained and lost loci would still increase confidence. Estimated time: 6-8 weeks for a focused follow up with two conditions and biological duplicates/triplicates.
2) The factorial RNA-seq is well designed and the attenuation analyses are clear. The EDHR selection is stringent and reproducible across two ER+ lines. To support the claim of ERα dependence mechanistically, a small number of targeted perturbations would go far. For example, confirm EDHR induction for SCNN1B and SCNN1G in hypoxia with and without fulvestrant by RT-qPCR and test whether short-term ERα knockdown reproduces the effect. A complementary test with a HIF-1α or HIF-2α knockdown at one time point would help position EDHR relative to HIF. Estimated time: 3-4 weeks for qPCR and siRNA validations.
3) The amiloride result is intriguing and consistent with a hypoxia-specific dependency. Because amiloride is pleiotropic, it would strengthen the conclusion to add one genetic and one pharmacological specificity control. A brief SCNN1B or SCNN1G knockdown in hypoxia should phenocopy the viability effect if ENaC contributes. In parallel, testing benzamil at sub-micromolar doses would provide a more ENaC-selective pharmacological readout. These can be performed in MCF7 and, resources permitting, in T47D. Estimated time: 4-6 weeks.
4) The RFS associations for SCNN1B and SCNN1G are compelling. It would be helpful to report whether the associations persist in a multivariable model that at least includes ER status, grade and nodal status where available, or to state clearly when this is not possible across merged datasets. Even a sensitivity analysis in TCGA with ER+ cases only would contextualise the hazard ratios. Estimated time: 1-2 weeks.
5) The spatial association of EDHR with EMT hotspots is a nice piece of the story. A short clarification of how spot-level cell type composition was handled will help readers interpret proximity results. If cell type deconvolution scores are available in the source dataset, adding a sentence on whether EDHR enrichment tracks tumour epithelial content would be useful. Estimated time: 1 week.
Reproducibility and statistics
Data processing for ChIP-seq and RNA-seq is documented and accessions are provided. The RNA-seq includes n=3 per condition, which is appropriate, and the correlation and LFC analyses are clearly presented. For the amiloride assay, the two-way ANOVA with interaction is appropriate; please add the exact n and whether experiments were independently repeated, and include the underlying values in a source table for transparency. These are small presentational edits rather than new experiments.
Optional
A small, hypothesis-driven mechanistic link from EDHR to ENaC function would substantially elevate impact without becoming a long project. For example, testing whether hypoxia increases amiloride-sensitive Na⁺ current in MCF7 and whether fulvestrant abrogates that increase would directly connect the transcriptional and functional observations. If available, patch-clamp or a simple SBFI-based Na⁺ imaging readout could suffice. Estimated time: 6-8 weeks.
Minor comments
Prior studies
The manuscript is well referenced. Where you contrast your findings with long-term CoCl₂ hypoxia, a sentence on why acute DMOG and short-term 1% O₂ may reveal different ERα behaviours would help position the novelty.
General assessment
The strongest aspects are the carefully designed factorial RNA-seq that cleanly separates ERα and hypoxia effects, the discovery of a concise EDHR signature reproducible across two ER+ lines, and the integration with spatial transcriptomics that places EDHR near EMT-rich tumour regions. The ENaC connection is new and potentially actionable, and the context-dependent amiloride response is a practical lead. Limitations are primarily mechanistic: DMOG vs hypoxia in the cistrome experiment, the absence of direct HIF or cofactor perturbations, and the pleiotropy of amiloride.
Advance
To my knowledge, this is the first description of a distinct ERα-dependent hypoxic programme in ER+ breast cancer that includes ENaC regulatory subunits and links to an EMT-adjacent spatial niche. The conceptual advance is the positioning of ERα as a coordinator of a subset of hypoxia-induced genes rather than as a parallel pathway, together with an initial functional readout that suggests a therapeutic angle through ENaC modulation. With the targeted additions outlined above, the study would move from strong association to a more mechanistic and translationally relevant model.
Audience
The work will interest a specialised audience in nuclear receptor biology, hypoxia signalling, tumour microenvironment, and ion transport in cancer. It has potential relevance for basic researchers studying ERα cistrome dynamics, for groups using spatial transcriptomics to define micro-niches, and for translational researchers exploring metabolic and ionic vulnerabilities in ER+ disease.
Expertise disclosure
Keywords: nuclear receptors,, chromatin profiling, transcriptomics, spatial transcriptomics, breast cancer biology.
I am not a domain expert in ion channel electrophysiology; my comments on ENaC pharmacology focus on specificity and study design rather than detailed channel biophysics.
Tone
I find the paper well conceived and already compelling. The suggested experiments are focused, realistic in scope, and primarily aim to turn several strong associations into concise mechanistic statements that would further increase confidence and impact.
Note: This preprint has been reviewed by subject experts for Review Commons. Content has not been altered except for formatting.
Learn more at Review Commons
ERα drives most luminal breast cancers. However, how hypoxia reshapes ERα activity and how ERα itself might influence the hypoxic response remain unclear. Understanding this interaction is crucial, as hypoxia is strongly linked to endocrine resistance and poor outcomes. In this study, authors investigated how hypoxia modifies ERα signalling in ER+ breast cancer and whether ERα contributes to the transcriptional response to low oxygen. Using MCF7 and T47D cells, they combined genome-wide profiling of the ERα cistrome under DMOG, hypoxic transcriptomics with or without ERα degradation, and spatial transcriptomics in tumours. This revealed an ERα-dependent hypoxic response (EDHR), prominently involving regulation of epithelial sodium channel (ENaC) subunits, whose expression requires both hypoxia and active ERα signalling. Functionally, ENaC inhibition with amiloride reduced cell viability under hypoxia. Together, these findings uncover a previously unrecognised ERα-dependent layer of the hypoxic transcriptome and identify ENaC as a potential therapeutic vulnerability in hypoxic ER+ breast cancer. Although the study is interesting, the manuscript lacks several essential functional and experimental validations. ENAC is proposed as a therapeutic vulnerability based on amiloride sensitivity assays. Additional experiments are required, such as western blot validation of ENaC regulation under hypoxia and loss-of-function approaches to assess its contribution to the phenotype. Fulvestrant is used to dissect ERa dependency. However, as a SERD, it may alter chromatin and transcription independently of a simple loss of ERα. Addition control would strengthen interpretation. The molecular mechanism by which ERα modulates the hypoxic transcriptome, specifically how ERα and HIF pathways converge at ENAC loci should be more studied. In addition, to assess the relevance of this work for luminal breast cancer and ERα expression, specific validation in TNBC should be performed Finally, the authors should provide RT-qPCR validation of the key EDHR genes, especially since this signature is later used for downstream analyses.
General assessment strengths:
This study uncovers a previously unrecognised ERα-dependent hypoxic response in breast cancer, revealing that ERα actively shapes the hypoxic transcriptome rather than functioning as an isolated pathway. To me, the main strength of this work is the identification of ENaC as a novel hypoxia-specific therapeutic vulnerability in ER+ breast cancer, suggesting that ion-channel regulation may play a broader and underappreciated role in endocrine resistance.
Limitation:
Reprogramming of the ERα cistrome under cellular stress is well documented. The study extends these ideas but does not clearly demonstrate a new mechanistic paradigm, particularly because the EDHR is defined primarily through omics approaches without strong mechanistic validation. In addition, we have to keep in mind that the study uses DMOG to model hypoxia-driven chromatin changes, but DMOG inhibits many 2-oxoglutarate-dependent dioxygenases non-selectively. This makes it difficult to attribute ERα cistrome reprogramming specifically to hypoxia, rather than to broad off-target effects. The transcriptomic dataset is more convincing by need the validation suggested previously.
Audience:
Given its reliance on omics datasets and preliminary functional assays, the paper will likely appeal to a specialized audience in transcriptional regulation, hypoxia signalling, and ER+ breast cancer biology. However, the limited mechanistic depth and uncertain translational relevance due to the lack of in vivo validation, may reduce its impact for broader oncology or therapeutic-development audiences. Without stronger validation, the findings may be perceived as niche and mainly of interest to researchers focused on ERα chromatin dynamics rather than to the wider cancer research community.
Expertise:
My evaluation is based on my background in breast cancer, ERα signaling and breast tumorigenesis. However, I have limited expertise in spacial transcriptomic analyses and advanced CHiP-seq bioinformatic analyses, which may affect my assessment of some computational analyses.
Note: This preprint has been reviewed by subject experts for Review Commons. Content has not been altered except for formatting.
Learn more at Review Commons
In this manuscript, Malcom et al. present evidence that, under hypoxic conditions, hypoxia-inducible factors (HIFs) alter the estrogen receptor alpha (ERα) epigenomic landscape in a model of estrogen receptor-positive (ER+) breast cancer (BrCa). The response of ER+ BrCa to estradiol (E2) in MCF7 (ER+) cells, as well as ERα signaling in both primary and metastatic breast cancer, has been well studied, and the epigenomic landscape of ERα+ BrCa is well documented. The differentially expressed genes (DEGs) identified under treatment with the hypoxia mimetic dimethyloxalylglycine (DMOG) revealed a subset of ERα-dependent hypoxic response (EDHR) genes. The outcome was a reprogramming of the basal ERα cistrome, coinciding with sites enriched for estrogen response elements (EREs) and co-transcription factor binding motifs for ERα, including FOXA1 and AP-1. This was demonstrated by ERα ChIP-seq (i.e. DMOG) and ATAC-seq (i.e. 1% O2) performed under different hypoxic conditions. The transcripts identified following DMOG treatment were leveraged and compared to publicly available RNA-seq datasets from various breast cancer subtypes exposed to 1% hypoxic oxygen. Although the comparison methods varied, the results suggested that BrCa cell lines under 1% hypoxic oxygen conditions showed strong similarity to MCF7 cells treated with DMOG. Genes upregulated in response to DMOG correlated with poorer survival outcomes. To demonstrate the requirement for ERα in this model, MCF7 cells were treated with the selective estrogen receptor degrader (SERD) fulvestrant-the only FDA-approved SERD for ER+ BrCa-showing a dampening of the HIF response among EDHR genes. This suggests that ERα is necessary for the expression of DEGs under hypoxic conditions induced by DMOG. Finally, the sodium channel protein ENaC subunits (i.e., SCNN1B and SCNN1G) were further characterized as candidate EDHR genes. Analyses of publicly available datasets indicated that high mRNA expression levels of these subunits were associated with worse survival outcomes, supporting the clinical relevance of EDHR genes SCNN1B and SCNN1G. To further validate clinical relevance, utilize the Spatial Transcriptome in a small subset of ER+ BrCa.
Major:
Minor:
In general, the manuscript in its present form does not greatly contribute from published work as the ERα cistrone is well documented work studied for its role in regulating gene expression, particularly in ERα-positive breast cancer. Additionally, a lack of a through comparison between DMOG and or 1 %O2 induce hypoxia in the MCF7 ER+ model, diminished initial interest in the manuscript. The lack of considering estradiol exposure under hypoxic conditions with either 1%O2 and or DMOG also limits relevance to patients with ER+ BrCa. The ERα epigenomic profile has been extensively studied including work under hypoxic conditions.
Em outros casos, mesmo quando remuneradas, muitas vezes recebem salários insuficientes e enfrentam condições de trabalho longe do idea
Salário-médio recebido das pessoas que exercem as atividades de cuidado.
Um dos pilares desses serviços são as pessoas cuidadora
Uma das formas de manter essa autonomia são os cuidadores.
Since Tea Cake and Janie had friended with the Bahaman workers in the ’Glades, they, the “Saws,” had been gradually drawn into the American crowd. They quit hiding out to hold their dances when they found that their American friends didn’t laugh at them as they feared. Many of the Americans learned to jump and liked it as much as the “Saws.” So they began to hold dances night after night in the quarters, usually behind Tea Cake’s house. Often now, Tea Cake and Janie stayed up so late at the fire dances that Tea Cake would not let her go with him to the field. He wanted her to get her rest.
Janie and Tea Cake made friends with the Bahamian workers, who began dancing and socializing more once they had felt more like accepted.
Data Downloads
I don't like this. Its crap.
gliacellen
zenuwcellen die geen signalen doorsturen maar zorgen voor onderhoud, voeding en bescherming van de andere zenuwcellen.
(part-time)
I would remove! Not relevant for someone to know it was part time, and feels like you're downplaying it
Meeting Minutes Mode
pag naghost ka ng meeting, matic nagiging agenda mode siya. once na ganung mode na siya, pede mo maset yung meeting details para kapag nagstart yung meeting, maconvert yung meeting into minutes mode.
locations and tiered locations
pede ka maglinkng iba't ibang procore objects like drawings, documents, rfis etc sa specific location ng job site para mabilis for team members madetect if may defect ba dun, may need na i-intsall na equipment etc
project level
manage project specifics lang
company level
manage overall settings tapos magprovide ng overview ng projects
Drawings by Area
drawings for each area ng building
28781
DOI: 10.7554/eLife.108551
Resource: RRID:BDSC_28781
Curator: @maulamb
SciCrunch record: RRID:BDSC_28781
29624
DOI: 10.7554/eLife.108551
Resource: RRID:BDSC_29624
Curator: @maulamb
SciCrunch record: RRID:BDSC_29624
27280
DOI: 10.7554/eLife.108551
Resource: RRID:BDSC_27280
Curator: @maulamb
SciCrunch record: RRID:BDSC_27280
25750
DOI: 10.7554/eLife.108551
Resource: RRID:BDSC_25750
Curator: @maulamb
SciCrunch record: RRID:BDSC_25750
57591
DOI: 10.7554/eLife.108551
Resource: RRID:BDSC_57591
Curator: @maulamb
SciCrunch record: RRID:BDSC_57591
93014
DOI: 10.7554/eLife.108551
Resource: RRID:BDSC_93014
Curator: @maulamb
SciCrunch record: RRID:BDSC_93014
37516
DOI: 10.7554/eLife.108551
Resource: RRID:BDSC_37516
Curator: @maulamb
SciCrunch record: RRID:BDSC_37516
67093
DOI: 10.7554/eLife.108551
Resource: RRID:BDSC_67093
Curator: @maulamb
SciCrunch record: RRID:BDSC_67093
42748
DOI: 10.7554/eLife.108551
Resource: RRID:BDSC_42748
Curator: @maulamb
SciCrunch record: RRID:BDSC_42748
58761
DOI: 10.7554/eLife.108551
Resource: RRID:BDSC_58761
Curator: @maulamb
SciCrunch record: RRID:BDSC_58761
TIB-71
DOI: 10.64898/2026.04.30.721640
Resource: (ATCC Cat# TIB-71, RRID:CVCL_0493)
Curator: @dhovakimyan1
SciCrunch record: RRID:CVCL_0493
