Often family descent was matrilineal, since it was easier to know who a person's mother was, than their father.
I wonder how this became, because is it like the mother is well known rather than the father but this is a interesting concept
Often family descent was matrilineal, since it was easier to know who a person's mother was, than their father.
I wonder how this became, because is it like the mother is well known rather than the father but this is a interesting concept
This is truly working in the Open Learning Commons
creating the Indy (Mutual) Learning Commons
The work is not only Open Souce
developing Open constructs
easy to emulate compelling to do and etend expand exapt
but it shipf with Open Sauce
i
Origo Folder for my hyperpost Peergos Account
No Groan Zome
but
Not just Converge but UpVerge in an autopoietic emregent upward spiral
Beyond all expectations
Imagined a whole new way what that leads to is beyond prior imaginings
an instructional coach. “Every single teacher can be developed and every single teacher can grow,” she says. “As a result of growing every teacher, we’ll be growing and supporting every student. That way we can ensure that every one of our students has the best teacher standing in front of them.
We have instructional coaches at our school for hum, STEM, and ELD. The tricky part is SPED. We have a person assigned which is nice and they are great but you can tell it is an after thought. It is not someone that is certified or has experience.
Steve Krenzel [@stevekrenzel]. With Twitter's change in ownership last week, I'm probably in the clear to talk about the most unethical thing I was asked to build while working at Twitter. 🧵. November 2022. URL: https://twitter.com/stevekrenzel/status/1589700721121058817 (visited on 2023-12-10).
The way in twitter operates is less the fault of twitter itself and the people that created it but more the fact that twitter is under a cooperation and as such needs to continuously make money. It monetization method relies on user engagement, and without it, the platform will quickly die out. To achieve this, twitter prays on the human psychic, showing the user what interests or draws them in the most, in most cases it might be something negative.
Ted Chiang. Will A.I. Become the New McKinsey? The New Yorker, May 2023. URL: https://www.newyorker.com/science/annals-of-artificial-intelligence/will-ai-become-the-new-mckinsey (visited on 2023-12-10).
We've always talked about artificial intelligence as some kind of neutral "intelligent tool," but in reality, it's more like a consulting firm, employed by people to improve efficiency and cut costs—usually at the expense of workers' interests. Chiang's points that technology doesn't automatically improve people's lives impresses me most because it explains why so many "innovations" feel disconnected from the actual needs of ordinary people.
decolonization has been taken up in theoretical terms withinpostcolonial theory or other academically based knowledges, but is fre-quently disconnected from the place-based nature of ongoing colonialismin the lands and communities in which we live.
If decolonization needs to be place-based, how do queer settlers avoid symbolic belonging on land they occupy?
In this article, we investigate questions about the nature of decolonialprocesses within our daily lives. We have chosen to center our investiga-tion of decolonization at the level of interpersonal relationships, familiesand homes in order to highlight the intimate and everyday practices ofallyship and decolonization that are often made invisible when we focussolely on social action strategies taking place in more “public” spaces suchas community coalitions.
The thesis of this article argues that decolonization is not only public activism, but something lived through intimate relationships, kinship, and everyday interactions. The authors reject the idea that decolonization equals symbolic gestures; instead, they centre it in the home, family, friendship, and embodied queer life. Decolonization happens in family, intimacy, conflict, and daily life.
The muezzin may be an educated mullah5 or an ignorant man. A wealthyneighbor had the call given from his housetop by an illiterate scavenger or porter,who had simply memorized the Arabic words, and was paid for his trouble withsome loads of wheat.
This might be intended as an insult but I think it is a sign of humility
“I had to start a telephone company to get [high-speed] Internet access.”
my god, I knew isps were shit but I didn't know they were THIS shit! once again, big mega corporations not caring for poor workers and all.
(unrelated but finally feel better to post a few annotations for once, my god everything has sucked over the weeks mentally, financially, and whatnot...)
“Is that all?” replied the Persian. “Of course I’ll apologize; I’ll say whateverhe wishes me to say. I lied when I called him a liar. I am a liar, the son of a liar,and the grandson of liars. What more does he want me to say?”
This reading is perhaps one of the most normal ones covering orientalism, but it is still rife with stereotypes. We see the typical fascination with women and splendor. It also reveals the intentions of the westerners as it is essentially a guide for business and exploitation.
requires a good figure to show it off to advantage. The scant garmentsworn indoors admit of considerable scope in the exercise of taste for color andembroidery, but otherwise there is no difference in the home-dress worn by thePersian women of Teheran either in the palace or the meanest hovel.
Legitimizing European fantasies
while by strongly asserting his claim toall the privileges which he has the right to demand, suitable to his rank, he receivesthe respect which is his due, but which no Persian will give except when he seeshim firm on these points
Because a European is assumed to be of high rank, right
not wholly the fictions of a fancy steeped in opium or b’hang
So he is self aware of the orientalist fixation, but he believes that it is reasonable
You aren’t likely to end up in a situation as dramatic as this. If you find yourself making a stand for ethical tech work, it would probably look more like arguing about what restrictions to put on a name field (e.g., minimum length), prioritizing accessibility, or arguing that a small piece of data about users is not really needed and shouldn’t be tracked. But regardless, if you end up in a position to have an influence in tech, we want you to be able to think through the ethical implications of what you are asked to do and how you choose to respond.
I think this kind of moral courage is undervalued in discussions of “tech ethics.” Too often we focus on the abstract risks of algorithmic bias, misinformation, privacy — but forget that behind every system is a person (or a team) making design choices. The chapter’s call for potential tech workers to reflect on these issues — and to be ready to push back — feels deeply important.
to die is different from what any one supposed, and luckier
Radical idea: death is not tragic but a fortunate transformation.
to die is different from what any one supposed, and luckier.
Radical idea: death is not tragic but a fortunate transformation.
An argument took place between husband and wife in the tavern, a public but informal setting where the normal code choice would be Friulian
In many bidialectal, bilingual, or multilingual speech communities distinctions among occasions and codes are not primarily hierarchical: the codes may be perceived as different but be equally valued, and similarly the situations may be differentiated on grounds other than prestige
Author response:
The following is the authors’ response to the original reviews
We would like to thank all reviewers for their constructive and in-depth reviews. Thanks to your feedback, we realized that the main objective of the paper was not presented clearly enough, and that our use of the same “modality-agnostic” terminology for both decoders and representations caused confusion. We addressed these two major points as outlined in the following.
In the revised manuscript, we highlight that the main contribution of this paper is to introduce modality-agnostic decoders. Apart from introducing this new decoder type, we put forward their advantages in comparison to modality-specific decoders in terms of decoding performance and analyze the modality-invariant representations (cf. updated terminology in the following paragraph) that these decoders rely on. The dataset that these analyses are based on is released as part of this paper, in the spirit of open science (but this dataset is only a secondary contribution for our paper).
Regarding the terminology, we clearly define modality-agnostic decoders as decoders that are trained on brain imaging data from subjects exposed to stimuli in multiple modalities. The decoder is not given any information on which modality a stimulus was presented in, and is therefore trained to operate in a modality-agnostic way. In contrast, modality-specific decoders are trained only on data from a single stimulus modality. These terms are explained in Figure 2. While these terms describe different ways of how decoders can be trained, there are also different ways to evaluate them afterwards (see also Figure 3); but obviously, this test-time evaluation does not change the nature of the decoder, i.e., there is no contradiction in applying a modality-specific decoder to brain data from a different modality.
Further, we identify representations that are relevant for modality-agnostic decoders using the searchlight analysis. We realized that our choice of using the same “modality-agnostic” term to describe these brain representations created unnecessary debate and confusion. In order to not conflate the terminology, in the updated manuscript we call these representations modality-invariant (and the opposite modality-dependent). Our methodology does not allow us to distinguish whether certain representations merely share representational structure to a certain degree, or are truly representations that abstract away from any modality-dependent information. However, in order to be useful for modality-agnostic decoding, a significant degree of shared representational structure is sufficient, and it is this property of brain representations that we now define as “modality-invariant”.
We updated the manuscript in line with this new terminology and focus: in particular, the first Related Work section on Modality-invariant brain representations, as well as the Introduction and Discussion.
Public Reviews:
Reviewer #1 (Public review):
Summary:
The authors introduce a densely-sampled dataset where 6 participants viewed images and sentence descriptions derived from the MS Coco database over the course of 10 scanning sessions. The authors further showcase how image and sentence decoders can be used to predict which images or descriptions were seen, using pairwise decoding across a set of 120 test images. The authors find decodable information widely distributed across the brain, with a left-lateralized focus. The results further showed that modality-agnostic models generally outperformed modality-specific models, and that data based on captions was not explained better by caption-based models but by modality-agnostic models. Finally, the authors decoded imagined scenes.
Strengths:
(1) The dataset presents a potentially very valuable resource for investigating visual and semantic representations and their interplay.
(2) The introduction and discussion are very well written in the context of trying to understand the nature of multimodal representations and present a comprehensive and very useful review of the current literature on the topic.
Weaknesses:
(1) The paper is framed as presenting a dataset, yet most of it revolves around the presentation of findings in relation to what the authors call modality-agnostic representations, and in part around mental imagery. This makes it very difficult to assess the manuscript, whether the authors have achieved their aims, and whether the results support the conclusions.
Thanks for this insightful remark. The dataset release is only a secondary contribution of our study; this was not clear enough in the previous version. We updated the manuscript to make the main objective of the paper more clear, as outlined in our general response to the reviews (see above).
(2) While the authors have presented a potential use case for such a dataset, there is currently far too little detail regarding data quality metrics expected from the introduction of similar datasets, including the absence of head-motion estimates, quality of intersession alignment, or noise ceilings of all individuals.
As already mentioned in the general response, the main focus of the paper is to introduce modality-agnostic decoders. The dataset is released in addition, this is why we did not focus on reporting extensive quality metrics in the original manuscript. To respond to your request, we updated the appendix of the manuscript to include a range of data quality metrics.
The updated appendix includes head motion estimates in the form of realignment parameters and framewise displacement, as well as a metric to assess the quality of intersession alignment. More detailed descriptions can be found in Appendix 1 of the updated manuscript.
Estimating noise ceilings based on repeated presentations of stimuli (as for example done in Allen et al. (2022)) requires multiple betas for each stimulus. All training stimuli were only presented once, so this could only be done for the test stimuli which were presented repeatedly. However, during our preprocessing procedure we directly calculated stimulus-specific betas based on data from all sessions using one single GLM, which means that we did not obtain separate betas for repeated presentations of the same stimulus. We will however share the raw data publicly, so that such noise ceilings can be calculated using an adapted preprocessing procedure if required.
Allen, E. J., St-Yves, G., Wu, Y., Breedlove, J. L., Prince, J. S., Dowdle, L. T., Nau, M., Caron, B., Pestilli, F., Charest, I., Hutchinson, J. B., Naselaris, T., & Kay, K. (2022). A massive 7T fMRI dataset to bridge cognitive neuroscience and artificial intelligence. Nature Neuroscience, 25(1), 116–126. https://doi.org/10.1038/s41593-021-00962-x
(3) The exact methods and statistical analyses used are still opaque, making it hard for a reader to understand how the authors achieved their results. More detail in the manuscript would be helpful, specifically regarding the exact statistical procedures, what tests were performed across, or how data were pooled across participants.
In the updated manuscript, we improved the level of detail for the descriptions of statistical analyses wherever possible (see also our response to your “Recommendations for the authors”, Point 6).
Regarding data pooling across participants:
Figure 8 shows averaged results across all subjects (as indicated in the caption)
Regarding data pooling for the estimation of the significance threshold of the searchlight analysis for modality-invariant regions: We updated the manuscript to clarify that we performed a permutation test, combined with a bootstrapping procedure to estimate a group-level null distribution: “For each subject, we evaluated the decoders 100 times with shuffled labels to create per-subject chance-level results. Then, we randomly selected one of the 100 chance-level results for each of the 6 subjects and calculated group-level statistics (TFCE values) the exact same way as described in the preceding paragraph. We repeated this procedure 10,000 times resulting in 10,000 permuted group-level results.”
Additionally, we indicated that the same permutation testing methods were applied to assess the significance threshold for the imagery decoding searchlight maps (Figure 10).
(4) Many findings (e.g., Figure 6) are still qualitative but could be supported by quantitative measures.
The Figures 6 and 7 are intentionally qualitative results to support the quantitative decoding results presented in Figures 4 and 5. (see also Reviewer 2 Comment 2)
Figures 4 and 5 show pairwise decoding accuracy as a quantitative measure for evaluation of the decoders. This metric is the main metric we used to compare different decoder types and features. Based on the finding that modality-agnostic decoders using imagebind features achieve the best score on this metric, we performed the additional qualitative analysis presented in Figures 6 and 7. (Note that we expanded the candidate set for the qualitative analysis in order to have a larger and more diverse set of images.)
(5) Results are significant in regions that typically lack responses to visual stimuli, indicating potential bias in the classifier. This is relevant for the interpretation of the findings. A classification approach less sensitive to outliers (e.g., 70-way classification) could avoid this issue. Given the extreme collinearity of the experimental design, regressors in close temporal proximity will be highly similar, which could lead to leakage effects.
It is true that our searchlight analysis revealed significant activity in regions outside of the visual cortex. However, it is assumed that the processing of visual information does not stop at the border of the visual cortex. The integration of information such as the semantics of the image is progressively processed in other higher-level regions of the brain. Recent studies have shown that activity in large areas of the cortex (including many outside of the visual cortex) can be related to visual stimulation (Solomon et al. 2024; Raugel et al. 2025). Our work confirms this finding and we therefore do not see reason to believe that this is due to a bias in our decoders.
Further, you are suggesting that we could replace our regression approach with a 70-way classification. However, this is difficult using our fMRI data as we do not see a straightforward way to assign the training and testing stimuli with class labels (the two datasets consist of non-overlapping sets of naturalistic images).
To address your concerns regarding the collinearity of the experimental design and possible leakage effects, we trained and evaluated a decoder for one subject after running a “null-hypothesis” adapted preprocessing. More specifically, for all sessions, we shifted the functional data of all runs by one run (moving the data of the last run to the very front), but leaving the design matrices in place. Thereby, we destroyed the relationship of stimuli and brain activity but kept the original data and design with its collinearity (and possible biases). We preprocessed this adapted data for subject 1, and ran a whole-brain decoding using Imagebind features and verified that the decoding performance was at chance level: Pairwise accuracy (captions): 0.43 | Pairwise accuracy (images): 0.47 | Pairwise accuracy (imagery): 0.50. This result provides evidence against the notion that potential collinearity or biases in our experimental design or evaluation procedure could have led to inflated results.
Raugel, J., Szafraniec, M., Vo, H.V., Couprie, C., Labatut, P., Bojanowski, P., Wyart, V. and King, J.R. (2025). Disentangling the Factors of Convergence between Brains and Computer Vision Models. arXiv preprint arXiv:2508.18226.
Solomon, S. H., Kay, K., & Schapiro, A. C. (2024). Semantic plasticity across timescales in the human brain. bioRxiv, 2024-02.
(6) The manuscript currently lacks a limitations section, specifically regarding the design of the experiment. This involves the use of the overly homogenous dataset Coco, which invites overfitting, the mixing of sentence descriptions and visual images, which invites imagery of previously seen content, and the use of a 1-back task, which can lead to carry-over effects to the subsequent trial.
Regarding the dataset CoCo: We agree that CoCo is somewhat homogenous, it is however much more diverse and naturalistic than the smaller datasets used in previous fMRI experiments with multimodal stimuli. Additionally, CoCo has been widely adopted as a benchmark dataset in the Machine Learning community, and features rich annotations for each image (e.g. object labels, segmentations, additional captions, people’s keypoints) facilitating many more future analyses based on our data.
Regarding the mixing of sentence descriptions and images: Subjects were not asked to visualize sentences and different techniques for the one-back tasks might have been used. Generally, we do not see it as problematic if subjects are performing visual imagery to some degree while reading sentences, and this might even be the case during normal reading as well. A more targeted experiment comparing reading with and without interleaved visual stimulation in the form of images and a one-back task would be required to assess this, but this was not the focus of our study. For now, it is true that we can not be sure that our results generalize to cases in which subjects are just reading and are less incentivized to perform mental imagery.
Regarding the use of a 1-back task: It was necessary to make some design choices in order to realize this large-scale data collection with approximately 10 hours of recording per subject. Specifically, the 1-back task was included in the experimental setup in order to assure continuous engagement of the participant during the rather long sessions of 1 hour. The subjects did indeed need to remember the previous stimulus to succeed at the 1-back task, which means that some brain activity during the presentation of a stimulus is likely to be related to the previous stimulus. We aimed to account for this confound during the preprocessing stage when fitting the GLM, which was fit to capture only the response to the presented image/caption, not the preceding one. Still, it might have picked up on some of the activity from preceding stimuli, causing some decrease of the final decoding performance.
We added a limitations section to the updated manuscript to discuss these important issues.
(7) I would urge the authors to clarify whether the primary aim is the introduction of a dataset and showing the use of it, or whether it is the set of results presented. This includes the title of this manuscript. While the decoding approach is very interesting and potentially very valuable, I believe that the results in the current form are rather descriptive, and I'm wondering what specifically they add beyond what is known from other related work. This includes imagery-related results. This is completely fine! It just highlights that a stronger framing as a dataset is probably advantageous for improving the significance of this work.
Thanks a lot for pointing this out. Based on this comment and feedback from the other reviewers we restructured the abstract, introduction and discussion section of the paper to better reflect the primary aim. (cf. general response above).
You further mention that it is not clear what our results add beyond what is known from related work. We list the main contributions here:
A single modality-agnostic decoder can decode the semantics of visual and linguistic stimuli irrespective of the presentation modality with a performance that is not lagging behind modality-specific decoders.
Modality-agnostic decoders outperform modality-specific decoders for decoding captions and mental imagery.
Modality-invariant representations are widespread across the cortex (a range of previous work has suggested they were much more localized (Bright et al. 2004; Jung et al. 2018; Man et al. 2012; Simanova et al. 2014).
Regions that are useful for imagery are largely overlapping with modality-invariant regions
Bright, P., Moss, H., & Tyler, L. K. (2004). Unitary vs multiple semantics: PET studies of word and picture processing. Brain and language, 89(3), 417-432.
Jung, Y., Larsen, B., & Walther, D. B. (2018). Modality-Independent Coding of Scene Categories in Prefrontal Cortex. Journal of Neuroscience, 38(26), 5969–5981.
Liuzzi, A. G., Bruffaerts, R., Peeters, R., Adamczuk, K., Keuleers, E., De Deyne, S., Storms, G., Dupont, P., & Vandenberghe, R. (2017). Cross-modal representation of spoken and written word meaning in left pars triangularis. NeuroImage, 150, 292–307. https://doi.org/10.1016/j.neuroimage.2017.02.032
Man, K., Kaplan, J. T., Damasio, A., & Meyer, K. (2012). Sight and Sound Converge to Form Modality-Invariant Representations in Temporoparietal Cortex. Journal of Neuroscience, 32(47), 16629–16636.
Simanova, I., Hagoort, P., Oostenveld, R., & van Gerven, M. A. J. (2014). Modality-Independent Decoding of Semantic Information from the Human Brain. Cerebral Cortex, 24(2), 426–434.
Reviewer #2 (Public review):
Summary:
This study introduces SemReps-8K, a large multimodal fMRI dataset collected while subjects viewed natural images and matched captions, and performed mental imagery based on textual cues. The authors aim to train modality-agnostic decoders--models that can predict neural representations independently of the input modality - and use these models to identify brain regions containing modality-agnostic information. They find that such decoders perform comparably or better than modality-specific decoders and generalize to imagery trials.
Strengths:
(1) The dataset is a substantial and well-controlled contribution, with >8,000 image-caption trials per subject and careful matching of stimuli across modalities - an essential resource for testing theories of abstract and amodal representation.
(2) The authors systematically compare unimodal, multimodal, and cross-modal decoders using a wide range of deep learning models, demonstrating thoughtful experimental design and thorough benchmarking.
(3) Their decoding pipeline is rigorous, with informative performance metrics and whole-brain searchlight analyses, offering valuable insights into the cortical distribution of shared representations.
(4) Extension to mental imagery decoding is a strong addition, aligning with theoretical predictions about the overlap between perception and imagery.
Weaknesses:
While the decoding results are robust, several critical limitations prevent the current findings from conclusively demonstrating truly modality-agnostic representations:
(1) Shared decoding ≠ abstraction: Successful decoding across modalities does not necessarily imply abstraction or modality-agnostic coding. Participants may engage in modality-specific processes (e.g., visual imagery when reading, inner speech when viewing images) that produce overlapping neural patterns. The analyses do not clearly disambiguate shared representational structure from genuinely modality-independent representations. Furthermore, in Figure 5, the modality-agnostic encoder did not perform better than the modality-specific decoder trained on images (in decoding images), but outperformed the modality-specific decoder trained on captions (in decoding captions). This asymmetry contradicts the premise of a truly "modality-agnostic" encoder. Additionally, given the similar performance between modality-agnostic decoders based on multimodal versus unimodal features, it remains unclear why neural representations did not preferentially align with multimodal features if they were truly modality-independent.
We agree that successful modality-agnostic and cross-modal decoding does not necessarily imply that abstract patterns were decoded. In the updated manuscript, we therefore refer to these representations as modality-invariant (see also the updated terminology explained in the general response above).
If participants are performing mental imagery when reading, and this is allowing us to perform cross-decoding, then this means that modality-invariant representations are formed during this mental imagery process, i.e. that the representations formed during this form of mental imagery are compatible with representations during visual perception (or, in your words, produce overlapping neural patterns). While we can not know to what extent people were performing mental imagery while reading (or having inner speech while viewing images), our results demonstrate that their brain activity allows for decoding across modalities, which implies that modality-invariant representations are present.
It is true that our current analyses can not disambiguate modality-invariant representations (or, in your words, shared representational structure) from abstract representations (in your words, genuinely modality-independent representations). As the main goal of the paper was to build modality-agnostic decoders, and these only require what we call “modality-invariant” representations (see our updated terminology in the general reviewer response above), we leave this question open for future work. We do however discuss this important limitation in the Discussion section of the updated manuscript.
Regarding the asymmetry of decoding results when comparing modality-agnostic decoders with the two respective modality-specific decoders for captions and images: We do not believe that this asymmetry contradicts the premise of a modality-agnostic decoder. Multiple explanations for this result are possible: (1) The modality-specific decoder for images might benefit from the more readily decodable lower-level modality-dependent neural activity patterns in response to images, which are less useful for the modality-agnostic decoder because they are not useful for decoding caption trials. The modality-specific decoders for captions might not be able to pick up on low-level modality-dependent neural activity patterns as these might be less easily decodable.
The signal-to-noise ratio for caption trials might be lower than for image trials (cf. generally lower caption decoding performance), therefore the addition of training data (even if it is from another modality) improves the decoding performance for captions, but not for images (which might be at ceiling already).
Regarding the similar performance between modality-agnostic decoders based on multimodal versus unimodal features: Unimodal features are based on rather high-level features of the respective modality (e.g. last-layer features of a model trained for semantic image classification), which can be already modality-invariant to some degree. Additionally, as already mentioned before, in the updated manuscript we only require representations to be modality-invariant and not necessarily abstract.
(2) The current analysis cannot definitively conclude that the decoder itself is modality-agnostic, making "Qualitative Decoding Results" difficult to interpret in this context. This section currently provides illustrative examples, but lacks systematic quantitative analyses.
The qualitative decoding results in Figures 6 and 7 present exemplary qualitative results for the quantitative results presented in Figures 4 and 5 (see also Reviewer 1 Comment 4).
Figures 4 and 5 show pairwise decoding accuracy as a quantitative measure for evaluation of the decoders. This metric is the main metric we used to compare different decoder types and features. Based on the finding that modality-agnostic decoders using imagebind features achieve the best score on this metric, we performed the additional qualitative analysis presented in Figures 6 and 7. (Note that we expanded the candidate set for the qualitative analysis in order to have a larger and more diverse set of images.)
(3) The use of mental imagery as evidence for modality-agnostic decoding is problematic.
Imagery involves subjective, variable experiences and likely draws on semantic and perceptual networks in flexible ways. Strong decoding in imagery trials could reflect semantic overlap or task strategies rather than evidence of abstraction.
It is true that mental imagery does not necessarily rely on modality-agnostic representations. In the updated manuscript we revised our terminology and refer to the analyzed representations as modality-invariant, which we define as “representations that significantly overlap between modalities”.
The manuscript presents a methodologically sophisticated and timely investigation into shared neural representations across modalities. However, the current evidence does not clearly distinguish between shared semantics, overlapping unimodal processes, and true modality-independent representations. A more cautious interpretation is warranted.
Nonetheless, the dataset and methodological framework represent a valuable resource for the field.
We fully agree with these observations, and updated our terminology as outlined in the general response.
Reviewer #3 (Public review):
Summary:
The authors recorded brain responses while participants viewed images and captions. The images and captions were taken from the COCO dataset, so each image has a corresponding caption, and each caption has a corresponding image. This enabled the authors to extract features from either the presented stimulus or the corresponding stimulus in the other modality.
The authors trained linear decoders to take brain responses and predict stimulus features.
"Modality-specific" decoders were trained on brain responses to either images or captions, while "modality-agnostic" decoders were trained on brain responses to both stimulus modalities. The decoders were evaluated on brain responses while the participants viewed and imagined new stimuli, and prediction performance was quantified using pairwise accuracy. The authors reported the following results:
(1) Decoders trained on brain responses to both images and captions can predict new brain responses to either modality.
(2) Decoders trained on brain responses to both images and captions outperform decoders trained on brain responses to a single modality.
(3) Many cortical regions represent the same concepts in vision and language.
(4) Decoders trained on brain responses to both images and captions can decode brain responses to imagined scenes.
Strengths:
This is an interesting study that addresses important questions about modality-agnostic representations. Previous work has shown that decoders trained on brain responses to one modality can be used to decode brain responses to another modality. The authors build on these findings by collecting a new multimodal dataset and training decoders on brain responses to both modalities.
To my knowledge, SemReps-8K is the first dataset of brain responses to vision and language where each stimulus item has a corresponding stimulus item in the other modality. This means that brain responses to a stimulus item can be modeled using visual features of the image, linguistic features of the caption, or multimodal features derived from both the image and the caption. The authors also employed a multimodal one-back matching task, which forces the participants to activate modality-agnostic representations. Overall, SemReps-8K is a valuable resource that will help researchers answer more questions about modality-agnostic representations.
The analyses are also very comprehensive. The authors trained decoders on brain responses to images, captions, and both modalities, and they tested the decoders on brain responses to images, captions, and imagined scenes. They extracted stimulus features using a range of visual, linguistic, and multimodal models. The modeling framework appears rigorous, and the results offer new insights into the relationship between vision, language, and imagery. In particular, the authors found that decoders trained on brain responses to both images and captions were more effective at decoding brain responses to imagined scenes than decoders trained on brain responses to either modality in isolation. The authors also found that imagined scenes can be decoded from a broad network of cortical regions.
Weaknesses:
The characterization of "modality-agnostic" and "modality-specific" decoders seems a bit contradictory. There are three major choices when fitting a decoder: the modality of the training stimuli, the modality of the testing stimuli, and the model used to extract stimulus features. However, the authors characterize their decoders based on only the first choice-"modality-specific" decoders were trained on brain responses to either images or captions, while "modality-agnostic" decoders were trained on brain responses to both stimulus modalities. I think that this leads to some instances where the conclusions are inconsistent with the methods and results.
In our analysis setup, a decoder is entirely determined by two factors: (1) the modality of the stimuli that the subject was exposed to, and (2) the machine learning model used to extract stimulus features.
The modality of the testing stimuli defines whether we are evaluating the decoder in a within-modality or cross-modality setting, but is not an inherent characteristic of a trained decoder
First, the authors suggest that "modality-specific decoders are not explicitly encouraged to pick up on modality-agnostic features during training" (line 137) while "modality-agnostic decoders may be more likely to leverage representations that are modality-agnostic" (line 140). However, whether a decoder is required to learn modality-agnostic representations depends on both the training responses and the stimulus features. Consider the case where the stimuli are represented using linguistic features of the captions. When you train a "modality-specific" decoder on image responses, the decoder is forced to rely on modality-agnostic information that is shared between the image responses and the caption features. On the other hand, when you train a "modality-agnostic" decoder on both image responses and caption responses, the decoder has access to the modality-specific information that is shared by the caption responses and the caption features, so it is not explicitly required to learn modality-agnostic features. As a result, while the authors show that "modality-agnostic" decoders outperform "modality-specific" decoders in most conditions, I am not convinced that this is because they are forced to learn more modality-agnostic features.
It is true that for example a modality-specific decoder trained on fmri data from images with stimulus features extracted from captions might also rely on modality-invariant features. We still call this decoder modality-specific, as it has been trained to decode brain activity recorded from a specific stimulus modality. In the updated manuscript we corrected the statement that “modality-specific decoders are not explicitly encouraged to pick up on modality-invariant features during training” to include the case of decoders trained on features from the other modality which might also rely on modality-invariant features.
It is true that a modality-agnostic decoder can also have access to modality-dependent information for captions and images. However, as it is trained jointly with both modalities and the modality-dependent features are not compatible, it is encouraged to rely on modality-invariant features. The result that modality-agnostic decoders are outperforming modality-specific decoders trained on captions for decoding captions confirms this, because if the decoder was only relying on modality-dependent features the addition of additional training data from another stimulus modality could not increase the performance. (Also, the lack of a performance drop compared to modality-specific decoders trained on images is only possible thanks to the reliance on modality-invariant features. If the decoder only relied on modality-dependent features the addition of data from another modality would equal an addition of noise to the training data which must result in a performance drop at test time.). We can not exclude the possibility that modality-agnostic decoders are also relying on modality-dependent features, but our results suggest that they are relying at least to some degree on modality-invariant features.
Second, the authors claim that "modality-specific decoders can be applied only in the modality that they were trained on, while "modality-agnostic decoders can be applied to decode stimuli from multiple modalities, even without knowing a priori the modality the stimulus was presented in" (line 47). While "modality-agnostic" decoders do outperform "modality-specific" decoders in the cross-modality conditions, it is important to note that "modality-specific" decoders still perform better than expected by chance (figure 5). It is also important to note that knowing about the input modality still improves decoding performance even for "modality-agnostic" decoders, since it determines the optimal feature space-it is better to decode brain responses to images using decoders trained on image features, and it is better to decode brain responses to captions using decoders trained on caption features.
Thanks for this important remark. We corrected this statement and now say that “modality-specific decoders that are trained to be applied only in the modality that they were trained on”, highlighting that their training process optimizes them for decoding in a specific modality. They can indeed be applied to the other modality at test time, this however results in a substantial performance drop.
It is true that knowing the input modality can improve performance even for modality-agnostic decoders. This can most likely be explained by the fact that in that case the decoder can leverage both, modality-invariant and modality-dependent features. We will not further focus on this result however as the main motivation to build modality-agnostic decoders is to be able to decode stimuli without knowing the stimulus modality a priori.
Recommendations for the authors:
Reviewer #1 (Recommendations for the authors):
I will list additional recommendations below in no specific order:
(1) I find the term "modality agnostic" quite unusual, and I believe I haven't seen it used outside of the ML community. I would urge the authors to change the terminology to be more common, or at least very early explain why the term is much better suited than the range of existing terms. A modality agnostic representation implies that it is not committed to a specific modality, but it seems that a representation cannot be committed to something.
In the updated manuscript we now refer to the identified brain patterns as modality-invariant, which has previously been used in the literature (Man et al. 2012; Devereux et al. 2013; Patterson et al. 2016; Deniz et al. 2019, Nakai et al. 2021) (see also the general response on top and the Introduction and Related Work sections of the updated manuscript).
We continue to refer to the decoders as modality-agnostic, as this is a new type of decoder, and describes the fact that they are trained in a way that abstracts away from the modality of the stimuli. We chose this term as we are not aware of any work in which brain decoders were trained jointly on multiple stimulus modalities and in order not to risk contradictions/confusions with other definitions.
Deniz, F., Nunez-Elizalde, A. O., Huth, A. G., & Gallant, J. L. (2019). The Representation of Semantic Information Across Human Cerebral Cortex During Listening Versus Reading Is Invariant to Stimulus Modality. Journal of Neuroscience, 39(39), 7722–7736. https://doi.org/10.1523/JNEUROSCI.0675-19.2019
Devereux, B. J., Clarke, A., Marouchos, A., & Tyler, L. K. (2013). Representational Similarity Analysis Reveals Commonalities and Differences in the Semantic Processing of Words and Objects. The Journal of Neuroscience, 33(48).
Nakai, T., Yamaguchi, H. Q., & Nishimoto, S. (2021). Convergence of Modality Invariance and Attention Selectivity in the Cortical Semantic Circuit. Cerebral Cortex, 31(10), 4825–4839. https://doi.org/10.1093/cercor/bhab125
Man, K., Kaplan, J. T., Damasio, A., & Meyer, K. (2012). Sight and Sound Converge to Form Modality-Invariant Representations in Temporoparietal Cortex. Journal of Neuroscience, 32(47), 16629–16636.
Patterson, K., & Lambon Ralph, M. A. (2016). The Hub-and-Spoke Hypothesis of Semantic Memory. In Neurobiology of Language (pp. 765–775). Elsevier. https://doi.org/10.1016/B978-0-12-407794-2.00061-4
(2) The table in Figure 1B would benefit from also highlighting the number of stimuli that have overlapping captions and images.
The number of overlapping stimuli is rather small (153-211 stimuli depending on the subject). We added this information to Table 1B.
(3) The authors wrote that training stimuli were presented only once, yet they used a one-back task. Did the authors also exclude the first presentation of these stimuli?
Thanks for pointing this out. It is indeed true that some training stimuli were presented more than once, but only for the case of one-back target trials. In these cases the second presentation of the stimulus was excluded, but not the first. As the subject can not be aware of the fact that the upcoming presentation is going to be a one-back target, the first presentation can not be affected by the presence of the subsequent repeated presentation. We updated the manuscript to clarify this issue.
(4) Coco has roughly 80-90 categories, so many image captions will be extremely similar (e.g., "a giraffe walking", "a surfer on a wave", etc.). How can people keep these apart?
It is true that some captions and images are highly similar even though they are not matching in the dataset. This might result in several false button presses because the subjects identified an image-caption pair as matching when in fact it wasn't intended to. However, as there was no feedback given on the task performance, this issue should not have had a major influence on the brain activity of the participants.
(5) Footnotes for statistics are quite unusual - could the authors integrate statistics into the text?
Thanks for this remark, in the updated manuscript all statistics are part of the main text.
(6) It may be difficult to achieve the assumptions of a permutation test - exchangeability, which may bias statistical results. It is not uncommon for densely sampled datasets to use bootstrap sampling on the predictions of the test data to identify if a given percentile of that distribution crosses 0. The lowest p-value is given by the number of bootstrap samples (e.g., if all 10,000 bootstrap samples are above chance, then p < 0.0001). This may turn out to be more effective.
Thanks for this comment. Our statistical procedure was in fact involving a bootstrapping procedure to generate a null distribution on the group-level. We updated the manuscript to describe this method in more detail. Here is the updated paragraph: “To estimate the statistical significance of the resulting clusters we performed a permutation test, combined with a bootstrapping procedure to estimate a group-level null distribution see also Stelzer et al., 2013). For each subject, we evaluated the decoders 100 times with shuffled labels to create per-subject chance-level results. Then, we randomly selected one of the 100 chance-level results for each of the 6 subjects and calculated group-level statistics (TFCE values) the exact same way as described in the preceding paragraph. We repeated this procedure 10,000 times resulting in 10,000 permuted group-level results. We ensured that every permutation was unique, i.e. no two permutations were based on the same combination of selected chance-level results. Based on this null distribution, we calculated p-values for each vertex by calculating the proportion of sampled permutations where the TFCE value was greater than the observed TFCE value. To control for multiple comparisons across space, we always considered the maximum TFCE score across vertices for each group-level permutation (Smith and Nichols, 2009).”
(7) The authors present no statistical evidence for some of their claims (e.g., lines 335-337). It would be good if they could complement this in their description. Further, the visualization in Figure 4 is rather opaque. It would help if the authors could add a separate bar for the average modality-specific and modality-agnostic decoders or present results in a scatter plot, showing modality-specific on the x-axis and modality-agnostic on the y-axis and color-code the modality (i.e., making it two scatter colors, one for images, one for captions). All points will end up above the diagonal.
We updated the manuscript and added statistical evidence for the claims made:
We now report results for the claim that when considering the average decoding performance for images and captions, modality-agnostic decoders perform better than modality-specific decoders, irrespective of the features that the decoders were trained on.
Additionally, we report the average modality-agnostic and modality-specific decoding accuracies corresponding to Figure 4. For modality-agnostic decoders the average value is 81.86\%, for modality-specific decoders trained on images 78.15\%, and for modality-specific decoders trained on captions 72.52\%. We did not add a separate bar to Figure 4 as this would add additional information to a Figure which is already very dense in its information content (cf. Reviewers 2’s recommendations for the authors). We therefore believe it is more useful to report the average values in the text and provide results for a statistical test comparing the decoder types. A scatter plot would make it difficult to include detailed information on the features, which we believe is crucial.
We further provide statistical evidence for the observation regarding the directionality of cross-modal decoding.
Reviewer #2 (Recommendations for the authors):
For achieving more evidence to support modality-agnostic representations in the brain, I suggest more thorough analyses, for example:
(1) Traditional searchlight RSA using different deep learning models. Through this approach, it might identify different brain areas that are sensitive to different formats of information (visual, text, multimodal); subsequently, compare the decoding performance using these ROIs.
(2) Build more dissociable decoders for information of different modality formats, if possible. While I do not have a concrete proposal, more targeted decoder designs might better dissociate representational formats (i.e., unimodal vs. modality-agnostic).
(3) A more detailed exploration of the "qualitative decoding results"--for example, quantitatively examining error types produced by modality-agnostic versus modality-specific decoders--would be informative for clarifying what specific content the decoder captures, potentially providing stronger evidence for modality-agnostic representations.
Thanks for these suggestions. As the main goal of the paper is to introduce modality-agnostic decoders (which should be more clear from the updated manuscript, see also the general response to reviews), we did not include alternative methods for identifying modality-invariant regions. Nonetheless, we agree that in order to obtain more in-depth insight into the nature of representations that were recorded, performing analyses with additional methods such as RSA, comparisons with more targeted decoder designs in terms of their target features will be indispensable, as well as more in-depth error type analyses. We leave these analyses as promising directions for future work.
The writing could be further improved in the introduction and, accordingly, the discussion. The authors listed a series of theories about conceptual representations; however, they did not systematically explain the relationships and controversies between them, and it seems that they did not aim to address the issues raised by these theories anyway. Thus, the extraction of core ideas is suggested. The difference between "modality-agnostic" and terms like "modality-independent," "modality-invariant," "abstract," "amodal," or "supramodal," and the necessity for a novel term should be articulated.
The updated manuscript includes an improved introduction and discussion section that highlight the main focus and contributions of the study.
We believe that a systematic comparison of theories on conceptual representations involving their relationships and controversies would require a dedicated review paper. Here, we focused on the aspects that are relevant for the study at hand (modality-invariant representations), for which we find that none of the considered theories can be rejected based on our results.
Regarding the terminology (modality-agnostic vs. modality-invariant, ..) please refer to the general response.
The figures also have room to improve. For example, Figures 4 and 5 present dense bar plots comparing multiple decoding settings (e.g., modality-specific vs. modality-agnostic decoders, feature space, within-modal vs. cross-modal, etc.); while comprehensive, they would benefit from clearer labels or separated subplots to aid interpretation. All figures are recommended to be optimized for greater clarity and directness in future revisions.
Thanks for this remark. We agree that the figures are quite dense in information. However, splitting them up into subplots (e.g. separate subplots for different decoder types) would make it much less straightforward to compare the accuracy scores between conditions. As the main goal of these figures is to compare features and decoder types, we believe that it is useful to keep all information in the same plot.
You are also suggesting to improve the clarity of the labels. It is true that the top left legend of Figures 4 and 5 was mixing information about decoder type and broad classes of features (vision/language/multimodal). To improve clarity, we updated the figures and clearly separated information on decoder type (the hue of different bars) and features (x-axis labels). The broad classes of features (vision/language/multimodal) are distinguished by alternating light gray background colors and additional labels at the very bottom of the plots.
The new plots allow for easy performance comparison of the different decoder types and additionally provide information on confidence intervals for the performance of modality-specific decoders, which was not available in the previous figures.
Reviewer #3 (Recommendations for the authors):
(1) As discussed in the Public Review, I think the paper would greatly benefit from clearer terminology. Instead of describing the decoders as "modality-agnostic" and "modality-specific", perhaps the authors could describe the decoding conditions based on the train and test modalities (e.g., "image-to-image", "caption-to-image", "multimodal-to-image") or using the terminology from Figure 3 (e.g., "within-modality", "cross-modality", "modality-agnostic").
We updated our terminology to be clearer and more accurate, as outlined in the general response. The terms modality-agnostic and modality-specific refer to the training conditions, and the test conditions are described in Figure 3 and are used throughout the paper.
(2) Line 244: I think the multimodal one-back task is an important aspect of the dataset that is worth highlighting. It seems to be a relatively novel paradigm, and it might help ensure that the participants are activating modality-agnostic representations.
It is true that the multimodal one-back task could play an important role for the activation of modality-invariant representations. Future work could investigate to what degree the presence of widespread modality-invariant representations is dependent on such a paradigm.
(3) Line 253: Could the authors elaborate on why they chose a random set of training stimuli for each participant? Is it to make the searchlight analyses more robust?
A random set of training stimuli was chosen in order to maximize the diversity of the training sets, i.e. to avoid bias based on a specific subsample of the CoCo dataset. Between-subject comparisons can still be made based on the test set which was shared for all subjects, with the limitation that performance differences due to individual differences or to the different training sets can not be disentangled. However, the main goal of the data collection was not to make between-subject comparisons based on common training sets, but rather to make group-level analyses based on a large and maximally diverse dataset.
(4) Figure 4: Could the authors comment more on the patterns of decoding performance in Figure 5? For instance, it is interesting that ResNet is a better target than ViT, and BERT-base is a better target than BERT-large.
A multitude of factors influence the decoding performance, such as features dimensionality, model architecture, training data, and training objective(s) (Conwell et al. 2023; Raugel et al. 2025). Bert-base might be better than bert-large because the extracted features are of lower dimension. Resnet might be better than ViT because of its architecture (CNN vs. Transformer). To dive deeper into these differences further controlled analysis would be necessary, but this is not the focus of this paper. The main objective of the feature comparison was to provide a broad overview over visual/linguistic/multimodal feature spaces and to identify the most suitable features for modality-agnostic decoding.
Conwell, C., Prince, J. S., Kay, K. N., Alvarez, G. A., & Konkle, T. (2023). What can 1.8 billion regressions tell us about the pressures shaping high-level visual representation in brains and machines? (p. 2022.03.28.485868). bioRxiv. https://doi.org/10.1101/2022.03.28.485868
Raugel, J., Szafraniec, M., Vo, H.V., Couprie, C., Labatut, P., Bojanowski, P., Wyart, V. and King, J.R. (2025). Disentangling the Factors of Convergence between Brains and Computer Vision Models. arXiv preprint arXiv:2508.18226.
(5) Figure 7: It is interesting that the modality-agnostic decoder predictions mostly appear traffic-related. Is there a possibility that the model always produces traffic-related predictions, making it trivially correct for the presented stimuli that are actually traffic-related? It could be helpful to include some examples where the decoder produces other types of predictions to dispel this concern.
The presented qualitative examples were randomly selected. To make sure that the decoder is not always predicting traffic-related content, we included 5 additional randomly selected examples in Figures 6 and 7 of the updated manuscript. In only one of the 5 new examples the decoder was predicting traffic-related content, and in this case the stimulus had actually been traffic-related (a bus).
The key part of our CSS: only letting <hr> have a width value that’s a multiple of 22px (the width of each repeating element). The width will never be set to a value that cuts off an element.
I do prefer round for border-image but this is good!
Note: This response was posted by the corresponding author to Review Commons. The content has not been altered except for formatting.
Learn more at Review Commons
Manuscript number: RC-2025-03174
Corresponding author(s): Cristina, Tocchini and Susan, Mango
We thank the reviewers for their thoughtful and constructive comments. We were pleased that the reviewers found our study “rigorous”, “well presented”, “technically strong”, and “novel”. We are also grateful for their recognition that our work identifies a function for a HOT region in gene regulation and provides new insights into the role of the uHOT in controlling dlg-1 expression.
Point-by-point description of the revisions
We have addressed the reviewers’ concerns by clarifying and refining the text, particularly regarding the intron 1 results, improving the quantitation and statistical analyses, and making adjustments and additions to text and figures.
Specific responses to each point are provided below in blue.
Reviewer #1
In my view, their conclusions regarding the intronic HOT region are speculative and unconvincing. See below for main criticisms.*
We agree, and have made changes throughout the manuscript to make this point clearer. Specifically, we contextualize the role of intron 1 as a putative enhancer in reporter assays, but not in endogenous, physiological conditions. Some examples are:
Abstract: “(…) In contrast, the intronic region displays weak enhancer-like activity when tested in transcriptional reporter assays but is dispensable in transcriptional control when studied at the endogenous locus. Our findings reveal how HOT regions contribute to gene regulation during animal development and illustrate how regulatory potential identified in isolated contexts can be selectively deployed or buffered within the native genomic architecture.”
Background: “(…) The HOT region in the first intron possesses weak transcriptional capabilities that are restricted to epidermal cells as observed in transcriptional reporters, but seem to not be employed in physiological contexts.” As it will become clear reading this updated version of the manuscript, we cannot exclude at present a functional role during non-physiological conditions (e.g., stress)
Results and discussion: “(…) This is in contrast with what the reporter experiments showed, where intron 1 alone was permissive for transcription and slightly enhanced the FL transgene expression levels (Figure 1F,G and S4). (…)”
Other changes can be found highlighted in yellow in the manuscript.
We thank the reviewer for raising this concern. To avoid overstating our conclusions, we now frame the potential interaction between the two studied HOT regions strictly in the context of previously published ARC-C data (Huang et al., 2022). We clarify in the revised text that these interactions have been observed in earlier work during larval stages (Huang et al., 2022), but remain to be validated during embryogenesis, and we present them solely as contextual information rather than as a central conclusion.
In Results and discussion section we wrote: “(…) Although the presence of a fountain at this locus remains to be confirmed during embryogenesis, Accessible Region Conformation Capture (ARC-C), a method that maps chromatin contacts anchored at accessible regulatory elements, showed that the putative HOT region interacts with other DNA sequences, including the first intron of dlg-1 (1). (…)”
* The authors claim that not all the phenotypic effects seen from deleting the uHOT region are specific to the dlg-1 gene. This is an interesting model, but the authors show essentially no data to support this or any explanation of what other gene might be regulated.*
We appreciate the reviewer’s comment and have revised the manuscript to ensure that the possibility of additional regulatory effects from the uHOT region is presented as a hypothesis rather than a claim. Our study was designed to investigate HOT-region–based transcriptional regulation rather than chromatin interactions, and we now make this scope more explicit in the text. The revised discussion highlights that, although ARC-C data suggest the uHOT region may contact other loci, the idea that these interactions contribute to the observed phenotypes remains speculative and will require dedicated future work.
In Results and discussion section we wrote: “(…) Because, as previously shown, the upstream HOT region exhibits chromatin interactions with other genomic loci (1), its depletion might affect gene expression of beyond dlg-1 alone. An intriguing hypothesis is that these phenotypes do not arise only from the reduction in dlg-1 mRNA and DLG-1 protein levels, but also from synergistic, partial loss-of-function phenotypes involving other genes (24). (…)”
* Finally, some of the hypotheses in the text could be more accurately framed by the authors. They claim HOT regions are often considered non-functional (lines 189-191). Also, they claim that correct expression levels and patterning is usually regulation by elements within a few hundred basepairs of the CDS (lines 78-80). These claims are not generally accepted in the field, despite a relatively compact genome. Notably, both claims were tested and disproven by Chen et al (2014), Genome Research, where the authors specifically showed strong transcriptional activity from 10 out of 10 HOT regions located up to 4.7 kb upstream of their nearest gene. Chen et al. 2014 is cited by Tocchini et al. and it is, therefore, surprisingly inconsistent with the claims in this manuscript.*
We thank the reviewer for this comment and have revised the text to clarify our intended meaning and avoid framing discussion points as absolute claims. We changed “often” to “frequently” in both sentences so that they better reflect general trends rather than universal rules.
The revised text now reads: “Controversially, C. elegans sequences that dictate correct expression levels and patterning are frequently located within a few hundred base-pairs (bp) (maximum around 1,000–1,500 bp) from a gene’s CDS (3,13–15),”;
And: “HOT regions in C. elegans, as well as other systems, have been predominantly associated with promoters and were frequently considered non-functional or simply reflective of accessible chromatin (25).”
Regarding the comparison to Chen et al., 2014, we note that their reporters did not include a reference baseline for “strong” transcriptional activity, and only five of the ten tested HOT regions were located more than 1.5 kb from the nearest TSS. Therefore, our phrasing is consistent with their findings while describing general trends observed in the C. elegans genome rather than absolute rules. We have also ensured that these sentences are presented as discussion points rather than definitive claims. We hope these revisions make the framing and context clearer to the reader. The fluorescence expression from the intronic HOT region is not visible by eye and the quantification shows very little expression, suggestive of background fluorescence. Although the authors show statistical significance in Figure 1G, I would argue this is possibly based on inappropriate comparisons and/or a wrong choice statistical test. The fluorescence levels should be compared to a non-transgenic animal and/or to a transgenic animal with the tested region shuffled but in an equivalent
We understand the reviewer’s concern regarding the low fluorescence levels observed for the intronic HOT reporter. To address this, we have now included a Figure S4 with higher-exposure versions of the embryos shown in Figure 1. These panels confirm that the nuclear signal is genuine: embryos without a functional transcriptional transgene do not display any comparable fluorescence, aside from the characteristic cytoplasmic granules associated with embryonic autofluorescence. Similar reference images have also been added to Figure S3 to clarify the appearance of autofluorescence under the same imaging conditions.
Regarding the quantitation analyses, as suggested by the reviewers, we now consistently quantify fluorescence by calculating the mean intensity for each embryo (biological replicates) and performing statistical analyses on these values. This approach ensures that the statistical tests are applied to independent biological measurements.
* I would suggest the authors remove their claims about the intronic enhancer and the interaction between the two regions. And I would suggest softening the claims about the uHOT regulation of another putatitive gene.*
We have revised the manuscript to avoid definitive claims regarding the presence of an interaction between the two studied HOT regions. These points are now presented strictly as hypotheses within the discussion, suggested by previously published ARC-C data rather than by our own experimental evidence. Likewise, we have softened our statements regarding the possibility that the uHOT region may regulate additional gene(s). This idea is now framed as a speculative model that will require dedicated future studies, rather than as a conclusion of the present work. Quotes can be found in the previous points (#3 and #4) raised by Reviewer 1.
* The authors would need to demonstrate several things to support their current claims. The major experiments necessary are:*
In general, the minimal Δpes-10 promoter is specifically designed to have negligible basal transcriptional activity on its own, and this property has been extensively validated in previous studies (reference included in the revised manuscript).
* It is not very clear why the authors did not test intron 1 within the H2B of the transgene and just the minimal promoter in front of the transgene, but only in the context of the full-length promoter. The authors show a minor difference in expression levels for the full-length (FL) and full-length with intron 1 (FL-INT1) but show a large statistical differnce. The authors use an inappropriate statistical test (T-test) for this experiment and treat many datapoints from the same embryo as independent, which is clearly not the case. Even minor differences in staging, transgene silencing in early development, or variability would potentially bias their data collection.*
We thank the reviewer for this comment. Our goal was to assess the potential contribution of intron 1 in two complementary contexts: (i) on its own, upstream of a minimal promoter, to test whether it can in principle support transcription, and (ii) within the full-length promoter construct, which more closely reflects the endogenous configuration. For this reason, we did not generate an additional construct placing intron 1 within the H2B reporter driven only by the minimal promoter, as we considered this redundant with the information provided by the existing INT1 and FL-INT1 reporters.
Regarding the statistical analysis, we agree that treating multiple measurements from the same embryo as independent is not appropriate. In the revised manuscript, we now use the mean fluorescence intensity per embryo as a single biological replicate and perform all statistical tests on these independent values. This approach avoids pseudo-replication and ensures that the analysis is robust to variability in staging or transgene behavior. The conclusions remain the same.
* The authors claim, based on ARC-C data previously published by their lab (Huang et al. 2022) that the dlg-1 HOT region interacts with "other" genomic regions. This is potentially interesting but the evidence for this should be included in the manuscript itself, perhaps by re-analyzing data from the 2022 manuscript?*
We thank the reviewer for this suggestion. The chromatin-interaction data referred to in the manuscript originate from the work of Huang et al., 2022, published by the Ahringer lab. As these ARC-C datasets are already publicly available and thoroughly analyzed in the original publication, we felt that reproducing them in our manuscript was not necessary for supporting the limited contextual point we make. Our intent is simply to note that previous work reported contacts between the uHOT region and additional loci. To address the reviewer’s concern, we have revised the manuscript to make clear that we are referencing previously published ARC-C observations and that we do not present these interactions as new findings from our study.
For example, in Results and discussion section we wrote: “(…) Because, as previously shown, the upstream HOT region exhibits chromatin interactions with other genomic loci (1), its depletion might affect gene expression beyond dlg-1 alone. An intriguing hypothesis is that these phenotypes do not arise only from the reduction in dlg-1 mRNA and DLG-1 protein levels, but also from a synergistic, partial loss-of-function phenotypes involving other genes (24). (…)”
* The fluorescence quantification is difficult to interpret from the attached data file (Table S1). For the invidividual values, it is unclear how many indpendent experiments (different embryos) were conducted. The authors should clarify if every data value is from an independent embryo or if they used several values from the same embryo. If they did use several values from the same embryo, how did they do this? Did they take very cell? Or did they focus on specific cells? How did they ensure embryo staging?*
We thank the reviewer for pointing this out. To clarify the quantification procedure, we have expanded the description in the Methods section (“Live imaging: microscopy, quantitation, and analysis”). The revised text now specifies that each data point represents the normalized fluorescence value obtained from three nuclei (or five junctions, depending on the construct), all taken from the same anatomical positions across embryos. Two independent biological replicates were performed for each experiment, with each embryo contributing a single averaged value.
As noted in the figure legends, the specific nuclei used for quantification are indicated in each panel (with dashed outlines), and a reference nucleus marked with an asterisk allows unambiguous identification of the same positions across all conditions. We are happy to further refine this description if additional clarification is needed.
* The authors also do not describe how they validated single-copy insertions (partial transgene deletions in integrants are not infrequent and they only appear to use a single insertion for each strain). This should be described and or added as a caveat if no validation was performed.*
The authors also do not describe any validation for the CRISPR alleles, either deletions or insertion of the synthetic intron into dlg-1. How were accurate gene edits verified.
We thank the reviewer for highlighting the importance of validating the genetic constructs. We have now clarified this more explicitly in the revised Methods section and in Table S1. All single-copy transgene insertions and all CRISPR-generated alleles were verified by genotyping and Sanger sequencing to confirm correct integration and the absence of unintended rearrangements.
I am not convinced the statistical analysis of the fluorescence data is correct. Unless the authors show that every datapoint in the fluorescence quantification is independent, then I would argue they vastly overestimate the statistical significance. Even small differences are shown to have "***" levels of significance, which does not appear empirically plausible.
We thank the reviewer for highlighting this point. To ensure that each data point represents an independent measurement, we now calculate the mean fluorescence per embryo (from three nuclei or five junctions) and use these per-embryo means as biological replicates for statistical testing. Two independent experiments were performed for each condition. Statistical differences were evaluated using a one-tailed t-test on the per-embryo means, as indicated in the revised Methods section.
After this adjustment, the differences remain statistically significant, although less extreme than in the initial analysis (now p * *
This study is so closely related to the Chen et al study, that I believe this study should be discussed in more detail to put the data into context.
We thank the reviewer for this suggestion. While we refer to Chen et al., 2014 as a relevant prior study for context, we believe that our work addresses distinct questions and experimental approaches. Specifically, our study focuses on HOT region-based transcriptional regulation in the dlg-1 locus and its functional dissection in vivo, which is conceptually and methodologically different from the scope of Chen et al., 2014 where the author tested the functionality of HOT region-containing promoters in the context of single-copy integrated transcriptional reporters. We hope this is clearer to the reader in the revised manuscript.
* Add H2B to the mNG in Figure 1 in order to understand where the first intron was inserted.*
We thank the reviewer for this suggestion. A schematic representation of the transgene is already provided above the corresponding images to indicate the location of the first intron.
For additional clarity, we have now added the following sentence in the main text: “In the other, intron 1 was inserted in the FL transgene within the H2B coding sequence (at position 25 from the ATG), preserving the canonical splice junctions with AG at the end of the first exon and a G at the beginning of the second exon, so that it acted as a bona fide intron (FL-INT1) (Figure 1F).”
This should help readers understand the placement of the intron without requiring modifications to the figure itself.__ __
Reviewer #2
1) The authors suggest that the region upstream of the dlg-1 gene is a HOT region. Although they highlight that other broad studies pick up this region as a HOT region, it would be good that the authors dive into the HOT identity of the region and characterize it, as it is a major part of their study. In addition to multiple TFs binding to the site, there are different criteria by which a region would be considered a HOT region. E.g. is there increased signal on this region in the IgG ChIP-seq tracks? Is the area CpG dense?
We thank the reviewer for this suggestion. In the manuscript and Figure S1, we show several features of HOT regions, including transcription factor binding and chromatin marks. To further characterize the dlg-1 uHOT region, we have added the following sentence to the text: “The conserved region is positioned approximately four Kb from the CDS of dlg-1 in a CpG-dense sequence (2), and is overlapping and bordered by chromatin marks typically found in enhancers (5,16).”
This addition provides additional evidence supporting the identity of the region as a HOT region, complementing the features already presented.
* 2) When describing the HOT region, they refer to Pol II binding as 'confirming its role as a promoter': non-promoter regions can also have Pol II binding, especially enhancers. Having binding of Pol II does not confirm its role as promoter. On the contrary, seeing the K27ac and K4me1 would point towards it being an enhancer.*
The sentence has been revised to clarify the interpretation of Pol II binding: “This HOT site also contains RNA Pol II peaks during embryogenesis (Figure S1C), supporting its role as a promoter or enhancer (9).” This wording avoids overinterpreting Pol II binding alone, while acknowledging that the HOT region may have both promoter and enhancer characteristics.
We would like to note that the relevant chromatin marks (H3K27ac and H3K4me1), which are indicative of enhancer activity, are described in the text: “(…) Specifically, it is enriched in acetylated lysine 27 (H3K27ac) and mono- and di-methylated lysine 4 of histone H3 (H3K4me1/2), and depleted from tri-methylated lysine 4 of histone H3 (H3K4me3) (Figure S1D) (5,16). (…)”
These changes clarify that the HOT region may have enhancer characteristics and avoid overinterpreting the Pol II signal.
* 3) In S1B, the authors show TF binding tracks. They also have a diagram of the region subsets (HOT1-4) that were later tested. What is their criteria for dividing the HOT region into those fragments? From looking at Fig S1, the 'proper' HOT region (ie. Where protein binding occurs) seems to be divided into two (one chunk as part of HOT3 and one chunk as part of HOT4). Can the authors comment on the effects of this division?*
To clarify the criteria for dividing the HOT region into subregions, we have added the following sentence to the main text: “The subregions were chosen taking into account (i) enrichment of putative TF binding sites (uHOT1 for PHA-4, uHOT2 for YAP-1 and NHR-25, uHOT3 for ELT-3, and uHOT4 for PHA-4 and others (e.g., ELT-1 and ELT-3)), (ii) Pol II binding peaks, and (iii) histone modification peaks (Fig. S1C,D).”
This description explains the rationale behind the division and clarifies why the HOT region was split into these four fragments for functional testing.
* 4) For the reporter experiments, the first experiments carry the histone H2B sequence and the second set of experiments (where the HOT region is dissected) carry a minimal promoter Δ*pes-10 (MINp). The results could be affected by the addition of these sequences. Is there a reason for this difference? Can the authors please justify it?
The difference in reporter design reflects the distinct goals of the two sets of experiments. The H2B sequence, coupled to mNG, is used as a coding sequence throughout the first part of the study (reporter analysis). This is commonly used to (i) concentrate the fluorescence signal (mNG) into nuclei (H2B) and (ii) be able to identify specific cells more accurately for quantitation reasons (intensity and consistency). The Δpes-10 promoter is instead used to analyze whether specific sequences possess enhancer potential: this promoter alone possesses the sequences that can allow transcription only in the presence of transcription factors that bind to the studied sequence placed upstream it.
To clarify this distinction in the manuscript, we have added the following sentence: “(…) Each region was paired with the minimal promoter Δpes-10 (MINp) (Figure 1D) and generated four transcriptional reporters. Δpes-10 is commonly used to generate transcriptional reporter aimed at assessing candidate regulatory enhancer sequences (20). The minimal promoter drives expression only when transcription factors bind to the tested upstream sequence and test enhancer activity. (…)”
5) Regarding the H2B sequence: ' 137: first intron [...] inserted in the FL transgene within the H2B sequence, acting as an actual intron (FL-INT1)': how was the location of the insertion chosen? Does it disrupt H2B? can it be that the H2B sequence contributed to dampening down the expression of mNG and disrupting it makes it stronger? It would be important to run the first experiments with minimal promoters and not with the H2B sequence.
The location of the intron insertion within the H2B coding sequence was chosen to preserve proper splicing and avoid disrupting H2B protein. We added the following sentence to clarify this point: “(…) In the other, the intron was inserted in the FL transgene within the H2B coding sequence (at position 25 from the ATG), preserving the canonical splice junctions with AG at the end of the first exon and a G at the beginning of the second exon, so that it acted as a bona fide intron (FL-INT1) (Figure 1F). (…)”
* 6) Have the authors explored the features of the sequences underlying the different HOT subregions? (e.g. running a motif enrichment analysis)? Is there anything special about HOT3 that could make it a functional region? It would be good to compare uHOT3 vs the others that do not drive the correct pattern. Since it's a HOT region, it may not have a special feature, but it is important to look into it.*
We thank the reviewer for this suggestion. To clarify the rationale for dividing the HOT region into four subregions, we have added the following sentence to the main text: “(…) The subregions were chosen taking into account (i) enrichment of putative TF binding sites (uHOT1 for PHA-4, uHOT2 for YAP-1 and NHR-25, uHOT3 for ELT-3, and uHOT4 for PHA-4 and others (e.g., ELT-1 and ELT-3)), (ii) Pol II binding peaks, and (iii) histone modification peaks (Fig. S1C,D). (…)”
While uHOT3 does not appear to possess unique sequence features beyond these general HOT-region characteristics, this approach allowed us to systematically test which fragments contribute to transcriptional activity and patterning.
7) For comparisons, the authors run t-tests. Is the data parametric? Otherwise, it would be more suitable to use a non-parametric test.
To ensure that each data point represents an independent biological replicate, we now calculate the mean fluorescence intensity per embryo and perform statistical tests on these per-embryo means. The data meet the assumptions of parametric tests, and we use a one-tailed t-test as indicated in the Methods.
* 1) The authors work with C. elegans embryos at comma stage, according to the methods section. It would be good if the authors mentioned it in the main text so that the reader is informed.*
Thanks for this suggestion. We added this sentence in the main text: “(…) Live imaging and quantitation analyses on embryos at the comma stage (used throughout the study for consistency purposes) showed (…)”.
* 2) 'Notably, the upstream HOT region is located more than four kilo-bases (Kb) away the CDS, and the one in the first intron contains enhancer sites, too.': what do they mean by 'enhance sites, too'. Is the region known as a functional enhancer? If so, could you please provide the reference?*
Here the clarification from the revised text: “(…) Notably, the upstream HOT region is located more than four kilo-bases (Kb) away the CDS, and the one in the first intron does not only contain two TSS but also three enhancer sites (8). (…)”
* 3) 'We hypothesized the upstream HOT region is the main driver of dlg-1 transcriptional regulation.': this sentence needs more reasoning. What led to this hypothesis? Is it the fact of seeing multiple TFs binding there? The chromatin marks?*
The reasoning behind the hypothesis is described in the preceding paragraph, and to make this connection clearer, we have revised the sentence to begin with: “Considering all of this information, we hypothesized the upstream HOT region is the main driver of dlg-1 transcriptional regulation. (…)”.
This change explicitly links the hypothesis to the observed TF binding and chromatin marks described above.
* 4) The labels of S1B are too wide, as if they have stretched the image. Could the authors please correct this?*
Yes, we agree with Reviewer 2. We corrected this.
* 5) This sentence does not flow with the rest of the text '84 - cohesins have been shown to organize the DNA in a way that active enhancers make contacts in the 3D space forming "fountains" detectable in Hi-C data (17,18).': is there a reason to explain this? I would remove it if not, as it can confuse the reader.*
We thank the reviewer for this comment. We agree that the sentence could potentially interrupt the flow; however, it is important for introducing the concept of “fountains” in 3D genome organization, which is necessary to understand the subsequent statement: “(…) Although the presence of a fountain at this locus remains to be confirmed during embryogenesis, Accessible Region Conformation Capture (ARC-C), a method that maps chromatin contacts anchored at accessible regulatory elements, showed that the putative HOT region interacts with other DNA sequences, including the first intron of dlg-1 (1). (…)”.
Therefore, we have retained this sentence to provide the necessary background for readers.
* 6) The authors mentioned that 'ARC-C data showed the putative HOT region interacts with other DNA sequences, including the first intron of dlg': have the authors analysed the data from the previous paper? A figure with the relevant data could illustrate this interaction so that the reader knows which specific region has been shown to interact with which. This would also bring clarity as to why they chose intron1 for additional experiments.*
We thank the reviewer for this suggestion. We have examined the relevant ARC-C data from the previous publication (Huang et al., 2022). However, as these results are already published, we do not feel it is necessary to reproduce them in our manuscript. The mentioning of these interactions is intended only to introduce the concept for discussion and to provide context for why intron 1 was considered in subsequent experiments
* 7) 'two deletion sequences spanning from the beginning (uHOT) or the end (Short) of the HOT region until the dlg-1 CDS': From the diagrams of the figure, I understand that uHOT has the distal region deleted, and the short HOT has the distal and the upstream regions deleted. Is this correct? Could you clarify this in the text? E.g. 'we designed two reporters - one containing the sequence starting at the HOT region and ending at the dlg-1 CDS, and the other without the HOT region, but rather starting downstream of it until the dlg-1 CDS'.*
To clarify the design of the reporters, we have revised the text as follows: “(…) To test this idea, we generated three single-copy, integrated transcriptional reporters carrying a histone H2B sequence fused to an mNeon-Green (mNG) fluorescent protein sequence under the transcriptional control of the following dlg-1 upstream regions: (i) a full-length sequence (“FL” = Distal + uHOT + Proximal sequences), (ii) one spanning from the beginning of the HOT region to the dlg-1 CDS (“uHOT” = uHOT + Proximal sequences), and (iii) one starting at the end of the HOT region and ending at the dlg-1 CDS (“Short” = Proximal sequence) (Figure 1A-C). (…)”
This description clarifies which parts of the upstream region are included in each reporter and matches the schematics in Figure 1.
* 8) 'Specifically, it spanned from bp 5,475,070 to 5,475,709 on chromosome X and removed HOT2 and HOT2 sequences' - this is unclear to me. What sequences are removed? HOT2 and 3?*
Thanks for spotting this typo. It has now been corrected.
* 9) 'ARC-C' is not introduced. Please spell out what this is. Accessible Region Conformation Capture (ARC-C). It would be helpful to include a sentence of what it is, as it will not be known by many readers.*
You are right, we changed into: “(…) Although the presence of a fountain at this locus remains to be confirmed during embryogenesis, Accessible Region Conformation Capture (ARC-C), a method that maps chromatin contacts anchored at accessible regulatory elements, showed that the putative HOT region interacts with other DNA sequences, including the first intron of dlg-1 (1). (...)”
* 10) Fig 1 B, diagram on the right: the H2B sequence is missing. I see that is indicated in the legend as part of mNG but this can be misleading. Could the authors add it to the diagram for clarification?*
Yes, you are right. We added this in the figure.__ __
Reviewer #3
The authors' claims are generally supported by the data, thoug the last sentence of the abstract was a bit overstated. They state that they "reveal the function of HOT regions in animals development...."; it would be more accurate to state that they linked the role of an upstream HOT region to dlg-1 regulation, and their findings hint that this element could have additional regulatory functions. The authors can either temper their conclusions or try RNA-seq experiments to find additional genes that are misregulated by the delta-uHOT deletion allele. [OPTIONAL]. Another [OPTIONAL] experiment that would strengthen the claims is to perform RNAi knockdown or DLG-1 protein depletion and link that to phenotype to show that the dlg-1 mRNA and DLG-1 protein changes seen in the uHOT mutant do not explain the lethality observed.
We thank the reviewer for this comment. We have studied HOT region function in the context of a model organism, C. elegans; therefore, we believe that describing our findings as revealing a function of HOT regions in animal development is accurate. The sentence aims at noting that these observations may provide broader insights into HOT region regulation. We changed the last sentence of the abstract into: “(…) Our findings reveal how HOT regions contribute to gene regulation during animal development and illustrate how regulatory potential identified in isolated contexts can be selectively deployed or buffered within the native genomic architecture. (…)”.
We note that RNA-seq is beyond the scope of this study; our discussion of potential effects on other genes is intended only as a hypothesis for future work. RNAi of dlg-1 has been previously reported and is cited in the manuscript, providing context for the phenotypes observed and discussed.
* When printed out I cannot read what the tracks are in Fig S1. Adding larger text to indicate what those tracks are is necessary.* Yes, you are right. We changed this in the figure.
*
Line 79. I would change the word "usually" to "frequently" in the discussion about regulatory element position. While promoters ranging from a few hundred to 2000 basepairs are frequently used, there are numerous examples where important enhancers can be further away.*
Corrected.
* Line 93-95. The description of the reporters was very confusing. When referring to the deletion sequences it sounds like that is what is missing rather than what is included. Rather, if I understand correctly the uHOT is the sequence from the start of the uHOT to the CDS and Short starts at the end of uHOT (omitting it). Adding the promoter fragments to the figure would improve clarity.*
To clarify the design of the reporters, we have revised the text as follows: “(…) To test this idea, we generated three single-copy, integrated transcriptional reporters carrying a histone H2B sequence fused to an mNeon-Green (mNG) fluorescent protein sequence under the transcriptional control of the following dlg-1 upstream regions: (i) a full-length sequence (“FL” = Distal + uHOT + Proximal sequences), (ii) one spanning from the beginning of the HOT region to the dlg-1 CDS (“uHOT” = uHOT + Proximal sequences), and (iii) one starting at the end of the HOT region and ending at the dlg-1 CDS (“Short” = Proximal sequence) (Figure 1A-C). (…)”
This description clarifies which parts of the upstream region are included in each reporter and matches the schematics in Figure 1.
* Line 108. Re-work the phrase "increase majorly". Majorly increase would be better.*
We thank the reviewer for this suggestion. The verb is used here as an infinitive (“to increase majorly”), and in standard English the infinitive is usually not split. Therefore, we have kept the phrasing as it currently appears in the manuscript.
* Line 153-154. The deletion indicates that HOT2 and HOT2 were removed. Was one supposed to be HOT3?*
Thanks for spotting this typo. It has now been corrected.
* In the figure legends the number of animals scored and the number of biological repeats is missing.*
Added.
* Figure 1 title in the legend. Should read "main driver" not "man driver".*
Thanks for spotting this typo. It has now been corrected.
* The references need to be gone through carefully and cleaned up. There are numerous gene and species names that are not italicized. There are also extra elements added by the reference manager such as [Internet].*
Thanks for pointing it out. We used Zotero and the requested formatting from the journal of our choice. We will discuss with their team how to go through this issue.
Note: This preprint has been reviewed by subject experts for Review Commons. Content has not been altered except for formatting.
Learn more at Review Commons
High occupancy target (HOT) regions are genomic sequences in C. elegans that are bound by large numbers of transcription factors and emerged from systematic ChIP-seq studies. Whether they play physiologically important roles in gene regulation is not clear. in In this manuscript, Tocchini et al. examine the function of two HOT regions using a combination of promoter reporters, genome editing, and smFISH. One HOT region is upstream of the dlg-1 gene and other is in the first intron of dlg-1.
The claims about the impact of the upstream HOT region on dlg-1 expression are convincing. Omitting the sequence in a promoter reporter reduces expression, the element is sufficient to drive expression from a MINp::mNG reporter, and deletion of the element reduces dlg-1 expression and causes developmental defects. The claims about the intronic HOT region need to be tempered slightly. The element drives weak expression in a MINp::mNG reporter but the replacement of the dlg-1 first intron with a syntron had no effect on expression, limiting the claims that be made about this regulatory element. The authors' claims are generally supported by the data, thoug the last sentence of the abstract was a bit overstated. They state that they "reveal the function of HOT regions in animals development...."; it would be more accurate to state that they linked the role of an upstream HOT region to dlg-1 regulation, and their findings hint that this element could have additional regulatory functions. The authors can either temper their conclusions or try RNA-seq experiments to find additional genes that are misregulated by the delta-uHOT deletion allele. [OPTIONAL]. Another [OPTIONAL] experiment that would strengthen the claims is to perform RNAi knockdown or DLG-1 protein depletion and link that to phenotype to show that the dlg-1 mRNA and DLG-1 protein changes seen in the uHOT mutant do not explain the lethality observed.
There are elements of the manuscript that must be improved for clarity/accuracy.
Referee cross-commenting
I agree with the comments from the previous reviewers. The suggested experiments are reasonable. Reviewer 1's point about the Chen et al 2014 Genome Res paper is really important. I put the revision as unknown as it depended on whether they did the optional experiments I suggested. If they revise their text, tempering claims, adjusting statistical analyses, then that could be 1-3 months. If they did the RNA-seq that I suggested, that would be a longer timeline.
The study is generally rigorously done. Strengths are that this work finds a function for a HOT region in gene regulation. Limitations are that the work is currently very thorough regulatory element bashing. They convincingly demonstrate the role of uHOT in regulating dlg-1 and suggest that the reduction of DLG-1 levels does not explain the phenotype. This finding is of interest to basic researchers in gene regulation. Without going into that discrepancy more, the significance is limited. Linking HOT regions to novel regulatory mechanisms controlling multiple genes would be broadly interesting to the gene regulation and developmental biology.
I am a C. elegans molecular biologist with expertise in gene regulatory networks.
Note: This preprint has been reviewed by subject experts for Review Commons. Content has not been altered except for formatting.
Learn more at Review Commons
Summary:
The authors investigate the functionality of a HOT region located upstream of the dlg-1 gene in Caenorhabditis elegans. This region is bound by multiple proteins and enriched for H3K27ac and H3K4me1, features characteristic of enhancers. Using reporter assays, they dissect the region and identify a sub-fragment, HOT3, as responsible for driving gene expression in epidermis, with a pattern similar to that of dlg-1 itself. Deletion of this region leads to downregulation of dlg-1 and lethality before or shortly after hatching, in contrast to complete dlg-1 knockouts, which die at mid-embryogenesis. They further examine the role of the gene's first intron, previously reported to physically interact with the HOT region. Incorporating intron 1 into the reporter construct slightly increases expression, suggesting an additive regulatory effect. However, replacing intron 1 with a synthetic sequence at the endogenous locus does not cause major changes. Overall, this study demonstrates that HOT regions can play a functional role in gene regulation, challenging the prevailing view that they are largely non-functional.
Major comments:
Overall, the paper lacks to explain their reasoning on choosing certain conditions and it also lacks on discussions on relevant topics, highlighted below.
1) The authors suggest that the region upstream of the dlg-1 gene is a HOT region. Although they highlight that other broad studies pick up this region as a HOT region, it would be good that the authors dive into the HOT identity of the region and characterize it, as it is a major part of their study. In addition to multiple TFs binding to the site, there are different criteria by which a region would be considered a HOT region. E.g. is there increased signal on this region in the IgG ChIP-seq tracks? Is the area CpG dense?
2) When describing the HOT region, they refer to Pol II binding as 'confirming its role as a promoter': non-promoter regions can also have Pol II binding, especially enhancers. Having binding of Pol II does not confirm its role as promoter. On the contrary, seeing the K27ac and K4me1 would point towards it being an enhancer.
3) In S1B, the authors show TF binding tracks. They also have a diagram of the region subsets (HOT1-4) that were later tested. What is their criteria for dividing the HOT region into those fragments? From looking at Fig S1, the 'proper' HOT region (ie. Where protein binding occurs) seems to be divided into two (one chunk as part of HOT3 and one chunk as part of HOT4). Can the authors comment on the effects of this division?
4) For the reporter experiments, the first experiments carry the histone H2B sequence and the second set of experiments (where the HOT region is dissected) carry a minimal promoter Δpes-10 (MINp). The results could be affected by the addition of these sequences. Is there a reason for this difference? Can the authors please justify it?
5) Regarding the H2B sequence: ' 137: first intron [...] inserted in the FL transgene within the H2B sequence, acting as an actual intron (FL-INT1)': how was the location of the insertion chosen? Does it disrupt H2B? can it be that the H2B sequence contributed to dampening down the expression of mNG and disrupting it makes it stronger? It would be important to run the first experiments with minimal promoters and not with the H2B sequence.
6) Have the authors explored the features of the sequences underlying the different HOT subregions? (e.g. running a motif enrichment analysis)? Is there anything special about HOT3 that could make it a functional region? It would be good to compare uHOT3 vs the others that do not drive the correct pattern. Since it's a HOT region, it may not have a special feature, but it is important to look into it.
7) For comparisons, the authors run t-tests. Is the data parametric? Otherwise, it would be more suitable to use a non-parametric test.
Minor comments:
1) The authors work with C. elegans embryos at comma stage, according to the methods section. It would be good if the authors mentioned it in the main text so that the reader is informed.
2) 'Notably, the upstream HOT region is located more than four kilo-bases (Kb) away the CDS, and the one in the first intron contains enhancer sites, too.': what do they mean by 'enhance sites, too'. Is the region known as a functional enhancer? If so, could you please provide the reference?
3) 'We hypothesized the upstream HOT region is the main driver of dlg-1 transcriptional regulation.': this sentence needs more reasoning. What led to this hypothesis? Is it the fact of seeing multiple TFs binding there? The chromatin marks?
4) The labels of S1B are too wide, as if they have stretched the image. Could the authors please correct this?
5) This sentence does not flow with the rest of the text '84 - cohesins have been shown to organize the DNA in a way that active enhancers make contacts in the 3D space forming "fountains" detectable in Hi-C data (17,18).': is there a reason to explain this? I would remove it if not, as it can confuse the reader.
6) The authors mentioned that 'ARC-C data showed the putative HOT region interacts with other DNA sequences, including the first intron of dlg': have the authors analysed the data from the previous paper? A figure with the relevant data could illustrate this interaction so that the reader knows which specific region has been shown to interact with which. This would also bring clarity as to why they chose intron1 for additional experiments.
7) 'two deletion sequences spanning from the beginning (uHOT) or the end (Short) of the HOT region until the dlg-1 CDS': From the diagrams of the figure, I understand that uHOT has the distal region deleted, and the short HOT has the distal and the upstream regions deleted. Is this correct? Could you clarify this in the text? E.g. 'we designed two reporters - one containing the sequence starting at the HOT region and ending at the dlg-1 CDS, and the other without the HOT region, but rather starting downstream of it until the dlg-1 CDS'.
8) 'Specifically, it spanned from bp 5,475,070 to 5,475,709 on chromosome X and removed HOT2 and HOT2 sequences' - this is unclear to me. What sequences are removed? HOT2 and 3?
9) 'ARC-C' is not introduced. Please spell out what this is. Accessible Region Conformation Capture (ARC-C). It would be helpful to include a sentence of what it is, as it will not be known by many readers.
10) Fig 1 B, diagram on the right: the H2B sequence is missing. I see that is indicated in the legend as part of mNG but this can be misleading. Could the authors add it to the diagram for clarification?
HOT regions are thought to be artifacts from ChIP-seq experiments. This study provides evidence that at least some HOT regions can have a functional role in gene regulation, emphasizing that they should not be dismissed outright.
The findings will be of interest to researchers investigating the biological nature of HOT regions, as well as to those who have encountered HOT regions in their own sequencing datasets. In addition, researchers studying the regulation of dlg-1 in C. elegans may find this work particularly relevant. I work on gene regulation during embryonic development and my technical expertise is omics and fluorescence microscopy. Since I do not work in C. elegans, I cannot evaluate if the patterns/location of the signal is where they claim it to be, I do not know if the cells marked are epidermal cells.
Note: This preprint has been reviewed by subject experts for Review Commons. Content has not been altered except for formatting.
Learn more at Review Commons
Summary:
Provide a short summary of the findings and key conclusions (including methodology and model system(s) where appropriate).
In this manuscript, Tocchini et al. characterize two enhancer regions, one distal and one intronic, of the gene dlg-1 in C. elegans. The two enhancers are termed high-occupancy target (HOT) regions as defined by their binding of most transcription factors, as identified by the modENCODE project. The authors test transcriptional activity of the two HOT regions using single-copy transgene assays and assay their functional relevance by deleting the regions using CRISPR/Cas9 genome editing. The authors observe robust transcriptional activity and functional effects of the distal regulatory element and little evidence for enhancer activity from the intronic enhancer. From these assays, the authors conclude that the distal and intronic enhancers coordinate to fine tune gene expression in a cell-type specific manner.
Major comments:
Are the key conclusions convincing?
The results fully support the authors conclusions regarding the significant role of the upstream HOT region ("uHOT") with strong fluorescence activity and substantial phenotypic effects (i.e., the animals have very low brood sizes and rarely progress through hatching). This data is well presented and technically well done.
The fluorescence expression from the intronic HOT region is not visible by eye and the quantification shows very little expression, suggestive of background fluorescence. Although the authors show statistical significance in Figure 1G, I would argue this is possibly based on inappropriate comparisons and/or a wrong choice statistical test. The fluorescence levels should be compared to a non-transgenic animal and/or to a transgenic animal with the tested region shuffled but in an equivalent - Should the authors qualify some of their claims as preliminary or speculative, or remove them altogether?
Yes, I would suggest the authors remove their claims about the intronic enhancer and the interaction between the two regions. And I would suggest softening the claims about the uHOT regulation of another putatitive gene. - Would additional experiments be essential to support the claims of the paper? Request additional experiments only where necessary for the paper as it is, and do not ask authors to open new lines of experimentation.
Yes, the authors would need to demonstrate several things to support their current claims. The major experiments necessary are:
These experiments are not costly (two transgenes inserted by single-copy transgenesis) nor particularly time-consuming. With cloning, injection, and microscopy, these experiments can be conducted in 6 weeks with relatively few "hands on" hours. The cost should be very reasonably (reagents surely less than €500). - Are the data and the methods presented in such a way that they can be reproduced?
The data are not entirely clear and could benefit from additional details. This is a partial list but shows the general concern.
The fluorescence quantification is difficult to interpret from the attached data file (Table S1). For the invidividual values, it is unclear how many indpendent experiments (different embryos) were conducted. The authors should clarify if every data value is from an independent embryo or if they used several values from the same embryo. If they did use several values from the same embryo, how did they do this? Did they take very cell? Or did they focus on specific cells? How did they ensure embryo staging?
The authors also do not describe how they validated single-copy insertions (partial transgene deletions in integrants are not infrequent and they only appear to use a single insertion for each strain). This should be described and or added as a caveat if no validation was performed.
The authors also do not describe any validation for the CRISPR alleles, either deletions or insertion of the synthetic intron into dlg-1. How were accurate gene edits verified. - Are the experiments adequately replicated and statistical analysis adequate?
I am not convinced the statistical analysis of the fluorescence data is correct. Unless the authors show that every datapoint in the fluorescence quantification is independent, then I would argue they vastly overestimate the statistical significance. Even small differences are shown to have "***" levels of significance, which does not appear empirically plausible.
Minor comments:
This study is so closely related to the Chen et al study, that I believe this study should be discussed in more detail to put the data into context. - Are the text and figures clear and accurate?
Yes, the text and figurea are clear - Do you have suggestions that would help the authors improve the presentation of their data and conclusions?
Add H2B to the mNG in Figure 1 in order to understand where the first intron was inserted.
This manuscript shows an incremental advance in our understanding of HOT regions in C. elegans. The authors replicate similar data presented previously (enhancer assays on HOT regions, PMID: 24653213). Importantly, the authors funcationally validate their data with smFISH and CRISPR-mediated deletion of two enhancers (including the substitution of the intron for a synthetic intron), which is, to my knowledge, novel and advances the field. As such, the data presented validate and increase our confidence in prior results on HOT regions. Unfortunately, the more interesting conclusions about HOT region interactions and synergy to direct expression are less well supported. The work will likely be mainly of interest to C. elegans researchers working on transcriptional regulation. My own field of expertise is C. elegans gene regulation and my lab frequently uses transcriptional transgene assays to determine gene expression.
Reviewer #1 (Public review):
This work compiles a comprehensive atlas of ncORFs across mammalian tissues and cell types, derived from reanalysis of ~400 public ribosome profiling datasets. The authors then evaluate cross-species conservation and functional signatures, proposing that evolutionarily ancient ncORFs tend to have higher translation potential, stronger expression, and closer relationships with canonical coding sequences.
Strengths:
In general, the study provides a large-scale and timely resource of annotated ncORFs, which could be broadly useful for the community. The authors collected ~400 public ribosome profiling datasets for annotations of ncORFs, which, to my best knowledge, is the largest collection of data for such a purpose. The catalog could facilitate future investigations into ncORF biology and broaden understanding of the coding potential of the "non-coding" genome.
Weaknesses:
Based on the ncORF catalog, some of the analyses were not properly done. Some of the results are descriptive.
(1) Bias and representations of the data source. Public ribo-seq datasets are unevenly distributed across tissues and cell lines, raising concerns about heterogeneity and underrepresentation of certain contexts. This may limit the generalizability of the catalog.
(2) The discussion on modular domains of ncORFs is unclear, and the claim that they may originate via TE-related mechanisms is not well supported. Stronger evidence or clearer reasoning is needed.
(3) The conservation comparisons are not fully convincing. Figure S7 shows only mild differences between ncORFs and CDS, and statistical significance is not clearly demonstrated.<br /> Comparisons with other non-coding RNAs should be added, and overlapping sequences between ncORFs and CDS should be excluded to avoid bias.
(4) Figure 3 indicates that some ncORFs are subject to evolutionary constraints. This is not surprising. The authors should provide further analyses on more detailed features of these "conserved" ncORFs vs. the "non-conserved" ones. Some pretty informative works have been done in Drosophila, worms, mice, and humans. Figure 3 suggests some ncORFs are under evolutionary constraint, but this is not unexpected. More granular analyses contrasting "conserved" versus "non-conserved" ncORFs would be informative. In fact, small ORFs, especially uORFs, have been extensively studied for their functions and cross-species conservation. The authors should explicitly show what is new here in their analyses.
(5) Translation levels are reported using RPF counts. However, translation efficiency (normalized by RNA expression) is a more appropriate measure to account for expression heterogeneity.
(6) The correlation analyses between ncORF translation levels and PhyloCSF are confusing and largely descriptive. These sections need sharper framing and clearer conclusions.
(7) Public ribo-seq datasets, generated by different research labs, are known for their strong batch effects. Representations of tissues and cells are also very unbalanced. Therefore, the co-translation analysis between ncORFs and canonical CDS is not well controlled. This should be done by referring to a recent large-scale ribo-seq meta-analysis (Nat Biotechnol. 2025. doi: 10.1038/s41587-025-02718-5).
Note: This response was posted by the corresponding author to Review Commons. The content has not been altered except for formatting.
Learn more at Review Commons
__Reviewer #1 (Evidence, reproducibility and clarity (Required)): __
This study explores chromatin organization around trans-splicing acceptor sites (TASs) in the trypanosomatid parasites Trypanosoma cruzi, T. brucei and Leishmania major. By systematically re-analyzing MNase-seq and MNase-ChIP-seq datasets, the authors conclude that TASs are protected by an MNase-sensitive complex that is, at least in part, histone-based, and that single-copy and multi-copy genes display differential chromatin accessibility. Altogether, the data suggest a common chromatin landscape at TASs and imply that chromatin may modulate transcript maturation, adding a new regulatory layer to an unusual gene-expression system.
I value integrative studies of this kind and appreciate the careful, consistent data analysis the authors implemented to extract novel insights. That said, several aspects require clarification or revision before the conclusions can be robustly supported. My main concerns are listed below, organized by topic/result section.
TAS prediction * Why were TAS predictions derived only from insect-stage RNA-seq data? Restricting TAS calls to one life stage risks biasing predictions toward transcripts that are highly expressed in that stage and may reduce annotation accuracy for lowly expressed or stage-specific genes. Please justify this choice and, if possible, evaluate TAS robustness using additional transcriptomes or explicitly state the limitation.
TAS predictions derived only from insect-stage RNA-seq data because in a previous study it was shown that there are no significant differences between stages in the 5'UTR procesing in T. cruzi life stages (https://doi.org/10.3389/fgene.2020.00166) We are not testing an additional transcriptome here, because the robustness of the software was already probed in the original article were UTRme was described (Radio S, 2018 doi:10.3389/fgene.2018.00671).
Results - "There is a distinctive average nucleosome arrangement at the TASs in TriTryps": * You state that "In the case of L. major the samples are less digested." However, Supplementary Fig. S1 suggests that replicate 1 of L. major is less digested than the T. brucei samples, while replicate 2 of L. major looks similarly digested. Please clarify which replicates you reference and correct the statement if needed.
The reviewer has a good point. We made our statement based on the value of the maximum peak of the sequenced DNA molecules, which in general is a good indicative of the extension of the digestion achieved by the sample (Cole H, NAR, 2011).
As the reviewer correctly points, we should have also considered the length of the DNA molecules in each percentile. However, in this case both, T. brucei's and L major's samples were gel purified before sequencing and it is hard to know exactly what fragments were left behind in each case. Therefore, it is better not to over conclude on that regard.
We have now comment on this in the main manuscript, and we have clarified in the figure legends which data set we used in each case in the figure legends and in Table S1.
* It appears you plot one replicate in Fig. 1b and the other in Suppl. Fig. S2. Please indicate explicitly which replicate is in each plot. For T. brucei, the NDR upstream of the TAS is clearer in Suppl. Fig. S2 while the TAS protection is less prominent; based on your digestion argument, this should correspond to the more-digested replicate. Please confirm.
The replicates used for the construction of each figure are explicitly indicated in Table S1. Although we have detailed in the table the original publication, the project and accession number for each data set, the reviewer is correct that in this case it was still not completely clear to which length distribution heatmap was each sample associated with. To avoid this confusion, we have now added the accession number for each data set to the figure legends and also clarified in Table S1. Regarding the reviewer's comment on the correspondence between the observed TAS protection and the extent of samples digestion, he/she is correct that for a more digested sample we would expect a clearer NDR. In this case, the difference in the extent of digestion between these two samples is minor, as observed the length of the main peak in the length distribution histogram for sequenced DNA molecules is the same. These two samples GSM5363006, represented in Fig1 b, and GSM5363007, represented in S2, belong to the same original paper (Maree et al 2017), and both were gel purified before sequencing. Therefore, any difference between them could not only be the result of a minor difference in the digestion level achieved in each experiment but could be also biased by the fragments included or not during gel purification. Therefore, I would not over conclude about TAS protection from this comparison. We have now included a brief comment on this, in the figure discussion
* The protected region around the TAS appears centered on the TAS in T. brucei but upstream in L. major. This is an interesting difference. If it is technical (different digestion or TAS prediction offset), explain why; if likely biological, discuss possible mechanisms and implications.
We appreciate the reviewer suggestion. We cannot assure if it is due to technical or biological reasons, but there is evidence that L. major 's genome has a different dinucleotide content and it might have an impact on nucleosome assembly. We have now added a comment about this observation in the final discussion of the manuscript.
Additionally, we analyzed DRIP-seq data for L. major, recently published doi: 10.1038/s41467-025-56785-y, and we observed that the R-loop footprint co-localized with the MNase-protected region upstream of the TAS (new S5 Fig), suggesting that the shift is not related to the MNase-seq technique.
Results - "An MNase sensitive complex occupies the TASs in T. brucei": * The definition of "MNase activity" and the ordering of samples into Low/Intermediate/High digestion are unclear. Did you infer digestion levels from fragment distributions rather than from controlled experimental timepoints? In Suppl. Fig. S3a it is not obvious how "Low digestion" was defined; that sample's fragment distribution appears intermediate. Please provide objective metrics (e.g., median fragment length, fraction 120-180 bp) used to classify digestion levels.
As the reviewer suggests, the ideal experiment would be to perform a time course of MNase reaction with all the samples in parallel, or to work with a fixed time point adding increasing amounts of MNase. However, even when making controlled experimental timepoints, you need to check the length distribution histogram of sequenced DNA molecules to be sure which level of digestion you have achieved.
In this particular case, we used public available data sets to make this analysis. We made an arbitrary definition of low, intermediate and high level of digestion, not as an absolute level of digestion, but as a comparative output among the tested samples. We based our definition on the comparison of __the main peak in length distribution heatmaps because this parameter is the best metric to estimate the level of digestion of a given sample. It represents the percentage of the total DNA sequenced that contains the predominant length in the sample tested. __Hence, we considered:
low digestion: when the main peak is longer than the expected protection for a nucleosome (longer than 150 bp). We expect this sample to contain additional longer bands that correspond to less digested material.
intermediate digestion, when the main peak is the expected for the nucleosome core-protection (˜146-150bp).
high digestion, when the main peak is shorter than that (shorter than 146 bp). This case, is normally accompanied by a bigger dispersion in fragment sizes.
To do this analysis, we chose samples that render different MNase protection of the TAS when plotting all the sequenced DNA molecules relative to this point and we used this protection as a predictor of the extent of sample digestion (Figure 2). To corroborate our hypothesis, that the degree of TAS protection was indeed related to the extent of the MNase digestion of a given sample, we looked at the length distribution histogram of the sequenced DNA molecules in each case. It is the best measurement of the extent of the digestion achieved, especially, when sequencing the whole sample without any gel purification and representing all the reads in the analysis as we did. The only caveat is with the sample called "intermediate digestion 1" that belongs to the original work of Mareé 2017, since only this data set was gel purified. To avoid this problem, we decided to remove this data from figures 2 and S3. In summary, the 3 remaining samples comes from the same lab, and belong to the same publication (Mareé 2022). These sample are the inputs of native MNase ChIp-seq, obtain the same way, totally comparable among each other.
* Several fragment distributions show a sharp cutoff at ~100-125 bp. Was this due to gel purification or bioinformatic filtering? State this clearly in Methods. If gel purification occurred, that can explain why some datasets preserve the MNase-sensitive region.
The sharp cutoff is neither due to gel purification or bioinformatic filtering, it is just due to the length of the paired-end read used in each case. In earlier works the most common was to sequence only 50bp, with the improvement of technologies it went up to 75,100 or 125 bp. We have now clarified in Table S1 the length of the paired-reads used in each case when possible.
* Please reconcile cases where samples labeled as more-digested contain a larger proportion of >200 bp fragments than supposedly less-digested samples; this ordering affects the inference that digestion level determines the loss/preservation of TAS protection. Based on the distributions I see, "Intermediate digestion 1" appears most consistent with an expected MNase curve - please confirm and correct the manuscript accordingly.
As explained above, it's a common observation in MNase digestion of chromatin that more extensive digestion can still result in a broad range of fragment sizes, including some longer fragments. This seemingly counter-intuitive result is primarily due to the non-uniform accessibility of chromatin and the sequence preference of the MNase enzyme, which has a preference for AT reach sequences.
The rationale of this is as follows: when you digest chromatin with MNase and the objective is to map nucleosomes genome-wide, the ideal situation would be to get the whole material contained in the mononucleosome band. Given that MNase is less efficient to digest protected DNA but, if the reaction proceeds further, it always ends up destroying part of it, the result is always far from perfect. The better situation we can get, is to obtain samples were ˜80% of the material is contained in the mononucloesome band. __And here comes the main point: __even in the best scenario, you always get some additional longer bands, such as those for di or tri nucleosomes. If you keep digesting, you will get less than 80 % in the nucleosome band and, those remaining DNA fragments that use to contain di and tri nucleosomes start getting digested as well, originating a bigger dispersion in fragments sizes. How do we explain persistence of Long Fragments? The longest fragments (di-, tri-nucleosomes) that persist in a highly digested sample are the ones that were originally most highly protected by proteins or higher-order structure, or by containing a poor AT sequence content, making their linker DNA extremely resistant to initial cleavage. Once the majority of the genome is fragmented, these few resistant longer fragments become a more visible component of the remaining population, contributing to a broader size dispersion. Hence, you end up observing a bigger dispersion in length distributions in the final material. Bottom line, it is not a good practice to work with under or over digested samples. Our main point, is to emphasize that especially when comparing samples, it important to compare those with comparable levels of digestion. Otherwise, a different sampling of the genome will be represented in the remaining sequenced DNA.
Results - "The MNase sensitive complexes protecting the TASs in T. brucei and T. cruzi are at least partly composed of histones": * The evidence that histones are part of the MNase-sensitive complex relies on H3 MNase-ChIP signal in subnucleosomal fragment bins. This seems to conflict with the observation (Fig. 1) that fragments protecting TASs are often nucleosome-sized. Please reconcile these points: are H3 signals confined to subnucleosomal fragments flanking the TAS while the TAS itself is depleted of H3? Provide plots that compare MNase-seq and H3 ChIP signals stratified by consistent fragment-size bins to clarify this.
What we learned from other eukaryotic organisms that were deeply studied, such as yeast, is that NDRs are normally generated at regulatory points in the genome. In this sense, yeast tRNA genes have a complex with a bootprint smaller than a nucleosome formed by TFIIIC-TFIIB (Nagarajavel, doi: 10.1093/nar/gkt611). On the other hand, many promotor regions have an MNase-sensitive complex with a nucleosome-size footprint, but it does not contain histones (Chereji, et al 2017, doi:10.1016/j.molcel.2016.12.009). The reviewer is right that from Figure 1 and S2 we could observe that the footprint of whatever occupies the TAS region, especially in T. brucei, is nucleosome-size. However, it only shows the size, but it doesn't prove the nature of its components. Nevertheless, those are only MNase-seq data sets. Since it does not include a precipitation with specific antibodies, we cannot confirm the protecting complex is made up by histones. In parallel, a complementary study by Wedel 2017, from Siegel's lab, shows that using a properly digested sample and further immunoprecipitating with a-H3 antibody, the TAS is not protected by nucleosomes at least not when analyzing nucleosome size-DNA molecules. Besides, Briggs et. al 2018 (doi: 10.1093/nar/gky928) showed that at least at intergenic regions H3 occupancy goes down while R-loops accumulation increases. We have now added a new figure 4 replotting R-loops and MNase-ChIP-seq for H3 relative to our predicted TAS showing this anti-correlation and how it partly correlates with MNase protection as well. As a control we show that Rpb9 trends resembles H3 as Siegel's lab have shown in Wedel 2018. Moreover, we analyzed redate from a recently published paper (doi: 10.1038/s41467-025-56785-y) added a new supplemental figure 5 showing that a similar correlation between MNase protection and R-loop footprint occurs in L. major (S5 Fig).
* Please indicate which datasets are used for each panel in Suppl. Fig. S4 (e.g., Wedel et al., Maree et al.), and avoid calling data from different labs "replicates" unless they are true replicates.
In most of our analysis we used real replicated experiments. Such is the case MNase-seq data used in Figure 1, with the corresponding replicate experiments used in Figure S2; T. cruzi MNase-ChIP-seq data used in Figure 3b and 4a with the respective replicate used in Figures S4 and S5 (now S6 in the revised manuscript). The only case in which we used experiments coming from two different laboratories, is in the case of MNase-ChIP-seq for H3 from T. brucei. Unfortunately, there are only two public data sets coming each of them from different laboratories. The samples used in Fig 3 (from Siegel's lab) whether the IP from H3 represented in S4 and S5 (S6 n the updated version) comes from another lab (Patterton's). To be more rigorous, we now call them data 1 and 2 when comparing these particular case.
The reviewer is right that in this particular case one is native chromatin (Pattertons') while the other one is crosslinked (Siegel's). We have now clarified it in the main text that unfortunately we do not count on a replicate but even under both condition the result remains the same, and this is compatible with my own experience, were crosslinking does not affect the global nucleosome patterns (compared nucleosome organization from crosslinked chromatin MNAse-seq inputs Chereji, Mol Cell, 2017 doi: 10.1016/j.molcel.2016.12.009 and native MNase-seq from Ocampo, NAR, 2016 doi: 10.1093/nar/gkw068).
* Several datasets show a sharp lower bound on fragment size in the subnucleosomal range (e.g., ~80-100 bp). Is this a filtering artifact or a gel-size selection? Clarify in Methods and, if this is an artifact, consider replotting after removing the cutoff.
We have only filtered adapter dimmer or overrepresented sequences when needed. In Figures 2 and S3 we represented all the sequenced reads. In other figures when we sort fragments sizes in silico, such as nucleosome range, dinucleosome or subnucleosome size, we make a note in the figure legends. What the reviewer points is related to the length of the sequence DNA fragment in each experiment. As we explained above, the older data-sets were performed with 50 bp paired-end reads, the newer ones are 75, 100 or 125bp. This is information is now clarified in Table S1.
__Results - "The TASs of single and multi-copy genes are differentially protected by nucleosomes": __
__ __* Please include T. brucei RNA-seq data in Suppl. Fig. S5b as you did for T. cruzi.
We have shown chromatin organization for T. brucei in previous S5b to illustrate that there is a similar trend. Unfortunately, we did not get a robust list of multi-copy genes for T. brucei as we did get for T. cruzi, therefore we do not want to over conclude showing the RNA-seq for these subsets of genes. The limitation is related to the fact that UTRme restrict the search and is extremely strict when calling sites at repetitive regions. Additionally, attending to the request of one reviewer we have now changed the UTR predictions for T. brucei using a different RNA-seq data set from Lister 427(detail in method section). Given that with the new predictions it was even harder to obtain the list of multicopy genes for T. brucei, we decided to remove that figure in the updated version of the manuscript.
* Discuss how low or absent expression of multigene families affects TAS annotation (which relies on RNA-seq) and whether annotation inaccuracies could bias the observed chromatin differences.
The mapping of occurrence and annotations that belong to repetitive regions has great complexity. UTRme is specially designed to avoid overcalling those sites. In other words, there is a chance that we could be underestimating the number of predicted TASs at multi-copy genes. Regarding the impact on chromatin analysis, we cannot rule out that it might have an impact, but the observation favors our conclusion, since even when some TASs at multi-copy genes can remain elusive, we observe more nucleosome density at those places.
* The statement that multi-copy genes show an "oscillation" between AT and GC dinucleotides is not clearly supported: the multi-copy average appears noisier and is based on fewer loci. Please tone down this claim or provide statistical support that the pattern is periodic rather than noisy.
We have fixed this now in the preliminary revised version
* How were multi-copy genes defined in T. brucei? Include the classification method in Methods.
This classification was done the same way it was explained for T. cruzi. However, decided to remove the supplemental figure that included this sorting.
Genomes and annotations: * If transcriptomic data for the Y strain was used for T. cruzi, please explain why a Y strain genome was not used (e.g., Wang et al. 2021 GCA_015033655.1), or justify the choice. For T. brucei, consider the more recent Lister 427 assembly (Tb427_2018) from TriTrypDB. Use strain-matched genomes and transcriptomes when possible, or discuss limitations.
The most appropriate way to analyze high throughput data, is to aline it to the same genome were the experiments were conducted. This was clearly illustrated in a previous publication from our group were we explained how should be analyzed data from the hybrid CL Brener strain. A common practice in the past was to use only Esmeraldo-like genome for simplicity, but this resulted in output artifacts. Therefore, we aligned it to CL Brener genome, and then focused the main analysis on the Esmeraldo haplotype (Beati Plos ONE, 2023). Ideally, we should have counted on transcriptomic data for the same strain (CL Brener or Esmeraldo). Since this was not the case at that moment, we used data from Y strain that belongs to the same DTU with Esmeraldo.
In the case of T. brucei, when we started our analysis and the software code for UTRme was written, the previous version of the genome was available. Upon 2018 version came up, we checked chromatin parameters and observed that it did not change the main observations. Therefore, we continue working with our previous setups.
Reproducibility and broader integration: * Please share the full analysis pipeline (ideally on GitHub/Zenodo) so the results are reproducible from raw reads to plots.
We are preparing a full pipeline in GitHub. We will make it available before manuscript full revision
* As an optional but helpful expansion, consider including additional datasets (other life stages, BSF MNase-seq, ATAC-seq, DRIP-seq) where available to strengthen comparative claims.
We are now including a new figure 4 and a supplemental figure 5 including DRIP-seq and Rp9 ChIP-seq for T. brucei (revised Fig 4) and DRIP-seq for L. major (S5 Fig). Additionally, we added FAIRE-seq data to previous Fig 4 now Fig 5 (revised Fig 5C).
We are analyzing ATAC-seq data for T. brucei.
Regarding BSF MNase-seq, the original article by Mareé 2017 claims that there is not significant difference for average chromatin organization between the two life forms; therefore, is not worth including that analysis.
Optional analyses that would strengthen the study: * Stratify single-copy genes by expression (high / medium / low) and examine average nucleosome occupancy at TASs for each group; a correlation between expression and NDR depth would strengthen the functional link to maturation.
We have now included a panel in suplemental figure 5 (now revised S6), showing the concordance for chromatin organization of stratified genes by RNA-seq levels relative to TAS.
__Minor / editorial comments: __ * In the Introduction, the sentence "transcription is initiated from dispersed promoters and in general they coincide with divergent strand switch regions" should be qualified: such initiation sites also include single transcription start regions.
We have clarified this in the preliminary revised version
* Define the dotted line in length distribution plots (if it is not the median, please clarify) and consider placing it at 147 bp across plots to ease comparison.
The dotted line is just to indicate where the maximum peak is located. It is now clarified in figure legends.
* In Suppl. Fig. 4b "Replicate2" the x-axis ticks are misaligned with labels - please fix.
We have now fixed the figure. Thanks for noticing this mistake.
* Typo in the Introduction: "remodellingremodeling" → "remodeling
Thanks for noticing this mistake, it is fixed in the current version of the manuscript
**Referee cross-commenting** Comment 1: I think Reviewer #2 and Reviewer #3 missed that they authors of this manuscript do cite and consider the results from Wedel at al. 2017. They even re-analysed their data (e.g. Figure 3a). I second Reviewer #2 comment indicating that the inclusion of a schematic figure to help readers visualize and better understand the findings would be an important addition.
Comment 2: I agree with Reviewer #3 that the use of different MNase digestion procedures in the different datasets have to be considered. On the other hand, I don't think there is a problem with figure 1 showing an MNase-protected TAS for T. brucei as it is based on MNase-seq data and reproduces the reported results (Maree et al. 2017). What the Siegel lab did in Wedel et al. 2017 was MNase-ChIPseq of H3 showing nucleosome depletion at TAS, but both results are not necessary contradictory: There could still be something else (which does not contain H3) sitting on the TAS protecting it from MNase digestion.
Reviewer #1 (Significance (Required)):
This study provides a systematic comparative analysis of chromatin landscapes at trans-splicing acceptor sites (TASs) in trypanosomatids, an area that has been relatively underexplored. By re-analyzing and harmonizing existing MNase-seq and MNase-ChIP-seq datasets, the authors highlight conserved and divergent features of nucleosome occupancy around TASs and propose that chromatin contributes to the fidelity of transcript maturation. The significance lies in three aspects: 1. Conceptual advance: It broadens our understanding of gene regulation in organisms where transcription initiation is unusual and largely constitutive, suggesting that chromatin can still modulate post-transcriptional processes such as trans-splicing. 2. Integrative perspective: Bringing together data from T. cruzi, T. brucei and L. major provides a comparative framework that may inspire further mechanistic studies across kinetoplastids. 3. Hypothesis generation: The findings open testable avenues about the role of chromatin in coordinating transcript maturation, the contribution of DNA sequence composition, and potential interactions with R-loops or RNA-binding proteins. Researchers in parasitology, chromatin biology, and RNA processing will find it a useful resource and a stimulus for targeted experimental follow-up.
My expertise is in gene regulation in eukaryotic parasites, with a focus on bioinformatic analysis of high-throughput sequencing data
__Reviewer #2 (Evidence, reproducibility and clarity (Required)): __
Siri et al. perform a comparative analysis using publicly available MNase-seq data from three trypanosomatids (T. brucei, T. cruzi, and Leishmania), showing that a similar chromatin profile is observed at TAS (trans-splicing acceptor site) regions. The original studies had already demonstrated that the nucleosome profile at TAS differs from the rest of the genome; however, this work fills an important gap in the literature by providing the most reliable cross-species comparison of nucleosome profiles among the tritryps. To achieve this, the authors applied the same computational analysis pipeline and carefully evaluated MNase digestion levels, which are known to influence nucleosome profiling outcomes.
In my view, the main conclusion is that the profiles are indeed similar-even when comparing T. brucei and T. cruzi. This was not clear in previous studies (and even appeared contradictory, reporting nucleosome depletion versus enrichment) largely due to differences in chromatin digestion across these organisms. The manuscript could be improved with some clarifications and adjustments:
- The authors state from the beginning that available MNase data indicate altered nucleosome occupancy around the TAS. However, they could also emphasize that the conclusions across the different trypanosomatids are inconsistent and even contradictory: NDR in T. cruzi versus protection-in different locations-in T. brucei and Leishmania.
We start our manuscript by referring to the first MNase-seq data sets publicly available for each TriTryp and we point that one of the main observations, in each of them, is the occurrence of a change in nucleosome density or occupancy at intergenic regions. In T. cruzi, in a previous publication from our group, we stablished that this intergenic drop in nucleosome density occurs near the trans-splicing acceptor site. In this work, we extend our study to the other members of TriTryps: T. brucei and L. major.
In T. brucei the papers from Patterton's lab and Siegel's lab came out almost simultaneously in 2017. Hence, they do not comment on each other's work. The first one claims the presence of a well-positioned nucleosome at the TAS by using MNase-seq, while the second one, shows an NDR at the TAS by using MNase-ChIP-seq. However, we do not think they are contradictory, or they have inconsistency. We brought them together along the manuscript because we think these works can provide complementary information.
On one hand, we infer data from Pattertons lab is slightly less digested than the sample from Siegel's lab. Therefore, we discuss that this moderate digestion must be the reason why they managed to detect an MNase protecting complex sitting at the TAS (Figure 1). On the other hand, Sigel's lab includes an additional step by performing MNase-ChIP-seq, showing that when analyzing nucleosome size fragments, histones are not detected at the TAS. Here, we go further in this analysis on figure 3, showing that only when looking at subnucleosome-size fragments, we can detect histone H3. And this is also true for T. cruzi.
By integrating every analysis in this work and the previous ones, we propose that TASs are protected by an MNase-sensitive complex (proved in Figure 2). This complex most likely is only partly formed by histones, since only when analyzing sub-nucleosomes size DNA molecules we can detect histone H3 (Figure 3). To be sure that the complex is not entirely made up by histones, future studies should perform an MNse-ChIP-seq with less digested samples. However, it was previously shown that R-loops are enriched at those intergenic NDRs (Briggs, 2018 doi: 10.1093/nar/gky928) and that R-loops have plenty of interacting proteins (Girasol, 2023 10.1093/nar/gkad836). Therefore, most likely, this MNase-sensitive complexed have a hybrid nature made up by H3 and some other regulatory molecules, possibly involved in trans-splicing. We have now added a new figure 4 showing R-loop co-localization with the NDR.
Regarding the comparison between different organisms, after explaining the sensitivity to MNase of the TAS protecting complex, we discuss that when comparing equally digested samples T. cruzi and T. brucei display a similar chromatin landscape with a mild NDR at the TAS (See T. cruzi represented in Figure 1 compared to T. brucei represented in Intermediate digestion 2 in Figure 2, intermediate digestion in the revised manuscript). Unfortunately, we cannot make a good comparison with L. major, since we do not count on a similar level of digestion. However, by analyzing a recently published DRIP-seq data-set for L. major we show that R-loop signal co localize with MNase-protection in a similar way (new S5 Fig).
Another point that requires clarification concerns what the authors mean in the introduction and discussion when they write that trypanosomes have "...poorly organized chromatin with nucleosomes that are not strikingly positioned or phased." On the other hand, they also cite evidence of organization: "...well-positioned nucleosome at the spliced-out region.. in Leishmania (ref 34)"; "...a well-positioned nucleosome at the TASs for internal genes (ref37)"; "...a nucleosome depletion was observed upstream of every gene (ref 35)." Aren't these examples of organized chromatin with at least a few phased nucleosomes? In addition, in ref 37, figure 4 shows at least two (possibly three to four) nucleosomes that appear phased. In my opinion, the authors should first define more precisely what they mean by "poorly organized chromatin" and clarify that this interpretation does not contradict the findings highlighted in the cited literature.
For a better understanding of nucleosome positioning and phasing I recommend the review: Clark 2010 doi:10.1080/073911010010524945, Figure 4. Briefly, in a cell population there are different alternative positions that a given nucleosome can adopt. However, some are more favorable. When talking about favorable positions, we refer to the coordinates in the genome that are most likely covered by a nucleosome and are predominant in the cell population. Additionally, nucleosomes could be phased or not. This refers not only the position in the genome, but to the distance relative to a given point. In yeast, or in highly transcribed genes of more complex eukaryotes, nucleosomes are regularly spaced and phased relative to the transcription start site (TSS) or to the +1 nucleosome (Ocampo, NAR, 2016, doi:10.1093/nar/gkw068). In trypanosomes, nucleosomes have some regular distribution when making a browser inspection but, given that they are not properly phased with respect to any point, it is almost impossible to make a spacing estimation from paired-end data. This is also consistent with a chromatin that is transcribed in an almost constitutive manner.
As the reviewer mention, we do site evidence of organization. We think the original observations are correct, but we do not fully agree with some of the original statements. In this manuscript our aim is to take the best we learned from their original works and to make a constructive contribution adding to the original discussions. In this regard, in trypanosomes there are some conserved patterns in the chromatin landscape, but their nucleosomes are far from being well-positioned or phased. For a better understanding, compare the variations observed in the y axis when representing av. nucleosome occupancy in yeast with those observed in trypanosomes and you will see that the troughs and peaks are much more prominent in yeast than the ones observed in any TryTryp member.
Following the reviewer's suggestion we have now clarified this in the main text.
The paper would also benefit from the inclusion of a schematic figure to help readers visualize and better understand the findings. What is the biological impact of having nucleosomes, di-nucleosomes, or sub-nucleosomes at TAS? This is not obvious to readers outside the chromatin field. For example, the following statement is not intuitive: "We observed that, when analyzing nucleosome-size (120-180 bp) DNA molecules or longer fragments (180-300 bp), the TASs of either T. cruzi or T. brucei are mostly nucleosome-depleted. However, when representing fragments smaller than a nucleosome-size (50-120 bp) some histone protection is unmasked (Fig. 3 and Fig. S4). This observation suggests that the MNase sensitive complex sitting at the TASs is at least partly composed of histones." Please clarify.
We appreciate the reviewer's suggestion to make a schematic figure. We have now added a new Figure 6.
Regarding the biological impact of having mono, di or subnucleosome fragments, it is important to unveil the fragment size of the protected DNA to infer the nature of the protecting complex. In the case of tRNA genes in yeast, at pol III promoters they found footprints smaller than a nucleosome size that ended up being TFIIB-TFIIC (Nagarajavel, doi: 10.1093/nar/gkt611). Therefore, detecting something smaller than a nucleosome might suggest the binding of trans-acting factors different than histones or involving histones in a mixed complex. These mixed complexes are also observed, and that is the case of the centromeric nucleosome which has a very peculiar composition (Ocampo and Clark, Cells Reports, 2015). On the other hand, if instead we detect bigger fragments, it could be indicative of the presence of bigger protecting molecules or that those regions are part of higher order chromatin organization still inaccessible for MNase linker digestions.
Here we show on 2Dplots, that complex or components protecting the TAS have nucleosome size, but we cannot assure they are entirely made up by histones, since, only when looking at subnucleosome-size fragments, we are able to detect histone H3. We have now added part of this explanation to the discussion.
By integrating every analysis in this work and the previous ones, we propose that the TAS is protected by an MNase-sensitive complex (Figure 2). This complex most likely is only partly formed by histones, since only when analyzing sub-nucleosomes size DNA molecules we can detect histone H3 (Figure 3). As explained above, to be sure that the complex is not entirely made up by histones, future studies should perform an MNse-ChIP-seq with less digested samples. However, it was previously shown that R-loops are enriched at those intergenic NDRs (Briggs 2018) and that R-loops have plenty of interacting proteins (Girasol, 2023). Therefore, most likely, this MNase-sensitive complexed have a hybrid nature made up by H3 and some other regulatory molecules. We have now added a new figure 4 showing R-loop partial co-localization with MNase protection.
Some references are missing or incorrect:
we will make a thorough revision
"In trypanosomes, there are no canonical promoter regions." - please check Cordon-Obras et al. (Navarro's group). Thank you for the appropiate suggestion.
Thank you for the appropriate suggestion. We have now added this reference
Please, cite the study by Wedel et al. (Siegel's group), which also performed MNase-seq analysis in T. brucei.
We understand that reviewer number 2# missed that we cited this reference and that we did used the raw data from the manuscript of Wedel et. al 2017 form Siegel's group. We used the MNase-ChIP-seq data set of histone H3 in our analysis for Figures 3, S4 and S6 (in the revised version), also detailed in table S1. To be even more explicit, we have now included the accession number of each data set in the figure legends.
Figure-specific comments: Fig. S3: Why does the number of larger fragments increase with greater MNase digestion? Shouldn't the opposite be expected?
This a good observation. As we also explained to reviewer#1:
It's a common observation in MNase digestion of chromatin that more extensive digestion can still result in a broad range of fragment sizes, including some longer fragments. This seemingly counter-intuitive result is primarily due to the non-uniform accessibility of chromatin and the sequence preference of the MNase enzyme.
The rationale of this is as follows: when you digest chromatin with MNase and the objective is to map nucleosomes genome-wide, the ideal situation would get the whole material contained in the mononucleosome band. Given that MNase is less efficient to digest protected DNA but, if the reaction proceeds further, it always ends up destroying part of it, the result is always far from perfect. The better situation we can get, is to obtain samples were ˜80% of the material is contained in the mononucloesome band. __And here comes the main point: __even in the best scenario, you always have some additional longer bands, such as those for di or tri nucleosomes. If you keep digesting, you will get less than 80 % in the nucleosome band and, those remaining DNA fragments that use to contain di and tri nucleosomes start getting digested as well originating a bigger dispersion in fragments sizes. How do we explain persistence of Long Fragments? The longest fragments (di-, tri-nucleosomes) that persist in a highly digested sample are the ones that were originally most highly protected by proteins or higher-order structure, making their linker DNA extremely resistant to initial cleavage. Once most of the genome is fragmented, these few resistant longer fragments become a more visible component of the remaining population, contributing to a broader size dispersion. Hence, there you end up having a bigger dispersion in length distributions in the final material. Bottom line, it is not a good practice to work with under or overdirected samples. Our main point is to emphasize that especially when comparing samples, it important to compare those with comparable levels of digestion. Otherwise, a different sampling of the genome will be represented in the remaining sequenced DNA.
Minor points:
There are several typos throughout the manuscript.
Thanks for the observation. We will check carefully.
Methods: "Dinucelotide frecuency calculation."
We will add a code in GitHub
Reviewer #2 (Significance (Required)):
In my view, the main conclusion is that the profiles are indeed similar-even when comparing T. brucei and T. cruzi. This was not clear in previous studies (and even appeared contradictory, reporting nucleosome depletion versus enrichment) largely due to differences in chromatin digestion across these organisms. Audience: basic science and specialized readers.
Expertise: epigenetics and gene expression in trypanosomatids.
__Reviewer #3 (Evidence, reproducibility and clarity (Required)): __
The authors analysed publicly accessible MNase-seq data in TriTryps parasites, focusing on the chromatin structure around trans-splicing acceptor sites (TASs), which are vital for processing gene transcripts. They describe a mild nucleosome depletion at the TAS of T. cruzi and L. major, whereas a histone-containing complex protects the TASs of T. brucei. In the subsequent analysis of T. brucei, they suggest that a Mnase-sensitive complex is localised at the TASs. For single-copy versus multi-copy genes, the authors show different di-nucleotide patterns and chromatin structures. Accordingly, they propose this difference could be a novel mechanism to ensure the accuracy of trans-splicing in these parasites.
Before providing an in- depth review of the manuscript, I note that some missing information would have helped in assessing the study more thoroughly; however, in the light of the available information, I provide the following comments for consideration.
The numbering of the figures, including the figure legends, is missing in the PDF file. This is essential for assessing the provided information.
We apologized for not including the figure numbers in the main text, although they are located in the right place when called in the text. The omission was unwillingly made when figure legends were moved to the bottom of the main text. This is now fixed in the updated version of the manuscript.
The publicly available Mnase- seq data are manyfold, with multiple datasets available for T. cruzi, for example. It is unclear from the manuscript which dataset was used for which figure. This must be clarified.
This was detailed in Table S1. We have now replaced the table by an improved version, and we have also included the accession number of each data set used in the figure legends.
Why do the authors start in figure 1 with the description of an MNase- protected TAS for T.brucei, given that it has been clearly shown by the Siegel lab that there is a nucleosome depletion similar to other parasites?
We did not want to ignore the paper from Patterton's lab because it was the first one to map nucleosomes genome-wide in T. brucei and the main finding of that paper claimed the existence of a well-positioned nucleosome at intergenic regions, what we though constitutes a point worth to be discussed. While Patterton's work use MNase-seq from gel-purified samples and provides replicated experiments sequenced in really good depth; Siegel's lab uses MNase-ChIP-seq of histone H3 but performs only one experiment and its input was not sequenced. So, each work has its own caveats and provides different information that together contributes to make a more comprehensive study. We think that bringing up both data sets to the discussion, as we have done in Figures 1 and 3, helps us and the community working in the field to enrich the discussion.
If the authors re- analyse the data, they should compare their pipeline to those used in the other studies, highlighting differences and potential improvements.
We are working on this point. We will provide a more detail description in the final revision.
Since many figures resemble those in already published studies, there seems little reason to repeat and compare without a detailed comparison of the pipelines and their differences.
Following the reviewer advice, we are now working on highlighting the main differences that justify analyzing the data the way we did and will be added in the finally revised method section.
At a first glance, some of the figures might look similar when looking at the original manuscripts comparing with ours. However, with a careful and detailed reading of our manuscripts you can notice that we have added several analyses that allow to unveil information that was not disclosed before.
First, we perform a systematic comparison analyzing every data set the same way from beginning to end, being the main difference with previous studies the thorough and precise prediction of TAS for the three organisms. Second, we represent the average chromatin organization relative to those predicted TASs for TriTryps and discuss their global patterns. Third, by representing the average chromatin into heatmaps, we show for the very first time, that those average nucleosome landscape are not just an average, they keep a similar organization in most of the genome. These was not done in any of the previous manuscripts except for our own (Beati, PLOS One 2023). Additionally, we introduce the discussion of how the extension of MNase reaction can affect the output of these experiments and we show 2D-plots and length distribution heatmaps to discuss this point (a point completely ignored in all the chromatin literature for trypanosomes). Furthermore, we made a far-reaching analysis by considering the contributions of each publish work even when addressed by different techniques. Finally, we discuss our findings in the context of a topic of current interest in the field, such as TriTryp's genome compartmentalization.
Several previous Mnase- seq analysis studies addressing chromatin accessibility emphasized the importance of using varying degrees of chromatin digestion, from low to high digestion (30496478, 38959309, 27151365).
The reviewer is correct, and this point is exactly what we intended to illustrate in figure number 2. We appreciate he/she suggests these references that we are now citing in the final discussion. Just to clarify, using varying degrees of chromatin digestion is useful to make conclusions about a given organism but when comparing samples, strains, histone marks, etc. It is extremely important to do it upon selection of similar digested samples.
No information on the extent of DNA hydrolysis is provided in the original Mnase- seq studies. This key information can not be inferred from the length distribution of the sequenced reads.
The reviewer is correct that "No information on the extent of DNA hydrolysis is provided in the original Mnase-seq studies" and this is another reason why our analysis is so important to be published and discussed by the scientific community working in trypanosomes. We disagree with the reviewer in the second statement, since the level of digestion of a sequenced sample is actually tested by representing the length distribution of the total DNA sequenced. It is true that before sequencing you can, and should, check the level of digestion of the purified samples in an agarose gel and/or in a bioanalyzer. It could be also tested after library preparation, but before sequencing, expecting to observe the samples sizes incremented in size by the addition of the library adapters. But, the final test of success when working with MNase digested samples is to analyze length of DNA molecules by representing the histograms with length distribution of the sequenced DNA molecules. Remarkably, on occasions different samples might look very similar when run in a gel, but they render different length distribution histograms and this is because the nucleosome core could be intact but they might have suffered a differential trimming of the linker DNA associated to it or even be chewed inside (see Cole Hope 2011, section 5.2, doi: 10.1016/B978-0-12-391938-0.00006-9, for a detailed explanation).
As the input material are selected, in part gel- purified mono- nucleosomal DNA bands. Furthermore the datasets are not directly comparable, as some use native MNase, while others employ MNase after crosslinking; some involve short digestion times at 37 {degree sign} C, while others involve longer digestion at lower temperatures. Combining these datasets to support the idea of an MNase- sensitive complex at the TAS of T. brucei therefore may not be appropriate, and additional experiments using consistent methodologies would strengthen the study's conclusions.
In my opinion, describing an MNase- sensitive complex based solely on these data is not feasible. It requires specifically designed experiments using a consistent method and well- defined MNase digestion kinetics.
As the reviewer suggests, the ideal experiment would be to perform a time course of MNase reaction with all the samples in parallel, or to work with a fix time point adding increasing amounts of MNase. However, the information obtained from the detail analysis of the length distribution histogram of sequenced DNA molecules the best test of the real outcome. In fact, those samples with different digestion levels were probably not generated on purpose.
The only data sets that were gel purified are those from Mareé 2017 (Patterton's lab), used in Figures 1, S1 and S2 and those from L. major shown in Fig 1. It was a common practice during those years, then we learned that is not necessary to gel purify, since we can sort fragment sizes later in silico when needed.
As we explained to reviewer #1, to avoid this conflict, we decided to remove this data from figures 2 and S3. In summary, the 3 remaining samples comes from the same lab, and belong to the same publication (Mareé 2022). These sample are the inputs of native MNase ChIp-seq, obtain the same way, totally comparable among each other.
Reviewer #3 (Significance (Required)):
Due to the lack of controlled MNase digestion, use of heterogeneous datasets, and absence of benchmarking against previous studies, the conclusions regarding MNase-sensitive complexes and their functional significance remain speculative. With standardized MNase digestion and clearly annotated datasets, this study could provide a valuable contribution to understanding chromatin regulation in TriTryps parasites.
As we have explained in the previous point our conclusions are valid since we do not compare in any figure samples coming from different treatments. The only exception to this comment could be in figure 3 when talking about MNase-ChIP-seq. We have now added a clear and explicit comment in the section and the discussion that despite having subtle differences in experimental procedures we arrive to the same results. This is the case for T. cruzi IP, run from crosslinked chromatin, compared to T. brucei's IP, run from native chromatin.
Along the years it was observed in the chromatin field that nucleosomes are so tightly bound to DNA that crosslinking is not necessary. However, it is still a common practice specially when performing IPs. In our own hands, we did not observe any difference at the global level neither in T. cruzi (unpublished) nor in my previous work with yeast (compared nucleosome organization from crosslinked chromatin MNAse-seq inputs Chereji, Mol Cell, 2017 doi:10.1016/j.molcel.2016.12.009 and native MNase-seq from Ocampo, NAR, 2016 doi: 10.1093/nar/gkw068).
Note: This preprint has been reviewed by subject experts for Review Commons. Content has not been altered except for formatting.
Learn more at Review Commons
This study explores chromatin organization around trans-splicing acceptor sites (TASs) in the trypanosomatid parasites Trypanosoma cruzi, T. brucei and Leishmania major. By systematically re-analyzing MNase-seq and MNase-ChIP-seq datasets, the authors conclude that TASs are protected by an MNase-sensitive complex that is, at least in part, histone-based, and that single-copy and multi-copy genes display differential chromatin accessibility. Altogether, the data suggest a common chromatin landscape at TASs and imply that chromatin may modulate transcript maturation, adding a new regulatory layer to an unusual gene-expression system.
I value integrative studies of this kind and appreciate the careful, consistent data analysis the authors implemented to extract novel insights. That said, several aspects require clarification or revision before the conclusions can be robustly supported. My main concerns are listed below, organized by topic/result section.
TAS prediction:
Results
Results
Genomes and annotations:
Reproducibility and broader integration:
Minor / editorial comments:
Referee cross-commenting
Comment 1: I think Reviewer #2 and Reviewer #3 missed that they authors of this manuscript do cite and consider the results from Wedel at al. 2017. They even re-analysed their data (e.g. Figure 3a). I second Reviewer #2 comment indicating that the inclusion of a schematic figure to help readers visualize and better understand the findings would be an important addition.
Comment 2: I agree with Reviewer #3 that the use of different MNase digestion procedures in the different datasets have to be considered. On the other hand, I don't think there is a problem with figure 1 showing an MNase-protected TAS for T. brucei as it is based on MNase-seq data and reproduces the reported results (Maree et al. 2017). What the Siegel lab did in Wedel et al. 2017 was MNase-ChIPseq of H3 showing nucleosome depletion at TAS, but both results are not necessary contradictory: There could still be something else (which does not contain H3) sitting on the TAS protecting it from MNase digestion.
This study provides a systematic comparative analysis of chromatin landscapes at trans-splicing acceptor sites (TASs) in trypanosomatids, an area that has been relatively underexplored. By re-analyzing and harmonizing existing MNase-seq and MNase-ChIP-seq datasets, the authors highlight conserved and divergent features of nucleosome occupancy around TASs and propose that chromatin contributes to the fidelity of transcript maturation.
The significance lies in three aspects:
My expertise is in gene regulation in eukaryotic parasites, with a focus on bioinformatic analysis of high-throughput sequencing data
Note: This preprint has been reviewed by subject experts for Review Commons. Content has not been altered except for formatting.
Learn more at Review Commons
Chapa-y-Lazo and colleagues report the detailed characterization of a number of different genetically-encoded fluorescent proteins in Drosophila embryos. The screening and selection of an appropriate fluorescent protein for imaging tasks is an important and often neglected part of experimental design, and datasets such as this one will be extremely useful in guiding decision making for other users. The manuscript is well-written and carefully controlled for different developmental stages and nicely compares the most pertinent properties of FPs such as brightness, photobleaching, and folding time. There would be a couple of additional experiments that would be nice to see but are not strictly necessary for improving the paper as-is, but might be helpful points to include in the discussion.
Comments:
1) All fluorophores in this study were fused to H2Av, at the same insertion site, which makes for a nice and easy comparison between lines. However, histone-binding proteins can sometimes behave unpredictably when tagged with different things and in addition it would be interesting to see if the fusion protein affects the FP properties in anyway. I.e. would sfGFP be brighter than mEmerald when bound to a CAAX sequence or some other organelle? It would be impractical for this study to re-do all the FPs, but the top two hits could be interesting and would potentially be quite interesting if there is a significant difference in behaviour between FPs when bound to different proteins/cellular compartments. Else maybe a mention in the discussion?
2) Another way to compare the fluorophore folding time would be to selectively bleach a portion of the embryo at the same developmental stage and measure the time it takes for each FP to recover to the same intensity as the rest of the embryo. This could potentially control for any delay for developmental reasons.
3) Some of the lines in the figure plots could be a bit thicker - purple and pink when overlapping are hard to distinguish.
This manuscript will be quite useful for those who are deciding between which fluorescent protein or combination to use for their live-imaging work, and additionally has created a number of useful fly strains in the process. It will hopefully also start a discussion about proper characterization and quantification of fluorescent reporters under different conditions, ideally before all the effort to generate an entirely new genetically modified animal is performed.
Note: This preprint has been reviewed by subject experts for Review Commons. Content has not been altered except for formatting.
Learn more at Review Commons
In this manuscript Saunders and colleagues benchmark the brightness, folding speed and photostability of a variety of red (8 versions) and green fluorescent proteins (9 versions), which have been widely used for in vivo imaging. They fused each protein to histone2Av, cloned the fusion into attP constructs and inserted them in the Drosophila genome at the same genetic location. Thus, expression levels can be compared. Nuclei at embryonic cycle 14 were imaged, segmented and fluorescence was quantified. At this early stage the maturation kinetics of the fluorophore can particularly influence its fluorescence intensity.
Additionally, stage 15-16 embryos were imaged at the dorsal side to quantify brightness. As the histone promoter is active in all cells, the fluorescence in the nuclei of all cell types can be quantified. Brightness differences between the different proteins vary a bit between both experiments, likely taking folding versus brightness into account. Generally, sfGFP, mEGFP, mEmerald as well as mStrawberry and mScarlet are the brightest. Next, developmental movies were recorded starting at gastrulation to estimate the folding rates of the different proteins. No large differences of the relative fluorescence increase over time were reported. To estimate photostability, embryos were imaged ventrally shortly before the onset of gastrulation for 2 or 4 hours with high laser intensity and the fluorescence intensity was recorded. Consistent with data in the literature, StayGold is the most photostable green protein, although it is not the brightest from the start, likely to also slower folding. From the red proteins mRFP and mCherry are good choices for long-term imaging.
In summary, these results do not bring huge surprises but are still valuable for future choice of protein tagging for imaging. Best green proteins are mEGFP, mNeonGreen, mStayGold with differences in brightness vs stability. For red, no protein is the clear winner, mScarlet-I is good in folding and brightness but others are better for photostability.
Major comments:
Minor comments:
Experiments are well performed and the finding are useful to guide the future choice of fluorophores in Drosophila and possibly other model organisms. Results are not very surprising, as the major finding that StayGold is photostable (but not the brightest) is not entirely new but still reassuring. It is particularly nice to have the differences confirmed by well controlled side-by-side measurements in Drosophila. This will likely guide many Drosophila researchers to tag their favourite protein with StayGold in the future.
Note: This preprint has been reviewed by subject experts for Review Commons. Content has not been altered except for formatting.
Learn more at Review Commons
Summary:
This is an outstanding study of high practical value, which provided the systematic performance evaluation of in vivo fluorophores under the same condition in the field of Drosophila developmental biology. By site-integrating 17 green and red fluorescent proteins into the same genomic locus and evaluating their fluorescent intensity (early/late embryos), folding time and photostability on the same imaging platform, this provides a powerful database for researchers.
Major comments:
Q1: All fluorescent proteins are fused with histone H2Av. Will this nuclear localization expression pattern mask the performance differences of fluorescent proteins in other subcellular structures (such as cell membranes, cytoplasm, and cytoskeleton)?
Q2: How do the authors ensure precise developmental synchrony among different embryos to avoid the influence of developmental time differences on fluorescence intensity and folding curves?
Q3: In this study, the authors conduct a quantitative screen of nine green and eight red fluorophore lines in Drosophila. A logical and valuable extension of this work would be a systematic evaluation of newer fluorescent proteins, including promising candidates like mBaoJin, mScarlet3, and mScarlet3-H.
Q4:The study does not discuss the potential for fluorescent proteins to interfere with biological function. Although the proteins were expressed from the identical genomic location, variations in their size, structure, or fusion design may influence the target protein's localization or activity.
Lines 145-147 "The only profile that did not fit well to this phenomenological function was mStayGold which did not display a clear reduction in its rate of intensity increase". What is the reason that causes mStayGold to fail to fit well? Is it related to the unique structure?
Lines 154-156 "For the red fluorophores, the intensity profiles were more varied (Fig. 3E). They could not be reduced to a single curve, unlike the green fluorophores (Fig. S7B). The phenomenological function I(t) did not fit the curves well". Compared with green fluorophores, the intensity profiles of red fluorophores vary greatly, what's the major factors drive this difference?
Lines 206 "Fluorophores including mEGFP and mEmerald displayed a secondary peak in intensity around an hour after experiment initiation. This is consistent with a change in the rate of protein production". What is the mechanism behind the secondary peak, and why is it distinctly observed only in mEGFP and mEmerald?
Minor comments:
Line 143 "curve I(t) = I0 tanh (t-tin/ts) (Fig. 4D, Methods)". It's not Fig. 4D, but Fig. 3D.
Line 145 "time is smallest for Superfolder GFP and longest for mNeonGreen (Fig. 4D)". Not Fig. 4D, but Fig. 3D.
Line159 "mScarlet" must be replaced with "mScarlet-I".
The systematic performance evaluation of in vivo fluorophores under the same condition will give a comprehensive guidence when choosing fluorescent proteins in the field of Drosophila developmental biology.
Reviewer #1 (Public review):
Summary:
RNA modification has emerged as an important modulator of protein synthesis. Recent studies found that mRNA can be acetylated (ac4c), which can alter mRNA stability and translation efficiency. The role of ac4c mRNA in the brain has not been studied. In this paper, the authors convincingly show that ac4c occurs selectively on mRNAs localized at synapses, but not cell-wide. The ac4c "writer" NAT10 is highly expressed in hippocampal excitatory neurons. Using NAT10 conditional KO mice, decreasing levels of NAT10 resulted in decreases in ac4c of mRNAs and also showed deficits in LTP and spatial memory. These results reveal a potential role for ac4c mRNA in memory consolidation.
This is a new type of mRNA regulation that seems to act specifically at synapses, which may help elucidate the mechanisms of local protein synthesis in memory consolidation. Overall, the studies are well carried out and presented. There is some confusion over training/learning vs memory, and the precise mRNAs that require ac4c to carry out memory consolidation are not clear. The specificity of changes occurring only at the end of training, rather than after each day of training, is interesting and warrants some investigation. This timeframe is puzzling because the authors show that ac4c can dynamically increase within 1 hour after cLTP.
Strengths:
(1) The studies show that mRNA acetylation (ac4c) occurs selectively at mRNAs localized to synaptic compartments (using synaptoneurosome preps).
(2) The authors identify a few key mRNAs acetylated and involved in plasticity and memory - e.g., Arc.
(3) The authors show that Ac4c is induced by learning and neuronal activity (cLTP).
(4) The studies show that the ac4c "writer" NAT10 is expressed in hippocampal excitatory neurons and may be relocated to synapses after cLTP/learning induction.
(5) The authors used floxed NAT10 mice injected with AAV-Cre in the hippocampus (NAT10 cKO) to show that NAT10 may play a role in LTP maintenance and memory consolidation (using the Morris Water Maze).
Weaknesses:
(1) The authors use a confusing timeline for their behavioral experiments, i.e, day 1 is the first day of training in the MWM, and day 6 is the probe trial, but in reality, day 6 is the first day after the last training day. So this is really day 1 post-training, and day 20 is 14 days post-training.
(2) The authors inaccurately use memory as a term. During the training period in the MWM, the animals are learning, while memory is only probed on day 6 (after learning). Thus, day 6 reflects memory consolidation processes after learning has taken place.
(3) The NAT10 cKO mice are useful to test the causal role of NAT10 in ac4a and plasticity/memory, but all the experiments used AAV-CRE injections in the dorsal hippocampus that showed somewhat modest decreases in total NAT10 protein levels. For these experiments, it would be better to cross the NAT10 floxed animals to CRE lines where a better knockdown of NAT10 can be achieved, with less variability.
(4) Because knockdown is only modest (~50%), it is not clear if the remaining ac4c on mRNAs is due to remaining NAT10 protein or due to an alternative writer (as the authors pose).
Reviewer #2 (Public review):
This is an interesting study that shows that mRNA acetylation at synapses is dynamically regulated at synapses by spatial memory in the mouse hippocampus. The dynamic changes of ac4C-mRNAs regulated by memory were validated by methods including ac4C dot-blot and liquid 13 chromatography-tandem mass spectrometry (LC-MS/MS).
Here are some comments for consideration by readers and authors:
(1) It is known that synaptosomes are contaminated with glial tissue. In the study, the authors also show that NAT0 is expressed in glia. So the candidate mRNAs identified by acRIP-seq might also be mixed with glial mRNAs. Are the GO BP terms shown in Figure 3A specifically chosen, or unbiasedly listed for all top ones?
(2) Where does NAT10-mediated mRNA acetylation take place within cells generally? Is there evidence that NAT10 can catalyze mRNA acetylation in the cytoplasm?
(3) "The NAT10 proteins were significantly reduced in the cytoplasm (S2 fraction) but increased in the PSD fraction at day 6 after memory (Figures 5J and 5K)." The authors argue that the translocation of NAT10 from soma to synapses accounts for these changes. The increase of NAT10 protein in the PSD fraction can be understood. However, it is quite surprising that the NAT10 proteins were significantly reduced in the cytoplasm (S2 fraction), considering the amount of NAT10 in soma is much more abundant in synapses. The small increase in synaptic NAT10 might not be enough to cause a decrease in soma NAT10 protein level.
(4) It is difficult to separate the effect on mRNA acetylation and protein mRNA acetylation when doing the loss of function of NAT10.
Author response:
Reviewer #1:
Comment 1: The authors use a confusing timeline for their behavioral experiments, i.e., day 1 is the first day of training in the MWM, and day 6 is the probe trial, but in reality, day 6 is the first day after the last training day. So this is really day 1 post-training, and day 20 is 14 days post-training.
We thank this reviewer for pointing out the issue of the behavioral timeline. We will revise the behavioral timeline as suggested by this reviewer. Days 1–5 will be labeled as “Training phase day 1–5”. Day 6 will be labeled as the “Day 1 post-training” and Day 20 will be labeled as the “Day 14 post-training”.
Comment 2: The authors inaccurately use memory as a term. During the training period in the MWM, the animals are learning, while memory is only probed on day 6 (after learning). Thus, day 6 reflects memory consolidation processes after learning has taken place.
We will revise the manuscript to distinguish between "learning" and "memory." We will refer to the performance during the 5-day training period as "spatial learning" and restrict the term "memory" to the probe tests on Day 6, which reflect memory processes after learning has taken place.
Comment 3: The NAT10 cKO mice are useful... but all the experiments used AAV-CRE injections in the dorsal hippocampus that showed somewhat modest decreases... For these experiments, it would be better to cross the NAT10 floxed animals to CRE lines where a better knockdown of NAT10 can be achieved, with less variability.
We want to clarify the reason for using AAV-Cre injection rather than Cre lines. Indeed, we attempted to generate Nat10 conditional knockouts by crossing Nat10<sup>flox/flox</sup> mice with several CNS-specific Cre lines. Crossing with Nestin-Cre and Emx1-Cre resulted in embryonic and premature lethality, respectively, consistent with the essential housekeeping function of NAT10 during neurodevelopment. We are currently using the Camk2α-Cre line which starts to express Cre after postnatal 3 weeks specifically in hippocampal pyramidal neurons (Tsien et al., 1996).
Comment 4: Because knockdown is only modest (~50%), it is not clear if the remaining ac4c on mRNAs is due to remaining NAT10 protein or due to an alternative writer (as the authors pose).
Our results suggest the existence of alternative writers. As shown in Figure 6D, we identified a population of "NAT10-independent" MISA mRNAs (present in MISA but not downregulated in NASA). Remarkably, these mRNAs possess a consensus motif (RGGGCACTAACY) that is fundamentally different from the canonical NAT10 motif (AGCAGCTG). This distinct motif usage suggests that the residual ac4C signals are not merely due to incomplete knockdown of NAT10, but reflect the activity of other, as-yet-unidentified ac4C writers. Nonetheless, we think that generation of a Nat10 knockout line with completely loss of NAT10 proteins is useful to address this reviewer’s concern.
Reviewer #2:
Comment 1: It is known that synaptosomes are contaminated with glial tissue... So the candidate mRNAs identified by acRIP-seq might also be mixed with glial mRNAs. Are the GO BP terms shown in Figure 3A specifically chosen, or unbiasedly listed for all top ones?
It is true that some ac4C-mRNAs identified by acRIP-seq from the synaptosomes are highly expressed in astrocyte, such as Aldh1l1, ApoE, Sox9 and Aqp4 (Table S3, Fig. S6H). In agreement, we found that NAT10 was also expressed in astrocyte in addition to neurons. We will show representative image for the expression of NAT10-Cre in astrocytes in the revised MS. The BP items shown in Fig. 3A were chosen from top 30 and highly related with synaptic plasticity and memory. We will show the full list of significant BP items for MISA in the revised MS.
Comment 2: Where does NAT10-mediated mRNA acetylation take place within cells generally? Is there evidence that NAT10 can catalyze mRNA acetylation in the cytoplasm?
The previous studies from non-neuronal cells showed that NAT10 can catalyze mRNA acetylation in the cytoplasm and enhance translational efficiency (Arango et al., 2018; Arango et al., 2022). In this study, we showed that mRNA acetylation occurred both in the homogenates and synapses (see ac4C-mRNA lists in Table S2 and S3). However, spatial memory upregulated mRNA acetylation mainly in the synapses rather than in the homogenates (Fig. 2 and Fig. S2).
Comment 3: "The NAT10 proteins were significantly reduced in the cytoplasm (S2 fraction) but increased in the PSD fraction..." The small increase in synaptic NAT10 might not be enough to cause a decrease in soma NAT10 protein level.
We showed that the NAT10 protein levels were increased by one-fold in the PSD fraction, but were reduced by about 50% in the cytoplasm after memory formation (Fig. 5J and K). The protein levels of NAT10 in the homogenates and nucleus were not altered after memory formation (Fig. 5F and I). Due to these facts, we hypothesized that NAT10 proteins may have a relocation from cytoplasm to synapses after memory formation, which was also supported by the immunofluorescent results from cultured neurons (Fig. S4). However, we agree with this reviewer that drawing such a conclusion may require the time-lapse imaging of NAT10 protein trafficking in living animals, which is technically challenging at this moment.
Comment 4: It is difficult to separate the effect on mRNA acetylation and protein mRNA acetylation when doing the loss of function of NAT10.
This is a good point. We agree with this reviewer that NAT10 may acetylate both mRNA and proteins. We examined the acetylation levels of -tubulin and histone H3, two substrate proteins of NAT10 in the hippocampus of Nat10 cKO mice. As shown in Fig S5C, E, and F, the acetylation levels of -tubulin and histone H3 remained unchanged in the Nat10 cKO mice, likely due to the compensation by other protein acetyltransferases. In contrast, mRNA ac4C levels were significantly decreased in the Nat10 cKO mice (Figure S5G–H). These results suggest that the memory deficits seen in Nat10 cKO mice may be largely due to the impaired mRNA acetylation. Nonetheless, we believe that developing a new technology which enables selective erasure of mRNA acetylation would be helpful to address the function of mRNA. We discussed these points in the MS (line 585-592).
References
Arango, D., Sturgill, D., Alhusaini, N., Dillman, A. A., Sweet, T. J., Hanson, G., Hosogane, M., Sinclair, W. R., Nanan, K. K., & Mandler, M. D. (2018). Acetylation of cytidine in mRNA promotes translation efficiency. Cell, 175(7), 1872-1886. e1824.
Arango, D., Sturgill, D., Yang, R., Kanai, T., Bauer, P., Roy, J., Wang, Z., Hosogane, M., Schiffers, S., & Oberdoerffer, S. (2022). Direct epitranscriptomic regulation of mammalian translation initiation through N4-acetylcytidine. Molecular cell, 82(15), 2797-2814. e2711.
Tsien, J. Z., Chen, D. F., Gerber, D., Tom, C., Mercer, E. H., Anderson, D. J., Mayford, M., Kandel, E. R., & Tonegawa, S. (1996). Subregion-and cell type–restricted gene knockout in mouse brain. Cell, 87(7), 1317-1326.
These models are not static
what if these aren't models
but are in morphic resonance with something that is outside the brain driven by the shift of attention
Reviewer #2 (Public review):
Summary:
Pia Richter et al. investigated the peptidoglycan (PG) recycling metabolism in the alpha-proteobacterium Caulobacter crescentus. The authors first identified a functional recycling pathway in this organism, which is similar to the Pseudomonas route, and they characterized two key enzymes (NagZ, AmiR) of this pathway, showing that AmiR differs in specificity from the AmpD counterpart of E. coli. Further, they studied the effects of deletions within the PG recycling pathway (ampG, amiR, nagZ, sdpA, blaA, nagA1, nagA2, amgK, nagK mutants), showing filamentation and cell widening, thereby revealing a link between PG recycling and cell division. Finally, they provide a link between PG recycling and beta-lactam sensitivity in C. crescents that is not caused by activation of a beta-lactamase, but rather is a result of reduced supply of PG building blocks increasing the sensitivity of penicillin-binding proteins.
Strengths:
This work adds to the understanding of the role of PG recycling in alpha-proteobacteria, which significantly differ in their mode of cell wall growth from the better studied gamma-proteobacteria.
Weaknesses:
The findings are not entirely novel as recent studies by Modi et al. 2025 mBio (studying C. crescentus) and Gilmore & Cava 2022 Nat. Commun. (studying Agrobacterium tumefaciens) came to similar conclusions.
AI can also hinder learning when students are overcommitted, overworked, and see AI exclusively as a time-saving device. But if AI can save you time doing the grunt work so you can devote that time to do more serious learning, I think that is a plus.
если ИИ может сэкономить вам время, которое вы можете потратить на более серьёзное обучение, это плюс.
Many students use AI without a good understanding of how it works in a computational/Bayesian sense, and this leads to putting too much confidence in its output.
AI can help students but they shold use it in appropriate way
So, teaching them to be critical and discerning about how they use it and what it offers is important. But even more important is helping them understand how their embodied human minds work and how powerful they can be when used well.
обучать студентов пользоваться правильно, вдумчиво и разборчиво с ИИ, а так же объяснять им, как хорошо они могут справляться самостоятельно ,без ИИ
but these skills will only progress when they are supported by higher-level skills in language and cognition, and given extensive opportunities for practice.
children will be able to take that next step with the support and extensive opportunities given.
here is ample evidence that having good morphological awareness helps with literacy, but expanding literacy skills in turn help to improve morphological awareness.
Both of these work hand in hand with each other and can benefit at the same time.
Having good morphological awareness is important not only to be able to spell a number of words, but also to read them.
All writers should master this ability.
in some cases, writers might not ever learn the morphological rules consistently, but rely on their knowledge of orthographic patterns instead, which often, but not always, lead to the same spellings.
Many writers often won't find or learn morphological rules and will often rely on their orthographic patterns instead.
Working toward this goal will help more children to find reading and writing not chores in themselves, but tools that they can use to understand others’ ideas and to express their own, with confidence and fluency.
This is very important. Children as a whole can benefit more with the use of these tools and techniques.
Decades of intensive research have contributed to a rich and growing body of knowledge about how children learn to read and write, but many gaps remain.
With many advancements and research studies showing growing knowledge, there is still some gaps that need to be filled.
Jhangiani, R. S., & Jhangiani, S. (2017). Investigating the Perceptions, Use, and Impact of Open Textbooks: A survey of Post-Secondary Students in British Columbia. The International Review of Research in Open and Distributed Learning, 18(4).
I found this study insightful because it shows that high textbook costs affect student engagement and performance. Using open textbooks not only saves money but also allows students to access materials instantly.
One place where neoliberal understanding of society has asserted itself in both scholarship and everyday speech is when we refer to digital platforms such as Twitter, Facebook, and Instagram as “social media.” At one level, the term “social” is here roughly synonymous with “interactive,” a word that at its narrowest refers to exchanges between discrete individuals. That usage of the keyword is entirely compatible with neoliberal ideology and with mainstream media accounts of social media and technology as atomizing and isolating. Cutting against these ideologies are phenomena ranging from the Arab Spring to the August 2011 London riots, from #BlackLivesMatter to #MeToo, each of which is larger and broader than a delimited “society” understood as an organization with a particular goal or purpose but none of which claims to represent “society” as a totality. The same media outlets and politicians may depict social media at one moment as isolating and at another as somehow responsible for these movements. In doing so, they are claiming (plausibly or not) that these interactive technologies enable political participation and the formation of new collective identities and are linking the word to broader and more explicitly political usages of the keyword such as “social justice” and “social movement.”
This section stands out because it shows how the meaning of “social” shifts depending on context. Social media can isolate people as individuals, but it can also create collective action, like #BlackLivesMatter or #MeToo. The author shows how the word reflects both personal interaction and large political movements. It demonstrates how “society” is not a fixed thing but a dynamic process shaped through technology and participation.
society produces “conformity” by enforcing conventional “names and customs” on the otherwise free (explicitly male and implicitly white) individual.
Emerson’s view of society as a force that suppresses individual freedom is interesting but also very reductive. This annotation makes me think about how easy it is to imagine “society” as something separate from people, when in reality individuals help create and shape it. The passage shows how the conflict between the individual and the collective is more complicated than a simple opposition, which fits the author’s argument about the word’s ambiguity.
Society” is a word too often used in a sloppy or vague way. When teachers share their pet peeves about student writing, they frequently name “society” as the word they would most like to ban. There are typically two reasons given for this antipathy. First, the term falsely implies universality (when you say “society,” do you really mean to refer to every single person in the world?). Second, it attributes agency to an abstraction (how can “society” actually do anything like oppress someone or believe something?). Baked into such usages is often a simplistic if widely recognizable story about how an amorphous “social” pressure is applied to equally amorphous “individuals” who either succumb to that pressure or resist it by “being themselves.” You can find versions of this story in a blog post about how well the free market organizes “society,” a sociology paper about gangs’ “antisocial” activity, or a political speech blaming “society” for certain behavior. But wherever this story is told, if it lacks any specifics about what is meant by “society,” readers are likely to see it as a cliché, an overgeneralizing formula.
The author points out that “society” is often used without clear meaning, and I notice that I also tend to use the word in a broad and imprecise way. This section reminds me that academic writing requires specificity. When people blame “society,” they usually refer to certain institutions or groups, not every person. The author’s criticism pushes me to be more intentional about who or what I actually mean when I use the term.
Zapping in front of the TV took place in a comparatively sealed-off, private space and was rarely coded as social behavior.
yeah but nielsen prototyped all this reactive surveillance
The reason for this beingin the Complex classification is, as one will tell youwho has operated a Subject File, because a great dealof care must be exercised in not only laying out theproper plan, but working in and cooperating withthose who send matter to be filed, and are constantlyasking for it. The file clerk may think it goes in oneplace, but unless it is carefully marked as to whereit should be filed and then remembered, and possiblyagain classified by card, it is many times found a dif-ficult matter to handle.
UBJECT filing is a branch of filingwhich is not much used in thebusiness world but which deservesas much attention as any other. It ismore complicated than other systemsand an adaptation has to be workedout for each , business to which it isapplied, but after the classification hasonce been made, it will prove to be foreconomy and increased efficiency.
COMPARISON OF THE DECIMAL ARRANGEMENT WITHTHE DUPLEX NUMERIC ARRANGEMENT ( showing the possibilityof expansion in the latter that is lacking in the decimalclassification )
Notice the one-to-one correspondences between these systems.
There is a sort of artificial lack of extension, but numerically it really doesn't exist mathematically.
o many men are isolated and alone today, and in that place we are susceptible to the whims, temptations, and empty show of the devil. Many men have buddies with whom they can watch sports and drink beer, and there’s nothing wrong with that. But we also need to have brothers who know who we are, what we are going through, and to whom we can be accountable.
need a community to support us and keep us in check to prevent us from becoming lonely and falling into the tempatations of satan
What is uncommon in our time is men who are free. A free man is not a perfect man who has it all together, but one who remembers who he is: a son of God whom God has called forth for love. And he knows how much more he can become by the power of grace unfolding in his life over time, and with the support of brothers.
a pefect man is one who turns their eyes to the Lord and remembers that they can be more by the power of God and those around him
For example, television in general may be functional in that it provides a great deal of information to people, helps fuel consumption, and stresses certain values, but it may be dysfunctional in that it portrays some types of people in negative roles, suggests that the world is more violent than it really is, and creates feelings of anxiety and discontent in people who cannot afford all of the good (and bad) things advertised on television. Functional analysis has a conservative bias in that it emphasizes the maintenance and stability of society instead of focusing on changes that might be made.
I would describe social media as functional and dysfunctional
By The Associated Press
Fact-based reporting, reputable news source. Their source is neutral, but the only problem with that is they might not provide much analysis to the story...
hey will appear to be omniscient and will generally know nothing; they will be tiresome company, having the show of wisdom without the reality.
What I find interesting is that anxiety about new technologies has almost recurred throughout history. When Thamus in Plato’s story said that writing would make people “look wise but actually know nothing,” is strikingly similar to the current assessment of AI that it makes us appear knowledgeable, but in reality know nothing. Each generation believes that technology is disrupting our attention and our life, the pattern is almost always the same.
So it is absolutely necessary for everyone to believe innothing. But I do not mean voidness. There is something,but that something is something which is always preparedfor taking some particular form, and it has some rules, ortheory, or truth in its activity.
okay NOW youre losing me bruh
i found most of this one to be not as good as the others but i do like this ending part.
While both ChatGPT and Gemini produced coherent summaries of Tacitus’ digital history, they also generated “phantom sources,” as Salvaggio (2025) and Tenzer et al. (2024) warn. This forced me to confront my own instinct to trust well-written text. AI’s polished language can disguise its lack of historical grounding, a problem Graham (2020) describes as “phantom authority.” Recognizing this made me more cautious about accepting digital outputs at face value.
This is a really thoughtful point, and I appreciate that you didn’t just say AI can help, but also explained where it falls short. You describe the difference between “pattern” and “understanding” in a way that feels honest and grounded in what we’ve been learning. I wonder if you found any specific moment in the AI interrogation where the generated answer sounded convincing but you later realized it had no real historical basis. If you included a short example of that, it would make your argument even more meaningful and personal. But overall you’ve captured the ethical tension of using AI in history really well.
inking atomic notes using wikilinks forced me to clarify conceptual relationships and avoid redundancy. My notes now reflect a networked understanding of digital history: an interconnected web of people, ideas, and technologies rather than a list of definitions. This structure mirrors the way historians themselves trace connections between events, actors, and sources—only now, the logic is embedded in digital architecture.
I really like how you explain the switch from “notes as storage” to “notes as a network.” The way you describe linking concepts actually helped me think about my own note system differently. I’m curious if you have a specific example of two ideas that didn’t seem connected at first but became linked once you used wikilinks. I think adding one concrete moment like that would make this even stronger, since you clearly worked hard to build an intentional structure instead of just tagging randomly. Still, you put the value of linking into words really clearly.
When I added YAML properties to my own notes, I began to understand that metadata is never neutral. A property like type or date might seem simple, but it decides how information is stored, sorted, and found. That small act of labeling defines what becomes visible in a database and what doesn’t. This connects to the idea of “dark data,” the information that stays invisible because it isn’t recorded within the system’s limits. Thinking through this process made me realize that data creation is interpretive work—it involves judgment, context, and responsibility.
When I added YAML properties to my own notes, I began to understand that metadata is never neutral. A property like type or date might seem simple, but it decides how information is stored, sorted, and found. That small act of labeling defines what becomes visible in a database and what doesn’t. This connects to the idea of “dark data,” the information that stays invisible because it isn’t recorded within the system’s limits. Thinking through this process made me realize that data creation is interpretive work and it involves judgment, context, and responsibility.
Welcome to my Lab Notebook - Reloaded Welcome to my lab notebook, version 3.0. My original open lab notebooks began on the wiki platform OpenWetWare, moved to a personally hosted Wordpress platform, and now run on a Jekyll-powered platform (site-config), but the basic idea remains the same. For completeness, earlier entries from both platforms have been migrated here. Quoting from my original introduction to the Wordpress notebook: Disclaimer: Not a Blog Welcome to my open lab notebook. This is the active, permanent record of my scientific research, standing in place of the traditional paper bound lab notebook. The notebook is primarily a tool for me to do science, not communicate it. I write my entries with the hope that they are intelligible to my future self; and maybe my collaborators and experts in my field. Only the occasional entry will be written for a more general audience. […] In these pages you will find not only thoughts and ideas, but references to the literature I read, the codes or manuscripts I write, derivations I scribble and graphs I create and mistakes I make. Why an open notebook? Is it working? My original introduction to the notebook from November 2010 dodged this question by suggesting the exercise was merely an experiment to see if any of the purported benefits or supposed risks were well-founded. Nearly three years in, can I draw any conclusions from this open notebook experiment? In that time, the notebook has seen six projects go from conception to publication, and a seventh founder on a null result (see #tribolium). Several more projects continue to unfold. I have often worked on several projects simultaneously, and some projects branch off while others merge, making it difficult to capture all the posts associated with a single paper into a single tag or category. Of course not all ideas make it into the paper, but they remain captured in the notebook. I often return to my earlier posts for my own reference, and frequently pass links to particular entries to collaborators or other colleagues. On occasion I have pointed reviewers of my papers to certain entries discussing why we did y instead of x, and so forth. Both close colleagues and researchers I’ve never met have emailed me to follow up on something they had read in my notebook. This evidence suggests that the practice of open notebook science can faciliate both the performance and dissemination of research while remaining compatible and even synergistic with academic publishing. I am both proud and nervous to know of a half dozen other researchers who have credited me for inspiring them to adopt open or partially open lab notebooks online. I am particularly grateful for the examples, interactions, and ideas from established practitioners of open notebook science in other fields. My collaborators have been largely been somewhere between favorable and agnostic towards the idea, with the occasional request for delayed or off-line notes. More often gaps arise from my own lapses in writing (or at least being intelligible), though the automated records from Github in particular, as well as Flickr (image log), Mendeley (reading log), and Twitter and the like help make up for some of the gaps. The Integrated Notebook becomes the Knitted Notebook In creating my wordpress lab notebook, I put forward the idea of an “Integrated Lab Notebook”, a somewhat convoluted scheme in which I would describe my ideas and analyses in Wordpress posts, embed figures from Flickr, and link them to code on Github. Knitr simplified all that. I can now write code, analysis, figures, equations, citations, etc, into a single Rmarkdown format and track it’s evolution through git version control. The knitr markdown format goes smoothly on Github, the lab notebook, and even into generating pdf or word documents for publication, never seperating the code from the results. For details, see “writing reproducibly in the open with knitr.” Navigating the Open Notebook You can page through the notebook chronologically just like any paper notebook using the “Next” and “Previous” buttons on the sidebar. The notebook also leverages all of the standard features of a blog: the ability to search, browse the archives by date, browse by tag or browse by category. follow the RSS feed add and share comments in Disqus I use categories as the electronic equivalent of separate paper notebooks, dividing out my ecological research projects, evolutionary research topics, my teaching notebook, and a few others. As such, each entry is (usually) made into exactly one category. I use tags for more flexible topics, usually refecting particular projects or methods, and entries can have zero or multiple tags. It can be difficult to get the big picture of a project by merely flipping through entries. The chronological flow of a notebook is a poor fit to the very nonlinear nature of research. Reproducing particular results frequently requires additional information (also data and software) that are not part of the daily entries. Github repositories have been the perfect answer to these challenges. (The real notebook is Github) My Github repositories offer a kind of inverted version of the lab notebook, grouped by project (tag) rather than chronology. Each of my research projects is now is given it’s own public Github repository. I work primarily in R because it is widely used by ecologists and statisicians, and has a strong emphasis on reproducible research. The “R package” structure turns out to be brilliantly designed for research projects, which specifies particular files for essential metadata (title, description, authors, software dependencies, etc), data, documentation, and source code (see my workflow for details). Rather than have each analysis described in full in my notebook, they live as seperate knitr markdown files in the inst/examples directory of the R package, where their history can be browsed on Github, complete with their commit logs. Long or frequently used blocks of code are written into functions with proper documentation in the package source-code directory /R, keeping the analysis files cleaner and consistent. The issues tracker connected to each Github repository provides a rich TO DO list for the project. Progress on any issue often takes the form of subsequent commits of a particular analysis file, and that commit log can automatically be appended to the issue. The social lab notebook When scripting analyses or writing papers, pretty much everything can be captured on Github. I have recently added a short script to Jekyll which will pull the relevant commit logs into that day’s post automatically. Other activities fit less neatly into this mold (reading, math, notes from seminars and conferences), so these things get traditional notebook entries. I’m exploring automated integration for other activities, such as pulling my current reading from Mendeley or my recent discussions from Twitter into the notebook as well. For now, feed for each of these appear at the top of my notebook homepage, with links to the associated sites.
This emphasis on reproducibility matters to history too. It suggests I should keep detailed logs: where I got a manuscript image, how I interpreted marginalia, what uncertainties remain. That way future readers or researchers can trace my reasoning or redo steps themselves.
Open science is a broad term for various efforts to make both the process and products of scientific research accessible to society at large. This encompasses both "open access" -- the lowering of economic barriers for the accessing of scientific publications and results -- and "open research" -- exposing the process of research to view, not just its traditional products. In the latter category, "open notebook science" aims to place notes, calculations, protocols, and evaluation of interim results into public view in order to allow scientists and the community at large to evaluate not just conclusions, but every step of the process. "Reproducible research" covers efforts to bundle publication of results with the raw data, software algorithms, and calculations needed to reconstruct the published results. My commitment to open science began with open access, and attempts to ensure that my written output was -- to the extent possible -- available online in freely downloadable format. This is always a work in progress, because older publications are often unavailable given paywalls or commercial licenses by academic publishers. To the extent possible, I will always make versions of publications available online, and I will attempt to choose journals with permissive preprint/postprint policies. I am slowly attempting to reconstruct PDF versions of older conference papers, many of which I have only in print files, which will need to be scanned. But by far the more important aspect of open science is an open process, and reproducible results. To that end, I have been exploring the use of wikis and blogs to record interim thinking on research topics, and this is the second iteration of an online "lab notebook" that goes beyond occasional blog posting. My first digital lab notebook was a local installation of the Instiki wiki, synchronized with Dropbox. This was useful for doing my own work wherever I happened to be, but was not truly "open" in the sense of public access. I have been migrating some of those reading notes, and topical notebooks to this current iteration, and that process is ongoing. My first "online open notebook" was hosted by Wikispaces, but I found that the lack of offline access was difficult for me, given travel and limited internet access where I live and work. This current iteration began when I stumbled onto Jekyll and Github Pages, and then learned of Carl Boettiger's sophisticated efforts at open notebook science using these components. My own notebook and reproducible notes are not nearly as advanced as Carl's workflow, but he continues to provide the paradigm toward which I believe many of us are striving. The community seems to be developing a taxonomy of "open notebook science" efforts, which allows readers to understand what they can expect from an online lab notebook. ONSclaims has two dimensions to its claims classification: completeness and immediacy. "All Content Immediate" indicates a lab notebook, for example, in which the scientist has the entirety of their notes, calculations, and data available immediately as generated. Such a state indicates that "if it isn't in the notebook, others can assume you haven't done it." This is a laudable goal, but since my process and the site are still evolving, I'm claiming a lesser classification, indicated by the icon here: Selected Content Immediate. Some of my manuscripts (including my dissertation text) are outside the online notebook format, and not all of my analyses are yet pipelined in such a way as to make them easy to post, but I'm evolving towards that. Unless otherwise noted (i.e., on a draft manuscript), notes posted here is made available under the Creative Commons NonCommercial-Attribution-ShareAlike license. This means you are free to make use of it, change it, use it for any non-commercial purposes, as long as you acknowledge the source. Journal manuscripts under development here are often NOT covered by this Creative Commons license, because they will eventually be subject to whatever license the target journal requires. Thus, drafts are readable in their posted form, but all rights are reserved beyond viewing (and, of course, having your own ideas with respect to the material). Software and tools I write for generating scientific results will always have a free, open-source version available for use by scholars, students, and the community. I'm not saying that I don't write commercial software, or that I won't take research results and find ways to create products. I am saying, however, that if I work on a piece of research, and communicate those results to the community, members of the community need a way to see what I've done, replicate it if desired, refute my claims if I turn out to be wrong, and use those tools and software in their own work to do something better.
Shows this notebook treats sources seriously and transparently. In my own project that’s important — I want to cite each manuscript image, each provenance trace, every secondary source, so readers can verify or explore further.
Open science is a broad term for various efforts to make both the process and products of scientific research accessible to society at large. This encompasses both "open access" -- the lowering of economic barriers for the accessing of scientific publications and results -- and "open research" -- exposing the process of research to view, not just its traditional products. In the latter category, "open notebook science" aims to place notes, calculations, protocols, and evaluation of interim results into public view in order to allow scientists and the community at large to evaluate not just conclusions, but every step of the process. "Reproducible research" covers efforts to bundle publication of results with the raw data, software algorithms, and calculations needed to reconstruct the published results. My commitment to open science began with open access, and attempts to ensure that my written output was -- to the extent possible -- available online in freely downloadable format. This is always a work in progress, because older publications are often unavailable given paywalls or commercial licenses by academic publishers. To the extent possible, I will always make versions of publications available online, and I will attempt to choose journals with permissive preprint/postprint policies. I am slowly attempting to reconstruct PDF versions of older conference papers, many of which I have only in print files, which will need to be scanned. But by far the more important aspect of open science is an open process, and reproducible results. To that end, I have been exploring the use of wikis and blogs to record interim thinking on research topics, and this is the second iteration of an online "lab notebook" that goes beyond occasional blog posting. My first digital lab notebook was a local installation of the Instiki wiki, synchronized with Dropbox. This was useful for doing my own work wherever I happened to be, but was not truly "open" in the sense of public access. I have been migrating some of those reading notes, and topical notebooks to this current iteration, and that process is ongoing. My first "online open notebook" was hosted by Wikispaces, but I found that the lack of offline access was difficult for me, given travel and limited internet access where I live and work. This current iteration began when I stumbled onto Jekyll and Github Pages, and then learned of Carl Boettiger's sophisticated efforts at open notebook science using these components. My own notebook and reproducible notes are not nearly as advanced as Carl's workflow, but he continues to provide the paradigm toward which I believe many of us are striving. The community seems to be developing a taxonomy of "open notebook science" efforts, which allows readers to understand what they can expect from an online lab notebook. ONSclaims has two dimensions to its claims classification: completeness and immediacy. "All Content Immediate" indicates a lab notebook, for example, in which the scientist has the entirety of their notes, calculations, and data available immediately as generated. Such a state indicates that "if it isn't in the notebook, others can assume you haven't done it." This is a laudable goal, but since my process and the site are still evolving, I'm claiming a lesser classification, indicated by the icon here: Selected Content Immediate. Some of my manuscripts (including my dissertation text) are outside the online notebook format, and not all of my analyses are yet pipelined in such a way as to make them easy to post, but I'm evolving towards that. Unless otherwise noted (i.e., on a draft manuscript), notes posted here is made available under the Creative Commons NonCommercial-Attribution-ShareAlike license. This means you are free to make use of it, change it, use it for any non-commercial purposes, as long as you acknowledge the source. Journal manuscripts under development here are often NOT covered by this Creative Commons license, because they will eventually be subject to whatever license the target journal requires. Thus, drafts are readable in their posted form, but all rights are reserved beyond viewing (and, of course, having your own ideas with respect to the material). Software and tools I write for generating scientific results will always have a free, open-source version available for use by scholars, students, and the community. I'm not saying that I don't write commercial software, or that I won't take research results and find ways to create products. I am saying, however, that if I work on a piece of research, and communicate those results to the community, members of the community need a way to see what I've done, replicate it if desired, refute my claims if I turn out to be wrong, and use those tools and software in their own work to do something better.
The open and editable public format makes the research living and dynamic. For medieval manuscripts it suggests I could update interpretations if I find new sources or corrections — it does not need to be fixed foreve
Open science is a broad term for various efforts to make both the process and products of scientific research accessible to society at large. This encompasses both "open access" -- the lowering of economic barriers for the accessing of scientific publications and results -- and "open research" -- exposing the process of research to view, not just its traditional products. In the latter category, "open notebook science" aims to place notes, calculations, protocols, and evaluation of interim results into public view in order to allow scientists and the community at large to evaluate not just conclusions, but every step of the process. "Reproducible research" covers efforts to bundle publication of results with the raw data, software algorithms, and calculations needed to reconstruct the published results. My commitment to open science began with open access, and attempts to ensure that my written output was -- to the extent possible -- available online in freely downloadable format. This is always a work in progress, because older publications are often unavailable given paywalls or commercial licenses by academic publishers. To the extent possible, I will always make versions of publications available online, and I will attempt to choose journals with permissive preprint/postprint policies. I am slowly attempting to reconstruct PDF versions of older conference papers, many of which I have only in print files, which will need to be scanned. But by far the more important aspect of open science is an open process, and reproducible results. To that end, I have been exploring the use of wikis and blogs to record interim thinking on research topics, and this is the second iteration of an online "lab notebook" that goes beyond occasional blog posting. My first digital lab notebook was a local installation of the Instiki wiki, synchronized with Dropbox. This was useful for doing my own work wherever I happened to be, but was not truly "open" in the sense of public access. I have been migrating some of those reading notes, and topical notebooks to this current iteration, and that process is ongoing. My first "online open notebook" was hosted by Wikispaces, but I found that the lack of offline access was difficult for me, given travel and limited internet access where I live and work. This current iteration began when I stumbled onto Jekyll and Github Pages, and then learned of Carl Boettiger's sophisticated efforts at open notebook science using these components. My own notebook and reproducible notes are not nearly as advanced as Carl's workflow, but he continues to provide the paradigm toward which I believe many of us are striving. The community seems to be developing a taxonomy of "open notebook science" efforts, which allows readers to understand what they can expect from an online lab notebook. ONSclaims has two dimensions to its claims classification: completeness and immediacy. "All Content Immediate" indicates a lab notebook, for example, in which the scientist has the entirety of their notes, calculations, and data available immediately as generated. Such a state indicates that "if it isn't in the notebook, others can assume you haven't done it." This is a laudable goal, but since my process and the site are still evolving, I'm claiming a lesser classification, indicated by the icon here: Selected Content Immediate. Some of my manuscripts (including my dissertation text) are outside the online notebook format, and not all of my analyses are yet pipelined in such a way as to make them easy to post, but I'm evolving towards that. Unless otherwise noted (i.e., on a draft manuscript), notes posted here is made available under the Creative Commons NonCommercial-Attribution-ShareAlike license. This means you are free to make use of it, change it, use it for any non-commercial purposes, as long as you acknowledge the source. Journal manuscripts under development here are often NOT covered by this Creative Commons license, because they will eventually be subject to whatever license the target journal requires. Thus, drafts are readable in their posted form, but all rights are reserved beyond viewing (and, of course, having your own ideas with respect to the material). Software and tools I write for generating scientific results will always have a free, open-source version available for use by scholars, students, and the community. I'm not saying that I don't write commercial software, or that I won't take research results and find ways to create products. I am saying, however, that if I work on a piece of research, and communicate those results to the community, members of the community need a way to see what I've done, replicate it if desired, refute my claims if I turn out to be wrong, and use those tools and software in their own work to do something better.
This statement shows the author’s commitment to transparency. It resonates with how I want to publish my own historical notebook: not just final conclusions, but the full process. For Dante manuscripts this means publishing not only text interpretations, but images, provenance notes, and gaps.
Why examples? What are example methods good for? As we have seen, examples make dependencies between tests explicit by reusing examples as setups for other examples, thus forming a hierarchy of examples. Best practice in test design supposedly should avoid dependencies between tests, but studies have shown that this practice instead leads to implicit dependencies due to duplicated code in test setups. This in turn leads to cascading failures due to the same setups being repeated in numerous tests. By factoring out the commonalities as examples, the duplication is removed, and cascading failures are avoided. A further benefit is that examples can be used in live documentation, and, as we shall see, examples support an exploratory approach to test-driven development, that we call example-driven development, or EDD.
With TDD, you develop code by incrementally adding a test for a new feature, which fails. Then you write the “simplest code” that passes the new test. You add new tests, refactoring as needed, until you have fully covered everything that the new feature should fulfil, as specified by the tests. But: Where do tests come from? When you write a test, you actually have to “guess first” to imagine what objects to create, exercise and test. How do we write the simplest code that passes? A test that fails gives you a debugger context, but then you have to go somewhere else to add some new classes and methods. What use is a green test? Green tests can be used to detect regressions, but otherwise they don't help you much to create new tests or explore the running system. With Example-Driven Development we try to answer these questions.
Desde que me lo presentaron, siempre me ha desagradado el Test Driven Design (TDD), pues me parecía absurdamente burocrático y contra flujo. Afortunadamente, gracias al podcast de Book Overflow, encontré un autor reconocido, John Ousterhout, creador de Tcl/Tk y "A Philosophy of software design", que comparte mi opinón respecto a escribir los test antes de escribir el código y dice que en el TDD no se hace diseño, sino que se depura el software hasta su existencia.
Mi enfoque, que podría llamarse Argumentative Driven Design o ADD es uno en el que el código se desarrolla para mostrar un argumento en favor de una hipótesis, y las pruebas de código se van creando en la medida en que uno necesita inspeccionar y manipular los objetos que dicho código produce.
En palabras práctica, esto quiere decir que los test y su configuración deberían hacerse cuando uno necesita hacer un "print" (para probar/inspeccionar/manipular un estado/elemento del sistema) y no antes, lo cual aumenta la utilidad, no interrumpe el flujo y responde preguntas similares a las de este apartado, respecto a de dónde provienen las pruebas y qué hacer con los resultados exitosos.
limate change, demographic change is increasingly recognisedas a grand societal challenge that, if not adequately addressed, can threatennot only the quality of life and human dignity of older people, but also thelabour market participation of their family members, the balance of nationaleconomies and even the legitimacy of political decision-making
Clearly laying out the stakes involved in figuring out how to care for people within a society. Not just a "grand societal challenge" that impacts QOL and dignity but also: * labour market participation of family members nationl econommies legitimacy of political decision (?)
I'm glad you got to taste the Rye of my people from the great state of Indiana--the libertarian bootleggers who display Hoosier hospitality.
It is spicy alone but this is the best Rye for an old fashioned. .If you have pure Canadian maple syrup, then turn it into a maple old fashioned.
If you are at Indiana Beach with Channon them a diet Shasta cola is a great mixer with this rye.
Note: This response was posted by the corresponding author to Review Commons. The content has not been altered except for formatting.
Learn more at Review Commons
Manuscript number: RC-2025-03195R
Point-by-Point Response to Reviewers
We thank the reviewers for their thoughtful and constructive evaluations, which have helped us substantially improve the clarity, rigor, and balance of our manuscript. We are grateful for their recognition that our integrated ATAC-seq and RNA-seq analyses provide a valuable and technically sound contribution to understanding soxB1-2 function and regenerative neurogenesis in planarians.
We have carefully addressed the reviewers' major points as follows:
Reviewer #1 (Evidence, reproducibility and clarity (Required)):
Summary
The authors of this interesting study take the approach of combining RNAi, RNA-seq and ATAC-seq to try to build a regulatory network surrounding the function of a planarian SoxB1 ortholog, broadly required for neural specification during planarian regeneration. They find a number of chromatin regions that differentially accessible (measured by ATAC-seq), associate these with potential genes by proximity to the TSS. They then compare this set of genes with those that are differentially regulated (using RNA-seq), after SoxB1 RNAi mediated knockdown. This allows them the authors some focus on potential directly regulated targets of the planarian SoxB1. Two of these downstream targets, the mecom and castor transcription factors are then studied in greater detail.
Major Comments
I have no suggestions for new experiments that fit sensibly with the scope of the current work. There are other analyses that could be appropriate with the ATAC-seq data, but may not make sense in the content of SoxB1 acting as pioneer factor.
I would like to see motif enrichment analysis under the set of peaks to see if SoxB1 is opening chromatin for a restricted set of other transcription factors to then bind. Much of this could be taken from Neiro et al, eLife 2022 (which also used ATAC-seq) and matched planarians TF families to likely binding motifs. This could add some breadth to the regulatory network. It could be revealing for example if downstream TF also help regulate other targets that SoxB1 makes available, this is pattern often seen for cell specification (as I am sure the authors are aware). Alternatively, it may reveal other candidate regulators.
Thank you for this suggestion. We agree with the reviewers that this analysis should be done. We ran the motif enrichment analysis using the same methods as outlined in Neiro et al. eLife, 2022. We have included a new motif enrichment analysis in the supplement to contextualize possible co-regulators within the SoxB1-2 network.
Overall peak calling consistency with ATAC-sample would be useful to report as well, to give readers an idea of noise in the data. What was the correlation between samples?
__Excellent point. In response to this comment, we ran a Pearson correlation test on replicates within gfp and soxB1-2 RNAi replicates to get an idea of overall correlation between replicates. Additionally, we calculated percent overlap of peaks for biological replicates and between treatment groups. __
While it is logical to focus on downregulated genes, it would also be interesting to look at upregulated genes in some detail. In simple terms would we expect to see the representation of an alternate set of fate decisions being made by neoblast progeny?
This is also an important point that we considered but initially did not pursue it due to the lack of tools to test upregulated gene function. However, the reviewer is correct that this is straightforward to perform computationally. Thus, we have performed Gene Ontology analysis on the upregulated genes in all RNA-seq datasets (soxB1-2 RNAi, mecom RNAi, and castor RNAi). Both mecom and castor datasets did not reveal enrichment within the upregulated portion of the dataset. Genes upregulated after soxB1-2 RNAi were enriched for metabolic, xenobiotic detoxification, potassium homeostasis, and endocytic programs. Rather than indicating a shift toward alternative lineages, including non-ectodermal fates, these signatures are consistent with stress-responsive and homeostatic programs activated following loss of soxB1-2. We did not detect enrichment patterns strongly associated with alternative cell fates. We conclude that this analysis does not formally exclude potential shifts in lineage-specific transcriptional programs, but does support our hypothesis that soxB1-2 functions as a transcriptional activator.
Can the authors be explicit about whether they have evidence for co-expression of SoxB1/castor and SoxB1/mecom? I could find this clearly and it would be important to be clear whether this basic piece of evidence is in place or not at this stage.
We included co-expression plots for soxB1-2 with mecom and castor in the supplemental material. These plots were generated from previously published scRNA-seq data and demonstrate that cells expressing soxB1-2 also express mecom and castor. We have not done experiments showing co-expression via in situ at this time.
Minor comments
Formally loss of castor and mecom expression does mean these cells are absent, strictly the cell absence needs an independent method. It might be useful to clarify this with the evidence of be clear that cells are "very probably" not produced.
We agree that loss of castor and mecom expression does not formally demonstrate the physical absence of these cells, and that independent methods would be required to definitively confirm their loss. In response, we have revised our wording to indicate that castor- and mecom-expressing cells are very likely not being produced, rather than stating that they are absent.
Reviewer #1 (Significance (Required)):
Significance
Strengths and limitations.
The precise exploitation of the planarian system to identify potential targets, and therefore regulatory mechanisms, mediated by SoxB1 is an interesting contribution to the fi eld. We know almost nothing about the regulatory mechanisms that allow regeneration and how these might have evolved, and this work is well-executed step in that direction.
Advance
The paper makes a clear advance in our understanding of an important process in animals (neural specification) and how this happens in the context in the context during an example of animal regeneration. The methods are state-of-the-art with respect to what is possible in the planarian system.
Audience
This will be of wide interest to developmental biologists, particularly those studying regeneration in planarians and other regenerative systems,and those who study comparative neurodevelopment.
Expertise
I have expertise in functional genomics in the context of stem cells and regeneration, particularly in the planarian model system
Reviewer #2 (Evidence, reproducibility and clarity (Required)):
Review - Cathell, et al (RC-2025-03195)
Summary and Significance:
Understanding regenerative neurogenesis has been difficult due to the limited amount of neurogenesis that occurs after injury in most animal species. Planarians, with their adult neurogenesis and robust post-injury response, allow us to get a glimpse into regenerative neurogenesis. The Zayas laboratory previously revealed a key role for SoxB1-2 in maintenance and regeneration of a broad set of sensory and peripheral neurons in the planarian body. SoxB1-2 also has a role in many epidermal fates. Their previous work left open the tempting possibility that SoxB1-2 acts as a very upstream regulator of epidermal and neuronal fates, potentially acting as a pioneer transcription factor within these lineages. In the manuscript currently under review, Cathell and colleagues use ATAC-Seq and RNA-Seq to investigate chromatin changes after SoxB1-2(RNAi). With the experimental limitations in planarians, this is a strong first step toward testing their hypothesis that SoxB1-2acts as a pioneer within a set of planarian lineages. Beyond these cell types, this work is also important because planarian cell fates often rely on a suite of transcription factors, but the nature of transcription factor cooperation has been much less well understood. Indeed, the authors do show that loss of SoxB1-2 by RNAi causes changes in a number of accessible regions of the genome; many of these chromatin changes correspond to changes in gene expression of genes nearby these peaks. The authors also examine in more detail two genes that have genomic and transcriptomic changes after SoxB1-2(RNAi), mecom and castor. The authors completed RNA-Seq on mecom(RNAi) and castor(RNAi) animals, identifying genes downregulated after loss of either factor that are also seen in SoxB1-2(RNAi). The results in this paper are rigorous and very well presented. I will share two major limitations of the study and some suggestions for addressing them, but this work may also be acceptable without those changes at some journals.
Limitation 1:
The paper aims to test the hypothesis that SoxB1-2 is a pioneer transcription factor. Observation that SoxB1-2(RNAi) leads to loss of many accessible regions in the chromatin supports the hypothesis. However, an alternate possibility is that SoxB1-2 leads to transcription of another factor that is a pioneer factor or a chromatin remodeling enzyme; in either of these cases, the accessibility peak changes may not be due to SoxB1-2 directly but due to another protein that SoxB1-2 promotes. The authors describe how they can address this limitation in the future; in the meantime, is it known what the likely binding for SoxB1-2 would be (experimentally or based on homology)? If so, could the authors examine the relative abundance of SoxB1-2 binding sites in peaks that change after SoxB1-2(RNAi)? This could be compared to the abundance of the same binding sequence in non-changing peaks. Enrichment of SoxB1-2 binding sites in ATAC peaks that change after its RNAi would support the argument that chromatin changes are directly due to SoxB1-2.
We appreciate the feedback and agree that distinguishing between direct SoxB1-2 pioneer activity and indirect effects mediated through downstream regulators is an important consideration. While we did not perform a direct abundance analysis of potential chromatin-remodeling cofactors, we conducted a motif enrichment analysis following the approach of Neiro et al. (eLife, 2022), comparing control and soxB1-2(RNAi) peak sets. This analysis revealed that Sox-family motifs, particularly SoxB1-like motifs, were among the most enriched in regions that remain accessible in control animals relative to soxB1-2(RNAi) animals, consistent with a model in which SoxB1-2 directly contributes to establishing or maintaining accessibility at these loci. We have now included this analysis in the supplemental materials to further contextualize potential co-regulators and transcriptional partners within the SoxB1-2 regulatory network. We agree and acknowledge in the report that future studies assessing chromatin remodeling factor expression and abundance will be valuable to definitively separate direct and indirect pioneer activity.
Limitation 2:
The characterization of mecom and castor is somewhat preliminary relative to the deep work in the rest of the paper. I think this could be addressed with a few experiments. The authors could validate RNA-seq findings with ISH to show that cells are lost after reduction of either TF (this would support the model figure). The authors could also try to define whether loss of either TF causes behavioral phenotypes that might be similar to SoxB1-2(RNAi); this would be a second line of evidence that the TFs are downstream of key events in the SoxB1-2
pathway.
Thank you for this suggestion. We agree that additional validation of the mecom and castor RNA-seq results and further phenotypic characterization would strengthen this section. We are currently conducting in situ hybridization experiments to validate transcriptional changes in mecom and castor using the same experimental framework applied to soxB1-2 downstream candidates. We anticipate completing these studies within the next three months and will incorporate the results into future work.
Regarding behavioral phenotypes, we performed preliminary screening for robust behavioral responses, including mechanosensory responses, but did not observe overt defects. However, the lack of established, standardized behavioral assays in planarians presents a current limitation; such assays need to be developed de novo, and predicting specific behavioral phenotypes in advance remains challenging. We fully agree that functional behavioral assays represent an important next step and are actively exploring strategies to systematically develop and implement them going forward.
Other questions or comments for the authors:
Is it known how other Sox factors work as pioneer TFs? Are key binding partners known? I wondered if it would be possible to show that SoxB1-2 is co-expressed with the genes that encode these partners and/or if RNAi of these factors would phenocopy SoxB1-2. This is likely beyond the scope of this paper, but if the authors wanted to further support their argument about SoxB1-2 acting as a pioneer in planarians, this might be an additional way to do it.
In other systems, Sox pioneer factors often act together with POU family transcription factors (for example, Oct4 and Brn2) and PAX family members such as Pax6. In planarians, a POU homolog (pou-p1) is expressed in neoblasts and may represent an interesting candidate co-factor for future investigation in the context of SoxB1-2 pioneer activity. We have also previously examined the relationship between SoxB1-2 and the POU family transcription factors pou4-1 and pou4-2. Although RNAi of these factors does not fully phenocopy soxB1-2 knockdown, pou4-2(RNAi) results in loss of mechanosensation, suggesting that downstream POU factors may contribute to aspects of neural function regulated by SoxB1-2 (McCubbin et al. eLife 2025). We agree that co-expression and functional interaction studies with these candidates would be highly informative, and we view this as an exciting future direction beyond the scope of the current manuscript.
This paper is one of few to use ATAC-Seq in planarians. First, I think the authors should make a bigger deal of their generation of a dataset with this tool! Second, it would be great to know whether the ATAC-Seq data (controls and/or RNAi) will be browsable in any planarian databases or in a new website for other scientists. I believe that in addition to the data being used to test hypotheses about planarians, the data could also be a huge hypothesis generating resource in the planarian community, so I would encourage the authors to both self-promote their contribution and make plans to share it as widely and usably as possible.
Thank you very much for this encouraging feedback. We appreciate the suggestion and have strengthened the text to emphasize the significance of generating this ATAC-seq resource for the planarian field. We agree that these datasets represent a valuable community resource and are committed to making all control and soxB1-2(RNAi) ATAC-seq data publicly accessible.
Reviewer #2 (Significance (Required)):
This paper's strengths are that it addresses an important problem in regenerative biology in a rigorous manner. The writing and presentation of the data are excellent. The paper also provides excellent datasets that will be very useful to other researchers in the fi eld. Finally, the work is one of, if not the first to examine how the action of one transcription factor in planarians leads to changes in the cellular and chromatin environment that could then be acted upon by subsequent factors. This is an important contribution to the planarian fi eld, but also one that will be useful for other developmental neuroscientists and regenerative biologists.
I described a couple of limitations in the review above, but the strengths outweigh the weaknesses.
Reviewer #3 (Evidence, reproducibility and clarity (Required)):
The authors investigated the role of soxB1-2 in planarian neural and epidermal lineage specification. Using ATAC-seq and RNA-seq from head fragments after soxB1-2 RNAi, they identified regions of decreased chromatin accessibility and reduced gene expression, demonstrating that soxB1-2 induces neural and sensory programs. Integration of the datasets yielded 31 overlapping candidate targets correlating ATAC-seq and RNA-seq. Downstream analyses of transcription factors that had either/or differentially accessible regulatory region or showed differential expression (castor and mecom) implicated these transcription factors in mechanosensory and ciliary modules. The authors combined additional techniques, such as in situ hybridization to support the observations based on the ATACseq/RNAseq data. The manuscript is clearly written as well as data presentation in the main and supplementary figures. The major claim of the manuscript is that SoxB1-2 is likely a pioneer transcription factor that alters the accessibility of the chromatin, which if true, would be one of the first demonstrations of direct transcriptional regulation in planarians. As described below, I am not certain that this interpretation of the data is more valid than alternative interpretations.
Major comments
We agree that distinguishing between direct SoxB1-2 pioneer activity and indirect chromatin changes mediated by downstream factors is an important consideration. As suggested, examining the enrichment of SoxB1-2 binding motifs in regions that lose accessibility following soxB1-2(RNAi) can provide supporting evidence for direct regulation.
While we did not conduct a direct abundance analysis of all potential chromatin-remodeling cofactors, we performed a motif enrichment analysis following the methodology of Neiro et al. (eLife, 2022), comparing control-specific and soxB1-2(RNAi)-specific accessible peak sets. Consistent with a direct role for SoxB1-2 in chromatin regulation, Sox-family motifs, particularly SoxB1-like motifs, were among the most significantly enriched in regions that maintain accessibility in control animals relative to soxB1-2(RNAi) animals.
Evidence for pioneer activity. The authors correctly acknowledge that they do not present direct evidence of soxB1-2 binding or chromatin opening. However, the section title in the Discussion could be interpreted as implying otherwise. The claim of pioneer activity should remain explicitly tentative until supported (at least) by motif or binding data.
We have performed suggested motif analysis and changed the language in this section to better fit the data.
Replication and dataset comparability. Both ATAC-seq and soxB1-2 RNA-seq were performed on head fragments, but the number of replicates differ between assays (ATAC-seq n=2 per group, RNA-seq n=4-6). This is of course acceptable, but when interpreting the results, it should be taken into consideration that the statistical power is different when using data collected using different techniques and having a varied number of replicates.
Thank you for raising this important point regarding replication and comparability across datasets. We agree that the differing number of biological replicates between the ATAC-seq and RNA-seq experiments results in different statistical power across assays. We have now clarified this consideration in the manuscript text.
Minor comments
"Thousands of accessible chromatin sites". Please state the number of peaks and the thresholds for calling them. Ensure consistency between text (264 DA peaks) and Figure 1 legend (269 DA peaks).
__We have clarified specific peak numbers and will include the calling parameters in the methods section. Additionally, we will fix the discrepancies between differential peaks. __
Specify the y-axis normalization units in all coverage plots.
We have specified this across plots.
Clarify replicate numbers consistently in the text and figure legends.
We have identified and corrected discrepancies in the figure legends vs text and correct them and ensured they are included consistently across datasets.
Referees cross commenting
The reviews are highly consistent. They recognize the value of the work, and raise similar points. The main shared view is that the current data do not distinguish direct from indirect effects, and claims about pioneer activity should be softened, and further analysis of the differentially accessible peaks could strengthen the link between SoxB1-2 and the chromatin changes.
-I don't think that it's necessary to further characterize experimentally mecom or castor (as suggested), but of course that it could have value.
We thank all three reviewers for their positive assessment of the value of our work aiming to elucidate mechanisms by which SoxB1-2 programs planarian stem cells. In the revision, we have improved the presentation and carefully edited conclusions about the function of SoxB1-2. Performing motif analysis and GO annotation of upregulated genes has strengthened our observation that SoxB1-2 acts as an activator and has revealed putative binding sites.
The preliminary revision does not yet include further characterization of mecom and castor downstream genes. In response to Reviewer #2, we appreciate that additional validation of the mecom and castor RNA-seq results and further phenotypic characterization would strengthen this section. Although we are currently conducting in situ hybridization experiments to validate transcriptional changes in mecom and castor using the same experimental framework applied to soxB1-2 downstream candidates, we also reconsidered, as we did in our first revision, whether this is necessary or better suited for future investigations.
In the revision, we noted that our Discussion points were not balanced and that we emphasized the mecom and castor results in a manner that distracted from the major focus of the work, likely contributing to the impression that additional experimental evidence was required. Therefore, we have revised the section accordingly and streamlined the Discussion to avoid repetitive statements and to focus on the insights gained into the mechanism of SoxB1-2 function in planarian neurogenesis. We remain open to including these additional experiments if the reviewers or handling editors consider them essential; however, we agree that their inclusion is not absolutely necessary.
Reviewer #3 (Significance (Required)):
General assessment. The study offers valuable observations by combining chromatin and transcriptional analysis of planarian neural differentiation. The integration with in situ validation convincingly demonstrates effects on neural tissues and provides a solid resource for future functional work. However, mechanistic interpretation remains limited, partly because of technical limitations of the system. The data support an important role for soxB1-2 in neural and epidermal lineage regulation, but not direct binding or chromatin-opening activity. The authors have previously published analysis of soxB1-2 in planarians, so the addition of ATAC-seq data contributes to solving another piece of the puzzle.
__Advance. __
This is one of the first studies to couple ATAC-seq and RNA-seq in planarian tissue to dissect regulatory logic during regeneration. It identifies new candidate regulators of sensory and epidermal differentiation and identifies soxB1-2 as a likely upstream factor in ectodermal lineage networks. The work extends previous studies on soxB1-2 activity and neural cell production by integrating chromatin and transcriptional layers. In that respect the results are very solid, although the study remains correlative at the mechanistic level.
Audience.
This work will potentially interest researchers interested in regeneration and transcriptional networks. The datasets and gene lists will be valuable references for follow-up studies on planarian ectodermal lineages, and therefore will appeal to this community.
Note: This preprint has been reviewed by subject experts for Review Commons. Content has not been altered except for formatting.
Learn more at Review Commons
The authors investigated the role of soxB1-2 in planarian neural and epidermal lineage specification. Using ATAC-seq and RNA-seq from head fragments after soxB1-2 RNAi, they identified regions of decreased chromatin accessibility and reduced gene expression, demonstrating that soxB1-2 induces neural and sensory programs. Integration of the datasets yielded 31 overlapping candidate targets correlating ATAC-seq and RNA-seq. Downstream analyses of transcription factors that had either/or differentially accessible regulatory region or showed differential expression (castor and mecom) implicated these transcription factors in mechanosensory and ciliary modules. The authors combined additional techniques, such as in situ hybridization to support the observations based on the ATACseq/RNAseq data. The manuscript is clearly written as well as data presentation in the main and supplementary figures. The major claim of the manuscript is that SoxB1-2 is likely a pioneer transcription factor that alters the accessibility of the chromatin, which if true, would be one of the first demonstrations of direct transcriptional regulation in planarians. As described below, I am not certain that this interpretation of the data is more valid than alternative interpretations.
Major comments
Minor comments
"Thousands of accessible chromatin sites". Please state the number of peaks and the thresholds for calling them. Ensure consistency between text (264 DA peaks) and Figure 1 legend (269 DA peaks). Specify the y-axis normalization units in all coverage plots. Clarify replicate numbers consistently in the text and figure legends.
Referees cross commenting
The reviews are highly consistent. They recognize the value of the work, and raise similar points. The main shared view is that the current data do not distinguish direct from indirect effects, and claims about pioneer activity should be softened, and further analysis of the differentially accessible peaks could strengthen the link between SoxB1-2 and the chromatin changes.
General assessment. The study offers valuable observations by combining chromatin and transcriptional analysis of planarian neural differentiation. The integration with in situ validation convincingly demonstrates effects on neural tissues and provides a solid resource for future functional work. However, mechanistic interpretation remains limited, partly because of technical limitations of the system. The data support an important role for soxB1-2 in neural and epidermal lineage regulation, but not direct binding or chromatin-opening activity. The authors have previously published analysis of soxB1-2 in planarians, so the addition of ATAC-seq data contributes to solving another piece of the puzzle.
Advance. This is one of the first studies to couple ATAC-seq and RNA-seq in planarian tissue to dissect regulatory logic during regeneration. It identifies new candidate regulators of sensory and epidermal differentiation and identifies soxB1-2 as a likely upstream factor in ectodermal lineage networks. The work extends previous studies on soxB1-2 activity and neural cell production by integrating chromatin and transcriptional layers. In that respect the results are very solid, although the study remains correlative at the mechanistic level.
Audience. This work will potentially interest researchers interested in regeneration and transcriptional networks. The datasets and gene lists will be valuable references for follow-up studies on planarian ectodermal lineages, and therefore will appeal to this community.
Note: This preprint has been reviewed by subject experts for Review Commons. Content has not been altered except for formatting.
Learn more at Review Commons
Review - Cathell, et al (RC-2025-03195)
Summary and Significance:
Understanding regenerative neurogenesis has been difficult due to the limited amount of neurogenesis that occurs after injury in most animal species. Planarians, with their adult neurogenesis and robust post-injury response, allow us to get a glimpse into regenerative neurogenesis. The Zayas laboratory previously revealed a key role for SoxB1-2 in maintenance and regeneration of a broad set of sensory and peripheral neurons in the planarian body. SoxB1-2 also has a role in many epidermal fates. Their previous work left open the tempting possibility that SoxB1-2 acts as a very upstream regulator of epidermal and neuronal fates, potentially acting as a pioneer transcription factor within these lineages. In the manuscript currently under review, Cathell and colleagues use ATAC-Seq and RNA-Seq to investigate chromatin changes after SoxB1-2(RNAi). With the experimental limitations in planarians, this is a strong first step toward testing their hypothesis that SoxB1-2 acts as a pioneer within a set of planarian lineages. Beyond these cell types, this work is also important because planarian cell fates often rely on a suite of transcription factors, but the nature of transcription factor cooperation has been much less well understood. Indeed, the authors do show that loss of SoxB1-2 by RNAi causes changes in a number of accessible regions of the genome; many of these chromatin changes correspond to changes in gene expression of genes nearby these peaks. The authors also examine in more detail two genes that have genomic and transcriptomic changes after SoxB1-2(RNAi), mecom and castor. The authors completed RNA-Seq on mecom(RNAi) and castor(RNAi) animals, identifying genes downregulated after loss of either factor that are also seen in SoxB1-2(RNAi). The results in this paper are rigorous and very well presented. I will share two major limitations of the study and some suggestions for addressing them, but this work may also be acceptable without those changes at some journals.
Limitation 1:
The paper aims to test the hypothesis that SoxB1-2 is a pioneer transcription factor. Observation that SoxB1-2(RNAi) leads to loss of many accessible regions in the chromatin supports the hypothesis. However, an alternate possibility is that SoxB1-2 leads to transcription of another factor that is a pioneer factor or a chromatin remodeling enzyme; in either of these cases, the accessibility peak changes may not be due to SoxB1-2 directly but due to another protein that SoxB1-2 promotes. The authors describe how they can address this limitation in the future; in the meantime, is it known what the likely binding for SoxB1-2 would be (experimentally or based on homology)? If so, could the authors examine the relative abundance of SoxB1-2 binding sites in peaks that change after SoxB1-2(RNAi)? This could be compared to the abundance of the same binding sequence in non-changing peaks. Enrichment of SoxB1-2 binding sites in ATAC peaks that change after its RNAi would support the argument that chromatin changes are directly due to SoxB1-2.
Limitation 2:
The characterization of mecom and castor is somewhat preliminary relative to the deep work in the rest of the paper. I think this could be addressed with a few experiments. The authors could validate RNA-seq findings with ISH to show that cells are lost after reduction of either TF (this would support the model figure). The authors could also try to define whether loss of either TF causes behavioral phenotypes that might be similar to SoxB1-2(RNAi); this would be a second line of evidence that the TFs are downstream of key events in the SoxB1-2 pathway.
Other questions or comments for the authors:
Is it known how other Sox factors work as pioneer TFs? Are key binding partners known? I wondered if it would be possible to show that SoxB1-2 is co-expressed with the genes that encode these partners and/or if RNAi of these factors would phenocopy SoxB1-2. This is likely beyond the scope of this paper, but if the authors wanted to further support their argument about SoxB1-2 acting as a pioneer in planarians, this might be an additional way to do it. This paper is one of few to use ATAC-Seq in planarians. First, I think the authors should make a bigger deal of their generation of a dataset with this tool! Second, it would be great to know whether the ATAC-Seq data (controls and/or RNAi) will be browsable in any planarian databases or in a new website for other scientists. I believe that in addition to the data being used to test hypotheses about planarians, the data could also be a huge hypothesis generating resource in the planarian community, so I would encourage the authors to both self-promote their contribution and make plans to share it as widely and usably as possible.
This paper's strengths are that it addresses an important problem in regenerative biology in a rigorous manner. The writing and presentation of the data are excellent. The paper also provides excellent datasets that will be very useful to other researchers in the field. Finally, the work is one of, if not the first to examine how the action of one transcription factor in planarians leads to changes in the cellular and chromatin environment that could then be acted upon by subsequent factors. This is an important contribution to the planarian field, but also one that will be useful for other developmental neuroscientists and regenerative biologists.
I described a couple of limitations in the review above, but the strengths outweigh the weaknesses.
Note: This preprint has been reviewed by subject experts for Review Commons. Content has not been altered except for formatting.
Learn more at Review Commons
Summary
The authors of this interesting study take the approach of combing RNAi, RNA-seq and ATAC-seq to try to build a regulatory network surrounding the function of a planarian SoxB1 ortholog, broadly required for neural specification during planarian regeneration. They find a number of chromatin regions that differentially accessible (measured by ATAC-seq), associate these with potential genes by promity to the TSS. They then compare this set of genes with those that are differentially regulated (using RNA-seq), after SoxB1 RNAi mediated knockdown. This allows them the authors some focus on potential directly regulated targets of the planarian SoxB1. Two of these downstream targets, the mecom and castor transcription factors are then studied in greater detail.
Major Comments.
I have no suggestions for new experiments that fit sensibly with the scope of the current work. There are other analyses that could be appropriate with the ATAC-seq data, but may not make sense in the content of SoxB1 acting as pioneer factor.
I would like to see motif enrichment analysis under the set of peaks to see if SoxB1 is opening chromatin for a restricted set of other transcription factors to then bind. Much of this could be taken from Neiro et al, eLife 2022 (which also used ATAC-seq) and matched planarians TF families to likely binding motifs. This could add some breadth to the regulatory network. It could be revealing for example if downstream TF also help regulate other targets that SoxB1 makes available, this is pattern often seen for cell specification (as I am sure the authors are aware). Alternatively, it may reveal other candidate regulators. Overall peak calling consistency with ATAC-sample would be useful to report as well, to give readers an idea of noise in the data. What was the correlation between samples? While it is logical to focus on downregulated genes, it would also be interesting to look at upregulated genes in some detail. In simple terms would we expect to see the representation of an alternate set of fate decisions being made by neoblast progeny? Can the authors be explicit about whether they have evidence for co-expression of SoxB1/castor and SoxB1/mecom? I could find this clearly and it would be important to be clear whether this basic piece of evidence is in place or not at this stage.
Summary
The authors of this interesting study take the approach of combing RNAi, RNA-seq and ATAC-seq to try to build a regulatory network surrounding the function of a planarian SoxB1 ortholog, broadly required for neural specification during planarian regeneration. They find a number of chromatin regions that differentially accessible (measured by ATAC-seq), associate these with potential genes by promity to the TSS. They then compare this set of genes with those that are differentially regulated (using RNA-seq), after SoxB1 RNAi mediated knockdown. This allows them the authors some focus on potential directly regulated targets of the planarian SoxB1. Two of these downstream targets, the mecom and castor transcription factors are then studied in greater detail.
Major Comments.
N suggestions for new experiments that fit sensibly with the scope of the current work. There are other analyses that could be appropriate with the ATAC-seq data but may not make sense in the content of SoxB1 acting as pioneer factor. Overall, the study is executed very well, methods are sound, data and analysis well-presented and narrated, and the results placed in context. The experiments are clearly reproducible and can be built on, all data is accessible to others. Motif enrichment analysis under the set of peaks to see if SoxB1 is opening chromatin for a restricted set of other transcription factors to then bind. Much of this could be taken from Neiro et al, eLife 2022 (which also used ATAC-seq) and matched planarians TF families to likely binding motifs. This could add some breadth to the regulatory network. It could be revealing for example if downstream TF also help regulate other targets that SoxB1 makes available, this is pattern often seen for cell specification (as I am sure the authors are aware). Alternatively, it may reveal other candidate regulators. Overall peak calling consistency with ATAC-sample would be useful to report as well, to give readers an idea of noise in the data. What was the correlation between samples? While it is logical to focus on downregulated genes, it would also be interesting to look at upregulated genes in some detail. In simple terms would we expect to see the representation of an alternate set of fate decisions being made by neoblast progeny? Can the authors be explicit about whether they have evidence for co-expression of SoxB1/castor and SoxB1/mecom? I could find this clearly and it would be important to be clear whether this basic piece of evidence is in place, or not, at this stage.
Minor comments.
Formally loss of castor and mecom expression does mean these cells are absent, strictly the cell absence needs an independent method. It might be useful to clarify this with the evidence of be clear that cells are "very probably" not produced.
Strengths and limitations.
The precise exploitation of the planarian system to identify potential targets, and therefore regulatory mechanisms, mediated by SoxB1 is an interesting contribution to the field. We know almost nothing about the regulatory mechanisms that allow regeneration and how these might have evolved, and this work is well-executed step in that direction.
Advance
The paper makes a clear advance in our understanding of an important process in animals (neural specification) and how this happens in the context in the context during an example of animal regeneration. The methods are state-of-the-art with respect to what is possible in the planarian system.
Audience
This will be of wide interest to developmental biologists, particularly those studying regeneration in planarians and other regenerative systems, and those who study comparative neurodevelopment.
Expertise
I have expertise in functional genomics in the context of stem cells and regeneration, particularly in the planarian model system
"There are no words. It's overwhelming pride, but it's also overwhelming responsibility being the first American pope, from Chicago, and a relative," he said.
The primary sources included are family, who know Prevost personally obviously. There are many local voices, and clergy. Missing voices are critics or those raising concerns about his record, keeping the tone celebratory.
Who is Pope Leo XIV? Chicago native Robert Prevost makes history as new pope
The headline immediately points to local pride and historic significance. Frames the story as global, but more Chicago-centered. (makes sense since it's a Chicago news outlet)
But no punishment either. If I’m not the cause of your health,
150
“It was just a normal childhood,” said Prevost’s 71-year-old older brother, John. “It’s kind of strange, but all three of us knew what we wanted to do very early in life.”
Sources include family members and clergy, which humanize him. Missing voices are critics or survivors of abuse scandals, though controversy (not directly tied to him, but relates to him certainly) is mentioned later.
Overall, he's considered a centrist, but on many social issues, he's seen as progressive, embracing marginalized groups like Francis, who championed migrants and the poor. But Prevost opposes ordaining women as deacons
Frames the new pope, Prevost, as balanced but conservative in terms of doctrine. Shows us the tension between reformist and traditional elements as readers.
"My experience of Cardinal Prevost was that he's not a showboat," a seminary classmate, Father Mark R. Francis, CSV, provincial of the Viatorians in the United States, told CBS News Chicago. "He's very calm, but extremely intelligent, and extremely compassionate."
While this personal account is valuable when describing Prevost, it only shows one side of the story. There are still missing voices such as critics of him or the Catholic church, as well as survivors of the abuse scandals over the years that have been covered up in the church. The frame is narrow and focused largely on admiration and celebration of this historic event.
Chicago-born polyglot who is viewed as a churchman who transcends borders. He served for two decades in Peru, where he became a bishop and a naturalized citizen
Builds this narrative of Pope Leo not only being an American, but truly an international pope with his experience in Peru.
Peruvian President Dina Boluarte mirrored that sentiment, calling his election a “historic moment for Peru and the world,” in a Thursday address.
Sources include political leaders from Peru and other nations, as well as Vatican analysts. Missing voices are critics of the Catholic church or survivors of abuse scandals, which CNN notes but doesn’t quote directly.
Maybe they are not great institutional gestures, but are in human gestures.”
Frames him as a leader defined by personal closeness rather than bureaucracy, reinforcing a narrative of humility and accessibility.
Accusations have been made about his handling of sexual abuse cases during his time as Bishop of Chiclayo.
Highlights conflict and institutional crisis within the church. This frames him not only as a unifier but also as someone facing credibility challenges.
A former roommate of his, Reverend John Lydon, described Leo to the BBC as "outgoing", "down to earth" and "very concerned with the poor".
Personal sources humanize him, but missing voices include critics outside the Church hierarchy or lay Catholics who may disagree with his positions.
The titles are crafted to provoke a confused but intrigued response:“What does the author mean by that?” “Is there something I don’t know?”Bold claims can usually command attention
These kind of titles grab your attention for a quick glance, but usually, (personally) the interest fizzles within the first couple paragraphs
temporal “data leakage” between the multi‑year regrowth label and contemporaneous predictors;
Did it really show this? OK we can check this in the appendix -- but it might be good to present a bit more side-by-side comparison.
OK I checked the appendix and I couldn't find any mention of the temporal data leakage issue. It mentioned other issues that I interpreted as more about fitting a model on one time period and expecting it to pertain to another period, but that's not 'leakage'.
19.2.1. Surveillance Capitalism# Meta’s way of making profits fits in a category called Surveillance Capitalism [s37]. Surveillance capitalism began when internet companies started tracking user behavior data to make their sites more personally tailored to users. These companies realized that this data was something that they could profit from, so they began to collect more data than strictly necessary (“behavioral surplus”) and see what more they could predict about users. Companies could then sell this data about users directly, or (more commonly), they could keep their data hidden, but use it to sell targeted advertisements. So, for example, Meta might let an advertiser say they want an ad to only go to people likely to be pregnant. Or they might let advertizes make ads go only to “Jew Haters” [s38] (which is ethically very bad, and something Meta allowed).
I find the collection of data by Meta that is not essential to their services to be extremely problematic, as shown with the advertisements branded towards "Jew Haters." By targeting people with ads based on their beliefs, it can foster a more hateful society, especially on a social media platform which already struggles with moderation and making sure there is not too much toxicity.
So, looking back at Meta’s goal (getting the most users possible to use Meta, and only Meta for social media), let’s look at some obstacles and how Meta tries to overcome these obstacles: Obstacle: Users don’t want ads on Facebook Solution: No ads until Facebook has attracted enough users (network power) so that users won’t leave when ads are introduced (Facebook introduced ads in 2007) Obstacle: People speak different languages Solution: Increase language support of Facebook so more people can use the site Obstacle: Not everyone has the internet Solution: Give them free internet [s45], but push them to Facebook while doing so (called Free Basic [s46]) Obstacle: A competing company social media company has a user base (e.g., Instagram, Snapchat [s47]) Solution: Try to purchase the company, or copy their features
in my opinion, in order to solve these obstacles, the company need to have a lot of money. Im also curious about how the first obstacle and its solution would work because why do people not leave when the ads are introduced since they didn't want it. How do creator make users so obsessed with their website.
More users: If Meta has more users, it can offer advertisers more people to advertise to.
Reading about how Meta increases profit by getting more users, more user time, and more personal data makes me think about how invisible these incentives are in my own daily social-media habits. I notice that whenever I open Instagram “just for one minute,” the platform always manages to keep me scrolling. After learning that this isn’t accidental—but a direct way to maximize ad revenue—I feel more critical of the design decisions that shape my behavior. It makes me wonder: if a company’s fiduciary duty is to maximize profits, are they ever able to prioritize user well-being over engagement? Or is the system designed so that our attention will always be treated as the product rather than something that deserves protection?
ourth, when sufficient information to compute a standardized mean difference (SMD) was lacking and the text reported a “null,” outcomes were set to an “unspecified null” of 0.01. This imputation is transparent but ad hoc; it could bias pooled estimates upward (relative to zero) and may not reflect the true variance of those effects. The manuscript would benefit from sensitivity checks setting these to 0, excluding them, or modeling them with conservative variances.
IIRC this echoes the human evaluation (although one of the evaluators had a particular detailed suggestion for this)
Heterogeneity analyses suggest stronger effects in urban areas and in PLZs with higher employment, more children, and more Catholics, and with higher predicted giving potential. These patterns can guide targeting but also indicate that the ITT estimates average over meaningful heterogeneity.
Seems to miss the issue of MHT, and some very surprising heterogeneity suggests spurious estimates.
Also, divergence from the PAP, although I'm not sure it had access to the PAP
Data construction choices appear reasonable but introduce some judgment calls. Winsorizing PLZ-day donations at €1,000 reduces variance from heavy tails; the authors show that results are directionally robust, but precision trades off.
Good it noted the Winsorizing -- something Reiley emphasized.
The most important methodological limitations concern exposure heterogeneity and spillovers. Treatment is assigned at the PLZ level, but impressions are probabilistic and sparse (roughly one in ten Facebook users in treated PLZs received at least one impression), so the estimates are ITT and likely attenuated relative to the effect of actually seeing the ad; the TOT is not estimated. The allocation strategy partly allows Facebook to endogenously concentrate impressions, creating within-treatment variation in exposure that is not exploited for causal TOT analysis (e.g., using randomized budgets as an instrument in a dose–response framework). Spillovers across PLZs are plausible (algorithmic leakage of geotargeting and social diffusion). The authors document positive “share of treated neighbors” effects and argue the main estimates are lower bounds, but the neighbor-treatment share is not itself randomized, and spatial correlation or common shocks could inflate these coefficients; the spillover analysis should be interpreted cautiously. Robustness to spatial correlation in errors is only partly addressed by robust standard errors and randomization inference; alternative SEs (e.g., spatial HAC or clustering at larger administrative units) and placebo geographies would further strengthen inference.
At a first look (and from my memory) this seems like an extremely useful and plausible report!
Merriam-Webster. Definition of CAPITALISM. December 2023. URL
I found this definition by Merriam Webster and the first section of this chapter very interesting because they were explaining what capitalism is and the definition of capitalism. I always hear about capitalism but I have never taken the time to really research the meaning, I knew the main idea of it but I found it helpful to get very clarify and clear meaning of capitalism. It is an interesting concept that people can get screwed in and people can do extremely well in.
Game Boy. November 2023. Page Version ID: 1187494477. URL: https://en.wikipedia.org/w/index.php?title=Game_Boy&oldid=1187494477 (visited on 2023-12-10).
This is a Wikipedia page about the 1989 handheld Nintendo console the Game Boy. I’ll use this as a jumping off point to try to explain why video games, mainly in the 80’s, 90’s, and early 2000’s, was viewed primarily as a masculine or male hobby. After the 1983 video game crash, Nintendo was having a troubled time marketing and selling their home console the Nintendo Famicon to American companies and retailers. After many failed attempts to convince retkairrs to hold their product, Nintendo decided to market the famicon in the US not as a game console, but as a toy, which is what lead to the release of the Nintendo Entertainment System in the US with the zappinator and Rob the robot. But, if you know anything about toys, then you’d know that toys are one of the most gendered marketed products out their, so when Nintendo was marketing the NES as a toy to the US, they decided to market it as a “boy toy” since that was viewed as more lucrative. Even after the NES and Game Boy and as other consoles entered the scene, that original mattering for the NES lead to the general idea of gaming as a male dominated hobby.
Free market. December 2023. Page Version ID: 1189274274. URL:
When I looked at the “Free Market” source in the bibliography, what surprised me was how neutral the Wikipedia definition sounded compared to how the term is used in real debates. The page describes the free market almost like a clean, ideal system where supply and demand naturally balance. But reading it after the chapter made me notice the gap between that ideal and the way companies like Meta actually operate. In theory, free markets are supposed to create competition and benefit consumers, but in reality we often see the opposite—big platforms trying to reduce competition and lock users in. It made me wonder whether the “free market” idea still makes sense in industries where network effects basically guarantee that only one or two companies will dominate.
20.7. Bibliography# [t1] Margaret Kohn and Kavita Reddy. Colonialism. In Edward N. Zalta and Uri Nodelman, editors, The Stanford Encyclopedia of Philosophy. Metaphysics Research Lab, Stanford University, spring 2023 edition, 2023. URL: https://plato.stanford.edu/archives/spr2023/entries/colonialism/ (visited on 2023-12-10). [t2] Hernán Cortés. November 2023. Page Version ID: 1186089050. URL: https://en.wikipedia.org/w/index.php?title=Hern%C3%A1n_Cort%C3%A9s&oldid=1186089050 (visited on 2023-12-10). [t3] Francisco Pizarro. December 2023. Page Version ID: 1188948507. URL: https://en.wikipedia.org/w/index.php?title=Francisco_Pizarro&oldid=1188948507 (visited on 2023-12-10). [t4] John Smith (explorer). December 2023. Page Version ID: 1189283105. URL: https://en.wikipedia.org/w/index.php?title=John_Smith_(explorer)&oldid=1189283105 (visited on 2023-12-10). [t5] Leopold II of Belgium. December 2023. Page Version ID: 1189115939. URL: https://en.wikipedia.org/w/index.php?title=Leopold_II_of_Belgium&oldid=1189115939 (visited on 2023-12-10). [t6] White savior. November 2023. Page Version ID: 1184795435. URL: https://en.wikipedia.org/w/index.php?title=White_savior&oldid=1184795435 (visited on 2023-12-10). [t7] Mighty Whitey. URL: https://tvtropes.org/pmwiki/pmwiki.php/Main/MightyWhitey (visited on 2023-12-10). [t8] White Man's Burden. URL: https://tvtropes.org/pmwiki/pmwiki.php/Main/WhiteMansBurden (visited on 2023-12-10). [t9] Ira Madison III. 'La La Land'’s White Jazz Narrative. MTV, December 2016. URL: https://www.mtv.com/news/5qr32e/la-la-lands-white-jazz-narrative (visited on 2023-12-10). [t10] Poster:The Last Samurai. February 2015. Page Version ID: 1025393048 This image is of a poster, and the copyright for it is most likely owned by either the publisher or the creator of the work depicted. URL: https://en.wikipedia.org/w/index.php?title=File:The_Last_Samurai.jpg&oldid=1025393048 (visited on 2023-12-10). [t11] The Last Samurai. December 2023. Page Version ID: 1188563405. URL: https://en.wikipedia.org/w/index.php?title=The_Last_Samurai&oldid=1188563405 (visited on 2023-12-10). [t12] Decolonization. December 2023. Page Version ID: 1189372296. URL: https://en.wikipedia.org/w/index.php?title=Decolonization&oldid=1189372296 (visited on 2023-12-10). [t13] Postcolonialism. November 2023. Page Version ID: 1186657050. URL: https://en.wikipedia.org/w/index.php?title=Postcolonialism&oldid=1186657050 (visited on 2023-12-10). [t14] Liberation movement. October 2023. Page Version ID: 1180933418. URL: https://en.wikipedia.org/w/index.php?title=Liberation_movement&oldid=1180933418 (visited on 2023-12-10). [t15] Land Back. December 2023. Page Version ID: 1188237630. URL: https://en.wikipedia.org/w/index.php?title=Land_Back&oldid=1188237630 (visited on 2023-12-10). [t16] Mahatma Gandhi. December 2023. Page Version ID: 1189603306. URL: https://en.wikipedia.org/w/index.php?title=Mahatma_Gandhi&oldid=1189603306 (visited on 2023-12-10). [t17] Toussaint Louverture. November 2023. Page Version ID: 1187587809. URL: https://en.wikipedia.org/w/index.php?title=Toussaint_Louverture&oldid=1187587809 (visited on 2023-12-10). [t18] Patrice Lumumba. December 2023. Page Version ID: 1189622266. URL: https://en.wikipedia.org/w/index.php?title=Patrice_Lumumba&oldid=1189622266 (visited on 2023-12-10). [t19] Susan B. Anthony. December 2023. Page Version ID: 1188464282. URL: https://en.wikipedia.org/w/index.php?title=Susan_B._Anthony&oldid=1188464282 (visited on 2023-12-10). [t20] Martin Luther King Jr. December 2023. Page Version ID: 1188881438. URL: https://en.wikipedia.org/w/index.php?title=Martin_Luther_King_Jr.&oldid=1188881438 (visited on 2023-12-10). [t21] Nelson Mandela. December 2023. Page Version ID: 1188461215. URL: https://en.wikipedia.org/w/index.php?title=Nelson_Mandela&oldid=1188461215 (visited on 2023-12-10). [t22] Gayatri Chakravorty Spivak. December 2023. Page Version ID: 1189060723. URL: https://en.wikipedia.org/w/index.php?title=Gayatri_Chakravorty_Spivak&oldid=1189060723 (visited on 2023-12-10). [t23] Edward Said. November 2023. Page Version ID: 1187438394. URL: https://en.wikipedia.org/w/index.php?title=Edward_Said&oldid=1187438394 (visited on 2023-12-10). [t24] One Laptop per Child. November 2023. Page Version ID: 1187517049. URL: https://en.wikipedia.org/w/index.php?title=One_Laptop_per_Child&oldid=1187517049 (visited on 2023-12-10). [t25] Adi Robertson. OLPC’s \$100 laptop was going to change the world — then it all went wrong. The Verge, April 2018. URL: https://www.theverge.com/2018/4/16/17233946/olpcs-100-laptop-education-where-is-it-now (visited on 2023-12-10). [t26] Non-English-based programming languages. November 2023. Page Version ID: 1185172571. URL: https://en.wikipedia.org/w/index.php?title=Non-English-based_programming_languages&oldid=1185172571 (visited on 2023-12-10). [t27] Philip J. Guo. Non-Native English Speakers Learning Computer Programming: Barriers, Desires, and Design Opportunities. In Proceedings of the 2018 CHI Conference on Human Factors in Computing Systems, CHI '18, 1–14. New York, NY, USA, April 2018. Association for Computing Machinery. URL: https://doi.org/10.1145/3173574.3173970 (visited on 2023-12-12), doi:10.1145/3173574.3173970. [t28] Yuri Takhteyev. Coding Places: Software Practice in a South American City. September 2012. URL: https://mitpress.mit.edu/9780262018074/coding-places/ (visited on 2023-12-10), doi:10.7551/mitpress/9109.001.0001. [t29] David Robinson. A Tale of Two Industries: How Programming Languages Differ Between Wealthy and Developing Countries - Stack Overflow. August 2017. URL: https://stackoverflow.blog/2017/08/29/tale-two-industries-programming-languages-differ-wealthy-developing-countries/ (visited on 2023-12-10). [t30] Lua (programming language). December 2023. Page Version ID: 1189590273. URL: https://en.wikipedia.org/w/index.php?title=Lua_(programming_language)&oldid=1189590273 (visited on 2023-12-10). [t31] Lev Grossman. Exclusive: Inside Facebook’s Plan to Wire the World. Time, December 2014. URL: https://time.com/facebook-world-plan/ (visited on 2023-12-10). [t32] The Hitchhiker's Guide to the Galaxy (novel). November 2023. Page Version ID: 1184131911. URL: https://en.wikipedia.org/w/index.php?title=The_Hitchhiker%27s_Guide_to_the_Galaxy_(novel)&oldid=1184131911 (visited on 2023-12-10). [t33] Dan Milmo. Rohingya sue Facebook for £150bn over Myanmar genocide. The Guardian, December 2021. URL: https://www.theguardian.com/technology/2021/dec/06/rohingya-sue-facebook-myanmar-genocide-us-uk-legal-action-social-media-violence (visited on 2023-12-10). [t34] Craig Silverman, Craig Timberg, Jeff Kao, and Jeremy Merrill. Facebook Hosted Surge of Misinformation and Insurrection Threats in Months Leading Up to Jan. 6 Attack, Records Show. ProPublica, January 2022. URL: https://www.propublica.org/article/facebook-hosted-surge-of-misinformation-and-insurrection-threats-in-months-leading-up-to-jan-6-attack-records-show (visited on 2023-12-10). [t35] Mark Zuckerberg. Bringing the world closer together. March 2021. URL: https://www.facebook.com/notes/393134628500376/ (visited on 2023-12-10). [t36] Meta - Resources. 2022. URL: https://investor.fb.com/resources/default.aspx (visited on 2023-12-10). [t37] Olivia Solon. 'It's digital colonialism': how Facebook's free internet service has failed its users. The Guardian, July 2017. URL: https://www.theguardian.com/technology/2017/jul/27/facebook-free-basics-developing-markets (visited on 2023-12-10). [t38] Josh Constine and Kim-Mai Cutler. Why Facebook Dropped \$19B On WhatsApp: Reach Into Europe, Emerging Markets. TechCrunch, February 2014. URL: https://techcrunch.com/2014/02/19/facebook-whatsapp/ (visited on 2023-12-10). { requestKernel: true, binderOptions: { repo: "binder-examples/jupyter-stacks-datascience", ref: "master", }, codeMirrorConfig: { theme: "abcdef", mode: "python" }, kernelOptions: { name: "python3", path: "./ch20_colonialism" }, predefinedOutput: true } kernelName = 'python3'
One source that stood out to me was the StackOverflow study (t29) about how programming languages differ between wealthy and developing countries. The most interesting detail I learned from that article is that Python and R—two languages I always hear people hype up—are barely used in poorer countries. Meanwhile, older languages like PHP and Android development stay extremely common there. The study explains that it’s not because developers in those countries “prefer” outdated tech, but because the global tech industry is shaped around Silicon Valley’s needs. That really clicked for me. It shows how something as simple as a programming language choice is actually influenced by economics and access, not just technical preference. It made me rethink the whole idea that tech is some neutral, equal-opportunity field.
19.1.1. Definition of Capitalism:
After reading this part, I realized that many decisions made by social media platforms are actually determined and driven by capitalism. The platform does not make choices that harm users at will, but is driven by competition, profit, and growth pressure, even if these choices may affect the user experience.
Public Funding# In a publicly funded organization, non-profit organization, or crowd-funded project (e.g., Wikipedia [s19], NPR [s20], Kickstarter projects [s21], Patreon creators [s22], charities), the investors (or donors) are not investing in profits from the organization, but instead are investing in the product or work the organization does. Therefore the responsibility to investors is not to make profits but to do the work investors are paying for. In this model, the more money someone invests or donates, the more say they have over what the organization does (like capitalism and unlike democratic socialism). For example, when buying groceries, you might be prompted to let the grocery store take an extra $5 from you to give to a charity that gives food to the needy. Then the grocery store corporation will give $5 to the charity and look good for doing so. But the corporation also gets $5 more say in how the charity operates (and they can pressure the charity to not do anything that hurts the corporation’s profits, and thus look charitable without violating their fiduciary duty)[2].
Public funding is something that I can relate to, as my dad had invested in many Kickstarter companies and then tested their products for them. I find this a good idea, and it helps smaller companies share their ideas and products with the world, and the people who first invested in the product get it first. However, when investing in Kickstarter, you must be cautious because once you invest that money, you can either get the product back or just lose your money because the company failed.
Or as another example, if the richest man in the world offers to buy out a social media site for more than it’s worth [s14], then it is the fiduciary duty of the leaders of the social media site to accept that offer. It doesn’t matter if it is clear that this rich man doesn’t know what he is doing and is likely to destroy the social media site, and potentially cause harm to society at large; the fiduciary duty of the company leaders is to get as much money as possible to their shareholders, and they can’t beat being overpaid by the richest man in the world. Rejecting that deal would be cheating the stockholders out of money.
For awhile, I had no idea why companies would always let themselves be bought out or sold when another party is trying to buy them, because in many cases it seemed like a bad idea with worse consequences. But now I family understand the concept that companies accept because they are required to make as much money as possible for their shareholders, and not accepting an offer like that would be cheating them out of money. This puts a lot of different things about company acquisitions into perspective for me, and maybe it took me a little too long to figure this out but hey, better late than never. This whole system of shareholders required business to make the most money whenever the opportunity arises however doesn’t always seem good though.
When shareholders buy stocks in a company, they are owed a percentage of the profits. Therefore it is the company leaders’ fiduciary duty [s11] to maximize the profits of the company (called the Friedman Doctrine [s12]). If the leader of the company (the CEO) intentionally makes a decision that they know will reduce the company’s profits, then they are cheating the shareholders out of money the shareholders could have had. CEOs mistakenly do things that lose money all the time, but doing so on purpose is a violation of fiduciary duty.
When I read section 19.1.3 about fiduciary duty and the Friedman doctrine, it really makes me feel like users basically have no real power on platforms like Meta. Even if a CEO personally want to care more about user well-being or ethics, the system kind of punish them if profits go down, so they are pushed to choose shareholders first. It feels a bit scary that even “good intentions” from leaders are not enough, because the whole structure of capitalism is pushing in the opposite direction. It also makes me question if telling people “just choose better companies or better CEOs” is actually helpful, since the problem seem more like the rules of the game, not only the people playing it.
Use the site less or delete their account. Individually, this doesn’t do much, but if they do this in coordination with others (e.g., a boycott), then this can affect Meta.
I think this is the best option for users to be able to make a difference on meta's sites. Facebook and Instagram both rely on users, they would be nothing without the users using the sites and creating everything about the cites. Without users there is no content or social media site at all. If users can all vote to leave a site and do it in an organized way, that could actually hurt meta and make a difference. This would be really hard to coordinate though.
20.3. Colonialism in Programming# Colonialism shows up in programming languages as well. 20.3.1. Programming in English# Most programming languages are based in English, and there are very few non-English programming languages [t26], and those that exist are rarely used. The reason few non-English programming languages exist is due to the network effect, which we mentioned last chapter. Once English became the standard language for programming, people who learn programming learn English (or enough to program with it). Attempts to create a non-English programming language face an uphill battle, since even those that know that language would still have to re-learn all their programming terms in the non-English language. Now, since many people do speak other languages, you can often find comments, variable names, and even sometimes coding libraries which use non-English languages, but the core coding terms (e.g., for, if, etc.), are still almost always in English. See also this academic paper: Non-Native English Speakers Learning Computer Programming: Barriers, Desires, and Design Opportunities [t27] 20.3.2. Programming Adoption Through Silicon Valley# The book Coding Places: Software Practice in a South American City [t28] by Dr. Yuri Takhteyev explores how programming in Brazil differs from programming in Silicon Valley. Dr. Takhteyev points out that since tech companies are centralized in Silicon Valley, this then means Silicon Valley determines which technologies (like programming languages or coding libraries) get adopted. He then compares this to how the art world works: “If you want to show [your art] in Chicago, you must move to New York. He then rewords this for tech: if you want your software to be used widely in Brazil, you should write it in Silicon Valley. We can see this happening in a study by StackOverflow [t29]. They found that some technologies which are gaining in popularity in Silicon Valley (Python and R), are not commonly used in poorer countries, whereas programming tech that is considered outdated in Silicon Valley (android and PHP), is much more popular in poorer countries. In his book, Takhteyev tracks the history of the [Lua programming language](https://en.wikipedia.org/wiki/Lua_(programming_language) [t30]), which was invented in Brazil but became adopted in Silicon Valley. In order to gain popularity in Silicon Valley (and thus the rest of the world), the developers had to make difficult tradeoffs, no longer customizing it for the needs of their Brazilian users.
Honestly, this chapter made me realize how invisible the role of English is in programming. I always took it for granted that terms like if, while, or return were “universal,” but they’re only universal because English basically colonized the coding world. It makes me think about how much harder programming must be for people who don’t speak English well. We talk a lot in tech about making things “accessible,” but the foundation of programming itself is already biased toward one language.
The part about Silicon Valley deciding what technologies the rest of the world uses also stood out to me. It feels weird that a whole country’s developers might rely on “outdated” languages just because the global tech trends are controlled by one region. It reminds me of how fashion or music trends spread — people follow whatever the cultural “center” is doing, even if it doesn’t fit their own needs.
One question I have is: would programming look totally different today if the early pioneers weren’t mostly English-speaking? Like, if the first mainstream languages came from Brazil or Japan, would we all be learning those instead? It makes me wonder how many innovations never spread just because they weren’t born in the “right” place.
Here are no religious distinctions, all men of good character are eligible to every public office without exception, the laws are mild but rigorously executed, thefts are not so frequent as in Ireland, perhaps because the people are not so poor,
OBSERVATION: Unthank notes that any man is entitled to run for public office regardless of their background, and that theft is less frequent than in his hometown, possibly due to the lower poverty rate.
INTERPRETATION: Unthank's experience living in New York was extremely pleasant, safe, and a large step up from his life in Ireland, with less discrimination, poverty, and crime taking place.
CONTEXT: The tertiary source describes the Protestants as very well-off, especially compared to their Catholic counterparts who would migrate to the US en masse in the following decade. They are described as predominantly being educated property-owners, making their transition into becoming citizens smooth and largely free of distress. This is corroborated by Unthank's account of his experience living in a safe area of the city where crime and suffering are at a minimum.
CONTEXT: The tertiary source gives context behind Unthank's experiences as a Protestant Irish immigrant to the US. Additionally, Unthank's experience gives context behind the privilege of living in the US as an educated white male at the time and why so many Protestants were drawn there from Ireland with the promise of better living.
reaction times were slower in rainy compared to sunny conditions, indicating that adverse weather impairs processing speed but not overall recognition accuracy.
Rainy conditions caused consistent delays in processing speed, showing that weather makes the brain slower at taking in and interpreting information. Participants were 126-139 ms slower during rain, showing a meaningful cognitive delay.
Winter SAD’s onset is associated with the changing of the seasons and the cold weather, being stuck indoors, shorter days and less sunlight exposure. However, Dumler said, there is a correlation between extreme heat and agitation. People on psychiatric medications such as antidepressants or mood stabilizers, for example, may have more difficulty regulating their body’s temperature, she said.
Warm-weather SAD is less common and tends to show up as anxiety, agitation, insomnia, and weight loss, while winter SAD is more tied to fatigue, oversleeping, weight gain, low energy, and social withdrawal. Winter symptoms are driven by shorter days, cold weather, and reduced sunlight, but Dumler notes that extreme heat can increase agitation, especially for people on psychiatric medications that make temperature regulation harder.
The point is not that the booth is "accessible to thepublic" at other times, but that it is a temporarily private place whose momentary occupants'expectations of freedom from intrusion are recognized as reasonable
It is important to note this sentence that is outlined because privacy is now implied. The question in this case is complicated by the definition of when the phone booth is a public versus private space. When the space is private it ensures that a person's privacy is protected under the Fourth Amendment.
A study by Cereda et al. (38) pointed out that in winter, reduced sunlight exposure and lower vitamin D levels may induce depressive symptoms in individuals with Seasonal Affective Disorder (SAD), as well as conditions like bipolar disorder.
Vitamin D, which is mainly produced through UVB exposure from sunlight, decreases during cloudy weather and winter, and low vitamin D levels are strongly linked to depression, fatigue, negative emotions, and even greater suicide risk, while supplementation has been shown to improve mood and reduced inflammation. This shows how adequate vitamin D is essential not only for physical health but also for maintaining psychological well-being and life satisfaction.
sunshine and high temperatures not only contribute to the generation of particulate matter in the air but also facilitate the formation of ozone. In contrast, weather conditions that make people want to stay indoors (e.g., precipitation, low temperatures, and strong winds) are more conducive to fresh air and fewer pollutants in the atmosphere.
Favorable weather like sunshine, warmth, low humidity, and light winds encourage outdoor activity but also promote the formation and stagnation of pollutants, while less pleasant conditions like rain, cold, or strong winds tend to clean the air, with events like typhoons and heavy rainfall significantly improving air quality.
Ultimately the goal is to gain both the technical skills and conceptual framework to build, maintain, and share digital tools that assist us in our creative and activist practices alongside a new community of friends and future collaborators.
Too long, hard to read.
I think the main idea here is that it's not only technical, but you also get to be part of a community of like minded individuals.
What thegovernment is not permitted to do, absent a showing of necessity not made here, is to classifyevery student on the basis of race and to assign each of them to schools based on thatclassification.
By using race as a tie breaker the court is actually discriminating on the bases of race which is what makes it unconstitutional. The intentions of the court from the outside seem to have good intentions but it is actually in violation of the exact concept that they are trying to "repair".
Bader’s contribution explores the widely discussed but unresolved issue of which factors affect the occurrence of constituents within the German prefield
further reading idea
Token
Not a "container" but an object contained by containers.
stablished a climate of mutual trust. i oals. determined the teacher’s concerns and self-improvement g' i iors and products. oals into observable behavio: ean obevato hee of classroom behavior to be recorded. * selected an observation instrument and types aaa drat ato boot discussed relevant contextual features of the classroom Sl! © discu served. i ional data. © collected and—if appropriate, summarized—the observationa. & back conference. Introduction 135 In the feedback conference itself, the supervisor and teacher review the accuracy of the observational data. Next, they interpret the data, looking for significant patterns—es- pecially those involving teacher behavior and its effect on students. They also try to ex- plain the patterns, possibly invoking values, beliefs, and formal theories of human behavior. Then, the teacher and supervisor make decisions about the next step s. These may in- volve trying alternative strategies, changing curriculum objectives, treating particular stu- dents differently, or setting goals to learn new instructional skills. Also, the teacher and supervisor might see the need for more observational data of the same or different sort. In fact, the feedback conference that completes one cycle of clinical supervision often initi- ates the planning phase of the next cycle. (Although planning can be initiated, we still rec- ommend a separate planning conference, however brief, shortly before the next classroom observation.) These procedures in the feedback conference are only useful if the supervisor’s pur- pose is to help the teacher become a reflective, self-regulating individual focused on personal professional growth. Unfortunately, this is not always true of actual clinical supervision, as we find in a research study conducted by Miriam Ben-Peretz and Sarah Rumney.’ They observed feedback conferences in Israeli teacher-education programs and discovered that the conferences were in most cases very one-directional, the teacher making comments and the trainee agree- ing. The majority of remarks concerned shortcomings of the student teachers. For in- stance, the teacher would say. ‘You should have taught this in a different way,’ or ‘I do not agree with your explanation of this word, or ‘Why didn’t you follow my instructions? Ben-Peretz and Rumney concluded from these and other research findings that, “ ating teachers perceive the student teachers not as novice professionals but as ‘s whose primary duty is to listen and learn?” It is helpful to keep in mind that preservice and inservice teachers will be on their own once the prescribed period of clinical supervision has ended. Teachers might listen to, and comply with, the supervisor’s directives and recommendations, but this does not mean that they will internalize them. For this reason, we believe it is best if the supervisor and teacher get “ on the same page” in terms of collecting and interpreting observational data. cooper- tudents’ For this to happen, the supervisor must understand how the teacher makes sense of classroom phenomena; conversely, the teacher must u isor” se- making. Additionally, both must come to a shared understanding and agreement _thaf the ulti al of cli eacher generate alternative instrac- ti nd test them in action. " Reaching these shared understandings in planning and feedback conferences requires <time, However, Ben-Peretz and Rumney found that feedback conferences led by cooper? ing teachers were quite brief. Ten to twenty minutes was the typical duration. Feedbaék conferences led by university supervisors were substantially longer (thirty to forty min- utes); there was also more reciprocal communication and more generation of alternative ideas for teaching. Although Ben-Peretz and Rumney’s research was limited to Israeli
You have to have the foundation and relationship for the conference to be successful.
fluence and Impact Giving autonomy to persons and groups oo Freeing people to “do their thing Expressing own ideas and feelings as one aspect of the group data Facilitating learning Giving orders Directing subordinates’ behavior Keeping own ideas and feelings “close to the vest” Exercising authority over people and organizations Coercing when necessary Teaching, instructing, advising Evaluating others Stimulating independence in d action Delenuting: siving full responsibility Offering feedback and receiving it Encouraging and relying on self-evaluation Finding rewards in the achievements of others Being rewarded by own achievements > Pp Pp d control. NT . wee Douglas McGregor’s Human Side of eo theory X and theory Y.° They are not oppos ‘ poles views about work—including teaching and obs a ae ement and the assumptions underlying it. Ty nived from research in the social sciences. Three basic assumptions of theory X are ggests two approaches to management, oles on a continuum but two different Theory X applies to traditional s based on assumptions de- isli i id it if Th age human being has an inherent dislike of work and will avoi 4. The aver possible. e of this hu * threatened with punishment to get them to put forth adeq achievement of organizational objectives. i i ibility, e human being prefers to be directed, wishes to avoid responsibility 3. The averag i 1. has relatively little ambition, and wants security above al i e an ick” tivation fits reason- i “ d the stick” theory of mo indicates that the “carrot an oe OE te alan theory X. External rewards and punishments are mu monn ee The oer ‘quent direction and control does not recognize intrinsic ' ms Theory Y is more humanistic and is based on six assumptions: i sh. and mental effort in work is as natural as play or re 1. The expenditure of physical ly means for bringing i the on 2. External controls and the threat of punishment are not i i ise self- iectives. Human beings will exercise sof obi h they are committed. izational o t effort toward organiza s. n ‘ineotion and self-control in the service of objectives to wh Notes 121 3. Commitment to objectives is a function of the rewards associated with their achievement. 4. The average human being learns, under proper conditions, not only to accept but also to seek responsibility, 5. The capacity to exercise a relatively hi creativity in the solution of organizatio tributed in the population. 6. Under the conditions of modern industrial life, th average human being are only partially utilized. gh degree of imagination, ingenuity, and nal problems is widely, not natrowly, dis- e intellectual potentialities of the McGregor saw these assumptions leading to superior—subordinate relationships in which the subordinate would have greater influence over the activities in his or her own work and also have influence on the Superior’s actions. Through participatory manage- Inent, greater creativity and productivity are expected, and also a greater sense of personal accomplishment and satisfaction by the workers. Chris Argyris,”° Warren Bennis,2” and Rensis Likert” cite evidence that a participatory system of management can be more ef- fective than traditional management. Likert’s studies showed that high production can be achieved by people- rather than production-oriented managers. Mor cover, these high-production managers were willing to delegate; to allow subordinates to participate in decisions; to be relatively nonpunitive; and to use open, two-way communication patterns. High morale and effective planning were also characteristic of these “person-centered” managers. The results may be applied to the supervisory relationship in education as well as to industry. There have been at least two theory Z candi broached in Abraham Maslow’s Nature.” The other dealt with when they were applied to pos circles, cooperative learning, influenced by those theories. dates in more recent years. One was posthumous publication, The Farther Reaches of Human the success of ideas from the 1930s in the United States twar Japan following WWII. Innovations such as quality participatory management, and shared decision making were NOTES 1. Shwartz, T. ( 1996). What really matters: Searching for wis- 7. Hersey, P. and Blanchard, K, (1982). Management of organi- dom in America. New York: Bantam Books. zational behavior: Utilizing human resources. Englewood Cliffs, 2. Bales, R. F. (1976). Interaction process analysis: A method NJ: Prentice-Hall. Jor the study of small 8roups. Chicago: Midway Reprint, Univer- 8. Gregorc, A. F. (1986). Gregore style delineator. Gregorc sity of Chicago Press, Associates. 9. Myers-Briggs: Quenk, N. L. (2000). Essentials of Myers- Briges type indicator assessment. New York: John Wiley & Sons. 10. Keirsey, D., & Bates, M. (1978). Please understand me. Del 3, Cattell; See Hall, Lindsey, and Campbell, (1997). Theories of Personality. New York: John Wiley & Sons. 4, Murray, Rorschach: See Buros, O. (1970-1975). Personality tests and reviews (Vol. 1 & 2). Highland Park, NI: Gryphon Mar, CA: Prometheus Nemesis Book Company. Press, : 11. Keirsey, D. (1998). Please understand me TT; Temperament, 5. Amidon, E., & Flanders, N. (1967), Interaction analysis asa character, intelligence. Loughton, UK: Prometheus Books. feedba¢k system. In Interaction Analysis: Theory, Research, and Applica’ ; ‘ 12. Goldberg, L. R. http://www.ori.org/scientists/goldberg. htm! ton (pp. 122-124). Reading, MA: Addison-Wesley. 6.8 . ; 13. Spaulding, R. I. (1967). A coping analysis schedule for edu- o lumberg, A, (1974). Supervisors and teachers: A Private cational settings (CASES). In A. Simon & EG. Boyer (Eds.), ‘var Berkeley, CA: McCutchan, 1974. Mirrors for behavior. Philadelphia: Research for Better Schools.
I agree that most teachers need influence and impact, NOT power and control from their leadership!
114 Chapter6 Styles of Interperson al Communication in Clinical Supervision idea to a different situation 18 but one example; pointing to a logical consequence 1S at other. ¥ araphrasing can be OV erdone if to 0 many responses are similar, or if they are inap ee ing 60 miles an hour,” her says, “The car was going . : ed. For example, if a teac . . m obile was ED atta much to respond, “What you are saying 1S a rat to communi- : vel a mile a minute.” An effective paraphrase must bea.g eer: idea shows cate that we understand what the other person 1s a 7 sane Of course, it can be pur- cee ood is pursuing the thougnt. . er heard, understood, and is pu x’s. Generally, ea ar it ceases to be the teacher's idea and becomes the observe sue wev Vv. y y i is rewarding. however, having a person ou respect use your idea is re zg 3 NS COMMUNICATION TECHNIQUE 3: ASK CLARIFYING QUESTIO ify the observer’s understanding , ften need to be probed to clarify ot The Fea teacher vink carefully about inferences and decisions. “Tell me what you eacher to th s nk. 0 1 nat oF “Can you say a little more about that?” are examples. So is mean by idence that... .” | waist Ae © maunoes if we do not clarify, miscommunication 1s ne result woroceeds z someone will say, “You're absolutely right! Moreover ao oh cv Pet SO eel i ht you said. ; t opposite of what you thoug, aid on Oe anal st teay of a case of not listening at all, but a clarifying question avoids u stra’ . : ; . \ understandings. ; . wees stions took place in a high schoo Anexample of paraphrasing and asking clarifying que o fill out anonymously. here the principal gave the faculty an administrator appraisal stactlty meeting, “What you ‘After analyzing the compiled responses, the principal said 5 & would like.” Several aeeatobe ling me in this survey is that I'm not as accessible as you we id look like?” an id almost in unison, “Could you tell us what "being eS a ome ‘drop-in’ we which the ptincipal replied: “Well, I'd keep my door open me = oan ewer it briefly ae And if you stopped me in the hall and asked a question, I'd try cnats. . tone 3? a way to a meeting. ; ant ane and Clarified his iatentions in public, he was destined to become i nced an a Mi sev eesible” in the next few months. Of course he had some help from wags “ T. ing, “ ible?” t resist asking, “Are you feeling accessi station fe veal veints ca be made with this example: (1) the ee pears oft into lech and-blood behavior; (2) the clarifying question checked the per
this is important with the work I often do with teachers who speak english as a second language. We have to clarify and not make assumptions of understanding.
OMMUNICATION TECHNIQUE 1: LISTEN MORE, TALK LESS Many observers domi and objectives Saualnate oe conversation. The teacher has little chance to identify goal Teachers talk to stile . interpret information, or reach decisions about future acti ns. suspect) observers talk in os avenge) about two-thirds of the time they teach and (we about the same proporti ° € but too many obs proportion to teachers. The i i ervers do most of the talki is di : exact ratio varies . : ng. It is difficult , cerns in a co: A to attend to a t , nference or encourage a teacher’s plans for improvement when the obs ver observer g COMMUNICATION TECHNIQUE 2: ACKN AND USE WHAT THE TEACHER IS ave benABHBASES teacher’s conversation indi y w indicate that they are listeni ° ¢ listening. Accurate paraphrases al at "Using the each, p ‘0 sho that hey understand the teacher. Using the teacher’s ideas can be even more conv ncing than merel y i i y acknowledging (hearing) or par. aphrasing (compr ehending) them. Appl ing A 4 ALAS . ‘an
Listen more, Talk less!!!! THIS! Stop talking so much. I remind teachers of this with their students and I think it is a great reminder for us as mentors.
video recording multiple days of the intern’s teaching * posting and sharing the recorded lessons with the intern for his/ her review * having the intern’s students complete the YouthTruth survey, an instrument designed to assess student perceptions of their aetegirat reed Teach classroom experiences!s next steps cycle * areflection created by the intern of his/her te
I love using video but so many people stuggle with this tool. Finding ways to make it fun is important and such a valuable tool
Michael Pollan observes, “Americans today are having a national conversation about food and agriculture that would have been impossible to imagine even a few short years ago” (29). Pollan continues, “But the national conversation unfolding around the subject of food and farming really began in the 1970s” (29). He then specifies, “I would argue that the conversation got under way in earnest in 1971, when [Wendell] Berry published an article in The Last Whole Earth Catalogue” (29).
after each signal phase you have to provide less and less information about the author/writer.
Note: This response was posted by the corresponding author to Review Commons. The content has not been altered except for formatting.
Learn more at Review Commons
Reviewer #1 (Evidence, reproducibility and clarity (Required)):
In this manuscript, the authors employed fast MAS NMR spectroscopy to investigate the gel aggregation of longer repeat (48×) RNAs, revealing inherent folding structures and interactions (i.e., G-quadruplex and duplex). The dynamic structure of the RNA gel was not resolved at high resolution, and only the structural features-namely, the coexistence of G-quadruplexes and duplexes-were inferred. The 1D and 2D NMR spectra were not assigned to specific atomic positions within the RNA, which makes it difficult to perform molecular dynamics (MD) modeling to elucidate the dynamic nature of the RNA gel. The following comments are provided for the authors' consideration:
Reviewer #1, Comment 1:
Figure 2E and Figure 3A: The data suggest that Ca²⁺ promotes stronger G-quadruplex formation within the RNA gel compared with Mg²⁺. This observation is somewhat puzzling, as Mg²⁺ is generally known to stabilize G-quadruplex structures. The authors should clarify this discrepancy.
__Response: __Mg2+ is also a stabilizer of double-stranded RNA. In most cases, Mg²⁺ stabilizes RNA duplexes more significantly than it stabilizes G-quadruplexes. When Mg2+ is removed and replaced for Ca2+, RNA duplex is destabilized more than G4 structures. We have added a clarification regarding that to the Conclusions section.
Reviewer #1, Comment 2:
Figures 2 and 3: The authors use the chemical shift at δN 144.1 ppm to distinguish between G-quadruplex and duplex structures. How was the reliability of this assignment evaluated? Chemical shifts of RNA atoms can be influenced by various factors such as intermolecular interactions, conformational stress, and local chemical environment, not only by higher-order structures. This point should be substantiated by citing relevant references or by analyzing additional RNA structures exhibiting δN 144.1 ppm signals using NMR spectroscopy.
Response: The assignment was made by comparing the chemical shifts with published data and by comparing the obtained spectra with existing datasets in the lab. We have added an explanation to the Results section and cited the literature. The 144.1 ppm was an illustrative value selected for guiding the discussion and we noted that it could sound too specific. We modified Figure 2 to outline the regions of chemical shifts in accordance with our interpretation of spectra.
Reviewer #1, Comment 3:
The authors state that "Our findings demonstrate that fast MAS NMR spectroscopy enables atomic-resolution monitoring of structural changes in GGGGCC repeat RNA of physiological lengths." This claim appears overstated, as no molecular model was constructed to define atomic coordinates based on NMR restraints.
Response: We agree and we have rewritten the conclusions to be more precise in wording. The new text does not mention “atomic-resolution” anymore.
Reviewer #1, Comment 4: Figure 3B: The experiment using nuclear extracts supplemented with Mg²⁺ to study RNA aggregation via 2D NMR may not accurately reflect intracellular conditions. It would be informative to perform a parallel experiment using nuclear extracts without additional Mg²⁺ to better simulate the native environment for RNA folding.
__Response: __We agree that we have not yet approached physiological conditions and that it would be interesting to obtain data for conditions at physiological Mg2+ concentrations in the range between 0.5 mM – 1 mM. The buffer of purchased nuclear extracts does not contain MgCl2, so some MgCl2 would still need to be added. In our opinion, nuclear extracts are actually not the optimal way to move forward, since they still differ from real in cell environment with the caveat that their composition is not well controlled. Full reconstitution with recombinant proteins might be a better approach because stoichiometry can be better regulated.
__Reviewer #1 (Significance (Required)): __ In this manuscript, the authors employed fast MAS NMR spectroscopy to investigate the gel aggregation of longer repeat (48×) RNAs, revealing inherent folding structures and interactions (i.e., G-quadruplex and duplex). The dynamic structure of the RNA gel was not resolved at high resolution, and only the structural features-namely, the coexistence of G-quadruplexes and duplexes-were inferred. The 1D and 2D NMR spectra were not assigned to specific atomic positions within the RNA, which makes it difficult to perform molecular dynamics (MD) modeling to elucidate the dynamic nature of the RNA gel.
Response: We agree that constraints for molecular dynamics cannot be derived from these data. The focus of this work is methodological: to demonstrate how 1H-15N 2D correlation spectra can be used to characterize G-G pairing in RNA gels directly. Such spectra could be used to study effects of small molecules or interacting proteins for example.
__Reviewer #2 (Evidence, reproducibility and clarity (Required)): __ The manuscript by Kragelj et al. has the potential to become a valuable study demonstrating the role and power of modern solid-state NMR spectroscopy in investigating molecular assemblies that are otherwise inaccessible to other structural biology techniques. However, due to poor experimental execution and incomplete data interpretation, the manuscript requires substantial revision before it can be considered for publication in any journal.
__Reviewer #2, Major Concern __Inspection of the analytical gels of the transcribed RNA clearly shows that the desired RNA product constitutes only about 10% of the total crude transcript. The RNA must therefore be purified, for example by preparative PAGE, before performing any NMR or other biophysical studies. As it stands, all spectra shown in the figures represent a combined signal of all products in the crude mixture rather than the intended 48 repeat RNA. Consequently, all analyses and conclusions currently refer to a heterogeneous mixture of transcripts rather than the specific target RNA.
Response: The estimate of 10% 48xG4C2 on the gel is an overstatement. While multiple bands are visible, they correspond to dimers or multimers of the 48xG4C2 RNA. Transcripts that are longer than 48xG4C2 cannot occur in our transcription conditions. Bands at lower masses than expected are folded RNA. The high repeat length and the presence of Mg²⁺ during transcription promote multimerization, which is not fully reversed by denaturation in urea. If shorter transcripts had arisen from early termination they would be still substantially longer than 24 repeats based of what is visible on the gel and would thus remain within the pathological length range. Therefore, the observed NMR spectra primarily report on 48 repeat lengths.
__Reviewer #2, Specific Comments 1: __The statements: "We show that a technique called NMR spectroscopy under fast Magic Angle Spinning (fast MAS NMR) can be used to obtain structural information on GGGGCC repeat RNAs of physiological lengths. Fast MAS NMR can be used to obtain structural information on biomolecules regardless of their size." on page 1 are not entirely correct. Firstly, not only fast MAS NMR but MAS NMR in general can provide structural information on biomolecules regardless of their size. Fast MAS primarily allows for ¹H-detected experiments, improves spectral resolution, and reduces the required sample amount. Conventional ¹³C-detected solid-state MAS NMR can provide very similar structural information. A more thorough review of relevant literature could help address this issue.
Response: We have clarified the distinction between MAS NMR and Fast MAS NMR in the introduction.
__Reviewer #2, Specific Comments 2: __Secondly, MAS NMR has already been applied to systems of comparable complexity - for instance, the (CUG)₉₇ repeat studied by the Goerlach group as early as 2005. That work provided a comprehensive structural characterization of a similar molecular assembly. The authors are strongly encouraged to cite these studies (e.g., Riedel et al., J. Biomol. NMR, 2005; Riedel et al., Angew. Chem., 2006).
Response: We added a mention of that study in the introduction.
Reviewer #2, Experimental Description 1: The experimental details are poorly documented and need to be described in sufficient detail for reproducibility. Specifically: 1. What was the transcription scale? What was the yield (e.g., xx mg RNA per 1 mL transcription reaction)?
Response: Between 3.5 mg and 4.5 mg per 10 ml transcription reaction. We’ve added this information to the methods.
Reviewer #2, Experimental Description 2: 2. Why was the transcription product not purified? Dialysis only removes small molecules, while all macromolecular impurities above the cutoff remain. What was the dialysis cutoff used?
Response: RNA was purified using dialysis and phenol-chloroform precipitation. We have added the information about molecular weight cutoff for dialysis membranes to the methods.
Reviewer #2, Experimental Description 3: 3. How much RNA was used for each precipitation experiment? Were the amounts normalized? For example, if 10 mg of pellet were obtained, what fraction of that mass corresponded to RNA? Was this ratio consistent across all samples?
Response: In the test gel formations, we used 180.0 µg per condition. We used 108.0 µg of RNA for gelation test in the presence of nuclear extracts. We have not determined the water content in the gels. We added this information to methods and results section.
Reviewer #2, Experimental Description 4: 4. Why is there a smaller amount of precipitate when nuclear extract (NE) or CaCl₂ is added?
Response: The apparent difference in pellet size may reflect variations in water content rather than RNA quantity. While the Figure 1 might entice to directly compare pellet weights across different ion series tests, our primary goal was to determine the minimal divalent-ion concentrations required to reproducibly obtain gels. We have added a clarification in the Results section and in the Figure 1 caption regarding the comparability of conditions
Reviewer #2, Experimental Description 5: 5. The authors should describe NE addition in more detail: What is the composition of NE? What buffer was used (particularly Mg²⁺ and salt concentrations)? Was a control performed with NE buffer-type alone (without NE)?
Response: We have added the full description of NE buffer to the methods section. Its composition is: 40 mM Tris pH 8.0, 100 mM KCl, 0.2 mM EDTA, 0.5 mM PMSF, 0.5 mM DTT, 25 % glycerol. After mixing the nuclear extract with RNA, the target buffer was: 20 mM Tris pH 8.0, 90 mM KCl, 0.1 mM EDTA, 0.25 mM PMSF, 0.75 mM DTT, 12.5% glycerol, and 10 mM MgCl2.
We have not performed a control with NE buffer-type alone but we confirmed separately that glycerol does not affect gel formation.
Reviewer #2, Experimental Description 6: 6. How much pellet/RNA material was actually packed into each MAS rotor?
Response: Starting with a 5 mg pellet, we packed a rotor with a volume of 3 µl. We added this information to the methods section.
Reviewer #2, Additional Clarifications: P5. What is meant by "selective" in the phrase "We recorded a selective 1D-¹H MAS NMR spectrum of 48×G₄C₂ RNA gels"?
Response: That was a typo. We meant imino-selective. It is now corrected.
__Reviewer #2, Additional Clarifications: __ There are also several contradictions between statements in the text and the corresponding figures. For example: • Page 4: The authors write that "The addition of at least 5 mM Mg²⁺ was required for significant 48×G₄C₂ aggregation." However, Figure 1E shows significant aggregation already at 3 mM MgCl₂ (NE−), and in samples containing NE, aggregation appears even at 1 mM MgCl₂. Was aggregation already present in the sample containing NE but without any added MgCl₂?
Response: We changed text in the results section to more closely align with what’s depicted on the figure. There was some aggregation present in the nuclear extracts but it was of different quantity and quality. We clarified this in the results section.
__Reviewer #2 (Significance (Required)): __ The manuscript by Kragelj et al. has the potential to become a valuable study demonstrating the role and power of modern solid-state NMR spectroscopy in investigating molecular assemblies that are otherwise inaccessible to other structural biology techniques.
In its current form, tthe manuscript has significant experimental concerns - particularly the lack of RNA purification and inadequate description of materials and methods. The data therefore cannot support the conclusions presented. I recommend extensive revision and repetition of the experiments using purified RNA material before further consideration for publication.
__Response: __We’ve addressed the concerns about RNA purification within the response to the first comment (Major concern).
__Reviewer #3 (Evidence, reproducibility and clarity (Required)): __ This is an interesting manuscript reporting evidence for formation of both hairpins and G-quadruplexes within RNA aggregates formed by ALS expansion repeats (GGGGCC)n. This is in line with literature but never directly confirmed. Given the novelty of the method (NMR magic angle) and of the data (NMR on aggregate), I believe this manuscript should be considered for publication. I also trust the methods are appropriately reported and reproducible.
Below are my main points:
Major points:
__Reviewer #3, Comment 1: __ 1) RNA aggregation of the GGGGCCn repeat has been reported for expansion as short as 6-8 repeats (see Raguseo et al. Nat Commun 2023), so the authors might not see aggregation under the conditions they use for these shorter repeats but this can happen under physiological conditions . The ionic strengths and the conditions used can vary heavily the phase diagram and the authors therefore should tone down significantly their conclusions. They characterise one aggregate that is likely to contain both secondary structures under the conditions used (in terms of ion and pHs). However, it has been shown in Raguseo et al that aggregates can arise by both intermolecular G4s and hairpins (or a mixture of them) depending on the ionic conditions used. This means that what the authors report might not be necessarily relevant in cells, which should be caveated in the manuscript.
__Response: __We toned down our statements regarding aggregation of shorter repeats in the introduction. We added the citation to Raguseo et al. Nat Commun 2023, which indeed provides useful insights about aggregation of GGGGCC repeats. In Supplementary Figure 1, we had data on gel formation with 8x and 24x repeats which showed these repeat lengths form gels to some extent. We oversimplified our conclusion and said there were no aggregates which needs correction, especially considering other studies reported in the literature have observed in vitro aggregation of these repeat lengths. We modified the results section to reflect this nuance.
__Reviewer #3, Comment 2: __ 2) It would be important to perform perturbation experiments that might promote/disrupt formation of the G4 or hairpin and see if this affect RNA aggregation, which has been already reported by Raguseo et al, and wether this can be appreciated spectroscopically in their assay. This can be done by taking advantage of some of the experiments reported in the manuscript mentioned above, such as: PDS treatment (favouring monomolecular G4s and preventing aggregation), Li vs K treatment (favouring hairpin over G4s), NMM photo-oxidation (disassembling G4s) or addition of ALS relevant RNA binding proteins (i.e. TDP-43). Not all of these controls need to be performed but it would be good to reconcile how the fraction of G4 vs hairpin reflect aggregates' properties, since the authors offer such a nice technique to measure this.
Response: We appreciate the reviewer’s suggestions and we would be eager to do the perturbation experiments in the future. However, these experiments would require additional optimization and waiting for approval and availability of measurement time on a high-field NMR spectrometer. Given that the primary goal of this manuscript is reporting on the methodological approach, we think the current data adequately demonstrate the technique’s utility.
__Reviewer #3, Comment 3: __ 3) I disagree with the speculation of the monomolecular G4 being formed within the condensates, as the authors have no evidence to support this. It has been shown that n=8 repeat forms multimolecular G4s that are responsible of aggregation, so the authors need to provide direct evidence to support this hypothesis if they want to keep it in the manuscript, as it would clash with previous reports (Raguseo et al Nat Commun 2023)
Response: We agree that multimolecular G4s contribute to aggregation in our 48xG4C2 gels. We also realized, after reading this comment, that the original presentation of data and schematics may have unintentionally suggested the presence of monomolecular G4 in our RNA gels. To address this, we have added a clarification to the results section, we modified Figure 2 and 3, and we included a new Supplementary Figure 4. For clarification, both multimolecular and monomolecular G4s in model oligonucleotides produce imino 1H and 15N chemical shifts in the same region and cannot be distinguished by the experiments used in our study. Based on the observations reported in the literature, we believe that G4s in 48xG4C2 form primarily intermolecularly, although direct experimental proof is not available with the present data.
Minor points:
__Reviewer #3, Comment 4: __ 4) An obvious omission in the literature is Raguseo et al Nat Commun 2023, extensively mentioned above. Given the relevance of the findings reported in this manuscript for this study, this should be appropriately referenced for clarity.
Response: We’ve added the citation to Raguseo et al Nat Commun 2023 to the introduction where in vitro aggregation is discussed.
__Reviewer #3, Comment 5: __ 5) The schematic in Figure 3 is somehow confusing and the structures reported and how they relate to aggregate formation is not clear. Given that in structural studies presentation and appearance is everything, I would strongly recommend to the authors to improve the clarity of the schematic for the benefit of the readers.
Response: We thank you for your comment. We’ve modified the figure, and we hope it is now clearer.
Providing that the authors can address the criticisms raised, I would be supportive of publication of this fine study.
Reviewer #3 (Significance (Required)):
The main strength of this paper is to provide direct evidence of DNA secondary structure formation within aggregates, which is something that has not been done before. This is important as it reconcile with the relevance of hairpin formation for the disease (reported by Disney and co-workers) and the relevance of G4-formation in the process of aggregation through multimolecular G4-formation (reported by Di Antonio and co-workers). Given the significance of the findings in this context and the novelty of the method applied to the study of RNA aggregation, this reviewer is supportive for publication of this manuscript and of its relevance to the field. I would be, however, more careful in the conclusions reported and would add additional controls to strengthen the conclusions.
Response: We thank the reviewer for the comment. In the conclusion section, we have added a statement highlighting the potential roles of both double-stranded and G4 structures in gel formation, in line with what has been reported in previous studies.
Note: This preprint has been reviewed by subject experts for Review Commons. Content has not been altered except for formatting.
Learn more at Review Commons
This is an interesting manuscript reporting evidence for formation of both hairpins and G-quadruplexes within RNA aggregates formed by ALS expansion repeats (GGGGCC)n. This is in line with literature but never directly confirmed. Given the novelty of the method (NMR magic angle) and of the data (NMR on aggregate), I believe this manuscript should be considered for publication. I also trust the methods are appropriately reported and reproducible.
Below are my main points:
Major points:
1) RNA aggregation of the GGGGCCn repeat has been reported for expansion as short as 6-8 repeats (see Raguseo et al. Nat Commun 2023), so the authors might not see aggregation under the conditions they use for these shorter repeats but this can happen under physiological conditions . The ionic strengths and the conditions used can vary heavily the phase diagram and the authors therefore should tone down significantly their conclusions. They characterise one aggregate that is likely to contain both secondary structures under the conditions used (in terms of ion and pHs). However, it has been shown in Raguseo et al that aggregates can arise by both intermolecular G4s and hairpins (or a mixture of them) depending on the ionic conditions used. This means that what the authors report might not be necessarily relevant in cells, which should be caveated in the manuscript.
2) It would be important to perform perturbation experiments that might promote/disrupt formation of the G4 or hairpin and see if this affect RNA aggregation, which has been already reported by Raguseo et al, and wether this can be appreciated spectroscopically in their assay. This can be done by taking advantage of some of the experiments reported in the manuscript mentioned above, such as: PDS treatment (favouring monomolecular G4s and preventing aggregation), Li vs K treatment (favouring hairpin over G4s), NMM photo-oxidation (disassembling G4s) or addition of ALS relevant RNA binding proteins (i.e. TDP-43). Not all of these controls need to be performed but it would be good to reconcile how the fraction of G4 vs hairpin reflect aggregates' properties, since the authors offer such a nice technique to measure this.
3) I disagree with the speculation of the monomolecular G4 being formed within the condensates, as the authors have no evidence to support this. It has been shown that n=8 repeat forms multimolecular G4s that are responsible of aggregation, so the authors need to provide direct evidence to support this hypothesis if they want to keep it in the manuscript, as it would clash with previous reports (Raguseo et al Nat Commun 2023)
Minor points:
4) An obvious omission in the literature is Raguseo et al Nat Commun 2023, extensively mentioned above. Given the relevance of the findings reported in this manuscript for this study, this should be appropriately referenced for clarity.
5) The schematic in Figure 3 is somehow confusing and the structures reported and how they relate to aggregate formation is not clear. Given that in structural studies presentation and appearance is everything, I would strongly recommend to the authors to improve the clarity of the schematic for the benefit of the readers.
Providing that the authors can address the criticisms raised, I would be supportive of publication of this fine study.
The main strength of this paper is to provide direct evidence of DNA secondary structure formation within aggregates, which is something that has not been done before. This is important as it reconcile with the relevance of hairpin formation for the disease (reported by Disney and co-workers) and the relevance of G4-formation in the process of aggregation through multimolecular G4-formation (reported by Di Antonio and co-workers). Given the significance of the findings in this context and the novelty of the method applied to the study of RNA aggregation, this reviewer is supportive for publication of this manuscript and of its relevance to the field. I would be, however, more careful in the conclusions reported and would add additional controls to strengthen the conclusions.
Note: This preprint has been reviewed by subject experts for Review Commons. Content has not been altered except for formatting.
Learn more at Review Commons
The manuscript by Kragelj et al. has the potential to become a valuable study demonstrating the role and power of modern solid-state NMR spectroscopy in investigating molecular assemblies that are otherwise inaccessible to other structural biology techniques. However, due to poor experimental execution and incomplete data interpretation, the manuscript requires substantial revision before it can be considered for publication in any journal.
Major Concern
Inspection of the analytical gels of the transcribed RNA clearly shows that the desired RNA product constitutes only about 10% of the total crude transcript. The RNA must therefore be purified, for example by preparative PAGE, before performing any NMR or other biophysical studies. As it stands, all spectra shown in the figures represent a combined signal of all products in the crude mixture rather than the intended 48× repeat RNA. Consequently, all analyses and conclusions currently refer to a heterogeneous mixture of transcripts rather than the specific target RNA.
Specific Comments
The statements: "We show that a technique called NMR spectroscopy under fast Magic Angle Spinning (fast MAS NMR) can be used to obtain structural information on GGGGCC repeat RNAs of physiological lengths. Fast MAS NMR can be used to obtain structural information on biomolecules regardless of their size." on page 1 are not entirely correct. Firstly, not only fast MAS NMR but MAS NMR in general can provide structural information on biomolecules regardless of their size. Fast MAS primarily allows for ¹H-detected experiments, improves spectral resolution, and reduces the required sample amount. Conventional ¹³C-detected solid-state MAS NMR can provide very similar structural information. A more thorough review of relevant literature could help address this issue. Secondly, MAS NMR has already been applied to systems of comparable complexity - for instance, the (CUG)₉₇ repeat studied by the Goerlach group as early as 2005. That work provided a comprehensive structural characterization of a similar molecular assembly. The authors are strongly encouraged to cite these studies (e.g., Riedel et al., J. Biomol. NMR, 2005; Riedel et al., Angew. Chem., 2006).
Experimental Description
The experimental details are poorly documented and need to be described in sufficient detail for reproducibility. Specifically:
How much pellet/RNA material was actually packed into each MAS rotor? Additional Clarifications P5. What is meant by "selective" in the phrase "We recorded a selective 1D-¹H MAS NMR spectrum of 48×G₄C₂ RNA gels"? There are also several contradictions between statements in the text and the corresponding figures. For example:
Page 4: The authors write that "The addition of at least 5 mM Mg²⁺ was required for significant 48×G₄C₂ aggregation." However, Figure 1E shows significant aggregation already at 3 mM MgCl₂ (NE−), and in samples containing NE, aggregation appears even at 1 mM MgCl₂. Was aggregation already present in the sample containing NE but without any added MgCl₂?
The manuscript by Kragelj et al. has the potential to become a valuable study demonstrating the role and power of modern solid-state NMR spectroscopy in investigating molecular assemblies that are otherwise inaccessible to other structural biology techniques.
In its current form, tthe manuscript has significant experimental concerns - particularly the lack of RNA purification and inadequate description of materials and methods. The data therefore cannot support the conclusions presented. I recommend extensive revision and repetition of the experiments using purified RNA material before further consideration for publication.
can reuse an execution plan when executing the same statement multiple times. It saves effort in rebuilding the execution plan but works only if the SQL statement is exactly the same.
Bind parameters allow for different values while still showing as the same statement.
Writing a good CLAUDE.md
neither be bored nor overwhelmed
For a long time! But they do need to be bored and overhwelmed at certain times, to expand their autonomy space, to make them reflect, to make them fail. Learning should not be linear.
Reviewer #1 (Public review):
The paper by Chen et al describes the role of neuronal themo-TRPV3 channels in the firing of cortical neurons at fever temperature range. The authors began by demonstrating that exposure to infrared light increasing ambient temperature causes body temperature rise to fever level above 38{degree sign}C. Subsequently, they showed that at the fever temperature of 39{degree sign}C, the increased spike threshold (ST) increased in both populations (P12-14 and P7-8) of cortical excitatory pyramidal neurons (PNs). However, the spike number only decreased in P7-8 PNs, while it remained stable in P12-14 PNs at 39{degree sign}C. In addition, the fever temperature also reduced the late peak postsynaptic potential (PSP) in P12-14 PNs. The authors further characterized the firing properties of cortical P12-14 PNs, identifying two types: STAY PNs that retained spiking at 30{degree sign}C, 36{degree sign}C and 39{degree sign}C, and STOP PNs that stopped spiking upon temperature change. They further extended their and analysis and characterization to striatal medium spiny neurons (MSNs) and found that STAY MSNs and PNs shared same ST temperature sensitivity. Using small molecule tools, they further identified that themo-TRPV3 currents in cortical PNs increased in response to temperature elevation, but not TRPV4 currents. The authors concluded that during fever, neuronal firing stability is largely maintained by sensory STAY PNs and MSNs that express functional TRPV3 channels. Overall, this study is well designed and executed with substantial controls, some interesting findings and quality of data.
Comments on revisions:
My previous concerns have been addressed in this revised manuscript.
Reviewer #2 (Public review):
Summary:
The authors studied the excitability of layer 2/3 pyramidal neurons in response to layer four stimulation at temperatures ranging from 30 to 39{degree sign}C in P7-8, P12-P14, and P22-P24 animals. They also measure brain temperature and spiking in vivo in response to externally applied heat. Some pyramidal neurons continue to fire action potentials in response to stimulation at 39{degree sign}C and are referred to as "stay neurons." Stay neurons have unique properties, aided by the expression of the TRPV3 channel.
Strengths:
The authors focused on layer 2/3 neuronal excitability at three developmental stages: during the window of susceptibility to febrile seizures, before the window opens, and after it closes.
Electrophysiological experiments are rigorously performed and carefully interpreted.
The cellular electrophysiology is further confirmed. The authors compared the seizure susceptibility of TRPV3 knockout, heterozygous, and wild-type mice. EEG recording would have strengthened the study, but they are challenging in this age group.
Finally, the authors studied TRPV3 expression with immunohistochemistry.
Author response:
The following is the authors’ response to the original reviews
Public Reviews:
Reviewer #1 (Public review):
The paper by Chen et al describes the role of neuronal themo-TRPV3 channels in the firing of cortical neurons at a fever temperature range. The authors began by demonstrating that exposure to infrared light increasing ambient temperature causes body temperature to rise to a fever level above 38{degree sign}C. Subsequently, they showed that at the fever temperature of 39{degree sign}C, the spike threshold (ST) increased in both populations (P12-14 and P7-8) of cortical excitatory pyramidal neurons (PNs). However, the spike number only decreased in P7-8 PNs, while it remained stable in P12-14 PNs at 39 degrees centigrade. In addition, the fever temperature also reduced the late peak postsynaptic potential (PSP) in P12-14 PNs. The authors further characterized the firing properties of cortical P12-14 PNs, identifying two types: STAY PNs that retained spiking at 30{degree sign}C, 36{degree sign}C, and 39{degree sign}C, and STOP PNs that stopped spiking upon temperature change. They further extended their analysis and characterization to striatal medium spiny neurons (MSNs) and found that STAY MSNs and PNs shared the same ST temperature sensitivity. Using small molecule tools, they further identified that themo-TRPV3 currents in cortical PNs increased in response to temperature elevation, but not TRPV4 currents. The authors concluded that during fever, neuronal firing stability is largely maintained by sensory STAY PNs and MSNs that express functional TRPV3 channels. Overall, this study is well designed and executed with substantial controls, some interesting findings, and quality of data. Here are some specific comments:
(1) Could the authors discuss, or is there any evidence of, changes in TRPV3 expression levels in the brain during the postnatal 1-4 week age range in mice?
This is an excellent question. To our knowledge, no published studies have documented changes in TRPV3 expression in the mouse brain during the first to fourth postnatal weeks. Research on TRPV3 expression has primarily relied on RT-PCR analysis of RNA from dissociated adult brain tissue (Jang et al., 2012; Kumar et al., 2018), largely due to the limited availability of effective antibodies for brain sections at the time. Furthermore, the Allen Brain Atlas does not provide data on TRPV3 expression in the developing or postnatal brain. To address this gap, we performed immunohistochemistry to examine TRPV3 expression at P7,
P14, and P21 (Figure 7). To confirm specificity, the TRPV3 antibody was co-incubated with a TRPV3 blocker (Figure 7A, top row, right panel). While immunohistochemistry is semiquantitative, we observed a trend toward increased TRPV3 expression in the cortex, striatum, hippocampus, and thalamus from P7 to P14.
(2) Are there any differential differences in TRPV3 expression patterns that could explain the different firing properties in response to fever temperature between the STAY- and STOP neurons?
This is another excellent question, and we plan to explore it in the future by developing reporter mice for TRPV3 expression and viral tools that leverage endogenous TRPV3 promoters to drive a fluorescent protein, enabling monitoring of cells with native TRPV3 expression. To our knowledge, such tools do not currently exist. Creating them will be challenging, as it requires identifying promoters that accurately reflect endogenous TRPV3 expression.
We have not yet quantified TRPV3 expression in STOP and STAY neurons. However, our analysis of evoked spiking at 30, 36, and 39 °C suggests that TRPV3 may mark a population of cortical pyramidal neurons that tend to remain active (“STAY”) as temperatures increase. While we have not directly compared TRPV3 expression between STAY and STOP neurons at feverrange temperatures, intracellular blockade of TRPV3 with forsythoside B (50 µM) significantly reduced the proportion of STAY neurons (Figure 9B). Consistently, spiking was also significantly reduced in Trpv3⁻/⁻ mice (Figure 10D).
In our immunohistochemical analysis, TRPV3 was detected in L4 barrels and in L2/3, where we observed a patchy distribution with some regions showing more intense staining (Figure 7B). It is possible that cells with higher TRPV3 levels correspond to STAY neurons, while those with lower levels correspond to STOP neurons. As we develop tools to monitor activity based on endogenous TRPV3 levels, we anticipate gaining deeper insight into this relationship.
(3) TRPV3 and TRPV4 can co-assemble to form heterotetrameric channels with distinct functional properties. Do STOP neurons exhibit any firing behaviors that could be attributed to the variable TRPV3/4 assembly ratio?
There is some evidence that TRPV3 and TRPV4 proteins can physically associate in HEK293 cells and native skin tissues (Hu et al., 2022).TRPV3 and TRPV4 are both expressed in the cortex (Kumar et al., 2018), but it remains unclear whether they are co-expressed and coassembled to form heteromeric channels in cortical excitatory pyramidal neurons. Examination of the I-V curve from HEK cells co-expressing TRPV3/4 heteromeric channels shows enhanced current at negative membrane potentials (Hu et al., 2022).
Currently, we cannot characterize cells as STOP or STAY and measure TRPV3 or TRPV4 currents simultaneously, as this would require different experimental setups and internal solutions. Additionally, the protocol involves a sequence of recordings at 30, 36, and 39°C, followed by cooling back to 30°C and re-heating to each temperature. Cells undergoing such a protocol will likely not survive till the end.
In our recordings of TRPV3 currents, which likely include both STOP and STAY cells, we do not observe a significant current at negative voltages, suggesting that TRPV3/4 heteromeric channels may either be absent or underrepresented, at least at a 1:1 ratio. However, the possibility that TRPV3/4 heteromeric channels could define the STOP cell population is intriguing and plausible.
(4) In Figure 7, have the authors observed an increase of TRPV3 currents in MSNs in response to temperature elevation?
We have not recorded TRPV3 currents in MSNs in response to elevated temperatures. Please note that the handling editor gave us the option to remove these data from the paper, and we elected to do so to develop them as a separate manuscript.
(5) Is there any evidence of a relationship between TRPV3 expression levels in D2+ MSNs and degeneration of dopamine-producing neurons?
This is an interesting question, though it falls outside our current research focus in the lab. A PubMed search yields no results connecting the terms TRPV3, MSNs, and degeneration. However, gain-of-function mutations in TRPV4 channel activity have been implicated in motor neuron degeneration (Sullivan et al., 2024) and axon degeneration (Woolums et al., 2020). Similarly, TRPV1 activation has been linked to developmental axon degeneration (Johnstone et al., 2019), while TRPV3 blockade has shown neuroprotective effects in models of cerebral ischemia/reperfusion injury in mice (Chen et al., 2022).
The link between TRPV activation and cell degeneration, however, may not be straightforward. For instance, TRPV1 loss has been shown to accelerate stress-induced degradation of axonal transport from retinal ganglion cells to the superior colliculus and to cause degeneration of axons in the optic nerve (Ward et al., 2014). Meanwhile, TRPV1 activation by capsaicin preserves the survival and function of nigrostriatal dopamine neurons in the MPTP mouse model of Parkinson's disease (Chung et al., 2017).
(6) Does fever range temperature alter the expressions of other neuronal Kv channels known to regulate the firing threshold?
This is an active line of investigation in our lab. The results of ongoing experiments will provide further insight into this question.
Reviewer #2 (Public review):
Summary:
The authors study the excitability of layer 2/3 pyramidal neurons in response to layer four stimulation at temperatures ranging from 30 to 39 Celsius in P7-8, P12-P14, and P22-P24 animals. They also measure brain temperature and spiking in vivo in response to externally applied heat. Some pyramidal neurons continue to fire action potentials in response to stimulation at 39 C and are called stay neurons. Stay neurons have unique properties aided by TRPV3 channel expression.
Strengths:
The authors use various techniques and assemble large amounts of data.
Weaknesses:
(1) No hyperthermia-induced seizures were recorded in the study.
The goal of this manuscript is to uncover age-related physiological changes that enable the brain to maintain function at fever-range temperatures, typically 38–40°C. Febrile seizures in humans are also typically induced within this temperature range. Given this context, we initially did not examine hyperthermia-induced seizures. However, as requested, we assessed the effects of reduced Trpv3 expression on hyperthermia-induced seizures in WT(Trpv3<sup>+/+</sup>), heterozygous (Trpv3<sup>+/-</sup>), and homozygous knockout (Trpv3<sup>-/-</sup>) P12 pups. Please see figure 10.
While T<sub>b</sub> at seizure onset and the rate of T<sub>b</sub> increase leading to seizure were not significantly different among genotypes, the time to seizure from the point of loss of postural control (LPC), defined as collapse and failure to maintain upright posture, was significantly longer in Trpv3<sup>+/-</sup> and Trpv3<sup>-/-</sup> mice. Together, these results indicate that reduced TRPV3 function enhances resistance to seizure initiation and/or propagation under febrile conditions, likely by decreasing neuronal depolarization and excitability.
(2) Febrile seizures in humans are age-specific, extending from 6 months to 6 years. While translating to rodents is challenging, according to published literature (see Baram), rodents aged P11-16 experience seizures upon exposure to hyperthermia. The rationale for publishing data on P7-8 and P22-24 animals, which are outside this age window, must be clearly explained to address a potential weakness in the study.
As requested, we have added an explanation in the “Introduction” for our rationale in including age ranges that flank the period of susceptibility to hyperthermia-induced seizures (see lines 80–100). In summary, we emphasize that this design provides negative controls, allowing us to determine whether the changes observed in the P12–14 window are specific to this developmental period.
(3) Authors evoked responses from layer 4 and recorded postsynaptic potentials, which then caused action potentials in layer 2/3 neurons in the current clamp. The post-synaptic potentials are exquisitely temperature-sensitive, as the authors demonstrate in Figures 3 B and 7D. Note markedly altered decay of synaptic potentials with rising temperature in these traces. The altered decays will likely change the activation and inactivation of voltage-gated ion channels, adjusting the action potential threshold.
The activation and inactivation of voltage-gated ion channels can modulate action potential threshold. Indeed, we have identified channels that contribute to the temperature-induced increase in spike threshold, including BK channels and Scn2a. However, Figure 4B represents a cell with no inhibition at 39°C, and thus the observed loss of the late postsynaptic potential (PSP). This primarily contributes to the prolonged decay of the synaptic potentials. By contrast, cells in which inhibition is retained, when exposed to the same thermal protocol, do not exhibit such extended decay.
(4) The data weakly supports the claim that the E-I balance is unchanged at higher temperatures. Synaptic transmission is exquisitely temperature-sensitive due to the many proteins and enzymes involved. A comprehensive analysis of spontaneous synaptic current amplitude, decay, and frequency is crucial to fully understand the effects of temperature on synaptic transmission.
We did not intend to imply that E-I balance is generally unchanged at higher temperatures. Our statements specifically referred to observations in experiments conducted during the P20–26 age range in cortical pyramidal neurons. We are conducting a parallel line of investigation examining the differential susceptibility of E-I balance across age and temperature, and we have observed age- and temperature-dependent effects. Recognizing that our earlier wording may have been misleading, we have removed this statement from the manuscript.
(5) It is unclear how the temperature sensitivity of medium spiny neurons is relevant to febrile seizures. Furthermore, the most relevant neurons are hippocampal neurons since the best evidence from human and rodent studies is that febrile seizures involve the hippocampus.
Thank you for the opportunity to provide clarification. The goal of this manuscript is to uncover age-related physiological changes that enable the brain to maintain stable, non-excessive neuronal firing at fever-range temperatures (typically 38–40°C). We hypothesize that these changes are a normal part of brain development, potentially explaining why most children do not experience febrile seizures. By understanding these mechanisms, we may identify points in the process that are susceptible to dysfunction, due to genetic mutations, developmental delays, or environmental factors, which could provide insight into the rare cases when seizures occur between 2–5 years of age.
Our aim was not to establish a link between medium spiny neuron (MSN) function and febrile seizures. MSNs were included in this study as a mechanistic comparison because they represent a non-pyramidal, non-excitatory neuronal subtype, allowing us to assess whether the physiological changes observed in L2/3 excitatory pyramidal neurons are unique to these cells. Please note that the handling editor gave us the option to remove these data from the manuscript, and we chose to do so, developing these findings into a separate manuscript.
(6) TRP3V3 data would be convincing if the knockout animals did not have febrile seizures.
We find that approximately equal numbers of excitatory neurons either start or stop firing at fever-range temperatures (typically 38–40 °C). Neurons that continue to fire (“STAY” cells), thus play a key role in maintaining stable, non-excessive network activity. While future studies will examine the mechanisms driving some neurons to initiate spiking, our findings suggest that a reduction in the number of STAY cells could influence more subtle aspects of seizure dynamics, such as time to onset, by decreasing overall network excitability. We assessed the effects of reduced Trpv3 expression on hyperthermia-induced seizures in WT(Trpv3<sup>+/+</sup>), heterozygous (Trpv3<sup>+/-</sup>), and homozygous knockout (Trpv3<sup>-/-</sup>) P12 pups. As you stated, these mice have hyperthermic seizures, however, we noted that the time to seizure from the point of loss of postural control (LPC), defined as collapse and failure to maintain upright posture, was significantly longer in Trpv3<sup>+/-</sup> and Trpv3<sup>-/-</sup> mice. Normally, seizures happen shortly after this point, but notably, Trpv3<sup>-/-</sup> mice took twice as long to reach seizure onset compared with wildtype mice. In an epileptic patient, this increased time may be sufficient for a caretaker to move the patient to a safer location, reducing the risk of injury during the seizure.
Consistent with findings that TRPV3 blockade using 50 µM forsythoside B reduces spiking in cortical L2/3 pyramidal neurons, we observed significantly reduced spiking in Trpv3<sup>-/-</sup> mice as well (Figure 10D). Analysis of postsynaptic potentials in these neurons showed that, in WT mice, PSP amplitude increased with temperature elevation into the febrile range, whereas this temperature-dependent depolarization was absent in Trpv3<sup>-/-</sup> mice (Figure 10E). Together, these results indicate that reduced TRPV3 function enhances resistance to seizure initiation and/or propagation under febrile conditions, likely by decreasing neuronal depolarization and excitability.
Reviewer #3 (Public review):
Summary:
This important study combines in vitro and in vivo recording to determine how the firing of cortical and striatal neurons changes during a fever range temperature rise (37-40 oC). The authors found that certain neurons will start, stop, or maintain firing during these body temperature changes. The authors further suggested that the TRPV3 channel plays a role in maintaining cortical activity during fever.
Strengths:
The topic of how the firing pattern of neurons changes during fever is unique and interesting. The authors carefully used in vitro electrophysiology assays to study this interesting topic.
Weaknesses:
(1) In vivo recording is a strength of this study. However, data from in vivo recording is only shown in Figures 5A,B. This reviewer suggests the authors further expand on the analysis of the in vivo Neuropixels recording. For example, to show single spike waveforms and raster plots to provide more information on the recording. The authors can also separate the recording based on brain regions (cortex vs striatum) using the depth of the probe as a landmark to study the specific firing of cortical neurons and striatal neurons. It is also possible to use published parameters to separate the recording based on spike waveform to identify regular principal neurons vs fast-spiking interneurons. Since the authors studied E/I balance in brain slices, it would be very interesting to see whether the "E/I balance" based on the firing of excitatory neurons vs fast-spiking interneurons might be changed or not in the in vivo condition.
As requested, we have included additional analyses and figures related to the in vivo recording experiments in Figure 5. Specifically, we added examples of multiunit and single-spike waveforms, as well as autocorrelation histograms (ACHs). ACHs were used because raster plots of individual single units would not be very informative given the long recording period. Additionally, Figure 5F was also aimed to replace raster plots as it helps to track changes in the firing rate of a single neurons over time.
Additionally, all recordings were conducted in the cortex at a depth of ~1 mm from the surface, and no recordings were performed in the striatum. Based on the reviewing editor’s suggestions, we decided to remove the striatal data from the manuscript and develop this aspect of the project for a separate publication.
Lastly, we used published parameters to classify recordings based on spike waveform into putative regular principal neurons and interneurons. To clarify this point, we have now included descriptions that were previously listed only in the “Methods” section into the “Results” section as well.
The paragraph below from the methods section describes this procedure.
“Following manual curation, based on their spike waveform duration, the selected single units (n= 633) were separated into putative inhibitory interneurons and excitatory principal cells (Barthóet al., 2004). The spike duration was calculated as the time difference between the trough and the subsequent waveform peak of the mean filtered (300 – 6000 Hz bandpassed) spike waveform. Durations of extracellularly recorded spikes showed a bimodal distribution (Hartigan’s dip test; p < 0.001) characteristic of the neocortex with shorter durations corresponding to putative interneurons (narrow spikes) and longer durations to putative principal cells (wide spikes). Next, k-means clustering was used to separate the single units into these two groups, which resulted in 140 interneurons (spike duration < 0.6 ms) and 493 principal cells (spike duration > 0.6 ms), corresponding to a typical 22% - 78% (interneuron – principal) cell ratio”.
As suggested, we calculated the E/I balance using the average firing rates of excitatory and inhibitory neurons in the in vivo condition. Our analysis revealed that the E/I balance remained unchanged (see Author response image 1). Nonetheless, following the option provided by the reviewing editor, we have chosen to remove the statement referencing E/I balance from the manuscript.
Author response image 1.
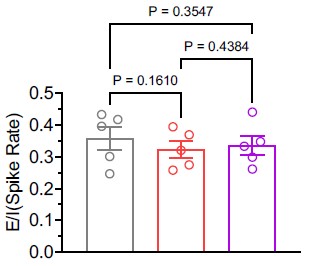
(2) The author should propose a potential mechanism for how TRPV3 helps to maintain cortical activity during fever. Would calcium influx-mediated change of membrane potential be the possible reason? Making a summary figure to put all the findings into perspective and propose a possible mechanism would also be appreciated.
Thank you for your helpful suggestion. In response, we have included a summary figure (Figure 11) illustrating the hypothesis described in the Discussion section. We agree with your assessment that Trpv3 most likely contributes to maintaining cortical activity during fever by promoting calcium influx and depolarizing the membrane potential.
(3) The author studied P7-8, P12-14, and P20-26 mice. How do these ages correspond to the human ages? it would be nice to provide a comparison to help the reader understand the context better.
Ideally, the mouse to human age comparison should depend on the specific process being studied. Per your suggestion, we have added additional references in the Introduction (Dobbing and Sands, 1973; Baram et al., 1997; Bender et al., 2004) to help readers better understand the correspondence between mouse and human ages.
Recommendations for the authors:
Reviewer #2 (Recommendations for the authors):
(3) Perform I-F curves to study the intrinsic properties of layer 2/3 neurons without the confound of evoked responses.
We performed F-I curve analyses (Figures 2H–I), as suggested by Reviewer 2, to study intrinsic properties of L2/3 neurons without evoked responses. Although rheobase increased at 39 °C compared to 30 °C, consistent with findings such as depolarized spike threshold and reduced input resistance, the mean number of spikes across current steps did not differ.
Reviewer #3 (Recommendations for the authors):
Some statistical descriptions are not clearly stated. For example, what statistical methods were used in Fig 2E? The effect size in Fig 2D seems to be quite small. The authors are advised to consider "nested analysis" to further increase the rigor of the analysis. Does each dot mean one neuron? Some of the data points might not be totally independent. The author should carefully check all figures to make sure the stats methods are provided for each panel.
We apologize for not including statistical details in Figure 2E. We have now added this information and verified that statistical descriptions are provided in all figure legends. In Figure 2D, each dot represents a cell, with measurements taken from the same cell at 30°C, 36°C, and 39°C. Given this design, the appropriate test is a one-way repeated-measures ANOVA.
Reviewer #1 (Public review):
Summary:
In the study by Roeder and colleagues, the authors aim to identify the psychophysiological markers of trust during the evaluation of matching or mismatching AI decision-making. Specifically, they aim to characterize through brain activity how the decision made by an AI can be monitored throughout time in a two-step decision-making task. The objective of this study is to unfold, through continuous brain activity recording, the general information processing sequence while interacting with an artificial agent, and how internal as well as external information interact and modify this processing. Additionally, the authors provide a subset of factors affecting this information processing for both decisions.
Strengths:
The study addresses a wide and important topic of the value attributed to AI decisions and their impact on our own confidence in decision-making. It especially questions some of the factors modulating the dynamical adaptation of trust in AI decisions. Factors such as perceived reliability, type of image, mismatch, or participants' bias toward one response or the other are very relevant to the question in human-AI interactions.
Interestingly, the authors also question the processing of more ambiguous stimuli, with no real ground truth. This gets closer to everyday life situations where people have to make decisions in uncertain environments. Having a better understanding of how those decisions are made is very relevant in many domains.
Also, the method for processing behavioral and especially EEG data is overall very robust and is what is currently recommended for statistical analyses for group studies. Additionally, authors provide complete figures with all robustness evaluation information. The results and statistics are very detailed. This promotes confidence, but also replicability of results.
An additional interesting method aspect is that it is addressing a large window of analysis and the interaction between three timeframes (evidence accumulation pre-decision, decision-making, post-AI decision processing) within the same trials. This type of analysis is quite innovative in the sense that it is not yet a standard in complex experimental designs. It moves forward from classical short-time windows and baseline ERP analysis.
Weaknesses:
This manuscript raises several conceptual and theoretical considerations that are not necessarily answered by the methods (especially the task) used. Even though the authors propose to assess trust dynamics and violations in cooperative human-AI teaming decision-making, I don't believe their task resolves such a question. Indeed, there is no direct link between the human decision and the AI decision. They do not cooperate per se, and the AI decision doesn't seem, from what I understood to have an impact on the participants' decision making. The authors make several assumptions regarding trust, feedback, response expectation, and "classification" (i.e., match vs. mismatch) which seem far stretched when considering the scientific literature on these topics.
Unlike what is done for the data processing, the authors have not managed to take the big picture of the theoretical implications of their results. A big part of this study's interpretation aims to have their results fit into the theoretical box of the neural markers of performance monitoring.
Overall, the analysis method was very robust and well-managed, but the experimental task they have set up does not allow to support their claim. Here, they seem to be assessing the impact of a mismatch between two independent decisions.
Nevertheless, this type of work is very important to various communities. First, it addresses topical concerns associated with the introduction of AI in our daily life and decisions, but it also addresses methodological difficulties that the EEG community has been having to move slowly away from the static event-based short-timeframe analyses onto a more dynamic evaluation of the unfolding of cognitive processes and their interactions. The topic of trust toward AI in cooperative decision making has also been raised by many communities, and understanding the dynamics of trust, as well as the factors modulating it, is of concern to many high-risk environments, or even everyday life contexts. Policy makers are especially interested in this kind of research output.
Author response:
A major point all three reviewers raise is that the ‘human-AI collaboration’ in our experiment may not be true collaboration (as the AI does not classify images per se), but that it is only implied. The reviewers pointed out that whether participants were genuinely engaged in our experimental task is currently not sufficiently addressed. We plan to address this issue in the revised manuscript by including results from a brief interview we conducted after the experiment with each participant, which asked about the participant’s experience and decision-making processes while performing the task. Additionally, we also measured the participants’ propensity to trust in AI via a questionnaire before and after the experiment. The questionnaire and interview results will allow us to more accurately describe the involvement of our participants in the task. Additionally, we will conduct additional analyses of the behavioural data (e.g., response times) to show that participants genuinely completed the experimental task. Finally, we will work to sharpen our language and conclusions in the revised manuscript, following the reviewers’ recommendations.
Reviewer #1:
Summary:
In the study by Roeder and colleagues, the authors aim to identify the psychophysiological markers of trust during the evaluation of matching or mismatching AI decision-making. Specifically, they aim to characterize through brain activity how the decision made by an AI can be monitored throughout time in a two-step decision-making task. The objective of this study is to unfold, through continuous brain activity recording, the general information processing sequence while interacting with an artificial agent, and how internal as well as external information interact and modify this processing. Additionally, the authors provide a subset of factors affecting this information processing for both decisions.
Strengths:
The study addresses a wide and important topic of the value attributed to AI decisions and their impact on our own confidence in decision-making. It especially questions some of the factors modulating the dynamical adaptation of trust in AI decisions. Factors such as perceived reliability, type of image, mismatch, or participants' bias toward one response or the other are very relevant to the question in human-AI interactions.
Interestingly, the authors also question the processing of more ambiguous stimuli, with no real ground truth. This gets closer to everyday life situations where people have to make decisions in uncertain environments. Having a better understanding of how those decisions are made is very relevant in many domains.
Also, the method for processing behavioural and especially EEG data is overall very robust and is what is currently recommended for statistical analyses for group studies. Additionally, authors provide complete figures with all robustness evaluation information. The results and statistics are very detailed. This promotes confidence, but also replicability of results.
An additional interesting method aspect is that it is addressing a large window of analysis and the interaction between three timeframes (evidence accumulation pre-decision, decision-making, post-AI decision processing) within the same trials. This type of analysis is quite innovative in the sense that it is not yet a standard in complex experimental designs. It moves forward from classical short-time windows and baseline ERP analysis.
We appreciate the constructive appraisal of our work.
Weaknesses:
R1.1. This manuscript raises several conceptual and theoretical considerations that are not necessarily answered by the methods (especially the task) used. Even though the authors propose to assess trust dynamics and violations in cooperative human-AI teaming decision-making, I don't believe their task resolves such a question. Indeed, there is no direct link between the human decision and the AI decision. They do not cooperate per se, and the AI decision doesn't seem, from what I understood to have an impact on the participants' decision making. The authors make several assumptions regarding trust, feedback, response expectation, and "classification" (i.e., match vs. mismatch) which seem far stretched when considering the scientific literature on these topics.
This issue is raised by the other reviewers as well. The reviewer is correct in that the AI does not classify images but that the AI response is dependent on the participants’ choice (agree in 75% of trials, disagree in 25% of the trials). Importantly, though, participants were briefed before and during the experiment that the AI is doing its own independent image classification and that human input is needed to assess how well the AI image classification works. That is, participants were led to believe in a genuine, independent AI image classifier on this experiment.
Moreover, the images we presented in the experiment were taken from previous work by Nightingale & Farid (2022). This image dataset includes ‘fake’ (AI generated) images that are indistinguishable from real images.
What matters most for our work is that the participants were truly engaging in the experimental task; that is, they were genuinely judging face images, and they were genuinely evaluating the AI feedback. There is strong indication that this was indeed the case. We conducted and recorded brief interviews after the experiment, asking our participants about their experience and decision-making processes. The questions are as follows:
(1) How did you make the judgements about the images?
(2) How confident were you about your judgement?
(3) What did you feel when you saw the AI response?
(4) Did that change during the trials?
(5) Who do you think it was correct?
(6) Did you feel surprised at any of the AI responses?
(7) How did you judge what to put for the reliability sliders?
In our revised manuscript we will conduct additional analyses to provide detail on participants’ engagement in the task; both in the judging of the AI faces, as well as in considering the AI feedback. In addition, we will investigate the EEG signal and response time to check for effects that carry over between trials. We will also frame our findings more carefully taking scientific literature into account.
Nightingale SJ, and Farid H. "AI-synthesized faces are indistinguishable from real faces and more trustworthy." Proceedings of the National Academy of Sciences 119.8 (2022): e2120481119.
R1.2. Unlike what is done for the data processing, the authors have not managed to take the big picture of the theoretical implications of their results. A big part of this study's interpretation aims to have their results fit into the theoretical box of the neural markers of performance monitoring.
We indeed used primarily the theoretical box of performance monitoring and predictive coding, since the make-up of our task is similar to a more classical EEG oddball paradigm. In our revised manuscript, we will re-frame and address the link of our findings with the theoretical framework of evidence accumulation and decision confidence.
R1.3. Overall, the analysis method was very robust and well-managed, but the experimental task they have set up does not allow to support their claim. Here, they seem to be assessing the impact of a mismatch between two independent decisions.
Although the human and AI decisions are independent in the current experiment, the EEG results still shed light on the participant’s neural processes, as long as the participant considers the AI’s decision and believes it to be genuine. An experiment in which both decisions carry effective consequences for the task and the human-AI cooperation would be an interesting follow-up study.
Nevertheless, this type of work is very important to various communities. First, it addresses topical concerns associated with the introduction of AI in our daily life and decisions, but it also addresses methodological difficulties that the EEG community has been having to move slowly away from the static event-based short-timeframe analyses onto a more dynamic evaluation of the unfolding of cognitive processes and their interactions. The topic of trust toward AI in cooperative decision making has also been raised by many communities, and understanding the dynamics of trust, as well as the factors modulating it, is of concern to many high-risk environments, or even everyday life contexts. Policy makers are especially interested in this kind of research output.
Reviewer #2:
Summary:
The authors investigated how "AI-agent" feedback is perceived in an ambiguous classification task, and categorised the neural responses to this. They asked participants to classify real or fake faces, and presented an AI-agent's feedback afterwards, where the AI-feedback disagreed with the participants' response on a random 25% of trials (called mismatches). Pre-response ERP was sensitive to participants' classification as real or fake, while ERPs after the AI-feedback were sensitive to AI-mismatches, with stronger N2 and P3a&b components. There was an interaction of these effects, with mismatches after a "Fake" response affecting the N2 and those after "Real" responses affecting P3a&b. The ERPs were also sensitive to the participants' response biases, and their subjective ratings of the AI agent's reliability.
Strengths:
The researchers address an interesting question, and extend the AI-feedback paradigm to ambiguous tasks without veridical feedback, which is closer to many real-world tasks. The in-depth analysis of ERPs provides a detailed categorisation of several ERPs, as well as whole-brain responses, to AI-feedback, and how this interacts with internal beliefs, response biases, and trust in the AI-agent.
We thank the reviewer for their time in reading and reviewing our manuscript.
Weaknesses:
R2.1. There is little discussion of how the poor performance (close to 50% chance) may have affected performance on the task, such as by leading to entirely random guessing or overreliance on response biases. This can change how error-monitoring signals presented, as they are affected by participants' accuracy, as well as affecting how the AI feedback is perceived.
The images were chosen from a previous study (Nightingale & Farid, 2022, PNAS) that looked specifically at performance accuracy and also found levels around 50%. Hence, ‘fake’ and ‘real’ images are indistinguishable in this image dataset. Our findings agree with the original study.
Judging based on the brief interviews after the experiment (see answer to R.1.1.), all participants were actively and genuinely engaged in the task, hence, it is unlikely that they pressed buttons at random. As mentioned above, we will include a formal analysis of the interviews in the revised manuscript.
The response bias might indeed play a role in how participants responded, and this might be related to their initial propensity to trust in AI. We have questionnaire data available that might shed light on this issue: before and after the experiment, all participants answered the following questions with a 5-point Likert scale ranging from ‘Not True’ to ‘Completely True’:
(1) Generally, I trust AI.
(2) AI helps me solve many problems.
(3) I think it's a good idea to rely on AI for help.
(4) I don't trust the information I get from AI.
(5) AI is reliable.
(6) I rely on AI.
The propensity to trust questionnaire is adapted from Jessup SA, Schneider T R, Alarcon GM, Ryan TJ, & Capiola A. (2019). The measurement of the propensity to trust automation. International Conference on Human-Computer Interaction.
Our initial analyses did not find a strong link between the initial (before the experiment) responses to these questions, and how images were rated during the experiment. We will re-visit this analysis and add the results to the revised manuscript.
Regarding how error-monitoring (or the equivalent thereof in our experiment) is perceived, we will analyse interview questions 3 (“What did you feel when you saw the AI response”) and 6 (“Did you feel surprised at any of the AI responses”) and add results to the revised manuscript.
The task design and performance make it hard to assess how much it was truly measuring "trust" in an AI agent's feedback. The AI-feedback is yoked to the participants' performance, agreeing on 75% of trials and disagreeing on 25% (randomly), which is an important difference from the framing provided of human-AI partnerships, where AI-agents usually act independently from the humans and thus disagreements offer information about the human's own performance. In this task, disagreements are uninformative, and coupled with the at-chance performance on an ambiguous task, it is not clear how participants should be interpreting disagreements, and whether they treat it like receiving feedback about the accuracy of their choices, or whether they realise it is uninformative. Much greater discussion and justification are needed about the behaviour in the task, how participants did/should treat the feedback, and how these affect the trust/reliability ratings, as these are all central to the claims of the paper.
In our experiment, the AI disagreements are indeed uninformative for the purpose of making a correct judgment (that is, correctly classifying images as real or fake). However, given that the AI-generated faces are so realistic and indistinguishable from the real faces, the correctness of the judgement is not the main experimental factor in this study. We argue that, provided participants were genuinely engaged in the task, their judgment accuracy is less important than their internal experience when the goal is to examine processes occurring within the participants themselves. We briefed our participants as follows before the experiment:
“Technology can now create hyper-realistic images of people that do not exist. We are interested in your view on how well our AI system performs at identifying whether images of people’s faces are real or fake (computer-generated). Human input is needed to determine when a face looks real or fake. You will be asked to rate images as real or fake. The AI system will also independently rate the images. You will rate how reliable the AI is several times throughout the experiment.”
We plan to more fully expand the behavioural aspect and our participants’ experience in the revised manuscript by reporting the brief post-experiment interview (R.1.1.), the propensity to trust questionnaire (R.2.1.), and additional analyses of the response times.
There are a lot of EEG results presented here, including whole-brain and window-free analyses, so greater clarity on which results were a priori hypothesised should be given, along with details on how electrodes were selected for ERPs and follow-up tests.
We chose the electrodes mainly to be consistent across findings, and opted to use central electrodes (Pz and Fz), as long as the electrode was part of the electrodes within the reported cluster. We can in our revised manuscript also report on the electrodes with the maximal statistic, as part of a more complete and descriptive overview. We will also report on where we expected to see ERP components within the paper. In short, we did expect something like a P3, and we did also expect to see something before the response what we call the CPP. The rest of the work was more exploratory, with a more careful expectation that bias would be connected to the CPP, and the reliability ratings more to the P3; however, we find the opposite results. We will include this in our revised work as well.
We selected the electrodes primarily to maintain consistency across our findings and figures, and focused on central electrodes (Pz and Fz), provided they fell within the reported cluster. In the revised manuscript, we will also report the electrodes showing the maximal statistical effects to give a more complete and descriptive overview. Additionally, we will report where we expected specific ERP components to appear. In brief, we expected to see a P3 component post AI feedback, and a pre-response signal corresponding to the CPP. Beyond these expectations, the remaining analyses were more exploratory. Although we tentatively expected bias to relate to the CPP and reliability ratings to the P3, our results showed the opposite pattern. We will clarify this in the revised version of the manuscript.
Reviewer #3:
The current paper investigates neural correlates of trust development in human-AI interaction, looking at EEG signatures locked to the moment that AI advice is presented. The key finding is that both human-response-locked EEG signatures (the CPP) and post-AI-advice signatures (N2, P3) are modulated by trust ratings. The study is interesting, however, it does have some clear and sometimes problematic weaknesses:
(1) The authors did not include "AI-advice". Instead, a manikin turned green or blue, which was framed as AI advice. It is unclear whether participants viewed this as actual AI advice.
This point has been raised by the other reviewers as well, and we refer to the answers under R1.1., and under R2.1. We will address this concern by analysing the post-experiment interviews. In particular, questions 3 (“What did you feel when you saw the AI response”), 4 (“Did that change during the trials?”) and 6 (“Did you feel surprised at any of the AI responses”) will give critical insight. As stated above, our general impression from conducting the interviews is that all participants considered the robot icon as decision from an independent AI agent.
(2) The authors did not include a "non-AI" control condition in their experiment, such that we cannot know how specific all of these effects are to AI, or just generic uncertain feedback processing.
In the conceptualization phase of this study, we indeed considered different control conditions for our experiment to contrast different kinds of feedback. However, previous EEG studies on performance monitoring ERPs have reported similar results for human and machine supervision (Somon et al., 2019; de Visser et al., 2018). We therefore decided to focus on one aspect (the judgement of observation of an AI classification), also to prevent the experiment from taking too long and risking that participants would lose concentration and motivation to complete the experiment. Comparing AI vs non-AI feedback, is still interesting and would be a valuable follow-up study.
Somon B, et al. "Human or not human? Performance monitoring ERPs during human agent and machine supervision." NeuroImage 186 (2019): 266-277.
De Visser EJ, et al. "Learning from the slips of others: Neural correlates of trust in automated agents." Frontiers in human neuroscience 12 (2018): 309.
(3) Participants perform the task at chance level. This makes it unclear to what extent they even tried to perform the task or just randomly pressed buttons. These situations likely differ substantially from a real-life scenario where humans perform an actual task (which is not impossible) and receive actual AI advice.
This concern was also raised by the other two reviewers. As already stated in our responses above, we will add results from the post-experiment interviews with the participants, the propensity to trust questionnaire, and additional behavioural analyses in our revised manuscript.
Reviewer 1 (R1.3) also brought up the situation where decisions by the participant and the AI have a more direct link which carries consequences. This will be valuable follow-up research. In the revised manuscript, we will more carefully frame our approach.
(4) Many of the conclusions in the paper are overstated or very generic.
In the revised manuscript, we will re-phrase our discussion and conclusions to address the points raised in the reviewer’s recommendations to authors.
Reviewer #1 (Public review):
Summary:
This manuscript provides a comprehensive systematic analysis of envelope-containing Ty3/gypsy retrotransposons (errantiviruses) across metazoan genomes, including both invertebrates and ancient animal lineages. Using iterative tBLASTn mining of over 1,900 genomes, the authors catalog 1,512 intact retrotransposons with uninterrupted gag, pol, and env open reading frames. They show that these elements are widespread-present in most metazoan phyla, including cnidarians, ctenophores, and tunicates-with active proliferation indicated by their multicopy status. Phylogenetic analyses distinguish "ancient" and "insect" errantivirus clades, while structural characterization (including AlphaFold2 modeling) reveals two major env types: paramyxovirus F-like and herpesvirus gB-like proteins. Although bot envelope types were identified in previous analyses two decades ago, the evolutionary provenance of these envelope genes was almost rudimentary and anecdotal (I can say this because I authored one of these studies). The results in the present study support an ancient origin for env acquisition in metazoan Ty3/gypsy elements, with subsequent vertical inheritance and limited recombination between env and pol domains. The paper also proposes an expanded definition of 'errantivirus' for env-carrying Ty3/gypsy elements outside Drosophila.
Strengths:
(1) Comprehensive Genomic Survey:<br /> The breadth of the genome search across non-model metazoan phyla yields an impressive dataset covering evolutionary breadth, with clear documentation of search iterations and validation criteria for intact elements.
(2) Robust Phylogenetic Inference:<br /> The use of maximum likelihood trees on both pol and env domains, with thorough congruence analysis, convincingly separates ancient from lineage-specific elements and demonstrates co-evolution of env and pol within clades.
(3) Structural Insights:<br /> AlphaFold2-based predictions provide high-confidence structural evidence that both env types have retained fusion-competent architectures, supporting the hypothesis of preserved functional potential.
(4) Novelty and Scope:<br /> The study challenges previous assumptions of insect-centric or recent env acquisition and makes a compelling case for a Pre-Cambrian origin, significantly advancing our understanding of animal retroelement diversity and evolution. THIS IS A MAJOR ADVANCE.
(5) Data Transparency:<br /> I appreciate that all data, code, and predicted structures are made openly available, facilitating reproducibility and future comparative analyses.
Major Weaknesses
(1) Functional Evidence Gaps:<br /> The work rests largely on sequence and structure prediction. No direct expression or experimental validation of envelope gene function or infectivity outside Drosophila is attempted, which would be valuable to corroborate the inferred roles of these glycoproteins in non-insect lineages. At least for some of these species, there are RNA-seq datasets that could be leveraged.
(2) Horizontal Transfer vs. Loss Hypotheses:<br /> The discussion argues primarily for vertical inheritance, but the somewhat sporadic phylogenetic distributions and long-branch effects suggest that loss and possibly rare horizontal events may contribute more than acknowledged. Explicit quantitative tests for horizontal transfer, or reconciliation analyses, would strengthen this conclusion. It's also worth pointing out that, unlike retrotransposons that can be found in genomes, any potential related viral envelopes must, by definition, have a spottier distribution due to sampling. I don't think this challenges any of the conclusions, but it must be acknowledged as something that could affect the strength of this conclusion
(3) Limited Taxon Sampling for Certain Phyla:<br /> Despite the impressive breadth, some ancient lineages (e.g., Porifera, Echinodermata) are negative, but the manuscript does not fully explore whether this reflects real biological absence, assembly quality, or insufficient sampling. A more systematic treatment of negative findings would clarify claims of ubiquity. However, I also believe this falls beyond the scope of this study.
(4) Mechanistic Ambiguity:<br /> The proposed model that env-containing elements exploit ovarian somatic niches is plausible but extrapolated from Drosophila data; for most taxa, actual tissue specificity, lifecycle, or host interaction mechanisms remain speculative and, to me, a bit unreasonable.
Minor Weaknesses:
(1) Terminology and Nomenclature:<br /> The paper introduces and then generalizes the term "errantivirus" to non-insect elements. While this is logical, it may confuse readers familiar with the established, Drosophila-centric definition if not more explicitly clarified throughout. I also worry about changes being made without any input from the ICTV nomenclature committee, which just went through a thorough reclassification. Nevertheless, change is expected, and calling them all errantiviruses is entirely reasonable.
(2) Figures and Supplementary Data Navigation:<br /> Some key phylogenies and domain alignments are found only in supplementary figures, occasionally hindering readability for non-expert audiences. Selected main-text inclusion of representative trees would benefit accessibility.
(3) ORF Integrity Thresholds:<br /> The cutoff choices for defining "intact" elements (e.g., numbers/placement of stop codons, length ranges) are reasonable but only lightly justified. More rationale or sensitivity analysis would improve confidence in the inclusion criteria. For example, how did changing these criteria change the number of intact elements?
(4) Minor Typos/Formatting:<br /> The paper contains sporadic typographical errors and formatting glitches (e.g., misaligned figure labels, unrendered symbols) that should be addressed.
Reviewer #3 (Public review):
Summary and Significance:
In this work, Cary and Hayashi address the important question of when, in evolution, certain mobile genetic elements (Ty3/gypsy-like non-LTR retrotransposons) associated with certain membrane fusion proteins (viral glycoprotein F or B-like proteins), which could allow these mobile genetic elements to be transferred between individual cells of a given host. It is debated in the literature whether the acquisition of membrane fusion proteins by non-LTR retrotransposons is a rather recent phenomenon that separately occurred in the ancestors of certain host species or whether the association with membrane fusion proteins is a much more ancient one, pre-dating the Cambrian explosion. Obviously, this question also touches upon the origin of the retroviruses, which can spread between individuals of a given host but seem restricted to vertebrates. Based on convincing data, Cary and Hayashi argue that an ancient association of non-LTR retrotransposons with membrane fusion proteins is most probable.
Strengths:
The authors take the smart approach to systematically retrieve apparently complete, intact, and recently functional Ty3/gypsy-like non-LTR retrotransposons that, next to their characteristic gag and pol genes, additionally carry sequences that are homologous to viral glycoprotein F (env-F) or viral glycoprotein B (env-B). They then construct and compare phylogenetic trees of the host species and individual encoded proteins and protein domains, where 3D-structure calculations and other features explain and corroborate the clustering within the phylogenetic trees. Congruence of phylogenetic trees and correlation of structural features is then taken as evidence for an infrequent recombination and a long-term co-evolution of the reverse transcriptase (encoded by the pol gene) and its respective putative membrane fusion gene (encoded by env-F or env-B). Importantly, the env-F and env-B containing retrotransposons do not form a monophyletic group among the Ty3/gypsy-like non-LTR retrotransposons, but are scattered throughout, supporting the idea of an originally ancient association followed by a random loss of env-F/env-B in individual branches of the tree (and rather rare re-associations via more recent recombinations).
Overall, this is valuable, stimulating, and important work of general and fundamental interest, but still also somewhat incompletely explored, imprecisely explained, and insufficiently put into context for a more general audience.
Weaknesses:
Some points that might be considered and clarified:
(1) Imprecise explanations, terms, and definitions:
It might help to add a 'definitions box' or similar to precisely explain how the authors decided to use certain terms in this manuscript, and then use these terms consistently and with precision.
a) In particular, these are terms such as 'vertebrate retrovirus' vs 'retrovirus' vs 'endogenized retrovirus' vs 'endogenous retrovirus' vs 'non-LTR retrotransposon' and 'Ty3/gypsi-like retrotransposon' vs 'Ty3/gypsy retrotransposon' vs 'errantivirus'.
b) The comment also applies to the term 'env' used for both 'env-F' and 'env-B', where often it remains unclear which of the two protein types the authors refer to. This is confusing, particularly in the methods, where the search for the respective homologs is described.
c) Other examples are the use of the entire pol gene vs. pol-RT for the definition of the Ty3/gypsy clade and for the generation of phylogenetic trees (Methods and Figure S1), and the names for various portions of pol that appear without prior definition or explanation (e.g., 'pro' in Figure 1A, 'bridge' in Figure S1C, 'the chromodomain' in the text and Figure 7).
d) It is unclear from the main text which portions of pol were chosen to define pol-RT and why. The methods name the 'palm-and-fingers', 'thumb', and 'connections' domains to define RT. In the main text, the 'connection' domain is called 'tether' and is instead defined as part of the 'bridge' region following RT, which is not part of RT.
(2) Insufficient broader context:
a) The introduction does not state what defines Ty3/gypsy non-LTR retrotransposons as compared to their closest relatives (Ty1/copia retrotransposons, BEL/pao retrotransposons, vertebrate retroviruses). This makes it difficult to judge the significance and generality of the findings.
b) The various known compositions of Ty3/gypsi-like retrotransposons are not mentioned and explained in the introduction (open reading frames, (poly-)proteins and protein domains, and their variable arrangement, enzymatic activities, and putative functions), and the distribution of Ty3/gypsi-like retrotransposons among eukaryotes remains unclear. The introduction does not mention that Ty3/gypsi-like retrotransposons apparently are absent from vertebrates, and Figure 7 is not very clear about whether or not it includes sequences from plants ('Chromoviridae').
c) The known association of Ty3/gypsi-like retrotransposons from different metazoan phyla with putative membrane fusion proteins (env-like) genes is mentioned in the introduction, but literature information, whether such associations also occur in the context of other retrotransposons (e.g., Ty1/ copia or BEL/pao), is not provided. The abstract is somewhat misleading in this respect. Finally, the different known types of env-like genes are not mentioned and explained as part of the introduction ('env-f', 'env-B', 'retroviral env', others?)
d) Some key references and reviews might be added:
- Pelisson, A. et al. (1994) https://www.embopress.org/doi/abs/10.1002/j.1460-2075.1994.tb06760.x<br /> (next to Song et al. (1994), for the identification of env in Ty3/gypsy)
- Boeke, J.D. et al. (1999)<br /> In Virus Taxonomy: ICTV VIIth report. (ed. F.A. Murphy),. Springer-Verlag, New York.<br /> (cited by Malik et al. (2000) - for the definition and first use of the term 'errantivirus')
- Eickbush, T.H. and Jamburuthugoda, V.K. (2008) https://doi.org/10.1016/j.virusres.2007.12.010<br /> (on the classification of retrotransposons and their env-like genes)
- Hayward, A. (2017) https://doi.org/10.1016/j.coviro.2017.06.006<br /> (on scenarios of env acquisition)
(3) Incomplete analysis:
a) Mobile genetic elements are sometimes difficult to assemble correctly from short-read sequencing data. Did the authors confirm some of their newly identified elements by e.g., PCR analysis or re-identification in long-read sequencing data?
b) The authors mention somewhat on the side that there are Ty3/gypsy elements with a different arrangement (gag-env-pol instead of gag-pol-env). Why was this important feature apparently not used and correlated in the analysis? How does it map on the RT phylogenetic tree? Which type of env is found with either arrangement? Is there evidence for a loss of env also in the case of gag-env-pol elements?
c) Sankey plots are insufficiently explained. How would inconsistencies between trees (recombinations) show up here? Why is there no Sankey plot for the analysis of env-B in Figure 5?
d) Why are there no trees generated for env-F and env-B like proteins, including closely related homologous sequences that do NOT come from Ty3/gypsy retrotransposons (e.g., from the eukaryotic hosts, from other types of retrotransposons (Ty1/copia or BEL/pao), from viruses such as Herpesvirus and Baculovirus)? It would be informative whether the sequences from Ty3/gypsy cluster together in this case.
e) Did the authors identify any other env-like ORFs (apart from env-F and env-B) among Ty3/gypsy retrotransposons? Did they identify other, non-env-like ORFs that might help in the analysis? It is not quite clear from the methods if the searches for env-F and env-B - containing Ty3/gypsy elements were done separately and consecutively or somehow combined (the authors generally use 'env', and it is not clear which type of protein this refers to).
f) Why was the gag protein apparently not used to support the analysis? Are there different, unrelated types of gag among non-LTR retrotransposons? Does gag follow or break the pattern of co-evolution between RT and env-F/env-B?
g) Data availability. The link given in the paper does not seem to work (https://github.com/RippeiHayashi/errantiviruses_2025/tree/main). It would be useful for the community to have the sequences of the newly identified Ty3/gypsy retrotransposons listed readily available (not just genome coordinates as in table S1), together with the respective annotations of ORFs and features.
Author response:
We appreciate thorough and highly valuable feedback from the reviewers. We will take their suggestions on board and prepare a revised manuscript focusing on the following points:
(1) As reviewers pointed out, we did not evaluate horizontal transfer events of env-containing Ty3/gypsy elements. We consistently observed that elements found in the same phylum/class/superfamily cluster together in the POL phylogenetic tree, suggesting an ancient acquisition of env to the Ty3/gypsy elements—separation should not be as clear as we observed should they had been frequently gained from animals across different phylum/class/superfamilies. However, this does not exclude more recent horizontal transfer events that may occur between closely related species. We will perform gene-tree species-tree reconciliation analyses in clades that have enough elements and represented species to estimate the frequency of horizontal transfer events.
(2) We did not find env-containing Ty3/gypsy elements in some animal phyla such as Echinodermata and Porifera, but this could be due to the quality or number of available genome assemblies as reviewers suggested. To address this, we will mine GAG-POL gypsy elements in the genomes that were devoid of GAG-POL-ENV elements and compare their abundance with other genomes that carry GAG-POL-ENV elements. If GAG-POL gypsy elements were similarly abundantly identified, that would indicate that the observed absence of GAG-POL-ENV elements is not due to poor quality of genome assemblies.
(3) We will include F-type and HSV-gB type ENV proteins from known viruses in the phylogenetic analysis to investigate their ancestry and potential recombination events with env-containing Ty3/gypsy elements.
(4) Wherever relevant, we will clarify the terms using in the manuscript, provide rationale to our selection of POL domains used for structural and phylogenetic analyses, improve accessibility of figures, touch on gypsy elements in vertebrates, and make sure all concepts covered in the results are sufficiently introduced in the introduction.
London Theater
Being both a playwright and an actor allowed him to understand performance from multiple perspectives. His success as a business partner shows that theater was not just art but also a practical livelihood.
Shakespeare
Shakespeare is called the most famous English writer, but it’s interesting that we know so little about his life. This makes me think about how historical records shape our understanding of authors and their work.
dialogue
I like the comparison between dialogue in novels and plays. Novels describe actions clearly, but in drama, actors interpret the stage directions and express action physically. This highlights how performance plays a huge role in meaning. The same written line could feel completely different depending on the actor’s delivery.
evolution
The connection between Greek drama and religious worship is fascinating. It shows how early drama wasn’t just entertainment, but a civic and spiritual activity.
fiction
I find it interesting how the chapter says plays and novels are similar in plot and character, but playwrights have to communicate everything visually. This reminds me that drama relies more on performance than description.
Perhaps the most significant reason for learning how to compose multi-modally is that it provides “real-life” skills that can help prepare studentsfor careers.
This quote stood out because it connects multimodal composing to jobs and careers. It made me realize that this type of writing is not just a class assignment but a skill used in real life. Many careers require people to use communication, technology, and visuals together, so learning this now helps students be ready for the future.
Second, all of us as educators, teacher educators, and researchers have much to learn about how we can foster not only an understanding of—but the valuing of—the multiple dialects used in schools and society.
important
In Part II of Other People’s English, Young lays out the case forcode-meshing in clear, compelling, and unequivocal terms. In his firstessay, Young explains the racial politics at work in language ideologythat privileges EAE over and against othered varieties of English, partic-ularly African American Englishes. He points out the implicit or agenticracism that shapes teachers’ “address” of linguistic racism by “puttinganother dialect, evidently one favoured by those perpetrating prejudice,in the mouths of the disadvantaged” (p. 55). Young suggests that teach-ing students of colour to speak and write the favoured dialect ratherthan addressing the racism that, among other harms it inflicts, promotesthat dialect over and against students’ own languages constitutes akind of resignation to racism, in general, and to linguistic intolerance,in particular. In this first essay, Young advocates for a code-meshingpedagogy that teaches the conflicts associated with language use: thepower dynamics that inform the reception, valuation, privileging,and disenfranchising not only of dialects but also of their speakers andwriters. He urges teachers to acknowledge and address conditions ofracism and linguistic intolerance in their classrooms and beyond, ratherthan merely capitulating to them. Finally, Young notes the ubiquity ofcode-meshing in public discourse, both professional and political, andthe relative silence of the teaching profession on the prevalence and rhe-torical value of code-meshing. He argues that teaching more people toavail themselves of the linguistic and rhetorical potency of code-meshedEnglishes is a more politically responsible and pedagogically efficaciousapproach to the teaching of writing for all students.
Another view of code meshing and an advocate of it.
The proverb points out that “impossible” is nota French word, but also suggests, perhaps, a national ethos or esprit decorps: an expression of rhetorical sovereignty that claims both a culturalidentity and a web of affiliative relations within that identity. Both218 Condon | Review: Other People's Englishphrases are examples of intrasentential code-meshin
use introduction for essay, interesting way to showcase language diversity
Seen in this way, electronic media not only democratize publication and content creation ([45]; [59]; [101]) but also make it possible for writers to speak with, ask questions of, and be influenced by an audience of readers.
Anyone can write, publish, and get feedback.
But, in this realm of increasingly pervasive written communication, to whom do we write?
Returns to the central problem of identifying audience.
What these measures cannot do, however, is reveal audiences’ underlying motivations. These measures reveal what audiences do, but not why.
Data can track clicks and views, but it can’t explain motivations.
They performedsimilarly on both measures in the fall testing, but the KEEP groupmade greater (although not statistically significant) gains in thespring testing than did the public school group. Although she iscareful to note limitations in the design of the study, Speidel (1987a)argues that these results suggest a relationship between teacherdiscourse modifications in small-group lessons and HCE-speakingchildren's use of SE grammatical features
Students are more likely to learn a language style better if the teacher is more involved in supporting the students culture as a collective class instead of singling out individuals one at a time. The group setting and speaking practice helps everyone ( SAE speakers and HCE speakers) learn more and engage in their own experiences.
and then answered comprehensionquestions based on the stories. Combined scores for the two groupsrevealed no significant difference between the HCE and SE groupson overall listening comprehension abil
comprehension = relatively the same for stories in SE But HCE performed better for stories in HCE
ting. It seems theyunderstand SE perfectly well, but they do not u
Why not use SE?
that interlocutors understand all aspectsof either the surface or underlying structure of utterances to whichthey respond
Def. interlocutors: ": one who takes part in dialogue or conversation" (Merriam Webster). Its not about how fully someone in a conversation understands the content but it is more important how they respond to the content.
le. The latter groups' success probably owes much tosocioeconomic status, parents' educational levels, and positiveattitudes toward mainstream schooling, whereas the SESD groupsexperiences are no doubt tied to generations of socioeconomic andethnic stratification in American society (Ogbu, 1
Def. Socioeconomic status: "Encompasses not only income but also educational attainment, occupational prestige, and subjective perceptions of social status and social class. SES encompasses quality-of-life attributes and opportunities afforded to people within society and is a consistent predictor of a vast array of psychological outcomes." Adapted from the APA Dictionary of Psychology
-there are minority varieties to consider: BlackEnglish Vernacular (BEV), Appalachian English, British WestIndian English, Louisiana Creole English, (South Carolinian and SeaIslands) Gullah, Chicano English, and Hawaii Creole English, toname but a few
Many versions of English!
This trend has important consequences ineducation, not only for speakers of languages other than English,but also for speakers of minority varieties of Eng
Important in learning
not only foster readingachievement, but facilitate the development of spoken SE as well
results
estricted to only the most formal level of style" (p. 415).There is some disagreement in the literature about whether SE isassociated with a particular social group. Strevens (1985) claims thatSE is "not 'upper class English
these variations of English are not very different but are perceived as different due to comprehension difficulties.
deliberate intervention by society, in
Standard English is "deliberate intervention by society" but why not the other versions of English? this is an example of bias.
neither dialects nor creoles are defined on the basis of socialevaluation of particular ways of speaking. This is not to deny theexistence of such evaluation, but simply to recognize that it isseparable from the scientific description of linguistic variation andthe identification of different varieties of English.
The species of dialogue are not particular ways of speaking? They are separate varieties of one language (English)
Lisabeth argues that modern style guides are not descended from pedagogical textbooks but from 19th-century "conversation" and etiquette guides. These guides were not about teaching language but about mapping "social, racial and gendered territory". She uses the metaphor of "racialized parlor and kitchen geography" to argue that style guides are designed to separate "correct" language (the parlor) from other "overreaching" vernaculars (the kitchen) .
For both Dreyer and White language becomes theground upon which social relations are mapped according toa similar linguistic system of racialized parlor and kitchengeography
Lisabeth argues that modern style guides are not descended from pedagogical textbooks but from 19th-century "conversation" and etiquette guides. These guides were not about teaching language but about mapping "social, racial and gendered territory". Guides are designed to separate "correct" language (the parlor) from other "overreaching" vernaculars (the kitchen)
having near by.We do want standardization for writ-*ten English. We insist on absurd spellingsfor one and eight, and we demand twoa's in separate and two i's in definitewhether or not our pronunciations supportthe spellin
Long draws a line between different kinds of language rules. He argues for standardizing spelling in written English, but simultaneously insists that grammatical "differences in construction must be allowed". This suggests a practical compromise for educators: they can uphold a clear academic standard while still honoring a student's home language by allowing for variations in sentence structure and grammar.
Long draws a line between different kinds of language rules. He argues for standardizing spelling in written English, but simultaneously insists that grammatical "differences in construction must be allowed". This suggests a practical compromise for educators: they can uphold a clear academic standard while still honoring a student's home language by allowing for variations in sentence structure and grammar.
English has become the most widely used language in the field of education. However, the wide spread of English also means that globalization is not only beneficial for education, but it also poses a lot of questions related to language policy and the use of different languages for teaching and learning.
Emphasizes the importance of the teaching of English and English understanding as times change and English grows in use across the world.
was linked to better mental health and social capabilities, including the ability to perceive nuances in interpersonal relationships
this is mostly for fiction but reading helps people socially, emotionally, and helps to process information. The more we read the better we can communicate with one another.
more than 20 percent of people surveyed had a child under 9 years old, only 2 percent of those surveyed read with a child — a finding that stayed largely flat throughout the study period but that could contribute to further declines in adult reading going forward, the researchers said.
Parents are reading less to their kids and how is this going to affect them later on?
Wang et al. study how college students actually use AI tools like ChatGPT while writing application letters and personal statements. The researchers had 47 U.S. college students use AI to complete a real class assignment, then answer open-ended survey questions about what worked, what didn’t, and what they learned. The study found that students usually went through multiple rounds of prompts. They said AI was helpful for structure, professional wording, and connecting résumé details to the job or program. However, students also said the AI writing was often generic, repetitive, too robotic, and lacked personal voice or emotion. Students recommended improving AI drafts by adding personal stories, emotions, and specific details. Overall, most students felt positive about writing with AI, but the authors warn that teachers still need clear rules and guidance. This source helps show how real students use AI in writing and what strengths and weaknesses they notice firsthand
pology andforgiveness
Thesis Flowers argues that forgiveness, as often demanded in reconciliation politics that asks the oppressed to surrender resentment. Our state (Canada) apologies for residential schools, are one-time events, not structural transformation. Forgiveness presumes a single, past event, whereas colonialism is a continuing structure and it is still happening. It is not a past event only. Refusing to forgive Is both rejection of colonial violence and affirmation of Indigenous law, teachings, and love. It is especially justified given ongoing violence against Indigenous women and children. Flowers closes with stories of her grandmother and great-grandmother, who both enacted refusal in everyday encounters with racism and dispossession, showing how refusal can be a small but powerful reclaiming of dignity and agency.
Refusal to forgive,
The story of Flowers’ great‑grandmother’s refusal in a grocery store illustrates refusal as sovereignty and intergenerational strength. When it comes to the violence against Indigenous women, Flowers notes that activists often emphasize victims’ “lovability” to counter stereotypes, but this can sideline women who don’t fit idealized images of “loveable” frame of mind. She insists that naming ongoing colonial and white supremacy violence is necessary. Indigenous women refuse to forgive because the harm is still continuing in Canada towards many indegenous people on daily basis.
Hul’qumi’num’ concept of anger.
Hul’qumi’num’ concepts show resentment is not pathological but relational. It connects to Indigenous feminist epistemologies. Indigenous feminist epistemologies connect us to what counts as knowledge, who can be a knower, and how we know. Indigenous feminist epistemology asks how gendered, racialized, and colonial power shape what is seen as “truth.” As of now “anger” in indigenous feminist is seen or “framed” as a rage or as a “bad woman” attitude in the eyes of settlers or heteropatriarchal mindsets. However, only a true indigenous woman would understand that anger is a form of love for their communities, for their own selves, and for all the women, men, and children who lost their lives on the name of “civilization” on Canadian souls. And it is showing the respect towards whose lost souls to end the continues violence and unfair treatments towards indigenous communities. I think not only indigenous women, but all the feminists who have been seeing the continues form of colonialism and inequities should be angry and should refuse to forgive until the transformation of change comes in its true form on Canadian grounds.
I’d figured that the gooners would need some coaxing, some assurance that I wasn’t setting them up to be ridiculed. But it was like they’d been waiting to hear from me
of course they want to feel significant
unevenly distributed, polluted, mismanaged and wasted.
And now, on top of this, there's the issue of such high amounts of water being needed to cool AI computers that scarcity is only increasing. This is a resource that EVERYONE NEEDS TO SURVIVE, but it's treated like garbage and I cannot fathom why.
586 calories
I could just be incredibly stupid, but what does calories have to do with this?
Water is the universal solvent
Honestly, completely unrelated, but how is it that people develop an allergy to water? There's been several cases of it, but its such a pure element that I genuinely have to wonder.
I’d estimate that the differences here are more substantive than the similarities, in the sense that they concern the nature of deity, purpose of humanity, the relationship of God/gods to chaos, and the moral → soteriological dimension. But the similarities are important because they may reflect shared cultural and cosmological motifs of the ancient Near East, which the biblical authors both interacted with and differentiated themselves from.
This is a very well thought out comparison between the two entries. I think it was especially impressive to notice that although the differences were more substantial, you made a point to acknowledge the importance of their shared similarities and explained how that might show the motivations behind the culture.
The Math of Why You Can't Focus at Work
“You come heah wid yo’ mouf full uh foolishness on uh busy day. Heah you got uh prop tuh lean on all yo’ bawn days, and big protection, and everybody got tuh tip dey hat tuh you and call you Mis’ Killicks, and you come worryin’ me ’bout love.” “But Nanny, Ah wants to want him sometimes. Ah don’t want him to do all de wantin’.”
Notice the contrasting views of Nanny and Janie.
Nanny has had a rougher early life compared with Janie, being a former slave, and as a result, she doesn't even care about love. Having someone like Logan as a husband would be unimaginably good to Nanny when she was Janie's age.
Janie never faced slavery, and takes personal safety for granted, so she wants personal fulfillment as well.
Traditionally underrepresented students may be held at a distance from academia due to their language use and due to the fact that there are no allowable identities that are linked to standardness and representative of their various social groups.
Held at a distance but also "no allowable identities linked to standardness" ?
How would users participate in decision-making?
I think it would be good for users but definitely not beneficial for the company. As long as users are involved in the business or decision making, the dynamic will not be balanced. The company won’t be able to take full control, or it will cost them more to manage everything.
Mah fust wife never bothered me ’bout choppin’ no wood nohow. She’d grab dat ax and sling chips lak uh man. You done been spoilt rotten.
Janie wants her relationships to be fulfilling, rather than just having her do work for her husband, but Logan wants Janie to work—their views of a good marriage conflict.
Leaving One Dead
Another instance that blames the Tesla for exploding and killing someone right away. The article should say later that it was not actually the truck that did it, and that the man committed suicide, but this headline does not make that clear at all.
Utilizing a CC license can help get your work out to more people. A brief review of the different CC licenses:
I found this information to be very important. I was aware of the different licenses, but gaining some literacy about their meaning and its representation makes a big difference when selecting and engaging with diverse OERs. I would love to see practical examples of how these licenses can be applied.
Bilinguals generally have no difficulty in keeping their two languages apart, but a common occurrence is the deliberate mixing of the two languages.
Whenever bilingual people are speaking with friends or family members who are bilingual as well, they tend to mix in a word of the other language into the conversation.
To code switch means that I can write and speak en ingles and Spanish without any problemas.
Code switching isn't just a linguistic skills but also empowerment. Being able to move freely between languages allows the speaker to maintain their identity.
My use of both languages, my code switching, is my way to resist being made into something else… . This resistance is part of the anticolonial struggle against both the Spanish colonizers and the white colonizers… . Chicanas [Chicanos] are using a language that is true to our experience, that is true to the places where we grew up—New Mexico, Arizona, Texas the Midwest. To me it is a political choice, as well as an aesthetic choice.(Anzaldúa, 2000, p. 248)
From what I understand, it wasn't communication but survival..?
Ms. Tebbit’s playful “jest” is not the selfish desiresof an emotionally stunted fairy king, but a set offeminist and queer values for a more inclusive town/society
This quote reveals how this adaptation of MSD, repurposes the origional motives of Oberon the king, to a more playful and feminist/queer view from Ms.Tebbit. It adds to the film's overarching theme of inclusion and transformation within a community.
Timothy finds connection, but onewhich he himself must rewrite and revise in orderto speak his desires. This song/scene represents apowerful moment of selffashioning (Greenblatt1980) in the film, one in which Timothy remakeshimself visually (he paints his face in the makeup ofPuck; he adopts some costuming) and uses languageto remake those around him.
This quote highlights how Timothy transforms and expresses himself through fashion and language. His adaption of the existing shakespearean text reveal his true desires and personal identity. Changing the lyrics, ultimately created the love potion, which changes all the relationships around him to what he invisions.
Briefing : Le Rôle des Modèles dans le Développement de l'Enfant
Ce document de synthèse analyse le rôle complexe et multifacette des modèles dans le développement de l'enfant, en se basant sur les perspectives de psychologues, d'experts en développement et de témoignages personnels.
Il ressort que les parents constituent les modèles les plus fondamentaux, dont l'influence est primordiale durant les premières années.
Cependant, la recherche de la perfection parentale est contre-productive ; l'authenticité, la capacité à reconnaître ses erreurs et à s'excuser sont bien plus formatrices.
L'enfant n'imite pas aveuglément mais opère une sélection rigoureuse de ses modèles, privilégiant la compétence, la familiarité et la confiance.
Les modèles parentaux dysfonctionnels, marqués par l'addiction ou des troubles psychiques, ont des conséquences graves et durables sur la sécurité affective et l'estime de soi de l'enfant.
À l'adolescence, la recherche de modèles s'élargit au-delà du cercle familial pour construire une identité propre, un processus sain de différenciation qui peut inclure la rébellion et l'adhésion à des groupes de pairs.
Enfin, une perspective émergente et cruciale est mise en lumière : les enfants et adolescents ne sont pas de simples récepteurs passifs mais peuvent être de puissants modèles et des acteurs de changement, capables d'influencer positivement leur entourage, y compris leurs propres parents, et de façonner la société de demain.
--------------------------------------------------------------------------------
Le processus par lequel un enfant choisit et imite un modèle est loin d'être passif.
Il repose sur des mécanismes neurologiques et psychologiques complexes qui démontrent une grande sélectivité dès le plus jeune âge.
• Bases Neurologiques : Selon Moritz Köster, professeur de psychologie du développement, lorsqu'un enfant observe quelqu'un agir, des séquences de mouvements similaires sont activées dans son propre cortex moteur au niveau cellulaire.
• Sélectivité Basée sur la Confiance : L'enfant n'imite pas tout ce qu'il voit. Son choix est nuancé par les émotions et une évaluation de la personne observée. Les principaux critères de sélection sont :
◦ La familiarité : Il préférera imiter une personne qu'il connaît.
◦ La compétence : Il analyse si la personne a déjà fait des choses "intelligentes" ou des erreurs, et choisira d'imiter la personne jugée la plus compétente.
◦ L'autorité : Pour tout ce qui est nouveau, l'enfant se tournera préférentiellement vers les adultes, qu'il perçoit comme des figures de confiance.
• Apprentissage des Normes : C'est principalement en observant le comportement des adultes et de leur entourage que les enfants apprennent et intègrent les valeurs et les normes sociales.
Lise, 8 ans : "Pour moi un modèle c'est quand on fait quelque chose de bien et que quelqu'un d'autre nous imite."
L'environnement familial, et plus particulièrement les parents, constitue la première et la plus puissante source de modèles pour un enfant, une influence que les parents ont souvent tendance à sous-estimer.
Durant les premières années de vie (1-2 ans), l'environnement de l'enfant est restreint aux parents et grands-parents.
Leur comportement façonne entièrement la compréhension initiale de l'enfant sur les interactions sociales.
• Apprentissage des Comportements Sociaux : La manière de gérer un conflit, d'éviter les disputes ou de présenter des excuses est directement apprise par l'observation des parents.
• Ancrage Émotionnel : Si les échanges familiaux sont marqués par la bienveillance et l'amour, l'enfant intègre ce modèle. Inversement, si les cris ou la violence sont la norme, il retiendra ce schéma comme référence.
• La Famille comme Microcosme : Au départ, l'enfant perçoit le monde entier comme fonctionnant selon les règles de sa propre famille. Ce n'est qu'à son entrée en maternelle qu'il découvre la diversité des modes de fonctionnement.
La psychologue Nora Imlau met en garde contre la volonté de certains parents de devenir "parfaits" après la naissance d'un enfant, la qualifiant de "très mauvaise idée".
• L'Inauthenticité : Les enfants ressentent très bien quand leurs parents ne sont pas authentiques, se mettent la pression et ignorent leurs propres besoins.
• Un Standard Inatteignable : Un enfant confronté à des modèles "parfaits" (qui ne se mettent jamais en colère, ne perdent jamais patience) n'a aucune chance de faire aussi bien.
Il sera sans cesse confronté à ses propres insuffisances.
• L'Importance de l'Erreur : Le fait que les parents commettent des erreurs est une opportunité d'apprentissage cruciale.
Cela permet à l'enfant d'apprendre comment on gère ses propres erreurs.
Présenter ses excuses à ses enfants pour des propos qui ont "dépassé notre pensée" est un acte modelant très puissant.
Nora Imlau, psychologue : "Ce que j'entends par parents parfaits, ce sont les parents qui ne se mettent jamais en colère, qui ne perdent jamais patience [...] ce qui est inhumain en soi."
Le comportement d'un enfant est souvent le reflet de l'état d'âme inconscient de ses parents. Un enfant agité peut être le miroir d'un parent stressé ou préoccupé.
• La Gestion de la Tristesse : Quand un parent est triste et qu'un enfant vient le consoler, il est conseillé d'accepter cette aide dans un premier temps.
Cependant, il est crucial que le parent reprenne ensuite le contrôle et rassure l'enfant sur sa capacité à gérer la situation, afin de ne pas inverser les rôles et de préserver l'enfant de la charge de ses responsabilités d'adulte.
• La Vulnérabilité Assumée : Une mère souffrant de trouble bipolaire témoigne de sa capacité à être présente pour ses enfants même dans les phases de dépression, tout en ne cachant pas sa tristesse.
Cela illustre la possibilité de rester un parent fonctionnel malgré des difficultés psychiques.
Lorsque les parents ne peuvent pas s'occuper correctement de leurs enfants, que ce soit à cause d'une dépendance ou d'un trouble psychique, les conséquences sur le développement de l'enfant sont multiples et profondes.
Le témoignage de Mia, 16 ans, dont le père était alcoolique, illustre les dégâts d'un modèle parental défaillant.
• Rupture de la Confiance : Un parent souffrant de dépression ou d'addiction n'est plus en mesure d'interpréter correctement les signaux de son enfant et d'y réagir de manière adaptée.
L'enfant retient que ses besoins ne sont pas satisfaits.
• Attachement Insécurisant : La relation d'attachement parent-enfant ne devient pas sécurisante, ce qui entrave la construction de la confiance en soi.
Cette confiance initiale est pourtant la base essentielle du développement de l'autonomie.
• Hypervigilance de l'Enfant : L'enfant est constamment aux aguets, utilisant une énergie considérable pour anticiper les réactions de ses parents et adapter son propre comportement, ce qui peut entraîner des problèmes d'autonomie et de sentiment de sécurité à l'âge adulte.
Mia, 16 ans : "En fait il fallait toujours qu'on soit la famille parfaite, on parlait jamais des problèmes, on avait pas le droit d'en parler et ça c'est très mal."
Suite à la séparation de ses parents et à ses propres difficultés psychologiques, Mia a été confrontée à des "modèles toxiques" dans un cadre thérapeutique.
• Influence des Pairs : En observant des jeunes toxicodépendants, elle a perçu leur consommation comme un moyen de "déconnecter totalement" et de ne plus être accessible émotionnellement, un état qu'elle a alors désiré atteindre.
• Augmentation de la Consommation : Son exposition à ces modèles a directement influencé son propre comportement, entraînant une augmentation significative de sa consommation d'alcool.
L'adolescence est une période de questionnements identitaires intenses ("Qui suis-je ?") où la recherche de modèles s'intensifie et s'étend au-delà du cercle familial.
Selon la psychothérapeute Isabelle Filliozat, l'adolescent va "chercher des modèles un petit peu partout pour [s]'aider à se construire".
• Le Rôle du Groupe : Le désir d'appartenance à un groupe de pairs est très fort.
Le groupe offre un cadre identitaire ("dans mon groupe on fait les choses d'une certaine manière [...] je sais à peu près qui je suis").
• Gestion des Modèles Négatifs : Lorsqu'un enfant adhère à un modèle jugé "malsain" (agressif, délinquant), la réaction parentale la plus constructive n'est pas de chercher à changer le comportement extérieur, mais de s'intéresser aux besoins et aux émotions de l'enfant qui le poussent vers ce modèle.
En répondant à ces besoins profonds, l'enfant est plus susceptible d'abandonner de lui-même le modèle négatif.
La révolte contre les parents à l'adolescence est un processus "sain et normal", une étape nécessaire du développement.
• Processus de Détachement : Les frictions parents-enfants font partie du processus de détachement et de la prise de conscience par l'adolescent qu'il est une personne à part entière, distincte de ses parents.
• Différenciation : Pour se construire, l'adolescent a besoin de s'opposer, de définir en quoi il est différent de ses parents (valeurs, mentalité) mais aussi en quoi il leur ressemble.
Ce processus est essentiel pour pouvoir, à terme, quitter le foyer et construire une nouvelle relation, d'adulte à adulte, avec ses parents.
La vision traditionnelle du modèle descendant (adulte vers enfant) est de plus en plus complétée par une reconnaissance du rôle actif des jeunes comme modèles et agents d'influence.
Des recherches ont démontré que les enfants peuvent avoir une influence positive sur la manière de penser et sur le comportement de leurs parents.
• "L'Hypothèse des Anniversaires" : Dans des zones post-conflit, le fait que des enfants d'un groupe ethnique ou religieux invitent à leur anniversaire des enfants d'un groupe adverse force les parents des deux bords à entrer en contact.
Il a été observé que lorsque l'attitude des enfants envers "l'autre groupe" change, celle des parents change également.
• Acteurs de Paix : Les enfants peuvent ainsi devenir des acteurs clés de la promotion de la paix.
Des adolescents comme Noé Renard, 17 ans, s'imposent comme des modèles d'engagement pour leur génération.
• Rendre l'Engagement Accessible : En créant l'association "les engagés Marseille", son but est de montrer l'exemple et de permettre à d'autres jeunes de se mobiliser sur des enjeux locaux (inégalités, pollution, mobilité).
• Une Voix pour la Jeunesse : De nombreux jeunes partagent le sentiment de ne pas être suffisamment écoutés dans les institutions politiques.
Ils peuvent devenir des modèles pour leurs pairs mais aussi pour les chercheurs, comme l'illustre la mise en place d'un Conseil consultatif de la jeunesse à l'Université libre de Berlin.
Noé Renard, 17 ans : "Défendre des causes c'est pas le faire pour soi mais c'est plutôt le faire pour les autres et je pense que c'est ça qui est important c'est de pouvoir montrer aux autres que l'engagement c'est [...] surtout pour les autres et pour aider ceux qui en ont besoin."
Une critique est formulée quant au fait d'attendre la majorité pour accorder le droit de vote sans formation préalable aux règles de la démocratie.
• Apprentissage Précoce : Les experts plaident pour que les enfants apprennent beaucoup plus tôt comment fonctionne un consensus, comment on règle les conflits dans une démocratie, et qu'ils aient davantage d'influence sur leur vie quotidienne.
• Faire Confiance : Pour que les jeunes développent leur identité et leur capacité à prendre des responsabilités, les parents doivent apprendre à leur faire confiance et à les laisser expérimenter par eux-mêmes, même si c'est "à leur façon".
In the morning, one might say, his face was of a fine florid hue, but after twelve o’clock, meridian—his dinner hour—it blazed like a grate full of Christmas coals; and continued blazing— but, as it were, with a gradual wane—till 6 o’clock, p.m. or thereabouts, after which I saw no more of the proprietor of the face, which gaining its meridian with the sun, seemed to set with it, to rise, culminate, and decline the following day, with the like regularity and undiminished glory.
[STY] Long, exhaustive sentences: Bore and confuse the reader -> stuplime (Ngai).
Now, valuing his morning services as I did, and resolved not to lose them; yet, at the same time made uncomfortable by his inflamed ways after twelve o’clock; and being a man of peace, unwilling by my admonitions to call forth unseemly retorts from him; I took upon me, one Saturday noon (he was always worse on Saturdays), to hint to him, very kindly, that perhaps now that he was growing old, it might be well to abridge his labors; in short, he need not come to my chambers after twelve o’clock, but, dinner over, had best go home to his lodgings and rest himself till teatime.
[STY] Long, exhaustive sentences: Bore and confuse the reader -> stuplime (Ngai).
Whereas with respect to Turkey, I had much ado to keep him from being a reproach to me. His clothes were apt to look oily and smell of eating-houses. He wore his pantaloons very loose and baggy in summer. His coats were execrable; his hat not to be handled. But while the hat was a thing of indifference to me, inasmuch as his natural civility and deference, as a dependent Englishman, always led him to doff it the moment he entered the room, yet his coat was another matter.
[STY] Minute detail.
But I am not particular.
[STY] Repetition.
There would seem little need for proceeding further in this history. Imagination will readily supply the meager recital of poor Bartleby’s interment.
[INT] The coda conlcudes with an external report that the narrator was given after Bartleby's death: Apparently, Bartleby had been employed at a Dead Letter Office in Washington before, meaning that he had to talke care of letters addressed at people already deceived. Before applying for a job at the lawyer's office, he was let off surprisingly, presumably leading him to lose his fortune and maybe also his social ties. That would explain his peculiar isolated situation when he came into the story's plot, but the exact circumastances remain for speculation.
And so I found him there, standing all alone in the quietest of the yards, his face towards a high wall, while all around, from the narrow slits of the jail windows, I thought I saw peering out upon him the eyes of murderers and thieves.
[INT] For the lawyer, Bartleby does not belong in prison - technically, he did not commit any grave crimes but nobody knew what else to do with a person that does not fit into society. As in the office, Bartleby is staring at a brick wall, seemingly disinterested in his surroundings.
I am not particular
[SCH] "Bartleby declines all of these offers and so his complaint seems to be more fundamental than mere personal preference. Three times Bartleby simply states: "I am not particular." Melville spins a pun on the adjective. On the one hand, Bartleby is saying that he is not particular, or "choosey," about the work he does; his dissatisfaction is not with the work environment or the nature of the work but with the employer-employee relationship.On the other hand, by stressing that he is not "particular," Bartleby is also asserting that he is not "unique" but a member of a class: dependent, wage-earning employees" (Kuebrich 400).
“These gentlemen, my tenants, cannot stand it any longer; Mr. B—” pointing to the lawyer, “has turned him out of his room, and he now persists in haunting the building generally, sitting upon the banisters of the stairs by day, and sleeping in the entry by night.
[INT] Now thrown out of the offices but still living in the building, Bartleby proves to be a "burden" for the community.
Since he will not quit me, I must quit him. I will change my offices; I will move elsewhere; and give him fair notice, that if I find him on my new premises I will then proceed against him as a common trespasser.
[INT] Lawyer concludes that the only way of getting rid of Bartleby is not by offering him motives to move out, but to move his own offices elsewhere. Since Bartleby is not dependent on his labor for the lawyer anymore, but much more dependent on the office as a place to live, the lawyer thinks by moving offices, Bartleby is simply not a problem for him anymore.