```js var name = 'Alfred'; var age = 47;
function greet(){
console.log(arguments[0]);
console.log(arguments[1]);
console.log(arguments[2]);
}
greetI'm ${name}. I'm ${age} years old.;
```
```js var name = 'Alfred'; var age = 47;
function greet(){
console.log(arguments[0]);
console.log(arguments[1]);
console.log(arguments[2]);
}
greetI'm ${name}. I'm ${age} years old.;
```
Author Response
Reviewer #1 (Public Review):
How morphogens spread within tissues remains an important question in developmental biology. Here the authors revisit the role of glypicans in the formation of the Dpp gradient in wing imaginal discs of Drosophila. They first use sophisticated genome engineering to demonstrate that the two glypicans of Drosophila are not equivalent despite being redundant for viability. They show that Dally is the relevant glypican for Dpp gradient formation. They then provide genetic evidence that, surprisingly, the core domain of Dally suffices to trap Dpp at the cell surface (suggesting a minor role for GAGs). They conclude with a model that Dally modulates the range of Dpp signaling by interfering with Dpp's degradation by Tkv. These are important conclusions, but more independent (biochemical/cell biological) evidence is needed.
As indicated above, the genetic evidence for the predominant role of Dally in Dpp protein/signalling gradient formation is strong. In passing, the authors could discuss why overexpressed Dlp has a negative effect on signaling, especially in the anterior compartment. The authors then move on to determine the role of GAG (=HS) chains of Dally. They find that in an overexpression assay, Dally lacking GAGs traps Dpp at the cell surface and, counterintuitively, suppresses signaling (fig 4 C, F). Both findings are unexpected and therefore require further validation and clarification, as outlined in a and b below.
a) In loss of function experiments (dallyDeltaHS replacing endogenous dally), Dpp protein is markedly reduced (fig 4R), as much as in the KO (panel Q), suggesting that GAG chains do contribute to trapping Dpp at the cell surface. This is all the more significant that, according to the overexpression essays, DallyDeltaHS seems more stable than WT Dally (by the way, this difference should also be assessed in the knock-ins, which is possible since they are YFP-tagged). The authors acknowledge that HS chains of Dally are critical for Dpp distribution (and signaling) under physiological conditions. If this is true, one can wonder why overexpressed dally core 'binds' Dpp and whether this is a physiologically relevant activity.
According to the overexpression assay, DallyDeltaHS seems more stable than WT Dally (Fig. 4B’, E’, 5H, I). As the reviewer suggested, we addressed the difference using the two knock-in alleles and found that DallyDeltaHS is more stable than WT Dally (Fig.4 L, M inset), further emphasizing the insufficient role of core protein of Dally for extracellular Dpp distribution.
(During the revising our figure, we found labeling mistake in Fig. 4M, N and Fig. 4Q, R and corrected the genotypes.)
In summary, we showed that, although Dally interacts with Dpp mainly through its core protein from the overexpression assay (Fig. 4E, I), HS chains are essential for extracellular Dpp distribution (Fig. 4R). Thus, the core protein of Dally alone is not sufficient for extracellular Dpp distribution under physiological conditions. These results raise a question about whether the interaction of core protein of Dally with Dpp is physiologically relevant. Since the increase of HS upon dally expression but not upon dlp expression resulted in the accumulation of extracellular Dpp (Fig. 2) and this accumulation was mainly through the core protein of Dally (Fig. 4E, I), we speculate that the interaction of the core protein of Dally with Dpp gives ligand specificity to Dally under physiological conditions.
To understand the importance of the interaction of core protein of Dally with Dpp under physiological conditions, it is important to identify a region responsible for the interaction. Our preliminary results overexpressing a dally mutant lacking the majority of core protein (but keeping the HS modified region intact) showed that HS chains modification was also lost. Although this is consistent with our results that enzymes adding HS chains also interact with the core protein of Dally (Fig. 4D), the dally mutant allele lacking the core protein would hamper us from distinguishing the role of core protein of Dally from HS chains.
Nevertheless, we can infer the importance of the interaction of core protein of Dally with Dpp using dally[3xHA-dlp, attP] allele, where dlp is expressed in dally expressing cells. Since Dally-like is modified by HS chains but does not interact with Dpp (Fig. 2, 4), dally[3xHA-dlp, attP] allele mimics a dally allele where HS chains are properly added but interaction of core protein with Dpp is lost. As we showed in Fig.3O, S, the allele could not rescue dallyKO phenotypes, consistent with the idea that interaction of core protein of Dally with Dpp is essential for Dpp distribution and signaling and HS chain alone is not sufficient for Dpp distribution.
b) Although the authors' inference that dallycore (at least if overexpressed) can bind Dpp. This assertion needs independent validation by a biochemical assay, ideally with surface plasmon resonance or similar so that an affinity can be estimated. I understand that this will require a method that is outside the authors' core expertise but there is no reason why they could not approach a collaborator for such a common technique. In vitro binding data is, in my view, essential.
We agree with the reviewer that a biochemical assay such as SPR helps us characterize the interaction of core protein of Dally and Dpp (if the interaction is direct), although the biochemical assay also would not demonstrate the interaction under the physiological conditions.
However, SPR has never been applied in the case of Dpp, probably because purifying functional refolded Dpp dimer from bacteria has previously been found to be stable only in low pH and be precipitated in normal pH buffer (Groppe J, et al., 1998)(Matsuda et al., 2021). As the reviewer suggests, collaborating with experts is an important step in the future.
Nevertheless, SPR was applied for the interaction between BMP4 and Dally (Kirkpatrick et al., 2006), probably because BMP4 is more stable in the normal buffer. Although the binding affinity was not calculated, SPR showed that BMP4 directly binds to Dally and this interaction was only partially inhibited by molar excess of exogenous HS, suggesting that BMP4 can interact with core protein of Dally as well as its HS chains. In addition, the same study applied Co-IP experiments using lysis of S2 cells and showed that Dpp and core protein of Dally are co-immunoprecipitated, although it does not demonstrate if the interaction is direct.
In a subsequent set of experiments, the authors assess the activity of a form of Dpp that is expected not to bind GAGs (DppDeltaN). Overexpression assays show that this protein is trapped by DallyWT but not dallyDeltaHS. This is a good first step validation of the deltaN mutation, although, as before, an invitro binding assay would be preferable.
Our overexpression assays actually showed that DppDeltaN is trapped by DallyWT and by dallyDeltaHS at similar levels (Fig. 5H-J), indicating that interaction of DppDeltaN and HS chains of Dally is largely lost but DppDeltaN can still interact with core protein of Dally.
(Related to this, we found typo in the sentence “In contrast, the relative DppΔN accumulation upon DallyΔHS expression in JAX;dppΔN was comparable to that upon DallyΔHS expression in JAX;dppΔN (Fig. 5H-J).” and corrected as follows, “In contrast, the relative DppΔN accumulation upon Dally expression in JAX;dppΔN was comparable to that upon DallyΔHS expression in JAX;dppΔN (Fig. 5H-J).”
We thank the reviewer for the suggesting the in vitro experiment. Although we decided not to develop biophysical experiments such as SPR for Dpp in this study due to the reasons discussed above, we would like to point out that our result is consistent with a previous Co-IP experiment using S2 cells showing that DppDeltaN loses interaction with heparin (Akiyama2008).
However, in contrast to our results, the same study also proposed by Co-IP experiments using S2 cells that DppDeltaN loses interaction with Dally (Akiyama2008). Although it is hard to conclude since western blotting was too saturated without loading controls and normalization (Fig. 1C in Akiyama 2008), and negative in vitro experiments do not necessarily demonstrate the lack of interaction in vivo. One explanation why the interaction was missed in the previous study is that some factors required for the interaction of DppDeltaN with core protein of Dally are missing in S2 cells. In this case, in vivo interaction assay we used in this study has an advantage to robustly detect the interaction.
Nevertheless, the authors show that DppDeltaN is surprisingly active in a knock-in strain. At face value (assuming that DeltaN fully abrogates binding to GAGs), this suggests that interaction of Dpp with the GAG chains of Dally is not required for signaling activity. This leads to authors to suggest (as shown in their final model) that GAG chains could be involved in mediating the interactions of Dally with Tkv (and not with Dpp. This is an interesting idea, which would need to be reconciled with the observation that the distribution of Dpp is affected in dallyDeltaHS knock-ins (item a above). It would also be strengthened by biochemical data (although more technically challenging than the experiments suggested above). In an attempt to determine the role of Dally (GAGs in particular) in the signaling gradient, the paper next addresses its relation to Tkv. They first show that reducing Tkv leads to Dpp accumulation at the cell surface, a clear indication that Tkv normally contributes to the degradation of Dpp. From this they suggest that Tkv could be required for Dpp internalisation although this is not shown directly. The authors then show that a Dpp gradient still forms upon double knockdown (Dally and Tkv). This intriguing observation shows that Dally is not strictly required for the spread of Dpp, an important conclusion that is compatible with early work by Lander suggesting that Dpp spreads by free diffusion. These result show that Dally is required for gradient formation only when Tkv is present. They suggest therefore that Dally prevents Tkv-mediated internalisation of Dpp. Although this is a reasonable inference, internalisation assays (e.g. with anti-Ollas or anti-HA Ab) would strengthen the authors' conclusions especially because they contradict a recent paper from the Gonzalez-Gaitan lab.
Thanks for suggesting the internalization assay. As we discussed in the discussion, our results suggest that extracellular Dpp distribution is severely reduced in dally mutants due to Tkv mediated internalization of Dpp (Fig. 6). Thus, extracellular Dpp available for labelling with nanobody is severely reduced in dally mutants, which can explain the reduced internalization of Dpp in dally mutants in the internalization assay. Therefore, we think that the nanobody internalization assay would not distinguish the two contradicting possibilities.
The paper ends with a model suggesting that HS chains have a dual function of suppressing Tkv internalisation and stimulating signaling. This constitutes a novel view of a glypican's mode of action and possibly an important contribution of this paper. As indicated above, further experiments could considerably strengthen the conclusion. Speculation on how the authors imagine that GAG chains have these activities would also be warranted.
Thank you very much!
Reviewer #2 (Public Review):
The authors are trying to distinguish between four models of the role of glypicans (HSPGs) on the Dpp/BMP gradient in the Drosophila wing, schematized in Fig. 1: (1) "Restricted diffusion" (HSPGs transport Dpp via repetitive interaction of HS chains with Dpp); (2) "Hindered diffusion" (HSPGs hinder Dpp spreading via reversible interaction of HS chains with Dpp); (3) "Stabilization" (HSPGs stabilize Dpp on the cell surface via reversible interaction of HS chains with Dpp that antagonizes Tkv-mediated Dpp internalization); and (4) "Recycling" (HSPGs internalize and recycle Dpp).
To distinguish between these models, the authors generate new alleles for the glypicans Dally and Dally-like protein (Dlp) and for Dpp: a Dally knock-out allele, a Dally YFP-tagged allele, a Dally knock-out allele with 3HA-Dlp, a Dlp knock-out allele, a Dlp allele containing 3-HA tags, and a Dpp lacking the HS-interacting domain. Additionally, they use an OLLAS-tag Dpp (OLLAS being an epitope tag against which extremely high affinity antibodies exist). They examine OLLAS-Dpp or HA-Dpp distribution, phospho-Mad staining, adult wing size.
They find that over-expressed Dally - but not Dlp - expands Dpp distribution in the larval wing disc. They find that the Dally[KO] allele behaves like a Dally strong hypomorph Dally[MH32]. The Dally[KO] - but not the Dlp[KO] - caused reduced pMad in both anterior and posterior domains and reduced adult wing size (particularly in the Anterior-Posterior axis). These defects can be substantially corrected by supplying an endogenously tagged YFP-tagged Dally. By contrast, they were not rescued when a 3xHA Dlp was inserted in the Dally locus. These results support their conclusion that Dpp interacts with Dally but not Dlp.
They next wanted to determine the relative contributions of the Dally core or the HS chains to the Dpp distribution. To test this, they over-expressed UAS-Dally or UAS-Dally[deltaHS] (lacking the HS chains) in the dorsal wing. Dally[deltaHS] over-expression increased the distribution of OLLAS-Dpp but caused a reduction in pMad. Then they write that after they normalize for expression levels, they find that Dally[deltaHS] only mildly reduces pMad and this result indicates a major contribution of the Dally core protein to Dpp stability.
Thanks for the comments. We actually showed that compared with Dally overexpression, Dally[deltaHS] overexpression only mildly reduces extracellular Dpp accumulation (Fig. 4I). This indicates a major contribution of the Dally core protein to interaction with Dpp, although the interaction is not sufficient to sustain extracellular Dpp distribution and signaling gradient.
The "normalization" is a key part of this model and is not mentioned how the normalization was done. When they do the critical experiment, making the Dally[deltaHS] allele, they find that loss of the HS chains is nearly as severe as total loss of Dally (i.e., Dally[KO]). Additionally, experimental approaches are needed here to prove the role of the Dally core.
Since the expression level of Dally[deltaHS] is higher than Dally when overexpressed, we normalized extracellular Dpp distribution (a-Ollas staining) against GFP fluorescent signal (Dally or Dally[deltaHS]). To do this, we first extracted both signal along the A-P axis from the same ROI. The ratio was calculated by dividing the intensity of a-Ollas staining with the intensity of GFP fluorescent signal at a given position x. The average profile from each normalized profile was generated and plotted using the script described in the method (wingdisc_comparison.py) as other pMad or extracellular staining profiles.
Although this analysis provides normalized extracellular Dpp accumulation at different positions along the A-P axis, we are more interested in the total amount of Dpp or DppDeltaN accumulation upon Dally or dallyDeltaHS expression. Therefore, we plan to analyze the normalized total amount of Dpp against GFP fluorescent signal (Dally or Dally[deltaHS]) in the revised ms. In this case, normalization will be performed by dividing total signal intensity of extracellular Dpp staining (ExOllas staining) divided by GFP fluorescent signal (Dally or Dally[deltaHS]) in ROI in each wing disc.
We agree with the reviewer that additional experimental approaches are needed to address the role of the core protein of Dally. As we discussed in the response to the reviewer1, to understand the importance of the interaction of core protein of Dally with Dpp, it is important to identify a region responsible for the interaction. Our preliminary results overexpressing a dally mutant lacking the majority of core protein (but keeping the HS modified region intact) showed that HS chains modification was also lost. Although this is consistent with our results that enzymes adding HS chains also interact with the core protein of Dally (Fig. 4D), the dally mutant allele lacking the core protein would hamper us from distinguishing the role of the core protein of Dally from HS chains.
Nevertheless, we can infer the importance of the interaction of core protein of Dally with Dpp using dally[3xHA-dlp, attP] allele, where dlp is expressed in dally expressing cells. Since Dally-like is modified by HS chains but does not interact with Dpp (Fig. 2, 4), dally[3xHA-dlp, attP] allele mimics a dally allele where HS chains are properly added but interaction of core protein with Dpp is lost. As we showed in Fig.3O, S, the allele could not rescue dallyKO phenotypes, consistent with the idea that interaction of core protein of Dally with Dpp is essential for Dpp distribution and signaling.
Prior work has shown that a stretch of 7 amino acids in the Dpp N-terminal domain is required to interact with heparin but not with Dpp receptors (Akiyama, 2008). The authors generated an HA-tagged Dpp allele lacking these residues (HA-dpp[deltaN]). It is an embryonic lethal allele, but they can get some animals to survive to larval stages if they also supply a transgene called “JAX” containing dpp regulatory sequences. In the JAX; HA-dpp[deltaN] mutant background, they find that the distribution and signaling of this Dpp molecule is largely normal. While over-expressed Dally can increase the distribution of HA-dpp[deltaN], over-expression of Dally[deltaHS] cannot. These latter results support the model that the HS chains in Dally are required for Dpp function but not because of a direct interaction with Dpp.
Our overexpression assays actually showed that both Dally and Dally[deltaHS] can accumulate Dpp upon overexpression and the accumulation of Dpp is comparable after normalization (Fig. 5H-J), consistent with the idea that interaction of DppdeltaN and HS chains are largely lost. As the reviewer pointed out, these results support the model that the HS chains in Dally are required for Dpp function but not because of a direct interaction with Dpp.
In the last part of the results, they attempt to determine if the Dpp receptor Thickveins (Tkv) is required for Dally-HS chains interaction. The 2008 (Akiyama) model posits that Tkv activates pMad downstream of Dpp and also internalizes and degrades Dpp. A 2022 (Romanova-Michaelides) model proposes that Dally (not Tkv) internalizes Dpp.
To distinguish between these models, the authors deplete Tkv from the dorsal compartment of the wing disc and found that extracellular Dpp increased and expanded in that domain. These results support the model that Tkv is required to internalize Dpp.
They then tested the model that Dally antagonizes Tkv-mediated Dpp internalization by determining whether the defective extracellular Dpp distribution in Dally[KO] mutants could be rescued by depleting Tkv. Extracellular Dpp did increase in the D vs V compartment, potentially providing some support for their model. However, there are no statistics performed, which is needed for full confidence in the results. The lack of statistics is particularly problematic (1) when they state that extracellular Dpp does not rise in ap>tkv RNAi vs ap>tkv RNAi, dally[KO] wing discs (Fig. 6E) or (2) when they state that extracellular Dpp gradient expanded in the dorsal compartment when tkv was dorsally depleted in dally[deltaHS] mutants (Fig. 6I). These last two experiments are important for their model but the differences are assessed only visually. In fact, extracellular Dpp in ap>tkv RNAi, dally[KO] (Fig. 6B) appears to be lower than extracellular Dpp in ap>tkv RNAi (Fig. 6A) and the histogram of Dpp in ap>tkv RNAi, dally[KO] is actually a bit lower than Dpp in ap>tkv RNAi, But the author claim that there is no difference between the two. Their conclusion would be strengthened by statistical analyses of the two lines.
We will provide the statistical analyses in the revised ms.
Strengths:
1) New genomically-engineered alleles
A considerable strength of the study is the generation and characterization of new Dally, Dlp and Dpp alleles. These reagents will be of great use to the field.
Thanks. We hope that these resources are indeed useful to the field.
2) Surveying multiple phenotypes
The authors survey numerous parameters (Dpp distribution, Dpp signaling (pMad) and adult wing phenotypes) which provides many points of analysis.
Thanks!
Weaknesses:
1) Confusing discussion regarding the Dally core vs HS in Dpp stability. They don't provide any measurements or information on how they "normalize" for the level of Dally vs Dally[deltaHS]? This is important part of their model that currently is not supported by any measurements.
We explained how we normalized in the above section. We will update the analysis in the revised ms.
2) Lacking quantifications and statistical analyses:
a) Why are statistical significance for histograms (pMad and Dpp distribution) not supplied? These histograms provide the key results supporting the authors' conclusions but no statistical tests/results are presented. This is a pervasive shortcoming in the current study.
Thanks. We will provide statistics in the revised ms.
b) dpp[deltaN] with JAX transgene - it would strengthen the study to supply quantitative data on the percent survival/lethal stage of dpp[deltaN] mutants with or without the JAK transgene
In this study, we are interested in the role of dpp[deltaN] during the wing disc development. Therefore, we decided not to perform the detailed analysis on the percent survival/lethal stage of dpp[deltaN] mutants with or without the JAX transgene in the current study. Nevertheless, the fact that dpp[deltaN] allele is maintained with a balanced stock and JAX;dpp[deltaN] allele can be maintained as homozygous stock indicates that the lethality of dpp[deltaN] allele comes from the early stages. Indeed, our preliminary results showed that pMad signal is severely lost in the dpp[deltaN] embryo without JAX (data not shown), indicating that the allele is lethal at early embryonic stages.
c) The graphs on wing size etc should start at zero.
Thanks. We corrected this in the current ms.
d) The sizes of histograms and graphs in each figure should be increased so that the reader can properly assess them. Currently, they are very small.
Thanks. We changed the sizes in the current ms.
The authors' model is that Dally (not Dlp) is required for Dpp distribution and signaling but that this is not due to a direct interaction with Dpp. Rather, they posit that Dally-HS antagonize Tkv-mediated Dpp internalization. Currently the results of the experiments could be considered consistent with their model, but as noted above, the lack of statistical analyses of some parameters is a weakness.
Thanks. We will perform the statistical analyses in the revised ms.
One problematic part of their result for me is the role of the Dally core protein (Fig. 7B). There is a mis-match between the over-expression results and Dally allele lacking HS (but containing the core). Finally, their results support the idea that one or more as-yet unidentified proteins interact with Dally-HS chains to control Dpp distribution and signaling in the wing disc.
Our results simply suggest that Dpp can interact with Dally mainly through core protein but this interaction is not sufficient to sustain extracellular Dpp gradient formation under physiological conditions (dallyDeltaHS) (Fig. 4Q). We find that the mis-match is not problematic if the role of Dally is not simply mediated through interaction with Dpp. We speculate that interaction of Dpp and core protein of Dally is transient and not sufficient to sustain the Dpp gradient without HS chains of Dally stabilizing extracellular Dpp distribution by blocking Tkv-mediated Dpp internalization.
There is much debate and controversy in the Dpp morphogen field. The generation of new, high quality alleles in this study will be useful to Drosophila community, and the results of this study support the concept that Tkv but not Dally regulate Dpp internalization. Thus the work could be impactful and fuel new debates among morphogen researchers.
Thanks.
The manuscript is currently written in a manner that really is only accessible to researchers who work on the Dpp gradient. It would be very helpful for the authors to re-write the manuscript and carefully explain in each section of the results (1) the exact question that will be asked, (2) the prior work on the topic, (3) the precise experiment that will be done, and (4) the predicted results. This would make the study more accessible to developmental biologists outside of the morphogen gradient and Drosophila communities.
Thanks. We will modify our texts to help non-experts understand our story in the revised ms.
Reviewer #2 (Public Review):
The authors are trying to distinguish between four models of the role of glypicans (HSPGs) on the Dpp/BMP gradient in the Drosophila wing, schematized in Fig. 1: (1) "Restricted diffusion" (HSPGs transport Dpp via repetitive interaction of HS chains with Dpp); (2) "Hindered diffusion" (HSPGs hinder Dpp spreading via reversible interaction of HS chains with Dpp); (3) "Stabilization" (HSPGs stabilize Dpp on the cell surface via reversible interaction of HS chains with Dpp that antagonizes Tkv-mediated Dpp internalization); and (4) "Recycling" (HSPGs internalize and recycle Dpp).
To distinguish between these models, the authors generate new alleles for the glypicans Dally and Dally-like protein (Dlp) and for Dpp: a Dally knock-out allele, a Dally YFP-tagged allele, a Dally knock-out allele with 3HA-Dlp, a Dlp knock-out allele, a Dlp allele containing 3-HA tags, and a Dpp lacking the HS-interacting domain. Additionally, they use an OLLAS-tag Dpp (OLLAS being an epitope tag against which extremely high affinity antibodies exist). They examine OLLAS-Dpp or HA-Dpp distribution, phospho-Mad staining, adult wing size.
They find that over-expressed Dally - but not Dlp - expands Dpp distribution in the larval wing disc. They find that the Dally[KO] allele behaves like a Dally strong hypomorph Dally[MH32]. The Dally[KO] - but not the Dlp[KO] - caused reduced pMad in both anterior and posterior domains and reduced adult wing size (particularly in the Anterior-Posterior axis). These defects can be substantially corrected by supplying an endogenously tagged YFP-tagged Dally. By contrast, they were not rescued when a 3xHA Dlp was inserted in the Dally locus. These results support their conclusion that Dpp interacts with Dally but not Dlp.
They next wanted to determine the relative contributions of the Dally core or the HS chains to the Dpp distribution. To test this, they over-expressed UAS-Dally or UAS-Dally[deltaHS] (lacking the HS chains) in the dorsal wing. Dally[deltaHS] over-expression increased the distribution of OLLAS-Dpp but caused a reduction in pMad. Then they write that after they normalize for expression levels, they find that Dally[deltaHS] only mildly reduces pMad and this result indicates a major contribution of the Dally core protein to Dpp stability. The "normalization" is a key part of this model and is not mentioned how the normalization was done. When they do the critical experiment, making the Dally[deltaHS] allele, they find that loss of the HS chains is nearly as severe as total loss of Dally (i.e., Dally[KO]). Additionally, experimental approaches are needed here to prove the role of the Dally core.
Prior work has shown that a stretch of 7 amino acids in the Dpp N-terminal domain is required to interact with heparin but not with Dpp receptors (Akiyama, 2008). The authors generated an HA-tagged Dpp allele lacking these residues (HA-dpp[deltaN]). It is an embryonic lethal allele, but they can get some animals to survive to larval stages if they also supply a transgene called “JAX” containing dpp regulatory sequences. In the JAX; HA-dpp[deltaN] mutant background, they find that the distribution and signaling of this Dpp molecule is largely normal. While over-expressed Dally can increase the distribution of HA-dpp[deltaN], over-expression of Dally[deltaHS] cannot. These latter results support the model that the HS chains in Dally are required for Dpp function but not because of a direct interaction with Dpp.
In the last part of the results, they attempt to determine if the Dpp receptor Thickveins (Tkv) is required for Dally-HS chains interaction. The 2008 (Akiyama) model posits that Tkv activates pMad downstream of Dpp and also internalizes and degrades Dpp. A 2022 (Romanova-Michaelides) model proposes that Dally (not Tkv) internalizes Dpp.
To distinguish between these models, the authors deplete Tkv from the dorsal compartment of the wing disc and found that extracellular Dpp increased and expanded in that domain. These results support the model that Tkv is required to internalize Dpp. They then tested the model that Dally antagonizes Tkv-mediated Dpp internalization by determining whether the defective extracellular Dpp distribution in Dally[KO] mutants could be rescued by depleting Tkv. Extracellular Dpp did increase in the D vs V compartment, potentially providing some support for their model. However, there are no statistics performed, which is needed for full confidence in the results. The lack of statistics is particularly problematic (1) when they state that extracellular Dpp does not rise in ap>tkv RNAi vs ap>tkv RNAi, dally[KO] wing discs (Fig. 6E) or (2) when they state that extracellular Dpp gradient expanded in the dorsal compartment when tkv was dorsally depleted in dally[deltaHS] mutants (Fig. 6I). These last two experiments are important for their model but the differences are assessed only visually. In fact, extracellular Dpp in ap>tkv RNAi, dally[KO] (Fig. 6B) appears to be lower than extracellular Dpp in ap>tkv RNAi (Fig. 6A) and the histogram of Dpp in ap>tkv RNAi, dally[KO] is actually a bit lower than Dpp in ap>tkv RNAi, But the author claim that there is no difference between the two. Their conclusion would be strengthened by statistical analyses of the two lines.
Strengths:
1. New genomically-engineered alleles
A considerable strength of the study is the generation and characterization of new Dally, Dlp and Dpp alleles. These reagents will be of great use to the field.
2. Surveying multiple phenotypes
The authors survey numerous parameters (Dpp distribution, Dpp signaling (pMad) and adult wing phenotypes) which provides many points of analysis.
Weaknesses:
1. Confusing discussion regarding the Dally core vs HS in Dpp stability. They don't provide any measurements or information on how they "normalize" for the level of Dally vs Dally[deltaHS]? This is important part of their model that currently is not supported by any measurements.
2. Lacking quantifications and statistical analyses:
a. Why are statistical significance for histograms (pMad and Dpp distribution) not supplied? These histograms provide the key results supporting the authors' conclusions but no statistical tests/results are presented. This is a pervasive shortcoming in the current study.
b. dpp[deltaN] with JAX transgene - it would strengthen the study to supply quantitative data on the percent survival/lethal stage of dpp[deltaN] mutants with or without the JAK transgene <br /> c. The graphs on wing size etc should start at zero. <br /> d. The sizes of histograms and graphs in each figure should be increased so that the reader can properly assess them. Currently, they are very small.
The authors' model is that Dally (not Dlp) is required for Dpp distribution and signaling but that this is not due to a direct interaction with Dpp. Rather, they posit that Dally-HS antagonize Tkv-mediated Dpp internalization. Currently the results of the experiments could be considered consistent with their model, but as noted above, the lack of statistical analyses of some parameters is a weakness. One problematic part of their result for me is the role of the Dally core protein (Fig. 7B). There is a mis-match between the over-expression results and Dally allele lacking HS (but containing the core). Finally, their results support the idea that one or more as-yet unidentified proteins interact with Dally-HS chains to control Dpp distribution and signaling in the wing disc.
There is much debate and controversy in the Dpp morphogen field. The generation of new, high quality alleles in this study will be useful to Drosophila community, and the results of this study support the concept that Tkv but not Dally regulate Dpp internalization. Thus the work could be impactful and fuel new debates among morphogen researchers. <br />
The manuscript is currently written in a manner that really is only accessible to researchers who work on the Dpp gradient. It would be very helpful for the authors to re-write the manuscript and carefully explain in each section of the results (1) the exact question that will be asked, (2) the prior work on the topic, (3) the precise experiment that will be done, and (4) the predicted results. This would make the study more accessible to developmental biologists outside of the morphogen gradient and Drosophila communities.
Key Features of Google Tag Manager
Tag management system
helps manage the lifecycle of digital marketing tags (sometimes referred to as tracking pixels or web beacons), used to track activity on digital properties, such as websites and web applications.
A second source of difference between growth and development relates to thequestion of externality and non-marketability. The G N P captures only thosemeans of well-being that happen to be transacted in the market, and this leavesout benefits and costs that do not have a price-tag attached to them.
GNP is limited to the market
Note: This rebuttal was posted by the corresponding author to Review Commons. Content has not been altered except for formatting.
Learn more at Review Commons
Reviewer 1:
We would like to thank you for taking the time to review our manuscript. Your thoughtful and insightful comments have greatly improved the quality of our work. We appreciate your thoroughness in evaluating our study and providing valuable feedback.
Your constructive criticism and suggestions have helped us identify areas that needed further clarification and improvement, and we are grateful for your efforts in guiding us towards a stronger manuscript.
Thank you again for your time and expertise in reviewing our work. We hope that you find our revisions satisfactory and look forward to hearing your thoughts on the revised manuscript.
Reviewer #1 (Evidence, reproducibility and clarity (Required)): *
In this manuscript by Sharma and colleagues, the authors investigate the transcriptional regulation of the TAL1 isoforms - that derive from differential promoter usage and/or alternative splicing - and the contribution of TAL1 long and TAL1 short protein isoforms in normal haematopoietic development and disease.
The study suggests that TAL1 transcript isoforms are fine-tuned regulated. By using CRISPR/Cas9 techniques, the authors show that the enhancer -8 (MuTE) and enhancer -60 differentially regulate the TAL1 isoforms. Whether the remaining enhancers at the TAL1 locus (see Zhou Y et al, Blood 2013) also differentially regulate TAL1 transcription remains to be elucidated.
The authors found that TAL1 short isoform interacts strongly with T-cell specific transcription factors such as TCF3 and TCF12, as compared to TAL1 long isoform. TAL1 short shows an apoptotic transcription signature and it fails in rescuing cell growth as compared to TAL1 long in T-ALL. In addition, TAL1 short promotes erythropoiesis.
Lastly, the authors suggest that altering TAL1 long and TAL1 short protein isoforms ratio could have a potential therapeutic application in disease, but further studies are needed. *
We would like to thank you for your time and effort in reviewing our manuscript. Your constructive feedback and insightful comments have been immensely valuable in improving the quality of our work. Your expertise in the field has undoubtedly contributed to the credibility and accuracy of this research. In addition, your dedication and attention to detail have been instrumental in shaping the final version of the manuscript.
* I have a number of comments: Figure 1 It was not mentioned that MOLT4 cells also have MuTE. Do Jurkat and MOLT4 share a similar profile in terms of TAL1 transcript isoforms? It would have been very interesting to see whether the TAL1 transcript isoforms are similar in SIL-TAL1+ cells (e.g RPMI-8402). In these cells, TAL1 activation results from a deletion that fuses the 5' non-coding region of SIL with TAL1. *
Thank you for your comment. We apologize for the confusion regarding the MOLT4 cells in our analysis. We have now updated the manuscript to explicitly mention the presence of MuTE in MOLT4 cells (Line 127). Additionally, we agree that it would be interesting to investigate whether the TAL1 transcript isoforms are similar in SIL-TAL1+ cells, such as RPMI-8402. To address this point, we have included the CCRF-CEM cell line that harbors the SIL-TAL1 recombination in our analysis. We have updated the manuscript with these new findings (Fig. 1C&D and S1A&B). Thank you for bringing this to our attention.
Figure 2 * It is not very clear how the expression of the short isoform delta exon 3 is quantified. Detailed information and a schematic of the primer location could be helpful. *
Thank you for your comment. We apologize for any confusion regarding the quantification of the expression of the short isoform (delta exon 3). The detailed information and schematic of the primer location can be found in Supplementary Figure 2B. We have included the location of each primer used in real-time PCR analysis for the quantification of all TAL1 isoforms. We hope this additional information will address your concerns.
* The results on Figure 2 derive from complex Cas9/CRISPR experiments. A schematic representation showing the location of the following elements is missing: CTCF sites, CTCF gRNA target region, dCas9-p300 gRNA target region and -60 enhancer. *
We agree that providing a schematic representation of the Cas9/CRISPR experiments would be helpful for better understanding the data in Figure 2. We have now included a detailed schematic of the location of the CTCF sites, CTCF gRNA target region, dCas9-p300 gRNA target region and -60 enhancer in Supplementary Figure 2E. We believe this new figure will provide a clearer overview of the experiments performed and will aid in the interpretation of the results.
* Are the levels of dCas9-p300 WT and dCas9-p300 MUT comparable in transfected HEK 293 cells? Were those possibly measured by qPCR or Western Blot? Why the authors chose to use 293T cells for the CTCF del as the enhancer usage around the locus must be so different from haematopoietic cells. *
Thank you for your question. We have added Western Blot analysis to compare the levels of dCas9-p300 WT and dCas9-p300 MUT in transfected HEK293T cells, as suggested. The results are presented in Supp. Fig. S2H.
Regarding the choice of HEK293T cells for the CTCF deletion experiment, we selected this cell line for its low expression of TAL1, which contributes to a high dynamic range when tethering p300 core to a closed chromatin region. We have added a clarification of our rationale for using HEK293T cells in the revised manuscript (Lines 177-8). Thank you for your valuable feedback.
* Is CPT - camptothecin? A control gene that is sensitive to CPT treatment would ensure the inhibitor is working. *
Thank you for your comment. Indeed, CPT stands for camptothecin, and this information is already included in the methods section. We have also added this information to the results section (Line 221) to make it clearer.
Regarding the suggestion to use a control gene sensitive to CPT treatment, we agree that this could be a useful addition to our experimental design. To address this, we have quantified the amount of TAL1 transcript to an endogenous control which is not transcribed by RNA Polymerase II (RNAPII) (18s rRNA). As a positive control, we compared Cyclo A, our endogenous control, to 18s rRNA and observed a reduction (Supp. Fig. S2K). This allows us to confidently conclude that the inhibitor is working as intended.
Thank you for bringing up this point, and we hope that our response addresses your concern.
*
In supplementary Figure 2D, the reduction in expression in Jurkat Del-12 is restricted to TSS2. There is no reduction in TAL1 TSS1 and TAL1 TSS4 (this is not clear from the result description section). As seen, these isoforms are upregulated and that could suggest a compensatory mechanism mediated by alternative promoter activation. The fact that Jurkat Del-12 express TAL1 from MSCV-TAL1 could also suggest that TSS1 and TSS4 are upregulated by TAL1 or indirectly, by other members of the TAL/LMO complex (see Sanda T et al, Cancer Cell 2012) *
Certainly, we appreciate your feedback. Supplementary Figure 2D indeed shows that the MuTE enhancer has a differential effect on the promoters, and we have now included this in the text of the manuscript. Regarding the TAL1-long isoform, while MSCV-TAL1 in the Jurkat Del-12 cell line does give rise to this isoform, our results from Figure 3A did not find TAL1-long to have a differential effect on TAL1 promoters. It is important to note that the experiment conducted was an exogenous construct in HEK293T cells, which has its limitations. Thus, the speculation that TAL1-long drives the result in supplementary Figure 2D is possible, and we have added this to the text. Thank you for bringing up this important point (Lines 167-9).
Figure 3 * A. Are the levels of TAL1 short cDNA and TAL1 long cDNA comparable in the co-transfection luciferase experiments? The overexpression of the isoforms does not reflect the endogenous expression levels in cell lines where one of the isoforms is more predominantly expressed (e.g Jurkat cells express low levels of TAL1 short). *
Thank you for your comment. To address your concern, we have added real time (Supp. Fig. S3A) as well as Western blot in a new figure (Supp. Fig. S3B) to show that the levels of TAL1-short and TAL1-long cDNA are comparable in the co-transfection luciferase experiments. Additionally, we observed a very low amount of endogenous TAL1 isoforms in the cell line (Supp. Fig. S3A&B), which was below detection using these methods. This suggests that the effect of the endogenous TAL1 in this cell line is low. We appreciate your feedback, and we hope this additional information addresses your concern.
* Figure 4 Are the levels of flag-TAL1 long and flag-TAL1 short comparable? The levels of expression could explain the low intensity signal for TAL1 long. *
Thank you for your insightful comment. Indeed, the issue of isoform quantification is critical in understanding the functional differences between TAL1-short and TAL1-long. To address this concern, we performed careful quantification of the isoforms and made sure that the amount was equal or slightly in favor of TAL1-long before conducting the experiments in this manuscript. We have also added a Western blot in Supp. Fig. S3A and real time in Supp. Fig. S3B showing the similar amount of the two isoforms. Furthermore, in Figure 4A, we provided the amount of each isoform in the input section, showing a higher amount of TAL1-long. This strengthens our result, which shows that TAL1-short binds stronger to TCF-3 and 12. Protein levels for ChIP-seq experiment (Fig. 4B-H) is now in Supp. Fig. S4B. We thank you for bringing up this important point, and we hope that our additional data and clarifications have addressed your concern
*Is there any reason for not performing a depletion of endogenous TAL1 prior to the ChIP seq flag experiment? *
Thank you for your comment. In our experience, infecting Jurkat cells with shRNA or an expressing vector systems can induce some cellular stress, and we did not want to add additional stress to the cells by depleting endogenous TAL1. Since we immunoprecipitated using a Flag-tagged protein, we did not see a need to deplete the endogenous TAL1 protein. However, in our RNA-seq experiment, depletion of endogenous TAL1 was critical, and we have added this additional step in this experiment.
* Could the authors speculate about MAF motif enrichment in both isoforms and not in TAL1-total? *
Thank you for bringing up this interesting point. It is worth noting that while all ChIP-seq experiments were performed in Jurkat cells, not all of them were conducted by us. In particular, ChIP-seq of TAL1 total was performed by Sanda et al., 2012, using an endogenous antibody against both isoforms, whereas we conducted ChIP-seq for TAL1-short and TAL1-long using a FLAG tag antibody in cells expressing each of the isoforms. Therefore, the different conditions of these experiments may have contributed to the observed MAF motif enrichment in both isoforms and not in TAL1-total. While we cannot provide a definitive explanation, we speculate that the overexpression of the isoforms or the presence of the FLAG tag may have facilitated the detection of the MAF motif. We have added this discussion to the manuscript to acknowledge and address this interesting observation (Lines: 307-8).
* Do TAL1 long and TAL1 short recognise the same DNA motif? *
This is indeed a very interesting question but a difficult one to answer since TAL1 does not bind to the DNA alone but in a complex. In this situation, the ChIP-seq de-novo binding results suggest motifs that could be recognized by TAL1 or any of its complex partners. Using previous data, TAL1’s binding motif is CAGNTG (Hsu et al., 1994), while this motif was not identified in our analysis of the TAL1-total or FLAG-TAL1-long ChIP-seq results, we did, however, identify this sequence in FLAG-TAL1-short ChIP-seq results (p value=1e-93). We predict that this discrepancy is due to the complex nature of transcription factors binding and the fact that the ChIP-seq results were not all done in the same way. We have now added this to the discussion (Lines: 419-25).
* Figure 6 In A and B, are the levels of flag-TAL1 long and flag-TAL1 short in transduced K562 comparable? In C and D, are the TAL1 levels reduced at the protein level?*
Thank you for your question. To answer your question, we added Western Blot analysis to show the comparable levels of flag-TAL1-long and flag-TAL1-short in transduced K562 cells (Supp. Fig. S6C). In Figure 6C and D, we also added Western Blot analysis to show the reduction in TAL1 protein levels upon shRNA-mediated knockdown(Supp. Fig. S6B).
* Minor points: Figure 1 A. Include a scale bar *
To address this, we included coordinates of the components of the gene marked in the figure.
* C. Loading control such as GAPDH is missing in the Western Blot. Are CUTLL cells the same as CUTTL-1? *
We added loading controls as requested now supplementary Fig. 1C, S2C, S3A, S4B, S6B&C. Yes, CUTLL is the same as CUTLL-1 we have now fixed this in the text (Line 120).
D. Adjust scale of the CHIP seq tracks in K562 cells in order to see the peak summit. *Include genome build *
Thank you for your comment. We have adjusted the scale of the ChIP-seq tracks in K562 cells as suggested to improve the visualization of the peak summit. However, one of the peaks still had a much higher signal and the summit is still missing from this particular peak. To address this, we have added a new figure in the supp. Fig. S1C materials where we adjusted the peak to show the summit. Please note that in this track, the chromatin structure at the enhancers is missing, and therefore, we did not include it in the main figure. Thank you for bringing this to our attention.
We have added a genome build hg19 to the figure legend.
* In supplementary Figure 1B, the symbol scheme is not clear *
Thank you for this note, we have replaced the figure and added text to make it clearer.
* Figure 2 A & C. Remove 'amount' from the Y axis. Is the total mRNA amount calculated as % of the reference genes? It could be specified on the y axis or figure legend. *
We have removed the word "amount" from the Y axis as requested. Total mRNA amount is normalized relative to the reference genes (∆∆Cq) by Bio-Rad's CFX Maestro software (version 2.3) according to the formula:
where:
* In supplementary Figure 2C, a loading control is missing.*
We have added alpha-tubulin to this figure.
* Figures 4, 5 and 6 Size of the figures should be increased. *
We have increased the figure size as suggested. *
Reviewer #1 (Significance (Required)): The study from Sharma and colleagues is novel and it extends the knowledge on TAL1 regulation and the role of TAL1 in development and disease. Although the study suggests that there is a correlation between enhancers, chromatin mark deposition at exons and regulation of alternative splicing, the mechanistic link is not fully elucidated.*
To further elucidate the mechanistic link between the MuTE enhancer, broad H3K4me3 modification spanning 7.5 Kbp from TAL1 promoter 1 to promoter 5 (as shown in Fig. 1D), and alternative splicing, we conducted experiments where we manipulated KMT2B, a component of the SET1/COMPASS complexes responsible for methylating H3K4. Our findings indicate that silencing KMT2B in Jurkat cells led to a significant 30% increase in TAL1-∆Ex3 (Fig. 2H and Supp. Fig. S2I&J). These results contribute to a more comprehensive understanding of the molecular mechanisms underlying TAL1 alternative splicing regulation.
The findings on TAL1 short protein are interesting but the data on TAL1 long lacks some refinement so then robust conclusions can be drawn. * The experimental data lacks a few controls. The text is clear and prior studies could be better referenced. *
We have made an effort to better reference out manuscript.
* As TAL1 is a very crucial transcription factor oncogene in T-ALL, the study is important as it addresses a very relevant question in the field that is the regulation of the transcription of TAL1 and the functional relevance of both TAL1 short and TAL1 long isoforms. *
Reviewer 2: *
Reviewer #2 (Evidence, reproducibility and clarity (Required)):
Summary: Sharma et al. thoroughly characterized the regulation of TAL1 by mapping the use of its five promoters and enhancers, which together transcribe five transcripts, coding for two protein isoforms. For that purpose the authors used few cell lines: Jurkat as a T-ALL cell line, chronic myeloid leukemia (CML) cell line K562 and HEK293T with low TAL1 expression, as well as CutLL and MOLT4. They profiled the chromatin marks H3K27ac and H3K4me3 at the TAL1 locus, and show that when a the -8 enhancer is compromised tha chromatin marks change, and not only the expression level of TAL1 is reduced, the level of exon 3 skipping is increased. When the -60 enhancr was activated, TAL1 expression increased, and exon 3 skipping was reduced. Those findings indicate that in tal1, transcription and alternative splicing are co-regulated, independent of RNAPII. The authors also show that as an autoregulator, TAL1-short has a preference to TSS1-3 of TAL1, which is not shared by TAL1-long, and that each of the 5' UTR affect Tal1 expression differently. TAL1-short binds E-proteins more strongly than TAL1-long, binds many more sites than TAL1-long and stronger, and each isoform has unique set of targets. Finally, the authors set to identify the different functions of the TAL1 isoforms, and showed that Tal1-short slows cell growth and leads to TAL1-short but not TAL1-long leads to exhaustion of hematopoietic stem cells and promotes differentiation into erythroids. This paper used for the first time TAL1 isoform specific ChIP-seq, which enable accurate definition of isoform-specific targets in Jurkat cells. They demonstrated an interaction between choice of TSS and alternative splicing, and isoform specific functions. Given the clinical importance of TAL1 and the meticulous work performed to characterize its isoform specific regulation and function, I find this manuscript of interest, and only have minor suggestions to improve readability. *
Thank you for taking the time to carefully review our manuscript on the regulation and function of TAL1 isoforms. We appreciate your positive feedback on our comprehensive characterization of TAL1 regulation using chromatin profiling and isoform-specific ChIP-seq. We are glad that you found our findings on the co-regulation of transcription and alternative splicing, as well as the isoform-specific functions of TAL1, to be of interest.
We also appreciate your suggestions to improve the readability of the manuscript and have made the necessary revisions accordingly. Your feedback has been invaluable in strengthening the quality of our work, and we are grateful for your contribution to the scientific community.
* Minor comments: Add explicitly the motivation for choosing the cell line in each part. *
We have added motivation (Lines: 157-8, 177-8, 192-194, 235-6 text that was on the previous version: 192-194, 379-80).
* Figure 1 - Consider marking the promoter numbers and the enhancers names in the same names as in text (-8,-60 etc.), to make it easier for the readers to understand which enhancers is being discussed. *
This in a very important point. We have added the numbering to Figure 1D and Supp. Fig. S2A, B & E.
*P5, P18 - ProtParam is only a prediction tool, and does not supply an experimental measurement, as may be assumed from text. Please rephrase accordingly. *
The words “prediction tool” were added in the indicated paragraphs (Lines 115 and 427).
* Figure 2B/D - y axis label unclear, not explained in text. In accordance, unclear if the change is in the amount of RNA, or the ratio between the long and short variants. *
Thank you for this comment. We greatly appreciate your feedback and suggestions. To make our calculations, which are the norm in the splicing field, clearer, we have now added text to Figure 4 and provided more detailed explanations in lines 670-73. We hope that these modifications will improve the clarity and comprehensiveness of our manuscript.
*Consider removing the bars and increasing the dots, to make the graphs cleaner. *
We removed the bars throughout the manuscript for a cleaner look.
* P8 - The term '5C' may require more explanation, depending on target audience. *
We have added text to explain the technique (Lines 179-81).
* Figure 3 - the trend is that TAL1-short promotes transcription from all five TSSs. However, only in TSS1-3 is the difference significant, but the difference between the long and short forms is not significant. It is unclear if "The mean of three independent experiments done with three replicates" means overall there are three replicates per condition or nine. Please rephrase to clarify. *
Thank you for your comment. To clarify, we want to state that each biological experiment was done in three technical replicates, resulting in a total of nine replicates for each condition. We apologize for any confusion and have now rephrased to: The mean was calculated from three independent biological experiments, each performed with three technical replicates (Lines: 696 and 699).
*Fig 4 A - it seems that many of the sites bound by Tal1 total are not bind by either Tal1-short or Tal1-long. Indeed very little overlap between Tal1-short and Tal-1-total is seen in Fig 4I as well. It seems Tal1-long has very few peaks. Consider adding a discussion of possible reasons. *
We agree that these findings are noteworthy and warrant further discussion. We added text to the discussion section to explore potential reasons for these observations (Lines 416-25).
* Fig 4c - it is hard to distinguish the different lines. Consider a more clear visualization. Also, some text is in a font size too small to read. *
We have changed the format of the figure and took out the input data from the main figure to help the visualization. The input data appear in the Supp. Fig. S4C.
* Fig 4 D-H - will be useful to see the numbers, not just the % divided by %. *
A table with the specific numbers can be found in Supp Figure 4F-J.
* Fig 4 legend - 'I&L' possibly means 'I-L'. P14 - refer to where the results of the 'validation using real-time PCR' are shown. P16 - symbol replaced by an empty rectangle 20 M *
Thank you for these valuable comments, we have fixed/added these in the manuscript.
* Figure 6D - Y axis value seem strange (fold change relative to day 0 should be 1 at day 0). Consider different Y axis label for C and D to clarify. *
Thank you for this comment, we have changed the y-axis to: Fold-change relative to day 1.
* P18 - It is unclear which "two isoforms with posttranslational modifications which affected the migration rate of the protein (Fig. 1C)" were shown. Only two isoforms are mentioned throughout the paper. *
We have added text to clarify we are referring to TAL1-short and long (Lines 409-10).
*
P18 - "Our ChIP-seq results suggest that the isoforms bind at the same location (Fig. 4B)." - in 4B it seems most of TAL1-short bound positions are not bound by TAL1 long. Please clarify. *
* Worth mentioning that the Total TAL1 is taken from Jurkat cells but from a different experiment. * We have changed the statement and added the text referring to the experiments done independently (Lines 422-3).
*
Reviewer #2 (Significance (Required)): This paper used for the first time TAL1 isoform specific ChIP-seq, which enable accurate definition of isoform-specific targets in Jurkat cells. They demonstrated an interaction between choice of TSS and alternative splicing, and isoform specific functions. Given the clinical importance of TAL1 and the meticulous work performed to characterize its isoform specific regulation and function, I find this manuscript of interest, and only have minor suggestions to improve readability. *
continued growth allows us to take into account planetary limits
creating a new tag
Note: This rebuttal was posted by the corresponding author to Review Commons. Content has not been altered except for formatting.
Learn more at Review Commons
We would like to thank the reviewers for their extensive review of our manuscript and constructive criticism. We have attempted to address the points raised in the reviewer's comments and have performed additional experiments and have edited the text of the manuscript to explain these points. Please see below, our point-by-point response to the reviewer’s comments. In the submitted revised manuscript, some figure numbers have changed from the prior reviewed version.
Reviewer #1 (Evidence, reproducibility and clarity (Required)):
In this MS, Mrj - a member of the JDP family of Hsp70 co-chaperones was identified as a regulator of the conversion of Orb2A (the Dm ortholog of CPEB) to its prion-like form.
In drosophila, Mrj deletion does not cause any gross neurodevelopmental defect nor leads to detectable alterations in protein homeostasis. Loss of Mrj, however, does lead to altered Orb2 oligomerization. Consistent with a role of prion-like characteristics of Orb2 in memory consolidation, loss of Mrj results in a deficit in long-term memory.
Aside from the fact that there are some unclarities related to the physicochemical properties of Orb2 and how Mrj affects this precisely, the finding that a chaperone could be important for memory is an interesting observation, albeit not entirely novel.
In addition, there are several minor technical concerns and questions I have that I feel the authors should address, including a major one related to the actual approach used to demonstrate memory deficits upon loss of Mrj.
Reviewer #1 (Significance (Required)):
Figure 1 (plus related Supplemental figures): • There seem to be two isoforms of Mrj (like what has been found for human DNAJB6). I find it striking to see that only (preferentially?) the shorter isoform interacts with Orb2. For DNAJB6, the long isoform is mainly related to an NLS and the presumed substrate binding is identical for both isoforms. If this is true for Dm-Mrj too, the authors could actually use this to demonstrate the specificity of their IPs where Orb2 is exclusively non-nuclear?
According to Flybase, Mrj has 8 predicted isoforms of which four are of 259 amino acids (PA, PB, PC, and PD), 3 are of 346 amino acids (PE, PG, and PH) and one is of 208 amino acids (PF) length (Supplementary data 1). We isolated RNA from flyheads and used this in RT-PCR experiments to check which Mrj isoforms express in the brain. Since both the 346 amino acid (1038 nucleotide long) and 259 amino acids (777 nucleotides long) form, which we refer to as the long and middle isoform, has the same N and C terminal sequences we used the same primer pair for this, but on RT-PCR the only amplicon we got corresponds to the 259 amino acid form. For the 208 amino acids (624 nucleotides long) form we designed a separate forward primer and attempted to amplify this using RT-PCR but were unable to detect this isoform also. This data is now presented in Supplemental Figure 4B. Since the only isoform detected from fly head cDNA corresponded to the 259 amino acid form, we think this is the predominant isoform of Mrj expressing in Drosophila and this is what is in our DnaJ library and what we have used in all our experiments here. This is also the same isoform described in previous papers on Drosophila Mrj (Fayazi et al, 2006; Li et al, 2016b). For this 259 amino acid Mrj isoform, we see its expression in both the nucleus and cytoplasm (Supplemental Figure 4C). As the long 346 AA fragment was undetectable in the brain, it was not feasible to address the reviewer’s point of using the long and short forms of Mrj for IP with Orb2. However, we have performed IP of human CPEB2 (hCPEB2) with the long and short isoforms of human DnaJB6 and have detected interaction of hCPEB2 with both the long and short isoforms of DnaJB6 (Supplemental Figure 6E).
- I would be interested to know a bit more about the other 5 JDPs that are interactors with Orb2: are the human orthologs of those known? It is striking that these other 5 JDPs interact with Orb2 in Dm (in IPs) but have no impact on Sup35 prion behavior. Importantly, this does not imply they may not have impact on the prion-like behavior of other Dm substrates, including Dm-Orb2.
We have performed BlastP analysis of CG4164, CG9828, CG7130, DroJ2, and Tpr2 protein sequences against Human proteins. Based on this we have listed the highest-ranking candidate identified here for each of these genes.
Drosophila Gene
Human gene
Query cover
Percent identity
E value
CG4164
dnaJ homolog subfamily B member 11 isoform 1
98 %
62.96%
2e-150
CG9828
dnaJ homolog subfamily A member 2
92%
39.41%
3e-84
CG7130
dnaJ homolog subfamily B member 4 isoform d
56%
69.44%
2e-30
Tpr2
dnaJ homolog subfamily C member 7 isoform 1
93%
46.22%
6e-139
DroJ2
dnaJ homolog subfamily A member 4 isoform 2
98%
60.60%
2e-169
In the context of the chimeric Sup35-based assay where Orb2A’s Prion-like domain (PrD) is coupled with the C-terminal domain of Sup35, the only protein which could convert Orb2A PrD-Sup35 C from its non-prion state to prion state was Mrj. Within the limitations of this heterologous-system based assay, the other 5 DnaJ domain proteins as well as the Hsp70’s were unable to convert the Orb2A PrD from its non-prion to prion-like state. What these other 5 interacting JDP proteins are doing through their interaction with Orb2A and if they are even expressing in the Orb2 relevant neurons will need to be tested separately and will be the subject of our future studies.
The data in panels H, I indeed suggest that Mrj1 alters the (size of) the oligomers. It would be important to know what is the actual physicochemical change that is occurring here. The observed species are insoluble in 0.1 % TX100 but soluble in 0.1% SDS, which suggest they could be gels, but not real amyloids such as formed by the polyQ proteins that require much higher SDS concentrations (~2%) to be solubilized. This is relevant as Mrj1 reduces polyQ amyloidogenesis whereas is here is shown to enhance Orb2A oligomerization/gelidification. In the same context, it is striking to see that without Mrj the amount of Orb2A seems drastically reduced and I wonder whether this might be due to the fact that in the absence of Mrj a part of Orb2A is not recovered/solubilized due to its conversion for a gel to a solid/amyloid state? In other words: Mrj1 may not promote the prion state, but prevents that state to become an irreversible, non-functional amyloid?
On the reviewer’s point to address what is the actual physicochemical change occurring here, we will need to develop methods to purify the Orb2 oligomers in significant quantities to examine and distinguish if they are of gel or real amyloid-like nature. Currently, within the limitations of our ongoing work, this has not been possible for us to do and we can attempt to address this in our future work. Cryo-EM derived structure of endogenous Orb2 oligomers purified from a fly head extract from 3 million fly heads, made in the TritonX-100 and NP-40 containing buffer, the same buffer as what we have used here for the first soluble fraction, showed these oligomers as amyloids (Hervas et al, 2020). If the oligomers extracted using 0.1% and 2% SDS are structurally and physicochemically different, within the limitations of our current work, had not been possible to address.
The other point raised by the reviewer is, if in the absence of Mrj (in the context of Figure 4 of our previously submitted manuscript), a part of Orb2 is not solubilized due to us using a lower 0.1% SDS for extraction. To address this, we attempted to see how much of leftover Orb2 is remaining in the pellet after extraction with 0.1 % SDS. Towards this, according to the reviewers’ suggestion, we used a higher 2% SDS containing buffer to resuspend the leftover pellet after 0.1% SDS extraction, and post solubilisation ran all the fractions in SDD-AGE. We did this experiment with both wild-type and Mrj knockout fly heads. Under these different extractions, we first observed while there is more Orb2 in the soluble fraction (Triton X-100 extracted) of Mrj knockout, this amount is reduced in both the 0.1% SDS solubilized and 2% SDS solubilized fractions. So, even though there is leftover Orb2 after 0.1% SDS extraction, which can be extracted using 2% SDS, this amount is reduced in Mrj knockout. The other observation here is the Orb2 extracted using 2% SDS shows a longer smear in comparison to the 0.1% SDS extracted form suggesting a possibility of more and higher-sized oligomers present in this fraction. Since we do not have the exact physicochemical characterization of these oligomers detected with 0.1% and 2% SDS-containing buffer, we are not differentiating them by using the terms gels and real amyloids, but refer to them as 0.1% SDS soluble Orb2 oligomers and 2% SDS soluble Orb2 oligomers. Overall, our observations here suggest in absence of Mrj, both of these kinds of Orb2 oligomers are decreased and so Mrj is most likely promoting the formation of Orb2 oligomers. It is possible that the 0.1% SDS soluble Orb2 oligomers gradually accumulate and undergo a further transition to the 2% SDS soluble Orb2 oligomers, so if in absence of Mrj, the formation of the 0.1% SDS soluble Orb2 oligomers is decreased, the next step of formation of 2% SDS soluble Orb2 oligomers also be decreased. This data is now presented in Figure 5H, I and J).
On the other possibility raised by the reviewer that Mrj can prevent the oligomeric state of Orb2 to become an irreversible non-functional amyloid, we think it is still possible for Mrj to do this but this could not be tested under the present conditions.
It may be good for clarity to refer to the human Mrj as DNAJB6 according to the HUGO nomenclature. Also, the first evidence for its oligomerization was by Hageman et al 2010.
We have now changed mentions of human Mrj to DNAJB6. We apologize for missing the Hageman et al 2010 reference and have now cited this reference in the context of Mrj oligomerization.
It is striking to see that Mrj co-Ips with Hsp70AA, Hsp70-4 but not Hsp70Cb. The fact that interactions were detected without using crosslinking is also striking given the reported transient nature of J-domain-Hsp70 interactions Together, this may even suggest that Mrj-1 is recognized as a Hsp70 substrate (for Hsp70AA, Hsp70-4 but not Hsp70Cb) rather than as a co-chaperone. In fact, a variant of Mrj-1 with a mutation in the HPD motif should be used to exclude this option.
In IP experiments we notice Mrj interacts with Hsp70Aa and Hsc70-4 but not with Hsc70-1 and Hsc70Cb. In our previously submitted manuscript, we realized we made a typo on the figure, where we referred to Hsp70Aa as Hsc70Aa. We have corrected this in the current revised manuscript. On the crosslinking point raised by the reviewer, we reviewed the published literature for studies of immunoprecipitation experiments which showed an interaction between DnaJB6 and Hsp70. We noted while one of the papers (Kakkar et al, 2016) report the use of a crosslinker in the experiment which showed an interaction between GFP-Hsp70 and V5-DnaJB6, in another two papers the interaction between endogenous Mrj and endogenous Hsp/c70 (Izawa et al, 2000) and Flag-Hsp70 and GFP-DnaJB6 (Bengoechea et al, 2020) could be detected without using any crosslinker. Our observations of detecting the interaction of Mrj with Hsp70Aa and Hsc70-4 in the absence of a crosslinker are thus similar to the observations reported by (Izawa et al, 2000; Bengoechea et al, 2020).
On the point of if Mrj is a substrate for Hsp70aa and Hsc70-4 and not a co-chaperone, we feel in the context of this manuscript, since we are focussing on the role of Mrj in the regulation of oligomerization of Orb2 and in memory, the experiment with HPD motif mutant is probably not necessary here. However, if the reviewers suggest this experiment to be essential, we can attempt this experiment by making this HPD motif mutant.
The rest of these data reconfirm nicely that Mrj/DNAJB6 can suppress polyQ-Htt aggregation. Yet note that in this case the oligomers that enter the agarose gel are smaller, not bigger. This argues that Mrj is not an enhancer of oligomerization, but rather an inhibitor of the conversion of oligomers to a more amyloid like state.
Figure 2 and Supplemental Figure 4 discuss the effect of Mrj on Htt aggregation. We have used 2 different Htt constructs here. For Figure 2I, we used only Exon1 of Htt with the poly Q repeats. Here in SDD-AGE, for the control lane, we see the Htt oligomers as a smear for the control. For Mrj, we see only a small band at the bottom which can be interpreted most likely as either a monomer or as small oligomers since we do not observe any smear here. However, for the 588 amino acid fragment of HttQ138 in the SDD-AGE we do not see a difference in the length of the smear but in the intensity of the smear of the Htt oligomers (Supplemental Figure 4E). Based on this we are suggesting in presence of Mrj, there are lesser Htt oligomers. On the point of Mrj is not an enhancer of oligomerization, but rather an inhibitor of the conversion of oligomers to a more amyloid-like state, our experiments with the Mrj knockout show reduced Orb2 oligomers (both for 0.1% and 2% SDS soluble forms), suggesting Mrj plays a role in the conversion of Orb2 to the oligomeric state. If Mrj inhibits the conversion of oligomers to a more amyloid-like state, this is possible but we couldn’t test this hypothesis here. However, for Htt amyloid aggregates, previous works done by other labs with DnaJB6 as well as our experiments with Mrj suggest this as a likely possibility.
Figure 3: • The finding that knockout of DNAJB6 in mice is embryonic lethal is related to a problem with placental development and not embryonic development (Hunter et al, 1999; Watson et al, 2007, 2009, 2011) as well recognized by the authors. Therefore, the finding that deletion of Dm-Mrj has no developmental phenotype in Drosophila may not be that surprising.
We agree with the reviewer’s point that DNAJB6 mutant mice have a problem with placental development. However, one of the papers cited here (Watson et al, 2009) suggests DNAJB6 also plays a crucial role in the development of the embryo independent of the placenta development defect. The mammalian DNAJB6 mutant embryos generated using the tetraploid complementation method show severe neural defects including exencephaly, defect in neural tube closure, reduced neural tube size, and thinner neuroepithelium. Due to these features seen in the mice knockout, and the lack of such developmental defects in the Drosophila knockout, we interpreted our findings in Drosophila as significantly different from the mammals.
It is a bit more surprising that Mrj knockout flies showed no aggregation phenotype or muscle phenotype, especially knowing that DNAJB6 mutations are linked to human diseases associated with aggregation (again well recognized by the authors). However, most of these diseases are late-onset and the phenotype may require stress to be revealed. So, while important to this MS in terms of not being a confounder for the memory test, I would like to ask the authors to add a note of caution that their data do not exclude that loss of Mrj activity still may cause a protein aggregation-related disease phenotype. Yet, I also do think that for the main message of this MS, it is not required to further test this experimentally.
We agree with the reviewer and have added this suggestion in the discussion that loss of Mrj may still result in a protein aggregation-related disease phenotype, probably under a sensitized condition of certain stresses which is not tested in this manuscript.
Figure 4:
IPs were done with Orb2A as bite and clearly pulled down substantial amounts of GFP-tagged Mrj. For interactions with Orb2B, a V5-tagged Mrj was use and only a minor fraction was pulled down. Why were two different Mrj constructs used for Arb2A and Orb2b?
In the previously submitted manuscript, we have used HA-tagged Mrj (not V5) for checking the interaction with full-length Orb2B tagged with GFP. This was done with the goal of using the same Mrj-HA construct as that used in the initial Orb2A immunoprecipitation experiment. Since this has raised some concern as in the IPs to check for interaction between truncated Orb2A constructs (Orb2A325-GFP and Orb2AD162-GFP) and Mrj (Mrj-RFP), we used a different GFP and RFP tag combination. To address this, we have now added the same tag combinations for the IPs (Mrj-RFP with Orb2A-GFP and Orb2B-GFP). In these immunoprecipitation experiments where Mrj-RFP was pulled down using RFP Trap beads, we were able to detect positive interaction with GFP-tagged Orb2A and Orb2B. This data is now added in Figure 4F and 4I. We also have added the IP data for interaction between Mrj-HA and untagged Orb2B in Figure 4K, similar to the combination of initial experiment between Mrj-HA and untagged Orb2A.
In addition, I think it would be important what one would see when pulling on Mrj1, especially under non-denaturing conditions and what is the status of the Orb2 that is than found to be associated with Mrj (monomeric, oligomeric and what size).
We have now performed IP from wild-type fly heads using anti Mrj antibody and ran the immunoprecipitate in SDS-PAGE and SDD-AGE followed by immunoblotting them with anti-Orb2 antibody. Our experiments suggest that immunoprecipitating endogenous Mrj brings down both the monomeric and oligomeric forms of Orb2. This data is now added in Figure 4L, M and N.
This also relates to my remark at figure 1 and the subsequent fractionation experiments they show here in which there is a slight (not very convincing) increase in the ratio of TX100-soluble and insoluble (0.1% SDS soluble) material. My question would be if there is a remaining fraction of 0.1% insoluble (2% soluble) Orb2 and how Mrj affects that? As stated before, this is (only) mechanistically relevant to understanding why there is less oligomers of Orb2 in terms of Mrj either promoting it or by preventing it to transfer from a gel to a solid state. The link to the memory data remains intriguing, irrespective of what is going on (but also on those data I do have several comments: see below).
We have addressed this in response to the reviewer’s comments on Figure 1. We find in both wild type and Mrj knockout fly heads, there are Orb2 oligomers that can be detected using 0.1% SDS extraction and with further extraction with 2% SDS. The 2% SDS soluble Orb2 oligomers were previously insoluble during 0.1% SDS-based extraction. However, the amounts of both of these oligomers are reduced in Mrj knockout fly heads. Since we do not have the physicochemical characterization of both of these kinds of oligomers, we are not using the terms gel or solid state here but referring to these oligomers as 0.1% SDS soluble Orb2 oligomers and 2% SDS soluble Orb2 oligomers. We speculate that the 0.1% SDS soluble Orb2 oligomers over time transition to the 2% SDS soluble Orb2 oligomers. As in the absence of Mrj in the knockout flies, both the 0.1% SDS soluble and 2% SDS soluble Orb2 oligomers are decreased, this suggests Mrj is promoting the formation of Orb2 oligomers. On the reviewer’s point, if Mrj can prevent the transition from 0.1% SDS soluble to 2% SDS soluble Orb2 oligomers, we think it is possible for Mrj to both promote oligomerization of Orb2 as well as prevent it from forming bigger non-functional oligomers, but the second point is not tested here. The relevant data is now presented in Figure 5H, I and J.
I also find the sentence that "Mrj is probably regulating the oligomerization of endogenous Orb2 in the brain" somewhat an overstatement. I would rather prefer to say that the data show that Mrj1 affects the oligomeric behavior/status of Orb2.
Based on the reviewer’s suggestion we have now changed the sentence to Mrj is probably regulating the oligomeric status of Orb2
Figure 5:
To my knowledge, the Elav driver regulates expression in all neurons, but not in glial cells that comprise a significant part of the fly heads/brain. The complete absence of Mrj in the fly-heads when using this driver is therefore somewhat surprising. Or do we need to conclude from this that glial cells normally already lack Mrj expression?
On driving Mrj RNAi with Elav Gal4, we did not detect any Mrj in the western. We attempted to address the glial contribution towards Mrj’s expression we used a Glia-specific driver Repo Gal4 line to drive the control and Mrj RNAi line and performed a western blot using fly head lysate with anti-Mrj antibody. In this experiment, we did not observe any difference in Mrj levels between the two sets. As the Mrj antibody raised by us works in western blots but not in immunostainings, we could not do a colocalization analysis with a glial marker. However, we used the Mrj knockout Gal4 line to drive NLS-GFP and performed immunostainings of these flies with a glial marker anti-Repo antibody. Here we see two kinds of cells in the brain, one which have GFP but no Repo and the other where both are present together. This suggest that while Glial cells have Mrj but probably majority of Mrj in the brain comes from the neurons. We also found a reference where it was shown that Elav protein as well as Elav Gal4 at earlier stages of development expresses in neuroblasts and in all Glia (Berger et al, 2007). So, another possibility is when we are driving Mrj RNAi using Elav Gal4, this knocks down Mrj in both the neurons as well as in the glia. This coupled with the catalytic nature of RNAi probably creates an effective knockdown of Mrj as seen in the western blot. This data is now added in Supplementary Figure 5G and H.
Why not use these lines also for the memory test for confirmation? I understand the concerns of putative confounding effects of a full knockdown (which were however not reported), but now data rely only on the mushroom body-specific knockdown for the 201Y Gal4 line, for which the knockdown efficiency is not provided. But even more so, here a temperature shift (22oC-30oC) was required to activate the expression of the siRNA. For the effects of this shift alone no controls were provided. The functional memory data are nice and consistent with the hypothesis, but can it be excluded that the temperature shift (rather than the Mrj) knockdown has caused the memory defects? I think it is crucial to include the proper controls or use a different knockdown approach that does not require temperature shifts or even use the knockout flies.
We have now performed the memory experiments with Mrj knockout flies. Our experiments show at 16 and 24-hour time points Mrj knockout flies have significantly reduced memory in comparison to the control wildtype. This data is now added in Figure 6B.
Figure 6:
The finding of a co-IP between Rpl18 and Mrj (one-directional only) by no means suffices to conclude that Mrj may interact with nascent Orb2 chains here (which would be the relevant finding here). The fact that Mrj is a self-oligomerising protein (also in vitro, so irrespective of ribosomal associations!), and hence is found in all fractions in a sucrose gradient, also is not a very strong case for its specific interaction with polysomes. The finding that there is just more self-oligomerizing Orb2A co-sedimenting with polysomes in sucrose gradients neither is evidence for a direct effect of Mrj enhancing association of Orb2A with the translating ribosomes even though it would fit the hypothesis. So all in all, I think the data in this figure and non-conclusive and the related conclusions should be deleted.
We have now performed the reverse co-IP between Rpl18-Flag and Mrj-HA using anti-HA antibody and could detect an interaction between the two. This data is now added in Supplementary Figure 6A.
To address if Mrj is a self-oligomerizing protein that can migrate to heavier polysome fractions due to its size, we have loaded recombinant Mrj on an identical sucrose gradient as we use for polysome analysis. Post ultra-centrifugation we fractionated the gradients and checked if Mrj can be detected in the fraction numbers where polysomes are present. In this experiment, we could not detect recombinant Mrj in the heavier polysome fractions (data presented in Supplementary Figure 6B). Overall, our observations of Mrj-Rpl18 IPs, the presence of cellularly expressed Mrj in polysome fractions, and the absence of recombinant Mrj from these fractions, suggest a likelihood of Mrj’s association with the translating ribosomes.
On the reviewer’s point of us concluding Mrj may interact with nascent Orb2 chains, we have not mentioned this possibility in the manuscript as we don’t have any evidence to suggest this. We have also added a sentence: This indicates that in presence of Mrj, the association of Orb2A with the translating ribosomes is enhanced, however, if this is a consequence of increased Orb2A oligomers due to Mrj or caused by interaction between polysome-associated Orb2A and Mrj will need to be tested in future.
Based on these above-mentioned points, we hope we can keep the data and conclusions of this section.
Overall, provided that proper controls/additional data can be provided for the key experiments of memory consolidation, I find this an intriguing study that would point towards a role of a molecular chaperone in controlling memory functions via regulating the oligomeric status of a prion-like protein and that is worthwhile publishing in a good journal.
However, in terms of mechanistical interpretations, several points have to be reconsidered (see remarks on figure 1,4); this pertains especially to what is discussed on page 13. In addition, I'd like the authors to put their data into the perspective of the findings that in differentiated neurons DNAJB6 levels actually decline, not incline (Thiruvalluvan et al, 2020), which would be counterintuitive if these proteins are playing a role as suggested here in memory consolidation.
We have addressed the comments on Figures 1 and 4 earlier. We have also added new memory experiment’s data with the Mrj knockout in Figure 6.
We have attempted to put the observations with Drosophila Mrj in perspective to observations in Thiruvalluvan et al, on human DnaJB6 in the discussions as follows:
Can our observation in Drosophila also be relevant for higher mammals? We tested this with human DnaJB6 and CPEB2. In mice CPEB2 knockout exhibited impaired hippocampus-dependent memory (Lu et al, 2017), so like Drosophila Orb2, its mammalian homolog CPEB2 is also a regulator of long-term memory. In immunoprecipitation assay we could detect an interaction between human CPEB2 and human DnaJB6, suggesting the feasibility for DnaJB6 to play a similar role to Drosophila Mrj in mammals. However, as the human DnaJB6 level was observed to undergo a reduction in transitioning from ES cells to neurons, (Thiruvalluvan et al, 2020) how this can be reconciled with its possible role in the regulation of memory. We speculate, such a reduction if is happening in the brain will occur in a highly regulatable manner to allow precise control over CPEB2 oligomerization only in specific neurons where it is needed and the reduced levels of DnaJB6 is probably sufficient to aid CPEB oligomerization Alternatively, there may be additional chaperones that may function in a stage-specific manner and be able to compensate for the decline in levels of DNAJB6.
Reviewer #2 (Evidence, reproducibility and clarity (Required)):
Summary: The manuscript describes the role of the Hsp40 family protein Mrj in the prion-like oligomerization of Orb2. The authors demonstrate that Mrj promotes the oligomerization of Orb2, while a loss in Mrj diminishes the extent of Orb2 oligomerization. They observe that while Mrj is not an essential gene, a loss in Mrj causes deficiencies in the consolidation of long-term memory. Further, they demonstrate that Mrj associates with polysomes and increases the association of Orb2 with polysomes.
Major comments: None
Minor comments:
In the section describing the chaperone properties of Mrj in clearing Htt aggregates (Fig 2), the legend describes that "Mrj-HA constructs are more efficient in decreasing Htt aggregation compared to Mrj-RFP". It would be helpful to add Mrj-RFP to the quantification in Fig 2G to know exactly the difference in efficiency. Is there an explanation for why the 2 constructs behave differently?
We have added the quantitation of Htt aggregates in presence of Mrj-RFP in the revised version (Data presented in Figure 2G). While the efficiency of Mrj-RFP to decrease Htt aggregates is significantly less in comparison to Mrj-HA, it is still significantly better in comparison to the control CG7133-HA construct. It is possible, due to the tagging of Mrj with a larger tag (RFP), this reduces its ability to decrease the Htt aggregates in comparison to the construct where Mrj is tagged with a much smaller HA tag.
Figs A, B, C, G need to have quantification of the percentage of colocalization with details about the number of cells quantified for each experiment.
We have now added the intensity profile images and colocalization quantitation (pearson’s coefficient) in the Supplemental Figure 5A and B. This quantitation is done from multiple ROI’s taken from at 4-6 cells.
In Fig 6 B, C, F, G it would be helpful to label the 40S, 60S and 80S peaks in the A 254 trace.
We have now labeled the 80S, and polysome peaks in the Figure 7B, C, F and G. We could not separate the 40S and 60S peaks in the A254 trace.
It's interesting that Mrj has opposing functions with regard to aggregation when comparing huntingtin with Orb2. From the literature presented in the discussion, it appears as though chaperones including Mrj have an anti-aggregation role for prions. It would be helpful to have more discussion around why, in the case of Orb2, this is different. The discussion states that "The only Hsp40 chaperone which was found similar to Mrj in increasing Orb2's oligomerization is the yeast Jjj2 protein" - this point needs elaboration, as well as a reference.
In the discussions section we have now added the following speculations on this:
One question here is why Mrj behaves differently with Orb2 in comparison to other amyloids. Orb2 differs from other pathogenic amyloids in its extremely transient existence in the toxic intermediate form (Hervás et al, 2016). For the pathogenic amyloids, since they exist in the toxic intermediate form for longer, Mrj probably gets more time to act and prevent or delay them from forming larger aggregates. For Orb2, Mrj may help to quickly transition it from the toxic intermediate state, thereby helping this state to be transient instead of longer. An alternate possibility is post-transition from the toxic intermediate state, Mrj stabilizes these Orb2 oligomers and prevents them from forming larger aggregates. This can be through Mrj interacting with Orb2 oligomers and blocking its surface thereby preventing more Orb2 from assembling over it. Another difference between the Orb2 oligomeric amyloids and the pathogenic amyloids is in the nature of their amyloid core. For the pathogenic amyloids, this core is hydrophobic devoid of any water molecules, however for Orb2, the core is hydrophilic. This raises another possibility that if the Orb2 oligomers go beyond a certain critical size, Mrj can destabilize these larger Orb2 aggregates by targeting its hydrophilic core.
On the Jjj2 point raised by the reviewer, we have added the (Li et al, 2016a) reference now and elaborated as:
The only Hsp40 chaperone which was found similar to Mrj in increasing Orb2’s oligomerization is the yeast Jjj2 protein. In Jjj2 knockout yeast strain, Orb2A mainly exists in the non-prion state, whereas on Jjj2 overexpression the non-prion state could be converted to a prion-like state. In S2 cells coexpression of Jjj2 with Orb2A lead to an increase in Orb2 oligomerization (Li et al, 2016a). However, Jjj2 differs from Mrj, as when it is expressed in S2 cells, we do not detect it to be present in the polysome fractions.
The Jjj2 polysome data is now presented in Supplementary Figure 6C.
Reviewer #2 (Significance (Required)):
General assessment:
Overall, the work is clearly described and the manuscript is very well-written. The motivation behind the study and its importance are well-explained. I only have minor comments and suggestions to improve the clarity of the work. The study newly describes the interaction between the chaperone Mrj and the translation regulator Orb2. The experiments that the screen for proteins that interact with Orb2 and promote its oligomerization are very thorough. The experiments that delve into the role of Mrj in protein synthesis are a good start, and need to be explored further, but that is beyond the scope of this study.
Advance: The study describes a new interaction between the chaperone Mrj and the translation regulator Orb2. The study is helpful in expanding our knowledge of prion regulators as well factors that affect memory acquisition and consolidation.
Audience: This paper will be of most interest to basic researchers.
My expertise is in Drosophila genetics and neuronal injury.
Reviewer #3 (Evidence, reproducibility and clarity (Required)):
The manuscript submitted by Desai et al. identifies a chaperone of the Hsp40 family (Mrj) that binds Orb2 and modulates its oligomerization, which is critical for Orb2 function in learning and memory in Drosophila. Orb2 are proteins with prion-like properties whose oligomerization is critical for their function in the storage of memories. The main contribution of the article is the screen of Hsp40 and Hsp70-family proteins that bind Orb2. The authors show IP results for all the candidates tested, including those that bind Fig. 1) and those that don't (Supp Fig 3). There is also a figure devoted to examining the interaction of Mrj with polyglutamine models (Htt). They also generate a KO mutant that is viable and shows no gross defects or protein aggregation. Lastly, they show that the silencing of Mrj in the mushroom body gamma neurons results in weaker memories in a courtship paradigm. Although the data is consistent and generally supportive of the hypothesis, key details are missing in several areas, including controls. Additionally, the interpretation of some results leaves room for debate. Overall, this is an ambitious article that needs additional work before publication.
Specific comments:
General concern over the interpretation of IP experiments and colocalization. These experiments don't necessarily reflect direct interactions. They are consistent with direct interaction but not the only explanation for a positive IP or colocalization.
This paper is centred on the interaction between Orb2A and Mrj, which we have detected using immunoprecipitation. The reviewer’s concern here is, this experiment is not able to distinguish if this can be a direct protein-protein interaction or if the two proteins are part of a complex.
To address this concern we have used purified recombinant protein-based pulldowns. Our experiments with purified protein pulldowns (GST tagged Mrj from E.coli with Orb2A from E.coli or Orb2A-GFP from Sf9 cells) suggest Orb2A and Mrj can directly interact amongst themselves. This data is now presented in Figure 1J and K.
The Huntingtin section has a few concerns. The IF doesn't show all controls and the quantification is not well done in terms of what is relevant. A major problem is the interpretation of Fig 2F. The idea is that Mrj prevents the aggregation of Htt, which is the opposite of what is observed with Orb2. The panel actually shows a large Htt aggregate instead of multiple small aggregates. This has been reported before in Drosophila and other systems with different polyQ models. Mrj and other Hsp40 and Hsp70 proteins modify Htt aggregation, but in an unexpected way. This affects the model shown in Fig. 6H. Lastly, Fig 2H and 2I show very different level of total Htt.
In Figure 2F of the previously submitted manuscript, we have shown representative images of HttQ103-GFP cells coexpressing with a control DnaJ protein CG7133-HA and Mrj-HA. In Figure 2G we quantitated the number of cells showing aggregates within the population of doubly transfected cells. On the reviewer’s point of figure 2F showing large Htt aggregates instead of multiple small aggregates, we do not see a large Htt aggregate in presence of Mrj in this figure, the pattern looks diffused here and very different from the control CG7133 where the aggregates are seen. We have performed the same experiment with a different Htt construct (588 amino acids long fragment) tagged with RFP, and here also we notice in presence of Mrj, the aggregates are decreased and the expression pattern looks diffused (Supplementary Figure 4E, 4F).
If the comment on large Htt aggregates in presence of Mrj is concerning figure 2E, here we show Mrj-RFP to colocalize with the Htt aggregates. Here, even though Mrj-RFP colocalizes with Htt aggregates, it rescues the Htt aggregation phenotype as in comparison to the control CG7133, the number of cells with Htt aggregates is still significantly less here. We have added this quantitation of rescue by Mrj-RFP in the revised manuscript now. The observation of colocalization of Mrj-RFP with Htt aggregates is similar to previous reports of chaperones rescuing Htt aggregation and yet showing colocalization with the aggregates. Both Hdj-2 and Hsc70 suppress Htt aggregation and yet were observed to colocalize with Htt aggregates in the cell line model as well as in nuclear inclusions in the brain (Jana et al, 2000). In a nematode model of Htt aggregation, DNJ-13 (DnaJB-1), HSP-1 (Hsc70), and HSP-11 (Apg-2) were shown to colocalize with Htt aggregates and yet decrease the Htt aggregation (Scior et al, 2018). Hsp70 was also found to colocalize with Htt aggregates in Hela cells (Kim et al, 2002).
Regarding Figures 2H and 2I, while figure 2H is of an SDS-PAGE to show no difference in the levels of monomeric HttQ103 (marked with *) in presence of Mrj and the control CG7133, figure 2I is for the same samples ran in an SDD-AGE where reduced amount of Htt oligomers as seen with the absence of a smear in presence of Mrj. The apparent difference in Htt levels between 2H and 2I is due to the detection of Htt aggregates/oligomers in the SDD-AGE which are unable to enter the SDS-PAGE and hence undetected. In Supplementary Figure 4E, similar experiments were done with the longer Htt588 fragment and here we notice in the SDD-AGE reduced intensity of the smear made up of Htt oligomers, again suggesting a reduction in Htt aggregates. Thus our results are not in contradiction to previous studies where Mrj was found to rescue Htt aggregate-associated toxicity.
Endogenous expression of Mrj using Gal4 line: where else is it expressed in the brain / head and in muscle. Fig 3G shows no muscle abnormalities but no evidence is shown for muscle expression. It is nice that Fig 3E and F show no abnormal aggregates in the Mrj mutant, but this would be maybe more interesting if flies were subjected to some form of stress.
We have now added images of the brain and muscles to show the expression pattern of Mrj. Using Mrj Gal4 line and UAS- CD8GFP, we noticed enriched expression in the optic lobes, mushroom body, and olfactory lobes. We also noticed GFP expression in the larval muscles and neuromuscular junction synaptic boutons. This data is now presented in Supplementary Figure 5C, D, E and F.
On the reviewer’s point of subjecting the Mrj KO flies to some form of stress, we have not performed this. We have added in the discussions a note of caution, that loss of Mrj may still result in a protein aggregation-related disease phenotype, probably under a sensitized condition of certain stresses which is not tested in this manuscript.
Fig. 5B shows no Mrj detectable from head homogenates in flies silencing Mrj in neurons with Elav-Gal4. It would be nice if they could show that ONLY neurons express Mrj in the head. Also noted, Elav-Gal4 is a weak driver, so it is surprising that it can generate such robust loss of Mrj protein
We have used an X chromosome Elav Gal4 driver to drive the UAS-Mrj RNAi line and here we could not detect Mrj in the western. To address the reviewer’s point on the glial contribution towards expression of Mrj, we used a Glial driver Repo Gal4 to drive Mrj RNAi. In this experiment, we did not detect any difference in Mrj levels between the control and the Mrj RNAi line (presented now in Supplementary Figure 5G). We also used the Mrj knockout Gal4 line to drive NLS-GFP and immunostained these using a glial marker anti-Repo antibody. Here, we were able to detect cells colabelled by GFP as well as Repo, suggesting Mrj is likely to be present in the glial cells (presented now in Supplementary Figure 5H). We also looked in the literature and found a reference where it was shown that Elav protein as well as Elav Gal4 at earlier stages of development expresses in neuroblasts and in all Glia (Berger et al, 2007). So, another possibility is when we are driving Mrj RNAi using Elav Gal4, this knocks down Mrj in both the neurons as well as in the glia.
Fig 4-Colocalization of Orb2 with Mrj lacks controls. The quantification could describe other phenomena because the colocalization is robust but the numbers shown describe something else.
We have now added the intensity profile and colocalization quantitation (pearson’s coefficient) in Supplemental Figure 5A and B. This quantitation is done from multiple ROI’s taken from 4-6 cells. Also, to suggest the interaction of Orb2 isoforms with Mrj, we are not depending on colocalization alone and have used immunoprecipitation experiments to support our observations.
Fly behavior. The results shown for Mrj RNAi alleles is fine but it would be more robust if this was validated with the KO line AND rescued with Mrj overexpression.
We have now performed memory assays with the Mrj knockout. Our experiments showed Mrj knockouts to show significantly decreased memory in comparison to wild-type flies at 16 and 24-hour time points (presented in Figure 6B). We have not been able to make an Mrj Knockout-UAS Mrj recombinant fly, most likely due to the closeness of the two with respect to their genomic location in second chromosome.
Minor comments:
Please, revise minor errors, there are several examples of words together without a space.
We have identified the words without space and have corrected them now.
Intro: describe the use of functional prions. Starting the paragraph with this sentence and then explaining what prion diseases are is a little confusing. Also "prion proteins" can be confusing because the term refers to PrP, the protein found in prions.
We have now altered the introduction and have described functional prions.
Results, second subtitle in page 5. This sentence is quite confusing using prion-like twice
We have now changed the heading to “Drosophila Mrj converts Orb2A from non-prion to a prion-like state.”
Page 6: "conversion from non-prion to prion-like form...". This can be presented differently. Prion-like properties are intrinsic, proteins don't change from non-prion to prion-like. They may be oligomeric or monomeric or highly aggregated but the prion-like property doesn't change
We agree with the reviewer's point of Prion-like properties are intrinsic, but the protein might or might not exist in the prion-like state or confirmation. When we are using the term conversion from non-prion to prion-like form we mean to suggest a conformational conversion leading to the eventual formation of the oligomeric species. We also noted the terminology of non-prion to prion-like state change is used in several papers (Satpute-Krishnan & Serio, 2005; Sw & Yo, 2012; Uptain et al, 2001).
Scale bars and text are too small in several figures
We have now mentioned in the figure legends the size of the scale bars. For several images we have made the scale bars also larger.
Not sure why Fig 4C is supplemental, seems like an important piece of data.
We have kept this data in the supplemental data as we performed this experiment with recombinant protein which is tagged with 6X His and we are not sure if this high degree of oligomerization/aggregation of recombinant Mrj and further precipitation over time, happens inside the cells/ brain.
Intro to Mrj KO in page 7 is too long. Most of it belongs in the discussion
We have now moved the portions on mammalian DNAJB6 which were earlier in the results section to the discussions section.
Change red panels in IF to other color to make it easier for colorblind readers.
We have now changed the red panels to magenta. We apologize for our figures not being colorblind friendly earlier.
The discussion is a little diffuse by trying to compare Orb2 with mammalian prions and amyloids and yeast prions.
We looked into the functional prion data and couldn’t find much on chaperone mediated regulation of these. Also, we felt comparing with the amyloids and yeast prions brings out the contrast with respect to the Mrj mediated regulatory differences between the two.
Reviewer #3 (Significance (Required)):
This is a paper with a broad scope and approaches. The paper describes the role of Mrj in the oligomerization of Orb2 by protein biochemistry techniques and determine the role of loss of Mrj in the mushroom bodies in fly behavior.
The audience for this content is basic research and specialized. The role of Mrj in Orb2 aggregation and function sheds new light on the mechanisms regulating the function of this protein involved in a novel mechanism of learning and memory.
References:
Bengoechea R, Findlay AR, Bhadra AK, Shao H, Stein KC, Pittman SK, Daw JA, Gestwicki JE, True HL & Weihl CC (2020) Inhibition of DNAJ-HSP70 interaction improves strength in muscular dystrophy. J Clin Invest 130: 4470–4485
Berger C, Renner S, Lüer K & Technau GM (2007) The commonly used marker ELAV is transiently expressed in neuroblasts and glial cells in the Drosophila embryonic CNS. Dev Dyn 236: 3562–3568
Fayazi Z, Ghosh S, Marion S, Bao X, Shero M & Kazemi-Esfarjani P (2006) A Drosophila ortholog of the human MRJ modulates polyglutamine toxicity and aggregation. Neurobiol Dis 24: 226–244
Heinrich SU & Lindquist S (2011) Protein-only mechanism induces self-perpetuating changes in the activity of neuronal Aplysia cytoplasmic polyadenylation element binding protein (CPEB). Proc Natl Acad Sci U S A 108: 2999–3004
Hervás R, Li L, Majumdar A, Fernández-Ramírez MDC, Unruh JR, Slaughter BD, Galera-Prat A, Santana E, Suzuki M, Nagai Y, et al (2016) Molecular Basis of Orb2 Amyloidogenesis and Blockade of Memory Consolidation. PLoS Biol 14: e1002361
Hervas R, Rau MJ, Park Y, Zhang W, Murzin AG, Fitzpatrick JAJ, Scheres SHW & Si K (2020) Cryo-EM structure of a neuronal functional amyloid implicated in memory persistence in Drosophila. Science 367: 1230–1234
Izawa I, Nishizawa M, Ohtakara K, Ohtsuka K, Inada H & Inagaki M (2000) Identification of Mrj, a DnaJ/Hsp40 family protein, as a keratin 8/18 filament regulatory protein. J Biol Chem 275: 34521–34527
Jana NR, Tanaka M, Wang G h & Nukina N (2000) Polyglutamine length-dependent interaction of Hsp40 and Hsp70 family chaperones with truncated N-terminal huntingtin: their role in suppression of aggregation and cellular toxicity. Hum Mol Genet 9: 2009–2018
Kakkar V, Månsson C, de Mattos EP, Bergink S, van der Zwaag M, van Waarde MAWH, Kloosterhuis NJ, Melki R, van Cruchten RTP, Al-Karadaghi S, et al (2016) The S/T-Rich Motif in the DNAJB6 Chaperone Delays Polyglutamine Aggregation and the Onset of Disease in a Mouse Model. Mol Cell 62: 272–283
Kim S, Nollen EAA, Kitagawa K, Bindokas VP & Morimoto RI (2002) Polyglutamine protein aggregates are dynamic. Nat Cell Biol 4: 826–831
Li L, Sanchez CP, Slaughter BD, Zhao Y, Khan MR, Unruh JR, Rubinstein B & Si K (2016a) A Putative Biochemical Engram of Long-Term Memory. Curr Biol 26: 3143–3156
Li S, Zhang P, Freibaum BD, Kim NC, Kolaitis R-M, Molliex A, Kanagaraj AP, Yabe I, Tanino M, Tanaka S, et al (2016b) Genetic interaction of hnRNPA2B1 and DNAJB6 in a Drosophila model of multisystem proteinopathy. Hum Mol Genet 25: 936–950
Liebman SW & Chernoff YO (2012) Prions in yeast. Genetics 191: 1041–1072
Lu W-H, Yeh N-H & Huang Y-S (2017) CPEB2 Activates GRASP1 mRNA Translation and Promotes AMPA Receptor Surface Expression, Long-Term Potentiation, and Memory. Cell Rep 21: 1783–1794
Prusiner SB (2001) Neurodegenerative Diseases and Prions. New England Journal of Medicine 344: 1516–1526
Satpute-Krishnan P & Serio TR (2005) Prion protein remodelling confers an immediate phenotypic switch. Nature 437: 262–265
Scior A, Buntru A, Arnsburg K, Ast A, Iburg M, Juenemann K, Pigazzini ML, Mlody B, Puchkov D, Priller J, et al (2018) Complete suppression of Htt fibrilization and disaggregation of Htt fibrils by a trimeric chaperone complex. EMBO J 37: 282–299
Si K (2015) Prions: what are they good for? Annu Rev Cell Dev Biol 31: 149–169
Si K, Choi Y-B, White-Grindley E, Majumdar A & Kandel ER (2010) Aplysia CPEB can form prion-like multimers in sensory neurons that contribute to long-term facilitation. Cell 140: 421–435
Si K, Lindquist S & Kandel ER (2003) A neuronal isoform of the aplysia CPEB has prion-like properties. Cell 115: 879–891
Sw L & Yo C (2012) Prions in yeast. Genetics 191
Thiruvalluvan A, de Mattos EP, Brunsting JF, Bakels R, Serlidaki D, Barazzuol L, Conforti P, Fatima A, Koyuncu S, Cattaneo E, et al (2020) DNAJB6, a Key Factor in Neuronal Sensitivity to Amyloidogenesis. Mol Cell 78: 346-358.e9
Uptain SM & Lindquist S (2002) Prions as protein-based genetic elements. Annu Rev Microbiol 56: 703–741
Uptain SM, Sawicki GJ, Caughey B & Lindquist S (2001) Strains of [PSI(+)] are distinguished by their efficiencies of prion-mediated conformational conversion. EMBO J 20: 6236–6245
Watson ED, Mattar P, Schuurmans C & Cross JC (2009) Neural stem cell self-renewal requires the Mrj co-chaperone. Dev Dyn 238: 2564–2574
Wickner RB (2016) Yeast and Fungal Prions. Cold Spring Harb Perspect Biol 8: a023531
Wickner RB, Edskes HK, Maddelein ML, Taylor KL & Moriyama H (1999) Prions of yeast and fungi. Proteins as genetic material. J Biol Chem 274: 555–558
Wickner RB, Masison DC, Edskes HK & Maddelein ML (1996) Prions of yeast, [PSI] and [URE3], as models for neurodegenerative diseases. Cold Spring Harb Symp Quant Biol 61: 541–550
Reporting via the CSRD will incorporate the increasing demand for digitization. Companies will be required to prepare their reporting in XHTML format in accordance with the European Single Electronic Format Regulation. They are also required to tag sustainability information within the report according to a digital categorization system, which should be developed with the ESRS.
So, it'll be scrapable, and presumably online
What do you typically use?
Imagine if they answered "Google Docs, and then pick 'HTML' when you save it".
It's the sort of thing that seems obviously wrong on its face, but in practice is more expedient and not egregiously worse than the accepted alternative.
Reviewer #1 (Public Review):
The manuscript by Lujan and colleagues describes a series of cellular phenotypes associated with the depletion of TANGO2, a poorly characterized gene product but relevant to neurological and muscular disorders. The authors report that TANGO2 associates with membrane-bound organelles, mainly mitochondria, impacting in lipid metabolism and the accumulation of reactive-oxygen species. Based on these observations the authors speculate that TANGO2 function in Acyl-CoA metabolism.
The observations are generally convincing and most of the conclusions appear logical. While the function of TANGO2 remains unclear, the finding that it interferes with lipid metabolism is novel and important. This observation was not developed to a great extent and based on the data presented, the link between TANGO2 and acyl-CoA, as proposed by the authors, appears rather speculative.
1. The data with overexpressed TANGO2 looks convincing but I wonder if the authors analyzed the localization of endogenous TANGO2 by immunofluorescence using the antibody described in Figure S2. The idea that TANGO2 localizes to membrane contact sites between mitochondria and the ER and LDs would also be strengthened by experiments including multiple organelle markers.
2. The changes in LD size in TANGO2-depleted cells are very interesting and consistent with the role of TANGO2 in lipid metabolism. From the lipidomics analysis, it seems that the relative levels of the main neutral lipids in TANGO2-depleted cells remain unaltered (TAG) or even decrease (CE). Therefore, it would be interesting to explore further the increase in LD size for example analyze/display the absolute levels of neutral lipids in the various conditions.
3. Most of the lipidomics changes in TANGO2-depleted cells are observed in lipid species present in very low amounts while the relative abundance of major phospholipids (PC, PE PI) remains mostly unchanged. It would be good to also display the absolute levels of the various lipids analyzed. This is an important point to clarify as it would be unlikely that these major phospholipids are unaffected by an overall defect in Acyl-CoA metabolism, as proposed by the authors.
Reviewer #1 (Public Review):
According to current knowledge, zebrafish neurons maintain the capacity of regenerating with the exception of adult cerebellar Purkinje cells (PC), which are thought to have lost this property. Regeneration instead occurs at larval stages but whether newly generated PC form fully functional circuits is still unclear. This elegant and well-performed study takes advantage of a transgenic zebrafish line that enables inducing apoptosis under a tamoxifen-inducible system and at the same time visualizes PCs morphology through a membrane tagged RFP. Using this line (and other lines that tag radial glial and ventricular progenitors) in combination with morphological and functional analysis, the authors show that ventricular progenitors retain the lifelong ability to regenerate PCs. At larval stages, the newly regenerated PCs form fully functional circuits that lead to normal behavior. In adults, PC regeneration is less efficient (and PCs are also less prone to undergo apoptosis) but sufficient to support exploratory behavior. This study resolves the controversial issue of whether adult PC regeneration is possible and demonstrates that newly formed PCs at larval and adult stages can form functional circuits that support normal behavior.
This is a well-performed and carefully executed and quantified study. There is however a point that needs clarification:
The authors state that acute regeneration occurs between 5-10dpt. However, the graphs in Fig 1D, F, and 2F indicate that most PC generation occurs from 20-30 days. What happens in this period? Does proliferation increase? Can the authors perform BrdU incorporation between 6 days and 1 month? Related to this, as the authors indicate in lines 129-131, the regeneration of new PCs overlaps with normal development. Are other neuronal cell types generated in appropriate numbers?
Author Response
Reviewer #1 (Public Review):
This study addresses the role of the general transcription factor TBP (TATA-binding protein), a subunit of the TFIID complex, in RNA polymerase II transcription. While TBP has been described as a key component of protein complexes involved in transcription by all three RNA polymerases, several previous studies on TBP loss of function and on the function of its TRF2 and TRF3 paralogues have questioned its essential role in RNA polymerase II transcription. This new study uses auxin induced TBP degradation in mouse ES cells to provide strong evidence that its loss does not affect ongoing polymerase II transcription or heat-shock and retinoic acid-induced transcription activation, but severely inhibits polymerase III transcription. The authors coupled TBP degradation with TRF2 knock out to show that it does not account for the residual TBP-independent transcription. Rather the study provides evidence that TFIID can assemble and is recruited to promoters in the absence of TBP.
All together the study provides compelling evidence for TBP-independent polymerase II transcription, but a better characterization of the residual TFIID complex and recruitment of other general transcription factors to promoters would strengthen the conclusions.
We thank the reviewer for their accurate summary of our findings and the public assessment of our manuscript.
Reviewer #2 (Public Review):
The paper is intriguing, but to me, a main weakness is that the imaging experiments are done with overexpressed protein. Another is that the different results for the different subunits of TFIID would indicate that there are multiple forms of TFIID in the nucleus, which no one has observed/proposed before. Otherwise, the experimental data would have to be interpreted in a more nuance way. Additionally, there is no real model of how a TBP-depleted TFIID would recruit Pol II. Do the authors suggest that when TBP is present, it is not playing a role in Pol II transcription, despite being at all promoters? Or that in its absence an alternative mechanism takes over? In the latter case, are they proposing that it is just based on the rest of TFIID? How? The authors do not provide a mechanistic explanation of what is actually happening and how Pol II is being recruited to promoters.
We thank the reviewer for their public review of our manuscript. Although the reviewer poses many interesting questions raised from our findings, they would be a great focus for future directions.
We agree that our imaging experiments using over-expressed constructs have limitations. Though they provide insight that is unique and orthogonal to the genomics analyses, we agree that they are still preliminary, and therefore we have removed them from the manuscript, with the hope of further developing these experiments into a follow-up manuscript.
While we cannot exclude different forms of TFIID in the cell, previous studies have identified different TAF-containing complexes. Indeed, we referenced several of these studies in our manuscript, including TFTC/SAGA. Furthermore, in our Discussion section, we speculated how a large multi-subunit complex like TFIID may not behave as a monolith but rather have distinct dynamics/behavior among the subunits. Some studies are now revealing that biochemically defined complexes behave more as a hub, with subunits having distinct dynamics coming in and out of the complex, but in a way such that a snapshot at any given time would show a stably formed complex.
What TBP does for Pol II is an intriguing question, and one that we had thought we could answer with our rapid depletion system. One possibility is that Pol II initiation has evolved to have so many redundant mechanisms such that removal of one factor (TBP) would not disrupt the whole system. And yet, TBP remains a highly essential gene (perhaps mostly for its essential role in Pol III transcription), and therefore, its binding to Pol II gene promoters has been maintained, almost in a vestigial way. Of course, this is speculative, and our rapid depletion system only shows us that TBP is not required for Pol II transcription, not what it does when it binds to promoters.
Lastly, we believe that our study tested 3 potential mechanisms that could explain TBP-independence for Pol II transcription. 1) We tested the possibility that TBP is only needed for induction and not for subsequent re-initiation. We provide evidence using two orthogonal induction systems that this is not the case. 2) We tested whether the TRF2 paralog could functionally replace TBP, and show that this is also not the case. 3) We show that TFIID can form in the absence of TBP. While we agree that there are more mechanisms to test, addressing all of them would require a re-examination of over 50 years of research that would not be feasible to report in a single manuscript, especially for a system as complex as Pol II initiation.
Reviewer #3 (Public Review):
In this study, the authors set out to study the requirement of the TATA binding protein (TBP) in transcription initiation in mESCs. To this end they used an auxin inducible degradation (AID) system. They report that by using the AID-TBP system after auxin degradation, 10-20% of TBP protein is remaining in mESCs. The authors claim that as, the observed 80-90% decrease of TBP levels are not accompanied by global changes in RNA polymerase II (Pol II) chromatin occupancy or nascent mRNA levels, TBP is not required for Pol II transcription. In contrast, they find that under similar TBP-depletion conditions tRNA transcription and Pol III chromatin occupancy were impaired. The authors also asked whether the mouse TBP paralogue, TBPL1 (also called TRF2) could functionally replace TBP, but they find that it does not. From these and additional experiments the authors conclude that redundant mechanisms may exist in which TBP-independent TFIID like complexes may function in Pol II transcription.
The major strengths of this manuscript are the numerous genome-wide investigations, such as many different CUT&Tag experiments, and NET-seq experiments under control and +auxin conditions and their analyses. Weaknesses lie in some experimental setups (i.e. overexpression of Halo-tagged TAFs), mainly in the overinterpretation (or misinterpretation) of the data and in the lack of a fair discussion of the obtained data in comparison to observations described in the literature. As a result, very often the interpretation of data does not fully support the conclusions. Nevertheless, the findings that 80-90% decrease in cellular TBP levels do not have a major effect on Pol II transcription are interesting, but the manuscript needs some tuning down of many of the authors' very strong conclusions, correcting several weaker points and with a more careful and eventually more interesting Discussion.
We thank the reviewer for their public review of our manuscript. We would like to add that, in addition to testing the TBP paralog for redundancy, we also tested a mechanism in which TBP would be required for the initial round of transcription but not for subsequent ones. We show that data from orthogonal experiments that this mechanism is not the case. As in our response to Reviewer 2, we agree that our over-expression imaging experiments are still somewhat preliminary, and therefore we have removed these experiments and potential over/misinterpretation of these results from the manuscript.
Reviewer #3 (Public Review):
In this study, the authors set out to study the requirement of the TATA binding protein (TBP) in transcription initiation in mESCs. To this end they used an auxin inducible degradation (AID) system. They report that by using the AID-TBP system after auxin degradation, 10-20% of TBP protein is remaining in mESCs. The authors claim that as, the observed 80-90% decrease of TBP levels are not accompanied by global changes in RNA polymerase II (Pol II) chromatin occupancy or nascent mRNA levels, TBP is not required for Pol II transcription. In contrast, they find that under similar TBP-depletion conditions tRNA transcription and Pol III chromatin occupancy were impaired. The authors also asked whether the mouse TBP paralogue, TBPL1 (also called TRF2) could functionally replace TBP, but they find that it does not. From these and additional experiments the authors conclude that redundant mechanisms may exist in which TBP-independent TFIID like complexes may function in Pol II transcription.
The major strengths of this manuscript are the numerous genome-wide investigations, such as many different CUT&Tag experiments, and NET-seq experiments under control and +auxin conditions and their analyses. Weaknesses lie in some experimental setups (i.e. overexpression of Halo-tagged TAFs), mainly in the overinterpretation (or misinterpretation) of the data and in the lack of a fair discussion of the obtained data in comparison to observations described in the literature. As a result, very often the interpretation of data does not fully support the conclusions.<br /> Nevertheless, the findings that 80-90% decrease in cellular TBP levels do not have a major effect on Pol II transcription are interesting, but the manuscript needs some tuning down of many of the authors' very strong conclusions, correcting several weaker points and with a more careful and eventually more interesting Discussion.
Author Response
Reviewer #1 (Public Review):
The authors present data identifying the role of the bacterial enhancer binding protein (bEBP) SypG in the regulation of the Qrr1 small RNA, which is known to be a key regulator of Vibrio fischeri bioluminescence production and squid colonization. Previously, only the bEBP LuxO was known to activate Qrr1 expression. LuxO and Qrr1 are conserved in the Vibrionaceae, and the authors show that SypG is conserved in ~half of the Vibrio family, suggesting that this Qrr1 regulatory OR gate controlled by LuxO or SypG may play important roles in physiology processes in other species.
Successful squid colonization by Vibrio fischeri is a complex process, known to be influenced by several factors, including the formation of and dispersal from cellular aggregates prior to entering squid pores, and inoculation of the light organ crypts, and biofilm formation within the crypts. Previously, it was shown that strains lacking qrr1 were at a deficit for crypt colonization in the presence of wild-type V. fischeri. Conversely, cells lacking binK, which encodes a hybrid histidine kinase, were at an advantage for crypt colonization in the presence of wild-type cells. However, the authors identified BinK as a negative regulator of Qrr1 expression in a transposon screen. The authors used genetic epistasis experiments and found that Qrr1 transcription can be activated by either phosphorylated LuxO at low cell densities (in the absence of quorum sensing signals) or by SypG, presumably by binding to the two upstream activation sequences in the promoter of qrr1 to activate transcription by the required alternative sigma factor sigma-54. The competition between these bEBPs has not been tested. The model proposed is an OR gate through which quorum sensing and aggregation signals control Qrr1. However, there are several untested aspects of this model. First, the role of phosphorylation in SypG activity, and the connection to BinK, are not addressed in this manuscript, which may confound the observed effects observed on qrr1 transcription. Further, the authors did not test whether SypG directly binds to the qrr1 promoter, nor did they assess the individual role of LuxO binding to the two LuxO binding sites in the absence of SypG. The study is lacking an in vivo assessment of SypG and LuxO binding/competition at the Qrr1 promoter based on the authors' model of the OR gate.
Major comments:
• What is known about the connection between BinK and SypG? BinK is a hybrid HK (intro states this). Does BinK phosphorylate/dephosphorylate SypG - directly or indirectly? I saw a published paper (Ludvik et al 2021) with a diagram suggesting BinK does inhibit SypG, but the connection is unclear. This diagram also suggested that SypG needs to be phosphorylated. Can the authors comment - does SypG need to be phosphorylated to be active? Because SypG has the same sequence as the LuxO linker (Fig. S2), then I presume that SypG would also need to be phosphorylated to be active (like LuxO)? The authors utilize a phosphomimic of LuxO to test function under constitutive activity (Fig. S3), but they do not use a phosphomimic of SypG (Fig 4). If the authors used a constitutive allele, would those assays reveal more about the competition between SypG and LuxO, in the presence of phosphorylated LuxO at low cell density? The authors should include a putative cartoon model for how BinK HK activity connects to SypG, based on what is already in the literature, to aid the reader.
We have added information & corresponding cartoon model in the results section about the signaling pathway involving BinK and SypG, including that SypG must be phosphorylated to be active and that BinK acts as a phosphatase towards SypG. We have also generated a SypGD53E mutant and found increased Pqrr1 activity, which suggests that phosphorylation of SypG has a major impact on SypG-dependent activation of Pqrr1.
• Line 246: Figure S3: nucleotide substitutions in both UAS regions showed loss of Pqrr1-gfp, but this could be due to binding/activation by SypG or LuxO. This should be tested in a sypG- strain to determine the sole effect of LuxO binding to these two UASs. In Figures 4G and 7, the luxO- sypG- Ptrc-sypG strain backgrounds allow the independent analysis of the two bEBPs. It is important to test which of these two sites is critical for LuxO-dependent activation of Pqrr1, given the conservation of the LuxO-Qrr1 region in other Vibrios (line 327, Fig. S5). Thus, the authors could also discuss whether these two proteins would compete at both sites. Further, the authors should comment that they have not shown biochemical evidence that SypG binds to the two UASs in the Qrr1 promoter. The regulation of this locus by SypG is only shown by genetic assays in this manuscript.
We have added a paragraph in the discussion highlighting how useful protein-DNA assays would be to address competition along with the barriers encountered with approaches to purify SypG. Regarding the contribution of each UAS to LuxO-dependent activation, we refer to the phosphomimic data of LuxO (Fig. S4) in the supplement that highlight G-131 and G-97 do not affect LuxO-dependent activation (as pointed out by reviewer #2), which has contributed to our test of a G-131T mutant in the co-colonization experiment.
• Examination of the binding of LuxO and SypG (e.g., ChIP-seq) in combination with their transcriptional reporter under varying conditions (low cell density vs high cell density, with or without rscS* overexpression) would be extremely beneficial in testing the model proposed.
We agree but have not had success in our attempts to perform ChIP due to protein instability. For example, we have tried SypG with a C-terminal TAP tag, which my colleague Dr. Lu Bai at Penn State has used extensively for ChIP, ChIP-seq, and ChIP-exo, but we could not observe a signal even when RscS* allele was included in the strain.
Reviewer #2 (Public Review):
The study by Surrett et al. uncovers a novel regulatory axis in Vibrio fischeri that controls the expression of the qrr1 small RNA, which post-transcriptionally controls various quorum-dependent outputs. This study is timely and addresses a major question about the physiology of this important model symbiosis and potentially other Vibrio species. The results should be of broad interest within the field of microbiology.
While it was previously believed that qrr1 expression is under the strict control of the LuxO-dependent quorum sensing cascade, the authors demonstrate that qrr1 expression can be induced by another bEBP, SypG, in a manner that is quorum-independent. It was previously shown that qrr1 is important for colonization, and the authors recapitulate and extend this finding here. However, bacteria are likely at high cell density prior to entry into the crypts, which would repress qrr1 expression. Thus, despite the importance of qrr1 expression for crypt colonization, it would counterintuitively be repressed. The discovery of the SypG quorum-independent induction of qrr1 in this study may help resolve this conundrum. The authors take a largely genetic approach to characterize this novel regulatory pathway in combination with a squid colonization model. The experiments performed are generally well controlled and the data are clearly presented. The authors, however, fail to provide experimental evidence to support the physiological relevance of SypG-dependent control of qrr1 expression during host colonization.
Fig. 2 - It is unclear why there is a disconnect between qrr1 expression and qrr1-dependent effects. Data in 2B, indicate that qrr1 is induced in the ∆binK mutant according to the Pqrr1-gfp reporter but this expressed qrr1 does not have any effect on phenotypes like bioluminescence according to the data presented in 2C. While the authors reveal an effect of the binK deletion when rscS is overexpressed, it is unclear why this is necessary since simple deletion of bink without rscS is sufficient to induce qrr1 in 2B. Could this discrepancy be due to the fact that experiments in 2B are done on solid media while the experiments in 2C are performed in liquid media? Do cells in liquid not express qrr1? Or conversely, perhaps testing the bioluminescence of cells scraped off of plates could reveal a phenotype for the binK mutant similar to those seen in the rscS background in liquid. Or alternatively, if cells in a liquid culture still express qrr1, perhaps there is a posttranscriptional mechanism that prevents qrr1 from exerting an effect on bioluminescence? The latter possibility would alter the proposed model.
To help explain why we chose to overexpress RscS, we have added the cartoon in Fig. 2C, which highlights how BinK dephosphorylates SypG. We believe that the conditions used in the bioluminescence assay do not phosphorylate SypG, which prevents an effect by BinK. However, overexpression of RscS permits phosphorylation of SypG, which enables a phenotype to emerge in a binK mutant. We have tested the bioluminescence of cells within spots but did not detect a difference.
The authors propose a model in which sypG dependent activation of qrr1 is required for appropriate temporal regulation of this small RNA and contributes to optimal fitness of V. fischeri during colonization, however, this was not directly tested, and experimental evidence to support a physiological role for spyG-dependent regulation of qrr1 remains lacking. Data in Fig. S3 and Fig. 4G-H suggest that the Gs at -131 and -97 in Pqrr1 are largely dispensable for LuxO-dependent activation, but are important for SypG-dependent activation of Pqrr1. Also, the Pqrr1 mutations at C -130 and -96 completely prevent sypG-dependent activation while only partially reducing LuxO-dependent activation. If SypG-dependent activation of qrr1 is critical for the fitness of V. fischeri, a strain harboring these Pqrr1 promoter mutations should be attenuated in a manner that resembles the qrr1 deletion mutant as shown in Fig. 3C.
We thank the reviewer for this suggestion, which led us to generate and test a G-131T mutant in vivo.
Fig. S4 - these data suggest that LuxO cannot enhance transcription of PsypA and PsypP at native expression levels. But sypG-dependent induction of qrr1 was largely tested with Ptrc-dependent overexpression of SypG. Would overexpression of LuxO induce PsypA and PsypP? The authors should at least acknowledge this possibility in the text.
As requested, we have added text that acknowledges this possibility.
The authors adopt three distinct strategies to induce sypG-dependent activation of qrr1 in distinct figures throughout the manuscript: deletion of binK, overexpression of rscS (rscS*), and direct overexpression of sypG. It is not entirely clear why distinct approaches are used in different figures. This is particularly true for Fig. 5 since the authors already demonstrated that the direct overexpression of sypG can be used, which is a more direct way of addressing this question. Similarly, sypG overexpression should inhibit bioluminescence in Fig. 2 based on the proposed model, which would have tested the claims made more directly. Additional text to clarify this would be helpful.
As requested, we have added Fig. 2C and text to describe how SypG is regulated, which provides ways to test SypG-dependent activation of qrr1.
The Fig. 5D legend indicates that the strains harbor a Ptrc-GFP reporter. However, the text would suggest that these strains should harbor a Pqrr1-GFP reporter to test the question posed.
This has been corrected.
The conclusion that SypG and LuxO share UASs in the qrr1 promoter is based on fairly limited genetic evidence where point mutations were introduced into 3 bp of the predicted LuxO UASs within the qrr1 promoter. This conclusion needs to be qualified in the text or additional experimental evidence is needed to support this claim. For example, in vivo ChIP-exo could be used to map the SypG and LuxO binding sites. Or SypG and LuxO could be purified to assess binding to the qrr promoter in vitro (to map binding sites or test competitive interactions of these proteins to the qrr promoter).
As described above and in the text, we have not been able to construct a functional tagged SypG that would enable these types of studies.
On a related note, SypG binding to the qrr1 promoter is speculated based on indirect genetic evidence. But the authors do not directly demonstrate this. This should be acknowledged in the text or additional experimental evidence should be provided to support this claim.
As requested, we have added text in the discussion that highlights this problem.
Reviewer #3 (Public Review):
In this manuscript, Surrett and coworkers aimed to identify the mechanism that regulates the transcription of Qrr1 sRNA in the squid symbiont Vibrio fischeri. In many Vibrio species, Qrr1 transcription is regulated by quorum sensing (QS) and activated only at low cell density. Qrr1 is important for V. fischeri to colonize the squid host. In the QS systems that have been studied so far, LuxO is the only known response regulator that activates Qrr sRNA transcription. However, the authors argued that since V. fischeri forms aggregates before entering into the light organ of the squid, Qrr1 would not be made as high cell density QS state is likely induced within the aggregates. Therefore, they hypothesized that additional regulatory systems must exist to allow Qrr1 expression in V. fischeri to initiate colonization of the light organ. In turn, the authors identified that disruption of the function of the sensor kinase BinK allowed Qrr1 expression even at high cell density. Through a series of cell-based reporter assays and an in vivo squid colonization assay, they concluded that BinK is also involved in Qrr1 regulation within the squid light organ. They went on to show that another sigma54-dependent response regulator SypG is also involved in controlling Qrr1 expression. The authors propose dual regulation of LuxO and SypG on Qrr could be a common regulatory mechanism on Qrr expression in a subset of Vibiro species.
Overall, the experiments were carefully performed and the findings that BinK and SypG are involved in Qrr1 regulation are interesting. This paper is of potential interest to an audience in the field of QS and Vibrio-host interaction. However, experimental deficiencies and alternative explanations of the results have been identified in the manuscript that prevents a thorough mechanistic understanding of the interplay between QS and these new regulators.
1) The premise that Qrr1 expression in the light organ has to be regulated by systems other than QS is unclear. In lines 108-109, it was stated that "...prior to entering the light organ, bacterial cells are collected from the environment and form aggregates that are densely packed", however, in lines 184-185, it was stated that "The majority of crypt spaces each contained only one strain type (Fig. 3B), which is consistent with most populations arising from only 1-2 cells that enter the corresponding crypt spaces". So, if the latter case is true (i.e., 1-2 cells/crypt), why Qrr1 could not be made at that time point as predicted by a QS regulation model?
We have not changed this section because if Qrr1 is expressed only after the cells have already entered the crypt space, then the Δqrr1 mutant would colonize a number of crypt spaces comparable to that of wild type cells.
2) The involvement of the rscS allele for the ∆binK mutant to show an altered bioluminescence phenotype is confusing. It is unclear why a WT genetic background was sufficient to show the high Qrr1 phenotype in the original genetic screen that identified BinK (Fig. 2A-B), while the rcsS allele is now required for the rest of the experiments to show the involvement of BinK in bioluminescence regulation (Fig 2C). Is the decreased bioluminescence phenotype observed in rcsS* ∆binK mutant (fig. 2C) dependent on LuxU/LuxO/Qrr1/LitR? Could it be through another indirect mechanism (e.g., SypK as discussed in line 403)? A better explanation of the connection between RcsS/Syp and BinK and perhaps additional mutant characterization are necessary to interpret the observed phenotypes.
As described above, we have added a cartoon that illustrates the pathway involving BinK (Fig. 2C) and additional justification in the results section, which better explains why RscS overexpression was used.
3) In squid colonization competition assays (Fig. 3), it was concluded that the ∆qrr1 allele is epistatic to the ∆binK allele (line 204), and the enhanced colonization of the ∆binK mutant is dependent on Qrr1 (section title, line 162). This conclusion is hard to interpret. The results can be interpreted as ∆qrr1 mutation lowers the colonization efficiency of the ∆binK mutant which could imply BinK regulates Qrr1 in vivo. Alternatively, it could be interpreted that the ∆binK mutation increases the colonization efficiency of the ∆qrr1 mutant. Direct competition between single and double mutants in the same animals may resolve the complexity. And direct comparison of Qrr1 expression of WT and ∆binK mutants inside the animals, if possible, will also help interpret these results.
We thank the reviewer for the suggestion and were able to test the ΔbinK and ΔbinK Δqrr1 mutants directly (Fig. S2). We were unable to interpret the data using the Pqrr1 reporter due to unexpected heterogeneity in Pqrr1 activity throughout the crypt spaces.
4) Similar concern to above (#2), in Fig. 4, the link between BinK and Qrr1 regulation is not fully explored. What connects BinK and Qrr1 expression? Does BinK function via LuxU (or other HPT) to control SypG like the other QS kinases? And what is the role of other known kinases (e.g., SypF) in the signaling pathway? And did the authors test other bEBPs found in V. fischeri for their role in Qrr1 regulation?
We have added to the discussion content that highlights examining LuxU as a direction worthwhile to pursue to understand how BinK affects signaling that activates Qrr1.
5) In addition to the genetic analysis, additional characterization of SypG is required to demonstrate the proposed regulatory mechanism: What is the expression level (and phosphorylation state) of SypG and LuxO at different cell densities? Does purified SypG directly bind to the qrr1 promoter region? c. How do these two bEBPs compete with each other if they are both made and active?
We agree that these are interesting questions, but as described above, we were unable to purify SypG to address the biochemistry.
6) The molecular OR logic gate is used to describe the relationship between LuxO and SypG, but this logic relationship is not always true in all conditions (if at all). In WT, deletion of luxO completely abolished Qrr1 expression (Fig. 4C). Even in the binK mutant, LuxO still seems to be the more prominent regulator (Fig. 4D) as deletion of luxO already caused a smaller but significant drop in Qrr1 expression. The authors may need to use this term more precisely.
We note that in wild-type cells, SypG is not active under the conditions tested, so SypG would not contribute to activating Qrr1 expression. The level of Pqrr1 activity by the SypG(D53E) variant surpasses the basal level of LuxO, which suggests that LuxO does not always serve as the prominent regulator. We have added content to the discussion to highlight how LuxO may contribute more to the regulation.
CCI Impact Report 2020-2021

Note: This rebuttal was posted by the corresponding author to Review Commons. Content has not been altered except for formatting.
Learn more at Review Commons
Reviewer #1 (Evidence, reproducibility and clarity (Required)):
I summarise the major findings of the work below. In my opinion the range and application of approaches has provided a broad evidence base that, in general, supports the authors conclusions. However, there are, in my opinion, particular failures to utilise and communicate this evidence. The manuscript may be much improved with attention in the following areas. In each case I will give general criticism with a few examples, but the principals of my comments could be applied throughout the work.
1) Insufficient quantification. The investigation combines various sources of qualitative data (EM, fluorescence microscopy, western blotting) to generate a reasonably strong evidence base. However, the work is over-reliant on representative images and should include more quantification from repeat experiments. When there are multiple fluorescence micrographs with intensity changes (not necessarily just representative images) (e.g. Figure 1 or 2) the authors should consider making measurements of these. Also the VLP production assays, which are assessed by western blotting would particularly benefit from a quantitative assessment (either by densitometry or, if samples remain, ELISA/similar approach).
We have performed quantification of immunofluoresence, western blotting and VLP experiments from existing data. These quantification are presented in our revised manuscript. An overview of new quantification is shown below:
Data shown
Quantification now shown in
Method
Analysis
Figure 1A
Supp F1C
IF
HAE (-/+ SARS-CoV-2)
Figure 1D
Supp F1E
IF
HeLa+ACE2 (-/+ SARS-CoV-2 )
Figure 2C
Supp F2B
IF
A549+ACE2 (-/+ SARS-CoV-2)
Figure 2G
Supp F2D
IF
T84 (-/+ SARS-CoV-2)
Supp F4A
Supp F4B
IF
HeLa + ss-HA-Spike transients (-/+ HA stained cells) - Tetherin total fluorescence intensity
Figure 4D
Supp F4E
IF
HeLa + TetOne ss-HA-Spike stables (-/+ Dox)
Figure 4F
Supp F4G
W blot
HeLa + TetOne ss-HA-Spike stables (-/+ Dox)
– Tetherin abundance
Figure 4G
Supp F4I
W blot – lysates
Spike VLP experiments
– tetherin abundance
Figure 4G
Supp F4J
W blot - VLPs
Spike VLP experiments
Figure 6A
Supp F7A
W blot – lysates
ORF3a VLP experiments
– tetherin abundance
Figure 6A
Supp F7B
W blot - VLPs
ORF3a VLP experiments
For immunofluoresence anaysis, the mean, standard deviation, number of cells analysed and number of independent experiments are shown in the updated figure legends. Statistical analysis is also detailed in figure legends. Methods for the quantificaiton of fluoresence intensity is included in the Methods section.
Densitometry was performed on western blots and VLP experiments as suggested. The mean, standard devisation and number of independent expreiments analysed are expressed in figure legends. Methods for densityometry quantification is now included.
2) Insufficient explanation. I found some of the images and legends contained insufficient annotation and/or description for a non-expert reader to appreciate the result(s). Particularly if the authors want to draw attention to features in micrographs they should consider using more enlarged/inset images and annotations (e.g. arrows) to point out structures (e.g DMVs etc.). This short coming exacerbates the lack of quantification.
Additional detail has been provided to the figure legends, and we have updated several figures to draw attention to features in micrographs. Black arrowheads have been added to Figures 1E, 2D, 2H to highlight plasma membrane-associated virions, and asterisks to highlight DMVs in Figures 1E, 2D and Supplemental Figures 2C, 2E. Similarly, typical Golgi cisternae are highlighted by white arrowheads micrographs in Figure 2E. These figure legends have also been modified to highlight these additions.
3) Insufficient exploration of the data. I had a sense that some aspects of the data seem unconsidered or ignored, and the discussion lacks depth and reflection. For example the tetherin down-regulation apparent in Figures 1 and 2 is not really explained by the spike/ORF3a antagonism described later on, but this is not explicitly addressed.
We have made changes throughout the manuscript, but the discussion especially has been modified. We now discuss the ORF3a data in more depth, discuss possible mechanisms by which ORF3a alone enhances VLP release, and discuss our ORF7a data in context to previous reports.
The discussion has been updated to now include a better description of our data, and additional writing putting our work in to context with previously published work. See discussion section of revised manuscript.
Also, Figure 6 suggests that ORF3a results in high levels of incorporation of tetherin in to VLPs, but I don't think this is even described(?). The discussion should also include more comparison with previous studies on the relationship between SARS-2 and tetherin.
We have added a section to discuss how ORF3a may enhance VLP release,
‘We found that the expression of ORF3a enhanced VLP independently of its ability to relocalise tetherin (Figure 6A). This may be due to either the ability of ORF3a to induce Golgi fragmentation [38] which facilitates viral trafficking [39], or due to enhanced lysosomal exocytosis [37]. Tetherin was also found in VLPs upon co-expression with ORF3a (Figure 6A) which may also indicate to enhanced release via lysosomal exocytosis [37].
The secretion of lysosomal hydrolases has been reported upon expression of ORF3a [31] and whilst this may in-part be due to enhanced lysosome-plasma membrane fusion, our data highlights that ORF3a impairs the retrograde trafficking of CIMPR (Supplemental Figures 6B, 6F, 6G), which may similarly increase hydrolase secretion.’ – (Line 625-654).
The discussion has been developed to compare the relationship between SARS-CoV-2 and tetherin in previous studies,
‘SARS-CoV-1 ORF7a is reported to inhibit tetherin glycosylation and localise to the plasma membrane in the presence of tetherin [18]. We did not observe any difference in total tetherin levels, tetherin glycosylation, ability to form dimers, or surface tetherin upon expression of either SARS-CoV-1 or SARS-CoV-2 ORF7a (Figures 4A, 4B, 4C).
Others groups have demonstrated a role for ORF7a in sarbecovirus infection and both SARS-CoV-1 and SARS-CoV-2 virus lacking ORF7a show impaired virus replication in the presence of tetherin [18,41]. A direct interaction between SARS-CoV-1 ORF7a and SARS-CoV-2 ORF7a and tetherin have been described [18,41], although the precise mechanism(s) by which ORF7a antagonises tetherin remains enigmatic. We cannot exclude that ORF7a requires other viral proteins to antagonise tetherin, or that ORF7a antagonises tetherin via another mechanism. For example, ORF7a can potently antagonise IFN signalling [42] which would impair tetherin induction in many cell types.’ – (Line 667-704).
I have no minor comments on this draft of the manuscript.
Reviewer #1 (Significance (Required)):
Tetherin, encoded by the BST2 gene, is an antiviral restriction factor that inhibits the release of enveloped viruses by creating tethers between viral and host membranes. It also has a capacity for sensing and signalling viral infection. It is most widely understood in the context of HIV-1, however, there is evidence of restriction in a wide variety of enveloped viruses, many of which have evolved strategies for antagonising tetherin. This knowledge informs on viral interactions with the innate immune system, with implications for basic virology and translational research.
This study investigates tetherin in the context of SARS-CoV-2. The authors use a powerful collection of tools (live virus, gene knock out cells, recombinant viral and host expression systems) and a variety of approaches (microscopy, western blotting, infection assays), which is, itself, a strength. The study provides evidence to support a series of conclusions: I) BST2/tetherin restricts SARS-CoV-2 II) SARS-CoV-2 ablates tetherin expression III) spike protein can modestly down-regulate tetherin IV) ORF3A dysregulates tetherin localisation by altering retrograde trafficking. These conclusions are broadly supported by the data and this study make significant contributions to our understanding of SARS-CoV-2/tetherin interactions.
My enthusiasm is reduced by, in my opinion, a failure of the authors to fully quantify, explain and explore their data. I expect the manuscript could be significantly improved without further experimentation by strengthening these aspects.
This manuscript will be of interest to investigators in virology and/or cellular intrinsic immunity. Given the focus on SARS-CoV-2 it is possible/likely that it will find a slightly broader readership.
I have highly appropriate skills for evaluating this work being experienced in virology, SARS-CoV-2, cell biology and microscopy.
We wish to thank Reviewer #1 for their comments which have helped us to improve the quality of our revised manuscript.
Reviewer #2 (Evidence, reproducibility and clarity (Required)):
BST2/tetherin can restrict the release and transmission of many enveloped viruses, including coronaviruses. In many cases, restricted viruses have developed mechanisms to abrogate tetherin-restriction by expressing proteins that antagonize tetherin; HIV-1 Vpu-mediated antagonism of tetherin restriction is a particularly well studied example. In this paper, Stewart et al. report their studies of the mechanism(s) underlying SARS-CoV-2 antagonism of tetherin restriction. They conclude that Orf3a is the primary virally encoded protein involved and that Orf3a manipulates endo-lysosomal trafficking to decrease tetherin cycling and divert the protein away from putative assembly sites.
Major comments:- In my view some of the claims made by the authors are not fully supported by the data. For example, the bystander effect discussed in line 162 may suggest that infected cells can produce IFN but does not 'indicate' that they do
This text has now been edited,
‘The levels of tetherin in uninfected HAE cells is lower than observed in uninfected neighbours in infected wells demonstrating that infected HAE cells are able to generate IFN to act upon uninfected neighbouring cells, enhancing tetherin expression.’ - (Lines 163-172).
Most of the EM images show part of a cell profile, so statements such as (line 192) 'virus containing tubulovesicular organelles were often polarised towards sites of significant surface-associated virus' should be backed up with appropriate images, or indicated as 'not shown', or removed (the observation is not so important for this story). Line 196, DMVs can't be seen in these micrographs.
The statement 'virus containing tubulovesicular organelles were often polarised towards sites of significant surface-associated virus' has been removed. The micrographs in Figure 1E have been re-cropped, and image iii replaced with an image showing DMVs and budding virions. Plasma membrane-associated virions are highlighted by black arrowheads, DMVs by black asterisks, and intracellular virion by a white arrow.
Line 391, I can't see much change in CD63 distribution.
CD63 reproducibly appears clustered towards the nuclei in ORF3a expressing cells, whilst CD63 positive puncta are abundant in the periphery of mock cells. CD63 puncta are also larger, and the staining of CIMPR and VPS35 also appears to be associated with larger organelles. We have amended the text to now read,
‘Expression of ORF3a also disrupted the distribution of numerous endosome-related markers including CIMPR, VPS35, CD63, which all localised to larger and less peripheral puncta (Supplemental Figure 6B), and the mixing of early and late endosomal markers’ - (Line 469).
Quantification of the diameter of CD63 puncta indicate that they are larger in ORF3a expressing cells than in mock cells. Mock cells - 0.71μm (SD; 0.19), ORF3a - 1.15μm (SD;0.35). At least 75 organelles per sample, from 10 different cells. We have not included this data as we do not wish to labor this point but are happy to include this quantification if required to do so.
Line 321, the authors show that ORF7a does not affect tetherin localization, abundance, glycosylation or dimer formation, but they don't show that it doesn't restrict SARS-CoV-2. Can they be sure that epitope tagging this molecule does not abrogate function (or the functions of any of the other tagged proteins for that matter), or that ORF7a works in conjunction with one of the other viral proteins?
We are careful in the manuscript not to claim that ORF7a has no effect on tetherin. Our data indicate that ‘ORF7a does not directly influence tetherin localisation, abundance, glycosylation or dimer formation’ - (Line 361-362).
We were unable to reproduce an effect of ORF7a on tetherin glycosylation. Our data conflicts with that presented by Taylor et al, 2015, where ORF7a impaired tetherin glycosylation and ORF7a localised to the plasma membrane in tetherin expressing cells. The experiments performed by Taylor et al used HEK293 cells and ectopically expressed tagged tetherin. The differences in results may be attributed to the differences between cell lines or due to differences between endogenous or ectopic / tagged tetherin.
The study by Taylor et al uses SARS-CoV-1 ORF7a-HA from Kopecky-Bromberg et al., 2007 (DOI: 1128/JVI.01782-06), where the -HA tag is positioned at the C-terminus. Our ORF7a-FLAG constructs have a C-terminal epitope tag. While we cannot exclude the possibility that tagged proteins may act differently from untagged ones, the differences between our findings and previous work appear unlikely to be due to epitope tags.
Our manuscript states that although we cannot find any effect of ORF7a on tetherin localisation, abundance, glycosylation, or dimer formation, we cannot exclude that ORF7a impacts tetherin by another mechanism. For example, ORF7a has been found to antagonise interferon responses. Tetherin is abundantly expressed in HeLa cells and expression does not require induction through interferon. None of our experiments above would be impacted by interferon antagonism yet this could impact other cell types besides infection in vivo. These possibilities may explain the reported differential impact of ORF7a by different labs. An addition comment has been added to the discussion to reflect this,
’We cannot exclude that ORF7a requires other viral proteins to antagonise tetherin, or that ORF7a antagonises tetherin via another mechanism. For example, ORF7a potently antagonises IFN signalling [38], which would impair tetherin induction in many cell types. - (Line 701-704).
Note - Reference 38 has been added to the manuscript – Xia et al., Cell Reports DOI: 10.1016/j.celrep.2020.108234
In the ORF screen, a number of the constructs are expressed at low level, is it possible they [the authors] are missing something?
Some of the ORFs expressed in the miniscreen appear poorly expressed. We accept that in the use of epitope tagged constructs expression levels of individual viral proteins may impact upon a successful screen. However, this screen was performed to identify any potential changes in tetherin abundance or localisation, and the screen did successfully identify ORF3a, which we were able to follow-up and verify.
Line 376, the authors refer to ORF3a being a viroporin. A recent eLife paper (doi: 10.7554/eLife.84477; initially published in BioRxiv) refutes this claim and builds on other evidence that ORF3a interacts with the HOPS complex. The authors should at least mention this work, especially in the discussion, as it would seem to provide a molecular mechanism to support their conclusions.
This paper had not been peer reviewed at the time of our initial submission. We have now included the following text,
‘SARS-CoV-2 ORF3a is an accessory protein that localises to and perturbs endosomes and lysosomes [29]. It may do so by acting either as a viroporin [30] or by interacting with, and possibly interfering with the function of VPS 39, a component of the HOPS complex which facilitates tethering of late endosomes or autophagosomes with lysosomes [29,31]. Given ORF3a likely impairs lysosome function, the observed increased….’ - (Lines 444-449).
Fig 3, the growth curves illustrated in Fig3 C and D do not have errors bars; how many times were these experiments repeated?
These experiments require more repeats to include error bars. Infection and plaque assay (Figure 3C, 3D) are currently ongoing and we plan to complete them in the next 6-8 weeks and include them in the finalised manuscript.
In the new experiments, infections will additionally be performed at MOI 0.01, in addition to the previous MOIs (1 and 5).
Line 396, the authors show increased co-localization with LAMP1. As LAMP1 is found in late endosomes as well as lysosomes, they cannot claim the redistributed tetherin is specifically in lysosomes.
We have altered the text to now say:
‘The ORF3a-mediated increase in tetherin abundance within endolysosomes could be due to defective lysosomal degradation.’ - (Line 475).
There seems to be a marked difference in the anti-rb555 signal in the 'mock' cells in panels 5H and Suppl 6E. Is there a good reason for this, or does this indicate variability between experiments?
Antibody uptake experiments in Figure 5H and Supp Figure 6E were performed and acquired on different days. Relatively low levels of signal are available in these antibody uptake experiments, and the disperse labelling seen in the mocks does not aid this.
Fig 6a, why is there negligible VLP release from cells lacking BST2 and ORF3a-strep? How many times were these experiments performed? Is this a representative image? I think it confusing to refer to the same protein by two different names in the same figure (i.e. BST2 and tetherin). Do the authors know how the levels of ORF3a expressed in cells in these experiments compares to those seen in infected cells?
We have changed the blot in Figure 6A for one with clearer FLAG bands. Three independent experiments were performed for Figure 6A. Quantification of VLPs is now included in Supplemental Figure 7B.
We have changed ‘Bst2’ to ‘tetherin’ in all previous figures relating to protein; Figure 4G, Figure 6A, B, C.
We have no current information to compare ORF3a levels in these experiments versus in infected cells. We can investigate quantifying this if necessary.
My final point is, perhaps, the trickiest to answer, but nevertheless needs to be considered. As far as we know, SARS-CoV-2 and at least some other coronaviruses, bud into organelles of the early secretory pathway, often considered to be ERGIC. In the experiments shown here the authors provide evidence that ORF3a can influence tetherin recycling, but the main way of showing this is through its increased association with endocytic organelles. Do the authors have any evidence that Orf3a reduces tetherin levels in the ERGIC or whether the tetherin cycling pathway(s) involve the ERGIC?
This is an interesting point, and as the reviewer concedes, this is tricky to answer. Expression of ORF3a causes the redistribution or remodeling of various organelles (Figures 1E, 2D, 2F, Supp Figures 2C, 2E, 3E, 6B, 6C, 6D). We have been unable to test the direct involvement of ERGIC, despite attempts with a number of commercial antibodies. Given the huge rearrangements of organelles during SARS-CoV-2 infection, it is unclear exactly what will happen to the distribution of ERGIC.
Minor comments: Line 53, delete 'shell' its redundant and confusing when the authors have said coronaviruses have a membrane.
Deleted.
Line 61, delete 'the'
Deleted.
Line 72, delete 'enveloped'; coronaviruses already described as enveloped viruses (line 53)
Deleted.
Lines 93 - 100, lop-sided discussion of the viral life cycle; this paragraph is mostly about entry, which is not relevant to this paper, and does not really deal with the synthesis and assembly side of the cycle.
We have now added the following text,
‘….liberating the viral nucleocapsid to the cytosol of the cell. Upon uncoating, the RNA genome is released into the host cytosol and replication-transcription complexes assemble to drive the replication of the viral genome and the expression of viral proteins. Coronaviruses modify host organelles to generate viral replication factories - so-called DMVs (double-membrane vesicles) that act as hubs for viral RNA synthesis [10]. SARS-CoV-2 viral budding occurs at ER-to-Golgi intermediate compartments (ERGIC) and newly formed viral particles traffic through secretory vesicles to the plasma membrane where they are released to the extracellular space.’ - (Lines 95-104).
Line 103, why are the neighbouring cells 'naive'?
‘naïve’ removed.
Line 112 - 113, delete last phrase; tetherin is described as an IFN stimulated gene in line 111; to be accurate, the beginning of the sentence should be 'Tetherin is expressed from a type 1 Interferon stimulated gene ...'
Amended.
Line 118 - 119, should say 'For tetherin-restricted enveloped viruses' as not all enveloped viruses are restricted by tetherin.
Amended.
Line 131, coronaviruses are not the only family of tetherin-restricted viruses that assemble on intracellular membranes, e.g. bunyaviruses.
This has been modified and now reads,
‘In order for tetherin to tether coronaviruses, tetherin must be incorporated in the virus envelope during budding which occurs in intracellular organelles.’ - (Lines 133-135).
Line 192, there is no EM data in Supplemental Fig 1C.
This has now been removed.
Line 251, 'a synchronous infection event' should be 'synchronous infection' as there will be multiple infection events.
This has been changed.
Page 13 (and elsewhere), unlike Southern, 'Western' should not have a capital letter, except at the start of a sentence.
These have been updated throughout the manuscript (Lines 183, 341, 3549, 356, 392, 509, 763, 1330, 1399).
Lines 330 and 352, can the authors quantitate S protein-induced reduction in cell surface tetherin rather than using the somewhat subjective 'mild'?
These are now changed to,
‘Transient transfection of cells with ss-HA-Spike caused a 32% decrease in tetherin as observed by immunofluorescence (Supplemental Figure 4A, 4B), with…’ – (Line 370).
‘To explore whether the Spike-induced tetherin downregulation altered virus release, we performed experiments with virus like particles (VLPs) in HEK293T …’ – (Line 399).
Line 379, OFR, should be ORF.
Yes, changed.
Line 448, 'Tetherin retains the ability' - did it ever loose it?
This has been rephrased to,
‘Tetherin has the ability to restrict a number of different enveloped viruses that bud at distinct organelles.’ - (Line 547).
Line 451, 'luminal' is confusing in this context.
This has been modified to,
‘Tetherin forms homodimers between opposing membranes (e.g., plasma membrane and viral envelope) that are linked via disulphide bonds.’ - (Line 549).
Line 453, the process of virus envelopment is likely to be more than a 'single step'
This now reads,
‘…virus during viral budding, which occurs in modified ERGIC organelles.’ - (Line 552).
Line 457, in my view the notion that Vpu abrogation of tetherin restriction is just due to redistribution of tetherin to the TGN is somewhat simplistic and disregards a lot of other work.
We have removed mention of mechanisms of tetherin antagonism by other viruses. The key point we wish to make here is that tetherin is lost from the budding compartment. This now reads,
‘Many enveloped viruses antagonise tetherin by altering its localisation and removing it from the respective site of virus budding.’ – (Line 552-553).
Line 472, what is meant by 'resting states'?
This should have been ‘in the absence of stimulation’ and have now been re-written,
‘Tetherin is an IFN-stimulated gene (ISG) [13], and many cell types express low levels of tetherin in the absence of stimulation.’ - (Line 577).
Line 1204, how were 'mock infected cells .......... infected'?
This has now been re-written,
‘Differentiated nasal primary human airway epithelial (HAE) cells were embedded to OCT….’ - (Line 1385).
Reviewer #2 (Significance (Required)):
This study builds on published work supporting the notion that SARS-Cov-2 ORF3a is an antagonist for the restriction factor tetherin. Importantly, it provides insights to the the mechanism of ORF3a mediated tetherin antagonism, specifically to ORF3a inhibits tetherin cycling, diverting the protein to lysosomes and away from compartment(s) where virions assemble. Overall, the authors provide good supporting evidence for these conclusions, however there are issues that the authors need to address.
We wish to thank Reviewer #2 for their insightful comments and suggestions for improving this work.
Reviewer #3 (Evidence, reproducibility and clarity (Required)):
Restriction factors are major barriers against viral infections. A prime example is Tetherin (aka BST2), which is able to physically tether budding virions to the plasma membrane preventing release of the infectious particles. Of note, tetherin has broad anti-viral activity and has been established as a crucial innate immune defense factor against HIV, IAV, SARS-CoV-2 and other important human pathogens. However, successful viruses like SARS-CoV-2 evolved strategies to counteract restriction factors and promote their replication. Important restriction factors, such as tetherin, may often be targeted by multiple viral strategies to ensure complete suppression of their anti-viral activities by the pathogen. Of note, it was previously published that the accessory protein ORF7a of SARS-CoV-2 binds to (Petrosino et al, Chemistry Europe, 2021) and antagonizes it (Martin-Sancho et al, Molecular Cell, 2021). Previous data on SARS-CoV also revealed that ORF7a promotes cleavage of tetherin (Taylor et al, 2015, J Virol). In this manuscript, the authors show that tetherin restricts SARS-CoV-2 by tethering virions to the plasma membrane and propose that tetherin is targeted by two proteins of SARS-CoV-2. Whereas the Spike protein promotes degradation of tetherin, the accessory protein ORF3a redirects tetherin away from newly forming SARS-CoV-2 virions. While the overall findings that both S and ORF3a are additionally targeting tetherin is both novel and intriguing, additional evidence is needed to support this. In addition, the authors show that in their experimental setups ORF7a does not induce cleavage of tetherin. This is in direct contrast to previously published data both on SARS-CoV(-1) and -2 (Taylor et al, 2015, J Virol; Petrosino et al, Chemistry Europe, 2021; Martin-Sancho et al, Molecular Cell, 2021). From my point of view that needs further experimental confirmation. While the authors state that the impact of Spike on tethrin is mild, the experiments should still allow the conclusion whether there is a (mild) effect or not. The mechanism of ORF3a is fortunately more robustly assessed and provides some novel insights. Unfortunately, the whole manuscript suffers from a striking lack of quantifications. In addition, it is not clear whether and how many times experiments were repeated to the same results. Overall, the data in this manuscript seem very speculative and preliminary and thus do not support the authors conclusions.
Major:
Much of the data seems like it was only done once. As I am sure that this is a writing issue, please clearly state how many times the individual assays were repeated, provide the quantification graphs and appropriate statistics. Some experiments may need additional quantification and confirmation by other methods to be convincing.
Quantification is provided throughout the revised manuscript. Figure legends have also been updated to provide information on quantification and statistical analysis.
For example, Figure 1A, C and D: Please quantify the levels of tetherin and use an alternative readout, e.g. Western blotting of infected cells.
Quantification has been performed and included in our revised manuscript in Supplemental Figures 1C, 1E. Tetherin is not shown in Figure 1C.
A table is provided (above) to highlight the additional quantification.
Figure 2A: Please quantify.
We are not sure we understand this point. The western blot shown in Figure 2A demonstrates the ectopic expression of ACE2 in our A549 cell line. A549 cells have been used by many labs to study SARS-CoV-2 infection, but express negligible ACE2.
Fig 3A: Please show and confirm successful tetherin KO in the cell lines that are used not only in microscopy.
A new blot is now shown in Figure 3A, including a blot demonstrating tetherin loss in both KO lines.
Figure 4C: Please quantify
Currently flow cytometry experiments have been performed twice each and this is now detailed in the figure legends. The data shown in each panel is representative and the data has been explored using analogous approaches. For example, Figure 4C is complemented by Figures 4A and 4B, Figures 4E is complemented by 4D and 4F. We do not feel that repeating these flow cytometry analysis will significantly improve the manuscript.
Figure 4D: Please quantify the effects are not obvious from the images provided.
Quantification is now provided in Supplemental Figure 4E.
Figure 4E, F Please provide a quantification of multiple independent repeats, the claimed differences are neither striking nor obvious.
Quantification of 4F is now provided in Supplemental Figure 4G. Tetherin levels were quantified to be reduced by 25% (SD: 8%) by addition of Doxycycline and induction of ss-HA-Spike. Information for quantification is provided in figure legends.
Figure 5A: Please quantify
These experiments have currently been performed twice and this is now described in the figure legends. Data shown is representative. We can perform one more repeat of these experiments to quantify if neccessary, but do not feel it will significantly alter the manuscript.
Figure 3C and D: At timepoint 0 the infection input levels are different. The initial infection levels have to be the same to draw the conclusion that tetherin KO affects virion release and not the initial infection efficiency. Can the authors either normalize or ensure that the initial infection is the same in all conditions and that variations in the initial infection efficiency do not correlated with the impact of tetherin on replication/release ? How often were those experiments repeated? Are the marginal differences in infectious titre significant? Overall the impact of tetherin on SARS-CoV-2 is very underwhelming but that may be due to efficient viral tetherin-counteraction strategies. Why is the phenotype inverted at 72 h?
Equal amounts of virus, as measured by plaque-forming units (PFU), were used for both HeLa cell lines and thus at 0 hpi the variation seen is within the parameters of the assay used. It remains possible that tetherin affects virus entry but this is unlikely and this assay was not designed to investigate that effect.
Growth curve assays are currently being repeated using an MOI of 0.01, 1 and 5. We are removing the 72 hpi sample from future experiments. At this time point, we find that the extensive cell death caused by viral replication (especially at higher MOIs) makes it difficult to accurately separate the released from intracellular fractions and conclusions cannot be accurately drawn from the data.
Additional repeats of these experiments are in progress and will be included in the finalised manuscript.
Figure 4B and C: Can the authors provide an explanation why SARS-CoV ORF7a is not inducing cleavage/removes glycosylation of tetherin. To show that the assays work, an independent positive control needs to be included. The FACS data in C is unfortunately not quantified.
See above comments (Reviewer #2) regarding discussion on ORF7a. Additional text has been included to discuss ORF7a data,
‘SARS-CoV-1 ORF7a is reported to inhibit tetherin glycosylation and localise to the plasma membrane in the presence of tetherin [18]. We did not observe any difference in total tetherin levels, tetherin glycosylation, ability to form dimers, or surface tetherin upon expression of either SARS-CoV-1 or SARS-CoV-2 ORF7a (Figures 4A, 4B, 4C).
Others groups have demonstrated a role for ORF7a in sarbecovirus infection and both SARS-CoV-1 and SARS-CoV-2 virus lacking ORF7a show impaired virus replication in the presence of tetherin [18,41]. A direct interaction between SARS-CoV-1 ORF7a and SARS-CoV-2 ORF7a and tetherin have been described [18,41], although the precise mechanism(s) by which ORF7a antagonises tetherin remains enigmatic. We cannot exclude that ORF7a requires other viral proteins to antagonise tetherin, or that ORF7a antagonises tetherin via another mechanism. For example, ORF7a can potently antagonise IFN signalling [42] which would impair tetherin induction in many cell types.’ – (Line 667-704).
Fig 4G: The rationale and result of this experiment are not clear.
The rationale for Spike VLP experiments is explained at Line 403. Given that Spike caused a reproducible decrease in cellular tetherin, we examined whether this downregulation was sufficient to antagonise tetherin and increase VLP yield.
Fig 6: What is the benefit of doing the VLP assays as opposed to genuine virus experiments? To me it rather seems to be making the data unnecessarily complex. Again, no quantifications or repeats are provided.
VLPs are used to separate the budding and release process from the replication process of RNA viruses. VLPs have been used in a number of SARS-CoV (DOI: 1002/jmv.25518) and HIV-1 (DOI: https://doi.org/10.1186/1742-4690-7-51) studies to analyse the impact of tetherin (and tetherin mutants) on release.
VLP experiment quantification are now included throughout.
Minor: Fig 1D: How do the authors explain the mainly intracellular Spike staining?
We do not understand this point. Spike staining is intracellular, whether expressed alone or in the context of infected cells.
Please add statistical analyses on the data e.g. Fig. 3 C and D
Additional repeats of these experiments are in progress and will be included in the finalised manuscript.
Fig. 4B and F: Why do the annotated sizes of tetherin differ between the blots?
Figures 4B and 4F are run in non-reduced and reduced conditions respectively. In order to best show the dimer deficient C3A-Tetherin, blots are typically run in non-reduced conditions to exemplify dimer formation and to highlight any defects in dimer formation. The rest of the blots in the manuscript are run in denaturing conditions to aid blotting of other proteins. (Lines 957-958) and now (Lines 1356-1357).
Fig. 5A: What is ORF6a? Do the authors mean ORF6?
Yes, this has been changed.
An MOI of 1 is NOT considered a low or relevant MOI. Can the authors either rephrase or repeat experiments with an actual low or relevant MOI i.e. 0.01 ?
We are currently repeating these experiments and are including MOIs of 0.01, 1 and 5.
Why were the cell models switched between Figure 1 and 2 and essentially the same experiments repeated?
HeLa cells express high levels of tetherin at steady state, whilst A549 cells require IFN stimulation. HeLa cells demonstrate that tetherin downregulation occurs via an IFN-independent manner. A549 and T84 cells are more physiologically relevant cell types for SARS-CoV-2 infection. These points are stated in Lines 230 and 261.
The manuscript may benefit a lot from streamlining and removing unessential deviations from the main message (e.g. discussions why multistep/single step growth curves are used/not relevant; why are they shown if the authors conclude that a single step is not relevant?). The discussion is extremely lengthy and does not provide sufficient discussion of the presented data.
The multistep/single step growth curve text will be adapted, but it will be re-written after additional infection experiments.
We have removed from the Discussion a small section discussing ORF7a mutants, given that the emphasis of our manuscript is not on ORF7a.
We have also removed a small section describing the rearrangements of intracellular organelles by SARS-CoV-2 as it does not directly relate to the central message of our manuscript.
According to my opinion, the current manuscript does not provide significant advancement for the field. While the intention was to update and expand our existing knowledge about tetherin restriction by SARS-CoV-2, the experiments do not support this yet. However, the general premise and approach/concept of the manuscript would be appealing to a broader audience. I especially like the notion that multiple proteins of SARS-CoV-2 could synergistically counteract an important innate immune defense factor, tetherin. My expertise is on SARS-CoV-2 and the interplay between the virus and host cell restriction factors.
Reviewer #3 (Significance (Required)):
According to my opinion, the current manuscript does not provide significant advancement for the field. While the intention was to update and expand our existing knowledge about tetherin restriction by SARS-CoV-2, the experiments do not support this yet. However, the general premise and approach/concept of the manuscript would be appealing to a broader audience. I especially like the notion that multiple proteins of SARS-CoV-2 could synergistically counteract an important innate immune defense factor, tetherin. My expertise is on SARS-CoV-2 and the interplay between the virus and host cell restriction factors.
We thank Reviewer#3 for their comments and suggestions for improving this work.
Tag: SIOP Events identity OpenID Connect Identiverse: Where are we with SIOP and DID?
self-issued names

4 This answer is not useful Save this answer. Show activity on this post. You have to escape all characters that can be used in a URI In modern browsers you only need to escape the # character in SVG
SVG
Author Response
Reviewer #2 (Public Review):
The idea of using fluorescently labeled tandem SH2 domains to target tagged RTKs is brilliant and could potentially provide a powerful new way to assess the activation of RTKs in situ and in multiple physiological contexts. Thus, it was disappointing that there was insufficient characterization of the system to be able to interpret the data it generates. Although the paper shows that tagging the EGFR appears to have minimal impact on its biological activity, the readout for receptor kinase activity is % clearance of the fluorescent reporter tag from the cytosol. Such clearance is likely to depend on a variety of different factors, including the ratio of tagged receptors to probe, the number of functional pools in which the probe exists, the exchange rate between these pools, and the affinity of the probes for the tagged receptor. Without determining how each of these factors impacts % clearance, it is difficult to interpret either the dose-response curves or response kinetics.
We appreciate the reviewer’s point that the paper would be improved by a thorough analysis of how membrane translocation depends on our biosensor’s expression levels. We have attempted to address this thoroughly in our response to the Editor’s summary comments above. Briefly, we have now added 3 new supplementary figures (Figures S2-S4) in which we quantify ZtSH2 translocation as a function of expression levels. We find that the ratio of EGFR/ZtSH2 expression predicts the extent of ZtSH2 translocation in both NIH3T3 and HEK293T cells, matching results from our computational model. We have also added a new section to the main text to clearly explain these results (Lines 190-235). We hope that these data clarify the design constraints for two-component biosensors of this type.
For example, the difference in activation kinetics between EGFR and ErbB2 is very interesting, but the almost instantaneous rise (Fig S4B) is very surprising. The kinetics of activation of the EGFR have been extensively studied by mass-spectrometry and are generally limited by ligand binding, which has a characteristic time of several minutes, not seconds (pmid: 26929352; pmid: 1975591). Thus, such a response is suggestive of a freely exchanging ZtSH2 reporter pool that is mostly depleted in seconds with the slow secondary kinetics reflecting a slowly exchanging ZtSH2 reporter pool. Alternately, the cells could be accumulating an intracellular pool of activated receptors over time. That the authors are using concentrations of EGF >100-fold physiological levels (pmid: 29268862) further complicates the interpretation of these experiments.
We thank the reviewer for bringing these papers to our attention. However, we strongly disagree with their interpretation of the results. In a paper cited by the reviewer (PMID:26929352), phosphotyrosine responses are extremely fast, with phosphorylation occurring within tens of seconds even in response to 20 nM EGF (see Figure 2 from Reddy et al PNAS 2016). Reddy et al further claim in their abstract “Significant changes were observed on proteins far downstream in the network as early as 10 s after stimulation.” While the timescale of EGFR phosphorylation may be of some debate, the response timescale we observe is consistent with previously published observations.
It is also important to point out that the secondary gradual rise of ZtSH2 recruitment is only observed upon treatment with EGF, not EREG or EPGN (Figure 3A). The gradual rise can also be observed upon treatment with EREG in the presence of a GBM-associated EGFR mutation that alters receptor dimerization (Figure 3E). These data indicate that the secondary rise is not an intrinsic feature of the ZtSH2 reporter, and instead represents a feature of ligand-receptor activation itself.
The reviewer suggests that perhaps there is some internal pool of ZtSH2 or EGF, but we find no evidence for such a pool in our microscopy imaging. To clarify this point to the reader, we have now added a new supplementary figure (Figure S6) showing representative cells for all stimulation conditions used in Figure 3A, showing consistent, high levels of EGFR and ZtSH2 enrichment at the plasma membrane and uniform cytosolic intensity for at least 30 min after stimulation across all ligands.
Finally, while the reviewer mentions the use of high EGF doses in our paper, we would like to point out that we performed extensive experiments at other doses in the manuscript, testing 14 total doses of three EGFR ligands in Figure 3, and present additional data at 20 ng/mL EGF throughout Figures 2, S2, and S7. It is also very important to test high input doses for our negative controls to ensure that the ZtSH2 biosensor retains specificity for ITAM sequences and fails to show recruitment to untagged EGFR even under saturating conditions. It is also quite customary in the field: for example, the Erk KTR paper that the reviewer mentions in a later comment (Regot et al, Cell 2014) exclusively tests their biosensors using saturating doses of 50 ng/mL anisomycin, 100 ng/mL FGF, and 10 μM forskolin to characterize p38, Erk and PKA biosensor responses.
There is also insufficient attention paid to either controlling or measuring important parameters, such as expression levels of tagged receptors or levels of endogenous receptors. 3T3 cells, contrary to the statement of the authors, do not have "negligible" numbers of EGFR: they have ~40K, which is typical for mouse fibroblasts. This is much higher than MCF7 cells, which are frequently used as a model system to study EGFR responses. Yet they do not see transactivation of their ErbB2 construct in 3T3 cells without expressing additional EGFR (Fig. 4C), suggesting low sensitivity of the assay. Conversely, they show a significant response mediated by endogenously tagged EGFR in HEK 293 cells, which are frequently used as an EGFR-negative cell line (PMID: 26368334). This indicates that their assay is extremely sensitive. Which is it? As mentioned above, it likely depends on the expression level and affinity of the different components of their system.
After extensive searching we have not found any publications with an estimate as high as 40K EGFR receptors/cell in NIH3T3 cells. Livneh et al 1986 report that NIH3T3 cells express as little as 500 EGFR receptors per cell and do not respond mitogenically to EGF, and subsequent Schlessinger lab papers use NIH3T3 cells as an EGFR-null background for introduction of receptor variants. Eierhoff et al PLOS Pathogens 2010 use NIH3T3s as an EGFR-null control, showing immunoblot data of undetectable pEGFR responses. The paper we found with the highest stated EGFR expression per cell in NIH3T3 cells is Verbeek et al, FEBS Lett 1998, which reports a value of 3,000 receptors per cell, but does so without any literature citation or measurement. These references are consistent with our experience: over nearly a decade of MAPK signaling experiments in the lab, we have only seen weak or undetectable EGF-stimulated responses in unmodified NIH3T3s, depending on the assay. We are quite confident that more potent responses are elicited in HEK293T cells, where we observe EGFR expression by fluorescence imaging of CRISPR-tagged cells, immunofluorescence staining, and immunoblotting, and where we observe robust signaling responses using biosensors. We also now cite some of these references to support our claim (Line 144).
The reviewer makes an excellent point in the last sentence of their comment: indeed, it is essential to match the expression level of our SH2-based biosensor to the expression level of EGFR in any system in order to observe potent membrane translocation! This was imperative for visualizing any translocation in our CRISPR-tagged HEK293Ts: we had to switch to an exceptionally bright fluorophore and select cells with very low ZtSH2 expression to observe translocation. The ZtSH2/EGFR ratio is a crucial design parameter, which we now present extensive data and modeling to support (Figure S2-S4; Lines 190-235). Our data suggests that quite sensitive biosensor responses are possible with appropriate balance between ZtSH2 and EGFR expression levels (Figure 6) and, in general, biosensor responses can be matched to a dynamic range of interest by scaling ZtSH2 expression with EGFR levels.
A great advantage of using the EGFR system as a test case for the new system is that thousands of investigations have been performed over the last four decades. This provides a strong foundation for determining whether the new technology is working correctly. For example, the dynamics of EGFR activation and trafficking at the single cell level have been documented in many studies, which show a remarkable consistency (e.g. see pmid: 24259669; pmid: 11408594; pmid: 25650738). Unfortunately, instead of using differences between the new results and previously reported data as a basis for refining their technique, the authors attempt to apply their raw data to address complex questions of EGFR dynamics, with less than satisfactory results.
For example, they attempt to use their technique to understand the basis of different signaling dynamics between EGFR ligands. Rather than being a relatively recent observation, differences in EGFR ligand signaling have been explored for over 30 years (pmcid: PMC361851), and are generally ascribed to differences in trafficking (pmid: 7876195). Based on these observations and resulting mathematical models, novel EGFR ligands have been designed with enhanced potency (pmid: 8195228 , pmid: 9634854 ). All this work was done over 20 years ago. Since then, new natural ligands for the EGFR have been discovered from sequence analysis and differences in their potency have similarly been ascribed to differences in their intracellular trafficking patterns (pmid: 19531065 - cited by the authors). An alternate hypothesis was proposed more recently by Freed et al (2017) as described by the authors, but that is what it is: an alternative hypothesis.
We thank the reviewer for pointing out many excellent, classic studies on EGFR endocytosis and trafficking. We agree that this is a well-established field and that EGFR is certainly internalized, recycled, and degraded in a manner that depends on ligand affinity on the cell surface and in endosomes. These seminal studies lead the reviewer to propose an alternative hypothesis to explain our kinetic data in Figure 3: that differences in trafficking and maintenance of EGFR levels at the plasma membrane are the source of the altered kinetics between high- and low-affinity ligands. To address this question, we have now included new supplementary data examining endocytosis and trafficking in multiple contexts.
First, we examine membrane EGFR levels in 3T3 cells overexpressing our EGFR-pYtag system (or ITAM-less EGFR as a control) after EGF stimulation (Figure S5A-C). We find that EGFR membrane intensity is virtually unchanged after 60 min of saturating EGF stimulation, a response that does not depend on whether ITAMs are appended to the receptor. We also now include still images of cells at every concentration examined in our dose-response experiments for all 3 ligands (Figure S6), which do not show clear differences in the subcellular distribution of EGFR before and after stimulation as a function of ligand identity. We also remind the reviewer that our interpretation is not simply an untested hypothesis – we experimentally tested a GBM-associated EGFR variant whose effect on receptor dimerization has been quantified, and observe EGF-like response kinetics even after EREG stimulation, a result predicted by our model (Figure 3D-E).
We believe that the sustained membrane-localized signaling we observe might be ascribed to two factors: our choice of cell line and its expression level of EGFR. This conjecture is supported by some data: in contrast to our EGFR-overexpressing NIH3T3 cells, HEK293Ts harboring endogenous or low EGFR levels exhibit a dramatic redistribution of EGFR after EGF stimulation (Figure S3, Figure 6). This is clearly a context where transient versus sustained signaling might depend on the choice of ligand and its consequences on internalization.
We also note that our data identify ligand-specific signaling differences that are distinct from prior studies, which focused on transient vs sustained signaling downstream of different EGFR ligands. In contrast, we identify a biphasic increase in EGFR activity after stimulation with EGF versus a rapid approach to steady state after stimulation with EREG or EPGN, despite the continued presence of high levels of membrane-localized EGFR in each case.
Unfortunately, the model that the authors use to test this hypothesis does not even include endocytosis or receptor trafficking but instead uses variable "scaling" factors to see if the data can fit the dimerization hypothesis. In the supplement, they state that "Since our simulations were run on relatively short time scales (~30 min post-stimulation), we did not consider trafficking and degradation of receptors." However, the half-life of EGFR internalization is generally ~3-4min (pmid: 1975591) and degradation ~1hr, so most of the signal shown in Figure 3 is likely to come from internalized rather than surface-associated ligand-EGFR complexes. A further complication is that internalization rates are strongly influenced by receptor expression levels (pmid: 3262110), which are not controlled for here. Thus, the omission of trafficking in their model is not appropriate. This does not mean that the authors are wrong, it simply means that without validation or calibration, their new technology is not ready to resolve current problems in the field.
We thank the reviewer for pointing out ways to improve our modeling (endocytosis) and discussion of its parameterization (scaling factors). We address both points below:
Scaling factors: We thank the reviewer for their comments & agree that our discussion of model parameterization was lacking. To clarify: our base-case model for EGF includes 9 parameters, 6 of which are obtained from literature and 3 which reflect lumped kinetic processes of EGFR dimerization and activation and which we set to match our data. We then used experimentally-determined values to change the base-case model to simulate low-affinity ligand stimulation: a fold-change in ligand affinity and a fold-change in receptor dimerization. This is why we simulate EREG with β=50 and γ=100, reflecting the 10-to-100-fold differences in binding affinity and receptor dimerization that have been experimentally measured for this low-affinity ligand. Similar experimentally defined values constrain β and γ in the case of GBM-associated mutations. A more thorough explanation of our model and these scaling parameters is now included in Lines 334-362.
Endocytosis: We wholeheartedly agree that our model is quite simplified, and a thorough treatment of endocytosis and trafficking would be essential for capturing nuances associated with these steps of the cascade. However, while we appreciate the 3-4 min rule of thumb for EGFR internalization that the reviewer mentions, it is simply not reflective of the membrane-associated EGFR levels we observe in our cells. Examples can be observed in Figure 1C, Figure 2A, Figure 5F, Figure S1B, Figure S2A-B, Figure S5A, and Figure S6, as well as in the quantification of membrane associated EGFR at 0 and 60 min in Figure S5B. It is quite likely that endocytosis and trafficking are operating throughout this time course, but are balanced to maintain similarly high level of EGFR at the cell surface. We wholeheartedly agree with the reviewer’s helpful note that EGFR expression levels heavily influence internalization, which our data also support, and may explain our results. For example, we also see rapid EGFR membrane clearance in HEK293T CRISPR cells (Figure 6) and in HEK293Ts that express low levels of EGFR but not high levels of EGFR (Figure S3A).
In sum, we argue that our inclusion of additional data showing sustained EGFR protein levels and ZtSH2 recruitment at the plasma membrane should help justify our assumption of membrane-associated signaling in our model. However, we happily concede that this is a highly simplified model, and that endocytosis is a very important process that should be accounted for in future studies (e.g., Line 344-346: “However, we expect that internalization and trafficking can play a crucial role in EGFR dynamics in many contexts, which would need to be included in future models to adequately assess those scenarios”).
Reviewer #2 (Public Review):
The idea of using fluorescently labeled tandem SH2 domains to target tagged RTKs is brilliant and could potentially provide a powerful new way to assess the activation of RTKs in situ and in multiple physiological contexts. Thus, it was disappointing that there was insufficient characterization of the system to be able to interpret the data it generates. Although the paper shows that tagging the EGFR appears to have minimal impact on its biological activity, the readout for receptor kinase activity is % clearance of the fluorescent reporter tag from the cytosol. Such clearance is likely to depend on a variety of different factors, including the ratio of tagged receptors to probe, the number of functional pools in which the probe exists, the exchange rate between these pools, and the affinity of the probes for the tagged receptor. Without determining how each of these factors impacts % clearance, it is difficult to interpret either the dose-response curves or response kinetics.
For example, the difference in activation kinetics between EGFR and ErbB2 is very interesting, but the almost instantaneous rise (Fig S4B) is very surprising. The kinetics of activation of the EGFR have been extensively studied by mass-spectrometry and are generally limited by ligand binding, which has a characteristic time of several minutes, not seconds (pmid: 26929352; pmid: 1975591). Thus, such a response is suggestive of a freely exchanging ZtSH2 reporter pool that is mostly depleted in seconds with the slow secondary kinetics reflecting a slowly exchanging ZtSH2 reporter pool. Alternately, the cells could be accumulating an intracellular pool of activated receptors over time. That the authors are using concentrations of EGF >100-fold physiological levels (pmid: 29268862) further complicates the interpretation of these experiments.
There is also insufficient attention paid to either controlling or measuring important parameters, such as expression levels of tagged receptors or levels of endogenous receptors. 3T3 cells, contrary to the statement of the authors, do not have "negligible" numbers of EGFR: they have ~40K, which is typical for mouse fibroblasts. This is much higher than MCF7 cells, which are frequently used as a model system to study EGFR responses. Yet they do not see transactivation of their ErbB2 construct in 3T3 cells without expressing additional EGFR (Fig. 4C), suggesting low sensitivity of the assay. Conversely, they show a significant response mediated by endogenously tagged EGFR in HEK 293 cells, which are frequently used as an EGFR-negative cell line (PMID: 26368334). This indicates that their assay is extremely sensitive. Which is it? As mentioned above, it likely depends on the expression level and affinity of the different components of their system.
A great advantage of using the EGFR system as a test case for the new system is that thousands of investigations have been performed over the last four decades. This provides a strong foundation for determining whether the new technology is working correctly. For example, the dynamics of EGFR activation and trafficking at the single cell level have been documented in many studies, which show a remarkable consistency (e.g. see pmid: 24259669; pmid: 11408594; pmid: 25650738). Unfortunately, instead of using differences between the new results and previously reported data as a basis for refining their technique, the authors attempt to apply their raw data to address complex questions of EGFR dynamics, with less than satisfactory results.
For example, they attempt to use their technique to understand the basis of different signaling dynamics between EGFR ligands. Rather than being a relatively recent observation, differences in EGFR ligand signaling have been explored for over 30 years (pmcid: PMC361851), and are generally ascribed to differences in trafficking (pmid: 7876195). Based on these observations and resulting mathematical models, novel EGFR ligands have been designed with enhanced potency (pmid: 8195228 , pmid: 9634854 ). All this work was done over 20 years ago. Since then, new natural ligands for the EGFR have been discovered from sequence analysis and differences in their potency have similarly been ascribed to differences in their intracellular trafficking patterns (pmid: 19531065 - cited by the authors). An alternate hypothesis was proposed more recently by Freed et al (2017) as described by the authors, but that is what it is: an alternative hypothesis.
Unfortunately, the model that the authors use to test this hypothesis does not even include endocytosis or receptor trafficking but instead uses variable "scaling" factors to see if the data can fit the dimerization hypothesis. In the supplement, they state that "Since our simulations were run on relatively short time scales (~30 min post-stimulation), we did not consider trafficking and degradation of receptors." However, the half-life of EGFR internalization is generally ~3-4min (pmid: 1975591) and degradation ~1hr, so most of the signal shown in Figure 3 is likely to come from internalized rather than surface-associated ligand-EGFR complexes. A further complication is that internalization rates are strongly influenced by receptor expression levels (pmid: 3262110), which are not controlled for here. Thus, the omission of trafficking in their model is not appropriate. This does not mean that the authors are wrong, it simply means that without validation or calibration, their new technology is not ready to resolve current problems in the field.
Simon Winchester describes the pigeonhole and slip system that professor James Murray used to create the Oxford English Dictionary. The editors essentially put out a call to readers to note down interesting every day words they found in their reading along with examples sentences and references. They then collected these words alphabetically into pigeonholes and from here were able to collectively compile their magisterial dictionary.
Interesting method of finding example sentences in words.
UML Profile Metaclass
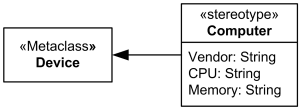
First, dictionaries are not arbiters of highly literate writing; they merely document usage. For example, irregardless has an entry in many dictionaries, even though any self-respecting writer will avoid using it—except, perhaps, in dialogue to signal that a speaker uses nonstandard language, because that is exactly how some dictionaries characterize the word. Yes, it has a place in dictionaries; regardless of that fact, its superfluous prefix renders it an improper term.
what to call these words? illiterate words?
1930s Wilson Memindex Co Index Card Organizer Pre Rolodex Ad Price List Brochure
archived page: https://web.archive.org/web/20230310010450/https://www.ebay.com/itm/165910049390
Includes price lists

List of cards includes: - Dated tab cards for a year from any desired. - Blank tab cards for jottings arranged by subject. - These were sold in 1/2 or 1/3 cut formats - Pocket Alphabets for jottings arranged by letter. - Cash Account Cards [without tabs]. - Extra Record Cards for permanent memoranda. - Monthly Guides for quick reference to future dates. - Blank Guides for filing records by subject.. - Alphabet Guides for filing alphabetically.
Memindex sales brochures recommended the 3 x 5" cards (which had apparently been standardized by 1930 compared to the 5 1/2" width from earlier versions around 1906) because they could be used with other 3 x 5" index card systems.
In the 1930s Wilson Memindex Company sold more of their vest pocket sized 2 1/4 x 4 1/2" systems than 3 x 5" systems.
Some of the difference between the vest sized and regular sized systems choice was based on the size of the particular user's handwriting. It was recommended that those with larger handwriting use the larger cards.
By the 1930's at least the Memindex tag line "An Automatic Memory" was being used, which also gave an indication of the ubiquity of automatization of industrialized life.
The Memindex has proved its success in more than one hundred kinds of business. Highly recommended by men in executive positions, merchants, manufacturers, managers, .... etc.
Notice the gendering of users specifically as men here.
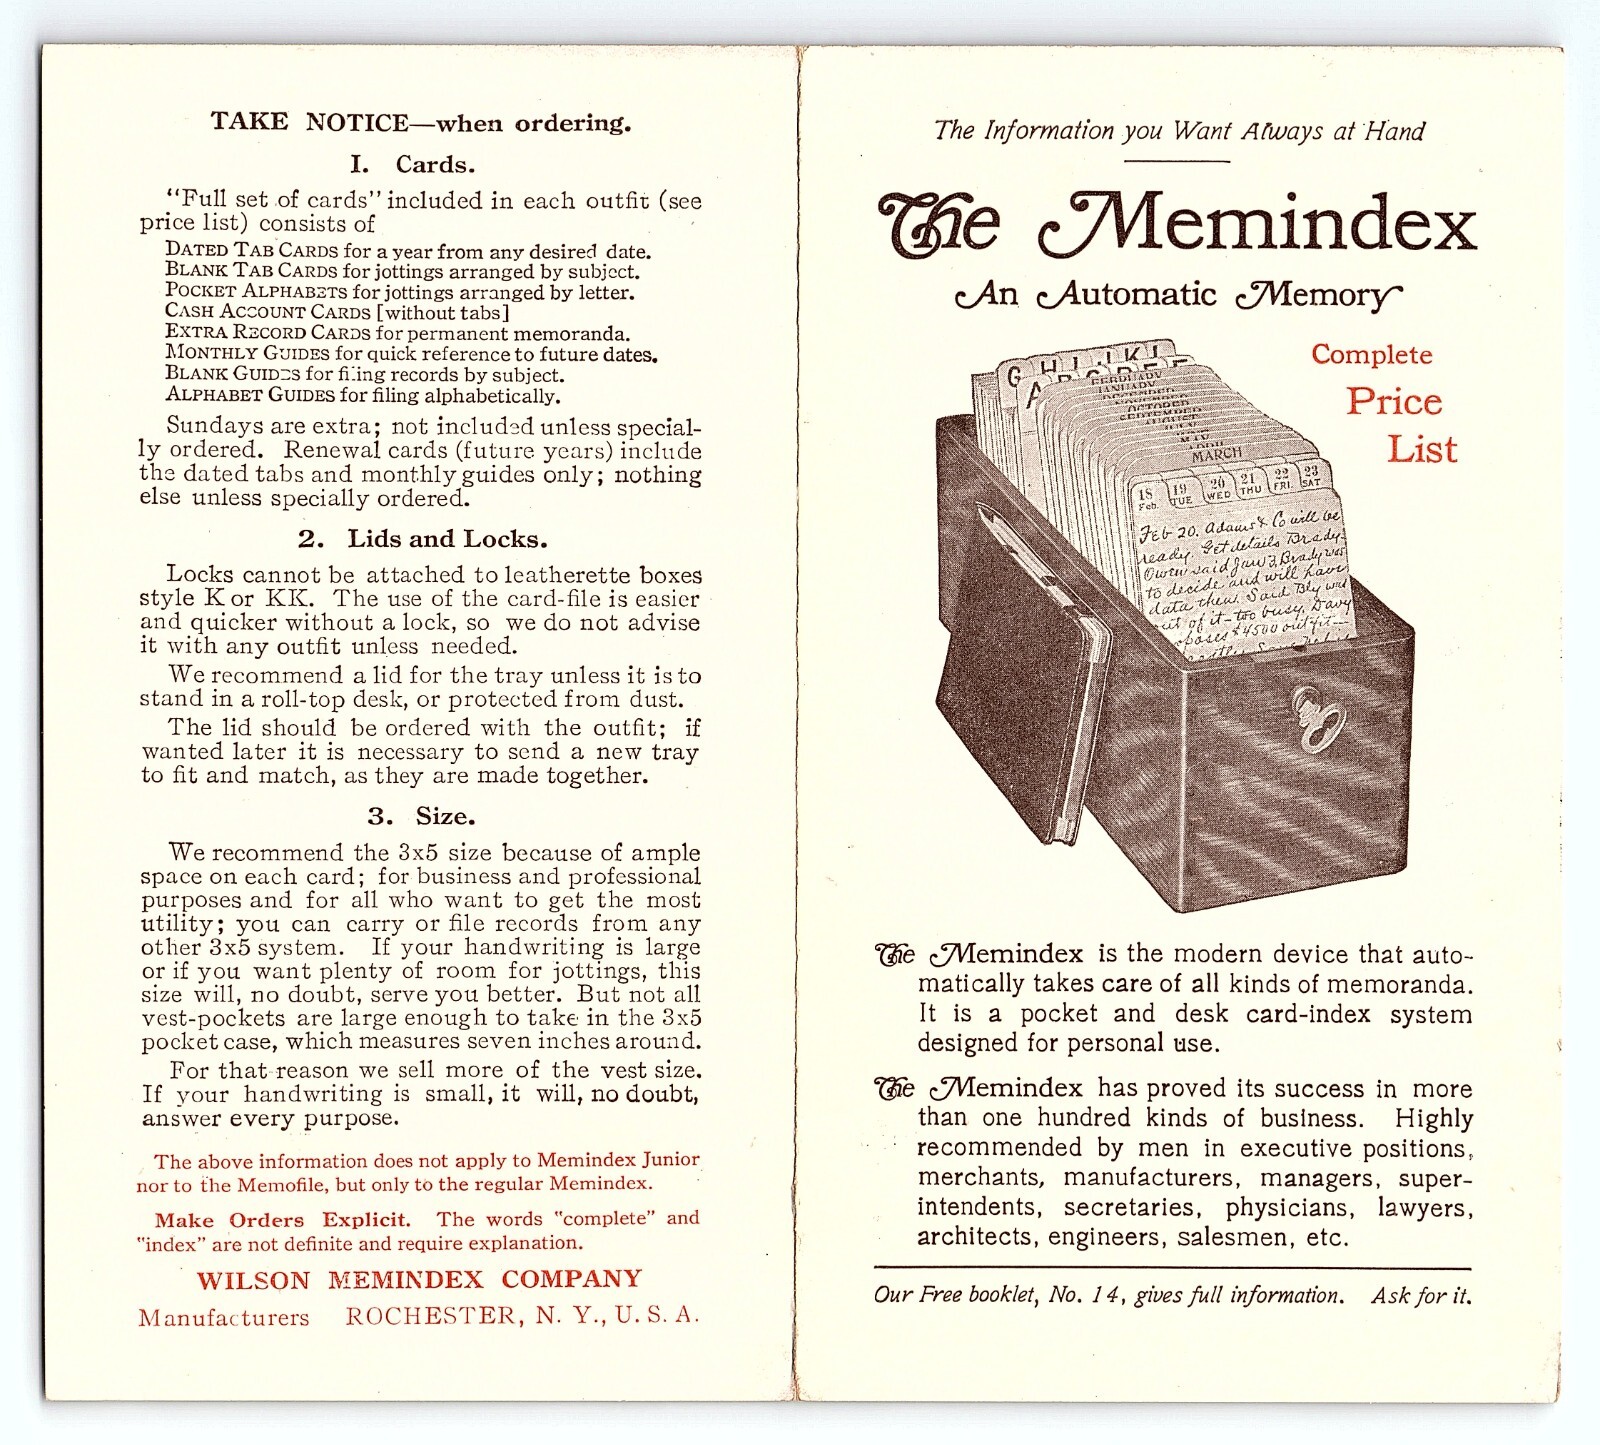

Features: - Sunday cards were sold separately and by my reading were full length tabs rather than 1/6 tabs like the other six days of the week - Lids were custom fit to the bases and needed to be ordered together - The Memindex Jr. held 400 cards versus the larger 9 inch standard trays which had space for 800 cards and block (presumably a block to hold them up or at an angle when partially empty).
The Memindex Jr., according to a price sheet in the 1930s, was used "extensively as an advertising gift".
The Memindex system had cards available in bundles of 100 that were labeled with the heading "Things to Keep in Sight".
Ultra-high frequencies typically offer better range
better range for bad actors to try to steal the data from my tag?
Does the EDL/EID card transmit my personal information? No. The RFID tag embedded in your card doesn't contain any personal identifying information, just a unique reference number.
Can this unique reference number be used to identify me (assuming they've already identified me another way and associated this number with me)? Yes!!
So this answer is a bit incomplete/misleading...
ABABA
ABAB is a rhyme scheme, that the first and third line end with rhyming words (A) and the second and fourth lines end with different rhyming words (B). The rhyme scheme is determined by the last word of each line. Lines that end with a rhyme are labeled with the same letter.
Example:
I have a cat. (A)
I have a mouse. (B)
I have a hat. (A)
I have a house. (B)
Reviewer #2 (Public Review):
This is a follow-up study by the senior author, who previously showed in a 2021 JBC paper that levels of Paternally Expressed Gene 10 (PEG10) protein, among many other protein changes, are increased in the spinal cord of Ubqln2 knockout (KO) animals (JBC 2021). In this report, they provide more direct evidence that PEG10 levels are regulated by ubqln2 and that PEG10 can be proteolytically cleaved generating fragments, which when overexpressed, induce alterations in gene expression. Through proteomic analysis of spinal cord tissue from control and ALS patients, they found that PEG10 levels and the signature of genes regulated by its products are increased in ALS, proposing that elevation in PEG10 is a novel marker and driver of ALS.
PEG10 resembles a retrotransposon, encoding virus-like gag-pol products. It is only found in eutherian mammals. Although it has lost its ability to transpose, it still retains the retroviral-like translation frameshifting property generating two main products, gag (reading frame 1, RF1) and gag-pol (RF1/2). PEG10 is essential for survival. It plays an important role in RNA-binding and trophoblast stem cell specification, being required for placental development. It is also expressed in several adult tissues, but its function in them is obscure. A recent study showed PEG10 RF1 and RF1/2 bind the deubiquiting enzyme USP9X, and that loss of USP9X destabilizes RF1 but not RF1/2, suggesting USP9X regulates ubiquitination and proteasomal degradation of PEG10 (Abed et al. PLOS One 2021). Additionally, Abed et al. showed PEG10 products support virus-like particle (VLP) assembly and that both RF1 and RF1/2 localize to the cytoplasm, whereas a portion of RF1/2 is found in the nucleus of some cells. They further showed PEG10 binds and regulates RNA expression, most probably through interaction with the 3'-ends of the RNAs but found no common binding motif suggesting interaction could be with the secondary structure.
As mentioned, the senior author previously reported in a JBC article in 2021 that PEG10 levels are elevated in ubqln2 knock out (KO) mice, but that its levels were slightly decreased in the P497S mouse model of ALS. They validated PEG10 as an interactor of ubqln2 by proximity-dependent biotin labeling. A review of the current manuscript follows.
1. Evidence that ubqln2 regulates PEG10 accumulation (Fig 1). The authors use human embryonic stem cells to investigate how knockout (KO) of different ubqln isoforms (1, 2, and 4) affects PEG10 accumulation, showing that only KO of ubqln2 increases the RF1/2 product.
a) There is considerable variation in PEG10 expression in the duplicate sample sets provided, but this is not reflected by the error bars (fig 1 A and B). For example, RF1/2 is quite different in the two ubqln4 KO lysates, yet the error bars do not capture the variation. Better loading and quantification is needed. Also, in the KO cells, gag levels are slightly increased, which is consistent with alterations in proteasomal degradation. Alternatively, the changes in RF1/2 could also result from changes in read-through translation, but this is not investigated. Also, it would be helpful to include blots showing the lower Mol weight PEG10 products, to see how they change relative to Fig 3.
Fig 1G. The authors examined if removal of the poly proline rich region (PPR) from PEG10 affects RF1/2 regulation by ubqln, confirming its requirement.
b) The mechanism why deletion of the PPR abolished RF1/2 regulation by ubqlns was not examined. Is it from accelerated degradation? Also, it is not clear why the authors use the triple ubqln KO cells and did not perform that tests in the different ubqln KO cells. The latter comment applies for several of their investigations, leading to uncertainty regarding the specificity of ubqln2 in PEG10 regulation. It is possible that removal of most ubqlns stalls protein degradation affecting PEG10 turnover?
2. The authors investigated the phylogenetic relationship between PEG10 and ubqln2 demonstrating that PEG10 levels from marsupials that lack a PPR can be increased by appending a PPR from human PEG10. They used triple ubqln KO cells for these investigations.
a) The change they describe is not obvious in Fig2C and E as they appear quite small. They also conclude that ubqln2 regulates PEG10 by these studies, but really the experiments show it is from loss of all ubqlns, not ubqln2 specifically.
3. The authors show PEG10 is capable of self-cleavage of the RF1 product, generating 2 detectable N-terminal products, and several other fragments, including a C-terminal nuclear capsid (NC) fragment (Fig3). They show expression of HA-tagged NC fragment localizes to mainly the nucleus, whereas several other PEG10 products and fragments localize to the cytoplasm. They provide strong support that PEG10 is capable of self-cleavage by mutation of an aspartate residue (D) in a DSG motif in the protein to alanine (A to → ASG), which abolished cleavage. They also conducted a nice experiment showing the ASG mutant can be cleaved in trans by introduction of WT PEG10.<br /> a) The authors never show evidence for liberation and accumulation of the NC fragment, only for an artificially tagged protein by immunofluorescence. Use of a tag to study its localization and affects is problematic as the could influence its properties. They need to show that the fragment is detectable because of their central claim that it is responsible for inducing changes in genes. Biochemical fractionation studies could also reveal the extent of the partitioning of the fragment in the nucleus and cytoplasm. The mechanism by which the NC fragment induces changes in gene expression is not clear.
4. The authors show differences in gene expression upon transfection of HEK293 cells with PEG10 RF1, RF1/2, and NC expression constructs. They show that two PEG10-regulated genes, DCLK1 and TXNIP, are both increased in the spinal cord in sporadic ALS cases compared to controls.<br /> a) It is not clear from the studies whether the changes found in ALS are related to changes in PEG10 specifically, or for other reasons. Additionally, more rigorous comparison in many more ALS and controls is needed. PEG10 levels increase upon cell differentiation (Abed et al.) so the changes in ALS may reflect a compensatory and protective response.
5. To investigate if PEG10 RF1/1 levels are altered by ALS mutations in ubqln2 they transfected ubqln TKO cells with either wt ubqln2, or with mutants carrying either the P497H or P506T ALS mutations. They show PEG10 RF1/2 levels are reduced by overexpression of both the wt and P497H mutant, but not by the P506T mutant. They claim that P497H expression did not affect RF1/2 levels. The authors conducted a proteomic comparison of extracts from the spinal cord of two controls, one P497H ubqln2 case, and six sporadic ALS cases. They found increased levels of RF1/2 in the ALS cases. They also found neurofilament medium and neurogranin were both reduced in the ALS cases. Based on these changes they speculate that PEG10 is a novel marker for ALS.<br /> a) The conclusion that the P497S mutant did not affect RF1/2 is incorrect. It reduced RF1/2 slightly more than wt ubqln2. In fact, it appears that expression of all three (wt and the 2 ALS mutants) ubqln2 proteins reduce RF1/2 significantly, compared to the TKO cells.<br /> b) The changes in PEG10 found in the ALS cases are difficult to evaluate because too few controls and ALS cases were used for the comparison. Huge variations in the levels of PEG10 and of the other proteins graphed In Fug 6B-F were seen in the two controls. The comparison needs to be done with many more samples for sound statistical comparison. Were the samples compared from the same region of the spinal cord?
General comments
1. In the Discussion the authors write that because ubqln2 is the only ubqln capable of regulating PEG10 RF1/2 levels, the PXX domain that is only present in ubqln2 is likely responsible for the regulation. There is no proof in support of this hypothesis. Only one ALS-causing mutation (P506T) in the PXX domain, but not the P497H mutation in the same PXX domain, affected RF1/2 accumulation, inconsistent with general involvement of the PXX domain in PEG10 regulation.
2. The authors claim that ubqln2 may have specifically evolved to restrain PEG10 expression, but don't mention USP9X as being another regulator. The common theme that emerges from these studies is that PEG10 levels are regulated by any mechanism that interferes with ubiquitination/proteasomal degradation. Indeed, immunoblots of the gag-pol (RF1/2) in the different ubqln KO cells show a smear at high molecular weight consistent with the accumulation of ubiquitinated PEG10. The authors imply that the transcriptional changes caused by the alteration in PEG10 levels by ubqln2 are responsible for ALS (title of the paper), but this is merely speculation as the effects of the changes are not known. The changes found could be protective. They also claim PEG10 may serve as a novel biomarker for ALS, but such a claim is not justified from the limited analysis conducted so far, which will require more extensive proof.
This web site is maintained by Tim Kindberg and Sandro Hawke as a place for authoritative information about the "tag" URI scheme. It is expected to stay small and simple.
Emphasis: last sentence
The date and time (YYYYMMDD hhmm) form a unique identifier for the note. As I get it using this unique identifier is a way to make the notes "anonymous" so that "surprise" connections between them can be found that we wouldn't otherwise have noticed. In other words, it removes us from getting in our own way and forcing the notes to connect in a certain way by how we name them. A great introduction to the system can be found at zettelkasten.de. The page is written in English. The origional numbering system is discussed in the article. The modern computerized system uses the date and time as the unique identifier. I hope this helps.
reply to u/OldSkoolVFX at https://www.reddit.com/r/ObsidianMD/comments/11jiein/comment/jb6np3f/?utm_source=reddit&utm_medium=web2x&context=3
I've studied (and used) Luhmann and other related systems more closely than most, so I'm aware of zettelkasten.de and the variety of numbering systems available including how Luhmann's likely grew out of governmental conscription numbers in 1770s Vienna. As a result your answer comes close to a generic answer, but not to the level of specificity I was hoping for. (Others who use a timestamp should feel free to chime in here as well.)
How specifically does the anonymity of the notes identified this way create surprise for you? Can you give me an example and how it worked for you?
As an example in my own practice using unique titles in Obsidian, when I type [[ and begin typing a word, I'll often get a list of other notes which are often closely related. This provides a variety of potential links and additional context to which I can write the current note in light of. I also get this same sort of serendipity in the autocomplete functionality of my tagging system which has been incredibly useful and generative to me in the past. This helps me to resurface past notes I hadn't thought of recently and can provide new avenues of growth and expansion.
I've tried the datetime stamp in the past, but without aliasing them all with other titles, things tend to get lost in a massive list of generally useless numbers in an Obsidian folder—i.e. looking at the list gives me absolutely no information without other actions. Further the aliasing to remedy this just becomes extra administrative work. I've also never experienced the sort of surprise you mention when using datetime stamps, or at least not as the result of the timestamps themselves. As a separate concrete example in this video https://share.tube/w/4ad929jjNYMLc6eRppVQmc?start=49s using Denote, there is a clever naming method which simultaneously uses timestamps, Luhmann IDs, titles, and tags. However in this scheme the timestamps is one of the least useful (other than for simply searching by creation date/time, as in "I remember doing this on my birthday last year", or "it was sometime in Winter 2015"...) compared with the Luhmann identifiers, the title, or the tag for search and discovery within the search functionality. Consequently, I'm looking for concrete reasons why people would use datetime stamps and affordances they provide other than to simply have an identifier.
What problem does this try to solve?
Funny (and ironic) that you should ask...
I myself have been asking lately, what problem does the now-standard "Run npm install after you clone the repo" approach solve? Can you state the NPM hypothesis?
See also: builds and burdens
Background
This work has been peer reviewed in GigaScience (see https://doi.org/10.1093/gigascience/giac126), which carries out open, named peer-review. These reviews are published under a CC-BY 4.0 license and were as follows:
Reviewer 1: Shiping Liu
How to model the statistical distribution of the gene expression, is a basic question for the field of single cell sequencing data mining. Dharmaratne and colleagues looked details at the distribution of very gene. By using the generalized linear models (GLM), the authors present a new program scShapes, which matched a specific gene with a distribution from one of the four shapes, Poisson, Negative Binomial (NB), Zero-inflated Poisson (ZIP), and Zero-inflated Negative Binomial (ZINB). As the authors present in this manuscript, not all genes adapted to a single distribution, neither NB or Poisson, and some of the genes actually adapted to the zero-inflated models because of the property of high drop-out rate in the modern single cell sequencing, says 3' tag sequenced. It is has been popular to employ GLM in single cell data mining recently, but it also got both praise and blame. So it is a good forward step to model a specific model for an individual gene. But the bad side is the computing cost, especially for the number of cells been sequenced reach to millions in currently research, and it believed that the dataset will be reached even bigger in the future. So it make a great obstacle arise to the application of the method presented by the author here. How to speed up the calculation using the mixed model or scShapes? The authors also performed the scShapes on some datasets, including the metformin, human T cells, and PBMCs. They found some potential genes that changed the distribution shape, but didn't easy to be identified by other methods. It demonstrated that scShapes could identified the subtle change in gene expression.
Major points: (1) We didn't see any details about the metformin dataset, the segueing depth and quality, number of genes/UMIs per cell, and so on. It makes hard to evaluate the quality and reliability of the results generated by scShapes. If this dataset is another manuscript could not possible to be presented at the same time, I suggest the author could perform on alternative dataset, as there are so many single cell datasets has been published could be used in this study.
(2) Even the authors taken the cell type account in the GLM, I wonder for a specific gene, whether the distribution shape will change in different cell type. If so, it will becoming more complex, that is need to model the distribution shape for individual gene for every cell type alone.
(3) To identify the different gene expression in scShapes, the author didn't consider the influence of different cell number, or the proportion of cell number, in the different cell type. A possible way to evaluate or eliminate this bias is to down sampling from a big dataset, instead of just simulated total number 2k ~ 5k from the PBMC. To evaluate the influence both the total number cell and the proportion in cell type.
(4) The author should present the comparative results of the computational cost for different methods. Says the accuracy, time and memory consuming under different number of cells. I suggest the authors use much a larger dataset, because currently single cell research may include millions of cells, and the ability to process big data is very important to the application and becoming a widely used one.
Minor points: (1) No figure legends for Fig.2 c and d.
(2) It is unclear whether the total 30% genes undergo shape change, or just the proportion of the remaining after the pipeline. So please clarify the details.
Reviewer 2: Yuchen Yang
In this manuscript, authors presented a novel statistical framework scShapes using GLM approach for identifying differential distributions in genes across scRNA-seq data of different conditions. scShapes quantifies gene-specific cell-to-cell variability by testing for differences in the expression distribution. scShapes was shown to be able to identify biologically-relevant switch in gene distribution shapes between different conditions. However, there are still several concerns required to be addressed.
In this study, authors compared scShapes to scDD and edgeR. However, besides these two, there are many other methods for calling DEGs from scRNA-seq. Wang et al. (2019) systematically evaluated the performance of eight methods specifically designed for scRNA-seq data (SCDE, MAST, scDD, D3E, Monocle2, SINCERA, DEsingle, and SigEMD) and two methods for bulk RNA-seq (edgeR and DESeq2). Thus, it is also worthy to compare scShapes to other methods, such as SigEMD, DEsingle and DESeq2, which were supposed to perform better than scDD or edgeR.
When scShapes was compared to scDD, authors mainly focused on the distribution shifting. However, to users, it would be better to present a venn diagram showing the numbers of the genes detected by both scShapes and scDD, and the genes specifically identified by scShapes and scDD, respectively. In addition, authors showed the functional enrichment results for DEGs identified by scShapes. It is also worthy to perform enrichment analysis for the genes detected by both scShapes and scDD or specifically identified by scShapes or scDD.
Since scShapes detects differential gene distribution between different conditions, it would be better to show users how to interpret the significant results biologically. For example, authors mentioned that RXRA is differentially distributed between Old and Young and Old and Treated, so what does this results mean? Can this differential distribution be associated with differential expression?
In Discussion, authors mentioned that scRATE is another tool that can model droplet-based scRNA-seq data. It would be clearer to discuss that why authors develop their own algorithm rather than using scRATE to model the distribution.
In Introduction, authors talked about the zero counts in scRNA-seq data, and presented evidence in Results part. Since 2020, there are several publications also focusing on this issue, such as Svensson, 2020 and Cao 2021. These discussions should be included in this manuscript.
While rPAL improves sensitivity of apparent high molecular weight (MW) glycoRNA species, it also induces background labeling; most notably the 18S rRNA and the small RNA pool (Figure 1C and elsewhere).
Do you think combining Ac4ManNAz and rPAL labeling could be a good way to both specifically identify Neu5Ac-ligated RNA and amplify that signal using orthogonal labels (perhaps Biotin and a FLAG tag) with different fluorophores?
Author Response
Reviewer #1 (Public Review):
The paper addresses an interesting question - how genetic changes in Y. pestis have led to phenotypic divergence from Y. pseudotuberculosis - and provides strong evidence that the frameshift mutation in rcsD is involved. Overall, I found the data to be clearly presented, and most of the conclusions well supported by the data. The authors convincingly show that (i) the frameshift mutation in rcsD alters the regulation of biofilm formation, (ii) this effect depends upon expression of a small protein that corresponds to the C-terminal portion of RcsD, and (iii) the frameshift mutation in rcsD prevents loss of the pgm locus. I felt that the discussion/conclusions about what phosphorylates/dephosphorylates RcsB and how this impacts biofilm formation are overstated, as there are no experiments that directly address this question. I also felt that the authors' model for what phosphorylates/dephosphorylates RcsB in Y. pestis should be more clearly articulated, even if it is only presented as speculation. Lastly, the authors propose that full-length RcsD is made in Y. pestis and contributes to phosphorylation of RcsB, but the evidence for this is weak (faint band in Figure 2d). It may be that the N-terminal domain of RcsD is functional. I recommend either softening this conclusion or testing this hypothesis further, e.g., by introducing an in-frame stop codon early in rcsD after the frame-shift.
Thanks for your comments. We have provided a model and revised the discussion about phosphorylation/dephosphorylation of RcsB and how this impacts biofilm formation (Figure 8 and Supplementary Figure 4). In addition, we have introduced an in-frame stop codon in rcsD before the frameshift and showed that full-length RcsD is only made in wildtype Y. pestis but not in the rcsDpe-stop mutant (Supplementary Figure 1g).
Reviewer #2 (Public Review):
Guo et al. have investigated the consequences of a frameshift mutation in the rcsD gene in the Yersinia pseudotuberculosis progenitor that is conserved in modern Y. pestis strains. Interestingly, they identify a start codon with a ribosome binding site that enables production of an Hpt-domain protein from the C-terminus in Y. pestis. Targeted deletion of this Hpt-domain increased biofilm production in Y. pestis. They find that the ancestral RcsDpstb (full length) is a positive regulator of biofilm in Y. pestis while the Hpt-domain version (RcsDYP) represses biofilm in vitro. When fleas were infected with Y. pestis expressing the ancestral RcsDPSTB protein, there was no difference in bacterial survival or rate of proventricular blockage. This strain also killed mice the same rate (in a different Y. pestis strain background). However, replacing RcsDYP with RcsYPTB dramatically increases the frequency of pgm locus deletion (containing Hms ECM and yersiniabactin genes) during flea infection. The authors predict that this would reduce the invasiveness of the bacteria in mammals and/or flea blockage in subsequent flea-rodent-flea transmission cycles. They also measured global gene expression differences between RcsDPSTB compared to the wild-type strain. They argue that the frameshift of RcsD maintaining the Hpt-domain (RcsDYP) was needed to regulate biofilm while limiting loss of the pgm locus.
Loss of the pgm locus was not tested in the Y. pestis rcsD mutant strain (lacking the entire gene or just the C-terminal Hpt domain). Therefore, the claim that maintaining the Hpt-domain protein was important lacks convincing evidence. Additionally, it is possible that the population of rcsDpe::rcsDpstb after in vitro growth for 6 days would still be proficient at infecting and blocking fleas, even though many of the bacteria would have lost the pgm locus. Production of Hms polysaccharide by pgm+ could trans-complement those that are pgm-. The nature of the pgm locus loss is assumed to be due to recombination between IS elements. This is certainly the likeliest explanation but not the only one. The authors checked for pgm loss by phenotype (CR binding) and by two sets of primers, one targeting the hmsS gene and another set that is unspecified. Loss of the entire pgm (especially yersiniabactin genes) should be clarified.
Thanks for your comments. We have now provided the data to show that deletion of RcsD-Hpt resulted in increased loss of the pgm locus (Figure 5d) to strengthen the claim that maintenance of the Hpt-domain is significant for retention of the pgm locus. We also agree that 6-day old cultures of a mixture of pgm+ and pgm- rcsDpe::rcsDpstb will still be capable of infecting and blocking fleas. However, these strains will be less efficient at causing disease in the vertebrate host in the absence of the pgm locus. We agree that recombination between IS elements might not be the only cause of loss of the pgm locus. To verify the loss of the pgm locus, we have used two sets of primers. One set targets the hmsS gene and another set targets the upstream and downstream sequences of the pgm locus (Supplementary Table 3). We have clarified this in the revised manuscript (Line 610-613).
Reviewer #3 (Public Review):
The Rcs phosphorelay plays an important role in regulating gene expression in bacteria; most of the current knowledge about the Rcs proteins is from E. coli. Yersinia pestis, carrying mutations in two central components of the Rcs machinery, provides an interesting example of how evolution has shaped this system to fit the life cycle of this bacteria. In bacteria other than Y. pestis, most Rcs activating signals are sensed via the outer membrane lipoprotein RcsF; from there, signalling depends on inner membrane protein IgaA, a negative regulator of RcsD. Histidine kinase RcsC is the source of the phosphorylation cascade that goes from the histidine kinase domain of RcsC to the response regulator domain of RcsC, from there to the histidine phosphotransfer (Hpt) domain of RcsD, and finally to the response regulator RcsB. RcsB, alone or with other proteins, regulates transcription of many genes, both positively and negatively. These authors have previously shown that RcsA, a co-regulator that acts with RcsB at some promoters, is functional in Y. pseudotuberculosis but mutant in Y. pestis, and that this leads to increased biofilm in the flea. The authors also noted that rcsD in Y. pestis contains a frameshift after codon 642 in this 897 aa protein; in theory that should eliminate the Hpt domain from the expressed protein. However, they found evidence that the frame-shifted gene had a role in regulation. This paper investigates this in more depth, providing clear evidence for expression of the Hpt domain (without the N-terminal domain), and demonstrating a critical role for this domain in repressing biofilm formation. The Y. pseudotuberculosis RcsD does not express a detectable amount of the Hpt domain nor does it repress biofilm formation. The ability of the Hpt domain protein to keep biofilm formation low explains most of what is observed for the full-length frame-shifted protein.
1) The authors provide a substantial amount of data supporting the expression of the C-terminus of RcsD is sufficient and necessary for low biofilm levels, and that this is dependent upon the active site His in the RcsD Hpt domain (H844A) as well as other components of the basic phosphorelay (RcsC and RcsB). However, it is only possible to see this protein by Western blot in 100-fold "Enriched" lysates (Figure 2). No small protein was detected in the RcsDpstb strain, although the enriched lysate was not shown for this. Without that experiment, it is not possible to evaluate whether the small protein is also made from the rcsDpstb gene. Either answer would be interesting, and would allow other conclusions to be drawn. Is the RBS and start codon the same for the HPT region of this rcsD gene (it could be added to Supplementary Table 6). If the small protein is made, is its ability to function blocked by the excess full length protein in terms of interactions with RcsC? Or is the expression of the small protein dependent upon loss of overlapping translation from the upstream start?
The small Hpt protein may be produced from expression of the epitope tagged rcsDpstb gene as it can be detected in an enriched isolation of this sample (Supplementary Figure 1f). Because only a small amount of the RcsD-Hpt is produced from the rcsDpstb substitution, it might only function at low levels in the presence of large amounts of RcsDpstb. The RBS and start codon are the same for the RcsD-Hpt in Y. pestis and Y. pseudotuberculosis, we have added them in the Supplementary Table 6. In addition, we have provided a model to show the function and regulation of RcsD and Hpt (Supplementary Figure 4).
2) In many phosphorelays, the protein kinase also acts as a phosphatase, and which direction P flows is critical for regulation. It is often difficult to follow what the model for this is in this paper, and that is important to understand for evaluating the results. Most of this paper uses two assays, biofilm formation and crystal violet staining (also related to biofilm formation) to assess the functioning of the Rcs phosphorelay. Based on the behavior of the rcsB mutant, it would seem that functional Yersinia pestis Rcs (RcsDpe) represses this behavior, and this correlates with RcsB phosphorylation (Figure4). What is the basis (Line 443-44) for saying that RcsD phosphorylates RcsB while RcsDHpt dephosphorylates? Yersinia pseudotuberculosis RcsD(pstb) shows no difference with the rcsB mutant. Doesn't that suggest that RcsDpstb is no longer repressing (phosphorylating)? In the presence of the RcsDpstb as well as multicopy RcsF, an activating signal in other organisms, RcsDpstb seems able to phosphorylate. This all suggests that the full-length protein, like the Hpt domain, is capable of phosphorylating, but that it may be doing nothing in the absence of signal (or dephosphorylating). Given these results, saying that RcsDpstb is positively regulating biofilm formation (Fig.1 title, and elsewhere) is somewhat misleading. What it presumably does is prevent the Hpt domain, expressed from the chromosomal locus in Figure1b, from signalling to RcsB. By itself, it is not clear it is doing anything. Understanding this clearly is important for interpreting this system and the tested mutants. A clear model and how phosphate is flowing in the various situations would help a lot. Currently Supplementary Figure3 seems to reflect the appropriate directional arrows, but the text does not. Moving the rcsB data earlier in the paper (after Figure1, 2, or maybe earlier, before Figure3) would certainly help.
RcsD dephosphorylates RcsB while RcsD-Hpt phosphorylates RcsB. Expression of RcsDpstb in the wild type strain and the N-term deletion mutant resulted in increased biofilm, indicating RcsB is less phosphorylated (Figure 1b and 1c). While over-expression of RcsD-Hpt resulted in decreased biofilm formation, indicating RcsB is more phosphorylated. In addition, the Phos-tag experiments showed that the RcsDpstb strain has a lower level of phosphorylated RcsB (Figure 4b). Expression of RcsDpstb in the wild type strain showed similar results as a rcsB mutant indicating a lower level of phosphorylated RcsB in the presence of RcsDpstb.
It is possible that the RcsDpstb interferes with the ability for RcsD-Hpt to phosphorylate RcsB. However, plasmid expression of the rcsDpstb-H844A mutant in the Y. pestis rcsDN-term deletion mutant formed significantly less biofilm than wild type rcsDpstb indicating H844 might be important for RcsD to dephosphorylate RcsB (Supplementary Figure 2b and Line 180-183). In addition, it is known that RcsD plays a dual role in phosphorylation and dephosphorylation of RcsB in other organisms (Majdalani N, et al., 2005, J. Bacteriol. https://doi.org/10.1128/JB.187.19.6770-6778.2005; Wall EA, et al., 2020, Plos Genetics, https://doi.org/10.1371/journal.pgen.1008610; Takeda S., et al., 2001, Mol. Microbiol., https://doi: 10.1046/j.1365-2958.2001.02393.x). We therefore think it is safe to say that the full length RcsD might function to dephosphorylate RcsB. We have modified the model in the revised manuscript (Supplementary Figure 4 and Figure 8). Regulation of RcsB has been investigated previously. The main finding of our manuscript is regulation of RcsB by the mutated RcsD (RcsD-Hpt). Thus, we have moved the known rcsB deletion mutant data to Figure 1 in the revised manuscript as suggested. We kept the rest of data in Figure 4 the same. We think it might be better to first show the mutation of rcsD alters Rcs signaling and then show how this occurs (by affecting RcsB phosphorylation).
3) The authors show (in their pull-down) that there is a bit of full-length RcsD even in the frame-shifted protein. Is there any clear evidence this does anything here? Does the N-terminus (truncated after the frame-shift) have a function?
We have introduced a stop codon in rcsDpe and showed that full-length RcsD is made by rcsDpe but not by rcsDpe with the stop codon (Supplementary Figure 1g). RcsDN-term seems do not have a function in our tested condition (Figure 1e).
4) While the RNA seq data is useful addition here, it is difficult to interpret without a bit more data on the strain used for the RNA seq, including the biofilm phenotypes of the WT and mutant derivatives, as well as the relevant rcsD sequences, and maybe expression of a few genes or proteins (Hms or hmsT). Are these similar in the parallel strains used earlier in the paper and the one for RNA seq, in WT, rcsB- and the RcsDpstb derivative? It would appear that rcsB- and rcsDpstb have opposite effects, at least at 25{degree sign}C, while in Figure4, these two derivatives have similar effects on biofilm. Is this due to temperature, strains, or biofilm genes that are not shown here? It is certainly possible that the ability of the full-length RcsD changes its kinase/phosphatase balance as a function of temperature, or dependent on other differences in these Y. pestis strains.
The strain used for RNA seq is a derivative of the biovar Microtus strain 201 which has a similar in vitro phenotype as the strain KIM6+ (Line 297-298). We used this strain for RNA seq because it has the virulence plasmid pCD1 and we wanted to analyze the gene expression of this plasmid, which is required for virulence, as well. RNAseq data showed that rcsB- and rcsDpstb have opposite effects on mRNA level of some genes. However, no significant change in expression of biofilm genes was noted in the RNAseq data set. In fact, our previous data has shown that the biofilm related (hmsT and hmsD) genes are only moderately (Less than 2-fold change between wild type and rcsB mutant) regulated by RcsB based on RT-PCR and β-gal analysis (Sun YC, et al., 2012, J. Bacteriol. https:// doi: 10.1128/JB.06243-11and Guo XP, et al., 2015, Sci. Rep. https://doi: 10.1038/srep08412 and Figure 4c).
Note: This preprint has been reviewed by subject experts for Review Commons. Content has not been altered except for formatting.
Learn more at Review Commons
RC-2022-01803 "UBXN1 maintains ER proteostasis and represses UPR activation by modulating translation independently of the p97 ATPase" By Ahlstedt et al.
Comments to the Author
UBXN1 is a VCP adaptor UBX domain protein which is known to be involved in elimination of ubiquitylated cytosolic proteins bound to the BAG6 complex. In this study, authors demonstrated that cells depleted of UBXN1 have elevated UPR activation, even without external ER stresses. Cells devoid of UBXN1 have significant and global up-regulation of UPR-specific target genes, and these cells are more sensitive to ER stress than their wildtype counterparts. Using quantitative tandem mass tag proteomics of UBXN1 deleted cells, authors found that significant enrichment of the abundance of ER proteins involved in protein translocation, protein folding, quality control, and the ER stress response in an ERAD-independent manner. Notably, they observed no change in the abundance of proteins in the cytosol or nucleus, and significant decrease in the expression of several mitochondrial proteins when UBXN1 was depleted. Authors further demonstrate that UBXN1 is a translation repressor, and its UBA domain is critical for suppressing protein synthesis. Thus, increased influx of proteins into the ER in UBXN1 KO cells causes UPR activation. Authors concluded that they have identified a new regulator of protein translation and ER proteostasis.
My specific comments were provided as follows.
Comments
Although the discovery in this manuscript might be potentially interesting for broad audience, the presented study did not provide enough mechanistic insights and their data lacks vital evidences to support their conclusion. I found that the data are preliminary to discuss the validity of this finding. The inadequacy of these points makes this manuscript unsuitable for publication at this stage.
My expertise is cell biology and biochemistry for protein quality control.
OpenAI also contracted out what’s known as ghost labor: gig workers, including some in Kenya (a former British Empire state, where people speak Empire English) who make $2 an hour to read and tag the worst stuff imaginable — pedophilia, bestiality, you name it — so it can be weeded out. The filtering leads to its own issues. If you remove content with words about sex, you lose content of in-groups talking with one another about those things.
You can change the list of popular tags to show tags you’ve used, or tags used in groups, by first searching for your username or group name.
To search for Tag list user:LeaAnn_Bethany tag: in the search bar.
Highlights are private
And only private. It seems you can not highlight publicly, unless you put at least one tag. A highlight with a comment is an annotation. An annotation without a highlight is Page Note (you need add it in separate pane).
how did you teach yourself zettelkasten? .t3_11ay28d._2FCtq-QzlfuN-SwVMUZMM3 { --postTitle-VisitedLinkColor: #9b9b9b; --postTitleLink-VisitedLinkColor: #9b9b9b; --postBodyLink-VisitedLinkColor: #989898; }
reply to u/laystitcher at https://www.reddit.com/r/Zettelkasten/comments/11ay28d/how_did_you_teach_yourself_zettelkasten/
Roughly in order: - Sixth grade social studies class assignment that used a "traditional" index card-based note taking system. - Years of annotating books - Years of blogging - Havens, Earle. Commonplace Books: A History of Manuscripts and Printed Books from Antiquity to the Twentieth Century. New Haven, CT: Beinecke Rare Book and Manuscript Library, 2001. - Locke, John, 1632-1704. A New Method of Making Common-Place-Books. 1685. Reprint, London, 1706. https://archive.org/details/gu_newmethodmaki00lock/mode/2up. - Erasmus, Desiderius. Literary and Educational Writings, 1 and 2. Edited by Craig R. Thompson. Vol. 23 & 24. Collected Works of Erasmus. Toronto, Buffalo, London: University of Toronto Press, 1978. https://utorontopress.com/9781487520731/collected-works-of-erasmus. - Kuehn, Manfred. Taking Note, A blog on the nature of note-taking. December 2007 - December 2018. https://web.archive.org/web/20181224085859/http://takingnotenow.blogspot.com/ - Ahrens, Sönke. How to Take Smart Notes: One Simple Technique to Boost Writing, Learning and Thinking – for Students, Academics and Nonfiction Book Writers. Create Space, 2017. - Sertillanges, Antonin Gilbert, and Mary Ryan. The Intellectual Life: Its Spirit, Conditions, Methods. First English Edition, Fifth printing. 1921. Reprint, Westminster, MD: The Newman Press, 1960. http://archive.org/details/a.d.sertillangestheintellectuallife. - Webb, Beatrice Potter. Appendix C of My Apprenticeship. First Edition. New York: Longmans, Green & Co., 1926. - Schmidt, Johannes F. K. “Niklas Luhmann’s Card Index: The Fabrication of Serendipity.” Sociologica 12, no. 1 (July 26, 2018): 53–60. https://doi.org/10.6092/issn.1971-8853/8350. - Hollier, Denis. “Notes (On the Index Card).” October 112, no. Spring (2005): 35–44. - Wilken, Rowan. “The Card Index as Creativity Machine.” Culture Machine 11 (2010): 7–30. - Blair, Ann M. Too Much to Know: Managing Scholarly Information before the Modern Age. Yale University Press, 2010. https://yalebooks.yale.edu/book/9780300165395/too-much-know. - Krajewski, Markus. Paper Machines: About Cards & Catalogs, 1548-1929. Translated by Peter Krapp. History and Foundations of Information Science. MIT Press, 2011. https://mitpress.mit.edu/books/paper-machines. - Goutor, Jacques. The Card-File System of Note-Taking. Approaching Ontario’s Past 3. Toronto: Ontario Historical Society, 1980. http://archive.org/details/cardfilesystemof0000gout.
And many, many others as I'm a student of intellectual history.... If you want to go spelunking on some of my public notes, perhaps this is an interesting place to start: https://hypothes.is/users/chrisaldrich?q=tag%3A%22note+taking%22 I also keep a reasonable public bibliography on this and related areas: https://www.zotero.org/groups/4676190/tools_for_thought
V5
this is a small peptide tag
v0.29.0 v0.29.0 9d3cf91 Compare Choose a tag to compare View all tags haydenyoung tagged this
orbitdb
6 Custom Google Chrome Profiles You Should Start Using

once termed “Brutalist atrocity”
Hyperlinks like this drive me nuts! On a news site, linking to 'recent posts' when referring to another specific article, term, or concept is ridiculous, particularly when the tag referenced seems to have nothing to do with the desired end result. I see this often on large news sites and articles. It makes web information impossible to reproduce and retrace when digging through archives, etc., and the cost to keep links updated if the name of the article changes surely can't be that substantial - right?
Note: This rebuttal was posted by the corresponding author to Review Commons. Content has not been altered except for formatting.
Learn more at Review Commons
We thank all the reviewers for having raised constructive criticism to fortify the main message and improve the clarity of the manuscript. We appreciate that all reviewers found that our work addresses an important topic and is of interest to a broad audience. We believe that we have thoroughly addressed the concerns of the reviewers, especially with regard to 1) performing another SMC3 chromatin immunoprecipitation and sequencing (ChIP-seq) replicate and control, 2) including a later time point for the transcriptional data, and 3) performing additional characterization of the growth phenotype of the SMC3 conditional knockdown.
Reviewer #1
(Evidence, reproducibility and clarity (Required)):*
Summary The present work by Rosa et al., provides convincing data about the presence and functional relevance of the cohesin complex in Plasmodium falciparum blood stages. In accordance with other organisms, the composition of the cohesin complex containing SMC1, SMC3 RAD21 and putatively STAG could be confirmed via pulldown and mass spectrometry. Basic characterization of endogenous tagged SMC3 demonstrated the expression and nuclear localization during IDC, as well as the relatively stable accumulation at centromeric regions, consistent with the known cohesin function in chromatid separation. Furthermore, dynamic and stage-dependent binding to intergenic regions observed in ChIPseq and major transcriptome aberrations upon knockdown of SMC3 (__Response: __As we regularly perform ChIP-seq experiments in the lab, we have generated multiple negative control datasets. In our opinion, the most stringent negative control for an HA-tagged protein is performing ChIP with an HA antibody in a WT strain. We have recently published an in-depth analysis of this (and other) negative ChIP-seq controls (Baumgarten & Bryant, 2022, https://doi.org/10.12688/openreseurope.14836.2). We show in this publication that non-specific ChIP-seq experiments (such as negative controls) result in an over-representation of HP1-heterochromatinized regions due to differences in sonication efficiency of heterochromatin and technical challenges with mapping regions with high levels of homology. In the anti-HA in WT ChIP negative control (performed at 12hpi), we do not see any enrichment at centromeric regions, but rather at heterochromatinized regions where clonally variant gene families are located. We performed peak calling analysis and found no significant overlap between the negative control ChIP-seq and the SMC3-3HA ChIP-seq data at 12hpi.
In addition, we have now performed a second biological replicate of the SMC3-3HA ChIP-seq with a different clone at all time points. We compared this data to that from the original clone and found significant overlap of the peaks called (see what is now Table 4 and Supp. Fig. 3A). We generated a stringent list of peaks that were shared between both clones at each time point and repeated all downstream analyses (see what are now Tables 5-8). We found that our conclusions were largely unchanged. Text describing these experiments and analyses have been added throughout the results section.
To address the question of whether genes that are upregulated upon depletion of SMC3 at early stages are affected at the 36hpi time point, we performed differential expression analysis of the SMC3-3HA-glmS parasites with and without glucosamine at 36hpi (we have added this data in Table 11). Again, significantly up- and down-regulated genes were not filtered using the WT dataset. With this analysis, we see only three genes from the list of invasion-related genes (Hu et al., 2010) that are up-regulated, but none of them have a significant q-value (Tab 5 of Table 18). Thus, depletion of SMC3 in late stage parasites does not lead to up-regulation of the same genes that are upregulated at 12 and 24hpi. We have added this information to the text (Line 273).
Furthermore, the hypothesized repressive effect of SMC3 does not explain the numerous genes downregulated in KD.
__Response: __As we state on line 350, we do not observe enrichment of SMC3 at downregulated genes, suggesting an indirect or secondary effect of SMC3 KD on these genes.
Due to the fact, that the KD was induced at the exact same timepoint and analysed 12h and 24h after induction it is possible that identified, differentially expressed genes at 24h are not directly regulated by SMC3, but rather due to a general deregulation of gene expression. Did the authors attempt to analyse gene expression upon induction at ring, trophozoite and schizont stage? Response: __As we state on line 230, in order to achieve SMC3 KD at the protein level, we had to treat the parasite with glucosamine for two cell cycles (approximately 96 hours). After two cell cycles of glucosamine treatment, the parasites were tightly synchronized and sampled 12 and 24 hours later. Thus, SMC3 KD takes place over the course of multiple days, but parasites are collected after stringent synchronization. Giemsa staining and bioinformatic analysis (line 250) of the RNA-seq data from parasites (with or without glucosamine) harvested at 12 and 24 hpi show that these parasites were synchronous and that there were no gross differences in genome-wide transcript levels. It is certainly possible that differentially expressed genes at 12 or 24hpi are not directly regulated by SMC3, and this is precisely why we perform ChIP-seq of SMC3: to provide evidence of direct involvement via binding, as stated on line 281. __
*Based on rapid parasite growth, the authors hypothesize a higher invasion rate due to upregulation of invasion genes. This hypothesis is not supported by quantitative invasion assays or quantification of invasion factors on the protein level. An alternative explanation could be a shorter cell cycle (__Response: __We have repeated the growth curve analysis with additional clones and no longer observe a growth phenotype in the SMC3 knockdown condition. We have added images of Giemsa-stained parasites from the knockdown time course we performed to what is now Supp. Fig. 5A. We see no obvious differences in cell morphology caused by glucosamine treatment in the WT or SMC3-3HA-glmS parasites.
Correlation of SMC3-occupancy/ATAC/expression profile of the exemplary genes rap2 and gap45 (Figure 4C,D,E): is this representative for all upregulated genes? __Response: __SMC3 occupancy shown at rap2 and gap45 is representative for all upregulated genes (see Fig. 4A and B). It is difficult to provide a general representation of the average expression profiles of all up-regulated genes over the course of the IDC, but Fig. 3E shows that the vast majority of up-regulated genes normally reach their peak expression in late stage parasites. With regard to ATAC-seq profiles, we have performed a metagene analysis of chromatin accessibility (data taken from (Toenhake et al., 2018)) at all up-regulated genes at time points that closely correspond to the time points used in our study: 15, 25, and 35, and 40 hpi (new Fig. 4C). This metagene analysis confirms what we observe at individual genes: increasing chromatin accessibility over the course of the IDC at these genes’ promoters. While metagene analyses offer important information, we always try to show the raw data (as in new Figs. 4D-F) from individual examples as proof of principle.
Given that SMC3 appears to be not essential for parasite growth, the authors could generate a null mutant for SMC3, which might allow for easier analysis of differences in gene regulation, cell cycle progression and/or invasion efficiency. __Response: __As we explain on line 327, very little cohesin is required for normal growth and/or mitosis in our study and two studies in S. cerevisiae and D. melanogaster. However, SMC3 is essential in S. cerevisiae. We were unable to knock out SMC3, and a recent mutagenesis study suggests that SMC3 and SMC1 are essential to the parasite during the intraerythrocytic developmental cycle (Zhang et al. Science, 2018). This is why we chose an inducible knockdown system.
*Reviewer #1 (Significance (Required)):
Own opinion The authors provide a basic characterization of the cohesin component SMC3 using NGS methods to investigate chromatin binding sites and its potential influence on gene expression. *
__Response: __We respectfully disagree that our study offers only a basic characterization of SMC3. We combine IFA, mass spectrometry, and both ChIP-seq and RNA-seq of SMC3 across the entire intraerythrocytic developmental cycle to provide the most detailed and comprehensive functional analysis of SMC3 in P. falciparum to date.
The localisation of SMC3 at centromers as described previously (Batugedara 2020) was confirmed. However, the dynamic binding to other regions in the genome, potentially mediated by other proteins, could not be resolved unequivocal with only one replicate of ChIPseq per time point.
__Response: __With regard to the replicates for ChIP-seq, please see our response to this same point above.
Similarly, the RNAseq data demonstrate the relevance of SMC3 for gene expression, but no clear picture of a regulatory mechanism can be drawn at his point. Lacking information about the mode of binding as well as the setup of transcriptome analysis (only two time-shifted sampling points after simultaneous glmS treatment for 96h resulting in incomplete knockdown) cannot definitely elucidate, if SMC3/cohesin is a chromatin factor that affects transcription of genes in general or a specific repressor of stage-specific genes. __Response: __We agree that we have not established a regulatory mechanism for how SMC3 achieves binding specificity. However, the combination of inducible knockdown (as SMC3 is essential to the cell cycle) and differential expression analysis with ChIP-seq from the same time points across the intraerythrocytic developmental cycle is the most stringent and standard approach in the field of epigenetics for determining the direct role of a chromatin-associated protein in gene expression. We provide a detailed explanation of how the transcriptome analysis was set up in the Results (lines 229-234) and Materials and Methods (lines 715-719) section. With regard to our sampling points being “time-shifted,” we provide bioinformatic analysis (line 246-251, what is now Supp. Fig. 5B) of the RNA-seq data from untreated and glucosamine-treated parasites showing highly similar “ages” with regard to progression through the intraerythrocytic developmental cycle. While we of course also monitor progression through the cell cycle with Giemsa staining (Supp. Fig. 5A), this bioinformatic analysis is the most stringent method of determining specific times in the cell cycle.
*The work will be interesting to a general audience, interested in gene regulation and chromatin remodelling
The reviewers are experts in Plasmodium cell biology and epigenetic regulation.*
Reviewer #2
(Evidence, reproducibility and clarity (Required)):
Rosa et al, Review Commons The manuscript by Rosa et al. addresses the function of the cohesion subunit Smc3 in gene regulation during the asexual life cycle of P. falciparum. Cohesin is a conserved protein complex involved in sister chromatin cohesion during mitosis and meiosis in eukaryotic cells. Cohesin also modulates transcription and DNA repair by mediating long range DNA interactions and regulating higher order chromatin structure in mammals and yeast. In P. falciparum, the Cohesin complex remains largely uncharacterized. In this manuscript, the authors present mass spectrometry data from co-IPs showing that Smc3 interacts with Smc1 and a putative Rad21 orthologue (Pf3D7_1440100, consistent with published data from Batugedara et al and Hilliers et al), as well as a putative STAG domain protein orthologue (PF3D7_1456500). Smc3 protein appears to be most abundant in schizonts, but ChIPseq indicates predominant enrichment of Smc3 in centromers in ring and trophozoite stages. In addition, Smc3 dynamically binds with low abundance to other loci across the genome; however, the enrichment is rather marginal and only a single replicate was conducted for each time point making the data interpretation difficult. Conditional knock-down using a GlmS ribozyme approach indicates that parasites with reduced levels of Smc3 have a mild growth advantage, which is only evident after five asexual replication cycles and which the authors attribute to the transcriptional upregulation of invasion-linked genes following Smc3 KD. Indeed, Smc3 seems to be more enriched upstream of genes that are upregulated after Smc3 KD in rings than in downregulated genes, indicating that Smc3/cohesin may have a function in supressing transcription of these schizont specific genes until they are needed. The manuscript is concise and very well written, however it suffers from the lack of experimental replicates for ChIP experiments and a better characterization of the phenotype of conditional KD parasites. * Major comments • In the mass spectrometry analysis, many seemingly irrelevant proteins are identified at similar abundance to the putative rad21 and ssc3 orthologues, and therefore the association with the cohesion complex seems to be based mostly on analogy to other species rather than statistical significance. Hence, it would be really nice to see a validation of the novel STAG domain and Rad21 proteins, for example by Co-IP using double transgenic parasites.*
__Response: __While our IP-MS data did not yield high numbers of peptides, the top most enriched proteins were SMC3 and SMC1. As we state on line 157, two previous studies have already shown a robust interaction between SMC1, SMC3, and RAD21 in Plasmodium, supporting the existence of a conserved cohesin complex. While the identification of the STAG domain-containing protein is interesting, the purpose of our IP-MS was less about redefining the cohesin complex in P. falciparum and more about confirming that the epitope-tagged SMC3 we generated was incorporated correctly into the cohesin complex and was specifically immunoprecipitated by the antibody we later use for western blot, immunofluorescence, and ChIP-seq analyses. However, to validate the results of ours and others’ mass spectrometry results, we generated two new parasite strains – SMC1-3HA-dd and STAG-3HA-dd – and an antibody against SMC3 (see what is now Supp. Fig. 1). We performed co-IP and western blot analysis with these strains and show an interaction between SMC1 and SMC3 and STAG and SMC3 (see what is now Supp. Fig. 2). This information has been added to the manuscript on lines 162-167.
In addition, we have now performed a second biological replicate of the SMC3-3HA ChIP-seq with a different clone at all time points. We compared this data to that from the original clone and found significant overlap of the peaks called (see what is now Table 4 and Supp. Fig. 3A). We generated a stringent list of peaks that were shared between both clones at each time point and repeated all downstream analyses (see what are now Tables 5-8). We found that our conclusions were largely unchanged. Text describing these experiments and analyses have been added throughout the results section.
The SMC3 ChIP from Batugedara et al., 2020 was performed with an in-house generated antibody (not a commercially available, widely validated antibody as we use) at a single time point in the IDC: trophozoites. Batugedara et al. performed one replicate and did not have an input sample for normalization. Rather, it seems that they incubated beads, which were not bound by antibody or IgG, with their chromatin and used any sequenced reads from this beads sample to subtract from their SMC3 ChIP signal as means of normalization. According to ENCODE ChIP-seq standards, this is not a standard nor stringent way of performing ChIP-seq and the subsequent analysis. Because they did not generate a dataset for their ChIP input, it is not possible to call peaks as we do in our study and compare those peaks with ours.
The authors argue that during schizogony, cohesin may no longer be required at centromers, explaining the low ChIPsignal at this stage (Line 301). However, during schizogony parasites undergo repeated rounds of DNA replication (S-phase) and mitosis (M-phase) to generate multinucleated parasites; and concentrated spots of Smc3 are observed in each nucleus in schizonts by IFA. In turn, the strong presence of Smc3 at centromers in ring stage parasites is surprising, particularly since the Western Blot in Figure 1D shows most expression of Smc3 in schizonts and least in rings; and Smc3 is undetectable in rings by IFA. Yet, the ChIP signal shows very strong enrichment at centromers, long before S phase produces sister chromatids. What could be the reason for this discrepancy? Again, ChIP replicates and controls would be helpful in distinguishing technical problems with the ChIP from biologically relevant differences. __Response: __We discuss in lines 337-342 not that cohesin is no longer required at centromeres during schizogony, but that its removal from centromeres may be required specifically for separation of sister chromatids, as is seen in other eukaryotes. We also discuss that the unique asynchronous mitosis in Plasmodium may lead to a mixed population of parasites at the time point sampled where there may be some centromeres with SMC3 present and some where it is absent to promote sister chromatid separation. Even though SMC3 may be evicted from centromeres to promote sister chromatid separation, it is likely re-loaded onto centromeres once this process is complete. This is most likely why we see foci of SMC3 in each nucleus of mature schizonts by IFA. With regard to the discrepancy between SMC3 levels in rings seen in total nuclear extracts (by western blot) and at centromeres (by ChIP-seq): the total level of a protein in the nucleus does not necessarily dictate the genome-wide binding pattern or the level of enrichment of that protein at specific loci in the genome. Moreover, if one molecule of SMC3 binds to each centromere, 14 molecules would be needed in a ring stage parasite while over 500 would be needed in a schizont (assuming that there are ~36 merozoites present). SMC3 binds to centromeres in interphase cells in other eukaryotes as well, and we speculate that this binding may play a role in the nuclear organization of centromeres, as we discuss starting on line 333.
It is surprising that a conserved protein like Smc3 shows such a subtle phenotype, given that it is predicted to be essential and its orthologues have a function in mitosis. Generally, only limited data are presented to characterize the Smc3 KD parasites, and more detail should be included. For example validation of the parasite line using a PCR screen for integration and absence of wt, parasite morphology after KD, and/or analysis of the KD parasites for cell cycle status. __Response: __First, we have repeated our growth curve analysis several times and with more clones and have concluded that there is not a significant growth phenotype in SMC3 KD parasites (see what is now Supp. Fig. 4B). As we discuss on line 342, very little intact cohesin complex seems to be required for normal growth and mitosis in S. cerevisiae and D. melanogaster, which is probably why we do not see an obvious growth or morphological phenotype. Because we could not generate SMC3 knockout parasites, there may be just enough SMC3 left to perform its vital function in our KD strain. We have added PCR data to demonstrate integration of the 3HA tag- and glmS ribozyme-encoding sequence in the clonal strains we are using for all experiments (see what is now Supp. Fig. 1A). Sanger sequencing was performed on these PCR products to confirm correct sequences. We also added images of Giemsa-stained parasites in untreated and glucosamine-treated parasites at all time points to demonstrate a lack of an obvious morphological phenotype in SMC3 KD parasites (see what is now Supp. Fig. 5A).
Synchronization was performed at the beginning of the growth time course, which would be expected to result in a stepwise increase in parasitemia every 48 hours; however, the parasitemia according to Fig. 4F rises steadily, which would indicate that the parasites are actually not very synchronous. __Response: __We did indeed tightly synchronize these parasites and hope that the stepwise increase in parasitemia is seen better in our new growth curve analysis (see what is now Supp. Fig. 4B).
The question of whether Smc3 causes a shorter parasite life cycle (quicker progression) or more invasion is important and could be experimentally addressed by purifying synchronous schizont stage parasites and determining their invasion rates as well as morphological examination of the Giemsa smears over the time course. __Response: __We have repeated our growth curve analysis several times and with more clones and have concluded that there is not a significant growth phenotype in SMC3 KD parasites (see what is now Supp. Fig. 4B).
Please also compare Smc3 transcriptional levels in transgenic parasites to those in wt parasites to rule out that the genetic modification has lead to artificial upregulation of Smc3 transcription. __Response: __We have added this data to what is now Supp. Fig. 4C, showing that there is no significant difference in SMC3 transcript levels between WT and SMC3-3HA-glmS strains. We have added this information to the text of the manuscript (Line 243). As we also generated an SMC3 antibody, we could demonstrate that there is no appreciable difference in SMC3 protein levels between WT and SMC3-3HA-glmS strains (see what is now Supp. Fig. 1D).
According to Figure S2, even more genes were deregulated at the 12 hpi time point in the WT parasites than in Smc3 parasites, and even to a much higher extent. What "transcriptional age" did the WT control parasites have at each time point? __Response: __We have now included the transcriptional age of all strains, replicates, and treatments in what is now Supp. Fig. 5B. At the 12 hpi time point in particular, regardless of glucosamine treatment, the SMC3-3HA-glmS and WT parasites were highly synchronous. The only large discrepancy we see in transcriptional age is between untreated and glucosamine-treated WT parasites at 36 hpi, which is why we did not include this time point in our transcriptional analysis. We were also surprised by the number of genes that were de-regulated with simple glucosamine treatment. The glmS system of inducible knockdown is widely used in P. falciparum; however, to our knowledge, no lab has investigated whether glucosamine treatment affects transcription in wildtype cells over the course of the IDC. Thus, for accurate phenotypic characterization of any protein with this system with regard to transcriptomics, we thought it was important to provide an RNA-seq dataset to define the cohort of genes affected by glucosamine treatment in WT parasites. We hope that our study will demonstrate the importance of using stringent controls when using inducible knockdown systems.
A negative correlation with transcription is well established in S. cerevisiae, particularly at inducible genes. How does Smc3 enrichment generally look like for genes that show maximal expression at each of the time point? __Response: __We have performed a metagene analysis of SMC3 enrichment at all genes at each respective time point, which we divided into quartiles of expression based on their FPKM values in the RNA-seq data from the corresponding time point in untreated SMC3-3HA-glmS parasites. This quartile analysis considers all genes, including genes that are not transcribed at all and regardless of whether a gene has a significant SMC3 peak or is differentially expressed upon SMC3 knockdown. At the 12 hpi time point, we do see an inverse correlation between SMC3 enrichment and gene transcription level, but this enrichment is most pronounced across genes bodies. We see the highest SMC3 enrichment at genes in the 4th (lowest) quartile category. For the other two time points, we do not see any obvious pattern of SMC3 enrichment with regard to transcriptional status.
Line 590: according to the methods, a 36 hpi KD time point was also harvested. Why are the data not shown/analysed? __Response: __To be clear, we are most interested in the transcriptional role of SMC3 during interphase, where results are not confounded by its potential role in mitosis. However, we did collect a 36hpi time point in the SMC3-3HA-glmS and WT strain, with and without glucosamine. We have added this last time point and the WT data from the other two time points to the manuscript (see Tables 11-13). Unfortunately, and for reasons unknown, the WT replicates treated with glucosamine showed a significantly advanced “transcriptional age” compared to the other replicates at 36hpi (see what is now Supp. Fig. 5B). Thus, we did not feel comfortable performing the RNA-seq analysis as we did with the other two time points (i.e. subtracting up- and down-regulated genes from the WT control from the SMC3-3HA-glmS data sets). We have added this information to the results section (Lines 256 and 261). As the WT parasites treated with glucosamine were approximately 8 hours in advance of the untreated WT parasites for the 36hpi time point, any up- and down-regulated genes might have been due to differences in the cell cycle rather than due to glucosamine treatment. The glmS system of inducible knockdown is widely used in P. falciparum; however, to our knowledge, no lab has investigated whether glucosamine treatment affects transcription in wildtype cells over the course of the IDC. Thus, for accurate phenotypic characterization of any protein with this system with regard to transcriptomics, we thought it was important to provide an RNA-seq dataset to define the cohort of genes affected by glucosamine treatment in WT parasites. We hope that our study will demonstrate the importance of using stringent controls when using inducible knockdown systems.
Minor Comments • Line 103/104: the hinge domain and ATPase head domain are mentioned, please annotate these in Figure 1A.
__Response: __We have annotated the hinge and ATPase domains.
Figure 1D: the kDa scale is missing from the H3 WB. __Response: __We have added a kDa scale.
What is the scale indicated by different colors in Fig. 2A? __Response: __The different colors (blue, coral, and green) only represent the 12, 24, and 36hpi time points, respectively. This color scheme is used throughout the manuscript. If the reviewer is referring to the color gradation within each circos plot, this does not indicate a specific scale. The maximum y-axis value for all circos plots is 24, as indicated in the figure legend.
Line 189: it would also be interesting how many peaks are "conserved" between the different time points studied, so not only to compare the gene lists of closest genes but also the intersecting peaks and then the closest genes to the intersecting peaks. __Response: __We have added this information in Table 7 and in the manuscript starting on Line 203. Using the new dataset of consensus peaks between two replicates, there were 88 genes associated with an SMC3 peak across all three time points, most of which were close to a centromeric region.
What is the distribution of the peaks over diverse genetic elements, such as gene bodies, introns, convergent/ divergent/ tandem intergenic regions? In yeast, cohesion is particularly enriched in convergent intergenic regions, so it would be interesting to see how this behaves in P. falciparum. __Response: __We would have liked to define how many peaks were in intergenic versus genic regions of the genome, but the dataset of “genes” from PlasmoDB includes UTRs. Thus, we would need a better annotation of the genome to perform this analysis. Regardless, we calculated the average SMC3 peak enrichment (shared between both replicates) in intergenic regions between convergent and divergent genes (see what is now Supp. Fig. 3B and Table 6). As we now state in the manuscript on line 198, we see a slight enrichment in regions between convergent genes at all time points, but the differences were not significant.
Line 130 intra-chromosomal interactions (word missing) __Response: __Thank you for pointing this out. We have corrected this.
Contrary to Figure 1D, the WB in Figure 3A indicates strong expression of Smc3 in rings. Please comment on this discrepancy. __Response: __While extracts from all time points were run on the same western blot in Fig. 1D and thus developed for the same amount of time, this was not the case for Fig. 3A. In Fig. 3A, the samples were run on different blots and exposed for different times, so while we can compare SMC3-HA levels between – and + glucosamine for each time point, the levels at 12 hpi cannot be quantitatively compared to those at 24 or 36hpi.
What time point after glucosamine addition represents the WB in Fig. 3A? __Response: __The “12hpi” parasites were sampled approximately 108 hours post glucosamine addition and the “24hpi” parasites sampled approximately 120 hours post glucosamine addition. Basically, the parasites were treated with glucosamine for 96 hours, synchronized, and then harvested 12 and 24 hours later.
Line 233 / Suppl Figure 3: Isn't it a bit concerning that the untreated control parasites at 24 hpi statistically corresponded to 18-19 hpi? And to what timepoint did the wt parasites correspond? __Response: __We are not concerned by this, and we have included the WT parasites in what is now Supp. Fig. 5B for better comparison. In the analysis presented in Supp. Fig. 5B, regardless of glucosamine presence or absence, the differences among replicates and strains at 12 and 24hpi are, in our opinion, minimal, amounting to one or two hours of the 48-hour IDC. In our extensive experience with RNA-seq across the P. falciparum lDC, this synchronization is extremely tight. As we describe on line 430 of the Materials and Methods, there is a ±3 hour window in our synchronization method, meaning that parasites harvested at 24hpi could be anywhere from 21-27hpi. In addition, the dataset that was used for comparison (from Bozdech et al., 2003) was generated in 2003 in a different laboratory using different strains with microarray. While comparing more recent RNA-seq data to this classic study has become well-established practice and is useful for comparing transcriptional age between replicates and strains, it is inevitable that the calculated “hpi” from (Bozdech et al., 2003) will differ somewhat from our experimental “hpi”. We have indeed seen this small discrepancy in predicted transcriptional age in several of our RNA-seq datasets (unrelated to this study) from trophozoites harvested at 24hpi.
Line 264: "whether naturally or via knockdown" - the meaning of this sentence is not entirely clear __Response: __We are referring to depletion of SMC3 at promoters, either naturally (i.e. lack of binding at the promoter at 36hpi that is not the result of SMC3 knockdown, as we show in Fig. 4B) or via SMC3 knockdown, which is not natural but artificial.
Figure 4 Legend: A, B, C etc. are mixed up. Response: Thank you for pointing this out. We have corrected this.
Figure 4D: the differences seem to be marginally significant, even not significant at all (q=0.8) for gap45 at 12hpi. __Response: __If one defines a significance cutoff of q = 0.05 (as is common practice in differential expression analyses), then the differences are significant. For a small minority of invasion genes (such as gap45), we do observe significance at either 12 hpi or 24 hpi, but not both. Thus, we have removed the word “significant” from the descriptions of each dataset in Tab 1 of what is now Table 18. however, we do not believe that this rules out a role for SMC3 at such a gene during interphase. What is now Table 18 offers a longer list of invasion-related genes, most of which are more “significantly” affected than rap2 and gap45.
Figure 4F shows FACS data using SYBR green as a DNA stain. The authors could exploit this data to look at the relative DNA content per cell as a measure of parasite stage, since more mature parasites will have more DNA (mean fluorescence intensity). How did the corresponding parasite cultures look in Giemsa smears? Response: We have repeated our growth curve analysis several times and with more clones and have concluded that there is not a significant growth phenotype in SMC3 KD parasites (see what is now Supp. Fig. 4B). We have added images of Giemsa-stained parasites in untreated and glucosamine-treated parasites at all time points to demonstrate a lack of an obvious morphological phenotype in SMC3 KD parasites (see what is now Supp. Fig. 5A).
Are RNAseq replicates biological replicates from independent experiments or technical replicates? __Response: __RNA-seq replicates are technical replicates from the same parasite clone.
Why does the number of genes analysed for differential gene expression differ between the comparisons? __Response: __If the reviewer is referring to the discrepancy between the total number of genes for different time points [for example, between what is now Table 9 (12hpi) and Table 10 (24hpi)], this is because in the RNA-seq/differential expression analysis, there have to be reads mapping back to a gene in order for that gene to be included in the analysis. Thus, if a gene is not transcribed at a given time point in the treated or untreated samples, it will not be included in the analysis. Gene transcription fluctuates significantly over the course of the IDC, so different time points will have different total numbers of transcribed genes.
Line 372: Do you mean the proteins or the genes? AP2-I has a peak at 24 hpi and 36 hpi, and its interacting AP2 factor Pf3D7_0613800 at all time points. __Response: __We are referring to the genes. With the new ChIP-seq analysis including the second replicate, there are no consensus SMC3 peaks associated with ap2-I, bdp1, or Pf3D7_0613800 (see what is now Table 7).
Line 480: no aldolase was shown. __Response: __We have removed this sentence.
Line 838: include GO analysis in methods __Response: __We have added this.
Reviewer #2 (Significance (Required)): The paper addresses the function of the cohesin complex in gene regulation of malaria parasites for the first time. Due to the conserved nature of the complex, the data may be interesting for a broad audience of scientists interested in nuclear biology and cell division/ gene regulation.
Reviewer #3
(Evidence, reproducibility and clarity (Required)):
*Summary:
In the presented manuscript by Rosa et al. the authors investigate the longstanding question of how P. falciparum achieves the tight transcriptional regulation of its genome despite the apparent absence of many canonical sequence specific transcription factor families found in other eukaryotes. To do this the authors investigate the role of the spatial organization of the genome in this context, by performing a functional characterization of the conserved cohesion subunit SMC3 and its putative role in transcriptional regulation in P. falciparum. Using Cas9 mediated genome editing the authors generated a SMC3-3xHA-glmS parasite line, which they subsequently used to show expression of the protein over the asexual replication cycle by western blot and IFA analysis. In addition, using co-IP experiments coupled with mass spectrometry they identified the additional components of the cohesion complex also found in other eukaryotes as interaction partners of SMC3 in the parasite, thereby confirming the presence of the conserved cohesin complex in P. falciparum. By using a combination of ChIP-seq and RNA-seq experiments in SMC3 knockdown parasites the authors furthermore show that a reduction of SMC3 resulted in the up-regulation of a specific set of genes involved in invasion and egress in the early stages of the asexual replication cycle and that this up-regulation in transcription is correlated with a loss of SMC3 enrichment at these genes. From these observations the authors conclude, that SMC3 binds dynamically to a subset of genes and works as a transcriptional repressor, ensuring the timely expression of the bound genes. Overall, the presented data is intriguing, of high quality and very well presented. However, there are some points, which should be addressed to bolster the conclusions drawn by the authors.
Major points: I was not able to find the deposited datasets in the BioProject database under the given accession number. This should obviously be addressed and would have been nice to be able to have a look at these datasets also for the review process. *__Response: __We apologize for not giving the reviewers access. As the manuscript has been made available as a pre-print (which includes data accession numbers), but has not yet been published, we have not activated access to the data on the database.
*SMC3-ChIP-seq experiments:
"168 were bound by SMC3 across all three time points (Fig. 2D). However, most SMC3-bound genes showed a dynamic binding pattern, with a peak present at only one or two time points (Fig. 2B,D)."
Here it would be interesting to actually have more than one replicate of each of these ChIP-seq time points. This could provide a better idea of how "dynamic" these binding patterns actually are. Furthermore, I was missing a list of these 168 genes, which are constantly bound by SMC3. Anything special about those? What actually happens to this subset of genes in the SMC3 knockdown parasites? Do they show similar transcriptional changes?*
__Response: __We have now performed a second biological replicate of the SMC3-3HA ChIP-seq with a different clone at all time points. We compared this data to that from the original clone and found significant overlap of the peaks called (see what is now Table 4 and Supp. Fig. 3A). We generated a stringent list of peaks that were shared between both clones at each time point and repeated all downstream analyses (see what are now Tables 5-8). We found that our conclusions were largely unchanged. Text describing these experiments and analyses have been added throughout the results section. Using the new dataset of consensus peaks between two replicates, there were 88 genes associated with an SMC3 peak across all three time points (see what is now Table 7). The genes that are associated with an SMC3 peak at all time points are, in general, those closest to centromeric/pericentromeric regions and show no obvious functional relationship to each other. Out of these 88 genes, four are significantly up- or downregulated at 12 hpi and 26 are significantly up- or downregulated at 24 hpi. The most significantly downregulated of these genes in both datasets is smc3 itself.
*SMC3-knockdown experiments:
In Sup. Fig. 1 there is a double band in the HA-western blot in the 2nd cycle -GlcN. sample. This second band is absent in all other HA-western shown. Have the authors any idea where that second band comes from?*
__Response: __As the reviewer says, we do not see this second band in most of our western blots. It is possible that it is just a small amount of degradation in the lysate.
In Figure 3A, the WB data shown is slightly contrasting the RNA-seq quantification (3B). The knock-down on protein level seems to be stronger in the 12 hpi samples here than in the 24 hpi samples. Although the band for HA-SMC3 is stronger at the 12 hpi TP there's no band visible in the + GlcN. sample. There's however in the 24 hpi samples. Could the authors comment on this?
Response: __With regard to the discrepancy of the knockdown and protein versus RNA level, it is quite common for transcript levels to not agree with protein levels. This is why we always confirm a transcriptional knockdown with western blot analysis using appropriate loading controls. We are not sure why there is a more dramatic knockdown of SMC3 at 12hpi than at 24hpi, as these samples came from the same culture, but were simply harvested 12 hours apart. __
*"Comparison of our RNA-seq data to the time course transcriptomics data from (Painter et al., 2018) revealed that SMC3 depletion at 12 hpi caused downregulation of genes that normally reach their peak expression in the trophozoite stage (18-30 hpi), with the majority of upregulated genes normally reaching their peak expression in the schizont and very early ring stages (40-2 hpi) (Fig. 3E). At 24 hpi, a similar trend is observed, with most downregulated genes normally peaking in expression in trophozoite stage (24-32 hpi) and the majority of upregulated genes peaking in expression at very early ring stage (2 hpi) (Fig. 3F)."
I'm not fully convinced by these presented results/conclusions. This dataset would greatly benefit from the inclusion of additional later time points.*
__Response: __To be clear, we are most interested in the transcriptional role of SMC3 during interphase, where results are not confounded by its potential role in mitosis. However, we did collect a 36hpi time point in the SMC3-3HA-glmS and WT strain, with and without glucosamine. We have added this last time point and the WT data from the other two time points to the manuscript (see Tables 11-13). Unfortunately, and for reasons unknown, the WT replicates treated with glucosamine showed a significantly advanced “transcriptional age” compared to the other replicates at 36hpi (see what is now Supp. Fig. 5B). Thus, we did not feel comfortable performing the RNA-seq analysis as we did with the other two time points (i.e. subtracting up- and down-regulated genes from the WT control from the SMC3-3HA-glmS data sets). We have added this information to the results section (Lines 256 and 261). As the WT parasites treated with glucosamine were approximately 8 hours in advance of the untreated WT parasites for the 36hpi time point, any up- and down-regulated genes might have been due to differences in the cell cycle rather than due to glucosamine treatment. The glmS system of inducible knockdown is widely used in P. falciparum; however, to our knowledge, no lab has investigated whether glucosamine treatment affects transcription in wildtype cells over the course of the IDC. Thus, for accurate phenotypic characterization of any protein with this system with regard to transcriptomics, we thought it was important to provide an RNA-seq dataset to define the cohort of genes affected by glucosamine treatment in WT parasites. We hope that our study will demonstrate the importance of using stringent controls when using inducible knockdown systems.
We performed differential expression analysis of the SMC3-3HA-glmS parasites with and without glucosamine at 36hpi (we have added this data in Table 11). Again, significantly up- and down-regulated genes were not filtered using the WT dataset. With this analysis, we see only three genes from the list of invasion-related genes (Hu et al., 2010) that are up-regulated, but none of them have a significant q-value (Tab 5 of Table 18). Thus, depletion of SMC3 in late stage parasites does not lead to up-regulation of the same genes that are upregulated at 12 and 24hpi. We have added this information to the text (Line 277).
*The presented upregulation of the egress and invasion related genes is hard to pinpoint to be a direct effect of transcriptional changes due to the SMC3 knockdown. While there's a slight upregulation of these genes they still seem to be regulated in their normal overall transcriptional program as shown in Figure 4D/E. *
__Response: __We provide evidence of a direct effect of SMC3 binding by combining differential expression analysis performed upon SMC3 knockdown with SMC3 ChIP-seq at corresponding time points. As we show in what is now Fig. 4C and D, promoter accessibility of these egress/invasion genes correlates with their transcriptional activity. However, SMC3 binding to the promoters of these same genes shows inverse correlation with their transcriptional activity (what is now Fig. 4B and D). While we believe that SMC3 does contribute to the repression of these genes at specific time points during the cell cycle, it is highly likely that SMC3 is just one protein of many that regulates these genes. Moreover, and especially since we do not see a growth phenotype in the SMC3 KD, it is possible that another protein or even SMC1 could compensate for loss of SMC3 at these promoter regions. We now state these possibilities on lines 346 383 of the Discussion.
*So the changes could in theory also be explained by the differences in cell cycle progression which are present between +/- GlcN. cultures (Sup. Fig. 3). The presented normalization to the microarray data is a well-established practice to correct for this but, as presented seems to have its limitation with these parasite lines (line 233, glucosamine treated parasites harvested at 24 hpi correspond statistically to approximately 18-19 hpi (Supp. Fig. 3).) *
__Response: __In the analysis presented in what is now Supp. Fig. 5B, regardless of glucosamine presence or absence, the differences among replicates and strains at 12 and 24hpi are, in our opinion, minimal, amounting to one or two hours of the 48-hour IDC. In our extensive experience with RNA-seq across the P. falciparum lDC, this synchronization is extremely tight. As we describe on lines 416-421 of the Materials and Methods, there is a ±3 hour window in our synchronization method, meaning that parasites harvested at 24hpi could be anywhere from 21-27hpi. In addition, the dataset that was used for comparison (from Bozdech et al., 2003) was generated in 2003 in a different laboratory using different strains with microarray. While comparing more recent RNA-seq data to this classic study has become well-established practice and is useful for comparing transcriptional age between replicates and strains, it is inevitable that the calculated “hpi” from (Bozdech et al., 2003) will differ somewhat from our experimental “hpi”. We have indeed seen this small discrepancy in predicted transcriptional age in several of our RNA-seq datasets from trophozoites harvested at 24hpi.
By including additional later time points, one could actually follow the expression profiles over the whole cycle and elucidate if there's an actual transcriptional up-regulation of the genes, or if the + GlcN. parasites show a faster cell cycle progression, with a shifted peak expression timing compared to the - GlcN. parasites. __Response: __We did collect a 36hpi time point in the SMC3-3HA-glmS and WT strain, with and without glucosamine. We have added this last time point and the WT data from the other two time points to what is now Supp. Fig. 5. Unfortunately, and for reasons unknown, the WT replicates treated with glucosamine showed a significantly advanced “transcriptional age” compared to the other replicates at 36hpi. Thus, we did not feel comfortable performing the RNA-seq analysis as we did with the other two time points (i.e. subtracting up- and down-regulated genes from the WT control from the SMC3-3HA-glmS data sets). We have added this information to the results section (Lines 256 and 261). As the WT parasites treated with glucosamine were approximately 8 hours in advance of the untreated WT parasites for the 36hpi time point, any up- and down-regulated genes might have been due to differences in the cell cycle rather than due to glucosamine treatment. The glmS system of inducible knockdown is widely used in P. falciparum; however, to our knowledge, no lab has investigated whether glucosamine treatment affects transcription in wildtype cells over the course of the IDC. Thus, for accurate phenotypic characterization of any protein with this system with regard to transcriptomics, we thought it was important to provide an RNA-seq dataset to define the cohort of genes affected by glucosamine treatment in WT parasites. We hope that our study will demonstrate the importance of using stringent controls when using inducible knockdown systems.
*"These genes show SMC3 enrichment at their promoter regions at 12 and 24 hpi, but not at 36 hpi (Fig. 4C), and depletion of SMC3 resulted in upregulation at both 12 and 24 hpi (Fig. 4D). Comparison of the SMC3 ChIP-seq data with published Assay for Transposase-Accessible Chromatin using sequencing (ATAC-seq) data (Toenhake et al., 2018) and mRNA dynamics data (Painter et al., 2018) from similar time points in the IDC revealed that SMC3 binding at the promoter regions of these genes inversely correlates with chromatin accessibility (Fig. 4C) and their mRNA levels (Fig. 4E), which both peak in schizont stages. These data are consistent with a role of SMC3 in repressing this gene subset until their appropriate time of expression in the IDC."
The presented correlations certainly make an intriguing point towards the authors conclusion that SMC3/cohesin depletion from the promoter regions of the genes results in a de-repression of these genes and their transcriptional activation. However, the SMC3 knockdown is not complete and only up to 69% as presented on RNA level in these parasites. Therefore a control experiment which needs to be done is to actually show the loss of SMC3 from the presented activated example genes in the knockdown parasites. This could easily be done by ChIP-qPCR or even ChIP-seq, to get a global picture of the actual changes in SMC3 occupation in the knockdown parasites in correlation with changes in transcript levels. *__Response: __While SMC3-3HA-glmS knockdown is not complete at the RNA level, it is fairly robust at the protein level, especially at 12hpi (Fig. 3A).
*"These data suggest that SMC3 knockdown results in a faster progression through the cell cycle or a higher rate of egress/invasion."
The authors could greatly strengthen their conclusions by investigating this thoroughly. Pinpointing the observed phenotype to an actual increase in invasion or egress would add to the authors main conclusion that the loss of SMC3 de-regulates the timing of gene expression for these invasion related genes thereby increasing their transcript levels and thus leading to a higher rate of egress/invasion. To determine cell cycle progression simple comparisons between DNA content using a flow cytometer at timepoints together with visual inspection of Giemsa stained blood smears would give a ggod indication towards changes in cell cycle progression. In addition invasion/egress assays by counting newly invaded rings per schizont could reveal, if there are changes in the rate of egress/invasion upon SMC3 knockdown.*
Response: __We have repeated our growth curve analysis several times and with more clones and have concluded that there is not a significant growth phenotype in SMC3 KD parasites (see what is now Supp. Fig. 4B). We have added images of Giemsa-stained parasites from the knockdown time course we performed to what is now Supp. Fig. 5A. We see no obvious differences in cell morphology caused by glucosamine treatment in the WT or SMC3-3HA-glmS parasites. As we discuss on line 327, very little intact cohesin complex seems to be required for normal growth and mitosis in S. cerevisiae and D. melanogaster, which is probably why we do not see an obvious growth or morphological phenotype. We believe that SMC3 is probably only a part of a complex controlling transcription of these invasion or egress genes. Thus, the up-regulation of these genes upon SMC3 KD might not be enough to lead to a significant growth or invasion phenotype. __
*Minor points:
In the MM section on the Cas9 experiments it says dCas9 where it should be Cas9 (line 425)*
__Response: __Thank you for pointing this out. We have corrected this.
It would be great to add which HP1 antibody was used in which dilution in the IFAs to the MM section. __Response: __We have added this information to the Materials and Methods section.
In Figure 4C for the gap45 gene there's is some green peak floating around which should not be there. __Response: __Thank you for pointing this out, we have corrected it.
*Reviewer #3 (Significance (Required)):
Significance: The manuscript investigates a very timely topic by trying to uncover new molecular mechanisms of transcriptional regulation in P. falciparum. Investigating the role of the cohesin complex/SMC3 in this context provides valuable new insights to the field. While the first part with the description of the SMC3 cell line and the co-IP experiments largely confirms published data on the existence and composition of the cohesin complex in Plasmodium and its enrichment at the centromeres, the second part is especially intriguing since it investigates the molecular function of SMC3 in more detail. The results pointing to a role of SMC3/cohesin as a transcriptional repressor are of great interest to the field and will open up new concepts for future investigation.*
*Audience: The work is particularly interesting for people interested in gene regulatory processes in Plasmodium and Apicomplexan parasites in general. At the same time it also nicely points towards shared principles of gene regulation to other eukaryotes in relation to the spatial organization of the genome making the work also very interesting for a broader audience with interest in the general principles of gene regulatory processes in eukaryotic organisms.
Expertise: P. falciparum epignetics and chromatin biology / gene regulation / Cas9 gene editing*
CROSS-CONSULTATION COMMENTS
All reviewers agree that the paper addresses an important topic and provides convincing evidence for enrichment of the cohesin component Smc3 at P. falciparum centromers. In contrast, evidence for a function of Smc3 as a transcriptional repressor of genes in the first part of the parasite life cycle is less well supported. All reviewers agree that the statistical significance of the ChIP experiments needs to be impoved by including biological replicates. In addition, the phenotype of the conditional knock-down should be analysed in more detail by clarifying whether faster cell cycle progression or higher invasion rate are responsible for the observed growth adavantage. Inclusion of transcriptional data from a later time point in addition to the presented data for 12 hpi and 24 hpi was also requested by all reviewers. Finally, several inconsistencies require clarification.
Note: This rebuttal was posted by the corresponding author to Review Commons. Content has not been altered except for formatting.
Learn more at Review Commons
Response to reviewers' comments
We thank the reviewers for their constructive evaluation of our manuscript. In the following point-by-point response, we explain how we will implement the suggested modifications.
Reviewer #1 (Evidence, reproducibility and clarity (Required)):
Summary:
The formation of meiotic double-stranded DNA breaks is the starting point of meiotic recombination. DNA breaks are made by the topoisomerase-like SPO11, which interacts with a number of regulatory factors including REC114, MEI4 and IHO1. Despite the key role this process has in the continuation, and genetic variation, or eukaryotic life, there is very little known about how this process is regulated. Laroussi et al make use of biochemical, biophysical and structural biological approaches to extensively characterise the REC114-MEI4-IHO1 complex.
This is an outstanding biochemical paper. The experiments are well planned and beautifully executed. The protein purifications used are very clean, and the figures well presented. Importantly Laroussi et. al describe, and carefully characterise through point mutational analysis, the direct physical interaction between IHO1 and REC114-MEI4. This is an interaction that has, at least in yeast, previously been suggested to be driven by liquid-liquid separation. The careful and convincing work presented here represents an important paradigm-shift for the field.
I am fully supportive of publication of this excellent and important study.
We thank the reviewer for his/her positive comments, appreciation of the importance of our study and suggested modifications.
Major comments:
Point 1:
My only major concern is regarding Figure 4, and specifically the AF2 model of the coiled-coil tetramer of IHO1. Given the ease with which MSAs of coiled-coils can become "contaminated" with non-orthologous sequences, I would urge some caution with this model. This is especially since the yeast ortholog of IHO1, Mer2, has been previously reported to be an anti-parallel tetramer (albeit, not very well supported by the data). The authors have several choices here. 1) They could simply reduce the visibility of the IHO1 tetramer model, and indicate caution in the parallel tetramer model. 2) They could consider using a structure prediction algorithm that doesn't use an MSA (e.g. ESMFold). 3) They could try to obtain experimental evidence for a parallel coiled-coil tetramer, e.g. through EM, SAXS or FRET approaches. I would like to make it crystal clear, however, that I would be *very* supportive of approach 1) or 2). An experimental approach is *not* necessary.
Assuming the authors don't take a wet-lab approach, this shouldn't take more than a couple of weeks.
This is a very good suggestion. We are aware of the previously reported anti-parallel architecture of the yeast IHO1 ortholog Mer2 (Claeys Bouuaert et al., Nature 2021). It should be noted, that in the recent preprint, posted by the Claeys Bouuaert lab (BioRxiv, https://doi.org/10.1101/2022.12.16.520760), a high confidence model of yeast Mer2 (and for human) parallel tetrameric coliled-coil is presented, apparently consistent with their previous XL-MS results (Claeys Bouuaert et al., Nature 2021).
To clarify this issue we will follow the suggestions of Reviewer 1 and 2.
Minor comments:
Point 2:
The observation that REC114 and MEI4 can also form a 4:2 complex is very interesting and potentially important. Did the authors also try to model this higher order complex in AF2?
Yes, we did this with the hope that we could identify residues whose mutation could limit the fast exchange between the 2:1 and 4:2 states. Unfortunately, no convincing additional contacts are modelled by AlphaFold. This PAE plot will be included as a supplementary figure.
Point 3:
Similarly to above, what does the prediction of the full-length REC114:MEI4 2:1 complex look like? Presumably the predicted interaction regions align well with experimental data, but it would be interesting to see (and easy to run).
The AlphaFold modelling of the FL REC114:MEI4 (2:1) complex will be included as supplementary figure. It is consistent with the model comprising only the interacting regions. No additional convincing contacts are predicted.
Point 4:
Did the authors carry out SEC-MALS experiments on any IHO1 fragment lacking the coiled-coil domain? It was previously reported for Mer2 that the C-terminal region can form dimers, for example (OPTIONAL).
We can easily do that. We have the N- and C- terminal regions lacking the coiled-coil expressed as MBP fusions and they will be analysed by SEC-MALLS.
Point 5:
Given that full-length REC114 is used for the IHO1 interaction studies, do the authors have any data as to the stoichiometry of the REC114FL-MEI41-127 complex? (OPTIONAL)
We have repeatedly analysed the REC114-MEI4-IHO1 complex sample by SEC-MALLS and native mass spectrometry, but in both cases the sample is too complex to be interpreted. This is like due to the fast exchange between REC114-MEI4 2:1 and 4:2 complexes and low binding affinity of IHO1 for REC114.
Point 6:
Did the authors try AF2 modelling of the REC114-IHO1 interaction using orthologs from other species?
Yes, but not extensively. We will repeat this modelling again.
**Referees cross commenting**
I will add cross-comments to the comments of Reviewer #2
Firstly, the comments made by Reviewer #2 are technically correct. Firstly, reviewer #2 points out that the oligomerization states that the authors report could, in part, be artifactual the based on the his-tag purification method. This is indeed correct. However, given that none of the oligomerization states reported are per se unusual, given what is already known (including pre-prints from the Keeney and Claeys Bouuaert laboratories), I think the authors could forego this step.
Secondly, the use of an experimental structural method, such as SAXS, would certainly add value to the paper. Also Reviewer #2 is correct in pointing out the availability of the ESRF beamlines to the authors. However, while SAXS is a useful method, I personally consider the use of mutants to validate the interactions, an even stronger piece of evidence that the AlphaFold2 interactions are correct. I must disagree somewhat with Reviewer #2 with their argument that SAXS would validate the fold. Certainly if one of the AF2 predicted structures is radically wrong, then SAXS would produce scattering data, and a subsequent distance distribution plot that is incompatible with the AF2 model. However, a partly correct AF2 model, of roughly the right shape, might still fit into a SAXS envelope.
Reviewer #2 shares my concern on the parallel coiled-coil of IHO1, and their suggested solution is very elegant.
In my view, due to the time constraints imposed by the partially competing work from the Keeney and Claeys Bouuaert laboratories (recently on biorxiv). I would support the authors if they chose the quickest route to publication.
Reviewer #1 (Significance (Required)):
General assessment: The strengths of the paper are as follows:
1) Quality of experiments - The proteins used have been properly purified (SEC) and properly handled. The experiments are carefully carried out and controlled.
2) Detail - The authors carry out the considerable effort of characterising protein interactions. through separation-of-function mutants. This adds to the quality of the paper, and renders the AF2 models as convincing as experimentally determined structures
3) Conceptual advances - The most important conceptual advance is the direct binding of the N-term of IHO1 to REC114. That this is the same region as used by both TOPOVIBL and ANKRD31 points to a complex regulation.
4) Integrity - the authors have taken great care not to "oversell" the results. The data are presented, and analysed, without hyperbole.
Limitations - The only limitation of the paper is the lack of in vivo experiments to test their findings. However given the time and effort required, and the pressing need to publish this exciting study, this is not a problem.
Advance: The paper provides advances from a number of directions, both conceptual and mechanistic. Mechanistically the description of the REC114-MEI14 complex is important, and in particular the observation that it can also form a higher order 4:2 structure. Likewise, while IHO1 was inferred to be a tetramer (based on work on Mer2) this was never proven formally. Most importantly, is the physical linkage between IHO1 and REC114, and that this is an interaction that is incompatible with TOPOVIBL and ANKRD31.
Audience:
Given the central role of meiotic recombination in eukaryotic life, any studies that shed additional light on the regulation of meiosis are suitable for a broad audience. However, this subject paper will be more specifically of interest to the meiosis community. The elegant methodology will also be of interest to structural biologists and protein biochemists.
Reviewer #2 (Evidence, reproducibility and clarity (Required)):
This manuscript addresses the structure of the REC114-MEI4-IHO1 complex, which controls the essential process of programmed DSB induction by SPO11/TOPOVIBL in meiosis.
The manuscript carefully combines biochemistry, biophysics and modelling in an integrative manner to report the architecture of the full REC114-MEI4-IHO1 complex that is not itself amenable to direct structure elucidation such as by X-ray crystallography. These are important results that will be of interest to the recombination and meiosis fields. The data are generally convincing and interpretations appear correct, so the manuscript is certainly suitable for publication. I have included some suggestions below that I believe would strengthen the manuscript and enhance our confidence in the findings. Whilst the manuscript is publishable in its current format, I believe the suggestions given below would make it into a much stronger paper.
We thank the reviewer for his/her positive comments on our study and the suggestions below.
I have two general suggestions:
Point 1:
Analyses have been performed on fusion proteins (His, His-MBP etc). we have previously observed that bulky tags such as MBP can interfere with oligomeric state through steric hindrance, and that His-tags can mediated formation of larger oligomers, seemingly through coordination of metals leached from IMAC purification. This latter point has also been observed by others
https://www.sciencedirect.com/science/article/pii/S1047847722000946.
Where possible, I would repeat SEC-MALS experiments using untagged proteins, or at least following incubation with EDTA to mitigate the potential for His-mediated oligomerization.
We agree with this reviewer’s comment that expression tags can have unexpected impact of the protein behaviour.
The authors have relied upon mutagenesis to validate Alphafold2 models. Their results are convincing but only confirm that contacts involved in structures rather than the specific fold per se. Their finding would be greatly strengthen by collecting SEC-SAXS data and fitting models directly to the scattering data. This is extremely sensitive, so a close fit provides the best possible evidence of accuracy of the model. SAXS is affected by unstructured regions and tags, so would have to be performed using structural cores of untagged proteins rather than full-length constructs. Given the local availability of world-class SAXS beamlines at the ESRF, which is next door to the leading author's institute, it seems that the collection of SAXS data would be practical for them.
The usage of SAXS is discussed in the specific points below. We will attempt to do SEC-SAXS on the REC114-MEI4 complex. Due to instability of REC114226-254 without MBP, SAXS cannot be done. We will also do SAXS on the IHO1 tetramer.
My specific comments are below:
Point 2:
Figure 1d
The SEC-MALS shows multiple species, with 2:1 and 4:2 representing a minority of total species present. What are the larger oligomers? Could these be an artefactual consequence of the His-tags (as described above)?
This SEC-MALLS will be repeated without the His-tag on MEI4.
Point 3:
Figure 1f,g
The AUC changes over concentration and pH are intriguing - have they tried MALS in these conditions? This would be much more informative as it would reveal the range of species present. Low concentrations could be analysed by peak position even if scattering is insufficient to provide interpretable MW fits. I would advise doing this without his tag or adding EDTA (as described above).
We will perform this experiment as suggested.
Point 4:
Figure 2
I would like to see the models validated by SAXS using minimum core untagged constructs. This could be sued to test the validity of the 2:1 model directly, and to model the 4:2 complex by multiphase analysis and/or docking together of 2:1 complexes.
The hydrophobic LALALAII region of MEI4 is interesting and the mutagenesis data do agree with the model. However, it is important to point out that any decent model would place this hydrophobic helix in the core of the complex, and so would be disrupted by mutagenesis. Hence, the mutagenesis results confirm that the hydrophobic helix is critical for the interaction, but does not confirm that the specific alphafold model is more valid than any other model in which the helix is similarly in a core position.
We will attempt to perform the SEC-SAXS measurements. The challenge here will be obtaining a sample that is monodisperse in solution being required for SAXS. We showed the fast exchange between the 2:1 and 4:2 oligomeric state. The AUC data indicates that the sample has a predominantly 2:1 stoichiometry at 0.2 mg/ml, pH 4.5 and 500mM NaCl. Given the small size of the complex, the signal at 0.2 mg/ml is likely to be noisy.
Point 5:
Figure 3
This would also benefit from SAXS validation of the structural core. The mutagenesis here provides convincing evidence in favour of the structure as specific hydrophobics ether disrupt or have no effect, exactly as predicted. Hence, their data strongly support the dimer model. As this provides the framework for the 2:1 complex, these data make me far more confident of the previous 2:1 model in figure 2. I am wondering whether it would be better to present these data first such that the reader can see the 2:1 model being built upon these strong foundations?
We agree with this suggestion and will present the REC114 dimerization data before the REC114-MEI4 complex. However, REC114226-254 is not stable without the MBP tag so is not suitable for SAXS analysis.
Point 6:
Figure 4
The MALS data convincingly show formation of a tetramer. How do we know that it is parallel? The truncation supports this but coiled-coils do sometimes form alternative structures when truncated (e.g. anti-parallel can become parallel when sequence is removed), and alphafold seems to have a tendency of predicting parallel coiled-coils even when the true structure of anti-parallel (informal observation by us and others). A simple test would be to make a tethered dimer of 110-240, with a short flexible linker between two copies of the same sequence - if parallel it should form a tetramer of double the length, if anti-parallel it should form a dimer of the same length - determinable by MALS (and SAXS).
To address this point we will perform this experiment as suggested by Reviewer 2. We will produce a tethered dimer of IHO1 110-240, connected by a short linker and determine its MW by MALS (and possibly SAXS). We also performed ESMfold modelling (Reviewer 1, Point 1), resulting in the same model. As the IHO1 tetramer is likely suitable for SAXS analysis, we will also perform SAXS on it.
Point 7:
Figures 5/6
The interaction is clear albeit low affinity (but within the biologically interesting range). It would be nice to obtain MALS (using superose 6) data showing the stoichiometry of the complex - are the data too noisy to be interpretable owing to dissociation? The alpahfold model and mutagenesis data strongly support the conclusion that the IHO1 N-term binds to the PH domain, as presented.
We have repeatedly analysed the REC114-MEI4-IHO1 complex sample by SEC-MALLS (on Superose 6) and native mass spectrometry, but in both cases the sample is too complex to be interpreted. This is likely due to the fast exchange between REC114-MEI4 2:1 and 4:2 complexes and low binding affinity of IHO1 for REC114.
**Referees cross commenting**
Just to clarify a couple of points regarding consultation comments from reviewer 1:
The suggestion regarding tags was mostly directed to the cases in which MALS data are noisy, with multiple oligomeric species (such as figure 1d). In these cases, i wondered whether the large MW species may be artefactual and could be resolved by removal of the tags. In cases where oligomers agree with those reported by other labs, I agree that there's no need to explore these further.
In terms of SAXS, I agree that fitting models into envelopes will not distinguish between similar folds. However, fitting models directly to raw scattering data is extremely sensitive and I have never seen good fits with low chi2 values for incorrect models (even when very similar in overall shape to the correct structure).
Reviewer #2 (Significance (Required)):
The manuscript carefully combines biochemistry, biophysics and modelling in an integrative manner to report the architecture of the full REC114-MEI4-IHO1 complex that is not itself amenable to direct structure elucidation such as by X-ray crystallography. These are important results that will be of interest to the recombination and meiosis fields. The data are generally convincing and interpretations appear correct, so the manuscript is certainly suitable for publication. I have included some suggestions below that I believe would strengthen the manuscript and enhance our confidence in the findings. Whilst the manuscript is publishable in its current format, I believe the suggestions given below would make it into a much stronger paper.
Reviewer #3 (Evidence, reproducibility and clarity (Required)):
Laroussi et al used Alphafold models to predict the assembly of REC114-MEI4-IHO1 complex, and verified the structure using different biochemical experiments. Both Alphafold predictions and experiment data are convincing for the overall protein complex assembly. Importantly, they identified a motif on IHO1 that share the same binding site on REC114 with TOPOVIBL and ANKRD31, suggesting that REC114 acts as a regulatory base coordinating different binding partners during meiosis progression. Overall, I believe this is a nice biochemistry paper, but lacks insights into the biology (I believe those in vivo data is beyond the scope of this paper), at least more discussions are needed in terms of these findings.
We thank the reviewer for the supportive comments on our manuscript and its evaluation. We agree with the reviewer, that including in vivo data, that might provide further biological insights, would be useful. However, there is currently no good cellular model for meiotic recombination in mouse and thus our structure-based mutations will need to be tested in transgenic mice. Such data will take a long time to obtain and would delay the publication these in-vitro results that already provide novel insight into the REC114-MEI4-IHO1 complex architecture. We will, nevertheless, as suggested, strengthen the discussion of the biological implications of our findings.
Some minor points:
Point 1:
Any data showing MEI4 forms a dimer on its own?
As mentioned in the manuscript, full-length MEI4 is difficult to produce in bacteria or insect cells. Thus, we worked with the N-terminal fragment which in absence of REC114 is nor very stable. We will perform SEC-MALLS to assess its oligomeric state. Alphafold suggests dimeric arrangement of MEI4, but only with low confidence.
Point 2:
In Fig2 and Sup Fig4, HisMBP-MEI4, you see more MBP than the fusion protein, especially more obvious in the mutants. What's your explanation?
The N-terminus of MEI4 is well produced when co-expressed with REC114. For the pull-down experiments in Figure 2 we expressed it as His-MBP fusion in absence of REC114. In this situation, there is a degradation between MBP and MEI4. We find this very often for proteins that not very stable, which is the case of MEI4 without REC114. This is the best way we could produce at least some MEI4 in absence of REC114. The MBP protein could probably be removed by other chromatography techniques, but we think that for the purpose of the pull-down its presence is not interfering with the REC114-MEI4 binding.
Point 3:
TOPOVIBL and ANKRD31, I am curious if you have looked at the conserved residues on these motifs.
We show a strong conservation of the IHO1 among vertebrates (Fig. 6c). We will further analyse the sequence conservation in more distant species.
Point 4:
Reference needed when stating that IHO1 was not interacting with REC114 in previous biochemical assay in the discussion part.
This will be corrected
Point 5:
Also, have you run AlphaFold that gives multiple models? Sometimes, with short motifs, 1 or 2 models of several models give good confidence for the interaction.
Using in-house Alphafold installation producing 25 models did not reveal better models.
Reviewer #3 (Significance (Required)):
While most of the interactions between REC114 and MEI4 or IHO1 were established with Y2H or other biochemical assays before. This paper used the AlphaFold, and finally verified the findings with biochemical experiments, which helps to establish the exact motifs/residues involved in the interaction. For example, the MEI4-REC114 interfaces are novel, more interestingly, the IHO1 shares the same interface with ANKRD31 and TOPOVIBL. Thus, this finding of REC114-MEI4-IHO1 complex assembly would be interesting to people with different working areas. I would like to see more studies on the coordination IHO1 with ANKRD31 or TOPOVIBL in the future.
Note: This preprint has been reviewed by subject experts for Review Commons. Content has not been altered except for formatting.
Learn more at Review Commons
This manuscript addresses the structure of the REC114-MEI4-IHO1 complex, which controls the essential process of programmed DSB induction by SPO11/TOPOVIBL in meiosis.
The manuscript carefully combines biochemistry, biophysics and modelling in an integrative manner to report the architecture of the full REC114-MEI4-IHO1 complex that is not itself amenable to direct structure elucidation such as by X-ray crystallography. These are important results that will be of interest to the recombination and meiosis fields. The data are generally convincing and interpretations appear correct, so the manuscript is certainly suitable for publication. I have included some suggestions below that I believe would strengthen the manuscript and enhance our confidence in the findings. Whilst the manuscript is publishable in its current format, I believe the suggestions given below would make it into a much stronger paper.
I have two general suggestions:
My specific comments are below:
Figure 1d The SEC-MALS shows multiple species, with 2:1 and 4:2 representing a minority of total species present. What are the larger oligomers? Could these be an artefactual consequence of the His-tags (as described above)?
Figure 1f,g The AUC changes over concentration and pH are intriguing - have they tried MALS in these conditions? This would be much more informative as it would reveal the range of species present. Low concentrations could be analysed by peak position even if scattering is insufficient to provide interpretable MW fits. I would advise doing this without his tag or adding EDTA (as described above).
Figure 2 I would like to see the models validated by SAXS using minimum core untagged constructs. This could be sued to test the validity of the 2:1 model directly, and to model the 4:2 complex by multiphase analysis and/or docking together of 2:1 complexes. The hydrophobic LALALAII region of MEI4 is interesting and the mutagenesis data do agree with the model. However, it is important to point out that any decent model would place this hydrophobic helix in the core of the complex, and so would be disrupted by mutagenesis. Hence, the mutagenesis results confirm that the hydrophobic helix is critical for the interaction, but does not confirm that the specific alphafold model is more valid than any other model in which the helix is similarly in a core position.
Figure 3 This would also benefit from SAXS validation of the structural core. The mutagenesis here provides convincing evidence in favour of the structure as specific hydrophobics ether disrupt or have no effect, exactly as predicted. Hence, their data strongly support the dimer model. As this provides the framework for the 2:1 complex, these data make me far more confident of the previous 2:1 model in figure 2. I am wondering whether it would be better to present these data first such that the reader can see the 2:1 model being built upon these strong foundations?
Figure 4 The MALS data convincingly show formation of a tetramer. How do we know that it is parallel? The truncation supports this but coiled-coils do sometimes form alternative structures when truncated (e.g. anti-parallel can become parallel when sequence is removed), and alphafold seems to have a tendency of predicting parallel coiled-coils even when the true structure of anti-parallel (informal observation by us and others). A simple test would be to make a tethered dimer of 110-240, with a short flexible linker between two copies of the same sequence - if parallel it should form a tetramer of double the length, if anti-parallel it should form a dimer of the same length - determinable by MALS (and SAXS).
Figures 5/6 The interaction is clear albeit low affinity (but within the biologically interesting range). It would be nice to obtain MALS (using superose 6) data showing the stoichiometry of the complex - are the data too noisy to be interpretable owing to dissociation? The alpahfold model and mutagenesis data strongly support the conclusion that the IHO1 N-term binds to the PH domain, as presented.
Referees cross commenting
Just to clarify a couple of points regarding consultation comments from reviewer 1:
The suggestion regarding tags was mostly directed to the cases in which MALS data are noisy, with multiple oligomeric species (such as figure 1d). In these cases, i wondered whether the large MW species may be artefactual and could be resolved by removal of the tags. In cases where oligomers agree with those reported by other labs, I agree that there's no need to explore these further.
In terms of SAXS, I agree that fitting models into envelopes will not distinguish between similar folds. However, fitting models directly to raw scattering data is extremely sensitive and I have never seen good fits with low chi2 values for incorrect models (even when very similar in overall shape to the correct structure).
The manuscript carefully combines biochemistry, biophysics and modelling in an integrative manner to report the architecture of the full REC114-MEI4-IHO1 complex that is not itself amenable to direct structure elucidation such as by X-ray crystallography. These are important results that will be of interest to the recombination and meiosis fields. The data are generally convincing and interpretations appear correct, so the manuscript is certainly suitable for publication. I have included some suggestions below that I believe would strengthen the manuscript and enhance our confidence in the findings. Whilst the manuscript is publishable in its current format, I believe the suggestions given below would make it into a much stronger paper.
Note: This preprint has been reviewed by subject experts for Review Commons. Content has not been altered except for formatting.
Learn more at Review Commons
Summary:
The formation of meiotic double-stranded DNA breaks is the starting point of meiotic recombination. DNA breaks are made by the topoisomerase-like SPO11, which interacts with a number of regulatory factors including REC114, MEI4 and IHO1. Despite the key role this process has in the continuation, and genetic variation, or eukaryotic life, there is very little known about how this process is regulated. Laroussi et al make use of biochemical, biophysical and structural biological approaches to extensively characterise the REC114-MEI4-IHO1 complex.
This is an outstanding biochemical paper. The experiments are well planned and beautifully executed. The protein purifications used are very clean, and the figures well presented. Importantly Laroussi et. al describe, and carefully characterise through point mutational analysis, the direct physical interaction between IHO1 and REC114-MEI4. This is an interaction that has, at least in yeast, previously been suggested to be driven by liquid-liquid separation. The careful and convincing work presented here represents an important paradigm-shift for the field.
I am fully supportive of publication of this excellent and important study.
Major comments:
My only major concern is regarding Figure 4, and specifically the AF2 model of the coiled-coil tetramer of IHO1. Given the ease with which MSAs of coiled-coils can become "contaminated" with non-orthologous sequences, I would urge some caution with this model. This is especially since the yeast ortholog of IHO1, Mer2, has been previously reported to be an anti-parallel tetramer (albeit, not very well supported by the data). The authors have several choices here. 1) They could simply reduce the visibility of the IHO1 tetramer model, and indicate caution in the parallel tetramer model. 2) They could consider using a structure prediction algorithm that doesn't use an MSA (e.g. ESMFold). 3) They could try to obtain experimental evidence for a parallel coiled-coil tetramer, e.g. through EM, SAXS or FRET approaches. I would like to make it crystal clear, however, that I would be very supportive of approach 1) or 2). An experimental approach is not necessary.
Assuming the authors don't take a wet-lab approach, this shouldn't take more than a couple of weeks.
Minor comments:
Referees cross commenting
I will add cross-comments to the comments of Reviewer #2
Firstly, the comments made by Reviewer #2 are technically correct. Firstly, reviewer #2 points out that the oligomerization states that the authors report could, in part, be artifactual the based on the his-tag purification method. This is indeed correct. However, given that none of the oligomerization states reported are per se unusual, given what is already known (including pre-prints from the Keeney and Claeys Bouuaert laboratories), I think the authors could forego this step.
Secondly, the use of an experimental structural method, such as SAXS, would certainly add value to the paper. Also Reviewer #2 is correct in pointing out the availability of the ESRF beamlines to the authors. However, while SAXS is a useful method, I personally consider the use of mutants to validate the interactions, an even stronger piece of evidence that the AlphaFold2 interactions are correct. I must disagree somewhat with Reviewer #2 with their argument that SAXS would validate the fold. Certainly if one of the AF2 predicted structures is radically wrong, then SAXS would produce scattering data, and a subsequent distance distribution plot that is incompatible with the AF2 model. However, a partly correct AF2 model, of roughly the right shape, might still fit into a SAXS envelope.
Reviewer #2 shares my concern on the parallel coiled-coil of IHO1, and their suggested solution is very elegant.
In my view, due to the time constraints imposed by the partially competing work from the the Keeney and Claeys Bouuaert laboratories (recently on biorxiv). I would support the authors if they chose the quickest route to publication.
General assessment: The strengths of the paper are as follows:
Limitations - The only limitation of the paper is the lack of in vivo experiments to test their findings. However given the time and effort required, and the pressing need to publish this exciting study, this is not a problem.
Advance: The paper provides advances from a number of directions, both conceptual and mechanistic. Mechanistically the description of the REC114-MEI14 complex is important, and in particular the observation that it can also form a higher order 4:2 structure. Likewise, while IHO1 was inferred to be a tetramer (based on work on Mer2) this was never proven formally. Most importantly, is the physical linkage between IHO1 and REC114, and that this is an interaction that is incompatible with TOPOVIBL and ANKRD31.
Audience: Given the central role of meiotic recombination in eukaryotic life, any studies that shed additional light on the regulation of meiosis are suitable for a broad audience. However, this subject paper will be more specifically of interest to the meiosis community. The elegant methodology will also be of interest to structural biologists and protein biochemists.
ve in cultivating students’ power to produce and reflect, rather than simply consume, as a fundamental way of being in
hello
hello
Reviewer #1 (Public Review):
The expression and localization of Foxc2 strongly suggest that its role is mainly confined to As undifferentiated spermatogonia (uSPGs). Lineage tracing demonstrated that all germ cells were derived from the FOXC2+ uSPGs. Specific ablation of the FOXC2+ uSPGs led to the depletion of all uSPG populations. Full spermatogenesis can be achieved through the transplantation of Foxc2+ uSPGs. Male germ cell-specific ablation of Foxc2 caused Sertoli-only testes in mice. CUT&Tag sequencing revealed that FOXC2 regulates the factors that inhibit the mitotic cell cycle, consistent with its potential role in maintaining a quiescent state in As spermatogonia. These data made the authors conclude that the FOXC2+ uSPG may be the true SSCs, essential for maintaining spermatogenesis. The conclusion is largely supported by the data presented, but two concerns should be addressed: 1) terminology used is confusing: primitive SSCs, primitive uSPGs, transit amplifying SSCs... 2) the GFP+ cells used for germ cell transplantation should be better controlled using THY1+ cells.
Reviewer #2 (Public Review):
The authors found FOXC2 is mainly expressed in As of mouse undifferentiated spermatogonia (uSPG). About 60% of As uSPG were FOXC2+ MKI67-, indicating that FOXC2 uSPG were quiescent. Similar spermatogonia (ZBTB16+ FOXC2+ MKI67-) were also found in human testis.
The lineage tracing experiment using Foxc2CRE/+;R26T/Gf/f mice demonstrated that all germ cells were derived from the FOXC2+ uSPG. Furthermore, specific ablation of the FOXC2+ uSPGs using Foxc2Cre/+;R26DTA/+ mice resulted in the depletion of all uSPG population. In the regenerative condition created by busulfan injection, all FOXC2+ uSPG survived and began to proliferate at around 30 days after busulfan injection. The survived FOXC2+ uSPGs generated all germ cells eventually. To examine the role of FOXC2 in the adult testis, spermatogenesis of Foxc2f/-;Ddx4-cre mice was analyzed. From a 2-month-old, the degenerative seminiferous tubules were increased and became Sertoli cell-only seminiferous tubules, indicating FOXC2 is required to maintain normal spermatogenesis in adult testes. To get insight into the role of FOXC2 in the uSPG, CUT&Tag sequencing was performed in sorted FOXC2+ uSPG from Foxc2CRE/+;R26T/Gf/f mice 3 days after TAM diet feeding. The results showed some unique biological processes, including negative regulation of the mitotic cell cycle, were enriched, suggesting the FOXC2 maintains a quiescent state in spermatogonia.
Lineage tracing experiments using transgenic mice of the TAM-inducing system was well-designed and demonstrated interesting results. Based on all data presented, the authors concluded that the FOXC2+ uSPG are primitive SSCs, an indispensable subpopulation to maintain adult spermatogenesis.
The conclusion of the mouse study is mostly supported by the data presented, but to accept some of the authors' claims needs additional information and explanation. Several terminologies define cell populations used in the paper may mislead readers.
1) "primitive spermatogonial stem cell (SSC)" is confusing. SSCs are considered the most immature subpopulation of uSPG. Thus, primitive uSPGs are likely SSCs. The naming, primitive SSCs, and transit-amplifying SSCs (Fig. 7K) are weird. In general, the transit-amplifying cell is progenitor, not stem cell. In human and even mouse, there are several models for the classification of uSPG and SSCs, such as reserved stem cells and active stem cells. The area is highly controversial. The authors' definition of stem cells and progenitor cells should be clarified rigorously and should compare to existing models.
2) scRNA seq data analysis and an image of FOXC2+ ZBTB16+ MKI67- cells by fluorescent immunohistochemistry are not sufficient to conclude that they are human primitive SSCs as described in the Abstract. The identity of human SSCs is controversial. Although Adark spermatogonia are a candidate population of human SSCs, the molecular profile of the Adark spermatogonia seems to be heterogeneous. None of the molecular profiles was defined by a specific cell cycle phase. Thus, more rigorous analysis is required to demonstrate the identity of FOXC2+ ZBTB16+ MKI67- cells and Adark spermatogonia.
3) FACS-sorted GFP+ cells and MACS-THY1 cells were used for functional transplantation assay to evaluate SSC activity. In general, the purity of MACS is significantly lower than that of FACS. Therefore, FACS-sorted THY1 cells must be used for the comparative analysis. As uSPGs in adult testes express THY1, the percentage of GFP+ cells in THY1+ cells determined by flow cytometry is important information to support the transplantation data.
4) The lineage tracing experiments of FOXC2+-SSCs in Foxc2CRE/+;R26T/Gf/f showed ~95% of spermatogenic cells and 100% progeny were derived from the FOXC2+ (GFP+) spermatogonia (Fig. 2I, J) at month 4 post-TAM induction, although FOXC2+ uSPG were quiescent and a very small subpopulation (~ 60% of As, ~0.03% in all cells). This means that 40% of As spermatogonia and most of Apr/Aal spermatogonia, which were FOXC2 negative, did not contribute to spermatogenesis at all eventually. This is a striking result. There is a possibility that FOXC2CRE expresses more widely in the uSPG population although immunohistochemistry could not detect them.
5) The CUT&Tag_FOXC2 analysis on the FACS-sorted FOXC2+ showed functional enrichment in biological processes such as DNA repair and mitotic cell cycle regulation (Fig.7D). The cells sorted were induced Cre recombinase expression by TAM diet and cut the tdTomato cassette out. DNA repair process and negative regulation of the mitotic cell cycle could be induced by the Cre/lox recombination process. The cells analyzed were not FOXC2+ uSPG in a normal physiological state.
6) Wei et al (Stem Cells Dev 27, 624-636) have published that FOXC2 is expressed predominately in As and Apr spermatogonia and requires self-renewal of mouse SSCs; however, the authors did not mention this study in Introduction, but referred shortly this at the end of Discussion. Their finding should be referred to and evaluated in advance in the Introduction.
live ones we tag, says Bill. Take them to the shelter. Nurse them backto health. Release them in the wild.
Description of King's "live Indians," Rudy and Bill take the ones that are still living to "safely store away" (The Inconvenient Indian)
28 K. J. Travers, C. K. Patil, L. Wodicka, D. J. Lockhart, J. S. Weissman, P. Walter, Functional and genomic analyses reveal an essential coordination between the unfolded protein response and ER-associated degradation. Cell 101, 249–258 (2000).
It was identified above as previous studies, so why was this article so important?
Tag as "References"
Although ER-phagy was initially described in 2005 (10), it was not until the first ER-phagy receptors were identified that the process was thought to be selective (11, 12).
News - why was this such an important discovery about describing the ER-phagy? Tag to "NewsAndPolicy"
Reviewer #1 (Public Review):
Pyrin domains (PYD) in inflammasome proteins oligomerize into filamentous assemblies and mediate inflammasome formation. Mammalian pyrin-only-proteins (POPs) exert inhibitory effects on inflammasome as they mimic the pyrin domains while lacking the effector domain. In this manuscript, Mazanek and colleagues combined computational prediction with cellular and in vitro experiments to investigate the mechanism and target specificity for three POPs, POP1, POP2, and POP3, in inflammasome activation.
The authors first modeled the structures of complex formed by POPs with inflammasomal PYDs, including ASCPYD, AIM2PYD, IFI16PYD, NLRP6PYD, and NLRP3PYD, then calculated their Rosetta interface energies(∆Gs). By comparing the ∆Gs of inflammasomal PYD(∆GPYD•PYD) with inflammasomal PYD/POPs complex (∆GPOP•PYD), they defined favorable and unfavorable interaction surfaces (∆∆G = ∆GPYD•PYD- ∆GPOP•PYD ). Their initial computational model indicates POP1 may have the strongest inhibitory effect on ASC, as it exhibits the most favorable interfaces. But the experiment results showed otherwise, with POP2 and POP3, which contain both favorable and unfavorable interfaces, exhibiting stronger inhibitory effects. They then revised the model and proposed the combination of favorable (recognition) and unfavorable interfaces (repulsion) is necessary for POPs to interfere with the assembly of inflammasome PYDs, which was further tested by other inflammasomal PYDs.
This is a timely study that enhanced our current understanding of inflammasome regulation by POPs, it is also interesting as it combined the newest computational prediction method with biological experimental validation. The explanations on 1.) sequence homology may not dictate the target specificity of POPs, and 2.) excess POPs are required to inhibit the polymerization of inflammasome assembly, are well supported; however, some questions about the target specificity need to be addressed/clarified:
1. The authors showed MBP tag affected the oligomerization of POPs, while the POPs used in Figures 2A, 3A, and 4A contain a GFP tag. It should be considered GFP may affect the property of POPs, such may change the inhibitory effect of POPs on ASC filament formation.
2. The authors take the reduction of PYD filamentation as an indication of inhibition, but it was not clear how they ruled out the possibility that POP1 co-assembles into ASCPYD filaments and inhibits inflammasome formation by repressing the recruitment of Caspase-1, as it lacks CARD the effector domain. Especially the model predicted comparable energy between POP1 and ASC, which could indicate POP1 co-assembled into ASC filament.
3. Further computational analysis should be performed to evaluate the interpretation of Rosetta interface energies. Could the "combination of favorable and unfavorable interfaces" theory apply to other PYD/PYD interactions and CARD/CARD interactions?
Author Response
Reviewer #1 (Public Review):
This study combines the biologging method with captive experiments and DNA metabarcoding to detail the hunting behavior of a bat species in the wild. Specifically, it shows that bats use two foraging strategies (echolocating small prey in the air and capturing large ground prey with passive listening) with different success rates and energetic gains. This result highlights that a species believed to be a specialist forager can, in fact, have mixed strategies depending on the condition and environment.
The detailed foraging behavior they show for such a small animal is impressive. A combination of several different methods, including captive experiments, is a major strength of the paper. I especially like the mastication sound analysis, although I don't know how new it is. However, I have a major concern about the presentation of this study. The manuscript is apparently written for a bat community, and it's hard to understand the significance of the results in the field of animal ecology.
Thank you for your helpful feedback. We agree that the framing of the ms was too narrow for the audience of eLife, and we have framed the introduction for a broader audience of animal ecology.
Reviewer #2 (Public Review):
This paper has huge potential for influencing the way we think about bats as foragers. But, I think that it can be improved.
Specifically, there is no clearly articulated hypothesis underlying the work. Second, there should be specific testable predictions arising from the hypothesis. This change, while relatively minor, will vastly improve the focus of the work, and hence its impact on the reader.
Thank you highlighting the need for clear hypotheses. We have added three specific hypotheses to guide the reader (line: 54-56) in the introduction. We have also reformatted the discussion section to address each hypothesis in succession using subheadings with clear take home messages (line: 223-224, 271-272, 293, 318)
Reviewer #3 (Public Review):
The study addresses a tough question in the study of wild bats: what and where they eat, using both acoustic bio-logging and DNA metabarcoding. As a result, it was found that greater mouse-eared bats made more frequent attack attempts against passively gleaning prey with lower predation success but higher prey profitability than aerial hawking with higher predation success. This is a precious study that reveals essential new insights into the foraging strategies of wild bats, whose foraging behavior has been challenging to measure. On the other hand, the detection of capture attempts, success or failure of predation, and whether it was by passively gleaning prey or aerial hawking were determined from the audio and triaxial accelerometer analysis, and all results of this study depend entirely on the veracity of this analysis. Also, although two different weights and a tag nearly 15% of its weight were used, it is essential for the results of this data that there be no effect on foraging behavior due to tag attachment. Since this is an excellent study design using state-of-the-art methods and very valuable results, readers should carefully consider the supplemental data as well.
Thank you for the kind words. We agree that it is critically important that the two foraging strategies are un-affected by tagging effects. In the revised ms, we have added tag weights, tag types and change in body weight during instrumentation as explanatory factors in out statistical models and found no effect of the tag weight on our results. We have also addressed this important issue in the method section (model 1: line 520-539, model 3: 568-590).
Author Response
Reviewer #1 (Public Review):
In this work, the authors investigate a means of cell communication through physical connections they call membrane tubules (similar or identical to the previously reported nanotubes, which they reference extensively). They show that Cas9 transfer between cells is facilitated by these structures rather than exosomes. A novel contribution is that this transfer is dependent on the pair of particular cell types and that the protein syncytin is required to establish a complete syncytial connection, which they show are open ended using electron microscopy.
The data is convincing because of the multiple readouts for transfer and the ultrastructural verification of the connection. The results support their conclusions. The implications are obvious, since it represents an avenue of cellular communication and modifications. It would be exciting if they could show this occurring in vivo, such as in tissue. The implication of this would be that neighboring cells in a tissue could be entrained over time through transfer of material.
Thank the reviewer for his/her comments and suggestion. It’s possible that the thick tubular connections found in this study also exist in vivo. A previous study reported that TNT-like structures were found in mouse or human primary tumor cells (PMID: 34494703; PMID: 34795441). Our transfer assays could be adopted to evaluate such transfer in primary cultures and in vivo. We anticipate this for future work.
Reviewer #2 (Public Review):
There is a lot of interest in how cells transfer materials (proteins, RNA, organelles) by extracellular vesicles (EV) and tunneling nanotubes (TNTs). Here, Zhang and Schekman developed quantitative assays, based on two different reporters, to measure EV and direct contact-dependent mediated transfer. The first assay is based on transfer of Cas9, which then edits a luciferase gene, whose enzymatic activity is then measured. The second assay is based on a split-GFP system. The experiments on EV trafficking convincingly show that purified exosomes, or any other diffusible agent, are unable to transfer functional Cas9 (either EV-tethered or untethered) and induce significant luciferase activity in acceptor cells. The authors suggest a plausible model by which Cas9 (with the gRNA?) gets "stuck" in such vesicles and is thus unable to enter the nucleus to edit the gene.
To test alternative pathways of transfer, e.g. by direct cell-cell contact, the authors co-cultured donor and acceptor cells and detect significant luciferase activity. The split GFP assay also showed successful transfer. The authors further characterize this process by biochemical, genetic and imaging approaches. They conclude that a small percentage of cells in the population produce open-ended membrane tubules (which are wider and distinct from TNTs) that can transfer material between cells. This process depends on actin polymerization but not endocytosis or trogocytosis. The process also seems to depend on endogenously expressed Syncytin proteins - fusogens which could be responsible for the membrane fusion leading to the open ends of the tubules.
The paper provides additional solid evidence to what is already known about the inefficiency of EV-mediated protein transport. Importantly, it provides an interesting new mechanism for contact-dependent transport of cellular material and assigns valuable new information about the possible function of Syncytins. However, the evidence that the proteins and vesicles transfer through the tubules is incomplete and a few more experiments are required. In addition, certain inconsistencies within the paper and with previous literature need to be resolved. Finally, some parts of the text, methods and the figures require re-writing or additional information for clarity.
Major comments
1) In Figure 1F, the authors compare the function of exosome-transported SBP-Cas9-GFP vs. transient transfection of SBP-Cas9-GFP. It is not clear if the cells in the transiently transfected culture also express the myc-str-CD63 and were treated with biotin. It is important to determine if CD63-tethering itself affects Cas9 function.
Thank the reviewer for his comments and suggestions. We now show in Figure 1- figure supplement 1D that CD63-tethering itself does not affect Cas9 function.
2) The authors do not rule out that TNTs are a mode of transfer in any of their experiments. Their actin polymerization inhibition experiments are also in-line with a TNT role in transfer. This possibility is not discussed in the discussion section.
Yes, the results in this study do not rule out a role for TNTs in the transfer. At present, we are not aware of conditions that would functionally distinguish transfer mediated by TNTs and thick tubules. We have now included this in the Discussion section.
3) Issues with the Split GFP assay:
a) On page 4, line 176, the authors claim that "A mixture of cells before co-culture should not exhibit a GFP signal". However, this result is not presented.
The results of mixture experiment are included in Figure 2-figure supplement 1D, E.
b) The authors show in Figure 2C and F that in MBA/HEK co-culture or only HEK293T co-culture, there are dual-labeled, CFP-mCherry, cells. First - what is the % of this sub-population? Second, the authors dismiss this population as cell adhesion (Page 5, line 192) - but in the methods section they claim they gated for single particles (page 17, line 642), supposedly excluding such events. There is a simple way to resolve this - sort these dual labeled cells and visualize under the microscope. Finally - why do the authors think that the GFP halves can transfer but not the mature CFP or mCherry?
The plot in the Figure 2C and F are displayed in an all-cell mode, not in singlet mode. The percentage of dual-labeled CFP-mCherry in singlet was 0-0.2%. Thus, most of the signal was from doublet, or cell adhesion. We did not claim that the mature CFP or mCherry cannot be transferred. We suggested that the GFP signal of split-GFP recombination may be a more accurate reflection of cytoplasmic transfer between cells. In contrast, mature CFP or mCherry may simply attach to the cell surface but not enter into the other cells.
c) In the Cas9 experiments - the authors detect an increase in Nluc activity similar in order of magnitude that that of transient transfection with the Cas9 plasmid - suggesting most acceptor cells now express Nluc. However, only 6% of the cells are GFP positive in the split-GFP assay. Can the authors explain why the rate is so low in the split-GFP assay? One possibility (related to item #2 above) is that the split-GFP is transferred by TNTs.
The Cas9-based Nluc activity assay is more sensitive as it measures an enzyme with a very high turnover number. The split-GFP assay requires a transfer of GFP fragments to produce intact GFP molecules where the signal is not amplified. We think this explains the dramatic increase in a signal once Cas9 is transferred. Our cell sorting results suggest that at least 6% of the receptor cells are transferred in the co-cultures. Of course, nothing in either analysis rules out a role for TNTs in this transfer.
4) The membrane tubules, the membrane fusion and the transfer process are not well characterized:
a) The suggested tubules are distinct from TNTs by diameter and (I presume, based on the images) that they are still attached to the surface - whereas TNTs are detached. However, how are these structures different from filopodia except that they (rarely) fuse?
We used TIRF microscopy and found that the thick tubules are not attached to the surface (not shown). Filopodia are much closer in diameter to TNTs (0.1-0.4 micron). The thick tubules we observe are much thicker (2-4 micron in diameter).
b) Figure 5E shows that the acceptor cells send out a tubule of its own to meet and fuse. Is this the case in all 8 open-ended tubules that were imaged? Is this structure absent in the closed-ended tubules (e.g. as seen in Figures 6 & 8)?
Around half of open-ended tubules appeared to emanate from acceptor cells. Likewise, for closed-ended tubules, for example, in Figure 6E where a recipient HEK293T cell projected a short tubule.
c) The authors suggest a model for transport of the proteins tethered to vesicles (via CD63 tethering). However, the data is incomplete.
i) They show only a single example of this type of transport, without quantification. How frequent is this event?
The transport of the proteins tethered to vesicles (via CD63 tethering) were found in all 8 open-ended tubules that we detected in this study.
ii) Furthermore, the labeling does not conclusively show that these are vesicles and not protein aggregates. Labeling of the vesicle - by dye or protein marker will be useful to determine if these are indeed vesicles, and which type.
In Figure 4B, the moving punctum in a tubular connection appears to contain SBP-Cas9-GFP, Streptavidin-CD63-mCherry, and the cell surface WGA conjugate that may have been internalized into a donor cell endosome, which indicates that the moving punctum is vesicle type. Nonetheless, in general we cannot distinguish the forms of Cas9 that are transferred and become localized to the nucleus of target cells and we make no claim other than to suggest this possibility that Cas9 may be transferred as an aggregate.
iii) The data from Figure 2 suggest (if I understand correctly) transfer of the CD63-tethered half-GFP, further strengthening the idea of vesicular transfer. However, the authors also show efficient transfer of untethered Cas9 protein (Figure 2A and other figures). Does this mean that free protein can diffuse through these tubules? The Cas9 has an NLS so the un-tethered versions should be concentrated in the nucleus of donor cells. How, then, do they transfer? The authors do not provide visual evidence for this and I think it is important they would.
Based on the results using the Cas9-based luciferase assay (His- or SBP-tagged Cas9) (Figure 2A) and split-GFP assay (free GFP1-10) (Figure 2G), we suggest that free protein could be transferred between cells. Our current imaging approach is not designed to quantify protein diffusion. However, we are able to detect from images that Cas9-GFP does not colocalize exclusively with CD63 or concentrate in the nucleus, but also appears in the cytoplasm. These data indicate that both vesicle association and free diffusion may mediate the transfer through tubules. We thank the referee for emphasizing this issue which we will consider for future work to distinguish the transfer types through tubules.
iv) In Figures 6 & 8, where transfer is diminished, there are still red granules in acceptors cells (representing CD63-mcherry). Does this mean that vesicles do transfer, just not those with Cas9-GFP? Is this background of the imaging? The latter case would suggest that the red granule moving from donor to acceptor cells in figure 4 could also be "background". This matter needs to be resolved.
There are a few red puncta in the acceptor cell in Figure 6B. Since the acceptor cell is close to and overlapped with other donor cells containing CD63-mCherry, the red signal may, as the reviewer suggests, be from donor cells and not as a result of transfer through tubular connections. However, donor-acceptor cultures of HEK293T where transfer is not observed, little CD63-mCherry signal, for example, in Figure 6a, was seen in acceptor cells, even during several hours of observation (Figure 6- figure supplement video). A minor red signal could arise from exosomes secreted by donor cells that are internalized by acceptor cells. Images of single-culture receptor cells were added in Figure 4- figure supplement 1.
For Figure 8, we used MDA-MB-231 syncytin-2 knock-down cells containing Fluc:Nluc:mCherry as the receptor cell, thus in these experiments the red signal most likely represents mCherry expressed in the acceptor cells.
In Figure 4, we observed moving punctum in a tubular connection which contained co-localized green, red, and purple signals, corresponding to SBP-Cas9-GFP, streptavidin-CD63-mCherry, and the WGA conjugate, respectively. The video of punctum transport (Figure 4-figure supplement video) suggests that the red signal is not “background”.
5) Why do HEK293T do not transfer to HEK293T?
a) A major inexplicable result is that HEK293T express high levels of both Syncytin proteins (Figure 7 - supp figure 1A) yet ectopic expression of mouse Syncytin increases transfer (Figure 7E). Why would that be? In addition, Fig 3A shows high transfer rates to A549 cells - which express the least amount of Syncytin. The authors suggest in the discussion that Syncytin in HEK293T might not be functional without real evidence.
We cannot yet explain why the basal level of syncytin expressed in HEK293 cells is insufficient to promote open-ended tubular connections between these cells. It could be that the proteins are not well represented in a processed form at the cell surface. Nonetheless, ectopic expression of mouse syncytin-A in HEK293T produced some increased transfer but less than when syncytin-A is ectopically expressed in MDA-MB-231 cells (up to 4-fold vs. 30-fold change of Nluc/Fluc signal) (Figure 7E). Furthermore, we have added new results which show that apparent furin-processed forms of syncytin-A, -1 and -2 can be detected by cell surface biotinylation in transfected MDA-MB-231 cells (Figure 8-figure supplement 1D). All we demonstrate is that syncytin in the acceptor cell is required for fusion and we make no claim that it is the only protein or lipid at the cell surface in the acceptor cell required for fusion. Clearly, more work is essential to establish the complexity of this fusion reaction.
For A549 cells, syncytin-1 is highly expressed in A549 cells, thus it is possible that syncytin-1 in A549 plays crucial roles in the process.
b) In addition - previous publications (e.g. PMID: 35596004; 31735710) show that over expression of syncytin-1 or -2 in HEK293T cells causes massive cell-cell fusion. The authors do not provide images of the cells, to rule out cell-cell fusion in this particular case.
Overexpression of syncytin-1 or -2 in cells indeed causes massive cell-cell fusion, while overexpression of syncytin-A induced much less cell fusion than syncytin-1, or -2. We have now added new images shown in Figure 8-figure supplement 1A-C to document these observations. It may be that overexpressed human syncytins are better represented in a furin-processed form in both cell types. In contrast, we did not observe donor-acceptor cell fusion at basal levels of expression of syncytin in HEK293T and MDA-MB-231. For example, the Figure 4-figure supplement video shows that tubular structures were seen to form and break during the course of visualization with a tubule fusion event but no cell fusion to form heterokaryons.
Reviewer #3 (Public Review):
In this manuscript, Zhang and Schekman investigated the mechanisms underlying intercellular cargo transfer. It has been proposed that cargo transfer between cells could be mediated by exosomes, tunneling nanotubes or thicker tubules. To determine which process is efficient in delivering cargos, the authors developed two quantitative approaches to study cargo transfer between cells. Their reporter assays showed clearly that the transfer of Cas9/gRNA is mediated by cell-cell contact, but not by exosome internalization and fusion. They showed that actin polymerization is required for the intercellular transfer of Cas9/gRNA, the latter of which is observed in the projected membrane tubule connections. The authors visualized the fine structure of the tubular connections by electron microscopy and observed organelles and vesicles in the open-ended tubular structure. The formation of the open-ended tubule connections depends on a plasma membrane fusion process. Moreover, they found that the endogenous trophoblast fusogens, syncytins, are required for the formation of open-ended tubular connections, and that syncytin depletion significantly reduced cargo Cas9 protein transfer.
Overall, this is a very nice study providing much clarity on the modes of intercellular cargo transfer. Using two quantitative approaches, the authors demonstrated convincingly that exosomes do not mediate efficient transfer via endocytosis, but that the open-ended membrane tubular connections are required for efficient cargo transfer. Furthermore, the authors pinpointed syncytins as the plasma membrane fusogenic proteins involved in this process. Experiments were well designed and conducted, and the conclusions are mostly supported by the data. My specific comments are as follows.
1) The authors showed that knocking down actin (which isoform?) in both donor and acceptor cells blocked transfer, and more so in the acceptor cells perhaps due to the greater knockdown efficiency in these cells. However, Arp2/3 complex knockdown in donor cells, but not recipient cell, reduced Cas9 transfer. It would be good to clarify whether the latter result suggests that the recipient cells use other actin nucleators rather than Arp2/3 to promote actin polymerization in the cargo transfer process. Are formins involved in the formation of these tubular connections?
We thank the reviewer for his/her comments and suggestions. Beta-actin was knocked down in this study. We tried a formin inhibitor, SMIFH2 which resulted in a decrease the Cas9 transfer between cells (Figure 3F).
2) The authors provided convincing evidence to show that the tubular connections are involved in cargo transfer. Intriguingly, in Figure 4-figure supplement video (upper right), protein transfer appeared to occur along a broad cell-cell contact region instead of a single tubular connection. How often does the former scenario occur? Is it possible that transfer can happen as long as cells are contacting each other and making protrusions that can fuse with the target cell?
In the Figure 4-figure supplement video (upper right), it may be that several membrane tubes from several different donor cells contact at sites close to one another on the recipient cell resulting in the appearance a broad cell-cell contact. This was a rare observation. In our quantification, only 8 connections were open-ended in 120 cell-cell contact junctions. Once open-ended, or plasma membrane fused, cargo transfer is observed.
3) The requirement of MFSD2A in both donor (HEK293T) and recipient (MDA-MB-231) cells is consistent with a role for syncytin-1 or 2 in both types of cells. Since HEK293T cells contain both syncytins and MFSD2A but cargo transfer does not occur among these cells, does this suggest that syncytins and/or MFSD2A are only trafficked to the HEK293T cell membrane in the presence of MDA-MB-231 cells?
A proper answer to this question requires the visualization of syncytins and MFSD2A. The commercial syncytin antibodies were inadequate for immunofluorescence. In advance of the more detailed effort required to tag the genes for endogenous syncytin 1 and 2, we performed live cell imaging and surface biotin labeling of cells transiently transfected to express fluorescently-tagged forms of syncytin-1, -2 and -A. We now show that syncytin-A, -1, and -2 partially localize to the plasma membrane or the cell surface of MDA-MB-231 and at points of cell-cell contact. In fact, overexpression of codon-optimized human syncytin-1, and -2 induced dramatic HEK293T cell-cell fusion. However, at basal levels of syncytin expression, HEK293T could not form open-ended tubular connections, which may be because the basal level of syncytins are not well represented in a processed form at the cell surface or their activity is limited by unknown factors.
As an independent test of cell surface localization, we used surface biotinylation to show that a fraction of the syncytins can be labeled externally (Figure 8-figure supplement 1D). This fraction shows evidence of proteolytic processing consistent with furin cleavage whereas the overwhelming majority of transfected syncytins detected in a blot of lysates suggests that most remain in the unprocessed precursor form, consistent with the punctate and reticular fluorescence images (Figure 8-figure supplement 1A-C).
We used IF and GFP-tagged MFSD2A and found this protein partially localized to the plasma membrane of HEK293T cells (Figure 9E, F). Given the results reveal that cargos could be transferred among MDA-MB-231 cells (Figure 2G), syncytin and its receptor appear to function in transfer among these cells.
to break up methods into logical paragraphs internally.
Interesting to call them "paragraphs" :)
tag team members
add at the end. "by using @".
Let’s create a document called style.css (you can select a different name, but you need to keep the .css extension). In this file, we will write the code we had in our style tag:
Essayon cela sur notre fichier HTML en créant un 2e fichier style.css
<!DOCTYPE html> DOCTYPE Indicates that the markup language for your document content is HTML5. <html> html Represents the root of an HTML document. All other elements must be descendants of this element. It’s the first node in our DOM. It is mandatory to close the tag at the very end of the document by typing </html>. <head> head Defines an element that provides general information (metadata) about the document, including its title and links to its scripts and style sheets. Usually it contains: - <title> Defines the title of the document, there’s only one title element in the head element of an HTML. This title contains only text and it is shown in a browser’s title bar or on the page’s tab. - <meta> Used to define metadata. This includes information about styles, scripts and data to help browsers use and render the page. One of the most commons elements is the <meta charset="UTF-8"> in our example. This specifies the character encoding for the HTML document as UTF-8. <body> body is the element containing all the content of an HTML document. Every HTML component should be written between the opening and the closing body tag. As there can be only one entire body in a document, there can be only one <body> element.
Revenons plus en détail sur chacun des éléments OBLIGATOIREs d’une page web :
cf. code minimal dans le validateur ```html
<meta charset="utf-8"> <title></title>
coucou ```
and click Create.
We need to show comments in issues (after creation). It will be similar to Adding a comment but users should know this exists. e.g. 3. After creating an issue, you can open the issue again and tag team members you wish to collaborate with on this issue. <add screenshot>
Author Response
Reviewer #1 (Public Review):
1) The authors show that there are several classes of Snf1 targets (Fig. 3e), most notably some that are phosphorylated immediately after Snf1 activation by glucose (<5 min) and others that are only phosphorylated after 15 min. In a simple view, all direct Snf1 targets should be phosphorylated immediately after Snf1 activation. Is that the case? What is the overlap between the direct targets found using the OBIKA assay and the slow and fast responding in vivo targets? What about the phosphorylation motif, does it differ between the groups? These points are not discussed in the text except to point out that the direct Snf1 target Msn4 is among the slowly phosphorylated group.
This is a very good point and we have performed the suggested analysis, which resulted in an interesting finding that we describe now in the text as follows:
“Notably, of the 145 confirmed target sites, 81 (i.e. 72%) were significantly regulated after both 5 min and 15 min. Of the remaining 64 sites, 32 responded only after 5 min, while the other 32 responded only after 15 min. Some of the former residues are located within Snf1 itself, the -subunit of the Snf1 complex (i.e. Sip1), the Snf1-targeting kinase Sak1, or Mig1, while some of the latter are located within the known Snf1-interacting proteins such as Gln3, Msn4, and Reg1. These observations indicate that Snf1-dependent phosphorylation initiates, as expected, within the Snf1 complex and then progresses to other effectors. Interestingly, based on the residues that responded exclusively after 5 min, we retrieved a perfect Snf1 consensus motif (i.e. an arginine residue in the -3 position and a leucine residue in the +4 position; Supplementary figure 2A). The one retrieved for the residues that respond exclusively at 15 min, in contrast, significantly deviated from this consensus motif (Supplementary figure 2B). The slight temporal deferral of Snf1 target phosphorylation may therefore perhaps in part be explained by reduced substrate affinity due to consensus motif divergence.”
2) The data showing that Snf1-dependent phosphorylation of Pib2 plays a key role in triggering inhibition of TORC1 is convincing but is entirely dependent on a rescue of the TORC1 inhibition defect seen in cells where Snf1 is inhibited. That is, TORC1 is normally inactivated during glucose starvation; this does not occur when Snf1 is inhibited by 2nm-pp1 but does occur when Snf1 is inhibited in a strain carrying a phosphomimetic version of Pib2 (Pib2SESE). This indicates that Pib2 phosphorylation is sufficient to replace Snf1 signaling and inhibit TORC1 during glucose starvation. However, in a simple model, a phosphodead version of Pib2 (SASA) should have the opposite effect. That is TORC1 should remain active during glucose starvation in the Pib2SASA strain-but that is not the case (Fig. 4g). This point is not discussed in the paper; why do the authors think that TORC1 is inhibited normally in the SASA mutant inhibits TORC1 normally?
We fully agree with this statement and have highlighted and discussed this issue now in the last paragraph of the results section (where we think this fits best) as follows:
“In contrast, the separated and combined expression of Sch9S288A and Pib2S268A,S309A showed, as predicted, no significant effect in the same experiment. Unexpectedly, however, the latter combination did not result in transient reactivation of TORC1, like we observed in glucose-starved, Snf1-compromised cells. This may be explained if TORC1 reactivation would rely on specific biophysical properties of the non-phosphorylated serines within Sch9 and Pib2 that may not be mimicked by respective serine-to-alanine substitutions. Alternatively, Snf1 may employ additional parallel mechanisms (perhaps through phosphorylation of Tco89, Kog1, and/or other factors; see above) to prevent TORC1 reactivation even when Pib2 and Sch9 cannot be appropriately phosphorylated. While such models warrant future studies, our current data still suggest that Snf1-mediated phosphorylation of Pib2 and Sch9 may be both additive and together sufficient to appropriately maintain TORC1 inactive in glucose-starved cells”
Reviewer #2 (Public Review):
1) Because PIB2 is a major focus of the manuscript, I was surprised that it was not discussed in the introduction. I think it would be appropriate to discuss prior evidence linking this protein to TORC1.
We thank the reviewer for this suggestion. Pib2 and its role in TORC1 control is now described in the introduction.
2) The authors introduce mutations into PIB2 at two sites determined to be phosphorylated by SNF1, at S268 and S309. Somewhat confusing results are obtained, in that the PIB2 null and phosphomimic mutants (S268E and S309E) confer a similar TORC1 phenotype, compared to the S268A S308A mutant. These results require further explanation than simply that "TORC1 inactivation defect in SNF1-compromised cells is due to a defect in PIB1 phosphorylation". This is particularly intriguing given that the opposite results are observed with the SCH9 mutants, where the null and alanine mutants confer a similar phenotype compared to the S to E mutants.
The finding that both loss of Pib2 and expression of the phosphomimetic allele yield the same phenotype is indeed counterintuitive. Hence, we fully agree with the criticism put forward here. We believe that the underlying reason for our observation is based on the unique property of Pib2 in having both a C-terminal TORC1-activating domain (CAD) and an-N-terminal TORC1-inhibitory domain (NID). We have addressed this point briefly in the discussion ("Our current data favor a model according to which Snf1-mediated phosphorylation of the Kog1-binding domain in Pib2 weakens its affinity to Kog1 and thereby reduces the TORC1-activating influence of Pib2 that is mediated by the C-terminal TORC1-activating (CAD) domain via a mechanism that is still largely elusive"), but now also address this issue in the results section as suggested.
3) The authors conclude, based on the co-IP data in Figure 4H, that interactions between KOG1 and PIB2 are direct. However, it remains possible that interactions between these proteins are mediated by other components of TORC1 or within cells. This should be addressed.
Please note that the Kog1-Pib2 interaction has previously been demonstrated by different methods. Accordingly, Pib2 has not only been shown to interact with Kog1 (or TORC1) in co-IP studies in vivo (PMID: 30485160, PMID: 29698392), but also by co-IP studies in vitro (PMID: 29698392, PMID: 28483912, PMID: 34535752). In addition, the interaction between Kog1-Pib2 has also been dissected (down to defined domains) by classical two hybrid analyses (PMID: 28481201). All of these studies are cited now in the introduction where Pib2 is discussed.
4) The authors demonstrate convincingly that the PIB2 and SCH9 SNF1-specific phospho-site mutants have a detectable effect on TORC1, primarily by examining TORC1-dependent phosphorylation of SCH9. What is unclear is whether phosphorylation at these sites has a significant physiological impact on cells. It appears that the rapamycin hyper-sensitivity displayed in Figure 6E is the only data presented to address this question. It would be appropriate for the authors to comment further on the significance of SNF1-dependent phosphorylation of these two substrates.
To further address the physiological role of the Snf1-dependent phosphorylation of Sch9 and Pib2 combined, we newly assessed the growth rate of the strain that expresses the Sch9SE and Pib2SESE alleles combined. Accordingly, we found the snf1as pib2SESE sch9SE strain to exhibit a significantly higher doubling time than the snf1as strain on both low-nitrogen-containing media and standard synthetic complete media. This is now included in the text (results section).
Reviewer #3 (Public Review):
1) Conceptually, the manuscript shows that Snf1 activity is important for the acute inhibition of TORC1 during glucose starvation. However, this is mainly restricted to 10 and 15 minutes of glucose starvation. After 20 minutes, TORC1 is inhibited by some unknown mechanisms independent of Snf1 (Hughes Hallet et al). This raises concern regarding the physiological relevance of Snf1-mediated TORC1 inhibition during acute glucose stress. The authors show that this regulation is important for the survival of cells under TORC1 inhibition. How do the authors envision that the acute role of Snf1 plays an important long-term physiological relevance during rapamycin treatment? Providing more support for the physiological relevance of this regulation will make this study of interest to a broad readership.
Please see our response to point 4 of reviewer #2.
2) Another major concern of the manuscript is the inconsistencies between the various representative immunoblots and their quantifications. The effect of AMPK activity on TORC1 signaling under glucose starvation seems very subtle. A few specific concerns are mentioned below:
a) In figure 1A, the increase in TORC1 activity upon inhibition of analogue sensitive Snf1as by 2NM-PP1 is very marginal. Although quantification shows a significant increase, a representative western blot figure should be shown.
We have replaced the original immunoblots with more representative ones in Figure 1A.
b) Does deleting Snf1 itself have any effect on TORC1 activity? Lane 4 of figure 1A shows reduced activity compared to lane 1.
TORC1 activity is generally assessed as the ratio between phosphorylated Sch9 and total Sch9 (see also below under (e)). Accordingly, based on the quantification of 6 blots (we added two more experiments to address this point; Figure 1B), loss of Snf1 has no significant impact on TORC1 activity in exponentially growing cells, as we expected.
c) To show the effect of Snf1 on the repression of TORC1, the time-course experiments are run on two separate gels in figure 1C. Hence, it is difficult to compare the effect of Snf1 on unscheduled reactivation of TORC1 under glucose starvation.
Please note that the data of the two blots were cross-normalized to the sample from exponentially growing cells (labeled “Exp”; i.e. the same sample was loaded on the two blots) in order to compare and quantify the effects of Snf1.
d) In figure 1E, the effect of Reg1 deletion on TORC1 activity seems minor as both phospho- and total levels of Sch9 are reduced.
As correctly pointed out by this reviewer, we consistently found the total Sch9 levels to be lower in reg1Δ cells when compared to wild-type cells. To assess TORC1 activity, we therefore always determine the ratio between phosphorylated Sch9 and total Sch9, and the respective ratio is significantly different in reg1∆ cells when compared to wild-type cells. We speculate that the reduced Sch9 levels in this mutant are caused by the reduced growth rate (PMID: 22140226) and hence lower protein synthesis rate (to which translation of SCH9 mRNA may be specifically sensitive).
Since further mechanistic insights are based on these initial findings of figure 1, solidifying these observations is very important.
3) In figure S1, the analogue sensitive Snf1as shows significant reduction in its activity (reduced S79 phosphorylation of ACC1-GFP). This raises the concern of whether this genetic background is an ideal system to resolve the mechanism of TORC1 suppression.
The Snf1as allele is indeed hypomorphic, which we acknowledge appropriately in the text. We would like to point out however, that we took great care in each experiment to include the DMSO control that allowed us to unequivocally assign any observed effects to the specific drug-mediated inhibition of Snf1as. Importantly, we think that the hypomorphic nature of the Snf1as allele (which allows normal growth on non-fermentable carbon sources) represents a minor trade-off when compared to the advantages that this allele provides over the use of a snf1∆ strain, which exhibits a fundamentally reprogrammed transcriptome/proteome (PMID: 17981722). Accordingly, this allele allows the assessment of Snf1 inhibition on very short time scales while minimizing confounding large-scale proteome rearrangements that may indirectly affect the studies. Moreover, use of the Snf1as allele also allowed us to compare our results more directly with other phosphoproteome studies that used the same allele (PMID: 25005228, PMID: 28265048). Finally, please also note that our main conclusions (on Snf1-mediated control of TORC1) are corroborated by additional genetic data such as the ones in Figure 1A/E where we use snf1∆ and reg1∆ cells.
4) In figure 2, during glucose restimulation, there is increased retention of Snf1as-pThr210 in the presence of 2NM-PP1. This suggests that the upstream glucose sensing pathway as well as Snf1 might be more active than in DMSO-treated cells. This also raises concerns regarding the suitability of the genetic background for the study. Can authors comment on why this phosphorylation persists? Does the phosphoproteomic analysis give any hint for this phenotype?
This is a very good point. In fact, we forgot to mention in the text that the observed effect of the 2NM-PP1 treatment on Snf1-Thr210 phosphorylation has already been studied and mechanistically explained earlier (PMID: 23184934). Accordingly, the entry of the drug into the broader catalytic cleft of the Snf1as mutant causes the catalytic domain to be stabilized in a conformation, which prevents dephosphorylation of pThr210 by the dedicated Glc7-Reg1 phosphatase heterodimer. This can be observed each time when we compared 2NM-PP1- and DMSO-treated cells and probed for Snf1-Thr210 phosphorylation. This is, in fact, an independent control for proper 2NM-PP1 functioning. We have now added a sentence (including reference) that pinpoints this issue in the text.
5) In figure 4H, where authors claim reduced binding of Kog1 to Pib2SESE, levels of Kog1 in input are also reduced. Can authors provide further support using colocalization studies? Also, does Pib2SESE has any defect in forming Kog1 bodies?
We took great care to load equal amounts of IPed Pib2-myc variants and then normalized the co-IPed Kog1-HA on the IPed Pib2-myc variant levels. The Kog1-HA input levels vary a bit between the 4 experiments, but they are on average not significantly lower in Pib2SESE-myc-expressing cells when compared to WT cells. In addition, in our Co-IP experiments, the beads are saturated with Pib2-myc variants and Kog1-HA levels are generally not limiting. We therefore deem it fair to say that the Pib2SESE has a reduced affinity for Kog1. Based on our experience with other co-localization studies of membrane-bound proteins and protein complexes (e.g. TORC1 versus EGOC), we find it extremely difficult to quantify local interactions by fluorescence microscopy (unless they are close to all or nothing). In this case, where we have a partial defect in the interaction between Kog1 and Pib2SESE, we anticipate that such analyses will not allow us to draw additional conclusions.
Regarding the issue of Kog1/TORC1-body formation: all of our mutations in PIB2 and SCH9 were introduced (by CRISPR-Cas9) in the genome of our snf1as strain, which was used throughout this study. To analyze Kog1/TORC1-bodies, we have therefore first tried to C-terminally tag KOG1 with GFP in the genome of our strain background (similarly as was done in the original description of Kog1 bodies; PMID: 26439012). However, because all our attempts failed to create KOG1-GFP in our strain, we assumed that this construct may be lethal in our strain background. This is not completely unexpected, as it is known that the Kog1-GFP allele is hypomorphic and temperature sensitive (PMID: 19144819). In an alternative approach, we have therefore set out to study TORC1 body formation in our strains by using a GFP-TOR1 allele that can be integrated into the genome and that expresses functional TORC1 (PMID: 25046117). As we have described earlier, the respective GFP-Tor1 construct localized on vacuolar membranes and on foci that we previously have shown to correspond to signaling endosomes (PMID: PMID: 30732525, 30527664). Unexpectedly, however, when we starved the respective cells for glucose, the number of GFP-Tor1 foci did only marginally increase (20%) in our strain background over a period of up to 1 hour. Given these various unexpected issues, we prefer to not include any of these preliminary data in the current version of our manuscript, but to rather follow up on these observations in a separate study. We deem this particularly justified as the current literature on TORC1-body and TOROID formation also appears controversial and may need further clarification. For instance, while TORC1-body formation has been suggested to represent a Snf1-dependent process that is dispensable for TORC1 inhibition (PMID: 30485160), TOROID formation has been suggested to represent a Snf1-independent process that is mechanistically linked to TORC1 inhibition (PMID: 28976958).
6) In figure 5F, where the authors claim the Sch9SE mutant has lower TORC1 activity, the difference is very minor. Furthermore, corresponding lanes also show reduced levels of Snf1as expression. Hence, improved blots are required here. Also, an in vitro kinase assay with full-length Sch9 KD with and without the Ser288 mutation could solidify the observation that phosphorylation of Ser288 indeed affects TORC1-mediated phosphorylation.
We have replaced the blots in Figure 5F with an alternative set that more clearly highlights the (statistically significant) differences, while also exhibiting more equal levels of Snf1as levels. Regarding the in vitro kinase assays: we have repeatedly tried to perform TORC1 kinase assays on full length Sch9KD without success. We currently believe that proper TORC1-mediated phosphorylation of Sch9 may have to occur on membranes to which both TORC1 and Sch9 are tethered through phospholipid interactions (PMID: 29237820). We are trying to set up such a system on liposomes, but we assume that this will be a major effort that cannot be resolved in due time.
7) In figure 6E, the Sch9SE mutant shows no effect in the presence of rapamycin. Thus, in vivo, phosphorylation at Ser288 may not be perturbing the phosphorylation of Sch9 by TORC1.
When cells are grown on glucose where TORC1 is highly active (as in Fig. 6E or 6A/B in Exp), expression of Sch9SE has no significant effect indeed. However, in glucose-starved cells, where TORC1 activity is low, expression of the Sch9S288E allele clearly and significantly contributes to inhibition of Sch9-Thr737 phosphorylation by TORC1 (Figure 6A/B and Figure 5F/G).
8) According to the author's proposed mechanism, TORC1 activity in Pib2SASA or Pib2SASA/Sch9SA backgrounds should be higher during glucose starvation compared to the control strains. However, glucose starvation shows a similar level of reduction in TORC1 activity in these backgrounds. This raises concern regarding the proposed mechanism. The authors mainly base their conclusions on Ser to Glutamate mutants. The authors should be cautious that Ser to Glutamate changes may also affect the protein structure which can confer similar phenotypes. How do the authors justify this discrepancy?
Please see our response to point 2 of reviewer #1.
it suggested we rethink the meaning of “domesticity,”
Its really intersting seeing how they have their ideas on topics that you'd think is shut and close, challenged and how to rethink this topic. I remember in class discussing how we found objects to be ineffective but with this, It makes me think of it differently. There is more meaning and makes you quesition some aspects. Although I still think the polar bear tag might need more explanation
recent support of the Android
It's not "recent". The Android support was introduced in 2015, 6 months after the initial iOS only version. https://github.com/facebook/react-native/releases/tag/v0.1.0 https://github.com/facebook/react-native/releases/tag/v0.11.0
Blue money
Rainbow money
Mammalian
This is more common because the end-product is similar to human systems.
A single or a double plasmid is possible. There are two options for the heavy chain:
For IgGs - there is a hinge region in the middle.
The same genes in a mammalian plasmid are also present.
These are Postman’s fears in action. They are also Hannah Arendt’s. Studying societies held in the sway of totalitarian dictators—the very real dystopias of the mid-20th century—Arendt concluded that the ideal subjects of such rule are not the committed believers in the cause. They are instead the people who come to believe in everything and nothing at all: people for whom the distinction between fact and fiction no longer exists.
one of my enduring beliefs is that we should put down some public stake in what we believe, something that declares what we think. and that we can re-assess that latter and just or not. are we willing to, years latter, affirm our previous claims? do we believe otherwise? is there visible nuance & complexity within us, or are we acting superficial, responsively? this, to me, is where relevation, self lies: whether we are dynamic, or merely transient creatures.
i don't know how to tag this.
If I commit to a compound keyword such as “mountain lion drinking,” I’ve really limited my flexibility in the future.
By using tags composed of several words, I am being too specific, and making my tag system less flexible.
What's this trick with the knitting needle? It sounds cool. How do you do it so you don't just run into the unpunched ones and get stopped?
reply to u/stjeromeslibido at https://www.reddit.com/r/antinet/comments/10lqfsn/comment/j63y2k9/?utm_source=reddit&utm_medium=web2x&context=3
Every card has holes pre-punched into it in exactly the same place (see the photo in the original post at the top) so that one might put a knitting needle (or other thin instrument) through the whole deck in each of the positions. Then one should decide on what each hole's meaning will be by position.
As an example, imagine you're using your cards in a rolodex fashion and you want to distinguish the six categories: family, friends, service providers, neighbors, co-workers, and organizations/businesses. For family members you cut/remove the additional paper between the first hole (representing "family") and the edge of the paper. You do the same thing for all the other cards based on their respective categories. So, for example, your brother Joe who lives across the street from you and works with you at the office in the family business would have cuts removed for positions 1, 4, and 5. For an entity that fits all six categories, cuts would be made such that the sheet would no longer stay in u/I-love-teal (the original poster's) six ring binder notebook.
At the end of the year you want to send Christmas cards to your friends, family and neighbors, so you put the knitting needles into position 1 and pull up separating your family out, then you repeat for positions 4 and 5 until you have your full list. (Pro tip: you probably wouldn't want to pull them out of the deck completely, but might rather pull them up and set them at a 90 degree angle thus preventing you from needing to do the work of refiling them all in a particular order.)
Obviously if you have multi-row edge punches or dozens of edge notches you can discern a lot more categories or data types using basic logic. Just abstract this to your particular note card system. Herman Hollerith used this in early versions of the U.S. Census in the late 1800s and it and variations were used heavily in early computer programming applications.
A variation of this sort of trick can also be done by coloring in (or not) the edges of parts of your cards as well. See for example the general suggestions in these photos which help to layout the idea of the "Pile of Index Card" system used back in 2006 with respect to Getting Things Done (GTD) philosophy:
On my mathematics specific notes which I generally put on graph paper cards, I use colored edge "notches" like these to represent broad categories like theorems, proofs, definitions, corollaries, etc. or method of proof (induction, direct, contradiction, contraposition, construction, exhaustion, probabilistic, combinatorial, etc.) This makes finding specific cards a bit easier as I tip through various sections.
A historian might use colored edges to visually label dates by decades or centuries depending on the timespan of their studies. The uses can be endless and can be specific to your field of study or needs.
Some might also attach the idea of tags/categories to the colors of their cards, so you might use white cards for ideas which are your own, yellow cards which are quotes of others' material, blue cards which represent synopses of other's ideas, etc. One might also profitably use a multi-pen with different colored inks to represent these sorts of meta-data as well.
The variations are endless...
Author Response
Reviewer #1 (Public Review):
In this study, the protein composition of exocytotic sites in dopaminergic neurons is investigated. While extensive data are available for both glutamatergic and GABA-ergic synapses, it is far less clear which of the known proteins (particularly proteins localized to the active zone) are also required for dopamine release, and whether proteins are involved that are not found in "classical" synapses. The approach used here uses proximity ligation to tag proteins close to synaptic release sites by using three presynaptic proteins (ELKS, RIM, and the beta4-subunit of the voltage-gated calcium channel) as "baits". Fusion proteins containing BirA were selectively expressed in striatal dopaminergic neurons, followed by in-vivo biotin labelling, isolation of biotinylated proteins and proteomics, using proteins labelled after expression of a soluble BirAconstruct in dopaminergic neurons as reference. As controls, the same experiments were performed in KO-mouse lines in which the presynaptic scaffolding protein RIM or the calcium sensor synaptotagmin 1 were selectively deleted in dopaminergic neurons. To control for specificity, the proteomes were compared with those obtained by expressing a soluble BirA construct. The authors found selective enrichments of synaptic and other proteins that were disrupted in RIM but not Syt1 KO animals, with some overlap between the different baits, thus providing a novel and useful dataset to better understand the composition of dopaminergic release sites.
Technically, the work is clearly state-of-the-art, cutting-edge, and of high quality, and I have no suggestions for experimental improvements.
We thank the reviewer for this summary and for pointing out the high quality of the work.
On the other hand, the data also show the limitations of the approach, and I suggest that the authors discuss these limitations in more detail. The problem is that there is very likely to be a lot of non-specific noise (for multiple reasons) and thus the enriched proteins certainly represent candidates for the interactome in the presynaptic network, but without further corroboration it cannot be claimed that as a whole they all belong to the proteome of the release site.
We fully agree with the reviewer. Most importantly, we have changed the final section from “Conclusions” to “Summary of conclusions and limitations” (lines 501-518) to summarize the limitations with equal weight to the conclusions. In the revised manuscript, we also included many specific additional points in this respect throughout the discussion and the results: many hits could be noise (lines 458, 478-479), thresholding affects the inclusion of proteins in the release site dataset (lines 208-215), the seven-day time window could deliver interactors from the soma to the synapse (lines 493-495), specific oddities (for example histones, lines 482-485), iBioID does not deliver an interactome per se but is simply based on proximity (lines 505-508), and several more. We also clearly state that each specific hit needs follow-up studies (lines 501-503: ” Each protein will require validation through morphological and functional characterization before an unequivocal assignment to dopamine release sites is possible.”), and a similar statement was added on lines 374-375.
Reviewer #2 (Public Review):
The Kaiser lab has been on the forefront in understanding the mechanism of dopamine release in central mammalian neurons. assessing dopamine neuron function has been quite difficult due to the limited experimental access to these neurons. Dopamine neurons possess a number of unique functional roles and participate in several pathophysiological conditions, making them an important target of basic research. This study here has been designed to describe the proteome of the dopamine release apparatus using proximity biotin labeling via active zone protein domains fused to BirA, to test in which ways its proteome composition is similar or different to other central nerve terminals. The control experiments demonstrating proper localization as well as specificity of biotinylation are very solid, yielding in a highly enriched and well characterized proteome data base. Several new proteins were identified and the data base will very likely be a very useful resource for future analysis of the protein composition of synapse and their function at dopamine and other synapses.
We thank the reviewer for this positive assessment of our work.
Major comment:
The authors find that loss of RIM leads to major reduction in the number of synaptically enriched proteins, while they did not see this loss of number of enriched proteins in the Syt1-KO's, arguing for undisrupted synaptome. Maybe I missed this, but which fraction of proteins and synaptic proteins are than co-detected both in the Syt1 and control conditions when comparing the Venn diagrams of Fig2 and Fig 3 Suppl. 2? This analysis may provide an estimate of the reliability of the method across experimental conditions.
We thank the reviewer for proposing to be clear in the comparison of the control and Syt-1 cKODA data. A direct comparison of hit numbers is included on lines 323-324, with 37% overlap between control and Syt-1 cKODA (vs. 15% between control and RIM cKODA). A direct mapping of this overlap is included in Fig. 4E. We think that this direct comparison is complicated by a number of factors, as outlined below, and did our best to include these complications in the discussion, including the last section (lines 501-518).
First, to assess overall similarity, the initial comparison should be to assess axonal proteins identified in the BirA-tdTomato samples. These datasets are quite similar, with 671 (control) and 793 (Syt-1 cKODA) proteins detected, and a high overlap of 601 proteins. We think that this indicates that the experiment per se is quite reproducible. The comparison of the release site proteome between control and Syt-1 cKODA is more complicated. We think that the main point of this comparison is that the overall number of hits is quite similar, with 450 hits in the Syt-1 cKODA proteome and 527 hits in the control proteome, and we now show that this similarity holds across multiple thresholds (lines 298-301; ≥ 1.5: Syt-1 cKODA 602 hits, control 991, ≥ 2.0: 450/527, ≥ 2.5: 252/348). Detailed analyses of overlap reveals that known active zone proteins such as Bassoon, CaV2 channels, RIMs, and ELKS proteins are present in both proteomes, but the overlap is partial and incomplete with 191 proteins found in both proteomes. As discussed throughout and summarized on lines 501-518, the reasons for this partial overlap may be manifold. Trivially, it could be explained by noise or non-saturation (“incompleteness”) of the proteome. We also think that the Syt-1 proteome is not expected to be identical because there is a strong release deficit in these mice. If Syt-1 has a dopamine vesicle docking function (which it does at conventional synapses [4]), this could influence the proteome. We note that protein functions in the dopamine axon are not well established, but inferred from studies of classical synapses.
We have scrutinized the manuscript to not express that the control and Syt-1 cKODA proteomes are identical; we know they are not and discuss the example of α-synuclein specifically (Fig. 6, lines 347-362). Rather, the striking part is that the extent of the proteomes with high hit number, much higher than RIM cKODA, are similar. Specific hits have to be assessed in a detailed way, one hit at a time, in future studies, as expressed unequivocally on lines 501-503).
Reviewer #3 (Public Review):
In this study Kershberg et al use three novel in vivo biotin-identification (iBioID) approaches in mice to isolate and identify proteins of axonal dopamine release sites. By dissecting the striatum, where dopamine axons are, from the substantia nigra and VTA, where dopamine somata are, the authors selectively analyzed axonal compartments. Perturbation studies were designed by crossing the iBioID lines with null mutant mice. Combining the data from these three independent iBioID approaches and the fact that axonal compartments are separated from somata provides a precise and valuable description of the protein composition of these release sites, with many new proteins not previously associated with synaptic release sites. These data are a valuable resource for future experiments on dopamine release mechanisms in the CNS and the organization of the release sites. The BirA (BioID) tags are carefully positioned in three target proteins not to affect their localization/function. Data analysis and visualization are excellent. Combining the new iBioID approaches with existing null mutant mice produces powerful perturbation experiments that lead and strong conclusions on the central role of RIM1 as central organizers of dopamine release sites and unexpected (and unexplained) new findings on how RIM1 and synaptotagmin1 are both required for the accumulation of alpha-synuclein at dopamine release sites.
We thank the reviewer for assessing our paper, for summarizing our main findings, and for expressing genuine enthusiasm for the approach and the outcomes.
It is not entirely clear how certain decisions made by the authors on data thresholds may affect the overall picture emerging from their analyses. This is a purely hypothesis-generating study. The authors made little efforts to define expectations and compare their results to these. Consequently, there is little guidance on how to interpret the data and how decisions made by the authors affect the overall conclusions. For instance, the collection of proteins tagged by all three tagging strategies (Fig 2) is expected to contain all known components of dopamine release sites (not at all the case), and maybe also synaptic vesicles (2 TM components detected, but not the most well-known components like vSNAREs and H+/DA-transporters), and endocytic machinery (only 2 endophilin orthologs detected). Whether or not a more complete collection the components of release sites, synaptic vesicles or endocytic machinery are observed might depend on two hard thresholds applied in this study: (a) "Hits" (depicted in Fig 2) were defined as proteins enriched {greater than or equal to} 2-fold (line 178) and peptides not detected in the negative control (soluble BirA) were defined as 0.5 (line 175). How crucial are these two decisions? It would be great to know if the overall conclusions change if these decisions were made differently.
We agree with the reviewer that the thresholding decisions are important and have now better incorporated the rationale for these decisions in the manuscript.
Two-fold enrichment threshold. As outlined in the response to point 1 in the editorial decision letter, we now include figure supplements to illustrate the composition of the control proteome if we apply 1.5- or 2.5-fold enrichment thresholds (Fig. 2 – figure supplements 1 and 2) instead of the 2.0-fold threshold used in Fig. 2. This leads to more or less hits (991 and 348, respectively) compared to the 2.0-fold threshold (527 hits). It is noteworthy that the SynGO-overlap is the highest with the 2.0 threshold (37% vs. 31% at 1.5 and 33% at 2.5, Fig. 2 – figure supplement 3), justifying this threshold experimentally in addition to what was done in previous work [1,2]. These data are now described on lines 208-215 of the manuscript. When we apply these different thresholds to RIM and Syt-1 cKODA datasets, the finding that RIM ablation disrupts release site assembly persists. The following hit numbers were observed in the mutants at the 1.5, 2.0 and 2.5 enrichment thresholds, respectively: RIM cKODA 268, 198 and 82 hits; Syt cKODA 602, 450 and 252 hits. Hence, the extent of the release site proteome remains much smaller after RIM ablation independent of the enrichment threshold, bolstering the conclusion that RIM is an important scaffold for these release sites. This is included in the revised manuscript on lines 298301.
Undetected peptides in BirA-tdTomato. We did not express this well enough in the manuscript. The undetected proteins were set to 0.5 such that a protein that was detected with a specific bait but not with BirA-tdTomato could be illustrated with a specific circle size, not to determine inclusion in the analyses. If the average peptide count across repeats with a specific bait was 1, this resulted in inclusion in Fig. 2 and consecutive analyses with the smallest circle size. Hence, this decision was made to define circle size. It did not affect inclusion in Fig. 2 beyond the following two points. If one were to further decrease it, this might result in including peptides that only appeared once as a single peptide for some of the experiments, which we wanted to avoid. If one would set it higher (to 1), this artificial threshold would be equal to proteins that were actually detected experimentally multiple times, which we wanted to avoid as well. We have now clarified this on lines 165-167 and lines 1119-1121.
Expected proteins. In general, interpreting our dataset with a strong prior of expected proteins is difficult. The literature on release site proteins specifically characterized for dopamine is limited. We have found Bassoon, RIM, ELKS and Munc13 to be present using 3D-SIM superresolution microscopy [5,6], and we indeed found these proteins in the data as discussed on lines 227-232 and lines 423-445 in the revised manuscript. The prediction for vesicular and endocytic proteins is complicated. Release sites are sparse [5,7], and vesicle clusters are widespread in the dopamine axon, in some cases filling most of the axon (for example, see extended vesicle clusters filling much of the dopamine axon in Fig. 7E of [5]). Furthermore, docking in dopamine axons has not been characterized, and it is unclear how frequently vesicles are docked. Hence, it is not clear whether vesicular proteins should be concentrated at release sites compared to the rest of the axon (the BirA-tdTomato proteome we use for normalization). Similar points can be made for proteins for endocytosis and recycling of dopamine vesicles. Within the dopamine system, it is unclear whether the recycling pathway is close to the exocytic sites. One consistent finding across functional studies is that depletion after activity is unusually long-lasting in the dopamine system, for tens of seconds, even after only mild stimulation [5,8–13]. Hence, endocytosis and RRP replenishment might be very slow in these axons. It is not certain that endocytic factors are predeployed to the plasma membrane, and if they are, it is unclear how close to release sites they would be. As such, we agree with the reviewer that the proteome we describe is a hypothesisgenerator. With the limited knowledge on dopamine release, predictions beyond the previously characterized proteins in dopamine axons are difficult to make.
We thank the reviewer for suggesting to include a better analysis of different thresholds and for giving us the opportunity to clarify the other points that were raised.
Given the good separation of the axonal compartment from the somata (one of the real experimental strengths of this study), it is completely unexpected to find two histones being enriched with all three tagging strategies (Hist1h1d and 1h4a). This should be mentioned and discussed.
We agree with the reviewer and have addressed this point in the manuscript. This could either reflect noise, or there could be more specific reasons behind it. The manuscript now states on lines 482-485: “It is surprising that Hist1h1d and Hist1h4a, genes encoding for the histone proteins H1.3 and H4, were robustly enriched (Fig. 2A). These hits might be entirely unspecific, or their co-purification could be due to biotinylation of H1 and H4 proteins (Stanley et al., 2001). It is also possible that there are unidentified synaptic functions of some of the unexpected proteins.” Ultimately, we do not know why these proteins are enriched, and we state clearly in the section “Summary of conclusions and limitations” that each new hit has to be validated in future studies (lines 501-503).
It would also help to compare the data more systematically to a previous study that attempted to define release sites (albeit not dopamine release sites) using a different methodology (biochemical purification): Boyken et al (only mentioned in relation to Nptn, but other proteins are observed in both studies too, e.g. Cend1).
We agree with the reviewer that Boyken et al, 2013 [14] is an important resource for our paper and for the assessment of the proteomic composition of release sites. We have now introduced links and citations to this paper multiple times (for example, on lines 231, 241, 430, 443, 481) and have expanded the discussion of overlap between these proteomes, including on Cend1 (lines 479482).
We think that a systematic comparison with Boyken et al, 2013 [14] is complicated because (1) so little is known about dopamine release mechanics and (2) because the approach is very different between the two papers. In respect to (1), most prominently, it is not certain how frequently vesicles are docked in the dopamine axon. Only ~25% of the varicosities contain these release sites, and vesicle docking has not been characterized in striatal dopamine axons to the best of our knowledge. Hence, how a docking site at a classical synapse compares to a dopamine release site remains unclear at the outset. For point (2), the key difference is that “within dataset normalizations” are very different in these two studies. In our iBioID dataset, we normalize to soluble proteins defined as proximity to BirA-tdTomato. In ref. [14], the authors express enrichment over “light”, regular synaptic vesicles purified with the same approach. This has a major impact on the proteome that strongly influences a direct comparison of hits, because there are large differences in the normalization. While each normalization makes sense for the respective paper, it complicates direct comparison.
With these points in mind, we have compared hits across both datasets class-by-class. For some classes, the datasets have reasonable overlap for ≥ 2-fold enriched proteins: for example for active zone proteins (3 of 7 hits in [14] appear in our control proteome) and adhesion and cell surface proteins (8 of 18). For other classes, the overlap is limited: for example for nucleotide metabolism/protein synthesis (0 of 16 hits in [14] appear in our dataset) and cytoskeletal proteins (5 of 29). We hope the reviewer agrees, that given these factors, the analyses and discussion needed for a systematic comparison goes beyond the scope of our paper. We have instead added a number of references to Boyken et al., 2013 [14], as outlined above, when direct comparison is meaningful.
Reviewer #1 (Public Review):
This study investigated the roles of sams-1 and sams-4, two enzymes that generate the major methyl donor SAM, in heat stress response and the associated molecular changes. The authors provided evidence that loss of sams-1 resulted in enhanced resistance to heat stress, whereas loss of sams-4 resulted in heightened sensitivity to heat stress. The authors further showed that whereas the basal level of the histone modification H3K4me3 in intestinal nuclei was substantially reduced in sams-1 loss-of-function mutants, H3K4me3 level greatly increased upon heat stress, and this increase depended on sams-4. Additional RNA-seq results revealed largely distinct heat stress-induced RNA expression changes in the sams-1 mutant and sams-4 knockdown worms. The authors further profiled genomic locations of H3K4me3 in sams-1 mutant and sams-4 knockdown worms. Unfortunately, the lack of sufficient technical detail made it difficult to evaluate the H3K4me3 profiling data.
The paper provided several conceptual advances:<br /> - Uncovering interesting and opposing heat stress phenotype associated with the loss of two related SAM synthases. Thus, even though both SAMS-1 and SAMS-4 produce SAM, the source of SAM production appears to have distinct consequences on the organismal heat stress response.<br /> - Demonstration that SAMS-4 appeared able to compensate for the loss of SAMS-1 upon heat shock, resulting in restoration of the histone mark H3K4me3 in intestinal cells.<br /> - Revealing largely different gene expression changes upon heat shock in animals lacking sams-1 or sams-4. Thus, the gene expression profiles corroborated the differential heat stress response.
This paper describes one of the first adaptations of CUT&TAG in C. elegans, which can be of high impact on the field. Unfortunately, the lack of experimental detail made it difficult to evaluate the quality of the CUT&TAG data and the consequent interpretations.
Overall, the paper reported a number of interesting findings that will be of substantial interest to the field. However, the paper in its current form has substantial shortcomings, particularly related to the difficulty in evaluating the validity of H3K4me3 profiling data. The paper would also benefit from further discussion that attempts to reconcile some of the inconsistent results.
Reviewer #2 (Public Review):
In this manuscript titled "S-adenosylmethionine synthases specify distinct H3K4me3 populations and gene expression patterns during heat stress", the authors Godbole et al investigated how C. elegans SAM synthases, SAMS-1 and SAMS-4, affected gene expression, H3K4 trimethylation (H3K4me3), and the survival under heat stress. They found in this study that SAMS-4 was required for survival during heat shock. They reasoned that SAM supplied by SAMS-4 but not SAMS-1 might be responsible for generating H3K4me3 under heat shock and claimed that the two SAM synthases differentially affected histone methylation and thus gene expression in the heat shock response. This study suggested a stress-responsive mechanism by which the specific isozyme of SAM synthetase provided a specific pool of cellular SAM for H3K4me3. Overall, this study is interesting but descriptive. Lacking necessary controls and mechanistic details weakened the significance of this work.
Strengths: Very interesting survival phenotypes in the loss of different SAM synthetases; technical success in CUT&tag in C. elegans.
Weaknesses: No clear conclusion can be drawn about whether and how SAM synthetases affect H3K4me3.
Note: This rebuttal was posted by the corresponding author to Review Commons. Content has not been altered except for formatting.
Learn more at Review Commons
Reviewer #1 (Evidence, reproducibility and clarity (Required)):
Summary:
The submitted manuscript is comparing the effect of individual chaperones and heat-resistant obscure (Hero) proteins on the overall folding of the TDP-43 LCD-domain and its relation to aggregation propensity. Therefore, the authors apply smFRET in order to deduce eventual morphological changes of the LCD-domain from FRET efficiencies. The authors observe that the LCD domain extends its structure upon binding of chaperone/Hero proteins whereas it is collapsed in the absence of those. Furthermore, immunoblotting of filter trap assays indicate that overexpression of chaperones and Hero proteins reduce aggregation of TDP-43 in vivo. Both, the morphological effects on the LCD-domain and the aggregation propensity are significantly enhanced for the TDP-43 A315T mutant. Moreover, the authors tested a charge depleted Hero protein version with reduced "chaperone-like" behaviour. Therefore, the authors conclude that the binding or chaperone activity of the Hero protein is based on its residue specific charges. Finally, the authors conclude that Hero proteins can act similar to chaperones in order to keep protein homeostasis under stress conditions.
We thank the Reviewer for their insightful evaluation of our study.
Major comments:
The similar effect of chaperones and Hero proteins on the morphology of TDP-43 found by the authors is intriguing and the applied experimental procedures seem well described and conducted.
However, the assumption of the authors that a change in morphology of the LCD-domain by the chaperones and Hero proteins is directly connected to the reduction of TDP-43 aggregation is not entirely clear. Whether an overexpression of individual chaperones and Hero proteins has a direct effect on TDP-43 aggregation cannot be tested in vivo, only. It cannot be excluded that inside the cell the here tested chaperones and Hero proteins control intermediate processes or work as co-factors for other proteins involved in protein homeostasis rather directly influencing the aggregation of TDP-43. Therefore, I recommend in vitro aggregation experiments, using ThT signal as a readout. By adding chaperones, Hero proteins and a negative (BSA or others) control individually, a direct effect on TDP-43 aggregation could be concluded. Those experiments have been extensively used in the field and are quick and straightforward to handle.
As the Reviewer explains, indirect effects on TDP-43 aggregation in cells may be accounted for by conducting aggregation experiments in vitro, with recombinant proteins. We are currently designing such experiments based on a previously described full-length recombinant TDP-43 with a TEV-cleavable MBP tag (Wang 2018 EMBO J). This can be incubated with Hero/DNAJA2/Control, and aggregation induced by cleavage of the tag, after which aggregation can be measured via filter trap similar to the method described in our work. We will include these results in our revised manuscript.
We thank the Reviewer for their advice. While we note that it is controversial whether ThT binds to aggregates formed from full-length TDP-43 (used in all our assays in the current manuscript), it is reasonable to apply this assay to the LCD fragment as in the paper referenced by the Reviewer below (Lu 2022 Nat Cell Biol). Such an assay is also a reasonable method for confirming effects of Hero protein and DNAJA2 in vitro, and we can conduct this assay as a back-up if the above does not work.
In addition, focusing on the LCD-domain as a main driver for TDP-43 aggregation is limiting this study. In particular, recent studies [1] indicate that the RRM1 and RRM2 sites of TDP-43 have a major impact on TDP-43 gelation and maturation to solid aggregates. Unfortunately, those sites have not been studied in this manuscript.
We thank the Reviewer for their insight. While we are keen to investigate the impact of other regions on the aggregation of TDP-43 in the future, we chose to focus on the LCD in our current study because our smFRET assay is particularly suitable to monitor the dynamic conformational nature of this flexible, unfolded region.
However, we agree with the Reviewer that it is possible the RRMs have an effect on the activities of Hero11 and DNAJA2. We will create constructs for the RRM-depleted variant, TDP43ΔRRM1&2, and RNA-binding deficient variant, TDP435FL for use in our cell-based assay. This will allow us to investigate how this domain influences the effects of Hero and DNAJA2, and we will include this in our revised manuscript.
As an optional alternative for using Hero11KR->G could be the alteration of buffer conditions and using higher number of salts to promote charge screening. It would be of interest whether the results with the Hero11KR->G could be reproduced with wild type Hero11.
We will perform our assays with Hero11 in high salt conditions for charge screening. While we agree that it may be a great alternative experiment, we note that changing the salt concentration may directly affect the LCD conformation, possibly complicating interpretation of results.
[1] Lu et al. Nat Cell Biol;24(9):1378-1393 (2022)
Minor comments:
Overall, the text is clearly written, and the figures are appropriate.
Whether the activity of individual chaperones or Hero proteins on TDP-43 aggregation "may result in the overall fitness of the cell" or "reinforcing the conformational health of the proteome" is disputable without knowing how the overexpression of certain chaperones or Hero proteins alter the formation of toxic TDP-43 oligomers.
We thank the Reviewer for their balanced critique. We will remove or weaken this point regarding how Hero proteins "may result in the overall fitness of the cell" or may be "reinforcing the conformational health of the proteome" from the discussion.
Reviewer #1 (Significance (Required)):
Studying the mechanistic effects of chaperones on aggregating proteins is of major interest for the field in order to understand aging related disbalance of protein homeostasis and the progression of neurological decline, such as seen for amyotrophic lateral sclerosis (ALS). Furthermore, finding homolog proteins, also being able to inhibit protein aggregation, can help to understand overall mechanisms of protein aggregation and processes preventing such fatal behaviour. However, the technique used in this manuscript are not very novel and have been used numerously times before. smFRET is a common technique to look at protein folding/unfolding and is used frequently as a molecular ruler. The manuscript is of interest for the field of protein aggregation and folding, smFRET and neurodegeneration.
My expertise lies in the field of protein aggregation and inhibition due to chaperones, measuring molecular interactions and neurodegenerative diseases.
We greatly appreciate the Reviewer’s expert opinion on our work. As the Reviewer explains, we believe our work will contribute to the fields of protein aggregation and folding, smFRET and neurodegeneration. While the smFRET method may not be novel on its own, to our knowledge this is the first observation of the TDP-43 LCD, with the effect of a pathogenic mutation, at the single-molecule level. In fact, the production, dye-labeling and isolation of individual molecules is extremely challenging for TDP-43. This was made possible by our technical advances using genetic code expansion to site-specifically introduce an unnatural amino acid in TDP-43, purifying and labeling the TDP-43 from HEK cells, and isolation on glass slides.
Reviewer #2 (Evidence, reproducibility and clarity (Required)):
In this manuscript, the authors build on their findings (Tsuboyama 2020) that electrostatically charged IDPs (Heros) can protect proteins from denaturation and aggregation. In their previous work, they demonstrate that these Hero proteins could decrease the fraction of insoluble GFP-TDP43∆NLS in mammalian cell lines and that this mode of action was related to the electrostatic charge of the proteins and not sequence dependent. Although this protective mode of action appears to be similar to that of canonical chaperones, it is unclear how the Hero proteins compare. In this study, the authors compare Hero11 to a panel of canonical chaperones in their cell-based assays and show that it prevents aggregation in a comparable way to DNJA2. It appears that Hero11 decreases the GFP-TDP43∆NLS aggregates better than some other chaperones. They then utilise their expertise in smFRET analysis (Tsuboyama, 2018) to compare what effect DNJA2 and Hero11 (along with Hero11KR-->G (non-charged control)) have on the dynamic structures of the GFP-TDP43∆NLS (labelled with complementary fluorophores in the LCD domain). Based on analysis of the WT GFP-TDP43∆NLS and the A315T GFP-TDP43∆NLS, the authors suggest that the presence of Hero11 and DNJA2 maintain the LCD-domain of TDP43 in an extended conformation and that by doing so, aggregation can be prevented (as assessed in the cell-based assay).
Despite finding the results very interesting, I feel that the study is preliminary and the conclusions drawn are not fully substantiated by the presented experimental work. Many questions need addressing to validate these findings and conclusions (please see more in the "Significance" section). I have tried to list the main concerns below.
We thank the Reviewer for their detailed and critical assessment of our current study.
Questions/concerns:
Authors used double transient transfections but have not shown quantification of protein levels of the chaperones versus TDP43 - western blots to confirm proper expression (and levels) of the chaperones/Hero protein is crucial without it, we cannot assume that the differences in TDP-43 aggregation are a result of effective chaperoning or due to a lack of expression of any of the chaperone proteins, or high expression of others.
We agree with the Reviewer that this is an important and straightforward validation experiment. We will perform the Western Blotting to confirm the proper and comparable expression of the chaperones/Hero proteins.
Authors used quite a high BSA concentration in the smFRET work; it would be useful to see what the TDP43 smFRET trace looks like without BSA incubation (to ensure it is not causing some effect). Also, is there a concentration dependence? The Authors mention they are unable to identify a Hero/TDP43 complex; but if the amount of Hero protein is high (given that it is single molecules tethered), the change in compaction may not relate to the levels/ratios found in the cells (where changes to aggregation are occurring). have the authors considered whether positively charged polymers (poly-Lys) have any impact on the TDP-43 smFRET distribution? Given that the smFRET trace is so heterogeneous, to understand what is happening here would require the comparison of more than 2 variants.
As the Reviewer suggests, we will include additional smFRET experiments in our revision.
First, we will perform the smFRET experiment of the TDP-43 alone in the PBS buffer. However, we would like to clarify the reason we used BSA incubation for comparison in the current experiment is to account for the possibility of non-specific macromolecular crowding effects on the conformation of the LCD (an effect reported for IDPs in general, for example in Banks 2018 Biophys. J.); we expected that it would be fair to compare Hero11 against another protein, rather than buffer alone. As the Reviewer suggested, we can also perform the same experiments at lower concentrations of Hero11 and DNAJA2, including equimolar concentrations (as suggested below). Moreover, we can also test poly-K peptides for comparison.
Although the A315T variant has a very distinct smFRET profile, it is clear that the effects of Hero11KR-->G (that is proposed to have no effect on aggregation or on the smFRET of WT TDP43) has a clear impact on A315T. Why is this?
We thank the Reviewer for raising this interesting point. We envision that the observed effect is due to weak interactions between the LCD domain of TDP-43 and Hero11KR->G; even without K and R, there many other functional amino acids that are fully accessible due to the extremely disordered nature of the protein. The effect is easier to be observed with the A315T mutant, compared to the WT TDP-43, presumably because the mutant tends to take more compact conformations on its own. Nonetheless, unlike WT Hero11, Hero11KR->G fails to accumulate the very extended form of the LCD (FRET signal of ~0; please see below for the explanation of this value), which appears to be associated with suppression of aggregation. We will include these in our discussion.
The LCD region is prone to PMTs - as the tethered protein is taken from expression in mammalian cells, how can the authors be sure that it has no PMTs? Although a clear difference is observed between WT and A315T in terms of "compactness" of the LCD domain, we cannot assume that the effect of DNAJ2 and Hero11 are the same - in fact, the Hero11 KR-->G control for the A315T is clearly different from the negative control (BSA) and the effect that was seen in WT. As the LCD domain is well-known to be the site of post-translational modifications (ie. Phosphorylation - this would have an effect on an electrostatic Hero11), could the effects be related to changes in PMTs as well?
We thank the Reviewer for their insight. We would like to clarify that we make no assumption that our dye-labeled TDP-43 is free of post-translational modifications. Indeed, the fact that it is derived from HEK293 cells suggests it should have post-translational modifications relevant to humans and may be even considered an advantage of our method. (Most structural methods require purification of a large amount of protein, often only possible through recombinant expression in E. coli, thus lacking human-relevant PTMs.) As the Reviewer points out, the LCD is known to have many phosphorylation sites, which may help explain how the positively charged Hero11 interacts with it. Thus, we will perform mass spectrometry of TDP-43 and the A315T variant expressed in HEK cells to identify what post-translational modifications are present.
The authors mention other studies on DNJA proteins on TDP-43; is the mechanism by which they suppress aggregation known? If the authors want to compare the unknown effects of Hero11, it would be useful to know what DNJ2A is doing, otherwise, the results are still not conclusive, only that "change is similar" in two experiments. What is known about DNJ2A interactions with TDP-43? Did the authors do any pulldown assays to detect a complex in cellulo?
While previous studies have identified various DNAJ (specifically J-domain protein B-subfamily) proteins that suppress aggregation of overexpressed TDP-43, not much is known of this specific interaction (Udan-Johns 2014 Hum Mol Genet, Chen 2016 Brain, Park 2017 PLOS Genet). To address the Reviewer’s questions, we will include experiments characterizing the effects of DNAJA2 on TDP-43. We will perform colocalization experiments, explaining effects of DNAJA2 and Hero11 on TDP-43 in the cell. As explained below, we will also perform Pulse Shape Analysis (PulSA), a flow cytometry-based method that can be used to study protein localization patterns in cell, which will also provide insight into the effects on the distribution of TDP-43 in cells. We can also perform co-IP of TDP-43 to detect if there is a detectable, stable complex with DNAJA2 and/or Hero11. Together, these will clarify the similarities and differences between DNAJA2 and Hero11.
It is unclear how the findings of the smFRET relate to structural understanding of the LCD-domain of TDP43 (i.e. NMR studies?); is it known whether PTMs are more prominent with the A315T variant as this may explain it's more compact nature? As well, putative helical structure in the LCD domain may lend to the changes in compaction.
The Reviewer brings up an interesting and careful discussion. Currently, it is unknown if PTMs actually cause more compaction, or if they are more prominent in the A315T variant, but we will perform mass spectrometry to detect PTMs.
As the Reviewer mentions, it would be very interesting to compare our smFRET results to other studies of specific LCD structures. However, it is not trivial to deduce lengths (and structure) from smFRET data as various other factors, for example, dye orientation and local chemical environment, may affect FRET efficiency. Nonetheless, we can still cautiously provide a discussion of how our FRET results compare with previous studies.
For the dye pair used in our study, Cy3 and ATTO647N, the low/no FRET signals promoted by DNAJA2 and Hero11 correspond to a range of end-to-end distances of 6.9 nm to 10.2 nm (FRET signals of 0.1 to 0.01, respectively). Assuming that the LCD behaves like a ~140 amino acid worm-like chain (WLC) with persistence length (Lp) = 0.8 nm, we expect a mean end-to-end distance of 7.35 nm. Thus, the low FRET peak can be well explained by promotion of an extended WLC behavior of the LCD by DNAJA2 and Hero11. On the other hand, the FRET peaks of WT LCD and the A315T mutant (in the absence of Hero11 or DNAJA2) correspond to ~4 and ~3.3 nm, respectively. We will include a careful discussion of how our results relate to known structural understanding of the LCD in the revised discussion.
It is unclear how there can be such a prominent FRET ~0 peak and in fact negative values.
We regret that we did not clearly explain this in the manuscript. Negative values arise when applying correction factors from the alternating laser scheme (ALEX) to FRET signals. FRET efficiency, E, is the ratio of acceptor signal intensity, IA, over the total signal intensity, ID+IA, (with the application of a correction factor, γ, but this doesn’t affect the negative values and won’t be discussed further here) and is given by the equation: E=IA/(γ×ID+IA). However, due to leakage of the donor signal into the acceptor channel and direct excitation of the acceptor dye by the donor laser, raw IA values, IA,raw, are erroneously higher than in reality. For example, the ~0 FRET peaks in question appear to be around 0.1–0.2 before correction. These are accounted for by applying the respective correction factors, Dleakage and Adirect, through the equation: IA=IA,raw–Dleakage×ID–Adirect×IAA. (IAA is the acceptor signal during excitation of the acceptor dye.) These two correction factors are determined by observing the traces and choosing the mean values using iSMS software (2015 Preus Nat Methods) and applied uniformly to all traces in an experiment. When IA is especially low, such as when FRET is almost 0, the magnitude of the correction factor terms may be larger than IA,raw, resulting in negative values. This does not mean that values less than 0 are invalid, but merely that they have been overcompensated in the error application. For the dye pair in our study, FRET efficiencies less than 0.1 correspond to distances greater than 6.9 nm, meaning peaks around zero represent LCD behaviors with end-to-end distances greater than around 7 nm. Please also note that kernel density estimation often gives distributions with values beyond the (0,1) range just because of how these plots are constructed. This will be added to the methods in the revised manuscript.
Conclusion is that Hero11 and DNJA2 maintain the TDP43 LCD-domain (soluble protein) in an extended form and that this is linked with the decrease in aggregates found in the cell; however, with the cell-based assay, no analysis to quantify the expression levels of the TDP43 and the chaperones/Hero are presented, and more importantly, no analysis on the complementary soluble fraction (to the filter assay) has been done to show that indeed, these biomolecules maintain the proteins in a soluble form. It is possible that the TDP-43 is being degraded?
As described above, we plan to perform Western Blotting to examine the expression levels of these proteins. To address the concerns about solubility, we will perform Pulse Shape Analysis (PulSA) to quantitatively measure the expression and soluble/aggregated distribution GFP-tagged TDP43 in HEK293T cells. Measuring the soluble diffuse signals and the punctate aggregate signals will also tell us if there are differences in how GFP-TDP43 is aggregated between Hero11, DNAJA2 and controls. In addition, to support results from the FTA, we will provide sedimentation assays, where the soluble and aggregate fraction from cells is separated by centrifugation and analyzed (Krobitsch 2000 PNAS). These will provide information on TDP-43 in the soluble fraction.
Reviewer #2 (Significance (Required)):
Contextually, this study has novelty and potential value for basic research. Firstly, understanding the underlying mechanisms by which Hero protein prevent aggregation would be valuable towards understanding the players in protein homeostasis which can be imbalanced with respect to disease. Secondly, the use of smFRET as a tool in understanding the dynamics of TDP-43 and mutational variants can be powerful in defining structural attributes with pathological consequences in ALS. Although this work shows comparisons between the effect of a canonical chaperone (DNJA2) and Hero11 on the dynamics of monomeric protein and the effect on cellular aggregation, proposing a general mechanism on the data from two TDP-43 variants and a cell-based aggregation assay is premature and more experimental evidence is needed to define the critical link that prevents aggregation of TDP-43 within the cell. Mechanistically, the study does not give a lot of additional insight into the mode of action of Hero11 in the process of preventing aggregation (nor does it explain what DNJA2 is doing and therefore how Hero11 compares and contrasts). The proposed "extended versus collapsed" switch is simplistic and doesn't account for the complexity of TDP-43 structural dynamics. To support their proposed mechanism of action, the authors needs to examine TDP-43 mutational variants (specifically disease-related ones) using their smFRET to understand exactly what the "collapsed" and "extended" data is defining before making the leap that this effect is what is preventing aggregation. There are some structural studies about residual structure in this region (via NMR) that should be considered (https://doi.org/10.1016/j.str.2016.07.007). Although the A315T variant has a very distinct smFRET profile, it is clear that the effects of Hero11KR-->G (that is proposed to have no effect on aggregation or on the smFRET of WT TDP43) has a clear impact on A315T. Why is this? Have the authors considered that the LCD domain of TDP43 is prone to post-translational modifications? Is this variant more phosphorylated - a PMT like phosphorylation is surely to have an impact on interactions with Hero proteins as they are positively charged. Given that the protein is expressed in mammalian cells, it is likely that PMTs have occurred (but the authors should analyse for this).
With regards to the cell-based aggregation assays, the authors again present a simplified relationship - however, a number of control experiments and additional questions arise. It appears that there is less aggregation with co-expression of some chaperones and the Hero11, but what about the soluble fraction? What is the impact of these biomolecules? Is this that it is maintaining soluble protein, enhancing degradation, propagating soluble oligomers? Equally, how do we know that the levels of the chaperones/Heros and the TDP-43 is the same in each cell - these are transient transfections, and no western blots are shown to confirm the levels of the proteins. In fact, the authors state that "co-transfection of HSP70 (HSPA8), HSP90 (HSP90AB1) or HOP all failed to suppress TDP-43 aggregation compared to GST" and mention that this is in contrast to other studies, but could this be a failure to express these in the cell models? Some western blot/lysate analysis is needed. Chaperones often form complexes with their client proteins, is there any evidence of complexes in these cell models (i.e. using immunoprecipitation)?
We thank the Reviewer for their detailed evaluation and interest in our work. As the Reviewer describes, smFRET is a powerful tool for studying the conformational dynamics of TDP-43, and we hope that this study will contribute to our understanding of how Hero proteins and chaperones prevent aggregation.
We are also grateful to the Reviewer for their constructive criticism of our current model, and we will revise it accordingly. We completely agree with the Reviewer that there are complex structural dynamics within the LCD that determine aggregation and phase separation behaviors. Our simple model was intended to explain how external factors that suppress aggregation, DNAJA2 and Hero11, could affect the conformation of LCD at the single-molecule level. As discussed above, we were cautious to over-interpret how our FRET observations correlate to specific conformations, leading to this simplistic model. We do not intend for our explanation of “extended versus collapsed” in the model to explain all structural dynamics of the LCD; rather, we wanted to highlight the characteristic low FRET state promoted by DNAJA2 and Hero11. We believe that the experiment plan explained above will address the Reviewer’s concerns in full, and we thank the Reviewer again for helping us to significantly improve our manuscript.
Reviewer #3 (Evidence, reproducibility and clarity (Required)):
- In a recent study (PLosBiol, 2020) the same authors described an interesting class of proteins they call 'Hero'. Based on their analyses in cultured cells and transgenic Drosophila models the authors concluded that 'Hero' proteins protect against protein instability and aggregation. So far, this class of proteins has not been analyzed by independent groups.
In the current manuscript, they mainly confirm their own previous finding that Hero 11 prevents There are several concerns about the presented data:
We thank the Reviewer for their critical comments on our current manuscript.
- Based on the filter trap assays shown in figure 1 and 3 the authors conclude that DNAJB8 and Hero11 specifically interfere with the aggregation of TDP-43. However, they do not show that the expression levels of TDP-43 are not altered by the co-expression of the different proteins and are comparable in the different samples. In order to make a relevant statement about the anti-aggregation activity of the analyzed proteins, the ratio between soluble and aggregated TDP-43 has to be analyzed.
We would like to clarify that the Reviewer means DNAJA2, not DNAJB8. Following the Reviewer’s advice, we will perform Western Blotting combined with sedimentation assays, where the soluble and aggregate fraction from cells is separated by centrifugation and analyzed to examine the expression levels. We will also perform colocalization experiments and Pulse Shape Analysis (PulSA), a flow cytometry-based method that can be used to study protein localization patterns in cell, which will provide insight into the anti-aggregation activities.
- The FRET assays shown in figures 2 and 4 indicate a slightly higher FRET efficiency in the presence of Hero11 and DNAJA2 and Hero11. The authors postulate that is phenomenon is causally linked to the activity of Hero11 to prevent aggregation of TDP-43. First, it remains unclear whether the slight increase is really significant. Second, I could not find any experimental evidence to support the assumption that a more collapse conformation of the TDP-43 LCD measured in single molecule FRET assays, correlates with an increased aggregation tendency of TDP-43.
We apologize that we are not sure what the Reviewer refers to by “a slightly higher FRET efficiency in the presence of Hero11 and DNAJA2 (and Hero11).” We would like to clarify that, in the presence of Hero11 and DNAJA2, what we observed was a very low (not slightly higher) FRET efficiency of ~0 (Figure 2g and h), suggesting an extended conformation. In contrast, the aggregation-prone A315T variant of TDP-43 shows a very high FRET efficiency of ~0.9 (Figure 4a), which indicates a collapsed conformation.
A minor comment, if the authors would like to compare the specific activity of different proteins, they should use equal molarities of the different proteins and not equal amounts.
As the Reviewer suggests, we will include experiments at equal molarities in the revision.
- For a one-way ANOVA, the response variable residuals have to be normally distributed. With an n = 3 this cannot be tested. Thus, the quantifications of the results shown in figure 1 and 3 are not reliable.
We thank the Reviewer for their critical comment on the statistical analysis. We would like to clarify that statistically significant differences in aggregation between conditions compared to a control are based on Dunnett’s test. While ANOVA is typically first performed to test for any significant difference in means before performing a post-hoc test, Dunnett’s test is independent and can be performed without ANOVA.
Following the Reviewer’s advice, we carefully re-examined our assumption of normality for this data. It is reasonable to perform Dunnett’s test on a sample size of n = 3, and it is generally safe to assume that data from three independent experiments will be reasonably normally distributed. In support of this, performing Kolmogorov-Smirnov test on our data in Figure 1 showed none of the groups differ significantly from normal distributions with the respective mean and standard deviation (p-values greater than 0.05). Thus, we believe it is reasonable to assume the data are normally distributed, the residuals normally distributed, and our statistical analyses reliable. This analysis will be included in the revision to support the normality assumption.
However, even if we did not assume a normal distribution of our data in Figure 1, we still would have obtained statistically significant differences; If we had relied on a Kruskal-Wallis test as a non-parametric equivalent of ANOVA, thus making no assumption of normality, we would have seen p = 0.005176, a value much lower than our significance level of α = 0.05, indicating sufficient evidence that there is a difference in aggregation among these groups.
- The title is imprecise and overstate the presented data:
'canonical chaperone' suggest that their results are valid for chaperones in general. However, they only tested DNAJA2 in the single -molecule FRET assay. Moreover, HAPA8, another canonical chaperone, obviously had an opposite effect on TDP-43 aggregation (Fig.1). Similarly, they only tested Hero11. Thus, 'canonical chaperone' has to be replaced by 'DNAJA2' and 'a heat-resistant obscure (Hero) protein' by 'Hero11'. Similarly, the term 'conformational modulation' is not as concise one would one expect for the title of a research paper.
We would like to clarify that the Reviewer means HSPA8 (not HAPA8). According to the Reviewer’s suggestion, we will change the title to “DNAJA2 and Hero11 mediate similar conformational extension and aggregation suppression of TDP-43”.
Reviewer #3 (Significance (Required)):
In a recent study (PLosBiol, 2020) the same authors described an interesting class of proteins they call 'Hero'. Based on their analyses in cultured cells and transgenic Drosophila models the authors concluded that 'Hero' proteins protect against protein instability and aggregation. So far, this class of proteins has not been analyzed by independent groups.
In the current manuscript, they mainly confirm their own previous finding that Hero 11 prevents aggregation of TDP-43 and present very few new data that would provide new insights. Specifically, only the FRET assays shown in figure 2 and 4 are really new, which, by the way, could easily be shown in one figure.
We thank the Reviewer for their critical evaluation of our current study. As the Reviewer suggests, we believe our smFRET results provide new insights into how Hero11 and DNAJA2 function. We would like to emphasize that, rather than confirming our previous findings, our current manuscript mainly addresses a critical point that remained unknown in our previous study by investigating the mechanism of how Hero proteins prevent aggregation. Moreover, to our knowledge, this is the first observation of the TDP-43 LCD, with the effect of a pathogenic mutation, at the single-molecule level.
The train becomes a route for marks to travelbetween places, entering publics that might not otherwise have encountered the tag
the train is a medium too. think about mediums other than paper. literally everything that exists in this world could be a medium
This was followed in 1910 by an unpublished manuscript, ‘An Inquiry into the Whole’. In that work he also suggested: "If we had the mental vision, our object would be to penetrate to that concept of the Whole which is no mere aggregation or sum total or compound of parts, but which is itself one and indivisible, a real vital organic unity of which the multiplicities of the universe are not the constituent parts but aspects, phenomena or manifestations."
!- similar to : Nagarjuna’s tetra lemma - https://jonudell.info/h/facet/?user=stopresetgo&max=50&tag=Nagarjuna
Massive, unfulfilling consumption, within the dictates of production and social control, reigns as the chief everyday consolation for this absence of meaning
!- quotable : John Zerzan - this is similar to: David Loy, Byung-Chui Han, Jay Garfield, John Varvaeke - https://jonudell.info/h/facet/?user=stopresetgo&tag=david+loy&max=100&exactTagSearch=true&expanded=true&addQuoteContext=true - https://hyp.is/go?https://hyp.is/go?url=https%3A%2F%2Fwww.meaningcrisis.co%2F&group=world
Progress is an ‘uncontested good’: Theoretically, that means scientific and technological progress is assumed to be a positive irrespective of any evidence to the contrary; practically, though, it means the moment technological or scientific progress is questioned it will often illicit silence, or ridicule, or in the worst case, abuse.
!- comment : progress as an "uncontested good" - progress trap is the contestation - see annotations on progress trap: https://jonudell.info/h/facet/?user=stopresetgo&tag=progress+trap&max=100&exactTagSearch=true&expanded=true&addQuoteContext=true
Author Response
Reviewer #1 (Public Review):
The authors devised a new mRNA imaging approach, MASS, and showed that it can be applied to investigate the activation of gene expression and the dynamics of endogenous mRNAs in the epidermis of live C. elegans. The approach is potentially useful, but this manuscript will benefit by addressing the following questions:
We thank the reviewer for spending time reviewing our manuscript and for the insightful comments.
Major comments:
1) In Figure 1-figure supplement 1, the authors claimed that MASS could verify the lamellipodia-localization of beta-actin mRNAs. However, the image showed the opposite of the authors' claim as the concentration of beta-actin mRNA was lower in lamellipodia than the rest of the cytosol. This result disagreed with ref. 17 (Katz, Z.B. et al., Genes and Development, 2012). Hence, the authors cannot make the statement that "MASS can be readily used to image RNA molecules in live cells without affecting RNA subcellular localization". To thoroughly test this notion, the authors should image beta-actin mRNA using MASS and the conventional MS2 system side by side and calculate the polarization index in the same way as shown in Katz, Z.B. et al., Genes and Development, 2012.
We noticed that b-ACTIN mRNAs were less polarized in our image compared to that shown in Katz, Z.B. et al. (Genes and Development, 2012). It is likely due to different cell lines being used. In the previous study, mouse embryonic fibroblasts (MEFs) were used. In our initial experiment, HeLa cells were used. Our data showed b-that ACTIN mRNAs labeled with MASS could be localized to the lamellipodia.
As suggested by the reviewer, we performed new experiments to image b-ACTIN mRNAs using MASS and the conventional MS2 system side by side in NIH3T3 cells, a mouse fibroblast cell line (MEF cells are not available in our lab). We did not find cells with extensively polarized b-ACTIN mRNAs localization, potentially due to different cell lines. We, therefore, did not calculate the polarization index. However, we found that b-ACTIN mRNAs detected by both methods showed a similar localization pattern. These new data suggest that MASS does not affect RNA subcellular localization. We added the new results and updated Figure 1-figure supplement 3.
2) The experiments that validate this new RNA imaging method are not sufficient. The authors need to systematically compare MASS and the MS2 system, including their RNA signal intensity, signal-to-background ratio.
We have systematically compared MASS and the conventional MS2 system, including signal intensity and signal-to-noise ratio, and measured the velocities of mRNA movement. We found that MASS showed a similar signal-to-noise ratio and higher signal intensity to the conventional MS2 system. We have now revised the information in the text on pages 4 and 5, and in Figure 1-figure supplement 4, 5, and 6.
3) In line with this, does beta-actin mRNA display the same behavior as in (Figure 1C-F) when the mRNA was imaged with the MS2 system? The movies do not indicate the type of motility expected of mRNA. For instance, it seems that almost all of the GFP dots, which are presumably single beta-actin mRNAs, stayed stationary over a time course of tens of seconds (Movie 1). This seems to be very different from what has been observed before. It's not clear that the dots are real mRNAs molecules. This further stresses the importance for them to compare their new imaging system with the conventional MS2 application.
We noticed that the mobility of b-ACTIN mRNAs vary in different cells. It is possible that the mobility of mRNAs was regulated in a cell context-dependent manner.
To confirm that the GFP foci detected are real mRNA molecules, we performed MASS combined with single-molecule RNA FISH. We found that MASS detected a similar number of GFP foci compared to the spots detected by smFISH. In addition, the majority (72%) of GFP foci colocalized with the smFISH spots of b-ACTIN-8xMS2 mRNAs. It is reported that not all MS2 stem-loop will be bound by the MCP (Wu et al., Biophysical journal 2012). As only 8xMS2 was used in MASS, it is likely that some mRNAs were not entirely bound by MCP and were not detected. On the other hand, only sixteen probes were used in the smFISH experiment, and it is possible that some mRNAs were miss labeled by smFISH. Therefore, 100% colocalization of MASS foci with the smFISH spots was hard to achieve. Thus these results suggest that GFP dots are real mRNA molecules. We have added the new data in Figure 1, Figure 1-figure supplement 1, and the text on page 3.
We measured the velocity of (b-ACTIN mRNA movement tracked by MASS and the conventional MS2 system. We added this information in Figure 1-figure supplement 5 and to the text on pages 4 and 5. With the conventional MS2 system, we observed similar behavior to those observed by MASS.
4) The authors claimed that a major advantage of MASS is that it has only 8xMS2 stemloops (350 nt) and overcomes "the previous obstacle of the requirement of inserting a long 1,300 nt 24xMS2". This statement lacks experimental support in this manuscript. The authors need to quantitatively compare the genomic tagging efficiency of 8xMS2 and 24xMS2.
It has been reported by several decent studies that the knock-in efficiency decreases dramatically with increasing insert size. For example:
~10-fold decrease of knockin frequency with a 1085 bp compared to a 767 bp insertion of DNA fragment (Extended Data Fig.8. Wang, J. et al. Nature methods, 2022).
~30-fold decrease of knockin frequency with an 1122 bp compared to a 714 bp insertion of DNA fragment (Figure 3 and Table S1. Paix, A. et al. PNAS, 2017).
In this study, we did not directly examine the knock-in efficiency of 8xMS2 and 24xMS2. Based on published data from other laboratories, we assumed that the efficiency of the knock-in of 8xMS2 (350 nt) would be higher than that of 24xMS2 (~1300 nt).
5) MASS has the same strategy as SunRISER (Guo, Y. & Lee, R.E.C., Cell Reports Methods, 2022). Both methods use Suntag to amplify signals of MS2- or PP7-tagged RNA. The authors need to elaborate the discussions and describe the similarities and differences of the two studies. In particular, the Guo paper needs to be properly referenced.
We have cited the paper and discussed the similarities and differences between our method and the SunRISER (page 7). Taking both studies together, Guo and we demonstrated that it is an efficient strategy to combine the MS2 system and the Suntag system as a signal amplifier for long-term and endogenous mRNA imaging in live cells.
6) In Guo, Y. & Lee, R.E.C., Cell Reports Methods, 2022, they showed that 8XPP7 with 24XSunTag configuration led to fewer mRNA per cell (Figure 5B of the Cell Reports Methods paper). Does MASS, which has 8xMS2 with 24xSunTag, similarly lead to few mRNAs? The authors should compare the number of mRNAs detected by MASS and the conventional MS2, or by FISH.
We compared the number of mRNAs detected by MASS and by smFISH. We performed MASS combined with single-molecule RNA FISH and found that MASS detected a similar number of GFP foci compared to the spots detected by smFISH.
In addition, the majority (72%) of GFP foci colocalized with the smFISH spots of b-ACTIN8xMS2 mRNAs. It is reported that not all MS2 stem-loop will be bound by the MCP. As only 8xMS2 was used in MASS, it is likely that some mRNAs were not entirely bound by MCP and were not detected. On the other hand, only sixteen probes were used in the smFISH experiment, and it is possible that some mRNAs were miss labeled by smFISH. Therefore, 100% colocalization of MASS foci with the smFISH spots was hard to achieve. These data indicated that MASS could label the majority of mRNAs from a specific gene in live cells.
We have added the new data in Figure 1, Figure 1-figure supplement 1, and the text on page 3.
Reviewer #2 (Public Review):
Hu et al. developed a new reagent to enhance single mRNA imaging in live cells and animal tissues. They combined an MS2-based RNA imaging technique and a Suntag system to further amplify the signal of single mRNA molecules. They used 8xMS2 stem-loops instead of the widely-used 24xMS2 stem-loops and then amplified the signal by fusing a 24xSuntag array to an MS2 coat protein (MCP). While a typical 24xMS2 approach can label a single mRNA with 48 GFPs, this technique can label a single mRNA with 384 GFPs, providing an 8-fold higher signal. Such high amplification allowed the authors to image endogenous mRNA in the epidermis of live C. elegans. While a similar approach combining PP7 and Suntag or Moontag has been published, this paper demonstrated imaging endogenous mRNA in live animals. Data mostly support the main conclusions of this paper, but some aspects of data analysis and interpretation need to be clarified and extended.
Strengths:
Because the authors further amplified the signal of single mRNA, this technique can be beneficial for mRNA imaging in live animal tissues where light scattering and absorption significantly reduce the signal. In addition, the size of an MS2 repeat cassette can be reduced to 8, which will make it easier to insert into an endogenous gene. Also, the MCP24xSuntag and scFv-sfGFP constructs can be expressed in previously developed 24xMS2 knock-in animal models to image single mRNAs in live tissues more easily.
The authors performed control experiments by omitting each one of the four elements of the system: MS2, MCP, 24xSuntag, and scFV. These control data confirm that the observed GFP foci are the labeled mRNAs rather than any artifacts or GFP aggregates. And the constructs were tested in two model systems: HeLa cells and the epidermis of C. elegans. These data demonstrate that the technique may be used across different species.
We thank the reviewer for spending time reviewing our manuscript and for the insightful comments.
Weaknesses:
Although the paper has strength in providing potentially useful reagents, there are some weaknesses in their approach.
Each MCP-24xSunTag is labeled with 24 GFPs, providing enough signal to be visualized as a single spot. Although the authors showed an image of a control experiment without MS2 in Figure 1B, the authors should at least mention this potential problem and discuss how to distinguish mRNA from MCP tagged with many GFPs. MCP-24xSunTag labeled with 24 GFPs may diffuse more rapidly than the labeled mRNA. Depending on the exposure time, they may appear as single particles or smeared background, but it will certainly increase the background noise. Such trade-offs should be discussed along with the advantage of this method.
With MCP-24xSuntag, in theory, there will be up to 24 GFP molecules tethered to one MCP molecule, which may lead to the formation of GFP puncta. However, under our imaging conditions (100 ms to 500 ms) with a spinning disk confocal microscopy, puncta of MCP24xSuntag were not detected. As the reviewer suggested, it might be because MCP24xSuntag is diffusing too fast to be detected as a spot.
For the signal-to-noise ratio, we did more experiments and analyses. We imaged overexpressed b-ACTIN mRNAs using the conventional 24xMS2 system or MASS with different repeats of Suntag arrays (MCP-24xSuntag, MCP-12xSuntag, MCP-6xSuntag). For the conventional 24xMS2 system, we followed the previous protocol that added a nuclear localization signal (NLS) to MCP, and b-ACTIN mRNAs were nicely detected with a signal-to-noise ratio of 1.21.
We found that MASS showed a comparable or better signal-to-noise ratio than the conventional 24xMS2 system. (MASS with MCP-24xSuntag: 1.79, MASS with MCP12xSuntag: 1.48, MASS with MCP-6xSuntag: 1.42). These data indicate that using Suntag as a signal amplifier did not increase background noise.
Also, more quantitative image analysis would be helpful to improve the manuscript. For instance, the authors can measure the intensity of each GFP foci, show an intensity histogram, and provide some criteria to determine whether it is an MCP-24xSuntag, a single mRNA, or a transcription site. For example, it is unclear if the GFP spots in Figure 2D are transcription sites or mRNA granules.
Under our imaging conditions, MCP-24xSuntag was not detected as GFP foci.
We performed MASS combined with single-molecule RNA FISH and found that MASS detected a similar number of GFP foci compared to the spots detected by smFISH.
In addition, the majority (72%) of GFP foci colocalized with the smFISH spots of b-ACTIN8xMS2 mRNAs. It is reported that not all MS2 stem-loop will be bound by the MCP. As only 8xMS2 was used in MASS, it is likely that some mRNAs were not entirely bound by MCP and were not detected. On the other hand, only sixteen probes were used in the smFISH experiment, and it is possible that some mRNAs were miss labeled by smFISH. Therefore, 100% colocalization of MASS foci with the smFISH spots was hard to achieve. These data indicated that MASS could label the majority of mRNAs from a specific gene in live cells.
We have added the new data in Figure 1, Figure 1-figure supplement 1, and the text on page 3.
The GFP spots in Figure 2D are not transcription sites, as they were localized in the cytoplasm, not in the nucleus. We imaged exogenous BFP-8xMS2 mRNAs in the epidermis of C. elegans and found that the size of the GFP foci of endogenous C42D4.38xMS2 mRNAs is larger than that of BFP-8xMS2 mRNAs. Those data suggest that the GFP spots in Figure 2D (C42D4.3-8xMS2 mRNA) are mRNA granules. We added those new data in Figure 2-figure supplement 5 and the text on page 7.
Another concern is that the heavier labeling with 24xSuntag may alter the dynamics of single mRNA. Therefore, it would be desirable to perform a control experiment to compare the diffusion coefficient of mRNAs when they are labeled with MCP-GFP vs MCP- 24xSuntag+scFv-sfGFP.
We thank the reviewer for raising this critical issue. We have performed live imaging of bACTIN mRNA using the conventional 24xMS2 system or MASS with different lengths of Suntag arrays (MCP-24xSuntag, MCP-12xSuntag, MCP-6xSuntag). We then measured the velocity of mRNA movement in each imaging condition. We found that compared to the conventional 24xMS2 system, mRNA labeled with MCP-24xSuntag or by MCP-12xSuntag showed a smaller velocity, indicating that heavier labeling affected mRNA movement speed.<br /> In contrast, we found that mRNAs labeled with MCP-6xSuntag showed a similar velocity to that tagged with the conventional 24xMS2 system. Those data pointed out that when MASS is used to measure the speed of mRNA movement, a short Suntag array (MCP6xSuntag) should be used. We added those new data in Figure 1-figure supplement 5 and to the text on pages 4, 5.
The authors could briefly explain about the genes c42d4.3 and mai-1. Why were these specific genes chosen to study gene expression upon wound healing? Did the authors find any difference in the dynamics of gene expression between these two genes?
The function of C42D4.3 and mai-1 is currently not known. Through mRNA deep sequencing, It has been shown that the expression level of C42D4.3 and mai-1 was quickly increased after wounding of the epidermis of C. elegans. We, therefore, choose those two mRNAs for imaging. We added more information about C42D4.3 and mai-1 to the text on page 6.
We observed similar dynamics of gene expression between C42D4.3 and mai-1 (Video 7 ,8, 9).
Reviewer #3 (Public Review):
It is a brilliant idea to combine the MS2-MCP system with Suntag. As the authors stated, it reduces the copies of the MS2 stem loops, which can create challenges during cloning process. The Suntag system can easily amplify the signal by several to tens of folds to boost the signal for live RNA tagging. One of the best ways to claim that MASS works better than the MS2 system by itself is to compare their signal-to-noise ratios (SNRs) within the same model system, such as HeLa cells or the C. elegans epidermis. Because the authors' main argument is that they made an improvement in live RNA tagging method, it is necessary to compare it with other methods side-by-side. The authors claim that MASS can significantly improves the efficiency of CRISPR by reducing the size of the insert, it still requires knocking in several transgenes, which can be even more challenging in some model systems where there are not many selection markers are available. Another possible issue is that the bulky, heavy tagging (384 scFv-sfGFP along with 24xSuntag) can affect the mobility or stability of the target mRNAs. If it also tags preprocessed RNA in the nucleus, it may affect the RNA processing and nuclear export. A few experiments to address these possibilities will strengthen the authors' arguments. I am proposing some experiments below in detailed comments.
We thank the reviewer for spending time reviewing our manuscript and for the insightful comments.
1) For the experiments with HeLa cells, it is not clear whether the authors used one focal plane or the whole z-stack for their assessment of mRNA kinetics, such as fusion, fission, and anchoring. If it was from one z-plane, it was possible that many mRNAs move along the z-axis of the images to assume kinetics. If the kinetics is true, is it expected by the authors? Are beta-actin mRNAs bound to some RNA-binding proteins or clustered in RNP complexes?
One focal plane was used in the experiments showing mRNAs' fusion, fission, and anchoring behavior. We have now added this information in the figure legend of figure 1. Yes, b-ACTIN mRNA are bound to specific RNA-binding proteins, for example, ZBP1, and it has been reported that ZBP1 forms granules with b-ACTIN mRNAs (Farina, K.L., et al., Journal of cell biology, 2003).
2) Some quantifications on beta-actin mRNA kinetics, such as a plot of their movement speed or fusion rate, etc., would help readers better understand the behaviors of the mRNAs and assess whether the MASS tagging did not affect them.
We thank the reviewer for raising this critical issue. We have performed live imaging of bACTIN mRNA using the conventional 24xMS2 system or MASS with different lengths of Suntag arrays (MCP-24xSuntag, MCP-12xSuntag, MCP-6xSuntag). We then measured the velocity of mRNA movement in each imaging condition. We found that compared to the conventional 24xMS2 system, mRNA labeled with MCP-24xSuntag or by MCP-12xSuntag showed a smaller velocity, indicating that heavier labeling affected mRNA movement speed.<br /> In contrast, we found that mRNAs labeled with MCP-6xSuntag showed a similar velocity to that tagged with the conventional 24xMS2 system. Those data pointed out that when MASS is used to measure the speed of mRNA movement, a short Suntag array (MCP6xSuntag) should be used. We added those new data in Figure 1-figure supplement 5 and the text on pages 4 and 5.
3) Using another target gene for MASS tagging would further confirm the efficacy of the system. Assuming the authors generated a parental strain of HeLa cell, where MCP24xSuntag and scFv-sfGFP are already stably expressed (shown in Fig. 1B), CRISPR-ing in another gene should be relatively easy and fast.
For exogenous genes, in addition to b-ACTIN, we imaged mRNAs from three more genes, C-MYC, HSPA1A, and KIF18B, with MASS in HeLa cells. For endogenous genes, we imaged C42D4.3 and mai-1 in the epidermis of C. elegans. These data indicated that MASS is able to image both exogenous and endogenous mRNAs in live cells. We have now added those new data in Figure 1-figure supplement 2, Figure 2-figure supplement 2, and to the text on pages 3, 4, and 6.
4) Adding a complementary approach to the data presented in Fig. 1, such as qRT-PCR for beta-actin, with or without the MASS system would ensure the intense tagging did not affect the mRNA expression or stability.
To address this question, we performed more experiments to test whether MASS affected the mRNA expression and stability. Because b-ACTIN mRNA is very stable; thus it is not suitable for measuring mRNA stability. We, therefore, tested three genes, including C-MYC, HSPA1A, and KIF18B, which were reported as medium-stable mRNAs. We found that MASS did not affect the stability of those three mRNAs in HeLa cells. We also tested the expression level and the stability of endogenous C42D4.3 mRNA in the epidermis of C. elegans and found that both the expression and the stability were not affected by MASS. We have now added those new data in Figure 1-figure supplement 2, Figure 2-figure supplement 2, and to the text on pages 3, 4, and 6.
5) For experiments with the C. elegans epidermis, including at least one more MASS movie clip for C42D4.3 and a movie for mai-1 would be helpful for readers to appreciate the RNA labeling and its dynamics.
We showed two movies (video 7 and video 8) and the snapshots for C42D4.3 mRNA (Figure 2D and Figure 2-figure supplement 3). We also added a movie (Video 9) for mai-1.
6) The difference between Fig. 2D and Fig. 2-fig supp. 3 is unclear. The authors should address the different patterns of RNA signal propagation. Is it due to the laser power used too much, resulting in photobleach in Fig. 2D?
We have noticed the difference between Figure 2D and Figure 2-figure supplement 3. In Figure 2D, GFP foci did not appear within the injury area after wounding. In Figure 2-figure supplement 3, GFP foci quickly appeared within the injury area. Although we kept the laser power setting constant when performing the laser wounding experiment, there are indeed variations in the actual laser power used. As the reviewer suggested, the difference may be due to photobleaching in Figure 2D. Alternatively, it is possible that the location of the injury site or the degree of injury could affect the dynamics of gene expression.
However, we would like to point out that the dynamics of gene expression pattern in Figure 2D (Video 7) and Figure 2-figure supplement 3 (Video 8) is similar. GFP foci of C42D4.3 mRNAs were first detected around the injury sites. Then GFP foci gradually appeared from the area around the injury site to distal regions.
7) Movie 7 is the key data the authors are presenting, but there are a few discrepancies between their arguments and what is seen from the movie. The authors say the RNAs are "gradually spread" (the line 120 in the manuscript). However, it seems that the green foci just appear here and there in the epidermis and the majority of them stay where they were throughout the timelapse. This pattern seems to be different from the montage in Fig. 2-fig supp. 3, which indeed looks like the mRNA spots are formed around the lesion and spread overtime. Additional explanation on this will strengthen the arguments. Given the dramatic increase of c42d4.3 mRNA abundance 1 min. after the laser wounding, there must be a tremendous boost of transcription at the active transcription sites, which should be captured as much bigger and fewer green foci that are located inside the nucleus. Is this simply because those nuclear sites are out of focus or in a similar size as mRNA foci? Regardless, this should be addressed in the discussion.
We apologize for the confusing description of our original data. We wrote "gradually spread", but we did not mean that mRNAs were transcribed at the wounding site and moved to the distal regions. We actually mean that GFP foci first appeared close to the wounding site and more GFP foci gradually appeared at the distal regions. We have changed our writing to "the appearance of GFP foci gradually spreads from the area around the injury site to distal regions".
For the difference between Figure 2D and Figure 2-figure supplement 3, please see our discussion for comment 6.
For transcription, we also expected a boost of transcription after wounding. However, we failed to detect the appearance of bigger GFP foci in the nucleus. We agree with the reviewer that this is because the active nuclear sites are out of focus. The epidermis of C. elegans is a syncytium with 139 nuclei located in different regions and focal planes. With our microscopy, we were able to image only one focal plane, in which there are usually only four to ten nuclei. Therefore, it is likely that the nuclei with active transcription were out of focus. We have now discussed this point in the revised manuscript (page 6).
8) One clear way to confirm that MASS labels mRNAs and does not affect their stability/localization is to compare the imaging data with single-molecule RNA fluorescence in situ hybridization (smFISH) that the Singer lab developed decades ago. The authors can target the endogenous c42d4.3 or mai-1 RNAs using smFISH and compare their abundance and subcellular localization patterns with their data.
To confirm that the GFP foci detected are real mRNA molecules, we performed MASS combined with single-molecule RNA FISH and found that MASS detected a similar number of GFP foci compared to the spots detected by smFISH. In addition, the majority (72%) of GFP foci colocalized with the smFISH spots of b-ACTIN-8xMS2 mRNAs. It is reported that not all MS2 stem-loop will be bound by the MCP. As only 8xMS2 was used in MASS, it is likely that some mRNAs were not fully bound by MCP and were not detected. On the other hand, only sixteen probes were used in the smFISH experiment, and it is possible that some mRNAs were miss labeled by smFISH. Therefore, 100% colocalization of MASS foci with the smFISH spots was hard to achieve. These data indicated that MASS could detect single mRNA molecules and label the majority of mRNAs from a specific gene in live cells. We have now added the new data in Figure 1, Figure 1-figure supplement 1, and to the text on page 3.
We performed more experiments to test whether MASS affected the mRNA expression and stability. Because b-ACTIN mRNA is very stable; thus it is not suitable for measuring mRNA stability. We, therefore, tested three genes, including C-MYC, HSPA1A, and KIF18B, which were reported as medium-stable mRNAs. We found that MASS did not affect the stability of those three mRNAs in HeLa cells. We also tested the expression level and the stability of endogenous C42D4.3 mRNA in the epidermis of C. elegans and found that both the expression and the stability were not affected by MASS. We have now added those new data in Figure 1-figure supplement 2, Figure 2-figure supplement 2, and to the text on pages 3, 4, and 6.
To test whether MASS affected the mRNA localization, we performed new experiments to image b-ACTIN mRNAs using MASS and the conventional MS2 system side by side in NIH3T3 cells, which is a mouse fibroblast cell line. We found that b-ACTIN mRNAs showed similar localization in both methods. These new data suggest that MASS does not affect RNA subcellular localization. We have now added the new results in Figure 1-figure supplement 2.
9) One of the main purposes to live image RNAs is to assess their dynamics. Adding some more analyses, such as the movement speed of the foci, would be helpful to show how effective this system is to assess those dynamics features.
We thank the reviewer for raising this critical issue. We have performed live imaging of bACTIN mRNA using the conventional 24xMS2 system or MASS with different lengths of Suntag arrays (MCP-24xSuntag, MCP-12xSuntag, MCP-6xSuntag). We then measured the velocity of mRNA movement in each imaging condition. We found that compared to the conventional 24xMS2 system, mRNA labeled with MCP-24xSuntag or by MCP-12xSuntag showed a smaller velocity, indicating that heavier labeling affected mRNA movement speed.
In contrast, we found that mRNAs labeled with MCP-6xSuntag showed a similar velocity to that tagged with the conventional 24xMS2 system. Those data pointed out that when MASS is used to measure the speed of mRNA movement, a short Suntag array (MCP6xSuntag) should be used. We added those new data in Figure 1-figure supplement 5 and to the text on pages 4 and 5.
Reviewer #4 (Public Review):
Hu et al introduced the MS2-Suntag system into C. elegans to tag and image the dynamics of individual mRNAs in a live animal. The system involves CRISPR-based integration of 8x MS2 motifs into the target gene, and two transgene constructs (MCP-Suntag; scFv-sfGFP) that can potentially recruit up to 384 GFP molecule to an mRNA to amplify the fluorescent signal. The images show very high signal to background ratio, indicating a large range of optimization to control phototoxicity for live imaging and/or artifacts caused by excessive labeling. The use of epidermal wound repair as a case study provides a simplified temporal context to interpret the results, such as the initiation of transcription upon wounding. The preliminary results also reveal potentially novel biology such as localization of mRNAs and dynamic RNP complexes in wound response and repair. On the other hand, the system recruits a large protein complex to an mRNA molecule, an immediate question is to what extent it may interfere with in vivo regulation. Phenotypic assays, e.g., in development and wound repair, would have been a powerful argument but are not explored. In all, C. elegans is powerful system for live imaging, and the genome is rich in RNA binding proteins as well as miRNAs and other small RNAs for rich posttranscriptional regulation. The manuscript provides an important technical progress and valuable resource for the field to study posttranscriptional regulation in vivo.
We thank the reviewer for spending time reviewing our manuscript and for the insightful comments.
Reviewer #4 (Public Review):
Hu et al introduced the MS2-Suntag system into C. elegans to tag and image the dynamics of individual mRNAs in a live animal. The system involves CRISPR-based integration of 8x MS2 motifs into the target gene, and two transgene constructs (MCP-Suntag; scFv-sfGFP) that can potentially recruit up to 384 GFP molecule to an mRNA to amplify the fluorescent signal. The images show very high signal to background ratio, indicating a large range of optimization to control phototoxicity for live imaging and/or artifacts caused by excessive labeling. The use of epidermal wound repair as a case study provides a simplified temporal context to interpret the results, such as the initiation of transcription upon wounding. The preliminary results also reveal potentially novel biology such as localization of mRNAs and dynamic RNP complexes in wound response and repair. On the other hand, the system recruits a large protein complex to an mRNA molecule, an immediate question is to what extent it may interfere with in vivo regulation. Phenotypic assays, e.g., in development and wound repair, would have been a powerful argument but are not explored. In all, C. elegans is powerful system for live imaging, and the genome is rich in RNA binding proteins as well as miRNAs and other small RNAs for rich posttranscriptional regulation. The manuscript provides an important technical progress and valuable resource for the field to study posttranscriptional regulation in vivo.
There's a fundamental error in your question: commits are not diffs; commits are snapshots. This might seem like a distinction without a difference—and for some commits, it is. But for merge commits, it's not.
Like any journal, Thoreau’s is repetitive, which suggests naturalplaces to shorten the text but these are precisely what need to be keptin order to preserve the feel of a journal, Thoreau’s in particular. Itrimmed many of Thoreau’s repetitions but kept them wheneverpossible, because they are important to Thoreau and because theyare beautiful. Sometimes he repeats himself because he is drafting,revising, constructing sentences solid enough to outlast the centuries.
Henry David Thoreau repeated himself frequently in his journals. Damion Searls who edited an edition of his journals suggested that some of this repetition was for the beauty and pleasure of the act, but that in many examples his repetition was an act of drafting, revising, and constructing.
Scott Scheper has recommended finding the place in one's zettelkasten where one wants to install a card before writing it out. I believe (check this) that he does this in part to prevent one from repeating themselves, but one could use the opportunity and the new context that brings them to an idea again to rewrite or rework and expand on their ideas while they're so inspired.
Thoreau's repetition may have also served the idea of spaced repetition: reminding him of his thoughts as he also revised them. We'll need examples of this through his writing to support such a claim. As the editor of this volume indicates that he removed some of the repetition, it may be better to go back to original sources than to look for these examples here.
(This last paragraph on repetition was inspired by attempting to type a tag for repetition and seeing "spaced repetition" pop up. This is an example in my own writing practice where the serendipity of a previously tagged word auto-populating/auto-completing in my interface helps to trigger new thoughts and ideas from a combinatorial creativity perspective.)
https://omnivore.app/<br /> Open source version of readwise
Originally bookmarked from phone on Sun 2023-01-15 11:25 PM
updated: 2023-01-17 with tag: "accounts"
I'm copying @kael seeing if I can follow mrcolbyrussell since he has some intriguing comments, but then again I don't know how tag actions work at all...
Das Interview der taz mit Olaf Scholz zeigt, dass für die Bundesregierung nach wie vor das weitere Wachstum der Wirtschaft Priorität vor dem Klimaschutz hat, und dass es dabei vor allem darum geht den Wirtschaftsstandort Deutschland so zu sichern, wie er jetzt gerade funktioniert. Einsparen von Energie hat dabei keine Priorität. Scholz spricht sich für eine Steigerung der Stromproduktion durch Erneuerbare aus und fordert 3-4 neue Windräder pro Tag.
That tends to be the biggest cop out excuse for libraries. Just do a major version release. The fact this library lies about the encodingis extremely problematic and causes numerous bugs. Any program currently using this library is already incorrect because of this behavior. Actually exposing the problem makes it easier for people to fix.
in reply to subject of https://hyp.is/VeTJlpN0Ee2mNKOVyQ-B5g/github.com/mikel/mail/issues/902
References to "the World Wide Wruntime" is a play on words. It means "someone's Web browser". Viz this extremely salient annotation: https://hypothes.is/a/i0jxaMvMEey_Elv_PlyzGg
Reviewer #3 (Public Review):
Cahoon set out to demonstrate that sexual dimorphic outcomes of meiosis are caused by different regulations of the synaptonemal complex (SC). In the employed model organism C. elegans it has been shown that the SC consists of at least 6 different proteins (SYP-1-6) and that their assembly into this intricate structure is mutually dependent and that crossover formation is drastically, if not completely abolished, in the absence of individual SC mutants (SYP-5 and SYP-6 are functionally redundant).
The authors employ FRAP analysis and examine the rate of reincorporation of the synapsis components SYP-2 and SYP3 in three different regions of the gonad and compare the incorporation after photobleaching in hermaphrodite and male gonads. They find that SYP-2 dynamics is increased in spermatocytes, whereas in oocytes SYP-3 dynamics is increased. They also found differing profiles of incorporation during the progression of prophase I for those two synapsis components in the two sexes.
Furthermore, the authors show that syp-2/+ and syp-3/+ show signs of haploinsufficiency, as demonstrated by increased embryonic lethality and the missegregation of the X chromosome. In these mutants, the authors examined the kinetics of the appearance of recombination foci, where they used RAD-51 as a measure for progress of homologous recombination and repair pathway choice (repair via the sister versus the homolog and/or non-homologous end joining), MSH-5 for stabilisation of the strand invasion product and COSA-1 as a marker for crossover designation.<br /> The authors show that in the hypomorphs the behaviour of some recombination markers change. The counts of the numbers of COSA-1 are not explaining the missegregation of the X chromosome. The localisation of the crossovers shifts towards the pairing centre chromosome ends in the hypomorphs.
The manuscript is descriptive and the link that dimorphic incorporation rates of SYP-2 and SYP-3 are causative for recombination dimorphisms is not substantiated by the shown experiments. The observed phenomena in the heterozygous syp mutants could be due to general SC defects and not the lack of a critical amount at a specific point during recombination. Overall, the FRAP experiments do not address the possible different synthesis rates of the employed markers (it would be more meaningful to examine the incorporation under protein synthesis inhibitory conditions) or use a photoconvertible tag, that allows the assessment of new synthesis. It has been well documented that in the more distal regions of the gonad gene expression is upregulated. It is not clear what the contribution of differing gene expression of the examined synapsis proteins to the different dynamic behaviour actually is.
Tweets
I created weekly tweets for another class and it was a fun way to interact with others/break up the usual assignments for the class. The tweets had their own respective tag so it was easy to keep track of who tweeted what/look at their opinions
name: string,
Is this from the tag?
Some conflicts and misreading of what’s the structure of the metadata. When you create some tag in the content - #tag - it becomes a “real” tag to Obsidian and to dataview (an implicit field - file.tags). When in frontmatter you write tag: [one, two] or tags: [one, two] it happens two things: Obsidian (and dataview) read the values as real tags (#one and #two) and for dataview they’re target by file.tags (or file.etgs - see docs for understand the difference) - and attention: file.tags are always an array, even if only one value… even if you write tags: one, two But for dataview tag: [one, two] it’s also a normal field with the key tag (or tags) - that’s why if you write tags: one, two it’ll be read as an array if targeted as file.tags and a string - “one, two” - if targeted as tags As normal tags they’re metadata at page level, not at task level or lists level (that is another thing). As tags field it’s also a page level metadata. Topics above are intended to explain the difference between targeting tags or file.tags. And as file.tags they’re page level. So, if you ask for tasks to be grouped by a page level (parent level to tasks), there’s no way to you achieve what you want in that way… because the file.tags is a list of tags, not a flattened values (maybe with another query, with the flatten command…) A second point is related with the conflict you create when you’re using a taks query with the key tags. Why? because task query is a little confusing… it works in two levels at same time: at page level and at tasks level (a file.tasks sub-level of page level). And the conflict exists here: inside tasks level there’s an implicit field called “tags”, i.e., a field for tags inside each task text. For example: - [ ] this is a task - [ ] this is another one with a #tag in the text in this case the “#tag” is a page level tag but also a task level tag. It’s possible to filter tasks with a specific tag inside: TASK WHERE contains(tags, "#tag") This to say: when you write in your query GROUP BY tags it try to group by the tags inside the task level, not by the field you create in the frontmatter (a conflict because the same key field). In your case, because they don’t exist the result is: (2) - [ ] Task 2 - [ ] Task 3
https://forum.obsidian.md/t/group-tasks-by-page-tags-using-dataview/47354/2
A good description of tags in Obsidian and how Dataview views them at the YAML, page level, and task level.
BIOmatodonte
https://mastodon.art/@fediblock
I boost everything from the #fediblock hashtag that isn't noise, reruns, or user-level. Do your own homework beyond that.
<small><cite class='h-cite via'>ᔥ <span class='p-author h-card'>@welshpixie@mastodon.art</span> in "If you're an instance admin/mod struggling to keep up with the fediblock tag, @fediblock is a 'curated' version that filters through the trolling/misuse of the tag and repeat entries, and only boosts the actual proper fediblock content. :)" - Mastodon.ART (<time class='dt-published'>01/05/2023 11:17:52</time>)</cite></small>
Note: This preprint has been reviewed by subject experts for Review Commons. Content has not been altered except for formatting.
Learn more at Review Commons
This study by Ghosh et al. proposes a role for phosphatidylinositol 5-phosphate 4-kinase (PIP4K) in regulating PI3P levels in vivo. They use loss-of-function Drosophila model of the only PIP4K gene (dPIP4K29) to investigate the PI3P and PI(3,5)P2 metabolizing enzymes. First, they showed that loss of function of PIP4K leads to reduced cell size in larval salivary glands and this was attributed to the elevated level of PI3P. Then, they modulated enzymes involved in PI3P metabolism (kinases and phosphatases) and propose the implication of the PI3P phosphatase myotubularin (Mtm) and the Pi3k Class III (PI3K59F) in PIP4K-dependent cell seize control. Finally, as PI3P has an established role in autophagy, they modulate the autophagy related gene (atg1) and connect the observed increase of PI3P level to the upregulation of autophagy in dPIP4K29 model. The authors used genetic manipulations of dPIP4K29 models as well as specialized lipidomic expertise (phosphoinositide measurement using mass spectrometry and PI-kinase/phosphatase assays) to address their conclusions. The experimental strategies were well designed and major conclusions were in line with the obtained results.
Major comments:
Almost yes, however there is two major concerns for me: Concern 1 is about the level of PIP2/PI4,5P2, the product of PIP4K, in the dPIP4K29 model. This was not measured in the study. The authors claim page 5 that: "This observation suggests that the ability of dPIP4K to regulate cell size does not depend on the pool of PI(4,5)P2 that it generates... based on the fact that re-expression a mutation that hPIP4Kβ[A381E] in the salivary glands of dPIP4K29 (AB1> hPIP4Kβ[A381E]; dPIP4K29) (Figure S1A) did not rescue the reduced cell size. This mutation hPIP4Kβ[A381E] was generated in a study by Kunz et al. (2002) where they demonstrated by in vitro kinase assay that it cannot utilize PI5P as a substrate but can produce PI(4,5)P2 using PI4P as a substrate. In the same study, using MG-63 cells, Kunz et al. propose that the A381E mutation did not metabolize PI5P as it lost its plasma membrane localization. In my opinion the author should strength their claim about the role of dPIP4K independently of PI(4,5)P2 by addressing the level of PI(4,5)P2 in their model biochemically by mass spectrometry as they have this powerful tool and support this by using PH-PLCd probe to detect PI(4,5)P2. Also, as they use completely different model as Kunz et al. they should verify, if possible, the localization of hPIP4Kβ[A381E] vs WT PIP4Kβ in salivary glands.
Concern 2: Page 7: The author used Mtm tagged constructs (mCherry and GFP) and measure its phosphatase activity toward PI(3,5)P2 and they did not show any obvious activity. I would like to suggest the use of untagged (or small tag construct, Flag or HA) for the expression experiment in S2R+ cell as it is known that active myotubularins in other cell model as well as in vitro have a strong 3-phosphatase activity toward PI(3,5)P2. By looking at the graph FigS2 Bii, we could clearly see a big disparity within mCherry-Mtm data points. This experiment should be more strengthen by additional experimental points but also by using a positive CTRL where PI(3,5)P2 level drops (inhibition of PIKfyve by Apilimod).
Concern 3: Page 10: "we tagged dPIP4K with the tandem FYVE domain at the C-terminus end of the protein (dPIP4K2XFYVE) to target it to the PI3P enriched endosomal compartment and reconstituted this in the background of dPIP4K29. We did not observe a significant change in the cell size of dPIP4K29" I really don't understand the relevance of this experiment. FYVE tandem will bind to PI3P whenever it was in the cell (Lysosomes, autophagosome). Why the authors claim that the expression of restricted dPIP4K2XFYVE will be restricted to the endosomes. I think that this experiment is confusing and should be removed. - Should the authors qualify some of their claims as preliminary or speculative, or remove them altogether?
See concern 1 to 3. - Would additional experiments be essential to support the claims of the paper? Request additional experiments only where necessary for the paper as it is, and do not ask authors to open new lines of experimentation.
Yes, the proposed experiments in concern 1-3 are not difficult to address as the authors have all the appropriate tools to manage this. - Are the suggested experiments realistic in terms of time and resources? It would help if you could add an estimated cost and time investment for substantial experiments.
Yes. It is not time consuming and not costly according to their expertise, available tools and materials that they used through the study. - Are the data and the methods presented in such a way that they can be reproduced?
Yes - Are the experiments adequately replicated and statistical analysis adequate?
Yes
Minor comments:
Specific experimental issues that are easily addressable.
Yes - Are the text and figures clear and accurate?
The figures needsmore organization. - Do you have suggestions that would help the authors improve the presentation of their data and conclusions?
NO
Referees cross-commenting
Overall, Reviewer #1 and #2 found the study by Ghosh et al interesting well designed and written providing insights into the role of PIP4K in regulating cell seize. However, they comment few points that would be very helpful to improve the study. I am agreeing with both reviewers for the raised comments.
The author addressed how elevated PI3P in dPIP4K29 model impacted cell seize. Indeed, they connected this cell phenotype to the autophagy where PI3P plays a crucial role. However, I am still questioning how deletion of PIP4K enhances PI3P level.
The role of PIP4K in cellular homeostasis and organismal physiology is still unclear. This study brings additional insights into how PIP4K could be involved in important cellular process such as autophagy by regulating additional phsophoinositides.<br /> - State what audience might be interested in and influenced by the reported findings.
Phosphoinositide metabolism<br /> - Define your field of expertise with a few keywords to help the authors contextualize your point of view. Indicate if there are any parts of the paper that you do not have sufficient expertise to evaluate.
Phosphoinositides, Myotubularin, endolysosomal trafficking, skeletal muscle.
Hi Chris Aldrich, thank you for sharing your great collection of hypothes.is annotations with the world. This is truly a great source of wisdom and insights. I noticed that you use tags quite a lot there. Are you tagging the notes inside your PKM (Obsidian?) as much as in Hypothes.is or are you more restrictive? Do you have any suggestions or further reading advice on the question of tagging? Thanks a lot in advance! Warmly, Jan
Sorry, I'm only just seeing this now Jan. I tag a lot in Hypothes.is to help make things a bit more searchable/findable in the future. Everything in Hypothes.is gets pulled into my Obsidian vault where it's turned into [[WikiLinks]] rather than tags. (I rarely use tags in Obsidian.) Really I find tagging is better for broad generic labels (perhaps the way many people might use folders) though I tend to tag things as specifically as I can as broad generic tags for things you work with frequently become unusable over time. I recommend trying it out for yourself and seeing what works best for you and the way you think. If you find that tagging doesn't give you anything in return for the work, then don't do it. Everyone can be different in these respects.
Reviewer #3 (Public Review):
The study addresses a tough question in the study of wild bats: what and where they eat, using both acoustic bio-logging and DNA metabarcoding. As a result, it was found that greater mouse-eared bats made more frequent attack attempts against passively gleaning prey with lower predation success but higher prey profitability than aerial hawking with higher predation success. This is a precious study that reveals essential new insights into the foraging strategies of wild bats, whose foraging behavior has been challenging to measure. On the other hand, the detection of capture attempts, success or failure of predation, and whether it was by passively gleaning prey or aerial hawking were determined from the audio and triaxial accelerometer analysis, and all results of this study depend entirely on the veracity of this analysis. Also, although two different weights and a tag nearly 15% of its weight were used, it is essential for the results of this data that there be no effect on foraging behavior due to tag attachment. Since this is an excellent study design using state-of-the-art methods and very valuable results, readers should carefully consider the supplemental data as well.
she would be stunned by the differences in my/our practice.
Would this 2010 Joyce be stunned by the 2023 school library? What has changed in the last 10 plus years?
Use the follow-up tag to delve further.
I’m a screenwriter. One of the reasons I use Obsidian is the ability to hashtag. It sounds so simple, but being able to tag notes with #theme or #sceneideas helps create linkages between notes that would not otherwise be linked. My ZK literally tells me what the movie is really about.
via u/The_Bee_Sneeze
Example of someone using Obsidian with a zettelkasten focus to write screenplays.
Thought the example appears in r/Zettelkasten, one must wonder at how Luhmann-esque such a practice really appears?
4NO POSTING OR UPLOADING VIDEOS OF ANY KINDTo protect the quality of our group & prevent members from being solicited products & services - we don't allow any videos because we can't monitor what's being said word for word. Written post only.
annotation meta: may need new tag: - can't effectively monitor
Emma, on reaching home, called the housekeeper directly, to an examination of her stores; and some arrowroot of very superior quality was speedily despatched to Miss Bates with a most friendly note. In half an hour the arrowroot was returned, with a thousand thanks from Miss Bates, but “dear Jane would not be satisfied without its being sent back; it was a thing she could not take—and, moreover, she insisted on her saying, that she was not at all in want of any thing.”
Immaturity on Jane's part, I think. Both for being so picky about eating as to make it the pressing concern of all your relations, to refuse perfectly good arrowroot, and then to scour the meadows for your own.
Arrowroot is a food of low nutritional value that was sought after by people who had various food intolerances.
There are connections to racism as it relied on slavery for mass production and exportation and the obsession with 'purity' also has ideological similarities with reference to race.
http://www.digitalussouth.org/vegetable/vegetable.php?vegName=Arrow%20Root
gipsies
Here is a link to a post about the Romany of England during the regency. It says that to even have spoken with these people during the time was a crime and that might account for some of Harriet's fear. It also adds another dimension to the conflation of 'othering' of children, the poor, and racism.
https://janeaustensworld.com/tag/gypsies-in-regency-england/
I had been wrapping my components with an improper tag that is, NextJS is not comfortable having a p tag wrapping your divs, sections etc so it will yell "Hydration failed because the initial UI does not match what was rendered on the server". So I solved this problem by examining how my elements were wrapping each other.
Note: This preprint has been reviewed by subject experts for Review Commons. Content has not been altered except for formatting.
Learn more at Review Commons
Summary:
Cohen et al. presented a high-throughput approach to analyze protein-(putative) substrate interactions in yeast using BirA biotin ligase and its acceptor peptide AVI tag. Using this system, the authors identified the common and unique substrates of translocation pores, Sec61 and Ssh1. Interestingly, the differential substrates between Sec61 and Ssh1 seem to be explained by the degree of hydrophobicity in signal peptide sequences, which was also nicely demonstrated by an experiment showing that swapping the first three amino acids of substrate proteins is sufficient to convert the substrate specificity. While I appreciate that the approach is high-throughput and simple (does not require mass spectrometers), there are some technical comments to be addressed.
Referees cross-commenting
The comments from reviewer #1 are reasonable and would further strengthen the quality of the paper.
The approach is high-throughput and simple (does not require mass spectrometers).
The differential substrates between Sec61 and Ssh1 seem to be explained by the degree of hydrophobicity in signal peptide sequences, which was also nicely demonstrated by an experiment showing that swapping the first three amino acids of substrate proteins is sufficient to convert the substrate specificity.
keep your gout causes notes
GoutPal Links Tip:
Annotations like this are an ideal way to start a personal gout causes project. Because you can add a question or a personal fact on any page. And use a causes tag to quickly find every note you ever made about your gout causes. Then with one click on your causes tag, you instantly link to your own Personal Gout Causes Research Project.
You can add more than one tag. For example, you might identify one of the 5 types of gout causes. Or just differentiate between avoidable and unavoidable causes. But remember that for practical purposes, you need to be able to avoid a cause immediately. For example, consider if obesity is causing your gout. Permanent weight loss takes time. So you must discuss with your doctor the risks of delaying uric acid treatment. Balancing those risks with the benefits of getting uric acid safe immediately, and then reducing gout treatment to zero as you lose weight.
For more explanations and tips about GoutPal Links, subscribe to my newsletter: Subscribe to Free GoutPal Links <span class="gumroad-button-logo"></span>
Subscription is free, and your email address is safe. Because I will never share it with anyone else. I use Gumroad to provide this service, as described at GoutPal Links Newsletter Service.
keep your gout symptoms notes linked here
GoutPal Links Tip:
You might record your gout symptoms in a spreadsheet. But sometimes you want to make a quick note. Then log the details later. In which case, annotations like this are ideal. Because you can add a question or a personal fact on any page. And use a symptoms tag to quickly find every note you ever made about your gout symptoms.
Or forget the spreadsheet, and just use these notes. Then with one click on your symptoms tag, you instantly get your own Gout Symptoms Journal.
For more explanations and tips about GoutPal Links, subscribe to my newsletter: Subscribe to Free GoutPal Links <span class="gumroad-button-logo"></span>
Subscription is free, and your email address is safe. Because I will never share it with anyone else. I use Gumroad to provide this service, as described at GoutPal Links Newsletter Service.
Note: This rebuttal was posted by the corresponding author to Review Commons. Content has not been altered except for formatting.
Learn more at Review Commons
Reviewer 1
Although this is an interesting, and generally well-performed study, it is primarily observational and there are few mechanistic insights provided into how MUC13 modulates barrier function. The authors propose a presumably direct interaction between MUC13 and PKC, which apparently sequesters PKC, preventing this kinase from triggering PKC-dependent increases in TJ barrier function; however, there is no evidence that a MUC13-PKC interaction occurs, that MUC13 is phosphorylated by PKC, or that phosphorylation of MUC13 has any impact on its function or overall barrier function. Thus, the hypothesis is not directly tested and all observations in this manuscript are generally correlative in nature.
While the MUC13 cytoplasmic tail contains a putative PKC-binding motif, we indeed do not show a direct interaction between MUC13 and a member of the PKC family in this manuscript. Unfortunately, we have so far not been able to successfully perform (co-)immunoprecipitation of MUC13 with our current anti-MUC13 antibodies.
To provide more insights into the possible MUC13-PKC interaction, we plan to perform several experiments.
Consider quantifying all blots (Fig. 5C, Fig. 6B).
As suggested, we will quantify both blots.
Consider using dot-plots for all quantified data.
The graphs will be altered to include individual measurement points.
Reviewer 2
Fig2E showed two bands with different size in the two MUC13 WT control cell lines. They hypothesized that this could be the consequences of glycosylation different patterns. A sample with untransfected HRT18 might be included in the western blot panel. Additionally, what is the 100kDa band?
Mucin blots are notoriously difficult and these MUC13 blots are the result of a lot of trial and error. We repeated the Western Blot with original HRT18 cells, HRT18 original cell line, as well as the two CRISPR control cells used in the study (WT 1 and WT 2) and one of the full-length MUC13 knockout cells. The higher band was absent from the MUC13 knockout cells, but a small shift in the MUC13 band size can be noted in the WT 1 cells compared to the original and the WT 2 cell lines, possibly indicating a change in the glycosylation pattern. The 100 kDa band remains detectable in all cell lines including the ∆MUC13 cell line, therefore we consider this to be an aspecific background band of the MUC13 antibody. We will add a more extensive Western Blot analysis to the manuscript.
Did the transfection of the inducible GFP-MUC13 plasmid induce any decrease of Claudin1/3/4 in HRT18 or Caco2 cells? Same question regarding PKCdelta.
These are indeed interesting questions. We will perform these experiments with our MUC13-overexpression HRT18 cells.
Reviewer 3
Moreover, the authors should determine if MUC13∆CT localize to TJs, as suggested by the working model in Figure 7C. The subcellular localization of MUC3∆CT could give critical clues for its function, but Figure 2G fails to provide any information and the authors do not present any additional data concerning the localization of MUC13∆CT. Detection of MUC13 in membrane fractions of WT, MUC13∆CT and cells lacking the mucin domain could be a feasible strategy forward.
We will perform additional immunofluorescence experiments to determine the subcellular localization of MUC13-∆CT more accurately. However, detection of the extracellular domain by western blot, as suggested, is not possible due to the incompatibility of the extracellular MUC13-directed hybridoma antibody with the western blot technique. We currently do not have a suitable antibody that recognizes the ED and can be used for western blot.
The authors introduce an inducible MUC13-GFP fusion protein into WT and ∆MUC13 cells and show that it reverses the enhanced TEER upon MUC13 deletion. Unfortunately, the "Materials and Methods" section lacks adequate information on how this fusion protein was designed. Critical questions are the position of the GFP tag within MUC13, whether the fusion protein is correctly processed in HRT18 cells, and if it localizes to the apical or apico-lateral membrane domains? Figure 2H is of low magnification and fails to provide information on the subcellular localization of the MUC13-GFP fusion protein.
The materials and methods section will be adjusted to describe all the design details of the fusion protein. The GFP tag was added to the MUC13 C-terminus with a GGGS linker sequence in between. Processing of the fusion protein seems correct as we observed MUC13-GFP localization to both lateral and apical membranes and no access intracellular build up. As suggested by the reviewer, we will add more detailed immunofluorescence pictures to the manuscript.
Figures 6B-C suggest that PKCdelta levels increase in ∆MUC13 cells, which correlates with higher enrichment of Claudins in membrane fractions. The authors then inhibited PKCdelta and observed reduced recruitment of Claudins to membrane fractions. Since the family of Claudins are differentially regulated by phosphorylation (PMID: 29186552), the authors should investigate the TEER phenotype of WT, ∆MUC13 and MUC13∆CT upon PKC inhibition.
We must clarify that figures 6C-D are done using the PKC inhibitor targeting all conventional PKCs (alpha, beta, gamma) as well as delta (https://www.tocris.com/products/gf-109203x_0741). We recently obtained a PKCdelta-specific inhibitor which we will test in the TEER build-up experiments.
Moreover, the authors predict phosphorylation sites in MUC13CT and suggest a link between PKC and MUC13 (Figure. 6A), however no evidence is presented to support this hypothesis. The authors should either determine if PKC phosphorylates MUC13 and if this modification has implication on MUC13 localization and TJ function, or remove statements regarding MUC13 phosphorylation. The data provided suggest that PKC regulates TJ proteins independent of MUC13.
We will adjust the manuscript to put less emphasis on the putative PKC motifs in the MUC13 cytoplasmic tail. For further details on how we will proceed regarding the possible MUC13-PKC interaction see question 1 from reviewer #1.
Figure 5C. Quantification of at least 3 independent experiments is required.
These data will be added to the manuscript.
Figure 6B. Quantification of at least 3 independent experiments is required.
These data will be added to the manuscript.
Reviewer 4
OPTIONAL: MUC13 is expressed both, in the basolateral membranes and in the apical membrane of intestinal epithelial cells (IECs). Does the authors check the relevance of MUC13 in the formation of microvilli in IECs? Are microvilli different (microvilli staining, number of positive cells to microvilli, length, width or distribution of microvilli) in ΔMUC13 and in MUC13-ΔCT? How the glycocalyx looks like in these cells genetically modified for MUC13?
HRT18 cells do not seem to develop microvilli. However, we plan to stain these cells with a microvilli-specific antibody (ACTUB). The HRT18 cells express mostly MUC13 and relatively low levels of the larger TM mucin MUC1. To study changes in the glycocalyx, we will stain using a MAL-II antibody which targets α-2,3 sialic acids, which are abundantly present in mucins. In this way, we will determine any big changes in the total glycocalyx that may occur in response to the removal of MUC13.
In the figure 1D would be nice to represent the co-localization of MUC13 together with occluding in a graph in each Z-stack so you can visualize in which part of the cell is maximum colocalization of these both components.
These data will be provided.
In the figure 1E, would be great to compare between the two different MUC13 antibodies the apical fraction stained in HRT18 and Caco-2. Specially in the HRT18 cell line since the first antibody did not label apical MUC13 expression meanwhile the second antibody detects the apical expression in these cells. How much lateral lateral stain the C terminal antibody compare with the extracellular antibody for MUC13 and how much stain apically the C terminal antibody compare with the extracellular antibody? Would be nice to see some comparative results using the intensity by Z-stack and plotting in a graph.
This is a good suggestion as it is quite intriguing that both MUC13 antibodies seem to target (partially) different MUC13 populations. We will perform co-staining with both MUC13 antibodies to provide information on which MUC13 populations are detected by each antibody (apical vs lateral membrane).
Manuscript would be improved if in the figure 2H to compare within the same cell line the number of MUC13 positive cells in the WT, number of MUC13 positive cells in WT+pMUC13 and the number of MUC13 positive cells in the ΔMUC13+pMUC13
We will quantify the percentage of MUC13-GFP positive cells in both the WT and ΔMUC13 backgrounds by either microscopy or flow cytometry.
In figure 5C would be helpful to plot in a graph the normalized expression of each TJ protein and compare between the different cells used (WT, ΔMUC13 and MUC13-ΔCT) as you did in figure 5A
We will provide the quantification data of three independent experiments.
Reviewer 1
In addition, this model does not explain why all kinase inhibitors tested reverse the increase in TER observed in deltaMUC13 cell lines. Does this reflect the lack of inhibitor specificity or the likelihood that many kinases are involved?
As stated in the manuscript, we think that MLCK, ROCK, and PKC are all essential for TER buildup in the ∆MUC13 cells. Because the roles of MLCK and ROCK are well established, we choose to follow up on the PKC results. We adjusted the text to clarify this point.
The authors do observe that there is an increase in expression of several tight junction-associated proteins, including the claudins, in deltaMUC13 cells. Affected CLDNs include 1, 2, 3, 4, 7, 12. (1) While it appears the authors are arguing that this increased claudin expression results in increased barrier function, they do not sufficiently highlight the well-known role that CLDN2 has in cation transport, and both CLDN-4 and -7 have also been implicated in paracellular ion flux (although this is apparently cell-type specific). These observations would seem to argue against a simple correlation between claudin expression and tight junction barrier function.
The reviewer is right about the different functions of claudins. Claudin-2, -4 and -7 have (potentially) pore-forming properties, while the other claudins restrict paracellular passage. It has been previously demonstrated that the magnitude of paracellular ion and water flux is reflected by the specific repertoire of claudin family members (Shashikanth et al., 2022). In this paper, overexpression of claudin-4 was shown to mobilize and affect polymeric strands of claudin-2, thus blocking its channel activity. Our mass spectrometry data demonstrated a striking increase in claudin-1, -2, -3, -4, -7, and -12 in the MUC13 knockout membranes compared to WT. We hypothesize that the claudin repertoire in the MUC13 knockout cells leads to a more restricted paracellular route (as observed in the TEER and tracer experiments). The pore-forming claudins may be subject to “interclaudin interference” therefore leading to restriction of the total paracellular ion and water flux. We have adjusted the text of the manuscript to clarify this point.
We attempted to investigate claudin-2 expression levels in isolated membranes by Western Blot but were unsuccessful as the antibody did not detect any protein while claudins-1 and -4 could be detected with the same method.
Furthermore, the authors should note the disconnect between paracellular ion flux mediated by claudins and the flux of markers such as dextrans and lucifer yellow, which can be dissociated from claudin function.
We acknowledge that the flux of larger particles (the leak pathway) is not regulated by claudins (which regulates the pore pathway). We aimed to assess both the pore and the leak paracellular pathways, by using different techniques including TEER, small solutes (Lucifer Yellow CH), and larger molecules (4 and 70 kDa FITC-Dextrans). HRT18 wild type cells are already very restrictive to the pass of larger molecules (FITC-Dextrans) but are more permeable to smaller solutes such as Lucifer Yellow (400 Da). We observed that removal of the MUC13 cytoplasmic tail did not affect the TEER, but reduced the paracellular passage of Lucifer Yellow, demonstrating that manipulation of MUC13 can affect both the pore and leak pathways. We adjusted to text to include this point.
The increased expression of claudins in the nominally tail-minus MUC13 without a corresponding change in TER would again seem to argue against a simple correlation;
MUC13-dCT cells showed consistently increased levels of claudins-1 and -2, but not the other claudins. This claudin repertoire (with high claudins-1 and -2, but lower claudin-3, -4, -7, and -12) is apparently not enough to increase TEER. We think that this again reflects the importance of the total claudin composition for the control of the paracellular pathway.
Watch the use of decimal points instead of commas (lines 253 and 256).
Corrected.
Line 543: MilliQ is not a washing agent (or is it?). (Line 535) We use MilliQ as a final step before mounting the glass slides to remove any possible salt deposition that would affect the visualization by microscopy.
We have specified this in the text.
Line 553: TER is the product of total resistance times the area. The units are ohms times area.
Indeed, we have changed this mistake (line 545).
Line 630: Please provide the transfer conditions (voltage, amp, watts?) and transfer buffer when describing the Western blot protocol.
For immunoblotting of MUC13, protein lysates were transferred to 0.2 µm PVDF membranes using the Trans-Blot Turbo Transfer system (Biorad). The transfer was run using the protocol (High MW) which consisted in running for 10 min at 25 volts (V) and 1,3 amperes (A). These experimental data were added to the manuscript.
Reviewer 2
My main concern about this manuscript is that the authors analyzed MUC13 role in intestinal homeostasis and function using colorectal cancer cells. As helpful as cancer cells are, we should always be cautious about extrapolating roles in normal intestinal epithelium or IBD pathology. Obviously, these finding are also interesting in a cancer context. Using GEPIA (http://gepia.cancer-pku.cn/), I observed that MUC13 is overexpressed in colorectal cancer COAD-TCGA dataset (compared to normal colon from GTEX). Similar results were obtained previously by Gupta et al. (ref #10). I am aware that this would be difficult to confirm the main findings in a non-cancerous intestinal cell line but this limit (normal intestine using cancer cells) should be at least discussed in the manuscript.
We appreciate the reviewers’ comments and are aware of the downsides of using cancer-derived cell lines. We have performed the GEPIA analysis ourselves and have an ongoing project about the possible role of MUC13 in colorectal cancer progression. In a separate project, we are collaborating with the Gaultier Laboratory at the University of Virginia which has generated a MUC13 knockout mouse. This model will allow us to study the role of MUC13 in non-cancerous tissue. We recently received intestinal biopsies from these mice which will be stained with MUC13 and claudin antibodies to determine localization in healthy tissue. These experiments will reveal if MUC13 colocalizes with claudin on the lateral membrane in the healthy mouse intestinal tract. In future experiments, we will also address MUC13 localization and function in human intestinal organoids. We have adjusted the discussion to refer to the limitations of using cancer cell lines.
Massey et al (Micro 2021, PMC7014956) previously showed that MUC13 overexpression increased rigidity in PDAC cells and discussed involvement MUC13 link with EMT. MUC13-Her2 interaction was also associated with decrease of E-cadherin suggesting an EMT phenotype. This should be included in the discussion section.
The discussion has been adjusted to include the link with EMT.
The authors performed mass spectrometry analysis. Results are deposited on ProteomeXchange but are not yet publicly released. Among the 1189 membrane protein identified. Did the authors observed alteration of EMT proteins? (decrease of vimentin for example). In the discussion section (lane 347), the authors mentioned the relationship between other membrane bound mucins such as MUC1, MUC4, MUC16 or MUC17 and AJ/TJproteins. Did the authors observed any alteration of these mucin in the mass spectrometry data?
The mass spec analysis was performed on membrane fractions, therefore our dataset will not contain true cytosolic proteins. One of the key EMT proteins, Vimentin, is a cytosolic protein, and indeed it was not found in our dataset. Other EMT-related proteins are shown in the following table. TGF beta 1 was slightly decreased, while E-cadherin and Integrin beta 6 were slightly increased in the ∆MUC13 cells compared to WT cells.
Gene Name
Mean WT
Mean ∆MUC13
Mean MUC13-∆CT
TGFBI (TGB beta 1)
20,54
16,48
18,83
CDH1 (E-cadherin)
22,69
24,57
24,24
ITGB6 (Integrin beta 6)
18,86
21,74
19,19
Vimentin - Cytosolic
-
-
-
CDH2 (Cadherin-2, N-cadherin)
-
-
-
Mucins are large proteins comprised of densely O-glycosylated mucin domains, which makes them extremely challenging to study by mass spectrometry (MS) (Rangel-Angarita et al., 2021). We did not specifically employ mucin-directed technologies in this dataset, thus making the detection of mucins hard. No mucins other than MUC13 were detected. For MUC13, two peptides corresponding to the EGF-like domains in the extracellular domain, a region that is less densely glycosylated. We added a sentence to the description of the mass spec results to include the EMT proteins and other mucins.
Minor points:
Lane 126: HRT18 and Caco2 colon cancer cells instead of intestinal epithelial cells
Corrected.
Lane 181 and lane 514: add "full length" MUC13 DNA sequence
Corrected.
Lane 234: TEER was measured every 12h. How the authors did observed the largest increase at 42h? Was it 48h? Please clarify.
We aimed at measuring every 12 h, however the exact measurements were done at 18h, 24h, and 42 h post-infection. We have corrected this in the manuscript.
Reviewer 3
Line 43 and 46. "Enterocytes" should be replaced with "intestinal epithelial cells", since enterocytes are themselves a distinct subpopulation of IECs.
We have changed it in the manuscript.
Lines 58-60. References in support of the statements should be added.
We added a reference to this sentence.
Lines 188-190. Authors comment on "roundness" of different cell lines. If the parameter is critical for the manuscript, the authors should quantify this phenotype.
The parameter is not critical for the manuscript. We removed the sentence.
Figure 3A. Staining of cell lines should include panels showing localization of MUC13.
Co-staining of MUC13 with occludin in HRT18 cell lines can be found in figure 1D, and MUC13 with E-cadherin in supplementary figure 1.
Lines 323-327 and 390-392. Sentences on these lines contradict each other. The sentences should describe/discuss quantified data presented in Figure 6D.
The reviewer is right that we should be discussing the quantified data in 6D. We adjusted the sentence in line 323-327.
Proteomic data sets should be made publicly available on data depositories.
All proteomics raw data were deposited to the ProteomeXchange Consortium with the dataset identifier PXD029606.
Reviewer 4
OPTIONAL: In the figure 2E, is the extracellular antibody still detecting the MUC13-ΔCT?
No, unfortunately the antibody directed against the MUC13 ED is not compatible with western blot.
In the figure 2G, would be nice to comment possible reasons why the deletion in the first cell line of the MUC13-CT you can still detect with the extracellular antibody some lateral expression of MUC13 meanwhile in the second cell line, the same deletion (MUC13-CT) you cannot see any lateral MUC13 staining with the extracellular antibody.
Yes, this is indeed a puzzling finding, especially because the CRISPR deletion is the same in both cell lines. We will add a sentence about possible reduced stability of the MUC13 without CT domain that leads to a different outcome in both cell lines.
It would be nice that the results from Figure 3H are better explained since it is difficult to follow.
We adjusted the text to explain the experiment in more detail.
Reviewer 1
The authors may be overly reliant on TER measurements. Epithelial cells have two parallel resistive pathways: transcellular and paracellular. TER measure the contribution of both. Thus, an increase in TER could result from a decrease in transcellular ion transport. The authors need to measure transcellular ion flow or selectively measure the junctional resistance in a select set of experiments to rule this possibility out.
The reviewer is right that TEER is a sum of the resistance of the transcellular and paracellular pathways. However, due to the high resistance of cell membranes, the current predominantly travels via the paracellular route (Elbrecht et al., 2016). For this reason, TEER measurements are widely accepted techniques for the assessment of ions passage through the paracellular pathway (Shen et al., 2011).
Reviewer 3
Figure 1C. Caco2 and HRT18 cells exhibit distinct MUC13 expression patterns when probed with an antibody against the MUC13 CT; MUC13 localizes almost exclusively to lateral cell junction in HRT18 cells, while a higher portion of MUC13 is present on the apical surface of Caco2 cells. This observation has two possible explanations: 1) the two cell lines express distinct forms of MUC13, or 2) the two cell lines carry distinct machineries for anchoring MUC13 to apical versus apico-lateral membranes. Thus, The authors should take the opportunity to determine the impact of MUC13 deletion on TEER and TJ function in Caco2 cells. Proteomic analysis and functional assays in Caco2 cells may provide more a general mechanism for how MUC13 regulates TJ proteins.
Yes, this would be a great line of investigation. However, we aimed to knockout MUC13 in Caco-2 cell lines (with the same CRISPR/Cas9 protocol as the HRT18 cells) but were unable to obtain Caco-2 knockout clones. We think this might be a consequence of the poor capability of Caco-2 cells to grow as single colonies (a required step in the protocol). Another option is Caco-2 MUC13 knockout cells have reduced viability.
The authors generate cell lines that either lack MUC13 or express MUC13 lacking the cytoplasmic domain. Loss of MUC13 cells resulted in enhanced TEER and increased recruitment of TJ proteins to membrane fractions. MUC13∆CT cells show moderate recruitment of TJ proteins to membranes and no increase in TEER but inhibit paracellular diffusion of Luciferase Yellow across monolayers. Figure 3A suggests that Occludin redistributes to tricellular junctions in ∆MUC13 cells, whereas it is found more laterally in WT and MUC13∆CT cells. These finding suggest that full-length MUC13 interferes with TJ protein complexes. However the impact of the extracellular and intracellular (CT) domains is not fully elucidated. Does the O-glycosylated mucin domain interfere with the extracellular domains Occludin and Claudins? The authors should clarify the contribution of the mucin domain to the observed phenotype, for example by performing the described experiments in a cell line expressing MUC13 lacking the mucin domain.
Mucins are type I membrane proteins with the N-terminal part of the protein on the extracellular site. Therefore, a CRISPR method to specifically remove the glycosylated domain but leave the remainder of the protein in frame is challenging. An additional difficulty is that the ED contains a lot of repeats, complicating the design of specific guide RNAs. To specifically address the contribution of the glycosylated domain, we could complement the MUC13 knockout cell with a construct lacking the ED. However, this would not be comparable to the endogenous MUC13∆CT cell line presented in this manuscript. In future studies, we will strive to address the functions of the different MUC13 domains in more detail.
Figure 5A. Turnover of TJ proteins in membrane fractions occurs faster than over a period of 1-3 days (PMID: 18474622). The authors should determine TJ protein turnover over a period of minutes and hours.
We acknowledge the findings in this interesting paper concerning the continuous remodeling of tight junctions. However, the readout of our biotinylation assay is degradation and the timeframe of degradation turns out to be days and not hours. Within this timeframe remodeling is taking place but it cannot be captured in the total lysate.
Reviewer 4
OPTIONAL: The authors show that the probiotic Lactobacillus plantarum increase epithelial barrier independently of MUC13. Have the authors considered to use other probiotics as Lactobacillus paracasei (10.3389/fcimb.2015.00026), Akkermansia muciniphila (10.1038/emm.2017.282) or some metabolic products from intestinal microbiota as short-chain fatty acids (SCFAs) (10.3389/fphys.2021.650313) to check what is the role of MUC13 and if it is related with other microbe or microbiota metabolite?
Thank you for the suggestion. We have an ongoing project in which we investigate the impact of different probiotic bacteria and plan to investigate whether they have an impact on the epithelial barrier function in a MUC13-dependent manner. This study will lead to a separate publication.
OPTIONAL: The authors successfully delete MUC13 in IECs, both, full length and the cytosolic tail. Have the authors considered targeting the deletion of the PTS domain in MUC13? Could affect that something different from paracellular trafficking as the extracellular detection of microbes and microbial products?
Removal of a domain in the extracellular domain of MUC13 with CRISPR is challenging because mucins are type I membrane proteins, the repeats and possible frameshift, as described above.
Note: This preprint has been reviewed by subject experts for Review Commons. Content has not been altered except for formatting.
Learn more at Review Commons
Summary:
The authors describe a novel function for transmembrane mucin MUC13 in regulation of tight junctions (TJs) that create an impermeable cell monolayer that allows. paracellular diffusion of very small molecules. The authors use cultured intestinal epithelial cell monolayers. to demonstrate that MUC13 localizes to the apical aspects of IECs as well laterally to tight junctions. CRSIPR/Cas-mediated deletion of MUC13 increased transepithelial resistance (TEER) and reduced the extent of paracellular diffusion of <0.5 kDa molecules across the monolayer. Proteomic analysis revealed that specific TJ proteins are enriched in cell membrane fractions upon deletion of MUC13, while pharmacological inhibition of PKC involved in actomyosin contractility, resulted in loss of TJ proteins from cell membranes and TEER reduction. See major comments for a detailed discussion concerning the findings.
Major comments:
Minor comments:
Mucins participate in critical functions in the human intestine. Gel-forming mucins form the mucus layers that separate the gut microbiota from the underlying intestinal epithelial cells (IECs) (PMID: 18806221). Transmembrane mucins are instead anchored to the plasma membrane of various populations of IECs (PMID: 32169835; PMID: 28052300). Despite its discovery over 20 years ago, the functional role of MUC13 in the intestinal epithelium is still debated. MUC13 is expressed in human small intestine and colon under baseline conditions and is dysregulated during inflammation and tumorigenesis, as described by the authors. Thus, understanding how MUC13 expression and localization impact cell function is of great importance for elucidating its function in health and disease. Studies so far have identified transmembrane mucins as biophysical barriers against bacteria (PMID: 33596425) or facilitators of bacterial invasion (PMID: 33824202). The current manuscript can potentially offer novel conceptual insights into how transmembrane mucins govern the integrity of the epithelial monolayer that serves as a firewall between the multitude of microbes in the gut lumen and the immune system. Such insights have implication for both basic and clinical research on inflammatory bowel disease (IBD) and colorectal cancer (CRC). However, while the authors present convincing data that deletion of MUC13 enhances TEER and recruitment of TJ proteins, the study in its current form fail to provide mechanistic proof of how MUC13 impacts individual TJ proteins. Moreover, it is not clear if findings in a specific cultured cell line (HRT18) can be extrapolated to other frequently used intestinal cell lines (e.g. Caco2) and IECs in an in vivo setting. The latter is particularly important since the authors argue that their findings have important implication in intestinal inflammation and cancer.
CodeFormer V0.1.0 Release
restorasi gambar
Reviewer #1 (Public Review):
This paper investigates whether bistable rhodopsins can be used to manipulate GPCR signalling in zebrafish. As a first step, the authors compared the performance of bistable rhodopsins fused with a flag tag or with a fluorescent protein tag (TagCFP). Constructs were compared by expressing in HEK cells followed by calcium imaging with aequorin or cAMP monitoring with GloSensor. This showed that the protein with a smaller flag tag performed better. Then, a series of transgenic zebrafish lines were made, in which tagged rhodopsins were expressed in reticulospinal neurons or cardiomyocytes.
The data indicate that bistable rhodopsin can be used to manipulate Gq and Gi/o signalling in zebrafish. The Gq-coupled SpiRh1 was effective in manipulating reticulospinal neurons, as indicated by analysis of tail movements and calcium imaging of the neurons. Gi/o signalling could be manipulated by Opn3 from mosquitoes, TMT from pufferfish, and parapinopsin from lamprey, as shown by their effects on the heartbeat. Lamprey parapinopsin has the interesting property that it can be turned on and off by different wavelengths of light, and this was used to stop and restart the heart. Finally, the authors show that the cardiac effects are mediated by an inward-rectifier K+ channel, through the use of pharmacological inhibitors.
A strength of this paper is the testing of a range of bistable rhodopsins, with a total of 10 proteins tested. This provides a good resource for future experiments. A weakness is the failure to show that some experiments involved repeated sampling of the same animal. Figure 3 gives the impression that there are 48 independent datapoints. However, there are 8 animals, with 6 datapoints coming from each. Similarly, Figure 4 shows the data from 6 trials of 4 animals, not 24 independent animals. Repeated sampling should be reflected in the data presentation, and in the statistical analysis. Was there an effect of trial number, which is suggested in Figure 6?
Delta F/F refers to relative change, which should be (F-F0)/F0. This should be zero when t = 0. The values in Figure 3E, and 3F are ~ 1 when t = 0, however. Are these figures showing F/F0?
The authors' conclusions that the bistable rhodopsins are useful tools in the zebrafish system appear largely justified. This is consistent with findings from other organisms, including mouse (https://www.ncbi.nlm.nih.gov/pmc/articles/PMC8097317/, https://www.sciencedirect.com/science/article/pii/S0896627321001616). The tools here are likely to find broad use by scientists who use the zebrafish as the experimental system for a variety of different areas.
Note: This rebuttal was posted by the corresponding author to Review Commons. Content has not been altered except for formatting.
Learn more at Review Commons
Reviewer 1.
Major point:
(1) The authors rely upon the redistribution of RNA to measure the inheritance of extant RNAs following cell cycle release. Blocking transcription nicely shows new synthesis is not required for this inheritance. This is also consistent with the idea any newly synthesized RNA would be 'dark,' or not EU labeled, but the transcription inhibitor experiments are critical controls and nicely done. As hinted at the end of their discussion, however, a lack of RNA localizing to G1 chromosomes could be formally attributable to differential RNA stability. Might altered RNA stability of NEAT1, MALAT1, or U2 also contribute to the observed altered localizations upon interphase reentry? The authors could use qPCR or measure RNA half-life to test this possibility. These data would nicely compliment the authors' existing FISH experiments and allow them to specifically argue for differential RNA localization.
We have addressed this point by measuring the stability of MALAT1, U2, and NEAT1 in G2 cells after transcription inhibition using RNA FISH. We find that U2 and MALAT1 exhibit very little RNA degradation after 2.5 hours of transcription inhibition, which is consistent with the reported half-lives for each of these transcripts (10 hours for MALAT1 and >24hrs for U2; PMC3337439). We conclude that differential RNA stability cannot account for differential RNA import observed for these two transcripts. In contrast, NEAT1 transcript is almost undetectable after 1.5 hours of transcription inhibition, which is also consistent with the reported half-life of this transcript (22406755, 3337439). Therefore, RNA degradation during mitosis could contribute to a lack of NEAT1 nuclear import in G1. We have included this new data in a modified Figure 2E (text p5 lines 154-166).
Minor Points:
(1) The authors examine published datasets identifying RNA associated with chromatin and state the reason why these data show little overlap is "primarily attributable to purification methodology." This statement seems speculative, and its basis seems unclear.
We have changed the wording of this section to remove unwarranted speculation (p4-5 lines 116-129).
(2) The SAF-A-AA experiments failed to reveal insight into mechanisms of RNA sorting, although they do suggest the AA construct functions as a gain-of-function due to a) increased RNA reincorporated into chromosomes b) dramatic increase of chromosome targeting of SAF-A. These effects make it difficult to interpret the SAF-A-AA data. Related to this point, the analysis of altered RNA distributions relative to SAF-A is underdeveloped. Because the authors only examined one lncRNA (MALAT1), the conclusion that “forced retention of SAF-A on mitotic chromatin does not lead to an increase in the nuclear inheritance of specific transcripts” seems like an overstatement.
We have reworded this conclusion about the role of SAF-A-AA on mitotic chromatin retention to more accurately reflect our findings (p6 line 197). (3) The authors find the U2 spliceosomal RNA is preferentially inherited. Might they speculate why this would be advantageous?
We have added a sentence to the discussion speculating about the importance of U2 inheritance (p8 line 269-271). (4) Optional: it would be exciting to test the significance of U2 RNA inheritance
We agree with the reviewer that this would be an exciting future direction to test. We envision that testing this idea rigorously would require the development of several new degron cell lines and is outside the scope of this study. (5) For Figure 1, please add statistics to figures and legend; add N=cells examined.
We have added a new supplemental Excel spreadsheet that contains the N of cells measured for each experiment and added statistics to figure legends and figures where tests were significant. (6) For Figure 2, single channel panel of U2 RNA should be added. Figure 2E seems to reproduce the same data shown in Figure 2D (right-most columns) shown with different axes.
We have added a single channel image of U2 to Figure 2 and replaced panel 2E with analysis of MALAT1, NEAT1, and U2 stability after transcription inhibition. (7) Figure 3, it is unclear why the authors selected MALAT1 for analysis, but not NEAT1 (or the single (unlabeled) antisense RNA also enriched in the SAF-A IP (figure 2C).
We examined MALAT1 in greater detail because it is the most abundant lncRNA bound by SAF-A and most robust RNA FISH probe. The unlabeled antisense transcript is hnRNPUas1 and was not detectable in DLD1 cells by RNA FISH. (8) Figure 4B, please add statistics to figure and legend.
For this experiment we prefer not to add statistics to the figure. This experiment was performed on a limited number of cells (21 and 8 respectively) and we do not believe that it is statistically appropriate to treat each cell as an independent N. The data confirms results in our previously published work (Sharp et al 2020) using live cell imaging. (9) Methods: in their description of the published lists of chromatin-bound RNAs, the authors should cite those works and provide a data availability statement with the associated GEO
We have cited these works in the text and methods sections and added GEO accession numbers associated with these studies. (p21 line 442).
Reviewer 2
Major comments:
The authors pose an interesting question -- how does nuclear RNA segregate following mitosis. In many ways, the results presented in this manuscript are rather preliminary. Key controls and validation are missing. Because of this, it is difficult to assess the validity of the main conclusions of the study. More specifically:
One reason that nuclear inheritance has not been properly addressed in the literature is the difficulty in obtaining pure populations of cells synchronized in telophase or recently divided cells in early G1. There are no drugs available which can uniquely target these cell stages. In addition, the ability of human cells to all release perfectly synchronously from a drug-induced arrest can vary with cell type. For this reason we used a strategy employing synchronization methods designed to enrich cell populations for telophase or early G1 events, combined with single cell analysis of events with the distinct cytological features of each stage. Cells that have recently divided are extremely distinctive and easily identified using a combination of DAPI morphology to assess nuclear size and condensation state and the presence of Aurora-B/Midbody staining to indicate a recent cytokinesis. Our approach of using single cell analysis coupled with quantitative imaging therefore does not require a high efficiency of synchronization in cell populations. To gain confidence that our observations were reproducible we analyzed a large number of cells, performed multiple experimental replicates, and applied statistical tests to the data.
To clarify these important points we have added text to the descriptions of how these experiments were performed (p3 line 72) and added information about the number of biological replicates to all figure legends and number of cell analyzed in each experiment to Supplementary Table 1.
The use of transcriptional inhibitors in Fig 1 is really nice and is important for showing that it's not due to new transcription following mitosis. Well done!
One potential mechanism that could explain the observed 25% relocalized nuclear RNA is through passive diffusion. That is, a proportion of molecules that are randomly diffusing during mitosis get trapped inside the newly formed nuclear membrane in early G1. This would be considered noise, and not a specific process that actively relocalizes nuclear RNA back into the nucleus. However, the authors' assay does not have a measure of the noise in their system. One potential experiment that may help quantify this noise is to express GFP in their cells, perform the experiment described in Fig 1A, and quantify the nuclear signal after telophase. This quantification would be the lower bound of the random process. A similar experiment with GFP-NLS could be performed to assess the upper bound of the 'inherited' molecules after mitosis. Without this type of control to quantify noise/random diffusion levels, it is unclear how much of the 25% EU signal that the authors detect is specific to the process they are testing.
We appreciate the point that the reviewer has raised. To address this concern we examined the localization of the abundant mRNA b-actin. We examined the fraction of all b-actin FISH signal that is present in the nucleus in G2 and G1 cells following division. If a significant fraction of RNA is trapped in the reforming nucleus then we would have expected the fraction of b-actin in the G1 nucleus to increase. We observed that less b-actin RNA was present in the G1 nucleus, suggesting that passive entrapment of RNA is unlikely to be a mechanism of RNA inheritance. This is consistent with a lack of inheritance of MALAT1 and NEAT1 lncRNAs following mitosis. We have added these results to a new Supplemental Figure 2 and added text describing the results to the Results section of the manuscript (p4 lines 101-113). Additionally, this result is consistent with recent work showing that mitotic chromosomes condense through histone deacetylation and exclude negatively charged macromolecules (PMID: 35922507) and that chromosome clustering by Ki67 in early G1 phase excludes the cytoplasm from the new nucleus (PMID: 32879492). These references and ideas are now included in the results section of the manuscript.
Related to the comment 1 and 2, EU labeling for 3 hrs in G2 cells would label ALL transcribed RNA, which would include mature mRNAs that will be translated in the cytoplasm. That is, this method is not specific to labeling nuclear RNAs only. How much of their signal is from mRNAs that got trapped inside the newly formed nuclear membrane? One way to test this is to measure the nuclear EU signal at later time points following telophase. Presumably, the nuclear transport mechanism would lead to export of non-nuclear RNAs and only the retained nuclear RNAs would contribute to the signal.
Please see our response to point 3 with regard to entrapment. The laboratory that originally described EU RNA labeling demonstrated a 3 hour EU labeling period results in labeling nuclear RNA, and that longer labeling periods are required to visualize EU labeling of cytoplasmic RNAs after export (18840688). We have also observed in our previously published work that the 3 hour period labels nuclear RNA during interphase (33053167, 32035037). The nuclear EU signal reflects RNAs undergoing transcription, nuclear retained RNAs, and mature mRNAs prior to nuclear export.
To identify nuclear RNAs that could be relocalized following mitosis, the authors analyzed data from "two different studies using different methodologies and a total of three different cell lines". From this analysis, the authors "found very little overlap in the chromatin-bound RNAs identified in these studies (Fig 2A)". This analysis seems fraught with problems. What is the rationale for using these studies? How valid is it to compare results from different methodologies and from different cell lines from the DLD-1 cells used in this study?
We analyzed the data from these two studies because they were the only published studies that identified RNAs that were tightly linked to chromatin. We chose to compare the results from three different human cell lines because we sought to identify nuclear RNAs that were cell type-independent, so that we could analyze the transcripts behavior in DLD1 cells. In support of using these two studies all the RNAs that we analyzed were nuclear in our RNA FISH assays.
A known problem of assessing chromatin-bound RNAs is that the level of contamination from cytoplasmic RNAs is highly variable and highly dependent on the assay. Indeed some of the most common contaminants of nuclear RNA assays are sn-, and sno-RNAs, and these are the main classes of RNA that the authors identified as common among the three data sets. What validation was used to assess whether these are the common noise/contaminants in the data?
Our goal in using the two previously published studies was to identify cell type-independent nuclear RNAs that could be studied in detail using FISH. For validation in our study we performed RNA FISH on MALAT1, NEAT1, and U2. We found that each of these RNAs are highly enriched in the nucleus, consistent with previous publications. Since snRNAs function in splicing and snoRNA primarily function in the modification of tRNA and rRNA in the nucleolus it seems unlikely that these are contaminants of nuclear preparations. Each of the published studies performed their own validations of their purification and sequencing methodology. For the purpose of our work nuclear enrichment of a transcript by RNA FISH satisfied our requirements.
One experimental validation that can be performed is biochemical fractionation of EU labeled cells, which would allow for fractionating nuclear from cytoplasmic RNA. The same problems arise with the analysis shown in Fig 3C when comparing SAF-A RIP-seq with this merged list of chromatin bound RNAs.
In support of the nuclear enrichment of each of the transcripts that we examined RNA-FISH analysis demonstrated significant nuclear enrichment. Additionally, many previous studies have shown that each of these transcripts are enriched in the nucleus (U2: 11489914, 10021385, 7597053; NEAT1: 17270048; MALAT1: 12970751, 17270048). New text describing our use of these studies is present in the results section (p4-5 lines 117-129).
Throughout the manuscript, the authors pose their findings as "RNA inheritance" following mitosis. However, this terminology is misleading. In fact, unless RNAs are lost/kicked out of the cell as they divide, aren't all RNAs inherited following cell division since they are present in the new daughter cells? Instead, what the authors mean is that some nuclear RNAs retain their function following cell division by relocalizing back into the nucleus in the new G1 cells, whereas other nuclear RNAs are unable to relocalize into the nucleus, and then presumably turned over by degradation process. The authors should take better care of their terminology throughout the manuscript.
Thank you for pointing this out to us. As the reviewer stated most nuclear RNAs are removed from chromatin during mitosis. Only a subset are reimported into the nucleus. We have modified our wording to clearly state that we are discussing nuclear RNA inheritance by daughter cell nuclei rather than inheritance into daughter cells in general. These text changes can be found throughout the manuscript.
Minor comments: 1. In all of the figures showing quantification of nuclear EU/FISH signal, the colors (red v blue) are not described (not found in the legend or methods). Presumably they are biological replicates, but this should be clearly stated.
We have modified the plots and figure legends to more clearly explain what is plotted (See text in Figure Legends). 2. Is figure 2E the same data presented in Fig 2D but in different y-axis? If so, state clearly
We have removed the data in the previous version of Figure 2E and replaced it with new data examining stability of MALAT1, NEAT1, and U2 in response to Reviewer 1 (p5 lines 154-166).
Figure 3A. This experiment is using the SAF-A-AID-mCherry system. Therefore the label in Fig 3A should be SAF-A-KD (Knockdown) instead of KO (knockout)
We have corrected this in Figure 3. 4. Typo in Fig 4B y-axis. It should be "Chromatin-localized SAF-A" instead of "Chromain-localized SAF-A"
Thank you for pointing this out, we have corrected it. 5. The methods section indicate the "precise N or replicates in indicated figure legends" but none of the figure legends have the N values listed.
We have listed number of biological replicates in all figure legends and included a new Supplemental Table 1 that contains the number of cells measured for each experiment.
Reviewer 3
The authors investigate an interesting question focussed on whether nuclear RNA from the previous cell cycle is present in the subsequent G1. It turns out that this is more complex than expected with some classes of RNA being inherited whilst others are not. SAF-A or HNRNPU had been implicated in this process but the authors suggest that its role is limited.
Figure 1 In panel A the authors write on image SAF-A-mCh. What does this refer to?
We have added information to the Figure legends indicating that this refers to SAF-A-AID-mCherry knocked-in to the endogenous SAF-A locus (see Figure Legends).
Panel B and other panels can the authors present this data as a boxplot or distribution plot to get a better feel of the data distribution spread.
We have modified all the plots in the manuscript to the Superviolin form to provide a clearer depiction of experimental replicates, mean, and standard deviation.
Presumably labelled RNAs are naturally turned over. Have the authors considered that some loss of signal could be because of this?
We have addressed the stability of specific RNAs using RNA FISH. We find that U2 and MALAT1 show essentially no degradation during the time course of our experiments. This data has now been included in an updated Figure 2. We have also modified our text to address this point more clearly (Figure 2E and p5 lines 154-166).
Panel E, have the authors considered labelling RNA before RO3306 treatment? What effect would this have?
We have performed this experiment in RPE1 cells and the presence of RO3306 did not affect cytological detection of transcript labeling. We have not included this experiment in the manuscript because it is performed in a different cell line than we use for the remainder of these studies.
Shouls TI be added before RO3306 washout?
We added transcription inhibitors after RO washout and entry into mitosis because transcription is naturally suppressed during mitosis. We were concerned that transcriptional inhibition in late G2 could lead to failure to properly enter into M phase.
Also, it is unclear what the arrows are pointing at. In panel F there is a difference between the red and blue experiments. In the methods the authors say that inhibition was for either 1.5 or 2 h. Is this the source of the difference?
We have modified the figure legends to state clearly that different colors indicate biological replicate experiments (See Figure Legends). Figure 2 In panel A there are clear differences between the cell lines. Is it right to compare them? Particularly the GRID-seq vs diMARGI? B, how relevant is it focussing on the "42" overlapping RNAs? In my mind this is not very informative.
Our goal with this analysis was to identify cell type-independent chromatin bound RNAs to analyze in greater detail. Therefore, we analyzed three different cell lines because we planned to analyze transcript behavior in DLD1 cells, which were not included in either study. We have explained this rationale in greater detail in a revised version of the text (p4-5 lines 116-129).
D-E, at a glance it is not clear that E is an expanded view of D. It might be easier if the panels were at same height.
We have removed Panel E and replaced it with a new experiment examining the stability of NEAT1, MALAT1, and U2 after transcription inhibition (p5 lines 154-166). Figure 3 Is it correct to describe IAA treated degron cells as a KO? I also could not see a WB showing how complete SAF-A KD was.
We previously characterized these cell lines in great detail (Sharp et al. JCB 2020). We have now provided quantitative measurement of SAF-A-mCherry fluorescence after different times of auxin addition to provide a quantitative estimate of SAF-A depletion (Supplemental Figure 3C).
2 h treatment seems quite short, is this enough time to obtain sufficient knock down? How heterogenous is SAF-A KD in the cell population?
We examined SAF-A depletion by auxin addition at 2 hours and 24 hours and achieve comparable depletion levels. This data in now included in Supplementary Figure 3C. There is some heterogeneity in the KD as is evident in Figure S3C, but these cells are easily identifiable by the presence of SAF-A-AID-mCherry fluorescence.
Previous studies have shown that SAF-A does not like being tagged. How certain are the authors that these cells behave typically?
We have generated two different cell lines (DLD1 and RPE1) where a C-terminal tag is inserted into the both copies of the endogenous SAF-A gene. SAF-A is one of the common essential genes (https://depmap.org/portal/gene/HNRNPU?tab=overview), however each of our cell lines exhibits no growth defects. We have recently shown that C-terminally tagged SAF-A fully rescues SAF-A knockout phenotypes (Sharp et al. JCB. 2020). Additionally, we have also performed RNA-seq (not published) on RPE1, RPE1 with endogenously tagged SAF-A and RPE-1 depleted of SAF-A and rescued with WT SAF-A-GFP and observed no changes in gene expression or mRNA splicing. Based on these assays we are confident that C-terminally tagged SAF-A expressed at endogenous levels functions normally. Figure 4 I'm struggling with the heading, and wonder if this is not supported by the data. Similarly the final sentence "The highly dynamic exchange of SAF-A:RNA complex" does not really provide an explanation.
We have expanded the text in this section to explain this phenotype in greater detail (p7 lines 216-218).
= - trail
From Chris "cdata" Joel @ Subconscious to Everyone 07:58 PM http://skyhunter.com/marcs/ewalnut.html From Alan Karp to Everyone 07:59 PM http://erights.org/
![]()
= Alan Karp
Object Oriented program and
Globally addressable objects
=- bible
From Chris "cdata" Joel @ Subconscious to Everyone 07:58 PM http://skyhunter.com/marcs/ewalnut.html From Alan Karp to Everyone 07:59 PM http://erights.org/
xxxx
asked in chat
From Me to Everyone 07:39 PM I do have one question From Jess Martin to Everyone 07:40 PM @gyuri: if it doesn't get covered in this call, feel free ask in the fission Discord and tag me, as I have a feeling I was on the livestream of which you speak 🙂 From Blaine Cook to Everyone 07:40 PM 💯 From Me to Everyone 07:41 PM I reallu liked the idea of no signup needed to control wenbative identity. This may have implications to the way the whole webnative SDK based app are to be created/distributed and thought off. Any comments would be apprefiatd. This may not be the right forum, but it is live From Brooklyn Zelenka (@expede) to Everyone 07:42 PM Im checking in sorry folks gimme a minute From Me to Everyone 07:42 PM Yes will do.
Note: This rebuttal was posted by the corresponding author to Review Commons. Content has not been altered except for formatting.
Learn more at Review Commons
We would like to thank the reviewers for taking time in reviewing and commenting on our paper. The comments were very constructive and conscientious, thanks to their expertise in the field. These comments and the revisions would surely make this paper a better and more robust finding in the field.
The comments were about clearer explanations, increasing the quality of the data and additional experiments for a stronger conclusion, all of which we are eager to accomplish. Now we have sorted out the problems and planned the experiments required in the revision, as detailed below.
Reviewer #1 (Evidence, reproducibility and clarity (Required)):
Summary In this manuscript, Komori et al. examined the role of the LRRK2 substrate and regulator Rab29 in the lysosomal stress response. Briefly, in chloroquine (CQ)-treated HEK293 cells the authors observed an apparent LRRK2-independent increased in Rab29 phosphorylation which was accompanied by translocation of Rab29 to lysosomes. Intriguingly, the authors detected a similar increase in Rab29 phosphorylation when Rab29 was tethered to lysosomes in the absence of CQ treatment. Using mass spectrometry, mutagenesis and a phospho-specific anti-body, the authors mapped the CQ-induced phosphorylation site to S185 and demonstrated its independence from LRRK2. Next, the authors found that PKCa was the kinase responsible for S185 phosphorylation and lysosomal translocation of Rab29. Lastly, the authors showed that in addition to PKCa the lysosomal translocation of Rab29 was also regulated by LRRK2. Overall, Komori and colleagues provide interesting new insights into the phosphorylation-dependent regulation of Rab29. However, there are. Number of technical and conception concerns which should be addressed.
Major points 1) Figure 1F: the localization of Rab29 to lysosomes is not convincing at all. The authors should either provide more representative image examples or image the cells at a higher resolution. The authors should also confirm the CQ-induced lysosomal localization of Rab29 in a different cell type (e.g., HEK293).
We will replace Fig 1F pictures with slightly more magnified images with higher resolution. We will also include additional cell types (HEK293, and other cells that are predicted to express endogenous Rab29); Reviewer #2 also raised this point (see Reviewer #2 comment on Significance).
Moreover, the authors should show that prenylation of Rab29 is required for its CQ-induced phosphorylation.
We will test the effect of lovastatin, a HMG-CoA reductase inhibitor that causes the depletion of the prenylation precursor geranylgeranyl diphosphate from cells (Binnington et al., Glycobiology 2016, Gomez et al, J Cell Biol 2019), or 3-PEHPC, a GGTase II specific inhibitor that also causes the inhibition of Rab prenylation (Coxon FP et al, Bone 2005).
2) The rapalog-induced increase in Rab29 phosphorylation in Figure 2D is not convincing since there is at least 2-3-fold more Rab29 in FRB-LAMP1 expressing cells compared to their FRB-FIS1 counterparts. An independent loading control is also missing. This is a key experiment and should be properly controlled and quantified. In addition, can CQ treatment drive 2xFKBP GFP-Rab29 from mitochondria to lysosomes (in the presence of rapalog and FRB-Fis1)?
We will carefully examine another round of rapalog-induced phosphorylation of Rab29, with an independent loading control such as alpha-tubulin. The immunoblot analysis will be made against the intensity of non-p-Rab29. The response to the latter question was described in the section 4 below.
3) Figure 4A-C: Are these stable Rab29 expressing cells? If not, the quantification of "the size of largest lysosome in EACH cell" becomes very problematic. This analysis should be repeated with stable Rab29 variant cells in a background lacking endogenous Rab29. Furthermore, the LAMP1 signal is too dim to see any convincing colocalization (e.g., with WT) or the lack thereof (e.g., in the case of S185D).
The cells shown in Figure 4 are HEK293 cells transiently expressing Rab29, and the issue of quantification was described in the section 3 below. We agree that the signal of LAMP1 was dim, and it turned out that the confocal microscope we used had problems with the sensitivity of the red channels. We will be taking another round of these images with a new confocal microscope.
Lastly, the authors should corroborate their findings with an ultrastructural analysis since the electron microscopy would definitively be more suitable for this type of measurements.
We are planning to obtain electron microscopic images, according to this reviewer’s request. We plan to invite an expert in electron microscopy analysis as a co-author.
4) The lysosomal colocalization of Rab29 in Figure 5C is again not convincing. This analysis needs to be repeated with high resolution imaging.
Again, we will repeat this experiment with a new confocal microscope, with the hope that it would yield better images.
5) The authors need to show the level of LRRK2 depletion (Figure 6). Given the role of LRRK2 in driving lysosomal Rab29 translocation, the importance of the LRRK2 independent pS185 for this process remains unclear.
We will add the level of LRRK2 on its knockdown; we have experienced that LRRK2 knockdown usually occurs with more than 50% efficiency every time. The response to the latter comment was described in the section 3 below.
6) In general, the authors employ an alternative, biochemical assay (e.g., LysoIP) for the lysosomal translocation of Rab29. This would in particular help to clarify the effect of the Rab29 variants and LRRK2 inhibition.
We have previously shown that the overexpressed Rab29 (and LRRK2) is enriched in the lysosomal fraction from CQ-treated cells, which was performed using dextran-coated magnetite (Eguchi et al, PNAS 2018). Using the same biochemical method, we will show the enrichment of endogenous Rab29 in the lysosomal fraction.
Minor points
9) Figure 2C is lacking the control IF staining for mitochondria (to which 2xFKBP-GFP-Rab29 is assumed be recruited upon co-expression with FRB-FIS1).
We will stain the cells with MitoTracker to ensure that anchoring away of 2xFKBP-GFP-Rab29 by FRB-Fis1 results in mitochondrial localization.
Reviewer #2 (Evidence, reproducibility and clarity (Required)):
The data in the manuscript convincingly demonstrates that lysosomal overload by Chloroquine treatment induces Rab29 localisation to the lysosomes and that this membrane association is dependent on PKCalpha-dependent phosphorylation at Ser185.
We have a number of rather minor comments listed below:
Figure 2
The increasing levels of non-phosphorylated Rab29 over the indicated time course of AP21967 treatment in Figure 2B are concerning. First, could you provide an explanation for this clear increase in both non-p-Rab29 and p-Rab29 in the phostag but not the normal gel? Second, could all quantifications of p-Rab29 be made relative to the non-p-Rab29?
We will try another round of rapalog-induced phosphorylation of Rab29, with an independent loading control. The immunoblot analysis will be made against the intensity of non-p-Rab29. Reviewer #1 raised a similar concern on Figure 2D.
Figure 5
To further demonstrate that PKCalpha phosphorylates endogenous Rab29 at Ser185, we recommend reperforming the Go3983/PMA treatment in figure B with the anti-p-Ser185 antibody. It may be sufficient to perform the treatment only at 4 or 8 hours, simply to provide stronger evidence regarding the phosphorylation of endogenous Rab29.
We will give a try, although the anti-phosphorylated protein antibodies that we tried never worked for phos-tag SDS-PAGE. With the conventional western blot, we will be able to try this experiment.
It is not clear whether the activity of PMA in the assay is due to inhibition of PKCalpha. Are the effects ablated by PKCalpha KD
We will test the knockdown of PKCalpha, beta, gamma and delta by siRNAs to further narrow down the effects of PKC-dependent phosphorylation of Rab29.
Reviewer #2 (Significance (Required)):
These cell biology findings are important in the field as both Rab29 and LRRK2 are implicated in the pathogenesis of Parkinson disease. The phosphorilation of Ser185 of Rab29 by PKCalpha is novel and contributes to our understanding of Rab29 and LKRR2 regulation. One limitation of the study is that is conducted in only two cell types quite unrelated to the disease, so how general and disease relevant are the findings it is not clear. Most of the data are solid. There are two experiments whose results are difficult to interpret and a few controls missing. Also a few issues with quantifications, all of which is described in details above and will need to be fixed prior to publication. My expertise for this paper is in the cell biology of lysosomal function.
The issue that only two cell types were analyzed was also raised by reviewer #1, so we will examine additional cell types, especially those that are predicted to express endogenous Rab29. Our responses to other issues raised are described elsewhere. Thank you for these insightful comments.
Figure 4A-C: Are these stable Rab29 expressing cells? If not, the quantification of "the size of largest lysosome in EACH cell" becomes very problematic. This analysis should be repeated with stable Rab29 variant cells in a background lacking endogenous Rab29. (Reviewer #1)
As described in the section 2 above, the cells shown in Figure 4 are HEK293 cells transiently expressing Rab29. We are sorry that the description “the size of largest lysosome in each cell” was misleading. As we analyzed only cells overexpressing GFP-Rab29 that were marked with GFP fluorescence, we believe that transient expression should not be a problem. To avoid any misunderstandings, we have described in Figure 4 legends that only lysosomes in Rab29-positive cells (and all cells expressing Rab29) were included in the analysis of the largest lysosome of each cell.
Regarding the effect of endogenous Rab29 in Figure 4 experiments, Reviewer #2 similarly raised the issue on whether Rab29 phosphomimetics are acting as dominant active, preventing lysosomal enlargement. On this point, we have previously reported that knockdown of endogenous Rab29 causes the enhancement of lysosomal enlargement upon CQ treatment (Figure 5I,J of Eguchi et al, PNAS 2018), suggesting that the lysosome-deflating effect by phosphomimetics is a dominant active effect rather than dominant negative suppressing endogenous Rab29. This point is considered significant, and thus has been explained in the results section (page 7, lines 168-171).
Along similar lines: why not all cells in Figure 5E and Figure 5G show Rab29- and LRRK2-positive structures? How do the authors know which of these phenotypes is the prevalent one? (Reviewer #1)
As for the ratio of cells with Rab29- and LRRK2-positive structures, it seems reasonable given that different cells have different levels of exposure to lysosomal stress and that the response is transient and does not occur simultaneously. The ratio of these positive cells may also vary depending on the cell culture conditions. Since Rab29- and LRRK2-positive structures are rarely seen in control cells, we think this would be a meaningful phenotype even if only 20-30% of cells show such structures. The result that the ratio of localization changes is not 100% is now noted in the results section explaining Figure 1G (page 4-5, lines 108-110) where the immunocytochemical data first appears.
Given the role of LRRK2 in driving lysosomal Rab29 translocation, the importance of the LRRK2 independent pS185 for this process remains unclear. (Reviewer #1)
Our data suggested that Rab29 is stabilized on lysosomes only when LRRK2-mediated phosphorylation and S185 phosphorylation both occur on Rab29 molecule (as shown in Figure 7 scheme), so we believe there is no contradiction. We have now described more clearly about this notion at the end of the results section (page 9, lines 235-236).
It is not clear what the authors mean by "lysosomal overload stress". Since mature lysosomal incoming pathways such as autophagy or endocytosis are disrupted by CQ, it is difficult to picture an overload. Maybe rephrasing would help to clarify this. (Reviewer #1)
Chloroquine (CQ) is known as a lysosomotropic agent that accumulates within acidic organelles due to its cationic and amphiphilic nature, causing lysosome overload and osmotic pressure elevation, and this is what we call “lysosomal overload stress”. The well-known effects of CQ to disrupt lysosomal incoming pathways are ultimately caused by the above consequences. Also, we have previously reported that lysosomal recruitment of LRRK2 is caused by CQ but not by bafilomycin A1, the latter being an inducer of lysosomal pH elevation, or by vacuolin-1 that enlarges lysosomes without inducing lysosomal overload/pH elevation (Eguchi et al, PNAS 2018), and further found that not only CQ but also other lysosomotropic agents commonly induced LRRK2 recruitment (Kuwahara et al, Neurobiol Dis 2020). We thus have described the effect of CQ as “overload”. However, it is true that we have not provided a clear explanation for readers, so we have added some notes for lysosomal overload stress in the introduction section (page 3, lines 69-71).
Which cell type is used for the IF analysis in Figure 2C? This information is in general quite sparse. The authors should clearly state the cell type for each experiment/Figure. (Reviewer #1)
We have added cell type information that was missing in several places in the manuscript. We are very sorry for the inconveniences. For clarification, HEK293 cells were used in Figure 2C.
Are the images in figure 1F representative? i.e. does Rab29 always colocalise to such enlarged lysosomes upon CQ treatment and does CQ treatment always drastically alter the cellular distribution of Rab29? (Reviewer #2)
The images in Figure 1F are representative of when Rab29 is recruited, but it is not seen in all cells, and the ratio of recruitment (~80%) is shown in Figure 1G. Reviewer #1 also asked why Rab29 recruitment is not seen in all cells, and we gave the same answer above. It may be reasonable to speculate that different cells have different levels of exposure to lysosomal stress and that the response is transient and does not occur simultaneously. The ratio of these positive cells may also vary depending on the cell culture conditions. For the readers’ clarity, we have added that the ratio of localization change of Rab29 is not 100% and is comparable to that of LRRK2 previously reported (page 4-5, lines 108-110).
Considering that the "forced localisation technique" induces a non-physiological colocalization of non-endogenous Rab29 to lysosomes, it may be an overestimation to conclude just from these data that phosphorylation of Rab29 occurs on the lysosomal surface. This is also quite in contrast with the later finding that phosphorylation by PKCalpha promotes lysosome localization of Rab29. It seems more reasonable to conclude that Rab29 can be phosphorylated when localised at the lysosomes (as opposed to other organelles such as mitochondria). If the authors feel strongly about this point they might need to find a less non-physiological assay. (Reviewer #2)
Yes, it could be an overestimation, and as we do not have better means to conduct a less non-physiological assay, we have modified the description from “occurred on the lysosomal surface” to “could occur on the lysosomal surface” (page 5, line 112 (subtitle) and line 128).
Regarding the comparison with the later finding that phosphorylation by PKCalpha promotes lysosome localization of Rab29, these data (Figure 2 and 5) could be explained with a single speculation: phosphorylation of Rab29 on lysosomal membranes could retain Rab29 on the membranes for a longer time. It is not easy to decipher which comes first, association with membranes or phosphorylation of Rab29, in a physiological assay, but considering reports that show PKCalpha activation happens on membranes (Prevostel et al., J Cell Sci 2000), at least the data favor our conclusion over the idea of PKCalpha phosphorylating Rab29 in the cytoplasm and then promoting lysosomal localization. This point is now clearly described in the discussion (page 10, lines 248-251).
It is not clear how the Rab29 phosphomimetics are acting as dominant active preventing lysosomal enlargement. Authors should speculate or repeat the experiments in absence of endogenous Rab29 to clarify the matter. (Reviewer #2)
A similar concern about the effect of endogenous Rab29 was also raised by Reviewer #1 (see above). We have previously reported that knockdown of endogenous Rab29 causes the enhancement of lysosomal enlargement upon CQ treatment (Figure 5I,J of Eguchi et al, PNAS 2018), suggesting that the lysosome-deflating effect by phosphomimetics is a dominant active effect rather than dominant negative suppressing endogenous Rab29. This point is considered important and thus has been explained in the results section (page 7, lines 168-171).
Overall, there is some missing information regarding repeats for Western blots, such as those in figure 3C, 3D and 3E. Please add indications about repeats in the figure legend or methods. (Reviewer #2)
We have added the repeat information to each figure legend where it was missing. We are very sorry for the inconveniences.
The model in figure 7 however seems to suggest that Rab29 associates to lysosomal membranes independently, and is then stabilised at the membranes by LRRK2 and PKCalpha - a point which is not directly supported by the data. (Reviewer #2)
As noted earlier, we consider that phosphorylation of Rab29 on lysosomal membranes could retain Rab29 on the membranes for a longer time, given the present data and previous reports that phosphorylation of Rab29 is more likely to happen on the lysosomal membrane than in the cytosol. Also, as inhibition of either of the two phosphorylations ends up in disperse Rab29 localization, we have made this figure as a model of what is plausible right now. This explanation is now added in the discussion (page 10, lines 248-251).
English proofreading should be improved: "CQ was treated to HEK293" (page 4), "As we assumed that this phosphorylation is independent of LRRK2" as an opening line (page 5) (Reviewer #2)
Thank you for pointing out these incorrect wordings. They were corrected.
In addition, can CQ treatment drive 2xFKBP GFP-Rab29 from mitochondria to lysosomes (in the presence of rapalog and FRB-Fis1)? (Reviewer #1)
We do not think that a comparison between the affinities of FKBP-rapalog-FRB and Rab29-[unknown factor that directs Rab29 to lysosomes] is necessary, as the former has a Kd in the single digit nM range (Banaszynski et al, JACS 2005), whereas the latter (based on estimations from related PPIs) is estimated to be in the μM range, which shows a much weaker affinity than the former (McGrath et al, Small GTPases 2019). Furthermore, even if Rab29 appears to have migrated from mitochondria to lysosomes as a result of this experiment, one cannot rule out the possibility that a small portion of the mitochondrial membrane was incorporated into the lysosomal membrane that was enlarged by CQ treatment.
Molecular weight markes should be provided for all immunoblot experiments. (Reviewer #1)
The immunoblot pictures without molecular weight markers in our paper are all Phos-tag SDS-PAGE blot analyses. Phos-tag SDS-PAGE results in band shifts of phosphorylated proteins, and writing in markers would be misleading. Moreover, previous representative studies heavily using Phos-tag (e.g., Kinoshita et al, Proteomics 2011, Ito et al, Biochemical Journal 2016) also did not show the molecular weight markers. Here we performed phos-tag SDS-PAGE analysis only to find differences in the phosphorylation state of Rab proteins.
The use of the quantification ratio of cells with Rab29-positive lysosomes in figure 1G might be slightly misleading as it does not allow the reader to understand to what extent Rab29 localisation at lysosomes upon CQ treatment. We recommend using a simpler quantification, such as by measuring the average colocalisation of Rab29 and LAMP1 per cell. (Reviewer #2)
For figure 5D and 5F, As with figure 1G, we recommend using a more straightforward and impartial method of quantification such as simply measuring the colocalisation of Rab29 with LAMP1. (Reviewer #2)
Popular colocalization analyses using Pearson’s or Mander’s coefficients would be a good choice if the amounts of Rab29 varied greatly between lysosomes. However, this may not apply in this case; the amount of Rab29 or LRRK2 on each lysosome is considered to saturate quickly and a relatively low amount of them may not be detected on immunofluorescence observations, whereas the probability of finding these structures has been shown to exhibit a moderate sigmoid curve (as seen in Figure 1E or 2H of Eguchi et al., PNAS 2018). Therefore, the amount of Rab29 or LRRK2 could be approximated to a Bernoulli distribution in terms of colocalization with lysosomes, and this is the reason why we chose to quantify “the ratio of cells with Rab29-positive lysosomes”.
We recommend using a more transparent and simple quantification method, such as average size of lysosomes per cell. (Reviewer #2)
As one can see in the inset of Figure 4B, unenlarged lysosomes are unfortunately too small for the quantification of their size, much less tell two small lysosomes apart in our experimental settings and laboratory resources, so we decided to analyze the largest lysosome in each cell as a representative of the cells to minimize measurement errors. This measurement only includes GFP-Rab29 positive cells, and by comparing against CQ-untreated cells we intended to increase the validity of this analysis. This quantification method was also used in our previous report (Eguchi et al, PNAS 2018).
Reviewer #1 (Public Review):
In this study, the protein composition of exocytotic sites in dopaminergic neurons is investigated. While extensive data are available for both glutamatergic and GABA-ergic synapses, it is far less clear which of the known proteins (particularly proteins localized to the active zone) are also required for dopamine release, and whether proteins are involved that are not found in "classical" synapses. The approach used here uses proximity ligation to tag proteins close to synaptic release sites by using three presynaptic proteins (ELKS, RIM, and the beta4-subunit of the voltage-gated calcium channel) as "baits". Fusion proteins containing BirA were selectively expressed in striatal dopaminergic neurons, followed by in-vivo biotin labelling, isolation of biotinylated proteins and proteomics, using proteins labelled after expression of a soluble BirA-construct in dopaminergic neurons as reference. As controls, the same experiments were performed in KO-mouse lines in which the presynaptic scaffolding protein RIM or the calcium sensor synaptotagmin 1 were selectively deleted in dopaminergic neurons. To control for specificity, the proteomes were compared with those obtained by expressing a soluble BirA construct. The authors found selective enrichments of synaptic and other proteins that were disrupted in RIM but not Syt1 KO animals, with some overlap between the different baits, thus providing a novel and useful dataset to better understand the composition of dopaminergic release sites.
Technically, the work is clearly state-of-the-art, cutting-edge, and of high quality, and I have no suggestions for experimental improvements. On the other hand, the data also show the limitations of the approach, and I suggest that the authors discuss these limitations in more detail. The problem is that there is very likely to be a lot of non-specific noise (for multiple reasons) and thus the enriched proteins certainly represent candidates for the interactome in the presynaptic network, but without further corroboration it cannot be claimed that as a whole they all belong to the proteome of the release site.
Donwell was famous for its strawberry-beds, which seemed a plea for the invitation: but no plea was necessary; cabbage-beds would have been enough to tempt the lady, who only wanted to be going somewhere.
Donwell Abbey is fiction, perhaps based on the real-life Claremont Park in Surrey, Highbury as Kenneth Smith evidences in his essay. However, Austen did not make up the popularity of strawberry season. Berry-picking could start as early as May reach its peak in July and and end in September (Eat the Seasons UK has a chart to follow). According to Austen's chronology, it is the "middle of June" in this segment and, as Mr. Knightley assures Mrs. Elton, the strawberries are already "ripening fast". Joanne Major's essay "Strawberries and cream: A Wimbledon tradition with a hong history" provides a brief history of British strawberry fanaticism paired with images that illustrate just how long the berry has remained a British summer staple. Why does Austen contrast "strawberries" with "cabbage-beds" then? The Royal Horticultural Society answers that cabbages can be harvested year round. Together with potatoes they make up the latter part of another common British staple "bubble and squeak". Even the mundanity of cabbages, Austen tells us, might "tempt" Mrs. Elton in her current state of restlessness.
FOSSDLE Commons (new OER Foundation project) https://social.fossdle.org/ 4 OERu https://mastodon.oeru.org/ 6 Open EdTech https://openedtech.social/ 8 Fossodon (open source) https://fosstodon.org/ 1 Wikis World (wiki enthusiasts) https://wikis.world 1
Because of this difference in behavior, x-if should not be applied directly to the element, but instead to a <template> tag that encloses the element. This way, Alpine can keep a record of the element once it's removed from the page.
一般使用在template上,不支持x-transition
While this offers flexibility to address many operator use cases, it makes simple use cases, like the developer use case, more complicated to express than they need to be.
annotation meta: may need new tag: - developer use case - more complicated to express than they need to be.
I have yet to see a Snapd or Flatpak build of Audacity that I'm happy with. Those builds are beyond our control as they are made by 3rd parties. I do find it mildly annoying that Flatpak direct users that have problems with their builds to us.
annotation meta: may need new tag: the runaround?
Note: This rebuttal was posted by the corresponding author to Review Commons. Content has not been altered except for formatting.
Learn more at Review Commons
Reviewer 1
This paper identifies a role for the hereditary spastic paraplegia protein spatacsin in lysosome morphology, positioning and dynamics, and undertakes detailed mechanistic studies to try to identify the mechanism for this effect. In doing so the paper elucidates further mechanistic information about the properties of two other hereditary spastic paraplegia proteins, spastizin and AP5Z1. The work is done in mammalian cells and uses a combination of over-expression, depletion and biochemical studies. The main findings are:
- The authors present evidence that spatacsin is an ER-localised protein.
- Murine embryonic fibroblasts lacking spatacsin have a reduced number of tubular lysosomes and the remaining lysosomes are less motile. In general, a relationship between tubular lysosome morphology and lysosome motility, often in association with the endoplasmic reticulum (ER), is demonstrated. These tubular lysosomes are catalytically active and acidic.
- In terms of mechanism of this effect, by combining a yeast-two hybrid and siRNA phenotypic screen, the authors identify a number of spatacsin-interacting proteins that also regulate lysosomal tubulation. The most important of these for the purposes of this paper is UBR4, an E3 ubiquitin ligase.
- The authors show that spatacsin and UBR4 promote degradation of AP5Z1, and that this property required the ability of spatacsin to interact with UBR4. Somewhat surprisingly, as AP5Z1 is a coat protein, this degradation appeared to occur within the lumen of the lysosome - the authors speculate how this could be in the discussion.
- The authors then demonstrate that AP5Z1 and spastizin, both hereditary spastic paraplegia proteins, compete for binding with spatacsin.
- The relationship between spatacsin, spastizin, AP5Z1 and motor proteins in then examined. There is a known interaction between spastizin and KIF13A and expression of a dominant negative KIF13A protein reduced lysosomal tubulation. The authors then demonstrate an interaction between AP5Z1 and the p150Glued dynein/dynactin complex member, then showed that expression of a dominant negative p150Glued protein reduced lysosomal tubulation.
- Finally, that authors demonstrate the relevance of these findings to neurons, the target cells of hereditary spastic paraplegia, by showing that lysosomal tubulation and axonal transport are reduced in mouse neurons lacking spastacsin, and that depletion of UBR4 or AP5Z1 affected these as expected from the experiments above.
Major comments:
Overall I believe that the key conclusions of this paper are generally convincing and that the work is of high quality. However, I do have some reservations:
The localisation of spatacsin on the ER. It is always difficult to be convinced about colocalization of a diffuse punctate marker and the ER. From the STED experiments in figure 1, while it definitely seems that there is some spatacsin on the ER, there also appears to be some spatacsin puncta that are not. I'd like to know if these puncta represent lysosome-associated spatacsin. This is important for interpretation of the subsequent experiments (see point 3 below). I also think quantification of these co-localisation will increase confidence in the results. In addition, a caveat of the immunofluorescence studies is that they use over-expressed spatacsin. I appreciate that there are no good antibodies to endogenous spatacsin, but I don't think this limitation is sufficiently acknowledged. As the claim of ER-localisation is critical for the proposed mechanistic model, and in the absence of experiments with endogenously tagged spatacsin, this makes the biochemical fractionation studies of figure 1C very important. To make these more convincing I would prefer to see additional control markers to verify the separation of lysosomal and ER compartments - e.g. lamp1, lamp2, an ER tubular marker such as a REEP5 or a reticulon.
Authors response : We agree with the reviewer that the localization of spatacsin is critical, and we appreciate the knowledge of the reviewer concerning the lack of good antibodies to endogenous spatacsin. We better acknowledged this limitation in our revised manucript (p. 5 and p. 15). We performed extra experiments to convincingly show that spatacsin is indeed localized at the ER. First, we performed 3-color STED experiments to visualize in the same cell spatacsin, the ER and lysosomes. The preliminary data seem to indicate that some spatacsin is associated with lysosomes at ER-lysosomes contact site. We plan to add quantifications of colocalization between spatacsin and ER staining at STED resolution to better support the fact that spatacsin is a protein of the ER.
Moreover, as requested, we have performed a western blot with Lamp2 and REEP5 antibodies on the ER- and lysosome-enriched fractions (New Figure 1B). This western blot shows that a significant proportion of Lamp2 is present in the ER-enriched fraction, which may be explained by the strong association of ER with late endosomes and lysosomes. Yet the lysosome-enriched fractions that contained no ER markers do not present spatacsin staining, suggesting that spatacsin is either in the ER or in lysosomes associated with the ER that are not positive for cathepsin D. We reformulated the text of Figure 1 according to the new included data (p. 5-6).
The authors generally do a good job of quantifying their results. However, this is lacking for the biochemical experiments (immunoblotting and IP) in figures 4 and 5, and I would prefer to see these quantified (the quantification should include data from repeat experiments so that we can judge the reproducibility of the results).
Authors response : We agree that our presentation did not indicate that the western blots were repeated several times. We have added quantifications for the western blots present in Figures 4 and 5.
On page 10, referring to the proximity ligation results, the authors comment: "This suggests that the spatacsin-spastizin interaction occurs at contact sites between the ER and lysosomes to allow spastizin recruitment to lysosomes". I'm not sure this statement is fully supported, as mentioned at point 1 above it is possible that some steady state spatacsin is at lysosomes. To fully support this, we'd need to see the PLA signal also convincingly co-localise with an ER marker.
Authors response : We will perform extra PLA experiment to indeed show that the spots where spatacsin and spastizin colocalize with an ER marker. This data will be added in Figure 5.
In figure 6C and D the effect of spastizin on lysosomal tubulation and dynamics is investigated. Wartmannin treatment is used to do this, as it is known to remove spastizin from lysosomes. However, this is a very indirect manipulation that could have many other consequences and it would be better to demonstrate this directly by showing the effect of depletion of spastizin on lysosomal morphology/dynamics. I also think the role of AP5Z1 in tubulation/dynamics would be better supported with additional experiments to deplete the protein - at present only over-expression is examined.
Authors response: *We added new data to answer this comment. Downregulation of spastizin using siRNA led to lower number of tubular lysosomes and decreased the proportion of dynamic lysosomes, showing that spastizin is required to regulate lysosome motility (Figure 6B-6C Supplementary Figure 7B). We have also added new data regarding downregulation of AP5Z1 (Figure 6A-6C-Supplementary 7A). Both overexpression and downregulation of AP5Z1 using siRNA decreased the number of tubular lysosomes and decreased the proportion of dynamic lysosomes (Figure 6A-6C-Supplementary Figure 6C-D). *
This observation suggests that the levels of AP5Z1 must be tightly regulated to control lysosome motility. We added discussion about this point as well (p.12-13).
While the experiments showing that over-expression of dominant negative forms of KIF13A and p150Glued affect lysosomal tubulation/dynamics provide good circumstantial evidence that spatacsin influences these lysosomal properties via its interactions with spastizin and AP5Z1 (which bind to these motor proteins), the authors have not shown that the interaction of the motor proteins with spastizin and AP5Z1 is required for this ability to regulate lysosome tubulation/dynamics. This means that the model presented in figure 7 is not fully supported by the data. If the authors have been able to map the binding regions for these interactions then perhaps this could be investigated with rescue experiments, although I appreciate that this is potentially a major piece of work and perhaps outside the scope of this paper. An alternative would be that the authors acknowledged this part of the model as somewhat speculative.
Authors response : We agree with the reviewer that our data do not show that KIF13A and p150Glued interact directly with spastizin and AP5Z1 to regulate lysosome dynamics. It has previously been shown that the adaptor complex AP2 interacts with p150glued via the ear domain of AP2 b subunit (Kononenko et al, 2017). It is therefore likely that the interaction of adaptor complex 5 with p150-Glued also occurs via AP5B1 subunit, and thus interaction of AP5Z1 with p150 glued would be indirect. *We discussed this point carefully (p.16). *
*Regarding the interaction of Spastizin with KIF13A, it was identified by yeast-two hybrid screen and validated by GST-pulldown (Sagona et al, 2010). This showed that KIF13A interacts with the C-terminal domain of Spastizin, and we discussed this point. To confirm that KIF13A interaction with spastizin is required to promote its role in tubular lysosome formation and dynamics, we can perform an experiment where we downregulate endogenous mouse spastizin using siRNA and express either full length human spastizin to rescue the effect of the siRNA, or overexpress a human spastizin lacking its C-terminal domain required for the interaction with KIF13A (where we would expect no rescue). This would strengthen our conclusion on the role of KIF13A in link with spastizin to regulate the formation and dynamics of tubular lysosomes. We could add these data in Figure 6 (or Supplementary Figure 7). *
- Are the experiments adequately replicated and statistical analysis adequate?
In general I am not convinced that the statistical tests are applied rigorously in this paper. Most experiments are done three times, but the "n" used for statistical testing is typically chosen as, e.g. the number of cells, number of lysosomes, rather than number of biological repeat experiments. This means that inter-experimental variability is not rigorously taken into account. A more rigorous practice would be to use the mean measures for each of three biological repeats and apply the statistical tests to the three means, so n=3 if three repeats were done. Superplots would be a nice way to graphically display these data.
Authors response : We agree with the comments of the reviewer regarding data presentation. We have therefore changed the presentation of all graphs of the manuscript using superplots that allow us to show all the points that were analyzed as well as the mean value for each biological replicate, and performed statistical analyses by comparing the biological replicates as proposed in Lord et al, JCB 2020 (10.1083/jcb.202001064).
Minor comments:
In supplementary figure 3D I cannot honestly say that I see the smaller band.
Authors response : We agree that this western blot is not clear. We will provide a new western blot.
When first called out, I expected supplementary tables 1 and 2 to show the list of interactors with wild-type spatacsin and spatacsind32-34 respectively, but this is not what they show.
Author response : We have added two supplementary data tables (Now Supplementary Tables 1 and 2) to give the list of interactors of wild-type C-terminal domain of spatacsin and spatacsinD32-34, respectively.
Supplementary Tables 3 and 4 now refer to the analysis of the downregulation experiments by respectively the neural network method and the tubular lysosome detection method.
The experiments in Figure 4A are a little problematic in the way that they are called out. The first call refers to just a small subset of the data in the figure, and the figure is then called out at various points later in the paper. This is quite confusing. Is there any way this could be simplified?
Authors response :We agree with the reviewer that Figure 4A was called at various points of the manuscript. This was to avoid duplicating data into two separate figures. However, we have modified the presentation of Figure 4 and Figure 5. We have included new Figure 4C to show that downregulation of UBR4 prevents the degradation of AP5Z1 upon overexpression of Spatacsin-GFP, but also in basal conditions in wild-type fibroblasts. The co-IP that was originally presented in Figure 4A has now been moved into Supplementary Figure 6A.
The section on page 10: "Spatacsin also interacts with spastizin, and is required to recruit spastizin to lysosomes (Hirst et al., 2021). ........ We hypothesized that spatacsin interaction with spastizin was required for spastizin localization to lysosomes." Is odd, as the authors seem to be hypothesising an observation that they have just said has already been demonstrated.
Authors response : We agree that these sentences were odd. We have rephrased the paragraph (p. 11).
Can the authors explain why there is so little interaction between wild-type KIF13A and spastizin?
Authors response : The interaction domain of spastizin with KIF13A is close to the motor domain according to the two-hybrid data published by Sagona et al (2010). The dominant negative construct of KIF13A that is devoid of the motor domain (KIF13A-ST) may thus facilitate access of spastizin to binding domain. We have commented on this point in the text (p.13).
In figure 6G p150Glued signal is also present in the control IP lane, which casts doubt on the specificity of the interaction. Could the authors generate a cleaner result?
Authors response : We have repeated the experiment 3 times, always with some p150Glued signal present in the control IP. Of note, as stated in the method section, we have increased the concentration of NaCl in the washing of this co-IP to decrease non-specific binding of p150glued to control beads, but we could not get cleaner results so far. We will try to get cleaner western blot to illustrate Figure 6G.
I would be interested to see how AP5Z1 expression differs between neurons with and without spatacsin- we would expect similar results to those shown in the MEFS.
*Authors response : We have not checked the levels of AP5Z1 in neurons with and without spatacsin yet. However, the complete knockout of spatacsin strongly modifies the levels of its partners. We previously showed that spastizin levels are decreased by >90% in Spg11 knockout brain (Branchu et al, 2017). Furthermore, the levels of AP5Z1 have been shown to be decreased by ~50% in fibroblasts of SPG11 and SPG15 patients (Hirst et al, 2015). *
*Our work shows that spatacsin promotes the degradation of AP5Z1 by lysosomes. It is possible that other degradation mechanism(s) may exist and could explain the lower levels of AP5Z1 in knockout cells. We discussed this point (p.15). *
Reviewer #2 (Evidence, reproducibility and clarity (Required)):
In this study Pierga et al. report that SPG11 (spatacsin) is an ER-resident protein involved in the regulation of ER-lysosome contact sites (in particular tubular lysosomes) and subsequent faster motility of tubular lysosomes, as well in the degradation of AP5Z1 (SPG48), which forms a heterotrimeric complex with SPG15 (spastizin) and SPG11. This complex has been localized by several groups on the cytoplasmic side of LAMP-1-positive lysosomes. In addition, mutations in SPG11, SPG15, and SPG48 patients share various clinical features and were supported by biochemical/cell biological data from Spg11 and Spg15 KO mouse models and cultured cells both from patients and mice, respectively, demonstrating e.g. accumulation of autolysosome storage material, defects in the autophagic lysosome reformation process, and the loss of cortical motoneurons and Purkinje cells.
Major concerns:
i) Fig. 1, 2, 3: major disadvantage of this study is the analysis of overexpressed proteins (SPG11-V5, GFP-Sec61, and Lamp1-mCherry) which might contribute to the observed strong expression of SPG11-V5 in the ER/ER-enriched fraction. The results should be compared with the endogenous expressed proteins.
Authors response :* As stated by reviewer 1, there are no good antibodies to endogenous spatacsin, and therefore we have to rely on expression of tagged spatacsin to study its localization by immunohistochemistry. For the colocalization with the ER, we stained the latter by GFP-Sec61 that is a widely used marker for this compartment. To confirm our results, we plan to try to perform new STED imaging with REEP5 antibody to stain the ER, and Lamp1 antibody to label lysosomes, avoiding overexpression of proteins to label the subcellular compartments. Furthermore, as it is not possible to localize endogenous spatacsin by immunostaining, we addressed its localization by biochemical fractionation and western blots comparing wild-type and Spg11 knockout samples. *
For Figure 2, the data presented were indeed obtained using transfection of Lamp1-mCherry. However, we confirmed our observation of Figure 2A using alternative staining of lysosomes (Lysotracker or loading of lysosomes with Texas-Red Dextran). We therefore think that our data presented in figure 2 are valid, and that the effect we observed on tubular lysosomes was not affected by expression of Lamp1-mCherry.
In Figure 3, the lysosome were labelled with Texas-Red Dextran, and thus all the data presented in figure 3 do not rely on overexpression.
In Fig. 1C the lack of the mature Cathepsin D form which is proteolytically generated only in lysosomes from the higher molecular mass precursor is misleading and should be related to presence of lysosomal membrane proteins.
Authors response: As requested, we have performed a western blot to show the lysosomal membrane protein Lamp2 on the ER- and lysosome-enriched fractions (Figure 1B). This western blot shows that a significant proportion of Lamp2 is actually present in the ER-enriched fraction, which may be explained by the strong association of ER with late endosomes and lysosomes previously described (Friedman et al, 2013). Yet the lysosome-enriched fractions that contained no ER markers do not present spatacsin staining, suggesting that spatacsin is either in the ER or in lysosomes associated with the ER. We reformulated the text of Figure 1 according to the new included data (p 5-6). The 3-colours STED experiment that we plan to perform to answer reviewer 1 comments will help discriminate between these possibilities.
Fig. 1D: the TEM image shows only a single lysosome and proposed ER contact zones in wt-MEFs without comparison with Spg11 KO MEFs (only in the quantification). Without double immunogold labeling of SPG11 (and their lack on SPG11 KO cell lysosomes) and known ER contact-site proteins this image and the conclusion are insufficient.
Authors response : We have added an image of a lysosome taken from a knockout fibroblast (Figure 1E). As stated above there are no good antibodies to spatacsin for immunostaining, so it will not be possible to perform double immunogold labelling. This prevents us from claiming that spatacsin is a protein enriched at contact site. We therefore modulated our result section and discussion accordingly (p.5-6 and p.16).
ii) The rationale for the selection of the deleted Spg11 region D32-34 is not clear. What are the symptoms of this Spg11 knock-in mouse? A more detailed description of the phenotype is required Is the phenotype including the accumulation of LC3-positive material similar to the phenotype of the SPG11 KO mouse which has been published by Varga et al.(2015) and Branchu et al. (2017) ? If not, is the new mechanisms reported here not so important?
Author response : We have added new data (Supplementary Figure 3E-F) showing motor and cognitive impairment in mice expressing truncating spatacsin, although the motor dysfunction is slightly less marked than in Spg11 knockout animals. We also checked for accumulation of autophagy markers. We did not use LC3, but p62 that labels substrates to be degraded by autophagy. We observed accumulation of p62 in Spg11 knockout and in Spg11D32-34/D32-34 mouse neurons (Supplementary Figure 3G). These data support the functional importance of the domain encoded by exons 32 to 34 of Spg11. We commented on this in the text (p.9).
iii) p8/Fig. 3F/Suppl.Fig.3F- the most important part of the manuscript: what are the parameters of lysosomal staining in images that were used to identify genes important for lysosome tubulation by the neural network?
Authors response : For screening in Figure 3, lysosomes were stained by loading fibroblasts with Texas-Red Dextran overnight, followed by a wash of at least 4 hours. The neural network was first trained to discriminate between control and Spg11-/- fibroblasts, using any parameters of the lysosomal staining, not necessarily lysosome tubulation. This is a completely unsupervised and unbiased method, but one of its drawbacks is that we do not know which parameters were used by the network to discriminate between control and Spg11-/- fibroblasts. Therefore, we validated the classification performed by the neural network on a data set independent from the training set before using it for the screening. We rephrased the paragraph to make it clearer (p.9).
I cannot understand how the authors predict the probability of the cell to be considered as an Spg11 KO fibroblast (why not as an Spg11 D32-34 knock-in fibroblast?) as the basis for the selection of interaction candidates.
Author response : The neural network was trained on sets of images obtained from wild-type and Spg11 KO fibroblasts, which were expected to represent extreme lysosomal phenotypes linked to spatacsin function. We could therefore predict the probability of cells to be considered as Spg11 KO, not as Spg11 *D32-34 fibroblasts. We clarified this in the text (p9). *
A simple statement that the neural network approach identified those genes is too weak and requires more convincing experimental data. It has to be shown at least for the 8 positive genes in both approaches how the siRNA treatments of these genes phenocopied the lysosomal changes and of course the effect of the downregulation on the protein level of their products both in wild-type control and Spg11 D32-34 knock-in MEF. The Suppl. Fig.3F is completely unclear. How were the Y2H interaction partner validated? Did the authors use the identified 8 interaction candidates as full length bait to demonstrate the interaction with the Spg11 exons 32-34 ?
Author response : The purpose of the siRNA screen was to quickly identify putative candidates important for the regulation of lysosome dynamics. We identified 8 candidates possibly implicated in lysosomes dynamics based on the two analysis methods. We have added in Supplementary Figure 4 C-D the effect of both siRNA on lysosomal function by the two methods of analysis compared to the effect of siSPG11. However, here we aimed to identify candidates and we do not claim that every one of these eight proteins were indeed implicated in the regulation of lysosome dynamics. We corrected the text, accordingly, stating that the products of the 8 identified genes are good candidates to regulate lysosomal function (p.10). We validated the role of one of the identified candidates, UBR4, and we showed that the UBR4 siRNA indeed downregulates the protein level (Figure 4C). We only validated the interaction of spatacsin Cter with UBR4 by co-immunoprecipitation (Figure 4B).
*For the 7 remaining candidates, full characterization would indeed be required to validate their role and elucidate their mechanisms of action, but this is out of the scope of this manuscript. *
p8/Fig.3F: the genes identified in both approaches have to be listed in the Fig. 3F-Table.
Authors response : We have added in new Figure 3F the list of the 8 candidate genes that could contribute to regulate lysosome function.
The GO process- ubiquitin-dependent protein catabolic process is neither positive for the neural network nor for the directed analysis but positive for both analyses? Please explain. Similarly, the GO process proteolysis involved in cellular protein catabolic process -is not positive for the neural network analysis but again positive for both analyses.
Authors response : We agree with the reviewer that Table 3F in its older version could be a bit confusing. GO analysis is based on “enrichment” of biological processes within a list of proteins. As we did not have the same number of proteins in the 3 analyses provided in original Table 3F, we got variability in the identified biological processes. To simplify, we have therefore chosen to present only the GO analysis for the 8 candidates that were most likely implicated in lysosomal dynamics according to our two analyses of the siRNA screen which is the most relevant for our study (new Figure 3G).
For Fig. 3G the mutant ubiquitin-K0 staining in wild-type MEF cells has to be shown as well as for the Spg11 ki/KO MEFs (+ quantification of the respective data)
Authors response : As stated by Reviewer 4, the expression of lysine-null ubiquitin may impact many different cellular pathways. We therefore removed this part of the data in order to simplify the manuscript (p.10)
iv) The interpretation of the Y2H-interactome analysis by the authors is hard to follow. They searched with the exon 32-34 cDNA for binding partner, selected 3 degradative GO processes and showed by overexpression of a mutant Ub-K0 plasmid in wild-type MEFs a decreased number of tubular lysosomes, as well as their dynamics (without showing the control data in Spg11 KO or ki-MEFs). Thus, poly-ub of proteins should be in some way responsible for a lysosomal phenotype of Spg11ki MEFs.
Now they went to AP5Z1, the second binding partner of SPG11, which is reduced in its abundance upon overexpression of Spg11-GFP. I would expect to do the respective control experiment to show that in the absence of SPG11 or in the knock-in cells the amount of AP5Z1 has to increase. However, in the studies by the Huebner group by deletion of Spg11 or the other binding partner Spg15, no increase of AP5Z1 protein levels has been observed. The authors have to comment on this discrepancy.
*Authors response : We agree that this is an important point to discuss, and we failed to do it in our first version. *
*The complete knockout of spatacsin strongly modifies the levels of its partners. We previously showed that spastizin levels are decreased by >90% in Spg11 knockout (Branchu 2017). Furthermore, the levels of AP5Z1 have been shown to be decreased by ~50% in fibroblasts of SPG11 and SPG15 patients (Hirst et al, 2015). *
Our work shows that spatacsin promotes the degradation of AP5Z1 by lysosomes. It is possible that other degradation mechanism may exist, and could explain the lower levels of AP5Z1 in knockout cells. Furthermore, it was proposed that AP5Z1 stability may depend on the presence of spatacsin and spastizin (Hirst et al., 2013)*. Therefore spatacsin may contribute to tightly regulate AP5Z1 levels by contributing both to its stability, and to its degradation. We have carefully discussed this point (p.16). Furthermore, the experiments requested by reviewer 2 in point (vi) that we are planning to perform will help clarify the mechanisms of AP5Z1 degradation both in presence and absence of spatacsin. *
Then the authors found that the selected interaction partner of the exon 32-34 sequence, UBR4, does not bind to the Spg11-GFP construct lacking the domain encoded by exons 32-34 but to the C-terminal domain of Spg11-GFP. Unfortunately, all these IP-experiments were shown as cut and paste figures, preventing the direct comparison between the input and the IP protein amounts (since the information is missing what percentage of the input and the IP has been loaded per lane, the evaluation and significance of these Co-IPs are unclear).
Authors response : We have added in the Figure legend the fact that the input represents 5% of lysate added to the immunoprecipitation assays
v) p9: AP5 (Z1) is a cytoplasmic protein and can be localized on the cytoplasmic surface of lysosomes. How should the GFP-mcherry-AP5Z1 protein enter the lumen of lysosomes justifying the quenching of the GFP signal? A positive control has to be included in the experiment shown in Fig. 4E demonstrating the effect of MG132 under identical conditions of a protein substrate for proteasomal degradation.
Authors response :* We agree this is an important control. We plan to add a control showing accumulation of ubiquitin in lysates upon MG132 treatment to show it was indeed effective. *
vi) Fig. 5A: In contrast to GFP-mcherry-AP5Z1, spastizin-GFP is localized at the cytoplasmic surface of lysosomes (co-staining with LAMP1-mcherry) in wild-type MEFs. In regard to the incomplete data commented under "minor points Fig.4/Suppl.Fig.4", I suggest to perform a simple control experiment with overexpressed GFP-spastizin and mCherry-AP5Z1 in wild-type MEFs (at the best also in Spg11 KO MEF) with and without bafA treatment, which will clearly demonstrate whether single components of the trimeric Spg11, spastizin-AP5Z1 complex are degraded independently of each other in lysosomes.
*Authors response : As stated above, we will perform this control experiment, and will add the data in Figure 5 in future revision. This will help clarify the mechanism of degradation of AP5Z1 and spastizin both in presence and absence of spatacsin. Discussion of this point will also help to clarify the point iv raised by reviewer #2. *
vii) why did the authors neither mention nor discuss the described role of SPG11 in autophago-lysosome reformation (ALR)?
*Authors response : We did not discuss ALR in our first version as we did not investigate autophagic conditions. However, due to the well-described role of spatacsin in ALR, we agree that we should discuss ALR in our manuscript, and we added a paragraph (p.15). *
Minor points
Figure 1 A, B, D, and G: ER-lysosome contact sites. The quantification of the co-localization of spatacsin-V5 with the ER marker protein GFP-Sec61b has to be given.
Authors response :* We plan to add quantification data performed on STED images showing localization of Spatacsin-GFP together with ER and lysosomal markers. This data will be added in Figure 1. *
Moreover, the authors analyzed overexpressed tagged-proteins only. The results should be compared with the endogenous proteins.
Authors response :* As stated above, there are no good antibodies to endogenous spatacsin for immunostaining. We will add new STED images with antibodies against endogenous Reep5 and Lamp1 to label the ER and lysosomes together with overexpressed spatacsin. Regarding endogenous spatacsin, we could only investigate its localization by subcellular fractionation and western blots comparing wild-type and Spg11 knockout samples. We added biochemical data suggesting that spatacsin is enriched either in the ER or in lysosome membrane associated with the ER. These data have been added in Figure 1 and in text (p.5) and we added a paragraph in discussion regarding spatacsin subcellular localization (p.15). *
p8/Figure 3: what does the 'analysis of trained neural networks' mean?
Authors response : We did not analyzed the trained neural network, but we used this trained neural network to perform image analysis. We clarified the text (p.10).
Figure 4: what happens with the other AP5 subunits?
Authors response : This is a very interesting question. We will test whether overexpression of spatacsin-GFP induces a degradation of some other AP5 subunit, provided we get specific antibody. We will add the data in Figure 4A.
Fig.4F/Suppl.Fig4: live images of GFP-mcherry-AP5Z1 + lysotracker staining have to be shown both for wild-type MEFs with and without bafilomycin A treatment(as in Fig.4F), and in Spg11 KO and Ki MEFs +/- bafA.
Authors response : We will add these data in Figure 4 (WT Mefs +/- Baf A) and in Supplementary Figure 5 (Spg11KO and SPG11D32-34 Mefs +/- Baf).
Reviewer #3 (Evidence, reproducibility and clarity (Required)):
This manuscript highlights an interesting localization of spatacsin in the endoplasmic reticulum (ER)-lysosomes contact sites. In addition, it implicates spatacsin in regulating tubular dynamic lysosomes. Mechanistically, the authors propose that spatacsin interacts with UBR4 to promote the autophagic degradation of its binding partner AP5Z1 at the lysosomes. In turn, this would also regulate the amount of spastizin at the lysosomes, which is known to interact with anterograde motors. The authors further show that AP5Z1 interacts with p150Glued. Thus, the balance between AP5Z1 and spastizin at the lysosomes would determine lysosomal trafficking directionality.
Major Comments
Several crucial results of the manuscript are based on quantifications performed on immunofluorescence stainings. Data points in graphs show individual cells or individual lysosomes and the authors apply statistical tests on replicates that cannot be considered biologically independent, since they come from the same experiment or even the same cell. It is recommended to show superplots where both the individual data and the average of each independent experiment is indicated as recommended by Lord et al. (J Cell Biol 2020 219 (6): e202001064.). Statistics should be performed only on independent biological replicates.
Authors response : We agree with the comments of the reviewer regarding data presentation. We have therefore changed the presentation of all graphs of the manuscript using superplots that allow us to show all the points that were analyzed as well as the mean value for each biological replicate, and performed statistical analyses by comparing the biological replicates as proposed in Lord et al, JCB 2020 (10.1083/jcb.202001064).
The authors have used yeast two-hybrid to search for spatacsin interactors. Although in the manuscript they refer to supplementary tables that should show these interactors, the available Tables are confusing and refer to the following downregulation experiments.
Author response : We have added two supplementary data tables (Now Supplementary Tables 1 and 2) to give the list of interactors of wild-type C-terminal domain of spatacsin and spatacsinD32-34, respectively.
Supplementary Tables 3 and 4 now refer to the analysis of the downregulation experiments by respectively the neural network method and the tubular lysosome detection method.
An experiment to demonstrate that endogenous UBR4 and spatacsin interact by co-immunoprecipitation would be crucial.
Authors response : We agree with the reviewer that it would be important to test whether endogenous spatacsin and UBR4 are interacting by co-immunoprecipitation. So far we have not managed to immunoprecipitate either endogenous spatacsin or endogenous UBR4 with the antibodies we tested, which prevents us to test the interactions of endogenous proteins by co-immunoprecipitation. We are not sure we can provide this result.
Several important experiments to unravel the mechanistic role of spatacsin (Figure 4 and 5) are performed upon overexpression. This is a major limitation of the study and the authors should address it as much as possible. Western blots and immunoprecipitations are shown that appear to have been performed only once and have no quantification. As an example, in Fig 4A the difference in levels of AP5Z1 upon spatacsin overexpression or UBR4 downregulation are very minor. I would be very careful in drawing big conclusions, without additional repetitions and additional experiments in an endogenous setting.
*Authors response : We agree that a lot of our experiments used overexpression. We have now added to the manuscript new data obtained in MEFs where we downregulated spastizin or AP5Z1 (Figure 6). They confirm the role of spastizin in the regulation of lysosome dynamics. Furthermore, our new data show that levels of AP5Z1 must be tightly regulated as both overexpression and downregulation of AP5Z1 affects lysosome dynamics (p.12). We also discussed these data carefully (p.16 ). *
Furthermore, we agree that our presentation did not indicate that the western blots were repeated several times. We have now added quantifications for the western blots presented in Figures 4 and 5. Furthermore, we have also added the data showing that downregulation of UBR4 led to higher levels of AP5Z1 in control fibroblasts (Figure 4C).
The authors suggest a model by which UBR4 recruited by spatacsin is involved in autophagic degradation of AP5Z1. The data shown do not support this conclusion. First, in Figure 4A downregulation of UBR4 does not increase levels of AP5Z1 above the control in lane 1, but only when spatacsin is overexpressed. The effect of downregulation of UBR4 in wilt-type cells on AP5Z1 should be investigated. Secondly, there is no experiment directly proving that the stability of AP5Z1 depends on UBR4.
Authors response : We have added new western blots (and quantification) in Figure 4C showing that downregulation of UBR4 increased levels of AP5Z1 in control conditions. The fact that downregulation of UBR4 increased levels of AP5Z1 in control conditions suggests that UBR4 contributes to regulating the levels of AP5Z1. However, we do not show whether UBR4 directly promotes the degradation of UBR4, which has been added in the discussion (p15). To test whether UBR4 affects the stability of AP5Z1, we will monitor whether downregulation of UBR4 by siRNA increases the half-life of AP5Z1. These data will be added on Figure 4.
The authors suggest that the interaction of spatacsin with spastizin or AP5Z1 are in competition. This is an interesting hypothesis, however to conclusively demonstrate this, pull-down experiments in KO cells and not upon extreme overexpression should be performed.
Authors response : We agree that testing the interaction of spatacsin with its partners in SPG15 KO or AP5Z1 KO fibroblasts would be a very good control of our hypothesis. However, we previously showed that the levels of AP5Z1 are lower in SPG15 KO than in control fibroblasts (Hirst et al, 2015), which introduces a bias in the analysis. We therefore plan to concentrate on AP5Z1 fibroblasts and investigate whether interaction of spatacsin with spastizin is modified in these cells. An alternative would be to monitor the effect of siRNA downregulating AP5Z1 on the interaction between spatacsin and spastizin. We will add these data in Figure 5.
Minor comments
In figure 1G and 1H the overlapping area between lysosomes and ER is quantified. Considering that the ER occupies a large portion of the field a 90{degree sign} flipped control for both WT and KO would be important to sort out random colocalization. In this direction, it would be also essential to show that the total amount of lysosomes is not different in WT and KO, especially because in figure 1A the lysosomes in WT and KO seem to be different not just in shape but also in number and size. A different number or size of lysosomes affects this analysis.
Authors response :* We added quantifications in Supplementary Figure 1F showing that 90° flipped controls are indeed not capturing the same proportion of contacts between the ER and lysosomes. We also added quantifications in Supplementary Figure 1D-E showing that the average size of lysosomes and the number of lysosomes per unit area are similar in control and Spg11 KO fibroblasts and mentioned it in the text (p.6). If the lysosomal staining appears different in Spg11 KO fibroblasts it is because lysosomes are clustered around the nucleus, an observation that we reported previously (Boutry et al, 2019). *
In the second chapter of the Results, the authors state: "we observed by live imaging a higher number of lysosomes with tubular shape in Spg11+/+ compared to Spg11-/- cells", however the number of elongated lysosomes is quantified per area. Why the number of elongated lysosomes is not quantified over the total amount of lysosomes?
Authors response : The point raised by the reviewer is a fair point. The purpose of our analysis was to compare the number of lysosomes with tubular shape in control and Spg11 KO cells. As the number of lysosomes per unit area is invariant between control and Spg11 KO cells as shown in new data included in Supplementary Figure 1D, normalization to total number of lysosomes or to cell surface reflects the same difference in phenotype.
The In the fourth chapter of the Results, the authors state:" In wild-type MEFs, mCherry was colocalized with lysosomes. In contrast, GFP that is sensitive to pH was poorly colocalized with lysosomes, suggesting that AP5Z1 was mainly inside the acidic subcellular compartment (Figure 4F)." If the aim of the authors is to shown that AP5Z1 is mainly into the lysosome, the amount AP5Z1-mcherry inside and outside the lysosome need to be compared, with a proper statistical analysis. There is also a lot of GFP signal in the cytosol. Why is that?
*Authors response : We agree with the reviewer, we will add quantification of the proportion of AP5Z1-mCherry inside lysosomes on Supplementary Figure 5. *
Regarding the GFP-AP5Z1 signal in the cytosol, AP5Z1 has no transmembrane domain and may thus exist as a cytosolic protein. Since GFP is quenched in the acidic environment of lysosomes, the GFP fluorescence of the mCherry-GFP-AP5Z1 protein is outside lysosomes, and it appears partly cytosolic. Of note, there is also some cytosolic mCherry signal that is less visible due to the high level of mCherry fluorescence in lysosomes. We will clarify this point with the quantification of the proportion of mCherry signal compared to GFP inside the lysosomes and add it in Figure 4.
construct used in the paper is a C-terminal tagged version of spatacsin. The authors should consider to test an N-terminal tagged construct at least for the localization experiments.
Authors response : We added an immunostaining image of Spatacsin with an N-terminal tag (Supplementary Figure 1B) and mentioned it in the text (p.6). As spatacsin with a C-terminal tag, it presents a diffuse distribution that poorly co-localizes with lysosomes.
Figure 5C: a negative control and the quantification are missing.
Authors response : A non-transfected cell is present on Figure 5C, visible thanks to the Lamp1 immunostaining, and that we considered as a negative control. In this non-transfected cell, we detected no PLA signal. We added an asterisk to point the non-transfected cell on Figure 5C. Quantification will also be added in the revised version after we have performed the PLA experiment required by Reviewer 1.
Reviewer #3 (Significance (Required)):
Since spatacsin, AP5Z1 and spastizin are all implicated in hereditary spastic paraplegia, the data are of potential interest not only for basic cell biology, but also to understand the pathogenesis of the disease. In addition, the manuscript proposes a novel model regulating trafficking of dynamic lysosomes.
Reviewer #4 (Evidence, reproducibility and clarity (Required)):
Pierga et al. reveal subtle differences in lysosome morphology, ER-contact, and trafficking in the absence of Spatascin. These data are replicated with a truncated Spatascin, presumably a loss of function. Two-hybrid screening of the deleted sequence from this truncation for interactors and then asked whether these hits could phenocopy the lysosome morphology changes. This led to an assertion for a role for ubiquitination in these effects. Rather than these hits the group then investigates previously known Spatascin interactors and reports similar complex but subtle abnormalities via overexpression or knockdown of these. While data show overlapping phenotypes by modulation Spatascin, AP5z1, and Spastizin, the manuscript is confusing, leaps from experiment to experiment, and does not provide novel rigorous mechanisitic insight. It conflates all the discrete lysosomes aspects into a collective to link them. The title is over-stated and not appropriate for the experiments.
The localization of endogenous Spatascin is lacking - over-expression is prone to artifact and the punctate data on the V5 suggests much more work is needed to understand where in the cell it is. It would seem much more work is needed here.
Authors response : As stated by reviewer 1, there are no good antibody to endogenous spatacsin, and therefore we have to rely on expression of tagged spatacsin to study its localization by immunofluorescence. When performing the images, we avoided the cells with the highest ovexpression of tagged spatacsin. Yet, we agree that this is still overexpression. That’s why we included subcellular fractionation data where we can detect endogenous spatacsin (Figure 1A-1B). These data confirmed that spatacsin is enriched in the ER or in lysosome fraction tightly associated with the ER.
Furthermore, the EM data (1E) would suggest the far majority of lysosomes are in contact with ER - these seems uncharacteristic.
Authors response : The EM data in figure 1E indeed shows that the majority of lysosomes are in contact with the ER, as previously shown by other groups (Friedman et al, 2013, Höglinger et al, 2019).
The phenotypes analyzed are very subtle, and while statistically significant the biological impact is unclear - in many cases individual lysosomes (or lysosome-ER contacts) are considered as an 'n'. While these results are probed across multiple independent experiments the batch effects and how uniform per cell the events are is unclear.
Authors response : We agree with the comments of the reviewer regarding data presentation. ‘n’ represented individual cells, but did not actually take into account the variability across experiments. We have therefore changed the presentation of all graphs of the manuscript using superplots that allow us to show all the points that were analyzed as well as the mean value for each biological replicate, and performed statistical analyses by comparing the biological replicates as proposed in Lord et al, JCB 2020 (10.1083/jcb.202001064).
In fig 2H critical data are missing - the effect of Spatascin KO on the transition between these morphologies should be considered as in G. Otherwise the relevance is unclear.
Authors response : We have added this quantification on Figure 2I. It shows that transition of morphology of lysosomes from round to tubular in Spg11 KO cells is still associated with a change of speed, although the average speed attained is halved compared to conditions where spatacsin is present. This shows that loss of spatacsin does not abolish morphological transition of lysosomes but limit their speed in the tubular shape. We commented on this new data in the text (p.8).
The impact of over-expressing a lysine-null Ub ( Fig 3) is far too crude and non-specific to have meaning here. It is assumed that the only proteins affected are those of interest. This is consistent with much of the paper where "true-true-and unrelated" is more likely than the presumption of causality.
Authors response : It is true that the expression of lysine-null ubiquitin is really crude and may impact many different cellular pathways. Furthermore, the results obtained with the lysine-null ubiquitin do not contribute to the rest of the paper. We therefore removed the original Fig3G, H, I and Fig 4B and updated the text accordingly (p.10).
The blots in Fig4 are a relatively poor quality and not quantified over repetition.
*Authors response :Spatacsin and spastizin are large proteins, and there is not much choice for antibodies able to detect these proteins. Yet we have validated their specificity by western blot using knockout cells (spatacsin) (Supplementary Figure 4 A-B) or siRNA (spastizin) (Supplementary Figure 7B). We agree that our presentation did not indicate that the western blots were repeated several times. We have added quantifications for the western blots present in Figures 4 and 5. We also changed some illustrative western blots to improve quality. *
Controls are missing and Fig5 suffers from a reliance on over-expression - there is a massive over-expression of AP5Z1 which may be affected the stoichiometry of these overall interactions, but with an n=1 its hard to know and its not clear what these data add. Again, while statistically significant (5E and F) due to the nature of data analysis (every lysosome=n of 1) it is not clear how biologically significant UBR4 siRNA or AP5Z1 over-expression is - as the accumulation of AP5Z1 in these two conditions is orders of magnitude apart - again likely unrelated.
Authors response : We added quantification for this western blot (Supplementary Figure 6A).
*As stated above we have changed the representation of the graphs. Each point represents one cell, and we included the mean value for each biological replicate. *
Preventing degradation of AP5Z1 by UBR4 siRNA or overexpression of AP5Z1 do not indeed have the same effect on total AP5Z1 but do have a similar effect on the interaction of spatacsin with its partners evaluated by co-immunoprecipitation, as illustrated by the quantifications that we have added. We clarified this in the text (p.12). As requested by reviewer 3, we will also investigate the effect of AP5Z1 knockout or downregulation on the interaction between spatacsin and spastizin assessed by co-immunoprecipitation. These data will be added in Figure 5 and will strengthen our conclusions.
Fig 6 begins to conflate the fact that different lysosome morphologies appear to have different trafficking properties even in WT cells and that many of these targets affect morphology - therefore to conclude a direct effect on trafficking seems inappropriate.
Authors response : In original Figure 6, we showed that Kif13A-ST and p150CC1 changed the proportion of tubular lysosomes (previous Figure 6 and H), and the data showing that these constructs changed the trafficking of lysosomes were presented in Supplementary Figure 5 B-C. We have now moved the data showing the effect of Kif13A-ST and p150CC1 in the main Figure (Figure 6F and 6I) to facilitate the interpretation of the data. Therefore, expression of Kif13A-ST and p150CC1 do not only affect the morphology of lysosomes, but also impaired their trafficking. We thus do not extrapolate lysosome dynamics from their morphology, we actually quantify lysosome dynamics.
Fig 7 extends this into polar cells (neurons) but still it is not clear whether form (morphology) dictates function (likelihood of trafficking or directionality.
Authors response : We did not only analyzed neurons because they are polarized cells, but because neurons are the main cells affected by neurodegeneration observed in absence of spatacsin (Branchu et al, 2017). We added new data on Figure 7 showing that tubular lysosomes in axons are actually more dynamic than round lysosomes, as observed in fibroblasts. We added these data in Figure 7 and text (p.13).
Investigation of lysosome trafficking in axons also allowed us to investigate the directionality of movement, which is difficult in MEFs. We clarified this point in the text (p.13).
In sum, there is a lot of data that collectively points to a partial localization of Spatascin at Er-lysosome contacts and an influence on morphology and trafficking of lysosomes in the cell, but at the end of the day very new mechanism is brought to light.
Authors response : The mechanisms regulating trafficking of lysosomes are far from being fully resolved. Our manuscript shows that spatacsin contributes to this regulation by modulating the degradation of AP5Z1. This in turn regulate the lysosomal association of AP5Z1 and spastizin that interact with motor proteins to control lysosomal dynamics.
Reviewer #4 (Significance (Required)):
This manuscript is directed to the basic cell biology community - involving ER, lysosome, and microtubule dependent trafficking. There are some new analytical tools employed and many co-factors and binding partners of Spatascin considered but frankly too many to adequately and rigorously control for. Because of this the manuscript is very unfocused, hard to follow and makes too many assumptions about shared dynamics ? necessarily arising from shared morphology - lysosomes are highly dynamic and can be affected by virtually any change in intracellular trafficking or protein/membrane transport. This is not appropriately considered.
Authors response : We have clarified our manuscript to show that dynamics is not necessarily arising from a tubular morphology. It turns out that lysosomes with a tubular morphology indeed are more dynamic that lysosomes with a round morphology. Importantly, in all our experiments dealing with lysosomal dynamics, we have actually included a quantification of lysosome dynamics using time lapse imaging as detailed in methods (p.21).
liability side would be a digital bearer asset, and a rather efficient one at that.
digital bearer asset means a token (or luggage tag?)
They didn't block new features for shits and giggles, though – the method to this madness was rent-extraction. The iron-clad rule of the Bell System was that anything that improved on the basic service had to have a price-tag attached. Every phone "feature" was a recurring source of monthly revenue for the phone company – even the phone itself, which you couldn't buy, and had to rent, month after month, year after year, until you'd paid for it hundreds of times over. This is an early and important example of "predatory inclusion": the monopoly carriers delivered universal service to all of us, but that was a prelude to an ugly, parasitic, rent-seeking way of doing business:
Predatory inclusion is a form of rent-seeking in which one preys on customers using monopoly power to extract excessive value for small add-on services.
Another intuitive justification is that a page can have a high PageRank if there are many pages that pointto it, or if there are some pages that point to it and have a high PageRank.
So, does this mean that hyperlinks influence the PageRank? If you were to tag a website multiple times, it's PageRank index will significantly increase?
2.
It's from the first project "Fluffy Tag". In this essay I wrote a story about my chilhood and how this memory was recalled. I had a dream to my grandma sewing my worn pillowcase, which reminds me of her throwing away my favorite pillowcase with my special smell on its tag when years ago. But I woke up that morning holding the tag on my comforter and caught a trace of the familiar smell, and I finally found my unique smell back.
Note: This preprint has been reviewed by subject experts for Review Commons. Content has not been altered except for formatting.
Learn more at Review Commons
In this manuscript by Rodriguez-Real et al, the authors address the contribution of the centrosome to cellular process unrelated to organizing the microtubule cytoskeleton, namely DNA repair. As many proteins contributing to the DNA damage response physically associate with centrosomes, this appears a relevant question that has been neglected so far and led to a number of studies that appeared controversial. To do so, the authors exploit a variety of tissue culture models that are well established in the fields of centrosomes and DNA repair, including U2OS and RPE1 cells, exposed to perturbations promoting DNA damage (such as ionizing radiation or pharmacologic perturbation of DNA stability) in conjunction with siRNA mediated depletion of candidate centrosomal proteins., followed by the visualization of repair events either using fluorescent reporters, or visualizing endogenous repair foci by immunofluorescence. On this basis, the authors propose that a discrete centrosomal sub-structure, namely sub-distal appendages and the CEP170 protein therein concur to promote a particular nuclear DNA repair process, namely homologous recombination.
The manuscript suffers of two main limitation:
Given that uncovering the mechanism underlying the contribution of CEP170 to homologous recombination might prove very demanding, my comments will focus primarily on the second point.
Major comments:
The centriolar depletion using centrinone is known to impinge on cell proliferation in p53 WT cells. Thus, I am not convinced that the data shown in Figure S1B and S1C will sufficiently document that the observed unbalance between HDR and NHEJ are not simply reflecting a different cell cycling speed/behavior. Moreover, it would be important to address whether centrinone or depletion of CEP170 (an essential gene, according to the authors!) will trigger DNA damage by themselves. In fact, even a small extent of chronic genotoxic stress caused by the perturbations used in the manuscript might explain the reported differential proficiency of HDR.
Minor comments:
It is a pity that CEP170 is not amenable to functional dissection using a complete knockout. The fact that in PMID: 27818179 a complete knockout of CEP128 has been achieved, suggests however that subdistal appendage mediated DNA repair is not the essential process in itself. As the authors employ other cell lines stemming from the same laboratory, they could consider acquiring CEP128 KO to complement their own experiments.
The proposal that CEP170 phosphorylation of by ATM/ATR upon DNA damage might require SDA localization of the protein is plausible, yet not circumstantiated by any experimental evidence. If the authors could monitor the phosphorylation of the endogenous CEP170 protein in WT vs CEP128 KO cells (phosphor-specific antibody, MS-based proteomics or simply "phos-tag" gels), this could provide a first spark towards a mechanistic understanding of the reported phenomenon.
The entire Figure 4 is based on quantifications of clonogenic potential.
Odf2 contribution to both DAs and SDAs: while Odf2 has been initially proposed to be necessary for the assembly of both types of appendages, its contribution to distal appendages has been disputed by Tanos et al using siRNA (PMID: 23348840), also confirmed by our group using CRISPR (unpublished). Thus, the role of Odf2 in SDA assembly appears more crucial than for DA assembly.
CEP164 contribution to ATM/ATR activation: this has been disputed in this paper by the Morrison lab (PMID: 26966185). Thus, a cautionary note should be mentioned when referring to this concept.
Taken together, this manuscript addresses the contribution of the centrosome to DNA repair. This is in itself a very interesting topic with the potential to attract the interest of both cell/molecular biologists as well as cancer researchers. The major advance strength is represented by pinpointing a specific centriolar substructure, namely subdistal appendages, in the control of HDR. CEP170 had been previously shown to be target of phosphorylation by ATM/R and the present study highlights that the abovementioned phosphorylation is not a mere passenger event during DNA repair, but that potentially reflects a decisive event informing the repair pathway of choice. However, several experiments have alternative explanations/interpretations and no understanding of the underlying mechanism is provided.
The expertise of this reviewer is the study of cell cycle regulation and on the centrosome structure/function.
certain classes of Mastodon page have corresponding RSS feeds, and wondered if the tag pages are members of one such class. Sure enough they are, and https://mastodon.social/tags/introduction.rss is a thing.
Mastodon has RSS feeds available for tags!
I'm enamored of this idea as well and this is a fascinating example.
It seems similar to the related (and also difficult-to-name) concept which I've called combinatorial creativity. One of the earliest versions I've seen is that of Raymond Llullus' work with respect to combinatorial mnemonics described in Frances Yates' The Art of Memory (1966). Farnam Street's post is a good start https://fs.blog/networked-knowledge-and-combinatorial-creativity/, but I've been collecting other examples: https://hypothes.is/users/chrisaldrich?q=tag%3A%22combinatorial+creativity%22 and other names for it over time.
I can't help but wonder what Ericsson's role of deliberate practice would look like with arts as the subject? What motivates long term deliberate practice?
Yates, Frances A. The Art of Memory. 1966. Reprint, Chicago, IL: University of Chicago Press, 2001. https://www.amazon.com/Art-Memory-Frances-Yates/dp/0226950018.
Ericsson, K. Anders, Ralf Th. Krampe, and Clemens Tesch-Romer. The Role of Deliberate Practice in the Acquisition of Expert Performance. Psychological Review, 1993.
support@opfin.com
add the mailto: tag and add a fullstop
"In case you want a white logo, contact us."(hyperlink contact us)
glutathione S-transferase
A protein that is popularly used as a tag for the purification of recombinant proteins. It can be fused to either ends of the desired protein, usually the end that does not affect the function of the target protein.
A recombinant protein is produced by cloning a gene into a system that allows the expression of that gene and the translation of its gene product.
BIOmastodonte
Authors' response (28 November 2022)
GENERAL ASSESSMENT
This interesting preprint by Suárez-Delgado et al. explores the mechanism by which activation of the Hv1 voltage-activated proton channel is dependent upon both the voltage and pH difference across the membrane. The authors are the first to incorporate the fluorescent unnatural amino acid, Anap, into the extracellular regions of the S4 helix of human Hv1 to monitor transitions of S4 upon changes in voltage or pH. The authors first checked that Anap is pH insensitive for practical use in Hv1, where changes in local pH are known to occur when the voltage sensor activates and the proton pore opens. Anap was incorporated at positions throughout the S3-S4 linker and the extracellular end of S4 (up to the 202nd residue) of hHv1 and some positions showed clear voltage-dependent changes in fluorescence intensity. The authors also obtained fluorescence spectra at different voltages and observed no spectral shifts, raising the possibility that voltage dependent changes in fluorescence intensity could primarily be due to fluorescence quenching. Upon mutation of F150, the Anap signal at the resting membrane voltage increased, suggesting dequenching upon removal of F150. The authors also discovered that the kinetics of Anap fluorescence upon membrane repolarization have two phases (rapid and slow) under certain pH conditions and that there is a pH-dependent negative shift of the conductance-voltage (G-V) relation compared with the fluorescence-voltage (F-V) relation in some mutants. The biphasic kinetics of the fluorescence decay upon repolarization were explained by modelling a slower transition of return from intermediate resting state to a resting state. The pH-dependent shift of the G-V relation from the F-V relation provides insight into mechanisms of ΔpH-dependent gating of Hv1, a longstanding enigma. Overall, the approaches are rigorous, the figures show important results, and this work paves the way for the use of Anap fluorescence to study Hv1 gating and modulation.
We thank the reviewers for the careful reading and assessment of our manuscript and for the constructive criticism. We have tried to respond to all the essential revisions, both by rewriting sections and performing some experiments or new analysis. Below we respond one by one to all the points raised. Please also note that we have added an author to the manuscript, who has carried out new experiments included in this revised version of the preprint.
RECOMMENDATIONS
Revisions essential for endorsement:
1) In its current form, the narrative of the preprint has two threads. One on the mechanisms of Anap fluorescence changes (mainly quenching) and another on a previously unappreciated transition of the voltage sensor, as revealed by Anap. Our impression is that the preprint suffers somewhat from this split focus, which could be resolved by explaining why Anap was used to explore voltage sensor activation in Hv1 in the introduction. Perhaps the authors could also explain the advantage of smaller sized fluorophores compared to other maleimide-based fluorophores earlier in the introduction, or the utility of being able to insert Anap into transmembrane segments. The authors should more clearly point out how they exploited the advantages of Anap as a tool in this study. It would furthermore be helpful to discuss previous studies using nongenetic tools for VCF and spell out how they have delineated key aspects of Hv1, which would help to emphasize how several positions studied here (for example, 201 and 202) could not be labelled with cysteine-based fluorophores.
We think that this is a very useful suggestion and we have expanded the introduction to more pointedly indicate the contributions of previous voltage-clamp fluorometry experiments in Hv1 channels and to clearly explain why we chose to pursue the use of a genetically-encoded small fluorophore such as Anap.
2) We think the authors should be cautious about understanding the physicochemical nature of Anap using prodan as a model. It would be helpful to discuss the possibility that undetected spectral shifts due to a nonquenching mechanism could be overlooked, even though major signal changes can be explained by fluorescence quenching in their data. Regarding the mechanisms of remaining voltage-dependent fluorescence changes of F150A-A197Anap, it would be helpful for the authors to suggest possible ideas about which residues might account for remaining signals.
The beautiful spectral data for Anap is impressive. However, the physicochemical basis of the fluorescence change of Anap cannot be understood by simple extension of findings for prodan, which shows structural similarity to Anap. Our understanding is that changes in Anap fluorescence can only reveal a change in the structural relationship between Anap and one of its neighbors because the physicochemical basis of Anap fluorescence is complicated. For example, fluorescence could also be affected by the electrostatic environment, stretch of peptide bond, etc. Previous studies, including those of TRP channels, showed that the kind of environmental changes that Anap faces in ion channels do not necessarily induce large spectral shifts, unlike in cell-free spectral analyses using distinct solvents. Further, only minor shifts in spectra occur upon local structural change, as seen in previous work including Xu et al. Nat. Commun. 2020 11:3790. Such minor shifts could be perhaps overlooked even when Anap is incorporated into S4 and exposed to environmental change. Therefore, it is not easy to decode the physicochemical basis of Anap fluorescence changes. F150A-A197Anap has increased fluorescence and no change in spectral pattern, leading the authors to conclude that F150 quenches Anap fluorescence of A197 position. However, a significant amount of fluorescence change still occurs upon changes in membrane potential after F150 is changed to alanine (Figure 4). It is very likely that quenching is not the only mechanism underlying the observed voltage induced change of Anap fluorescence of Hv1. The authors suggest that remaining voltage-dependent fluorescence change of F150A-A197Anap could be due to interaction with other aromatic residues, but this has not been tested.
Thank you for pointing out our oversimplified discussion of the mechanisms of Anap fluorescence changes in Hv1 channels. We have taken into account your comments and present a more nuanced and toned-down discussion of the possible mechanisms at play in our experimental system.
3) The current version of the preprint is missing important control experiments, ideally performed using western blots to measure protein expression or, if that is not possible, proton current and fluorescence measurements, to demonstrate that protein expression or functional channels are not seen for all mutants in the absence of ANAP (but in the presence of the tRNA and Rs construct). A similar control for imaging would be to use ANAP alone without encoding.
We thank the reviewers for this recommendation. We show that the number of cells showing mCherry fluorescence is greatly diminished in the absence of L-Anap, but in the presence of the tRNA and synthetase. As suggested, we have included results of control experiments in which we attempted to record currents from cells expressing the constructs: F150A-A197tag, Q191tag, A197tag and L201tag co-expressed with the tRNA and synthetase-coding plasmid (pANAP) and in the absence of L-Anap. We struggled to find red fluorescing cells and recorded currents from a relatively small number of these cells, most of which was leak current. We now include these data in Figure 1-Supplement 1B. These control experiments show that there is very little leakage of expression of channels that did not incorporate Anap.
4) Aromatics in the S4 segment were ruled out as potential quenchers on the assumption that they would move together with Anap during gating. It should be noted, however, that Hv1 is a dimer and therefore a fluorophore attached to S4 in one subunit could be quenched by S4 aromatics in the neighboring subunit if were close to the dimer interface. In Fujiwara et al. J. Gen. Physiol. 2014 143:377-386, for example, W207 does not appear very far from labeled positions in the adjacent S4. This possibility should be mentioned in the discussion.
We appreciate the reviewers' concern regarding the role of other aromatic residues near Anap incorporation sites, especially the ones close to the subunit interface given that Hv1 is a dimer. We now mention the possibility that other residues could be quenching groups, especially given the fact that some quenching remains in the double mutant F150A-A197Anap (line 272 in results and line 432 in discussion). We have also included a new analysis of the ratio of Anap/mCherry fluorescence (at resting membrane potential) for all insertion sites. This shows a decreased ratio as Anap gets inserted in residues closer to the c-terminus of S4, which is evidence of a quenching group located near the center of the transmembrane domains (Figure 4-Supplement 1).
5) It is not clear whether the Anap spectra purely represent Hv1 incorporated into the plasma membrane or perhaps include signals from the cytoplasm or channels in internal membranes (whether assembled or incompletely assembled). It would be helpful to provide a more complete presentation of the data obtained and to provide more information in the Methods Section. In the Methods section, it is stated "The spectra of both fluorophores (Anap and mCherry) were recorded by measuring line scans of the spectral image of the cell membrane, and the background fluorescence from a region of the image without cells was subtracted". How are signals from cell membranes specified in this method being discriminated from those associated with the cytoplasm and intracellular membranes? If spectral data include signals from free Anap in the cytoplasm or Hv1 in intracellular membranes, spectral shifts upon membrane potential changes will be difficult to detect, even when Anap is incorporated into Hv1 and senses environmental change by voltage-induced conformational change. In Figure 3E, wavelength spectra were shown as standardized signals for different voltages. Amplitude change would be demonstrated (spectrum at different voltages without standardization should be shown).
We appreciate the concern related to the origin of the fluorescence signals and we have improved both the presentation and the associated figures. Since this is also a concern for the experiments that determined the pH-dependence of Anap incorporated at position Q191, we have included a figure supplement 1 to Figure 2 in which we explain how the membrane was visualized. We use mCherry fluoresce as an indication of plasma membrane-associated channels, since its red fluorescence is easier to detect in the membrane than Anap fluorescence (even though cytoplasm dialysis in whole-cell should diminish the amount of free Anap, it is difficult to distinguish Anap fluorescence in the membrane by itself). Once the membrane associated mCherry fluorescence is detected, the measurement of the spectrum from a very small membrane area is insured because the spectrograph slit delimits light collection to a very small vertical area and the horizontal line scan further limits light measurement. These procedures are now made explicit in methods section and supplementary figure mentioned before. Moreover, we explain that they were also followed in experiments where the cell was under voltage-clamp. The spectral data in Figure 3E is now presented without normalization to show the voltage-dependent change in amplitude without changes in peak emission wavelength.
In Figure 4, spectra were compared between A197Anap and F150A-A197Anap, showing increases of fluorescence in F150A-A197Anap. Was this signal measured at resting membrane potential? How does the spectrum change when the membrane potential is changed?
As in the experiments of figure 1E, the spectra were obtained in non-patched cells. Thus, the signal was measured at the HEK cell resting potential (~ -30 mV) and a ΔpH ≈ 0.2. We have now incorporated that information in the methods section and the figure description. On the other hand, we did not perform experiments measuring the double mutant spectra at different voltage steps, so we cannot respond to the second question.
Rationales for the confirmation of signals originating from the cell surface for Hv1 Anap might include the observations that: a) some mutants showed slightly different spectral patterns (in particular, Q191Anap showed a small hump at longer wavelengths, which is proposed to represent FRET between mCherry and Anap) and b) signal intensity was voltage dependent (if signals originate from endomembranes, they should not be voltage dependent). Mentioning these two points earlier in the text might help to alleviate concerns about the location of the protein that contributes to the measured signals.
These are great suggestions and we have incorporated them to the text (lines 156, 190 and 216 Results section), along with a better explanation of procedures followed to measure mostly membrane-associated fluorescence (see new Figure 2-Supplement 1).
6) In Fig 5, the fluorescence kinetics do not really match the current activation kinetics for panels A, B, and C. Is there an explanation for this mismatch? It would be helpful to have the fitted data in the figure. A more thorough comparison of the kinetics of currents and fluorescence would be helpful throughout the study.
We believe that the kinetics of fluorescence and current does not match because the current activation rate is overestimated due to a small amount of proton depletion present in recordings from large currents. This is an unavoidable problem in proton current recordings, even with the high concentration of proton buffer used in our experiments and the long time-intervals between each voltage pulse. For this reason, we did not undertake a systematic exploration of kinetics. Nonetheless, the current and fluorescence rates are very close and have the same voltage dependence, indicating a close correlation between voltage-sensor movement and current activation. We now explain this limitation in the manuscript text (line 223 and 327, results section).
7) Which construct of hHv1 was used to obtain the data in Figure 6? Unless we missed it, this information is not provided in the text or figure legend. Is it for L201Anap? This figure also shows an intriguing finding that the G-V relationship is negatively shifted from the F-V relationship at pHo7-pHi7 but not at pHo5.5-pHi5.5. A shifted G-V relation with the same ΔpH contrasts with what has been reported in other papers. However, the authors did not really discuss this surprising finding in the light of previous references. Could the shift of the G-V relation between two pH conditions with the same ΔpH be due to any position-specific effect of Anap? If Figure 6 represents L201Anap mutant, the presence of Anap at L201 probably makes such shift of G-V curve in Figure 6C? The authors should openly discuss this finding in relation to what has been reported in the literature.
Yes, construct L201Anap was used in Figure 6. This is stated now in the figure legend and in the corresponding main text. We agree that the leftward shift of the GV with respect to the FV in pHi7-pHo7 is an intriguing finding, suggesting that coupling between S4 movement and proton permeation can be regulated by the absolute value of the pH. We discuss this in the results section. The DeCoursey group has shown evidence in W207 mutants of hHv1 that the absolute value of pH can modulate the voltage dependence of the conductance. Although we had mentioned these results, we now mention them more prominently and also discuss the possibility that this might be a unique feature of introducing Anap at L201.
8) The authors suggest that the small hump near 600 nm in Figure 1E represents FRET between Anap and mCherry. It is surprising that FRET can take place across the membrane. Can the authors point to another case of FRET taking place across a cell membrane? One possibility might be that misfolded proteins place mCherry and Anap close to each other. It is also curious that only A191Anap did not show such a FRET-like signal. Also, if there is FRET, why wouldn't this also contribute to the voltage-dependent changes in fluorescence?
We thank the reviewers for bringing up this point. Based on published data, we assumed that mCherry could not be excited by 405 nm radiation, thus our conclusion that the observed emission near 604 nm is FRET between Anap and mCherry. We have now measured the excitation of the Hv1-mCherry construct and observe that the 405 nm laser is capable of exciting mCherry and produced ~2 % emission (as compared to 514 nm excitation), which is almost the same as that observed for the Hv1Anap-mCherry channels. We now conclude that the second hump in the emission spectrum near 600 nm is due to direct excitation of mCherry.
On the other hand, FRET across the membrane has been demonstrated for the membrane-bound hydrophobic anion dipicrylamine and membrane-anchored GFP (Chanda, et al. A hybrid approach to measuring electrical activity in genetically specified neurons. Nature neuroscience, 2005, vol. 8, no 11, p. 1619-1626.) and dipicrylamine and GFP in the c-terminus of CNG channels (Taraska & Zagotta, Structural dynamics in the gating ring of cyclic nucleotide–gated ion channels. Nature structural & molecular biology, 2007, vol. 14, no 9, p. 854). Finally, single-molecule FRET between dyes placed extracellularly and intracellularly in Hv1 channels has been demonstrated (Han et al. eLife 2022;11:e73093. DOI: https:// doi. org/ 10. 7554/ eLife. 73093).
A191Anap shows the hump at ~600 nm, but we think it's less evident because Anap at 191 is less quenched (see Figure 4-Supplement 1 and answer to point 4 above).
9) F150A-A197Anap shows a leftward shift of the F-V relation compared with the G-V relation only when ΔpH=1. Another unusual finding with F150A-A197Anap is the very small shift of the G-V relation between ΔpH=0 and ΔpH=1, when other reports in the literature suggest it should be 40 mV or more. Are these peculiar properties simply due to the absence of Phe at position 150, which might play a critical role in gating as one of the hydrophobic plugs of Hv1? To address this possibility, it would be ideal to compare different ΔpH values with and without F150 when Anap is incorporated at a different position (such as L201Anap). Regardless, it would be helpful to discuss this point.
We now discuss these changes in the discussion (lines 440-446).
10) In Figure 1E, I202Anap exhibits a blue shift in its spectrum suggesting the environment of Anap on I202 is more hydrophobic than the other sites. We presume these spectra were obtained at a negative membrane voltage, but the text or legend should clearly state how these were obtained. The authors should also explain whether the whole cell or edge was imaged. If these are at negative membrane voltages, might the Anap spectrum shift to higher wavelengths (i.e. more hydrophilic) when the membrane is depolarized? Did the authors find any spectral shift for I202Anap when doing a similar test as depicted in Figure 3E?
Yes, the spectrum of I202Anap was obtained at the resting potential (~ -30 mV), as were all spectra in Figure 1E. We now indicate this clearly in the methods section and in the figure legend. Fluorescence was measured from the membrane region as indicated by mCherry fluorescence and as illustrated in Figure 2-Supplement 1. We did not explore this mutant further and we cannot answer the question of whether a depolarizing potential might produce a red shift of the spectrum.
11) In Figure 3E, spectra are shown as normalized signals for different voltages, but an amplitude change should also be demonstrated by providing raw spectra at different voltages.
We have changed figure 3E to show non-normalized data that now show the increase in fluorescence intensity and no wavelength shift in the fluorescence spectrum of Anap (see also response to point 5).
12) In Figure 4, spectra are compared between A197Anap and F150A-A197Anap, showing increase of fluorescence in F150A-A197Anap. Were these obtained at a negative membrane voltage? How do these spectra change when membrane potential is changed?
See response to point 4 of "Revisions essential for endorsement" section.
Additional suggestions for the authors to consider:
1) The authors propose that Anap fluorescence tracks an S4 movement involved in the opening of the channel. They also argue that the existence of more than one open state could explain why the increase in florescence upon depolarization lags the proton current in most cases. While they convincingly show that Anap is not pH sensitive per se, when incorporated into the protein, the fluorescence efficiency of the fluorophore could still be affected by protonation of channel residues in the immediate environment when the channel opens, even after S4 has completed its movement. To address this alternative explanation, the authors could use Hv1 mutants with strongly reduced proton conductance. Channels bearing mutations corresponding to N214R or D112N were used successfully to isolate Hv1 gating currents from the much larger proton currents (De La Rosa & Ramsey, Biophys. J. 2018 114:2844-2854; Carmona et al. PNAS 2018 115:9240-9245; Carmona et al. PNAS 2021 118: e2025556118). Perhaps, they could be used with patch clamp fluorometry as well?
This is an interesting suggestion that could be explored in a follow up study.
2) The data showing that Hv1-197Anap is quenched by Phe at position 150 are very nice. Yet, it would be useful to show that the quenching is specific to F150 using a negative control. F149, for instance, is just next to F150 but points in a different direction, so its mutation to alanine should not affect Hv1-197Anap fluorescence.
This is an interesting suggestion, but, as suggested by reviewers, we think there is a possibility that other aromatic residues could contribute to quenching. Given the absence of a reliable structure for Hv1, prediction of the relative positions of any resides is very difficult and thus we did not attempt the suggested experiment.
3) A major finding of this work is the identification of a slow kinetic component that is highly sensitive to ΔpH. Earlier studies found that the ability of Hv1 to sense ΔpH is altered by some channel modifications, e.g., in the loop between TMH2 and TMH3 (Cherny et al. J. Gen. Physiol. 2018 150:851-862). Did the authors check whether any of these modifications alter the transition responsible for the slow kinetic component? For instance, a suppression of the transition resulting from a H168X mutation would help tighten the link to ΔpH sensing.
We did not carry out any of these experiments.
4) We understand that it is difficult to tightly control intracellular and extracellular pH when Hv1 is heterologously expressed in mammalian cells. The G-V relation is not always reliable because accumulation of protons or depletion of protons upon Hv channel activity will alter gating, as the authors have previously published (De La Rosa et al., J. Gen. Physiol. 2016 147:127-136). Could the kinetic analysis of Anap fluorescence be affected by similar alterations to proton concentration in the vicinity of Hv1? It would be helpful for the authors to comment on this specifically.
Thanks for this suggestion. Yes, we think that the kinetics, specially of ionic currents can be affected by even small changes in the pH gradient, for this reason we did not attempt a systematic kinetic analysis. We mention this in the text where we compare the voltage dependence of current and fluorescence activation for construct A197Anap (line 223).
5) Quenching of Anap by Phe could be verified in cell free conditions using a spectrophotometer with different concentrations of Phe, or citing the literature if it has already been reported.
We attempted this experiment but were unsuccessful in observing Anap quenching by phenylalanine at the concentrations of phenylalanine that can be attained in aqueous solution. We suspect that Phe quenching of Anap could happen by electron transfer or ground-state complex formation, in which case near proximity is necessary and higher concentrations of Phe would be required to detect quenching in solution. However, we measured the absorbance of Anap in the absence and presence of phenylalanine (Phe) (and tyrosine (Tyr)) at the concentrations that can be achieved in aqueous solution (8 mM and 1mM, respectively). Absorbance measurements can detect ground-state complex formation even at relatively low concentrations (J.R. Lakowicz, 1999, Principles of Fluorescence Spectroscopy). We observed that the absorbance of Anap is modified by the presence of Tyr or Phe, indicating that these amino acids indeed interact with Anap, possibly through ground-state complex formation. We include this data for the reviewers to inspect.
6) The authors did not cite any example of Anap incorporation into S4 helices, but there are several recent papers where Anap was utilized to probe motion of S4 in other channels. Examples include Dai et al., Nat. Commun. 2021 12:2802 and Mizutani et al. PNAS 2022 119:e2200364119.
Thanks for this observation, we have included these important results in the discussion.
7) In the Anap-free negative control (with only A197TAG plasmid transfection), the mCherry signal seems positive (Supplementary Figure 1, left row, second from the top). Is this due to unexpected skipping of the TAG codon to make mCherry-containing partial polypeptides? It would seem like an explanation is needed.
Thanks for bringing this up. We do not know the exact origin of these leak expression of red fluorescence. We think that, as suggested, there is a possibility that skipping of the Amber codon can lead to a methionine at the end of S4 acting as a second translation initiation site, giving rise to truncated channels that would express mCherry but not currents. This is consistent with the fact that we cannot detect currents in the absence of Anap but we see a small number of red cells.
8) The data of Figure 3E are shown as data with different membrane voltages. But there is no information about membrane voltage for Fig. 1E and Fig. 2A and Fig. 4B. Are these from unpatched cells? Please clarify.
See response to point 4 of "Revisions essential for endorsement" section.
9) G-V relations are shown for F150A-A197Anap, but current traces of F150A-A197Anap are missing.
We have modified the figure to include current and fluorescence traces.
10) On Page 11, Line 303 says "experimental F-V relationship is positively shifted by 10 mV with respect to the G-V curve". But looking at the data Fig5D, the shift at ΔpH=2 seems the opposite. Perhaps "positively" should be "negatively" in this sentence?
Thanks for pointing out this mistake. We have found that this misunderstanding was provoked because of a mistake with the image labeling of F-V and G-V curves for the ΔpH=2 data, we have now corrected the figure. The shift of F-V is indeed positive to G-V as stated before.
(This is a response to peer review conducted by Biophysics Colab on version 1 of this preprint.)
https://brainsteam.co.uk/2022/11/26/one-week-with-hypothesis/
I too read a lot of niche papers and feel the emptiness, but because I'm most often writing for myself anyway, its alright. There are times, however, when I see a growing community of people who've left their associative trails behind before I've found a particular page.
I've used the phrase "digital exhaust" before, but I like the more positive framing of "learning exhaust".
If you've not found it yet, my own experimentations with the platform can largely be found here: https://boffosocko.com/tag/hypothes.is/
She competed in the beauty contest with her campaign tag line #realsizebeauty.
She wants to show the world that no matter how your body is, your beauty doesn't depend on it. She created the trend called #realsizebeauty to let people recognize and be confidence to yourself.
trep-tagge
The Strep-tag system is a method which allows the purification and detection of proteins by affinity chromatography. The Strep-tag II is a synthetic peptide consisting of eight amino acids (Trp-Ser-His-Pro-Gln-Phe-Glu-Lys). This peptide sequence exhibits intrinsic affinity towards Strep-Tactin, a specifically engineered streptavidin, and can be N- or C- terminally fused to recombinant proteins. By exploiting the highly specific interaction, Strep-tagged proteins can be isolated in one step from crude cell lysates. Because the Strep-tag elutes under gentle, physiological conditions, it is especially suited for generation of functional proteins.
nonphosphorylated forms of HY5 (GST-HY5-S36A) have higheraffinity to MBP-COP1. GST-HY5 and all other phosphorylation mutant proteins were pulled down by MBP-COP1 using maltose agarose beads.
So this blot has affinity for the MBP tag on COP1- it will therefore be attached at all time. The HY5 and HY5 mutants are being washed over this background (each row has 1x HY5 added). The MBP-only column is a negative control to show that the HY5 do not interact with the MBP tag on its own.
(MBP)-COP1, MBP-SPA1,
same tag used for cop1 and spa1
(b)
TAP-SPA1--- is this a control? Paik et al. 2019 paper uses both-- need to check if used for different things? Is this to show that the LUC tag is not having an effect in the complementation mutants? By showing that the phenotype is unaffected by the addition of the TAP-SPA1? BUT shouldn't they have done a LUC-SPA1 only expressing plant (with no spaQ mutant background) as well, to show this? That TAP-SPA1 and LUC-SPA1 produce the same phenotype?
20 lM Phos-tag (Fig. S2C). However, in spaQ mutant, nomobility shift was observed under these conditions and HY5-GFP showed a faster migrating band than that in WT (Fig. 2c),suggesting a complete absence of phosphorylation of HY5in vivo.
So the Phospho-tagged SDS-PAGE gel will enhance the difference in mobility of phosphorylated---- or not. The lack of band shift is shown between the B and CIP conditions in fig.2c. This is the same result as shown for the HY5-S26A, so the phosphorylation is at this residue by the SPA kinase
Gout Skin Rash and Itching Forum
See Is Gout Itchy and associated new pages.
Notes like this are part of my GoutPal Links service. Which is currently in the pre-launch phase. I will add documentation for this feature as I answer requests from readers. So if you need help using this feature, the best way is to subscribe to my free GoutPal Links Newsletter. Where you can email and message me directly. Or you can use the feedback options near the end of every page.
Joint Public Review:
In this work Malis et al introduce a novel spin-labeling MRI sequence to measure cerebrospinal fluid (CSF) outflow. The glymphatic system is of growing interest in a range of diseases, but few studies have been conducted in humans due to the requirement for and invasiveness of contrast injections. By labeling one hemisphere of the brain the authors attempt to assess outflow through the superior sagittal sinus (SSS), one of the major drainage pathways for CSF, signal changes across time were assessed to extract commonly used metrics. Additionally, correlations with age are explored in their cohort of healthy volunteers. The authors report the movement of labeled CSF from the subarachnoid space to the dura mater, parasagittal dura, and ultimately SSS, evidence of leakage from the subarachnoid space to the SSS, and decreases in CSF outflow metrics with older age.
1. I don't think that the description of Parasagittal dura in figure 1 is correct. There is no anatomical structure at the top of SSS that is known as PSD. The location of the lymphatic structures is also incorrect. Please review "Anatomic details of intradural channels in the parasagittal dura: a possible pathway for flow of cerebrospinal fluid" Neurosurgery 1996 Fox at al. There is usually no obvious tissue between the upper wall of the SSS and the calvarium, which can also be seen in the authors' fig 2A and 2B. All of the tissues located lateral to the SSS are known as PSD. Also, the SSS wall is not as thick as the authors stated and is known as PSD in this region. For this reason, the authors need to revise Fig 1 and it should be changed to PSD in the areas referred to as the SSS wall in the article.
2. The authors described tagged CSF in two pathways: from dura mater to PSD and SAS into the SSS and directly from SAS to SSS. Flow from dura mater to PSD and SAS in the main and supplement cannot be seen. Only a flow from PSD to SSS can be seen. Also, regular dura cannot carry flow-collagen-rich fibrous tissue, except parasagittal dura. There is no flow from dura to the CSF in the figures.
3. The authors have conducted many tests to prevent venous contamination. However, measurements were made based on SSS flow rates in all tests. Small parenchymal venous structures, and small cortical-SAS veins might be tagged due to different flow patterns and T2- Relaxation times.
4. The rate of CSF formation in humans is 0.3 - 0.4 ml min-1. ( Brinker et al 2014. Fluids Barriers CNS). We can assume that the absorption rate is also similar to the CSF formation for the entire system brain and Spine. Therefore, the absorption rate of this very small amount of CSF by SSS is very low in seconds. It is hard to detect by MR and especially CSF flow from the PSD to SSS. The authors concluded that using this technique the rate averaged less than a couple of seconds, rather than on the order of hours or days as previously reported with the use of intrathecal administration of GBCA (Ringstad et al., 2020).
5. Overall, I think that the CSF flow from the PSD to the CNS described by the authors - the CSF flow, might be the venous flow that drains into the SSS slowly, predominantly in the rich venous channels, venous lacunae, and previously described channels in the PSD. Additional explanations are needed.
6. The study is generally well described and to the best of my knowledge an innovative approach. The findings are broadly consistent with what might be expected from the literature and the authors make a good argument in support of their findings. However, the lack of validation is a major limitation of the presented work. In introducing a novel technique a comparison with an existing approach, such as Gd enhanced contrast techniques, or phase contrast would have been expected. Several considerations could have been mentioned/addressed in more detail e.g. what effect labeling efficiency, tortuosity of vessels, lack of gating, the effectiveness of the intensity thresholding to remove the signal from blood, etc may have on the quantification, etc. Without a more thorough validation, it is difficult to evaluate the findings. While scans were conducted on two volunteers to assess reproducibility this is a very small sample and it is notable that scans were conducted consecutively, which might be expected to reduce variance relative to scans further apart e.g. on different dates, scanned by a different operator and no information is provided on how the two scans were positioned (i.e. separately vs copied from the first to the second scan), some metrics showed large percentage differences, which were more pronounced in one subject than the other. Without further data, it is difficult to interpret the reproducibility results. No assessment of the effect of physiological parameters e.g. breathing, cardiac pulsations, or factors affecting glymphatic clearance e.g. amount of sleep the evening before was given.
7. Given these limitations it is hard to adequately assess the likely impact or utility. In recent years several groups have published work e.g. doi.org/10.1038/s41467-020-16002-4 , doi.org/10.1016/j.neuroimage.2021.118755 assessing the blood-CSF barrier. However, previous work has generally focused on larger structures, and by labeling in the oblique-sagittal plane it is unclear how drainage and blood flow rates may affect the presented values here.
8. Some validation data would greatly increase the value of the reported work. I would therefore encourage the authors to consider acquiring some additional datasets to compare measures of CSF draining against another method e.g. 2-D or 4-D phase contrast, or Gd-based contrast-enhanced techniques. Some additional points to consider are noted below.
8. Abstract
CSF outflow may also be imaged with phase contrast MRI (albeit in a limited way).<br /> Demographics would fit better in Results, breakdown could be given for the young and old groups i.e. n, ages, sex.<br /> Conclusion - unless further validation can be provided I think some of the claims should be toned down.
9. Introduction
The authors emphasise the role of Nedergaard, however, there was some relevant earlier work (e.g. Rennels et al, PMID: 2396537).
10. Methods
It would be more conventional to summarise the volunteer characteristics in the Results.<br /> Given the age difference between the two groups, and the fact that for conventional ASL we know of differences in labelling efficiency and the need for a different post-labelling duration in more elderly patients how did the authors account for this?<br /> More broadly what would the effect of differences in labeling efficiency be, given the labeling plane is unlikely to be perpendicular to the draining vessels?<br /> While the authors mention circadian effects there is no mention of controlling for other factors before the scan e.g. caffeine consumption, smoking, etc.<br /> Various mechanisms have been hypothesised to drive glymphatic pulsations. Assessing how physiological signals correlated with the flow may have been a useful proof of concept. Why was it not considered necessary to use a gated acquisition? Did the authors consider the potential impact of respiratory and cardiac pulsations on their measurements?<br /> ROI segmentation - manually selected by two raters, was this done independently and blinded? How were consensus ROIs agreed?<br /> Intensity values outwith MEAN +/- 2 SD were excluded from further analyses. This is justified as removing pulsatile blood. However, was this done independently for tag-on and tag-off? Does this mean slight differences were present in the number of voxels between the two?<br /> The starting points and parameter ranges are given in Eq'n 3, how were the ranges defined? Was there a reason for constraining the fit to positive values only, is there a risk of bias from this?<br /> While the main results appear to have a reasonable sample size n=2 for the reproducibility analysis is very limited. Additional datasets would be useful in properly interpreting the results.
11. Results<br /> While the authors have taken some measures to reduce potential contamination from blood I would be concerned about the risk of surface vessels affecting the signal, and there does not seem to be an evaluation of how effective their measures are.<br /> The labeling pulse is applied in the oblique sagittal orientation, but in tandem with differing rates of blood flow and CSF drainage from the labeling plane does that not risk circulating flow from other slices potentially affecting the values?<br /> Figure 4. The authors focus on the parasagittal dura, but in both the subtraction image and panel C showing different slices at TI=1250 ms some movement appears visible in the opposing hemisphere. Similarly in S2 If the signal does represent CSF movement then this seems counterintuitive and should be explained.<br /> In Figures 4 and 5 the angulation of the TIME-SLIP tag pulse seems quite different. What procedure was used to standardise this, and what effect may this have on the results?
12. Discussion<br /> Phrasing error 'which will be assessed in future studies'.<br /> I would suggest that some of the claims of novelty be moderated e.g. 'may facilitate establishment of normative values for CSF outflow' seems a stretch given multiple pathways exist and this is only considered one.<br /> More consideration should be given to some of the points mentioned in the results. The lack of validation should be properly discussed.
Partners Group, CVC Team Up to Rival Celanese for CeramTecBC said to seek over $4.7 billion for technical-ceramics makerNext-round bids due around July 19 as buyout activity surgesByDinesh Nair, Jan-Henrik Foerster, and Kiel Porter+FollowJuly 14, 2021 at 12:51 PM EDTUpdated onJuly 15, 2021 at 3:49 AM EDTShare this articleCopiedFollow the authors@DNair5+ Get alerts forDinesh Nair@JanFoe+ Get alerts forJan-Henrik Foerster@kielporter+ Get alerts forKiel PorterBuyout firms Partners Group Holding AG and CVC Capital Partners have teamed up against chemicals company Celanese Corp. in the bidding for German technical-ceramics maker CeramTec GmbH, according to people familiar with the matter.Owner BC Partners has called for next-round bids around July 19 and is seeking a valuation of at least 4 billion euros ($4.7 billion), the people said, asking not to be identified because discussions are private.LIVE ON BLOOMBERGWatch Live TVListen to Live RadioVideo Player is loading.Play VideoPlayUnmuteCurrent Time 0:00/Duration 0:00Loaded: 0%Progress: 0%Stream Type LIVERemaining Time -0:00 Playback Rate1xChaptersChaptersCaptionscaptions settings, opens captions settings dialogcaptions off, selectedFullscreenThis is a modal window.An error has occurred. Reload the web page or use another browser. Error 3Beginning of dialog window. Escape will cancel and close the window.TextColorWhiteBlackRedGreenBlueYellowMagentaCyanTransparencyOpaqueSemi-TransparentBackgroundColorBlackWhiteRedGreenBlueYellowMagentaCyanTransparencyOpaqueSemi-TransparentTransparentWindowColorBlackWhiteRedGreenBlueYellowMagentaCyanTransparencyTransparentSemi-TransparentOpaqueFont Size50%75%100%125%150%175%200%300%400%Text Edge StyleNoneRaisedDepressedUniformDropshadowFont FamilyProportional Sans-SerifMonospace Sans-SerifProportional SerifMonospace SerifCasualScriptSmall CapsReset restore all settings to the default valuesDoneClose Modal DialogEnd of dialog window.Play Again {"contentId":"QW88EUT1UM0W01","position":"box1","dimensions":{"small_desktop":[[300,600],[300,250],[3,3],[1,1],"fluid"],"large_desktop":[[300,600],[300,250],[3,3],[1,1],"fluid"]},"positionIncrement":1,"targeting":{"position":"box1","positionIncrement":1,"url":"/news/articles/2021-07-14/partners-group-cvc-team-up-against-celanese-in-ceramtec-bidding"},"containerId":"box-7030"}Most ReadTechnologyBillionaire Investor Carl Icahn Is Betting Against GameStop SharesMarketsFTX Latest: Hearing Ahead; Trabucco Used Poker Tactics to TradeBusinessweekTech Layoffs Send H-1B Visa Holders Scrambling for New JobsIndustriesWhen Disney Decided to Dump its CEO, the Change Happened FastBusinessDisney Shares Jump on Optimism Over Iger’s Surprise Return var _____WB$wombat$assign$function_____ = function(name) {return (self._wb_wombat && self._wb_wombat.local_init && self._wb_wombat.local_init(name)) || self[name]; }; if (!self.__WB_pmw) { self.__WB_pmw = function(obj) { this.__WB_source = obj; return this; } } { let window = _____WB$wombat$assign$function_____("window"); let self = _____WB$wombat$assign$function_____("self"); let document = _____WB$wombat$assign$function_____("document"); let location = _____WB$wombat$assign$function_____("location"); let top = _____WB$wombat$assign$function_____("top"); let parent = _____WB$wombat$assign$function_____("parent"); let frames = _____WB$wombat$assign$function_____("frames"); let opener = _____WB$wombat$assign$function_____("opener"); let arguments; { window._brandmetrics = window._brandmetrics || []; window._brandmetrics.push({ cmd: "_loadsurvey" }); }}{"story":{"audios":[],"abstract":["BC said to seek over $4.7 billion for technical-ceramics maker","Next-round bids due around July 19 as buyout activity surges"],"adCode":"bloomberg\/markets\/deals\/article","adTargeting":{"suid":"QW88EUT1UM0W01","page":"articlejav","currentResource":"Story|QW88EUT1UM0W01","ni":["ASSETMGMT","AUTOMOTIVE","BON","BUSINESS","EQUITYKEY","FAMOFFNEWS","FIALL","FIASST","FIN","INI","MARKETS","PE"],"tagr":[],"kwl":["biz_cartier","biz_googlelisttwo","biz_schwab","biz_generic","biz_lexus2","biz_singlecountry2","biz_United","biz_BMW","biz_boeing","biz_att6","biz_facebook1","biz_facebook2","biz_mulberry","biz_Fidelity_investopedia","biz_hsbcpb","biz_jpmorgan","biz_morg","biz_morgan1","biz_mobkoivca","biz_mobkoirichemont19","biz_kpmg","biz_socgenoctnov19","biz_wellspop","biz_porsche","biz_porsche2019","biz_burberryhk","biz_porsche2020","biz_kpmgpg","biz_mobkoifacebookpolicyaffairs","biz_mstouts2020","biz_signet","biz_cartier3","biz_signet2","biz_mobkoiintel","biz_socgen2020","biz_vancleef1","biz_cigna","biz_vca","biz_mobkoiintel2","biz_mobkoicastrol","biz_msci","biz_facebookpgemea21","biz_vacheron_2021","biz_iwc_2021","biz_panerai","biz_vancleef_2022","biz_cartier2022","biz_vcawatches2022","biz_Chanel","biz_chanelbleu","biz_vac2022"],"sites":["markets","deals"],"tickers":[],"language":"en","gs_cat":["hnwi_aiq_custom","csuite3_aiq_custom","sme2_aiq_custom","gs_economy_markets","travel_aiq_custom","gs_economy","pos_ibm","gs_science_misc","gs_business_sme","private_equity_custom","gs_science","gs_auto_misc","gv_safe"]},"archived":true,"assistance":["Aaron Kirchfeld"],"attributor":"bn","authoredRegion":"Global","authors":[{"id":"18657817","name":"Dinesh Nair","slug":"ARyyGQR8v_w\/dinesh-nair","title":null,"bio":null,"columnist":false,"contributor":false,"editorialBoard":false,"headshot":{"id":"386512166","baseUrl":"https:\/\/assets.bwbx.io\/images\/users\/iqjWHBFdfxIU\/iAHQo9umsWls\/v1\/200x200.jpg","origWidth":2000,"origHeight":2000,"caption":null,"type":"image","themes":null},"facebookHandle":null,"facebookUrl":null,"twitterHandle":"DNair5","twitterUrl":"https:\/\/www.twitter.com\/DNair5"},{"id":"17673321","name":"Jan-Henrik Foerster","slug":"AQ2saY71wbs\/janhenrik-foerster","title":null,"bio":null,"columnist":false,"contributor":false,"editorialBoard":false,"headshot":{"id":"386352019","baseUrl":"https:\/\/assets.bwbx.io\/images\/users\/iqjWHBFdfxIU\/ifa_pJeO2tgQ\/v2\/200x200.jpg","origWidth":2000,"origHeight":2000,"caption":null,"type":"image","themes":null},"facebookHandle":null,"facebookUrl":null,"twitterHandle":"JanFoe","twitterUrl":"https:\/\/www.twitter.com\/JanFoe"},{"id":"18043877","name":"Kiel Porter","slug":"ARNT5T6VBW0\/kiel-porter","title":null,"bio":null,"columnist":false,"contributor":false,"editorialBoard":false,"headshot":{"id":"110348767","baseUrl":"https:\/\/assets.bwbx.io\/images\/users\/iqjWHBFdfxIU\/iodhiLzBpXTw\/v1\/200x200.jpg","origWidth":160,"origHeight":211,"caption":null,"type":"image","themes":null},"facebookHandle":null,"facebookUrl":null,"twitterHandle":"kielporter","twitterUrl":"https:\/\/www.twitter.com\/kielporter"}],"blensQuoteIds":[{"id":"7473980Z:FP"},{"id":"CE:US"},{"id":"3711Z:GR"},{"id":"PGHN:SW"},{"id":"1872421D:LN"}],"body":"<div class=\"inline-newsletter-top\"><\/div><p>Buyout firms <a href=\"\/quote\/PGHN:SW\" title=\"Company Overview\"><meta content=\"PGHN SW Equity\"><meta content=\"SecurityLink\">Partners Group Holding AG<\/a> and <a href=\"\/quote\/2270Z:LN\" title=\"Company Overview\"><meta content=\"2270Z LN Equity\"><meta content=\"SecurityLink\">CVC Capital Partners<\/a> have teamed up against chemicals company <a href=\"\/quote\/CE:US\" title=\"Company Overview\"><meta content=\"CE US Equity\"><meta content=\"SecurityLink\">Celanese Corp.<\/a> in the bidding for German technical-ceramics maker <a href=\"\/quote\/3711Z:GR\" title=\"Company Overview\"><meta content=\"3711Z GR Equity\"><meta content=\"SecurityLink\">CeramTec GmbH<\/a>, according to people familiar with the matter.<\/p><p>Owner <a href=\"\/quote\/7473980Z:FP\" title=\"Company Overview\"><meta content=\"7473980Z FP Equity\"><meta content=\"SecurityLink\">BC Partners<\/a> has called for next-round bids around July 19 and is seeking a valuation of at least 4 billion euros ($4.7 billion), the people said, asking not to be identified because discussions are private.<\/p>\n <div id=\"outstream-video-1-QW88EUT1UM0W01\" class=\"outstream-ad outstream-ad--default paywall\" data-position=\"outstream-video\" data-ad-placeholder=\"Advertisement\">\n \n <script type=\"application\/javascript\">window.__bloomberg__.ads.enqueue(\"outstream-video-1-QW88EUT1UM0W01\");<\/script>\n <script class=\"params\" type=\"application\/json\">{\"contentId\":\"QW88EUT1UM0W01\",\"position\":\"outstream\",\"dimensions\":{\"large_desktop\":[[300,250],[1,8],[3,3]],\"small_desktop\":[[300,250],[1,8],[3,3]],\"tablet\":[[300,250],[1,8],[3,3]]},\"strategy\":\"viewable\",\"type\":\"Outstream Video Native Ad\",\"targeting\":{\"position\":\"outstream\",\"url\":\"\/news\/articles\/2021-07-14\/partners-group-cvc-team-up-against-celanese-in-ceramtec-bidding\"},\"containerId\":\"outstream-video-1-QW88EUT1UM0W01\"}<\/script>\n \n <\/div>\n \n <div id=\"outstream-video-2-QW88EUT1UM0W01\" class=\"outstream-ad outstream-ad--mobile paywall\" data-position=\"outstream-video\" data-ad-placeholder=\"Advertisement\">\n \n <script type=\"application\/javascript\">window.__bloomberg__.ads.enqueue(\"outstream-video-2-QW88EUT1UM0W01\");<\/script>\n <script class=\"params\" type=\"application\/json\">{\"contentId\":\"QW88EUT1UM0W01\",\"position\":\"outstream\",\"dimensions\":{\"mobile\":[[300,250],[1,8],[3,3]]},\"strategy\":\"viewable\",\"type\":\"Outstream Video Native Ad\",\"targeting\":{\"position\":\"outstream\",\"url\":\"\/news\/articles\/2021-07-14\/partners-group-cvc-team-up-against-celanese-in-ceramtec-bidding\"},\"containerId\":\"outstream-video-2-QW88EUT1UM0W01\"}<\/script>\n \n <\/div>\n <p class=\"paywall\">Other investment firms and companies have also looked at the asset, the people said. Bloomberg News <a href=\"https:\/\/www.bloomberg.com\/news\/articles\/2021-07-01\/bc-partners-said-to-explore-options-for-4-billion-ceramics-firm\" title=\"BC Partners Said to Mull Options for $4 Billion Ceramic Firm (1)\" target=\"_blank\"><meta content=\"QVLX12T1UM0W\"><meta content=\"StoryLink\">reported<\/a> earlier this month that BC Partners started exploring options, including a sale or initial public offering, in a deal that could value the business at 3.5 billion euros or more.<\/p><aside class=\"left-rail-newsletter paywall\"><\/aside><p class=\"paywall\">CeramTec produces industrial and technical ceramics for the medical, automotive, electronics and chemicals industries, making everything from hip joints to car parts. The company, which traces its <a href=\"https:\/\/www.ceramtec-group.com\/en\/about-us\/history\" title=\"History\" target=\"_blank\" rel=\"noopener\"><meta content=\"WebLink\">roots<\/a> back to a porcelain factory from 1903, employs more than 3,400 globally and had over 550 million euros in 2020 sales, according to its <a href=\"https:\/\/www.ceramtec-group.com\/en\/about-us\" title=\"related website\" target=\"_blank\" rel=\"noopener\"><meta content=\"WebLink\">website<\/a>.<\/p><p class=\"paywall\">Private equity firms’ divestments in Europe have risen more than 150% to $70 billion this year, according to data compiled by Bloomberg. <a href=\"\/quote\/277924Z:LN\" title=\"Company Overview\"><meta content=\"277924Z LN Equity\"><meta content=\"SecurityLink\">TDR Capital<\/a> agreed <a href=\"https:\/\/www.bloomberg.com\/news\/articles\/2021-06-27\/brookfield-unit-said-to-near-deal-for-tdr-backed-modulaire-group\" title=\"Brookfield Unit to Buy TDR-Backed Modulaire Group for $5 Billion\" target=\"_blank\"><meta content=\"QVEGAXT1UM0Z\"><meta content=\"StoryLink\">last month<\/a> to sell Modulaire Group, a designer of modular work spaces, to <a href=\"\/quote\/BBU-U:CN\" title=\"Company Overview\"><meta content=\"BBU-U CN Equity\"><meta content=\"SecurityLink\">Brookfield Business Partners LP<\/a> for about $5 billion.<\/p>\n <div id=\"box-jc6JU4A\" class=\"mobile-box page-ad paywall\" data-position=\"mobile-box\" data-ad-placeholder=\"Advertisement\">\n \n <script type=\"application\/javascript\">window.__bloomberg__.ads.enqueue(\"box-jc6JU4A\");<\/script>\n <script class=\"params\" type=\"application\/json\">{\"contentId\":\"QW88EUT1UM0W01\",\"position\":\"box\",\"dimensions\":{\"mobile\":[[300,250],[3,3],[1,1],\"fluid\"]},\"type\":\"Mobile Body Box Ad\",\"positionIncrement\":1,\"targeting\":{\"position\":\"box1\",\"positionIncrement\":1,\"url\":\"\/news\/articles\/2021-07-14\/partners-group-cvc-team-up-against-celanese-in-ceramtec-bidding\"},\"containerId\":\"box-jc6JU4A\"}<\/script>\n \n <\/div>\n <div class=\"for-you__wrapper paywall\"><\/div><p class=\"paywall\">No final decisions have been made, and there’s no certainty talks will lead to a transaction, the people said. Representatives for BC Partners, Celanese, CVC and Partners Group declined to comment.<\/p>\n <div id=\"desktop-in-article-1-QW88EUT1UM0W01\" class=\"desktop-in-article page-ad paywall\" data-position=\"desktop-in-article\" data-ad-placeholder=\"Advertisement\">\n \n <script type=\"application\/javascript\">window.__bloomberg__.ads.enqueue(\"desktop-in-article-1-QW88EUT1UM0W01\");<\/script>\n <script class=\"params\" type=\"application\/json\">{\"contentId\":\"QW88EUT1UM0W01\",\"position\":\"desktop-in-article1\",\"dimensions\":{\"large_desktop\":[[300,250],[5,4],[3,3]],\"small_desktop\":[[300,250],[5,4],[3,3]]},\"type\":\"Desktop in article Native Ad\",\"targeting\":{\"position\":\"desktop-in-article1\",\"url\":\"\/news\/articles\/2021-07-14\/partners-group-cvc-team-up-against-celanese-in-ceramtec-bidding\"},\"containerId\":\"desktop-in-article-1-QW88EUT1UM0W01\"}<\/script>\n \n <\/div>\n <p class=\"paywall\">A consortium led by BC Partners <a href=\"https:\/\/www.bcpartners.com\/news\/bc-partners-led-consortium-including-psp-investments-and-ontario-teachers-acquires-ceramtec-a-leading-international-manufacturer-and-supplier-of-technical-ceramic\" title=\"Link\" target=\"_blank\" rel=\"noopener\"><meta content=\"WebLink\">agreed<\/a> to acquire CeramTec from private equity firm <a href=\"\/quote\/9990648Z:LN\" title=\"Company Overview\"><meta content=\"9990648Z LN Equity\"><meta content=\"SecurityLink\">Cinven<\/a> in 2017. Canada’s Public Sector Pension Investment Board and Ontario Teachers’ Pension Plan also joined the deal. That acquisition valued CeramTec at about 2.6 billion euros including debt, Bloomberg News <a href=\"\/news\/terminal\/OXM9ER6KLVRX\" title=\"Cinven Is Said Near $3 Billion CeramTec Sale to BC Partners (1)\" class=\"terminal-news-story\" target=\"_blank\"><meta content=\"OXM9ER6KLVRX\"><meta content=\"StoryLink\">reported<\/a> at the time.<\/p><p class=\"paywall\">Elsewhere in Germany, BC Partners this month agreed to take a <a href=\"\/news\/terminal\/QVZJPOT0AFBE\" title=\"BC Partners Reaches Deal for German Laboratories Group Tentamus\" class=\"terminal-news-story\" target=\"_blank\"><meta content=\"QVZJPOT0AFBE\"><meta content=\"StoryLink\">stake<\/a> in Tentamus Group GmbH amid strong private equity demand for laboratory assets in Europe. The deal values the food and pharmaceutical-testing company at about 1 billion euros, people familiar with the matter said.<\/p>\n <div id=\"in-article-1-QW88EUT1UM0W01\" class=\"in-article page-ad hide_on_small_desktop hide_on_large_desktop paywall\" data-position=\"in-article\" data-ad-placeholder=\"Advertisement\">\n \n <script type=\"application\/javascript\">window.__bloomberg__.ads.enqueue(\"in-article-1-QW88EUT1UM0W01\");<\/script>\n <script class=\"params\" type=\"application\/json\">{\"contentId\":\"QW88EUT1UM0W01\",\"position\":\"in-article1\",\"dimensions\":{\"mobile\":[[5,19],[300,250],[3,3],[1,1],\"fluid\"],\"tablet\":[[5,11],[728,90],[1,1]]},\"type\":\"In Article Flex Native Ad\",\"positionIncrement\":1,\"targeting\":{\"position\":\"in-article1\",\"positionIncrement\":1,\"url\":\"\/news\/articles\/2021-07-14\/partners-group-cvc-team-up-against-celanese-in-ceramtec-bidding\"},\"containerId\":\"in-article-1-QW88EUT1UM0W01\"}<\/script>\n \n <\/div>\n <p class=\"paywall\"><em>— With assistance by Aaron Kirchfeld<\/em><\/p><div class=\"trashline paywall\">(<span>Adds BC Partners Germany deal in final paragraph.<\/span>)<\/div><ol class=\"noscript-footnotes paywall\"><\/ol><div class=\"inline-newsletter-bottom paywall\"><\/div>","brand":"markets","canonical":"https:\/\/www.bloomberg.com\/news\/articles\/2021-07-14\/partners-group-cvc-team-up-against-celanese-in-ceramtec-bidding","byline":"Dinesh Nair, Jan-Henrik Förster and Kiel Porter","categories":["markets"],"charts":[],"checksum":"6638bc1c8e358f7bda223c21d7a55eba","columnists":[],"corrected":false,"dek":null,"disableAds":false,"disclaimer":"","embeds":[],"facebookStatus":"Buyout firms Partners Group Holding AG and CVC Capital Partners have teamed up against chemicals company Celanese Corp. in the bidding for German technical-ceramics maker CeramTec GmbH, according to people familiar with the matter.","featureVersion":null,"footer":"<meta itemprop=\"NewsFooterAttributionType\" content=\"http:\/\/bloomberg.com\/StoryFormat\/NewsIndividualAttribution\"><p class=\"news-rsf-assists\">--With assistance from <span itemscope=\"itemscope\" itemtype=\"http:\/\/schema.org\/Person\"><link itemprop=\"additionalType\" href=\"http:\/\/bloomberg.com\/StoryFormat\/ContactInfo\"><meta itemprop=\"url\" content=\"bbg:\/\/people\/profile\/15014888\"><meta itemprop=\"pepl\" content=\"15014888\"><meta itemprop=\"uuid\" content=\"3925253\"><meta itemprop=\"email\" content=\"akirchfeld@bloomberg.net\"><meta itemprop=\"telephone\" content=\"+44-20-35258830\"><span itemprop=\"workLocation\" itemscope=\"itemscope\" itemtype=\"http:\/\/schema.org\/Place\"><meta itemprop=\"name\" content=\"London\"><\/span><meta itemprop=\"role\" content=\"assist\"><span itemprop=\"attribution\" itemscope=\"itemscope\"><meta itemprop=\"indicator\" content=\"assist\"><meta itemprop=\"ordinal\" content=\"4\"><\/span><span itemprop=\"name\">Aaron Kirchfeld<\/span><\/span>.<\/p><p class=\"news-rsf-contact-reporter\">To contact the reporters on this story:<br><span itemscope=\"itemscope\" itemtype=\"http:\/\/schema.org\/Person\"><link itemprop=\"additionalType\" href=\"http:\/\/bloomberg.com\/StoryFormat\/ContactInfo\"><meta itemprop=\"url\" content=\"bbg:\/\/people\/profile\/18657817\"><meta itemprop=\"pepl\" content=\"18657817\"><meta itemprop=\"uuid\" content=\"11900697\"><meta itemprop=\"telephone\" content=\"+44-20-35253212\"><meta itemprop=\"role\" content=\"by\"><meta itemprop=\"role\" content=\"reporter\"><span itemprop=\"attribution\" itemscope=\"itemscope\"><meta itemprop=\"indicator\" content=\"by\"><meta itemprop=\"indicator\" content=\"reporter\"><meta itemprop=\"ordinal\" content=\"1\"><\/span><span itemprop=\"name\">Dinesh Nair<\/span> in <span itemprop=\"workLocation\" itemscope=\"itemscope\" itemtype=\"http:\/\/schema.org\/Place\"><span itemprop=\"name\">London<\/span><\/span> at <span itemprop=\"email\">dnair5@bloomberg.net<\/span><\/span>;<br><span itemscope=\"itemscope\" itemtype=\"http:\/\/schema.org\/Person\"><link itemprop=\"additionalType\" href=\"http:\/\/bloomberg.com\/StoryFormat\/ContactInfo\"><meta itemprop=\"url\" content=\"bbg:\/\/people\/profile\/17673321\"><meta itemprop=\"pepl\" content=\"17673321\"><meta itemprop=\"uuid\" content=\"11757890\"><meta itemprop=\"telephone\" content=\"+44-20-35254287\"><meta itemprop=\"role\" content=\"by\"><meta itemprop=\"role\" content=\"reporter\"><span itemprop=\"attribution\" itemscope=\"itemscope\"><meta itemprop=\"indicator\" content=\"by\"><meta itemprop=\"indicator\" content=\"reporter\"><meta itemprop=\"ordinal\" content=\"2\"><\/span><span itemprop=\"name\">Jan-Henrik Förster<\/span> in <span itemprop=\"workLocation\" itemscope=\"itemscope\" itemtype=\"http:\/\/schema.org\/Place\"><span itemprop=\"name\">London<\/span><\/span> at <span itemprop=\"email\">jforster20@bloomberg.net<\/span><\/span>;<br><span itemscope=\"itemscope\" itemtype=\"http:\/\/schema.org\/Person\"><link itemprop=\"additionalType\" href=\"http:\/\/bloomberg.com\/StoryFormat\/ContactInfo\"><meta itemprop=\"url\" content=\"bbg:\/\/people\/profile\/18043877\"><meta itemprop=\"pepl\" content=\"18043877\"><meta itemprop=\"uuid\" content=\"10594416\"><meta itemprop=\"telephone\" content=\"+1-312-443-5967\"><meta itemprop=\"role\" content=\"by\"><meta itemprop=\"role\" content=\"reporter\"><span itemprop=\"attribution\" itemscope=\"itemscope\"><meta itemprop=\"indicator\" content=\"by\"><meta itemprop=\"indicator\" content=\"reporter\"><meta itemprop=\"ordinal\" content=\"3\"><\/span><span itemprop=\"name\">Kiel Porter<\/span> in <span itemprop=\"workLocation\" itemscope=\"itemscope\" itemtype=\"http:\/\/schema.org\/Place\"><span itemprop=\"name\">Chicago<\/span><\/span> at <span itemprop=\"email\">kporter17@bloomberg.net<\/span><\/span><\/p><p class=\"news-rsf-contact-editor\">To contact the editors responsible for this story:<br><span itemscope=\"itemscope\" itemtype=\"http:\/\/schema.org\/Person\"><link itemprop=\"additionalType\" href=\"http:\/\/bloomberg.com\/StoryFormat\/ContactInfo\"><meta itemprop=\"url\" content=\"bbg:\/\/people\/profile\/6720026\"><meta itemprop=\"pepl\" content=\"6720026\"><meta itemprop=\"uuid\" content=\"2920049\"><meta itemprop=\"jobTitle\" content=\"Executive Editor:Deals & Corporate Finance\"><meta itemprop=\"telephone\" content=\"+1-212-617-1697\"><span itemprop=\"workLocation\" itemscope=\"itemscope\" itemtype=\"http:\/\/schema.org\/Place\"><meta itemprop=\"name\" content=\"New York\"><\/span><meta itemprop=\"role\" content=\"editor\"><meta itemprop=\"role\" content=\"responsible\"><span itemprop=\"attribution\" itemscope=\"itemscope\"><meta itemprop=\"indicator\" content=\"editor\"><meta itemprop=\"indicator\" content=\"responsible\"><meta itemprop=\"ordinal\" content=\"6\"><\/span><span itemprop=\"name\">Daniel Hauck<\/span> at <span itemprop=\"email\">dhauck1@bloomberg.net<\/span><\/span><br><span class=\"news-rsf-editor-byline\"><span itemscope=\"itemscope\" itemtype=\"http:\/\/schema.org\/Person\"><link itemprop=\"additionalType\" href=\"http:\/\/bloomberg.com\/StoryFormat\/ContactInfo\"><meta itemprop=\"url\" content=\"bbg:\/\/people\/profile\/21714985\"><meta itemprop=\"pepl\" content=\"21714985\"><meta itemprop=\"uuid\" content=\"29472435\"><meta itemprop=\"email\" content=\"fsahloul@bloomberg.net\"><meta itemprop=\"telephone\" content=\"+44-20-35253357\"><span itemprop=\"workLocation\" itemscope=\"itemscope\" itemtype=\"http:\/\/schema.org\/Place\"><meta itemprop=\"name\" content=\"London\"><\/span><meta itemprop=\"role\" content=\"editor\"><meta itemprop=\"role\" content=\"primary\"><span itemprop=\"attribution\" itemscope=\"itemscope\"><meta itemprop=\"indicator\" content=\"editor\"><meta itemprop=\"indicator\" content=\"primary\"><meta itemprop=\"ordinal\" content=\"5\"><\/span><span itemprop=\"name\">Fareed Sahloul<\/span><\/span><\/span><\/p>","footnotes":{},"franchise":"deals","headline":"Partners Group, CVC Team Up to Rival Celanese for CeramTec","headlineText":"Partners Group, CVC Team Up to Rival Celanese for CeramTec","hedAndDekPosition":"above","id":"QW88EUT1UM0W01","isPressRelease":false,"isTrending":false,"imageAttachments":{"373530619":{"id":"373530619","baseUrl":"https:\/\/assets.bwbx.io\/images\/users\/iqjWHBFdfxIU\/i6CB2JgDX_TI\/v0\/-1x-1.jpg","origWidth":811,"origHeight":608,"caption":null,"type":"image","alt":"ceramtec","themes":null},"373530732":{"id":"373530732","baseUrl":"https:\/\/assets.bwbx.io\/images\/users\/iqjWHBFdfxIU\/i2B9vOvxzOdU\/v0\/-1x-1.jpg","origWidth":1215,"origHeight":608,"caption":null,"type":"image","alt":"ceramtec SOCIAL","themes":null},"373752001":{"id":"373752001","baseUrl":"https:\/\/assets.bwbx.io\/images\/users\/iqjWHBFdfxIU\/ikeljb901_vY\/v0\/-1x-1.jpg","origWidth":1215,"origHeight":608,"caption":null,"type":"image","alt":"Partners Group, CVC Team Up to Rival Celanese for CeramTec","themes":null}},"label":null,"language":"en","ledeAttachment":null,"ledeCaption":null,"ledeCredit":null,"ledeDescription":null,"ledeImageUrl":null,"ledeKind":"not_quite_full_width","ledeMediaKind":"","ledeSize":"","locale":"en","magazine":null,"magazineMetadata":null,"marketcards":[],"metadata":{"hiddenInlineAttachments":[],"magazine":false,"suppressComments":false,"excludeFromPaywall":false,"theme":null,"background":null,"isMetered":false,"newsletterSlug":null,"newsletterToutLabel":null,"cobrand":null,"terminalBlogId":null},"mostRelevantTags":["Capital Partners","Private Equity","Valuation","IPOs","Automotive","Europe"],"moved":false,"pillar":null,"premium":false,"primaryCategory":"markets","primarySite":"markets","publishedAt":"2021-07-14T16:51:30.758Z","readings":{"url":"https:\/\/assets.bwbx.io\/s3\/readings\/QW9WWDT0AFB41626336911620.mp3","durationMs":135262},"relatedStories":[],"resourceType":"Story","revision":"QW9WWDT0AFB4","secondaryBrands":["markets","business"],"seoHeadline":"Partners Group, CVC Team Up to Rival Celanese for CeramTec","slug":"2021-07-14\/partners-group-cvc-team-up-against-celanese-in-ceramtec-bidding","socialDescription":"Buyout firms Partners Group Holding AG and CVC Capital Partners have teamed up against chemicals company Celanese Corp. in the bidding for German technical-ceramics maker CeramTec GmbH, according to people familiar with the matter.","socialHeadline":"Partners Group, CVC Team Up to Rival Celanese for CeramTec","socialImageUrl":"https:\/\/assets.bwbx.io\/images\/users\/iqjWHBFdfxIU\/i2B9vOvxzOdU\/v0\/1200x600.jpg","storythreads":[],"summary":"Buyout firms Partners Group Holding AG and CVC Capital Partners have teamed up against chemicals company Celanese Corp. in the bidding for German technical-ceramics maker CeramTec GmbH, according to people familiar with the matter.","summaryText":"","suppressComments":false,"textHeadline":"Partners Group, CVC Team Up to Rival Celanese for CeramTec","theme":"markets","timeline":{},"topic":"Capital Partners","trashline":"(<span itemprop=\"description\">Adds BC Partners Germany deal in final paragraph.<\/span>)","twitterDescription":"Buyout firms Partners Group Holding AG and CVC Capital Partners have teamed up against chemicals company Celanese Corp. in the bidding for German technical-ceramics maker CeramTec GmbH, according to people familiar with the matter.","twitterHandle":"markets","twitterText":"Partners Group and CVC have teamed up against chemicals company Celanese in the bidding for German technical-ceramics maker CeramTec, sources say","twitterTitle":"Partners Group, CVC Team Up to Rival Celanese for CeramTec","type":"archived","updatedAt":"2021-07-15T07:49:08.909Z","url":"\/news\/articles\/2021-07-14\/partners-group-cvc-team-up-against-celanese-in-ceramtec-bidding","videoAttachments":{},"webOriginal":false,"wssTags":[{"id":"Europe","type":"Region","directScore":0.5449411764705883,"derivedScore":8.858547871735478},{"id":"DE","type":"Country","directScore":0.1251764705882353,"derivedScore":5.632072944712481},{"id":"CA","type":"Country","directScore":0.23294117647058823,"derivedScore":0.4639285714285714},{"id":"1125977D:GR","type":"Company","directScore":0.09835294117647059,"derivedScore":0.09835294117647059},{"id":"BBU-U:CN","type":"Company","directScore":0.3952941176470588,"derivedScore":0.3952941176470588},{"id":"1872421D:LN","type":"Company","directScore":0.42023529411764704,"derivedScore":0.42023529411764704},{"id":"PGHN:SW","type":"Company","directScore":3.824317135549872,"derivedScore":3.824317135549872},{"id":"3711Z:GR","type":"Company","directScore":5.629854175079643,"derivedScore":5.629854175079643},{"id":"CE:US","type":"Company","directScore":6.306546237717054,"derivedScore":6.306546237717054},{"id":"7473980Z:FP","type":"Company","directScore":7.619764705882353,"derivedScore":7.619764705882353},{"id":"food","type":"Topic","directScore":0.048,"derivedScore":0.048},{"id":"debt","type":"Topic","directScore":0.15058823529411763,"derivedScore":0.15058823529411763},{"id":"pension-plan","type":"Topic","directScore":0.2,"derivedScore":0.2},{"id":"automotive","type":"Topic","directScore":0.6291764705882353,"derivedScore":0.6291764705882353},{"id":"ipos","type":"Topic","directScore":0.7049411764705882,"derivedScore":0.7049411764705882},{"id":"valuation","type":"Topic","directScore":0.8536470588235294,"derivedScore":0.8536470588235294},{"id":"private-equity","type":"Topic","directScore":1.6324705882352941,"derivedScore":1.6324705882352941},{"id":"capital-partners","type":"Topic","directScore":3.8010741687979537,"derivedScore":3.8010741687979537},{"id":"markets","type":"Classification","directScore":0,"derivedScore":6},{"id":"finance","type":"Classification","directScore":0,"derivedScore":8.210859861717834},{"id":"GB","type":"Country","directScore":0,"derivedScore":0.42023529411764704},{"id":"industrials","type":"Topic","directScore":0,"derivedScore":0.3952941176470588},{"id":"FR","type":"Country","directScore":0,"derivedScore":7.619764705882353},{"id":"infrastructure","type":"Topic","directScore":0,"derivedScore":0.6291764705882353},{"id":"US","type":"Region","directScore":0,"derivedScore":6.322191868855642},{"id":"fixed-income","type":"Topic","directScore":0,"derivedScore":0.15058823529411763},{"id":"CH","type":"Country","directScore":0,"derivedScore":3.824317135549872},{"id":"materials","type":"Topic","directScore":0,"derivedScore":6.317207134650508},{"id":"bonds","type":"Topic","directScore":0,"derivedScore":0.15058823529411763},{"id":"US","type":"Country","directScore":0,"derivedScore":6.306546237717054},{"id":"transportation","type":"Topic","directScore":0,"derivedScore":0.6291764705882353},{"id":"technology","type":"Classification","directScore":0,"derivedScore":8.81943180439255},{"id":"UK","type":"Country","directScore":0,"derivedScore":0.42023529411764704}],"validatedAt":"2022-11-22T16:52:27.557Z","teaserBody":"<p>Buyout firms <a href=\"\/quote\/PGHN:SW\" itemprop=\"StoryLink\" itemscope=\"itemscope\" title=\"Company Overview\"><meta itemprop=\"security\" content=\"PGHN SW Equity\"><meta itemprop=\"type\" content=\"SecurityLink\">Partners Group Holding AG<\/a> and <a href=\"\/quote\/2270Z:LN\" itemprop=\"StoryLink\" itemscope=\"itemscope\" title=\"Company Overview\"><meta itemprop=\"security\" content=\"2270Z LN Equity\"><meta itemprop=\"type\" content=\"SecurityLink\">CVC Capital Partners<\/a> have teamed up against chemicals company <a href=\"\/quote\/CE:US\" itemprop=\"StoryLink\" itemscope=\"itemscope\" title=\"Company Overview\"><meta itemprop=\"security\" content=\"CE US Equity\"><meta itemprop=\"type\" content=\"SecurityLink\">Celanese Corp.<\/a> in the bidding for German technical-ceramics maker <a href=\"\/quote\/3711Z:GR\" itemprop=\"StoryLink\" itemscope=\"itemscope\" title=\"Company Overview\"><meta itemprop=\"security\" content=\"3711Z GR Equity\"><meta itemprop=\"type\" content=\"SecurityLink\">CeramTec GmbH<\/a>, according to people familiar with the matter.<\/p><p>Owner <a href=\"\/quote\/7473980Z:FP\" itemprop=\"StoryLink\" itemscope=\"itemscope\" title=\"Company Overview\"><meta itemprop=\"security\" content=\"7473980Z FP Equity\"><meta itemprop=\"type\" content=\"SecurityLink\">BC Partners<\/a> has called for next-round bids around July 19 and is seeking a valuation of at least 4 billion euros ($4.7 billion), the people said, asking not to be identified because discussions are private.<\/p>"},"greenDataSnippet":{"js":"","css":"","html":""},"coronavirusDataSnippet":{"js":"","css":"","html":""},"isNewsletter":false,"mostPopular":[{"brand":"technology","site":"technology","byline":"","headline":"Billionaire Investor Carl Icahn Is Betting Against GameStop Shares","summary":"","url":"https:\/\/www.bloomberg.com\/news\/articles\/2022-11-21\/carl-icahn-said-to-hold-large-gamestop-short-position","authors":[],"updatedAt":"2022-11-22T15:28:14.413Z","publishedAt":"2022-11-21T22:56:20.025Z","thumbnail":{"id":"393699102","baseUrl":"https:\/\/assets.bwbx.io\/images\/users\/iqjWHBFdfxIU\/i637E6R.YXeI\/v0\/-1x-1.jpg","origWidth":1000,"origHeight":667,"caption":null,"type":"image","alt":"Key Speakers At The Leveraged Finance Fights Melanoma Event","themes":null}},{"brand":"markets","site":"markets","byline":"","headline":"FTX Latest: Hearing Ahead; Trabucco Used Poker Tactics to Trade","summary":"","url":"https:\/\/www.bloomberg.com\/news\/articles\/2022-11-21\/ftx-latest-genesis-bankruptcy-warning-buffets-crypto-markets","authors":[],"updatedAt":"2022-11-22T13:55:19.544Z","publishedAt":"2022-11-21T23:13:02.022Z","thumbnail":{"id":"393710641","baseUrl":"https:\/\/assets.bwbx.io\/images\/users\/iqjWHBFdfxIU\/ir9iuF0h9HzU\/v0\/-1x-1.jpg","origWidth":2000,"origHeight":1334,"caption":null,"type":"image","alt":"FTX's Crypto Contagion Infects Firms From BlockFi To Voyager","themes":null}},{"brand":"businessweek","site":"businessweek","byline":"","headline":"Tech Layoffs Send H-1B Visa Holders Scrambling for New Jobs","summary":"Hundreds of people in the US on temporary work visas may need to leave the country if they can’t find new sponsors.","url":"https:\/\/www.bloomberg.com\/news\/articles\/2022-11-21\/2022-tech-layoffs-leave-h-1b-visa-holders-in-limbo","authors":[],"updatedAt":"2022-11-21T11:00:12.018Z","publishedAt":"2022-11-21T11:00:12.017Z","thumbnail":{"id":"393641100","baseUrl":"https:\/\/assets.bwbx.io\/images\/users\/iqjWHBFdfxIU\/iBSApks1Zt_g\/v0\/-1x-1.jpg","origWidth":2200,"origHeight":1467,"caption":null,"type":"image","alt":null,"themes":null}},{"brand":"industries","site":"industries","byline":"","headline":"When Disney Decided to Dump its CEO, the Change Happened Fast","summary":"","url":"https:\/\/www.bloomberg.com\/news\/articles\/2022-11-22\/when-disney-decided-to-dump-its-ceo-the-change-happened-fast","authors":[],"updatedAt":"2022-11-22T14:32:42.357Z","publishedAt":"2022-11-22T02:42:07.788Z","thumbnail":{"id":"393710385","baseUrl":"https:\/\/assets.bwbx.io\/images\/users\/iqjWHBFdfxIU\/ijILhvKfCTVE\/v0\/-1x-1.jpg","origWidth":2000,"origHeight":1500,"caption":null,"type":"image","alt":"Walt Disney Co. CEO Bob Iger Speaks At The ECNY","themes":null}},{"brand":"business","site":"bbiz","byline":"","headline":"Disney Shares Jump on Optimism Over Iger’s Surprise Return","summary":"","url":"https:\/\/www.bloomberg.com\/news\/articles\/2022-11-21\/disney-says-bob-iger-will-return-as-ceo-succeeding-bob-chapek","authors":[],"updatedAt":"2022-11-21T17:03:20.443Z","publishedAt":"2022-11-21T03:07:17.325Z","thumbnail":{"id":"393668822","baseUrl":"https:\/\/assets.bwbx.io\/images\/users\/iqjWHBFdfxIU\/iecm1xBCQOHQ\/v0\/-1x-1.jpg","origWidth":2000,"origHeight":1328,"caption":null,"type":"image","alt":"Vox Media's 2022 Code Conference - Day 2","themes":null}}],"mostReadEnabled":true} {"id":"QW88EUT1UM0W01","contentType":"Story","contentTags":[{"id":"Europe","type":"Region","directScore":0.5449411764705883,"derivedScore":8.858547871735478},{"id":"DE","type":"Country","directScore":0.1251764705882353,"derivedScore":5.632072944712481},{"id":"CA","type":"Country","directScore":0.23294117647058823,"derivedScore":0.4639285714285714},{"id":"1125977D:GR","type":"Company","directScore":0.09835294117647059,"derivedScore":0.09835294117647059},{"id":"BBU-U:CN","type":"Company","directScore":0.3952941176470588,"derivedScore":0.3952941176470588},{"id":"1872421D:LN","type":"Company","directScore":0.42023529411764704,"derivedScore":0.42023529411764704},{"id":"PGHN:SW","type":"Company","directScore":3.824317135549872,"derivedScore":3.824317135549872},{"id":"3711Z:GR","type":"Company","directScore":5.629854175079643,"derivedScore":5.629854175079643},{"id":"CE:US","type":"Company","directScore":6.306546237717054,"derivedScore":6.306546237717054},{"id":"7473980Z:FP","type":"Company","directScore":7.619764705882353,"derivedScore":7.619764705882353},{"id":"food","type":"Topic","directScore":0.048,"derivedScore":0.048},{"id":"debt","type":"Topic","directScore":0.15058823529411763,"derivedScore":0.15058823529411763},{"id":"pension-plan","type":"Topic","directScore":0.2,"derivedScore":0.2},{"id":"automotive","type":"Topic","directScore":0.6291764705882353,"derivedScore":0.6291764705882353},{"id":"ipos","type":"Topic","directScore":0.7049411764705882,"derivedScore":0.7049411764705882},{"id":"valuation","type":"Topic","directScore":0.8536470588235294,"derivedScore":0.8536470588235294},{"id":"private-equity","type":"Topic","directScore":1.6324705882352941,"derivedScore":1.6324705882352941},{"id":"capital-partners","type":"Topic","directScore":3.8010741687979537,"derivedScore":3.8010741687979537},{"id":"markets","type":"Classification","directScore":0,"derivedScore":6},{"id":"finance","type":"Classification","directScore":0,"derivedScore":8.210859861717834},{"id":"GB","type":"Country","directScore":0,"derivedScore":0.42023529411764704},{"id":"industrials","type":"Topic","directScore":0,"derivedScore":0.3952941176470588},{"id":"FR","type":"Country","directScore":0,"derivedScore":7.619764705882353},{"id":"infrastructure","type":"Topic","directScore":0,"derivedScore":0.6291764705882353},{"id":"US","type":"Region","directScore":0,"derivedScore":6.322191868855642},{"id":"fixed-income","type":"Topic","directScore":0,"derivedScore":0.15058823529411763},{"id":"CH","type":"Country","directScore":0,"derivedScore":3.824317135549872},{"id":"materials","type":"Topic","directScore":0,"derivedScore":6.317207134650508},{"id":"bonds","type":"Topic","directScore":0,"derivedScore":0.15058823529411763},{"id":"US","type":"Country","directScore":0,"derivedScore":6.306546237717054},{"id":"transportation","type":"Topic","directScore":0,"derivedScore":0.6291764705882353},{"id":"technology","type":"Classification","directScore":0,"derivedScore":8.81943180439255},{"id":"UK","type":"Country","directScore":0,"derivedScore":0.42023529411764704}],"brand":"markets","franchise":"deals","archived":true,"metadata":{"hiddenInlineAttachments":[],"magazine":false,"suppressComments":false,"excludeFromPaywall":false,"theme":null,"background":null,"isMetered":false,"newsletterSlug":null,"newsletterToutLabel":null,"cobrand":null,"terminalBlogId":null,"authors":[{"id":"18657817","name":"Dinesh Nair","slug":"ARyyGQR8v_w/dinesh-nair","title":null,"bio":null,"columnist":false,"contributor":false,"editorialBoard":false,"headshot":{"id":"386512166","baseUrl":"https://assets.bwbx.io/images/users/iqjWHBFdfxIU/iAHQo9umsWls/v1/200x200.jpg","origWidth":2000,"origHeight":2000,"caption":null,"type":"image","themes":null},"facebookHandle":null,"facebookUrl":null,"twitterHandle":"DNair5","twitterUrl":"https://www.twitter.com/DNair5"},{"id":"17673321","name":"Jan-Henrik Foerster","slug":"AQ2saY71wbs/janhenrik-foerster","title":null,"bio":null,"columnist":false,"contributor":false,"editorialBoard":false,"headshot":{"id":"386352019","baseUrl":"https://assets.bwbx.io/images/users/iqjWHBFdfxIU/ifa_pJeO2tgQ/v2/200x200.jpg","origWidth":2000,"origHeight":2000,"caption":null,"type":"image","themes":null},"facebookHandle":null,"facebookUrl":null,"twitterHandle":"JanFoe","twitterUrl":"https://www.twitter.com/JanFoe"},{"id":"18043877","name":"Kiel Porter","slug":"ARNT5T6VBW0/kiel-porter","title":null,"bio":null,"columnist":false,"contributor":false,"editorialBoard":false,"headshot":{"id":"110348767","baseUrl":"https://assets.bwbx.io/images/users/iqjWHBFdfxIU/iodhiLzBpXTw/v1/200x200.jpg","origWidth":160,"origHeight":211,"caption":null,"type":"image","themes":null},"facebookHandle":null,"facebookUrl":null,"twitterHandle":"kielporter","twitterUrl":"https://www.twitter.com/kielporter"}]},"adConfig":{"adCode":"bloomberg/markets/deals/article"},"adCodes":["5262/bloomberg/markets/deals/article"]} var _____WB$wombat$assign$function_____ = function(name) {return (self._wb_wombat && self._wb_wombat.local_init && self._wb_wombat.local_init(name)) || self[name]; }; if (!self.__WB_pmw) { self.__WB_pmw = function(obj) { this.__WB_source = obj; return this; } } { let window = _____WB$wombat$assign$function_____("window"); let self = _____WB$wombat$assign$function_____("self"); let document = _____WB$wombat$assign$function_____("document"); let location = _____WB$wombat$assign$function_____("location"); let top = _____WB$wombat$assign$function_____("top"); let parent = _____WB$wombat$assign$function_____("parent"); let frames = _____WB$wombat$assign$function_____("frames"); let opener = _____WB$wombat$assign$function_____("opener"); let arguments; { document.dispatchEvent(new CustomEvent('contentMetadata:ready', { detail: {"id":"QW88EUT1UM0W01","contentType":"Story","contentTags":[{"id":"Europe","type":"Region","directScore":0.5449411764705883,"derivedScore":8.858547871735478},{"id":"DE","type":"Country","directScore":0.1251764705882353,"derivedScore":5.632072944712481},{"id":"CA","type":"Country","directScore":0.23294117647058823,"derivedScore":0.4639285714285714},{"id":"1125977D:GR","type":"Company","directScore":0.09835294117647059,"derivedScore":0.09835294117647059},{"id":"BBU-U:CN","type":"Company","directScore":0.3952941176470588,"derivedScore":0.3952941176470588},{"id":"1872421D:LN","type":"Company","directScore":0.42023529411764704,"derivedScore":0.42023529411764704},{"id":"PGHN:SW","type":"Company","directScore":3.824317135549872,"derivedScore":3.824317135549872},{"id":"3711Z:GR","type":"Company","directScore":5.629854175079643,"derivedScore":5.629854175079643},{"id":"CE:US","type":"Company","directScore":6.306546237717054,"derivedScore":6.306546237717054},{"id":"7473980Z:FP","type":"Company","directScore":7.619764705882353,"derivedScore":7.619764705882353},{"id":"food","type":"Topic","directScore":0.048,"derivedScore":0.048},{"id":"debt","type":"Topic","directScore":0.15058823529411763,"derivedScore":0.15058823529411763},{"id":"pension-plan","type":"Topic","directScore":0.2,"derivedScore":0.2},{"id":"automotive","type":"Topic","directScore":0.6291764705882353,"derivedScore":0.6291764705882353},{"id":"ipos","type":"Topic","directScore":0.7049411764705882,"derivedScore":0.7049411764705882},{"id":"valuation","type":"Topic","directScore":0.8536470588235294,"derivedScore":0.8536470588235294},{"id":"private-equity","type":"Topic","directScore":1.6324705882352941,"derivedScore":1.6324705882352941},{"id":"capital-partners","type":"Topic","directScore":3.8010741687979537,"derivedScore":3.8010741687979537},{"id":"markets","type":"Classification","directScore":0,"derivedScore":6},{"id":"finance","type":"Classification","directScore":0,"derivedScore":8.210859861717834},{"id":"GB","type":"Country","directScore":0,"derivedScore":0.42023529411764704},{"id":"industrials","type":"Topic","directScore":0,"derivedScore":0.3952941176470588},{"id":"FR","type":"Country","directScore":0,"derivedScore":7.619764705882353},{"id":"infrastructure","type":"Topic","directScore":0,"derivedScore":0.6291764705882353},{"id":"US","type":"Region","directScore":0,"derivedScore":6.322191868855642},{"id":"fixed-income","type":"Topic","directScore":0,"derivedScore":0.15058823529411763},{"id":"CH","type":"Country","directScore":0,"derivedScore":3.824317135549872},{"id":"materials","type":"Topic","directScore":0,"derivedScore":6.317207134650508},{"id":"bonds","type":"Topic","directScore":0,"derivedScore":0.15058823529411763},{"id":"US","type":"Country","directScore":0,"derivedScore":6.306546237717054},{"id":"transportation","type":"Topic","directScore":0,"derivedScore":0.6291764705882353},{"id":"technology","type":"Classification","directScore":0,"derivedScore":8.81943180439255},{"id":"UK","type":"Country","directScore":0,"derivedScore":0.42023529411764704}],"brand":"markets","franchise":"deals","archived":true,"metadata":{"hiddenInlineAttachments":[],"magazine":false,"suppressComments":false,"excludeFromPaywall":false,"theme":null,"background":null,"isMetered":false,"newsletterSlug":null,"newsletterToutLabel":null,"cobrand":null,"terminalBlogId":null,"authors":[{"id":"18657817","name":"Dinesh Nair","slug":"ARyyGQR8v_w/dinesh-nair","title":null,"bio":null,"columnist":false,"contributor":false,"editorialBoard":false,"headshot":{"id":"386512166","baseUrl":"https://assets.bwbx.io/images/users/iqjWHBFdfxIU/iAHQo9umsWls/v1/200x200.jpg","origWidth":2000,"origHeight":2000,"caption":null,"type":"image","themes":null},"facebookHandle":null,"facebookUrl":null,"twitterHandle":"DNair5","twitterUrl":"https://www.twitter.com/DNair5"},{"id":"17673321","name":"Jan-Henrik Foerster","slug":"AQ2saY71wbs/janhenrik-foerster","title":null,"bio":null,"columnist":false,"contributor":false,"editorialBoard":false,"headshot":{"id":"386352019","baseUrl":"https://assets.bwbx.io/images/users/iqjWHBFdfxIU/ifa_pJeO2tgQ/v2/200x200.jpg","origWidth":2000,"origHeight":2000,"caption":null,"type":"image","themes":null},"facebookHandle":null,"facebookUrl":null,"twitterHandle":"JanFoe","twitterUrl":"https://www.twitter.com/JanFoe"},{"id":"18043877","name":"Kiel Porter","slug":"ARNT5T6VBW0/kiel-porter","title":null,"bio":null,"columnist":false,"contributor":false,"editorialBoard":false,"headshot":{"id":"110348767","baseUrl":"https://assets.bwbx.io/images/users/iqjWHBFdfxIU/iodhiLzBpXTw/v1/200x200.jpg","origWidth":160,"origHeight":211,"caption":null,"type":"image","themes":null},"facebookHandle":null,"facebookUrl":null,"twitterHandle":"kielporter","twitterUrl":"https://www.twitter.com/kielporter"}]},"adConfig":{"adCode":"bloomberg/markets/deals/article"},"adCodes":["5262/bloomberg/markets/deals/article"]} })); }} Terms of Service Do Not Sell My Info (California) Trademarks Privacy Policy ©2022 Bloomberg L.P. All Rights Reserved Careers Made in NYC Advertise Ad Choices Help {"adCode":"bloomberg/markets/deals/article","archived":true,"premium":false,"attributor":"bn","authors":[{"id":"18657817","name":"Dinesh Nair","slug":"ARyyGQR8v_w/dinesh-nair","title":null,"bio":null,"columnist":false,"contributor":false,"editorialBoard":false,"headshot":{"id":"386512166","baseUrl":"https://assets.bwbx.io/images/users/iqjWHBFdfxIU/iAHQo9umsWls/v1/200x200.jpg","origWidth":2000,"origHeight":2000,"caption":null,"type":"image","themes":null},"facebookHandle":null,"facebookUrl":null,"twitterHandle":"DNair5","twitterUrl":"https://www.twitter.com/DNair5"},{"id":"17673321","name":"Jan-Henrik Foerster","slug":"AQ2saY71wbs/janhenrik-foerster","title":null,"bio":null,"columnist":false,"contributor":false,"editorialBoard":false,"headshot":{"id":"386352019","baseUrl":"https://assets.bwbx.io/images/users/iqjWHBFdfxIU/ifa_pJeO2tgQ/v2/200x200.jpg","origWidth":2000,"origHeight":2000,"caption":null,"type":"image","themes":null},"facebookHandle":null,"facebookUrl":null,"twitterHandle":"JanFoe","twitterUrl":"https://www.twitter.com/JanFoe"},{"id":"18043877","name":"Kiel Porter","slug":"ARNT5T6VBW0/kiel-porter","title":null,"bio":null,"columnist":false,"contributor":false,"editorialBoard":false,"headshot":{"id":"110348767","baseUrl":"https://assets.bwbx.io/images/users/iqjWHBFdfxIU/iodhiLzBpXTw/v1/200x200.jpg","origWidth":160,"origHeight":211,"caption":null,"type":"image","themes":null},"facebookHandle":null,"facebookUrl":null,"twitterHandle":"kielporter","twitterUrl":"https://www.twitter.com/kielporter"}],"brand":"markets","secondaryBrands":["markets","business"],"byline":"Dinesh Nair, Jan-Henrik Förster and Kiel Porter","wssTags":["Europe","DE","CA","1125977D:GR","BBU-U:CN","1872421D:LN","PGHN:SW","3711Z:GR","CE:US","7473980Z:FP","food","debt","pension-plan","automotive","ipos","valuation","private-equity","capital-partners","markets","finance","GB","industrials","FR","infrastructure","US","fixed-income","CH","materials","bonds","US","transportation","technology","UK"],"franchise":"deals","locale":"en","id":"QW88EUT1UM0W01","isPressRelease":false,"paywallType":"additive","primaryCategory":"markets","categories":["markets"],"primarySite":"markets","publishedAt":"2021-07-14T16:51:30.758Z","revision":"QW9WWDT0AFB4","resourceType":"Story","seoHeadline":"Partners Group, CVC Team Up to Rival Celanese for CeramTec","slug":"2021-07-14/partners-group-cvc-team-up-against-celanese-in-ceramtec-bidding","textHeadline":"Partners Group, CVC Team Up to Rival Celanese for CeramTec","theme":"markets","topic":"Capital Partners","twitterHandle":"markets","twitterText":"Partners Group and CVC have teamed up against chemicals company Celanese in the bidding for German technical-ceramics maker CeramTec, sources say","type":"archived","url":"/news/articles/2021-07-14/partners-group-cvc-team-up-against-celanese-in-ceramtec-bidding","canonical":"https://www.bloomberg.com/news/articles/2021-07-14/partners-group-cvc-team-up-against-celanese-in-ceramtec-bidding","webOriginal":false,"metadata":{"isMetered":false}} var _____WB$wombat$assign$function_____ = function(name) {return (self._wb_wombat && self._wb_wombat.local_init && self._wb_wombat.local_init(name)) || self[name]; }; if (!self.__WB_pmw) { self.__WB_pmw = function(obj) { this.__WB_source = obj; return this; } } { let window = _____WB$wombat$assign$function_____("window"); let self = _____WB$wombat$assign$function_____("self"); let document = _____WB$wombat$assign$function_____("document"); let location = _____WB$wombat$assign$function_____("location"); let top = _____WB$wombat$assign$function_____("top"); let parent = _____WB$wombat$assign$function_____("parent"); let frames = _____WB$wombat$assign$function_____("frames"); let opener = _____WB$wombat$assign$function_____("opener"); let arguments; {window.__bloomberg__.abba=[{"targetId":"tc2t6","priority":-101,"condition":"{\"and\":[{\"or\":[{\"indicator_value\":\"\",\"indicator_comparator\":\"\",\"value\":\"wolf.bloomberg.com/wolf\",\"comparator\":\"nct\",\"id\":\"url\",\"type\":\"string\",\"store\":\"url\",\"path\":\"url\"}]},{\"or\":[{\"indicator_value\":\"\",\"indicator_comparator\":\"\",\"value\":\"https://www.bloomberg.com/features/2022-the-crypto-story\",\"comparator\":\"ct\",\"id\":\"url\",\"type\":\"string\",\"store\":\"url\",\"path\":\"url\"}]}]}","config":"{\"rewards\":{\"recurring\":false,\"rewardType\":\"verification\",\"articleCount\":1,\"rewardDuration\":43200,\"subscriberTrial\":false,\"subscriberOnlyContentIncluded\":false},\"verification-wall\":{\"type\":\"banner\",\"enabled\":true,\"boldText\":\"Get Started\",\"limitText\":\"Register to read more.\",\"headerText\":\"Create an account to read The Crypto Story.\",\"subHeaderText\":\"Register to read more on Bloomberg.com\",\"mobileHeaderText\":\"Register to unlock more content on Bloomberg.com\"}}","experiments":[{"experimentId":"e2ktf","population":1,"startTime":"2022-10-24T19:37:00.000Z","endTime":"2023-01-31T20:37:00.000Z","locked":false,"buckets":[{"bucketId":"bdvmw","config":"{}"},{"bucketId":"bhuhp","config":"{}"},{"bucketId":"b66q4","config":"{\"rewards\":{\"recurring\":false,\"rewardType\":\"verification\",\"articleCount\":1,\"rewardDuration\":43200,\"subscriberTrial\":false,\"subscriberOnlyContentIncluded\":false},\"verification-wall\":{\"type\":\"banner\",\"enabled\":true,\"boldText\":\"Get Started\",\"limitText\":\"Register to read more.\",\"headerText\":\"Create an account to read The Crypto Story.\",\"subHeaderText\":\"Register to read more on Bloomberg.com\",\"mobileHeaderText\":\"Register to unlock more content on Bloomberg.com\"}}"}]}]},{"targetId":"tz05c","priority":-100,"condition":"{\"and\":[{\"or\":[{\"value\":\"US\",\"comparator\":\"eq\",\"id\":\"geoIp\",\"type\":\"string\",\"store\":\"geo\"},{\"value\":\"US\",\"comparator\":\"not\",\"id\":\"geoIp\",\"type\":\"string\",\"store\":\"geo\"}]}]}","config":"{\"navi-subscription\":{\"subscribeUrl\":\"https://www.bloomberg.com/subscriptions?in_source=nav-c_original\"}}","experiments":[{"experimentId":"ebkyi","population":1,"startTime":"2022-11-16T21:00:00.000Z","endTime":"2022-11-30T21:30:00.000Z","locked":false,"buckets":[{"bucketId":"bjmx7","config":"{}"},{"bucketId":"bmzfv","config":"{}"},{"bucketId":"beojj","config":"{\"navi-subscription\":{\"subscribeUrl\":\"https://www.bloomberg.com/subscriptions?in_source=nav-cm22_t1_unlimited\",\"subscriptionText\":\"Get Unlimited Access\",\"subscriptionColor\":\"white\",\"subscriptionBackgroundColor\":\"black\"}}"},{"bucketId":"bz3hl","config":"{\"navi-subscription\":{\"subscribeUrl\":\"https://www.bloomberg.com/subscriptions?in_source=nav-cm22_t2_flashsale\",\"subscriptionText\":\"Flash Sale\",\"subscriptionColor\":\"white\",\"subscriptionBackgroundColor\":\"black\"}}"},{"bucketId":"bwqzn","config":"{\"navi-subscription\":{\"subscribeUrl\":\"https://www.bloomberg.com/subscriptions?in_source=nav-cm22_t3_cybermondaysale\",\"subscriptionText\":\"Cyber Monday Sale\",\"subscriptionColor\":\"white\",\"subscriptionBackgroundColor\":\"black\"}}"}]}]},{"targetId":"tllfj","priority":-1,"condition":"{\"or\":[{\"and\":[{\"value\":\"chrome\",\"comparator\":\"eq\",\"id\":\"userAgent\",\"type\":\"enumeration\",\"store\":\"userAgent\"}]},{\"and\":[{\"value\":\"firefox\",\"comparator\":\"eq\",\"id\":\"userAgent\",\"type\":\"enumeration\",\"store\":\"userAgent\"}]},{\"and\":[{\"value\":\"opera\",\"comparator\":\"eq\",\"id\":\"userAgent\",\"type\":\"enumeration\",\"store\":\"userAgent\"}]},{\"and\":[{\"value\":\"samsung\",\"comparator\":\"eq\",\"id\":\"userAgent\",\"type\":\"enumeration\",\"store\":\"userAgent\"}]}]}","config":"{\"webpushprompt\":{\"title\":\"Cut through the chaos with real time updates on the news affecting the global economy.\",\"titleBold\":\"Enable Notifications.\",\"variation\":\"wide\",\"turnonText\":\"Enable\",\"nothanksText\":\"Later\",\"shouldDisplay\":true,\"deferMinAfterClose\":300,\"showAfterPageViews\":5,\"deferMinAfterIgnore\":100}}","experiments":[]},{"targetId":"tn4lo","priority":-1,"condition":"{\"or\":[{\"and\":[{\"indicator_value\":\"\",\"indicator_comparator\":\"\",\"value\":\"desktop\",\"comparator\":\"not\",\"id\":\"device\",\"type\":\"enumeration\",\"store\":\"device\"}]}]}","config":"{\"for-you-module\":{\"position\":\"hidden\"}}","experiments":[{"experimentId":"e8awq","population":1,"startTime":"2022-08-15T14:45:56.839Z","endTime":"2022-12-16T22:45:00.000Z","locked":false,"buckets":[{"bucketId":"b3eq9","config":"{}"},{"bucketId":"br61f","config":"{}"},{"bucketId":"bmq0b","config":"{\"for-you-module\":{\"position\":\"bottom\"}}"},{"bucketId":"bq1pw","config":"{\"for-you-module\":{\"position\":\"bottom\"}}"}]}]},{"targetId":"t95ib","priority":-1,"condition":"{\"and\":[{\"or\":[{\"indicator_value\":\"\",\"indicator_comparator\":\"\",\"value\":\"DIGITAL\",\"comparator\":\"eq\",\"id\":\"subscriptionType\",\"type\":\"enumeration\",\"store\":\"userInfo\",\"path\":\"subscriptionType\"}]},{\"or\":[{\"indicator_value\":\"\",\"indicator_comparator\":\"\",\"value\":\"end-of-intro\",\"comparator\":\"eq\",\"id\":\"introPeriodStatus\",\"type\":\"enumeration\",\"store\":\"userInfo\",\"path\":\"introPeriodStatus\"}]},{\"or\":[{\"indicator_value\":\"\",\"indicator_comparator\":\"\",\"value\":\"Month\",\"comparator\":\"eq\",\"id\":\"billingPeriod\",\"type\":\"enumeration\",\"store\":\"userInfo\",\"path\":\"billingPeriod\"}]},{\"or\":[{\"indicator_value\":\"\",\"indicator_comparator\":\"\",\"value\":120,\"comparator\":\"gte\",\"id\":\"daysSubscribed\",\"type\":\"numeric\",\"store\":\"userInfo\",\"path\":\"daysSubscribed\"}]},{\"or\":[{\"indicator_value\":\"\",\"indicator_comparator\":\"\",\"value\":270,\"comparator\":\"lte\",\"id\":\"daysSubscribed\",\"type\":\"numeric\",\"store\":\"userInfo\",\"path\":\"daysSubscribed\"}]}]}","config":"{\"upsell-offer\":{\"title\":\"Exclusive offer – save 40% by switching to annual billing.\",\"subtitle\":\"Lock in your discounted rate now\",\"ratePlanId\":\"2c92a0087c1b0da1017c28b1ce3667ba\"},\"upsell-offer-banner\":{\"outlet\":\"banner\",\"templateId\":313,\"Text_460_color\":\"white\",\"Text_644_color\":\"white\",\"renderStrategy\":\"on-load\",\"Text_460_content\":\"\",\"Text_644_content\":\"\",\"CloseButton_549_theme\":\"white\",\"Text_460_mobileContent\":\"\",\"Text_644_mobileContent\":\"\",\"PrimaryButton_723_label\":\"Claim My Offer\",\"PrimaryButton_723_theme\":\"opinion-blue\",\"PrimaryButton_723_title\":\"Claim My Offer\",\"Text_460_desktopContent\":\"Exclusive offer – save 40% by switching to annual billing.\",\"Text_644_desktopContent\":\"Lock in your discounted rate now\",\"CloseButton_549_modalRenderId\":313,\"PrimaryButton_723_modalRenderId\":313,\"FlexibleColumnContainer_222_color\":\"black\",\"Render_Manager_daysAfterLastShown\":1,\"Render_Manager_daysAfterLastClosed\":7,\"FlexibleColumnContainer_222_columnCount\":2}}","experiments":[]},{"targetId":"t6zao","priority":3,"condition":"{\"or\":[{\"and\":[{\"indicator_value\":\"\",\"indicator_comparator\":\"\",\"value\":\"https://www.bloomberg.com/graphics/electric-vehicles/\",\"comparator\":\"ct\",\"id\":\"url\",\"type\":\"string\",\"store\":\"url\",\"path\":\"url\"}]}]}","config":"{\"rules\":{\"isMeteredOverride\":false,\"enableVerificationWall\":true},\"verification-wall\":{\"type\":\"modal\",\"enabled\":true,\"buttonText\":\"Create account\",\"headerText\":\"Create an account to access this article\",\"nextModule\":\"none\",\"subTitleCopy\":\"Read more about green power and green ratings for electric vehicles.\",\"isDismissible\":false,\"subHeaderText\":\"Read more about green power and green ratings for electric vehicles.\"}}","experiments":[]},{"targetId":"tkrgd","priority":10,"condition":"{\"and\":[{\"or\":[{\"value\":0.5,\"comparator\":\"lt\",\"id\":\"subscription_propensity_v2\",\"type\":\"numeric\",\"store\":\"byzantium\",\"path\":\"Metadata.action\"}]},{\"or\":[{\"value\":false,\"comparator\":\"eq\",\"id\":\"subscriber\",\"type\":\"boolean\",\"store\":\"userInfo\",\"path\":\"subscriber\"}]},{\"or\":[{\"value\":1,\"comparator\":\"gt\",\"id\":\"calendarMonthSinceFirstVisit\",\"type\":\"numeric\",\"store\":\"byzantium\",\"path\":\"Metadata.attribute.calendarMonthSinceFirstVisit\"}]},{\"or\":[{\"indicator_value\":\"\",\"indicator_comparator\":\"\",\"value\":\"bloomberg.co.jp\",\"comparator\":\"nct\",\"id\":\"url\",\"type\":\"string\",\"store\":\"url\",\"path\":\"url\"}]},{\"or\":[{\"indicator_value\":\"\",\"indicator_comparator\":\"\",\"value\":\"/letters/\",\"comparator\":\"nct\",\"id\":\"url\",\"type\":\"string\",\"store\":\"url\",\"path\":\"url\"}]},{\"or\":[{\"indicator_value\":\"\",\"indicator_comparator\":\"\",\"value\":\"/newsletters/\",\"comparator\":\"nct\",\"id\":\"url\",\"type\":\"string\",\"store\":\"url\",\"path\":\"url\"}]},{\"or\":[{\"indicator_value\":\"\",\"indicator_comparator\":\"\",\"value\":\"/storythreads/\",\"comparator\":\"nct\",\"id\":\"url\",\"type\":\"string\",\"store\":\"url\",\"path\":\"url\"}]},{\"or\":[{\"indicator_value\":\"\",\"indicator_comparator\":\"\",\"value\":\"/press-releases/\",\"comparator\":\"nct\",\"id\":\"url\",\"type\":\"string\",\"store\":\"url\",\"path\":\"url\"}]},{\"or\":[{\"indicator_value\":\"\",\"indicator_comparator\":\"\",\"value\":false,\"comparator\":\"eq\",\"id\":\"registered\",\"type\":\"boolean\",\"store\":\"userInfo\",\"path\":\"registered\"}]}]}","config":"{\"rewards\":{\"recurring\":false,\"rewardType\":\"verification\",\"articleCount\":2,\"rewardDuration\":43200,\"subscriberTrial\":false,\"subscriberOnlyContentIncluded\":false},\"meter-config\":{\"type\":\"expandable\",\"color\":\"dark\",\"boldText\":\"Explore Offers\",\"meterUrl\":\"https://www.bloomberg.com/subscriptions/checkout?id=2c92a0086614a669016615eb9d965f86\",\"buttonUrl\":\"https://www.bloomberg.com/subscriptions/checkout?id=2c92a0086614a669016615eb9d965f86\",\"limitText\":\"Get unlimited access today.\",\"buttonText\":\"Claim This Offer\",\"headerText\":\"Subscribe now for uninterrupted access. \",\"subHeaderText\":\"Global news that uncovers a new tomorrow, for $1.99/month. Cancel anytime.\",\"renderStrategy\":\"default\"},\"paywall-config\":{\"type\":\"banner\",\"color\":\"dark\",\"boldText\":\"Explore Offers\",\"limitText\":\"Get unlimited access today.\",\"buttonText\":\"Claim This Offer\",\"headerText\":\"Subscribe now for uninterrupted access. \",\"paywallUrl\":\"https://www.bloomberg.com/subscriptions/checkout?id=2c92a0086614a669016615eb9d965f86\",\"subHeaderText\":\"Global news that uncovers a new tomorrow, for $1.99/month. Cancel anytime.\",\"mobileHeaderText\":\"Get uninterrupted access to global news for $1.99/month. Cancel anytime.\"},\"navi-subscription\":{\"subscribeUrl\":\"https://www.bloomberg.com/subscriptions/67obqkd5zdp5lj8\"},\"verification-wall\":{\"type\":\"banner\",\"enabled\":false,\"headerText\":\"Create an account and unlock 2 bonus articles.\",\"nextModule\":\"none\",\"subHeaderText\":\"Register to read more on Bloomberg.com\"},\"super-elastic-rules\":{\"enabled\":true,\"dailyMax\":\"3\",\"dailyMin\":0,\"monthlyMax\":\"7\",\"monthlyMin\":1,\"STRThreshold\":0.85,\"realTimeBlocking\":true,\"weightingVersion\":\"v1\",\"aggregationVersion\":\"v1\",\"decisionTreeVersion\":\"v6\"}}","experiments":[]},{"targetId":"tllyq","priority":10,"condition":"{\"and\":[{\"or\":[{\"value\":false,\"comparator\":\"eq\",\"id\":\"subscriber\",\"type\":\"boolean\",\"store\":\"userInfo\",\"path\":\"subscriber\"}]},{\"or\":[{\"value\":1,\"comparator\":\"eq\",\"id\":\"calendarMonthSinceFirstVisit\",\"type\":\"numeric\",\"store\":\"byzantium\",\"path\":\"Metadata.attribute.calendarMonthSinceFirstVisit\"}]},{\"or\":[{\"indicator_value\":\"\",\"indicator_comparator\":\"\",\"value\":false,\"comparator\":\"eq\",\"id\":\"registered\",\"type\":\"boolean\",\"store\":\"userInfo\",\"path\":\"registered\"}]}]}","config":"{\"rules\":{\"paywallTriggerCount\":0,\"enableVerificationWall\":true,\"meterRenderingStrategy\":\"show\"},\"rewards\":{\"recurring\":false,\"rewardType\":\"verification\",\"articleCount\":1,\"rewardDuration\":43200,\"subscriberTrial\":false,\"subscriberOnlyContentIncluded\":false},\"meter-config\":{\"type\":\"expandable\",\"color\":\"dark\",\"boldText\":\"Explore Offer\",\"meterUrl\":\"https://www.bloomberg.com/subscriptions/checkout?id=2c92a0086614a669016615eb9d965f86\",\"buttonUrl\":\"https://www.bloomberg.com/subscriptions/checkout?id=2c92a0086614a669016615eb9d965f86\",\"limitText\":\"Get unlimited access today.\",\"buttonText\":\"Claim This Offer\",\"headerText\":\"Subscribe now for unlimited access to Bloomberg.com and the Bloomberg app\",\"subHeaderText\":\"Global news that uncovers a new tomorrow. Cancel anytime.\",\"renderStrategy\":\"hide\",\"mobileHeaderText\":\"Get uninterrupted access to global news. Cancel anytime.\"},\"paywall-config\":{\"type\":\"banner\",\"color\":\"dark\",\"boldText\":\"Explore Offer\",\"limitText\":\"Get unlimited access today.\",\"buttonText\":\"Claim this offer\",\"headerText\":\"Subscribe now for unlimited access to Bloomberg.com and the Bloomberg app\",\"paywallUrl\":\"https://www.bloomberg.com/subscriptions/checkout?id=2c92a0086614a669016615eb9d965f86\",\"subHeaderText\":\"Global news that uncovers a new tomorrow. Cancel anytime.\",\"mobileHeaderText\":\"\"},\"verification-wall\":{\"type\":\"banner\",\"enabled\":true,\"boldText\":\"Get Started\",\"limitText\":\"Register to read more.\",\"headerText\":\"Create an account and unlock 1 bonus article.\",\"nextModule\":\"none\",\"isDismissible\":true,\"subHeaderText\":\"Register to read more on Bloomberg.com\",\"mobileHeaderText\":\"Register to unlock more content on Bloomberg.com\"}}","experiments":[]},{"targetId":"td4ip","priority":10,"condition":"{\"and\":[{\"or\":[{\"value\":0.5,\"comparator\":\"gte\",\"id\":\"subscription_propensity_v2\",\"type\":\"numeric\",\"store\":\"byzantium\",\"path\":\"Metadata.action\"}]},{\"or\":[{\"value\":false,\"comparator\":\"eq\",\"id\":\"subscriber\",\"type\":\"boolean\",\"store\":\"userInfo\",\"path\":\"subscriber\"}]},{\"or\":[{\"value\":1,\"comparator\":\"gt\",\"id\":\"calendarMonthSinceFirstVisit\",\"type\":\"numeric\",\"store\":\"byzantium\",\"path\":\"Metadata.attribute.calendarMonthSinceFirstVisit\"}]},{\"or\":[{\"indicator_value\":\"\",\"indicator_comparator\":\"\",\"value\":\"bloomberg.co.jp\",\"comparator\":\"nct\",\"id\":\"url\",\"type\":\"string\",\"store\":\"url\",\"path\":\"url\"}]},{\"or\":[{\"indicator_value\":\"\",\"indicator_comparator\":\"\",\"value\":\"/letters/\",\"comparator\":\"nct\",\"id\":\"url\",\"type\":\"string\",\"store\":\"url\",\"path\":\"url\"}]},{\"or\":[{\"indicator_value\":\"\",\"indicator_comparator\":\"\",\"value\":\"/press-releases/\",\"comparator\":\"nct\",\"id\":\"url\",\"type\":\"string\",\"store\":\"url\",\"path\":\"url\"}]},{\"or\":[{\"indicator_value\":\"\",\"indicator_comparator\":\"\",\"value\":\"/newsletters/\",\"comparator\":\"nct\",\"id\":\"url\",\"type\":\"string\",\"store\":\"url\",\"path\":\"url\"}]},{\"or\":[{\"indicator_value\":\"\",\"indicator_comparator\":\"\",\"value\":\"/storythreads/\",\"comparator\":\"nct\",\"id\":\"url\",\"type\":\"string\",\"store\":\"url\",\"path\":\"url\"}]},{\"or\":[{\"indicator_value\":\"\",\"indicator_comparator\":\"\",\"value\":false,\"comparator\":\"eq\",\"id\":\"registered\",\"type\":\"boolean\",\"store\":\"userInfo\",\"path\":\"registered\"}]}]}","config":"{\"rewards\":{\"recurring\":false,\"rewardType\":\"verification\",\"articleCount\":2,\"rewardDuration\":43200,\"subscriberTrial\":false,\"subscriberOnlyContentIncluded\":false},\"meter-config\":{\"type\":\"expandable\",\"color\":\"dark\",\"boldText\":\"Explore Offers\",\"meterUrl\":\"https://www.bloomberg.com/subscriptions/checkout?id=2c92a0086614a669016615eb9d965f86\",\"buttonUrl\":\"https://www.bloomberg.com/subscriptions/checkout?id=2c92a0086614a669016615eb9d965f86\",\"limitText\":\"Get unlimited access today.\",\"buttonText\":\"Claim This Offer\",\"headerText\":\"Subscribe now for uninterrupted access\",\"subHeaderText\":\"Global news that uncovers a new tomorrow, for $1.99/month. Cancel anytime.\",\"renderStrategy\":\"default\"},\"paywall-config\":{\"type\":\"banner\",\"color\":\"dark\",\"boldText\":\"Explore Offers\",\"limitText\":\"Get unlimited access today.\",\"buttonText\":\"Explore Offers\",\"headerText\":\"2,700 journalists. 120 countries. Unlimited insights.\",\"paywallUrl\":\"https://www.bloomberg.com/subscriptions/checkout?id=2c92a0086614a669016615eb9d965f86\",\"subHeaderText\":\"Global news that uncovers a new tomorrow. Cancel anytime.\",\"mobileHeaderText\":\"2,700 journalists. 120 countries. Unlimited insights. Cancel anytime.\"},\"navi-subscription\":{\"subscribeUrl\":\"https://www.bloomberg.com/subscriptions/4Kad5a9HW77vW8b\"},\"verification-wall\":{\"type\":\"banner\",\"enabled\":false,\"headerText\":\"Create an account and unlock 2 bonus articles.\",\"nextModule\":\"none\",\"subHeaderText\":\"Register to read more on Bloomberg.com\"},\"super-elastic-rules\":{\"enabled\":true,\"dailyMax\":\"3\",\"dailyMin\":\"0\",\"monthlyMax\":\"7\",\"monthlyMin\":\"1\",\"STRThreshold\":\"0.85\",\"realTimeBlocking\":true,\"weightingVersion\":\"v1\",\"aggregationVersion\":\"v1\",\"decisionTreeVersion\":\"v4\"}}","experiments":[]},{"targetId":"tbx19","priority":10,"condition":"{\"and\":[{\"or\":[{\"indicator_value\":\"\",\"indicator_comparator\":\"\",\"value\":true,\"comparator\":\"eq\",\"id\":\"registered\",\"type\":\"boolean\",\"store\":\"userInfo\",\"path\":\"registered\"}]},{\"or\":[{\"indicator_value\":\"\",\"indicator_comparator\":\"\",\"value\":false,\"comparator\":\"eq\",\"id\":\"subscriber\",\"type\":\"boolean\",\"store\":\"userInfo\",\"path\":\"subscriber\"}]}]}","config":"{\"rules\":{\"paywallTriggerCount\":1,\"meterRenderingStrategy\":\"show\"},\"meter-config\":{\"type\":\"expandable\",\"color\":\"dark\",\"boldText\":\"Explore Offer\",\"meterUrl\":\"https://www.bloomberg.com/subscriptions/checkout?id=2c92a0076c297df1016c3eb3f3237096\",\"limitText\":\"Special offer: $99 for 6 months.\",\"buttonText\":\"Claim this offer\",\"headerText\":\"Get 6 months of unlimited access for $99.\",\"subHeaderText\":\"Global news that uncovers a new tomorrow. Cancel anytime.\",\"mobileHeaderText\":\"Get 6 months of unlimited access for $99. Cancel anytime.\"},\"paywall-config\":{\"type\":\"banner\",\"color\":\"dark\",\"boldText\":\"Explore Offers\",\"limitText\":\"Special offer: $99 for 6 months.\",\"buttonText\":\"Claim This Offer\",\"headerText\":\"Get 6 months of unlimited access for $99.\",\"paywallUrl\":\"https://www.bloomberg.com/subscriptions/checkout?id=2c92a0076c297df1016c3eb3f3237096\",\"subHeaderText\":\"Global news that uncovers a new tomorrow. Cancel anytime.\",\"mobileHeaderText\":\"Get 6 months of unlimited access for $99. Cancel anytime.\"}}","experiments":[]},{"targetId":"t1pr5","priority":12,"condition":"{\"and\":[{\"or\":[{\"indicator_value\":\"\",\"indicator_comparator\":\"\",\"value\":0.9,\"comparator\":\"gte\",\"id\":\"subscription_propensity_v2\",\"type\":\"numeric\",\"store\":\"byzantium\",\"path\":\"Metadata.action\"}]},{\"or\":[{\"indicator_value\":\"\",\"indicator_comparator\":\"\",\"value\":false,\"comparator\":\"eq\",\"id\":\"subscriber\",\"type\":\"boolean\",\"store\":\"userInfo\",\"path\":\"subscriber\"}]},{\"or\":[{\"indicator_value\":\"\",\"indicator_comparator\":\"\",\"value\":false,\"comparator\":\"eq\",\"id\":\"registered\",\"type\":\"boolean\",\"store\":\"userInfo\",\"path\":\"registered\"}]},{\"or\":[{\"indicator_value\":\"\",\"indicator_comparator\":\"\",\"value\":1,\"comparator\":\"gt\",\"id\":\"calendarMonthSinceFirstVisit\",\"type\":\"numeric\",\"store\":\"byzantium\",\"path\":\"Metadata.attribute.calendarMonthSinceFirstVisit\"}]}]}","config":"{\"meter-config\":{\"type\":\"expandable\",\"color\":\"dark\",\"boldText\":\"Explore Offer\",\"meterUrl\":\"https://www.bloomberg.com/subscriptions/checkout?id=8a12801c81429f1f01814dd78a303bf0\",\"limitText\":\"Save $120 with a special offer.\",\"buttonText\":\"Claim this offer\",\"headerText\":\"Subscribe now and save $120 with our annual plan.\",\"subHeaderText\":\"Global news that uncovers a new tomorrow. Cancel anytime.\",\"mobileHeaderText\":\"Get uninterrupted access to global news and save $120 with our annual plan. Cancel anytime.\"},\"paywall-config\":{\"type\":\"banner\",\"color\":\"dark\",\"boldText\":\"Explore Offer\",\"limitText\":\"Save $120 with a special offer.\",\"buttonText\":\"Claim this offer\",\"headerText\":\"Subscribe now and save $120 with our annual plan.\",\"paywallUrl\":\"https://www.bloomberg.com/subscriptions/checkout?id=8a12801c81429f1f01814dd78a303bf0\",\"subHeaderText\":\"Global news that uncovers a new tomorrow. Cancel anytime.\",\"mobileHeaderText\":\"Get uninterrupted access to global news and save $120 with our annual plan. Cancel anytime.\"},\"super-elastic-rules\":{\"enabled\":true,\"dailyMax\":3,\"dailyMin\":0,\"monthlyMax\":7,\"monthlyMin\":1,\"STRThreshold\":null,\"realTimeBlocking\":true,\"weightingVersion\":\"v1\",\"aggregationVersion\":\"v1\",\"decisionTreeVersion\":\"v4\"}}","experiments":[]},{"targetId":"tvr9j","priority":50,"condition":"{\"or\":[{\"and\":[{\"indicator_value\":\"\",\"indicator_comparator\":\"=\",\"value\":\"https://www.bloomberg.com/graphics/covid-vaccine-tracker-global-distribution/\",\"comparator\":\"ct\",\"id\":\"url\",\"type\":\"string\",\"store\":\"url\",\"path\":\"url\"}]}]}","config":"{\"rules\":{\"paywallTriggerCount\":1,\"enableRegistrationWall\":false,\"enableVerificationWall\":true}}","experiments":[]},{"targetId":"t8uc1","priority":120,"condition":"{\"and\":[{\"or\":[{\"indicator_value\":\"\",\"indicator_comparator\":\"\",\"value\":\"GB\",\"comparator\":\"eq\",\"id\":\"geoIp\",\"type\":\"string\",\"store\":\"geo\"}]},{\"or\":[{\"indicator_value\":\"\",\"indicator_comparator\":\"\",\"value\":false,\"comparator\":\"eq\",\"id\":\"subscriber\",\"type\":\"boolean\",\"store\":\"userInfo\",\"path\":\"subscriber\"}]}]}","config":"{\"rules\":{\"paywallTriggerCount\":0,\"meterRenderingStrategy\":\"show\"},\"rewards\":{\"recurring\":false,\"rewardType\":\"verification\",\"articleCount\":1,\"rewardDuration\":43200,\"subscriberTrial\":false,\"subscriberOnlyContentIncluded\":false},\"meter-config\":{\"type\":\"expandable\",\"color\":\"dark\",\"boldText\":\"Claim today\",\"meterUrl\":\"https://www.bloomberg.com/subscriptions/uk\",\"limitText\":\"Get unlimited access today.\",\"buttonText\":\"Claim today\",\"headerText\":\"Limited time offer. Just 99p/month for 3 months.\",\"subHeaderText\":\"Get global insights, local perspectives and data-backed analysis. Cancel anytime.\",\"mobileHeaderText\":\"\"},\"paywall-config\":{\"type\":\"banner\",\"color\":\"dark\",\"boldText\":\"Claim today\",\"limitText\":\"Get unlimited access today.\",\"buttonText\":\"Claim today\",\"cancelText\":\"\",\"headerText\":\"Limited time offer. Just 99p/month for 3 months.\",\"paywallUrl\":\"https://www.bloomberg.com/subscriptions/uk\",\"subHeaderText\":\"Get global insights, local perspectives and data-backed analysis. Cancel anytime.\",\"mobileHeaderText\":\"\"},\"verification-wall\":{\"type\":\"banner\",\"enabled\":true,\"boldText\":\"Get Started\",\"limitText\":\"Register to read more.\",\"headerText\":\"Create an account and unlock 1 bonus article.\",\"nextModule\":\"none\",\"subHeaderText\":\"Register to read more on Bloomberg.com\"}}","experiments":[{"experimentId":"ekqsw","population":1,"startTime":"2022-11-16T21:00:00.000Z","endTime":"2022-11-30T23:00:00.000Z","locked":false,"buckets":[{"bucketId":"bhqd9","config":"{}"},{"bucketId":"b5r43","config":"{}"},{"bucketId":"bz8ri","config":"{\"rules\":{\"paywallTriggerCount\":0,\"meterRenderingStrategy\":\"show\"},\"rewards\":{\"recurring\":false,\"rewardType\":\"verification\",\"articleCount\":1,\"rewardDuration\":43200,\"subscriberTrial\":false,\"subscriberOnlyContentIncluded\":false},\"meter-config\":{\"type\":\"expandable\",\"color\":\"dark\",\"boldText\":\"Claim today\",\"meterUrl\":\"https://www.bloomberg.com/subscriptions/uk\",\"limitText\":\"Get unlimited access today.\",\"buttonText\":\"Claim today\",\"headerText\":\"Limited time offer. Just 99p/month for 3 months.\",\"subHeaderText\":\"Get global insights, local perspectives and data-backed analysis. Cancel anytime.\"},\"paywall-config\":{\"type\":\"banner\",\"color\":\"dark\",\"boldText\":\"Claim today\",\"limitText\":\"Get unlimited access today.\",\"buttonText\":\"Claim today\",\"headerText\":\"Limited time offer. Just 99p/month for 3 months.\",\"paywallUrl\":\"https://www.bloomberg.com/subscriptions/uk\",\"subHeaderText\":\"Get global insights, local perspectives and data-backed analysis. Cancel anytime.\"},\"verification-wall\":{\"type\":\"banner\",\"enabled\":true,\"boldText\":\"Get Started\",\"limitText\":\"Register to read more.\",\"headerText\":\"Create an account and unlock 1 bonus article.\",\"nextModule\":\"none\",\"mobileHeaderText\":\"Register to read more on Bloomberg.com\"}}"}]}]},{"targetId":"tsrfj","priority":130,"condition":"{\"or\":[{\"and\":[{\"value\":true,\"comparator\":\"eq\",\"id\":\"churnStatus\",\"type\":\"boolean\",\"store\":\"byzantium\",\"path\":\"Metadata.attribute.churnStatus\"}]}]}","config":"{\"meter-config\":{\"type\":\"expandable\",\"color\":\"dark\",\"boldText\":\"Explore Offers\",\"buttonUrl\":\"https://www.bloomberg.com/subscriptions/checkout?id=2c92a01073d12ea20173dee0b7df0e11\",\"buttonText\":\"Claim This Offer\",\"headerText\":\"Come back to unlimited access today.\",\"subHeaderText\":\"Global news that uncovers a new tomorrow, for $290/year. Cancel anytime.\",\"renderStrategy\":\"default\"},\"paywall-config\":{\"type\":\"banner\",\"color\":\"dark\",\"boldText\":\"Explore Offers\",\"buttonText\":\"Claim This Offer\",\"headerText\":\"Come back to unlimited access today.\",\"paywallUrl\":\"https://www.bloomberg.com/subscriptions/checkout?id=2c92a01073d12ea20173dee0b7df0e11\",\"subHeaderText\":\"Global news that uncovers a new tomorrow, for $290/year. Cancel anytime. \",\"mobileHeaderText\":\"\"},\"super-elastic-rules\":{\"enabled\":false,\"STRThreshold\":\".85\",\"realTimeBlocking\":true,\"weightingVersion\":\"v1\",\"aggregationVersion\":\"v1\"}}","experiments":[]},{"targetId":"t3618","priority":999,"condition":"{\"or\":[{\"and\":[{\"indicator_value\":\"\",\"indicator_comparator\":\"\",\"value\":\"winb-auto-em1\",\"comparator\":\"ct\",\"id\":\"url\",\"type\":\"string\",\"store\":\"url\",\"path\":\"url\"}]}]}","config":"{\"meter-config\":{\"type\":\"expandable\",\"color\":\"dark\",\"boldText\":\"Explore Offers\",\"buttonUrl\":\"https://www.bloomberg.com/subscriptions/checkout?id=2c92a00f74e99eb90175042d1f9b210a&in_source=winb-auto-em1\",\"buttonText\":\"Claim This Offer\",\"headerText\":\"Subscribe now for uninterrupted access. Limited time offer.\",\"subHeaderText\":\"Global news that uncovers a new tomorrow, for $199/year. Cancel anytime. \",\"renderStrategy\":\"default\"},\"paywall-config\":{\"type\":\"banner\",\"color\":\"dark\",\"boldText\":\"Explore Offers\",\"buttonText\":\"Claim This Offer\",\"headerText\":\"Subscribe now for uninterrupted access. Limited time offer.\",\"paywallUrl\":\"https://www.bloomberg.com/subscriptions/checkout?id=8a1290688180b1b0018187ff444334cf&in_source=winb-auto-em1\",\"subHeaderText\":\"Global news that uncovers a new tomorrow, for $199/year. Cancel anytime. \"},\"super-elastic-rules\":{\"enabled\":false,\"STRThreshold\":\"0.85\",\"realTimeBlocking\":false,\"weightingVersion\":\"v1\",\"aggregationVersion\":\"v1\"}}","experiments":[]},{"targetId":"td7cx","priority":999,"condition":"{\"or\":[{\"and\":[{\"indicator_value\":\"\",\"indicator_comparator\":\"\",\"value\":\"winb-auto-em2\",\"comparator\":\"ct\",\"id\":\"url\",\"type\":\"string\",\"store\":\"url\",\"path\":\"url\"}]}]}","config":"{\"meter-config\":{\"type\":\"expandable\",\"color\":\"dark\",\"boldText\":\"Explore Offers\",\"buttonUrl\":\"https://www.bloomberg.com/subscriptions/checkout?id=2c92a007749612d001749dd904ab0dd8&in_source=winb-auto-em2\",\"buttonText\":\"Claim This Offer\",\"headerText\":\"Subscribe now for uninterrupted access. Limited time offer.\",\"subHeaderText\":\"Global news that uncovers a new tomorrow, for $99/6 months. Cancel anytime. \",\"renderStrategy\":\"default\"},\"paywall-config\":{\"type\":\"banner\",\"color\":\"dark\",\"boldText\":\"Explore Offers\",\"buttonText\":\"Claim This Offer\",\"headerText\":\"Subscribe now for uninterrupted access. Limited time offer.\",\"paywallUrl\":\"https://www.bloomberg.com/subscriptions/checkout?id=8a1291128180c1a301818802755e7fdf&in_source=winb-auto-em2\",\"subHeaderText\":\"Global news that uncovers a new tomorrow, for $99/6 months. Cancel anytime. \"},\"super-elastic-rules\":{\"enabled\":false,\"STRThreshold\":\"0.85\",\"realTimeBlocking\":false,\"weightingVersion\":\"v1\",\"aggregationVersion\":\"v1\"}}","experiments":[]},{"targetId":"tdh0p","priority":1000,"condition":"{\"or\":[{\"and\":[{\"indicator_value\":\"\",\"indicator_comparator\":\"\",\"value\":\"RU\",\"comparator\":\"eq\",\"id\":\"geoIp\",\"type\":\"string\",\"store\":\"geo\"}]},{\"and\":[{\"indicator_value\":\"\",\"indicator_comparator\":\"\",\"value\":\"BY\",\"comparator\":\"eq\",\"id\":\"geoIp\",\"type\":\"string\",\"store\":\"geo\"}]},{\"and\":[{\"indicator_value\":\"\",\"indicator_comparator\":\"\",\"value\":\"UA\",\"comparator\":\"eq\",\"id\":\"geoIp\",\"type\":\"string\",\"store\":\"geo\"}]}]}","config":"{\"tout\":{\"meterRendering\":\"none\"},\"rules\":{\"isMeteredOverride\":false}}","experiments":[{"experimentId":"efp9k","population":1,"startTime":"2022-04-01T15:00:00.000Z","endTime":"2023-05-01T21:08:00.000Z","locked":false,"buckets":[{"bucketId":"bf4dc","config":"{}"},{"bucketId":"bdiim","config":"{}"},{"bucketId":"bujpk","config":"{\"rules\":{\"isMeteredOverride\":false},\"quote-rules\":{\"isMetered\":false}}"}]}]},{"targetId":"tlrc1","priority":999999,"condition":"{\"and\":[{\"or\":[{\"indicator_value\":\"\",\"indicator_comparator\":\"\",\"value\":0.5,\"comparator\":\"lte\",\"id\":\"churn_propensity\",\"type\":\"numeric\",\"store\":\"byzantium\",\"path\":\"Metadata.action\"},{\"indicator_value\":\"\",\"indicator_comparator\":\"\",\"value\":\"RU\",\"comparator\":\"nct\",\"id\":\"geoIp\",\"type\":\"string\",\"store\":\"geo\"}]},{\"or\":[{\"indicator_value\":\"\",\"indicator_comparator\":\"\",\"value\":true,\"comparator\":\"eq\",\"id\":\"subscriber\",\"type\":\"boolean\",\"store\":\"userInfo\",\"path\":\"subscriber\"}]},{\"or\":[{\"indicator_value\":\"\",\"indicator_comparator\":\"\",\"value\":\"DIGITAL\",\"comparator\":\"eq\",\"id\":\"subscriptionType\",\"type\":\"enumeration\",\"store\":\"userInfo\",\"path\":\"subscriptionType\"}]},{\"or\":[{\"indicator_value\":\"\",\"indicator_comparator\":\"\",\"value\":\"Month\",\"comparator\":\"eq\",\"id\":\"billingPeriod\",\"type\":\"enumeration\",\"store\":\"userInfo\",\"path\":\"billingPeriod\"}]},{\"or\":[{\"indicator_value\":\"\",\"indicator_comparator\":\"\",\"value\":240,\"comparator\":\"lte\",\"id\":\"daysSubscribed\",\"type\":\"numeric\",\"store\":\"userInfo\",\"path\":\"daysSubscribed\"}]},{\"or\":[{\"indicator_value\":\"\",\"indicator_comparator\":\"\",\"value\":\"BY\",\"comparator\":\"nct\",\"id\":\"geoIp\",\"type\":\"string\",\"store\":\"geo\"}]},{\"or\":[{\"indicator_value\":\"\",\"indicator_comparator\":\"\",\"value\":\"UA\",\"comparator\":\"nct\",\"id\":\"geoIp\",\"type\":\"string\",\"store\":\"geo\"}]}]}","config":"{\"upsell-offer\":{\"title\":\"Save 30% with annual billing\",\"subtitle\":\"Lock in your discounted rate.\",\"ratePlanId\":\"8a1297638180b1b601818800caf271ff\",\"toutBoldCopy\":\"Continue reading for less.\",\"toutRegularCopy\":\"Upgrade to an annual subscription and save up to $120 every year.\"}}","experiments":[]},{"targetId":"t3hjp","priority":999999,"condition":"{\"and\":[{\"or\":[{\"indicator_value\":\"\",\"indicator_comparator\":\"\",\"value\":0.5,\"comparator\":\"gt\",\"id\":\"churn_propensity\",\"type\":\"numeric\",\"store\":\"byzantium\",\"path\":\"Metadata.action\"}]},{\"or\":[{\"indicator_value\":\"\",\"indicator_comparator\":\"\",\"value\":\"DIGITAL\",\"comparator\":\"eq\",\"id\":\"subscriptionType\",\"type\":\"enumeration\",\"store\":\"userInfo\",\"path\":\"subscriptionType\"}]},{\"or\":[{\"indicator_value\":\"\",\"indicator_comparator\":\"\",\"value\":\"Month\",\"comparator\":\"eq\",\"id\":\"billingPeriod\",\"type\":\"enumeration\",\"store\":\"userInfo\",\"path\":\"billingPeriod\"}]},{\"or\":[{\"indicator_value\":\"\",\"indicator_comparator\":\"\",\"value\":true,\"comparator\":\"eq\",\"id\":\"subscriber\",\"type\":\"boolean\",\"store\":\"userInfo\",\"path\":\"subscriber\"}]},{\"or\":[{\"indicator_value\":\"\",\"indicator_comparator\":\"\",\"value\":\"RU\",\"comparator\":\"nct\",\"id\":\"geoIp\",\"type\":\"string\",\"store\":\"geo\"}]},{\"or\":[{\"indicator_value\":\"\",\"indicator_comparator\":\"\",\"value\":\"UA\",\"comparator\":\"nct\",\"id\":\"geoIp\",\"type\":\"string\",\"store\":\"geo\"}]},{\"or\":[{\"indicator_value\":\"\",\"indicator_comparator\":\"\",\"value\":\"BY\",\"comparator\":\"nct\",\"id\":\"geoIp\",\"type\":\"string\",\"store\":\"geo\"}]}]}","config":"{\"upsell-offer\":{\"title\":\"Save 30% with annual billing\",\"subtitle\":\"Lock in your discounted rate.\",\"ratePlanId\":\"8a1297638180b1b601818800caf271ff\",\"toutBoldCopy\":\"Continue reading for less.\",\"toutRegularCopy\":\"Upgrade to an annual subscription and save up to $120 every year.\"}}","experiments":[]},{"targetId":"tbvvi","priority":1000000,"condition":"{\"and\":[{\"or\":[{\"indicator_value\":\"utm_medium\",\"indicator_comparator\":\"eq\",\"value\":\"email\",\"comparator\":\"eq\",\"id\":\"queryParameters\",\"type\":\"string\",\"store\":\"url\",\"path\":\"urlUtmValues.queryParams\"}]},{\"or\":[{\"indicator_value\":\"utm_source\",\"indicator_comparator\":\"eq\",\"value\":\"subs-offer\",\"comparator\":\"eq\",\"id\":\"queryParameters\",\"type\":\"string\",\"store\":\"url\",\"path\":\"urlUtmValues.queryParams\"}]},{\"or\":[{\"indicator_value\":\"utm_campaign\",\"indicator_comparator\":\"eq\",\"value\":\"ups-99c-upsell-dollar\",\"comparator\":\"eq\",\"id\":\"queryParameters\",\"type\":\"string\",\"store\":\"url\",\"path\":\"urlUtmValues.queryParams\"},{\"indicator_value\":\"utm_campaign\",\"indicator_comparator\":\"eq\",\"value\":\"ups-1.99-upsell-percent\",\"comparator\":\"eq\",\"id\":\"queryParameters\",\"type\":\"string\",\"store\":\"url\",\"path\":\"urlUtmValues.queryParams\"},{\"indicator_value\":\"utm_campaign\",\"indicator_comparator\":\"eq\",\"value\":\"ups-fp-monthly-user-upsell-dollar\",\"comparator\":\"eq\",\"id\":\"queryParameters\",\"type\":\"string\",\"store\":\"url\",\"path\":\"urlUtmValues.queryParams\"}]},{\"or\":[{\"indicator_value\":\"utm_term\",\"indicator_comparator\":\"eq\",\"value\":\"43645\",\"comparator\":\"eq\",\"id\":\"queryParameters\",\"type\":\"string\",\"store\":\"url\",\"path\":\"urlUtmValues.queryParams\"},{\"indicator_value\":\"utm_term\",\"indicator_comparator\":\"eq\",\"value\":\"44276\",\"comparator\":\"eq\",\"id\":\"queryParameters\",\"type\":\"string\",\"store\":\"url\",\"path\":\"urlUtmValues.queryParams\"},{\"indicator_value\":\"utm_term\",\"indicator_comparator\":\"eq\",\"value\":\"44529\",\"comparator\":\"eq\",\"id\":\"queryParameters\",\"type\":\"string\",\"store\":\"url\",\"path\":\"urlUtmValues.queryParams\"},{\"indicator_value\":\"utm_term\",\"indicator_comparator\":\"eq\",\"value\":\"44555\",\"comparator\":\"eq\",\"id\":\"queryParameters\",\"type\":\"string\",\"store\":\"url\",\"path\":\"urlUtmValues.queryParams\"},{\"indicator_value\":\"utm_term\",\"indicator_comparator\":\"eq\",\"value\":\"44556\",\"comparator\":\"eq\",\"id\":\"queryParameters\",\"type\":\"string\",\"store\":\"url\",\"path\":\"urlUtmValues.queryParams\"}]},{\"or\":[{\"indicator_value\":\"utm_content\",\"indicator_comparator\":\"eq\",\"value\":\"cta-button\",\"comparator\":\"eq\",\"id\":\"queryParameters\",\"type\":\"string\",\"store\":\"url\",\"path\":\"urlUtmValues.queryParams\"},{\"indicator_value\":\"utm_content\",\"indicator_comparator\":\"eq\",\"value\":\"hero-img\",\"comparator\":\"eq\",\"id\":\"queryParameters\",\"type\":\"string\",\"store\":\"url\",\"path\":\"urlUtmValues.queryParams\"},{\"indicator_value\":\"utm_content\",\"indicator_comparator\":\"eq\",\"value\":\"chart-img\",\"comparator\":\"eq\",\"id\":\"queryParameters\",\"type\":\"string\",\"store\":\"url\",\"path\":\"urlUtmValues.queryParams\"}]}]}","config":"{\"upsell-offer\":{\"title\":\"Switch to annual and save.\",\"subtitle\":\"Upgrade to an annual subscription and save $120.\",\"ratePlanId\":\"8a1297638180b1b601818800caf271ff\"},\"upsell-offer-banner\":{\"outlet\":\"banner\",\"templateId\":313,\"Text_460_color\":\"white\",\"Text_644_color\":\"white\",\"renderStrategy\":\"on-load\",\"CloseButton_549_theme\":\"white\",\"PrimaryButton_723_label\":\"Claim my offer\",\"PrimaryButton_723_theme\":\"opinion-blue\",\"PrimaryButton_723_title\":\"Claim my offer\",\"Text_460_desktopContent\":\"Switch to annual and save.\",\"Text_644_desktopContent\":\"Upgrade to an annual subscription and save $120.\",\"CloseButton_549_modalRenderId\":313,\"PrimaryButton_723_modalRenderId\":313,\"FlexibleColumnContainer_222_color\":\"black\",\"Render_Manager_daysAfterLastShown\":1,\"Render_Manager_daysAfterLastClosed\":7,\"FlexibleColumnContainer_222_columnCount\":2}}","experiments":[]},{"targetId":"tspxd","priority":1000000,"condition":"{\"and\":[{\"or\":[{\"indicator_value\":\"utm_medium\",\"indicator_comparator\":\"eq\",\"value\":\"email\",\"comparator\":\"eq\",\"id\":\"queryParameters\",\"type\":\"string\",\"store\":\"url\",\"path\":\"urlUtmValues.queryParams\"}]},{\"or\":[{\"indicator_value\":\"utm_source\",\"indicator_comparator\":\"eq\",\"value\":\"subs-offer\",\"comparator\":\"eq\",\"id\":\"queryParameters\",\"type\":\"string\",\"store\":\"url\",\"path\":\"urlUtmValues.queryParams\"}]},{\"or\":[{\"indicator_value\":\"utm_campaign\",\"indicator_comparator\":\"eq\",\"value\":\"ups-99c-upsell-percent\",\"comparator\":\"eq\",\"id\":\"queryParameters\",\"type\":\"string\",\"store\":\"url\",\"path\":\"urlUtmValues.queryParams\"}]},{\"or\":[{\"indicator_value\":\"utm_term\",\"indicator_comparator\":\"eq\",\"value\":\"43648\",\"comparator\":\"eq\",\"id\":\"queryParameters\",\"type\":\"string\",\"store\":\"url\",\"path\":\"urlUtmValues.queryParams\"}]},{\"or\":[{\"indicator_value\":\"utm_content\",\"indicator_comparator\":\"eq\",\"value\":\"hero-img\",\"comparator\":\"eq\",\"id\":\"queryParameters\",\"type\":\"string\",\"store\":\"url\",\"path\":\"urlUtmValues.queryParams\"},{\"indicator_value\":\"utm_content\",\"indicator_comparator\":\"eq\",\"value\":\"chart-img\",\"comparator\":\"eq\",\"id\":\"queryParameters\",\"type\":\"string\",\"store\":\"url\",\"path\":\"urlUtmValues.queryParams\"},{\"indicator_value\":\"utm_content\",\"indicator_comparator\":\"eq\",\"value\":\"cta-button\",\"comparator\":\"eq\",\"id\":\"queryParameters\",\"type\":\"string\",\"store\":\"url\",\"path\":\"urlUtmValues.queryParams\"}]}]}","config":"{\"upsell-offer\":{\"title\":\"Switch to annual and save.\",\"subtitle\":\"Upgrade to an annual subscription and save 30%.\",\"ratePlanId\":\"8a1297638180b1b601818800caf271ff\"},\"upsell-offer-banner\":{\"outlet\":\"banner\",\"templateId\":313,\"Text_460_color\":\"white\",\"Text_644_color\":\"white\",\"renderStrategy\":\"on-load\",\"CloseButton_549_theme\":\"white\",\"PrimaryButton_723_label\":\"Claim my offer\",\"PrimaryButton_723_theme\":\"opinion-blue\",\"PrimaryButton_723_title\":\"Claim my offer\",\"Text_460_desktopContent\":\"Switch to annual and save.\",\"Text_644_desktopContent\":\"Upgrade to an annual subscription and save 30%.\",\"CloseButton_549_modalRenderId\":313,\"PrimaryButton_723_modalRenderId\":313,\"FlexibleColumnContainer_222_color\":\"black\",\"Render_Manager_daysAfterLastShown\":1,\"Render_Manager_daysAfterLastClosed\":7,\"FlexibleColumnContainer_222_columnCount\":2}}","experiments":[]}]; }} var _____WB$wombat$assign$function_____ = function(name) {return (self._wb_wombat && self._wb_wombat.local_init && self._wb_wombat.local_init(name)) || self[name]; }; if (!self.__WB_pmw) { self.__WB_pmw = function(obj) { this.__WB_source = obj; return this; } } { let window = _____WB$wombat$assign$function_____("window"); let self = _____WB$wombat$assign$function_____("self"); let document = _____WB$wombat$assign$function_____("document"); let location = _____WB$wombat$assign$function_____("location"); let top = _____WB$wombat$assign$function_____("top"); let parent = _____WB$wombat$assign$function_____("parent"); let frames = _____WB$wombat$assign$function_____("frames"); let opener = _____WB$wombat$assign$function_____("opener"); let arguments; {window["jvln-asset-prefix"] = "https://assets.bwbx.io/s3/javelin"; }} { "js": [ "/public/javelin/js/core_vitals/core_vitals-f1dac682b9.js", "/public/javelin/js/components/event_bus/event_bus-462b234ebc.sync.js", "/public/javelin/js/components/preact/required/preact-41b1a5add6.sync.js", "/public/javelin/js/reg-ui-client/reg-ui-client-de8fd4852c.js", "/public/javelin/js/sparkle/initialize/initialize_sparkle-c03496d88c.js", "/public/javelin/js/abba/abba-158011eb0f.js", "/public/javelin/js/foundation/transporter/foundation_transporter-ce88b020e3.js", "/public/javelin/js/foundation/OverlayAd/OverlayAd-8088e33bb8.entry.js", "/public/javelin/js/foundation/LeaderboardAd/LeaderboardAd-69cfbbb338.entry.js", "/public/javelin/js/foundation/SuperburstAd/SuperburstAd-45930d0d20.entry.js", "/public/javelin/js/byzantium/byzantium-710babd7a5.js", "/public/javelin/js/components/video_player/video_player-eb21d0ec7f.js", "/public/javelin/js/foundation/ArticleBody/ArticleBody-d58303647e.entry.js", "/public/javelin/js/analytics/geoip/geoip-7c8d29aa6e.js", "/public/javelin/js/dependencies/dependencies-ab77720231.js" ], "css": [ "/public/javelin/css/application/application-f84a6c413e.css", "/public/javelin/css/application/application-1488c77cf2.mobile-tablet.css", "/public/javelin/css/print_foundation/print-65335d1881.css", "/public/javelin/css/sparkle/initialize/initialize_sparkle-28c3bb1bed.css", "/public/javelin/css/components/skiplink/skiplink-684dc5ecd7.css", "/public/javelin/css/foundation/LeaderboardAd/LeaderboardAd-399413a06a.css", "/public/javelin/js/foundation/ArticleBody/ArticleBody-e544ef3112.entry-jsx.css", "/public/javelin/css/foundation/ArticleBody/ArticleBody-e7f41abd18.tsx.css", "/public/javelin/css/foundation/ArticleBody/AudioPlayer-ea9e346b2d.css", "/public/javelin/css/foundation/ArticleBody/BodyAds-464967946a.css", "/public/javelin/css/foundation/ArticleBody/BodyContent-743d4afb1f.css", "/public/javelin/css/foundation/ArticleBody/Charts-0c90d3fdcb.css", "/public/javelin/css/foundation/ArticleBody/LazyImage-943dc1c3c4.css", "/public/javelin/css/foundation/ArticleBody/Sizes-d41d8cd98f.css", "/public/javelin/css/foundation/ArticleBody/postr_recirc-e75d1b96c5.css", "/public/javelin/css/foundation/ArticleBody/BodyContent-c520e5e7f2.desktop.css", "/public/javelin/css/foundation/ArticleBody/Charts-ed3eb13025.desktop.css", "/public/javelin/css/foundation/ArticleBody/BodyContent-5a031c4c0f.large_desktop.css", "/public/javelin/css/foundation/ArticleBody/BodyContent-b50507ca95.mobile.css", "/public/javelin/css/foundation/ArticleBody/BodyContent-21025c68da.tablet.css" ] } var _____WB$wombat$assign$function_____ = function(name) {return (self._wb_wombat && self._wb_wombat.local_init && self._wb_wombat.local_init(name)) || self[name]; }; if (!self.__WB_pmw) { self.__WB_pmw = function(obj) { this.__WB_source = obj; return this; } } { let window = _____WB$wombat$assign$function_____("window"); let self = _____WB$wombat$assign$function_____("self"); let document = _____WB$wombat$assign$function_____("document"); let location = _____WB$wombat$assign$function_____("location"); let top = _____WB$wombat$assign$function_____("top"); let parent = _____WB$wombat$assign$function_____("parent"); let frames = _____WB$wombat$assign$function_____("frames"); let opener = _____WB$wombat$assign$function_____("opener"); let arguments; {(function(w,d,s,l,i){w[l]=w[l]||[];w[l].push({'gtm.start':new Date().getTime(),event:'gtm.js'});var f=d.getElementsByTagName(s)[0],j=d.createElement(s),dl=l!='dataLayer'?'&l='+l:'';j.defer=true;j.src='https://www.googletagmanager.com/gtm.js?id='+i+dl;f.parentNode.insertBefore(j,f);})(window,document,'script','dataLayer','GTM-MNTH5N'); }} <iframe src="https://viahtml.hypothes.is/proxy/if_/https://www.googletagmanager.com/ns.html?id=GTM-MNTH5N&nojscript=true" height="0" width="0" style="display:none;visibility:hidden"></iframe> var _____WB$wombat$assign$function_____ = function(name) {return (self._wb_wombat && self._wb_wombat.local_init && self._wb_wombat.local_init(name)) || self[name]; }; if (!self.__WB_pmw) { self.__WB_pmw = function(obj) { this.__WB_source = obj; return this; } } { let window = _____WB$wombat$assign$function_____("window"); let self = _____WB$wombat$assign$function_____("self"); let document = _____WB$wombat$assign$function_____("document"); let location = _____WB$wombat$assign$function_____("location"); let top = _____WB$wombat$assign$function_____("top"); let parent = _____WB$wombat$assign$function_____("parent"); let frames = _____WB$wombat$assign$function_____("frames"); let opener = _____WB$wombat$assign$function_____("opener"); let arguments; {(function(d){var s=d.createElement("script");s.async=true;s.src="https://www.bloomberg.com/tophat/assets/v2.6.4/that.js";s.type="text/javascript";d.head.appendChild(s);})(document); }} var _____WB$wombat$assign$function_____ = function(name) {return (self._wb_wombat && self._wb_wombat.local_init && self._wb_wombat.local_init(name)) || self[name]; }; if (!self.__WB_pmw) { self.__WB_pmw = function(obj) { this.__WB_source = obj; return this; } } { let window = _____WB$wombat$assign$function_____("window"); let self = _____WB$wombat$assign$function_____("self"); let document = _____WB$wombat$assign$function_____("document"); let location = _____WB$wombat$assign$function_____("location"); let top = _____WB$wombat$assign$function_____("top"); let parent = _____WB$wombat$assign$function_____("parent"); let frames = _____WB$wombat$assign$function_____("frames"); let opener = _____WB$wombat$assign$function_____("opener"); let arguments; {!function(){window._pxAppId="PX8FCGYgk4";var e=document.getElementsByTagName("script")[0],t=document.createElement("script");t.async=1,t.src="/8FCGYgk4/init.js",e.parentNode.insertBefore(t,e)}() }} <div style="position:fixed; top:0; left:0; display:none" width="1" height="1"> <img src="/proxy/im_/https://www.bloomberg.com/8FCGYgk4/xhr/api/v1/collector/noScript.gif?appId=PX8FCGYgk4" alt="PxPixel"> </div> var _____WB$wombat$assign$function_____ = function(name) {return (self._wb_wombat && self._wb_wombat.local_init && self._wb_wombat.local_init(name)) || self[name]; }; if (!self.__WB_pmw) { self.__WB_pmw = function(obj) { this.__WB_source = obj; return this; } } { let window = _____WB$wombat$assign$function_____("window"); let self = _____WB$wombat$assign$function_____("self"); let document = _____WB$wombat$assign$function_____("document"); let location = _____WB$wombat$assign$function_____("location"); let top = _____WB$wombat$assign$function_____("top"); let parent = _____WB$wombat$assign$function_____("parent"); let frames = _____WB$wombat$assign$function_____("frames"); let opener = _____WB$wombat$assign$function_____("opener"); let arguments; { window.__bloomberg__ = window.__bloomberg__ || {}; const bridge = new window.bridgeWebModule(); window.__bloomberg__.byzantium = new window.msByzantiumCoreModule.ByzantiumCore(bridge, { coordinatorServiceUrl: "https://coordinator.cm.bloomberg.com/coordination" }); const contentMetadataElement = document.querySelector("#article-info-QW88EUT1UM0W01"); const contentMetadata = JSON.parse(contentMetadataElement.textContent); window.__bloomberg__.byzantium.setContentMetadata(contentMetadata); window.__bloomberg__.byzantium.refreshCoordinatorServiceData().then(function() { performance.mark("fortress:byzantium-refresh"); }); }} var _____WB$wombat$assign$function_____ = function(name) {return (self._wb_wombat && self._wb_wombat.local_init && self._wb_wombat.local_init(name)) || self[name]; }; if (!self.__WB_pmw) { self.__WB_pmw = function(obj) { this.__WB_source = obj; return this; } } { let window = _____WB$wombat$assign$function_____("window"); let self = _____WB$wombat$assign$function_____("self"); let document = _____WB$wombat$assign$function_____("document"); let location = _____WB$wombat$assign$function_____("location"); let top = _____WB$wombat$assign$function_____("top"); let parent = _____WB$wombat$assign$function_____("parent"); let frames = _____WB$wombat$assign$function_____("frames"); let opener = _____WB$wombat$assign$function_____("opener"); let arguments; {!function(e,c,n){function t(n,t){t.forEach(function(t){!function(n,t){if(e.matchMedia(n).matches){var i=c.createElement("script");i.src=t,i.type="text/javascript",i.async=!0,c.body.appendChild(i)}}(n,t)})}e[n]?e[n].injectScriptsForMedia=t:e[n]={injectScriptsForMedia:t}}(window,document,"jvln-dependencies"); }} var _____WB$wombat$assign$function_____ = function(name) {return (self._wb_wombat && self._wb_wombat.local_init && self._wb_wombat.local_init(name)) || self[name]; }; if (!self.__WB_pmw) { self.__WB_pmw = function(obj) { this.__WB_source = obj; return this; } } { let window = _____WB$wombat$assign$function_____("window"); let self = _____WB$wombat$assign$function_____("self"); let document = _____WB$wombat$assign$function_____("document"); let location = _____WB$wombat$assign$function_____("location"); let top = _____WB$wombat$assign$function_____("top"); let parent = _____WB$wombat$assign$function_____("parent"); let frames = _____WB$wombat$assign$function_____("frames"); let opener = _____WB$wombat$assign$function_____("opener"); let arguments; {window["jvln-dependencies"].injectScriptsForMedia("all", [ "https://assets.bwbx.io/s3/javelin/public/javelin/js/core_vitals/core_vitals-f1dac682b9.js", "https://assets.bwbx.io/s3/javelin/public/javelin/js/reg-ui-client/reg-ui-client-de8fd4852c.js", "https://assets.bwbx.io/s3/javelin/public/javelin/js/sparkle/initialize/initialize_sparkle-c03496d88c.js", "https://assets.bwbx.io/s3/javelin/public/javelin/js/abba/abba-158011eb0f.js", "https://assets.bwbx.io/s3/javelin/public/javelin/js/foundation/transporter/foundation_transporter-ce88b020e3.js", "https://assets.bwbx.io/s3/javelin/public/javelin/js/foundation/OverlayAd/OverlayAd-8088e33bb8.entry.js", "https://assets.bwbx.io/s3/javelin/public/javelin/js/foundation/LeaderboardAd/LeaderboardAd-69cfbbb338.entry.js", "https://assets.bwbx.io/s3/javelin/public/javelin/js/foundation/SuperburstAd/SuperburstAd-45930d0d20.entry.js", "https://assets.bwbx.io/s3/javelin/public/javelin/js/byzantium/byzantium-710babd7a5.js", "https://assets.bwbx.io/s3/javelin/public/javelin/js/components/video_player/video_player-eb21d0ec7f.js", "https://assets.bwbx.io/s3/javelin/public/javelin/js/foundation/ArticleBody/ArticleBody-d58303647e.entry.js", "https://assets.bwbx.io/s3/javelin/public/javelin/js/analytics/geoip/geoip-7c8d29aa6e.js", "https://assets.bwbx.io/s3/javelin/public/javelin/js/dependencies/dependencies-ab77720231.js" ]); }} var _____WB$wombat$assign$function_____ = function(name) {return (self._wb_wombat && self._wb_wombat.local_init && self._wb_wombat.local_init(name)) || self[name]; }; if (!self.__WB_pmw) { self.__WB_pmw = function(obj) { this.__WB_source = obj; return this; } } { let window = _____WB$wombat$assign$function_____("window"); let self = _____WB$wombat$assign$function_____("self"); let document = _____WB$wombat$assign$function_____("document"); let location = _____WB$wombat$assign$function_____("location"); let top = _____WB$wombat$assign$function_____("top"); let parent = _____WB$wombat$assign$function_____("parent"); let frames = _____WB$wombat$assign$function_____("frames"); let opener = _____WB$wombat$assign$function_____("opener"); let arguments; { (function(w, n) { w[n] = w[n] || {}; w[n].cmd = w[n].cmd || []; })(window, "PlugClient"); }} var _____WB$wombat$assign$function_____ = function(name) {return (self._wb_wombat && self._wb_wombat.local_init && self._wb_wombat.local_init(name)) || self[name]; }; if (!self.__WB_pmw) { self.__WB_pmw = function(obj) { this.__WB_source = obj; return this; } } { let window = _____WB$wombat$assign$function_____("window"); let self = _____WB$wombat$assign$function_____("self"); let document = _____WB$wombat$assign$function_____("document"); let location = _____WB$wombat$assign$function_____("location"); let top = _____WB$wombat$assign$function_____("top"); let parent = _____WB$wombat$assign$function_____("parent"); let frames = _____WB$wombat$assign$function_____("frames"); let opener = _____WB$wombat$assign$function_____("opener"); { (function(){window.__piiRedact=window.__piiRedact||!1;var k=function(f){var c=[{name:"EMAIL",regex:/[^\/]{4}(@|%40)(?!example\.com)[^\/]{4}/gi,group:""},{name:"SELF-EMAIL",regex:/[^\/]{4}(@|%40)(?=example\.com)[^\/]{4}/gi,group:""},{name:"TEL",regex:/((tel=)|(telephone=)|(phone=)|(mobile=)|(mob=))[\d\+\s][^&\/\?]+/gi,group:"$1"},{name:"NAME",regex:/((firstname=)|(lastname=)|(surname=))[^&\/\?]+/gi,group:"$1"},{name:"PASSWORD",regex:/((password=)|(passwd=)|(pass=))[^&\/\?]+/gi,group:"$1"},{name:"ZIP", regex:/((postcode=)|(zipcode=)|(zip=))[^&\/\?]+/gi,group:"$1"}],d=function(a){return(a||document.location.search).replace(/(^\?)/,"").split("\x26").map(function(b){return b=b.split("\x3d"),_____WB$wombat$check$this$function_____(this)[b[0]]=decodeURIComponent(b[1]),_____WB$wombat$check$this$function_____(this)}.bind({}))[0]},h=function(a){return Object.keys(a).map(function(b){return b+"\x3d"+encodeURIComponent(a[b])}).join("\x26")},e=d(f),g;for(g in e)c.forEach(function(a){e[g].match(a.regex)&&(e[g]=e[g].replace(a.regex,a.group+"[REDACTED "+a.name+"]"))});return h(e)};if(!window.__piiRedact){window.__piiRedact= !0;try{var l=window.navigator.sendBeacon;window.navigator.sendBeacon=function(){if(arguments&&arguments[0].match(/google-analytics\.com.*v=2&/)){var f=arguments[0].split("?")[0],c=arguments[0].split("?")[1];c=k(c);var d=[];arguments[1]&&arguments[1].split("\r\n").forEach(function(h){d.push(k(h))});arguments[0]=[f,c].join("?");arguments[1]&&0<d.length&&d.join("\r\n")}return l.apply(this,arguments)}}catch(f){return l.apply(this,arguments)}}})(); }}function getIP(a){dataLayer.push({event:"ipEvent",ipAddress:a.ip})}; var _____WB$wombat$assign$function_____ = function(name) {return (self._wb_wombat && self._wb_wombat.local_init && self._wb_wombat.local_init(name)) || self[name]; }; if (!self.__WB_pmw) { self.__WB_pmw = function(obj) { this.__WB_source = obj; return this; } } { let window = _____WB$wombat$assign$function_____("window"); let self = _____WB$wombat$assign$function_____("self"); let document = _____WB$wombat$assign$function_____("document"); let location = _____WB$wombat$assign$function_____("location"); let top = _____WB$wombat$assign$function_____("top"); let parent = _____WB$wombat$assign$function_____("parent"); let frames = _____WB$wombat$assign$function_____("frames"); let opener = _____WB$wombat$assign$function_____("opener"); { (function(){var b=/US~US/.test(google_tag_manager["GTM-MNTH5N"].macro(29))?"https://cdn.brandmetrics.com/tag/002bd45403b64f0698cb2579a9094574/US.js":/US~CA/.test(google_tag_manager["GTM-MNTH5N"].macro(30))?"https://cdn.brandmetrics.com/tag/002bd45403b64f0698cb2579a9094574/CAN.js":/Asia~/.test(google_tag_manager["GTM-MNTH5N"].macro(31))?"https://cdn.brandmetrics.com/tag/002bd45403b64f0698cb2579a9094574/APAC.js":/(Europe|Africa|Middleeast)~/.test(google_tag_manager["GTM-MNTH5N"].macro(32))?"https://cdn.brandmetrics.com/tag/002bd45403b64f0698cb2579a9094574/EMEA.js":"https://cdn.brandmetrics.com/tag/002bd45403b64f0698cb2579a9094574/ROW.js"; if(google_tag_manager["GTM-MNTH5N"].macro(33)){var a=document.createElement("script");a.async=1;a.setAttribute("src",b);document.head.appendChild(a)}})(); }}var _____WB$wombat$assign$function_____ = function(name) {return (self._wb_wombat && self._wb_wombat.local_init && self._wb_wombat.local_init(name)) || self[name]; }; if (!self.__WB_pmw) { self.__WB_pmw = function(obj) { this.__WB_source = obj; return this; } } { let window = _____WB$wombat$assign$function_____("window"); let self = _____WB$wombat$assign$function_____("self"); let document = _____WB$wombat$assign$function_____("document"); let location = _____WB$wombat$assign$function_____("location"); let top = _____WB$wombat$assign$function_____("top"); let parent = _____WB$wombat$assign$function_____("parent"); let frames = _____WB$wombat$assign$function_____("frames"); let opener = _____WB$wombat$assign$function_____("opener"); { (function(a){var b=a.body;a=a.createElement("div");a.innerHTML='\x3cspan id\x3d"parsely-cfg" data-parsely-site\x3d"bloomberg.com"\x3e\x3c/span\x3e';a.id="parsely-root";a.style.display="none";b.appendChild(a)})(document); (function(a,b,d){var e=d.location.protocol,f=b+"-"+a,c=d.getElementById(f),g=d.getElementById(b+"-root");b="https:"===e?"d1z2jf7jlzjs58.cloudfront.net":"static."+b+".com";c||(c=d.createElement(a),c.id=f,c.async=!0,c.src=e+"//"+b+"/p.js",g.appendChild(c))})("script","parsely",document); }}var _____WB$wombat$assign$function_____ = function(name) {return (self._wb_wombat && self._wb_wombat.local_init && self._wb_wombat.local_init(name)) || self[name]; }; if (!self.__WB_pmw) { self.__WB_pmw = function(obj) { this.__WB_source = obj; return this; } } { let window = _____WB$wombat$assign$function_____("window"); let self = _____WB$wombat$assign$function_____("self"); let document = _____WB$wombat$assign$function_____("document"); let location = _____WB$wombat$assign$function_____("location"); let top = _____WB$wombat$assign$function_____("top"); let parent = _____WB$wombat$assign$function_____("parent"); let frames = _____WB$wombat$assign$function_____("frames"); let opener = _____WB$wombat$assign$function_____("opener"); { (function(){window._pxParam3="true"===google_tag_manager["GTM-MNTH5N"].macro(60)?1:0;window._pxParam4="logged_in"===google_tag_manager["GTM-MNTH5N"].macro(61)?1:0;window._pxParam6=google_tag_manager["GTM-MNTH5N"].macro(62);if(!window._pxAppId){window._pxAppId="PX8FCGYgk4";var b=document.getElementsByTagName("script")[0],a=document.createElement("script");a.async=1;a.src="/8FCGYgk4/init.js";b.parentNode.insertBefore(a,b)}})(); }} <div style="position:fixed; top:0; left:0; display:none" width="1" height="1"> <img src="/proxy/im_/https://www.bloomberg.com/8FCGYgk4/xhr/api/v1/collector/noScript.gif?appId=PX8FCGYgk4" alt="PxPixel"> </div> var _____WB$wombat$assign$function_____ = function(name) {return (self._wb_wombat && self._wb_wombat.local_init && self._wb_wombat.local_init(name)) || self[name]; }; if (!self.__WB_pmw) { self.__WB_pmw = function(obj) { this.__WB_source = obj; return this; } } { let window = _____WB$wombat$assign$function_____("window"); let self = _____WB$wombat$assign$function_____("self"); let document = _____WB$wombat$assign$function_____("document"); let location = _____WB$wombat$assign$function_____("location"); let top = _____WB$wombat$assign$function_____("top"); let parent = _____WB$wombat$assign$function_____("parent"); let frames = _____WB$wombat$assign$function_____("frames"); let opener = _____WB$wombat$assign$function_____("opener"); { (function(){var a="12098",d="ksg",c="lotame_"+a+"_auds";window.googletag=window.googletag||{};window.googletag.cmd=window.googletag.cmd||[];try{var e=window.localStorage.getItem(c)||"";e&&googletag.cmd.push(function(){window.googletag.pubads().setTargeting(d,e.split(","))})}catch(f){}var b=function(f){var g=f.getAudiences()||[];googletag.cmd.push(function(){window.googletag.pubads().setTargeting(d,g)})};b={clientId:Number(a),audienceLocalStorage:c,onProfileReady:b};c={behaviors:{"int":"dataLayer : brand : markets;dataLayer : contentType : content-archived;dataLayer : pageType : content;dataLayer : refresh : false;dataLayer : topic : Capital Partners;dataLayer : transporter : false".split(";")}, thirdParty:{namespace:"BLPI",value:"undefined"}};b=b||{};a=window["lotame_"+a]={};a.config=b;a.data=c||{};a.cmd=a.cmd||[]})(); }} var _____WB$wombat$assign$function_____ = function(name) {return (self._wb_wombat && self._wb_wombat.local_init && self._wb_wombat.local_init(name)) || self[name]; }; if (!self.__WB_pmw) { self.__WB_pmw = function(obj) { this.__WB_source = obj; return this; } } { let window = _____WB$wombat$assign$function_____("window"); let self = _____WB$wombat$assign$function_____("self"); let document = _____WB$wombat$assign$function_____("document"); let location = _____WB$wombat$assign$function_____("location"); let top = _____WB$wombat$assign$function_____("top"); let parent = _____WB$wombat$assign$function_____("parent"); let frames = _____WB$wombat$assign$function_____("frames"); let opener = _____WB$wombat$assign$function_____("opener"); { (function(){var m="https://tracking.bloomberg.com/psz/pixel.gif",n="Author Bond City Classification Commodity Company Country Currency Dataarticle Event External Feature Fund Index Interactive Location Newsletter Organization Person Quicktake Region Section Series Slideshow Storythread Story Topic Tracker Video".split(" "),p={author:"Author",article:"Story",breaking_news:"Story",data_article:"Dataarticle",feature:"Feature",interactive:"Interactive",quicktake:"Quicktake",slideshow:"Slideshow",tracker:"Tracker", video:"Video"},q={extend:function(){var c=[].slice.call(arguments),a=c.shift();return[].reduce.call(c,function(b,d){for(var e in d)b[e]=d[e];return b},a)}},g=function(c,a){return function(b){if(window[c])b(window[c]);else{var d=function(e){window.removeEventListener(a,d);b(e.detail)};window.addEventListener(a,d)}}},r=g("_geoIpInfo","geo-ip-ready"),t=g("_regUserInfo","reg-user-info-ready"),u=function(c){return Object.keys(c).filter(function(a){a=c[a];return!(void 0===a||null===a||""===a)}).map(function(a){var b= encodeURIComponent(a);a=encodeURIComponent(c[a]);return b+"\x3d"+a}).join("\x26")},v=function(c,a){var b=new Image;b.src=c+"?"+u(a);b.onload=function(){b=null}},w=function(c,a){a.blocked="false";a.timezoneOffset=6E4*(new Date).getTimezoneOffset();r(function(b){a.bb_country=b.country;a.region=b.region;t(function(d){a.session_id=d.sessionId;a.session_key=d.sessionKey;a.agent_id=d.agentId;a.breg=d.userId;v(c,a)})})};g=function(c,a,b,d,e){if(!b||0>n.indexOf(a))throw Error("Invalid resource");var h=a+ "|"+b;try{var k=window.localStorage,x=k.getItem(h);k.removeItem(h);var f=JSON.parse(x);"string"===typeof f&&(f=JSON.parse(f));var l="object"===typeof f?f:{}}catch(y){l={}}q.extend(e,l,{site:c,referrer:d.replace(/&/g,"---"),resourceType:a,resourceId:b});w(m,e)};g(google_tag_manager["GTM-MNTH5N"].macro(63),p[google_tag_manager["GTM-MNTH5N"].macro(64)]||google_tag_manager["GTM-MNTH5N"].macro(65),google_tag_manager["GTM-MNTH5N"].macro(66),google_tag_manager["GTM-MNTH5N"].macro(67),{resourceSubType:google_tag_manager["GTM-MNTH5N"].macro(68),interactionType:"VIEW",exp_pref:google_tag_manager["GTM-MNTH5N"].macro(69)})})(); }} var _____WB$wombat$assign$function_____ = function(name) {return (self._wb_wombat && self._wb_wombat.local_init && self._wb_wombat.local_init(name)) || self[name]; }; if (!self.__WB_pmw) { self.__WB_pmw = function(obj) { this.__WB_source = obj; return this; } } { let window = _____WB$wombat$assign$function_____("window"); let self = _____WB$wombat$assign$function_____("self"); let document = _____WB$wombat$assign$function_____("document"); let location = _____WB$wombat$assign$function_____("location"); let top = _____WB$wombat$assign$function_____("top"); let parent = _____WB$wombat$assign$function_____("parent"); let frames = _____WB$wombat$assign$function_____("frames"); let opener = _____WB$wombat$assign$function_____("opener"); { function udm_(c){var k="comScore\x3d",a=document,b=a.cookie,r="",t="indexOf",l="substring",w="length",x=2048,m,n="\x26ns_",p="\x26",d,e=window,u=e.encodeURIComponent||escape;if(b[t](k)+1){var f=0;b=b.split(";");for(d=b[w];f<d;f++){var g=b[f][t](k);g+1&&(r=p+unescape(b[f][l](g+k[w])))}}c+=n+"_t\x3d"+ +new Date+n+"c\x3d"+(a.characterSet||a.defaultCharset||"")+r;c[w]>x&&0<c[t](p)&&(m=c[l](0,x-8).lastIndexOf(p),c=(c[l](0,m)+n+"cut\x3d"+u(c[l](m+1)))[l](0,x));a.images?(g=new Image,e.ns_p||(ns_p=g),g.src= c):a.write("\x3c","p","\x3e\x3c",'img src\x3d"',c,'" height\x3d"1" width\x3d"1" alt\x3d"*"',"\x3e\x3c","/p","\x3e")}"undefined"==typeof _comscore&&(_comscore=[]); (function(){var c="length",k=self,a=k.encodeURIComponent?encodeURIComponent:escape,b=".scorecardresearch.com",r="//app"+b+"/s2e/invite",t=Math,l="script",w="width",x=/c2=(\d*)&/,m,n=function(d){if(d){var e=[];var u=0,f="";for(h in d){var g=typeof d[h];if("string"==g||"number"==g)e[e[c]]=h+"\x3d"+a(d[h]),"c2"==h?f=d[h]:"c1"==h&&(u=1)}if(!(0>=e[c]||""==f)){var v=d.options||{};v.d=v.d||document;if("string"==typeof v.url_append){d=v.url_append.replace(/&/,"\x26").split("\x26");var h=0;for(g=d[c];h<g;h++)f= d[h].split("\x3d"),2==f[c]&&(e[e[c]]=f[0]+"\x3d"+a(f[1]))}e=["http","s"==v.d.URL.charAt(4)?"s://sb":"://b",b,"/b?",u?"":"c1\x3d2\x26",e.join("\x26").replace(/&$/,"")];udm_(e.join(""),function(){var q=v;if(!(0>this.src.indexOf("c1\x3d2"))&&q.d.createElement&&(q.force_script_extension||2==_____WB$wombat$check$this$function_____(this)[w]&&this.height>t.round(100*t.random()))){var y=q.d.createElement(l),z=q.d.getElementsByTagName(l)[0];q=[q.script_extension_url||r,"?c2\x3d",this.src.match(x)[1]].join("");z&&(y.src=q,y.async=!0,z.parentNode.insertBefore(y, z))}})}}},p=function(d){d=d||_comscore;for(var e=0,u=d[c];e<u;e++)n(d[e]);_comscore=[]};p();(m=k.COMSCORE)?(m.purge=p,m.beacon=n):COMSCORE={purge:p,beacon:n}})(); (function(){function c(b,r){for(b=b.toString();b.length<r;)b="0"+b;return b}function k(){var b=new Date;return b.getFullYear()+"-"+c(b.getMonth(),2)+"-"+c(b.getDate(),2)+" "+c(b.getHours(),2)+":"+c(b.getMinutes(),2)+":"+c(b.getSeconds(),2)}var a={name:google_tag_manager["GTM-MNTH5N"].macro(70),bb_localhour:k(),bb_c_type:google_tag_manager["GTM-MNTH5N"].macro(71),bb_cg_3:window.document.title,bb_brand:google_tag_manager["GTM-MNTH5N"].macro(72)||google_tag_manager["GTM-MNTH5N"].macro(73),bb_screensize:window.screen.availWidth+"x"+window.screen.availHeight,bb_viewport:window.innerWidth+ "x"+window.innerHeight,bb_focus:google_tag_manager["GTM-MNTH5N"].macro(74),bb_refresh:"true"===google_tag_manager["GTM-MNTH5N"].macro(75)?"1":"0",bb_region:google_tag_manager["GTM-MNTH5N"].macro(76)||"US",bb_exp:google_tag_manager["GTM-MNTH5N"].macro(77)||"AMER",c1:2,c2:"3005059",c7:window.document.URL,c8:window.document.title,c9:"",bb_userid:google_tag_manager["GTM-MNTH5N"].macro(78),ns_site:google_tag_manager["GTM-MNTH5N"].macro(81)};google_tag_manager["GTM-MNTH5N"].macro(82)&&(a.bb_cg_2=google_tag_manager["GTM-MNTH5N"].macro(83));google_tag_manager["GTM-MNTH5N"].macro(84)&&(a.bb_groupid=google_tag_manager["GTM-MNTH5N"].macro(85),a.bb_attributor=google_tag_manager["GTM-MNTH5N"].macro(86), a.bb_author=google_tag_manager["GTM-MNTH5N"].macro(87),a.bb_pub_d=google_tag_manager["GTM-MNTH5N"].macro(88),a.bb_cg_3=google_tag_manager["GTM-MNTH5N"].macro(89),a.bb_transporter="true"===google_tag_manager["GTM-MNTH5N"].macro(90)?"1":"0",a.bb_slug=google_tag_manager["GTM-MNTH5N"].macro(91),a.bb_topic1=google_tag_manager["GTM-MNTH5N"].macro(92),a.bb_topic2=google_tag_manager["GTM-MNTH5N"].macro(93),a.bb_people=google_tag_manager["GTM-MNTH5N"].macro(94),a.bb_category=google_tag_manager["GTM-MNTH5N"].macro(95),a.legacy_bb_contentage=google_tag_manager["GTM-MNTH5N"].macro(98),google_tag_manager["GTM-MNTH5N"].macro(99)&&(a.bb_topic_opinion=google_tag_manager["GTM-MNTH5N"].macro(100)));COMSCORE.beacon(a)})(); }} var _____WB$wombat$assign$function_____ = function(name) {return (self._wb_wombat && self._wb_wombat.local_init && self._wb_wombat.local_init(name)) || self[name]; }; if (!self.__WB_pmw) { self.__WB_pmw = function(obj) { this.__WB_source = obj; return this; } } { let window = _____WB$wombat$assign$function_____("window"); let self = _____WB$wombat$assign$function_____("self"); let document = _____WB$wombat$assign$function_____("document"); let location = _____WB$wombat$assign$function_____("location"); let top = _____WB$wombat$assign$function_____("top"); let parent = _____WB$wombat$assign$function_____("parent"); let frames = _____WB$wombat$assign$function_____("frames"); let opener = _____WB$wombat$assign$function_____("opener"); { !function(d,e,f,a,b,c){d.qp||(a=d.qp=function(){a.qp?a.qp.apply(a,arguments):a.queue.push(arguments)},a.queue=[],b=document.createElement(e),b.async=!0,b.src=f,c=document.getElementsByTagName(e)[0],c.parentNode.insertBefore(b,c))}(window,"script","https://a.quora.com/qevents.js");qp("init","7f95fe1a74cb492e8656a1e2ab719ad4");qp("track","ViewContent"); }} <img height="1" width="1" style="display:none" src="https://viahtml.hypothes.is/proxy/im_/https://q.quora.com/_/ad/7f95fe1a74cb492e8656a1e2ab719ad4/pixel?tag=ViewContent&noscript=1" alt=""> var _____WB$wombat$assign$function_____ = function(name) {return (self._wb_wombat && self._wb_wombat.local_init && self._wb_wombat.local_init(name)) || self[name]; }; if (!self.__WB_pmw) { self.__WB_pmw = function(obj) { this.__WB_source = obj; return this; } } { let window = _____WB$wombat$assign$function_____("window"); let self = _____WB$wombat$assign$function_____("self"); let document = _____WB$wombat$assign$function_____("document"); let location = _____WB$wombat$assign$function_____("location"); let top = _____WB$wombat$assign$function_____("top"); let parent = _____WB$wombat$assign$function_____("parent"); let frames = _____WB$wombat$assign$function_____("frames"); let opener = _____WB$wombat$assign$function_____("opener"); { !function(b,e,f,g,a,c,d){b.fbq||(a=b.fbq=function(){a.callMethod?a.callMethod.apply(a,arguments):a.queue.push(arguments)},b._fbq||(b._fbq=a),a.push=a,a.loaded=!0,a.version="2.0",a.queue=[],c=e.createElement(f),c.async=!0,c.src=g,d=e.getElementsByTagName(f)[0],d.parentNode.insertBefore(c,d))}(window,document,"script","https://connect.facebook.net/en_US/fbevents.js");fbq("init","227995338998622");fbq("trackSingle","227995338998622","PageView"); }} <img height="1" width="1" style="display:none" src="https://viahtml.hypothes.is/proxy/im_/https://www.facebook.com/tr?id=227995338998622&ev=PageView&noscript=1" alt=""> var _____WB$wombat$assign$function_____ = function(name) {return (self._wb_wombat && self._wb_wombat.local_init && self._wb_wombat.local_init(name)) || self[name]; }; if (!self.__WB_pmw) { self.__WB_pmw = function(obj) { this.__WB_source = obj; return this; } } { let window = _____WB$wombat$assign$function_____("window"); let self = _____WB$wombat$assign$function_____("self"); let document = _____WB$wombat$assign$function_____("document"); let location = _____WB$wombat$assign$function_____("location"); let top = _____WB$wombat$assign$function_____("top"); let parent = _____WB$wombat$assign$function_____("parent"); let frames = _____WB$wombat$assign$function_____("frames"); let opener = _____WB$wombat$assign$function_____("opener"); { !function(d,e,f,a,b,c){d.twq||(a=d.twq=function(){a.exe?a.exe.apply(a,arguments):a.queue.push(arguments)},a.version="1.1",a.queue=[],b=e.createElement(f),b.async=!0,b.src="//static.ads-twitter.com/uwt.js",c=e.getElementsByTagName(f)[0],c.parentNode.insertBefore(b,c))}(window,document,"script");twq("init","nzex3");twq("track","PageView"); }} var _____WB$wombat$assign$function_____ = function(name) {return (self._wb_wombat && self._wb_wombat.local_init && self._wb_wombat.local_init(name)) || self[name]; }; if (!self.__WB_pmw) { self.__WB_pmw = function(obj) { this.__WB_source = obj; return this; } } { let window = _____WB$wombat$assign$function_____("window"); let self = _____WB$wombat$assign$function_____("self"); let document = _____WB$wombat$assign$function_____("document"); let location = _____WB$wombat$assign$function_____("location"); let top = _____WB$wombat$assign$function_____("top"); let parent = _____WB$wombat$assign$function_____("parent"); let frames = _____WB$wombat$assign$function_____("frames"); let opener = _____WB$wombat$assign$function_____("opener"); { (function(c,d,f,g,e){c[e]=c[e]||[];var h=function(){var b={ti:"5820275"};b.q=c[e];c[e]=new UET(b);c[e].push("pageLoad")};var a=d.createElement(f);a.src=g;a.async=1;a.onload=a.onreadystatechange=function(){var b=this.readyState;b&&"loaded"!==b&&"complete"!==b||(h(),a.onload=a.onreadystatechange=null)};d=d.getElementsByTagName(f)[0];d.parentNode.insertBefore(a,d)})(window,document,"script","//bat.bing.com/bat.js","uetq"); }}var _____WB$wombat$assign$function_____ = function(name) {return (self._wb_wombat && self._wb_wombat.local_init && self._wb_wombat.local_init(name)) || self[name]; }; if (!self.__WB_pmw) { self.__WB_pmw = function(obj) { this.__WB_source = obj; return this; } } { let window = _____WB$wombat$assign$function_____("window"); let self = _____WB$wombat$assign$function_____("self"); let document = _____WB$wombat$assign$function_____("document"); let location = _____WB$wombat$assign$function_____("location"); let top = _____WB$wombat$assign$function_____("top"); let parent = _____WB$wombat$assign$function_____("parent"); let frames = _____WB$wombat$assign$function_____("frames"); let opener = _____WB$wombat$assign$function_____("opener"); { var DATALAYER_OBJECT_NAME="dataLayer",referrerOverride=function(d){var c=window[DATALAYER_OBJECT_NAME]||[];c.push({event:"optimizely-referrer-override","optimizely-referrer":d})},sendCampaignData=function(d,c,f,h,g,k,b,a,e){optimizely&&"function"===typeof optimizely.get&&(h=optimizely.get("data")&&optimizely.get("data").campaigns[c]&&optimizely.get("data").campaigns[c].integrationSettings&&optimizely.get("data").campaigns[c].integrationSettings.google_universal_analytics&&optimizely.get("data").campaigns[c].integrationSettings.google_universal_analytics.universal_analytics_slot)&& (d=d?d+"("+c+")":c,f=f.join(","),g=g?g+"("+k+")":f+"("+k+")",b=b?b+"("+a+")":a,e=e?"holdback":"treatment",e=[d,g,b,e].join(":"),b=window[DATALAYER_OBJECT_NAME]||[],b.push({event:"campaign-decided","optimizely-dimension-value":e,"optimizely-dimension-number":h}))},initNewOptimizelyIntegration=function(d,c){var f=!1,h=function(b){var a=window.optimizely.get&&window.optimizely.get("state"),e=a.getRedirectInfo()&&a.getRedirectInfo().referrer;!f&&e&&(d(e),f=!0);a=a.getCampaignStates({isActive:!0});a=a[b]; e=a.campaignName;if(0<a.audiences.length){var m=a.audiences.map(function(l){return l.name});var n=a.audiences.map(function(l){return l.id})}else m=["everyone_else"],n=[0];var p=a.experiment.name,q=a.experiment.id,r=a.variation.name,t=a.variation.id;c(e,b,m,n,p,q,r,t,a.isInCampaignHoldback)},g=function(){window.optimizely=window.optimizely||[];window.optimizely.push({type:"addListener",filter:{type:"lifecycle",name:"campaignDecided"},handler:function(b){b=b.data.campaign.id;h(b)}})},k=function(){var b= window.optimizely.get&&window.optimizely.get("state");if(b){b=b.getCampaignStates({isActive:!0});for(var a in b)h(a)}};k();g()},initOptimizelyIntegration=function(d,c){window.optimizely&&"function"===typeof window.optimizely.get&&initNewOptimizelyIntegration(d,c)};initOptimizelyIntegration(referrerOverride,sendCampaignData); }}var _____WB$wombat$assign$function_____ = function(name) {return (self._wb_wombat && self._wb_wombat.local_init && self._wb_wombat.local_init(name)) || self[name]; }; if (!self.__WB_pmw) { self.__WB_pmw = function(obj) { this.__WB_source = obj; return this; } } { let window = _____WB$wombat$assign$function_____("window"); let self = _____WB$wombat$assign$function_____("self"); let document = _____WB$wombat$assign$function_____("document"); let location = _____WB$wombat$assign$function_____("location"); let top = _____WB$wombat$assign$function_____("top"); let parent = _____WB$wombat$assign$function_____("parent"); let frames = _____WB$wombat$assign$function_____("frames"); let opener = _____WB$wombat$assign$function_____("opener"); { _linkedin_partner_id="403593";window._linkedin_data_partner_ids=window._linkedin_data_partner_ids||[];window._linkedin_data_partner_ids.push(_linkedin_partner_id); }}var _____WB$wombat$assign$function_____ = function(name) {return (self._wb_wombat && self._wb_wombat.local_init && self._wb_wombat.local_init(name)) || self[name]; }; if (!self.__WB_pmw) { self.__WB_pmw = function(obj) { this.__WB_source = obj; return this; } } { let window = _____WB$wombat$assign$function_____("window"); let self = _____WB$wombat$assign$function_____("self"); let document = _____WB$wombat$assign$function_____("document"); let location = _____WB$wombat$assign$function_____("location"); let top = _____WB$wombat$assign$function_____("top"); let parent = _____WB$wombat$assign$function_____("parent"); let frames = _____WB$wombat$assign$function_____("frames"); let opener = _____WB$wombat$assign$function_____("opener"); { (function(){var b=document.getElementsByTagName("script")[0],a=document.createElement("script");a.type="text/javascript";a.async=!0;a.src="https://snap.licdn.com/li.lms-analytics/insight.min.js";b.parentNode.insertBefore(a,b)})(); }} <img height="1" width="1" style="display:none;" alt="" src="https://viahtml.hypothes.is/proxy/im_/https://dc.ads.linkedin.com/collect/?pid=403593&fmt=gif"> var _____WB$wombat$assign$function_____ = function(name) {return (self._wb_wombat && self._wb_wombat.local_init && self._wb_wombat.local_init(name)) || self[name]; }; if (!self.__WB_pmw) { self.__WB_pmw = function(obj) { this.__WB_source = obj; return this; } } { let window = _____WB$wombat$assign$function_____("window"); let self = _____WB$wombat$assign$function_____("self"); let document = _____WB$wombat$assign$function_____("document"); let location = _____WB$wombat$assign$function_____("location"); let top = _____WB$wombat$assign$function_____("top"); let parent = _____WB$wombat$assign$function_____("parent"); let frames = _____WB$wombat$assign$function_____("frames"); let opener = _____WB$wombat$assign$function_____("opener"); { (function(b,a){b.cmd=b.cmd||[];if(a){a=a.split(":");a=atob(a[1]);a=JSON.parse(a);a=a.ipc_id;for(var e=1,f=73,c=!1,d=0;d<a.length&&!(c=+a[d],c=c>=e&&c<=f);d++);c&&b.cmd.push(function(){"pubads"in b&&b.pubads().setTargeting("ss","on")})}})(window.googletag||{},google_tag_manager["GTM-MNTH5N"].macro(101)); }} var _____WB$wombat$assign$function_____ = function(name) {return (self._wb_wombat && self._wb_wombat.local_init && self._wb_wombat.local_init(name)) || self[name]; }; if (!self.__WB_pmw) { self.__WB_pmw = function(obj) { this.__WB_source = obj; return this; } } { let window = _____WB$wombat$assign$function_____("window"); let self = _____WB$wombat$assign$function_____("self"); let document = _____WB$wombat$assign$function_____("document"); let location = _____WB$wombat$assign$function_____("location"); let top = _____WB$wombat$assign$function_____("top"); let parent = _____WB$wombat$assign$function_____("parent"); let frames = _____WB$wombat$assign$function_____("frames"); let opener = _____WB$wombat$assign$function_____("opener"); { function cb(a){dataLayer.push({"Private Browser":a})}function isChrome(){return!!("undefined"!==typeof window&&window.navigator&&window.navigator.userAgent&&/Chrome/.test(window.navigator.userAgent)&&window.navigator.vendor&&/Google Inc/.test(window.navigator.vendor))}function isSafari(){return!(!("undefined"!==typeof window&&window.navigator&&window.navigator.userAgent&&/Safari/i.test(window.navigator.userAgent))||/Chrome/i.test(window.navigator.userAgent))} function isIEorEdge(){return!("undefined"===typeof window||!window.PointerEvent&&!window.MSPointerEvent)}function isFirefox(){return!!("undefined"!==typeof document&&document.documentElement&&document.documentElement.style&&"MozAppearance"in document.documentElement.style)}function retry(a,c){var e=0,f=50,b=!1,d=window.setInterval(function(){a()&&(window.clearInterval(d),c(b));e++>f&&(window.clearInterval(d),b=!0,c(b))},10)} if(isChrome())navigator&&navigator.storage&&navigator.storage.estimate?navigator.storage.estimate().then(function(a){12E7>a.quota?cb(!0):cb(!1)}):cb(!1);else if(isSafari())try{window.openDatabase(null,null,null,null),cb(!1)}catch(a){cb(!0)}else if(isFirefox()){var db;try{db=window.indexedDB.open("test")}catch(a){is_private=!0}"undefined"===typeof is_private&&retry(function(){return"done"===db.readyState?cb(!0):cb(!1)},function(a){a||(is_private=db.result?cb(!1):cb(!0))})}else if(isIEorEdge()){try{if(!window.indexedDB)throw Error("private mode"); }catch(a){cb(!0)}cb(!1)}cb(!1); }} var _____WB$wombat$assign$function_____ = function(name) {return (self._wb_wombat && self._wb_wombat.local_init && self._wb_wombat.local_init(name)) || self[name]; }; if (!self.__WB_pmw) { self.__WB_pmw = function(obj) { this.__WB_source = obj; return this; } } { let window = _____WB$wombat$assign$function_____("window"); let self = _____WB$wombat$assign$function_____("self"); let document = _____WB$wombat$assign$function_____("document"); let location = _____WB$wombat$assign$function_____("location"); let top = _____WB$wombat$assign$function_____("top"); let parent = _____WB$wombat$assign$function_____("parent"); let frames = _____WB$wombat$assign$function_____("frames"); let opener = _____WB$wombat$assign$function_____("opener"); { !function(a,b){if(!a.rdt){var c=a.rdt=function(){c.sendEvent?c.sendEvent.apply(c,arguments):c.callQueue.push(arguments)};c.callQueue=[];a=b.createElement("script");a.src="https://www.redditstatic.com/ads/pixel.js";a.async=!0;b=b.getElementsByTagName("script")[0];b.parentNode.insertBefore(a,b)}}(window,document);rdt("init","t2_1095cgk5");rdt("track","PageVisit"); }} var _____WB$wombat$assign$function_____ = function(name) {return (self._wb_wombat && self._wb_wombat.local_init && self._wb_wombat.local_init(name)) || self[name]; }; if (!self.__WB_pmw) { self.__WB_pmw = function(obj) { this.__WB_source = obj; return this; } } { let window = _____WB$wombat$assign$function_____("window"); let self = _____WB$wombat$assign$function_____("self"); let document = _____WB$wombat$assign$function_____("document"); let location = _____WB$wombat$assign$function_____("location"); let top = _____WB$wombat$assign$function_____("top"); let parent = _____WB$wombat$assign$function_____("parent"); let frames = _____WB$wombat$assign$function_____("frames"); let opener = _____WB$wombat$assign$function_____("opener"); { !function(d,e,f,a,b,c){d.qp||(a=d.qp=function(){a.qp?a.qp.apply(a,arguments):a.queue.push(arguments)},a.queue=[],b=document.createElement(e),b.async=!0,b.src=f,c=document.getElementsByTagName(e)[0],c.parentNode.insertBefore(b,c))}(window,"script","https://a.quora.com/qevents.js");qp("init","546596e768e74822a47e1fae12063d1a");qp("track","PageView"); }} <img height="1" width="1" style="display:none" src="https://viahtml.hypothes.is/proxy/im_/https://q.quora.com/_/ad/546596e768e74822a47e1fae12063d1a/pixel?tag=ViewContent&noscript=1"> var _____WB$wombat$assign$function_____ = function(name) {return (self._wb_wombat && self._wb_wombat.local_init && self._wb_wombat.local_init(name)) || self[name]; }; if (!self.__WB_pmw) { self.__WB_pmw = function(obj) { this.__WB_source = obj; return this; } } { let window = _____WB$wombat$assign$function_____("window"); let self = _____WB$wombat$assign$function_____("self"); let document = _____WB$wombat$assign$function_____("document"); let location = _____WB$wombat$assign$function_____("location"); let top = _____WB$wombat$assign$function_____("top"); let parent = _____WB$wombat$assign$function_____("parent"); let frames = _____WB$wombat$assign$function_____("frames"); let opener = _____WB$wombat$assign$function_____("opener"); { !function(a,b){if(!a.rdt){var c=a.rdt=function(){c.sendEvent?c.sendEvent.apply(c,arguments):c.callQueue.push(arguments)};c.callQueue=[];a=b.createElement("script");a.src="https://www.redditstatic.com/ads/pixel.js";a.async=!0;b=b.getElementsByTagName("script")[0];b.parentNode.insertBefore(a,b)}}(window,document);rdt("init","t2_1095cgk5");rdt("track","ViewContent"); }} var _____WB$wombat$assign$function_____ = function(name) {return (self._wb_wombat && self._wb_wombat.local_init && self._wb_wombat.local_init(name)) || self[name]; }; if (!self.__WB_pmw) { self.__WB_pmw = function(obj) { this.__WB_source = obj; return this; } } { let window = _____WB$wombat$assign$function_____("window"); let self = _____WB$wombat$assign$function_____("self"); let document = _____WB$wombat$assign$function_____("document"); let location = _____WB$wombat$assign$function_____("location"); let top = _____WB$wombat$assign$function_____("top"); let parent = _____WB$wombat$assign$function_____("parent"); let frames = _____WB$wombat$assign$function_____("frames"); let opener = _____WB$wombat$assign$function_____("opener"); { !function(d,e,f,a,b,c){d.qp||(a=d.qp=function(){a.qp?a.qp.apply(a,arguments):a.queue.push(arguments)},a.queue=[],b=document.createElement(e),b.async=!0,b.src=f,c=document.getElementsByTagName(e)[0],c.parentNode.insertBefore(b,c))}(window,"script","https://a.quora.com/qevents.js");qp("init","546596e768e74822a47e1fae12063d1a");qp("track","ViewContent"); }} <img height="1" width="1" style="display:none" src="https://viahtml.hypothes.is/proxy/im_/https://q.quora.com/_/ad/546596e768e74822a47e1fae12063d1a/pixel?tag=ViewContent&noscript=1"> var _____WB$wombat$assign$function_____ = function(name) {return (self._wb_wombat && self._wb_wombat.local_init && self._wb_wombat.local_init(name)) || self[name]; }; if (!self.__WB_pmw) { self.__WB_pmw = function(obj) { this.__WB_source = obj; return this; } } { let window = _____WB$wombat$assign$function_____("window"); let self = _____WB$wombat$assign$function_____("self"); let document = _____WB$wombat$assign$function_____("document"); let location = _____WB$wombat$assign$function_____("location"); let top = _____WB$wombat$assign$function_____("top"); let parent = _____WB$wombat$assign$function_____("parent"); let frames = _____WB$wombat$assign$function_____("frames"); let opener = _____WB$wombat$assign$function_____("opener"); { window.liQ=window.liQ||[];window.liQ.push({event:"viewContent",contentType:"Product"}); }} var _____WB$wombat$assign$function_____ = function(name) {return (self._wb_wombat && self._wb_wombat.local_init && self._wb_wombat.local_init(name)) || self[name]; }; if (!self.__WB_pmw) { self.__WB_pmw = function(obj) { this.__WB_source = obj; return this; } } { let window = _____WB$wombat$assign$function_____("window"); let self = _____WB$wombat$assign$function_____("self"); let document = _____WB$wombat$assign$function_____("document"); let location = _____WB$wombat$assign$function_____("location"); let top = _____WB$wombat$assign$function_____("top"); let parent = _____WB$wombat$assign$function_____("parent"); let frames = _____WB$wombat$assign$function_____("frames"); let opener = _____WB$wombat$assign$function_____("opener"); { var __nspid="grdq0w",__nsptags=[];(function(a,c){var d=function(){var b=c.createElement("script");b.type="text/javascript";b.async=!0;b.src="http"+("https:"===c.location.protocol?"s://cs":"://c")+".ns1p.net/p.js?a\x3d"+__nspid;c.body.appendChild(b)};a.addEventListener?a.addEventListener("load",d,!1):a.attachEvent?a.attachEvent("onload",d):a.onload=d})(window,document); }} var _____WB$wombat$assign$function_____ = function(name) {return (self._wb_wombat && self._wb_wombat.local_init && self._wb_wombat.local_init(name)) || self[name]; }; if (!self.__WB_pmw) { self.__WB_pmw = function(obj) { this.__WB_source = obj; return this; } } { let window = _____WB$wombat$assign$function_____("window"); let self = _____WB$wombat$assign$function_____("self"); let document = _____WB$wombat$assign$function_____("document"); let location = _____WB$wombat$assign$function_____("location"); let top = _____WB$wombat$assign$function_____("top"); let parent = _____WB$wombat$assign$function_____("parent"); let frames = _____WB$wombat$assign$function_____("frames"); let opener = _____WB$wombat$assign$function_____("opener"); { (function(a,b,d){if(!a.snaptr){var c=a.snaptr=function(){c.handleRequest?c.handleRequest.apply(c,arguments):c.queue.push(arguments)};c.queue=[];a="script";r=b.createElement(a);r.async=!0;r.src=d;b=b.getElementsByTagName(a)[0];b.parentNode.insertBefore(r,b)}})(window,document,"https://sc-static.net/scevent.min.js");snaptr("init","a3122455-b81e-4771-b727-9863f4dd20d6",{user_email:""});snaptr("track","PAGE_VIEW"); }} var _____WB$wombat$assign$function_____ = function(name) {return (self._wb_wombat && self._wb_wombat.local_init && self._wb_wombat.local_init(name)) || self[name]; }; if (!self.__WB_pmw) { self.__WB_pmw = function(obj) { this.__WB_source = obj; return this; } } { let window = _____WB$wombat$assign$function_____("window"); let self = _____WB$wombat$assign$function_____("self"); let document = _____WB$wombat$assign$function_____("document"); let location = _____WB$wombat$assign$function_____("location"); let top = _____WB$wombat$assign$function_____("top"); let parent = _____WB$wombat$assign$function_____("parent"); let frames = _____WB$wombat$assign$function_____("frames"); let opener = _____WB$wombat$assign$function_____("opener"); { (function(a,b,e){if(!a.snaptr){var c=a.snaptr=function(){c.handleRequest?c.handleRequest.apply(c,arguments):c.queue.push(arguments)};c.queue=[];var d="script";a=b.createElement(d);a.async=!0;a.src=e;b=b.getElementsByTagName(d)[0];b.parentNode.insertBefore(a,b)}})(window,document,"https://sc-static.net/scevent.min.js");snaptr("init","a3122455-b81e-4771-b727-9863f4dd20d6",{user_email:""});snaptr("track","VIEW_CONTENT"); }} var _____WB$wombat$assign$function_____ = function(name) {return (self._wb_wombat && self._wb_wombat.local_init && self._wb_wombat.local_init(name)) || self[name]; }; if (!self.__WB_pmw) { self.__WB_pmw = function(obj) { this.__WB_source = obj; return this; } } { let window = _____WB$wombat$assign$function_____("window"); let self = _____WB$wombat$assign$function_____("self"); let document = _____WB$wombat$assign$function_____("document"); let location = _____WB$wombat$assign$function_____("location"); let top = _____WB$wombat$assign$function_____("top"); let parent = _____WB$wombat$assign$function_____("parent"); let frames = _____WB$wombat$assign$function_____("frames"); let opener = _____WB$wombat$assign$function_____("opener"); { !function(a,e,f,k,h,g,c,b,d){a.AppsFlyerSdkObject=h;a.AF=a.AF||function(){(a.AF.q=a.AF.q||[]).push([Date.now()].concat(Array.prototype.slice.call(arguments)))};a.AF.id=a.AF.id||c;a.AF.plugins={};b=e.createElement(f);d=e.getElementsByTagName(f)[0];b.async=1;b.src="https://websdk.appsflyer.com?"+(0<g.length?"st\x3d"+g.split(",").sort().join(",")+"\x26":"")+(0<c.length?"af_id\x3d"+c:"");d.parentNode.insertBefore(b,d)}(window,document,"script",0,"AF","pba,banners",{pba:{webAppId:"1cfcf625-e923-4494-a876-4b28f5086046"}, banners:{key:"63dbce54-a34f-4323-a052-5f4e03364ea8"}});AF("banners","showBanner"); }}var locale=navigator.userLanguage||navigator.languages&&navigator.languages.length&&navigator.languages[0]||navigator.language||navigator.browserLanguage||navigator.systemLanguage||"en";AF("pba","event",{eventType:"EVENT",eventName:"af_Content_View",eventValue:{af_content:google_tag_manager["GTM-MNTH5N"].macro(102),af_content_type:google_tag_manager["GTM-MNTH5N"].macro(103),af_author:google_tag_manager["GTM-MNTH5N"].macro(104),af_franchise:google_tag_manager["GTM-MNTH5N"].macro(105),af_subbrand:google_tag_manager["GTM-MNTH5N"].macro(106),af_content_id:google_tag_manager["GTM-MNTH5N"].macro(107),language:locale}}); fbq("trackSingle","227995338998622","ViewContent",{content:google_tag_manager["GTM-MNTH5N"].macro(108),content_type:google_tag_manager["GTM-MNTH5N"].macro(109),author:google_tag_manager["GTM-MNTH5N"].macro(110),franchise:google_tag_manager["GTM-MNTH5N"].macro(111),subbrand:google_tag_manager["GTM-MNTH5N"].macro(112),content_id:google_tag_manager["GTM-MNTH5N"].macro(113),language:locale}); sessionStorage.setItem("my_ip",google_tag_manager["GTM-MNTH5N"].macro(149));Register to read more. Already
CVC looks like Ceramic with the "era" starting with "emblem"
** not affiliated with QWERTY either. ECMA
Author Response
Reviewer #1 (Public Review):
The authors have generated a set of seven nanobody tools against two of the largest Drosophila proteins, which are related to vertebrate titin and essential for muscle function. The study of such gigantic proteins is a challenge. They show that each of these nanobodies recognizes their epitope with high affinity (as expected from antibodies), fails to generate a signal after immune-fixation of a mutant for the cognate protein, do not cross-react with each other, and generates a signal in the muscle that makes sense with what one would anticipate for fly titin homologs. In addition, they show that these nanobodies have better penetration and labeling efficiency than conventional antibodies in thick tissues after classical paraformaldehyde fixation. Using these nanobodies, they could deduce the organization of the epitopes in different muscle types and propose a model for Sallimus and Projectin arrangement in muscles, including in larvae which are difficult to label with traditional antibodies due to their impermeable chitin skeleton. Finally, they could fuse the gene encoding one of the nanobodies to the open reading frame of NeonGreen and express the corresponding fusion protein in animals to use the probe in FRAP assays.
The work is very well performed and convincing. However, given its significant redundancy in terms of biological conclusions with the companion study "Nanobodies combined with DNAPAINT super-resolution reveal a staggered titin nano-architecture in flight muscles" by the same authors, and other published papers, I recommend the authors further prove the use of their nanobodies in live assays. In particular, the authors should test whether they can use the nanobodies to induce protein degradation either permanently or conditionally.
Thanks for this nice summary of our findings. We have now extended the analysis of the Nanobody-NeonGreen fusion expressing larval muscles and provide first proof of principle analysis of new fly strains that we generated that contain Sls-Nano2 or Sls-Nano42 nanobodies fused to a degradation signal. These induce lethality of the animals suggesting that Sls protein is partially non functional. We verified this by providing quantitative stainings of various Sls epitopes in these muscles suggesting that Sls is not fully degraded but rather partially modified in the Sls-Nano-deGrad expressing muscle fibers. These will be interesting tools to study Sls function during sarcomere homeostasis.
Reviewer #2 (Public Review):
The data presented in this manuscript are sound but rather descriptive. The contribution - as presented - is mostly of a technical nature. The authors correctly state that anti-GFP nanobodies, while used extensively across many model organisms, have limited utility for in vivo applications when the GFP-tagged protein in question displays abnormal behavior or is non-functional. The creation of nanobodies that are uniquely specific for the protein(s) of interest is therefore a significant improvement, especially since the Sallimus and Projectinspecific reagents reported here react with PFA-fixed material. At least one of these nanobodies, when expressed in vivo, decorates the appropriate target. The source of antigens used for the construction of the nanobody library is Drosophila-derived. The extent of homology of Drosophila Sallimus and Projectin with related proteins in other species is not discussed. Whether the nanobodies reported here would be useful in other (closely related?) species, therefore, remains to be established. For those studying muscle biology in Drosophila, the nanobodies described here will be publicly available as cDNAs. Ease of production implies a readily shared and standardized resource for the field.
We thank this reviewer for appreciating that our Sallimus and Projectin nanobodies are useful. We now have extended the collection even further, including anti-Obscurin, αActinin and Zasp52 nanobodies, the latter two will also be useful for researcher studying other tissues, in particular Drosophila epithelial tissues. As always in the Drosophila field, all the here generated fly strains and plasmids will be made easily available to the community by placing them in stock centers or shipping them to the laboratories directly. As indicated, also the plasmids will be deposited at Addgene.
Further characterization of these nanobodies by biochemical methods such as immunoblotting would be challenging, given the size of the target proteins. In view of the technical nature of this manuscript, the authors should perhaps critically discuss the distinction between bulky GFP tags versus the much smaller epitope tags and the nanobodies that recognize them, although this was covered in a recent eLife paper from the Perrimon lab. Insertion of small tags, in conjunction with nanobodies that recognize them, would be less perturbing than the much bulkier GFP tag and lend itself to genome-wide applications. Creating nanobodies uniquely specific for each protein encoded in the Drosophila genome is not realistic, and the targeted approach deployed here is obviously valuable.
We are discussing the drawbacks of solely relying on GFP nanobodies, which requires GFP tagged proteins to be available and being functional. In particular for the sarcomeric proteins this is often not the case. We also cite the Perrimon paper, which was just published as we prepared this manuscript. We would like to point out to this reviewer that even tagging with a small epitope tag is considerable work in Drosophila and that the Perrimon paper, on which this reviewer is an author, does describe only two endogenously tagged genes with a nanotag (histone H2Av and Dilp2) the other genes described were expressed from a UAS source or in cell culture. We show here 22 nanobodies against 11 target epitopes.
Nanobodies recognise typically folded epitopes and are rather unlikely to work in immunoblotting.
The authors apply two different approaches to characterize the newly generated Nanobodies: more or less conventional immunohistochemistry with fluorescently labeled nanobodies, and in vivo expression of nanobodies fused to the fluorescent neongreen protein. The superiority of nanobodies in terms of tissue penetration has been shown by others in a direct comparison of intact fluorescently labeled immunoglobulins versus nanobodies. The authors state that in vivo labeling with nanobody fusions "thus far was done only with nanobodies against GFP, mCherry or short epitope tags." There is no fundamental difference between these recognition events and what the authors report for their Sallimus and Projectin-specific reagents. The section that starts at line 304 is thus a little bit of a 'straw man'. There is no reason to assume that a nanobody that recognizes a muscle protein would behave differently than a nanobody that would recognize that same protein (or another) when epitope- or GFP-tagged. What might be interesting is to examine the behavior of these muscle-specific nanobodies in the course of muscle contraction/relaxation: are there conformational alterations that promote dissociation of bound nanobodies? Do different nanobodies display discrete behavior in this regard? The manuscript is silent on how muscles behave in live L3 larvae. The FRAP experiment seems to suggest that not much is happening, but the text refers to the contraction of larval sarcomeres from 8.5 µM to 4.5 µM. Does the in vivo expressed nanobody remain stably bound during this contraction/relaxation cycle? What about the other nanobodies reported in this manuscript? Since the larval motion was reduced by exposure to diethylether, have the authors considered imaging the contractive cycle in the absence of such exposure?
We appreciate the expert knowledge about nanobodies by this reviewer. However, nanobodies were not extensively applied in Drosophila tissues. Hence, we believe it is important to characterise their penetration in stainings and compare them carefully to antibodies. Such, the Drosophila reader will be aware of their advantages.
We have now also included more data on the larval muscle morphology in the nanobody expressing muscles. Their morphology is normal. As larvae move around extensively all the time, the binding of the nanobodies to the target must be stable, otherwise it would not be bound when we fix them or anesthetize them. However, we have not attempted to image them at high resolution while crawling freely. From quantifying the crawling speed (about 1.5 mm per second, see Figure 9 S1) we hope this reviewer appreciates that high resolution imaging of sarcomeres in freely crawling larvae is highly non trivial.
Given that the nanobodies bind well-folded epitopes with low picomolar dissociations constants, it is hard to imagine that conformational changes of the target would dissociate them. The nanobody would stabilise the recognised conformation by a ΔG of ≈60 KJ/ mole, and we would not expect that the chosen domains undergo major conformational changes.
Reviewer #3 (Public Review):
Loreau et al. have presented a well-written manuscript reporting clever, original work taking advantage of fairly new biotechnology - the generation and use of single chain antibodies called nanobodies. The authors demonstrate the production of multiple nanobodies to two titin homologs in Drosophila and use these nanobodies to localize these proteins in several fly muscle types and discover interesting aspects of the localization and span of these elongated proteins in the muscle sarcomere. They also demonstrate that one of these single chain antibodies can be expressed in muscle fused to a fluorescent protein to image the localization of a segment of one of these giant proteins called Sallimus in muscle in a live fly. Their project is well-justified given the limitations of the usual approaches for localizing and studying the dynamics of proteins in the muscle of model organisms such as the possibility that GFP tagging of a protein will interfere with its localization or function, and poor penetration of large IgG or IgM antibodies into densly packed structures like the sarcomere after fixation as compared to smaller nanbodies.
They achieved their goals consistent with the known/expected properties of nanobodies: (1) They demonstrate that at least one of their nanobodies binds with very high affinity. (2) They bind with high specificity. (3) The nanobodies show much better penetration of fixed stage 17 embryos than do conventional antibodies.
They use their nanobodies mostly generated to the N- and C-terminal ends of Sallimus and Projectin to learn new information about how these elongated proteins span and are oriented in the sarcomere. For example, in examining larval muscles which have long sarcomeres (8.5 microns), using nanobodies to domains located near the N- and C-termini, they show definitively that the predicted 2.1 MDa protein Sallimus spans the entire I-band and extends a bit into the A-band with its N-terminus embedded in the Z-disk and C-terminus in the outer edge of the A-band. Using a similar approach they also show that the 800 kDa Projectin decorates the entire myosin thick filament except for the H-zone and M-line in a polar orientation. Their final experiment is most exciting! They were able to express in fly larval muscles a nanobody directed to near the N-terminus of Sallimus fused to NeonGreen and show that it localizes to Z-disks in living larvae, and by FRAP experiments demonstrate that the binding of this nanobody to Sallimus in vivo is very stable. This opens the door to using a similar approach to study the assembly, dynamics, and even conformational changes of a protein in a complex in a live animal in real time.
We thank this reviewer for appreciating the quality and impact of our approach and the our obtained results.
There are only a few minor weaknesses about their conclusions: (1) They should note that in fact their estimate of the span of Sallimus could be an underestimate since their Nano2 nanobody is directed to Ig13/14 so if all of these 12 Ig domains N-terminal of their epitope were unwound it would add 12 X 30 nm = 360 nm of length, and even if unwound would add about 50 nm of length.
We are discussing the length contribution of the 12 Ig domains now more extensively in the DNA PAINT super-resolution paper, however not in this resource paper as the 50 nm difference was not resolved with the confocal microscopy applied here to the larval muscle sarcomere.
(2) They discuss how Sallimus and Projectin are the two Drosophila homologs of mammalian titin, however, they ignore the fact that there is more similarity between Sallimus and Projectin to muscle proteins in invertebrates. For example, in C. elegans, TTN-1 is the counterpart of Sallimus, and twitchin is the counterpart of Projectin, both in size and domain organization. The authors present definitive data to support Figure 9, their nice model for a fly larval sarcomere but fail to point out that this model likely pertains to C. elegans and other invertebrates. In Forbes et al. (2010) it was shown that TTN-1, which can be detected by western blot as ~2 MDa protein and using two polyclonal antibodies spans the entire Iband and extends into the outer edge of the A-band, very similar to what the authors here have shown, more elegantly for Sallimus. In addition, several studies have shown that twitchin (Projectin) does not extend into the M-line; the M-line is exclusively occupied by UNC-89, the homolog of Obscurin.
We thank this reviewer for pointing out the important C. elegans literature that we have now included in this revised manuscript. We apologise for initially omitting them. They are indeed highly relevant.
Reviewer #4 (Public Review):
Authors report the generation and characterisation of several nanobodies for giant Drosophila sarcomeric proteins, Sallimus and Projectin the functional orthologs of titin. They describe an efficient pipeline that could potentially help in designing and producing nanobodies for other proteins. There are several advantages to using nanobodies in comparison to conventional antibodies and the authors nicely demonstrate that the generated nanobodies allow to precisely map subcellular localisation and even the protein orientation in the case of Projectin. They also show that small nanobody molecules have superior penetration and labelling efficiencies with respect to classical antibodies. Finally, the authors select one of the nanobodies to test whether it will efficiently detect native proteins in living tissue. They confirm that Sls-Nano2NeoGreen binds Sls in vivo in muscles of temporarily immobilized 3rd instar larva allowing to reveal sarcomeric Sls pattern and to demonstrate by FRAP experiments that Sls does not exchange during a short time period.
This work is of significant value to a large audience. It provides a clear and precise pipeline for the generation of efficient nanobodies, which are invaluable tools of modern biology.
We thank this reviewer for expressing strong support for our manuscript and appreciating its value for a large readership.
Reviewer #2 (Public Review):
The data presented in this manuscript are sound but rather descriptive. The contribution - as presented - is mostly of a technical nature. The authors correctly state that anti-GFP nanobodies, while used extensively across many model organisms, have limited utility for in vivo applications when the GFP-tagged protein in question displays abnormal behavior or is non-functional. The creation of nanobodies that are uniquely specific for the protein(s) of interest is therefore a significant improvement, especially since the Sallimus and Projectin-specific reagents reported here react with PFA-fixed material. At least one of these nanobodies, when expressed in vivo, decorates the appropriate target. The source of antigens used for the construction of the nanobody library is Drosophila-derived. The extent of homology of Drosophila Sallimus and Projectin with related proteins in other species is not discussed. Whether the nanobodies reported here would be useful in other (closely related?) species, therefore, remains to be established. For those studying muscle biology in Drosophila, the nanobodies described here will be publicly available as cDNAs. Ease of production implies a readily shared and standardized resource for the field.
Further characterization of these nanobodies by biochemical methods such as immunoblotting would be challenging, given the size of the target proteins. In view of the technical nature of this manuscript, the authors should perhaps critically discuss the distinction between bulky GFP tags versus the much smaller epitope tags and the nanobodies that recognize them, although this was covered in a recent eLife paper from the Perrimon lab. Insertion of small tags, in conjunction with nanobodies that recognize them, would be less perturbing than the much bulkier GFP tag and lend itself to genome-wide applications. Creating nanobodies uniquely specific for each protein encoded in the Drosophila genome is not realistic, and the targeted approach deployed here is obviously valuable.
The authors apply two different approaches to characterize the newly generated Nanobodies: more or less conventional immunohistochemistry with fluorescently labeled nanobodies, and in vivo expression of nanobodies fused to the fluorescent neongreen protein. The superiority of nanobodies in terms of tissue penetration has been shown by others in a direct comparison of intact fluorescently labeled immunoglobulins versus nanobodies. The authors state that in vivo labeling with nanobody fusions "thus far was done only with nanobodies against GFP, mCherry or short epitope tags." There is no fundamental difference between these recognition events and what the authors report for their Sallimus and Projectin-specific reagents. The section that starts at line 304 is thus a little bit of a 'straw man'. There is no reason to assume that a nanobody that recognizes a muscle protein would behave differently than a nanobody that would recognize that same protein (or another) when epitope- or GFP-tagged. What might be interesting is to examine the behavior of these muscle-specific nanobodies in the course of muscle contraction/relaxation: are there conformational alterations that promote dissociation of bound nanobodies? Do different nanobodies display discrete behavior in this regard? The manuscript is silent on how muscles behave in live L3 larvae. The FRAP experiment seems to suggest that not much is happening, but the text refers to the contraction of larval sarcomeres from 8.5 µM to 4.5 µM. Does the in vivo expressed nanobody remain stably bound during this contraction/relaxation cycle? What about the other nanobodies reported in this manuscript? Since the larval motion was reduced by exposure to diethylether, have the authors considered imaging the contractive cycle in the absence of such exposure?
Author Response
Reviewer #1 (Public Review):
In a very interesting and technically advanced study, the authors measured the force production of curved protofilaments at depolymerizing mammalian microtubule ends using an optical trap assay that they developed previously for yeast microtubules. They found that the magnesium concentration affects this force production, which they argue based on a theoretical model is due to affecting the length of the protofilament curls, as observed previously by electron microscopy. Comparing with their previous force measurements, they conclude that mammalian microtubules produce smaller force pulses than yeast microtubules due to shorter protofilament curls. This work provides new mechanistic insight into how shrinking microtubules exert forces on cargoes such as for example kinetochores during cell division. The experiments are sophisticated and appear to be of high quality, conclusions are well supported by the data, and language is appropriate when conclusions are drawn from more indirect evidence. Given that the experimental setup differs from the previous optical trap assay (antibody plus tubulin attached to bead versus only antibody attached to bead), a control experiment could be useful with yeast microtubules using the same protocol used in the new variant of the assay, or at least a discussion regarding this issue. One open question may be whether the authors can be sure that measured forces are only due to single depolymerizing protofilaments instead of two or more protofilaments staying laterally attached for a while. How would this affect the interpretation of the data?
This work will be of interest to cell biologists and biophysicists interested in spindle mechanics or generally in filament mechanics.
Thank you for your careful reading of our manuscript, your kind remarks, and your favorable review.
Reviewers #1 and #2 both mentioned a concern about potential differences between our previous setup with yeast microtubules, versus our new setup with predominantly bovine microtubules, and whether such differences might underlie the different pulse amplitudes we measured. We think this concern comes mainly from a misunderstanding of how the beads in both setups were tethered to the sides of the microtubules, and we apologize for not making this aspect clearer in our original submission.
It is true that our new setup requires one additional step, pre-decoration of the anti-His beads with His6-tagged yeast tubulin. However, in both cases, the anti-His antibodies were kept very sparse on the beads to ensure that most beads, if they became tethered to a microtubule, were attached by a single antibody. (~30 pM beads were mixed with 30 pM of anti-His antibody, for a molar ratio of 1:1.) And even though the anti-His beads in our previous work did not undergo a separate incubation step for pre-decoration with tubulin, they undoubtedly were decorated immediately after being mixed into the microtubule growth mix, which in that case included ~1 µM of unpolymerized His6-tagged yeast tubulin dimers. Thus, the arrangement with beads tethered laterally to the sides of microtubules via single antibodies was created in both cases by essentially the same three-step process: First, beads decorated very sparsely with anti-His antibodies were bound to unpolymerized His6-tagged yeast tubulin. Second, a bead-tethered His6-tagged yeast tubulin was incorporated into the growing tip of a microtubule (which could be assembling from either yeast or bovine tubulin, depending on the experiment). Third, the tip grew past the bead to create a large extension. Because the beads in both scenarios were tethered by a single antibody to the same C-terminal tail of yeast β-tubulin, the differences in pulse amplitude cannot be explained by differences in the tethering. In our revised manuscript, we now mention explicitly in Results that the beads were tethered by single antibodies (lines 95 to 100). In Methods we significantly expanded the section about preparation of beads and how they became tethered (lines 365 to 393). [We refer here, and below, to line numbers when the document is viewed with “All Markup” shown.]
You also raise an interesting, open question: Do protofilaments curl outward entirely independently of their lateral neighbors? Or under some conditions might they tend to stay laterally associated during the curling process, perhaps curling outward in pairs rather than as individual protofilaments? We cannot formally rule out the possibility that such lateral associations sometimes persist during protofilament curling. However, changes in lateral association seem unlikely to explain the magnesium- and species-dependent differences we measured in pulse amplitude, for several reasons: First, there is good evidence for lengthening of protofilament curls at disassembling tips (e.g., Mandelkow 1991, Tran & Salmon 1997), but we are not aware of convincing evidence for magnesium or species-dependent increases in the propensity of curling protofilaments to remain laterally associated. Second, an increase in lateral association should increase the effective flexural rigidity of the curls, but under all the conditions we examined, pulse enlargement was associated with a steepening of the amplitude-vs-force relation – i.e., with softening, not stiffening. Our model indicates that this softening can be fully explained by an increase in protofilament contour length, without any change in the intrinsic flexural rigidity of the protofilament curls.
Reviewer #2 (Public Review):
Microtubules are regarded as dynamic tracks for kinesin and dynein motors that generate force for moving cargoes through cells, but microtubules also act as motors themselves by generating force from outward splaying protofilaments at depolymerizing ends. Force from depolymerization has been demonstrated in vitro and is thought to contribute to chromosome movement and other contexts in cells. Although this model has been in the field for many years, key questions have remained unanswered, including the mechanism of force generation, how force generated might be regulated in cells, and how this system might be tuned across cellular contexts or organisms. The barrier is that we lack an understanding of experimental conditions that can be used to control protofilament shape and energetics. This study by Murray and colleagues makes an important advance towards overcoming that barrier.
This study builds on previous work from the authors where they developed a system to directly measure forces generated by outward curling protofilaments at depolymerizing microtubule ends. That study showed for the first time that protofilaments act like elastic springs and related the generated force to the estimated energy contained in the microtubule lattice. Furthermore, they showed that slowing polymerization rate did not diminish force generation. That study used recombinant yeast tubulin, including a 6x histidine tag on beta tubulin that created attachment points for the bead on the microtubule lattice. The current study extends that system to show that work output is related to the length of protofilament curls.
We are grateful for your very thoughtful and thorough review, which has helped us improve our manuscript.
Murray and colleagues show this by manipulating curls in two ways - using bovine brain tubulin instead of yeast tubulin and altering magnesium concentration. Previous EM studies indicated that protofilaments on depolymerizing bovine microtubules have similar curvature but are shorter. The authors here use a blend of bovine brain tubulin and bead-linked recombinant yeast tubulin with the 6x histidine tag in their in vitro system and find smaller deflections of the laser-trapped bead than previously observed with pure yeast tubulin. A concern with comparing this heterogeneous bovine/yeast system to the previous work with homogeneous yeast tubulin is that density of 6x histidine-tagged tubulin subunits is likely to be different between the two systems. Also, the rate of incorporation of 6x histidine yeast tubulin into bovine microtubules in the current study may be different from the rate of incorporation into yeast microtubules in the previous study. These differences could lead to changes in the strength of bead attachment to the microtubule lattice and alter the compliance of the bead to deflection by curling protofilaments. These possibilities and lattice attachment strength are not explored in this study, raising concerns about comparing the two systems.
Reviewers #1 and #2 both mentioned a concern about potential differences between our previous setup with yeast microtubules, versus our new setup with predominantly bovine microtubules, and whether such differences might underlie the different pulse amplitudes we measured. As detailed in our response to Reviewer #1 above, we think this concern comes mainly from a misunderstanding of how the beads in both setups were tethered to the sides of the microtubules, and we apologize for not making this aspect clearer in our original submission. For both our yeast and bovine microtubule experiments, the anti-His antibodies were kept very sparse on the beads to ensure that most beads, if they became tethered to a microtubule, were attached by a single antibody. Because the beads in both scenarios were tethered by a single antibody to the same C-terminal tail of yeast β-tubulin, the differences in pulse amplitude cannot be explained by differences in the tethering. In our revised manuscript, we now mention explicitly in Results that the beads were tethered by single antibodies (lines 95 to 100). In Methods we significantly expanded the section about preparation of beads and how they became tethered (lines 365 to 393).
The authors go on to show that magnesium increases bead deflection and work output from the system. The use of magnesium was motivated by earlier studies which showed that increasing magnesium speeds up depolymerization and increases the lengths of protofilament curls. The use of magnesium here provides the first evidence that work output can be tuned biochemically. This is an important finding. The authors then go on to show that the effect of magnesium on bead deflection can be separated from its effect on depolymerization speed. They do this by proteolytically removing the beta tubulin tail domain, which previous studies had shown to be necessary to mediate the magnesium effect on depolymerization rate. The authors arrive at a conclusion that magnesium must promote protofilament work output by increasing their lengths. How magnesium might do this remains unanswered. The mechanistic insight from the magnesium experiments ends there, but the authors discuss possible roles for magnesium in strengthening longitudinal interactions within protofilaments or perhaps complexing with the GDP nucleotide at the exchangeable site, although that seems less likely at the concentrations in these experiments.
The major conclusion of the study is the finding that work output from curling protofilaments is a tunable system. The examples here demonstrate tuning by tubulin composition and by divalent cations. Whether these examples relate to tuning in biological systems will be an important next question and could expand our appreciation for the versatility of depolymerizing microtubules as a motor.
We fully agree that two very important next questions are whether work output from curling protofilaments is truly harnessed in vivo, and whether protofilament properties in vivo might be actively regulated for this purpose. Based on your recommendations, and as detailed below (under Major point 2), we have expanded our discussion of these possibilities in our revised manuscript.
Reviewer #3 (Public Review):
The authors used a previously established optical tweezers-based assay to measure the regulation of the working stroke of curled protofilaments of bovine microtubules by magnesium. To do so, the authors improved the assay by attaching bovine microtubules to trapping beads through an incorporated tagged yeast tubulin.
The assay is state-of-the-art and provides a direct measurement of the stroke size of protofilaments and its dependence on magnesium.
The authors have achieved all their goals and the manuscript is well written.
The reported findings will be of high interest for the cell biology community.
Thank you for reading and evaluating our manuscript. We are grateful for your positive comments.
Reviewer #2 (Public Review):
Microtubules are regarded as dynamic tracks for kinesin and dynein motors that generate force for moving cargoes through cells, but microtubules also act as motors themselves by generating force from outward splaying protofilaments at depolymerizing ends. Force from depolymerization has been demonstrated in vitro and is thought to contribute to chromosome movement and other contexts in cells. Although this model has been in the field for many years, key questions have remained unanswered, including the mechanism of force generation, how force generated might be regulated in cells, and how this system might be tuned across cellular contexts or organisms. The barrier is that we lack an understanding of experimental conditions that can be used to control protofilament shape and energetics. This study by Murray and colleagues makes an important advance towards overcoming that barrier.
This study builds on previous work from the authors where they developed a system to directly measure forces generated by outward curling protofilaments at depolymerizing microtubule ends. That study showed for the first time that protofilaments act like elastic springs and related the generated force to the estimated energy contained in the microtubule lattice. Furthermore, they showed that slowing polymerization rate did not diminish force generation. That study used recombinant yeast tubulin, including a 6x histidine tag on beta tubulin that created attachment points for the bead on the microtubule lattice. The current study extends that system to show that work output is related to the length of protofilament curls.
Murray and colleagues show this by manipulating curls in two ways - using bovine brain tubulin instead of yeast tubulin and altering magnesium concentration. Previous EM studies indicated that protofilaments on depolymerizing bovine microtubules have similar curvature but are shorter. The authors here use a blend of bovine brain tubulin and bead-linked recombinant yeast tubulin with the 6x histidine tag in their in vitro system and find smaller deflections of the laser-trapped bead than previously observed with pure yeast tubulin. A concern with comparing this heterogeneous bovine/yeast system to the previous work with homogeneous yeast tubulin is that density of 6x histidine-tagged tubulin subunits is likely to be different between the two systems. Also, the rate of incorporation of 6x histidine yeast tubulin into bovine microtubules in the current study may be different from the rate of incorporation into yeast microtubules in the previous study. These differences could lead to changes in the strength of bead attachment to the microtubule lattice and alter the compliance of the bead to deflection by curling protofilaments. These possibilities and lattice attachment strength are not explored in this study, raising concerns about comparing the two systems.
The authors go on to show that magnesium increases bead deflection and work output from the system. The use of magnesium was motivated by earlier studies which showed that increasing magnesium speeds up depolymerization and increases the lengths of protofilament curls. The use of magnesium here provides the first evidence that work output can be tuned biochemically. This is an important finding. The authors then go on to show that the effect of magnesium on bead deflection can be separated from its effect on depolymerization speed. They do this by proteolytically removing the beta tubulin tail domain, which previous studies had shown to be necessary to mediate the magnesium effect on depolymerization rate. The authors arrive at a conclusion that magnesium must promote protofilament work output by increasing their lengths. How magnesium might do this remains unanswered. The mechanistic insight from the magnesium experiments ends there, but the authors discuss possible roles for magnesium in strengthening longitudinal interactions within protofilaments or perhaps complexing with the GDP nucleotide at the exchangeable site, although that seems less likely at the concentrations in these experiments.
The major conclusion of the study is the finding that work output from curling protofilaments is a tunable system. The examples here demonstrate tuning by tubulin composition and by divalent cations. Whether these examples relate to tuning in biological systems will be an important next question and could expand our appreciation for the versatility of depolymerizing microtubules as a motor.
As I wrote in my feedback on the M4 Discussion in IOCD, "I agree that this prompt has a 'low floor' and 'high ceiling.' The prompt emphasizes observation, creative thinking, and multiple perspectives. You even state, 'There are no wrong answers.' I like how you require students to explain their reasoning when they answer the ... question about which tag doesn't belong."
Benoit Daloze of TruffleRuby points out that this is all much easier to read if you define your Ruby internals in Ruby, like they do. He's not wrong.
green fluorescent protein containing a degradation tag (GFPmut3_LAA)
BLAST matches the GFPmut3 sequence in rGFP and fGFP to this - so the Voigt lab authors cloned this with the partial degron tag without the LAA amino acids for this paper :
Yang, Lei, et al. "Permanent genetic memory with> 1-byte capacity." Nature methods 11.12 (2014): 1261-1266.
Author Response
Reviewer #2 (Public Review):
“To describe LLPS or to distinguish between polymer-polymer phase separation and LLPS, recent studies have used single particle tracking, a technique allowing to follow the dynamics of individual proteins in living cells (https://doi.org/10.7554/eLife.60577; https://doi.org/10.7554/eLife.69181; https://doi.org/10.7554/eLife.47098). The authors should mention that such an approach can be a good alternative to avoid the artefact of fixation. Using techniques such as single particle tracking or FCS, it is possible to estimate the effective diffusion coefficient of protein-living cells. When a liquid phase separation is formed, it is also possible to estimate the diffusion coefficient of the protein of interest (POI) inside versus outside of the LLPS.”
We thank the reviewer for their insight and fully agree that live-cell techniques like SPT and FCS are valuable for investigating LLPS while avoiding fixation artifacts. We have added discussion emphasizing this fact and incorporated the citations recommended by the reviewer in Paragraph 1 on Page 15: “Live imaging techniques that allow estimation of protein diffusion coefficients within specific cellular compartments, e.g., SPT (Hansen et al., 2018 and Heckert et al., 2022) and fluorescence correlation spectroscopy (Lanzanò et al., 2017), can be useful alternative approaches for diagnosing LLPS in vivo without the potential artifact of fixation, as diffusion dynamics are recently shown to be affected by LLPS (Heltberg et al., 2021; McSwiggen et al., 2019a; Miné-Hattab et al., 2021; Chong et al., 2022; and Ladouceur et al., 2020).”
“The authors say that less dynamic interactions are better captured by PFA fixation. In the simulation part, would it be possible to predict from the diffusion coefficients of the POI inside a condensate the effect of the PFA fixation? […] In the simulation part, they could try to incorporate the diffusion coefficient of the protein of interest and see if it is possible to predict the effect of fixation as a function of the diffusion coefficient.”
We thank the reviewer for pointing out the absence of this critical piece that connects our experimental observations to our kinetic model. Our model considers association/dissociation rates rather than diffusion coefficients to describe interaction dynamics, but the reviewers’ point is still very insightful and important. As described in Response 2, we compared two proteins: Halo-TAF15(IDR), which is poorly preserved by fixation, and TAF15(IDR)-Halo-FTH1, which is well preserved by fixation. We used SPT to measure the dissociation rates of Halo-TAF15(IDR) and TAF15(IDR)-Halo-FTH1 and showed that the dissociation rate of Halo-TAF15(IDR) from its puncta is much faster than that of TAF15(IDR)-Halo-FTH1, demonstrating more stable homotypic interactions of the latter than the former. The observation that TAF15(IDR)-Halo-FTH1 has less dynamic interactions and is better preserved by fixation compared to Halo-TAF15(IDR) agrees with our model’s prediction that less dynamic interactions are better captured by fixation. Please see Response 2 for more details. Our new data and discussion have been added to the revised manuscript in Paragraph 3 on Page 13 and in Figure 3B, Figure 3E, Figure 6, and Video 2.
“Finally, the authors propose that in the future, it will be important to design novel fixatives with significantly faster cross-linking rates than biomolecular interactions to eliminate fixation artifacts in the cell. It would be even more interesting if the authors could propose some ideas of potential novel fixatives. Did they test several concentrations of PFA, for example? Did they test different times of PFA incubation? Did they test cryofixation and do they know what would be their effect on LLPS? Do they have novel fixatives in mind? […] To strengthen the manuscript, the authors should try more protocols of fixation.”
We thank the reviewer for these good questions. As described in Response 1, we have done additional quantification of the change of LLPS appearance in cells upon treatment of 0% PFA (only PBS buffer), 1% PFA, 2% PFA, and 8% PFA as well as 4% PFA supplemented by 0.2% GA. We saw statistically significant changes in the LLPS-describing parameters upon all the PFA and PFA/GA treatments except the 0% PFA control. To examine how fixation artifacts depend on the time of PFA incubation, we acquired a time-lapse movie of a cell overexpressing EGFP-FUS(IDR) immediately after 4% PFA treatment and quantified the number of puncta over time (Video 1). We showed that fixation is complete (the number of puncta becomes constant) by roughly 100 seconds (Figure 1 – figure supplement 2). Our new data also justified our choice of a 10-minute PFA incubation time for analyzing fixation-induced change of LLPS appearance in the rest of the paper. Please see Response 1 for more details. Our new data and discussion have been added to the revised manuscript in Paragraph 3 on Page 3 and in Figure 1 - figure supplement 2 (time dependence of fixation artifacts), Figure 1 - figure supplement 3 (fixation artifact at various PFA concentrations), and Figure 1 - figure supplement 4 (fixation artifact upon treatment of 4% PFA supplemented with 0.2% GA).
We agree that testing more cell fixation protocols such as cryofixation on LLPS appearance would be interesting. However, given the complexity of novel fixation protocols like cryofixation and highly specialized equipment and reagents they require, testing widely how different fixation methods might change LLPS appearance would be a tremendous amount of work that is enough to fill a separate paper. These experiments would be much more appropriate for a separate study in the future.
Reviewer #3 (Public Review):
“Understanding whether/how fixation methods affect the detection of biomolecular condensates is of broad interest given the importance of LLPS in regulating different aspects of cell biology. However, in this manuscript, the authors use only paraformaldehyde as a fixation method and study only fluorescently-labelled IDR proteins. The work would benefit from a comparison between living cells and cells fixed with other fixation methods.”
We appreciate the reviewer for this suggestion and agree that more fixation protocols should be investigated. As described in Response 1 and Response 18, besides examining PFA fixation, we have quantified how fixation using 4% PFA supplemented by 0.2% GA changes LLPS appearance in cells. We saw statistically significant changes in all the LLPS-describing parameters upon PFA/GA treatments. Please see Response 1 and Response 18 for details. Our new data and discussion have been added to the revised manuscript in Paragraph 3 on Page 3 and in Figure 1 - figure supplement 4.
“In addition, it would be useful to test the impact of these fixation methods on the detection of endogenous proteins or IDR proteins without fluorescent tag.”
We appreciate the reviewer for this suggestion and have now investigated an endogenous IDR-containing protein in the revised manuscript. Specifically, we quantified the effect of 4% PFA fixation on endogenously expressed EWS::FLI1 in an Ewing sarcoma cell line A673, which is an oncogenic fusion transcription factor that causes Ewing sarcoma (Grünewald et al., 2018) and known to form local, high-concentration hubs at target genes associated with GGAA microsatellites (Chong et al., 2018). We previously Halo-tagged endogenous EWS::FLI1 in A673 cells using CRISPR/Cas9-mediated genome editing (Chong et al., 2018). Here, we quantified the effect of PFA fixation on endogenous EWS::FLI1 puncta in this knock-in cell line and found no significant difference in the distribution of EWS::FLI1 upon fixation. This result suggests that PFA fixation does not change the intracellular distribution of all proteins. Our new data and discussion have been added to the revised manuscript in Paragraph 1 on Page 8 and in Figure 3C.
Unfortunately, testing fixation artifacts of IDR-containing proteins without a fluorescent tag has been infeasible as we rely on fluorescence from a tag on the protein of interest to quantitatively compare LLPS appearance in live and fixed cells. Although we have considered using non-fluorescent methods, e.g., phase contrast microscopy, to visualize putative LLPS in cells, its lack of specificity in imaging proteins or cellular structures makes the type of quantification we do for fixation artifact characterization inaccessible.
Reviewer #3 (Public Review):
The authors compare the detection of biomolecular condensates in living cells overexpressing fluorescently tagged IDR proteins and upon fixation with paraformaldehyde (PFA). Given that they observe differences in the number and size of the condensates in the fixed versus living cells the authors conclude that the fixation method can introduce an artifact in the visualization of these condensates. Next, through kinetic modeling simulations, the authors propose a model in which the extent of the artifact introduced by PFA fixation correlates with the strength of the protein-protein interaction: artifacts are lower when the protein‐protein interactions are stable and less dynamic compared with the overall fixation rate. Based on their comparative analysis of PFA fixation and the kinetic modeling the authors strongly recommend caution in the interpretation of data obtained in PFA-fixed cells and suggest that parallel studies with living cells should be performed.
Understanding whether/how fixation methods affect the detection of biomolecular condensates is of broad interest given the importance of LLPS in regulating different aspects of cell biology. However, in this manuscript, the authors use only paraformaldehyde as a fixation method and study only fluorescently-labelled IDR proteins. The work would benefit from a comparison between living cells and cells fixed with other fixation methods; in addition, it would be useful to test the impact of these fixation methods on the detection of endogenous proteins or IDR proteins without fluorescent tag.
Testing frameworks often introduce their own abstractions for e.g. evaluation order, data validation, reporting, scope, code reuse, state, and lifecycle. In my experience, these abstractions are always needlessly different from (and inferior to) related abstractions provided by the language itself.
SPA2(3/4)-GFP
Are the additional bands from the cleaved GFP tag? Again, a WB against HY5, SPA, and GFP may elucidate these bands.
Author Response
Reviewer #3 (Public Review):
The authors use two-photon imaging to visualize various axonal organelle populations that they have virally labeled with fluorescent proteins, including DCVs and late endosomes/ lysosomes. The latter topic is a bit contentious, as the authors use two labels that tag potentially overlapping and not highly specific markers so that the nature of the tagged organelle populations remains unclear. Notably, the authors also have previously published a detailed account of how DCVs traffic in vivo, so the novelty is mostly in comparing the behavior of different organelles and the potential influence of activity.
Overall, the reported results mostly corroborate the expectations from previous in vitro and in vivo work on these organelles and other cargoes, performed by the authors and their collaborators, as well as in many other laboratories:
(i) Different organelles have different transport behaviors regarding speed, the ratio of anterograde to retrograde moving organelles, etc.
(ii) Organelles move in different ways when they pass specific anatomical landmarks in the axons, such as presynaptic terminals.
(iii) Activity of a neuron (here measured by calcium imaging) can impact the measured transport parameters, albeit in a subtle and mechanistically not well-defined manner. The chosen experimental design precludes a more detailed analysis, for example of the precise movement behavior (such as defining the exact pausing/movement behavior of organelles, which would require higher imaging speeds) or of a correlation of different organellar behavior at synaptic sites or during activity (which would require three-channel simultaneous imaging of two organelle classes plus a synaptic or activity marker).
In summary, this publication uses sophisticated in vivo labeling and imaging methods to corroborate and complement previous observations on how different axonal organelles move, and what influences their trafficking.
We thank the reviewer for the time dedicated to our manuscript. We are thankful for the critical and specific comments, which allowed us to further improve our manuscript. We agree that it would have been beneficial to have higher frame rates and there instead of two imaging channels. However, this would have further added technical complexity to an already complex experimental setup resolving fluorescent puncta with sizes below the resolution limit. And we are convinced that all our main conclusions are justified based on the imaging settings in the current data sets.
Reviewer #3 (Public Review):
The authors use two-photon imaging to visualize various axonal organelle populations that they have virally labeled with fluorescent proteins, including DCVs and late endosomes/ lysosomes. The latter topic is a bit contentious, as the authors use two labels that tag potentially overlapping and not highly specific markers so that the nature of the tagged organelle populations remains unclear. Notably, the authors also have previously published a detailed account of how DCVs traffic in vivo, so the novelty is mostly in comparing the behavior of different organelles and the potential influence of activity.
Overall, the reported results mostly corroborate the expectations from previous in vitro and in vivo work on these organelles and other cargoes, performed by the authors and their collaborators, as well as in many other laboratories:<br /> (i) Different organelles have different transport behaviors regarding speed, the ratio of anterograde to retrograde moving organelles, etc.<br /> (ii) Organelles move in different ways when they pass specific anatomical landmarks in the axons, such as presynaptic terminals.<br /> (iii) Activity of a neuron (here measured by calcium imaging) can impact the measured transport parameters, albeit in a subtle and mechanistically not well-defined manner. The chosen experimental design precludes a more detailed analysis, for example of the precise movement behavior (such as defining the exact pausing/movement behavior of organelles, which would require higher imaging speeds) or of a correlation of different organellar behavior at synaptic sites or during activity (which would require three-channel simultaneous imaging of two organelle classes plus a synaptic or activity marker).
In summary, this publication uses sophisticated in vivo labeling and imaging methods to corroborate and complement previous observations on how different axonal organelles move, and what influences their trafficking.
-<br
unnecessary use of br tag (breaks)
<ul> <li><h3>Latest News</h3></li> <li>Octtober 1:<br/>Lorem ipsum dolor sit</li><br /> <li>September 15th:<br/>Lorem ipsum dolor sit</li><br /> <li>September 10th:<br/>Lorem ipsum dolor sit</li> </ul>
i believe there should be more space between the heading tag and the content use after it. and the text size need to bigger for the content like month names, as i see in reference image.
<li>Octtober 1:<br/>Lorem ipsum dolor sit</li><br />
its not look same as image reference its better if you use heading tag to make month name as heading.
Most of the tourist and sporting infrastructure had to be built at enormous expense — estimates range anywhere from$200 billion to $300 billion. Yet the return on investment for huge events like this is rarely positive. The Olympics are infamously pricey to put on, and the economic benefits for residents of the host city are questionable. So, with the big price tag and not much to show in return, why do countries like Qatar, Russia and Brazil offer up billions of dollars to host global sporting events? According to Victor Matheson, a professor of economics at the College of the Holy Cross and a former Major League Soccer referee, they may be seeking to burnish their reputations through international media coverage. “If you’re putting any sort of significant money into infrastructure like Qatar obviously is doing, there’s just no way you can make that back on ticket sales, on media rights, [or] on the amount of money you make from tourists coming to visit your country,” Matheson said in an interview with Marketplace’s David Brancaccio. “So obviously, you’re hoping for some sort of long-run benefits, some sort of legacy, and often that is an improvement in your reputation, either as a tourist destination or as a world player in some ways.”
Alternate thesis for why countries and cities vie to host money-losing events like the World Cup and the Olympics: grift.
With the necessary need for building infrastructure, there's easy and ample opportunity for cooking the books and pushing cash flow into the pockets of contractors and political figures as well as into the pockets of the governing bodies and their officials.
Cross reference FIFA bribery
Some of the money may go into the local economy and workers which is good, but who's really benefitting here? Where is the money going? Who is footing the loss? It can't all be written off to goodwill.
<div class="evaluation"> <a id="communicate-2"></a> <h3><em>Problem: </em>These webpages don’t have appropriate headings. For example, there is no h1 in “Home” webpage.</h3> <figure> <img src="images/Home.PNG" alt="Home page of Ascent Physiotherapy"> <figcaption>There is no h1 tag. </figcaption> </figure> <h3><em>Solution: </em>Put appropriate headings on each page.</h3> </div> <div class="evaluation"> <a id="communicate-3"></a> <h3><em>Problem: </em><br> There are some difficult words and long sentences in some webpages.</h3> <p>In “Products & Services” page, although there are links to explain the difficult words, but not all words have links.</p> <p>In “Our team” page, some long sentences make users give up reading.</p> <figure> <img src="images/Products&Services.PNG" alt="Difficult_words in Ascent Physiotherapy"> <figcaption>For example, TMJ is an abbreviation. </figcaption> </figure> <figure> <img src="images/Our_team.PNG" alt="Long sentences in Our team page"> <figcaption>For example, TMJ is an abbreviation. </figcaption> </figure>
looks and nice and you have mentioned nicely
<article class="card">
most of the time I use the "Div" tag instead of "article". I feel it gets easy to work with "Divs". "article " is not the issue still
<article class="box-1"> <div> <h1>Write to Communicate</h1> <p>While analyzing this site the first thing I observed was how messy the content was. The content is not grouped in the blocks. It is hard to find headings as the color does not have enough contrast. The language used is not descriptive and accurate enough. For example, in the main headline it just says “Trending???” which doesn’t make any sense. It should be like “Looking for Trending fits?” The size should be a bit large and there should be a button for call-to-action. </p> </div> <img src="images/Screenshot (73).png"> </article>
you can use the "main" tag here for the web content. It'll be good to have both header and footer too.
<h1>Assignment E</h1>
You can use this h1 tag in header section.
ArtículoHDBIOcolores
Zotero
Hello
Author Response
Reviewer #2 (Public Review):
Grasses develop morphologically unique stomata for efficient gas exchange. A key feature of stomata is the subsidiary cell (SC), which laterally flanks the guard cell (GC). Although it has been shown that the lateral SC contributes to rapid stomatal opening and closing, little is known about how the SC is generated from the subsidiary mother cell (SMC) and how the SMC acquires its intracellular polarity. The authors identified BdPOLAR as a polarity factor that forms a polarity domain in the SMC in a BdPAN1-dependent manner. They concluded that BdPAN1 and BdPOLAR exhibit mutually exclusive localization patterns within SMCs and that formative SC division requires both. Further mutant analysis showed that BdPAN1 and BdPOLAR act in SMC nuclear migration and the proper placement of the cortical division site marker BdTANGLED1, respectively. This study reveals a unique developmental process of grass stomata, where two opposing polarity factors form domains in the SMC and ensure asymmetric cell division and SC generation.
The findings of this study, if further validated, are novel and interesting. However, I feel that the data presented in the current manuscript do not fully support some crucial conclusions. The lack of dual-color images is the weakest point of this study. If it is technically impossible to add them, alternative analyses are needed to validate the main conclusions.
1) Is BdPOLAR-mVenus functional? Although the authors interpret that weak BdPOLAR-mVenus expression partially rescued the bdpolar mutant phenotype in Fig. S4D, the localization pattern visualized by BdPOLAR-mVenus may not be completely reliable with this partial rescue activity.
This is indeed a valid point. The partial complementation of weakly expressing translational reporters (Figure 3–figure supplement 1D) and the weak effect of BdPOLAR-mVenus overexpression lines (Figure 3–figure supplement 1J) at least suggest partial functionality which is strongly dependent on dosage. Yet the localization pattern and the temporal dynamics might indeed not fully reflect the spatiotemporal dynamics of the endogenous BdPOLAR. This criticism is, however, true for any transgenic reporter line–even when fully complementing–as the requirement for dosage, stability, and turnover likely varies strongly between different protein classes and functions.
Nonetheless, we have added a sentence on p. 7, which mentions this potential caveat.
2) Regardless of the functionality of the tagged protein, the authors need to provide more information on their localization. For example, is there a difference in polarity pattern depending on expression level? Does overexpressed BdPOLAR-mVenus invade the BdPAN1 zone? In such cases, might the loss of BdPOLAR polarity in the bdpan1 mutant be a side effect of overexpression, not PAN1 exclusion? Does BdPOLAR expression (no tag) show a dose-dependent effect, similar to the mVenus-tagged protein?
The difference in polarity patterns in bdpan1 mutants and wild-type does not depend on expression level. BdPOLAR-mVenus was crossed into bdpan1 and mutant and wild-type siblings in the F2 generation were analyzed. This means that the data presented in Fig. 3E and F show exactly the same transgene insertion line in wt and bdpan1 and were imaged with the same setting for comparability. Therefore, the difference in localization is not due to different expression levels but indeed reflects a PAN1-dependent effect.
To address if BdPOLAR without a tag is also sensitive to dosage, we have generated an untagged complementation line that includes the untagged, genomic locus of BdPOLAR including promoter (-3.1kb) and terminator (+1.1kb). Yet, even though this construct is much better at rescuing the mutant, we still see remaining defects in T0 lines (Figure 3–figure supplement 1K) suggesting that even without a tag we cannot fully recapitulate wild-type functionality. Yet, to actually measure protein levels of untagged BdPOLAR, we would need to raise an antibody against BdPOLAR, which we think is clearly out of the scope of this study.
3) A major conclusion of this study was that the polarity domains of BdPOLAR and BdPAN1 are mutually exclusive. However, not all the cells in the figures were consistent with this statement. For example, the BdPOLAR signals at the GMC/SMC interphase appear to match BdPAN1 localization (compare 0:03 s in Video 1 and 0:20 s in Video 2 [top cell]). The 3D rendered image in Fig. 2F shows that BdPOLAR is excluded near the GMC on the front side of the SMC, where BdPAN1 is not localized. Some cells did not exhibit polarization (Fig. 3A, bottom left; Fig. 3E, bottom left). The most convincing data are the dual-color images of these two proteins. Otherwise, a sophisticated image analysis is required to support this conclusion.
We agree that dual-color image analysis would have provided the most convincing data. As mentioned in our answers to the reviewing editor and reviewer 1, we have generated a dual marker line (BdPAN1p:BdPAN1-CFP; BdPOLARp:BdPOLAR-mCitrine), yet the BdPAN1-CFP signal (compared to mCitrine signal) was too weak to visualize the proximal BdPAN1 domain.
This issue was also raised by reviewer 1 and deemed an essential revision. To determine how BdPOLAR and BdPAN1 relate spatially to each other, we have added data in Figure 2E where we manually traced mature SMC outlines to determine BdPOLAR-mVenus and BdPAN1-mCitrine occupancy along the SMC’s circumference. This confirmed that the polarization is indeed opposite yet not perfectly reciprocal (see details above, Essential Revisions #1).
Finally, we realized that the 3D image renderings were more confusing than helpful and we removed them from the revised version.
4) Another central conclusion was that BdPOLAR was excluded at the future SC division site, marked with BdTANGLED1. However, these data are also not very convincing, as such specific exclusion cannot be seen in some figure panels (e.g., Fig. 3A, bottom left; Fig. 3E, all three cells on the left). If dual-color imaging is not feasible, a quantitative image analysis is needed to support this conclusion.
As for point 3, this was also criticized by reviewer 1 and deemed an essential revision by the reviewing editor.
To determine whether the absence of BdPOLAR signal and the presence of BdTAN1 signal colocalize, we again manually traced mature SMC outlines to determine BdPOLAR-mVenus and BdTAN1-mCitrine occupancy along the SMC’s circumference. We plotted the relative average fluorescence intensity in Figure 4G-I nicely showing that BdTAN1 indeed resides in the BdPOLAR gaps above and below the GMC (again, details above, Essential Revisions #2).
5) I could not find detailed imaging conditions and data processing methods. Are Figs. 2B and 2E max-projection or single-plane images? If they are single-plane images, which planes of the SMC are observed? In addition, how were Figs. 2C and 2F rendered? (e.g., number of images, distance intervals, processing procedures). This information is important for data interpretations.
We agree that we might not have provided sufficient imaging condition details and have added more details regarding image acquisition in the method part (p. 20). We always use a consistent depth and show the midplane of SMCs. As mentioned above, we removed Figs. 2C and 2F and the supplemental movies as these data did not seem to be helpful.
6) [Minor point] The authors should clearly describe where BdPAN1 is expressed and localized. Is it expressed in the GMC and localized at the GMC/SMC interface? Alternatively, is it expressed and localized in the SMC?
BdPAN1 is expressed throughout the epidermis but starts to strongly accumulate at the GMC/SMC interface. According to the literature (Cartwright et al 2009 with immunostainings against ZmPAN1 and Sutimantanapi et al. 2014 with PAN1 and PAN2 reporter) and our own observations (Fig. S3), this accumulation occurs in the SMC rather than in the GMC. In Fig. S3A, third panel, second GMC from the top, for example, one can see that the early PAN1 polarity domain expands beyond the GMC/SMC interface suggesting that it is indeed forming in SMCs rather than in GMCs. We have specified this in the text more clearly now (p. 5).
Reviewer #2 (Public Review):
Grasses develop morphologically unique stomata for efficient gas exchange. A key feature of stomata is the subsidiary cell (SC), which laterally flanks the guard cell (GC). Although it has been shown that the lateral SC contributes to rapid stomatal opening and closing, little is known about how the SC is generated from the subsidiary mother cell (SMC) and how the SMC acquires its intracellular polarity. The authors identified BdPOLAR as a polarity factor that forms a polarity domain in the SMC in a BdPAN1-dependent manner. They concluded that BdPAN1 and BdPOLAR exhibit mutually exclusive localization patterns within SMCs and that formative SC division requires both. Further mutant analysis showed that BdPAN1 and BdPOLAR act in SMC nuclear migration and the proper placement of the cortical division site marker BdTANGLED1, respectively. This study reveals a unique developmental process of grass stomata, where two opposing polarity factors form domains in the SMC and ensure asymmetric cell division and SC generation.
The findings of this study, if further validated, are novel and interesting. However, I feel that the data presented in the current manuscript do not fully support some crucial conclusions. The lack of dual-color images is the weakest point of this study. If it is technically impossible to add them, alternative analyses are needed to validate the main conclusions.
1. Is BdPOLAR-mVenus functional? Although the authors interpret that weak BdPOLAR-mVenus expression partially rescued the bdpolar mutant phenotype in Fig. S4D, the localization pattern visualized by BdPOLAR-mVenus may not be completely reliable with this partial rescue activity.<br /> 2. Regardless of the functionality of the tagged protein, the authors need to provide more information on their localization. For example, is there a difference in polarity pattern depending on expression level? Does overexpressed BdPOLAR-mVenus invade the BdPAN1 zone? In such cases, might the loss of BdPOLAR polarity in the bdpan1 mutant be a side effect of overexpression, not PAN1 exclusion? Does BdPOLAR expression (no tag) show a dose-dependent effect, similar to the mVenus-tagged protein?<br /> 3. A major conclusion of this study was that the polarity domains of BdPOLAR and BdPAN1 are mutually exclusive. However, not all the cells in the figures were consistent with this statement. For example, the BdPOLAR signals at the GMC/SMC interphase appear to match BdPAN1 localization (compare 0:03 s in Video 1 and 0:20 s in Video 2 [top cell]). The 3D rendered image in Fig. 2F shows that BdPOLAR is excluded near the GMC on the front side of the SMC, where BdPAN1 is not localized. Some cells did not exhibit polarization (Fig. 3A, bottom left; Fig. 3E, bottom left). The most convincing data are the dual-color images of these two proteins. Otherwise, a sophisticated image analysis is required to support this conclusion.<br /> 4. Another central conclusion was that BdPOLAR was excluded at the future SC division site, marked with BdTANGLED1. However, these data are also not very convincing, as such specific exclusion cannot be seen in some figure panels (e.g., Fig. 3A, bottom left; Fig. 3E, all three cells on the left). If dual-color imaging is not feasible, a quantitative image analysis is needed to support this conclusion.<br /> 5. I could not find detailed imaging conditions and data processing methods. Are Figs. 2B and 2E max-projection or single-plane images? If they are single-plane images, which planes of the SMC are observed? In addition, how were Figs. 2C and 2F rendered? (e.g., number of images, distance intervals, processing procedures). This information is important for data interpretations.<br /> 6. [Minor point] The authors should clearly describe where BdPAN1 is expressed and localized. Is it expressed in the GMC and localized at the GMC/SMC interface? Alternatively, is it expressed and localized in the SMC?
Reviewer #2 (Public Review):
The study aims to characterize the role of lncRNA H19 in senescence and proposes a mechanism involving CTCF and the activation of p53. The authors suggest that H19 loss induces let7b-mediated repression of EZH2, which is a critical component in the regulation of senescence-associated genes. Additionally, the authors state that H19 is required for inhibition of senescence by the mTOR inhibitor rapamycin.
The experiments appear to be performed to a high standard, and the individual observations, and conclusions about the importance of the individual players in senescence appear solid. For example, the authors convincingly show that H19 decreases in expression in aged cells/tissues and that its knockdown leads to entry into senescence. These results are consistent with recent studies in other systems (e.g., ref 38). Also, the knockdown of CTCF convincingly leads to senescence. However, these observations are largely not very surprising/novel. The premise of the manuscript is a connection between these components into a particular "axis" that regulates entry into senescence. This connection between the different regulators studied (H19, CTCF, EZH2, p53), and in particular, their specificity, which is key to the proposed "axis" remains insufficiently supported, and many of the results, unfortunately, appear to be over-interpreted.
Major comments
1. In Figure 1, the authors claim that H19 levels are reduced during aging in vitro and in vivo and that H19 levels are maintained by rapamycin treatment. To state the connection between H19 and rapamycin and its relation to aging, there is a need to show what happens in "young" cells treated with rapamycin.
Furthermore, the authors state that H19 "is essential for the inhibitory effect of rapamycin on cellular senescence". There doesn't appear to be sufficient evidence to support such a claim; additional data emphasizing the direct connection between H19 and rapamycin is needed - e.g., show that in H19-null cells rapamycin does not affect senescence.
2. CTCF is a general regulator involved in various cellular processes and supporting progression through the cell cycle; therefore, its perturbation can lead to global effects on cell health that are not necessarily related to H19. The data shown in figure 2 is insufficient to indicate a direct correlation between CTCF and H19. This will require showing that mutating specifically the CTCF binding sites near H19 affects senescence.
The same applies to the connection between H19 and let-7b shown in Figure 5. It is not very surprising that let-7b, a general antagonist of proliferation, positively regulates senescence. Here as well, the direct connection to H19 is weak. Can the authors rescue the cells that enter senescence following H19 depletion by H19 expression? If so - is this rescue capacity lost when let-7 sites are mutated? Is it possible to rescue by expressing an artificial let-7 sponge instead of H19? Otherwise, let-7b could very well be another factor related to senescence and/or regulated, but not the main mediator of the effects of H19, or part of an axis that includes H19, as proposed in the manuscript.
3. In figures 2d,3f,5i/j the authors present only representative tracks and regions from CUT&Tag-experiments, and its not clear to what extent these changes are significant when considering genome-wide data, replicates etc., and so these data are uninterpretable. This is important, as these panels are used as evidence for specific connections between members of the axis. The authors should provide a statistical test for all the regions in the genome, based on replicates, and show that these changes are significant to use these data to support their model. Otherwise, the specific connection between CTCF and H19 remains weak, and the specific change in p53 regulation of CTCF in the context of senescence is not convincing. In any case, the number of replicates and the QC of the data should be presented, and the data should be made available to the reviewers.
4. The authors state in the Discussion that the mechanism that lead to decreased H19 expression as part of the senescence program consists of two phases: an acute response driven by p53 activation and a prolonged response dictated by the loss of CTCF. There doesn't appear to be enough evidence to support this claim, as the individual experiments don't measure any such bi-phasic phenomena.
{ "inquiry": "affordability", // new "amount": 100000, // mandatory "currency": "INR", // mandatory "customer": { "id": "cust_JbRkXMROZUMCVq", "contact": "+919000090000", // mandatory "alternate_contact": "9900099000", // new "imei": "6234672537253752735", // new "ip": "105.106.107.108", // new "referrer": "https://merchansite.com/example/paybill", // new "user_agent": "Mozilla/5.0", // new "addresses": [ // new { "name": "Gaurav Kumar", "line1": "SJR Cyber Laskar", "line2": "Hosur Rd", "landmark": "Adugodi", "zipcode": "560030", "city": "Bangalore", "state": "Karnataka", "contact": "9000090000", "tag": "office", "type": "shipping" }, { "name": "Gaurav Kumar", "line1": "Arena Building", "line2": "Hosur Rd", "landmark": "Adugodi", "zipcode": "560030", "city": "Bangalore", "state": "Karnataka", "contact": "9000090000", "tag": "home", "type": "billing" }, { "name": "Gaurav Kumar", "line1": "SJR Cyber Laskar", "line2": "Hosur Rd", "landmark": "Adugodi", "zipcode": "560030", "city": "Bangalore", "state": "Karnataka", "contact": "9000090000", "tag": "office", "type": "saved" } } }, { "instruments": [ { "method": "emi", "issuers": [ "HDFC" ], "types": [ "debit" ] }, { "method": "cardless_emi", "providers": [ "zestmoney", "walnut369" ] }, { "method": "paylater", "providers": [ "simpl", "lazypay" ] } ] }
please update the sample code. I have fixed it and am sending on slack
<hr>
good call using the
I don't think a new tag makes sense here, at least not yet.
creating the new tag as a synonym.
</d>
This closing tag is unnecessary you can remove it.
<!DOCTYPE html>
missing head and closing head before the body tag
https://hypothes.is/search?q=tag%3A%27etc556+etcnau%27
Randomly ran across a great tag full of education resources...
Seems to be related to this class:<br /> ETC 556 - Contexts And Methods Of Technology In Adult Education
Description: This course is designed for adult educators in the various contexts, including: higher education, military, non-profit, health and business settings. Through research, readings and collaborative activities, students will gain an understanding of various adult learning methods that include, but are not limited to, training, professional development, performance improvement, online and mobile learning. Letter grade only.
https://catalog.nau.edu/Courses/course?courseId=011553&catalogYear=2223
div
comment tag again could be used to differentiate which closing div relates to which div class
<br>
Without using the <br> tag you can achive the new line by adjusting the width of the block.
<figure> <img src="images/home.png" alt="" width="900" height="500" /> <figcaption> The Home page of the phiarchitecture website. </figcaption> </figure> <figure> <img src="images/About.png" alt="" width="900" height="500" /> <figcaption> The About page of the phiarchitecture website. </figcaption> </figure> <figure> <img src="images/Project.png" alt="" width="900" height="500" /> <figcaption> The Projrct page of the phiarchitecture website. </figcaption> </figure>
It's better to have some space between each tag in order to understand the code easy(i.e., visibility must be good).
Copyright © 2022 All Rights Reserved North Island College Digital Design and Development
You may want to add small tag to this sentence.
line-height: 1.8rem; padding: 10px 0; }
take off the padding on the li and give it to the a tag so you can hover less over the word to select the link, makes it better for accessibility.
Reviewer #3 (Public Review):
This manuscript will be of interest primarily to researchers in the field of NADPH oxidases (NOXs) but also to those interested in the wider ferric reductase superfamily, also comprising members of the six-transmembrane epithelial antigen of the prostate enzymes (STEAPs). More limited interest may be expressed by investigators of ferredoxin - NADP reductases, resembling the dehydrogenase region (DH) of NOXs, expressing lesser "visibility" in the structure described in the paper. Considering the fact that NOXs are essentially electron transport machines from NADPH to dioxygen, along a multi-step redox cascade, those interested in hydride and electron transfer, at a more conceptual level, might also want to have a look at the paper. Elucidating structures of NOXs are still rare achievements, with only four published papers, so far (one coming from the group of the present main author) and, thus, any new publication profits from the aura of novelty.
Introduction<br /> This manuscript offers a detailed and in depth description of the structure of the catalytic core of the human phagocyte NADPH oxidase, NOX2, in heterodimeric association with the protein p22phox. The phagocyte NADPH oxidase is responsible for the production of reactive oxygen species (ROS), the primary molecule of which is the superoxide radical (O2.-), derived by the one-electron reduction of molecular oxygen by NADPH. NOX2 belongs to the NOX family, consisting of 7 members (NOX 1-5, and DUOX1 and DUOX2), sharing common structural characteristics but expressing a wide variety of functions. The principal but not the only function of NOX2 is as a source of ROS for the killing of pathogenic microorganisms (bacteria, fungi, protozoa) engulfed by phagocytes in the course of innate and acquired immunity.
The structures of C. stagnale NOX5, and that of murine and human DUOX1 were determined by X-ray crystallography (NOX5) and cryo-EM (DUOX1). As sources of potentially dangerous auto-toxic ROS, NOXs are subject to strict functional regulation. Whereas Nox5 and the DUOXs are regulated by Ca2+, NOXs 1, 2, and 3 are regulated by several cytosolic proteins, that associate with the Nox2-p22phox dimer forming the active O2.-generating complex. The paramount model of cytosolic regulation is Nox2 and the "dream" of structure investigators is to elucidate the structure of NOX2 in both resting and activated states.
Achievements<br /> Note: When this paper was received for review, this reviewer was not aware of any publication dealing with the structure of human Nox2. However, on October 14, 2022 a paper was published on line, dealing with the structure of Nox2 (S. Noreng et al., Structure of the core human NADPH oxidase Nox2, Nature Communications (2022)13:6079). This review will not discuss the present manuscript in relation to the paper by S. Noreng et al.
This manuscript is successful in describing the structure of the NOX2-p22phox heterodimer using cryo-EM methodology. In order to compensate for the small size of the complex, use was made of the Fab of a monoclonal anti-Nox2 antibody binding an anti-light chain tagged nanobody. In order to mimic as much as possible the milieu of NOX2-p22phox in the phagocyte membrane bilayer, the authors reconstitute the quaternary complex in a nanodisc, using soybean phosphatidylcholine (PC) and a membrane scaffold protein (MSP). To the best of my knowledge, this is the first report of studying a NOX in a nanodisc, for both function and structure. Peptidiscs were used in determining the structure of human DUOX1 by a group led by the main author of this paper, but nanodiscs offer the advantage of adding a phospholipid chosen by the investigator. The purified nanodiscs incorporating the quaternary complex led to successful structure determination of the transmembrane domain (TMD), extracellular and intracellular loops, inner and outer hemes, distances between hemes and FAD to inner heme, and a hydrophilic tunnel connecting the exterior of the cell to the oxygen-reducing center of NOX2. The structure of the dehydrogenase region (DH) was less well defined; the FAD-binding domain (FBD) was more visible than the NADPH-binding domain (NBD). The structure of p22phox and the interface between Nox2 and p22phox are well described.
The mutations in NOX2 and p22phox causative of the deficient bactericidal function in Chronic Granulomatous Disease are related in detail to the location and role of the mutated residues as revealed by the solved structure.<br /> The authors make it clear that the structure, as presented, is in the resting state. The distances between hemes are suitable for electron transfer but the distance between FAD, in the FBD, and the inner heme is too large for transfer. The poor quality of the obtained structure of the DH (especially, the NBD), even after local refinement focusing, suggests its flexibility (mobility?) relative to the TMD and that, in NOX2, the DH is "displaced" relative to the TMD, when compared to the situation in the activated (by Ca2+) DUOX1. The mobility of NBD in NOX2 also results in weak interaction with FBD, making hydride transfer from NADPH to FAD inefficient
A major achievement of the work described in this manuscript is what I believe to be the first description of the activation of recombinant NOX2-p22phox in a nanodisc, to generate O2.-, when activated by a trimeric fusion protein (trimera), consisting of the functionally important parts of the three cytosolic components, p47phox, p67phox, and Rac (see Y. Berdichevsky et al., J. Biol. Chem. 282, 22122-22139, 2007). This proves that the resting state structure of NOX2-p22phox has all that is needed to be converted to the activated state. The fact that the nature of the phospholipid in the nanodisc can be varied and that this is known to have a major effect on the affinity of the trimera for NOX2-p22phox, offers additional advantages.
Weaknesses<br /> A weakness of this, otherwise impressive work, is the difficulty for readers who are not sufficiently "structure educated" to fully understand the "displacement" of the DH of NOX2, shown in the NOX2/DUOX1 overlay (Figure 5). The meaning of "centers of mass" of FBD and FAD, in Figures 5C and 5D, respectively, is not properly explained.
Yet another weakness is the much too vague wording of the change in NOX2 conformation from the resting to the activated state by cytosolic factors as "the cytosolic factors might likely stabilize the DH of NOX2 in the "docked" conformation which is similar to that observed in the activated DUOX1 in the high-calcium state". First, the evidence from biochemical studies of NOX2 activation indicates clearly distinct targets of individual cytosolic components and not a "block" action. There is also support for the conformational change being the result of the action of a single cytosolic component (p67phox), with the other cytosolic components acting as carriers or activators of one cytosolic component by another, such as Rac-GTP acting as a carrier and inducer of a conformational change in p67phox (see J. El-Benna and P.M-C. Dang, J. Leukoc. Biol. 110, 213-215, 2021, and E. Bechor et al., J. Leukoc. Biol. 110, 219-237, 2021). Also, the concept of "docking of the DH to the TMD" seems like an oversimplification of the many locations and partners of such "docking" and ignores the possible multiple consequence of such docking. Even before the appearance of structural studies of NOXs, revealing precise distances between redox stations (NADPH-FAD; FAD-inner heme; inner heme - outer heme), as first reported for C. stagnale Nox5, by F. Magnani et al., Proc. Natl. Acad. Sci. U.S.A. 114, 6764-6769, 2017, a shortening of the distance between an electron donor and acceptor at specific locations in the redox cascade was proposed. The most popular was the NADPH - FAD hydride transfer, based on structural work by P.A. Karplus on Ferredoxin - NADP reductases, the accepted model for the DH of NOXs.
An unfair request for an unachieved task<br /> Of course, the dream of those hoping for a structure-based response to solving the molecular mechanism of NOX activation is to see the structure of the activated NOX2 in complex with three cytosolic components. The compelling finding in the present manuscript that a nanodisc-embedded recombinant NOX2-p22phox can be activated to ROS production by the use of a [p47phox-p67phox-Rac] trimera (replacing three cytosolic components) will provoke in all the readers the wish to see the structure of such a complex. The size of the trimera with a GFP tag (108 kDa) might make the use of the anti-Nox2 Fab and anti-light chain nanobody, unnecessary. Prenylation of the trimera at the Rac moiety is bound to markedly enhance its affinity for the phospholipids in the nanodisc and is likely to generate a more stable complex, most suitable for cryo-EM (see A. Mizrahi et al., J. Biol. Chem. 285, 25485-25499, 2010).
Is there a way to search for your replies to someone's public annotations?
Currently, they don't show up when I search my user name and the tag I used in the reply. Is there an elegant way to search for these annotations and my reply to them?
This palpable, active, ongoing grief is a non-negotiable part of this period of immense change. Grief is one of the most beautiful and difficult ways we love. As we grieve we feel our humanity and connection to each other. Building the path from this heartbreaking present to a future where we center our collective existence in love and care is where we come in. We are the ones shining light on the lies and inconsistencies in our current reality, and we are the ones dreaming up, remembering and practicing mutual ways of being in community with each other. We are learning how to grieve without disappearing, and we are refusing to normalize this terror. We are scholars of belonging and accountability, releasing ourselves from the reductive protocols of punitive culture. We are protesting injustice wherever we find it, while forging the pathways to a justice we cocreate. We are releasing either/or thinking, and we are outgrowing every construct meant to divide and disempower us. We understand that this is an extinction point, and we are not just interested in survival – we want a just world for future generations and for the earth. Each day, we are the ones creating more possibilities. We at ESII see how this community is showing up to hold each other, to grieve, to care for each other, to practice the future together. We love you, we trust you, we grieve with you, and we change with you.

adrienne maree brown 'The only way to deal with an unfree world is to become so absolutely free that your very existence is an act of rebellion.' – camus…documenting my liberation
<img class="logo-img" src="images/dgl-logo.png" alt="DGL logo" width="80">
I agree with Sahil. I think creating a link to the homepage by placing the img inside an anchor tag would be ideal .
<p> Tessa Warman</p>
This probably could have been an h2 tag, there will be alot of contrast between Assignment E and your name with it being a paragraph.
<p></p>
Not totally sure why you have an open and closed paragraph tag.
<p class="footerheading">About us:</p>
You can use h tag instead of p.
