No, no la practico
Si A veces / algunas actividades No No estoy segura/o
No, no la practico
Si A veces / algunas actividades No No estoy segura/o
Reviewer #2 (Public Review):
In this study, Pinatel et al. address the role of interneuron myelination in the hippocampus using a 4.1B protein mouse knockout model. They show that deficiency in 4.1B significantly reduces myelin in CA1 stratum radiatum, specifically myelin along axons of parvalbumin and somatostatin hippocampal interneurons. In addition, there are striking defects in the distribution of ion channels along myelinated axons, with misplacement of Na channel clusters along the nodes of Ranvier and the heminodes, and a pronounced decrease in potassium channels (Kv1) at juxtaparanodes. The axon initial segments of SST are also shorter. Because the majority of myelinated axons in the stratum radiatum of the hippocampus belong to PV and SST interneurons such profound changes in myelination are expected to affect interneuronal function. Interestingly, the authors show that PV basket cells' properties appear largely unaffected, while there are substantial changes in stratum oriens O-LM cells. Inhibitory inputs to pyramidal neurons are also changed. Behaviorally, the 4.1B KO mice exhibit deficits in spatial working memory, supporting the role of interneuronal myelination in hippocampal function. This study provides important insights into the role of myelination for the function of inhibitory interneurons, as well as in the mechanisms of axonal node development and ion channel clustering, and thus will be of interest to a broad audience of circuit and cellular neuroscientists. However, the claims of the specificity of the reported changes in myelination need to be better supported by evidence.
Strengths:<br /> The authors combine a wide array of genetic, immunolabeling, optical, electrophysiological, and behavioral tools to address a still unresolved complex problem of the role of myelination of locally projecting inhibitory interneurons in the hippocampus. They convincingly show that changing myelination and ion channel distribution along nodes and heminodes significantly impairs the function of at least some interneuron types in the hippocampus and that this is accompanied by behavioral deficits in spatial memory.
Regarding the organization of myelinated axons, the lack of 4.1B causes striking changes at the nodes of Ranvier that are convincingly and beautifully presented in the Figures. While the reduction in Kv1 in 4.1B KO mice has been previously reported, the mislocalization of sodium channels at the nodes and heminodes had only been observed in developing but not adult spinal cords. This difference in the dependence of the sodium channel distribution on 4.1B in adult hippocampus vs spinal cord may hold important clues for the varying role of myelin along axons of different neuronal types.
The manuscript is very well written, the discussion is comprehensive, and provides detailed background and analysis of the current findings and their implications.
Weaknesses:<br /> Because of the wide diversity of interneuron types in the hippocampus, and also the presence of myelinated axons from other neuron types as well, including pyramidal neurons, it is very difficult to disentangle the effects of the observed changes in the 4.1 B KO mouse model. While the authors have been careful to explore different possibilities, some of the claims of the specificity of the reported changes in myelination are not completely founded. For example, there is no compelling evidence that the myelination of axons other than the local interneurons is unchanged. The evidence strongly supports the claims of changes in interneuronal myelination, but it leaves open the question of whether 4.1B lack affects the myelination of hippocampal pyramidal neurons or of long-range projections.
To be able to better interpret the changes in the 4.1B KO mice, knowledge of the distribution of 4.1B in the hippocampus of control mice will be very helpful. The authors state that 4.1B is observed in PV neurons but not in pyramidal neurons, however, the evidence is not convincing. Thus, the lack of immunolabeling at the pyramidal neuron cell bodies does not indicate that 4.1B is missing at the axonal level. The analysis also leaves out the question of whether 4.1 B is seen in the axons of somatostatin neurons.
Art. 5º O advogado postula, em juízo ou fora dele, fazendo prova do mandato.
§ 1º O advogado, afirmando urgência, pode atuar sem procuração, obrigando-se a apresentá-la no prazo de quinze dias, prorrogável por igual período.
§ 2º A procuração para o foro em geral habilita o advogado a praticar todos os atos judiciais, em qualquer juízo ou instância, salvo os que exijam poderes especiais.
§ 3º O advogado que renunciar ao mandato continuará, durante os dez dias seguintes à notificação da renúncia, a representar o mandante, salvo se for substituído antes do término desse prazo.
§ 4º As atividades de consultoria e assessoria jurídicas podem ser exercidas de modo verbal ou por escrito, a critério do advogado e do cliente, e independem de outorga de mandato ou de formalização por contrato de honorários.
we recorded the brain activity of people while they're watching the performance, over 10 performances of "O," which is iconic Cirque performance.
En lugar de solo pedir recursos o material, sea específico sobre el tipo de actividad que desearealizar. Por ejemplo, trate de pedir "recursos prácticos e interactivos" o "recursos creativosy únicos"
Importante para recursos interactivos.
Cree una prueba corta con 5 preguntas de opción múltipleque evalúe la comprensión de los estudiantes sobre [el concepto que estaenseña]
Creación de evaluaciones cortas. Útil para evaluaciones de temas cortos al final de la clase o de la semana.
What is PWA software and how to install it..
SSuite WordGraph Editor v8.50.2
Free Software Categories
SSuite Office Software Made SimpleFree Software Created with Pure Visual Simplicity
Note: This rebuttal was posted by the corresponding author to Review Commons. Content has not been altered except for formatting.
Learn more at Review Commons
Manuscript number: RC-2023-01991
Corresponding author(s): Chaitanya A. Athale
*We are grateful to the editors sending our manuscript out to review, and the reviewers for the careful reading and critical comments. In the following sections we describe our plan for revisions that will address the comments of the reviewers. We have added these in a point-wise manner. In summary most of the comments are addressable with additional experiments, simulations and data analysis. These will indeed serve to strengthen the findings without altering the fundamental findings. However, we would require upto 90 days to make these changes. *
Description of the planned revisions
Reviewer #1 Evidence, reproducibility and clarity
Summary: This work combines in-vitro experiments and numerical modeling to study the dynamics ofmicrotubules, driven by molecular motors. In this bottom-up approach, molecular motors areimmobilized on the surface and microtubule filaments are anchored to the surface from one end. The dynamics results in "beating like" motion of the anchored microtubules. The authors establish aphase diagram of the different dynamical patterns of "beating like" motions by varying the molecular motor density and the length of the microtubule anchored to the surface. They use a numerical framework that captures the observed patterns.
Our response: We are grateful to the reviewer for the careful reading and agree with the summary of our work. In the following sections we detail how we plan to address the specific comments.
Major comments:
1. Overall the experiments and results are well described and claims are supported by the data.
Both experimental and numerical methods are presented in a way that they can be reproduced.
Our response: We are grateful for the reviewer’s assessment about our findings and presentation of the results.
Minor comments:
1. A key feature of beating cilia is the asymmetry of the beat pattern (fast stroke and slow recovery). It might be interesting to use the kymographs or the Phy vs time analysis to see whether or not this feature exists in this simplified experimental model.
Our response: We agree with the reviewer that it could be of interest to examine whether the dynamics of the tip-angle phi (φ) shows a difference between the strokes at onset and return, to compare to the fast-slow asymmetry observed in cilia. This will be approached in two ways:
1) We will obtain more data from more fields of view
2) Use the time-derivative of the tip-angle, phi (φ) dynamics to examine whether the onset and return strokes are asymmetric and how this compares to ciliary dynamics.
3) We will also analyze the tangent angle to the contour, psi (ψ) plots with time (y-axis) and MT length (x-axis).
A qualitative analysis of a few time-series suggests indeed that the onset v/s return stroke of the ‘beating’ is likely to be asymmetric in the manner qualitatively distinct from cilia and flagella, that appear to be symmetric. This would suggest we avoid the term flagella-like to describe the dynamics.
2. Also, the beating frequency is very low (mHz) compared to real cilia/flagella (~Hz). Would it be possible to use the model to predict which parameter would need to be tuned to reach more
physiologically relevant beating frequencies?
Our response: We agree that the oscillations we observe have a frequency thousand fold lower as compared toflagella and cilia and have highlighted this in our discussion. When we modified motor velocity and stall forces, we found only a marginal increase in frequency of oscillations by a factor of 2-5, but not 10-fold or more. We also attempted in simulations to mimic kinesin-like properties. However we do not see a dramatic improvement. This suggests an involvement of higher-order organization of the filament. Indeed we plan to perform simulations that test the following scenarios not already tested:
1) the role of microtubule bundling factors resulting in 2-, 3-, and higher order complexes of MTs
2) varying the bending rigidity of the microtubules within ranges of what may be experimentally feasible with differences reported for taxol and GMPCPP filaments
3) altering the duty ratio of the motor
These will be in the nature of “what if” simulations that could provide the basis of future experimental design to test such predictions. This comment is similar to one by the other reviewers.
Significance
This study is part of the field of in-vitro reconstitution, from a minimal set of components, that aims to reproduce a biological function to identify and understand the minimal physical/biophysical mechanisms underlying a function. This study might be of interest for the people who address questions of the self-organization of cytoskeletal elements in minimal systems.
Our response: We agree with the assessment of the reviewer of the significance of the study and the readership that might be most interested in this work.
*The main limitation of this study relies on the claim of reproducing a flagella-like motion. Indeed, the frequency of the described oscillations is in the mHz range while the frequency of cilia is in the range of few Hz to tens of Hz. This suggests that the mechanism at play in such a reconstituted system is not the one that drives beating in real cilia/flagella. Yet, this limitation also applies to other studies in the field (Vilfan et al. 1999, Guido et al. 2022 ...). *
Our response: We agree with the reviewer that the 10^3 to 10^4 difference in oscillation frequency with that observed in cilia is striking. Indeed our claim was limited to the wavelike nature of the oscillation of the free end of a clamped microtubule driven by molecular motors producing a buckling instability, release and re-engagement of motors. Therefore it is evident we are missing many components in our minimal system as compared to cilia. However, we would like to emphasize for now that the beating is only qualitatively comparable to cilia and flagella. So far we have not compared the two waveforms. As a part of our revision plan, we aim to objectively describe the quantitativeaspects that could strengthen our claim of a similarity or lack thereof in wave-forms.
Indeed this limitation is also observed in the work of Vilfan et al. (2019) and Guido et al. (2022). However, we believe with changes to the experimental setup and a robust and tractable model we have improved on these studies.
References:
Vilfan A, Subramani S, Bodenschatz E, Golestanian R, Guido I (2019). Flagella- like Beating of a Single Microtubule. Nano Lett 19(5), 3359–3363.
Guido I, Vilfan A, Ishibashi K, Sakakibara H, Shiraga M, Bodenschatz E, Golestanian R, Oiwa K (2022). A synthetic minimal beating axoneme. Small e2107854.
My second concern is that the added value with regards to state of art is not clearly explicit. I'm thinking about the work of the Isabelle Guido's team where they have more complex reconstituted systems (a pair of 2 microtubules); or the work of Pascal Martin's lab where the design of the system allows to capture more complex mechanisms such as myosin density waves, which result infrequency beat of 0.1Hz.
Our response: We agree that the advances of our study can be highlighted. In the following points we highlight the value added to prior art:
In previous work, MT bundles have been shown to produce synchronized base-to-tip oscillations in vitro driven by kinesin in presence of crowdants (Sanchez et al., 2011??). However, the study lacked control over MT length,, something we have addressed in our study.
Cilia reconstitution with MT length and motor density control (Sasaki et al., 2018) are closer to control of the system but because of the complexity it is hard to distinguish what effect emerged from which componen.
The generation of a bending wave driven by outer dynein arm (ODA) combined with pairs of MTs nucleated from Chlamydomonas axonemal fragments (Guido et al., 2022) was probably a close mimic of a minimal system; it not only lacked ??lacked variation in motor density and length but failed to show oscillations, with S-shaped buckling patterns observed.
As a result it is reasonable to state that this work is a distinct improvement on previous work. In some senses it provides a consistency check on the previous results and at the other with a model and novel order-parameter an opportunity to improve our understanding.
References:
Vilfan A, Subramani S, Bodenschatz E, Golestanian R, Guido I (2019). Flagella-like Beating of a Single Microtubule. Nano Lett 19(5), 3359–3363.
Sanchez T, Welch D, Nicastro D, Dogic Z (2011). Cilia-like beating of active microtubule bundles. Science 333(6041), 456–9.
Sasaki R, Kabir AMR, Inoue D, Anan S, Kimura AP, Konagaya A, Sada K, Kakugo A (2018). Construction of artificial cilia from microtubules and kinesins through a well-designed bottom-up approach. Nanoscale 10(14), 63236332.
Guido I, Vilfan A, Ishibashi K, Sakakibara H, Shiraga M, Bodenschatz E, Golestanian R, Oiwa K (2022). A synthetic minimal beating axoneme. Small e2107854.
Reviewer #2 Evidence, reproducibility and clarity Summary:
The authors use a modified version of conventional gliding assays to induce microtubule bending, buckling, looping and cyclic beating (which they term "flagella-like") via clamping the plus ends of gliding microtubules to the surface. They find that the pattern of motion depends on different factors such as microtubule length and motor density. They build a simple computational model that predicts transitions between microtubule motion patterns depending on these parameters.
Our response: We agree with the assessment of the reviewer summarizing our work in terms of the approach taken and the inferences.
Major comments:
- Overall, the experimental data is extremely sparse. As far as I can see, there are only two replicas for the lower motor density. It is not clear to me how the authors define the boundaries in the
experimental phase diagram in Fig. 7. To build a phase diagram - where one axis corresponds to the motor density - on just two experiments is not convincing. I would need to see more experiments covering a larger range of motor densities and at least three replica per condition.
Our response: The comment refers to Fig. 7, whose purpose was to answer the question- can we test the phase diagram predicted in simulations by comparing to experiment? The answer was provided with representative data, in order to demonstrate that the model is qualitatively validated.
The reviewer is asking for a systematic experimental test that rigorously demonstrates such a match between simulation and experiment. To this end, the phase diagram may not be the ideal form for such a test. We will attempt to examine the beating frequency and wave-transition in line with a comment by reviewer #3, as a measure of experiment-theory validation.
We agree with the reviewer that our data could be enriched with replicates, with more densities of the motor. We will then analyze all the experimental data using common metrics to compare to simulations.
- It is not clear to me why the proportion of pinned vs. free microtubule segments should affect the beating pattern. I would expect that the free microtubule segment does not "feel" the length of the clamped segment, if it is indeed fixed all along its length and unable to move / bend. The simulations use only two anchor points at the pinned tip. The segment in between the anchor points bends, which could affect how the free microtubule segment behaves. To support the claim that it is indeed the proportion of the lengths of the pinned vs. free segments and not simply the length of the free segment alone that influence the beating pattern, I would expect to
(1) see the corresponding and thoroughly quantified experimental data that verifies this simulation-based prediction. Fig. 5C is based on only three microtubules and it is not clear how long the segments are.
(2) the entire pinned segments in the simulation should be fixed. This should also be compared to experimental data, where the lengths of the free segments are the same and only the lengths of the pinned segments
vary.
Our response: Originally the intention of comparing pinned length changes was based on experimental design, in which we incubated biotinylated tubulin to obtain longer or shorter clamped plus-ends. The contrast between a point-pinning and a longer segment is based on beam bending and buckling theory, corresponding to the difference between a swivelling point of immobilization (pinning) and a clamped end (clamped). However, we agree with the reviewer that beyond the pining scenario, once a segment is pinned the only thing really driving the beating is the free length. To address the specific comment we aim to add simulation calculations that will include a fixed clamp and increasing free length demonstrating that the primary driver in changing dynamics (so long as a segment is clamped) is the free length.
(1) To address the question of experimental comparison we will examine more data with increasing free segment lengths for the same density of motors and plot the dynamics, as well as characterize the oscillations with frequency estimation.
(2) This relates to the earlier part of this comment and we aim to re-run the filament clamped segment simulations to make it consistent with expectation and theory from related papers in the field, with only the free-segment length varied.
- In relation to my previous comments: I would expect a direct comparison between the simulation-based prediction that the beating pattern changes with microtubule length and motor density in a quantitative manner, where all pinned microtubules observed experimentally are analyzed. The figures are often based on single observations.
Our response: The experimental phase diagram had representative beating MTs, as compared to simulations. We agree that showing more statistics on these patterns could help. We aim to perform more experiments and analyze more data, which will be systematically plotted to make statistically relevant inferences of patterns as a function of density and length of MT.
- The authors report that the pinned microtubules typically undergo 2-3 cycles of beating. This
number is very low, and I am hesitant to call it "flagella-like" cyclic beating. Is this due to the dynein motors being much slower than e.g. kinesis? To confirm this and support the generality claimed by the authors, I would like to see experiments with a different, faster motor. If other motors are not readily available to the authors, this would imply a substantial amount of time and effort though.
Our response: The slower velocity of yeast cytoplasmic dynein is indeed one the contributing factors for the slow oscillations seen. In preliminary experiments with kinesin we indeed see a faster oscillation, but still in the 10 mHz range. These experiments will be added to the revised manuscript.
- Please perform statistical analysis of the experimental data.
Our response: Most of the data, while statistical, is not being compared for means (e.g. simulation v/s experiment). However we will analyze the frequency as a function of length and density and examine differences based on standard statistical tests.
Minor comments:
- Number of replicates and samples should be indicated in the figures.
Our response: With additional analyzed data and new experiments we will have more datasets and
Significance
- The approach to clamp the plus ends of gliding microtubules in order to induce buckling, bending and beating is elegant and should be easily transferable to other groups who may be interested in this method, since it is straightforward to adapt conventional gliding assays to induce pinning.
Our response: We agree with this assessment of the reviewer.
- The study could potentially be interesting to an audience studying flagella-like systems. Since the system is simple and based on in vitro components with defined parameters, it could serve as a basis for studying more complex systems or testing the influence of particular proteins associated with flagella. However, I do not see a major advance regarding our understanding of flagella or similar structures based on the manuscript. In combination with the model, I see it majorly as a useful tool, providing methodological advance. It would be desirably to make the computational model available to the public.
Our response: We agree that this system of minimal in vitro components could in future be made more complex in a step-wise manner. Once the manuscript is accepted after review, we have intended to make the code available in OpenSource. The source code of Cytosim already is OpenSource and can be downloaded here: https://gitlab.com/f-nedelec/cytosim.
- The computational model seems useful and straightforward to me, yet my background is purely experimental and I cannot judge the model in detail.
Our response: The computational model is indeed straightforward, and is based on a set of C++ codes that are OpenSource and those with a computational training have tested it in multiple studies both by us and other labs.
- In my view, the most important limitation of the manuscript is its lack of thorough experimental data to support the claims made by the authors. In its current state, the manuscript seems rather preliminary and I see the need for significant additional experimental evidence.
Our response: We plan to take the reviewers criticism on board and perform new experiments, analyses and simulations to address this gap of additional experiments. These experiments we believe will go to strengthen the manuscript, but not fundamentally alter the result.
Reviewer #3 *(Evidence, reproducibility and clarity (Required)): *
-Summary:
*This manuscript reports experimental in vitro gliding assays demonstrating bending oscillations when single microtubules are anchored at their plus end and compressed beyond a buckling threshold by dynein molecular motors immobilized on a solid substrate. Together with numerical simulations based on the well-established Cytosim software, the authors identify three main classes of motile behavior under the control of microtubule length and motor density: aperiodic fluctuations (flapping), periodic beating with bending traveling waves over at least part of the filament length, and looping behaviors where the microtubule can curl on itself near its free tip. The authors claim that these movements are reminiscent of the beating movements of eukaryotic cilia and flagella and may provide useful information of the mechanism underlying the oscillatory instability. *
Our response: We are grateful to the reviewer for a careful reading and have in the following sections outlined our plan for revision in response to the specific comments.
*- Major comments: *
1. The observed oscillations show only a few cycles (up to only 4, but often 2-3 (Fig. 1-2)) and are in addition very noisy. Oscillations thus appear to happen only transiently, i.e. do not show a dynamic steady state on timescale much larger than the oscillation period. Demonstrating the emergence of true (and stable) regular oscillations thus remains a challenge, in contrast to the authors' claim. The large variability of behavior from filament to filament (as seen in SV3), as well as in a single filament over time, also makes it difficult to achieve a robust quantitative description of these movements (see below).
Our response: We have observed at times 4 and at times more cycles but we believe this is limited by the fact that mechanical pulling on the streptavidin-biotin linkage could result in occasional detachment of the filament from the surface. Stable oscillations of the form that the reviewer is pointing to may not emerge due to practical challenges and may require an alternative experiment such as optical tweezer to clamp the filament for a longer period. This is currently beyond the scope of the study, but could be attempted in future.
Regarding the variability, we are aiming to analyze more data that has already been recorded and is also being acquired. These additional datapoints will allow for more representative statistics. The variability should tell us more about the nature of the system. We will estimate frequency of oscillations as a parameter for comparison along with our order parameter (span). This is similar to the comment by reviewer #2.
2. Overall, the amount of experimental control seems relatively limited, for there is systematic variation of microtubule length (free or pinned) and only two motor densities have been explored.
Our response: We will address this shortcoming by performing more experiments, with a few more motor densities of intermediate value. This will be supplemented with additional data analysis.
• *One wonders why the motor density has not been more extensively varied and what determines the range of densities that can be achieved. What happens if the density gets larger than 50/µm^2? Do the filaments fail to remain anchored? Is buckling still permitted at high motor density? *
Our response: The range of densities are obtained after the experiment, since this is not a patterning system. At times the density is either too low, and the filaments do not beat, or too high and they detach. This results in only two reported densities, less than perhaps desirable as pointed out by the reviewer. Now that we know what densities work, we aim for a fine-grained scan in the same range expected to produce regular oscillations.
We will titrate the motors to obtain intermediate densities in the range that we have already found to result in stable oscillations with between 4-5 periods and hope to address this question.
• *Important fundamental issues remain here unfortunately untouched in experiments and are also only qualitatively discussed in simulations (bottom of p11 and Fig. 4), namely the dependence of the frequency and wavelength of wave-like beating as a function of motor density and microtubule length. These limitations result from a lack of control over the microtubule lengths and that only two motor densities have been tested. Using the natural variability in length of the anchored filaments may be potentially used to study length effects but then a relatively large amount of data will be required to reliably conclude that filaments ensembles of different mean lengths reliably show different behaviors. Similarly, I do not see where in the data one can see that increasing motor density actually controls the oscillation frequency, as concluded from simulation data (but not analyzed quantitatively). *
Our response: We plan to systematically analyze the frequency, which we have already demonstrated we can measure. The dependence on MT length and density will be tested and added as additional data. We will perform experiments with more motor densities to address that aspect too. We will also run additional simulations and compare outputs. This will help to address the comment and is in line with suggestions by the other reviewers too.
3. The authors repeatedly claim that the movements they observe are "flagella-like". However, the comparison remains vague as there is no quantitative assessment of the similarity or dissimilarity between the movements observed here and biological beating of flagella or cilia (e.g. using data in Riedel-Kruse et al HSFP Journal 2007. DOI:10.2976/1.2773861 as a reference).
Our response: We have compared frequency of oscillations from previous literature but find them to be extremely disparate – by a factor of 1,000. We will use the suggested references to find geometric properties that could test our claim of flagella-like in terms either of waveforms, symmetry of beating or the dynamics or tip-behavior.
• *What does it mean to resemble flagellar beating? It would be desirable to be more explicit/quantitative and not be ashamed to point to differences (could be event more instructive) as well as to similarities. Note that oscillations of the tangent angle in flagella of the bull sperm are nearly sinusoidal, and are thus smooth, with no snaps (Riedel-Kruse et al HSFP 2007), thus challenging the claimed resemblance between bending oscillations in this work and the flagellar beat. *
Our response: This is similar to the previous point. We agree that a quantitative comparison between the dynamics we observe of single filaments and of bonafide flagella, could strengthen the findings of this manuscript. We will use multiple metrics such as the tangent angle-with time of the free end, and the average angle along the flagella (as reported by Riedel-Kruse et al.) to make a more concrete comparison.
• *In my opinion, the authors should tone done the resemblance of their system with cilia and flagella and be much more quantitative about the detailed features of the observed movements in their in-vitro assay. *
Our response: We will take the reviewers comment on board and discuss the work in the absence of the flagellar connection since indeed there is no direct link so far- our comparison with flagella-like systems will be moved to the discussion section with a qualitative comparison of waveforms as this reviewer and others have suggested.
• *In the present gliding assay, motors produce compressive tangential forces on the microtubule, which can result in buckling and thus in an elastic load applied by the filament to the motor with a component perpendicular to the filament. Instead, flagellar motors produce force dipoles that result in neighboring-filament sliding which is then converted in bending of the filament bundle as a result of elastic constrains. Symmetries of the problem thus seem very different. It is also worth noting that many (but not all) models of the flagellar beat actually assume a constant inter-filament distance so that there is no effective normal force acting on the motors to detach them, yet faithfully reproduce beating waveforms (e.g. Camalet and Jülicher New J of Phys (2000) DOI: 10.1088/1367-2630/2/1/324; Riedel-Kruse et al HSFP J (2010)). More generally, whether the present study provides any useful information to inform our current understanding of the flagellar beat is not clear to me and the authors' claim that it may be the case is not motivated enough. Accordingly, the statement (P19) "qualitative transitions (...) expected from not just the minimal but even the potentially complex flagellum" is not justified. *
Our response: This distinction will be more elaborately discussed in the revised discussions section and similar to the previous point, we will avoid reference to flagella-like behavior.
4. I could not find a detailed statistical account of the total number of filaments that was used for the paper, how many fell in the four classes of movement (swiveling, fluctuations, beating, and looping) identified by the authors, and whether the population in each class could actually be controlled experimentally, e.g. by varying motor density or microtubule length. This gave the unfortunate impression that the conclusions were based on cherry picking, which is troublesome considering the large variability in behavior between filaments and the ambition of the authors to provide a state diagram of the dynamics (Fig. 7). To reach clear conclusions, one parameter must be changed while the others remain fixed. For instance, to discuss the effects of the pinned length, one would like to fix the total microtubule length (but then the free length varies) or vary the pinned length with constant free length (thus changing the total microtubule length). I understand that this might be difficult (in experiments), but the authors should then acknowledge these limitations and mitigate their conclusions. In principle, if the yield of the experiment (number of anchored filaments per slide) were sufficient, one could to address these issues by classifying the filaments in ensembles of a given properties (e.g. same total length by variable pinned length). To reach this goal, there is a need to obtain a sufficiently large quantity of data. The reader gets an estimate on the order of 10 usable filaments per slide (video SV3 and inset in Fig. 2D), with only a few replicates (4 experiments at 46/µm^2 and 2 experiments at 27/µm^2). The authors talk about "representative filaments" throughout the text but there is no detail about the ensemble of filaments that show a given behavior and the number of filaments that are used to reach a given conclusion is not given. Length distributions for the free and pined ends of the microtubules, for the maximal amplitude of tangent-angle oscillations, and other measures that characterize the microtubule movements (curvature, wave speed) ought to be given, provided that enough data has been collected to compute reliable ensemble averages.
Our response: For now we have only considered the average behavior with the dynamics observed from multiple fields of view, combined in terms of MT lengths and motor densities. Since Fig. 7 was meant to be representative and therefore a qualitative comparison with simulation predictions, replicates were not added. However, in response to reviewer’s question, we will analyze more data and add it in the supplementary material, in order to support the statistical validity of our claims- that are not based on purely selective evidence.
*5. The effect of motor density on beating properties, in particular frequency, is discussed in simulations but not clearly demonstrated in experiments. One cannot conclude that experiments confirm the prediction of the theory in this respect. *
Our response: Currently we have used a novel metric for the type of oscillation and pattern, the span-parameter (S). However, this was meant to capture large qualitative changes observed in experiment and simulation in terms of patterns.
In response to this comment, we will also analyze the dominant frequency of filaments using FFT on the tip-angles from multiple conditions of MT length and motor density. The scaling of frequency with length and motor density will be compared to simulation predictions. The comparison will then allow an additional quantitative comparison between experiment and simulation.
*- Minor comments: *
6. More extensive quantitative analysis of the waveform of oscillation (noisy sinusoid vs. sawtooth or relaxation oscillations?) and bending wave propagation (speed and curvature vs position along the filament) is needed. In particular, it is claimed that the filaments "snap" and thus evince a "recovery stroke" (e.g. p7). I agree that snaps are evident in some of the videos, and are expected at low motor density. However, I would expect the movements to get smoother at higher motor density, as shown in simulations (looping regime). In any case, one could use the analysis of the tip or (better) tangent angle as a function of time to assess whether 'snaps' indeed occur; due to noise, snapping behavior is not so clear in the data provided in Fig. 1D-E.
Our response: We agree with the reviewer that “snap-back” movement arising from potentially low motor density scenarios changes when the motor density is increased to a more smooth motion. We have observed this, and will characterize it quantitatively to make this point more clear. The tip-dynamics will be analyzed for velocity and symmetry to make this point more apparent.
*7. Because the tips of the microtubules are "sticky" due to their biotinylated tips, I wonder whether the histogram of gliding velocity of the microtubules that are not anchored is modified, i.e shifted toward lower velocities, as compared to that of bare gliding microtubules. This is assuming that a majority of the microtubules are equipped with biotinylated "heads"; this information ought to be provided in the Methods if, as the author claim, the biotinylated tips can be visualized. Analysis of gliding velocities (e.g. in video SV3) could potentially reveal the enhanced interaction between the microtubules and the surface. *
Our response: We will analyze the instantaneous gliding velocity and test the hypothesis that some filaments may be transiently immobile, while others may move unhindered at typical gliding assay velocities (50 to 80 nm/s).
*8. Demonstrating that the anchoring strategy has actually improved the chance to anchor a microtubule, as compared to random anchoring to surface defects that occur naturally in gliding assays, would be welcome. *
Our response: We will analyze the frequency histogram of gliding assay velocities and compare them to the filament-oscillation scenario with biotinylated filaments. We expect to see a zero-velocity mode in the clamped filament scenario and only transient (and therefore less frequent) pinned or clamped filaments. This is already our qualitative observation but we will seek to quantify it.
*9. The simulations should be analyzed more quantitatively and extensively to study how motor density and microtubule length affect the wavelength and frequency of oscillations in the wave-like beating regime, going beyond what can be achieved experimentally. In particular, one could compute the speed of the bending waves, asses how it varies during wave progression from base to tip of the microtubule, describe the increase in the magnitude of tangent-angle and curvature oscillation as a function of curvilinear abscissa. *
Our response: We have now analyzed the frequency and amplitude of filament oscillations in simulations. This will in the next step be used to look for trends as a function of MT length and motor density. We hope indeed to look beyond what experimentally achievable ranges might be, including measuring the propagation of the bending wave along the contour as suggested by the reviewer.
*- Suggestions to help improving the presentation: *
*1. First section of the results (p5-7): this section is full of methological details that get in the way of the description of the actual result (Fig. 1). I would suggest moving these details (e.g. there is not need here to explain how the motors are attached to the substrate, which you use cytoplasmic yeast dynein, and other details). *
Our response: We will rewrite the manuscript to improve the clarity and move the methods to the section dedicated to the methodology.
*2. The top of P9 could also be moved to Discussion section. *
Our response: We will move the page 9 text referred to into the discussion.
*3. P12-13: I also find that the Results section mixes results with discussion, which is not very effective. I would again move elements of discussion (here associated with bending energies) to the Discussion section and focus on results only. *
Our response: We have done so due perhaps to a requirement from an earlier round of reviews. However, we will be happy to separate results from discussion- for example the reference to bending energies.
*4. Throughout the result section: Move any comparison to actual flagellar dynamics to a dedicated section in Discussion. *
Our response: The flagellar discussion will be moved out of the results section entirely unless we invoke the analysis of bonafide flagella.
5. P12: doesn't the increase of the clamped length reduce the length of the free length, moving in the state diagram toward regions of shorter filaments. One wonders whether the clamped length really matter as long as the filament is clamped near the plus end. I would naively expect that it is the free-filament length that maters rather than the total length or the faction of the filament that is clamped.
Our response: We agree with the reviewer with one caveat- filaments pinned at one end (point pinning) are distinct from those with long segments clamped. However, the reviewer is correct in pointing out cases where filaments have a substantial clamp, the free length is more important. We will revise our figures and results section to clarify this.
*6. Figure 4: this figure shows very interesting simulation data that, in my opinion could be much more extensively studied. In particular, one could plot the oscillation frequency, the bending-wave speed, and wavelength as a function of the filament length and the motor density. Also, to characterize the beating waveform more in detail, it would be worth computing how the magnitude of tangent-angle oscillation increases with the curvilinear abscissa for representative examples of waveforms in the three regimes (see again in Riedel-Kruse et al HSFP 2007. DOI: 10.2976/1.2773861 or Pochitaloff et al Nat Phys 2022 DOI: 10.1038/s41567-022-01688-8). *
Our response: We have performed fourier series analysis to obtain dominant frequencies. This will indeed be applied to the simulations in Fig. 4 in order to examine the rich dynamics, as well as provide a point of quantitative comparison to exepriments.
*7. Figure 5: the way to display the data in A-B (simulations) and C-D (experiments) does not allow for an easy comparison between simulations and experiments. I would use beating patterns and kymographs of the tangent angle for both. *
Our response: We are in the process of revising Fig. 5 in order to examine the effect of free MT length on oscillations and will put experimental and simulation analyses that match each other in the nature of the analysis. The analysis itself will be elaborated to include aspects such as average tangent angle as a function of arc-length (Riedel-Kruse et al., 2007) along with frequency.
*8. Figure 6: the way to present the experimental beating patterns is no so clear (thick colored lines). I would recommend showing black lines resulting from automatic tracking of the microtubule. *
Our response: The data in Fig. 6 is raw data projected in order to provide a picture within the limits of magnification. In order to address this comment we will project the tracked contour of the filament and that will result in a finer and better resolved image.
*9. Legend of Fig. S1: the panels (D) and (E) of the figure are not called properly. *
Our response: We will rectify the issue of sub-figure callouts.
*10. Fig. S3: use the same scale in the different panels of (a) and (b) to allow for an easier comparison. It would also be nice to show videos of the simulated motion. *
Our response: The current differences were in order for visual clarity and the modified axis values are mentioned. We will revise Fig. S3 simulation outputs where filaments are projected on the same axis for consistency.
*11. Fig. S4: Hard to read, in particular the motors are not visible. Would be better to have the patterns in black on a white background. The panels look like screen shots. *
Our response: The unbound motors have been deliberately made invisible for clarity. We can provide a figure update with the motors made visible again.
*12. Fig.S5: indicate in the title that this figure deals with results of simulations. The legend refers to color bars but the figure is in grey scale. *
Our response: Colorbar is indeed in grayscale. The legend entry will be modified to read “grayscale bar”.
*Reviewer #3 (Significance (Required)): *
*The motile phenomena reported here are qualitatively already well known in the field. Indeed, anyone who has performed a gliding assay, with microtubules or actin filaments has probably seen undulating or spiraling filaments accidentally anchored on surface defects. Accordingly, the topic has already been somewhat adressed in previous publications (e.g. Bourdieu et al Phys Rev Lett 1995; Sekimoto et al Phys rev Lett 1995; Vilfan et al Nanoletter 2019). As a matter of fact, microtubules anchored on defects in standard gliding assay can show oscillations very similar to those shown here. However, the lack of control over filament anchoring has precluded a systematic experimental study of the oscillatory filament dynamics. It is worth noting that ther bottom-up approaches have used filament bundles instead of single filaments, either with microtubules and kinesin motors (Sanchez et al Science 2011) or actin filaments and myosin motors (Pochitaloff et al Nature Phys 2022). These assays evince more regular oscillations (over tens of cycles) and waveforms that more closely resemble those of eukaryotic flagella than reported here. *
Our response: We agree with this summary of our work, and will highlight the possible reasons why it differs from the work of Pochitaloff et al.
*Here, the authors have developed an experimental strategy to increase the chance of anchoring single filaments' plus end to the substrate, potentially allowing for more control of the experimental conditions that lead to the emergence of oscillations (but see my criticisms above). Anchoring is made more likely, because short segments of biotinylated tubulin are added to the end of bare microtubules to make them stick to the substrate, which has been functionalized with streptavidin. A similar protocol had been reported before in the literature to study buckling of single microtubules by single kinesin motors (Gittes et al Biophys J 1996), but is here used at larger motor densities on the substrate. There is unfortunately no quantification of the success of the approach. *
Our response: We propose to perform more experiments and analyze the data more quantitatively using multiple measures described in the literature and cited by this reviewer. We believe these changes will adequately address the concerns.
*The comparison of the experimental data to Cytosim simulations is, to my knowledge, novel and a clear asset of the work, although this comparison could be more effective, as detailed above. *
Our response: We will add a more complete quantitative comparison to supplement the already provided qualitative comparison to address the comments.
*The emergence of periodic wave-like beating oscillations in motor-filament systems is a classical problem in biophysics. This problem is particularly relevant in the context of eukaryotic cilia and flagellar beating in biology. The audience for the present work is thus potentially broad, although the simplistic and artificial nature of the in-vitro system, with only one microtubule, will probably appeal more to biophysicists and theoretical physicists than biologists. *
Our response: We appreciate the effort of this reviewer to evaluate our work. We however believe that the relevance of this work could extend beyond purely biophysics and theoretical physics as claimed by the reviewer.
Description of the revisions that have already been incorporated in the transferred manuscript
Please insert a point-by-point reply describing the revisions that were already carried out and included in the transferred manuscript. If no revisions have been carried out yet, please leave this section empty.
-
Description of analyses that authors prefer not to carry out
Please include a point-by-point response explaining why some of the requested data or additional analyses might not be necessary or cannot be provided within the scope of a revision. This can be due to time or resource limitations or in case of disagreement about the necessity of such additional data given the scope of the study. Please leave empty if not applicable.
-
El colesterol actúa como amortiguador para modificar la fluidez de las membranas. A temperaturas por debajo de la Tm, interfiere con la interacción de las colas hidrocarbonadas de los ácidos grasos y, por tanto, aumenta la fluidez. A temperaturas por encima de la Tm, limita el desorden porque es más rígido que las colas de hidrocarburo de los ácidos grasos y no puede moverse en la membrana en la misma medida, lo que limita o “amortigua” la fluidez de la membrana.
Temperatura
Reviewer #2 (Public Review):
The authors phototag DA and GABA neurons in the VTA in mice performing a t-maze task, and report choice-specific responses in the delay period of a memory-guided task, more so than in a variant task w/o a memory component. Overall, I found the results convincing. While showing responses that are choice selective in DA neurons is not entirely novel (e.g. Morris et al NN 2006, Parker et al NN 2016), the fact that this feature is stronger when there is a memory requirement is an interesting and novel observation.
I found the plots in 3B misleading because it looks like the main result is the sequential firing of DA neurons during the Tmaze. However, many of the neurons aren't significant by their permutation test. Often people either only plot the neurons that are significant, or plot with cross-validation (ie sort by half of the trials, and plot the other half).
Relatedly, the cross-task comparisons of sequences (Fig, 4,5) are hampered by the fact that they sort in one task, then plot in the other, which will make the sequences look less robust even if they were equally strong. What happens if they swap which task's sequences they use to order the neurons? I do realize they also show statistical comparisons of modulated units across tasks, which is helpful.
Overall, the introduction was scholarly and did a good job covering a vast literature. But the explanation of t-maze data towards the end of the introduction was confusing. In Line 87, I would not say "in the same task" but "in a similar task" because there are many differences between the tasks in question. And not clear what is meant by "by averaging neuronal population activities, none of these computational schemes would have been revealed. " There was trial averaging, at least in Harvey et al. I thought the main result of that paper related to coding schemes was that neural activity was sequential, not persistent. I think it would help the paper to say that clearly. Also, I'm not aware it was shown that choice selectivity diminishes when the memory demand of the task is removed - please clarify if that is true in both referenced papers. If so, an interpretation of this present data could be found in Lee et al biorxiv 2022, which presents a computational model that implies that the heterogeneity in the VTA DA system is a reflection of the heterogeneity found in upstream regions (the state representation), based on the idea that different subsets of DA neurons calculate prediction errors with respect to different subsets of the state representation.
I am surprised only 28% of DA neurons responded to reward - the reward is not completely certain in this task. This seems lower than other papers in mice (even Pavlovian conditioning, when the reward is entirely certain). It would be helpful if the authors comment on how this number compares to other papers.
RRID:AB_2341188
DOI: 10.1016/j.celrep.2023.112884
Resource: (Cell Signaling Technology Cat# 9661, RRID:AB_2341188)
Curator: @scibot
SciCrunch record: RRID:AB_2341188
plasmid_12259
DOI: 10.1016/j.celrep.2023.112927
Resource: RRID:Addgene_12259
Curator: @scibot
SciCrunch record: RRID:Addgene_12259
saben o han sabido la correcta manera de trovar,quiero yo hacer este libro para dar a conocer y saber qué trovadores han trovado mejor y han enseñado mejor, y cómodeben seguir la correcta manera de trovar aquellos que quieran aprende
prueba II
O nás
Nad touto sekcí je opravdu velký margin a pod touto sekcí zase skoro žádný není
Note: This rebuttal was posted by the corresponding author to Review Commons. Content has not been altered except for formatting.
Learn more at Review Commons
We appreciate the positive feedback from both reviewers and their critical comments, which will help us to improve the manuscript. Below, we provide a point-by-point response and how we propose to address their queries and comments.
As the laboratory is currently undergoing a major transition, we propose essential experiments that are realistic to perform under these circumstances. We are positive that we can address all the most critical points identified by the reviewers.
Suggestions for minor changes to the figures are already included.
We also include responses to questions the reviewers raise.
Reviewer #1 (Evidence, reproducibility and clarity):
Major comments:
1 - The authors assessed acridine orange incorporation in BECs upon LiverZap and concluded that LiverZap triggers hepatocyte-specific cell death without a bystander effect in adjacent cells (Figure 1 D-E). What happened to endothelial cells, which could also be affected either directly by ROS production in hepatocytes or indirectly by gross morphological changes in tissue organization?
Response:
The reviewer raises two excellent points:
(i) Bystander effect of hepatocyte-produced ROS on endothelial cells: the cell death analysis included in the manuscript, shows that Acridine Orange staining overlaps with hepatocyte _tg(fabp10a:dsRed) expression, but not with biliary tg(tp1:H2B-mCherry) indicating cell death is specific to hepatocytes. Moreover, singlet oxygen species as produced by LiverZap have been shown to have a very short half-life and short range of action, suggesting that neighbouring cells are unlikely affected (Liang et al., 2020).
PLAN: Investigate potential bystander effect in endothelial cells, by activating the LiverZap tool in livers expressing transgenic tg(kdrl:mcherry) marking the vascular network followed by live staining with Acridine Orange at 8 hours post illumination.
(ii) indirect effects of morphological tissue changes on endothelial cells: studying the tissue response of the vascular network to hepatocyte ablation would be very interesting. A separate and detailed study would be required to generate meaningful data and insights into said process. This could encompass for instance the use of the transgenic endothelial _tg(kdrl:mcherry) line for LiverZap experiments and parallel those in Figure 4A-S. Thus, it seems beyond the scope of this work.
NO CHANGES PROPOSED.
2 - The evaluation criteria for distinguishing mCherry and cells in imaging experiments should be clearly described in the methods section. The authors should also provide some quantitative data regarding the level of correlation between the mCherry hepatocytes and the BEC-derived hepatocytes strictly defined based on the TP1-H2B-EGFP lineage tracing, as the former was used as a surrogate marker for the latter in some experiments.
Response:
Here, we believe the reviewer refers to the Tp1:H2B-mCherry-based lineage tracing, since the tg(tp1:egfp) line has not been used for this purpose. Similar to previous studies in the regeneration field (e.g. Choi et al., 2014; He at al., 2014), we have used histone inheritance of Tp1:H2B-mCherry for short-term lineage tracing. Tp1:H2B-mCherry-based lineage tracing was assessed on the whole organ level, for which we will describe the quantification pipeline. Tp1:H2B-mCherrylow cells were identified as BEC-derived hepatocytes after severe hepatocyte ablation, as shown in Fig. 2A,C, correlating with hepatocyte marker tg(fabp10a:GFP) expression. Tp1high and Tp1low cell numbers were quantified for 12, 24, 48 and 72 hpi and can be added as supplementary information.
PLAN: Update the material and methods section and produce a more detailed description. This would include the following information: Whole-mounted livers of tg(tp1:H2B-mCherry) fish were stained for mCherry and imaged using an Leica SP8 confocal microscope. Image processing was carried out using the Imaris software. All mCherry-expressing cells in the liver were masked using the “spots” function, which allows quantification of signal intensity of all cells, represented by a sphere. Tp1high and Tp1low cells were identified using an automatically generated intensity threshold. Due to intensity differences with increasing imaging depth/z-position, segmented Tp1high cells were manually curated.
To showcase the analysis strategy, we propose to include an example showing original image data, semi-automated quantification at the surface and deep tissue levels, as well as the overall Tp1:H2B-mCherry intensities for all positive cells and specifically Tp1high cells for all z-positions of an entire liver (see data figure below). This example could be included as supplementary data. Likewise, cell number quantification for Tp1high and Tp1low across regeneration can be added to Fig. S2.
Fig. Quantification of Tp1:H2B-mCherryhigh cells. (A,B) 10 µm maximum intensity projections from whole mount stained tg(LiverZap);tg(tp1:H2B-mCherry) livers at 48 hpi: at the surface (A-A’) and deep in the liver (B-B’). Tp1high cells are identified by fluorescence intensity of segmented nuclei, outlined in yellow (A’ and B’). Graphs showing distribution of all Tp1:H2B-mCherry nuclei (C) and Tp1high nuclei (D) by fluorescence intensity and z-position (C). The intensity of all mCherry+ nuclei decreases with increasing z-position (C-D). The dotted line outlines the liver in A-B’.
3 - OPTIONAL: In the locally restricted ablation model, do hepatocytes located adjacent to the ROI proliferate and/or contribute to the regeneration of the injured region?
Response:
An important consideration, as highlighted by the reviewer, is whether neighbouring hepatocytes also contribute to regeneration following ROI ablation.
PLAN: To address this point, LiverZap ROI ablation will be followed by cell proliferation analysis using an EdU incorporation assay at 24 and 72 hpi. These time points are selected based on the proliferation results following global LiverZap ablation; see Fig. 2D-F. The experiment will be performed in a tg(tp1:H2B-mcherry); _tg(fabp10a:gfp)_background to distinguish proliferating GFP-positive hepatocytes, which are H2B-mCherry-negative, from LPC-derived hepatocytes that have inherited H2B-mCherry (Tp1low). The resulting insights may help to refine hypotheses regarding the process(es) stimulating the formation of new hepatocytes adjacent to the ablated region.
4 - OPTIONAL: Figure 4, A-S. It should be of significant interest if the authors could also analyze the BEC dynamics using the locally restricted hepatocyte ablation model, comparing those in the injured region (ROI) and the outside of the ROI.
Response:
We agree with the reviewer that this is the exciting next question, as it likely would provide insights into the cellular mechanism by which the biliary network is de- and re-constructed, as well as the mechanism by which BECs outside the ROI may initiate the LPC response to give rise to hepatocytes in a semi-systemic response. For this, the experimental set-up introduced in Fig.4J-P, in which BECs in the ROI are distinguished from adjacent ones by photoconversion, would be followed by extended live light-sheet microscopy of the regenerating liver. Due to the complexity, extent of the experiments and current unavailability of a light-sheet microscope, we would address this optional comment in future investigations.
NO CHANGES PROPOSED.
5A- Figure 4, T-V'. The data shown here for the changes in E-cadherin distribution is difficult to understand and interpret. The authors should provide magnified images and better description on how to distinguish the membranous (spotted signals?) and intracellular localization. Quantitative assessment should certainly be a plus, if possible.
Response:
We appreciate that it may be difficult to recognize the changes in E-Cadherin localisation, in particular at BEC membranes, given that there are intracellular puncta, and that E-Cadherin is expressed both in BECs and hepatocytes. We are convinced of the related data described in Figures 4 and S4, because the first experiment allowed quantification of the staining using both Tp1:H2B-mCherry to identify BECs and intestinal E-Cadherin for normalisation, which revealed a 51% E-Cadherin reduction at BEC cell membranes following injury. Unfortunately, the signal-to-noise ratio declined in consecutive experiments precluding further quantification although we could still observe a change in localisation. We tested alternative antibodies against E-Cadherin as well as optimized staining protocols, yet without success.
5B - OPTIONAL: In relation to the above point, it is this reviewer's candid impression that the very last part regarding the possible role of E-cadherin dynamics in regulating the biliary network remodeling is still preliminary compared to the remaining parts, thereby rather depreciating the value of the entire manuscript. Perhaps this part could be published separately, together with more functional evidence regarding the causal relationship between them (e.g., showing the effect of Ecadherin knockdown in hepatocytes on the biliary remodeling and the induction of the BECdependent regeneration program)
Response:
PLAN: Following this reviewer’s and reviewer 2’s comments and suggestions, we agree to remove the data on E-Cadherin. Loss of adhesion as a mechanism for adopting an LPC-state remains very exciting, future investigations with novel tools to monitor and modulate E‑Cadherin expression in BECs would thus be needed.
6 - Do zebrafish livers possess lobular structures with the portal-to-central vein axis and the metabolic zonation as typically observed in mammalian livers? As has been described in the manuscript, the "localized" injury patters in the mammalian livers usually occur at the sub-lobular structure levels (i.e., peri-portal region-restricted vs. peri-central region-restricted). Although the "localized" injury model described in this study using the zebrafish livers was indeed localized from the viewpoint of the entire organ (or the lobe), it still seemed much more "global" when considering those situations in the mammalian livers, so that the authors' claim that the former recapitulating the latter might be too exaggerated and somehow misleading. The authors should clarify and discuss this point in the manuscript.
Response:
The reviewer raises an important point, and it seems that our wording might not have been clear. In mammals, boundaries between injured and healthy tissue arise, because liver injuries frequently occur at the sub-lobular level. Although zebrafish livers are composed of metabolically diverse hepatocytes, a spatial arrangement comparable to mammalian zonation has so far not been identified (Morrison et al. 2022; Oderberg and Goessling, 2023). Yet, the liver lobes in the adult zebrafish have a central vein and periportal veins at the periphery of the organ, similar to the mammalian lobular organisation (Ota et al. 2022). Therefore, the scale of injury in the mammalian setting and the ROI-ablation model introduced in the current work differs. It, nevertheless, creates boundaries of healthy and injured liver tissue relevant for uncovering dynamic cellular processes mediating tissue repair in chronic liver disease. Importantly, with its suitability for advanced live imaging and optogenetic methods (e.g. photoconversion), LiverZap, complements mammalian models, in which this is still challenging. This offers therefore the powerful opportunity to employ LiverZap to screen for dynamic repair behaviours, which subsequently can be validated in a target approach in mammalian injury models.
PLAN: To describe the relevance of our ROI ablation paradigm for elucidating repair processes at the interface of injured and healthy tissue more precisely. We will further edit and clarify text to place the ROI ablation into the context of hepatic injuries at the sub-lobular level throughout the mammalian liver.
Minor comments:
7 - Figure 4. Panels D and G should correspond to the same one image and the way of labeling be changed (as in Figure 1G). Likewise, in panel J, the bars shown separately as "M" and "S" at 12 dpi should correspond to the same data, so that they should be unified as one bar.
Response:
Thank you for pointing this out, this is changed in the updated figures; panels Fig. 4D and I.
8 - Figure S3L. How was the ROI border defined? Perhaps the shape of the ROI should change significantly during regeneration due to dynamic tissue remodeling processes, thereby moving the position of the border as well.
Response:
The ROI border was defined as the interface between photoconverted and non-converted BECs. We concur with the reviewer’s notion that cell movement and rearrangement may occur during the regeneration process (see Fig. 4A-J), and the initially straight ROI border could consequently change during the regeneration process. Nevertheless, the border between photoconverted and non-converted BECs persists, serving as a landmark for the measurements shown in Figure S3L.
Fig.: Quantification strategy for determining the region exhibiting an LPC-response outside the ROI ablation region. The dashed line of the ROI indicates morphogenetic changes of the interface between photoconverted and nonconverted cells over time due to repair-related cell rearrangement.
PLAN: In the revised manuscript, we propose to include the below schematic as panel J to Figure S3. Moreover, we also suggest to change the solid line of the squares indicating the ROI area in figure panels 3C,G,O,P and S3D,H,K into a dashed line at the interface between photoconverted and non-converted tissue (see below figure as an example).
9 - The authors should comment in the manuscript as to whether the system can be applicable for induction of more restricted areas (e.g., at a single hepatocyte level; in particular metabolic zones, if existing), as well as for ablation of other hepatic cell types such as BECs and endothelial cells.
Response:
Indeed, the optogenetic nature of the LiverZap system allows to induce hepatocyte death at the single cell level, as well as any defined region of interest that can be generated by the light source (e.g. confocal microscope software).
Likewise, the FAP-TAP system can be easily applied to BECs or endothelial cells, or any cell type for which a specific promoter has been identified to drive the genetic FAP component fluorogen-activating protein dL5**.
Response:
PLAN: Both points will be included in the discussion section of the manuscript.
Reviewer #2 (Evidence, reproducibility and clarity):
MAJOR COMMENTS:
1 - The LiverZap is an elegant new tool to induce localized ablation of hepatocytes. It is not as claimed by the authors a real breakthrough: (1) While localized ablation is nice compared to NTR-MTZ model in zebrafish, mice model such as CCl4 chronic injury can also study the interaction between healthy and injured tissue. (2) Although not using MTZ, the system still requires injection or exposure to malachite green derivate dye MG-2I. A few searches suggest that this compound could induce toxicity. Can the authors study and compare the toxicity of malachite green derivate dye MG-2I to the toxicity of MTZ? This is important as this would be indeed a strong argument in favor of the presented tool.
Response:
Point 1 – studying interactions between healthy and injured liver tissue: The reviewer is of course correct that interactions between healthy and injured tissue can also be studied in the mouse. However, ROI ablation with the LiverZap system can be combined with live imaging, thereby enabling the observation of cellular responses of the same sample over time, at a resolution currently difficult to achieve in mammals. Moreover, the possibility to induce cell death in a defined ROI, also allows to simultaneously employ other genetic tools, including cell-type specific lineage tracing by photoconversion, which is difficult to achieve in mammalian systems. The finding that BECs beyond the ROI of hepatocyte ablation produce new hepatocytes by a LPC response, illustrates the power of this approach. The optogenetic LiverZap ablation system would therefore complement existing mammalian and zebrafish liver regeneration models.
PLAN: to include a more detailed discussion of this point and the complementary knowledge that can be gained in the discussion section.
Point 2 – MG-2I toxicity__: Indeed, as described in the manuscript, the FAP-TAP system, underlying LiverZap hepatocyte ablation, requires MG-2I incubation for the formation of the photosensitiser. Compared to the NTR/MTZ system, incubation with MG2I is short, requiring <3 hours in contrast to more than 24hours MTZ incubation. The system, including MG-2I has also been employed in cells, as well as in the zebrafish heart and nervous system without reported adverse effects (He et al., 2016; Xie et al., 2020). Consistently, we have not observed any apparent adverse effects between 0-72 hpi following 3-18 hour MG-2I incubation (unpublished). Nevertheless, toxicity studies evaluating survival upon MG-2I incubation have not yet been carried out and may be required for comparison with MTZ.
PLAN: To perform toxicity studies for MG-2I, similar to those previously performed for MTZ (e.g. Mathias et al. 2014), in which larval survival after 3, 24 and 48 hour MG-2I exposure starting at 4 dpf will be assessed daily until 8 days post fertilisation.
2 -The term ablation is choose because it is anticipated that it induces heaptospecific death. However, the consequences of cell death is not shown. In particular, the inflammatory immune response is not shown nor discussed.
Response:
The reviewer raises an interesting point, namely the inflammatory immune response, which is not the focus of this manuscript. Acridine Orange- and TUNEL-positive cells during the ablation process indicate that the reactive oxygen species produced by the FAP-TAP system cause hepatocyte apoptosis. We predict that this would recruit and be cleared by macrophages with little or no inflammatory response, like findings for the NTR-MTZ system (Stoddard et al., 2019). However, the role of neutrophils is unclear due to a possible direct effect of MTZ on this cell type.
PLAN: We will include this point in the discussion.
Future in-depth live imaging of transgenic reporters will be required for detailed studies of macrophage and neutrophil recruitment and their role in efferocytosis, including transcriptome analysis of specific gene signatures to detect an inflammatory response.
3 - The difference between mild and severe ablation is hard to grasp. Can the authors explain more clearly the differences between mild and severe: what are the criteria as there is no difference in liver volume between mild and severe ablation? How do you achieve mild or severe ablation? It appears that the severity of the ablation is judged a posteriori and not decided per the experiment.
Response:
Concerning the first point, there must be a misunderstanding. Mild and severe hepatocyte ablation result in clearly different liver sizes, for instance at 30 hpi, the end of ablation, liver volumes are reduced by 23 % for mild or 64 % for severe cases (Fig. 1Q). This is supported by representative image data in Figs. 1F-P and S1A-C. Nevertheless, for consistency, we had represented the 12 hpi volume data as the same two data bars, although we cannot distinguish them yet at that timepoint of the experiment, as shown by images in Fig. 1F-G.
PLAN: Adjust Fig.1Q and represent the 12 hpi liver volume data as a shared graph for mild/severe ablation, see included figure 1Q. We propose to similarly represent all 12 hpi quantifications, as represented in Figs. S1F, 2D-F and S2A.
For the second point, the reviewer is correct that ablation severity is evaluated and determined between 24-30 hpi, at the end of hepatocyte ablation, given there is some variability in the response. Nonetheless, both length of 660nm illumination and oxygen availability can be used to shift the proportion of mild and severe ablation, depending on the desired outcome (Figs. 1Q, S1G-H).
NO CHANGES PLANNED.
4 - The work supports that biliary-driven regeneration also occurs when hepatocyte ablation happens in a small area of interest. Our knowledge is that you need a large defect in hepatocyte or a chronic liver injury ro activate the BDC-driven auxiliary process for regeneration. Could this be a specificity of the fish model?
Response:
Like the reviewer, our understanding is that severe hepatocyte loss, senescence or chronic liver injury activate BEC-derived regeneration in mammals and in zebrafish. All these cases are characterised by substantial reduction of local hepatocyte density or loss of function (in senescence). Given the overall hepatocyte loss is only 10-20% in the ROI model, the induction of the local LPC response was very surprising, on the other hand it corresponds to a near complete local hepatocyte depletion. The hepatobiliary architecture in zebrafish is similar to that of the mammalian ductular reaction, an adaptation of the biliary network to severe hepatocyte loss. In both cases, the majority of hepatocytes connect directly via their apical canaliculi to biliary ductules to ensure physiologic transport of hepatocyte products, often preceding the LPC response (Sato et al., 2019; Caviglia et al., 2022). Therefore, we propose that the LPC response following ROI hepatocyte ablation is not specific to the zebrafish model, but a common mechanism elicited across species and related to the severity of the injury and the configuration of the hepatobiliary network at the time of injury, such as the ductular reaction.
PLAN: To edit the text and discuss this point clearly.
5 - Pathways revealed to control liver regeneration or BEC-driven regeneration in fish have not be found to have a similar drastic predominance in rodents. This mitigate perhaps the use of fish for this type of research?
Response:
On the contrary, zebrafish has been established and validated as a model to investigate and elucidate developmental hepatic programs as well as regeneration (Goessling and Sadler, 2015; Wang et al., 2017). However, we acknowledge that more comparative studies are needed to understand the molecular pathways driving regeneration both in zebrafish and mammals and their similarity.
Specifically, zebrafish and mammals display high conservation in the parenchymal and non-parenchymal cell types of the liver as well as their developmental programs (Goessling and Sadler, 2015; Wang et al., 2017). Using different injury paradigms in zebrafish, including ethanol, acetaminophen toxicity and the pharmacogenetic NTR-MTZ model, it has been shown that cellular responses to liver injury are also remarkably conserved with mammals where hepatocyte proliferation governs repair after mild injury while severe injury repair is driven by conversion of BECs into LPCs (So, et al., 2020; Forbes and Newsome, 2019). Major pathways, such as Wnt, FGF and BMP signaling show conserved functions in restorative hepatocyte proliferation (Goessling et al., 2008; Kan et al. 2009, Böhm et al 2010). At present, only very little is known about the molecular mechanisms controlling the BEC/LPC to hepatocyte conversion particularly in rodent models (Kim et al., 2023), while a number of zebrafish studies have started to elucidate the signals governing the different steps of this process (Kim et al., 2023), due to the relative ease of using the larval zebrafish model for this work. Notably, the Notch pathway plays multiple roles in both mouse and zebrafish LPC-mediated repair (Minnis-Lyons et al., 2021; Huang et al 2014; Russel et al.,2019), however further work will be necessary to determine the detailed corresponding functions. Therefore, future work in both rodents and zebrafish will be essential to uncover the molecular mechanisms of this repair process relevant for chronic injury. Given the large conservation of developmental and repair mechanism between mammals and zebrafish observed so far, it is highly likely that this will also apply to LPC-mediated repair. Studies promise to uncover even greater similarity between zebrafish and human (e.g. Fang et al 2011), underscoring the power of using complementary vertebrate models.
PLAN: To edit the text in the introduction and discussion to clarify and highlight the similarities, differences, and opportunities the zebrafish model offers for understanding the mechanisms of vertebrate liver regeneration in general and in particular by using the LiverZap system.
6 - The authors show that in the case of mild ablation, hepatocytes are responsible for replenishment of the parenchyma, but in the context of severe ablation, LPC-mediated regeneration takes control. However, when the authors perform localized and controlled ablation, which is small (around 10-20%) and, to my understanding, a mild / local ablation, however the authors show that LPC mediates the regeneration. Can the authors explain the discrepancy between their results?
Response:
We agree with the reviewer that the LPC response in the smaller, local ROI ablation was unexpected. However, it could be explained by the following: while such ROI hepatocyte ablation represents only a 10-20% ablation of the total hepatocyte population, by sheer numbers comparable to a mild global ablation, the near-complete local hepatocyte loss however makes it more similar to a severe or chronic global injury. Notably, the zebrafish hepatobiliary architecture in zebrafish is similar to that of the mammalian ductular reaction, an adaptation of the biliary network to severe hepatocyte loss. In both cases, the majority of hepatocytes connect directly via their apical canaliculi to biliary ductules to ensure physiologic transport of hepatocyte products, often preceding the LPC response (Sato et al., 2019; Caviglia et al., 2022). We hypothesize that if a similar local, near complete hepatocyte loss would be induced in a mammalian liver exhibiting a ductular reaction, it would similarly induce local LPC-mediated repair. Since this is, to our knowledge not possible, the LiverZap model represents a unique opportunity to induce the LPC-response in a controlled manner and in addition investigate the underlying cellular and molecular processes of injured and adjacent healthy tissues at high resolution in an in vivo context.
PLAN: We will edit the discussion to clarify this important point.
7 - The last part of the paper about E-Cadherin expression is not convincing. I am not sure about the quality of the IF stainings of E-Cadherin, and it is not helping proving the point of the authors. Can the authors provide better stainings for this figure?
Response:
(Same response as to point 5A+B of reviewer 1). We appreciate that it may be difficult to recognize the changes in E-Cadherin localisation, in particular at BEC membranes, given that there are intracellular puncta and that E-Cadherin is expressed both in BECs and hepatocytes. We are convinced of the related data described in Figures 4 and S4, because the first experiment allowed quantification of the staining using both Tp1:H2B-mCherry to identify BECs and intestinal E-Cadherin for normalisation, which revealed a 51 % E-Cadherin reduction at BEC cell membranes following injury. Unfortunately, the signal to noise ratio declined in consecutive experiments, while we could still observe a change in localisation, it challenged a meaningful quantification. We tested alternative antibodies against E-Cadherin, yet without success.
PLAN: Following both reviewers’ comments and suggestions, we agree to remove the data on E-Cadherin.
8 - Could the authors provide a bit more information on the live imaging. Exactly how do they achieve imaging for such a long time?
Response:
Thank you for pointing this out, the information was not very detailed. We used relatively standard mounting conditions (low-melting point agarose and Tricaine anaesthesia, see below for details), combined with light-sheet microscopy, which was the key to achieving the long imaging. We believe that in addition to the known gentle imaging condition, the mounting set-up is critical as the fish is completely suspended in a very low-percentage, low melting point agarose within a large volume of embryo medium.
PLAN: Update the material and methods section with the following details: Long-term live imaging was performed using a LS1 Live light sheet microscopy system (Viventis Microscopy Sàrl). Larvae were with anesthetized with 0.4% Tricaine and mounted ventrally in 0.8% low melting point agarose in E3/PTU media supplemented with 0.16% tricaine. Once the agarose solidified, the chamber was filled with E3/PTU with 0.16% Tricaine to maintain anaesthesia. A 25X objective was used and acquisition was performed every 20 minutes.
MINOR COMMENTS:
9 - It is hard to imagine the full-size liver in Figure 1, bad contrast. Can the authors manually delineate it?
Response:
The livers in this figure are now outlined in the updated figures, see new Figure 1.
10 - "This finding is very surprising, since current understanding in the field links the generation of new hepatocytes from BECs/LPCs with global hepatocyte death." This statement lacks references.
Response:
PLAN: To add the following primary references to the above sentence: (Choi et al., 2014; He et al., 2014; Manco et al., 2019; Raven et al., 2017) and recent review (Kim et al_._, 2023).
REFERENCES
Böhm F, Köhler UA, Speicher T, Werner S. Regulation of liver regeneration by growth factors and cytokines. EMBO Mol Med. 2010 doi:10.1002/emmm.201000085.
Caviglia S, Unterweger IA, Gasiūnaitė A, Vanoosthuyse AE, Cutrale F, Trinh LA, Fraser SE, Neuhauss SCF, Ober EA. Fraeppli: a multispectral imaging toolbox for cell tracing and dense tissue analysis in zebrafish. Development. 2022 doi:10.1242/dev.199615.
Choi TY, Ninov N, Stainier DY, Shin D. Extensive conversion of hepatic biliary epithelial cells to hepatocytes after near total loss of hepatocytes in zebrafish. Gastroenterology. 2014 doi:10.1053/j.gastro.2013.10.019.
Fang L, Green SR, Baek JS, Lee SH, Ellett F, Deer E, Lieschke GJ, Witztum JL, Tsimikas S, Miller YI. In vivo visualization and attenuation of oxidized lipid accumulation in hypercholesterolemic zebrafish. J Clin Invest. 2011 doi: 10.1172/JCI57755.
Forbes SJ, Newsome PN. Liver regeneration - mechanisms and models to clinical application. Nat Rev Gastroenterol Hepatol. 2016 doi:10.1038/nrgastro.2016.97
Goessling W, North TE, Lord AM, Ceol C, Lee S, Weidinger G, Bourque C, Strijbosch R, Haramis AP, Puder M, Clevers H, Moon RT, Zon LI. APC mutant zebrafish uncover a changing temporal requirement for wnt signaling in liver development. Dev Biol. 2008 doi:10.1016/j.ydbio.2008.05.526.
Goessling W, Sadler KC. Zebrafish: an important tool for liver disease research. Gastroenterology. 2015 doi:10.1053/j.gastro.2015.08.034.
He J, Lu H, Zou Q, Luo L. Regeneration of liver after extreme hepatocyte loss occurs mainly via biliary transdifferentiation in zebrafish. Gastroenterology. 2014 doi:10.1053/j.gastro.2013.11.045.
He J, Wang Y, Missinato MA, Onuoha E, Perkins LA, Watkins SC, St Croix CM, Tsang M, Bruchez MP. A genetically targetable near-infrared photosensitizer. NatMethods. 2016 doi:10.1038/nmeth.3735.
Huang M, Chang A, Choi M, Zhou D, Anania FA, Shin CH. Antagonistic interaction between Wnt and Notch activity modulates the regenerative capacity of a zebrafish fibrotic liver model. Hepatology. 2014 doi:10.1002/hep.27285.
Kan NG, Junghans D, Izpisua Belmonte JC. Compensatory growth mechanisms regulated by BMP and FGF signaling mediate liver regeneration in zebrafish after partial hepatectomy. FASEB J. 2009 doi:10.1096/fj.09-131730.
Kim M, Rizvi F, Shin D, Gouon-Evans V. Update on Hepatobiliary Plasticity. Semin Liver Dis. 2023 doi: 10.1055/s-0042-1760306.
Liang P, Kolodieznyi D, Creeger Y, Ballou B, Bruchez MP. Subcellular Singlet Oxygen and Cell Death: Location Matters. Front Chem. 2020. doi:10.3389/fchem.2020.592941.
Manco R, Clerbaux LA, Verhulst S, Bou Nader M, Sempoux C, Ambroise J, Bearzatto B, Gala JL, Horsmans Y, van Grunsven L, Desdouets C, Leclercq I. Reactive cholangiocytes differentiate into proliferative hepatocytes with efficient DNA repair in mice with chronic liver injury. J Hepatol. 2019
doi: 10.1016/j.jhep.2019.02.003.
Mathias JR, Zhang Z, Saxena MT, Mumm JS. Enhanced cell-specific ablation in zebrafish using a triple mutant of Escherichia coli nitroreductase. Zebrafish. 2014 doi: 10.1089/zeb.2013.0937.
Minnis-Lyons SE, Ferreira-González S, Aleksieva N, Man TY, Gadd VL, Williams MJ, Guest RV, Lu WY, Dwyer BJ, Jamieson T, Nixon C, Van Hul N, Lemaigre FP, McCafferty J, Leclercq IA, Sansom OJ, Boulter L, Forbes SJ. Notch-IGF1 signaling during liver regeneration drives biliary epithelial cell expansion and inhibits hepatocyte differentiation. Sci Signal. 2021 doi:10.1126/scisignal.aay9185.
Morrison JK, DeRossi C, Alter IL, Nayar S, Giri M, Zhang C, Cho JH, Chu J. (2022) Single-cell transcriptomics reveals conserved cell identities and fibrogenic phenotypes in zebrafish and human liver. Hepatol Commun. doi: 10.1002/hep4.1930.
Oderberg IM, Goessling W. (2023) Biliary epithelial cells are facultative liver stem cells during liver regeneration in adult zebrafish. JCI Insight. doi: 10.1172/jci.insight.163929.
Ota N, Shiojiri N. Comparative study on a novel lobule structure of the zebrafish liver and that of the mammalian liver. Cell Tissue Res. 2022 doi:10.1007/s00441-022-03607-y.
Raven A, Lu WY, Man TY, Ferreira-Gonzalez S, O'Duibhir E, Dwyer BJ, Thomson JP, Meehan RR, Bogorad R, Koteliansky V, Kotelevtsev Y, Ffrench-Constant C, Boulter L, Forbes SJ. Cholangiocytes act as facultative liver stem cells during impaired hepatocyte regeneration. Nature. 2017 doi:10.1038/nature23015.
Russell JO, Ko S, Monga SP, Shin D. Notch Inhibition Promotes Differentiation of Liver Progenitor Cells into Hepatocytes via _sox9b_Repression in Zebrafish. Stem Cells Int. 2019 doi:10.1155/2019/8451282.
Sato K, Marzioni M, Meng F, Francis H, Glaser S, Alpini G. Ductular Reaction in Liver Diseases: Pathological Mechanisms and Translational Significances. Hepatology. 2019 doi: 10.1002/hep.30150.
So J, Kim A, Lee SH, Shin D. Liver progenitor cell-driven liver regeneration. Exp Mol Med. 2020 doi: 10.1038/s12276-020-0483-0.
Stoddard M, Huang C, Enyedi B, Niethammer P. Live imaging of leukocyte recruitment in a zebrafish model of chemical liver injury. Sci Rep. 2019 doi: 10.1038/s41598-018-36771-9.
Wang S, Miller SR, Ober EA, Sadler KC. Making It New Again: Insight Into Liver Development, Regeneration, and Disease From Zebrafish Research. Curr Top Dev Biol. 2017 doi: 10.1016/bs.ctdb.2016.11.012.
Xie W, Jiao B, Bai Q, Ilin VA, Sun M, Burton CE, Kolodieznyi D, Calderon MJ, Stolz DB, Opresko PL, St Croix CM, Watkins S, Van Houten B, Bruchez MP, Burton EA. Chemoptogenetic ablation of neuronal mitochondria in vivo with spatiotemporal precision and controllable severity. Elife. 2020 doi: 10.7554/eLife.51845.
Esta cartilla está pensada para cualquiera que quiera construir textos en formato digital con otras personas para expresar conocimientos colectivos. Ya seas un científico, académico, activista, periodista, hacker, creemos que esta manera de hacer colectivamente es potente y se instaura en la idea de escritura como performance estético colectivo en lugar de como forma de escritura individual.
Compartir y saber diferentes tipos de vista, es una manera de interactuar con personas de manera virtual o remota. Cuando alguien pueda que no entienda otra persona te lo va replicando explicando de una manera adecuada. Por eso es interesante este párrafo ya que se puede construir textos en formato digital.
Debería poderse usar en procesos de aprendizaje entre pares, sin mayor lectura o preparación previa por parte de un facilitador, sino presuponiendo que los aprendices leerán en conjunto y usarán la obra como guía de sus actividades prácticas
Esta parte es importante tenerla en cuenta, ya que va dejando claro el uso de procesos de aprendizaje entre pares y el porque debería usarse de ese modo.
Pretende ser un librito colectivo que se enseña y escribe en conjunto, desde un hackerspace en el Sur Global, llamado HackBo y se usa a sí mismo como ejemplo.
¿Y si quien o quienes escriben se contradicen?¿Y sí la información que se escribe no es la correcta? ¿Cómo identificar?
Los factores asociados con un mayor riesgo quirúrgico incluyen edad avanzada, comorbilidades médicas específicas como diabetes mellitus, sexo masculino, cirrosis con o sin hipertensión portal y colecistitis gangrenosa aguda
Factores de riesgo, relacionados al síndrome metabólico.
Mientras estés revisando un documento con hypothesis, puedes subrayar una parte del texto y aparecerá la opción de Anotar (Annotate) o Subrayar (Highlight), como se ve la siguiente imagen:
subrayando las frases me parece interesante porque es una guía para uno no perderse del tema central.
cuando hayas ingresado a tu cuenta con tu login, (usuario y contraseña), te sale un cuadro con las cosas o anotaciones que has hecho en esta página, al lado derecho suyo, aparece un enlace que dice Visit Anotation in context. Ahi te aparece nuevamente la pagina de Hypotesis ya con los cuadritos que describe para uno poder realizar la lectura anotada
como Twitter, Facebook y correo electrónico. En caso de que estemos también navegando con nuestro usuario por dichas redes socales, cuando hagamos click en sus respectivos íconos nos llevará automáticamente a la opción de compartir, con un mensaje precreado, que podemos modificar para finalmente enviar el mensaje en Facebook o Twitter.
Sin duda, actualmente nuestras labores están ligadas a las redes sociales de alguna manera, así que, el poder compartir las lecturas por medio de estas es una apuesta interesante para la academía; por un lado, porque el acceso puede ser más "rápido" y por otro lado, por la apuesta a cambiar estos hábitos de lectura sobre todo en Colombia que el indice de lectura es bastante bajo.
Mientras estés revisando un documento con hypothesis, puedes subrayar una parte del texto y aparecerá la opción de Anotar (Annotate) o Subrayar (Highlight), como se ve la siguiente imagen:
es importante aprender nuevas tecnicas y herramientas para replicar a nuestros compañeros familiares o amigos
En dicha barra seleccionamos el ícono \faShareAlt{} y se desplegará, justo abajo, una ventana como la mostrada en la figura @fig:hyp-sharing, que nos muestra en enlace para compartir y nos sugiere una formar para hacerlo, como Twitter, Facebook y correo electrónico. En caso de que estemos también navegando con nuestro usuario por dichas redes socales, cuando hagamos click en sus respectivos íconos nos llevará automáticamente a la opción de compartir, con un mensaje precreado, que podemos modificar para finalmente enviar el mensaje en Facebook o Twitter.
Que interesante que este tipo de herramientas se puedan compartir por redes sociales y mejorar esta practica de lectura y escritura.
here's also a kind of Shadow side to this approach which is which we could call maybe religios as opposed to religious in in 00:03:51 English it's religious o-s-e adjective and um this is very very common actually in ecological language whether it's in newspapers or books or anything music art anything that says that there needs 00:04:05 to be a very profound sudden massive change in ourselves um is is I think a dangerous
o create this balance, each FLU category has a bonus ceiling, whichspecifies a maximum amount of density bonus that can be granted to any development within that category.
This doesn't really make sense when some of the bonuses are specifically there because there is infrastructure. It changes the requirement from just having infrastructure to needing infrastructure and FLU updates
This also perpetuates historical inequities between neighborhoods.
o assess this another way, the LRTP forecast estimates that thepopulation of Tampa will grow by about 159,000 people between 2020 and 2045. The unconstrained estimate ofcapacity (as shown in Table 2) would allow for a population growth of over 1 million people, assuming a 50-50 splitof residential and commercial in mixed use areas and an average household size of 2.26 people. In other words, thefuture land use regulations do not prevent this level of residential development
Okay this analysis is good. We should lean on this when talking about maximizing existing FLU.
jistého rekreačního zařízení
Jedná se o Rekreační a školící středisko Loutí?
ó ý thức trách nhiệm công dân; có thái độ và đạo đức nghề nghiệp đúng đắn; có ýthức kỷ luật và tác phong làm việc nghiêm túc.- Có kế hoạch chủ động phát triển nghề nghiệp cho bản thân.- Có khả năng tự cập nhật kiến thức, thông tin trong lĩnh vực chuyên ngành của mình vàchủ động xử lý những thay đổi đó một cách có h
COmment
To fashion worlds more amendable to care, we might need tochange how the meaning of passion is understood. The book proceedswith this hope in mind, believing that a change in the inquiry into pas-sionate work can shift the ways that we have come to recognize the prob-lems of work culture today.
để fashion (fashion ở đây là động từ) thế giới theo hướng care nhiều hơn, ta cần thay đổi cách hiểu kn passion.
cuốn sách này muốn làm điều đó
o out for my morning walk with tapes from two very different audio-books, and let those ideas bounce off each other, simmer, reproduce in some odd way, so that I come up with ideas that I might not have come up with if I had simply stuck to one book until I was done with it and then gone a
técnicamente hablando, el nombre de sismo es más utilizado (terremoto se refiere a sismos de grandes dimensiones).
Sin determinar con precisión (o por alguna definición) la frontera entre ambos términos...
o it is not necessary to use force to constrain the convict to good behaviour, the madman to calm, the worker to work, the schoolboy to application, the patient to the observation of the regulations
Women of today are still being called upon to stretch across the gapof male ignorance, and to educate men as to our existence and ourneeds. This is an old and primary tool of all oppressors to keep theoppressed occupied with the master's concerns. Now we hear that it isthe task of black and third world w o m e n to educate white women, inthe face of tremendous resistance, as to our existence, our differences,our relative roles in our joint survival.
This is a ridiculous request from men and white women to be asking of black women and black queer women and tracks back to slavery in it's way of giving power to oppressors
Note: This rebuttal was posted by the corresponding author to Review Commons. Content has not been altered except for formatting.
Learn more at Review Commons
Please find our point-to-point response to the reviewer’s comments below, where we marked all changes implemented in the manuscript in italics.
Reviewer #1 (Evidence, reproducibility and clarity (Required)):
With the emergence and spread of resistance to Artemisinin (ART), a key component of current frontline malaria combination therapies, there is a growing effort to understand the mechanisms that lead to ART resistance. Previous work has shown that ART resistant parasites harbour mutations in the Kelch13 protein, which in turn leads to reduced endocytosis of host haemoglobin. The digestion of haemoglobin is thought to be critical for the activation of the artemisinin endoperoxide bridge, leading to the production of free radicals and parasite death. However, the mechanisms by which the parasites endocytose host cell haemoglobin remain poorly understood.
Previous work by the authors identified several proteins in the proximity of K13 using proximity-based labelling (BioID) (Birnbaum et al. 2020). The authors then went on to characterise several of these proteins, showing that when proteins including EPS15, AP2mu, UBP1 and KIC7 are disrupted, this leads to ART resistance and defects in endocytosis leading to the hypothesis that these two processes are inextricably linked.
In this manuscript, Schmidt et al. set themselves the task of characterising more K13 component candidates identified in their previous work (Birnbaum et al. 2020) that were not previously validated or characterised. They chose 10 candidates and investigated their localisations, and colocalisation with K13, and their involvement in endocytosis and in vitro ART resistance, 2 processes mediated by K13 and some members of the K13 compartments
The authors show that of their 10 candidates, only 4 can be co-localised with K13. Then, using a combination of targeted gene disruption (TGD) as well as knock sideways (KS), they characterised these 4 proteins found in the K13 compartment. They show that MyoF and KIC12 are involved in endocytosis and are important for parasite growth, however their disruption does not lead to a change in ART sensitivity. The authors also confirm the findings of their previous publication (Birnbaum et al. 2020), using a slightly different TGD
(note from the authors: we apologise if this has not properly transpired from the manuscript but the difference between the TGDs is substantial and relevant: one has less than 3% of the protein left and hence can be considered to fully inactivate MCA2 and has a growth defect whereas the other contains about two thirds of the protein (1344 amino acids/~66% are left), has no growth defect, although it lacks the MCA2 domain (hence that domain can not be critical for the growth defect)),
that MCA2 is involved in ART resistance, however they did not check whether its disruption impacts haemoglobin uptake. They also show that KIC11 is not involved in mediating haemoglobin uptake or ART resistance. To finish, the authors used AlphaFold to identify new domains in the proteins of the K13 compartment. This led them to the conclusion that vesicle trafficking domains are enriched in proteins of the K13 compartment involved in endocytosis and in vitro ART resistance.
The majority of the experiments conducted by the authors are performed to a good standard in biological and technical replicates, with the correct controls. Their findings provide confirmation that their 4 candidate genes seem to be important for parasite growth, and show that some of their candidates are involved in endocytosis. While the KD and KS approaches employed by the authors to study their candidate genes each have their own advantages and can be excellent tools for studying a large sets or genes, this manuscript highlights the many limitations of these approaches. For example, the large tag used for the KS approach can mislocalise proteins or disrupt their function (as is the case for MyoF), resulting in spurious results, or indeed the inability to generate the tagged line (as is the case for MCA2). The KS approach also makes the results of a protein with a dual localisation, like KIC12, extremely difficult to interpret.
We thank the reviewer for this thorough and insightful review.
The limitations mentioned above were addressed in the response to the main points and a general detailed response in regards to the systems used for this research are added at the end of this rebuttal. Briefly summarised here: while we agree that there are limitations of the system used, we are convinced that
the advantages of using a large tag in most cases outweighs the drawbacks as it permits to track the inactivation of the target, if need be on the individual cell level
while not optimal for MyoF, the partial inactivation actually helps in its functional study as detailed in major point 23&28 or reviewer#3 major point 11: it shows a consistent correlation of the phenotype with different causes and degrees of inactivation (this is now better illustrated in Figure 1L1M). Further, regarding the concern of the large tag: the effect of the tag based on localisation was overestimated in the review by what seems to have been a mix up comparing numbers from MyoF with a number from MCA2 (there is a difference, but it is only small) (see reviewer#1 major point #23).
KS is the optimal method for most of the assays in this work (e.g. bloated food vacuole assays and RSAs); these assays would be impossible or difficult to use with other inactivation systems currently used in P. falciparum research (see details in the response to the specific points and after the rebuttal)
In regards to the difficulty to interpret KIC12 data: this is only true for measuring absolute essentiality, everything else we believe we actually have the optimal method. If not KS, which method targets a specific pool of a protein with a dual localisastion? Again, our assays targeting the K13 pool and revealing the specific function would have been difficult or impossible with any other system.
Ultimately the question is whether any other system would have resulted in a different conclusion on the function of the proteins studied. At present we are confident this would not be the case and other systems probably would not have delivered the specific functional data shown in this work. Clearly, more in depth work will provide more nuanced and detailed insights into the proteins analysed in this work and this likely will also include the use of other systems for specific aspects they are most suitable for. However, this (e.g. different complementations in a diCre cKO) is complex and therefore beyond what fits into this work which had the goal to assess which proteins are true positives for the K13 compartment and to place them into functional groups in regards to endocytosis.
Moreover, the manuscript is disjointed at times, with the authors choosing to conduct certain experiments for only a subset of genes, but not for others. For example, considering that the aim of this paper was to identify more proteins involved in ART resistance and endocytosis, it is confusing why the authors do not perform the endocytosis assays for all their selected proteins, and why they do not do this for the proteins they identify in their domain search. There is significant room for improvement for this manuscript, and a generally interesting question.
The reviewer remarks that not every experiment was done for every target. Based on the rebuttal we tried to amend this but also note that there was some sentiment by the reviewers to better stick to the point and not make the manuscript more disjointed. We attempted to balance that as much as possible and hope we were able to honour both aspects (amendments were done as detailed in the point by point response below).
In regards to endocytosis and choice of targets: We did do endocytosis assays for all proteins that showed a growth phenotype upon inactivation in this work. We therefore assume the reviewer here refers to major point #40 asking for endocytosis assays with KIC4 and KIC5 (which were not studied in this manuscript) as well as MCA2 (point 17). We fully agree with the reviewer that this would fill a gap in the work on K13 compartment proteins but such assays are difficult with TGDs (there are issues with non-comparable samples and compensatory effects) and proteins that are not essential (and hence likely have a smaller impact on endocytosis when truncated). We nevertheless now carried them out, but due to the limitations to do this with these lines would be hesitant to draw definite conclusions (see major point 17 and 40 for details and outcomes).
But in it's current format, other than confirming that MCA2 is involved in ART resistance (which was already known from the Birnbaum paper), the authors do not further expand our understanding of the link between ART resistance and endocytosis in this manuscript.
We would like to point out that the importance of the K13 compartment and endocytosis goes beyond ART resistance (see e.g. also newly published papers on the K13 compartment in Toxoplasma, (Wan et al., 2023; Koreny et al., 2023)). Endocytosis is an essential and prominent process in blood stages. However, in contrast to processes such as invasion, our understanding about endocytosis is only rudimentary. Hence, this manuscript provides important insights on an emerging topic that in our opinion deserves more attention:
it identifies novel proteins at the K13 compartment and provides 2 new proteins in endocytosis (MyoF and KIC12); getting an as complete as possible list of proteins involved in the process will be critical to study and understand it
it leads to the realisation that not all growth-relevant proteins detected at the K13 compartment are needed for endocytosis
it provides domains and stage specificity of function for several K13 compartment proteins, overall bolstering the model of endocytosis in ART resistance and providing a framework critical to direct future studies on endocytosis and their detailed mechanistic function at the cytostome
the identified vesicle trafficking domains (for instance now also found in UBP1) are expected to strengthen the support for the role of endocytosis of the K13 compartment; this and also the above points are important as (based on the current literature) there still seems to be prominent sentiment in the field that (in part due to the involvement of UBP1 and K13) the cause of ART resistance is due to various unclearly defined stress response pathways
with MyoF it also shows the first protein in connection with the K13 compartment that acts downstream of the generation of hemoglobin-filled containers in the parasite and provides the first protein that explains the suspected involvement of actin in endocytosis (so far this was only based on CytD studies)
Overall we therefore believe this manuscript contains critical information and a framework for future studies on endocytosis and the K13 compartment. We hope the relevance of endocytosis as one of the most prominent and essential processes in the parasites and the connection to various aspects linked with many commercial drugs (in addition to the role of endocytosis in ART resistance), is adequately explained in the introduction. We also would like to mention that the main focus of the work is reflected in the title of the manuscript which does not mention ART susceptibility.
Major Comments
1) line 31: please change defined to characterised - defined suggests that novel proteins were identified in this study, which is not the case.
We apologise, but we do not fully understand this comment. We did identify novel proteins not before known to be at the K13 compartment (MCA2 (admittedly this one was likely but had not previously been verified), MyoF, KIC11 and KIC12). In our view "further defining the composition of the K13 compartment" therefore is an accurate statement. Additionally, the identification of previously not-discovered domains, the stage-specificity and function of these proteins helped to further define the K13 compartment.
If the reviewer is referring to the fact that the proteins analysed in this study were taken from a previously generated list of hits, we would like to stress that the presence in such a list (obtained from a BioID, but also if from an IP etc) can not be equalled for them to be true positives, they are merely candidates that still need to be experimentally validated. This is what we did in this work to find out which further proteins from the list can be classified as K13 compartment proteins (for hits with lower FDRs this is even more relevant as illustrated by the fact that 6 of the here analysed hits were not at the K13 compartment). In an attempt to address this comment in the manuscript, we changed the wording of this sentence to (line 31): "Here we further defined the composition of the K13 compartment by analysing more hits from a previous BioID, showing that MyoF and MCA2 as well as Kelch13 interaction candidate (KIC) 11 and 12 are found at this site."
2) line 37: please change 'second' to "another". As explained further below, the authors identified 3 classes of proteins (confer ART resistance + involved in HCCU, involved in HCCU only, or involved in neither).
We realized that the groups description wasn’t clear in the abstract. Please see response to major comment #41 for a detailed answer to this (endocytosis is an overarching criterion, ART resistance is a subgroup and applies only to those proteins with a function in endocytosis in ring stages). To clarify this (see also major point #8) we added an explanation on the influence of stage-specificity of endocytosis on ART susceptibility to the introduction (line 76): “In contrast to K13 which is only needed for endocytosis in ring stages (the stage relevant for in vitro ART resistance), some of these proteins (AP2µ and UBP1) are also needed for endocytosis in later stage parasites (Birnbaum et al., 2020). At least in the case of UBP1, this is associated with a higher fitness cost but lower resistance compared to K13 mutations (Behrens et al., 2021; Behrens et al., 2023). Hence, the stage-specificity of endocytosis functions is relevant for in vitro ART resistance: proteins influencing endocytosis in trophozoites are expected to have a high fitness cost whereas proteins not needed for endocytosis in rings would not be expected to influence resistance.” The abstract was changed in response to this and other comments and hope it is now clearer in regards to the groups.
3) Line 40: You define KIC11 as essential but according to your data some parasites are still alive and replicating 2 cycles after induction of the knock sideways. Please consider changing "essential" to "important for asexual parasite growth".
We fully agree with the reviewer, we reworded the sentence as suggested.
4) Line 40: please change 'second group' to 'this group'
We reworded this part of the abstract and it know reads: (line 38): “While this strengthened the link of the K13 compartment to endocytosis, many proteins of this group showed unusual domain combinations and large parasite-specific regions, indicating a high level of taxon-specific adaptation of this process.”
5) line 41: state here that despite it being essential, it is unknown what it is involved in.
With the newly added data we show that this protein either has a function in invasion or very early ring development although we did not see any evidence for the latter. We therefore changed the sentence to (line 43): “We here identified the first protein of this group that is important for asexual blood stage development and showed that it likely is involved in invasion*..” *
6) Line 50: the authors should state here that there is actually a reversal in this trend over the last few years.
Done as suggested.
7) Line 54: please separate out the references for each of the two statements made in this line (a: that ART resistance is widespread in SEA, and b: that ART resistance is now in Africa) Reference 14 also seems to reference ART resistance in Amazonia - which is not covered by the statement made by the authors (in which case the authors should state ART is now present in Africa and South America). The authors should also reference PMID: 34279219 for their statement that ART resistance is now found in Africa (albeit a different mutation to the one found in SEA).
Done as suggested.
8) Line 65: it is also worth mentioning here that there are other mutations in proteins other than K13, such as AP2mu and UBP1 (PMID: 24994911;24270944) that can lead to ART resistance.
As suggested by the reviewer, we included a sentence about non-K13 mutations linked with reduced ART susceptibility in the introduction (line 74): “Beside K13 mutations in other genes, such as Coronin (Demas et al., 2018) UBP1 (Borrmann et al., 2013; Henrici et al., 2020b; Birnbaum et al., 2020; Simwela et al., 2020) or AP2µ (Henriques et al., 2014; Henrici et al., 2020b)* have also been linked with reduced ART susceptibility." *
We here also added data on fitness cost that is related to this and is also relevant for the issue of proteins with a stage-specific function in endocytosis, making a transition for this statement which might help clarifying the grouping of K13 compartment proteins (see also major point #2).
9) Line 80, 86: ref 43 is misused. Reference 43 refers to Maurer's clefts trafficking which takes place in the erythrocyte cytosol and is not involved in haemoglobin uptake as far as I know. Please replace ref 43 with one showing the role of actin in haemoglobin uptake.
We thank the reviewer for pointing this out, Ref 43 was removed from the manuscript.
10) Line 98: the authors state here that they 'identified' further candidates from the K13 proxiome. This suggests that they identified new proteins in this paper, when in fact the list was already generated in ref 26. All they did was characterise proteins from that list that were not previously characterised. The authors should therefore remove identified from this statement.
We agree with the reviewer that we did not identify further candidates, we identified new K13 compartment proteins from the list of potential K13 compartment proteins. We therefore changed “identified further candidates” into “identified further K13 compartment proteins” (line 116). Please see also response to major comment #1.
11) Line 107-108: it is not clear from this sentence why these proteins were left out of the initial analysis in Ref 26. A sentence here explaining this would be valuable for the reader.
This is a good point. One reason why we did not analyse more in our previous publication was that we had to stop somewhere and adding more would have been very difficult to fit into what was already a packed paper. However, as shown in this work, the list does contain further interesting candidates (e.g. K13 compartment proteins that are involved in endocytosis).
We altered the relevant part of the introduction to highlight that we previously analysed the top hits, clarifying that the 'remaining' hits analysed in this work were further down in the list. This now reads: (line 113)“We reasoned that due to the high number of proteins that turned out to belong to the K13 compartment when validating the top hits of the K13 BioID (Birnbaum et al., 2020), the remaining hits of these experiments might contain further proteins belonging to the K13 compartment.” We hope this clarifies that we simply moved further down in the candidate list.
12) Line 117-123: The authors say that PF3D7_0204300, PF3D7_1117900 and PF3D7_1016200 were not studied because they were not in the top 10 hits. However, the current organisation of Supplementary Table 1 shows all 3 proteins among the top 10 hits (MyoF, KIC12, UIS14 and 0907200 being after them). I think the authors should reorganise their table. It is also unclear according to what the proteins in the table are ranked. Could the authors indicate the metric used for the ranking?
We thank the reviewer for alerting us to this. The issue here is that the 3 non-analysed proteins belong to a 'lower stringency' group comprising hits significant with FDRThe information about ranking is now also included as “Table legend” in the revised manuscript and the Table heading has been changed to: “List of putative K13 compartment proteins, proteins selected for further characterization in this manuscript are highlighted.”
13) Line 129-141: Can the authors be clearer with their explanations of the identification of mutation Y1344Stop? One dataset (ref 61) shows that 52% of African parasites have a mutation in MCA2 in position 1344 leading to a STOP codon. But another dataset (ref 62) shows that the next base is also mutated, reverting the stop codon. That should have been seen in the first dataset as well. Could the authors please clarify.
This mutation was first spotted in the MalariaGEN database (https://www.malariagen.net) (MalariaGEN et al., 2021), which allows online accessing of the data by using the “variant catalogue” tool, which is in a table format of frequency rather than in a sequence context. Hence, only after further research later on it became evident to us, that this mutation does not occur alone when looking at individual MCA2 sequences from patient samples in (Wichers et al., 2021b). We hope this is accurately reflected in our results section.
14) Line 147: the authors say that MCA2 is expressed throughout the intraerythrocytic cycle as shown by live cell imaging. In Birnbaum et al 2020 fig 4I, the authors show that MCA2 is mainly expressed between 4 and 16hpi. But in Figure 1B of this manuscript there is a clear multiplication of MCA2 signal between trophozoite and schizont. How do the authors explain this discrepancy? Could expression of the truncated MCA2 be different than the full length? This cannot be assessed as expression and localisation of the full-length HA tag MCA2 is not shown in Schizonts.
The key difference lies in transcription vs protein expression (usually protein levels peak after mRNA levels peak and - depending on turnover - protein levels can stay high even after mRNA levels have declined). Figure 4 of the Birnbaum et al paper presents transcriptomic data, but with a peak in trophozoites (The axis label in Fig. 4l of that publication is a bit confusing, as hour 0 is at the top, 48 h at the bottom; it is clearer in Fig. S13 of that paper) which would fit very well with the multiplication of the signal between trophozoites and schizonts mentioned by the reviewer. So, overall, the temporal peaks of transcripts and protein of that protein fit well.
For the signal in rings: Likely the protein has a turnover rate that is sufficiently low for some protein to be taken into the new cycle after re-invasion. Also different transcriptomic datasets e.g. (Otto et al., 2010; Wichers et al., 2019; Subudhi et al., 2020) available on plasmoDB show some mRNA present across the complete asexual development cycle, with each dataset showing maximum peak at a slightly different stage.
Even when located in foci and hence aiding detection of small amounts of protein (as is the case for MCA2-Y1344-GFP), the MCA2 signal in rings is not strong. For MCA2-TGD, the GFP signal is dispersed and therefore likely below our detection limit, while the same amount of protein concentrated at the K13 compartment is visible as foci in the MCA2-Y1344 cell line. Please note that MCA2-TGD has only 2.8% of the protein left whereas MCA2-Y1344 has 66.5% left and based on our manuscript is almost fully functional, hence fitting the different locations between the two versions.
Overall we believe this shows that there are actually no significant discrepancies of the expression of the different MCA2 versions.
15) Line 158: would it not have been more useful for the authors to have episomally expressed MCA2-3xHA in their MCA2Y1344STOP-GFPENDO line to make sure that the truncated protein is indeed going to the correct compartment? The experiments done by the authors suggests that the MCA2Y1344STOP goes to the right location but does not really confirm it.
We appreciate the reviewers caution here. However, considering that MCA2Y1344STOP-GFPendo co-locates with mCherryK13 and endogenously HA-tagged full length MCA2 does the same to a similar extent, there is in our opinion little doubt that MCA2 is found at the K13 compartment and that this is similar with both constructs. If there are minor differences, these might as well occur if MCA2 is episomally (as suggested in the comment) instead of endogenously expressed. Given the limited insight, we therefore decided against the episomal overexpression (which due to its size of > 6000bp may also be somewhat less straight forward than it may sound).
16) Line 191: it is stated that MCA2 confers resistance independently of the MCA domain, however in both the MCA2-TGD and MCA2Y1344STOP-GFPENDO parasites, the MCA domain is deleted, and for both parasites, there is resistance (albeit to a lower level in the MCA2Y1344STOP-GFPENDO line). Therefore, how can the authors state that the ART resistance is independent of the MCA domain? This statement should be that resistance is dependent on the loss of the MCA domain.
We agree that this can’t be categorically excluded. However, a ~5 fold difference in ART sensitivity was observed between the parasites with MCA2 truncated at amino acid 57 compared to those with MCA at amino acid 1344 even though both do not contain the MCA2 domain. Hence, at least this difference is not dependent on the MCA2 domain. The larger construct missing the MCA domain shows only a very moderate reduction in RSA survival, again suggesting the MCA domain is not the main factor. We amended our statement in an attempt to more accurately reflect the data (line 487): “This considerable reduction in ART susceptibility in the parasites with the truncation at MCA2 position 57 compared to the parasites still expressing 1344 amino acids of MCA2, despite both versions of the protein lacking the MCA domain, indicates that the influence on ART resistance is not, or only partially due to the MCA domain.” We would be hesitant to state the reviewer's conclusion that “resistance is dependent on the loss of the MCA domain”, as the larger construct missing the MCA2 domain has a milder RSA effect compared to MCA2-TGD, which suggests the reduction in ART susceptibility is independent of the MCA domain. These considerations also agree with the fact that the parasites with the longer MCA2 version (in contrast to the MCA2-TGD) do not have any detectable growth defect which indicates that the protein can fulfil its function without the MCA2 domain.
17) Line 192: Why did the authors not check if MCA2 is involved in endocytosis? They state later on in the manuscript that they did not do endocytosis assays with TGD lines, however if the authors include the correct controls, this could be easily done. It would also be really interesting to see whether endocytosis gets progressively worse going from WT to MCA2Y1344STOP to MAC2TGD. This experiment (as well as doing endocytosis assays for KIC4 and KIC5 TGD lines) would drastically increase the impact of this study. These experiments would not take more than 3 weeks to perform, and would not require the generation of new lines.
So far were very hesitant to do bloated FV assays with TGDs (even though TGDs were available for the genes encoding MCA2 and KIC4 and KIC5). The reason for this was:
Based on the RSA results at least rings can be expected to have a reduced endocytosis in the MCA2-TGD. Apart from options 1-3 mentioned above, it is therefore possible there is an effect restricted to rings, although in that case the reduced growth in trophozoites would be due to other functions of MCA2. Overall, we can conclude that the MCA2-TGD parasites do not have a strongly reduced endocytosis, but given the fact that the parasites are viable, this is not surprising. Whether the MCA2-TGD has no effect at all on endocytosis we would be very hesitant to postulate based on these results.
18) The authors should consider re-organising the MCA2 section, first showing that the 3xHA tagged line colocalises with K13, then performing the new truncation.
We attempted to re-organise as suggested but because we now included additional fluorescence microscopy images of schizont and merozoites (in response to reviewer 2 major comment 3) the main figure would become even larger. To prevent this, we kept the 3xHA data in the supplement.
19) Line 197: Once again ref 43 is not correct to illustrate that actin/myosin is involved in endocytosis
We thank the reviewer for pointing this out – we removed Ref 43.
20) Line 202: the authors state that MyoF localises near the food vacuole from ring stage/trophs onwards. However, how can this statement be made in schizonts based on these images (Fig. 2A), where it doesn't look like MyoF is anywhere near the FV? This statement can only be made for schizonts if co-localised with a FV marker (which is done in Fig. 2B), however, based on the number of MyoF foci, it appears that this was not done for schizonts. Please either remove the statement that MyoF is near the food vacuole from trophs onwards (because it is only seen near the FV up until trophs) or show the data in Fig. 2B of schizonts to substantiate these claims.
This is a valid point. We originally did not focus on schizonts because most markers end up in some focal area in the forming merozoite but other proteins (such as e.g. K13) also have one or more additional foci at the FV, making interpretation unclear, particularly if the schizont is still organizing to become fully segmented. This is why we generally focused the K13 co-localisations on the trophozoite stage to obtain the clearest information on endocytosis. However, given the fact that this manuscript gives the first localization of MyoF in P. falciparum parasites, we now provide a comprehensive time course (Figure 1C, S1A) including schizonts, which show quite a complex pattern: while the MyoF-GFP localization in trophozoites appeared as multiple foci close to K13 and also the FV, the MyoF-GFP pattern changes in late schizonts (fully segmented) and merozoites, appearing as elongated foci no longer close to K13 or the FV. Of note, this pattern has been previously reported for MyoE in P. berghei (Wall et al., 2019).
We therefore revised the statement about MyoF localization in schizont to better reflect the observed localization: (line 175): “In late schizonts and merozoite the MyoF-GFP signal was not associated with K13, but showed elongated GFP foci (Figure 1C, S2A) reminiscent of the MyoE signal previously reported in P. berghei schizonts (Wall et al., 2019).”
21) Line 204-206: what does this statement bring to the paper? Is it to show that it is the real localisation of MyoF because 2 tag cell line show the same localisation? I don't think this is needed, especially as later in the manuscript an HA-tag MyoF line is used and show similar localisation.
We see the reviewers point, but prefer to keep this data included in the supplement, particularly because potential differences in the location of tagged MyoF were a major concern.
Related to the tag issue: in order to get a better understanding of the effect of C-terminally tagging with different sized tags we now performed a more detailed analysis of the MyoF-3xHA cell line (Figure S2F-G), showing that this cell line shows a growth rate similar to the 3D7 wild type parasites, and has less vesicles than the 2x-FKBP-GFP-2xFKBP cell line, but still slightly, but significantly more than 3D7 parasites. Overall, this indicates that the smaller 3xHA tag has less effect on the parasite, than the larger 2x-FKBP-GFP-2xFKBP tag (see also new Figure 1L, showing a correlation of level of inactivation and the endocytosis phenotype for MyoF).
22) Line 212: The overlap of K13 with MyoF in Figure 2C 3rd panel (1st trophozoite panel) is not obvious, especially as the MyoF signal seems inexistant. I would advise the authors to replace with a better image. Also, why are there no images of schizonts shown in Figure 2C?
As suggested we exchanged the trophozoite image of panel Figure 2 C (now Figure 1C) and expanded this panel with images covering the complete asexual development cycle including schizonts in response to this and the previous points. As indicated above (point 20), schizont stages are complex to interpret. While late schizonts likely are not very relevant for endocytosis this is the first description of the location of the protein in this parasite and we therefore now provide a more thorough representation of the MyoF location across asexual stages in Figure1C and S2A.
23) Line 217: the spatial association of MyoF with K13 is very different when it is tagged with GFP and when it is tagged with 3xHA. The way the authors word it here, it seems that there is agreement with the two datasets, when this is not in fact the case (59% overlap for MyoF-GFP and only 16% overlap with MyoF-3xHA). These data suggest that the GFP and the multiple FKBP tags are doing something to the protein and therefore maybe the ensuing results using this line should not be trusted or be taken with a pinch of salt.
We agree with the reviewer that the location of this MyoF-GFP in the cell might differ due to the partial inactivation but in contrast to this comment, the data does not indicate any large differences. It seems the reviewer mixed something up (the 59% mentioned might come from the MCA2 figure?). The data with the two lines with differently tagged MyoF co-localised with K13 are actually quite comparable: GFP-tagged vs HA-tagged MyoF overlapping with K13 was 8% vs 16% full overlap, 12% vs 19% partially overlapping foci, 36% vs 63% foci that were touching but not overlapping (compare what now is Figure 1D and Figure S2C). Only in the 'no overlap' there is a much smaller proportion in the HA-tagged line. However, given that these are IFAs which on the one hand are more sensitive to see small protein pools but on the other hand also have pitfalls due to fixing of the cells (e.g. tiny increase in focus size due to fixing could increase the number of touching foci that in live cells might be close but did not touch), some variation can be expected to the live cells. We agree though that the partly reduced functionality of MyoF might be the reason for the consistent tendency of a lower overlap even though the difference is much less than indicated in the comment. We added "with a tendency for higher overlap with K13 which might be due to the partial inactivation of the GFP-tagged MyoF" to the sentence "IFA confirmed the focal localisation of MyoF and its spatial association with mCherry-K13 foci"
While we expect the fact that the difference between these parasites is only small somewhat reduces the "pinch of salt" with the MyoF line, we do agree that the partial functional inactivation of the GFP-tagged MyoF line may have some impact. However, we do not think that this means the results with the MyoF-GFP line are untrustworthy. On the contrary, it provides insights into its function that in some ways is equivalent to a knock down or TGD. Overall all the MyoF lines show: few vesicles occur in the MyoF-HA-line, more in the MyoF-GFP line and even more after knock sideways of MyoF-GFP. Importantly the severity of this phenotype correlates with the growth rates in these lines. Hence, together with the bloated food vacuole assays, this provides consistent data indicating that MyoF has a role in the transport of HCC to the FV and its level of activity correlates with the number of vesicles and growth. To better highlight this, it is now summarised in Figure 1M.
24) Line 219: the authors state here that they could not detect MyoF-GFP in rings, when in Figure 2C they show MyoF-GFP in rings, and also show that they could detect MyoF in Sup Fig. 3B with the 3xHA tagged line. Is this a labelling mistake in Figure 2C? If the authors could indeed not see MoyF-GFP in rings, this statement should have been made when Figure 2A was presented, and not so late in the manuscript, which causes confusion.
We thank the reviewer for pointing this out. We now provide a detailed time course (see also previous points) which shows that there is no detectable MyoF-GFP signal during ring stage development until the stage where the parasites starts the transition to trophozoites (i.e. MyoF-GFP signal could only be observed in parasites already containing hemozoin). In addition to the extended time course in Figure 1C (previously 2C) we included a panel of example ring stage images below to further highlight this. We also changed the labelling of the parasite with MyoF-GFP signal the reviewer mentions in Figure 1C to “late ring stage” (it already contains hemozoin) to clarify this.
The description of Figure 1A is now changed to: (line 153) *“The tagged MyoF was detectable as foci close to the food vacuole from the stage parasites turned from late rings to young trophozoite stage onwards, while in schizonts multiple MyoF foci were visible (Figure 1A, S2A).” *
Please see our answer to major comment #45 where we provide an explanation for the difference between MyoF-3xHA and MyoF-GFP signal in ring stage parasites.
[Figure MyoF]
25) Line 237: Showing a DNA marker (DAPI, Hoecht) for Figure 2E, and subsequent figures using mislocalisation to the nucleus, would help the reader assess efficiency of the mislocalisation.
Please see response to major comment #64 for a detailed answer on why we did not include DNA staining in the imaging used to assess mislocalization upon knock-sideways.
26) Line 254-256: authors should show the results of the bloating assay for parental 3D7 parasites (+ and - rapalog) to see whether the MyoF line - rapalog has increased baseline bloating. This applies to all subsequent FV bloating assays.
We did do several controls for bloated assays (including +/- rapalog of an irrelevant knock sideways line as well as using a chemical insult for which the control was 3D7 without treatment) in previous work (Birnbaum et al., 2020), which indicated that there is no effect of rapalog to reduce bloating. Although these controls are more stringent, we nevertheless did a 3D7 +/- rapalog control and added this to the manuscript (Figure S2I). As it is not possible to do this side by side with the assays that are already in the manuscript and the +/- rapalog 3D7 cells consistently showed no or very low numbers of cells without bloating (and stringent controls in the past equally did not show an effect), we believe adding this control once suffices.
27) Line 254-257: The authors say that because fewer parasites show a bloated food vacuole upon inactivation of MyoF it means that less hemoglobin reached the food vacuole. I understand the authors statement, however, shouldn't they look at the size of the food vacuole, instead of the number of parasites with bloated FV, to make such a statement? This has been done for KIC12 so why not doing it for MyoF?
This was now done and is provided as Figure 1J-K, S2J. The results confirm the assessment scoring bloated vs non-boated food vacuoles.
28) Line 259-261: these results would be difficult to interpret namely because the authors have dying parasites, which is exacerbated with the protein being knocked sideways. The authors should mention the pitfalls their knock sideways and tagging design here. Line 260-261: RSA is an assay relying on measuring parasite growth 1 cycle after a challenge with ART for 6 hours.
Fortunately, this concern is unfounded, as the survival (measured by parasitemia after one cycle) of the same sample + and - DHA is assessed, isolating the DHA effect independent of potential growth defects which are cancelled out. Hence, if there were parasites dying in the MyoF line (please note that they might not actually die, but simply grow more slowly), this factor applies for both the + and - ART condition. As we are testing for a decreased susceptibility to ART which would manifest as an increased survival in RSA surfacing above 1%, antagonistic effects of reduced MyoF function and ART treatment would not result in detectable differences as without effect, the RSA survival is always close to zero.
The same applies for the knock sideways where we assess the survival of +rapalog between +ART and -ART. If the reduced MyoF activity of the knock sideways leads to a decreased survival, this applies to both +ART and -ART. Please also note that rapalog was lifted after the DHA pulse (see e.g. Figure S2K).
That effects on growth are cancelled out is nicely illustrated for proteins where there is a stronger and more rapid effect on growth upon their conditional inactivation. For instance when KIC7 is knocked aside, there is a considerable increased of RSA survival, even though continued inactivation of KIC7 would have a severe growth defect (Birnbaum et al., 2020). Vice versa, a growth defect alone does not result in reduced RSA susceptibility as evident from knock sideways of an unrelated protein or using a chemical insult (Figure 4H in (Birnbaum et al., 2020) or simply slowing the ring stage by e.g. reducing EXP1 levels (Mesén-Ramírez et al., 2019). Hence, a growth reduction is not expected to alter the RSA outcome. And even if it did, it would only lead to an underestimation of the readout if growth is too severely affected (which would be obvious in the + rapalog without DHA sample, which was not the case).
In that respect it is valuable to have the rapid kinetics of knock sideways which permit inactivation of a protein before severe growth defects occur (although the only partial responsiveness of MyoF clearly is not the most optimal). In contrast, the absolute loss of a gene (as is the case if diCre is used) prevents (or at least makes it extremely difficult as the timing would need to exactly hit sufficient protein reduction without killing the parasite until the end of the RSA) using this system in these experiments (again see (Mesén-Ramírez et al., 2021) where in a EXP1 diCre based knock out RSA was only possible because we complemented with a lowly, episomally expressed EXP1 copy to have parasites with only a partial phenotype to do this assay).
29) Line 261-263: the authors sate that MyoF has a function in endocytosis but at a different step compared to K13 compartment proteins. I am not sure what they mean here. Can this be clarified?
The different steps in endocytosis are explained in the introduction and we now tried to further clarify this (line 98). “So far VPS45 (Jonscher et al., 2019), Rbsn5 (Sabitzki et al., 2023), Rab5b (Sabitzki et al., 2023), the phosphoinositide-binding protein PX1 (Mukherjee et al., 2022), the host enzyme peroxiredoxin 6 (Wagner et al., 2022) and K13 and some of its compartment proteins (Eps15, AP2µ, KIC7, UBP1) (Birnbaum et al., 2020) have been reported to act at different steps in the endocytic uptake pathway of hemoglobin. While inactivation of VPS45, Rbsn5, Rab5b, PX1 or actin resulted in an accumulation of hemoglobin filled vesicles (Lazarus et al., 2008; Jonscher et al., 2019; Mukherjee et al., 2022; Sabitzki et al., 2023), indicative of a block during endosomal transport (late steps in endocytosis), no such vesicles were observed upon inactivation of K13 and its compartment proteins (Birnbaum et al., 2020), suggesting a role of these proteins during initiation of endocytosis (early steps in endocytosis).“
VPS45 has not apparent spatial connection to the K13 compartment but the fact that MyoF does - and its inactivation also results in vesicle accumulation - indicates that it is downstream of vesicle initiation, providing the first connection from the initiation phase to the transport phase. More evidence for these different steps of endocytosis has been published in a recent preprint from our lab, where we simultaneously inactivated a protein of both “endocytosis steps” (Sabitzki et al., 2023).
To clarify this in the results as requested, we changed the statement to: (line 256) “Overall, our results indicate a close association of MyoF foci with the K13 compartment and a role of MyoF in endocytosis albeit not in rings and at a step in the endocytosis pathway when hemoglobin-filled vesicles had already formed and hence is subsequent to the function of the other so far known K13 compartment proteins.”
30) Do the authors mean that it is involved in endocytosis but not in ART resistance? If so, this is a very difficult statement to make since the parasites are dying. Is there any evidence of point mutations in MyoF in the field?
We split this point to address all issues raised here. Please see response to point 29 which clarifies that this was meant in a different way and our response to point 28 which explains why the dying parasite issue is not expected to affect the RSA (please also note that we do not have evidence of actually dying parasites in the MyoF-2xFKBP-GFP-2xFKBP line, most likely the growth is slowed).
The mutation issue is interesting. In fact evidence exists that MyoF mutations may be associated with resistance (Cerqueira et al., 2017) (please note that there it is still called MyoC) but in a recent preprint from our lab we did not find any evidence for a significantly changed RSA survival in 12 tested mutations in the corresponding gene (Behrens et al., 2023).
To clarify this we added the following statement to the discussion (line 709): "Of note, mutations in myoF have previously been found to be associated with reduced ART susceptibility (Cerqueira et al., 2017), but 12 mutations tested in the laboratory strain 3D7 did not result in increased RSA survival (Behrens et al., 2023)*. *
31) Line 298: the authors state that there is no growth defect in the first cycle when rapalog is added to the KIC11 line, however based on Figure 3D, there is evidently a 25% reduction in growth compared to - rapalog at day 1 post treatment, and a 60% reduction by day 2, which is still within the 1st growth cycle. The authors should either revise their statement or provide an explanation for these findings. The authors should also explain why their Giemsa data in Fig. 3E is not in accordance with their FACS data.
We think there is a misunderstanding here, as our figure legend was not detailed enough and we apologise if this had been misleading. The growth effect is restricted to invasion or possibly the first hours of ring stage development (see point 4&5, reviewer 2), which in asynchronous cultures more rapidly takes effect as the culture also contains schizonts that immediately generate cells that re-invade but can't due to inactivation of KIC11 (due to the rapid action of the knock sideways, KIC11 is already inactivated). In contrast, in highly synchronous cultures, this effect can only be evident once the parasites reached the schizont stage (starting with rings this takes close to 2 days). We now clarify that Figure 2E (previously Figure 3D) shows growth data obtained with an asynchronous parasite culture, while in Figure 2F the growth assay is performed with tightly synchronized (4h window) parasites as stated in the Figure legend.
We now explicitly state in each Figure legend and for each growth experiment throughout the manuscript whether we used asynchronous or synchronized parasites for growth assays.
Related to this, the incorrect y-axis label of what is now Figure 2E mentioned in major comment #58 is now corrected.
32) Line 301: KIC11 could also be important very early for establishment of the ring stage for example for establishment of the PV. Also, was mislocalisation assessed in rapalog-treated parasites at 72 hours or in cycle 3?
This is a valid point and this has now been addressed. We performed an invasion/egress assay revealing similar schizont rupture rates, but significantly reduced numbers of newly formed ring stage parasites (Figure 2H, S3G), indicating an effect of KIC11 inactivation either on invasion or possibly the first hours of ring stage development. A very similar point was raised by Reviewer 2, please see reviewer 2; major comment #4. This is now also reflected in line 302, which now reads: ”… indicating an invasion defect or an effect on parasite viability in merozoites or early rings but no effect on other parasite stages (Figure 2F-H, Figure S3F-G).”
We further included an assessment of mislocalization 80 hours after the induction of knock-sideways by addition of rapalog in Figure S3E which showed mislocalization of KIC11 to the nucleus.
33) Line 311: the authors should change the sentence from 'not related to endocytosis' to 'not related to endocytosis or ART resistance'.
Done as suggested.
34) Line 323-325: Authors say that a nuclear GFP signal can be observed in early schizonts for KIC12. According to the pictures provided in Figure 4A and Figure S5A it is not very obvious. Also faint cytoplasmic GFP signal could only be background as we can see that exposure is higher for schizont pictures
We changed the sentence (line 339) to: “…nuclear signal and a faint uniform cytoplasmic GFP signal was detected in late trophozoites and early schizonts and these signals were absent in later schizonts and merozoites (Figure 3A, Figure S4A,B).” in order to emphasize that the nuclear signal disappears early during schizont development.
35) Line 326-328: The authors say that kic12 transcriptional profile indicate mRNA levels peak (no s at peak) in merozoites. Should they show live cell imaging of merozoites then? Because from the Figure 4A schizont pictures where schizonts are almost fully segmented no signal can be observed.
The observation that mRNA levels of early ring stage expressed proteins tend to increase already in mature schizonts and merozoites is well established (e.g. (Bozdech et al., 2003)). A very good example for this are exported proteins of which most show a transcription peak in schizonts but the proteins are only detected in rings see e.g. (Marti et al., 2004). Hence, our observation for KIC12 is quite typical.
We originally did not include merozoites, as in the last row of Figure 3B fully developed merozoites within a schizont with already ruptured PVM are shown and no GFP signal can be detected in these parasites. We now provide images of free merozoites in Figure S4A-B showing again no detectable GFP signal.
We thank the reviewer for pointing out the typo, "peak" has been corrected.
36) Line 347: The authors state that using the Lyn mislocaliser the nuclear pool of KIC12 is inactivated by mislocalisation to the PPM. This tends to suggest that only the nuclear pool of KIC12 is mislocalised. How is it possible that only the nuclear pool is mislocalised?
The Lyn mislocaliser is at the PPM which is continuous with the cytostomal neck where the K13 compartment likely is found. The effect of the Lyn mislocalizer on the KIC12 protein pool localizing at the K13 compartment is therefore somewhat unclear. For this reason we already had the following statement in the original submission (line 400): “Foci were still detected in the parasite periphery and it is unclear whether these remained with the K13 compartment or were also in some way affected by the Lyn-mislocaliser.” We would like to stress here that the same does not apply to the nuclear mislocaliser, which is only a trafficking signal delivering KIC12 to the nucleus and hence likely does not affect the nuclear pool of KIC12, only the K13 compartment pool (the main interest of this manuscript).
We realised that the statement towards the end of this paragraph was unnecessarily ambiguous in regards to the K13 compartment pool of KIC12 which might have caused some confusion about the function of this pool of KIC12 and therefore modified it to (line 374): "Due to the possible influence on the K13 compartment located foci of KIC12 with the Lyn mislocaliser, a clear interpretation in regard to the functional importance of the nuclear pool of KIC12 other than that it confirms the importance of this protein for asexual blood stages is not possible. In contrast, the results with the nuclear mislocaliser indicate that the K13 located pool of KIC12 is important for efficient parasite growth.". It is also important to note that this limitation does not apply to the NLS knock sideways in regard to the K13 compartment and that the endocytosis function of this pool of KIC12 seems solid which with this statement is enforced.
37) Line 368-369: Effect was also only partial for MyoF. Why didn't you measure the same metrics for MyoF?
This was now done and is provided as Figure 1J-K, S2J, confirming our previous interpretation, see also point #27 which raises the same point.
38) Line 379: you don't know if all proteins acting later in endocytosis will have an increased number of vesicles as a phenotype
This is based on our current definition as stated in the introduction. It assumes a directional vesicular transport of hemoglobin to the food vacuole where inhibition of early stages will prevent transport before HCC-filled autonomous vesicular containers have formed and entered the cell. In contrast later inhibition stops such containers from further transport, leading to their accumulation. Such an accumulation is visible after VPS45-inactivation and other proteins (Jonscher et al., 2019; Mukherjee et al., 2022; Sabitzki et al., 2023) or treatment with cytochalasin D (Lazarus et al., 2008). While it is possible that there may be smaller intermediates formed at the K13 compartment that later on unite or fuse with the compartment evident after VPS45 inactivation and these might be missed due to small size (i.e. inhibition of a step between K13 compartment and an early endosome or equivalent), this would still be upstream of the VPS45 induced containers and hence would be earlier. We therefore believe that based on the framework given in the introduction (see also (Spielmann et al., 2020)) to assume that a phenotype manifesting as reduced food vacuole bloating without formation of detectable vesicles likely signifies inhibition of the process early whereas reduced bloating but with vesicles signifies inhibition later in the process.
39) Line 413-414: The authors state that no growth defect was observed upon KS of 1365800. Is growth alone enough to say that there is no impact on endocytosis?
This is an interesting point. The endocytosis proteins we studied so far indicate that efficient impairment of endocytosis manifests as a severe growth defect. Hence, lack of a growth defect can be assumed to be an indicator for absence of an important role for endocytosis (or any other growth relevant process). Clearly there is a gradual response, such as seen in the different MyoF versions resulting in proportional growth and vesicle appearance phenotypes. Hence, a protein with a minor role might have slipped our attention but then it probably is also not a very important protein in endocytosis.
To further strengthen our assessment of PF3D7_1365800 importance for asexual blood stage development, we now also generated a cell line expressing the PPM Mislocalizer, enabling knock sideways to the PPM. This was done because this protein consistently has a focus at the nucleus that may be within the nucleus. Again this revealed no growth defect upon inactivation (Figure S7D).
40) Line 432: in this section, the authors state that KIC4 and KIC5 seem to have domains that may suggest these proteins are involved in endocytosis, based on the alpha fold data that is publicly available. Considering the authors have TGD-SLI versions of these lines (Birnbaum et al. 2020) and have already confirmed in this previous publication that they confer resistance to ART; it would make sense to look at endocytosis for these genes. This would be a relatively simple and straightforward experiment, taking no longer than two to three weeks, and would require no additional reagents or line generation. Doing these experiments would add a lot more weight to this final section. The authors later state that KIC4 and 5 are TGD lines, so not the best for endocytosis assays. It is unclear why this would be difficult to do if an adequate control is contained in the experiment (such as parental 3D7). It explains why they did not perform the MCA2 endocytosis assays further up, but in my opinion, an attempt at doing these assays is important and would significantly increase the impact of this paper. Identical as major comment #17.
As stated in the manuscript and above, we were originally hesitant to do these assays due to the fact that we can't induce inactivation which is less ideal than comparing the identical parasite population split into plus and minus and is further complicated by the likely smaller effect as the TGDs still permitted growth. However, we see the point of the reviewer and now performed these assays using 3D7 as controls and taking extra care to account for stage differences between the TGD lines and 3D7. However, there was no significant difference in the bloated food vacuole assays with these cell lines. Due to the reasons mentioned in major point 17, we are not sure this indeed means these proteins have no role in endocytosis. One possible reason why we were able to obtain these TGDs may have been because the effect on endocytosis is less than in the essential proteins (or is ring stage specific) and in a TGD an endocytosis defect may therefore not be detectable with our assays (see details and further possible explanations in response to point 17).
In an attempt to address the TGD issue, we generated knock sideways cell lines for KIC4 and KIC5. Unfortunately, the mislocalization of KIC5 to the nucleus was inefficient (see figure below). As this did not result in a growth defect (in contrast to the clear KIC5-TGD growth defect (Birnbaum et al., 2020)), this line is not suitable to study a potential role of this protein in endocytosis. Therefore, we performed the bloated food vacuole assay only with KIC4-2xFKBP-GFP-2xFKBPendo+1xNLSmislocaliser parasites. However, this revealed no effect on HHC uptake, which is in line with the normal growth of KIC4-TGD parasites (Birnbaum et al., 2020) and suggests that this protein could only have a minor or redundant role in endocytosis (it is the line that shows the smallest effect in RSA). As the KIC4 and KIC5 knock sideway lines did not permit any conclusions, we did not include them into the revised manuscript but they can be found here:
[Figure KIC4 knock sideways & KIC5 knocksideways]
Figure legend: (A) Live-cell microscopy of knock sideways (+ rapalog) and control (without rapalog) KIC4-2xFKBP-GFP-2xFKBPendo+ 1xNLS mislocaliser parasites 4 and 20 hours after the induction of knock-sideways by addition of rapalog. Scale bar, 5 µm. Relative growth of asynchronous KIC4-2xFKBP-GFP-2xFKBPendo+1xNLSmislocaliser plus rapalog compared with control parasites over five days. Three independent experiments were performed. Growth of knock sideways (+ rapalog) compared to control (without rapalog) KIC4-2xFKBP-GFP-2xFKBPendo+1xNLSmislocaliser (blue) or KIC5-2xFKBP-GFP-2xFKBPendo+1xNLSmislocaliser (red) parasites over five days. Mean relative parasitemia ± SD is shown. (B) Live-cell microscopy of knock sideways (+ rapalog) and control (without rapalog) KIC5-2xFKBP-GFP-2xFKBPendo+1xNLSmislocaliser parasites 4 and 20 hours after the induction of knock-sideways by addition of rapalog. Scale bar, 5 µm. Growth of asynchronous KIC5-2xFKBP-GFP-2xFKBPendo+ 1xNLSmislocaliser plus rapalog compared with control parasites over five days. Four independent experiments were performed. __(C) __Bloated food vacuole assay with KIC4-2xFKBP-GFP-2xFKBPendo+1xNLSmislocaliser parasites 8 hours after inactivation of KIC4 (+rapalog). Cells were categorized as with ‘bloated FV’ or ‘non-bloated FV’ and percentage of cells with bloated FV is displayed; n = 3 independent experiments with each n=19-30 (mean 21.4) parasites analysed per condition. Representative DIC are displayed. Area of the FV, area of the parasite and area of FV divided by area of the corresponding parasites were determined. Mean of each independent experiment indicated by coloured symbols, individual datapoints by grey dots. Data presented according to SuperPlot guidelines (Lord et al., 2020); Error bars represent mean ± SD. P-value determined by paired t-test. Area of FV of individual cells plotted versus the area of the corresponding parasite. Line represents linear regression with error indicated by dashed line.
41) Line 490-493: the authors state that the K13 compartment proteins fall in two groups, some that are involved in ART resistance AND endocytosis, and some that have different functions. However, in this manuscript the authors have demonstrated 3 flavours that K13 compartment proteins can come in: • Some that confer ART resistance and are involved in HCCU (MCA2) • Some that are involved in HCCU but not ART resistance (MyoF & KIC12) • Some that are involved in neither (KIC11) The authors should therefore revise this statement.
We agree that this was not well phrased. To account for the fact that not all endocytosis proteins confer increased RSA survival to the parasites when inactivated we changed this statement (line 604): "This analysis suggests that proteins detected at the K13 compartment can be classified into at least two groups of which one comprises proteins involved in endocytosis or in vitro ART resistance whereas the other group might have different functions yet to be discovered.“
Generally, we believe that endocytosis is the overarching criterion and we therefore would like to keep the definitions of the main groups (endocytosis or not). As indicated by the title, the focus of the manuscript is on the K13 compartment for which so far endocytosis is the only experimentally associated function. That this group contains proteins that do not confer reduced ART susceptibility when conditionally inactivated (KIC12 and MyoF) is explained by their stage-specificity, making this a subgroup of the overarching endocytosis group.
We realise that with the endocytosis data on the KIC4, KIC5 and MCA2 TGD there is now also a subgroup we were unable to demonstrate an endocytosis effect in trophozoites although they show changes in RSA survival. However, as indicated above, we would be hesitant to fully exclude some role of these proteins in endocytosis in rings. Particularly as a comparably small reduction in endocytosis protein activity or abundance is sufficient to increase RSA survival (Behrens et al., 2023). A principal classification of "endocytosis or ART resistance" or "neither endocytosis nor ART resistance" still accounts for this and therefore seems to us to be the most useful, particularly also in light of our domain identification that then can be linked with one or the other group.
42) Line 508: the authors state that they expanded the repertoire of K13 compartments, when in fact they functionally analysed them - they did not do another BioID to identify more candidates.
We respectfully disagree with the reviewer in this point, we did expand the repertoire of known K13 compartment proteins. Only independently experimentally validated proteins from proximity biotinylation experiments can be considered part of the K13 compartment (or any other cellular site or complex). Without validation of the location, the identified proteins can only be considered candidates. This is highlighted in this manuscript by the finding that several proteins of the list did not localize at the K13 compartment.
43) Line 570-572: has anyone ever tested whether CytoD or JAS treatment in rings, is sufficient to mediate ART resistance? Something similar to what was done in PMID 21709259 with protease inhibitors. If not this would be a pretty interesting experiment for the authors to do that could shed more light on the MyoF data. It would take maybe 2 weeks to do and not require the generation of any new lines. This would clarify whether other Myosins other than MyoF are involved in endocytosis, as is suggested by previous publications (PMID: 17944961).
We now included this experiment. In agreement with a lacking need of MyoF in rings and no effect on RSA survival, there was no increased survival of the parasites in RSA (neither on 3D7 nor on K13 C580Y parasites) after cytD treatment (new part in Figure 1M). We thank the reviewer for pointing out that this experiment might also inform on whether other myosins influence endocytosis in ring stages. We added (line 250): “Similarly, also incubation with the actin destabilising agent Cytochalasin D (Casella et al., 1981), had no effect on RSA survival in 3D7 or K13C580Y (Birnbaum et al., 2020) parasites, indicating an actin/myosin independent endocytosis pathway in ring stage parasites (Figure 1M) and speaking against other myosins taking over the MyoF endocytosis function in rings.”
44) Line 608: inhibitors targeting the metacaspase domain of MCA2 may inadvertently inactivate other essential parts of the protein. They authors should acknowledge this possibility in the text.
The inhibitors used in the cited studies (Kumari et al., 2018) are validated metacaspase inhibitors, such as Z-FA-FMK (Lopez-Hernandez et al., 2003). Activity against the other parts of PfMCA2 - which apart from the MCA domain shows no homology to other proteins - is therefore unlikely.
45) Line 624-625: the authors state that MyoF is 'lowly expressed in rings' - indeed this is the case in their MyoF-2xFKBP-GFP-2xFKBP line which the authors established has defects due to the tag, but it appears from their MyoF-3xHA tagged line that it is expressed in rings. The authors should therefore revise their statement, and be careful of making claims based on their defective line and using fluorescence imaging as their only metric. If they do want to make the statement that it is not there in rings, they should also do a western blot, which is much more sensitive since it amplifies the signal compared to an image of one parasite.
This comment is related to major point #24. We also would like to stress that while the MyoF-GFP line already shows a phenotype, the impression of defectiveness based on its location is due to a mix up (see major point #23).
We now provide a comprehensive time course of the MyoF-GFP signal (Figure 1C, S2A) showing that there is no detectable MyoF-GFP signal until the transition from ring to trophozoite stage. As this is all under the endogenous promoter, we do not think the partial functional inactivation of the tagging is the reason for the absence of the signal. If anything, we would have expected adding a stably folded structure such as GFP to increase the stability of the protein. The main reason for the discrepancy of MyoF signal in rings between the GFP-tagged line (of note there is also no detectable MyoF-GFP signal in MyoF-2xFKBP-GFP ring stage parasites (Figure S2B)) and the HA-tagged line likely is that IFA is much more sensitive than live GFP detection (similar to the high sensitivity the reviewer mentions in regards to WB). This discrepancy therefore is likely due to the fact that the lowly expressed MyoF only become apparent with the HA-tagged line due to the IFA. We therefore believe that MyoF is 'lowly expressed in rings' is an appropriate description of our results obtained with three different cell lines (MyoF-2xFKBP-GFP-2xFKBP, MyoF-2xFKBP-GFP and MyoF-3xHA). We hope this is sufficiently well reflected in the manuscript where we write ‘a low level of expression of MyoF in ring stage parasites.’ not that it is ‘not there in rings’ (line 174).
46) Line 635: arguably this is the 3rd variety and not the 2nd (the authors already mentioned 2 types - ones that are involved in HCCU AND ART and those involved in HCCU only). See comment for line 490-493 above.
See response for major comment #41, we now consistently used "or" instead of "and". See line 490-493 how this was resolved for what previously was line 635.
47) Line 785: Bloated food vacuole assay/E64 hemoglobin uptake assay method specify that a concentration of 33mM E64protease inhibitor was used. However, in reference 44, cited in the manuscript, a concentration of 33µM E64 was used. Please confirmed if this is just a typo or if 1000x E64 concentration was used which renders the experiment invalid.
We thank the reviewer for pointing this out, we corrected this typo and will look out for symbol font conversion errors for the resubmission.
48) Line 788: it is unclear from this section what is considered a bloated food vacuole - is there an area above which the FV is considered bloated? Do the authors do these measurements manually or use an addon in FIJI/ImageJ? What is the cutoff for if a FV is bloated? Please clarify. Additionally, for the representative images + rapalog for Figures 2H and 4H, it would be useful to see where the authors delineate the FV (add a white circle showing what is actually measured).
The bloated FV assay is well established (Jonscher et al., 2019; Birnbaum et al., 2020; Sabitzki et al., 2023). Although the bloating of the FV is a human judgment call, it is actually quite obvious: bloating appears as an easily spotted bulging of the FV in DIC. As also minor bloating is scored as 'bloated', it is a very conservative assay. Using an-add on to measure this is not straight forward. It is unclear how this bulging effect of the FV in DIC could be spotted by a software and due to the obviousness to human operators, potentially lengthy and complicated efforts to design appropriate machine learning options were not undertaken. The situation faced by the scorer of the assay is evident from Figure S4F-G which contains close to 50 "on rapalog" cells and close to 50 control cells, giving representative cells from all replicas of bloated FV assays with KIC12. Please note that these images shows the most complicated situation as far as bloated assays go, because the phenotype is not 100% (see Figure 3F) compared to e.g. KIC7 inactivation which leads to lack of bloating in almost all cells (see (Birnbaum et al., 2020) Figure 3E) but nevertheless the difference is still obvious. We are aware that in such situations (less than absolute inhibition) this assay scoring of "yes" or "no" is a surrogate for the actual level of inhibition and may be more subjective. This is why in this case we also did the FV size measurements (which are less dependent on human judgment) to further support this and give a better quantifiable measure. Of note, the bloated food vacuole judgments are done "blinded", i.e. the examiner does not know which sample they are looking at.
In response to this reviewer's point we now also added the FV size refinement of the assay for MyoF inactivation which is one of the cases where inhibition of bloating is not in 100% of the cells (see major comment #27). Please also note here the advantage of the rapidly acting knock sideways technique for these assays which shows the sum of effect 8 h after initiating inactivation and for which we carefully control size of the cells which shows that there is no significant growth reduction over the assay time, excluding secondary effects due to a generally reduced viability. Compared to slower acting systems suggested to have been used instead (see introductory part and significance of this review), the rapid speed of knock sideways reduces the risk of potential pleiotropic or compensatory effects due to the time needed for proteins to be depleted if the gene or mRNA is targeted instead.
The suggestion to include a ‘white circle’ (raised also as minor comment#27) is useful as an aid to see the food vacuole. However, in contrast to the Figures in (Birnbaum et al., 2020) (where we did add such a circle), we here included the DHE staining images in the figure, labelling the parasite cytosol which readily shows the FV (the FV corresponds to the region where there is no DHE staining). As this shows the position of the FV we would prefer to not obscure the DIC images with additional features to permit the reader to see the difference between bloated or non-bloated food vacuoles and keeping the image as natural as possible.
49) Line 863-864: this sentence seems to be out of place.
We thank the reviewer for pointing this out, the details of nucleus staining were moved to the correct part.
50) Line 875: the authors state that there is a light blue wedge, when the circle consists of grey and black wedges. Please revise this.
This has been corrected.
51) Line 1059-1061: it is unclear whether the individual growth curves are different clones or whether they are just the same experiment repeated? If it is the latter, then why are they not combined, as is traditionally done?
These are the individual replicates of the growth curves shown in Figure 1G of the same cell lines done on a different occasion. We always try to show as much of the primary data as possible and believe that showing individual data points from the different experiments is better than only the combined values which obscure the actual course of each experiment.
52) Line 919-924: the authors mention a blue and red line, but there is only a black line in figure 3D. Moreover, the experiment of using the LYN mislocaliser was only done for KIC12 according to the manuscript. Additionally, the y axis of the figure states relative growth day 4[%] compared to rapalog, but then on the x axis there are several days. In the text it says there is no growth defect until the second cycle, but from this graph it appears the growth defect is evident as early as 1 day post rapalog treatment. Can the authors please clarify and correct the issues pointed out.
We thank the reviewer for pointing this out, this was due to a copy & paste error in the figure legend that was now amended. We also fixed the incorrect axis label. For the last part (growth defect) please see detailed answer to Major comment#31 raising the same concern for KIC11 (in synchronous parasites the defect only takes effect once the cells reached the relevant stage whereas in asynchronous cultures there are always cells in the relevant stage that due to the rapid effect of the knock sideways already have a growth phenotype).
53) Figure 1 panel B & C: the label of the figure where the signal from MCA2Y1344STOP-GFP is shown with the DAPI signal overlayed is deceptive since it suggests that this is the signal of full length MCA2. Please change the label of this panel from MAC2/DAPI to MCA2Y1344STOP/DAPI. The same is true for Panel C for the image labeled MCA2/K13 - please change this to MCA2Y1344STOP/K13.
Done as requested.
54) Figure 2B: what stages are these parasites? Please state this in the figure. Based on the MyoF pattern, it looks like rings in the upper panel and trophs in the bottom pannel. Why were schizonts not shown?
Both are trophozoites (early trophozoite in top panel and late trophozoite in bottom panel). This is now labelled in what now is figure 1B. As stated above, schizont stages are less relevant for the topic of this manuscript and in order to prevent the manuscript from getting more disjointed and keeping it more focussed on the main topic, we decided to not include a schizont in the manuscript. Nevertheless, we included an example image below.
[Figure MyoF_p40px schizont]
55) Figure 2D&F: it is not very meaningful when growth assays are shown as a final bar after 4 days of growth. It is much more useful and informative to see a growth curve instead (as is shown in the supplementary), since it shows if the defect is apparent in the first growth cycle or later. With the way the data is currently shown, this is not apparent. I would advise the authors to switch the graph in 2F out of a combined graph of all the biological replicates growth curves for S3D - showing error bars.
While we in principle fully agree with the reviewer in showing the course of the full experiment (which is available in Figure S2E), the key here is to show the overall difference. Hence, we would like to keep this comparison of the overall effect on growth in what now is Figure 1E and G. It is part of the argument to the doubts this reviewer raises to the function of MyoF (mainly in the overall assessment and the significance statement) to show that the phenotype is actually very consistent (partial inactivation through tagging or further inactivation using knock sideways increases endocytosis phenotypes, correlating with parasite viability).
Please also note, that the growth curves upon knock sideways shown in Figure 1G, S2E are performed with asynchronous parasite cultures, which doesn’t allow us to draw direct conclusions about growth cycle effects.
Nevertheless, we now also included the suggested combined data representation in Figure S2E.
56) Figure 3: why were the calculation of FV area, parasite area and FV/parasite area only done for KIC12 and not done for MyoF? It would be interesting to see if any of these values are different for MyoF - whether the parasites are smaller in area and therefore FV smaller. Please present them Figure 2. Images should be already available and would not require further experiments to be done, only the analysis.
This now has been done (confirming our results) and is included as Figure 1J-K, S2J. This point was also raised as major comment #37, please also see detailed answer there.
57) Figure 3B: why is there no spatial association assessment for KIC11 and K13 as was done for the MCA2 and MyoF? The authors should show a pie chart showing the degree of association here as was done for the other proteins.
This is now included in Figure 2C.
58) Figure 3D: The y axis of the figure states relative growth day 4[%] compared to rapalog, but then on the x axis the experiment takes place over several days. Is this a typo in the y axis? Additionally, the authors state in line 287-290 that the growth defect upon addition of rapalog is only seen in the second cycle, but from this graph it appears the growth defect is already evident 1 day post rapalog addition. The figure legend also does not make sense for this figure since it mentions a blue and a red line, when there is only a black line present. The legend also mentions the LYN mislocaliser which was used for KIC12 not KIC 11 (see above).
We apologise for the inadequate legend and colour issues, this was amended. This point was also raised in major comment #31 and #52, please find detailed answer there.
59) Figure 3E: the colour for Control and Rapalog 4 hpi are very similar and very hard to discern. Please choose an alternative colour or add a pattern to one of the samples. The y axis is also missing a label. Is this supposed to be parasitemia (%)?
We thank the reviewer for pointing this out, the missing label is now included and the colour has been adapted to make them better distinguishable.
60) Figure 4A: the ring shown in this figure does not appear to be a ring (it is far too large and appears to have multiple nuclei?). Do the authors have any other representative images to show instead?
This is in fact a ring, but we realize that we accidentally included an incorrect size bar in the ring image of Figure 4A (now Figure 3A) (size bar for 63x objective instead of the correct one for the 100x objective), we apologise for this oversight. We don’t think this parasite has multiple nuclei, instead the Hoechst signal shows the often elongated nucleus seen in rings that can appear as two foci in Giemsa stained smears which leads to the typical diagnostic feature of P. falciparum rings in diagnostics. In order to exclude any doubts about the nuclear localization of KIC12 in rings, we here attached a panel with more examples of KIC12-2xFKBP-GFP-2xFKBP ring stage parasites.
[Figure KIC12]
61) Figure 4B: why is there no spatial association assessment for KIC12 and K13 as was done for the MCA2 and MyoF? The authors should show a pie chart showing the degree of association here as was done for the other proteins. This should be done for the different life cycle stages considering the changing localisation of KIC12.
This is now provided in Figure S4A. As suggested by the reviewer, we independently quantified the association for ring stage, early trophozoite and late trophozoites stage. As there is no KI12 signal in schizonts, we did not include a quantification for this stage.
62) Figures 4C&E: it is extremely important to show the DNA stain in both these samples considering that a portion of KIC12 is in the nucleus! Please add the DAPI signal for these figures (as for all other figures!).
Please see major comment #64 for a detailed answer why we did not include DNA staining in the imaging used to assess mislocalization upon knock-sideways.
63) Figure 4E: this figure should be presented before 4D (considering the line being presented in 4E is used in an experiment in 4D). The authors should switch the order of these two.
We see the point the reviewer is raising here, Figure 4D (now Figure 3D) also contains the data with the Lyn mislocaliser while we first talk about the NLS mislocaliser. This permits a better comparison between the two mislocaliser lines. However, first explaining the Lyn-mislocaliser and then going back to the NLS would make it rather complicated for the reader to follow the storyline and therefore we would like to keep the order as it is. We realise that this means the reader has to go back one figure part for seeing the Lyn growth data, but believe this is worth the benefit that the data is there compared to the NLS result.
64) It is unclear why in many of the fluorescence images the authors do not show the DAPI signal - particularly when colocalising with K13 and when doing the knock sideways experiments. Please add these images to the figures - I would assume they have already been taken, so would simply involved adding the images to the panel.
We did not include DNA staining (DAPI or Hoechst) for any of the images used to assess the efficacy of mislocalization, as we would prefer to keep the parasites as representative of a viable parasites in culture as possible. Hence they were imaged without DNA stain (these stains are toxic). We would like to point out that a DNA stain is not necessary, as the mislocaliser already marks the nucleus (in the case of the NLS mislocaliser), actually even somewhat more accurately, as it fills the entire nuclear space rather than only the DNA which is marked by DAPI or Hoechst.
For LYN this admittedly is not the case, there the mislocaliser marks the plasma membrane. However, we think the proper control for efficient mislocalisation is the comparison between the GFP-tagged protein of interest and the mCherry mislocaliser to show mislocalisation, as previously done in our lab (e.g. (Birnbaum et al., 2017; Jonscher et al., 2019; Birnbaum et al., 2020)).
Due to their toxicity, we also avoided nuclear staining in some other parts of the manuscript when we were of the opinion that a nucleus signal was not necessary.
65) Throughout the manuscript, there is no western blot confirming the correct size of their modified proteins. This should be provided.
We did perform Western blot analysis for both MCA2 cell lines. MCA2 is the only gene-product for which we generated a disruption for this work, and together with the severe truncation from previous work, we provided a Western blot-based confirmation of the correct size.
The MCA2 disruptions are at least partially dispensable for in vitro parasite growth, hence if degradation occurred, this might not have been noticed. In that case we considered it relevant to show that the truncations were of the expected size. The other proteins in the main figures are essential for growth. Hence, if the tagging approach would lead to unexpected changes in protein integrity (which we assume is what was intended by this concern to be assessed with a Western blot), the parasites expressing the tagged MyoF, KIC11 and KIC12 would - due to their importance for asexual blood stage development - not have been obtained. Hence, we can assume the integrity of the tagged protein is very unlikely to have been affected in a functionally relevant way.
66) None of the figures are appropriate for individuals with colour blindness, limiting their accessibility to the paper. Please change the colour schemes for all fluorescent images using magenta/green or an alternative colour combination appropriate for colourblind individuals.
We thank the reviewer for this comment. This has now been amended, individual channels of fluorescence microscopy images are now shown in greyscale, while the overlay was changed to green/magenta.
Minor Comments
1) line 29: remove 'are'.
Done.
2) Line 29: the text says "HCCU is critical for parasite survival but is poorly understood, with the K13 compartment proteins are among the few proteins so far functionally linked to this process." The sentence should be: 'HCCU is critical for parasite survival but is poorly understood, with the K13 compartment proteins among the few proteins so far functionally linked to this process."
Done.
3) line 44: remove 'the'
Done.
4) Line 48: consider mentioning here that malaria is caused by the parasite Plasmodium - otherwise the first mention of parasite in line 52 is confusing for the non-specialist reader.
Done.
5) Line 49: estimated malaria-related death and case numbers are from the 2021 WHO World malaria report. You cite the 2020 WHO World malaria report.
We now cite the newest WHO report.
6) Line 53: please insert the word 'have' between now and also.
Done.
7) Line 54: please change 'was linked' to is linked
Done
8) Line 72: I would specify that free heme is toxic to the parasite. Especially as you mention that hemozoin is nontoxic.
Sentence would be "where digestion results in the generation of free heme, toxic to the parasite, which is further converted into nontoxic hemozoin"
Done.
9) Line 90: authors should either say "in previous works" or "in a previous work"
The text has been altered to say: “ in a previous work”.
10) Line 91: "We designated these proteins as K13 interaction candidates (KICs)"
Done.
11) Line 95: please change 'rate' to number
Done.
12) Line 109: Please include a coma before (ii).
Done.
13) Line 112: as shown by Rudlaff et al in the paper you are citing, PPP8 is actually associated with the basal complex. You can say that "(ii) were either linked or had been shown to localise to the inner membrane complex (IMC) or the basal complex (PF3D7...).
Done.
14) Line 114: Protein PF3D7_1141300 is called APR1 in the manuscript but ARP1 in Supplementary Table 1. Please correct.
Done.
15) Line 131: please define SNP - this is the first use of the acronym.
Done.
16) Line 133-134: South-East Asia instead of "South Asia"
Done.
17) Line 135: please explain what TGD is - it is referred to over and over again in the manuscript without ever being explained.
We apologise for this oversight. We now explain what is meant with TGD at the suggested point of the manuscript.
18) Line 145: change 'Western blot' to western blot - only Southern blot is capitalised since it is named after an individual, while the other techniques are not.
To the best of our knowledge this issue has not been resolved, some Journals capitalize the “W” (e.g. Science), while others don’t (e.g. Nature). We would prefer to continue to capitalize the “W”, as this is consistent with the original publication from (Burnette, 1981), but if there are strong objections, we would be happy to change this____.
19) Line 152: add "the" between 'and spatial'
Done.
20) Line 158: please define SLI as selected linked integration, since it is the first use of the acronym.
Done.
21) Line 178: introduce a coma after protein. Sentence should be "Proliferation assays with the MCAY1344STOP-GFPendo parasites which express a larger portion of this protein, yet still lacking the MCA domain (Figure 1), indicated no growth ...
Done.
22) Line 195: the authors could mention that MyoF was previously called MyoC in the Birnbaum 2020 paper. I wanted to check back in the Birnbaum 2020 paper and could not find MyoF
Good point, this was done.
23) Line 200: "Expression and localisation of the fusion protein was analysed by fluorescent microscopy". Why expression was not analysed also by western Blot same as for MCA2?
Please see major comment #64 for a detailed answer.
24) Line 204: I could not find any mention of MyoF (Pf3D7_1329100) in reference 65. Please remove reference 65 if not correct. Also reference 66 looks at Plasmodium chabaudii transcriptomes so I would specify that "This expression pattern is in agreement with the transcriptional profile of its Plasmodium chabaudii orthologue"
Reference 65 (Wichers et al., 2019) provides an RNAseq transcriptome dataset for asexual blood stage development of 3D7 (originating from the same source as the 3D7 used in this study). While Ref 66 (Subudhi et al., 2020) indeed contain transcriptomic data from P. chabaudi, the authors also provide a nice 2h window RNAseq transcriptome dataset for asexual blood stage development of Plasmodium falciparum. Both datasets are therefore suitable as reference for the statement about myoF transcription pattern. Both datasets are also easily accessible and show the pattern in a graph in PlasmoDB.
25) Line 208: Please indicate a reference for P40 being a marker of the food vacuole
Done.
26) Line 220-224: The authors should consider changing to " Taken together these results show that MyoF is in foci that are mainly close to K13 and, at times, overlapping, indicating that MyoF is found in a regular close spatial association with the K13 compartment."
The suggested wording introduces "mainly" for "frequently" and likely was in part motivated by the discrepancy in location between cell lines that we hope we now could clarify to be only minor (see major point #23). We therefore think the original wording appropriately summarises the findings (line 178): “*Taken together these results show that MyoF is in foci that are frequently close or overlapping with K13, indicating that MyoF is found in a regular close spatial association with the K13 compartment and at times overlaps with that compartment.” *
27) Line 255: In Figure 2H, and subsequent figures showing bloated FV assay, I would delineate the food vacuole with dashed line as in Birnbaum et al. 2020 to help the reader understanding where the food vacuole is.
In contrast to the Figures in Birnbaum et al. 2020, we here included the DHE staining (parasite cytosol) in images of bloated FV assays which visualizes the FV. We therefore decided to avoid any further marking, to keep the image as unprocessed as possible (see also major point 48).
28) Line 265-266: Here the title says that KIC11 is a K13 compartment associated protein, but the title of Figure 3 says KIC11 is a K13 compartment protein. I noticed that you make the difference between K13 compartment protein et K13 compartment associated protein for MyoF for example which is not clearly associated with the K13 compartment. Which one is it for KIC11?
The interpretation of the reviewer is correct, we indeed graded this subconsciously based on level of overlap. Based on the newly added quantification shown in Figure 2C, we describe KIC11 now as K13 compartment protein.
29) Line 309-310: indicate a reference for your statement "which is in contrast to previously characterised essential K13 compartment proteins".
Done, we now included Birnbaum et al. 2020 as reference for this.
30) Line 377: Figure 4I, please correct 1st panel Y axis legend
Done.
31) Line 404: replace "dispensability" with dispensable
Done.
32) Line 416: can the authors provide any speculation as to why they observed these proteins as hits in the BioID experiments?
As some of these proteins were less well or less consistently enriched, they could be background of the experiment. Alternatively, some could be proteins that only transiently interact with the K13 compartment.
33) Line 451: Where the "97% of proteins containing these domains also contain an Adaptin_N domain and function in vesicle adaptor complexes as subunit a" come from. Do you have a reference?
The statement now includes references and reads (with small changes to original submission): "More than 97% of proteins containing these domains also contain an Adaptin_N (IPR002553) domain (Blum et al., 2021) and in this combination typically function in vesicle adaptor complexes as subunit α (Hirst and Robinson, 1998; Traub et al., 1999) (Figure 5D) but no such domain was detectable in KIC5."
34) Line 465-467: the same could be said for KIC4 as it also has a VHS domain.
The critical issue is the combination of domains and their position within the protein. While KIC4 also contains a VHS domain, the VHS domain in KIC4 is N-terminal, not in a central position and it is also not the first structural domain to be identified in KIC4. The similarity to adaptin domains was already described ((Birnbaum et al., 2020) and annotated in PlasmoDB) and these domains are also involved in vesicle formation and trafficking. These aspects of the statement can therefore not be extended to KIC4. With regards to VHS domains being involved in vesicle trafficking, this is already stated in line 538: «KIC4 contained an N-terminal VHS domain (IPR002014), followed by a GAT domain (IPR004152) and an Ig-like clathrin adaptor α/β/γ adaptin appendage domain (IPR008152) (Figure 5A-C, Figure S8). This is an arrangement typical for GGAs (Golgi-localised gamma ear-containing Arf-binding proteins) which are vesicle adaptors first found to function at the trans-Golgi (Dell’Angelica et al., 2000; Hirst et al., 2000).»
35) Line 477-479: Can be rephrased to "However, we found this protein as being likely dispensable for intra-erythrocytic parasite development and no colocalisation with K13 could be demonstrated, suggesting a limited role for PF3D7_1365800 in endocytosis. Or something like that. Makes it clearer.
We rephrased this sentence and it now reads (line 592): “However, we found this protein as being likely dispensable for intra-erythrocytic parasite development and no colocalisation with K13 was observed, suggesting PF3D7_1365800 is not needed for endocytosis“.
36) Line 535: Have AP-2a or AP-2b been shown to be at the K13 compartment?
AP2m is at the K13 compartment (Birnbaum et al., 2020). Adaptor complexes are heterotetramers and their subunits do not typically function on their own and this is conserved across evolutionarily distant organisms. In agreement that this is also the case in P. falciparum, Henrici et al. (Henrici et al., 2020a) showed that both, AP-2a and AP-2b, were present in an AP2µ Co-IP, indicating that the AP2 complex consist of the ‘classical’ subunits in P. falciparum. Therefore, the presence of all subunits at the K13 compartment is very likely, although this has only been experimentally confirmed for AP2µ. Of note, for Toxoplasma gondii the presence of AP-2a and AP-2b at the micropore has been experimentally confirmed (Wan et al., 2023; Koreny et al., 2023) and interaction suggested by presence in the same IP as DRPC (Heredero-Bermejo et al., 2019).
37) Line 569: reference 43 is wrong
We thanks the reviewer for pointing this out – we removed Ref 43.
38) Line 746: typo "ot" instead of or.
Changed.
39) Line 801: method for Domain Identification using AlphaFold specify that RMSDs of under 5Å over more than 60 amino acids are listed in the results. However, there is a typo in Figure 5B for KIC5 where it says "RMSD 4.0 Å over 8 aa". Please correct.
Done. In addition, we have now applied a more stringent cut-off of 4Å over more than 60 amino acids to ensure a higher reliability of our hits. This decision was based on results from our preprint (Behrens and Spielmann, 2023). Because of this the phosphatase domain in KIC12 is no longer included in this manuscript and accordingly the following sentence has been deleted. “In KIC12 we identified a potential purple acid phosphatase (PAP) domain. However, with the high RMSD of 4.9 Å, the domain might also be a divergent similar fold, such as a C2 domain, which targets proteins to membranes.”
40) Line 856: In Figure 1E, please use the same Y axis legend as in Figure 2D "relative growth at day 4 [%] compared with 3D7"
Done.
41) Figure S1: Some PCR gels check for integration are presented as 5', 3' and ori whereas other gels are presented as ori, 5' and 3'. This is confusing.
We agree that ideally the order of sample loading should be consistent and we apologise for this. The explanation for this is that these gels were run by different people at different times before we were able to better standardize the loading scheme. However, in the interest of not unnecessarily using resources for something that has a similar meaning, we would prefer not to repeat these PCRs and re-run them only for consistency reasons (as the conclusion is not affected by the different loading schemes).
42) Figure S1: Why was the expression of only MCA2 was verified by Western blot? What about the other proteins?
See response to major comment 56.
43) Line 493: Considering KIC11 was not involved in HCCU or ART resistance it might be worth mentioning in this section that it is of note that there are no domains detected that would be involved in endocytosis.
We agree that this is the case, however it is also the case for all other proteins that either are not involved in endocytosis and/or lowered susceptibility to ART. We therefore now added a summary statement addressing this in line 602: “In contrast, the K13 compartment proteins where no role in ART resistance (based on RSA) or endocytosis was detected, KIC1, KIC2, KIC6, KIC8, KIC9 and KIC11, do not contain such domains (Figure 5E).” We did not add this at the suggested part of the manuscript as at that point the domain search results are not yet introduced and doing this each time for all the individual proteins would disconnect the flow of the manuscript.
44) Line 503-506: is it wise to generate more drugs that target a pathway that is already highly susceptible to mutations? The authors should add a statement explaining how this might be avoided.
The only protein for which mutations do not have a large fitness cost is K13 (see also our preprint on fitness cost of ubp1 mutation (Behrens et al., 2023) and even with K13 the level of resistance seems to be limited by amino acid deprivation when endocytosis is reduced (Mesén-Ramírez et al., 2021). We therefore do not think that this pathway is particularly prone for mutations. Further, the number of commercial drugs targeting the "endproduct" of endocytosis (hemoglobin digestion and detoxification of heme) highlight it as the most prominent vulnerability for drug-based intervention if we go by number of commercially available drugs acting on things associated with a single process.
45) Throughout, scale bars are stated in the figure legends at the end of the legend. This is a slightly confusing format. The authors should consider stating the scale bar for each sub-legend where a fluorescence image is taken.
Done.
** Referees cross-commenting**
After reading reviewer 2 and 3's comments, I think there are significant overlaps in the key points raised in terms of questions about fusion proteins and their potential partial mis-localisation, better descripton of results and target selection. Overall I think we agree that the work has potential, but in its current form does not represent a major advance. It would be immensely helpful if the manuscript would be carefully edited for a better flow and linear description of results.
We now rearranged the manuscript for better flow but would like to highlight that the many requests for smaller experimental issues (and "better description of results") worked somewhat in the opposite way of a more linear description. We hope the rearranged version acceptably balances these two issues. The issues raised in regards to target selection and potential partial mis-localisation are addressed in our responses mainly to this reviewer. Please also see comments on systems used at the end of the rebuttal.
Reviewer #1 (Significance (Required)):
The authors set out to test whether other proteins that are in the vicinity of K13 are involved in mediating ART resistance and endocytosis. This is an interesting question. However, other than MCA2 which was already known to be involved in mediating ART resistance (and was not tested for its involvement in endocytosis), none of their candidate proteins seem to be involved in mediating both these functions. The authors show that the other proteins tested appear important for parasite growth, with KIC12 and MyoF involved in mediating endocytosis. While these findings are novel, the KS approach used by the authors casts some doubt over the findings, and would mean that these findings would have to be re-tested with a more reliable approach, such as the GlmS system or generating a conditional knockout using the DiCre system. Despite not advancing our understanding of ART resistance, or identifying further players involved in this process, this manuscripts provides two candidates that are involved in mediating endocytosis and a further candidate that appears to be important for parasite growth. Further work on these proteins will be required to understand their exact roles. As stated above, there is currently limited interest for these results (limited to researchers working on endocytosis in apicomplexan parasites and possibly the wider endocytosis field from an evolutionary perspective), however with further work, this could increase the impact and interest of this work substantially.
The authors do not describe any novel methods/approaches within this work.
In the significance statement the reviewer indicates that other systems would have been more reliable for the work here. This is addressed in our response above and in a detailed considerations on the properties of conditional inactivation systems at the end of the rebuttal. The systems used in this work were not only chosen because they permit rapid targeting of many different proteins, but because they have merits that are beneficial for our assays. In fact many of the functional assays in this manuscript are difficult or impossible to carry with the suggested conditional inactivation systems (please note that we have extensive experience with the systems considered preferable:
DiCre (Birnbaum et al., 2017; Mesén-Ramírez et al., 2019; Mesén-Ramírez et al., 2021; Wichers et al., 2022; Kimmel et al., 2023)
glmS (Wichers et al., 2021c; Wichers et al., 2021a; Wichers et al., 2022; Wichers-Misterek et al., 2023)).
Reviewer #2 (Evidence, reproducibility and clarity (Required)):
In a previous publication the Spielmann lab identified the molecular mechanism of ART resistance in P. falciparum by connecting reduced levels of the protein K13 to decreased endocytosis (uptake of hemoglobin from the RBC cytosol), which results in reduced ART susceptibility. Using quantitative BioID the authors further identified proteins belonging to a K13 compartment, highlighting an unusual endocytosis mechanism.
In the present manuscript the authors follow up on this work and closely examine ten more proteins of the K13/Eps15-related "proxiome". They successfully link MCA2 to ART resistance in vitro, while the proteins MyoF and KIC12 are involved in endocytosis but do not confer in vitro ART resistance when impaired. They further characterize one candidate (KIC11) that partially colocalizes with K13 in trophozoites but to a lesser degree in schizonts. Growth assays suggest an important function for KIC11 in late stages of the intraerythrocytic developmental cycle. Five analyzed proteins however do not colocalize with the K13 compartment, while a sixth was refractory to endogenous tagging.
Using AlphaFold predictions of the KIC protein structures the author identify domains in most constituents of the K13 compartment, highlighting vesicle trafficking-related features that were not identified on primary sequence level before.
The combination of functional data together with structure predictions leads them to propose a refinement of the K13 compartment as being divided into proteins participating in endocytosis and proteins that have an unknown function.
We thank the reviewer for the assessment of the manuscript and the constructive comments.
Major comments:
1) -Table 1 is missing
We apologise for this mistake; Table 1 is now included.
2) -Lines 117-123: Given the total list of uncharacterized candidates encompasses 13 proteins, can the author gives the reason why only the top 10 and not all 13 were characterized in this study?
A similar point has been raised by Reviewer 1 in major comment #12, please see our response there for an explanation why we chose which targets.
3) -Line 174: 20% of observed MCA2 foci show no overlap with K13 and 21% only partially overlap, can the author confirm that the observed MCA2 foci in schizonts are the ones that co-localize with K13. (Addition of a schizont stage image in Fig 1C would be sufficient).
We now extended Figure 4C with images of MCA2-Y1344STOP-GFP+mCherryK13 parasites covering the schizont and merozoite stage, showing that the majority of the MCA2 foci in schizonts are also mCherry-K13 positive.
4) -The localization and observed phenotype of KIC11 is interesting but unfortunately the authors do not explore it further. Does KIC11 localize with markers of e.g. the secretory organelles (micronemes or rhoptries) in schizonts and could therefore be involved in RBC invasion?
While we intended to focus mainly on the endocytosis aspect of these proteins, we see the reviewer's point and now generated new cell lines enabling assessment of spatial association of KIC11 with markers for rhoptry (ARO), micronemes (AMA1), and inner membrane complex (IMC1c). This revealed that the KIC11-GFP signal in schizonts does not overlap with apical organelle markers and the signal does not resemble a typical apical localization. In addition, we assessed all three organelle markers after inactivating KIC11 by knock sideways which showed that KIC11 inactivation has no apparent effect on the appearance of these markers, suggesting no major alterations in schizont morphology in respect to apical markers. These results are now presented as Figure S3A and in line 304 of the results.
5) Can the author distinguish if KIC11 is involved in RBC invasion or in establishment of the ring-stage parasite?
In order to look into this, we performed egress/invasion assays, quantifying schizont and ring stage parasites in tightly synchronized parasites at two different time points (pre-egress: 38-42 hpi & post-egress: 46-50 hpi). This revealed a significant decrease in newly formed ring stage parasite per ruptured schizont in parasites with inactivated KIC11, while the egress efficacy remained unaffected. This indicated an invasion or very early ring stage development defect (new Figure 2H, Figure S3G). To further determine at which point exactly the phenotype occurs (ie during invasion or early after invasion) would require extensive experimentation that goes beyond the scope of this study (e.g. invasion assays using video microscopy with a representative number of parasites or sophisticated flow based quantification assays). We hope by excluding egress and gross changes of apical organelles as well as no indication for similar number of early rings (indicating it is invasion or a very early ring-establishment phenotype) will sufficiently narrow down the phenotype for labs interested in invasion to more definitely answer this question.
Minor comments:
1) Table S1: Please add the criterion for the order of proteins (abundance in "proxiome"?) in the table as a separate column. I would also suggest adding a new column that highlights the 10 proteins investigated in this study as I found the color-coding slightly confusing.
Done as suggested: we now include the “average log2 Ratio normalized Kelch13” values from the four DiQ-BioID experiments performed with K13 in (Birnbaum et al., 2020), as well as the suggested column to highlight the investigated proteins. Please also see reviewer 1 major point # 12 for additional information on the selection criteria and how this was added to the manuscript.
2) -154-155: There is a discrepancy between the text and Fig1C regarding the % of partial overlapping and non-overlapping foci.
We thank the reviewer for pointing this out, this was corrected.
3) -The y-axis label is missing in Fig 3E
Done.
4) -Fig 4I left graph, the superscript 2 is missing in μm2
We thank the reviewer for pointing this out, this is now changed.
5) -Did the author colocalize KIC11 in schizonts with other proteins found in the K13 compartment group of proteins not involved in endocytosis/ART resistance? This may help to further subgroup these proteins.
This is an interesting point but would actually be technically challenging to do. For this we would need to generate a KIC11endo parasite line for each of these KICs and then do co-localisation in schizonts. However, the outcome of this likely would not be very clear. The reason for this is as follows. There are foci of KIC11 that do overlap with K13 in schizonts. One can expect that these foci show KIC11 at the K13 compartment and that the other KICs would overlap with KIC11 in these K13 foci in schizonts. Hence, we would also need to see K13 to find the non-K13 compartment KIC11 foci and see if these contained the KIC of interest. This is technically challenging because it would mean we would need a third fluorescent protein which is not that trivial to do. Due to the difficulty to do this and the large amount of work involved and the already considerable amount of data in this manuscript, we believe this will be better suited for a different study.
6) -As a general comment: to make the beautiful IFAs more accessible to a broader readership, I would encourage the authors to switch the color-coding to green/magenta/blue or an equivalent color system or add grayscale images.
This was done as suggested, all fluorescence images are now provided as greyscale images and the overlays are shown in magenta/green.
Reviewer #2 (Significance (Required)):
Characterizing the molecular components involved in Plasmodium endocytosis will not only reveal interesting biology in these highly adapted parasites, but will more importantly lead to a better understanding and potentially open new avenues for intervention of ART resistance. The here presented manuscript is a carefully executed follow-up on previous work done in Dr. Spielmann's lab focusing on the K13 compartment. The authors use established assays to characterize novel components and reveal three new players in endocytosis with one mediating ART resistance in vitro. The proposition that parts of the K13 compartment have a function other than endocytosis is interesting, but will have to await more data from future studies. Taken together this manuscript adds significantly to our understanding of endocytosis in P. falciparum.
This work is of interest for cell and molecular biologists working on Apicomplexa, but especially for the Plasmodium community.
We thank the reviewer for this positive assessment.
I am a cell and molecular biologist working on Toxoplasma gondii
Reviewer #3 (Evidence, reproducibility and clarity (Required)):
Summary: The authors characterized 4 proteins from P. falciparum via cellular (co-)localization, endocytosis, parasite growth, and artemisinin resistance assays. These proteins have been identified as candidates for Kelch13 compartment and a possible role in endocytosis in their previously work with quantitative BioID for potential proximity to K13 and Eps15 (Birnbaum et al. 2020). In the current work, additional 6 proteins were not confirmed as being associated to the K13 compartment. This experimental work was complemented by an in-silico analysis of protein domains based on AlphaFold algorithm. For this protein structure evaluation all proteins were chosen, which were experimentally confirmed to be linked to the K13 compartment in the current publication and previous work. With the work 3 novel proteins linked to artemisinin resistance or endocytosis could be functionally described (KIC12, MCA2, and MyoF) and a number of hypotheses were generated.
We thank the reviewer for the assessment of the manuscript and the constructive comments.
Major comments:
The quality of the presented work is solid, the experimental design is adequate, and methods are presented clearly. The publication contains a lot of results both presented in text and in the figures and it is not always straight forward for the reader to follow the descriptions due to many details presented and a lack of context for some of these experiments.
We thank the reviewer for this overall positive assessment.
We now reordered the results section in an attempt to increase the flow of the manuscript. We also made changes to improve the context for the results. Given the further (very valid) requests for data on schizonts and invasion, there was an increased danger for a less linear manuscript that we hope to have acceptably managed with the re-arrange.
Specific suggestions for consideration by the authors to improve the manuscript. Abstract: 1) R 31: Mention how the 4 proteins were identified as candidates, you need to refer to previous work to clarify this
To clarify this the sentence was changed to (line 31): "Here we further defined the composition of the K13 compartment by analysing more hits from a previous BioID, showing that MyoF and MCA2 as well as Kelch13 interaction candidate (KIC) 11 and 12 are found at this site."
2) R38: "Second group of proteins" is confusing - different from the 4 mentioned above? Significance to endocytosis unclear. Please unify terminology in the manuscript, see also comment below on proxiome.
We changed the wording to clarify the group issue in the abstract as follows line 34: "Functional analyses, tests for ART susceptibility as well as comparisons of structural similarities using AlphaFold2 predictions of these and previously identified proteins showed that canonical vesicle trafficking and endocytosis domains were frequent in proteins involved in resistance or endocytosis (or both), comprising one group of K13 compartment proteins, While this strengthened the link of the K13 compartment to endocytosis, many proteins of this group showed unusual domain combinations and large parasite-specific regions, indicating a high level of taxon-specific adaptation of this process. Another group of K13 compartment proteins did not influence endocytosis or ART susceptibility and lacked detectable vesicle trafficking domains. We here identified the first protein of this group that is important for asexual blood stage development and showed that it likely is involved in invasion.”
3) Abstract can only be understood after reading the full publication
We attempted to amend this by expanding the abstract, particularly the changes highlighted in the previous two points.
Results: 4) Table 1 is missing from the submitted materials
We apologise for this mistake. Table 1 is now included.
5) Consider to shorten and stratify the result section to focus on the significant data
We rearranged the results in an attempt to streamline this section and are now starting with MyoF in the revised manuscript. However, as highlighted by the requests from reviewer 1, many details need to be available to support our conclusions. For instance the fact that GFP-tagging partially inactivated MyoF asked for further data to support our conclusion (HA-tagged version, showing that the location of the GFP-tagged version was consistent with the HA-tagged version, showing to what extent the different constructs affected growth and correlated with number of vesicles and bloating, see new figure 1M) or that KIC12 has two locations. Overall, we are therefore hesitant to remove data or description from the result part.
6) Unclear how the localization and functionalization assays might be impaired by the fusion proteins Significance of ART resistance assay is not clear, in presence of strong growth effects due to inactivation or truncation of genes/proteins
As indicated also in the example given in the previous point (this reviewer #5), the use of different cell lines (GFP-tagged live cells and small epitope tag in IFA) for targets with an indication for an effect of the tagging confirm that the location we assigned is reasonable. In the case of MyoF, the HA-tagged line, the partial inactivation due to GFP and the further inactivation in the GFP-tagged line by knock sideways show plausible increase of phenotypes (vesicle accumulation and bloated FV assays). Thereby the GFP-tagged line can be seen as a partial inactivation line that further supports our conclusions and overall this paints a consistent picture of the function of this protein in endocytosis (see new Figure 1M better illustrating this). Please note that the difference in location shown by this line compared to the HA-tagged proteins is only small (see also reviewer 1 major point 23ff). See also general discussion on tags at the end of this rebuttal.
Significance of ART resistance assay: The ‘ART resistance assay’ is done comparing +/- ART (DHA) in identical parasites (originating from the same culture and the same condition). Hence, any growth effects are cancelled out and effects in reducing ART susceptibility would - if at all - be underestimated (see more detailed response to point 28, reviewer 1 and controls in Birnbaum et al., 2020 where we tested an unrelated essential protein, unrelated chemical insult and rapalog on 3D7 and did not detect any effect on RSA survival).
MCA 7) Stratify results, order by significance of findings, it appears to be described in chronological order, improve readability/flow, eg ART resistance if mentioned in r138, but only reported in r183ff
We attempted to stratify, but then the reason for generating the partial MCA2 disruption parasite line becomes very arbitrary and would leave the reader wondering why we at all truncated the protein at two thirds of the protein. Hence, we do not see a way around this chronological reporting. However, this part is now not at the start of the experimental results section anymore, possibly making it overall a bit more palatable.
MyoF 8) R195 to 197 - consider moving to discussion as it is distracting here
This was shortened and additional information (asked for by reviewer 1, major point 22) to clarify that MyoF was previously called MyoC, was added (line 147): “The presence of MyosinF (MyoF; PF3D7_1329100 previously also MyoC), in the K13 proxiome could indicate an involvement of actin/myosin in endocytosis in malaria parasites. "
9) Term proxiome is introduced above, but not used in result section - suggest to unify language, eg r195 uses "K13 compartment DiQ-BioIDs" instead, which is not very convenient for the reader
We carefully reviewed this and made this more consistent.
10) What is the enrichment factor? Please provide for this and the following proteins, eg in Table 1
The enrichment factor is log2 enrichment over control and this is now provided in table S1 (see also detailed answer for Reviewer 1 major point 12).
11) R225 to 243 - overall significance of the growth experiments with mislocaliser is not clear, consider removing from manuscript or explain relevance more clearly
See also point 28, reviewer 1: This experiment is actually quite important. It shows that if we conditionally inactivate the GFP-tagged MyoF, the growth is further reduced, as stated in line 208. It might have been confusing that the mislocalisation is only partial, but this is equivalent to a partial knock down and hence is useful. This becomes even more relevant with the specific assays following in the next paragraph: while the tagging of MyoF already resulted in vesicles, conditional inactivation with KS generated even more vesicles, showing that the same phenotype was rapidly increased when MyoF was further inactivated by a different means and this also correlated with growth. Hence, this is actually a very consistent phenotype that despite some shortcomings of the tools available to analyse this protein (due to the partial inactivation by the GFP tag) in our eyes looks very convincing. We now added a graph showing the correlation of growth and phenotypes to illustrate this (Figure 1L).
We also tried to make this clearer by changing line 200 to: “Hence, conditional inactivation of MyoF further reduced growth despite the fact that the tag on MyoF already led to a substantial growth defect, indicating an important role for MyoF during asexual blood stage development.” And line 208 to:“ This was even more pronounced upon conditional inactivation of MyoF by KS (Figure 1H), suggesting this is due to a reduced function of MyoF.”
12) KIC11/KIC12 Enrichment factor?
The enrichment (’average log2 Ratio normalized Kelch13 from Birnbaum et al. 2020’) is 1.65 for KIC11 and 1.32 for KIC12, which is now also explicitly shown in column D of Table S1.
** Referees cross-commenting**
I would like to applaud reviewer #1 for a great, very thorough review and lots of detailed suggestions. I agree with the conclusions mentioned in the significance evaluation from reviewer #1 and #2: the work presented does not contain novel methods and the scope is rather narrow with the current results. (I am working on clinical studies with novel antimalarial agents)
Reviewer #3 (Significance (Required)):
On the one hand side, the authors have wrapped up some of the remaining protein candidates of the K13 compartment and could verify 4 of 10 proteins. The work is of interest for the scientific community working on endocytosis and malaria drug resistance mechanisms. Overall, the conclusions and findings from the previous work, Birnbaum et al. 2020, could be confirmed and extended mainly using the methods previously described. On the other hand, the authors made use of progress in protein structure predictions and identified domains linking the K13 compartment proteins to putative functions. The overlaid protein folds of the newly identified domains in figure 5 look convincing, but I can't comment on the technical details or cut-off used for this in-silico analysis.
Extended general remarks on the systems used for this work:
Mainly reviewer 1 suggest (in the general comments and the significance statement) that other systems would have been better suited to use for this work, namely glmS and diCre and also has concerns about the large tag which is seconded by a comment of reviewer 3. In light of this we here provide some extended considerations on the properties for conditional systems and tagging in regards to the goals of this work.
We would like to point out that we do have experience with the systems considered better-suited by the reviewer (one of the first authors has extensively used glmS (Wichers et al., 2021c; Wichers et al., 2021a; Wichers et al., 2022; Wichers-Misterek et al., 2023) and our lab was one of the first to adopt the diCre system in P. falciparum parasites and we regularly us it (Birnbaum et al., 2017; Mesén-Ramírez et al., 2019; Kimmel et al., 2023)). Clearly, these methods have a lot of strengths but there are a number of issues to be considered for the assays we use in this work (see the next section on conditional inactivation systems). In a nutshell, we believe diCre would give a more reliable readout of the absolute level of "essentiality" (i.e. importance for growth) but is unsuitable or at least difficult to use for the assays that reveal the function of our interest in this work. GlmS basically combines the drawbacks of diCre and knock sideways and hence for most targets is not expected to give a better readout of level of "essentiality" but is similarly difficult to use for our specific assays. The fact that both of these systems are possible to use without adding a tag to the target may be an advantage but without tag one loses some very important features that can be critical to understand the outcome with a given system (see considerations on the tag further below).
Conditional inactivation systems:
The comparably short time frame for malaria parasites to go through different stages during blood stage development also is an issue relevant for inactivation speed. The advantage of speed and the danger of obscured phenotypes is highlighted by our work on VPS45 which showed that in trophozoites this protein is involved in the transport of hemoglobin to the FV whereas in late stages it also has a role in secretory processes. Both of these functions we were able to specifically assess in the same growth cycle using KS to rapidly inactivate the protein (Bisio et al., 2020) but with a slower system would have been more complicated to dissect.
Speed of effect with glmS: unless the KS does not work well, glmS is slower acting than KS (it does not target the already synthesised protein which can remain in the cell) and also often suffers from only partial inactivation, hence the benefit of using it here is unclear. The option to have an untagged protein is a plus, however it also is a minus, as assessing efficiency (particularly in live cells e.g. for bloated assays etc a fluorescent tag is the only direct option to assess inactivation of target) is critical to ensure the phenotype manifests at the stage of interest.
lethality/absolute phenotypic effects are detrimental to some assays to study the functions we are interested in for this work: no RSA can be conducted, if the gene is lost and the parasites die. Again, with diCre, one could attempt to hit the point when the parasites have lost sufficient amounts of the target protein when they are placed under ART but then the parasites need to continue growing for ~3 days, which is not possible if the cKO is lethal except for very slowly turning over proteins. However, in that latter case, the parasites likely still had full functionality of the target protein at the beginning of the RSA, when the drug pulse happens and there would be no effect. Knock sideways solves these problems by permitting knock sideways inactivation only under ART (or with a few hours pre-incubation depending on the inactivation speed) to not yet affect growth in a severe manner but inhibiting the process the protein is involved in. It may be possible to use glmS for RSAs, but the slow speed would complicate it (it would not permit control of target protein levels in a matter of a few hours to inactivate the target protein and then re-install it).
None-absolute inactivation is also a strength for some functional assays. While we really like using diCre, in the case of EXP1 it made it necessary to complement the exp1 cKO parasites with low levels of EXP1 to be able to do functional assays without killing the parasites (Mesén-Ramírez et al., 2019; Mesén-Ramírez et al., 2021). While the lethality issue does not apply to glmS (like knock sideways, it also can be tuned), it is unclear what would be gained over knock sideways. Knockdown levels with glmS vary from gene to gene and cannot be predicted, it is in most cases considerably slower than KS, it requires glucosamine which becomes toxic at higher concentrations and might introduce off target effects and tracking protein levels during the assay would equally need GFP tagging.
Integration of properties of conditional systems
Given the above discussed properties, several factors have to be considered to be able to use a system for a given assay. Stage-specific transcription is one example. For diCre a protein not expressed in e.g. rings permits to remove the gene and the protein is never made in that parasite development cycle. We exploited this for instance for two proteins only expressed from the trophozoite stage onwards (Kimmel et al., 2023). However, if lethal (absolute effect problem), this also means one can also only see the phenotype on onset of expression of the target (e.g. if in mitosis, the first nuclear division in case the protein is absolutely essential for the process). This is just one example of such issues. Expression timing, turnover of the protein and homogeneity of stage-specific loss of protein will all influence how clearly the phenotype can be determined. All this will decide the exact time of loss/inactivation of the target protein to levels generating a phenotype and ideally therefore can be monitored during an assay (see considerations on tagging).
For these reasons vesicle accumulation or bloated food vacuole assays are difficult with slow systems as ideally the target should rapidly be inactivated at the trophozoite stage and the result monitored before the cells have moved to the schizont stage. For this a well responding knock sideways is ideal as the protein can be rapidly taken away (sometimes within seconds) to visualise the immediate, direct effect in the cell.
As shown for KIC11, there is also no disadvantage of using KS for proteins with other assays or proteins that result in different phenotypes. It permits stage-specific same cycle inactivation without having to worry about the turnover of mRNA and protein (Fig. 2F,G). Thus, besides the advantages of knock sideways for endocytosis related assays and RSAs, we also see no disadvantage of using knock sideways for the functional study of KIC11 which has a role other than endocytosis. KS also permits to specifically target the K13 pool of KIC12, something impossible or very difficult to do with other systems. Hence, we are of the opinion that the system for inactivation was adequate for most of the proteins analysed in this manuscript.
Large tag: we agree that GFP-tagging can be a disadvantage but in our opinion its benefits often outweigh the drawbacks because it permits easy and immediate (on individual cell level, if need be) monitoring of the presence/location of the target protein (e.g. after KS, but given the discrepancy of the timing between gene excision and protein loss, it might be even more important for techniques such as diCre). No fixing/permeabilisation (prone to artifacts, prevents immediate view of cells) to detect a target with specific antibodies or via a small tag is needed with GFP. Similarly, the use of Western blots to do this is time consuming and impractical if monitoring of left-over protein in the course of an assay such as a bloated food vacuole assay is needed.
In many cases, adding GFP has no negative effect. In addition, if the bulky folded structure of GFP is tolerated, it usually also tolerates the 2 to 4 12kDa FKBP domains in our standard tag. We also typically add a linker. This approach has worked for a large number of different proteins, including many essential ones for which we would not otherwise have obtained the integration cell lines (Birnbaum et al., 2017; Jonscher et al., 2019; Hoeijmakers et al., 2019; Birnbaum et al., 2020; Kimmel et al., 2023; Sabitzki et al., 2023). Hence, whenever a cell line is obtained with it, this tag in most cases is not a disadvantage. Admittedly an exception in this is MyoF and to some extent maybe MCA2 (we would like to stress that in the case of MCA2 the reason for not being able to obtain the full length tagged cell line is unclear: the protein can be severely truncated to less than 3% of its amino acid sequence and a GFP-tag is tolerated on the version with 2/3s of the protein left, which gives no good reason why the full length was not obtained; a potential reason could be a dominant negative effect). However, we obtained the full length with a small tag detected by IFA for both, MyoF and MCA2 and the location of these agreed well with the GFP tagged versions, indicating that the GFP-tagged versions are useful to show the location of these proteins in live cells.
There are also tricks to attempt monitoring the effect of e.g. diCre without tagging the target. For instance, if a fluorescent protein is connected to excision without actually being fused to the target (ie excision of the gene leads to its expression of e.g. GFP), which would avoid adding a tag to the target itself. However, the problem with this is that expression of GFP does only show excision, but mRNA producing the target protein and left over target protein may still be there in the cell. All in all, the GFP-tag on the target, while with some drawbacks, is still our preferred method to control to monitor the target protein in the cell (in principle permitting quantification of ablation efficiency on the individual cell level).
Conclusion on these considerations for this manuscript
Based on these considerations we do not see the immediate benefit of changing the system for the conclusions drawn from this study and are unsure if they are indeed better suited for this work as suggested. While a more exact readout of "essentiality" might be possible with the diCre system we are of the opinion this is less important than learning the function of a protein which - as outlined above - we believe to be considerably more difficult with diCre and even more so with glmS considering our target functions. The same applies to target specific cellular pools of a protein as done here for KIC12. Clearly MyoF is one example where the employed systems shows limitations, but with the new Figure part showing consistency in phenotype with degree of inactivation (importantly with two different forms of inactivation) and the clarification that the location of the GFP-tagged and HA-tagged versions are actually quite similar in location, we do not think employing an extra system is warranted for the conclusions of this work. Admittedly, the apparent lack of need in ring stags might give an opening to attack MyoF using diCre (by excision before its major expression peak), but depending on lethality this might preclude extended analyses (possibly vesicle assays, for sure not RSAs).
In the end the question is, if our approach provides the function of target analysed in this work and based on the data in our manuscript and the arguments in the rebuttal, we are reasonably confident that this is the case. It is not very likely the other mentioned techniques would result in a different conclusion on the function of the here studied proteins. In fact, we expect other commonly used techniques to be less suitable for the key assays in this work.
References used in our responses to the reviewers’ comments:
Behrens, H.M., Schmidt, S., Peigney, D., Sabitzki, R., Henshall, I., May, J., et al. (2023) Impact of different mutations on Kelch13 protein levels, ART resistance and fitness cost in Plasmodium falciparum parasites. bioRxiv 2022.05.13.491767.
Behrens, H.M., Schmidt, S., and Spielmann, T. (2021) The newly discovered role of endocytosis in artemisinin resistance. Med Res Rev med.21848.
Behrens, H.M., and Spielmann, T. (2023) Identification of domains in Plasmodium falciparum proteins of unknown function using DALI search on Alphafold predictions. bioRxiv 2023.06.05.543710.
Birnbaum, J., Flemming, S., Reichard, N., Soares, A.B., Mesén-Ramírez, P., Jonscher, E., et al. (2017) A genetic system to study Plasmodium falciparum protein function. Nat Methods 14: 450–456.
Birnbaum, J., Scharf, S., Schmidt, S., Jonscher, E., Hoeijmakers, W.A.M., Flemming, S., et al. (2020) A Kelch13-defined endocytosis pathway mediates artemisinin resistance in malaria parasites. Science (80- ) 367: 51–59.
Bisio, H., Chaabene, R. Ben, Sabitzki, R., Maco, B., Baptiste Marq, J., Gilberger, T.W., et al. (2020) The zip code of vesicle trafficking in apicomplexa: Sec1/munc18 and snare proteins. MBio 11: 1–21.
Blum, M., Chang, H.Y., Chuguransky, S., Grego, T., Kandasaamy, S., Mitchell, A., et al. (2021) The InterPro protein families and domains database: 20 years on. Nucleic Acids Res 49: D344–D354.
Borrmann, S., Straimer, J., Mwai, L., Abdi, A., Rippert, A., Okombo, J., et al. (2013) Genome-wide screen identifies new candidate genes associated with artemisinin susceptibility in Plasmodium falciparum in Kenya. Sci Rep 3.
Bozdech, Z., Llinás, M., Pulliam, B.L., Wong, E.D., Zhu, J., and DeRisi, J.L. (2003) The transcriptome of the intraerythrocytic developmental cycle of Plasmodium falciparum. PLoS Biol 1: e5.
Burnette, W.N. (1981) “Western Blotting”: Electrophoretic transfer of proteins from sodium dodecyl sulfate-polyacrylamide gels to unmodified nitrocellulose and radiographic detection with antibody and radioiodinated protein A. Anal Biochem 112: 195–203.
Casella, J.F., Flanagan, M.D., and Lin, S. (1981) Cytochalasin D inhibits actin polymerization and induces depolymerization of actin filaments formed during platelet shape change. Nature 293: 302–305.
Cerqueira, G.C., Cheeseman, I.H., Schaffner, S.F., Nair, S., McDew-White, M., Phyo, A.P., et al. (2017) Longitudinal genomic surveillance of Plasmodium falciparum malaria parasites reveals complex genomic architecture of emerging artemisinin resistance. Genome Biol 18: 78.
Chen, Z., and Schmid, S.L. (2020) Evolving models for assembling and shaping clathrin-coated pits. J Cell Biol 219.
Dell’Angelica, E.C., Puertollano, R., Mullins, C., Aguilar, R.C., Vargas, J.D., Hartnell, L.M., and Bonifacino, J.S. (2000) GGAs: A family of ADP ribosylation factor-binding proteins related to adaptors and associated with the Golgi complex. J Cell Biol 149: 81–93.
Demas, A.R., Sharma, A.I., Wong, W., Early, A.M., Redmond, S., Bopp, S., et al. (2018) Mutations in Plasmodium falciparum actin-binding protein coronin confer reduced artemisinin susceptibility. Proc Natl Acad Sci 201812317.
Henrici, R.C., Edwards, R.L., Zoltner, M., Schalkwyk, D.A. van, Hart, M.N., Mohring, F., et al. (2020a) The plasmodium falciparum artemisinin susceptibility-associated ap-2 adaptin μ subunit is clathrin independent and essential for schizont maturation. MBio 11.
Henrici, R.C., Schalkwyk, D.A. van, and Sutherland, C.J. (2020b) Modification of pfap2μ and pfubp1 Markedly Reduces Ring-Stage Susceptibility of Plasmodium falciparum to Artemisinin in Vitro. Antimicrob Agents Chemother 64.
Henriques, G., Hallett, R.L., Beshir, K.B., Gadalla, N.B., Johnson, R.E., Burrow, R., et al. (2014) Directional selection at the pfmdr1, pfcrt, pfubp1, and pfap2mu loci of Plasmodium falciparum in Kenyan children treated with ACT. J Infect Dis 210: 2001–2008.
Heredero-Bermejo, I., Varberg, J.M., Charvat, R., Jacobs, K., Garbuz, T., Sullivan, W.J., and Arrizabalaga, G. (2019) TgDrpC, an atypical dynamin-related protein in Toxoplasma gondii, is associated with vesicular transport factors and parasite division. Mol Microbiol 111: 46–64.
Hirst, J., Lui, W.W.Y., Bright, N.A., Totty, N., Seaman, M.N.J., and Robinson, M.S. (2000) A family of proteins with γ-adaptin and VHS domains that facilitate trafficking between the trans-golgi network and the vacuole/lysosome. J Cell Biol 149: 67–79.
Hirst, J., and Robinson, M.S. (1998) Clathrin and adaptors. Biochim Biophys Acta - Mol Cell Res 1404: 173–193.
Hoeijmakers, W.A.M., Miao, J., Schmidt, S., Toenhake, C.G., Shrestha, S., Venhuizen, J., et al. (2019) Epigenetic reader complexes of the human malaria parasite, Plasmodium falciparum. Nucleic Acids Res 47: 11574–11588.
Jonscher, E., Flemming, S., Schmitt, M., Sabitzki, R., Reichard, N., Birnbaum, J., et al. (2019) PfVPS45 Is Required for Host Cell Cytosol Uptake by Malaria Blood Stage Parasites. Cell Host Microbe 25: 166-173.e5.
Kimmel, J., Schmitt, M., Sinner, A., Jansen, P.W.T.C., Mainye, S., Ramón-Zamorano, G., et al. (2023) Gene-by-gene screen of the unknown proteins encoded on Plasmodium falciparum chromosome 3. Cell Syst 14: 9-23.e7.
Koreny, L., Mercado-Saavedra, B.N., Klinger, C.M., Barylyuk, K., Butterworth, S., Hirst, J., et al. (2023) Stable endocytic structures navigate the complex pellicle of apicomplexan parasites. Nat Commun 14: 2167.
Kumari, V., Singh, A.P., Singh, J., Sharma, R., Akhter, M., Mishra, P.K., et al. (2018) Biochemical characterization of unusual cysteine protease of P. falciparum, metacaspase-2 (MCA-2). Mol Biochem Parasitol 220: 28–41.
Lazarus, M.D., Schneider, T.G., and Taraschi, T.F. (2008) A new model for hemoglobin ingestion and transport by the human malaria parasite Plasmodium falciparum. J Cell Sci 121: 1937–1949.
Lopez-Hernandez, F.J., Ortiz, M.A., Bayon, Y., and Piedrafita, F.J. (2003) Z-FA-fmk inhibits effector caspases but not initiator caspases 8 and 10, and demonstrates that novel anticancer retinoid-related molecules induce apoptosis via the intrinsic pathway. Mol Cancer Ther 2: 255–263.
Lord, S.J., Velle, K.B., Mullins, R.D., and Fritz-Laylin, L.K. (2020) SuperPlots: Communicating reproducibility and variability in cell biology. J Cell Biol 219.
MalariaGEN, Ahouidi, A., Ali, M., Almagro-Garcia, J., Amambua-Ngwa, A., Amaratunga, C., et al. (2021) An open dataset of Plasmodium falciparum genome variation in 7,000 worldwide samples. Wellcome open Res 6: 42.
Marti, M., Good, R.T., Rug, M., Knuepfer, E., and Cowman, A.F. (2004) Targeting malaria virulence and remodeling proteins to the host erythrocyte. Science 306: 1930–3.
Mesén-Ramírez, P., Bergmann, B., Elhabiri, M., Zhu, L., Thien, H. von, Castro-Peña, C., et al. (2021) The parasitophorous vacuole nutrient pore is critical for drug access in malaria parasites and modulates the fitness cost of artemisinin resistance. Cell Host Microbe 0: 283.
Mesén-Ramírez, P., Bergmann, B., Tran, T.T., Garten, M., Stäcker, J., Naranjo-Prado, I., et al. (2019) EXP1 is critical for nutrient uptake across the parasitophorous vacuole membrane of malaria parasites. PLoS Biol 17: e3000473.
Mukherjee, A., Crochetière, M.-È., Sergerie, A., Amiar, S., Thompson, L.A., Ebrahimzadeh, Z., et al. (2022) A Phosphoinositide-Binding Protein Acts in the Trafficking Pathway of Hemoglobin in the Malaria Parasite Plasmodium falciparum. MBio 13.
Otto, T.D., Wilinski, D., Assefa, S., Keane, T.M., Sarry, L.R., Böhme, U., et al. (2010) New insights into the blood-stage transcriptome of Plasmodium falciparum using RNA-Seq. Mol Microbiol 76: 12–24.
Robinson, M.S., Sahlender, D.A., and Foster, S.D. (2010) Rapid Inactivation of Proteins by Rapamycin-Induced Rerouting to Mitochondria. Dev Cell 18: 324–331.
Sabitzki, R., Schmitt, M., Flemming, S., Jonscher, E., Hoehn, K., Froehlke, U., and Spielmann, T. (2023) Identification of a Rabenosyn-5 like protein and Rab5b in host cell cytosol uptake reveals conservation of endosomal transport in malaria parasites. bioRxiv 2023.04.05.535711.
Simwela, N. V., Hughes, K.R., Roberts, A.B., Rennie, M.T., Barrett, M.P., and Waters, A.P. (2020) Experimentally engineered mutations in a ubiquitin hydrolase, UBP-1, modulate in vivo susceptibility to artemisinin and chloroquine in plasmodium berghei. Antimicrob Agents Chemother 64.
Spielmann, T., Gras, S., Sabitzki, R., and Meissner, M. (2020) Endocytosis in Plasmodium and Toxoplasma Parasites. Trends Parasitol 36: 520–532.
Subudhi, A.K., O’Donnell, A.J., Ramaprasad, A., Abkallo, H.M., Kaushik, A., Ansari, H.R., et al. (2020) Malaria parasites regulate intra-erythrocytic development duration via serpentine receptor 10 to coordinate with host rhythms. Nat Commun 11.
Traub, L.M., Downs, M.A., Westrich, J.L., and Fremont, D.H. (1999) Crystal structure of the α appendage of AP-2 reveals a recruitment platform for clathrin-coat assembly. Proc Natl Acad Sci U S A 96: 8907–8912.
Wagner, M.P., Formaglio, P., Gorgette, O., Dziekan, J.M., Huon, C., Berneburg, I., et al. (2022) Human peroxiredoxin 6 is essential for malaria parasites and provides a host-based drug target. Cell Rep 39: 110923.
Wall, R.J., Zeeshan, M., Katris, N.J., Limenitakis, R., Rea, E., Stock, J., et al. (2019) Systematic analysis of Plasmodium myosins reveals differential expression, localisation, and function in invasive and proliferative parasite stages. Cell Microbiol 21.
Wan, W., Dong, H., Lai, D.-H., Yang, J., He, K., Tang, X., et al. (2023) The Toxoplasma micropore mediates endocytosis for selective nutrient salvage from host cell compartments. Nat Commun 14: 977.
Wichers-Misterek, J.S., Binder, A.M., Mesén-Ramírez, P., Dorner, L.P., Safavi, S., Fuchs, G., et al. (2023) A Microtubule-Associated Protein Is Essential for Malaria Parasite Transmission. MBio .
Wichers, J.S., Gelder, C. van, Fuchs, G., Ruge, J.M., Pietsch, E., Ferreira, J.L., et al. (2021a) Characterization of Apicomplexan Amino Acid Transporters (ApiATs) in the Malaria Parasite Plasmodium falciparum. mSphere 6.
Wichers, J.S., Mesén-Ramírez, P., Fuchs, G., Yu-Strzelczyk, J., Stäcker, J., Thien, H. von, et al. (2022) PMRT1, a Plasmodium -Specific Parasite Plasma Membrane Transporter, Is Essential for Asexual and Sexual Blood Stage Development. MBio 13.
Wichers, J.S., Scholz, J.A.M., Strauss, J., Witt, S., Lill, A., Ehnold, L.-I., et al. (2019) Dissecting the Gene Expression, Localization, Membrane Topology, and Function of the Plasmodium falciparum STEVOR Protein Family. MBio 10: e01500-19.
Wichers, J.S., Tonkin-Hill, G., Thye, T., Krumkamp, R., Kreuels, B., Strauss, J., et al. (2021b) Common virulence gene expression in adult first-time infected malaria patients and severe cases. Elife 10.
Wichers, J.S., Wunderlich, J., Heincke, D., Pazicky, S., Strauss, J., Schmitt, M., et al. (2021c) Identification of novel inner membrane complex and apical annuli proteins of the malaria parasite Plasmodium falciparum. Cell Microbiol 23: e13341.
We won’t get too much into python control structures yet, but it is good to mention them early to give you a taste for what you can do with the language! If these make sense to you now, that’s great! However, we don’t expect you to understand these yet - understanding will come later.
Se pueden poner comentarios publicos o privados.
Tienen que crear una cuenta en Hypothesis.
En la proxima leccion vemos como.
call truncation towards zero
O Python não arredonda números, ele apenas ignora o que está à direita do ponto flutuante.
Blank lines are also ignored by the interpreter, but comments and blank lines can make your programs much easier for humans to parse. Use them liberally!
Outra dica muito importante. Colocar linhas vazias, que são ignoradas pelo interpretador, e comentários ajudam qualquer pessoa a analisar o código. "Use os indiscriminadamente".
inicio insidioso.
Una enfermedad insidiosa o gradual se refiere a cualquier enfermedad que comienza lentamente, y que no tiene síntomas obvios al principio. La persona no está consciente de que la enfermedad se está presentando.
ou como onda. Esta proposta foi o resultado da Tese de Doutorado de de Broglie, mas ele
Muito legal
ations have different terminologies - SDE 1, SDE 2, Staff Engineer, Team Lead, Director, VP and so o
foobar
nents plot
se sopra i mutati erano arancioni dovrebbero esserlo anche qua, o viceversa :) Inoltre dovremmo mantenere l'ordine di raw e normalized, metterei sempre prima raw
Lord Acton
The demonstration principle, providing examples of the content being taught, is fundamental for effective instruction and engaging instruction.
Before taking this assertion and then structuring ALL learning with this model, I'd want to explore who and why some people learn w/o examples or demonstration...
Author Response
Reviewer #1 (Public Review):
This study uses electrophysiological techniques in vitro to address the role of the Na+ leak channel NALCN in various physiological functions in cartwheel interneurons of the dorsal cochlear nucleus. Comparing wild type and glycinergic neuron-specific knockout mice for NALCN, the authors show that these channels 1) are required for spontaneous firing, 2) are modulated by noradrenaline (NA, via alpha2 receptors) and GABA (through GABAB receptors), 3) how the modulation by NA enhances IPSCs in these neurons.
This work builds on previous results from the Trussell's lab in terms of the physiology of cartwheel cells, and from other labs in terms of the role of NALCN channels, that have been characterized in more and more brain areas somewhat recently; for this reason, this study could be of interest for researchers that work in other preparations as well. The general conclusions are strongly supported by results that are clearly and elegantly presented.
I have a few comments that, in my opinion, might help clarify some aspects of the manuscript.
1) It is mentioned throughout the manuscript, including the abstract, that the results suggest a closed apposition of NALCN channels and alpha2 and GABAB receptors. From what I understand, this conclusion comes from the fact that GABAB receptors activate GIRK channels through a membrane-delimited mechanism. Is it possible that these receptors converge on other effectors, for example adenylate cyclase (see https://www.ncbi.nlm.nih.gov/pmc/articles/PMC6374141/).
It will be of interest to test the roles of adenylyl cyclase modulation in the control of NALCN, as a complement to the studies we have presented here.
2) In Figure 2G, the neurons from NALCN KO mice appear to reach a significantly higher frequency than those from WT (figure 2E, 110 vs. 70 spikes/s). Was this higher frequency a feature of all experiments? The results mention a rundown of peak firing rate due to whole-cell dialysis, but, from what I understand, the control conditions should be similar for all experiments.
The peak firing rates in control solutions for WT and KO CWC are not statistically different.
3) Also in Figure 2, the firing patterns for neurons from WT and NALCN KO mice appear to be quite different, with spikes appearing to be generated during the hyperpolarization of the bursts in the second half of the current step for WT neurons but always during the depolarization in KO neurons. Was this always the case? If so, could NALCN channels be involved in this type of firing? Along these lines, it would be interesting to show an example of a firing pattern of neurons from WT mice in the presence of NA, which inhibits NALCN channels.
The specific pattern of spikes in CWC is quite variable from trial-to-trial or cell-to-cell, as it is dependent on multiple CaV and calcium dependent K channels subtypes, and is not dependent on the genotypes used here. The primary effects observed in the KO are in background firing and sensitivity to NA, both reflected alterations in rheobase. The firing pattern example requested was shown in the raster plot of fig 2B2.
4) It might be interesting to discuss how the hyperpolarization induced by the activation of GIRK channels and inhibition of NALCN channels could have different consequences due to their opposite effect on the input resistance.
We considered this as a point of discussion, but decided that making sense of it would depend on assumptions about the location of the channels (dendritic vs somatic, distance to AIS) that we do not have data for. For example, a dendritic increase in resistance through NALCN block, leading to a hyperpolarization of the soma, might have actions similar to a somatic hyperpolarizing conductance increase by GIRK, as far as the voltage at the AIS is concerned.
Reviewer #3 (Public Review):
The study by Ngodup and colleagues describes the contribution of sodium leak NALCN conductance on the effects of noradrenaline on cartwheel interneurons of the DCN. The manuscript is very well-written and the experiments are well-controlled. The scope of the study is of high biological relevance and recapitulates a primary finding of the Khaliq lab (Philippart et al., eLife, 2018) in ventral midbrain dopamine neurons, that Gi/o-coupled receptors inhibit NALCN current to reduce neuronal excitability. Together these studies provide unequivocable evidence for NALCN as a downstream target of these receptors. There are no major concerns. I have only minor suggestions:
Minor
1) As introduced in the introduction, NALCN is inhibited by extracellular calcium which has led to some discourse of the relevance of NALCN when recorded in 0.1 mM calcium. A strength of this study is the effect of NA on NALCN is recorded in physiological levels of calcium (1.2 mM). I suggest including the concentration of extracellular calcium in the aCSF in the Results section instead of relying on the reader to look to the Methods.
Will do.
2) It would be interesting to include the basal membrane properties of the KO compared to wildtype, including membrane resistance and resting membrane potential. From the example recording in Figure 2, one might think that the KOs have lower membrane resistance, so it is interesting that the 2 mV hyperpolarization produced similar effects on rheobase. In addition, from the example in Figure 2G, it appears that NA has an effect on firing frequency with large current injection in the KO. Is this true in grouped data and if so, is there any speculation into how this occurs?
Will do.
3) Please expand on the rationale for why GABAB and alpha2 must be physically close to NALCN. To my knowledge, the mechanism by which these receptors inhibit NALCN is not known. Must it be membrane-delimited?
Given the known membrane delimited modulation of GIRK by GABAB, and that alpha2 and GABAB receptors appear to share the same population of NALCN channels, and that alpha2 receptors do not appear to target GIRK channels, we felt the simplest explanation would be coupling through G-proteins, with spatial segregation of different receptor/channel pools providing the means for separating GIRK and NALCN effects. However, the involvement of an additional second messenger is testable.
Reviewer #3 (Public Review):
The study by Ngodup and colleagues describes the contribution of sodium leak NALCN conductance on the effects of noradrenaline on cartwheel interneurons of the DCN. The manuscript is very well-written and the experiments are well-controlled. The scope of the study is of high biological relevance and recapitulates a primary finding of the Khaliq lab (Philippart et al., eLife, 2018) in ventral midbrain dopamine neurons, that Gi/o-coupled receptors inhibit NALCN current to reduce neuronal excitability. Together these studies provide unequivocable evidence for NALCN as a downstream target of these receptors. There are no major concerns. I have only minor suggestions:
Minor<br /> 1. As introduced in the introduction, NALCN is inhibited by extracellular calcium which has led to some discourse of the relevance of NALCN when recorded in 0.1 mM calcium. A strength of this study is the effect of NA on NALCN is recorded in physiological levels of calcium (1.2 mM). I suggest including the concentration of extracellular calcium in the aCSF in the Results section instead of relying on the reader to look to the Methods.
2. It would be interesting to include the basal membrane properties of the KO compared to wildtype, including membrane resistance and resting membrane potential. From the example recording in Figure 2, one might think that the KOs have lower membrane resistance, so it is interesting that the 2 mV hyperpolarization produced similar effects on rheobase. In addition, from the example in Figure 2G, it appears that NA has an effect on firing frequency with large current injection in the KO. Is this true in grouped data and if so, is there any speculation into how this occurs?
3. Please expand on the rationale for why GABAB and alpha2 must be physically close to NALCN. To my knowledge, the mechanism by which these receptors inhibit NALCN is not known. Must it be membrane-delimited?
la teoría germinal o microbian
es una teoría cientifíca que los mciroorganismos son causantes de una amaplia gama de enfermedes
O logo do Inspira está cortado?
RRID:AB_2620524
DOI: 10.1016/j.xcrm.2023.101110
Resource: (Bethyl Cat# A304-328A, RRID:AB_2620524)
Curator: @olekpark
SciCrunch record: RRID:AB_2620524
RRID:AB_2072083
DOI: 10.1016/j.immuni.2023.06.020
Resource: (R and D Systems Cat# AF457, RRID:AB_2072083)
Curator: @scibot
SciCrunch record: RRID:AB_2072083
provide computer-users with free quality office software and applications without any digital restrictions attached.
SSuite Office is the foremost provider of Free quality office software on the internet today...
selection
first occurence : selection
This process is simple selection: i t proceeds by examining in turn every one of a large set of irems and by picking out those which have certain specified characterist~cs.Therc 1s another form of sclcction bcsr dlusrratrd by thc aururnaric relephone exchange. You dial a number and the machine selects and connects just one of a million poss~blesta'tions. I t does not run over them all. Ir pays attention only to a class givcn by a first digit, then only to a suhclars of this given by the second d i g ~ t ,and so on; and thus proceeds rapidly and almost ~lncrringlyto the selected station. I t requires a few seconds t o make the selection, although the process could hc speeded up if in- creased speed were economically warranred
shell mode
O shell mode é uma forma onde o interpretador fornece rapidamente o resultado das expressões digitadas. Essa é uma forma de avaliar a qualidade e funcionalidade do código na medida em que se digita. É como um rascunho de teste. O shell mode pode ser feito com facilidade no colab sem a necesidade de ">>>".
Two kinds of programs process high-level languages into low-level languages: interpreters and compilers.
O interpretador transforma o código de alto nível em código de baixo nível linha por linha na medida em que vai executando. Já o compilador primeiro lê todo o código de alto nível, para em seguida criar um código objeto (baixo nível) que será executado pela máquina.
Forget the Cloud... Go Direct!
Carl Sagan talked about the need for an “exhaustive program of unmanned biological exploration of Mars”. We can actually achieve 100% sterilization by heating landers to 300 C which would completely destroy amino acids and DNA bases. Silicon on insulator chips can be run indefinitely at 300 C and there are many modern components we can use including some in development for your Venus HOTTECH program that can even withstand 500 C for months on en
"º" degrees
However we have the technology to achieve 100% sterile landers due to remarkable advances in high temperature electronics, with silicon on insulator chips at 0.35 microns resolution able to run indefinitely at 300 C, video cameras that work in ovens, and many otehr capabilities including the Venus HOTTECH, with plans already available for a lander that could survive several months at 500 C on Venus.
"º" missing :P
DISK channel (used to perform disk I/O) or an SBT channel (used to perform I/O through a third-party media management software).
en fait, il n'existe que 2 type de 'channel' (des destination pour les fichiers de backup) : 1. disque 2. ruban magnétique
Note: This rebuttal was posted by the corresponding author to Review Commons. Content has not been altered except for formatting.
Learn more at Review Commons
We would like to thank reviewers for their insightful comments.
Overall, there were two major concerns/suggestions:
Applicability to humans of the increase of BTC in non-alcoholic steatohepatitis (NASH) and mechanisms of downregulation of BTC by omega-3. We now analyzed __3 __additional human gene expression datasets and show that BTC not only is increased in human NASH (as we have already shown for liver cancer meta-analysis), but is also decreased in livers of patients who received omega-3.
One of the reviewers suggested investigating a potential mechanism of how BTC is regulated by omega3 fatty acids. Although a complete answer to this question would require entirely new studies to be done, we still performed additional investigation that was possible within a reasonable timeframe. We found that transcription factor FOXO3 (well-known inhibitor of carcinogenesis) is a highly probable mediator of the DHA inhibitory effect on BTC.
See all details of items 1 and 2 as well as answers to other (less critical concerns) below after each specific question.
Reviewer #1 (Evidence, reproducibility and clarity (Required)):
This work by Padiadpu and colleagues investigate the mechanism by which pufa of the n-3 series (mostly DHA) may influence NAFLD progression using systems biology analysis and multiple omics analysis. The work is interesting and may provide a novel view of the topic. However, there are a number of issues the authors may wish to consider in order to improve their manuscript.
Major issues: Clarity: Since the authors refer to previously published experiments, they must refer to this work in the figure legends and improve the clarity of such legends. Here are a list of issues that must be fixed:
Fig.1: First panel is not clear. What does the table tell the reader? What are the effects of the different diets on NAFLD?
All the transcriptomic data are newly generated from the samples of previously published studies. The table shows the number of features changed by DHA and/or EPA in each of the -omics and phenotypic data used in the analysis.
I understand that the results are published elsewhere, but the authors must provide information regarding the NAFLD/ NASH scores.
We now added a supplementary table 1a showing the scores.
Fig.4: Why is there sometimes a DHA diet, sometimes DHA and EPA. Legend is not clear. What does WD + Mean? I guess it is olive oil... But the legend must be improved.
We added details in the legend for more clarity. Specifically, WD+O means WD + olive oil added as a control for WD+DHA, WD+EPA. As described in the 2nd paragraph of results, when both EPA and DHA had a similar and significant effects in reversing WD effect, it was defined as “EPA&DHA category” of parameters. When only WD+DHA or WD+EPA were significantly changed vs WD+O, those were assigned as “DHA category” or “EPA category”, respectively.
One issue the authors may consider trying to fix is the specificity of the effect of DHA on BTC.
Is it really specific? It seems to me that EPA has more or less the same effect. If the effect is DHA-specific, than make this clearer through the text.
Although BTC expression was reduced by both DHA and EPA comparing to WD, DHA had a statistically significant stronger effect than EPA (Fig. 3D).
Another issue the authors may wish to investigate is the relationship between W3 consumption and BTC expression in studies performed by other labs (if available on Gene expression omnibus?).
Thanks for the suggestion. We used publicly available data of human and mouse studies that showed significant increase in liver BTC gene expression in NASH in multiple datasets while a human trial with Omega 3 treatment for one year showed its significant reduction (Figures 3F - human data, S3G-mouse data).
Finally, a key issue would be to identify the mechanism by which DHA inhibits BTC expression? How does this happen? could such inhibition be induced by other fatty acids of the W3 series? I understand that this is not easy to address but it would significantly strengthen the manuscript.
Thanks to your question we investigated and found at least one of potential mechanisms contributing to how “DHA inhibits BTC expression”. See details in the answer to next question. As for “other fatty acids” while we agree this is important question, it is outside of the scope of the current study but will be investigated in future studies.
Moreover, it might be possible to identify the set of genes highly co-regulated with BTC expression and to investigate the possible transcription factors at play in the control of such gene set.
We really appreciate this question as our efforts in this direction provided one potential mechanism. A direct screen of transcription factor (TF) motifs in genes co-regulated with BTC did not provide any clear results. Therefore, we implemented a combination of network analysis and screen for motifs in BTC gene with the in vivo and in vitro treatment results and found FOXO3 as a candidate TF regulated by DHA upstream of BTC.
See details of the analysis and results in a new Supplementary Figure S6 and corresponding text located at the end of the results.
Minor: the authors use the term "beneficial" transcriptome alterations by DHA.
I do not think it is correct to use "beneficial".
We agree and removed the word "beneficial”.
Reviewer #1 (Significance (Required)):
Strength: This paper uses new approaches to investigate the relationship between W3 consumption and liver gene expression and its relevance to chronic metabolic liver diseases.
The experiments and data set used to perform systems biology are from an excellent lab (the authors lab) who has published a lot of important and reproducible discoveries in the field of regulation of gene expression by dietary fatty acids.
The work has high translational relevance in medicine / hepatology / metabolism.
I am not a qualified reviewer to assess the systems biology that has been done.
Limitation: The mechanistic link between DHA consumption and BTC expression is not very clear. The specificity of this effect could also be tested (DHA vs other W3 and/or W6).
Although BTC expression was reduced by both DHA and EPA comparing to WD, DHA had a significantly stronger effect than EPA (Fig. 3D). Other omega fatty acids were not tested but it can be done in future studies.
Reviewer #2 (Evidence, reproducibility and clarity (Required)):
The authors files a manuscript describing the impact of the suppression of betacellulin as a key mechanism to counteract fibrosis and inflammation in NASH by modulating fatty acids in WD-fed mice.
Major Comments: (i) No histological analysis was presented and indeed this is of clinical relevance for NASH since diagnosis is still based on biopsy.
While histological evaluation was presented in the originally published papers (PMID: 28422962, 23303872), it is now provided in Supplementary Table S1a.
(ii) Human comparative analysis: is done with HCC not with NASH patients.
This cancer-related dataset is most likely obtained from different etiologies.
I would suggest comparing these mouse datasets with GSE48452 (human NAFLD-NASH spectra).
Thanks for this important question. We now analyzed available human data of NASH and show significant increase of BTC expression in two datasets while a human trial with omega-3 treatment for one year showed its significant reduction of BTC expression (Figure 3F) resembling our observations in mice.
(iii) to compare the inflammation and fibrosis (also lipid metabolism), one can compare these mouse datasets with GSE222576 and cite this preprint (https://doi.org/10.21203/rs.3.rs-2009380/v1)
Using the suggested dataset (of a chemically induced liver fibrosis), we first observed that Btc gene expression was significantly increased over 10 weeks of the model and now included this result in Fig. S3G.
We also queried the 66 genes from the network modules described by the authors to check their changes in our NASH model. We observed that 28 genes were differentially expressed in NASH with 14 of them belonging to the module that authors named as “Pathways in Cancer”. Other genes were from the lipid metabolism (4 genes), immunity (2) and inflammation (2 genes). In addition, we observed that several genes we found regulated by omega-3 and changed in this fibrosis model contained other inflammatory genes such as classical macrophage genes (Mmp12, Lgals3, Cd68, Trem2), fibrosis (Col4a1, Col27a1, Itga2b, Itga8) and lipid metabolism (Scd2, Lpl, Soat1). Of note, the preprint has been published and we now cite the corresponding article.
Minor comments:
(i) The heatmap in Figure 1B and another heatmap should show all mice not the average to see the variability
The supplementary figure with all the individual mouse data as another heatmap is added to show the variability and similarity (Figure S1D).
Reviewer #2 (Significance (Required)): The authors files a manuscript describing the impact of the suppression of betacellulin as a key mechanism to counteract fibrosis and inflammation in NASH by modulating fatty acids.
This is well designed experiment, and the results are of interest to hepatologists and should be indeed published after consideration of the following points
Strength is multiOMICs approach.
Weakness is human applicability.
We improved human applicability by investigating 3 additional human datasets of NASH (Fig. 3F) and finding consistent changes in BTC expression closely resembling our observations in mouse NASH model, including one trial with omega-3 treatment of patients for one year showing significant reduction in BTC gene expression.
Mọi thứ thay đổi vào cuối năm 1588 khi Giáo hoàng Sixtus V tuyên bố phá thai ở bất kỳ giai đoạn nào của thai kỳ đều là tội giết người, và hình phạt vạ tuyệt thông sẽ được áp dụng, trong khi sự tha thứ chỉ có thể được chấp nhận nếu người bị phạt phải đến Rome cầu xin sự tha thứ [12]. Lập trường cứng rắn này kéo dài được 3 năm khi Giáo hoàng Gregory XIV đảo ngược quyết định, tuyên bố phá thai sẽ là giết người chỉ sau khi người phụ nữ mang thai đến tam cá nguyệt thứ hai.
1 u-turn, nhưng mà không được lâu
Vào thế kỷ XIII, Thánh Thomas Aquinas với việc áp dụng rộng rãi tư tưởng của Aristotle đã tuyên bố một bào thai sẽ có sự chuyển tiếp giữa linh hồn dinh dưỡng, tri giác và cuối cùng là lý trí khi cơ thể được phát triển. Ông cũng đồng thời bác bỏ quan điểm cho rằng phá thai là sai lầm nghiêm trọng ở mọi giai đoạn, và đề xuất về cách để phân chia giai đoạn
thế kỉ 13 để xuất phân đoạn thời gian cho quá trình phát triển phôi thai
Vào thế kỷ thứ V, giám mục- nhà thần học vĩ đại Thánh Augustine cảnh báo không nên lạm dụng niềm tin về việc linh hồn không tồn tại đến khi mang thai được vài tuần, và cho rằng kiến thức con người về sinh học vẫn còn rất hạn chế. Vì thế, ông một lần nữa khẳng định phá thai ở mọi giai đoạn đều là trọng tội, và sẽ xử phạt nặng nếu đó là hành vi dùng để che giấu sự tà dâm hay ngoại tình.
thế kỉ 5 vẫn vậy
Vào thế kỷ thứ V, giám mục- nhà thần học vĩ đại Thánh Augustine cảnh báo không nên lạm dụng niềm tin về việc linh hồn không tồn tại đến khi mang thai được vài tuần, và cho rằng kiến thức con người về sinh học vẫn còn rất hạn chế. Vì thế, ông một lần nữa khẳng định phá thai ở mọi giai đoạn đều là trọng tội, và sẽ xử phạt nặng nếu đó là hành vi dùng để che giấu sự tà dâm hay ngoại tình.
vẫn thế, không có gì khác biệt
S - A class should have a single responsibility
O - Classes should be open for extension, but closed for modification
L - Objects of a superclass should be replaceable with objects of its subclass without affecting the correctness of the program
I - Clients should not be forced to depend on methods that they do not use.
D - High-level modules should not depend on low-level modules. Both should depend on the abstraction. Abstractions should not depend on details. Details should depend on abstractions.
Así, para muestras de leche o fórmulas infantiles, el boro se eluyó con ácido clorhídrico 2 M y fue posible pasar a través de la columna un flujo de 40 mL de muestra y concentrar en una fracción de 4 mL, lo que permite obtener un factor de preconcentración de 10 vece
Factor de preconcentración
Çoğu IP araması, tek noktaya yayın yönlendirme şemasını kullanır. DNS, bir URL'yi sizi belirli bir sunucuya götüren bir IP adresine çözümler. Ancak Deno Deploy ve Cloudflare , bir IP adresinin bir bilgisayar havuzuyla eşlendiği herhangi bir yayını kullanır. Ağ (en azından bir WAN'da, yani internette) daha sonra adresi en yakın bilgisayara çözer. Genel olarak, bir istemci bir uç çalışandan bir uç işlevi aracılığıyla veya konuşlandırılmış bir kod paketinde bir şey istediğinde, ince bir ters proxy sunucusuna ulaşır. Bu proxy onu istemciye yakın bir sunucuya yönlendirir (bu durumda yakın, o konum için en hızlı anlamına gelir) ve istenen işlevi yürütür. Kodun gerçekten yürütüldüğü sunucu, kaynak olarak bilinir. Orada tipik sunucu tarafı işlevleri sağlayabilir: veritabanlarından veri çekin, dinamik bilgileri doldurun ve istemciyi ağır JavaScript yükleriyle yormaktan kaçınmak için bölümleri statik HTML olarak işleyin. Ubl, "Yerel makinenizde çalışan şeyi çevirin ve altyapıya yerleştirdiğimizde tam olarak aynı şekilde davranacak şekilde sarın" dedi. "Bu, uç fonksiyonları ürünümüzü daha soyut bir kavram haline getiriyor çünkü onları doğrudan kullanmıyorsunuz.
RRID:SCR_002105
DOI: 10.1158/1078-0432.CCR-23-0311
Resource: Samtools (RRID:SCR_002105)
Curator: @scibot
SciCrunch record: RRID:SCR_002105
A hash map can add and remove elements in O(1)O(1)O(1), as well as update values associated with a key and check if a key exists, also in O(1)O(1)O(1).
On average case is O(1), but in the worst case is O(n)
Author Response
Reviewer #1 (Public Review):
This paper investigates whether bistable rhodopsins can be used to manipulate GPCR signalling in zebrafish. As a first step, the authors compared the performance of bistable rhodopsins fused with a flag tag or with a fluorescent protein tag (TagCFP). Constructs were compared by expressing in HEK cells followed by calcium imaging with aequorin or cAMP monitoring with GloSensor. This showed that the protein with a smaller flag tag performed better. Then, a series of transgenic zebrafish lines were made, in which tagged rhodopsins were expressed in reticulospinal neurons or cardiomyocytes.
The data indicate that bistable rhodopsin can be used to manipulate Gq and Gi/o signalling in zebrafish. The Gq-coupled SpiRh1 was effective in manipulating reticulospinal neurons, as indicated by analysis of tail movements and calcium imaging of the neurons. Gi/o signalling could be manipulated by Opn3 from mosquitoes, TMT from pufferfish, and parapinopsin from lamprey, as shown by their effects on the heartbeat. Lamprey parapinopsin has the interesting property that it can be turned on and off by different wavelengths of light, and this was used to stop and restart the heart. Finally, the authors show that the cardiac effects are mediated by an inward-rectifier K+ channel, through the use of pharmacological inhibitors.
A strength of this paper is the testing of a range of bistable rhodopsins, with a total of 10 proteins tested. This provides a good resource for future experiments. A weakness is the failure to show that some experiments involved repeated sampling of the same animal. Figure 3 gives the impression that there are 48 independent datapoints. However, there are 8 animals, with 6 datapoints coming from each. Similarly, Figure 4 shows the data from 6 trials of 4 animals, not 24 independent animals. Repeated sampling should be reflected in the data presentation, and in the statistical analysis. Was there an effect of trial number, which is suggested in Figure 6?
In response to the reviewer’s comments, we modified the graph to show the average data for individual animals in Figure 3A-E, Figure 3-supplement 2, Figure 4D-F, H, and Figure 4-supplement 2B. We also showed the effect of trial number (difference between trials 1 and 6) in Figure 3-supplement 1 and Figure 4-supplement 1. In addition, we also showed all data as source data. We believe that more accurate statistical analyses were conducted using data from each individual animal.
Delta F/F refers to relative change, which should be (F-F0)/F0. This should be zero when t = 0. The values in Figure 3E, and 3F are ~ 1 when t = 0, however. Are these figures showing F/F0?
The reviewer is correct. It is indeed F-F0/F0 (ΔF/F0). In Figure 3F (3E in the original manuscript), t=0 was the time when 470-495 nm light (for both stimulation of SpiRh1 and detection of GCaMP6s fluorescence) started to be applied. In the experiment in Figure 3G (3F in the original manuscript), 405 nm light was applied to activate SpiRh1[S186F] for 2 s and then 470-495 nm light was applied to detect GCaMP6s fluorescence. In other words, t=0 is the time when 405 nm light started to be applied.
The authors' conclusions that the bistable rhodopsins are useful tools in the zebrafish system appear largely justified. This is consistent with findings from other organisms, including mouse (https://www.ncbi.nlm.nih.gov/pmc/articles/PMC8097317/, https://www.sciencedirect.com/science/article/pii/S0896627321001616). The tools here are likely to find broad use by scientists who use the zebrafish as the experimental system for a variety of different areas.
For the studies on LamPP and MosOpn3, we cited the references mentioned by the reviewer. We believe that our study substantiates that LampPP and MosOpn3, as well as other bistable rhodopsins, are valuable tools for zebrafish research, as pointed out by the reviewer.
Reviewer #2 (Public Review):
The presented study aims at deciphering the physiological function of GPCR signaling in excitable cells. To this end, the authors developed transgenic zebrafish models expressing a selection of Gq- and Gi/o-coupled bistable rhodopsins in either reticulospinal neurons or cardiomyocytes and elucidated behavioral responses (tail movements) or physiological responses (heartbeat) as well as intracellular Ca2+ dynamics following optical stimulation of rhodopsins.
One of the major strengths of the presented study is the functional comparison of five Gq- and five Gi/o-coupled rhodopsins in two major classes of excitable cells, however; the selection of rhodopsins tested remains elusive. More importantly, it is not obvious why some of the effects of rhodopsin activation were assessed in both neurons and cardiomyocytes, while others were only tested in one of the two systems without further explanation. The main chosen experimental readouts (swimming/tail bending or cardiac contractions) have limited informative value regarding GPCR signaling, as they will only report the peak of the iceberg, namely whether movements are elicited or heartbeats inhibited. No analysis on subtle changes in heart rate and contraction force was included, but such modulation of cardiac activity (e.g. positive or negative chronotropic, inotropic, dromotropic, bathmotropic, and/or lusitropic responses) would represent better the physiological modulation of the heart via GPCR and down-stream signaling events. In line, the presented data only represents behavior at one light intensity tested, whereas a light titration of observed effects could provide more meaningful insight into both rhodopsin responses and signaling mechanisms. Also, the potential promiscuity of G protein activation of selected receptors has not been addressed, neither experimentally nor in the discussion part. As a result of the above-mentioned limitations, it is difficult to follow the logic of the study and especially to interconnect the data obtained in reticulospinal neurons (where activation of jumping spider rhodopsin elicited tail bending) to myocyte data (where three Gi-coupled rhodopsins suppressed cardiac activity). Moreover, as such, the study does not provide explanations on why a certain tool might evoke an effect in one system or the other, or not, which could be the main deliverable of such a comparative analysis.
We are grateful for helpful and insightful comments from the reviewer. We believe that the presentation of experimental findings in the original manuscript may have led to a misunderstanding. We examined the effects of Gq and Gi/o-coupled bistable rhodopsins on both reticulospinal V2a neurons and cardiomyocytes. We observed noticeable effects of Gq rhodopsins on reticulospinal V2a neurons, but no significant effects on cardiomyocytes. Similarly, we found effects of Gi/o-coupled rhodopsins on cardiomyocytes, but no significant effects on reticulospinal V2a neurons. These discrepancies could be attributed to differences in the target cells and experimental conditions, suggesting the need for further optimization. We described the data on page 13, lines 16-22 and page 16, lines 9-10 in the Result section and Table 1, and discussed the relationship between the activity of bistable rhodopsins and their effects on target cells on page 21, lines 6-15 and page 24, line 19-page 25, line 2 in the Discussion section of the revised manuscript.
In order to clarify the function of Gi/o-coupled rhodopsins on the heart in more detail, we conducted experiments in which we activated cardiomyocytes expressing bistable rhodopsins at various light intensities to observe the effects on heartbeats. We analyzed cardiac arrest rate, latency to cardiac arrest, and time to resumption of heartbeat. The results of these experiments are shown in Figure 4 and Figure 4-supplement 2, 3 in the revised manuscript. We described the data on page 15, line 16-page 16, line 1 in the revised manuscript, as follows.
To analyze the photosensitivity of Gi/o-coupled rhodopsins, we applied light of various intensities for 1 s and examine their effect on HBs (Figure 4-supplement 2). Cardiac arrest was induced and sustained for over 20 s after stimulation of MosOpn3 with 0.05 mW/mm2 light for 1 s. Photoactivation of PufTMT and LamPP at lower light intensities (0.2 or 0.05 mW/mm2) resulted in cardiac arrest, but faster HB recovery than stimulation with 0.5 mW/mm2 light (Figure 4-supplement 2). The data indicate that the ability of MosOpn3 to suppress HBs is more photosensitive than PufTMT and LamPP in the zebrafish heart. We further examined atrial-ventricular (AV) conductivity by measuring the time difference between atrial and ventricular contractions before and after light stimulation when HBs had slightly recovered. There was no significant difference in AV conductivity before and after light stimulation (Figure 4-supplement 3).
We performed experiments to the best of our ability with current technology regarding cardiac function. However, we hope that the reviewer is willing to acknowledge that there are certain limitations in conducting a detailed analysis of the zebrafish larval heart, since many experimental techniques, such as electrophysiological analysis, have not yet been fully or effectively established for this animal model.
While the presented data is interesting, the graphical presentation and description of the data are insufficient. Most importantly, the current version of the text does not include a quantitative description of effects and statistical analyses (which are found in the figures and legends!). The lack of quantitative description also extends to both the introduction and discussion, which remain general without a specific dissection of observed effects.
We have described quantitative data in the Result section.
One major concern is the selective citation of own work. While single statements in both the introduction and discussion are supported by up to ten own papers, recent studies using rhodopsins for dissecting GPCR signaling in neurons are not sufficiently discussed and new data is not compared to published results by other teams. Moreover, relevant papers on cardiomyocytes (e.g. PMID: 35579776, 35365606, 34987414, 30894542) are not cited at all, despite the use of similar rhodopsins and/or optogenetic activation of the same signaling pathways. Taking into account these published studies may help to better understand the observed responses.
We apologize for not citing important relevant papers in the original manuscript. We have now cited all four papers (Dai et la., 2022; Wagdi et al., 2022; Cokic et al., 2021; Makowka et al., 2019) mentioned by the reviewer, as well as a new paper describing the use of MosOpn3 and LamPP in C. elegans neurons (Koyanagi et al., 2022) in the Introduction section. We also discussed the differences between our findings and previously published data in the Discussion section.
Additional comment: Data were obtained from larvae zebrafish. It would be useful to include a discussion on how GPCR signaling might be different in adult fish compared to larvae, and how to test whether the observed effects are more generally applicable.
We discussed the differences between the hearts of zebrafish larvae and adults, and the differences in GPCR signaling, on page 27, lines 10-16, as follows. In this study, we used zebrafish larvae to study the role of GPCR signaling in cardiac function, and there are differences in heart structure and function between larvae and adult zebrafish. As a zebrafish grows, blood pressure increases and the heart becomes more complex with the development of valves and ventricular trabeculae. Therefore, GPCR signaling, which regulates heart structure and function, may differ between juvenile and adult fish. Optogenetic manipulation of the heart’s function in adult zebrafish using bistable opsins should clarify this issue.
Reviewer #2 (Public Review):
Jarysta and colleagues set out to define how similar GNAI/O family members contribute to the shape and orientation of stereocilia bundles on auditory hair cells. Previous work demonstrated that loss of particular GNAI proteins, or inhibition of GNAIs by pertussis toxin, caused several defects in hair bundle morphogenesis, but open questions remained which the authors sought to address. Some of these questions include whether all phenotypes resulting from expression of pertussis toxin stemmed from GNAI inhibition; which GNAI family members are most critical for directing bundle development; whether GNAI proteins are needed for basal body movements that contribute to bundle patterning. These questions are important for understanding how tissue is patterned in response to planar cell polarity cues.
To address questions related to the GNAI family in auditory hair cell development, the authors assembled an impressive and nearly comprehensive collection of mouse models. This approach allowed for each Gnai and Gnao gene to be knocked out individually or in combination with each other. Notably, a new floxed allele was generated for Gnai3 because loss of this gene in combination with Gnai2 deletion was known to be embryonic lethal. Besides these lines, a new knockin mouse was made to conditionally express untagged pertussis toxin following cre induction from a strong promoter. The breadth and complexity involved in generating and collecting these strains makes this study unique, and likely the authoritative last word on which GNAI proteins are needed for which aspect of auditory hair bundle development.
Appropriate methods were employed by the authors to characterize auditory hair bundle morphology in each mouse line. Conclusions were carefully drawn from the data and largely based on excellent quantitative analysis. The main conclusions are that GNAI3 has the largest effect on hair bundle development. GNAI2 can compensate for GNAI3 loss in early development but incompletely in late development. The Gnai2 Gnai3 double mutant recapitulates nearly all the phenotypic effects associated with pertussis toxin expression and also reveals a role for GNAIs in early movement of the basal body. Although these results are not entirely unexpected based on earlier reports, the current results both uncover new functions and put putative functions on more solid ground.
Based on this study, loss of GNAI1 and GNAO show a slight shortening of the tallest row of stereocilia but no other significant changes to bundle shape. Antibody staining shows no change in GNAI localization in the Gnai1 knockout, suggesting that little to no protein is found in hair cells. One caveat to this interpretation is that the antibody, while proposed to cross-react with GNAI1, is not clearly shown to immunolabel GNAI1. More than anything, this reservation mostly serves to illustrate how challenging it is to nail down every last detail. In turn, the comprehensive nature of the current study seems all the more impressive.
Intelligence tests of delinquents. One of the most important facts brought to light by the use of intelligence tests is the frequent association of delinquency and mental deficiency. Although it has long been recognized that the proportion of feeble-mindedness among offenders is rather large, the real amount has, until recently, been underestimated even by the most competent students of criminology.
I believe the connection between mental deficiency and delinquency is a serious issue. I think a lot of people associate mental delinquency with being "slow" but according to the true crime shows I watch, a lot o criminals actually have high IQs. To me, mental delinquency can be a defect in a certain part of the brain that alters decision making. I believe the fetus experiences some sort of alteration when they are in utero from a mothers intake of drugs or alcohol or any other harmful substance. Brian damage after birth can also cause a mental defect that can set the tone for later delinquent behavior.
eleva-se uma preocupação no sentido de preparar osestudantes para uma situação profissional futura
Sendo conhecedor da reflexão desenvolvida no seio do neo-humanismo alemão sobre o conceito de Bildung ou formação (por autores como Wlhelm von Humboldt, Hegel ou Herder) esta preocupação com a aplicação prática do saber suscita-me reservas. A Bildung é, acima de tudo, um processo de autodeterminação e de desenvolvimento pessoal não subordinado a fins práticos, baseado na multiplicação de experiências e na abertura a outras perspetivas. A Bildung pode coabitar com um ensino profissionalizante, mas não se confunde com ele. Importa não perder de vista esta distinção, que tem claras implicações práticas. Uma referência: Forming Humanity – Redeeming the German Bildung Tradition. Chicago University Press, 2019. Rui Silva
Avaliar, mais do que medir,
Na nossa última sessão síncrona, levantaram-se questões muito interessantes a partir das tensões entre estes dois verbos: avaliar e medir. Ainda que não queiramos reduzir o primeiro ao segundo e procuremos diferentes formas de monotorização das aprendizagens, a verdade é que no final do semestre temos sempre necessidade de apresentar um número que traduz o percurso dos nossos estudantes.
“avaliar para aprender”
Abordagem da avaliação como uma ferramenta de aprendizagem ativa e contínua, em vez de ser apenas um momento final de verificação do aprendente, com vista à atribuição de uma classificação. Nessa perspetiva, a avaliação é vista como um processo integrante do ensino, fornecendo feedback relevante e permitindo identificar as lacunas com o objetivo de melhorar o desempenho ao longo do tempo. "O papel da avaliação enquanto promotora e reguladora da aprendizagem." [Maria do Carmo Martins e Helena Melo, Universidade dos Açores]
As tarefas de avaliação deverão ser desenvolvidas em contextos similares acontextos reais
Todos os exercícios práticos, quer durante as aulas quer de avaliação são casos reais, com resultados reais. No entanto os alunos não têm a capacidade de verificar nem a noção se o seu resultado final é possível (real). (José Fontes UAç)
uma percentagem significativa dosestudantes considera que as tarefas de avaliação digital propostas eram próximas dasque irão encontrar na vida profissional e que foram realizadas num contexto real ou desimulação do real. Referem, ainda, que essas tarefas são relevantes para o seu dia-a-dia e úteis para o seu desempenho profissional.
Isto me termos de cursos por exemplo na área de agronomia e nas outras de uma forma geral é de extrema importância para o estudante sentir a importância e aplicabilidade real do que apreendeu na UC
A perceção dos estudantes sobre a importância da avaliação das competências deplaneamento e gestão de um projeto, não é totalmente coincidente com a que lhe éatribuída pela docente
Este é um problema e um dilema real de todos os docentes para o qual urge encontrar forma de o resolver para despertar o interesse do estudante pela UC em causa.
O conceito de competência, do nosso ponto de vista, define-se como a capacidade pararesponder com sucesso a uma solicitação, pessoal e/ou societal, ou para efetuar umatarefa ou atividade que requer a mobilização de conhecimentos (implícitos e/ouexplícitos), habilidades, destrezas, capacidades, atitudes, emoções e valore
A incorporação de "atitudes, emoções e valores" no conceito de competência surpreende-me, porque o meu termo de referência aqui é o programa do pensamento crítico que, desde as suas origens por volta dos anos 70/80 do séc. XX, defendeu a existência de uma dualidade competência/disposição (exemplo disso é Robert Ennis). Posso ter uma competência e não ter a disposição intelectual para a utilizar. Por isso é tão importante cultivar a dimensão disposicional do pensamento (virtudes intelectuais, disposições do pensamento crítico), um ponto que fica obscurecido diluindo-a no conceito de competência. Rui Silva
tempo de maturação
O tempo, especificamente na área da Matemática, é fundamental para consolidar conteúdos visando adquirir competências necessárias e preparação para obter conceitos mais avançados que necessitam de outros anteriores.
[Helena Melo e Maria do Carmo Martins, Universidade dos Açores]
Ciências da Educação
Ao longo dos capítulos em que são apresentados exemplos práticos relativos a UCs do 1.º ciclo e do 2.º ciclo, referentes à área das Ciências da Educação, também poderiam exemplificar, de modo concreto, exemplos relativo às áreas das Ciências Exatas, atendendo à sua especificidade.
Salientamos que se torna difícil implementar tais ideologias formativas da área das Ciências da Educação diretamente, ou adaptada, às Ciência Exatas.
Observamos que a parte científica de uma UC na área das Ciências da Educação é muito similar às práticas pedagógicas utilizadas nesta área, enquanto que na área das Ciências Exatas a parte científica é distinta da prática pedagógica.
[Helena Melo e Maria do Carmo Martins, Universidade dos Açores]
E portanto o desafio, o grande desafio deles écolocarem-se mesmo numa postura em que não lhes é dito nada
Contudo, o avanço tecnológico é rápido e o estudante, no momento da sua utilização, pode estar desfasado, se não estiver constantemente a atualizar-se. Atendendo ao paradigma atual exige-se, do estudante e do formador, uma atitude reflexiva e interativa, um trabalho colaborativo incessante e um recurso permanente aos meios digitais, tendo em vista a uma preparação consciente para o amanhã e para lidar com o inesperado.
[Helena Melo e Maria do Carmo Martins, Universidade dos Açores]
falência
A palavra falência é demasido forte. Talvez fizessse mais sentido usar "artificialidade" ou "crescente inedequabilidade". De facto, o sistema de ensino tem estado ligado as formas tradicionais psicométricas, mas se ele existe é sinal do seu sucesso, dai não se poder falar de falência.
em direção aos objetivos a atingir
Também há autores que questionam isto que parece ser uma sugestão de que a avaliação incide apenas sobre objetivos previamente definidos (o que foi planeado antes do ato de ensino), desvalorizando os imprevistos acontecendo ao longo do processo educativo e que podem ter grande potencial educativo, razão pela qual não deveriam ficar fora da avaliação. Como afirma Kliebard (1991), essa visão estreita da avaliação "não leva em consideração resultados latentes que talvez sejam os mais significativos" (p.126). Referência Kliebard (1991). Crítica aos princípios de Tyler. In F. A. Machado e M. F. Gonçalves (Orgs.), Currículo e Desenvolvimento Curricular: problemas e perspectivas (pp. 125-127). ASA. [Francisco Sousa, Universidade dos Açores]
novo
Novo mesmo? Há décadas que quem estuda aprofundadamente a avaliação defende a ideia de que avaliação não é sinónimo de classificação, pois, como se afirma e desenvolve mais adiante nesta publicação, inclui uma dimensão de avaliação formativa. Por exemplo, Ribeiro e Ribeiro (1989) afirmam que "a função de avaliar corresponde a uma análise cuidada das aprendizagens planeadas, o que se vai traduzir numa descrição que informa professores e alunos sobre os objetivos atingidos e aqueles onde se levantam dificuldades", permitindo assim que se ofereça aos alunos "informação que lhes permite orientar os seus esforços, com o apoio do professor, no sentido de ultrapassar dificuldades" (p. 337). Referência Ribeiro, A. C. e Ribeiro, L. (1989). Planificação e avaliação do ensino-aprendizagem. Universidade Aberta. [Francisco Sousa, Universidade dos Açores]
podem indiciar diversasperspetivas de ensino não necessariamente transformadoras
Como sublinha Fino (2017), as expectativas de que o desenvolvimento tecnológico revolucionaria a educação e teria um forte impacto positivo no sucesso educativo têm sido cada vez mais reconhecidas como mitos. Mas as Tecnologias da Informação e da Comunicação (TIC) podem ser muito úteis na educação e têm características que lhes podem conferir o papel de peças importantes da inovação educacional, se integradas em estratégias de ensino transformadoras. Refiro-me ao ensino em geral e à avaliação em particular. Referência Fino, C. (2017). Um século de máquinas de ensinar, 50 anos de máquinas de aprender. Revista Hipótese, 3 (3), 58-74.Description [Francisco Sousa, Universidade dos Açores]
Desafios da Avaliação Digital no Ensino Superio
Car@s cibernautas, o desafio desta semana da nossa sala de aula virtual é comentar alguns dos desafios da avaliação digital no ES que encontrarem neste texto. Divirtam-se, façam anotações e highlights!! E podem interagir com as anotações já existentes.... saudações académicas António Moreira
Reviewer #1 (Public Review):
This is my first review of the article entitled "The canonical stopping network: Revisiting the role of the subcortex in response inhibition" by Isherwood and colleagues. This study is one in a series of excellent papers by the Forstmann group focusing on the ability of fMRI to reliably detect activity in small subcortical nuclei - in this case, specifically those purportedly involved in the hyper- and indirect inhibitory basal ganglia pathways. I have been very fond of this work for a long time, beginning with the demonstration of De Hollander, Forstmann et al. (HBM 2017) of the fact that 3T fMRI imaging (as well as many 7T imaging sequences) do not afford sufficient signal to noise ratio to reliably image these small subcortical nuclei. This work has done a lot to reshape my view of seminal past studies of subcortical activity during inhibitory control, including some that have several thousand citations.
In the current study, the authors compiled five datasets that aimed to investigate neural activity associated with stopping an already initiated action, as operationalized in the classic stop-signal paradigm. Three of these datasets are taken from their own 7T investigations, and two are datasets from the Poldrack group, which used 3T fMRI.
The authors make six chief points:<br /> 1. There does not seem to be a measurable BOLD response in the purportedly critical subcortical areas in contrasts of successful stopping (SS) vs. going (GO), neither across datasets nor within each individual dataset. This includes the STN but also any other areas of the indirect and hyperdirect pathways.<br /> 2. The failed-stop (FS) vs. GO contrast is the only contrast showing substantial differences in those nodes.<br /> 3. The positive findings of STN (and other subcortical) activation during the SS vs. GO contrast could be due to the usage of inappropriate smoothing kernels.<br /> 4. The study demonstrates the utility of aggregating publicly available fMRI data from similar cognitive tasks.<br /> 5. From the abstract: "The findings challenge previous functional magnetic resonance (fMRI) of the stop-signal task"<br /> 6. and further: "suggest the need to ascribe a separate function to these networks."
I strongly and emphatically agree with points 1-5. However, I vehemently disagree with point 6, which appears to be the main thrust of the current paper, based on the discussion, abstract, and - not least - the title.
To me, this paper essentially shows that fMRI is ill-suited to study the subcortex in the specific context of the stop-signal task. That is not just because of the issues of subcortical small-volume SNR (the main topic of this and related works by this outstanding group), but also because of its limited temporal resolution (which is unacknowledged, but especially impactful in the context of the stop-signal task). I'll expand on what I mean in the following.
First, the authors are underrepresenting the non-fMRI evidence in favor of the involvement of the subthalamic nucleus (STN) and the basal ganglia more generally in stopping actions.<br /> - There are many more intracranial local field potential recording studies that show increased STN LFP (or even single-unit) activity in the SS vs. FS and SS vs. GO contrast than listed, which come from at least seven different labs. Here's a (likely non-exhaustive) list of studies that come to mind:<br /> o Ray et al., NeuroImage 2012<br /> o Alegre et al., Experimental Brain Research 2013<br /> o Benis et al., NeuroImage 2014<br /> o Wessel et al., Movement Disorders 2016<br /> o Benis et al., Cortex 2016<br /> o Fischer et al., eLife 2017<br /> o Ghahremani et al., Brain and Language 2018<br /> o Chen et al., Neuron 2020<br /> o Mosher et al., Neuron 2021<br /> o Diesburg et al., eLife 2021<br /> - Similarly, there is much more evidence than cited that causally influencing STN via deep-brain stimulation also influences action-stopping. Again, the following list is probably incomplete:<br /> o Van den Wildenberg et al., JoCN 2006<br /> o Ray et al., Neuropsychologia 2009<br /> o Hershey et al., Brain 2010<br /> o Swann et al., JNeuro 2011<br /> o Mirabella et al., Cerebral Cortex 2012<br /> o Obeso et al., Exp. Brain Res. 2013<br /> o Georgiev et al., Exp Br Res 2016<br /> o Lofredi et al., Brain 2021<br /> o van den Wildenberg et al, Behav Brain Res 2021<br /> o Wessel et al., Current Biology 2022<br /> - Moreover, evidence from non-human animals similarly suggests critical STN involvement in action stopping, e.g.:<br /> o Eagle et al., Cerebral Cortex 2008<br /> o Schmidt et al., Nature Neuroscience 2013<br /> o Fife et al., eLife 2017<br /> o Anderson et al., Brain Res 2020
Together, studies like these provide either causal evidence for STN involvement via direct electrical stimulation of the nucleus or provide direct recordings of its local field potential activity during stopping. This is not to mention the extensive evidence for the involvement of the STN - and the indirect and hyperdirect pathways in general - in motor inhibition more broadly, perhaps best illustrated by their damage leading to (hemi)ballism.
Hence, I cannot agree with the idea that the current set of findings "suggest the need to ascribe a separate function to these networks", as suggested in the abstract and further explicated in the discussion of the current paper. For this to be the case, we would need to disregard more than a decade's worth of direct recording studies of the STN in favor of a remote measurement of the BOLD response using (provably) sub ideal imaging parameters. There are myriads of explanations of why fMRI may not be able to reveal a potential ground-truth difference in STN activity between the SS and FS/GO conditions, beginning with the simple proposition that it may not afford sufficient SNR, or that perhaps subcortical BOLD is not tightly related to the type of neurophysiological activity that distinguishes these conditions (in the purported case of the stop-signal task, specifically the beta band). But essentially, this paper shows that a specific lens into subcortical activity is likely broken, but then also suggests dismissing existing evidence from superior lenses in favor of the findings from the 'broken' lens. That doesn't make much sense to me.
Second, there is actually another substantial reason why fMRI may indeed be unsuitable to study STN activity, specifically in the stop-signal paradigm: its limited time resolution. The sequence of subcortical processes on each specific trial type in the stop-signal task is purportedly as follows: at baseline, the basal ganglia exert inhibition on the motor system. During motor initiation, this inhibition is lifted via direct pathway innervation. This is when the three trial types start diverging. When actions then have to be rapidly cancelled (SS and FS), cortical regions signal to STN via the hyperdirect pathway that inhibition has to be rapidly reinstated (see Chen, Starr et al., Neuron 2020 for direct evidence for such a monosynaptic hyperdirect pathway, the speed of which directly predicts SSRT). Hence, inhibition is reinstated (too late in the case of FS trials, but early enough in SS trials, see recordings from the BG in Schmidt, Berke et al., Nature Neuroscience 2013; and Diesburg, Wessel et al., eLife 2021).<br /> Hence, according to this prevailing model, all three trial types involve a sequence of STN activation (initial inhibition), STN deactivation (disinhibition during GO), and STN reactivation (reinstantiation of inhibition during the response via the hyperdirect pathway on SS/FS trials, reinstantiation of inhibition via the indirect pathway after the response on GO trials). What distinguishes the trial types during this period is chiefly the relative timing of the inhibitory process (earliest on SS trials, slightly later on FS trials, latest on GO trials). However, these temporal differences play out on a level of hundreds of milliseconds, and in all three cases, processing concludes well under a second overall. To fMRI, given its limited time resolution, these activations are bound to look quite similar.
Lastly, further building on this logic, it's not surprising that FS trials yield increased activity compared to SS and GO trials. That's because FS trials are errors, which are known to activate the STN (Cavanagh et al., JoCN 2014; Siegert et al. Cortex 2014) and afford additional inhibition of the motor system after their occurrence (Guan et al., JNeuro 2022). Again, fMRI will likely conflate this activity with the abovementioned sequence, resulting in a summation of activity and the highest level of BOLD for FS trials.
In sum, I believe this study has a lot of merit in demonstrating that fMRI is ill-suited to study the subcortex during the SST, but I cannot agree that it warrants any reappreciation of the subcortex's role in stopping, which are not chiefly based on fMRI evidence.
A few other points:<br /> - As I said before, this team's previous work has done a lot to convince me that 3T fMRI is unsuitable to study the STN. As such, it would have been nice to see a combination of the subsamples of the study that DID use imaging protocols and field strengths suitable to actually study this node. This is especially true since the second 3T sample (and arguably, the Isherwood_7T sample) does not afford a lot of trials per subject, to begin with.<br /> - What was the GLM analysis time-locked to on SS and FS trials? The stop-signal or the GO-signal?<br /> - Why was SSRT calculated using the outdated mean method?<br /> - The authors chose 3.1 as a z-score to "ensure conservatism", but since they are essentially trying to prove the null hypothesis that there is no increased STN activity on SS trials, I would suggest erring on the side of a more lenient threshold to avoid type-2 error.<br /> - The authors state that "The results presented here add to a growing literature exposing inconsistencies in our understanding of the networks underlying successful response inhibition". It would be helpful if the authors cited these studies and what those inconsistencies are.
! images - search - xanadu ted nelson
quadratic
In the future will we have to specify time complexity like we did in python (ie big O notation) or is descriptors like quadratic enough?
Author Response:
We would like to thank the eLife reviewers for the considerable time and effort they have invested to review these manuscripts. We have also benefited from a previous round of review of the manuscript describing the proposed burial features, which underwent two rounds of revisions in a high-impact journal over a period of approximately 8 months during 2022 and early 2023. Both sets of reviews have reflected mixed responses to the evidence we have presented, with one reviewer recommending acceptance with minor editorial revisions, two recommending acceptance with minor revisions and the fourth recommending rejection based upon similar arguments to those reflected by some of the reviewers in this current round of reviews in eLife. Ultimately the managing editor of this first journal took the decision that the review process could not be completed in a timely manner and rejected the manuscript although the submission here reflected our consideration of these reviewers suggestions.
We have chosen in this initial response to the eLife reviews to include some references to the previous anonymous reviews in order to illustrate differences of opinion and differences in revision suggestions within the review process. Our goal is to offer maximal insight into our decision-making process and to acknowledge the considerable time and effort put into the assessment of these manuscripts by reviewers (for eLife and in the case of the earlier review process). We hope that this approach will assist the readers, and reviewers, of our manuscripts in understanding why we are proceeding with certain decisions during the revision process.
This is a new process for us and the reviewers, and one way in which it significantly differs from more traditional review is that both the reviews and our reply will be public well in advance of our revisions to the manuscript. Indeed, considering the scope of the reviews, some of those revisions may take considerable time, although many can be accomplished fairly easily. Thus, we are not in a position to say that we have solved every issue raised by the reviewers. Instead, we will examine what appear to be the key critical issues raised regarding the data and the analyses and how we propose to address these as we revise the papers. We will also address several philosophical and ethical issues raised by the reviews and our proposal for dealing with these. More specific editorial and citational recommendations will be dealt with on a case-by-case basis, and we do not address these point-by-point in this reply. Please note, this response to the reviewers is not the revision of the manuscript and is only the initial opinion of the corresponding authors with some guidance from the larger group of authors of all three papers. Our final submitted revision will reflect the input of all authors included on those submissions.
We took the decision to submit three separate papers consciously. The two different categories of evidence, burials and engravings, involve different kinds of analysis and different (although overlapping) teams of researchers, and we recognized that each deserved their own presentation and assessment. Meanwhile, together they inform the context of H. naledi in a way that requires some synthetic discussion, in which both kinds of evidence are relevant, leading to a third paper. But the mutual relevance of these different kinds of evidence and their review by a common set of reviewers naturally raises cross-cutting issues, and the reviewers have cross-referenced the three articles. This has sometimes led to suggestions about one manuscript based on the contents of another. Considering the situation, we accepted the recommendation that it would be clearer to consider all three articles in a single reply. Thus, while each of the three papers will proceed separately during the revision process, it will be necessary to highlight across all three papers occasionally in our responses.
Scientific Issues:
In reading the reviews, we feel there are 9 critical points/assertions raised by one or more of the reviewers that present a problem for, or challenge to, our hypothesis that the observed evidence (bone accumulations and engravings) described in the Dinaledi subsystem are of intentional naledigenic origin. These are:
The evidence presented does not demonstrate a clear interruption of the floor sediments, thus failing to demonstrate excavated holes.
The sediments infilling the holes where the skeletal remains are found have not been demonstrated to originate from the disruption of the floor sediments and thus could be part of a natural geological process (e.g. water movement, slumping) or carnivore accumulations.
Previous geological interpretations by our research group have given alternative geological explanations for formation of the bony accumulations that contradict the present evidence presented here and result in alternative origins hypotheses.
Burial cannot be effectively assessed without complete excavation of the features and site.
The skeletal remains as presented do not conform clearly to typical body arrangement/positions associated with human (Homo sapiens) burials.
There is no evidence of grave goods or lithic scatters that are typically associated with human burials.
Humans may have been involved with the creation of either the Homo naledi bone accumulations, the engravings, or both.
Without a date of the engravings, the null hypothesis should be the engravings were created by Homo sapiens.
The null hypothesis for explanation of the skeletal remains in this situation should be “natural accumulation”.
Our analysis of the Dinaledi Feature 1 leads us to accept that the laminated orange-red mudstone (LORM) sedimentary layer is interrupted, indicating a non-natural intervention, and that the hole created by the interruption was then filled by both a fleshed body (and perhaps parts of other bodies) which were then covered by sediment that originated from the hole that was dug. We recognize that the four eLife reviewers are not convinced that our presentation is sufficient to establish this. Interestingly, this was not the universal opinion of earlier reviewers of the initial manuscript several of whom felt we had adequately supported this hypothesis. The lack of clarity in this current version of the burial manuscript is our responsibility. In the upcoming revision of this paper to be submitted, we will take the reviewers’ critiques to heart and add additional figures that illustrate better the disruption of the LORM and clarify the sedimentological data showing the material covering the skeletal remains in the hole are the disrupted sediments excavated from the same hole. We are proposing to isolate this most critical evidence for burial into a separate section in the revised submission based on the reviewers’ comments. The fact that the LORM layer is disrupted, a fleshed body was placed in the hole created by this disruption, and the body (and perhaps parts of other bodies) was/were then covered by the same sediments from the hole is the central feature of our hypothesis that the bone accumulations observed reflect a burial and not a natural process.
The possibility of fluvial transport or involvement in the subsystem is a topic that we have addressed extensively in past work, and it is clear from these reviews that we must enhance our current manuscript to discuss this issue at greater length. Our previous work (Dirks et al. 2015; Dirks et al. 2017) emphasized that fluvial transport of whole bodies into the subsystem was precluded by several lines of sedimentological evidence. We excavated a rich accumulation of skeletal remains, including articulated limbs and other elements in subvertical orientations inconsistent with slow sedimentary infill, which were difficult to explain without positing either a large and dense pile of bodies and/or sediment movement. We encountered fractured chunks of laminated orange-red mudstone (LORM) in random orientations within our excavation area, within and among skeletal remains, which directly refuted that the remains were inundated with water at the time of burial, and this limited the possibility of fluvial transport. Water flow sufficient to displace bodies or complete skeletal evidence would also transport large and course sediment, which is absent from the subsystem, and would sort the commingled skeletal material that we found by size, which we do not observe. But our excavation only covered less than a square meter at very limited depth, and this was the limit to our knowledge of subsurface sediment. We thus were left with uncertainty that led us to suggest the possibility of sediment slumping or movement into subsurface drains, although these were not observed near our excavation. Our current work expands our knowledge of the subsurface and presents an alternative explanation for the disposition of skeletal remains from our earlier excavation. But we acknowledge that this new explanation is vulnerable to our own previous published proposals, and we must do a better job of explaining how the new information addresses our previous suggestions. By not clearly creating a section where we explained how these previous hypotheses were now nullified by new evidence, we clearly confused the reviewers with our own previous work. We will revise the manuscript by enhancing the review of the significant geological evidence demonstrating that there is no significant fluvial action in the system and making it clear how the burial hypothesis provides a clearer explanation for the situation of skeletal remains from our previous excavation work.
One of the central issues raised by reviewers has been a perceived need to excavate these features completely, totally exhuming all skeletal remains from them. Reviewers have written that it is necessary to identify every skeletal element that is present and account for any missing elements. On this point, we have both ethical and scientific differences from these reviewers. We express our ethical concerns first. Many of the best-preserved possible burials ever discovered by archaeologists were subjected to total excavation and exhumation. Cases like La Chapelle-aux-Saints, La Ferrassie, and Skhūl were fully excavated at a time when data recording and excavation methods did not include the range of spatial and geomorphological approaches that later became routine. The judgment of early investigators that these situations were intentional burials was challenged by later workers, and the kind of information that might enable better tests had been irrevocably lost (Gargett 1999; Dibble et al. 2015; Rendu et al. 2014).
Later, improved excavation standards have not sufficed to remove uncertainty or debate about possible burials. For example, it was long presumed that well-preserved remains of young children were by themselves diagnostic of intentional burial, such as those from Dederiyeh, Border Cave, or Roc de Marsal. Such cases were also fully excavated, with adequate documentation of the positioning of skeletal remains and their surrounding stratigraphic situation, but such cases were later challenged on several bases and the complete exhumation of material has confused or precluded testing of new hypotheses (e.g. Gargett 1999). The case of Roc de Marsal is one in which data from the initial excavation combined with data from the initial excavation combined with re-excavation and geoarchaeological analysis led to a naturalistic interpretation of the skeletal material (Sandgathe et al. 2011; Goldberg et al. 2017). But even in this case, the researchers erred in their interpretation of the skeleton’s situation due to a lack of identification of parts of the infant’s skeleton (Gómez-Olivencia and García-Martinez 2019). That is to say, it is not only the burial hypothesis but other hypotheses that suffer from complete excavation. Researchers concerned with preserving all possible information have sometimes taken extraordinary measures to remove and study possible burials at high-resolution in the laboratory. Such was the case of the Shanidar IV burial removed from the site and transported in plaster jacket by Solecki, which led to the disruption and loss of internal stratigraphic information (Pomeroy et al. 2020). Arguably, the current state of the art is full excavation with partial preparation, such as that undertaken at Panga ya Saidi (Martinón-Torres et al. 2021). But again, any future attempt to reinterpret or test the hypothesis of burial must rely on the adequacy of documentation as the original context has been removed.
In our decision to leave material in place as much as possible, we are expanding upon standard practice to leave witness sections and unexcavated areas for future research. The situation is novel, representing possible burials by a nonhuman species, and that makes it doubly important in our opinion to be conservative in not fully exhuming the skeletal material from its context. We anticipate that many other researchers, including future investigators, will suggest additional methods to further test the hypothesis of burial, something that would be impossible if we had excavated the features in their entirety prior to publishing a description of our work. We believe strongly that our ethical responsibility is to publish the work and the most likely interpretation while leaving as much evidence in place as possible to enable further testing and replication. We welcome the suggestions of additional methods/analyses to test the H. naledi burial hypothesis.
This being said, we also observe that total exhumation would not resolve the concerns raised by the reviewers. The recommendation of total exhumation is in pursuit of a full account of all skeletal material present and its preservation and spatial situation, in order to demonstrate that they conform to body positions comparable to human burials. As has been highlighted in forensic casework, the excavation of an inhumation feature does not necessarily provide an accurate spatial or anatomical manifest of the stratigraphical relationships between the body, encapsulating matrix, and any cut present due to preservational, taphonomic and operational factors (Dirkmaat and Cabo, 2016; Hunter, 2014). In particular, in cases where skeletal elements are highly fragmented, friable, or degraded (such as through bioerosion) then complete excavation—even under controlled laboratory conditions—may destroy bone and severely limit skeletal identification (Henderson, 1997; Hochrein, 2002; Owsley and Compton, 1997), particularly in elements where the ratio of trabecular to cortical bone is high (Darwent and Lyman, 2002; Lyman, 1994). As such, non-invasive methods of 3D and 4D modelling (preservation in situ) are often considered preferable to complete necropsy or excavation (preservation by record) where appropriate (Bolliger and Thali, 2009; Dell’Unto and Landeschi, 2022; Randolph-Quinney et al., 2018; Silver, 2016).
The test of burial is not primarily positional, but taphonomic and geological. The position and number of bones can elaborate on process-driven questions of decay and destruction in the burial environment, or post-mortem modification, but are not singularly indicative of whether the remains were intentionally buried – the post-mortem narrative of all the processes affecting the cadaveric island is required (Knüsel and Robb, 2016). In previous cases, researchers have disputed or accepted the hypothesis of intentional hominin burial based upon assumptions about how modern humans or Neandertals would have positioned bodies, with the idea that some positions reflect ritual intent while others do not. But applying such assumptions is unjustifiable, particularly for a species like H. naledi, whose culture may have differed fundamentally from our own. Our work acknowledges that the present evidence does not enable a full reconstruction of the burial positions, but it does show that fleshed remains were encased in sediment prior to decomposition of soft tissue, and that subsequent spatial changes can be most parsimoniously explained by natural decomposition within sedimentary matrix contained within a burial feature (after Green, 2022; Mickleburgh and Wescott, 2018; Mickleburgh et al., 2022). If the argument is that extraordinary claims require extraordinary evidence, we feel that the evidence documents excavation and interment (and will do so more clearly in the revision) and the fact of the remains do not match a “typical” human burial in body positioning is not in itself evidence that these are not H. naledi burials.
We feel that the reviewers (in keeping with many palaeoanthropologists) have a clear idea of what they “think” a burial should look like in an idealised sense, but this platonic ideal of burial form is not matched by the extensive literature in archaeothanatology, funerary archaeology and forensic science which indicates enormous variability in the activity, morphology and post-mortem system experienced by the human body in cases of interment and body disposal (e.g. Aspöck, 2008; Boulestin and Duday, 2005 and 2006; Connelly et al., 2005; Channing and Randolph-Quinney, 2006; Cherryson, 2008; Donnelly et al., 1995; Finley, 2000; Hunter, 2014; Parker Pearson, 1999; Randolph-Quinney, 2013). Decades of experience in the identification, recovery and interpretation of clandestine, deviant, and non-formal burials indicates the platonic ideal is rare, and in many contexts, the exception (Cherryson, 2008; Parker Pearson, 1999). This variability is particularly relevant to morphological traits in burial context, such as the informal nature of the grave cut in plan and section, shallow burial depth, and initial disposition of body (placement) during the early post-mortem period. These might run counter to the expectations of reviewers or others referencing the fossil hominin record, but are well accepted within the communities of researchers investigating Holocene archaeological sites and forensic contexts.
It is encouraging to see reviewers beginning to incorporate the extensive (often experimentally derived) literature from archaeothanatology and forensic taphonomy in their deliberations, and we will be taking these comments on board going forward. In particular, we acknowledge reviewers’ comments and the need to construct a more detailed post-mortem narrative, accounting for joint disarticulation (labile versus persistent joints etc), displacement, and final disposition of elements within the burial space. As such we will incorporate the hierarchy of decomposition (rank order disarticulation), associations between regions of anatomical association, areas of disassociation, and the voids produced during decomposition (after Mickleburgh and Wescott, 2018; Mickleburgh et al., 2022) into our narrative. In doing so we acknowledge the tensions between the inductive archaeolothanatological narrative-driven approach (e.g. Duday, 2005 & 2009) versus robust decomposition data derived from human forensic taphonomic experimentation recently articulated by Schotsmans and colleagues (2022) - noting that we will highlight comparative data based on forensic experimental casework and actualistic modelling over inductive intuitive approaches which come with significant evidential shortcomings (Bristow et al. 2011).
Finally, from a taphonomic perspective it is worth pointing out to reviewers that we have already addressed the issue of lack of taphonomic evidence for carnivore involvement in the formation of the Dinaledi assemblage (Dirks, et al., 2016). Absence of any carnivore-induced bone surface modifications, patterns of skeletal part representation, and a total absence of any carnivore remains found within the Dinaledi chamber (following Kuhn and colleagues, 2010) lead us to reject carnivores as possible vectors of body accumulation within the Dinaledi Chamber and Hill Antechamber.
Reviewers suggest that without a date derived from geochronological methods, the engravings cannot be associated with H. naledi, and that it is possible (or probable) that the engravings were done in the recent past by H. sapiens. This suggestion neglects the context of the site. We have previously documented the structure and extremely limited accessibility of the Dinaledi subsystem. This subsystem was not recorded on maps of the documented Rising Star Cave system prior to our work and its discovery by our teams. Furthermore, there is no evidence of prehistoric human activity in the areas of the cave related to possible subterranean entrances There is no evidence that humans in the past typically ventured into such extreme spaces like those of Rising Star. It is clear from the presence of the remains of many individuals that H. naledi ventured into these spaces again and again. It is likely that H. naledi moved through these spaces more easily than humans do based on their physique. We show that the engravings overlay each other suggesting multiple engraving events. These engravings took time and effort and the only evidence for use of the Dinaledi subsystem by any hominin is by H. naledi. The context leads to the null hypothesis that H. naledi made the marks. In our revision, we will elaborate on this argument to clarify the evidence for our stance on this hypothesis. Several reviewers took issue with the title of the engraving paper as we did not insert a qualifier in front of the suggested date range for the engravings. We deliberately left out qualifying language so that the title took the form of a testable hypothesis rather than a weak assertation. Should future work find the engravings were not produced within this time range, then we will restate this hypothesis.
Finally, with regards to the engravings we have chosen to report them because they exist. Not reporting the presence of engraved marks on the walls of a cave above hypothesized burials would be tantamount to leaving relevant evidence out of the description of an archeological context. We recognize and state in our manuscript that these markings require substantial further study, including attempts at geochronological dating. But the current evidence is clearly relevant to the archaeological context of the subsystem. We take a similar stance with reporting the presence of the tool shaped artefact near the hand of the H. naledi skeleton in the Hill Antechamber. It is evident that this object requires further study, as we stated in our manuscript, but again omitting it from our study would be leaving out relevant evidence.
Some have suggested that the null hypothesis should be that all of these observed circumstances are of natural origin. Our team took this approach in our early investigation of the Dinaledi subsystem (Dirks et al. 2015). We adopted the null hypothesis that the geological processes involved in the accumulation of H. naledi skeletal remains were “natural” (e.g., non-naledigenic involvement), and we were able to reject many alternative explanations for the assemblage, including carnivore accumulation, “death trap” accumulation, and fluvial transport of bodies or bones (Dirks et al. 2015). This led us to the hypothesis that H. naledi were involved in bringing the bodies into the spaces where they were found. But we did not hypothesize their involvement in the formation of the deposit itself beyond bringing the bodies to the location.
This approach seems conservative. It followed the traditional view that small-brained hominins do not engage in cultural practices. But we recognize in hindsight that this null hypothesis approach did harm to our analyses. It impeded us from recognizing within our initial excavations of the puzzle box area and other excavations between 2014 – 2017 that we might be encountering remains that were intrusive in the sedimentary floor of the chamber. If we had approached the accumulation of a large number of hominins from the perspective of the null hypothesis being that the situation was likely cultural, we perhaps would have collected evidence in a slightly different manner. We certainly note that if the Dinaledi system had been full of the remains of modern humans, there would have been little doubt that the null hypothesis would have been that this was a cultural space and not a “natural space”. We therefore respectfully disagree with the reviewers who continue to support the idea that we should approach hominin excavations with the null hypothesis that they will be natural (specifically non-cultural) in origins. If excavations continue with this mindset we believe that potential cultural evidence is almost certain to be lost.
There has been a gradient across paleoanthropological excavations, archaeological work, and forensic investigation, with increasing precision of context. The reality is that the recording precision and frame of approach is typically different in most paleontological excavations than in those related to contemporary human remains. If anything comes from the present discussion of whether the Dinaledi system is a burial site for H. naledi or not, we hope that by taking seriously the possibility of deep cultural dynamics of hominins, we will encourage other teams to meet the highest standards of excavation in order to preserve potential cultural evidence. Given H. naledi’s cranial capacity we suggest that even very early hominin skeletal assemblages should be re-examined, if there is sufficient evidence or records available. These would include examples such as the A.L. 333 Au. afarensis site (the so called First Family site in Hadar Ethiopia), the Dikika infant skeleton, WT 15000 (Turkana Boy) and even A.L. 288 (Lucy) as such unusual taphonomic situations where skeletons are preserved cannot be simply explained away as “natural” in origin, based solely on the cranial capacity and assumed lack of cognitive and cultural complexity of the hominins as emphasized by us in Fuentes et al. (2023). We are not the first to observe that some very early hominin situations may represent early mortuary activity (Pettitt 2013), but we would advocate a step further. We suggest it may be damaging to take “natural accumulation” as the standard null hypothesis for hominin paleoanthropology, and that it is more conservative in practice to engage remains with the null hypothesis of possible cultural formation.
We are deeply grateful for the time and effort all of the 8 reviewers (across three reviews) have taken with this work. We also acknowledge the anonymous reviewers from previous submissions who’s opinions and comments will have made the final iterations of these manuscripts better for their efforts. As this process is rather public and includes commentary outside of the eLife forum, we ask that the efforts of all 37 authors and 8 reviewers involved be respected and that the discourse remain professional in all venues as we study this fascinating and quite complex occurrence. We appreciate also the efforts of members of the public who have engaged with this relatively new process where preprints are posted prior to the reviews allowing comments and interactions from colleagues and the public who are normally not part of the internal peer review process. We believe these interactions will make for better final papers. We feel we have met the standards of demonstrating burials in H. naledi and that the engraving are most likely associated with H. naledi. However, given the reviews we see many areas where our clarity and context, and analyses, were less strong than they can be. With the clarifications and additions taken on board through these review processes the final papers will be stronger and clearer. We, recognize that this is an ongoing process of scientific investigation and further work will allow continued, and possibly better, evaluation of these hypothesis and others.
Lee R Berger, Agustín Fuentes, John Hawks, Tebogo Makhubela
Works cited:
Aspöck, E. (2008). What Actually is a ‘Deviant Burial’?: Comparing German-Language and Anglophone Research on ‘Deviant Burials.’ In E. M. Murphy (Ed.). Deviant Burial in the Archaeological Record. Oxford: Oxbow Books. pp 17–34.
Bolliger, S.A. & Thali, M.J. (2009). Thanatology. In S.A. Bolliger and M.J. Thali (eds) Virtopsy Approach: 3D Optical and Radiological Scanning and Reconstruction in Forensic Medicine. Boca Raton: CRC Press. pp 187-218.
Boulestin, B. & Duday, H. (2005). Ethnologie et archéologie de la mort: de l’illusion des références à l’emploi d’un vocabulaire. In: C. Mordant and G. Depierre (eds) Les Pratiques Funéraires à l’Âge du Bronze en France. Actes de la table ronde de Sens-en-Bourgogne. Paris: Éditions du Comité des Travaux Historiques et Scientifiques. pp. 17–30.
Boulestin, B. & Duday, H. (2006). Ethnology and archaeology of death: from the illusion of references to the use of a terminology. Archaeologia Polona 44: 149–169.
Bristow, J., Simms, Z. & Randolph-Quinney, P.S. Taphonomy. In S. Black and E. Ferguson (eds.) Forensic Anthropology 2000-2010. Boca Raton, FL: CRC Press. pp 279-318.
Channing, J. & Randolph-Quinney, P.S. (2006). Death, decay and reconstruction: the archaeology of Ballykilmore Cemetery, County Westmeath. In J. O’Sullivan and M. Stanley (eds.) Settlement, Industry and Ritual: Archaeology. National Roads Authority Monograph Series No. 3. Dublin: NRA/Four Courts Press. pp 113-126.
Cherryson, A. K. (2008). Normal, Deviant and Atypical: Burial Variation in Late Saxon Wessex, c. AD 700–1100. In E. M. Murphy (Ed.). Deviant Burial in the Archaeological Record. Oxford: Oxbow Books. pp 115–130.
Connolly, M., F. Coyne & L. G. Lynch (2005). Underworld : Death and Burial in Cloghermore Cave, Co. Kerry. Bray, Co. Wicklow: Wordwell.
Darwent, C. M. & R. L. Lyman (2002). Detecting the postburial fragmentation of carpals, tarsals and phalanges. In M. H. Sorg and W. D. Haglund (eds). Advances in Forensic Taphonomy: Method, Theory and Archeological Perspectives. Boca Raton, FL, CRC Press. pp 355-378.
d’Errico, F., & Backwell, L. (2016). Earliest evidence of personal ornaments associated with burial: The Conus shells from Border Cave. Journal of Human Evolution, 93, 91–108.
De Villiers. H. (1973). Human skeletal remains from Border Cave, Ingwavuma District, KwaZulu, South Africa. Annals of the Transvaal Museum, 28(13), 229–246.
Dell’Unto, N. and Landeschi, G. (2022). Archaeological 3D GIS. London: Routledge.
Dibble, H. L., Aldeias, V., Goldberg, P., McPherron, S. P., Sandgathe, D., & Steele, T. E. (2015). A critical look at evidence from La Chapelle-aux-Saints supporting an intentional Neandertal burial. Journal of Archaeological Science, 53, 649–657.
Dirkmaat, D. C., & Cabo, L. L. (2016). Forensic archaeology and forensic taphonomy: basic considerations on how to properly process and interpret the outdoor forensic scene_. Academic Forensic Pathology_ 6, 439–454.
Dirks, P. H., Berger, L. R., Roberts, E. M., Kramers, J. D., Hawks, J., Randolph-Quinney, P. S., Elliott, M., Musiba, C. M., Churchill, S. E., de Ruiter, D. J., Schmid, P., Backwell, L. R., Belyanin, G. A., Boshoff, P., Hunter, K. L., Feuerriegel, E. M., Gurtov, A., Harrison, J. du G., Hunter, R., … Tucker, S. (2015). Geological and taphonomic context for the new hominin species Homo naledi from the Dinaledi Chamber, South Africa. ELife, 4, e09561.
Dirks, P.H.G.M., Berger, L.R., Hawks, J., Randolph-Quinney, P.S., Backwell, L.R., and Roberts, E.M. (2016). Comment on “Deliberate body disposal by hominins in the Dinaledi Chamber, Cradle of Humankind, South Africa?” [J. Hum. Evol. 96 (2016) 145-148]. Journal of Human Evolution 96: 149-153.
Dirks, P. H., Roberts, E. M., Hilbert-Wolf, H., Kramers, J. D., Hawks, J., Dosseto, A., Duval, M., Elliott, M., Evans, M., Grün, R., Hellstrom, J., Herries, A. I., Joannes-Boyau, R., Makhubela, T. V., Placzek, C. J., Robbins, J., Spandler, C., Wiersma, J., Woodhead, J., & Berger, L. R. (2017). The age of Homo naledi and associated sediments in the Rising Star Cave, South Africa. ELife, 6, e24231.
Donnelly, S., C. Donnelly & E. Murphy (1999). The forgotten dead: The cíllíní and disused burial grounds of Ballintoy, County Antrim. Ulster Journal of Archaeology 58, 109-113.
Duday, H. (2005). L’archéothanatologie ou l’archéologie de la mort. In: O. Dutour, J.-J. Hublin and B. Vandermeersch (eds) Objets et Méthodes en Paléoanthropologie. Paris: Comité des Travaux Historiques et Scientifiques. pp. 153–215.
Duday, H. (2009). Archaeology of the Dead: Lectures in Archaeothanatology. Oxford: Oxbow Books.
Finley, N. (2000). Outside of life: Traditions of infant burial in Ireland from cillin to cist. World Archaeology 31, 407-422.
Gargett, R. H. (1999). Middle Palaeolithic burial is not a dead issue: The view from Qafzeh, Saint-Césaire, Kebara, Amud, and Dederiyeh. Journal of Human Evolution, 37(1), 27–90.
Goldberg, P., Aldeias, V., Dibble, H., McPherron, S., Sandgathe, D., & Turq, A. (2017). Testing the Roc de Marsal Neandertal “Burial” with Geoarchaeology. Archaeological and Anthropological Sciences, 9(6), 1005–1015.
Gómez-Olivencia, A., & García-Martínez, D. (2019). New postcranial remains from the Roc de Marsal Neandertal child. PALEO. Revue d’archéologie Préhistorique, 30–1, 30–1.
Green, E.C. (2022). An archaeothanatological approach to the identification of late Anglo-Saxon burials in wooden containers. In C.J. Knüsel and E.M.J. Schotsmans (eds.) The Routledge Handbook of Archaeothanatology. London: Routledge. pp 436-455.
Henderson, J. (1987). Factors determining the state of preservation of human remains. In A. Boddington, A. Garland and R. Janaway (eds). Death, Decay and Reconstruction: Approaches to Archaeology and Forensic Science. Manchester: Manchester University Press. pp 43-54.
Hunter, J. R. (2014). Human remains recovery: archaeological and forensic perspectives. In C. Smith (ed). Encyclopedia of Global Archaeology. New York: Springer New York. pp 3549-3556.
Hochrein, M. (2002). An Autopsy of the Grave: Recognizing, Collecting and Preserving Forensic Geotaphonomic Evidence. In M. H. Sorg and W. D. Haglund (eds). Advances in Forensic Taphonomy: Method, Theory and Archeological Perspectives. Boca Raton, FL, CRC Press: 45-70.
Knüsel, C.K. & Robb, J. (2016). Funerary taphonomy: An overview of goals and methods. Journal of Archaeological Science: Reports 10, 655-673.
Kuhn, B.F., Berger, L.R. & Skinner, J.D. (2010). Examining criteria for identifying and differentiating fossil faunal assemblages accumulated by hyenas and hominins using extant hyenid accumulations. International Journal of Osteoarchaeology 20, 15-35.
Lyman, R. (1994). Vertebrate Taphonomy. Cambridge, Cambridge University Press.
Martinón-Torres, M., d’Errico, F., Santos, E., Álvaro Gallo, A., Amano, N., Archer, W., Armitage, S. J., Arsuaga, J. L., Bermúdez de Castro, J. M., Blinkhorn, J., Crowther, A., Douka, K., Dubernet, S., Faulkner, P., Fernández-Colón, P., Kourampas, N., González García, J., Larreina, D., Le Bourdonnec, F.-X., … Petraglia, M. D. (2021). Earliest known human burial in Africa. Nature, 593(7857), 7857.
Mickleburgh, H.L & Wescott, D.J. (2018). Controlled experimental observations on joint disarticulation and bone displacement of a human body in an open pit: implications for funerary archaeology. Journal of Archaeological Science: Reports 20: 158-167.
Mickleburgh, H.L., Wescott, D.J., Gluschitz, S. & Klinkenberg, V.M. (2022). Exploring the use of actualistic forensic taphonomy in the study of (forensic) archaeological human burials: An actualistic experimental research programme at the Forensic Anthropology Center at Texas State University (FACTS), San Marcos, Texas. In C.J. Knüsel and E.M.J. Schotsmans (eds.) The Routledge Handbook of Archaeothanatology. London: Routledge. pp 542-562.
Owsley, D. & B. Compton (1997). Preservation in late 19th Century iron coffin burials. In W. Haglund and M. Sorg (eds). Forensic Taphonomy: The Postmortem Fate of Human Remains. Boca Raton, FL, CRC Press: 511-526.
Parker Pearson, M. (1999). The Archaeology of Death and Burial. College Station: Texas A&M University Press.
Pettitt, P. (2013). The Palaeolithic Origins of Human Burial. Routledge.
Pomeroy, E., Bennett, P., Hunt, C. O., Reynolds, T., Farr, L., Frouin, M., Holman, J., Lane, R., French, C., & Barker, G. (2020). New Neanderthal remains associated with the ‘flower burial’ at Shanidar Cave. Antiquity, 94(373), 11–26.
Randolph-Quinney, P.S. (2013). From the cradle to the grave: the bioarchaeology of Clonfad 3 and Ballykilmore 6. In N. Brady, P. Stevens and J. Channing (eds.). Settlement and Community in the Fir Tulach Kingdom. Dublin: National Roads Authority Press. pp A2.1-48.
Randolph-Quinney, P.S., Haines, S. and Kruger, A. (2018). The use of three-dimensional scanning and surface capture methods in recording forensic taphonomic traces: issues of technology, visualisation, and validation. In: W.J. M. Groen and P. M. Barone (eds). Multidisciplinary Approaches to Forensic Archaeology. Berlin: Springer International Publishing, pp. 115-130.
Rendu, W., Beauval, C., Crevecoeur, I., Bayle, P., Balzeau, A., Bismuth, T., Bourguignon, L., Delfour, G., Faivre, J.-P., Lacrampe-Cuyaubère, F., Tavormina, C., Todisco, D., Turq, A., & Maureille, B. (2014). Evidence supporting an intentional Neandertal burial at La Chapelle-aux-Saints. Proceedings of the National Academy of Sciences, 111(1), 81–86.
Sandgathe, D. M., Dibble, H. L., Goldberg, P., & McPherron, S. P. (2011). The Roc de Marsal Neandertal child: A reassessment of its status as a deliberate burial. Journal of Human Evolution, 61(3), 243–253.
Silver, M. (2016). Conservation Techniques in Cultural Heritage. In E. Stylianidis and F. Remondino (eds) 3D Recording, Documentation and Management of Cultural Heritage. Dunbeath: Whittles Publishing. pp 15-106.
Schotsmans, E.M.J., Georges-Zimmermann, P., Ueland, M. and Dent, B.B. (2022). From flesh to bone: Building bridges between taphonomy, archaeothanatology and forensic science for a better understanding of mortuary practices. In C.J. Knüsel and E.M.J. Schotsmans (eds.) The Routledge Handbook of Archaeothanatology. London: Routledge. pp 501-541.
La ignorancia de los derechos colectivos
Un derecho implica necesariamente un deber para otro. Que un grupo social "A" tenga un derecho significa que el individuo u otro grupo social "B" tenga un deber respecto al primer grupo social "A". Si se otorgan derechos a grupos sociales se limita la libertad de otros, imponiendo su opinión o criterio de unos sobre otros. Si los derechos se aplican por igual a todos los individuos nadie se ve limitado ni se impone ninguna preferencia personal sobre nadie.
suele ignorar o no le confiere importancia política a los procesos de subjetivación, esos mecanismos mediante los cuales se produce la posición de cada uno en la estructura social.
Porque eso depende de lo que quiera hacer cada individuo. Y en esto, no debe meterse el Estado.
el individuo no antecede a la sociedad,
El liberalismo considera que núcleo básico y esencial de todo es el individuo. Según esto es la sociedad. Pero un individuo o una pequeña familia puede vivir sin una sociedad alrededor. De forma aislada. Por lo tanto esta premisa es falsa.
treating Anna O. and discovered that allowing her to talk about her experiences seemed to bring some relief of her symptoms. Anna O.
Isn't that what would now be known as therapy?
na medición de PSA a los 60 años
La concentración de PSA tiene una sensibilidad muy superior, pero la especificidad es baja porque trastornos como la hipertrofia benigna de próstata o la prostatitis pueden producir elevaciones falsamente positivas, usando un umbral para el PSA de 4 ng/ml se pueden detectar el 70-80 % de los tumores
o you slee
very nice
¿Ha publicado en revistas o repositorios de Acceso Abierto?
Esta la sacaría, se cruza con las respuestas de la primera pregunta
Planea considerar uno o más de los procedimientos de Ciencia Abierta mencionados con anterioridad al realizar sus propios estudios en un futuro próximo?: Preregistro de hipótesis (o declarar estudio explícitamente como exploratorio)
batería de preguntas ...
Usted ha sido invitado(a) a participar en la investigación Prácticas, creencias y conocimientos en Ciencia Abierta: propuestas para las ciencias sociales. Su objetivo es analizar el conocimiento, creencias y prácticas de ciencia abierta en académicos/as de ciencias sociales en Chile, lo que permitirá generar recomendaciones y propuestas tanto para el quehacer académico como para las políticas científicas. Usted ha sido invitado/a porque es profesor/a de planta ordinaria de alguna Facultad, Escuela, Instituto o carrera de ciencias sociales en Chile.
Tamaño letra
¿Qué tan familiarizado está con el concepto "Barreras de Pago" (o Pay Wall por su nombre en inglés?
Creo que esta no va acá
¿Ha utilizado alguno de estos elementos de Ciencia Abierta?
Estas preguntas se pueden presentar en formato grilla o cuadro? para no repetir los encabezados.
ta selecionando algum texto e clicando no botão
O trabalho em parceria e o suporte com foco na solução estão intimamente ligados, e é durante as fases de definição de metas e estratégias que a assistência com foco na solução se evidencia.
--------´´--------
Onde se encontra neste momento em relação a este tema? 2
Onde gostaria de estar? 7
Como se sentirá quando lá chegar? Seria fantástico, sentir-se-ia orgulhosa, diminuiria o stress do bebé. Vai notar uma evolução no filho, são novos hábitos e conhecimentos.
O que já fez para chegar onde está? (...e o que mais?...) Tenta perceber quais os alimentos que o bebé gosta e procura oferecer esses alimentos em vez daqueles que ele rejeita. A novidade leva muitas vezes à rejeição, é necessário tempo, persistência e paciência para a construção de novos hábitos alimentares.
Qual seria um número realista para alcançar como próximo passo na escala? 4
Quando lá chegar, o que estará a fazer de diferente…? A Clara poderá sentar-se à mesa e comer algo com ele, assim estará a fazer aquilo que gostaria que ele fizesse. As crianças são o reflexo dos pais, se os pais se juntarem a estas novas aventuras, todos vão evoluir.
… e o que o(a) ajudará a fazer isso? (…e o que mais?...) Participar nas refeições será bom para os dois. Se a Clara estiver a comer, não vai querer apressá-lo tanto, o que também será melhor. E se comerem todos ao mesmo tempo, deixa de estar tão preocupada com os horários dos mais velhos. Criando uma harmonia em casa.
O que irá notar que mudou? (…e o que mais?...) A aprendizagem. Vai ficar menos impaciente e frustrada e o bebé não vai chorar tanto. Vai ser mais fácil a introdução de certos alimentos, porque com o stress o bebé também fica stressado e acaba por dispersar do foco no momento, a alimentação.
O que sentirá em relação a estas mudanças? Ele irá aceitar melhor os novos alimentos, o que acaba por trazer menos preocupação, será um alívio. Novos hábitos, mais conhecimento, melhor crescimento e evolução.
Author Response
Reviewer #1 (Public Review):
In this study, Shin and colleagues investigate the role of the posttranslational modification of the DNA methyltransferase by covalent linkage of the N-Acetylglucosamine (O-GlcNAc).
The authors present compelling evidence showing that a prolonged high fat/sucrose diet causes global protein O-GlcNAcylation in the liver and DNMT1 is among the proteins that increase their O-GlcNAc level. This result is significant because of the paucity of in vivo data addressing the interplay between metabolism and protein O-GlcNAcylation. The paper also shows that DNMT1's O-GlcNAcylation level correlated to the extracellular glucose levels in other cell types.
Using mass spectrometry, the authors identify S878 as the main site for O-GlcNAcylation. It is noteworthy that the mapping was performed with hyper-O-GlcNAcylated cells and may be different in a physiological situation. To investigate how O-GlcNAcylation of S878 of DNMT1 impacts its activity and ultimately DNA methylation patterns, Shin and colleagues mostly use a cellular model of hyper O-GlcNAcylation induced by the combination of high glucose and a chemical inhibitor of OGA (the only enzyme responsible for O-GlcNAc removal). The data shows that increased O-GlcNAcylation resulting from the combination of high glucose and OGA inhibition causes a reduction of DNMT1 activity and local loss of DNA methylation specifically at partially methylated domains.
This study brings completely new knowledge on the regulatory function of glycosylation of DNMT1 and its impact on its methyl-transferase activity and downstream genomic methylation. Furthermore, the manuscript introduces new data on the interplay between cellular metabolism and O-GlcNAcylation on DNMT1 and other proteins. The experiments are well-controlled, and their interpretation is sound. This study should be of special interest to the fields of fundamental and environmental epigenetics, as well as metabolism.
The main limitation of the study is the convolution of the functional experiments where the perturbation is a combination of high glucose and chemical inhibition of OGA. The relative contribution of the two variables is partially addressed in Figure 3-figure supplement 1B which shows that high glucose increases DNMT1 activity (Hep3B cells) while Figure 3D shows that high glucose when combined with OGA inhibitor decreases DNMT1 activity (Hep3B cells). As discussed, the data suggest that high-glucose and OGA inhibition may have an antagonistic effect on DNMT1 activity. An experiment of treatment of the cells with the OGA inhibitor in physiological glucose conditions would address this gap of knowledge.
We thank the reviewer for the suggestion. The physiological glucose levels are between 5 to 7 mM, and 25mM is in hyperglycemic range, which corresponds to severe diabetes. The new Figure 1A shows TMG treatment with physiological glucose conditions. We have included new WB data of 5mM glucose, 5mM glucose + TMG, 25mM glucose, and 25mM glucose + TMG (Figure 1A).
To understand the impact of the environment (in this study: extracellular glucose level) on the epigenome, one should keep in mind the variation of cytosine methylation patterns between individuals and over time. A recent large-scale profiling of DNA methylation of 137 individuals shows a near absence of individual variation between replicates of the same cell type, suggesting that genomic methylation patterns are largely insensitive to the environment (https://doi.org/10.1038/s41586-022-05580-6).
Comparative methylomes of healthy and diabetic individuals are needed to examine the medical significance of the findings presented here. It is possible that the modulation of DNMT1 activity by O-GlcNAc modification is relevant for a specific cell type or developmental stage that remains to be discovered.
We thank the reviewer for the suggestion. While the present study is focused on the functional impact of glucose concentrations on O-GlcNAcylation of DNMT1, the extension of this work to diabetic individuals is a goal for a follow up project.
Reviewer #2 (Public Review):
I've read the manuscript by Shin et al with great interest. The authors describe the identification of O-GlcNAcylation of DNMT1 and the impact this modification has on the maintenance activity of DNMT1 genome-wide and that modification of S878 leads to enzyme inhibition. The manuscript is written in a clear and understandable way making it easy for the reader to understand the logic as well as the steps of the experimental approach.
The authors identify O-GlcNAcylation of DNMT1 in a number of different cell lines by combining inhibition studies and WB and further on they identify the modification sites with LC/MS, predictions, and mutational studies. I really like the experimental approach, which while being straightforward (albeit technically challenging), is powerful and well-controlled in this case to unequivocally prove the modification of DNMT1 and identify the site. However, mutation of the two identified modification sites does not remove all the O-GlcNAcylation signal associated with DNMT1, thus possibly not all the possible sites were identified. While this is not a criticism of this manuscript, it would be interesting to know what other sites are modified and the enzymatic/biological effects associated.
We completely agree with the reviewer. As the O-GlcNAc band was also detected in double mutated DNMT1 (Figure 2D), it is expected that undetected O-GlcNAcylated sites will exist. This is a limitation of current MS analysis and is known to be difficult to detect in the case of modified sites located at both 5’- and 3’- ends of the protein or around the site cut by endoprotease such as trypsin. In follow up work we plan to detect more diverse O-GlcNAc modified sites using more types of endoproteases and observe changes in the phenotype of various cells accordingly.
Also, the authors isolate the modified DNMT1 from cells using immunoprecipitation, which is indeed useful to study the changes in catalytic activity but does not provide any information if the cellular localisation of modified DNMT1 changes.
We apologize for this oversight. We have added a DNMT1 localization assay via immunofluorescence (IF) in the revised manuscript (Figure 3—figure supplement 3). We found no difference in DNMT1 localization between wild type and S878A mutants.
Subsequently, the authors checked the impact of high glucose diet on the genome-wide DNA methylation patterns. The observed effects (Fig 4A) are very strong, almost as strong as observed with Aza treatment and therefore I wonder if LINE/IAP or other elements are getting activated (as observed with genome-wide demethylation with Aza).
We thank the reviewer for the suggestion. Changes in methylation of LINE-1 by hyperglycemia condition are displayed in Figure 4—figure supplement 4. In the case of LINE-1, DNA methylation is lost globally in hyperglycemia conditions. While beyond the scope of this study, a more thorough examination of the impact of the observed loss of methylation under high glucose conditions is of interest.
Do the authors see any changes in cell phenotype, slower/faster proliferation, or increased apoptosis due to the activation of mobile elements (not only ROS)?
This is also a very interesting idea. We plan on further investigating this as part of a follow up study.
Another point is that the S878A mutant seems not to be able to fully maintain the DNA methylation (Fig 4A). Does O-GlcNAcylation recruit any additional interactors? Given that the authors immunoprecipitated DNMT1 and use it for activity assay, it is possible, that the modification attracts an additional protein factor that could in turn inhibit DNMT1 activity (as observed). Therefore, the observed kinetic effect could be indirect, while still interesting and important, the mechanism of inhibition would be different.
We thank the reviewer for the great suggestions. According to Figure 4A, in the case of mutated DNMT1, a slight methylation loss appears to occur in both conditions. There could be for a number of reasons. It may be due to interacting proteins or it may be caused by some damage of DNMT1 itself. A further investigation of this is planned as a follow up project.
DNA methylation clock can be used to estimate the biological age of a tissue/cells. While not directly in the line of the manuscript, I was wondering if the DNA methylation changes in the high glucose diet would affect the methylation sites used for the DNAme clock. Meaning, would the cells/tissue epigenetically age faster when in high glucose media, and if the Ala mutant could provide resistance to that?
We thank the reviewer for the interesting suggestion. We believe this is beyond the scope of this manuscript, but we'll consider this with interest in the future.
In discussion, the authors write that this is the first investigation of O-GlcNAcylation in relation to DNA methylation, while this is true for DNMTs, TET enzymes, that oxidise 5mC and trigger active DNA demethylation have been shown before to also be modified.
We have toned down the language throughout the revised manuscript. This is the first investigation into the maintenance of DNA methylation. Although there is a great deal of evidence regarding the important regulatory role of O-GlcNAcylation in gene regulation, a direct link with maintenance of DNA methylation has not previously been established.
A nice and rigorous study, with important observations and connections to biological effects. It would be nice to prove that the effects are direct and not associated with other factors that could be recruited by the modification and impact the activity of DNMT1. I find it a bit surprising that phosphorylation of the target serine does not impact DNMT1 activity as well.
We thank the reviewer for the positive comments and agree that there are many interesting avenues to follow up on this.
Reviewer #3 (Public Review):
The authors investigate the potential effect of OGlcNacylation on the activity of the DNA methyltransferase DNMT1.
Some results that are convincingly obtained include:
There is more overall OGlcNacylation when Glucose concentration in the culture medium or the feed is high;
DNMT1 is OGlcNacylated, and more so in high glucose or on rich chow;
The position S878 can be OGlcNacylated;
The activity of transfected DNMT1 is decreased in high glucose conditions. This effect is lessened when S878 is mutated to A or D.
Some results that are suggested but not fully backed by experimental data include:
- This process happens to the endogenous protein under physiologically relevant conditions;
We agree that we could not completely rule out endogenous DNMT1 in our experiments. We have adjusted the language in the revised manuscript to acknowledge this. However, we confirmed the change in activity of recombinant DNMT1 (Figure 3D), and also demonstrated the change in activity under physiological conditions (normal physiological glucose level vs hyperglycemic range) in Figure 3—figure supplement 1B. This is a result that directly shows that the activity of DNMT1 changes under physiological conditions. In addition, DNA hypomethylation due to high glucose has been previously reported, already (Kandilya et al., 2020; Lan et al., 2016). Our results suggest a possible mechanism for this.
Kandilya, D., Shyamasundar, S., Singh, D.K., Banik, A., Hande, M.P., Stunkel, W., Chong, Y.S., and Dheen, S.T. (2020). High glucose alters the DNA methylation pattern of neurodevelopment associated genes in human neural progenitor cells in vitro. Sci Rep 10, 15676.
Lan, C.C., Huang, S.M., Wu, C.S., Wu, C.H., and Chen, G.S. (2016). High-glucose environment increased thrombospondin-1 expression in keratinocytes via DNA hypomethylation. Transl Res 169, 91-101 e101-103.
- This process is responsible for changes in DNA methylation, leading to changes in gene expression, leading to increased ROS and increased apoptosis.
We confirmed that ROS levels increased under high glucose conditions through DCFH-DA fluorescence experiments (Figure 5A). In addition, γH2A.X fluorescence experiments showed that DNA damage was increased under high glucose conditions (Fig. 5B). On the other hand, in the case of the S878A mutant, DNA damage was reduced under hyperglycemic conditions compared to wild type DNMT1 despite an increase in ROS levels (Fig. 5B). Moreover, we verified that the DNA damage did not come from oxidative stress through 8-OHdG analysis (Figure 5—figure supplement 4). Therefore, DNA oxidative stress is suppressed by DNMT1 due to the increase of ROS under high glucose conditions. However, the reduction of DNA methylation by O-GlcNAcylation of DNMT1 induces apoptosis due to oxidative stress.
Studying the connection between cellular metabolism and epigenetic phenomena is interesting. However, I feel that the article falls short of its aims because of the limits of the experimental system, some missing controls, and some data overinterpretation.
We hope the reviewer finds our revised manuscript more suitable.
eLife assessment
This study explores the regulatory function of O-GlcNAcylation on DNA methyltransferase 1 and identifies serine 878 as the main target. This study is of interest to those in epigenetics and metabolism. The significance is important and the strength of the evidence is convincing.
Reviewer #1 (Public Review):
In this study, Shin and colleagues investigate the role of the posttranslational modification of the DNA methyltransferase by covalent linkage of the N-Acetylglucosamine (O-GlcNAc).
The authors present compelling evidence showing that a prolonged high fat/sucrose diet causes global protein O-GlcNAcylation in the liver and DNMT1 is among the proteins that increase their O-GlcNAc level. This result is significant because of the paucity of in vivo data addressing the interplay between metabolism and protein O-GlcNAcylation. The paper also shows that DNMT1's O-GlcNAcylation level correlated to the extracellular glucose levels in other cell types.
Using mass spectrometry, the authors identify S878 as the main site for O-GlcNAcylation. It is noteworthy that the mapping was performed with hyper-O-GlcNAcylated cells and may be different in a physiological situation. To investigate how O-GlcNAcylation of S878 of DNMT1 impacts its activity and ultimately DNA methylation patterns, Shin and colleagues mostly use a cellular model of hyper O-GlcNAcylation induced by the combination of high glucose and a chemical inhibitor of OGA (the only enzyme responsible for O-GlcNAc removal). The data shows that increased O-GlcNAcylation resulting from the combination of high glucose and OGA inhibition causes a reduction of DNMT1 activity and local loss of DNA methylation specifically at partially methylated domains.
This study brings completely new knowledge on the regulatory function of glycosylation of DNMT1 and its impact on its methyl-transferase activity and downstream genomic methylation. Furthermore, the manuscript introduces new data on the interplay between cellular metabolism and O-GlcNAcylation on DNMT1 and other proteins. The experiments are well-controlled, and their interpretation is sound. This study should be of special interest to the fields of fundamental and environmental epigenetics, as well as metabolism.
The main limitation of the study is the convolution of the functional experiments where the perturbation is a combination of high glucose and chemical inhibition of OGA. The relative contribution of the two variables is partially addressed in Figure 3-figure supplement 1B which shows that high glucose increases DNMT1 activity (Hep3B cells) while Figure 3D shows that high glucose when combined with OGA inhibitor decreases DNMT1 activity (Hep3B cells). As discussed, the data suggest that high-glucose and OGA inhibition may have an antagonistic effect on DNMT1 activity. An experiment of treatment of the cells with the OGA inhibitor in physiological glucose conditions would address this gap of knowledge.
To understand the impact of the environment (in this study: extracellular glucose level) on the epigenome, one should keep in mind the variation of cytosine methylation patterns between individuals and over time. A recent large-scale profiling of DNA methylation of 137 individuals shows a near absence of individual variation between replicates of the same cell type, suggesting that genomic methylation patterns are largely insensitive to the environment (https://doi.org/10.1038/s41586-022-05580-6).
Comparative methylomes of healthy and diabetic individuals are needed to examine the medical significance of the findings presented here. It is possible that the modulation of DNMT1 activity by O-GlcNAc modification is relevant for a specific cell type or developmental stage that remains to be discovered.
Reviewer #2 (Public Review):
I've read the manuscript by Shin et al with great interest. The authors describe the identification of O-GlcNAcylation of DNMT1 and the impact this modification has on the maintenance activity of DNMT1 genome-wide and that modification of S878 leads to enzyme inhibition.<br /> The manuscript is written in a clear and understandable way making it easy for the reader to understand the logic as well as the steps of the experimental approach.
The authors identify O-GlcNAcylation of DNMT1 in a number of different cell lines by combining inhibition studies and WB and further on they identify the modification sites with LC/MS, predictions, and mutational studies. I really like the experimental approach, which while being straightforward (albeit technically challenging), is powerful and well-controlled in this case to unequivocally prove the modification of DNMT1 and identify the site. However, mutation of the two identified modification sites does not remove all the O-GlcNAcylation signal associated with DNMT1, thus possibly not all the possible sites were identified. While this is not a criticism of this manuscript, it would be interesting to know what other sites are modified and the enzymatic/biological effects associated.
Also, the authors isolate the modified DNMT1 from cells using immunoprecipitation, which is indeed useful to study the changes in catalytic activity but does not provide any information if the cellular localisation of modified DNMT1 changes. Subsequently, the authors checked the impact of high glucose diet on the genome-wide DNA methylation patterns. The observed effects (Fig 4A) are very strong, almost as strong as observed with Aza treatment and therefore I wonder if LINE/IAP or other elements are getting activated (as observed with genome-wide demethylation with Aza). Do the authors see any changes in cell phenotype, slower/faster proliferation, or increased apoptosis due to the activation of mobile elements (not only ROS)? Another point is that the S878A mutant seems not to be able to fully maintain the DNA methylation (Fig 4A). Does O-GlcNAcylation recruit any additional interactors? Given that the authors immunoprecipitated DNMT1 and use it for activity assay, it is possible, that the modification attracts an additional protein factor that could in turn inhibit DNMT1 activity (as observed). Therefore, the observed kinetic effect could be indirect, while still interesting and important, the mechanism of inhibition would be different.
DNA methylation clock can be used to estimate the biological age of a tissue/cells. While not directly in the line of the manuscript, I was wondering if the DNA methylation changes in the high glucose diet would affect the methylation sites used for the DNAme clock. Meaning, would the cells/tissue epigenetically age faster when in high glucose media, and if the Ala mutant could provide resistance to that?
In discussion, the authors write that this is the first investigation of O-GlcNAcylation in relation to DNA methylation, while this is true for DNMTs, TET enzymes, that oxidise 5mC and trigger active DNA demethylation have been shown before to also be modified.
A nice and rigorous study, with important observations and connections to biological effects. It would be nice to prove that the effects are direct and not associated with other factors that could be recruited by the modification and impact the activity of DNMT1. I find it a bit surprising that phosphorylation of the target serine does not impact DNMT1 activity as well.
“Utter the Word of Majesty and Terror! True without lie, and certain without error, And of the essence of The Truth. I know The things above are as the things below, The things below are as the things above, To wield the One Thing's Thaumaturgy – Love. As all from one sprang, by one contemplation, So all from one were born, by permutation. Sun sired, Moon bore, this unique Universe; Air was its chariot, and Earth its nurse. Here is the root of every talisman Of the whole world, since the whole world began. Here is the fount and source of every soul. Let it be spilt on earth! its strength is whole. Now gently, subtly, with thine Art conspire To fine the gross, dividing earth and fire. Lo! it ascendeth and descendeth, even And swift, an endless band of earth and heaven; Thus it receiveth might of duplex Love, The powers below conjoined with those above, So shall the glory of the world be thine And darkness flee before thy SOVRAN shrine. This is the strong strength of all strength; surpass The subtle and subdue it; pierce the crass And salve it; so bring all things to their fated Perfection: for by this was all created. [196] O marvel of miracle! O magic mode! All things adapted to one circling code! Since three parts of all wisdom I may claim, Hermes thrice great, and greatest, is my name. What I have written of the one sole Sun, His work, is here divined, and dared, and done.”
it might be worth comparing this with the ordinary versions
Connors, M. H., & Halligan, P. W. (2015). A cognitive account of belief: A tentative road map. Frontiers in Psychology, 5. https://www.frontiersin.org/articles/10.3389/fpsyg.2014.01588
r. Ainsi, o
, permettant de montrer
Stadtmüller (1894) s’oppose à Hecker et il écrit en paratexte que au CP23 on lit ἄν ϑέσιν. Ainsi, dans son texte Stadtmüller écrit ἄνθεσιν ἐν χλοερoῖς, tel quel Waltz. Et le nom ἄνθος, εος-ους (τὸ) – « fleur » – remplace ἅψος.
S. s'y oppose, indiquant dans son édition le lecture ἄν ϑέσιν dans le codex palatinus graecus 23 et établissant donc le texte comme suit : ... Il sera repris par Waltz.
et supprimer la phrase Et le nom...
Δωρίδα τὴν ῥοδόπυγον ὑπὲρ λεχέων διατείνας ἄνθεσιν ἐν χλοερoῖς ἀθάνατος γέγονα.
Pas la peine de le réécire je dirais, tu le cites au-dessus.
L'édition de Stadtmüller (1984) ainsi que la deuxième édition de Paton (2014) sont semblables à l'établissement de Waltz indiqué ci-dessus. La première édition de Paton (1916), par contre, indiquait plutôt ceci :
Note: This rebuttal was posted by the corresponding author to Review Commons. Content has not been altered except for formatting.
Learn more at Review Commons
We thank the reviewers for their insights and comments on this manuscript. Specific responses to reviewer concerns are detailed below. We made a couple of significant changes based on the feedback. First, we performed more experiments to increase biologic replicates and then quantified image data for multiple figures. The new quantitative information added to Figure 3 fully supports our original conclusions about changes to the ONH in Hes-TKO mutants. The quantification of Atoh7, Otx2, Rbpms and Crx expressing cells among the different genotypes revealed interesting differences in Notch intracellular gene requirements for both RGC and cone development. The most startling outcome is that changes in both cell types correlate with significant changes in Otx2, but not Atoh7. This singular finding suggests interesting future work is needed, well beyond the scope of this paper about the molecular mechanisms underlying these cell fates. Second, our data presentation was reorganized with new information added to Fig 1 that clarifies the relationships between Hes1, Hes5, Foxg1 and Pax2; old Figs 6 & 7 about neurogenesis were merged; and some data moved to new Suppl Figs 2 and 5. The numbering for multiple figures changed and a new summary model (now Fig 8) is provided. In addition, the manuscript was completely rewritten to improve clarity. We hope this revised manuscript is acceptable for publication.
Reviewer #1 Summary:
In this study, the authors employed an impressive set of mouse mutant or Cre lines to investigate the complexity of Notch signaling across different stages of retinal development. These comprehensive analyses led to two main findings: 1. Sustained hes1 in the OHS/OS is Notch-independent; 2. Rbpj and Hes1 exhibited opposing roles in cone photoreceptor development. Although the study is potentially interesting, the current manuscript needs the essential research background and quantification, a lack of which significantly reduced the clarity of the manuscript and the credibility of the major conclusions. Also, how the authors organized the results is quite confusing, making the manuscript very difficult to follow.
Response: We agree with all reviewers concerning incomplete quantification of the data. We directly addressed this shortcoming in revised Figs 3 and 6 (the latter combines old Figs 6 +7). To do this, we repeated some IHC experiments to add more replicates and reorganized all of the neurogenesis phenotypic data figures. Our quantifications uncovered several surprising outcomes that clarify our model. For these reasons, the manuscript was exhaustively rewritten. We merged E13 neurogenesis data into revised Figure 6 and moved the most relevant E16 analyses to new supplemental data Fig 5. All changes made should make the paper easier to understand for retinal development, neurogenesis, and Notch pathway aficionados, in addition to readers lacking such expertise.
Major comments: 1. The authors needed to make the quantification for many analyses to strengthen the conclusions, such as Fig. 1F, 1G, and etc.
Response: We quantified optic nerve head (ONL) immunohistochemistry data in the revised Fig 3. We also quantified neurogenesis markers Atoh7, Otx2, Rbpms (RGCs), and Crx at E13 in revised Fig 6 (former Figs 6 and 7). Older stages were moved to a new Suppl Fig 5.
Respectfully, Hes5 mRNA expression in old Fig 1F and 1G shows that Hes5, like other retinal progenitor cell (RPC) markers, expanded in Rax-Cre deletion but not Chx10-Cre deletion conditions. This is analogous to Pax6 and Rax expansion in Rax-Cre;Hes1 CKO eyes and Pax2 mutants (doi: 10.1523/JNEUROSCI.2327-19.2020) (1). In revised Fig 1, we now show analogous expansion of Hes5 mRNA in Pax2 mutant retinas (compare Figs 1F-1I). Because Hes5 RNA in situ hybridization experiments are nonquantitative, we do not discuss the possibility of Hes5 mRNA level changes in labeled cells.
The authors reported many exciting results. However, further mechanistic insights are largely missing. They may focus on one of these exciting findings and give some mechanistic insights. For example, hes1 suppresses hes5 expression as the ONH boundary forms; hes1 expression in the ONH is Notch independent; differential influences of Rbpj and Hes1 on cone development. It is better for the authors to select one of these exciting findings and provide a deeper mechanistic study.
Response: This revision brings fresh focus to Notch regulation of RGC and photoreceptor development, particularly differential influences for Rbpj versus Hes1. We also better support our interpretation of image data in Fig 1. We include new data about the spatial relationships between Hes5-GFP/Pax2 and Hes5-GFP/Foxg1. In summary, we find that as Pax2 becomes restricted to the nasal optic cup prior to the onset of RGC genesis, it becomes mutually exclusive with Hes5-GFP, at the same time that Hes5-GFP+ cells coexpress Hes1. This is consistent with Hes1 indirectly regulating Hes5-GFP as a marker of neurogenic RPCs at the forming ONH. Furthermore, it emphasizes the importance of genetically teasing apart the separate and potentially compensatory roles for Hes1 versus Hes5 undertaken here. These relationships remain poorly resolved during vertebrate CNS development.
Some analyses lack an explanation of the rationale. For example, "To understand if the loss of multiple Hes genes is more catastrophic than Hes1 alone..."(PAGE 7). Please explain its significance.
Response: We assume the reviewer is referring to the first sentence of the last paragraph on this page. We analyzed Hes triple mutant mice (TKO) to understand if removing multiple Hes genes reveals redundant functions. This is an open question, given that Hes1 is expressed in the ONH/OS, which is normally devoid of Hes5 by the time retinal neurogenesis begins. These questions have only been explored in a handful of tissues throughout the body. Also see response to point 2 above. In general, we have expanded the rationale for all of the experiments throughout the revised manuscript.
Significance: In general, many results are quite interesting. However, the significance of these findings is largely hampered in the following aspects: 1. The authors were unable to provide the sufficient research contexts that are essential for understanding many results.2. Many conclusions were solely based on descriptive images but lacked statistical quantification, which significantly weakened many conclusions. 3. Many interesting findings are quite descriptive, and some mechanistic understandings of one of these exciting findings will be beneficial to improve the focus and significance of the study. Current format of the manuscript fits more specialized audience.
Response: During in vivo development, we wished to understand which particular Notch pathway genes can interact in a Notch-dependent versus a Notch-independent manner. Genetic (phenotypic) studies produce extremely rigorous datasets, in our opinion. This revision now extensively quantifies key findings. Here we dissected the "receipt" of a Notch signal by identically testing the functional requirements of particular pathway members. For Mastermind (Maml), there are 3 paralogues, double mutants for Maml1 and Maml3 are early lethal, and no floxed alleles exist, so it was logical to employ the ROSA-dnMaml mouse strain, particularly since it has been discussed throughout the Notch literature as "analogous" to removing either a Notch receptor or Rbpj. Our finding that the dnMAML allele does not function like a Rbpj null in the retina is important for researchers in the broad Notch field to consider when designing and interpreting experiments.
Reviewer #2: Hes genes are effectors of the Notch signaling pathway but can also act down-stream of other signaling cascades. In this manuscript the authors attempt to address the complexity of Hes effectors during optic cup development and retinal neurogenesis. To do so, they compared optic cup patterning and retinal neurogenesis in seven germline or conditional mutant mouse embryos generated with two spatio-temporally distinct Cre drivers. These lines allowed for the analysis of the consequences of perturbing the Notch ternary complex and multiple Hes genes alone or in combination. The authors show that the optic disc/nerve head is regulated by Notch independent Hes1 function. They also confirm that perturbation of Notch signaling interferes with cell proliferation enhancing the production of differentiated ganglion cells, whereas photoreceptor genesis requires both Rbpj and Hes1 with Notch dependent and independent mechanisms. This is a rather complex study that dissects further the role of the Notch pathway and Hes proteins during eye development, a topic that has been addressed in many previous studies but perhaps not with the details that the authors have used here. In this respect, this study adds to current literature but will likely be of interest to retina aficionados. The manuscript reads well and the figures are of very good quality. However, many of the statements are based on qualitative rather than on quantitative analysis. This should be, at least in some cases, remediated, despite the effort that this may require given the number of mouse lines used in the study.
Response: As described in the response to Reviewer 1, we agree and present considerably more quantification data. We extensively reorganized and rewrote this manuscript to emphasize that Hes1 in the ONH/OS is fully Notch-independent and highlight branchpoints in Notch-dependent signaling, for Rbpj versus Hes,1 during early retinal neurogenesis. It is too simplistic that the ternary complex (Rbpj-NICD-Maml) simply activates Hes1 (and/or multiple Hes genes) to regulate downstream signaling targets. This paradigm has been portrayed in the literature numerous times for many processes throughout vertebrate development, homeostasis or relative to particular diseases. By focusing on one tissue and a narrow window of development, our phenotypic studies delved more deeply to show the greater complexity and molecular cross-talk that we think underlie the modulation of signaling levels with in vivo context. Thus, our results are of broad interest and impact to the greater Notch field.
The title is somewhat misleading. The authors have explored mostly the role of Hes1, 3 and5. Although these are Notch effectors, there is already evidence that they participate in other pathways This is confirmed by the data present here. I would suggest to eliminate Notch from the title and use instead "Hes" to better reflect the findings. Furthermore, it is unclear why there is a reference to "mutations" or what are the Notch branchpoints to which the authors refer at the beginning of the discussion.
Response: We appreciate the reviewer’s viewpoint but disagree this paper is mostly about Hes genes, as there is a critical direct, comparable evaluation with Rbpj and dn-Maml. Direct comparison of 7 genotypes highlights where each pathway member exhibits idiosyncratic phenotypes. We are striving for a clear, simple title about a very complex topic, involving the in vivo genetic dissection of a signaling pathway. We modified the title to: "Notch pathway mutations do not equivalently perturb mouse embryonic retinal development "
- "Although the Pax6-Pax2 boundary is intact in Rax-Cre;RbpjCKO/CKO eyes, ONH shape was attenuated compared to controls (Fig 3I)". This statement is arguable as the difference seems subtle. Perhaps some kind of quantification would help.
Response: We quantified Pax2+ cells (ONH domain) using the adjacent proximal terminus of the retinal pigmented epithelium (RPE) to indicate a transition from ONH to optic stalk (OS). We also quantified the number of Pax2+Pax6+ double positive cells where the 2 domains abut (boundary cells). Some higher magnification examples are now provided in Fig 3H';3K';3N'. Grossly, the imaging data support that the Pax2+ ONH is expanded in Chx10-Cre;TKO eyes, while boundary cells are most affected in Rax-Cre;HesTKO eyes, due to an expansion of retinal tissue. This is supported by our quantitative data (Fig 3O,3P). We observed even in controls that Pax2-expressing cells show some numerical variability. We attributed this to the position of the section through the ONH, which is a 3-dimsenional ring (torus). Therefore, we quantified additional wild-type controls and mutant samples in the new Fig 3O,3P graphs, improving statistical power, and allowing us to detect quantitative differences.
Page 12 first paragraph. "....but all other genotypes were unaffected". This statement is unclear. All lines in which the Rax-Cre has been used seem to have an increased number of apoptotic cells. This should be better explained
Response: Respectfully, only one genotype, Rax-Cre;Rbpj mutants contain a statistically significant increase in apoptotic cells (Fig 5P). This is demonstrated by one-way ANOVA analyses that included all pairwise comparisons. To ensure that the quantification was not misleading due to changes in tissue morphology, data in Figs 5, 6, and 7 were normalized to optic cup area. The area was traced in FIJI, creating a polygon whose area was determined in square microns. For every section image, the marker+ cells were divided by the square micron area of the retina (excluding the opening for the optic nerve). Such a method is critical for comparison across this allelic series, given the morphologic changes, differences in cell clustering where rosettes form, and reduced proliferation whenever Notch signaling is lost or reduced.
Page 12, end of second paragraph: "E13.5 Chx10-Cre;HesTKO eyes had a milder RGC phenotype (Figs 6G, 6N, 6U), but all other mutants were unaffected (Figs 6E, 6F, 6L, 6M, 6S, 6T). This statement is also rather subjective. The phenotype of Chx10-Cre;HesTKO is quite strong and the other mutants seem to have a phenotype. Some quantifications here will help.
Response: We agree and provide quantification for both Atoh7 and Rbpms positive cells in the revised Figure 6. This is now in the same figure with quantification of Otx2+, Otx2+Atoh7+ and Crx+ cells. The reviewer is correct that both ROSA-dnMaml and both HesTKO mutants have a statistically significant increase in RGCs. Surprisingly, neither of the Rbpj CKO mutants have this outcome (Fig 6Y).
- Page 13, toward the bottom..."...but noted that Chx10-Cre RbpjCKO/CKO eyes were not different from controls (Figs 7E, 7AA)". Again, this statement is questionable as staining for both CRX and Rbpms seem reduced as compared to controls as quantifications in 7AA seems also to indicate (about half?). Did the authors calculate whether there is a statistical difference between controls and Chx10-Cre RbpjCKO/CKO ?
Response: Rbpms+ RGCs and Crx+ photoreceptor precursors were colabeled and quantified on sections for all genotypes. All counts were normalized to area as described above. Upon quantification and ANOVA with pairwise comparisons, there was no statistical difference in Crx+ or Rbpms+ cells between control and Chx10-Cre;Rbpj mutants (new Fig 6Y and Z).
In Fig 7CC the authors should make the effort of including at least one additional sample, 2 biological replicates seem insufficient to draw a conclusion.
Response: The Rax-Cre;Hes1CKO/+ X Hes1CKO/CKO matings stopped producing litters in late 2022. While this manuscript was out for review, we obtained younger mice, from which new control and Rax-Cre; Hes1 mutant littermates were collected, stained, imaged and quantified. Upon adding samples, we found that the outcome was unchanged, but the data better support the lack of a statistical difference in rods between genotypes at E17. These data were moved to revised Suppl Fig 5.
Significance: This is a rather complex study that dissects further the role of the Notch pathway and Hes proteins during eye development, a topic that has been addressed in many previous studies but perhaps not with the details that the authors have used here. In this respect, this study adds to current literature but will likely be of interest to retina aficionados. The manuscript reads well and the figures are of very good quality. However, many of the statements are based on qualitative rather than on quantitative analysis. This should be, at least in some cases, remediated, despite the effort that this may require given the number of mouse lines used in the study.
Response: To increase the impact of our manuscript, we quantified all markers except Tubb3, since its localization in cell bodies and axons make it impossible to assign to individual cells. We feel that this additional quantification strongly improves the quality of our findings and allowed us to make well-supported and novel conclusions. While we certainly believe that the retinal development community will find this paper of interest, it will also be of value to the broader Notch pathway scientific community. In this manuscript, we simultaneously compared phenotypes for Notch pathway genes in signal receiving cells. We could find essentially no studies like this for the mouse CNS and only a few from the Kopan lab about the kidney and immune system. Interestingly, one of us (NLB) is a coauthor on a recent paper about Notch signaling in the cortex, in which ROSA-dnMaml behaves analogously to Notch1CKO or RbpjCKO. This emphasizes that findings in one organ may not recapitulate the "rules" for this pathway for other cell types or tissues (doi: 10.1242/dev.201408)(2). Deeper understanding of how the Notch pathway in the retina functions, analogously or differently, is important. We feel our revised study advances when and where there are "branchpoints" in canonical signaling that may be overlooked in other developing tissues and organs.
Reviewer #3: I have reviewed a manuscript submitted by Bosze et al., which is entitled "Not all Notch pathway mutations are equal in the embryonic mouse retina". The authors focused on Notch signaling pathway. Notch signaling is deeply conserved across vertebrate and invertebrate animal species: in general, two transmembrane proteins, Delta and Notch, interact as a ligand and a receptor, respectively, which induces proteolytic cleavage of Notch receptors to generate Notch intracellular domain (NICD). NICD is translocated into nucleus, then forms the transcription factor complex including Rbpj (also referred to as CBF1) and Mastermind-like (Maml), and activates the transcription of Hes family transcription factors. Three Hes proteins, Hes1, 3, and 5, are important for nervous system development. In the vertebrate developing retina, these Hes proteins inhibit neurogenesis to maintain a pool of neural progenitor cells. In addition to their primary role in neurogenesis, the authors recently reported that Hes1 promotes cone photoreceptor differentiation. In the later stages of development, Hes proteins also promote Müller glial differentiation. In addition, Hes1 is highly expressed in the boundary between the neural retina and optic stalk and required for this boundary maintenance. To understand precise regulation of Notch component-mediated signaling network for retinal neurogenesis and cell differentiation, the authors compared retinal phenotypes in the knockdown of three Notch pathway components, that is (1) Hes1/3/5 cTKO, (2) Rbpj KO, and (3) dominant-negative Maml (dnMaml) overexpression, under the control of two Cre derivers; Rax-Cre and Chx10-Cre. First, the authors found that Hes1 expression in the boundary between optic stalk and neural retina is lost in Rax-Cre; Hes1/3/5 cTKO, but still retained in Rax-Cre; Rbpj KO and Rax-Cre; dnMaml overexpression, suggesting that Delta-Notch interaction is not required for Hes1 expression in the boundary between optic stalk and neural retina. Furthermore, Hes1 expressing boundary region expands distally at the expense of the neural retina in Chx10-Cre; Hes1/3/5 cTKO. Maintenance of ccd2 expression in this expanded boundary area suggests that Hes1 normally maintains a proliferative state in the optic stalk, which may allow these cells to differentiate into astrocyte in later stages. Second, in addition to precocious RGC differentiation in all the Notch component KO, the authors found that, as compared with wild-type, cone and rod photoreceptor genesis is highly enhanced in Rax-Cre; Rbpj KO and Rax-Cre; dnMaml overexpression and mildly enhanced in Chx10-Cre; dnMaml overexpression. On the other hand, in Rax-Cre; Hes1/3/5 cTKO, cone and rod photoreceptor genesis is not enhanced but similar to wild-type level. Since the authors previously reported that cone genesis is reduced in Rax-Cre; Hes1 cKO and Chx10-Cre; Hes1 cKO, so Rax-Cre; Hes1/3/5 cTKO may rescue decrease in cone genesis in single Hes1 cKO. The authors raise the possibility that elevated Hes5 expression in single Hes1 cKO may suppress cone photoreceptor genesis. The authors also found that amacrine cell genesis is significantly suppressed in Rax-Cre; Rbpj KO but not changed in Rax-Cre; dnMaml overexpression and Rax-Cre; Hes1/3/5 cTKO, suggesting that Rbpj is specifically required for amacrine cell genesis. From these observations, the authors propose that there are at least two branchpoints for photoreceptor and amacrine cell genesis in Notch component-mediated signaling network. Their findings are very interesting and provide some new insight on how Notch signaling components are integrated into other signaling pathways and promote to generate diverse but well-balanced retinal cell-types during retinal neurogenesis and cell differentiation, in addition to conventional classic view of Notch signaling pathway. However, one weak point is that, although the authors figured out what kinds of phenotypic difference appear in the KO retinas between these Notch components, the research result is descriptive and less analytical. Most of their conclusions may be supported by their previous works or others; it is still hypothetical. So, it is important to show more analytical data to support their interpretation and more clearly show what is new conceptual advance for Notch signaling pathways.
For example, sustained Hes1 expression in the boundary region between optic stalk and neural retina may be reminiscent to brain isthmus situation. I would like to request the authors to show more direct evidence that Hes1 regulation in optic stalk/retina boundary is independent of Delta-Notch interaction. One possible experiment is whether DAPT treatment phenocopies Rax-Cre; Rbpj KO and Rax-Cre; dnMaml overexpression (Hes1 in optic stalk boundary is normal?).
Response: Usage of the gamma secretase inhibitor DAPT is an interesting experiment as it can phenocopy the loss of Notch signaling in developing tissues. However, the reviewer's proposed DAPT experiment is problematic for two major reasons. First, DAPT blocks the gamma secretase complex, which has more than 90 protein targets in the cell membrane (3). Therefore, DAPT may not be informative for Hes1 regulation given the myriad of expected off-target effects. Second, it would be difficult to treat embryos at the relevant stages with DAPT. Injections into pregnant mice are lethal and we cannot localize drug to the relevant area during in vivo development. Our direct phenotypic comparisons with two Cre drivers strongly indicate that Hes1 is independent of canonical Notch signaling in the developing optic stalk.
We include an extra related data figure (Reviewer Fig 1) showing anti-Hes1 immunolabeling of E13.5 Rax-Cre;Notch1CKO/CKO (n=2) and E13.5 Rax-Cre;Notch2CKO/CKO eyes (n=3). The Notch1 mutant lost oscillating Hes1 expression in retinal progenitors, but the uniform Hes1 ONH domain remains. Interestingly, the Notch2 mutant had essentially no effect on Hes1 (oscillating or sustained), or Hes5 mRNA expression. A Notch2 RNA in situ hybridization demonstrates that Notch2 mRNA was lost in the E13 optic cup and RPE (Rax-Cre expressing tissues). These data emphasize: A) the Notch1-specific dependency of oscillating Hes1 expression in retinal progenitors is absent from the ONH; B) although coexpressed in the same tissue, Notch receptors have unequal activities.
Does Rax-Cre; Rbpj KO; Hes1-cKO phenocopy Rax-Cre; Hes1-cKO (or Rax-Cre; Hes1/3/5 cTKO)?
Response: This is a good question! The first author tried very hard to produce Rax-Cre; Rbpj CKO;Hes1 CKO double mutant embryos. However, these progeny could not be recovered from E10-E13 embryos, despite collecting more than 10 litters. Thus, it is likely that this genotype is lethal before eye formation.
Could the authors identify an enhancer element that drives Hes1 transcription in optic stalk/retina boundary, which should be not overlapped with that of NICD/ Rbpj binding motif? Such additional evidence will make their conclusion more convincing.
Response: Another interesting question. We have been working for >3 years on Hes1 cis regulatory enhancers, but the pandemic greatly delayed progress. The proximal Hes1 600bp upstream region is a generic enhancer that contains Hes1 binding sites for repressing its own expression (4) and has a pair of Rbpj consensus sites for Notch ternary complex activation of Hes1 expression (5,6). Nearby is a binding site occupied by Gli2 in the E16 mouse retina (7). Recently, it was shown that Ikzf4 binds slightly farther away (8). The upstream 1.8 kb region (including the 600bp just described) can drive destabilized GFP or dsRed reporters in early postnatal retinal explants (9). However, this sequence was used to make and analyze a classic Hes1-GFP transgenic reporter mouse, in which GFP was not expressed in the early embryonic mouse optic vesicle or cup (10). Therefore, any early eye-specific enhancer(s) are located farther upstream, in an intron, or downstream (or combination thereof). Public domain epigenetic and chromatin accessibility datasets support this idea. Identifying the gene regulatory logic for Hes1 expression in the eye will be an exciting future story, well beyond this manuscript. We are excited to use live imaging of enhancer reporters to discern oscillating versus sustained activity patterns during early ocular development.
Regarding the conclusion on new branchpoints on photoreceptor and amacrine cell genesis, a model shown in Figure 9 is still hypothetical. Figure 9B indicate a model in which the increase of Otx2+ cells and Crx+ cells in Rax-Cre; Rbpj KO is mediated by Hes1, which is presumed to be activated in Notch-independent signaling. However, Hes1 expression in the neural retina is markedly reduced in Rax-Cre; Rbpj KO (Fig. 2I), which does not fit in with the model.
Response: We removed Fig 9B and now present new models about the Notch-dependent versus -independent roles for both Rbpj and Hes1. The new summary is Fig 8.
So, I would like to request the authors to examine whether the increase of Otx2+ cells and Crx+ cells in Rax-Cre; Rbpj KO, (or Rax-Cre; dnMaml overexpression and Chx10-Cre; dnMaml overexpression) is inhibited by Hes1 KO.
Response: If we understand this correctly, it would mean generating double mutants, some of which we determined are not viable (see the response above, and Suppl Table 2). Given there is only a partial knockdown of Hes1 or Hes5 in either dnMaml mutant we do not believe repeating this in the Hes1 CKO genetic background to be informative and it would take 3 generations to perform.
Second, the authors concluded that both cone and rod genesis are enhanced in Rax-Cre; Rbpj KO by showing the data on Crx/Nr2e3 labeling in Rax-Cre; Hes1 cKO in Fig. 7BB. However, as the authors mentioned in the manuscript, Hes5 expression is elevated in Rax-Cre; Hes1 cKO (Fig. 1G). So, since Rax-Cre; Hes1 cKO has residual Hes activity in the retina, Fig. 7BB should be replaced with labeling of Crx/Nr2e3 in Rax-Cre; Hes1/3/5 cTKO.
Response: Unfortunately, Rax-Cre;HesTKO embryos do not live past E13 (Suppl Table 2). Thus, we cannot evaluate rods, whose genesis starts around E13.5. Revised Fig 1G shows the Hes5 domain is shifted with the expansion of retinal tissue in E13.5 Hes1 single mutants, but importantly, also analogously shifted in Pax2 mutants (Fig 1H). We do not conclude that mRNA levels are "elevated" since mRNA in situ hybridization is not a quantitative technique. Our initial examination of rods in E17 Rax-Cre;Hes1 CKO mutants tested the idea of a fate shift from cones to rods. However, deeper quantification (Suppl Fig 5) do not support such a fate change.
Furthermore, possibly, it is best to examine labeling of the retinas of Rax-Cre; Rbpj KO with rod and cone-specific markers and confirm that the number of both rods and cones is significantly increased. Third, as for defects in amacrine cells genesis in Rax-Cre; Rbpj KO, I would like to request the authors to show the data on Crx10-Cre; Rbpj KO. Although Rbpj KO is mosaic in Crx10-Cre; Rbpj KO, we can distinct Rbpj KO cells by GFP expression (Fig. S2C, C', C'). So, the authors can confirm that amacrine cell genesis is inhibited in a cell-autonomous manner in Crx10-Cre; Rbpj KO retinas but not in Crx10-Cre; dnMaml overexpression. Addition of such data will make the authors' conclusion is more convincing.
Response: Suppl Table 1 lists multiple references (two from the NLB lab) that demonstrated both a rod and cone increase in Rbpj loss-of-function conditions. Chx10;Rbpj CKO animals were evaluated by Zheng et al., who showed an amacrine loss phenotype in these mutants (11). This is equivalent to what we see in our Rax-Cre;Rbpj CKO data, but without the complications of Chx10 mosaic Cre expression upon Rbpj deletion.
Other comments: 1) Title of this manuscript is "Not all Notch pathway mutations are equal in the embryonic mouse retina". However, this title is quite obscure in what is research advancement of their findings. I suggest the authors to include more concrete and conclusive sentence in the title, for example "Hes and Rbpj differentially promotes retina/optic stalk boundary maintenance and photoreceptor genesis, in parallel with neurogenic inhibition by Notch signaling pathway".
Response: We appreciate the reviewer's perspective. We are striving for a relatively simple title about a very complex topic, involving the in vivo genetic dissection of a signaling pathway. We modified the title to "Notch pathway mutations do not equivalently perturb mouse embryonic retinal development ".
2) The "Results" section is a bit difficult to follow logics without detailed knowledge on roles of Notch signaling in mouse retinal development. I suggest the authors to improve a writing style of "Results" section for readers without such detailed knowledge on mouse Notch mutant phenotypes to follow logical flow more easily. There are many additional descriptions on research background before start to mention results. Such introductory sentences should be moved to the "Introduction" section, by which logical flow in the Results section should be simpler. In addition, the authors should show a concrete question at the beginning of each result subsection. Furthermore, the authors sometimes jump over from one result subsection and suddenly move to cite another figure panel in a far ahead subsection whose data has not been explained. Such a back-and-forth citation of figure data generally makes it difficult to follow logical flow.
Response: We now present a considerable amount of new quantified data, reorganized multiple figures, and extensively rewrote the paper. We significantly revised the summary figure to improve clarity. In addition, Suppl Table 1 provides a wealth of background information to orient the reader on this topic. We feel that this extensive revision has greatly improved the quality, logical flow, and readability of the manuscript.
3) In addition, figure configuration is not well organized. Each figure compared some particular marker expression in wild-type, Rax-Cre; HesTKO, Rax-Cre; Rbpj cKO, Rax-Cre; dn-Maml-GFP, Chx10-Cre; HesTKO, Chx10-Cre; Rbpj cKO, Chx10-Cre; dn-Maml-GFP. For example, Fig. 2 shows Hes1 for inhibition of neurogenesis, Fig. 3 shows Vsx2; Mitf and Pax2; Pax6 for retinal pigmented epithelium and optic stalk, Fig. 6 shows Atoh7, Rbpms, and Tubb3 for retinal ganglion cells. Fig. 7 shows Crx, Otx2, and Thrb2 for photoreceptor differentiation. Fig. 8 shows Prdm1, and Ptf1a for photoreceptors and amacrine cells. Although this figure configuration is convenient to show phenotypic difference between different genetic mutations, it is difficult to know how each differentiation steps are spatially and temporally coordinated during development. At least, I recommend the authors to show one summary figure, which shows spatio-temporal expression profile of retinal markers in wild-type mouse retinas.
Response: We recognize this point and completely reorganized and combined Figs 6 and 7 to improve clarity. New Figure 6 presents E13 quantification for Atoh7, Otx2, Atoh7/Otx2, Rbpms and Crx expressing retinal populations. E16-E17 data were condensed and moved to a new Suppl Fig 5.
4a) Page 7, line 7-10 "With earlier deletion using Rax-Cre, hes5 mRNA abnormally extended into the optic stalk": I wonder how the authors define the optic stalk. It is likely that optic stalk area (Pax2+, Vax1+ area) is shifted to more proximal (depart from the optic cup and move toward the brain), and neural retina is expanded accordingly (Fig. 4B, 4F), resulting in expansion of hes5 expression. Thus, it may be better to mention that optic stalk/neural retina boundary is abnormally shifted toward the brain.
Response: The retina, including the optic nerve head, ends where the adjacent RPE terminates. This is conspicuous morphologically in our sections. We also defined this by colabeling for Pax2 and Pax6, which is now quantified in revised Fig 3. To clarify this further, we added the words " in all panels the brain is to the right" in the Fig 4 legend.
4b) Page 8, line 14-15, "ONH/OS cells still express it (Hes1), demonstrating that sustained Hes1 is independent of Notch": I presume that Cre-Rax drives Cre in neural retina as well as optic stalk and pigmented epithelium. However, it is likely that Rbpj is not expressed in optic stalk/neural retina boundary area in wild type (Fig. S2A). No expression of Rbpj in optic stalk/neural retina boundary may support that Hes1 expression in this boundary area is Notch-independent. However, Rbpj expression is retained in some vitreal cells near optic nerve head in Rax-Cre; Rbpj-CKO retinas (Fig. S2B). What are these Rbpj+ cells? I would like to request the authors to confirm that Rbpj expression is completely absent in both neural retina and optic stalk in Rax-Cre; Rbpj-CKO mice. Otherwise, this conclusion is still not fully supported.
Response: We show the Rax-Cre lineage in Suppl Fig 2 via the Ai9 (tomato) reporter. The results are striking, with all of the optic cup derivatives (retina, RPE, ONH, optic stalk, and presumptive ciliary tissue and iris) being tomato positive, while the well-described population of vascular cells in the hyaloid space lack tomato expression. Furthermore, our figure shows that Rbpj expression is only absent from the optic cup derivates, rather than the vascular structures in the vitreous. Vascular cells also depend on the Notch pathway and express Rbpj. Based on considerable evidence from the literature and our lineage experiments, the population of cells the reviewer highlights represents the hyaloid vasculature and associated cell types. It does not represent any population that derives from neuroectoderm.
4c) Page 9, line 16-18, "Foxg1 had spread into the nasal optic stalk": Is Foxg1 expanded nasal area really "OS" rather than expanded retina? I suggest the authors to confirm molecular markers Pax2 expression is overlapped with Foxg1. Otherwise, it is difficult to conclude that foxg1 is expanded into the optic stalk territory, because foxg1 is normally a marker of retina. Indeed, Fig. 3K shows pax2 expression is shifted into more inside towards the brain, suggesting that neural retina is expanded. Please explain the situation.
Response: Foxg1 (BF-1) mRNA and protein are found in the nasal retina and are expressed in other brain tissues. Multiple studies show Foxg1 in the nasal side of the E10 optic cup/retina/optic stalk and developing hypothalamus (See extra data figure Reviewer Fig 2; top row figure is data from Smith et al., 2017 (12) with Foxg1 mRNA in purple. Also see our new manuscript panel Fig 1C. We include here for reviewers (extra data Reviewer Fig 2 showing E13 ocular cryosections colabeled for Foxg1 and Pax2, highlighting their relationship in the retina, optic stalk and adjacent forming hypothalamus. On page 9 the text now reads "At E13.5 Rax-Cre;HesTKO eyes, the Foxg1 nasal retinal domain was contiguous with the nasal optic stalk (Suppl Fig 4D). This is reminiscent of younger stages (Fig 1C), since normally at E13.5, Foxg1 in the nasal optic cup/retina is separated from expression in the ONH/OS (Suppl Fig 4A). Based on the expansion of Pax6, Vsx2 and Hes5 RPC domains into the optic stalk, we conclude that the change in Foxg1 similarly reflects an extension of retinal tissue."
4d) Page 10, line 4-5, In Rax-Cre; Hes1/3/5 cTKO eye, this tissue (RPE) extended into the optic stalk": This description seems to be incorrect. A part of Pax2 area, which is adjacent to the neural retina, contacts with RPE in wild type (Fig. 3AH), so most of RPE covers the neural retina even in Fig. 3DK.
Response: We disagree with the reviewer’s interpretation. Fig 3D shows Mitf labeling of RPE nuclei. Figure 3K shows the adjacent section labeled with Pax2 and Pax6 (labels both retina and RPE). As the retina extended "towards the brain", the RPE analogously extends and surrounds the retinal domain. We also added higher magnification data panels 3H, 3K and 3N, showing merged and single channels.
4e) Page 10, line 22-23, "For Chk10-Cre; Hes1/3/5 cTKO, there was a unique presence of ectopic Pax2 within the retinal territories": I wonder if this description is correct. I suspect that proliferative Pax2+ cells expand into regressing territory of Hes KO retinal cells, which undergo precocious neurogenesis and lose proliferative activity, in Chk10-Cre; HesTKO. In this case, it is possible that the Pax2/Pax6 interface may be maintained. Please show red and green channel panels for Fig. 3N to confirm that there is ectopic pax2 and pax6 double positive cells.
Response: New quantification in revised Fig 3 (see panels O,P) fully supports our original conclusion. Only Chx10-Cre;HesTKO mutants have a statistically significant increase in Pax2+ cells. There are not more Pax2+Pax6+ double labeled cells. Only this particular genotype has an increase in Pax2+ single labeled cells.
5a) Page 11, line 20-25. There seems to be inconsistency between result description and image data of Fig. 5A-G, and histogram Fig. 5O. Authors mentioned that a modest loss of pH3+ cell fraction in Chx10-Cre; Hes1/3/5 cTKO but not in Rax-Cre; Hes1/3/5 cTKO. However, Fig. 5D indicates severe reduction of pH3+ cell fraction in Rax-Cre; Hes1/3/5/ cTKO, which is similar to reduction of pH3+ cell fraction in Rex-Cre; Rbpj (Fig. 5B), but histogram data is different (Fig. 5O). Furthermore, pH3+ cell fraction is severely reduced in Chx10-Cre; ROSA(dn-Maml-GFP) (Fig. 5F) and modestly reduced in Chx10-Cre; Hes1/3/5 cTKO (Fig. 5G). However, pH3+ cell fraction seems to be normal in Chx10-Cre; Rbpj (Fig. 5E). These Chx10-Cre image data do not match the histogram of Fig. 5O. Please check their situation.
Response: Images in old Figs 5-8 were normalized using area measurements, see methods and above comments (note: old Figs 6&7 were combined into new Fig 6). One-way ANOVA with pairwise comparisons for each mutant genotype compared to control were calculated using Prism. All genotypes except two have a statistically significant loss of M phase cells and we discuss possibilities for this outcome (Fig 5O). A normalization method for the sampled area is an essential component of these studies since morphologic differences are apparent for particular genotypes. The quantitative data are consistent with our original conclusions.
5b) Fig. 5H-N, P: I wonder if the stage E13 is appropriate to evaluate cell death and survival because optic cup already becomes smaller in Rax-Cre; Rbpj, Hes1/3/5 cTKO, or ROSA(dn-MAML-GFP) than in wild-type control. I suggest the authors examine more earlier stage.
Response: While an earlier effect is possible, we only observed size differences in a subset of the genotypes. Thus, E13 serves as a critical timepoint to examine early developmental phenotypes across the totality of our mutant conditions. It is also first age when the ONH is fully formed.
5c) Page 12, line 19-20, "all other mutants (Chx10-Cre; Rbpj, and Chx10-Cre; ROSA(dn-MAML-GFP) were unaffected (Fig. 6EF, LM, ST)": It is likely that atoh7 expressing cells are mildly decreased and neuronal marker, Tubb3 and Rbpms-expressing cells are increased in Chx10-Cre; Rbpj, and Chx10-Cre; ROSA(dn-MAML-GFP). I requested the authors to evaluate the fraction of these markers in retinal area statistically in all the cases.
Response: As described above, we quantified Atoh7 and Rbpms nuclear expression by immunohistochemistry. We do not believe that Tubb3+ cells can be reliably quantified. Nonetheless, it is useful to qualitatively show the extent of excess neuron formation. Importantly, we observed that it is not the Atoh7 status that matters for RGC formation, rather it is the Otx2 expression status. This is in good agreement with single cell-RNA transcriptomics data from Wu et al 2021 showing that Atoh7 mRNA in all early transitional RPCs remains fairly constant and its loss does not block the formation of early RGC cell states (13). By contrast Otx2 fluctuates but remains expressed in transitional RPCs that progress to photoreceptor lineages.
6a) Page 7, line 19 "Ectopic blood vessels protruded from the ONH (Fig. 1K, 1L)": It is difficult to see blood vessel structures in these panels (Fig. 1I-L). Please show some molecular marker of blood vessels to confirm how blood vessel is organized in Hes1/3/5 cTKO.
Response: These vascular structures are highly conspicuous by morphology in the H&E insets. Nonetheless, we used adjacent P21 sections to immunolabel for Endomuscin (14) and Tubb3 antibodies. This colabeling confirms the morphology and position of ectopic blood vessels in the abnormal tissue masses in Chx10-Cre;HesTKO mutant eyes. Ectopic tissue contains only rare Tubb3+ cells or cell processes suggesting it is overwhelmingly nonneural. All P21 data were moved to a new Suppl Fig 2. A full detailing of vascular phenotypes is beyond the scope of this manuscript and, interestingly, would be potentially attributable to non-autonomous effects of perturbing the Hes genes in the adjacent retina.
6b) Fig. 5: Increase of pH3 fraction indicates several possibilities, for example (1) increased fraction of mitotic cells due to precocious neurogenesis, (2) increased fraction of mitotic cells due to activated cell proliferation of retinal progenitor cells, (3) increased cell-cycle arrest in M phase due to some stress response of progenitor cells. So, I suggest the authors to examine (1) BrdU percentage of retinal section area, (2) the percentage of pH3+ cells in PCNA+ retinal cells.
Response: The data listed in Suppl Table 1 presents a unified picture that disrupting Notch signaling reduced proliferation. This paradigm extends to other model organisms (e.g., Drosophila, chick, frog, zebrafish and even to nonneural tissues). We included the phospho-histone H3 staining so readers would see how the six mutants evaluated in this study align with this paradigm, providing confidence for the novel findings in other figures. A full evaluation of cell cycle kinetics is interesting, but beyond the scope and focus of this manuscript.
6c) Fig. 5: It is better that cell death fraction will be evaluated by TUNEL and labeling with anti-activated caspase 3 antibody.
Response: We disagree. The DNA repair enzyme PARP is inactivated upon cleavage by activated caspase 3. There are currently ~3,600 citations that use it as a marker of apoptosis. PARP also has a separate and very specific role in maintaining the integrity of sperm DNA. This antibody works on all metazoans and is amenable to many tissue preparations and fixatives, making it easy to use, robust and quantifiable.
7a) Please show red channel (Hes1) image in Fig1BC.
Response: This was added to Revised Fig 1 (Fig 1A).
7b) Fig. 1DH should be shown in neighbor. Fig. 1H should be assigned as Fig. 1E.
Response: The new Fig 1 layout addresses this point.
7c) Fig. S2D, F, H, J: Please show GFP green channel as well. Otherwise, it is difficult to see non-overlapping expression in optic stalk area.
Response: In the revision, this is Suppl Fig 3. Chx-10-Cre is not expressed by ONH-OS cells (1). The green and fuchsia overlap (coexpression) in RPCs is white, we feel this is fairly clear. If needed, all readers can turn on and off the green channel in the final PDF version of this figure to compare GFP with Hes1 expression for those panels.
7d) Fig. 9B: It is better to show Rax-Cre: Hes1/3/5 TKO rather than Rax-Cre: Hes1 cKO. 7e) Fig. 9B: Lettering "Rbpj mutant" should be revised as "Rax-Cre: Rbpj KO".
Response: Fig 9B was removed so these terms are now irrelevant. Our models are presented in new Fig 8.
Significance: The senior author of this manuscript, Dr. Nadean Brown, is an expert scientist who has investigate the role of Notch signaling pathway in vertebrate ocular tissue, including the neural retina and lens. In general, Notch signaling pathway consists of signaling stream from the interaction of Delta and Notch, Notch receptor activation by proteolytic cleavage, translocation of Notch intracellular domain (NICD) into nucleus, formation of transcription factor complex consisting of NICD/Rbpj/Maml, to the transcriptional activation of Notch target genes, Hes family transcription factors. Finally, Hes suppresses neurogenic program and maintain a pool of neural progenitor cells. Therefore, Notch is a key factor to regulate the balance between neurogenesis and progenitor proliferation. In this manuscript, the authors investigated retinal phenotypes in the knockout mice of different Notch signaling components, including Rbpj, Maml, and Hes. They found that functions of these three factors are not always equal in retinal cell differentiation; rather, they specifically regulate a particular step of retinal development. The authors propose the possibility that each of Notch signaling components may be modified by other signaling pathways and achieve some new roles beyond the conventional frame of classic Notch signaling pathway. In this point, this work has a potential to provide a new conceptual advance in the field of developmental and cell biology.
We fully agree this work is a significant advance for the fields of developmental and cell biology. Our findings provide new information and stimulate fresh ideas for anyone working on signal transduction and signal integration.
References cited:
but the NAACP made few claims of intentional segregation during the 19:20s and 1930s and of-fered the New York City elementary schools as a model for other cities ~o emulate.
good!!
RRID:AB_1125118
DOI: 10.1016/j.celrep.2023.112764
Resource: (Santa Cruz Biotechnology Cat# sc-74548, RRID:AB_1125118)
Curator: @scibot
SciCrunch record: RRID:AB_1125118
Além disso, Primo Levi consegue fazer com que sua obra sirvade alerta para o momento presente, no qual a biopolítica e a violência impõemclaramente na sociedade moderna regras de exceção como torturas, exploração doscorpos frágeis, execuções, deportações ilegais, opressões institucionalizadas etodas as formas de desumanização e aviltamento contra os mais fragilizadossocialmente, o que aciona o “alarme de incêndio” (LÖWY, 2005, p. 23) de que ofuturo de barbárie profetizado por Benjamin, infelizmente, já chegou.
crucial
É isto um homem? por seu estilo analítico e quase científico, porsua construção de um testemunho consciente da sua própria aporia e daimpossibilidade da linguagem, mas que a despeito disso persevera em relatar aslacunas, os silêncios deixados pela história oficial, e por seu perseverante propósitoem registrar uma memória que fizesse com que o genocídio de milhões de judeusjamais se repetisse, consegue suplantar o estatuto de mero relato privativo. Portudo isso, a narrativa testemunhal de Levi pode ser contundentemente consideradacomo fonte histórica, pois resgata o evento coletivo da Shoah recompondo opassado enquanto ruína e sendo resistência ao esquecimento traumático, aonegacionismo histórico e à narrativa histórica oficial
considerado como fonte histórica
consciente da importância histórica do seu trabalho ede que o registro de sua memória individual não se resume a uma obraautobiográfica, antes se entrelaça com a memória de uma sociedade vitimada, Leviinsiste em acolher em sua narrativa o silêncio de toda uma coletividade que existelatente em sua narrativa, o que vai dar ao seu relato uma configuração dedocumento de memória social. Portanto, pode-se constatar firmemente que Levivence os rígidos limites da lembrança traumática e da linguagem para vincular suamemória individual à memória de toda uma coletividade impossibilitada
todo o parágrafo
Apesar do seu objetivo de transmitir o fenômeno da Auschwitz,estando ainda prisioneiro no campo em Auschwitz, Levi temia que seus futurosouvintes não lhe dessem crédito face ao horror inaudito daquele evento. Foi de talintensidade esse seu receio que chegava a sonhar de modo recorrente que, diantedo seu relato, os ouvintes se retiravam, se negavam a ouvir sua história de morte evergonha, como se de alguma forma pudessem ser alcançados e/ou desvelados porela. Na verdade, Levi relata em seu livro Os afogados e os sobreviventes que asprimeiras notícias que se difundiram entre os judeus, em 1942, a respeito doscampos de extermínio nazista eram sobremodo vagas, mas ao mesmo tempo eramde tamanha crueldade e de motivações tão complexas e absurdas que logo foramrejeitadas pelo público. Levi segue dizendo que tal rejeição foi prevista peloscriminosos genocidas e chegou a transcrever a fala dos capatazes SS que,divertindo-se, avisavam aos prisioneiros que já eram os vitoriosos na guerra contraeles, uma vez que ninguém restaria vivo daquele genocídio e mesmo que algunssobrevivessem e contassem o que lhes havia ocorrido não lhes dariam créditodevido à monstruosidade do evento. Os SS completavam sua fala afirmando comsoberba: “Nós é que ditaremos a história dos Lager” (LEVI, 2016, p. 7). Issoexplica o pesadelo de Levi e de tantos outros porque, tempos depois, ele descobreque esse sonho é também sonhado por quase todos os seus companheirosprisioneiros do campo
crucial para debater memória no presente
É isto um homem? possui um tom diarístico, onde Levi relata osacontecimentos cotidianos mais significativos de sua experiência enquantoprisioneiro de Auschwitz. Por todo o relato observa-se que o autor se equilibraentre a memória e o esquecimento, procurando vencer a dor de relembrar tudo oque lá viveu, mas sempre enfatizando que aquele sofrimento espe
todo o parágrafo
How the Absolute Might Move
o con
حالا می خواد بره با Axios وصلش کنه
How the Absolute Might MoveMediumhttps://medium.com › ...Mediumhttps://medium.com › ...(Re)constructing “A Is A” argues that “The Metaphysics of Adjacency” created by Layman is brilliant and aligns with the work of Hegel, as does the work of ...The Modern Counter-Enlightenment - O.G. Rose - Mediumhttps://o-g-rose-writing.medium.com › ...https://o-g-rose-writing.medium.com › ...Dec 12, 2022 — 'Our contemporary age is bringing into popular discussion the Metaphysics of Adjacency under various names — 'post-metaphysics,' ...
GTV prescription was commonly 52.5 Gyin 15 fractions
Sarcoma metastásico o irresecable RT hipofraccionada: GTV 52.5 Gy en 15 fx --> CTV 45 Gy en 15 fx GTV 45Gy en 15 fx --> CTV 37.5 Gy en 15 fx
5 Gy in 15 fractions (59% ≥45 Gy)
Sarcoma metastásico o irresecable RT hipofraccionada: 45Gy en 15 fx
klikatých cest
Klika
Klikatý
Author Response
Reviewer #1 (Public Review):
The objective of this investigation was to determine whether experimental pain could induce alterations in cortical inhibitory/facilitatory activity observed in TMS-evoked potentials (TEPs). Previous TMS investigations of pain perception had focused on motor evoked potentials (MEPs), which reflect a combination of cortical, spinal, and peripheral activity, as well as restricting the focus to M1. The main strength of this investigation is the combined use of TMS and EEG in the context of experimental pain. More specifically, Experiment 1 investigated whether acute pain altered cortical excitability, reflected in the modulation of TEPs. The main outcome of this study is that relative to non-painful warm stimuli, painful thermal stimuli led to an increase on the amplitude of the TEP N45, with a larger increase associated with higher pain ratings. Because it has been argued that a significant portion of TEPs could reflect auditory potentials elicited by the sound (click) of the TMS, Experiment 2 constituted a control study that aimed to disentangle the cortical response related to TMS and auditory activity. Finally, Experiment 3 aimed to disentangle the cortical response to TMS and reafferent feedback from muscular activity elicited by suprathreshold TMS applied over M1. The fact that the authors accompanied their main experiment with two control experiments strengthens the conclusion that the N45 TEP peak could be implicated in the perception of painful stimuli.
Perhaps, the addition of a highly salient but non-painful stimulus (i.e. from another modality) would have further ruled out that the effects on the N45 are not predominantly related to intensity/saliency of the stimulus rather than to pain per se.
We thank the reviewer for their comment on the possibility of whether stimulus salience influences the N45 as opposed to pain per se. However, we note that in Experiment 1, despite the same level of stimulus salience/intensity for all participants (46 degrees), individual differences in pain ratings were associated with the change in the N45 amplitude, suggesting that the results cannot be explained by stimulus intensity/salience.
Reviewer #2 (Public Review):
The authors have used transcranial magnetic stimulation (TMS) and motor evoked potentials (MEPs) and TMS-electroencephalography (EEG) evoked potentials (TEPs) to determine how experimental heat pain could induce alterations in these metrics.In Experiment 1 (n = 29), multiple sustained thermal stimuli were administered over the forearm, with the first, second, and third block of stimuli consisting of warm but non-painful (pre-pain block), painful heat (pain block) and warm but non-painful (post-pain block) temperatures respectively. Painful stimuli led to an increase in the amplitude of the fronto-central N45, with a larger increase associated with higher pain ratings. Experiments 2 and 3 studied the correlation between the increase in the N45 in pain and the effects of a sham stimulation protocol/higher stimulation intensity. They found that the centro-frontal N45 TEP was decreased in acute pain.
The study comes from a very strong group in the pain fields with long experience in psychophysics, experimental pain, neuromodulation, and EEG in pain. They are among the first to report on changes in cortical excitability as measured by TMS-EEG over M1.
While their results are in line with reductions seen in motor-evoked responses during pain and effort was made to address possible confounding factors (study 2 and 3), there are some points that need attention. In my view the most important are:
1) The method used to calculate the rest motor threshold, which is likely to have overestimated its true value : calculating highly abnormal RMT may lead to suprathreshold stimulations in all instances (Experiment 3) and may lead to somatosensory "contamination" due to re-afferent loops in both "supra" and "infra" (aka. less supra) conditions.
The method used to assess motor threshold was the TMS motor threshold Assessment Tool (Awiszus et al., 2003). This was developed as a quicker alternative for calculating motor threshold compared to the traditional Rossini-Rothwell method which involves determining the lowest intensity that evokes 5/10 MEPs of at least 50 microvolts. The method has been shown to achieve the same accuracy of determining motor threshold as the traditional Rossini-Rothwell method, but with fewer pulses (Qi et al., 2011; Silbert et al., 2013). Therefore, the high RMTs in our study cannot be explained by the threshold assessment method. Instead, they are likely explained by aspects of the experimental setup that increased the distance between the TMS coil and the scalp, including the layer of foam placed over the coil, the EEG cap and the fact that the electrodes we used had a relatively thick profile.
Awiszus, F. (2003). TMS and threshold hunting. In Supplements to Clinical neurophysiology (Vol. 56, pp. 13-23). Elsevier.
Qi, F., Wu, A. D., & Schweighofer, N. (2011). Fast estimation of transcranial magnetic stimulation motor threshold. Brain stimulation, 4(1), 50-57.
Silbert, B. I., Patterson, H. I., Pevcic, D. D., Windnagel, K. A., & Thickbroom, G. W. (2013). A comparison of relative-frequency and threshold-hunting methods to determine stimulus intensity in transcranial magnetic stimulation. Clinical Neurophysiology, 124(4), 708-712.
2) The low number of pulses used for TEPs (close to ⅓ of the usual and recommended)
We agree that increasing the number of pulses can increase the signal to noise ratio. During piloting, participants were unable to tolerate the painful stimulus for long periods of time and we were required to minimize the number of pulses per condition.
We note that there is no set advised number of trials in TMS-EEG research. According to the recommendations paper, the number of trials should be based on the outcome measure e.g., TEP peaks vs. frequency domain measures vs. other measures and based on previous studies investigating test-retest reliability (Hernandez-Pavon et al., 2023). The choice of 66 pulses per condition was based on the study by Kerwin et al., (2018) showing that optimal concordance between TEP peaks can be found with 60-100 TMS pulses delivered in the same run (as in the present study). The concordance was particularly higher for the N40 peak at prefrontal electrodes, which was the key peak and electrode cluster in our study.
Further supporting the reliability of the TEP data in our experiment, we note that the scalp topographies of the TEPs for active TMS at various timepoints (Figures 5, 7 and 9) were similar across all three experiments, especially at 45 ms post-TMS (frontal negative activity, parietal-occipital positive activity).
In addition to this, the interclass correlation coefficient (Two-way fixed, single measure) for the N45 to active suprathreshold TMS across timepoints for each experiment was 0.90 for Experiment 1 (across pre-pain, pain, post-pain time points), 0.74 for Experiment 2 (across pre-pain and pain conditions), and 0.95 for Experiment 3 (across pre-pain conditions). This suggests that even with the fluctuations in the N45 induced by pain, the N45 for each participant was stable across time, further supporting the reliability of our data. These ICCs will be reported in the next revision.
Hernandez-Pavon, J. C., Veniero, D., Bergmann, T. O., Belardinelli, P., Bortoletto, M., Casarotto, S., ... & Ilmoniemi, R. J. (2023). TMS combined with EEG: Recommendations and open issues for data collection and analysis. Brain Stimulatio, 16(3), 567-593
Kerwin, L. J., Keller, C. J., Wu, W., Narayan, M., & Etkin, A. (2018). Test-retest reliability of transcranial magnetic stimulation EEG evoked potentials. Brain stimulation, 11(3), 536-544.
Lack of measures to mask auditory noise.
In TMS-EEG research, various masking methods have been proposed to suppress the somatosensory and auditory artefacts resulting from TMS pulses, such as white noise played through headphones to mask the click sound (Ilmoniemi and Kičić, 2010), and a thin layer of foam placed between the TMS coil and EEG cap to minimize the scalp sensation (Massimini et al., 2005). However, recent studies have shown that even when these methods are used, sensory contamination of TEPs is still present, as shown by studies that show commonalities in the signal between active and sensory sham conditions that mimic the auditory/somatosensory aspects of real TMS (Biabani et al., 2019; Conde et al., 2019; Rocchi et al., 2021). This has led many authors (Biabani et al., 2019; Conde et al., 2019) to recommend the use of sham conditions to control for sensory contamination. To separate the direct cortical response to TMS from sensory evoked activity, Experiment 2 (n = 10) included a sham TMS condition that mimicked the auditory/somatosensory aspects of active TMS to determine whether any alterations in the TEP peaks in response to pain were due to changes in sensory evoked activity associated with TMS, as opposed to changes in cortical excitability. Therefore, the lack of auditory masking does not impact the main conclusions of the paper.
Ilmoniemi, R. J., & Kičić, D. (2010). Methodology for combined TMS and EEG. Brain topography, 22, 233-248.
Massimini, M., Ferrarelli, F., Huber, R., Esser, S. K., Singh, H., & Tononi, G. (2005). Breakdown of cortical effective connectivity during sleep. Science, 309(5744), 2228-2232.
Biabani, M., Fornito, A., Mutanen, T. P., Morrow, J., & Rogasch, N. C. (2019). Characterizing and minimizing the contribution of sensory inputs to TMS-evoked potentials. Brain stimulation, 12(6), 1537-1552.
Conde, V., Tomasevic, L., Akopian, I., Stanek, K., Saturnino, G. B., Thielscher, A., ... & Siebner, H. R. (2019). The non-transcranial TMS-evoked potential is an inherent source of ambiguity in TMS-EEG studies. Neuroimage, 185, 300-312.
Rocchi, L., Di Santo, A., Brown, K., Ibáñez, J., Casula, E., Rawji, V., ... & Rothwell, J. (2021). Disentangling EEG responses to TMS due to cortical and peripheral activations. Brain stimulation, 14(1), 4-18.
3) A supra-stimulus heat stimulus not based on individual HPT, that oscillates during the experiment and that lead to large variations in pain intensity across participants is unfortunate.
The choice of whether to calibrate or fix stimulus intensity is a contentious question in experimental pain research. A recent discussion by Adamczyk et al., (2022) explores the pros and cons of each approach and recommends situations where one method may be preferred over the other. That paper suggests that the choice of the methodology is related to the research question – when the main outcome of the research is objective (neurophysiological measures) and researchers are interested in the variability in pain ratings, the fixed approach is preferrable. Given we explored the relationship between MEP/N45 modulation by pain and pain intensity, this question is better explored by using the same stimulus intensity for all participants, as opposed to calibrating the intensity to achieve a similar of pain across participants.
Adamczyk, W. M., Szikszay, T. M., Nahman-Averbuch, H., Skalski, J., Nastaj, J., Gouverneur, P., & Luedtke, K. (2022). To calibrate or not to calibrate? A methodological dilemma in experimental pain research. The Journal of Pain, 23(11), 1823-1832.
So is the lack of report on measures taken to correct for a fortuitous significance (multiple comparison correction) in such a huge number of serial paired tests.
Note that we used a Bayesian approach for all analyses as opposed to traditional frequentist approach. In contrast to the frequentist approach, the Bayesian approach does not require corrections for multiple comparisons (Gelman et al., 2000) given that they provide a ratio representing the strength of evidence for the null vs. alternative hypotheses as opposed to accepting or rejecting the null hypothesis based on p-values. As such, throughout the paper, we frame our interpretations and conclusions based on the strength of evidence (e.g. anecdotal/weak, moderate, strong, very strong) as opposed to referring to the significance of the effects.
Gelman A, Tuerlinckx F. (2000). Type S error rates for classical and Bayesian single and multiple comparison procedures. Computational statistics, 15(3):373-90.
Reviewer #3 (Public Review):
The present study aims to investigate whether pain influences cortical excitability. To this end, heat pain stimuli are applied to healthy human participants. Simultaneously, TMS pulses are applied to M1 and TMS-evoked potentials (TEPs) and pain ratings are assessed after each TMS pulse. TEPs are used as measures of cortical excitability. The results show that TEP amplitudes at 45 msec (N45) after TMS pulses are higher during painful stimulation than during non-painful warm stimulation. Control experiments indicate that auditory, somatosensory, or proprioceptive effects cannot explain this effect. Considering that the N45 might reflect GABAergic activity, the results suggest that pain changes GABAergic activity. The authors conclude that TEP indices of GABAergic transmission might be useful as biomarkers of pain sensitivity.
Pain-induced cortical excitability changes is an interesting, timely, and potentially clinically relevant topic. The paradigm and the analysis are sound, the results are mostly convincing, and the interpretation is adequate. The following clarifications and revisions might help to improve the manuscript further.
1) Non-painful control condition. In this condition, stimuli are applied at warmth detection threshold. At this intensity, by definition, some stimuli are not perceived as different from the baseline. Thus, this condition might not be perfectly suited to control for the effects of painful vs. non-painful stimulation. This potential confound should be critically discussed.
In Experiment 3, we also collected warmth ratings to confirm whether the pre-pain stimuli were perceived as different from baseline. We did not include this data initially in the first submission, but will do so in the supplemental material in our next revision. This data showed warmth ratings were close to 2/10 on average. This confirms that the non-painful control condition produced some level of non-painful sensation.
2) MEP differences between conditions. The results do not show differences in MEP amplitudes between conditions (BF 1.015). The analysis nevertheless relates MEP differences between conditions to pain ratings. It would be more appropriate to state that in this study, pain did not affect MEP and to remove the correlation analysis and its interpretation from the manuscript.
The interindividual relationship between changes in MEP amplitude and individual pain rating is statistically independent from the overall group level effect of pain on MEP amplitude. Therefore, conclusions for the individual and group level effects can be made independently.
It is also important to note that in the pain literature, there is now increasing emphasis placed on investigating the individual level relationship between changes in cortical excitability and pain as opposed to the group level effect (Seminowicz et al., 2019; Summers et al., 2019). As such, it is important to make these results readily available for the scientific community.
Summers, S. J., Chipchase, L. S., Hirata, R., Graven-Nielsen, T., Cavaleri, R., & Schabrun, S. M. (2019). Motor adaptation varies between individuals in the transition to sustained pain. Pain, 160(9), 2115-2125.
Seminowicz, D. A., Thapa, T., & Schabrun, S. M. (2019). Corticomotor depression is associated with higher pain severity in the transition to sustained pain: a longitudinal exploratory study of individual differences. The Journal of Pain, 20(12), 1498-1506.
3) Confounds by pain ratings. The ISI between TMS pulses is 4 sec and includes verbal pain ratings. Considering this relatively short ISI, would it be possible that verbal pain ratings confound the TEP? Moreover, could the pain ratings confound TEP differences between conditions, e.g., by providing earlier ratings when the stimulus is painful? This should be carefully considered, and the authors might perform control analyses.
It is unlikely that the verbal ratings contaminated the TEP response as the subsequent TMS pulse was not delivered until the verbal rating was complete and given that each participant was cued by the experimenter to provide the pain rating after each pulse (rather than the participant giving the rating at any time). As such, it would not be possible for participants to provide earlier ratings to more painful stimuli. We will make this part of the protocol clearer in the next revision of the manuscript.
4) Confounds by time effects. Non-painful and painful conditions were performed in a fixed order. Potential confounds by time effects should be carefully considered.
Previous research suggests that pain alters neural excitability even after pain has subsided. In a recent meta-analysis (Chowdhury et al., 2022) we found effect sizes of 0.55-0.9 for MEP reductions 0-30 minutes after pain had resolved. As such, we avoided intermixing pain and warm blocks given subsequent warm blocks would not serve as a valid baseline, as each subsequent warm block would have residual effects from the previous pain blocks.
At the same time, given there was no conclusive evidence for a difference in N45 amplitude between pre-pain and post-pain conditions of Experiment 1 (Supplementary Figure 1), it is unlikely that the effect of pain was an artefact of time i.e., the explanation that successive thermal stimuli applied to the skin results an increase in the N45, regardless of whether they are painful or not. We will make this point in our next revision.
Chowdhury, N. S., Chang, W. J., Millard, S. K., Skippen, P., Bilska, K., Seminowicz, D. A., & Schabrun, S. M. (2022). The Effect of Acute and Sustained Pain on Corticomotor Excitability: A Systematic Review and Meta-Analysis of Group and Individual Level Data. The Journal of Pain, 23(10), 1680-1696.
5) Data availability. The authors should state how they make the data openly available.
We will upload the MEP, TEP and pain data on the Open science framework at the time of the next revision.
voy a compartir contigo mi flujo de trabajo
Art. 1.790.
DECLARADO INCONSTITUCIONAL:
TEMA 809 - É inconstitucional a distinção de regimes sucessórios entre cônjuges e companheiros prevista no art. 1.790 do CC/2002, devendo ser aplicado, tanto nas hipóteses de casamento quanto nas de união estável, o regime do art. 1.829 do CC/2002.
TEMA 498 - É inconstitucional a distinção de regimes sucessórios entre cônjuges e companheiros prevista no art. 1.790 do CC/2002, devendo ser aplicado, tanto nas hipóteses de casamento quanto nas de união estável, o regime do art. 1.829 do CC/2002.
Note: This rebuttal was posted by the corresponding author to Review Commons. Content has not been altered except for formatting.
Learn more at Review Commons
We would like to thank the reviewers for their careful reading of our manuscript and constructive comments.
Reviewer 1) “Indeed, the manuscript describe the alteration of total brain O-GlcNAc levels, but understanding pathways or protein specific changes would allow to identify the mechanisms potentially at the basis of the development of intellectual disability.”
Response: While finding the pathways involved in phenotypes described here is beyond the scope of the present manuscript, we plan to include RNAi experiments elucidating cell types responsible for the sleep phenotype observed in sxc mutant flies.
Reviewer 3) “2) Lacing fly food with compounds can sometimes lead to phenotypes not actually caused by the drug. There are reports I have previously seen where the compound can make the food more aversive or attractive, both leading to results not due to the drug. Specifically, it has been previously reported that starved flies (if the compound leads to aversion from the food and causes starvation) will reduce the bouts of sleep in Drosophila ( Masek et al J Exp Biol 2014; Figure 4). Do the authors know if the TMG treated food eaten at the same level as normal food? Is there the potential for a starvation phenotype?”
Response: We appreciate this insight and we plan to perform this control experiment. Briefly, this will entail measuring male adult ingestion of Thiamet G laced food by adding Blue No. 1 dye and measuring absorbance of lysed flies, as previously described in Wong et al. 2009 (PMID: 19557170).
Reviewer 1) “In figure 1C the blot show a different MW range compared to blots 1A and 1B, author should correct. “ and “For figure 1 and 2 the dot graph are too small and difficult to read”
Response: The figures have been amended to address this.
Reviewer 3) “In the methods - Neuromuscular Junction Immunohistochemistry - which muscles and which types of boutons were imaged was not denoted in this section - it is described in results (lines 210-211) but should be in methods for ease to the reader.”
Response: The methods section has been amended.
“The statistics and data analyses are some of the best I have seen to date. One concern is the removal of a single outlier data point described at line 575. Was this necessary? Does it change the data? If not, I would recommend leaving it in. If it does, I would further recommend additionally biasing toward the alternative hypothesis by additionally removing the data point that lies furthest from the outlier. This would reduce bias.”
Response: Removal of an outlier does indeed change the results of the data. Following the suggestions of the reviewer, we re-analyzed our data removing the minimum for the group for which we previously removed an outlier (the maximum).
“1) line 391 mentions that feeding higher doses of TMG results in a non-rescue phenotype. Is there any data to support this statement (maybe supplementally) to give the reader the full picture of the availability of this compound? For example, how far above 250 uM does this happen?”
Response: This statement refers to adult Thiamet G feeding experiments, and the data to support this statement can be found in figures 2B and S2A. This statement has been amended for clarity and to include the caveat that even higher doses of TMG were not trialed.
Reviewer 1) “Authors employed RL2 antibody for O-GlcNac detection, however it recognized mainly high MW proteins and it would be nice to obtain the alteration profile of low MW proteins at the same conditions.”
Response: We agree that the use of a single method for detecting O-GlcNAcylation is limited, however, there is no reason to believe that immunoblotting using this antibody would bias the interpretation of the effects of mutations studied here on global O-GlcNAcylation. Specifically, there is no reason to believe low molecular weight proteins are recognized and modified by OGT differently to high molecular weight proteins. While gaining insight into substrate specific alterations in O-GlcNAcylation is of great interest to us, this is technically very challenging and beyond the scope of this study.
Reviewer 2) “… would it be possible for the authors to overexpress specifically in neurons wildtype OGT postnatally on a mutant background and quantify the effects on neuro-muscular synapse number and morphology? It would be interesting to compare these data with a similar experiment where they overexpress wildtype OGT in the corresponding muscle.”
Response: While temporal control of transgene expression is possible in Drosophila, it is not a technique that we routinely use and would require extensive optimization to include in the present manuscript.
_Reviewer 3) “In Figure 3D the authors show sxcWT compared with OgaKO with no significant difference at ~20 boutons in the count. Other work done by [47] in their reference list (ref 47: Figure 2D) shows an increase in OgaKO boutons vs WT and also shown in [50] (ref 50; Figure 4B) where # of boutons in 1B muscle 4 is increased in OgaKO significantly. There appears to be a difference in what was found with OgaKO vs controls in the authors' results vs these two manuscripts and it should be noted and explained to the reader.” _
Response: This is indeed an inconsistency we have observed, however, looking at reference Fenckova et al. 2022 (47 in our manuscript) we find that in figure legend 2 the following is stated: “None of the parameters is significantly affected in the OgaKO larvae (N = 30, in purple; OgaKO experiments were performed simultaneously and first published here [53] with significantly increased bouton counts (p <0.05) without multiple testing correction)” Reference [53] in the quote refers to Muha et al. 2020 (reference 50 in our manuscript). Therefore, it appears that this effect is too weak to withstand multiple correction testing, which we employ in our analysis.
Note: This preprint has been reviewed by subject experts for Review Commons. Content has not been altered except for formatting.
Learn more at Review Commons
The manuscript written by Czajewski et al. "Rescuable sleep and synaptogenesis phenotypes in a Drosophila model of O-GlcNAc transferase intellectual disability" is a novel approach to examining genetic missense mutations representing a patient derived OGT mutation in quantifiable phenotypes coupled with genetic and pharmacological manipulation. The authors find novel contradictory results in synaptic bouton parameters than previous work leading to increased interest in these results. The authors also use pharmacological intervention to reverse the phenotypes derived from the OGT mutations creating an interesting path forward for these types of studies. The manuscript was well written, the experiments are sounds, and the analyses are extremely well done. The manuscript would benefit from addressing a few concerns:
Minor:
In the methods - Neuromuscular Junction Immunohistochemistry - which muscles and which types of boutons were imaged was not denoted in this section - it is described in results (lines 210-211) but should be in methods for ease to the reader.
The statistics and data analyses are some of the best I have seen to date. One concern is the removal of a single outlier data point described at line 575. Was this necessary? Does it change the data? If not, I would recommend leaving it in. If it does, I would further recommend additionally biasing toward the alternative hypothesis by additionally removing the data point that lies furthest from the outlier. This would reduce bias.
Major:
In Figure 3D the authors show sxcWT compared with OgaKO with no significant difference at ~20 boutons in the count. Other work done by [47] in their reference list (ref 47: Figure 2D) shows an increase in OgaKO boutons vs WT and also shown in [50] (ref 50; Figure 4B) where # of boutons in 1B muscle 4 is increased in OgaKO significantly. There appears to be a difference in what was found with OgaKO vs controls in the authors' results vs these two manuscripts and it should be noted and explained to the reader.
The results working with Thiamet G (TMG) is very interesting and needs a bit more clarification. I tried to find other research where TMG is fed to Drosophila, and could not find this, and I suspect this is novel and very interesting, especially as a tool. However, I do have concerns about the details for this feeding and would like to further understand a few things that came up in the manuscript that need to be addressed:
There is a novel technique in this manuscript that could enhance OGT research in Drosophila, which is significant.
Note: This preprint has been reviewed by subject experts for Review Commons. Content has not been altered except for formatting.
Learn more at Review Commons
The authors of this manuscript describe the effect on neuronal development and function in drosophila of OGT mutations derived from patients with intellectual disability. OGT is an enzyme that adds the posttranslational modification O-GlcNAc to proteins. Once added, O-GlcNAc can be removed by the enzyme OGA. O-GlcNAc cycling on and off proteins has been associated not only with intellectual disability but a range of other brain-dependent disorders. However, molecular mechanisms by which O-GlcNAc cycling may affect brain development and function are largely unclear. It is equally unclear whether and how disorders associated with OGT mutations may be treated. This manuscript presents evidence that it is possible to rescue neurological phenotypes dependent on patient-derived OGT mutations using genetic or pharmacological manipulations of OGA. These results strongly suggest that at least some aspects of the phenotype of patient-derived OGT mutations depend on O-GlcNAc cycling rather than other mechanisms. Excitingly, they also suggest that it may be possible to treat patients suffering from OGT mutations with drugs that target OGA after the baby has been born. This last point is critical not only for the field of OGT-associated disorders but for the whole field of intellectual disability.
Minor comment:
While the manuscript delivers its message clearly with a simple and concise language, the manuscript would become even stronger if the observation that some aspects of intellectual disability can be treated postnatally is substantiated with additional methods that are more specific. The current data are also somewhat difficult to interpret because the pharmacological and genetic manipulations of OGA used so far may not be a direct rescue of the OGT mutations, which the authors also point out. For example, would it be possible for the authors to overexpress specifically in neurons wildtype OGT postnatally on a mutant background and quantify the effects on neuro-muscular synapse number and morphology? It would be interesting to compare these data with a similar experiment where they overexpress wildtype OGT in the corresponding muscle. These experiments would both strengthen their finding that it is possible to rescue neurodevelopmental conditions postnatally and give further evidence to the molecular mechanism by which OGT affects neurodevelopment.
In summary, while it is a short manuscript and on a topic studied previously, its data are novel, clearly presented and would appeal to researchers within and outside the field of O-GlcNAc. It is ready for publication as it has been submitted but including more experiments along the lines suggested above would help it reach one level higher.
Note: This preprint has been reviewed by subject experts for Review Commons. Content has not been altered except for formatting.
Learn more at Review Commons
The manuscript from Czajewski and colleagues demonstrates that patients-derived OGT mutation can lead to reduced O-GlcNAc levels, which can be rescued by genetic OGA ablation or pharmacological OGA inhibition. Several studies in the last decade demonstrated that O-GlcNac homeostasis is crucial for brain development and function and that its alteration is deeply involved in neurodegeneration and cognitive decline. Therefore rescuing protein O-GlcNAcylation by targeting OGT/OGA cycling could represent a valuable therapeutic approach for intellectual disability. Results obtained by the authors are very promising and support the notion of a mutual interplay between OGT and OGA in regulating brain O-GlcNAc levels. Furthermore, the partial rescue of synaptogenesis and sleep stability support the efficacy of OGA reduction in rescuing O-GlcNAc levels.<br /> I do not find Major flaws in the manuscript structure or in the experimental approach, however I believe that the manuscript would benefit of the analysis of the molecular target that lead to brain defects under OGT mutation and that are rescued after OGA inhibition. Indeed, the manuscript describe the alteration of total brain O-GlcNAc levels, but understanding pathways or protein specific changes would allow to identify the mechanisms potentially at the basis of the development of intellectual disability . Furthermore, it would be also interesting to understand if the mutation of OGT has direct or indirect effects on Ser/Thr phosphorylation levels.
Minor comments:
Authors employed RL2 antibody for O-GlcNac detection, however it recognized mainly high MW proteins and it would be nice to obtain the alteration profile of low MW proteins at the same conditions.
In figure 1C the blot show a different MW range compared to blots 1A and 1B, author should correct.
For figure 1 and 2 the dot graph are too small and difficult to read
General assessment: I believe that the study is well executed and interesting since it nicely demonstrate the influence of OGT mutation on O-GlcNAc levels and the efficacy of OGA reduction in rescuing the process and in improving synaptogenesis and sleep stability. However, I also believe that a better understanding of the molecular mechanisms involved could substantially improve the study.
Advance: the present study provide further knowledge about the physio/pathological role of OGT/OGA cycling in the brain.
Audience: basic researchers
(1648), To the Virgins, to make much of Time.
l'anno può essere messo alla fine, dopo il titolo, o deve stare qui?
12.2 Zalven
\(Hydrofoob\) * Bestaan uit vaste, halfvast en/of vloeibare vetten. * Bereiding smelten en roeren tot bekoelen.
\(Crèmes \) * O/W creme; Olie in water. * W/O creme; water in olie. * Atijd een emulgator nodig. * Creme altijd conserveren. * Bij voorkeur in tube afleveren.
\(Basiszalven FNA\) * Basis voor waterhoudende zalf. * Basis voor cetomacrogolzalf. * Cetmacrogolzalf/ung cetomacrogol. * Basis voor lanettezalf. * Lanettezalf/ung.lanette. * Hypromellosezalf 20%
Verwerking geneesmiddel in basis
* Oplossen.
* Dispergeren.
* Mengen.
* Onverenigbaar = als een stof niet mengbaar is
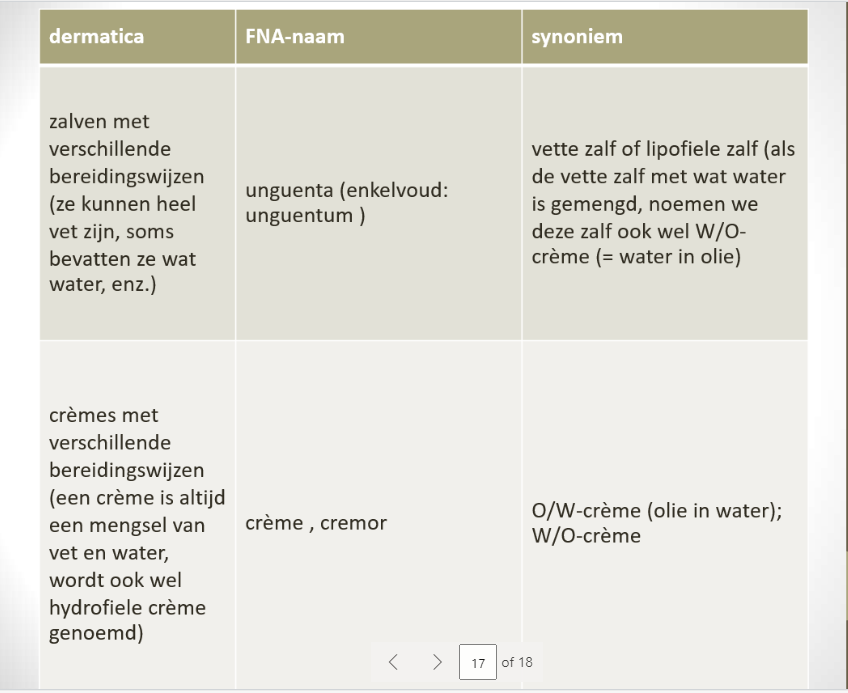
Prohibition. (e) RELATIVE BUDGET PRIORITIES NOT T o B E ALTERED.—Nothing in the preceding provisions of this section shall be construed to give the President new authority to alter the relative priorities in the Fed- eral budget that are established by law, and no person who is or becomes eligible for benefits under any provision of law shall be denied eligibility by reason of any order issued under this part. 2 use 903. SEC. 253. COMPLIANCE REPORT BY COMPTROLLER GENERAL. On or before November 15 of each fiscal year (or on or before April 1, 1986, in the case of the fiscal year 1986), the Comptroller General shall submit to the Congress and the President a report on Ante, p. 1072. the extent to which the President's order issued under section 252(b) for such fiscal year complies with all of the requirements contained in section 252, either certifying that the order fully and accurately complies with such requirements or indicating the respects in which it does not.
section 252(e) of the Balanced Budget and Emergency Deficit Control Act of 1985
If the JSON o
نکته خیلی مهمی که میگه اینه که حتما باید Value ها حاوی کلید باشند مگرنه به مشکل میخوره
Original
woher kommt das Original? s. o.
be aware that in an asynchronous course MORE IS REQUIRED of you...o in terms of managing your own time, schedule, personal life and so on...▪ to get the course work done▪ with the flexibility to practically complete assignments any time / anywhere• be aware that EACH asynchronous class has its own structure, methods, requirements and soon...o college instructors are required to meet the learning goals of their Department▪ but they individually decide on specific curriculum or methods for their courseo focus on... and try your best... to meet the requirements and so on... for this asynchronouscourse▪ “It always seems impossible until it’s done”▪ complaining that this asynchronous course is not like another or a previous one doesnot get this course work done▪ energy spent complaining about the course does not get the course work done▪ while one student is complaining, another student is doing the course work▪ energy is better spent doing the course work▪ energy is better spent asking questions on the Q & A Discussion Forum▪ energy is better spent seeking various help early
Asynchronous courses necessitate more responsibility in managing time, schedule, and personal life in order to finish the coursework. Each asynchronous course has its own distinct structure, techniques, and requirements that are set by the instructor while complying with the Department's learning objectives. Concentrate on meeting the requirements of this specific asynchronous course and give it your all. Complaining or comparing the course to others will not assist you in completing the coursework. Concentrate your efforts on completing the coursework, asking questions on the discussion board, and getting help as soon as possible.
Schopenhauer dijo, «el hombre puede hacer lo que quiera, pero no puede querer lo que quiera.».
Uno no puede querer aquello que desconoce. También es posible que le hayan engañado respecto a las opciones que realmente tiene o estén manipulando la imagen que le dan de ciertas opciones para que las vea mal o bien según los intereses de otros.
and they were not of the sex which is supposed (2)
Tea drinking was a cultural practice in England during the late 19th century, and it was particularly significant for women. Tea ceremonies were a means for women to socialize, discuss important issues, and engage in polite conversation. According to the sentence, the tea ceremony participants "were not of the sex" assumed. In this instance, it illustrates the expectation of English society that tea drinking was primarily a female activity, reinforcing English gender norms and reflecting the segregated social spheres of the 19th century.
Qual é o futuro do mundo digital?
O museólogo Millard Shisler debate essa questão em seu painel intitulado "Photo Finished: A preservação, ou não, de fotografias digitais". São muitas as problemáticas levantadas. Entre elas, o custo para preservação de filmes no formato digital está sendo percebido, pelos grandes estúdios, como mais caro do que a preservação de mídia física em, por exemplo, 35mm. Isso se dá tanto pela complexidade inerente ao aspecto físico da mídia digital (a forma como bits se configuram em um hard drive), mas também a problemática de como os formatos de arquivos estão sempre mudando. Uma das soluções que o Millard propõe é a de se recorrer à mídia física como forma de preservação. Algo que se assemelha ao que Brenez fala a seguir. O futuro está no livro, e acho briilhaante como ela pontua a permanencia da referência da mídia física na constituição da mídia digital em relação às terminologias e até à própria disposição dos elementos.
O espectro das práticas de imagens não para de se ampliar. Em uma das múltiplas extremidades do rizoma: a automatização generalizada, sem precisar mais de humanos para fabricar imagens em massa, sem precisar mais preparar ferramentas ou se preparar para utilizá-las, sem precisar mais ler manuais, meditar sobre um conteúdo, avaliar destinatários, nem mesmo circulação. Tudo está instalado, disposto, otimizado, dublado, securizado, armazenado, sem necessidade de qualquer olhar. Em uma outra das múltiplas extremidades do rizoma: equipes de cientistas durante décadas percorrem milhares de quilômetros para registrar a ínfima cintilação de luz que confirmará, para eles, a existência de um exoplaneta, por exemplo, Proxima b.3
Esse trecho me faz refletir sobre a dualidade entre a facilidade e a complexidade envolvidas nas práticas de imagens atualmente. Por um lado, a automação e a otimização tecnológica tornaram a produção e o acesso às imagens mais fáceis e rápidos, eliminando a necessidade de intervenção humana em certos casos. Por outro lado, existem áreas do conhecimento que demandam uma dedicação intensa, como no exemplo dos cientistas que buscam registrar cintilações de luz para confirmar a existência de exoplanetas. Essa dualidade mostra como a tecnologia tem impactado nossas interações com as imagens, proporcionando tanto uma comodidade imediata como um desafio intelectual. É interessante refletir sobre como equilibramos essas duas extremidades e como essa ampliação do espectro de práticas de imagens afeta nossa forma de ver e compreender o mundo ao nosso redor.
QUAIS AS FUNÇÕES DAS IMAGENS NO SÉCULO 21?
As imagens são uma forma poderosa de comunicação, transmitindo mensagens e ideias de maneira rápida e impactante. Além disso,As imagens têm um papel central no entretenimento contemporâneo. Filmes, programas de TV, vídeos online e jogos eletrônicos usam imagens em movimento para contar histórias, criar emoções e proporcionar experiências imersivas. São muitas as funçãoes da imagem nesse seculo,incllusive As imagens têm o poder de moldar e influenciar a opinião pública, promover mudanças sociais e políticas e conscientizar sobre questões importantes e também tem função documental.Com o avanço da tecnologia e a proliferação dos meios de comunicação visual, o papel das imagens na sociedade tem evolução constante e se adapta às demandas e possibilidades do mundo contemporâneo.
O cinema sempre viveu abalos sísmicos e metamorfoses tecnológicas, mas nunca foi aí que sua grandeza artística entrava em jogo. Aqui, dois fenômenos podem confrontar os cinéfilos.
O texto discute a questão dos canais de distribuição de filmes e como isso afeta o pequeno comércio cinematográfico. O autor menciona dois fenômenos que afetam os cinéfilos.
O primeiro fenômeno abordado é a disponibilidade de filmes em sites piratas antes mesmo de seu lançamento nas salas de cinema. Isso representa um desafio para a Política dos Autores, que tradicionalmente enfatizava a importância dos diretores como criadores de obras de arte. No entanto, nos sites piratas, os filmes são procurados principalmente pelo título e data de lançamento, e o nome do diretor perde sua relevância. Isso sugere uma mudança na forma como as pessoas consomem filmes, não valorizando tanto a autoria.O segundo fenômeno mencionado é a digitalização em massa das obras cinematográficas, que protege e aumenta a visibilidade de filmes que antes eram considerados raros ou inacessíveis. Isso permite um acesso mais fácil a filmes engajados e experimentais, embora em versões possivelmente degradadas. O autor expressa esperança de que essa maior acessibilidade resulte em histórias mais justas e informadas sobre o cinema. A disponibilidade de filmes digitalizados pode contribuir para uma melhor compreensão e apreciação da diversidade cinematográfica.
“Poeta tão respeitoso da poesia que, em sua presença, não queria nem regras, nem leis, nem ciência, nem crítica, nem tradução, nem ordem, mas apenas a poesia que estremece nua em um cérebro;
Ainda na lógica da semiótica, essa fala me remete à uma certa rebeldia em relação aos estudos de Platão sobre o mundo inteligível e o mundo sensível, onde é criada uma terceira categoria chamada "simulacro" que se constitui pela "cópia da cópia", em outros termos, a arte, pois esta tende a imitar o mundo sensível que já é considerado uma cópia do mundo inteligível.
Em contraposição a esse pensamento, surge Aristóteles com uma visão muito mais aberta ao campo artístico e que acredita na possibilidade de "brincar" com a língua para atingir algo que o mesmo chamava de "katharsis" que seria a plena realização emocional de um indivíduo a partir da arte. A poesia era considerada por ele uma das principais e mais importantes formas artísticas de expressão, e a forma com que esse autor se expressou sobre sua relação com a poesia lembra bastante esse paradigma sobre qual seria o lugar da arte em nosso mundo.
– Desde o Renascimento ocidental, as imagens participam de um empreendimento científico, a conquista do visível e, em seguida, do invisível
Esse trecho me faz lembrar sobre como a construção imagética de mundo que temos hoje é fortemente pautada no ocidentalismo e na lógica da semiótica de Ferdinand de Saussure, um dos mais importantes estudiosos desse campo. Essa dualidade entre visível e invisível soa bastante semelhante aos conceitos do linguista de significante (a imagem acústica, ou seja, o “material” ou a representação) e significado, que seria o sentido que uma sociedade denomina para tal objeto/composição.
A “conquista” do invisível nessa fala me pareceu um desmembramento muito comumente usado no campo artístico ocidental: a subversão desses dois conceitos para a criação de novos sentidos, e o vídeo do efeito Kuleshov visto em uma das aulas é um ótimo exemplo desse desmembramento. Ao juntar o frame de um homem com outras imagens, como a de uma mulher ou uma criança falecida (significantes), gera-se outro significado que não é comumente associado àquelas imagens sozinhas, como o sentimento de paixão e tristeza, respectivamente.
Quais imagens ou agregados de planos contemporâneos a história vai reter, de quais precisaremos, a quais amaremos?
Engraçado pensar como na internet tudo é “permanente”, eu mesma ja ouvi esse tipo de comentário varias vezes, geralmente como forma de aviso pra ter cuidado com o que posta, mas, apesar dessa permanência não ser necessariamente falsa, todos esses dados são tão facilmente e rapidamente esquecíveis.
Nicéphore Niépce
Joseph Nicéphore Niépce foi um inventor francês responsável por uma das primeiras fotografias. []https://pt.wikipedia.org/wiki/Joseph_Nic%C3%A9phore_Ni%C3%A9pce
nolens volens
'A forma verbal latina volens significa «querendo», e a forma verbal nolens significa «não querendo».
As expressões volens, nolens ou nolens, volens significam «querendo ou não querendo».'
in Ciberdúvidas da Língua Portuguesa, https://ciberduvidas.iscte-iul.pt/consultorio/perguntas/a-expressao-latina-nolens-volens/19581 [consultado em 25-06-2023]
Note: This rebuttal was posted by the corresponding author to Review Commons. Content has not been altered except for formatting.
Learn more at Review Commons
__Reviewer 1____: __
1-Localization of ESYT1 and SYNJ2BP
The claim of a localization at ER-mitochondria contacts relies on two type of assays. Light microscopy and subcellular fractionation. Concerning microscopy, while the staining pattern is obviously colocalizing with the ER (a control of specificity of staining using KO cells would nevertheless be desirable)
the idea that ESYT1 foci "partially colocalized with mitochondria" is either trivial or unfounded
Every cellular structure is "partially colocalized with mitochondria" simply by chance at the resolution of light microscopy
If the meaning of the experiment is to show that ESYT1 'specifically' colocalizes with mitochondria, then this isn't shown by the data
There is no quantification that the level of colocalization is more than expected by chance
nor that it is higher than that of any other ER protein
Moreover, the author's model implies that ESYT1 partial colocalization with mitochondria is, at least partially, due to its interaction with SYNJ2BP. This is not tested.
- To analyze and measure MERCs parameters and functions, we used a set of validated methods described in the following specialized review articles (Eisenberg-Bord, Shai et al. 2016, Scorrano, De Matteis et al. 2019).
- To support and confirm the localization of ESYT1-SYNJ2BP complex at MERCs, we performed supplementary BioID analysis using ER target BirA*, OMM targeted BirA* and ER-mitochondria tether BirA* (Table S1, Figure S1 and Figure 1 A and B). These results confirmed the specificity of the interaction of the 2 partners. ESYT1 is not identified as a prey in OMM BioID and SYNJ2BP is not identified in ER BioID, on the other hand both partners are identified in the ER-mitochondria tether BioID.
- To improve our description of the partial localization of ESYT1 at mitochondria, we performed a quantitative analysis using confocal microscopy on control human fibroblasts stably overexpressing SEC61B-mCherry as an ER marker which were labelled with ESYT1 and TOMM40 for mitochondria. We measured the % of ESYT1 signal colocalizing with mitochondria and the % of mitochondria positive for ESYT1 (Figure 1E).
To demonstrate than ESYT1 partial colocalization with mitochondria is, at least partially, due to its interaction with SYNJ2BP, we performed a quantitative analysis using confocal microscopy. Human control fibroblasts, KO SYNJ2BP fibroblasts and SYNJ2BP overexpressing fibroblasts were labelled with ESYT1, TOMM40 for mitochondria and CANX for ER. We measured the % of ESYT1 signal colocalizing with mitochondria in each condition (Figure 3C). Membranes (MAM) can be purified and are enriched for proteins that localize at ER-mitochondria contacts. This idea originated in the early 90's and since then, myriad of papers has been using MAM purification, and whole MAM proteomes have been determined. Yet the evidence that MAM-enriched proteins represent bona fide ER-mitochondria-contact-enriched proteins (as can nowadays be determined by microscopy techniques) remain scarce. Here, anyway, ESYT1 fractionation pattern is identical to that of PDI, a marker of general ER, with no indication of specific MAM accumulation.
To highlight the enrichment of ESYT1 in the MAM fraction, we quantified the ESYT1 signal in each fraction. Those results show a similar fractionation pattern than the MAM resident protein SIGMAR1 (Figure 1F). For SYNJ2BP, it is different as it is more enriched in the MAM than the general mitochondrial marker PRDX3. However, PRDX3 is a matrix protein, making it a poor comparison point, since SYNJ2BP is an OMM protein.
To confirm the partial enrichment of SYNJ2BP in the MAM fraction compared to another outer mitochondrial membrane protein, we added the signal of the well characterized OMM protein CARD19 (Rios, Zhou et al. 2022). Again, the model implies that ESYT1 and SYNJ2BP accumulation in the MAM should be dependent on each other. This is not tested.
As describe above, we demonstrated in Figure 3C than the accumulation of ESYT1 at mitochondria is, at least partially, dependent on the quantity of SYNJ2BP.
- We moreover showed a reciprocal effect in Figure 3E. A quantitative analysis using confocal microscopy demonstrated that the effect of SYNJ2BP overexpression on MERCs formation is partially dependent of the presence of ESYT1. 2-ESYT1-SYNJ2BP interaction.
The starting point of the paper is a BioID signal for SYNJ2BP when BioID is fused to ESYT1. One confirmation of the interaction comes in figure 4, using blue native gel electrophoresis and assessing comigration. Because BioID is promiscuous and comigration can be spurious, better evidence is needed to make this claim. This is exemplified by the fact that, although SYNJ2BP is found in a complex comigrating with RRBP1, according to the BN gel, this slow migrating complex isn't disturbed by RRBP1 knockdown, but is somewhat disturbed by ESYT1 knockdown. More than a change in abundance, a change in migration velocity when either protein is absent would be evidence that these comigrating bands represent the same complex.
- We showed in Figure 4C that the presence of SYNJ2BP in a complex of a similar molecular weight that ESYT1 (410KDa) is totally dependent of the presence of ESYT1, suggesting an interaction of the 2 proteins.
To confirm this interaction, in figure 4A we analyzed on BN cells overexpressing SYNJ2BP together with a 3xFlag tagged version of ESYT1. As a result of the addition of the Flag tag, the complex positive for ESYT1 shifted to a higher molecular weight. The complex positive for SYNJ2BP shifted to a similar the molecular weight, demonstrating the interaction and dependence of the 2 partners. ESYT1-SYNJ2BP interaction needs to be tested by coimmunoprecipitation of endogenous proteins, yeast-2-hybrid, in vitro reconstitution or any other confirmatory methods.
To confirm the interaction of the 2 partners, we performed co-immunoprecipitation of the ESYT1-3xFlag protein that we showed in Figure 1H to form complexes similar to the endogenous protein. SYNJ2BP is found as the strongest prey, followed by ESYT2 and SEC22B two described interactors of ESYT1, confirming the quality of the analysis (Table S2) (Giordano, Saheki et al. 2013, Gallo, Danglot et al. 2020). 3-Tethering by ESYT1- SYNJ2BP.
This is assessed by light and electron microscopy. Absence of ESYT1 decreases several metrics for ER-mitochondria contacts (whether absence of SYNJ2BP has the same effect isn't tested).
- Using PLA (proximity ligation assay) we demonstrated that the loss of SYNJ2BP leads to a decrease in MERCs (Figure 7 H and I), confirming previous studies (Ilacqua, Anastasia et al. 2022, Pourshafie, Masati et al. 2022). This interesting phenomenon could be due to many things, including but not limited to the possibility that "ESYT1 tethers ER to mitochondria".
This statement and the respective subheading title are therefore clearly overreaching and should be either supported by evidence or removed.
Indeed, absence of ESYT1 ER-PM tethering and lipid exchange could have knock-on effects on ER-mito contacts, therefore strong statements aren't supported.
Moreover, the effect on ER-mitochondria contact metrics could be due to changes in ER-mitochondria contact indeed but may also reflect changes in ER and/or mitochondria abundance and/or distribution, which favour or disfavour their encounter. Abundance and distribution of both organelles are not controlled for.
The mitochondrial phenotypes caused by the loss of ESYT1 are all rescued by the introduction of an artificial mitochondrial-ER tether, demonstrating that they are due to loss of the tethering function of ESYT1. Finally, the authors repeat a finding that SYNJ2BP overexpression induces artificial ER-mitochondria tethering. Again, according to the model, this should be, at least in part, due to interaction with ESYT1. Whether ESYT1 is required for this tethering enhancement isn't tested.
As described above, we demonstrated in Figure 3C that the accumulation of ESYT1 at mitochondria is, at least partially, dependent on the quantity of SYNJ2BP.
- We moreover showed a reciprocal effect in Figure 3F. A quantitative analysis using confocal microscopy demonstrated that the effect of SYNJ2BP overexpression on MERC formation is partially dependent of the presence of ESYT1. 4-Phenotypes of ESYT1/SYNJ2BP KD or KO.
The study goes in details to show that downregulation of either protein yields physiological phenotypes consistent with decreased ER-mitochondria tethering. These phenotypes include calcium import into mitochondria and mitochondrial lipid composition.
Figure 5 shows that histamine-evoked ER-calcium release cause an increase in mitochondrial calcium, and this increase is reduced in absence of ESYT1, without detectable change in the abundance of the main known players of this calcium import. This is rescued by an artificial ER-mitochondria tether. However, Figure 5D shows that the increase in calcium concentration in the cytosol upon histamine-evoked ER calcium release is equally impaired by ESYT1 deletion, contrary to expectation. Indeed, if the impairment of mitochondrial calcium import was due to improper ER-mitochondria tethering in ESYT1 mutant cells, one would expect more calcium to leak into the cytosol, not less.
The remaining explanation is that ESYT1 knockout desensitizes the cells to histamine, by affecting GPCR signalling at the PM, something unexplored here.
In any case, a decreased calcium discharge by the ER upon histamine treatment, explains the decreased uptake by mitochondria.
The authors argue that ER calcium release is unaffected by ESYT1 KO, but crucially use thapsigargin instead of histamine to show it. Thus, the most likely interpretation of the data is that ESYT1 KO affects histamine signalling and histamine-evoked calcium release upstream of ER-mitochondria contacts.
- Silencing ESYT1 impairs SOCE efficiency in Jurkat cells (Woo, Sun et al. 2020), but not in HeLa cells (Giordano, Saheki et al. 2013, Woo, Sun et al. 2020). Analysis of the role of ESYT1 in HeLa cells prevents confounding effects due to the loss of ESYT1 at ER-PM. In this model, knock-down of ESYT1 led to a decrease of mitochondrial Ca2+ uptake from the ER upon histamine stimulation, as monitored by genetically encoded Ca2+ indicator targeted to mitochondrial matrix (Figure 5A and B). ESYT1 silencing in HeLa cells did not impact ER Ca2+ store measured by the ER-targeted R-GECO Ca2+ probe (Figure 5C and D). The expression of the artificial mitochondria-ER tether was able to rescue mitochondrial Ca2+ defects observed in ESYT1 silenced cells (Figure 5B), confirming that the observed anomalies are specifically due to MERC defects.
- In contrast loss of ESYT1 impaired SOCE efficiency in fibroblasts (Figure 6 A and B). This phenotype was fully rescued by re-expression of ESYT1-Myc but not the artificial tether. We therefore investigated the influence of ESYT1 loss on cytosolic Ca2+ concentration following ATP (Figure 6F to H) or histamine stimulation (Figure S3 D to F), both of which showed a reduced cytosolic Ca2+ concentration and uptake in ESYT1 KO cells. This phenotype was fully rescued by the re-expression of ESYT1-Myc but not the artificial tether. Measurment of cytosolic Ca2+ after tharpsigargin treatment in Ca2+-fee media, an inhibitor of the sarco/endoplasmic reticulum Ca2+ ATPase SERCA that blocks Ca2+ pumping into the ER, showed that ESYT1 KO does not influence the total ER Ca2+ pool (Figure 6K and L). However, ER-Ca2+ release capacity upon histamine stimulation (Figure 6I and J) is decreased in ESYT1 KO cells. This phenotype was fully rescued by the re-expression of ESYT1-Myc but not the artificial tether. Loss of ESYT1 decreased the Ca2+ uptake capacities of mitochondria after activation with histamine (Figure S3 A to C) or ATP (Figure 6 C to E). This phenotype was rescued by re-expression of ESYT1-Myc and also the engineered ER-mitochondria tether. Thus, despite the ER-Ca2+ release defect observed after ESYT1 loss, the artificial tether fully rescued the mitochondrial phenotype.
These results highlight the distinct and dual roles of ESYT1 in Ca2+ regulation at the ER-PM and at MERCs. The data with SYNJ2BP deletion are more compatible with decreased ER-mito contacts, as no decreased in cytosolic calcium is observed. This is compatible with the previously proposed role of SYNJ2BP in ER-mitochondria tethering, but the difference with ESYT1 rather argue that both proteins affect calcium signaling by different means, meaning they act in different pathways.
We explain the different results concerning cytosolic calcium by the fact that ESYT1 is a bi-localized protein with dual functions on cellular calcium. Implicated both in SOCE at ER-PM and in mitochondrial calcium uptake at MERCs. On the other hand, SYNJ2BP is only present at MERCs and its loss do not influence PM-ER signaling or ER-Ca2+ release. Finally, the study delves into mitochondrial lipids to "investigated the role of the SMP-domain containing protein ESYT1 in lipid transfer from ER to mitochondria". In reality, it is not ER-mitochondria lipid transport that is under scrutiny, but general lipid homeostasis, and changes in ER-PM lipids could have knock-on effects on mitochondrial lipids without the need to invoke disruptions in ER-mitochondria transfer activity.
The fact that the artificial tether, which specifically rescue MERCs, fully rescue the lipid phenotype argue for a direct loss of MERCs tethering function when ESYT1 is missing. The changes observed are interesting but could be due to anything. Surprisingly, PCA analysis shows that the rescue of the knockout by the ESYT1 gene clusters with the rescue by the artificial tether, and not with the wildtype. This indicates that overexpressing either ESYT1 or a tether cause similar lipidomic changes. These could be due, for instance, to ER stress caused by protein overexpression, and not to a rescue.
In order to verify if the overexpression of ESYT1 or the artificial tether induces ER stress, we performed a WB analysis to compare markers of ER stress in control fibroblasts, KO ESYT1 fibroblasts, KO ESYT1 fibroblasts overexpressing ESYT1-Myc or the tether (Figure S4C). This showed no changes in the levels of several different markers of ER stress or cell death. __Reviewer 2____: __
1) the interaction between those proteins is direct,
2) if SYNJ2BP is necessary and sufficient to localize E-Syt1 at MERC, and
3) if MERCs extension induced by SYNJ2BP is dependent on E-Syt1.
Those points are important to investigate because SYNJ2BP has already been shown to induce MERCs by interacting with the ER protein RRBP1. In addition, some experiments need to be better quantified.
Major comments: E-syt1/SYNJ2BP in MERCs formation: the authors provide several convincing lines of evidence that both proteins are in the same complex (proximity labelling, localization in the same complex in BN-PAGE, localization in MAM) but it is not clear in which extent the direct interaction between both proteins regulates ER-mitochondria tethering. 1- Pull down experiments or BiFC strategy could be performed to show the direct interaction between both proteins.
- We showed in Figure 4C that the presence of SYNJ2BP in a complex of a similar molecular weight to that ESYT1 (410KDa) is totally dependent of the presence of ESYT1, suggesting an interaction of the 2 proteins.
- To confirm this interaction, in figure 4A we analyzed on BN cells overexpressing SYNJ2BP together with a 3xFlag tagged version of ESYT1. As a result of the addition of the Flag tag, the complex positive for ESYT1 shifted to a higher molecular weight. Significantly, the complex positive for SYNJ2BP shifted to a similar the molecular weight, demonstrating the interaction and dependence of the 2 protein partners.
To confirm the interaction of the 2 partners, we performed co-immunoprecipitation of the ESYT1-3xFlag protein (Table S2). SYNJ2BP was found as the strongest prey, followed by ESYT2 and SEC22B two described interactors of ESYT1, confirming the quality of the analysis (Giordano, Saheki et al. 2013, Gallo, Danglot et al. 2020). 2- SYNJ2BP OE has already been demonstrated to increase MERCs and this being dependent on the ER binding partners RRBP1 (10.7554/eLife.24463). Therefore, it would be of interest to perform OE of SYNJ2BP in KO Esyt1 to address the question of whether ESyt1 is also required to increase MERCs.
A quantitative analysis using confocal microscopy demonstrated that the effect of SYNJ2BP overexpression on MERCs formation is partially dependent of the presence of ESYT1 (Figure 3F). 3- The authors show that Esyt1 punctate size increases when SYNJ2BP is OE (Fig3C), but this can be indirectly linked to the increase of MERCs in the OE line. Thus, it could be interesting to test if the number/shape of E-syt1 punctate located close to mitochondria decreases in KO SYNJ2B. This could really show the dependence of SYNJ2BP for E-syt1 function at MERCs.
To improve our description of the partial localization of ESYT1 at mitochondria, we performed a quantitative analysis using confocal microscopy on control human fibroblasts stably overexpressing SEC61B-mCherry as an ER marker which were labelled with ESYT1 and TOMM40 for mitochondria. We measured the % of ESYT1 signal colocalizing with mitochondria and the % of mitochondria colocalizing with ESYT1 (Figure 1E).
To demonstrate than ESYT1 partial colocalization with mitochondria is, at least partially, due to its interaction with SYNJ2BP, we performed a quantitative analysis using confocal microscopy. Human control fibroblasts, KO SYNJ2BP fibroblasts and SYNJ2BP overexpressing fibroblasts were labelled with ESYT1, TOMM40 for mitochondria and CANX for ER. We measured the % of ESYT1 signal colocalizing with mitochondria in each condition (Figure 3C). Lipid analyses: the results of MS on isolated mitochondria clearly show that mitochondrial lipid homeostasis is affected on KO-Syt1 and rescued by expression of Syt1-Myc and artificial mitochondria-ER tether. However, p.15, the authors wrote "The loss of ESYT1 resulted in a decrease of the three main mitochondrial lipid categories CL, PE and PI, which was accompanied by an increase in PC ». As the results are expressed in mol%, this interpretation can be distorted by the fact that mathematically, if the content of one lipid decreases, the content of others will increase. I would suggest to express the results in lipid quantity (nmol)/mg of mitochondria proteins instead of mol%. This will clarify the role of E-Syt1 on mitochondrial lipid homeostasis and which lipid increase and decrease.
We changed the sentence in the text as suggested. Also it could be of high interest to have the lipid composition of the whole cells to reinforce the direct involvement of E-Syt1 in mitochondrial lipid homeostasis and verify that the disruption of mitochondrial lipid homeostasis is not linked to a general perturbation of lipid metabolism as this protein acts at different MCSs.
This is beyond the scope of the project and we would argue that the results of such an experiment would be difficult to interpret. To better understand the impact of Esyt1 of mitochondria morphology, the author could analyze the mitochondria morphology (size, shape, cristae) on their EM images of crt, KO and OE lines. Indeed, on OE (Fig3A), the mitochondria look bigger and with a different shape compared to crt.
As we do not observe obvious differences in mitochondrial morphology between control, KO and OE fibroblasts we do not think that quantitative analysis would add to the understanding of the effect of ESYT1 on mitochondrial function. Also, they performed a lot of BN-PAGE. Is it possible to check whether the mitochondrial respiratory chain super-complexes are affected on Esyt1 KO line compared to crt?
We decided to remove the data on the metabolic consequences of ESYT1 loss since it was too preliminary and required deeper investigations, focusing instead on the effect of ESYT1 loss on calcium homeostasis. Quantifications: some western blots needs to be quantified (Fig 5K, 6J, S3E);
We did not observe obvious differences in the protein levels so we think that quantitation would not add significantly to the understanding of the differences in calcium dynamics that we report. Fig1A: Can the author provide a higher magnification of the triple labeling and perform quantification about the proportion of E-Syt1 punctate located close to mitochondria?
We added higher magnification of the same area in all channels and arrows that point to the foci of ESYT1 colocalizing with both ER and mitochondria (Figure 1D).
To improve our description of the partial localization of ESYT1 at mitochondria, we performed a quantitative analysis using confocal microscopy on control human fibroblasts stably overexpressing SEC61B-mCherry as an ER marker which were labelled with ESYT1 and TOMM40 for mitochondria. We measured the % of ESYT1 signal colocalizing with mitochondria and the % of mitochondria colocalizing with ESYT1 (Figure 1E). Minor comments:
Fig1E + text: according to the legend, the BN-PAGE has been performed on Heavy membrane fraction. Why the authors speak about complexes at MAM in the text of the corresponding figure? Is-it the MAM or the heavy fraction (MAM + mito + ER...)? If BN have been performed from heavy membranes, it is not a real proof that E-syt1 is in MAMs.
Heavy membranes have been used in this experiment. The text and conclusions have been changed accordingly.
On fig3C (panel crt): it seems like SYNJ2BP dots are not co-localizaed with mito. Is this protein targeted to another organelle beside mitochondria?
It is not described that SYNJ2BP would be targeted to another organelle beside mitochondria. It is possible that those dots outside of mitochondria could be non-specific signals from the antibody we used.
Fig4A: can the author provide a control of protein loading (membrane staining as example) to confirm the decrease of E-Syt1 in siSYNJ2BP?
As we performed this experiment only once we have removed the statement suggesting a decrease in ESYT1 protein in response to the siSYNJ2BP.
Fig5E/F: it is not clear to me why the expression of E-Syt1 in the KO is not able to complement the KO phenotype for cytosolic Ca++. Can the authors comment this?
We performed further analysis using ATP to trigger calcium release from the ER (figure 6 F to H). In those conditions, expression of ESYT1 in the KO is able to complement the KO phenotype for cytosolic Ca2+. __Reviewer 3____: __
Main points 1. Confirming the MERC localization of ESYT1 should include some more of tethering factors as demonstrated interactors (some are mentioned above) and should not be limited to lipid homeostasis.
- As shown in Figure 1B, VAPB, PDZD8 and BCAP31 are found as preys in the ESYT1 bioID analysis. Those proteins have been described as MERC tethers, their loss leading to mitochondrial calcium defects. To support and confirm the specificity of ESYT1-SYNJ2BP complex at MERCs, we performed a supplementary BioID analysis using ER targeted BirA* and OMM targeted BirA* (Table S1, Figure S1 and Figure 1 A and B). These results confirmed the specificity of the interaction of the 2 partners. ESYT1 is not identified as a prey in OMM BioID and SYNJ2BP is not identified in ER BioID. Additional ER-mitochondria tether BirA* analyses showed that tether-BirA* identified both ESYT1 and SYNJ2BP as a prey at MERCs, confirming the localisation of this interaction. Interestingly, a large majority of the known MERCs tethers VAPB-PTPIP51, MFN2, ITPRs, BCAP31 are also found as preys in the tether-BirA* (Figure 1B), confirming the quality of these data.
- To confirm the interaction of the 2 partners, we performed co-immunoprecipitation of the ESYT1-3xFlag protein. SYNJ2BP is found as the strongest prey, followed by ESYT2 and SEC22B two described interactors of ESYT1, confirming the quality of the analysis (Table S2) (Giordano, Saheki et al. 2013, Gallo, Danglot et al. 2020).
The fact that in ESYT1 KO cells both mitochondrial calcium transfer and cytosolic calcium accumulation are accompanied by decreased ER-cepia1ER signal decay upon histamine addition suggest that the main reason for ER-mitochondria calcium transfer defects are due to impaired SOCE. Calcium-free medium and histamine are used to show that ESYT1 does not affect ER calcium content. However, if it affects SOCE, then the absence of extracellular calcium would abolish such an effect; moreover, histamine does not test for leak effects. As additional information, the authors should investigate whether ER calcium content is affected by the presence of extracellular calcium in the ko scenario using thapsigargin. The authors should inhibit SOCE to test whether this mechanism is affected in ESYT1 KO and could account for observed signal differences. Excluding SOCE is critical, since any change in calcium entry from the outside would potentially negate a role of ESYT1 in mitochondrial calcium uptake.
- Silencing ESYT1 impairs SOCE efficiency in Jurkat cells (Woo, Sun et al. 2020), but not in HeLa cells (Giordano, Saheki et al. 2013, Woo, Sun et al. 2020). Analysis of the role of ESYT1 in HeLa cells prevents confounding effects due to the loss of ESYT1 at ER-PM. In this model, knock-down of ESYT1 led to a decrease of mitochondrial Ca2+ uptake from the ER upon histamine stimulation, as monitored by genetically encoded Ca2+ indicator targeted to mitochondrial matrix (Figure 5A and B). ESYT1 silencing in HeLa cells did not impact ER Ca2+ store measured by the ER-targeted R-GECO Ca2+ probe (Figure 5C and D). The expression of the artificial mitochondria-ER tether was able to rescue mitochondrial Ca2+ defects observed in ESYT1 silenced cells (Figure 5B), confirming that the observed anomalies are specifically due to MERC defects.
- In contrast loss of ESYT1 impaired SOCE efficiency in fibroblasts (Figure 6 A and B). This phenotype was fully rescued by re-expression of ESYT1-Myc but not the artificial tether. We therefore investigated the influence of ESYT1 loss on cytosolic Ca2+ concentration following ATP (Figure 6F to H) or histamine stimulation (Figure S3 D to F), both of which showed a reduced cytosolic Ca2+ concentration and uptake in ESYT1 KO cells. This phenotype was fully rescued by the re-expression of ESYT1-Myc but not the artificial tether. Measurment of cytosolic Ca2+ after tharpsigargin treatment in Ca2+-fee media, an inhibitor of the sarco/endoplasmic reticulum Ca2+ ATPase SERCA that blocks Ca2+ pumping into the ER, showed that ESYT1 KO does not influence the total ER Ca2+ pool (Figure 6K and L). However, ER-Ca2+ release capacity upon histamine stimulation (Figure 6I and J) is decreased in ESYT1 KO cells. This phenotype was fully rescued by the re-expression of ESYT1-Myc but not the artificial tether. Loss of ESYT1 decreased the Ca2+ uptake capacities of mitochondria after activation with histamine (Figure S3 A to C) or ATP (Figure 6 C to E). This phenotype was rescued by re-expression of ESYT1-Myc and also the engineered ER-mitochondria tether. Thus, despite the ER-Ca2+ release defect observed after ESYT1 loss, the artificial tether fully rescued the mitochondrial phenotype.
- These results highlight the distinct and dual roles of ESYT1 in Ca2+ regulation at the ER-PM and at MERCs.
The authors claim that ER-Geco measurements show that no change of ER calcium was observed. However, they use thapsigargin treatment and then get a peak, when the signal should show a decrease due to leak. This suggests they did not use ER-Geco in Figure S3C. What was measured and what does it mean?
- We used R-GECO (not ER-GECO) which measures the cytosolic calcium.
- We measured total ER Ca2+ store using the cytosolic-targeted R-GECO Ca2+ probe upon thapsigarin treatment, an inhibitor of the sarco/endoplasmic reticulum Ca2+ ATPase SERCA that blocks Ca2+ pumping into the ER (Figure 5C and D) and observed no difference in our different conditions.
The findings on growth in galactose medium are intriguing but are not accompanied by respirometry to confirm mitochondria are compromised upon ESYT1 KO.
- We decided to remove the data on the metabolic consequences of ESYT1 loss since it was to preliminary and required deeper investigations, focusing instead on the effect of ESYT1 loss on calcium homeostasis
Minor points: 1. The authors mention they measure mitochondrial uptake of "exogenous" calcium by applying histamine. They should specify that these measures transferred calcium from the ER rather than uptake of calcium from the exterior (directly at the plasma membrane).
The text was clarified as suggested.
Expression levels of IP3Rs are not very indicative of any change of their activity. The authors should discuss how ESYT1 could affect their PTMs.
- A large numer of post translational modifications are known to regulate IP3R activity (Hamada and Mikoshiba 2020), and it is possible that the loss of ESYT1 could interfere with these modifications, but an exploration of this issue is beyond the scope of this study. The text was clarified as suggested. Eisenberg-Bord, M., N. Shai, M. Schuldiner and M. Bohnert (2016). "A Tether Is a Tether Is a Tether: Tethering at Membrane Contact Sites." Dev Cell 39(4): 395-409.
Gallo, A., L. Danglot, F. Giordano, B. Hewlett, T. Binz, C. Vannier and T. Galli (2020). "Role of the Sec22b-E-Syt complex in neurite growth and ramification." J Cell Sci 133(18).
Giordano, F., Y. Saheki, O. Idevall-Hagren, S. F. Colombo, M. Pirruccello, I. Milosevic, E. O. Gracheva, S. N. Bagriantsev, N. Borgese and P. De Camilli (2013). "PI(4,5)P(2)-dependent and Ca(2+)-regulated ER-PM interactions mediated by the extended synaptotagmins." Cell 153(7): 1494-1509.
Hamada, K. and K. Mikoshiba (2020). "IP(3) Receptor Plasticity Underlying Diverse Functions." Annu Rev Physiol 82: 151-176.
Ilacqua, N., I. Anastasia, D. Aloshyn, R. Ghandehari-Alavijeh, E. A. Peluso, M. C. Brearley-Sholto, L. V. Pellegrini, A. Raimondi, T. Q. de Aguiar Vallim and L. Pellegrini (2022). "Expression of Synj2bp in mouse liver regulates the extent of wrappER-mitochondria contact to maintain hepatic lipid homeostasis." Biol Direct 17(1): 37.
Pourshafie, N., E. Masati, A. Lopez, E. Bunker, A. Snyder, N. A. Edwards, A. M. Winkelsas, K. H. Fischbeck and C. Grunseich (2022). "Altered SYNJ2BP-mediated mitochondrial-ER contacts in motor neuron disease." Neurobiol Dis: 105832.
Rios, K. E., M. Zhou, N. M. Lott, C. R. Beauregard, D. P. McDaniel, T. P. Conrads and B. C. Schaefer (2022). "CARD19 Interacts with Mitochondrial Contact Site and Cristae Organizing System Constituent Proteins and Regulates Cristae Morphology." Cells 11(7).
Scorrano, L., M. A. De Matteis, S. Emr, F. Giordano, G. Hajnoczky, B. Kornmann, L. L. Lackner, T. P. Levine, L. Pellegrini, K. Reinisch, R. Rizzuto, T. Simmen, H. Stenmark, C. Ungermann and M. Schuldiner (2019). "Coming together to define membrane contact sites." Nat Commun 10(1): 1287.
Woo, J. S., Z. Sun, S. Srikanth and Y. Gwack (2020). "The short isoform of extended synaptotagmin-2 controls Ca(2+) dynamics in T cells via interaction with STIM1." Sci Rep 10(1): 14433.
Bij een medeklinker (ook wel consonant genoemd) kan de lucht niet ongehinderd naar buiten komen wanneer je praat. Er is een blokkade door bijvoorbeeld je tong, tanden, keel of lippen. Dit is het geval bij bijna alle letters van het alfabet, behalve de klinkers. Bij een klinker (ook wel vocaal genoemd) kan de lucht dus wél ongehinderd naar buiten komen wanneer je praat. Klinkers zijn de a, e, i, o en u in het alfabet
With vowels, there is no blockage when you say them, opposed to consonants, which seem to block the airway (I tested this, and this is the case: back in school, I never realised this... makes a lot of sense now)
“Onde habilidades como criatividade, empatia e resiliência estão mencionadas no currículo do aluno?”, questiona Noah Geisel, professor e gerente do Programa de Microcredenciais da Universidade do Colorado Boulder, no primeiro painel do evento virtual ‘O admirável futuro da educação superior’, promovido pelo Semesp, que acontecerá até sexta-feira, dia 28.
If you’ll forgive the pun, there are no constants in programming – the opinions that Rails enshrines, even for great benefit, will change, and even the principles of O-O design are only principles, not immutable laws that should be blindly followed for the rest of time. There will be other ways of doing things. Change is inevitable.
"o music is to take part, in any capacity, in a musical performance, whether by performing, by listening, by rehearsing or practicing, by providing material for performance (what is called compos- ing), or by dancing." (15) definition of musicking, main argument.
second paragraph on page 307 starting from "The other is for the material to fall within the category o f what the musically untrained listener would call “natural” music:"
I find this interesting, the concept of natural musical language and that that is developed and harnessed from a very young age, from nursery rhymes.
This is kind of demeaning to all popular music -- I don't agree/don't enjoy this take.
"The beginning o f the chorus is replaceable by the beginning of innumerable other choruses" (303)
f it indicates, whether by stating a fixed time for acceptance orotherwise, that it is irrevocable; o
within that time it is irrevocable
Note: This rebuttal was posted by the corresponding author to Review Commons. Content has not been altered except for formatting.
Learn more at Review Commons
We would like to thank the reviewers for their insightful comments. We believe that the changes that have been suggested will add greatly to this paper, and we will endeavor to incorporate as many of these suggestions as we can.
Reviewer #1
This is an interesting study, which presents yet another mechanism involved in the regulation of tumour associated paraneoplastic syndromes, such as muscle wasting. It suggest the intriguing possibility of using a hight fat diet and modulating mitochondrial metabolism as a means of alleviating cachectic muscle wasting. However, as it stands, these aspects of the study remains rather preliminary. This is particularly the case regarding the role of dietary interventions in the model and understanding of the type of metabolic reprogramming in wasting muscles, which lack direct experimental evidence. If the authors were able to further develop this aspects of the study with robust experimental work, it will make it a very valuable and impactful report.
1- All the mitochondrial phenotypes presented should be compared in the two different tumour models (Gal4/UAS and the QF/QUAS driven), which are indistinctively used throughout the study.
We will ensure that mitochondrial size and TMRE staining are performed in the two different tumour models so that they can be compared.
2- The mitochondrial phenotype of wasting muscles is only evident towards the late stages of tumourigenesis (7 day old larvae). Mitochondria of 5 day old tumour bearing animals is indistinct from the control ones. Given that 5 days is the oldest wild type larvae available, the authors need to assess the mitochondrial size and function in muscles form developmentally delayed, no-tumour bearing larvae to discard a trivial contribution of failed metamorphosis in such phenotype.
We will examine mitochondrial size and TMRE in pmhGal4 > torsoRNAi animals (which undergo delayed metamorphosis) compared with control animals.
4- TMRE staining presented in Figure 1 is not convincing. If available, a biochemical and/or more quantitative method to address mitochondrial function should be used.
We will perform ATP synthesis and O2 consumption assays to provide a biochemical method to accompany the TMRE assays.
5- Related to the point above. The extent of the mitochondrial phenotype following genetic manipulations in the tumour or muscle is not consistently analysed. In some cases, mitochondrial size and activity is assessed but in multiple cases, only mitochondrial size is measured. Mitochondrial activity should be assessed in all cases also.
We will assess mitochondrial activity in a time course of RasV12DlgRNAi vs w1118, as well as tumor-bearing animals treated with nicotinamide, QF-QUAS RasV12scribRNAi, MHC> foxoRNAi, and RasV12DlgRNAi > Impl2RNAi.
6- Are mitochondrial fusion proteins such as Marf upregulated in muscles undergoing wasting in Rasv12dlg RNAi animals?
Regulation of neither Opa1 nor Marf are altered in our proteomics study.
7- Is overexpression of mitochondrial fusion proteins alone sufficient to induce muscle wasting?
No, overexpression of Marf was not sufficient to induce muscle wasting, however overexpression of Marf caused worsened muscle wasting in tumour-bearing animals. We will include this data in our revised manuscript.
8- Is there a change in the expression of ATP5A in the muscles of bearing animals RasV12dlgRNAi, which has dysfunctional mitochondria compared to the control?
There is no change in ATP5A expression in our proteomics study.
9- Regarding measures of insulin signaling activity in muscle (Figure 2): the data provide on FOXO staining is not very convincing. Improved staining and robust and more quantitative measure of insulin signaling activity, such as western blot analysis of pAkt should be provided. Apart from the nucleus, there is an overall increase in FOXO expression in the muscle cells of RasV12dlgRNAi compared to the control. In control animals, there is no signal of FOXO. How do you explain this?
We have attempted western blots of pAkt in tumour-bearing muscle previously and found that tumour metastases caused unreliable results, making immuno-staining a more reliable option. However, pAkt antibody staining also does not work well in the muscles. The control image we displayed was an extreme example, so we will choose more representative images that show more consistent FOXO staining.
12- In S3 J-L, Since MHC expression is also dependent upon muscle health and integrity, it would be better to use another, and more universal, readout for protein translation/synthesis. For example, labelling the tissue with Puromycin or staining for translation initiation factors.
We will perform O-propargyl-puromycin (OPP) staining for a w1118 vs RasV12DlgRNAi time course to provide another translation readout to accompany the MHC staining.
13- How does lipid/high fat diet restore muscle wasting? What happens to the tumours of high fat and Nicotinamide feed animals? In all cases, the impact on tumour size upon genetic manipulations of the muscle should be shown.
We will measure tumour size in tumour-bearing animals on both nicotinamide and high-fat diets, as well as QF-QUAS RasV12scribRNAi MHC> foxoRNAi, marfRNAi and whdRNAi animals. Impl2RNAi in tumour-bearing animals has been shown already (Lodge et al., 2021).
14- Does NAM feeding or High-fat diet restore whd transcript levels??
We will perform qPCR to examine whd transcript levels in tumour-bearing animals on nicotinamide diets as well as high-fat diets.
15- Do these feeding regimes restore insulin signaling in RasV12dlgRNAi animals?
We have demonstrated that for RasV12dlgRNAi animals fed a nicotinamide diet, FOXO levels are decreased (Fig 5D). We will do the same experiment for tumour-bearing animals fed a high fat diet.
17- Related to the point above, DAPI and phalloidin should be included when showing lipid staining to understand better the cellular structures present in the field of view along with the lipid droplets.
DAPI and phalloidin staining is not compatible with lipid staining, as they require the use of PBST (detergent) which breaks down extracellular lipids. We will include more representative, raw images in which the details of the muscle can be seen.
Minor comments<br /> 1. The order of panels in the figures and the main text should be the same for better readability.
We will revisit the figures to ensure readability is improved.
- Figure S3 G-H: The image looks out of focus. Is Atg8 expression high near to the nucleus?
Atg8a expression is highest near the nucleus, and is decreased in RasV12dlgRNAi > Impl2RNAi animals. We will provide more representative images to make this clearer.
Reviewer #2
This manuscript proposes and interesting new mechanism how tumours non-autonomously induce muscle mass loss (cachexia) in a genetic Drosophila model. These effects can be modified by diet. Hence results are interesting for both basic and more clinically interested audience.<br /> The weak point of the paper is the limited quantification of mitochondria sizes/morphologies, which is an important point that asks for significant improvement of either the imaging conditions or the image analysis.
- The authors provide evidence that eye or imaginal disc tumours induce larger mitochondria in muscles. The authors try to quantify mitochondrial sizes using an automated analysis. This is a tricky task from their light microscopy images that appear to be limited in resolution. By looking at the Suppl. Figure 1, I wonder how relevant an increase of a "large" mitochondria fraction from 7 to 12 % is in the tumour larvae, considering that a significant fraction of the mitochondria are currently not counted, as they are too large to be investigated (white colours in S1F, G). Can the authors increase resolution to resolve these large clumps that likely consist of individual mitochondria to reliably segment all of them, and not only a sub fraction. It would be useful to display the size profiles of all mitochondria in various conditions and not only of a very selected subset of "large" mitochondria. This comment applies to all figures in which mitochondria size was quantified and hence is critical for the entire manuscript.
We will utilise a newly developed segmentation and centroid tracking-based analysis pipeline based in MATLAB, that may be able to separate the large clumps of mitochondria, to ensure that as many mitochondria can be quantified as possible. We will also provide size profiles of all mitochondria sizes from all conditions in which we performed mitochondria size analysis.
- Comparing MitoTracker to TMRE is a valid approach to estimate mitochondria activity/health. The images shown in 1H,I are overview images that seem to show large regional differences in the muscles of unclear origin. High resolution images of representative regions as shown for the ATP5A stains would be more convincing as these can resolve individual mitochondria to hopefully see damaged ones next to normal ones. Would "active" mitochondria not be expected to be the ones that oxidise a lot of fatty acid break down products?
We will take representative zoomed in images for 1H & I to better demonstrate mitochondria morphology.
- The authors find that co-overexpressing FOXO in muscles results in a more severe muscle degeneration phenotype in tumour bearing animals than tumour alone. However, it seems the important control of FOXO overexpression in an otherwise wildtype animal is missing. In order to judge if the muscles really detach in these genotypes, instead of shrink and finally rupture, high resolution images of muscle attachment sites would be needed.
We will assess if MHCGal4 > UAS dFOXO causes loss of muscle integrity. In addition, in both wildtype and tumour-bearing animals, we will overexpress FOXO in the muscles and stain for muscle attachment proteins such as tiggrin to determine if the phenotype seen is caused by a mislocalisation of proteins at attachment sites.
- The strongly reduced lipid droplets in the tumour bearing animals is interesting. To better normalise for the reduced size of the muscles, a counter staining for muscle and a following normalisation would make the statement stronger and thus better support the conclusion.
As mentioned above we will provide more representative images to help visualize muscle structures in LipidTOX experiments. In addition, we will normalize the amount of lipid droplets detected to a set area, as opposed to just measuring total lipid droplets.
Reviewer #3
The strength of the study is the use of suitable in vivo model systems, combined with genetic manipulations to study the mechanisms behind cancer cachexia. The weak points of the study is the lack of functional assays such as quantitative measurements of oxidative phosphorylation and metabolites.
1, Throughout the manuscript the authors use TMRE staining to evaluate mitochondrial function. To me it is not clear what function they are actually referring to. I assume they mean respiration/respiratory chain function, as this generates the proton motif force measured, but neither oxygen consumption nor aerobic ATP synthesis is ever mentioned or measured. Especially considering that the authors suggest that an increased flux through beta oxidation, which is a mitochondrial function, results in muscle wasting, the authors might want to consider measuring respiration with different substrates, using either a seahorse or Oroboros or equivalent.
We do not have the necessary equipment or resources to perform Seahorse or Oroboros experiments. Therefore, we will perform O2 consumption and ATP synthesis assays for RasV12dlgRNAi and QF-QUAS RasV12scribRNAi vs w1118, RasV12dlgRNAi > Impl2RNAi, QF-QUAS RasV12scribRNAi > marfRNAi, whdRNAi, and tumour-bearing animals fed high fat diets to provide more insights into mitochondria function.
3, It is difficult to understand that it is even possible for beta oxidation to exceed the capacity of the OXPHOS system. In that case one would have excess of acetyl CoA and NADH, inevitably inhibiting further beta oxidation and the TCA cycle due to lack of NAD, as well as numerous regulatory mechanisms. Additionally, one would expect increased ketone body production. The authors might want to clarify how the excess redox potential, due to increased beta oxidation is utilised.
We will perform acetyl-CoA and NAD/NADH assays in RasV12dlgRNAi and QF-QUAS RasV12scribRNAi vs w1118 to determine if beta-oxidation is occurring in excess. In addition, we will clarify in the text that we hypothesize that increased beta-oxidation is utilizing the muscle’s resources to the point that there is none left to continue energy production.
Minor:
Line 223 "Together, this data suggests that FOXO lies upstream of beta-oxidation, and mitochondria function lies downstream of beta-oxidation".<br /> I would suggest to rephrase. Of course beta-oxidation and the TCA takes place inside mitochondria, so what mitochondrial functions do the authors refer to?
As mentioned earlier, we will perform O2 consumption and ATP synthesis assays to strengthen this claim. In addition, we will rephrase this sentence to avoid confusion.
Line 238 "Overall, this data suggests that the depletion of muscle lipid stores via beta oxidation affects mitochondrial function and is negatively correlated with muscle health in cachectic flies, mice and patients" - The mechanism is not fully clear to me as other energy sources are still available to the fly. The authors might want to expand here.
We will clarify that there may be other energy sources available that were not investigated in this paper.
Line 93 : "To test whether this increase in mitochondrial size could lead to compromised mitochondrial function, we performed live staining with tetramethylrhodamine ethyl ester (TMRE), a compound used to measure the membrane potential of mitochondria." - I am not sure that size on its own correlates with mitochondrial function, but rather the energetic and metabolic state of the cell. Increased biogenesis is a common response to dysfunction, but often reflected in increased mass.
We will clarify the that the increase in size may be a reflection of increased metabolic need of the muscle.
Please insert a point-by-point reply describing the revisions that were already carried out and included in the transferred manuscript. If no revisions have been carried out yet, please leave this section empty.
Reviewer 1:
3- In all cases, the age of experimental animals must be clearly indicated in figures and/or figure legends.
We have already put the ages of the experimental animals in the bottom of the figure legends.
11- Does insulin signaling influence Lipid metabolism in muscle?
We demonstrate in the manuscript that FoxoRNAi in the muscle of tumour-bearing animals reduces whd transcript levels (Fig 4C), and Impl2RNAi in the tumour restores muscle lipid droplet levels (Fig 3G-I).
Please include a point-by-point response explaining why some of the requested data or additional analyses might not be necessary or cannot be provided within the scope of a revision. This can be due to time or resource limitations or in case of disagreement about the necessity of such additional data given the scope of the study. Please leave empty if not applicable.
Reviewer 1:
10- The phenotype of increased fatty acid oxidation in wasting muscles is inferred as per the proteomic signature but not directly demonstrated. TCA metabolite tracing using 13C-Palmitate should be used to demonstrate this, which is a central point of the manuscript.
The examination of 13C-palmitate would require metabolomic approaches, for which we do not have the necessary equipment and is beyond our timeframe. Thus, we will aim to examine changes in mitochondria metabolism through other measures mentioned above.
16- The lipid phenotype in cachectic fly muscles is not consistent with that reported in humans and shown by the authors in their xenograft model. While loss of lipid droplets is observed in the fly muscle cells, there is increase in the lipid content within the mouse muscle and only extramyocellular lipid is decreased. The relevance of the extracellular lipid is unclear.
We hypothesize that this is due to a transport of lipids from extracellular lipid droplets to mitochondria for utilization, as has been suggested previously (Rambold et al., 2015). Examining in detail if this is the case in our models is beyond the scope of this paper.
Reviewer 3:
2, The authors suggest that an increase in beta oxidation exceeds mitochondrial function (?), which in turn induces a change in mitochondrial morphology, further contributing to the muscle wasting. The authors may want to demonstrate that there is indeed excess beta oxidation, by measuring a toxic accumulation of different lengths of acylcarnitines. For instance, it is well known that patients with beta oxidation defects accumulate toxic intermediates of beta oxidation that can ultimately affect mitochondrial function.<br /> The manuscript would be much improved if oxygen consumption is measured and combined with analysis of acylcarnitines.
The examination of acylcarnitines would require lipidomic approaches, and is beyond our timeframe for these revisions. To try to address the need for investigations if beta-oxidation is in excess, we will perform oxygen consumption assays as mentioned and alter the manuscript to de-emphasize excess beta-oxidation.
4, Unfortunately the supplementary information is in a format I can't open, thus I can't evaluate the method for identifying large mitochondria and other results in these files. This makes part of the reviewing process difficult.
N/A
Los agentes físicos incluyen métodos de control tales como temperatura alta o baja, desecación, presión osmótica, radiación y filtración. El control por agentes químicos se refiere al uso de desinfectantes, antisépticos, antibióticos y químicos antimicrobianos quimioterapéuticos.
Los agentes físicos incluyen métodos de control tales como temperatura alta o baja, desecación, presión osmótica, radiación y filtración. El control por agentes químicos se refiere al uso de desinfectantes, antisépticos, antibióticos y químicos antimicrobianos quimioterapéuticos.
The actual function o f sentim ental music lies rather in the tem poraryrelease given to the awareness that one has missed fulfillment.
I think this is why music is so popular -- music can actually be really meaningful
This natural language for the American listener stems from his earliest musical experiences,the nursery rhymes, the hymns he sings in Sunday school, the little tuneshe whistles on his way home from school. All these are vastly m ore important in the form ation o f musical language than his ability to distinguishthe beginning o f Brahm s’s Third Symphony from that of his Second.
I think this "natural language" is a little bit like building a musical vocabulary. For Jazz, one must be able to acquaint oneself with an arsenal of musical vocabulary in order to be able to improvise effectively.
This dualism is not developed in a schematicway so that first the phrase o f the strings is elaborated, then the answer ofthe winds, and then the string them e is mechanically repeated.
I think that having one group of instruments say something and then having another group of instruments answer is a great way to develop some sort of story or mood to musical compositions, even without words. I find it very impressive.
For example, in the introductionof the first m ovem ent of B eethoven’s Seventh Symphony the second them e(in C-major) gets its true meaning only from the context. Only through thewhole does it acquire its particular lyrical and expressive quality— that is,a whole built up o f its very contrast with the cantus firmus—\ike characterof the first them e. Taken in isolation the second them e would be disrobedto insignificance
I agree with this statement. I think there are many songs that are a lot more meaningful and complete with knowledge of their contexts. If they didn't have context to back them up, then they would just be another song.
Por tudo quanto apreciado neste tópico
O autor nesse tópico apenas apresentou todos os argumentos que refutam a investigação criminal pelo MP e defendeu sua visão, fundamentando.
Acordo de não persecução penal (art. 18 da Resolução n° 181/2017CNMP):
já encontra disposição expressa no CPP no art. 28-A. Como o livro é antigo, fundamentaram na antiga resolução do CNMP.
Note: This rebuttal was posted by the corresponding author to Review Commons. Content has not been altered except for formatting.
Learn more at Review Commons
Reviewer #1
Major:
- The statement (line 149'Together, our data suggest that systemic ecdysone levels are unlikely to be involved in modulating tumour-induced muscle detachment or to mediate the role of fatbody Insulin signalling in regulating muscle detachment.') is derived from an experiment with sterol free diet (in which 20HE is genetically addressed) and a pleiotropic experiment (PG>RasG12V). In neither paper nor the current manuscript, 20HE levels have been directly addressed.
Therefore, this statement needs further experimental support and discussion. Ecdysone is a critical hormone during development and especially growth-related effects central to this study. The authors should consider doing pharmacology or augment their claims here with genetic manipulation experiments of 20HE related genes in larvae (Leopold, Rewitz, Rideout, Drummond-Barbosa, Schuldiner labs) and adult animals using genetics, pharmacology or direct assessment of 20HE levels (RIPA, Edgar and Reiff labs).
The main point we were trying to convey is that we do not think global ecdysone levels plays a role in modulating fatbody insulin or tgfb signalling, which in turn affects muscle detachment. We are not claiming that edysone levels is not changing in control vs. tumour bearing animals. In fact, we predict that 20HE levels will be different in tumour bearing vs. control animals (as tumour bearing animals undergo developmental delay), but this is not the main point of our conclusions. We believe that our conclusions are supported by the experiment demonstrating global ecdysone alterations (via feeding sterol-free food) did not affect how fatbody Akt activation altered tgfb signalling and enhanced muscle integrity (Figure S1). Therefore, we don’t think measuring 20HE helps to support our conclusions. Pharmacological inhibition via feeding ecdysone inhibitors effectively demonstrate a similar point to feeding sterol-free food which we have already performed. We are happy to try direct manipulation of 20HE related genes (eip75B-RNAi) in the fatbody to see if this affects muscle detachment or pAkt and pMad levels in tumour bearing animals.
- In Fig.7 the authors used a sog-LacZ stock to show transcriptional activation in fatbody cells. This stock is based on P-element insertion in the according regulatory regions and supposed to express lacZ with an nls. I can clearly see lacZ in nuclei in Fig. 7H, whereas this is very hard to see in nuclei in Fig7i in the tumour model. In addition, lacZ is known for its high stability and not the best option. As this finding is vital for central claims of this study, it should be complemented by either qPCR for sog on fat body cells or using another readout by converting one of the two Mimic lines (BL42189/44958) into GFP sensors for sog.
We will add a counterstain to these images. We will also perform qPCR in the fatbody of control and cachectic animals to assess whether Sog transcription is altered. We agree converting one of the Mimic lines to a GFP sensor would be a good option, but this experiment would require getting new fly lines into Australia, which takes at least 2 months because of quarantine laws. We don’t believe this experiment would change the general conclusions of the paper, therefore would prefer not to do this experiment.
- I have similar problems with Fig.7B-F, as phosphorylated Mad should be translocated to the nucleus. In 7F the authors measure pMad over Dapi, which is the right way but it is hard to see pMad in the nucleaus apart from Fig7B, wheras in D and E, where the authors measure higher levels, I cannot identify clear pMad in nuclei. These images either need to show the Dapi channel or more representative images should be chosen like in Fig.4 with arrows pointing to measured nuclei. Fig.7C something went wrong with the compression of this image.
We will show more representative examples and fix Fig 7C.
- The proper function of RNAi stocks targeting genes like sog, mad, etc. is vital for this study as these lines are used throughout the study. Functional evidence of specific knockdown efficiency should be provided or references given in which these stocks were shown to provide functional knockdown on transcript or protein level.
We agree with the reviewer that this is an important point. We will demonstrate the knockdown of sog and mad (and other RNAis) used in the study by either referring to published data or demonstrate knockdown ourselves.
- Fig.S7 discusses appearance of gbb/Bmp7 and Sog/CHRD in human patients. The analysis the authors performed shows a correlation between both factors, but is hampered by the fact that datasets for peripheral tissues of cachexia patients are unavailable. The authors may consider sorting these after tumor entities in which cachexia occurs frequently vs. low occurrence and then check for both genes.
We will try this analysis.
Fig.5 M-P pMAd is not indicated in the Panels only the legend.
We will fix this error.
- Please follow FlyBase nomenclature, e.g. dlg1 for discs large 1 and unify in the whole manuscript and figure for all genes.
We will fix this error.
- For endogenous fusion proteins like Viking-GFP (e.g. vkg::GFP) choose a format to clearly decipher them from transcriptional readout stocks like sog-lacZ.
We will fix this error.
- The quantifications in most figures are quite small with tiny lettering and XY axis are difficult to read in letter/A4 size.
We will enlarge font size.
Minor:
Adjust in-figure caption alignments
Line 104: add comma RasV12, dlgRNAi
Line 114: replace little not significant (n.s.)
Line 334: 'sogRNAi overexpression' to my knowledge, RNAi are expressed, not overexpressed.
Line 454: italicize r4>
Fig S4E: remove frame
Figures 6: It would be better to number and explain the pathway presented in the figure in text and fig legend.
Just a personal preference. Lettering of images in images is commonly done horizontally, here it appears like a mix between vertical and horizontal.
We will fix these minor errors.
Reviewer #2
Major comment
Their genetic experiments clearly showed that the reduction of insulin signaling activity in the fatbody induces upregulation of TGF-β signaling and Collagen accumulation. Then, how does TGF-β signaling induce Collagen accumulation?
From the experiments we have carried out, we do not have insights into how TGF-B signalling induce Collagen accumulation.
They showed that Rab10 knockdown and SPARC overexpression reduced the accumulation of fatbody ECM. Are Rab10 and SPARC expression regulated by TGF-β signaling?
We can address this point by assessing if Rab10 and SPARC expression is altered in cachectic fatbody.
Minor comments
Line 90: "Disc Large (Dlg) RNAi in the eye" must be "Discs Large (Dlg1) RNAi in the eye imaginal discs".
we will fix this error.
Figures 1D and 1L are from the same image. Also, Figures 1C and 1M are from the same image. Are both of them necessary to be shown in the different panels?
The duplication of 1C and 1M, was an error, we thank the reviewer for picking this up. We will fix this error. We will use different images for 1D and 1L.
Why are the staining patterns of anti-pAkt shown in Figures 1L and 1U so different? pAkt is not detected in the nuclei in Fig. 1L but its nuclear signal is clear in Fig. 1U.
We will show more representative images of these staining.
Figure 1: Images of counter staining for nuclei like DAPI should be also included for all these fatbody images.
We will show counter staining for DAPI.
Line 101: "Tumour specific ImpL2 inhibition was sufficient to reduce fatbody pAkt levels." Is this correct? ImpL2 inhibition in tumors should elevate the pAKT level in fatbody.
This was a mistake, we will fix this error.
Figure S1~S4: These figures and their legends do not correspond to each other. We thank the reviewer in picking up this error, there was an error in inserting the images into the text. S2 and S3 were swapped.
We will fix this error.
Line 189: The pAkt level in the muscle of tumour-bearing animals should be examined to confirm the activity of the insulin signaling is downregulated.
We will include this data.
Line 189: If the authors conclude that muscle insulin signaling predominantly regulates translation and atrophy, OPP assay for the muscle cells should be examined in the same experimental settings.
We will carry out OPP assay upon Akt overexpression in the muscle.
Line 247: The expression level of Rab10 and SPARC should be examined in the fatbody of tumour-bearing animals to see whether Rab10 is upregulated and SPARC is downregulated.
Line 247: If Rab10 upregulation and SPARC downregulation are the causes of the accumulation of ECM proteins in the fatbody of tumour-bearing animals, how the overexpressed Collagen proteins can be secreted from the fatbody cells?
We are not sure, but the overexpression of Collagen proteins is at an extremely high level, therefore, it is possible that some of it can be processed and secreted despite Rab10 upregulation and SPARC downregulation. We have carried out an experiment to overexpress Collagen proteins in the muscle, in this case, this manipulation did not rescue. This indicates that processing of Collagen in the fatbody is important, however, we do not know how the processing is regulated.
Line 347: Sog is a secreted BMP antagonist. Thus, it can be expected that the Sog overexpression downregulates TGF-β signaling in fatbody and muscle tissues. If the rescued phenotypes with Sog overexpression can be explained by this logic, pMad level should be examined in these experiments.
We have shown this data in Figure R-T. We will refer back to this data in Line 347.
Reviewer #3
Major comments:
- Are the key conclusions convincing?
Most of the conclusions are convincing. It is not clear however whether the ECM accumulation in the fat body of tumor animals is fibrotic and whether it is extracellular or in the cell cortex.
- Should the authors qualify some of their claims as preliminary or speculative, or remove them altogether?
-The authors state in line 71 'This deposition of disorganized ECM leads to fibrotic ECM
accumulation.' The authors haven't really provided evidence for the ECM being fibrotic. The authors could either rephrase this or provide additional experimental evidence of fibrosis in the fat body.
We will tone down the claim that the ECM accumulation is fibrotic.
- Would additional experiments be essential to support the claims of the paper? Request additional experiments only where necessary for the paper as it is, and do not ask authors to open new lines of experimentation.
-The authors state in line 147" Finally, in tumor-bearing animals fed a sterol-free diet, that underwent a prolonged 3rd instar stage due to reduced ecdysone levels (Parkin and Burnet, 1986), we activated insulin signalling in the fatbody via Akt overexpression (QRasV12, scribRNAi). We found that this manipulation caused a significant decrease in pMad levels in the fatbody and a rescue of muscle detachment (Figure S1 D-I), similar to animals fed a standard diet (Figure 1 O-Q, Figure 2 F-H)." Since it's not already known what the extent of muscle integrity defect there is in tumors with additional sterol free diet, it would be important to show a non-tumor control for comparison in FigS1F. This would also then make it clear to what extent the defect is rescued by Akt overexpression.
We will include a non-tumour control for Fig S1F.
-The authors state in line 158 'Upon the knockdown of Impl2, we found that tumor gbb was not significantly altered (Figure S3A).' Even though this shows an indication that Gbb levels are not reduced, the n number is too low to state that it is non-significant. The authors should increase the n number here.
N=3 is generally enough to see a difference, we will include data done in parallel which shows Impl2 RNAi is sufficient to induce a reduction in Impl2 RNA levels. This will demonstrate that n=3 is sufficient to demonstrate a reduction in transcript levels if there is a reduction.
-The authors state in line 171 'Conversely, knockdown of gbb alone or knockdown of gbb together with ImpL2 significantly rescued the Nidogen overaccumulation defects observed at the plasma membrane of fatbody from tumor-bearing animals, while ImpL2RNAi alone did not (Figure S2 Q-U).' This is a somewhat misleading representation, since again no non-tumor control was used, so the extent of the rescue by gbb knowdown is not obvious. In FigS2P Nidogen levels in the tumor seem ~100% higher than in control. But in FigS2U, in which no control was included, the tumor+gbb knowdown seems ~ 20% lower than tumor. So it is probably a more moderate rescue, but that's only possible to assess by including a non-tumor control in FigS2U. Also the images in FigS2Q-T don't seem representative since they appear to show a much bigger difference in fluorescence intensity than ~20%. Please show more representative images.
We will include a non-tumour control for S2Q-T and show more representative pictures.
-The authors state in line 174 'Finally, co-knockdown of gbb and ImpL2 in the tumor significantly rescued the reduction in OPP and Nidogen levels observed in the muscles of tumor-bearing animals (Figure S3 B-I).'
Again, the single knockdowns and the non-tumor control are not shown in FigS3E and I and should be included for comparison and to see the contribution of each knockdown and to be able to judge the extent of the rescue.
We will include the single knockdowns and a wildtype control
-Regarding Fig3O: Is there a significant tumor muscle attachment defect here? In this graph the tumor only looks about 10% lower than the WT (rather than 40% in Fig2E). The other issue is the extremely low n number for WT. I would recommend increasing the n number for WT here and to indicate in the graph whether the tumor is significantly different to WT (or non-significant, in which case RabRNAi wouldn't actually 'rescue' the defect). In the present form, this graph is not very convincing.
We will increase the n number for WT for this experiment. The reduction in muscle detachment is 10% rather than 40% here is because this experiment was done at day 6, which we will indicate in the figure legend. The 40% reduction in Fig2E is because these samples were processed at day7. Rab10RNAi experiment was carried out at day 6, because by day7, the Rab10RNAi rescue is so good, most of the tumour bearing animals have pupated, thus the experiment could only be carried out at day6.
- Regarding Fig3W: A non-tumor control would be important to include to be able to judge the extent of muscle attachment defects and the extent of the rescue for UAS-Sparc. This will allow to assess the severity of muscle integrity defect in this particular experiment (since it appears to vary in different experiments e.g. muscle defect in tumor 40% in Fig2E and ~10% in Fig3O) and to assess the extent of rescue for the various genotypes.
We will include a non-tumour control for 3W.
-The authors show an accumulation of ECM in the fat body of tumors. It is not clear, whether this ECM accumulates intracellularly near the cell surface or extracellularly. The authors should assess this, maybe by doing electron microscopy.
We do not have an EM facility that can accommodate this experiment, thus doing EM is not an option for us. However, we can address whether the accumulation of ECM is intracellular or extracellular by performing an experiment, where we try perform antibody staining against Viking-GFP without permeabilizing the cells. If Viking is detected without permeabilization, it would indicate the accumulations are extracellular. This approach has been previously used to address this question in Zang et al., elife, 2015.
- Are the suggested experiments realistic in terms of time and resources? It would help if you could add an estimated cost and time investment for substantial experiments.
-These suggested experiments should be quite straightforward since they are mostly just repeating previous experiments with the appropriate controls and n numbers. I would think that they can be done within a few months. The electron microscopy should not take more than a few weeks and not be costly.
- Are the data and the methods presented in such a way that they can be reproduced?
-The details on how old animals used in each experiment were, are not easy to find and not written very clearly. They should be included in the each figure legend rather than summarising those details in the methods.
We will add the number of days in the figure legend.
-Also, in line 788 in the methods, several stocks are indicated as coming from particular labs (e.g. UAS-FOXO (Kieran Harvey), UAS-GFP (Kieran Harvey), UAS-lacZRNAi (Kieran Harvey), UAS-RasV12 (Helena Richardson), UAS-cg25C;UAS-Vkg (Brian Stramer)).
However, it is not clear whether these labs actually made these stocks and if so whether it has already been described in their papers how the lines were made. If the lines are unpublished, the detailed information should be given on how the lines were made. Or if the lines are published, the authors should provide the reference.
We will fix these references.
- Are the experiments adequately replicated and statistical analysis adequate?
In general, the n number is rather low in several experiments, especially n of 3 for many controls. And as I mentioned before, rescues of tumor phenotypes are often shown without including a non-tumor control, making it hard to judge the extent of the rescue. Sometimes this information can be found in other figures, but the reader should not have to search for it. And also the severity of the phenotype can vary from experiment to experiment.
We will include a non-tumour control when appropriate to address this.
Minor comments:
- Specific experimental issues that are easily addressable.
- Are prior studies referenced appropriately?
Yes, as far as I can tell.
- Are the text and figures clear and accurate?
-In the literature, people usually call it 'fat body' rather than 'fatbody'.
We will fix this error.
-The authors state in line 265 "Vkg accumulated in the membranes of fatbody where p60 was overexpressed using r4-GAL4 (Figure 5 A-C)."
This must be a typo. I think it is shown in Fig5E-G. Unless it's labelled wrongly in the figure and B, C and D show p60 rather than TorDN.
We will fix this error.
-The authors state in line 188 'This manipulation significantly rescued muscle integrity (Figure S4 A-C) and muscle atrophy (Figure S4 D-F), without affecting muscle ECM levels (Figure S4 G-H).' According to the graph in FigS4H this does actually 'affect muscle ECM levels' significantly, as in that it reduced Nidogen levels further. The authors could rephrase this.
We will reword this statement.
Note: This preprint has been reviewed by subject experts for Review Commons. Content has not been altered except for formatting.
Learn more at Review Commons
Summary:
Provide a short summary of the findings and key conclusions (including methodology and model system(s) where appropriate).
This paper uses a Drosophila tumor model induced by the expression of RasV12+Scrib-IR or RasV12+Dlg-IR in the eye imaginal disc to understand how inter-organ communication affects cachexia in the fat body and muscle. The tumor has previously been shown to secrete the factors ImpL2 and Gbb which decreases insulin signalling and increases TGF-beta signalling in the fat body, respectively, and results in fat body and muscle defects. Here they dissect the role of insulin and TGF-beta signalling in the fat body in regulating muscle integrity further. They show that these two pathways converge via Sog in the fat body of tumor-bearing animals and result in aberrant ECM accumulation in the fat body which hinders ECM secretion. This then results in the muscle receiving less fat body-derived ECM which causes muscle attachment defects. Interestingly, these muscle defects can be ameliorated by activating insulin signalling or inhibiting TGF-beta signalling or even by increasing ECM secretion in the fat body. The authors also provide some evidence that the insulin and TGF-beta signalling pathways can converge in non-tumor settings.
Major comments:
Most of the conclusions are convincing. It is not clear however whether the ECM accumulation in the fat body of tumor animals is fibrotic and whether it is extracellular or in the cell cortex.<br /> - Should the authors qualify some of their claims as preliminary or speculative, or remove them altogether?<br /> - The authors state in line 71 'This deposition of disorganized ECM leads to fibrotic ECM<br /> accumulation.' The authors haven't really provided evidence for the ECM being fibrotic. The authors could either rephrase this or provide additional experimental evidence of fibrosis in the fat body.<br /> - Would additional experiments be essential to support the claims of the paper? Request additional experiments only where necessary for the paper as it is, and do not ask authors to open new lines of experimentation.<br /> - The authors state in line 147" Finally, in tumor-bearing animals fed a sterol-free diet, that underwent a prolonged 3rd instar stage due to reduced ecdysone levels (Parkin and Burnet, 1986), we activated insulin signalling in the fatbody via Akt overexpression (QRasV12, scribRNAi). We found that this manipulation caused a significant decrease in pMad levels in the fatbody and a rescue of muscle detachment (Figure S1 D-I), similar to animals fed a standard diet (Figure 1 O-Q, Figure 2 F-H)." Since it's not already known what the extent of muscle integrity defect there is in tumors with additional sterol free diet, it would be important to show a non-tumor control for comparison in FigS1F. This would also then make it clear to what extent the defect is rescued by Akt overexpression.<br /> - The authors state in line 158 'Upon the knockdown of Impl2, we found that tumor gbb was not significantly altered (Figure S3A).' Even though this shows an indication that Gbb levels are not reduced, the n number is too low to state that it is non-significant. The authors should increase the n number here.<br /> - The authors state in line 171 'Conversely, knockdown of gbb alone or knockdown of gbb together with ImpL2 significantly rescued the Nidogen overaccumulation defects observed at the plasma membrane of fatbody from tumor-bearing animals, while ImpL2RNAi alone did not (Figure S2 Q-U).' This is a somewhat misleading representation, since again no non-tumor control was used, so the extent of the rescue by gbb knowdown is not obvious. In FigS2P Nidogen levels in the tumor seem ~100% higher than in control. But in FigS2U, in which no control was included, the tumor+gbb knowdown seems ~ 20% lower than tumor. So it is probably a more moderate rescue, but that's only possible to assess by including a non-tumor control in FigS2U. Also the images in FigS2Q-T don't seem representative since they appear to show a much bigger difference in fluorescence intensity than ~20%. Please show more representative images.<br /> - The authors state in line 174 'Finally, co-knockdown of gbb and ImpL2 in the tumor significantly rescued the reduction in OPP and Nidogen levels observed in the muscles of tumor-bearing animals (Figure S3 B-I).'<br /> Again, the single knockdowns and the non-tumor control are not shown here in Fig3E and I and should be included for comparison and to see the contribution of each knockdown and to be able to judge the extent of the rescue.<br /> - Regarding Fig3O: Is there a significant tumor muscle attachment defect here? In this graph the tumor only looks about 10% lower than the WT (rather than 40% in Fig2E). The other issue is the extremely low n number for WT. I would recommend increasing the n number for WT here and to indicate in the graph whether the tumor is significantly different to WT (or non-significant, in which case RabRNAi wouldn't actually 'rescue' the defect). In the present form, this graph is not very convincing.<br /> - Regarding Fig3W: A non-tumor control would be important to include to be able to judge the extent of muscle attachment defects and the extent of the rescue for UAS-Sparc. This will allow to assess the severity of muscle integrity defect in this particular experiment (since it appears to vary in different experiments e.g. muscle defect in tumor 40% in Fig2E and ~10% in Fig3O) and to assess the extent of rescue for the various genotypes.<br /> - The authors show an accumulation of ECM in the fat body of tumors. It is not clear, whether this ECM accumulates intracellularly near the cell surface or extracellularly. The authors should assess this, maybe by doing electron microscopy.<br /> - Are the suggested experiments realistic in terms of time and resources? It would help if you could add an estimated cost and time investment for substantial experiments.<br /> - These suggested experiments should be quite straightforward since they are mostly just repeating previous experiments with the appropriate controls and n numbers. I would think that they can be done within a few months. The electron microscopy should not take more than a few weeks and not be costly.<br /> - Are the data and the methods presented in such a way that they can be reproduced?<br /> - The details on how old animals used in each experiment were, are not easy to find and not written very clearly. They should be included in the each figure legend rather than summarising those details in the methods.<br /> - Also, in line 788 in the methods, several stocks are indicated as coming from particular labs (e.g. UAS-FOXO (Kieran Harvey), UAS-GFP (Kieran Harvey), UAS-lacZRNAi (Kieran Harvey), UAS-RasV12 (Helena Richardson), UAS-cg25C;UAS-Vkg (Brian Stramer)).<br /> However, it is not clear whether these labs actually made these stocks and if so whether it has already been described in their papers how the lines were made. If the lines are unpublished, the detailed information should be given on how the lines were made. Or if the lines are published, the authors should provide the reference.<br /> - Are the experiments adequately replicated and statistical analysis adequate?<br /> In general, the n number is rather low in several experiments, especially n of 3 for many controls. And as I mentioned before, rescues of tumor phenotypes are often shown without including a non-tumor control, making it hard to judge the extent of the rescue. Sometimes this information can be found in other figures, but the reader should not have to search for it. And also the severity of the phenotype can vary from experiment to experiment.
Minor comments:
Specific experimental issues that are easily addressable.
Yes, as far as I can tell.<br /> - Are the text and figures clear and accurate?<br /> - In the literature, people usually call it 'fat body' rather than 'fatbody'.<br /> - The authors state in line 265 "Vkg accumulated in the membranes of fatbody where p60 was overexpressed using r4-GAL4 (Figure 5 A-C)."<br /> This must be a typo. I think it is shown in Fig5E-G. Unless it's labelled wrongly in the figure and B, C and D show p60 rather than TorDN.<br /> - The authors state in line 188 'This manipulation significantly rescued muscle integrity (Figure S4 A-C) and muscle atrophy (Figure S4 D-F), without affecting muscle ECM levels (Figure S4 G-H).' According to the graph in FigS4H this does actually 'affect muscle ECM levels' significantly, as in that it reduced Nidogen levels further. The authors could rephrase this.<br /> - Do you have suggestions that would help the authors improve the presentation of their data and conclusions?
The field of inter-organ communication in cancer is a very interesting and trending research field. Several labs including this one have provided new insights into how the tumor, the fat body and the muscle communicate and affect each other and how this can cause cachexia. Previous work from the Chen lab already showed that the tumor secretes the factors ImpL2 and Gbb which decreases insulin signalling and increases TGF-beta signalling in the fat body, respectively and results in fat body and muscle defects. Here they dissect this role of insulin and TGF-beta signalling in the fat body in regulating muscle integrity during cachexia further. They show that these two pathways converge via Sog in the fat body of tumor-bearing animals and result in aberrant ECM accumulation in the fat body which hinders ECM secretion. As a result of this, the muscle receives less fat body-derived ECM and displays muscle attachment defects. Interestingly, the authors show that these muscle defects can be ameliorated by activating insulin signalling or inhibiting TGF-beta signalling or even by increasing ECM secretion in the fat body. This has potentially important implications for the clinic since it suggests that targeting ECM secretion or ECM remodeling in the fat tissue could be a promising treatment for cachexia.<br /> Moreover, the authors also provide some evidence that the insulin and TGF-beta signalling pathways can converge in tumor and non-tumor settings. This might also reveal new drug targets to treat cachexia.<br /> - Place the work in the context of the existing literature (provide references, where appropriate).
The Chen lab showed previously that MMP1 secreted from the tumor induces ECM disruption in the fat body as well as muscle, ultimately causing fat body remodeling and muscle wasting (Lodge et al. 2021). They showed that this is via TGF-beta activation in the fat body. Another contributing factor is tumor-secreted Impl2 which decreases Insulin signalling in the fat body and tumor. However, it remained unknown, how ECM accumulation in the fat body might cause muscle wasting. In this paper, the authors look into this.<br /> - State what audience might be interested in and influenced by the reported findings.
This paper would be of interest for scientists and clinicians interested in inter-organ communication in cancer, particularly in the context of cachexia.<br /> - Define your field of expertise with a few keywords to help the authors contextualize your point of view. Indicate if there are any parts of the paper that you do not have sufficient expertise to evaluate.
My expertise lies in the field of Drosophila fat body and ECM, and to some extent tumors but less so signalling pathways.
In addition, the “Comparison” (C) is not typically part of aqualitative research question so becomes irrelevant, whereasboth “Intervention” (I) and “Outcome” (O) might need to bemanipulated to fit with the qualitative paradigm. Therefore,specification using PICO might become a subjective exer-cise when used for qualitative research questions, rather thanthe systematic search strategy tool intended when used forquantitative research questions.
Have these elements in Crawley (2022) been manipulated as suggested?
De que forma é que o profissional aplica esta abordagem? Quais as estratégias utilizadas? Que estratégias alternativas propõem?
De que forma é que o profissional aplica esta abordagem? Quais as estratégias utilizadas? Que estratégias alternativas propõem?
In English Composition, Asynchronous Learning allows you to learn on your own schedule, within acertain time frame. The instructor and the students in the course all engage the course content atdifferent times (and from different locations). The instructor provides students with a sequence ofComposition related work to be completed within a specified time frame.1. WHERE does our ASYNCHRONOUS class take place?• our online asynchronous class takes place ENTIRELY ON Blackboard (BB)o
It is very efficient to learn on your own timing. Especially if you are working or having any outside activities going on. Asynchronous learning is very understanding but if you do not understand something reach out to the professor.
RRID:CVCL_0105
DOI: 10.1093/glycob/cwad044
Resource: (CLS Cat# 300168/p708_DU-145, RRID:CVCL_0105)
Curator: @scibot
SciCrunch record: RRID:CVCL_0105
RRID:SCR_004757
DOI: 10.1038/s41598-020-78768-3
Resource: ANTS - Advanced Normalization ToolS (RRID:SCR_004757)
Curator: @scibot
SciCrunch record: RRID:SCR_004757
aeronaves de operador certificado para prestar serviços aéreos a terceiros
Brecha para driblar o fisco: em vez de possuir um jatinho próprio, pode-se criar uma PJ e incluir a aeronave como patrimônio desta empresa, ocasião em que não seria cobrado o imposto.
55, II,
Se o substitutivo institui o IBS, porque o texto mantém a existência do ICMS (art. 155, II)?
RRID:AB_2837030
DOI: 10.1016/j.isci.2023.107116
Resource: (Affinity Biosciences Cat# DF4679, RRID:AB_2837030)
Curator: @scibot
SciCrunch record: RRID:AB_2837030
AB_258167
DOI: 10.3390/antiox12061303
Resource: (Sigma-Aldrich Cat# A4416, RRID:AB_258167)
Curator: @scibot
SciCrunch record: RRID:AB_258167
RRID:AB_2621762
DOI: 10.1016/j.isci.2023.106946
Resource: (Tonbo Biosciences Cat# 50-0441, RRID:AB_2621762)
Curator: @scibot
SciCrunch record: RRID:AB_2621762
RRID:BDSC_86837
DOI: 10.1016/j.cub.2023.05.054
Resource: RRID:BDSC_86837
Curator: @scibot
SciCrunch record: RRID:BDSC_86837
Author Response
Reviewer #1 (Public Review):
This paper studies color vision in anemonefish. The central conclusion of the paper is that anemonefish use signals from their UV cones to discriminate colors that would not otherwise be distinguishable; this differs from other fish in which UV cones extend the range of wavelengths of sensitivity but do not add a dimension to color vision. The work fits into a rich history of studies investigating how color vision fits into an animal's ecological niche. My primary concerns regard the microspectrophotometry data from single cones and some aspects of the presentation of the behavioral data.
Microspectrophotometry
The spectral properties of the cone types are a key issue for interpreting the results. These were measured using MSP, and fits are shown in Figure 2. The raw data shown in Fig. S1 appears more complicated than indicated in the main text. The templates miss the measurements across broad wavelength bands in each cone type. Particularly concerning is the high UV absorbance across cone types and the long-wavelength absorbance in the UV cone. It is not clear how this picture supports the relatively simple description of cone types and spectral sensitivities given in the main text and which forms the basis of the modeling.
Microspectrophotometry is an inherently noise-prone measurement technique, particularly for very small photoreceptor outer segments such as that of single cones, which are also difficult to detect as intact, isolated (nonoverlapping) cells. As such, the absorbance curve fitting and derived lambda max (λmax) values should be treated as estimates. The accuracy of these estimates is adequate for this type of study, and visual modelling results have been shown to be robust against small errors (±10 nm λmax) in photoreceptor sensitivity for multiple species [see Lind, O. & Kelber, A. (2009). Vis Res. 49(15), 1939-1947; and Bitton, PP. et al. (2017). PLOS ONE, 12: e0169810]. We consider it highly unlikely that small shifts in cone λmax from measurement error would make a meaningful difference to the colour discrimination thresholds.
It should be noted that the raw data shown in the original Supplementary Figure 1, included all scans overlain with an average absorbance curve for presentation purposes; however, the actual lambda max values for different cone types were measured and then averaged among individual scans fitted with photopigment absorbance curve templates. For clarity and transparency, we have now provided three multipaned plots (see Figure 1 – figure supplements 1-3) showing the individual pre- and post-bleach scans of absorbance spectra, fitted absorbance curve templates, and R2 values from the best visual pigment template fit.
It is worth noting that most of the cone absorbance spectra found in our study closely resemble those in λmax and quality to those measured in another anemonefish species (Amphiprion akindynos) [see Supplementary Figure 1 in Stieb S. et al. (2019). Sci Rep. 9, 16459]. These cone λmax values can also be reconciled with previous estimates on opsin λmax based on amino acid sequences and cone opsin expression in the A. ocellaris retina characterised in Mitchell LJ et al. (2021). GBE, 13: evab184.
Evidence that the unusual long-wavelength absorbance detected in a couple of the single cone (pre-bleach) measurements were not of visual pigment in origin comes from post-bleach scans, which showed their persistence (i.e., did not show a photobleaching response) and were likely instead contaminants (e.g., blood, RPE pigment). UV absorbance in some of the double cone measurements (above that expected of the prebleached beta peak from chromophore spectral absorption) can be attributed to either noise from scans as is quite typical of MSP and/or partial (accidental) bleaching from stray light sources. Although utmost care was taken to minimise contamination and unintended bleaching sometimes it is unavoidable.
We refer the Reviewer to multiple published studies for further examples of typical MSP measurements that share similar levels of noise to ours e.g., see Figure 1 in Knott B. et al. (2013). JEB, 216:4454-4461; Figure 3 in Schott, RK et al. (2015). PNAS, 113(2): 356-361; Figure 2 in Dalton BE et al. (2014). Proc R Soc B. 281; Figure 5 in Tosetto, JE et al. (2021). Brain Behav Evol. 96: 103-123.
Presentation
The results are not presented in a straightforward way - at least for this reviewer. What is missing for me is a clear link between the psychometric curves in Figure 3A and the discrimination thresholds indicated in Figure 3B and Figure 4. Figure 3A is only discussed in the text on line 289 - after Figure 4 has been introduced and discussed. It would have been very helpful for me if the psychometric curves were first introduced and described, then the relation to Figure 3B was clearly indicated (perhaps with a single psychometric curve as an example). Similarly for Figure 4 the relationship between specific psychometric curves and the threshold plotted would be quite helpful. Currently it takes a careful reading to understand why being below the dashed line in Figure 4 is important.
We have made the following changes, including the introduction of the psychometric curves earlier in the results (lines 236-249) and moved the psychometric function comparison before the mention of Figure 4. Additionally, to make the association between the plotted colour loci and psychometric curves clearer, we have added a smaller psychometric curve plot adjacent to the colour space (in Figure 3B) using red as an example which has an averaged psychometric curve overlying the individual fish curves. The figure caption (lines 250-274) explains that the plotted colour loci and given thresholds are mean values calculated from the individual fish behavioural data.
We have also added a brief reminder that the theoretical limit of colour discrimination is predicted by the RNL model as 1∆S, where in our task fish should be just able to distinguish targets from grey distractors (see lines 222-224). To clarify, the plotted values in Figure 4B are both the individual fish thresholds (points) and average threshold (black bar) per colour set. The individual threshold values are taken at a correct choice probability of 50% from fitted psychometric curves of fish behavioural performance (shown in Figure 3A).
RNL model
The data is fit and interpreted in the context of the receptor noise limited model. The paragraph in the discussion about complementary color pairs suggests that this model is incorrect (text around line 332). Consideration of how the results depend on the RNL model is important, especially given the interpretation here.
The inability of the RNL model to account for the observed asymmetry between color discrimination thresholds implies that they cannot be solely attributed to photoreceptor noise. We can therefore infer from the asymmetry that thresholds are set by a higher-level process, whether that involves post-receptor processes within the inner retina or in the brain remains to be investigated. As explained in lines 396-397 one possibility is that activation of the UV receptor suppresses noise in the visual pathway or enhances the saliency of colors for anemonefish. The high sensitivity to violet-green, which was found in all six of the fish tested, is consistent with the heightened saliency of this color (lines 397-399).
Figure 3B
This is the key figure in the paper. But several issues make seeing the data in this figure difficult. First, the important part of the figure is buried near the origin and hard to see. Can you show a surface that connects the thresholds in the different chromatic directions, or otherwise highlight the regions of discriminable and not discriminable colors?
See previous comment. In short, we have taken the advice of the Reviewer and added highlighted areas around the regions of discriminable colors in Figure 3B to help visually separate them from the non-discriminable regions of colors (from grey). Additionally, we have added an inset showing an enlarged image of the area surrounding the centre of colour space.
Reviewer #2 (Public Review):
Mitchell and colleagues examined the contribution of a UV-sensitive cone photoreceptor to chromatic detection in Amphiprion ocellaris, a type of anemonefish. First, they used biophysical measurements to characterize the response properties of the retinal receptors, which come in four spectrally-distinct subtypes: UV, M1, M2, and L. They then used these spectral sensitivities to construct a 4-dimensional (tetrahedral) color space in which stimuli with known spectral power distributions can be represented according to the responses they elicit in the four cone types. A novel five-LED display was used to test the fish's ability to detect "chromatic" modulations in this color space against a background of random-intensity, "achromatic" distractors that produce roughly equal relative responses in the four cone types. A subset of stimuli, defined by their high positive UV contrast, were more readily detected than other colors that contained less UV information. A well-established model was used to link calculated receptor responses to behavioral thresholds. This framework also enabled statistical comparisons between models with varying number of cone types contributing to discrimination performance, allowing inferences to be drawn about the dimensionality of color vision in anemonefish.
The authors make a compelling case for how UV light in the anemonefish habitat is likely an important ecological source of information for guiding their behavior. The authors are to be commended for developing an elegant behavioral paradigm to assess visual performance and for incorporating a novel display device especially suited to addressing hypotheses about the role of UV light in color perception. While the data are suggestive of behavioral tetrachromacy in anemonefish, there are some aspects of the study that warrant additional consideration:
1) One challenge faced by many biological imaging systems is longitudinal chromatic aberration (LCA) - that is, the focal power of the system depends on wavelength. In general, focal power increases with decreasing wavelength, such that shorter wavelengths tend to focus in front of longer wavelengths. In the human eye, at least, this focal power changes nonlinearly with wavelength, with the steepest changes occurring in the shorter part of the visible spectrum (Atchison & Smith, 2005). In the fish eye, where the visible spectrum extends to even shorter wavelengths, it seems plausible that a considerable amount of LCA may exist, which could in turn cause UV-enriched stimuli to be more salient (relative to the distractor pixels) due to differences in perceived focus rather than due solely to differences in their respective spectral compositions. Such a mechanism has been proposed by Stubbs & Stubbs (2016) as a means for supporting "color vision" in monochromatic cephalopods (but see Gagnon et al. 2016). It would be worth discussing what is known about the dispersive properties of the crystalline lens in A. ocellaris (or similar species), and whether optical factors could produce sufficient cues in the retinal image that might explain aspects of the behavioral data presented in the current study.
This is an interesting point, and we appreciate the reviewer’s thoughtful comment regarding this topic especially as LCA increases exponentially in the UV. Although we certainly cannot disprove such a mechanism in the present study, we are highly sceptical that LCA could be used by reef fish and is involved in the heightened saliency of UV stimuli. Previous work has found that LCA is mostly corrected for in the teleost retina of both marine and freshwater species by graded, multifocal lenses that focus different wavelengths at the same depth as their maximally sensitive cone photoreceptors [e.g., for evidence in African cichlids see Kröger, R. H. H. et al. (1999). J Comp Physiol. A, 184, 361-369; Malkki, P. E. & Kröger, R. H. H. (2005). J Opt. A, 7, 691-700; and for various reef fishes see Karpestam, B. et al. (2007). J Exp Biol., 210, 16: 2923-2931]. In essence, LCA is corrected in the eyes of many teleosts by accurately tuning longitudinal spherical aberration through having a graded density lens. We draw particular attention to the latter reference which comparatively examined the optical properties of reef fish lenses, including diurnal, planktivorous damselfishes (from the same family as anemonefishes, Pomacentridae). They found that not only were the lenses of these species highly UV-transmissive (as we show in anemonefish), but all were multifocal and capable of focusing both visible (non-UV) and UV wavelengths. Considering the coastal cephalopod species examined thus far, all of them contain only one type of visual pigment which is packed in their long photoreceptor (150-450µm long outer segment) across an entire retina (Chung and Marshall 2016, Proceeding B). Theoretically, given these long photoreceptors, the LCA and the resulting differentials of focal length onto different patches of photoreceptors or different depth of the outer segment might provide cues for colour discrimination even though no behavioural evidence exists to prove this hypothesis yet. Unlike the cephalopod case, the four specific spectral cones arranged in a mosaic pattern along with their very short outer segments (5-10µm) in the anemonefish retina likely makes the LCA less effective in this retinal design.
We have added a short paragraph (Lines 400-412) discussing the possibility of an optical mechanism contributing to heightened UV saliency with a particular focus on LCA and our thoughts on why we consider it an unlikely mechanism in anemonefish.
2) The authors provide a quantitative description of anemonefish visual performance within the context of a well-developed receptor-based framework. However, it was less clear to me what inferences (if any) can be drawn from these data about the post-receptoral mechanisms that support tetrachromatic color vision in these organisms. Would specific cone-opponent processes account for instances where behavioral data diverged from predictions generated with the "receptor noise limited" model described in the text? The general reader may benefit from more discussion centered on what is known (or unknown) about the organization of cone-opponent processing in anemonefish and related species.
In short, we do not know the specific opponent interactions of anemonefish cones. The RNL model assumes all possible opponent interactions in its calculations. From our results, very little can be said about the post-receptor mechanisms involved in their putative tetrachromatic vision. We would like to avoid overreaching beyond what our data can show. A future directions section has now been added to the discussion (lines 467-497), which briefly mentions the known UV opponency in larval zebrafish and that future investigation in anemonefish should attempt to disentangle the specific opponent (chromatic) and non-opponent (achromatic) circuits in the anemonefish retina.
Reviewer #3 (Public Review):
The comments below focus mainly on ways that the data and analysis as currently present do not to this reviewer compel the conclusions the authors wish to draw. It is possible that further analysis and/or clarification in the presentation would more persuasively bolster the authors' position. It also seems possible that a presentation with more limited conclusions but clarity on exactly what has been demonstrated and where additional future work is needed would make a strong contribution to the literature.
- Fig 3A. It might be worth emphasizing a bit more explicitly that the x-axis (delta S) is the result of a model fit to the data being shown, since this then means that if RNL model fit the data perfectly, all of the thresholds would fall at deltaS = 1. They don't, so I would like to see some evaluation from the authors' experience with this model as to whether they think the deviations (looks like the delta S range is ~0.4 to ~1.6 in Figure 4B) represent important deviations of the data from the model, the non-significant ANOVA notwithstanding. For example, Figure 4B suggests that the sign of the fit deviations is driven by the sign of the UV contrast and that this is systematic, something that would not be picked up by the ANOVA. Quite a bit is made of the deviations below, but that the model doesn't fully account for the data should be brought out here I think. As the authors note elsewhere, deviations of the data from the RNL model indicate that factors other than receptor noise are at play, and reminding the reader of this here at the first point it becomes clear would be helpful.
We have now stated more explicitly in the figure caption for Figure 3A, that the delta S values presented were calculated by fitting fish behavioral data to the RNL model. To test the overall effect that the sign of the UV contrast had on the discrimination threshold, we have now included ‘contrast’ (positive or negative) as another fixed effect in the linear mixed effects model. We have now included details of this test in the results which shows the systematic effect (lines 338-340). Additionally, as suggested we now briefly introduce in the results the idea that factors other than receptor noise are causing the observed deviations in data from the RNL model.
- Line 217 ff, Figure 4, Supplemental Figure 4). If I'm understanding what the ANOVA is telling us, it is that the deviations of the data across color directions and fish (I think these are the two factors based on line 649) is that the predictions deviate significantly from the data, relative to the inter-fish variability), for the trichromatic models but not the tetrachromatic model. If that's not correct, please interpret this comment to mean that more explanation of the logic of the test would be helpful.
The interpretation of the ANOVA by the Reviewer is mostly correct. We had the variables color set and Fish ID, with threshold delta S as the dependent variable. This showed that deviations from the predicted threshold were significant relative to the inter-fish variability for the trichromatic models. Missing details describing the ANOVA have now been added to the methods (lines 789-798).
Assuming that the above is right about the nature of the test, then I don't think the fact that the tetrachromatic model has an additional parameter (noise level for the added receptor type) is being taken into account in the model comparison. That is, the trichromatic models are all subsets of the tetrachromatic model, and must necessarily fit the data worse. What we want to know is whether the tetrachromatic model is fitting better because its extra parameter is allowing it to account for measurement noise (overfitting), or whether it is really doing a better job accounting for systematic features of the data. This comparison requires some method of taking the different number of parameters into account, and I don't think the ANOVA is doing that work. If the models being compared were nested linear models, than an F-ratio test could be deployed, but even this doesn't seem like what is being done. And the RNL model is not linear in its parameters, so I don't think that would be the right model comparison test in any case.
Typical model comparison approaches would include a likelihood ratio test, AIC/BIC sorts of comparisons, or a cross-validation approach.
If the authors feel their current method does persuasively handle the model comparison, how it does so needs to be brought out more carefully in the manuscript, since one of the central conclusions of the work hinges at least in part on the appropriateness of such a statistical comparison.
Our visual model comparisons were aimed at assessing whether a trichromatic or tetrachromatic model best fit the colour discrimination data. The trichromatic and tetrachromatic models assume two and three opponency pathways, respectively. If the fish were not tetrachromatic, and instead trichromatic, then we would expect that the RNL model should better fit the data with two opponency mechanisms (rather than three). Our reason for making this assessment, is because of the possibility that not all the cones could be contributing to colour vision and could be used exclusively for achromatic tasks (e.g., luminance vision or motion detection). However, according to our finding that the data best fit the tetrachromatic model (i.e., how the behavioural discrimination thresholds more closely fitted the theoretical prediction of 1∆S), it is likely that anemonefish used all four cones for colour vision.
We have also now repeated our analysis using unweighed delta S values which are calculated using general n-dimensional models of colour vision (using the PAVO2 package). These models essentially follow the same initial steps followed by the RNL model (and many others) but omit the receptor noise correction stage. After comparing (using ANOVA, see lines 303-311) the predicted thresholds with the data in this non-RNL space, it was found that again the tetrachromatic model predictions did not deviate significantly from the data relative to individual fish performance; however, we also found that the trichromatic model without M2 cone input no longer differed from the predicted values. In this case, it seems that the extra noise parameter did contribute to the difference in fit. Whether this is a biologically meaningful comparison (as all photoreceptors contain noise) is an open question. We have added a short statement explicitly framing our interpretation of anemonefish having a 3-D colour space to being in accordance with the closeness of RNL model predictions (lines 370-371, 506-508).
- Also on the general point on conclusions drawn from the model fits, it seems important to note that rejecting a trichromatic version of the RNL model is not the same as rejecting all trichromatic models. For example, a trichromatic model that postulates limiting noise added after a set of opponent transformations will make predictions that are not nested within those of RNL trichromatic models. This point seems particularly important given the systematic failures of even the tetrachromatic version of the RNL model.
This is a good point. We have limited our conclusions to specifically address trichromatic models generated within the framework of the RNL model by adding in the conclusion section that fish psychophysical thresholds were best explained by the RNL model when all four cone types contributed to colour vision (see lines 370-371, 506-508). In this same sentence, we have also added in parentheses that “suggesting (but not proving) tetrachromacy” (line 508). We have also edited the abstract to state that our results were “…best described by a tetrachromatic model using all four cone types…”, rather than stating we have shown tetrachromacy (lines 36-37).
- More generally, attempts to decide whether some human observers exhibit tetrachromacy have taught us how hard this is to do. Two issues, beyond the above, are the following. 1) If the properties of a trichromatic visual system vary across the retina, then by imaging stimuli on different parts of the visual field an observer can in principle make tetrachromatic discriminations even though visual system is locally trichromatic at each retinal location. 2) When trying to show that there is no direction in a tetrachromatic receptor space to which the observer is blind, a lot of color directions need to be sampled. Here, 9 directions are studied. Is that enough? How would we know? The following paper may be of interest in this regard: Horiguchi, Hiroshi, Jonathan Winawer, Robert F. Dougherty, and Brian A. Wandell. "Human trichromacy revisited." Proceedings of the National Academy of Sciences 110, no. 3 (2013): E260-E269. Although I'm not suggesting that the authors conduct additional experiments to try to address these points, I do think they need to be discussed. We agree with the reviewer, that colour discriminability achieved by tetrachromatic vision could in theory be achieved by the combined effect of localised, distinct forms of trichromacy. Evidence in other fishes suggests that such multiple forms of trichromacy across the retina likely exist in many species. However, the behavioural effects of this retinal setup remain to be studied likely due to its extremely difficult nature. We have added a new section titled “future directions” (Lines 474-489), in which we discuss the possibility that distinct forms of trichromacy in the anemonefish retina could in theory achieve colour discrimination on par with tetrachromatic vision. We also give suggestions on how this could be investigated.
Although we tried to include as many colour directions as practically possible in our experiment, we have certainly not provided an exhaustive range that completely encompasses anemonefish colour space. Whether 9 colour directions are adequate to assess the dimensionality of their color vision is difficult to say. As addressed in the previous comment, we now acknowledge this limitation by refining our conclusion, saying that our results do not prove tetrachromacy.
- Line 277 ff. After reading through the paper several times, I remain unsure about what the authors regard as their compelling evidence that the UV cone has a higher sensitivity or makes an omnibus higher contribution to sensitivity than other cones (as stated in various forms in the title, Lines 37-41, 56-57, 125, 313, 352 and perhaps elsewhere).
At first, I thought they key point was that the receptor noise inferred via the RNL model as slightly lower (0.11) for the UV cone than for the double cones (0.14). And this is the argument made explicitly at line 326 of the discussion. But if this is the argument, what needs to be shown is that the data reject a tetrachromatic version of the RNL model where the noise value of all the cones is locked to be the same (or something similar), with the analysis taking into account the fewer parametric degrees of freedom where the noise parameters are so constrained. That is, a careful model comparison analysis would be needed. Such an analysis is not presented that I see, and I need more convincing that the difference between 0.11 and 0.14 is a real effect driven by the data. Also, I am not sanguine that the parameters of a model that in some systematic ways fails to fit the data should be taken as characterizing properties of the receptors themselves (as sometimes seems to be stated as the conclusion we should draw).
We have performed various modelling scenarios where receptor noise was adjusted for each channel; however, the UV channel was consistently found to be more sensitive than the other channels. In (the original) Supplementary Figure 6 (now Figure 4 – figure supplements 1 and 2), we show predicted dS values calculated using receptor noise levels in the exact manner that the Reviewer suggests by ranging from 0.05 to 0.15, and most importantly, included scenarios where receptor noise was held equal across cone types and others where it was varied between single cones and double cones. None of the models adjusted the data so that sensitivity was equal across all four channels, which means that by an unknown mechanism, the UV channel is more sensitive, but this is unrelated to noise levels. Our best-fit receptor noise values of 0.11 (for single cones) and 0.14 (for double cones) are estimate values and should be treated as such till actual receptor noise measurements are made.
Then, I thought maybe the argument is not that the noise levels differ, but rather that the failures of the model are in the direction of thresholds being under predicted for discriminations that involve UV cone signals. That's what seems to be being argued here at lines 277 ff, and then again at lines 328 ff of the discussion. But then the argument as I read it more detail in both places switches from being about the UV cones per se to being about postive versus negative UV contrast. That's fine, but it's distinct from an argument that favors omnibus enhanced UV sensitivity, since both the UV increments and decrements are conveyed by the UV cone; it's an argument for differential sensitivity for increments versus decrements in UV mediated discriminations. The authors get to this on lines 334 of the discussion, but if the point is an increment/decrement asymmetry the title and many of the terser earlier assertions should be reworked to be consistent with what is shown.
To clarify our argument, we found that the colour discrimination thresholds were systematically lower than predicted by the RNL model for colours which elicited higher UV cone stimulation relative to other cone types. These colours we refer to as UV positive based on the sign direction of their contrast against grey distractors produced by higher UV/V LED channel (i.e., in a positive direction). Whereas colours with UV negative chromatic contrast had lower UV cone stimulation relative to the other cone types. Therefore, our interpretation of the importance of UV cone signals for colour discrimination are congruent with the results. In the discussion, we suggest a possibility that activation of the UV receptor suppresses noise downstream in the visual pathway or enhances the saliency of colours (see lines 397-398). This activation of the UV receptor would, of course, be at its highest for colours with positive UV chromatic contrast.
Note that we have added to the discussion the possibility that colour preferences or a difference in attentiveness might have contributed to differences in discrimination thresholds (see discussion lines 412-413, 427-428, 433-435, 456-466, and 469-473). However, we consider it a less likely explanation due to a couple of reasons, including 1) a lack of difference in responsiveness across colour sets in their timing to peck the target, and 2) any non-learnt bias would have likely been overridden or at least weakened by training prior to the experiment where colours were rewarded equally (see lines 462-466).
We have edited the results (lines 334-352) to make our point clearer and by changing the subtitle to be more explicit: “Lower discrimination thresholds induced by positive UV contrast”. The subsection begins by explaining the different types of UV chromatic contrast by elevation angle and, finally, how this division among colour sets was a major determinant of colour discrimination thresholds.
Perhaps the argument with respect to model deviations and UV contrast independent of sign could be elaborated to show more systematically that the way the covariation with the contrasts of the other cone stimulations in the stimulus set goes, the data do favor deviations from the RNL in the direction of enhanced sensitivity to UV cone signals, but if this is the intent I think the authors need to think more about how to present the data in a manner that makes it more compelling than currently, and walk the reader carefully through the argument.
We have added to the results the linear mixed-effects model output with ‘contrast’ (positive/negative) added as a fixed effect. This analysis shows that the sign direction of UV contrast was a strong predictor of threshold (see address to previous comments and lines 399-401, 790-799).
- On this point, if the authors decide to stick with the enhanced UV sensitivity argument in the revision, a bit more care about what is meant by "the UV cone has a comparatively high sensitivity (line 313 and throughout)" needs more unpacking. If it is that these cones have lower inferred noise (in the context of a model that doesn't account for at least some aspects of the data), is this because of properties of the UV cones, or the way that post-receptoral processing handles the signals from these cones mimicking a cone effect in the model. And if it is thought that it is because of properties of the cones, some discussion of what those properties might be would be helpful. As I understand the RNL model, relative numbers of cones of each type are taken into account, so it isn't that. But could it be something as simple as higher photopigment density or larger entrance aperture (thus more quantum catches and higher SNR)?
It is unknown what aspect of the cone morphology or physiology sets the activation or inactivation threshold. Electrophysiological data collected from the UV cones of other fish species e.g., in goldfish and zebrafish [see Hawryshyn & Beauchamp (1985). 25, Vis Res.; and Yoshimatsu et al. (2020). 107, Neuron.] show that they have exceptionally high sensitivity. What has not been shown is that having a UV cone can improve colour discrimination.
Previous quantitative cone opsin gene expression analysis showed that the single cone opsins (SWS1 and SWS2B) are expressed at lower levels than all double cone opsin genes. This difference in expression combined with the smaller size of single cone outer segments than the double cones make it unlikely that a larger photoreceptor size, higher volume or packing density of visual pigment is responsible. Contrary to our findings, these aspects of the different cone types (if they had an effect) would instead predict that double cones have a higher SNR, and non-UV colours would be more discriminable. We have now added these details to the discussion (see lines 391-397).
- Line 288 ff. The fact that the slopes of the psychometric functions differed across color directions is, I think, a failure of the RNL model to describe this aspect of the data, and tells us that a simple summary of what happens for thresholds at delta S = 1 does not generalize across color directions for other performance levels. Since one of the directions where the slope is shallower is the UV direction, this fact would seem to place serious limits on the claim that discrimination in the UV direction is enhanced relative to other directions, but it goes by here without comment along those lines. Some comment here, both about implications for fit of RNL model and about implications for generalizations about efficacy of UV receptor mediated discrimination and UV increment/decrement asymmetries, seems important.
The variation in the psychometric functions is difficult to interpret and cannot be explained by the RNL model. What the RNL model predicts is delta S based on low level factors (namely receptor noise). In the discussion, we completely agree with the notion that the asymmetry in thresholds from predicted values, and the variation in psychometric slopes cannot be explained by the RNL model, e.g., this is heavily implied by “colour discrimination thresholds cannot be directly attributed to noise in the early stages of the visual pathway…” (lines 388-390). To clarify the inability of the RNL model to account for this aspect of the data, we have included a statement (see line 390).
It is a good point that this could be an indication of heterogeneity in colour space. Heterogeneity in discrimination thresholds across animal colour space (both surrounding the threshold area and for more saturated regions) has been explored in detail using trichromatic triggerfish by Green N. F. et al. (2022). JEB, 7(225):jeb243533. We have added this idea to the discussion (see lines 490-498). For UV, it seems that two of the five fish (#34 and 20) had noticeably shallower curves than the others tested for UV (fish #19, 33, 36). Both also varied more in their ability to distinguish targets, as shown by their wider confidence intervals. One of these two fish (#34) was retested for UV at the end of the experiment, and in the secondary assessment had a steeper psychometric curve more in line with the other fish in the experiment (see Figure 3 – figure supplement 1 and added lines 247-250). Based on this discrepancy in performance between assessments, it is also possible that individual learning effects had a role in impacting the shape of the psychometric curve. Note, this had minimal effect on colour discrimination thresholds and any differences were in the direction of change observed across colour sets in the experiment (i.e., lower dS for UV positive directions).
- Line 357 ff. Up until this point, all of the discussion of differences in threshold across stimulus sets has been in terms of sensitivity. Here the authors (correctly) raise the possibility that a difference in "preference" across stimulus sets could drive the difference in thresholds as measured. Although the discussion is interesting and germaine, it does to some extent further undercut the security of conclusions about differential sensitivity across color directions relative to the RNL model predictions, and that should be brought out for the reader here. The authors might also discuss about how a future experiment might differentiate between a preference explanation and a sensitivity explanation of threshold differences.
We have now added a paragraph (see lines 469-473) discussing that future work should test for color preferences and suggest how this could be done using a similar foraging task. We also include our thoughts immediately prior on why it is unlikely that a colour preference was a major contribution towards the results. In short, we consider it unlikely as fish showed no evidence of reduced latency for pecking at targets across the colour sets and because the training regime prior to the experiment equally rewarded fish for all colours and would likely have overridden a strong preference (at least in this specific foraging context).
- RNL model. The paper cites a lot of earlier work that used the RNL model, but I think many readers will not be familiar with it. A bit more descriptive prose would be helpful, and particularly noting that in the full dimensional receptor space, if the limiting noise at the photoreceptors is Gaussian, then the isothreshold contour will be a hyper-ellipsoid with its axes aligned with the receptor directions.
There is now added explanation of the RNL model (see lines 141-151), particularly on its assumptions that it only receives chromatic input and that discrimination is limited by noise arising in the photoreceptors and not by any specific opponent mechanisms. We also added the mention of the expected hyper-ellipsoid shape of isothreshold contours if receptor noise is Gaussian. Note, while we appreciate the importance of the reader to understand the basic functionality of the model, we wanted to avoid overloading the introduction with details on the RNL model which is not the focus of the paper. The RNL model is well-established in the field of visual ecology and animal vision research for well over a decade and has been thoroughly dissected by previous methodological reviews. We refer to one of these more recent reviews by Olsson et al. (2018) Behav Ecol. 29(2):273-282, and direct the reader to the methods section for further details on the RNL model.
- Use of cone isolating stimuli? For showing that all four cone classes contribute to what the authors call color discrimination, a more direct approach would seem to be to use stimuli that target stimulation of only one class of cone at a time. This might require a modified design in which the distractors and target were shown against a uniform background and approximately matched in their estimated effect on a putative achromatic mechanism. Did the authors consider this approach, and more generally could they discuss what they see as its advantages and disadvantages for future work.
The Reviewer is correct in that a targeted approach of isolated cone stimulation would be the optimal approach to demonstrating tetrachromatic colour vision. However, the extreme spectral overlap in the absorption curves of anemonefish cones, particularly in the mid-wavelength region makes this problematic in using the current LED display. We added to the discussion ways that this could be studied in the future (see lines 474-489). This might be possible (but still challenging) using a monochromator, but such technology severely limits the diversity of stimuli which can be created and usually restricts experiments to a simple paired choice design (or grey card experiment). The traditional paired choice experiment requires animals to be trained to distinguish a specific colour, while the Ishihara-like task trains animals to distinguish targets using an odd-one-out approach. This latter approach is highly efficient, as it does not require retraining when testing a new colour (i.e., fish learnt the task not a specific colour). Here, we wanted to assess colour discrimination in multiple directions to compare performance, and the flexible LED display combined with a generalisable task was important.
The above assumes that anemonefish do not use multiple trichromatic systems. In which case, the use of standard experimental stimuli (e.g., a monochromator, an LED display) would be unsuitable as they illuminate the whole retina. To definitively test the range of opponent interactions, it would be necessary to make electrophysiological measurements targeting the transmitting neurons using a retinal multielectrode array (MEA) approach or by in-vivo calcium imaging (lines 484-486).
We understand that our results are not a direct test of the dimensionality of anemonefish colour vision and should not be interpreted as such, as we do not have direct evidence of tetrachromacy. To recognize this limitation of our data, we have drawn back some of our conclusive statements that claimed to have demonstrated tetrachromacy.
Author Response
Reviewer #2 (Public Review):
Here, a simple model of cerebellar computation is used to study the dependence of task performance on input type: it is demonstrated that task performance and optimal representations are highly dependent on task and stimulus type. This challenges many standard models which use simple random stimuli and concludes that the granular layer is required to provide a sparse representation. This is a useful contribution to our understanding of cerebellar circuits, though, in common with many models of this type, the neural dynamics and circuit architecture are not very specific to the cerebellum, the model includes the feedforward structure and the high dimension of the granule layer, but little else. This paper has the virtue of including tasks that are more realistic, but by the paper’s own admission, the same model can be applied to the electrosensory lateral line lobe and it could, though it is not mentioned in the paper, be applied to the dentate gyrus and large pyramidal cells of CA3. The discussion does not include specific elements related to, for example, the dynamics of the Purkinje cells or the role of Golgi cells, and, in a way, the demonstration that the model can encompass different tasks and stimuli types is an indication of how abstract the model is. Nonetheless, it is useful and interesting to see a generalization of what has become a standard paradigm for discussing cerebellar function.
We appreciate the Reviewer’s positive comments. Regarding the simplifications of our model, we agree that we have taken a modeling approach that abstracts away certain details to permit comparisons across systems. We now include an in-depth discussion of our simplifying assumptions (Assumptions & Extensions section in the Discussion) and have further noted the possibility that other biophysical mechanisms we have not accounted for may also underlie differences across systems.
Our results predict that qualitative differences in the coding levels of cerebellum-like systems, across brain regions or across species, reflect an optimization to distinct tasks (Figure 7). However, it is also possible that differences in coding level arise from other physiological differences between systems.
Reviewer #3 (Public Review):
1) The paper by Xie et al is a modelling study of the mossy fiber-to-granule cell-to-Purkinje cell network, reporting that the optimal type of representations in the cerebellar granule cell layer depends on the type task. The paper stresses that the findings indicate a higher overall bias towards dense representations than stated in the literature, but it appears the authors have missed parts of the literature that already reported on this. While the modelling and analysis appear mathematically solid, the model is lacking many known constraints of the cerebellar circuitry, which makes the applicability of the findings to the biological counterpart somewhat limited.
We thank the Reviewer for suggesting additional references to include in our manuscript, and for encouraging us to extend our model toward greater biological plausibility and more critically discuss simplifying assumptions we have made. We respond to both the comment about previous literature and about applicability to cerebellar circuitry in detail below.
2) I have some concerns with the novelty of the main conclusion, here from the abstract: ’Here, we generalize theories of cerebellar learning to determine the optimal granule cell representation for tasks beyond random stimulus discrimination, including continuous input-output transformations as required for smooth motor control. We show that for such tasks, the optimal granule cell representation is substantially denser than predicted by classic theories.’ Stated like this, this has in principle already been shown, i.e. for example: Spanne and Jo¨rntell (2013) Processing of multi-dimensional sensorimotor information in the spinal and cerebellar neuronal circuitry: a new hypothesis. PLoS Comput Biol. 9(3):e1002979. Indeed, even the 2 DoF arm movement control that is used in the present paper as an application, was used in this previous paper, with similar conclusions with respect to the advantage of continuous input-output transformations and dense coding. Thus, already from the beginning of this paper, the novelty aspect of this paper is questionable. Even the conclusion in the last paragraph of the Introduction: ‘We show that, when learning input-output mappings for motor control tasks, the optimal granule cell representation is much denser than predicted by previous analyses.’ was in principle already shown by this previous paper.
We thank the Reviewer for drawing our attention to Spanne and Jo¨rntell (2013). Our study shares certain similarities with this work, including the consideration of tasks with smooth input-output mappings, such as learning the dynamics of a two-joint arm. However, our study differs substantially, most notably the fact that we focus our study on parametrically varying the degree of sparsity in the granule cell layer to determine the circumstances under which dense versus sparse coding is optimal. To the best of our ability, we can find no result in Spanne and J¨orntell (2013) that indicates the performance of a network as a function of average coding level. Instead, Spanne and Jo¨rntell (2013) propose that inhibition from Golgi cells produces heterogeneity in coding level which can improve performance, which is an interesting but complementary finding to ours. We therefore do not believe that the quantitative computations of optimal coding level that we present are redundant with the results of this previous study. We also note that a key contribution of our study is mathemetical analysis of the inductive bias of networks with different coding levels which supports our conclusions.
We have included a discussion of Spanne and Jo¨rntell (2013) and (2015) in the revised version of our manuscript:
"Other studies have considered tasks with smooth input-output mappings and low-dimensional inputs, finding that heterogeneous Golgi cell inhibition can improve performance by diversifying individual granule cell thresholds (Spanne and J¨orntell, 2013). Extending our model to include heterogeneous thresholds is an interesting direction for future work. Another proposal states that dense coding may improve generalization (Spanne and Jo¨rntell, 2015). Our theory reveals that whether or not dense coding is beneficial depends on the task."
3) However, the present paper does add several more specific investigations/characterizations that were not previously explored. Many of the main figures report interesting new model results. However, the model is implemented in a highly generic fashion. Consequently, the model relates better to general neural network theory than to specific interpretations of the function of the cerebellar neuronal circuitry. One good example is the findings reported in Figure 2. These represent an interesting extension to the main conclusion, but they are also partly based on arbitrariness as the type of mossy fiber input described in the random categorization task has not been observed in the mammalian cerebellum under behavior in vivo, whereas in contrast, the type of input for the motor control task does resemble mossy fiber input recorded under behavior (van Kan et al 1993).
We agree that the tasks we consider in Figure 2 are simplified compared to those that we consider elsewhere in the paper. The choice of random mossy fiber input was made to provide a comparison to previous modeling studies that also use random input as a benchmark (Marr 1969, Albus 1971, Brunel 2004, Babadi and Sompolinsky 2014, Billings 2014, LitwinKumar et al., 2017). This baseline permits us to specifically evaluate the effects of lowdimensional inputs (Figure 2) and richer input-output mappings (Figure 2, Figure 7). We agree with the Reviewer that the random and uncorrelated mossy fiber activity that has been extensively used in previous studies is almost certainly an unrealistic idealization of in vivo neural activity—this is a motivating factor for our study, which relaxes this assumption and examines the consequences. To provide additional context, we have updated the following paragraph in the main text Results section:
"A typical assumption in computational theories of the cerebellar cortex is that inputs are randomly distributed in a high-dimensional space (Marr, 1969; Albus, 1971; Brunel et al., 2004; Babadi and Sompolinsky, 2014; Billings et al., 2014; Litwin-Kumar et al., 2017). While this may be a reasonable simplification in some cases, many tasks, including cerebellumdependent tasks, are likely best-described as being encoded by a low-dimensional set of variables. For example, the cerebellum is often hypothesized to learn a forward model for motor control (Wolpert et al., 1998), which uses sensory input and motor efference to predict an effector’s future state. Mossy fiber activity recorded in monkeys correlates with position and velocity during natural movement (van Kan et al., 1993). Sources of motor efference copies include motor cortex, whose population activity lies on a lowdimensional manifold (Wagner et al., 2019; Huang et al., 2013; Churchland et al., 2010; Yu et al., 2009). We begin by modeling the low dimensionality of inputs and later consider more specific tasks."
4) The overall conclusion states: ‘Our results....suggest that optimal cerebellar representations are task-dependent.’ This is not a particularly strong or specific conclusion. One could interpret this statement as simply saying: ‘if I construct an arbitrary neural network, with arbitrary intrinsic properties in neurons and synapses, I can get outputs that depend on the intensity of the input that I provide to that network.’ Further, the last sentence of the Introduction states: ‘More broadly, we show that the sparsity of a neural code has a task-dependent influence on learning...’ This is very general and unspecific, and would likely not come as a surprise to anyone interested in the analysis of neural networks. It doesn’t pinpoint any specific biological problem but just says that if I change the density of the input to a [generic] network, then the learning will be impacted in one way or another.
We agree with the Reviewer that our conclusions are quite general, and we have removed the final sentence as we agree it was unspecific. However, we disagree with the Reviewer’s paraphrasing of our results.
First, we do not select arbitrary intrinsic properties of neurons and synapses. Rather, we construct a simplified model with a key quantity, the neuronal threshold, that we vary parametrically in order to assess the effect of the resulting changes in the representation on performance. Second, we do not vary the intensity/density of inputs provided to the network – this is fixed throughout our study for all key comparisons we perform. Instead, we vary the density (coding level) of the expansion layer representation and quantify its effect on inductive bias and generalization. Finally, our study’s key contribution is an explanation of the heterogeneity in average coding level observed across behaviors and cerebellum-like systems. We go beyond the empirical statement that there is a dependence of performance on the parameter that we vary by developing an analytical theory. Our theory describes the performance of the class of networks that we study and the properties of learning tasks that determine the optimal expansion layer representation.
To clarify our main contributions, we have updated the final paragraph of the Introduction. We have also removed the sentence that the Reviewer objects to, as it was less specific than the other points we make here.
"We propose that these differences can be explained by the capacity of representations with different levels of sparsity to support learning of different tasks. We show that the optimal level of sparsity depends on the structure of the input-output relationship of a task. When learning input-output mappings for motor control tasks, the optimal granule cell representation is much denser than predicted by previous analyses. To explain this result, we develop an analytic theory that predicts the performance of cerebellum-like circuits for arbitrary learning tasks. The theory describes how properties of cerebellar architecture and activity control these networks’ inductive bias: the tendency of a network toward learning particular types of input-output mappings (Sollich, 1998; Jacot et al., 2018; Bordelon et al., 2020; Canatar et al., 2021; Simon et al., 2021). The theory shows that inductive bias, rather than the dimension of the representation alone, is necessary to explain learning performance across tasks. It also suggests that cerebellar regions specialized for different functions may adjust the sparsity of their granule cell representations depending on the task."
5) The interpretation of the distribution of the mossy fiber inputs to the granule cells, which would have a crucial impact on the results of a study like this, is likely incorrect. First, unlike the papers that the authors cite, there are many studies indicating that there is a topographic organization in the mossy fiber termination, such that mossy fibers from the same inputs, representing similar types of information, are regionally co-localized in the granule cell layer. Hence, there is no support for the model assumption that there is a predominantly random termination of mossy fibers of different origins. This risks invalidating the comparisons that the authors are making, i.e. such as in Figure 3. This is a list of example papers, there are more: van Kan, Gibson and Houk (1993) Movement-related inputs to intermediate cerebellum of the monkey. Journal of Neurophysiology. Garwicz et al (1998) Cutaneous receptive fields and topography of mossy fibres and climbing fibres projecting to cat cerebellar C3 zone. The Journal of Physiology. Brown and Bower (2001) Congruence of mossy fiber and climbing fiber tactile projections in the lateral hemispheres of the rat cerebellum. The Journal of Comparative Neurology. Na, Sugihara, Shinoda (2019) The entire trajectories of single pontocerebellar axons and their lobular and longitudinal terminal distribution patterns in multiple aldolase C-positive compartments of the rat cerebellar cortex. The Journal of Comparative Neurology.
6) The nature of the mossy fiber-granule cell recording is also reviewed here: Gilbert and Miall (2022) How and Why the Cerebellum Recodes Input Signals: An Alternative to Machine Learning. The Neuroscientist. Further, considering the re-coding idea, the following paper shows that detailed information, as it is provided by mossy fibers, is transmitted through the granule cells without any evidence of re-coding: Jo¨rntell and Ekerot (2006) Journal of Neuroscience; and this paper shows that these granule inputs are powerfully transmitted to the molecular layer even in a decerebrated animal (i.e. where only the ascending sensory pathways remains) Jo¨rntell and Ekerot 2002, Neuron.
We agree that there is strong evidence for a topographic organization in mossy fiber to granule cell connectivity at the microzonal level. We thank the Reviewer for pointing us to specific examples. We acknowledge that our simplified model does not capture the structure of connectivity observed in these studies.
However, the focus of our model is on cerebellar neurons presynaptic to a single Purkinje cell. Random or disordered distribution of inputs at this local scale is compatible with topographic organization at the microzonal scale. Furthermore, while there is evidence of structured connections at the local scale, models with random connectivity are able to reproduce the dimensionality of granule cell activity within a small margin of error (Nguyen et al., 2022). Finally, our finding that dense codes are optimal for learning slowly varying tasks is consistent with evidence for the lack of re-coding – for such tasks, re-coding may absent because it is not required.
We have dedicated a section on this issue in the Assumptions and Extensions portion of our Discussion:
"Another key assumption concerning the granule cells is that they sample mossy fiber inputs randomly, as is typically assumed in Marr-Albus models (Marr, 1969; Albus, 1971; LitwinKumar et al., 2017; Cayco-Gajic et al., 2017). Other studies instead argue that granule cells sample from mossy fibers with highly similar receptive fields (Garwicz et al., 1998; Brown and Bower, 2001; J¨orntell and Ekerot, 2006) defined by the tuning of mossy fiber and climbing fiber inputs to cerebellar microzones (Apps et al., 2018). This has led to an alternative hypothesis that granule cells serve to relay similarly tuned mossy fiber inputs and enhance their signal-to-noise ratio (Jo¨rntell and Ekerot, 2006; Gilbert and Chris Miall, 2022) rather than to re-encode inputs. Another hypothesis is that granule cells enable Purkinje cells to learn piece-wise linear approximations of nonlinear functions (Spanne and J¨orntell, 2013). However, several recent studies support the existence of heterogeneous connectivity and selectivity of granule cells to multiple distinct inputs at the local scale (Huang et al., 2013; Ishikawa et al., 2015). Furthermore, the deviation of the predicted dimension in models constrained by electron-microscopy data as compared to randomly wired models is modest (Nguyen et al., 2022). Thus, topographically organized connectivity at the macroscopic scale may coexist with disordered connectivity at the local scale, allowing granule cells presynaptic to an individual Purkinje cell to sample heterogeneous combinations of the subset of sensorimotor signals relevant to the tasks that Purkinje cell participates in. Finally, we note that the optimality of dense codes for learning slowly varying tasks in our theory suggests that observations of a lack of mixing (J¨orntell and Ekerot, 2002) for such tasks are compatible with Marr-Albus models, as in this case nonlinear mixing is not required."
7) I could not find any description of the neuron model used in this paper, so I assume that the neurons are just modelled as linear summators with a threshold (in fact, Figure 5 mentions inhibition, but this appears to be just one big lump inhibition, which basically is an incorrect implementation). In reality, granule cells of course do have specific properties that can impact the input-output transformation, PARTICULARLY with respect to the comparison of sparse versus dense coding, because the low-pass filtering of input that occurs in granule cells (and other neurons) as well as their spike firing stochasticity (Saarinen et al (2008). Stochastic differential equation model for cerebellar granule cell excitability. PLoS Comput. Biol. 4:e1000004) will profoundly complicate these comparisons and make them less straight forward than what is portrayed in this paper. There are also several other factors that would be present in the biological setting but are lacking here, which makes it doubtful how much information in relation to the biological performance that this modelling study provides: What are the types of activity patterns of the inputs? What are the learning rules? What is the topography? What is the impact of Purkinje cell outputs downstream, as the Purkinje cell output does not have any direct action, it acts on the deep cerebellar nuclear neurons, which in turn act on a complex sensorimotor circuitry to exert their effect, hence predictive coding could only become interpretable after the PC output has been added to the activity in those circuits. Where is the differentiated Golgi cell inhibition?
Thank you for these critiques. We have made numerous edits to improve the presentation of the details of our model in the main text of the manuscript. Indeed, granule cells in the main text are modeled as linear sums of mossy fiber inputs with a threshold-linear activation function. A more detailed description of the model for granule cells can now be found in Equation 1 in the Results section:
"The activity of neurons in the expansion layer is given by: h = φ(Jeffx − θ), (1) where φ is a rectified linear activation function φ(u) = max(u,0) applied element-wise. Our results also hold for other threshold-polynomial activation functions. The scalar threshold θ is shared across neurons and controls the coding level, which we denote by f, defined as the average fraction of neurons in the expansion layer that are active."
Most of our analyses use the firing rate model we describe above, but several Supplemental Figures show extensions to this model. As we mention in the Discussion, our results do not depend on the specific choice of nonlinearity (Figure 2-figure supplement 2). We have also considered the possibility that the stochastic nature of granule cell spikes could impact our measures of coding level. In Figure 7-figure supplement 1 we test the robustness of our main conclusion using a spiking model where we model granule cell spikes with Poisson statistics. When measuring coding level in a population of spiking neurons, a key question is at what time window the Purkinje cell integrates spikes. For several choices of integration time windows, we show that dense coding remains optimal for learning smooth tasks. However, we agree with the Reviewer that there are other biological details our model does not address. For example, our spiking model does not capture some of the properties the Saarinen et al. (2008) model captures, including random sub-threshold oscillations and clusters of spikes. Modeling biophysical phenomena at this scale is beyond the scope of our study. We have added this reference to the relevant section of the Discussion:
"We also note that coding level is most easily defined when neurons are modeled as rate, rather than spiking units. To investigate the consistency of our results under a spiking code, we implemented a model in which granule cell spiking exhibits Poisson variability and quantify coding level as the fraction of neurons that have nonzero spike counts (Figure 7-figure supplement 1; Figure 7C). In general, increased spike count leads to improved performance as noise associated with spiking variability is reduced. Granule cells have been shown to exhibit reliable burst responses to mossy fiber stimulation (Chadderton et al., 2004), motivating models using deterministic responses or sub-Poisson spiking variability. However, further work is needed to quantitatively compare variability in model and experiment and to account for more complex biophysical properties of granule cells (Saarinen et al., 2008)."
A second concern the Reviewer raises is our implementation of Golgi cell inhibition as a homogeneous rather than heterogeneous input onto granule cells. In simplified models, adding heterogeneous inhibition does not dramatically change the qualitative properties of the expansion layer representation, in particular the dimensionality of the representation (Billings et al., 2014, Cayco-Gajic et al., 2017, Litwin-Kumar et al., 2017). We have added a section about inhibition to our Discussion:
"We also have not explicitly modeled inhibitory input provided by Golgi cells, instead assuming such input can be modeled as a change in effective threshold, as in previous studies (Billings et al., 2014; Cayco-Gajic et al., 2017; Litwin-Kumar et al., 2017). This is appropriate when considering the dimension of the granule cell representation (Litwin-Kumar et al., 2017), but more work is needed to extend our model to the case of heterogeneous inhibition."
Regarding the mossy fiber inputs, as we state in response to paragraph 3, we agree with the Reviewer that the random and uncorrelated mossy fiber activity that has been used in previous studies is an unrealistic idealization of in vivo neural activity. One of the motivations for our model was to relax this assumption and examine the consequences: we introduce correlations in the mossy fiber activity by projecting low-dimensional patterns into the mossy fiber layer (Figure 1B):
"A typical assumption in computational theories of the cerebellar cortex is that inputs are randomly distributed in a high-dimensional space (Marr, 1969; Albus, 1971; Brunel et al., 2004; Babadi and Sompolinsky, 2014; Billings et al., 2014; Litwin-Kumar et al., 2017). While this may be a reasonable simplification in some cases, many tasks, including cerebellumdependent tasks, are likely best-described as being encoded by a low-dimensional set of variables. For example, the cerebellum is often hypothesized to learn a forward model for motor control (Wolpert et al., 1998), which uses sensory input and motor efference to predict an effector’s future state. Mossy fiber activity recorded in monkeys correlates with position and velocity during natural movement (van Kan et al., 1993). Sources of motor efference copies include motor cortex, whose population activity lies on a low-dimensional manifold (Wagner et al., 2019; Huang et al., 2013; Churchland et al., 2010; Yu et al., 2009). We begin by modeling the low dimensionality of inputs and later consider more specific tasks.
We therefore assume that the inputs to our model lie on a D-dimensional subspace embedded in the N-dimensional input space, where D is typically much smaller than N (Figure 1B). We refer to this subspace as the “task subspace” (Figure 1C)."
The Reviewer also mentions the learning rule at granule cell to Purkinje cell synapses. We agree that considering online, climbing-fiber-dependent learning is an important generalization. We therefore added a new supplemental figure investigating whether we would still see a difference in optimal coding levels across tasks if online learning were used instead of the least squares solution (Figure 7-figure supplement 2). Indeed, we observed a similar task dependence as we saw in Figure 2F. We have added a new paragraph in the Discussion under Assumptions and Extensions describing our rationale and approach in detail:
"For the Purkinje cells, our model assumes that their responses to granule cell input can be modeled as an optimal linear readout. Our model therefore provides an upper bound to linear readout performance, a standard benchmark for the quality of a neural representation that does not require assumptions on the nature of climbing fiber-mediated plasticity, which is still debated. Electrophysiological studies have argued in favor of a linear approximation (Brunel et al., 2004). To improve the biological applicability of our model, we implemented an online climbing fiber-mediated learning rule and found that optimal coding levels are still task-dependent (Figure 7-figure supplement 2). We also note that although we model several timing-dependent tasks (Figure 7), our learning rule does not exploit temporal information, and we assume that temporal dynamics of granule cell responses are largely inherited from mossy fibers. Integrating temporal information into our model is an interesting direction for future investigation."
Finally, regarding the function of the Purkinje cell, our model defines a learning task as a mapping from inputs to target activity in the Purkinje cell and is thus agnostic to the cell’s downstream effects. We clarify this point when introducing the definition of a learning task:
"In our model, a learning task is defined by a mapping from task variables x to an output f(x), representing a target change in activity of a readout neuron, for example a Purkinje cell. The limited scope of this definition implies our results should not strongly depend on the influence of the readout neuron on downstream circuits."
8) The problem of these, in my impression, generic, arbitrary settings of the neurons and the network in the model becomes obvious here: ‘In contrast to the dense activity in cerebellar granule cells, odor responses in Kenyon cells, the analogs of granule cells in the Drosophila mushroom body, are sparse...’ How can this system be interpreted as an analogy to granule cells in the mammalian cerebellum when the model does not address the specifics lined up above? I.e. the ‘inductive bias’ that the authors speak of, defined as ‘the tendency of a network toward learning particular types of input-output mappings’, would be highly dependent on the specifics of the network model.
We agree with the Reviewer that our model makes several simplifying assumptions for mathematical tractability. However, we note that our study is not the first to draw analogies between cerebellum-like systems, including the mushroom body (Bell et al., 2008; Farris, 2011). All the systems we study feature a sparsely connected, expanded granule-like layer that sends parallel fiber axons onto densely connected downstream neurons known to exhibit powerful synaptic plasticity, thus motivating the key architectural assumptions of our model. We have constrained anatomical parameters of the model using data as available (Table 1). However, we agree with the Reviewer that when making comparisons across species there is always a possibility that differences are due to physiological mechanisms we have not fully understood or captured with a model. As such, we can only present a hypothesis for these differences. We have modified our Discussion section on this topic to clearly state this.
"Our results predict that qualitative differences in the coding levels of cerebellum-like systems, across brain regions or across species, reflect an optimization to distinct tasks (Figure 7). However, it is also possible that differences in coding level arise from other physiological differences between systems."
9) More detailed comments: Abstract: ‘In these models [Marr-Albus], granule cells form a sparse, combinatorial encoding of diverse sensorimotor inputs. Such sparse representations are optimal for learning to discriminate random stimuli.’ Yes, I would agree with the first part, but I contest the second part of this statement. I think what is true for sparse coding is that the learning of random stimuli will be faster, as in a perceptron, but not necessarily better. As the sparsification essentially removes information, it could be argued that the quality of the learning is poorer. So from that perspective, it is not optimal. The authors need to specify from what perspective they consider sparse representations optimal for learning.
This is an important point that we would like to clarify. It is not the case that sparse coding simply speeds up learning. In our study and many related works (Barak et al. 2013; Babadi and Sompolinsky 2014; Litwin-Kumar et al. 2017), learning performance is measured based on the generalization ability of the network – the ability to predict correct labels for previously unseen inputs. As our study and previous studies show, sparse codes are optimal in the sense that they minimize generalization error, independent of any effect on learning speed. To communicate this more effectively, we have added the following sentence to the first paragraph of the Introduction:
"Sparsity affects both learning speed (Cayco-Gajic et al., 2017), and generalization, the ability to predict correct labels for previously unseen inputs (Barak et al., 2013; Babadi and Sompolinsky, 2014; Litwin-Kumar et al., 2017)."
10) Introduction: ‘Indeed, several recent studies have reported dense activity in cerebellar granule cells in response to sensory stimulation or during motor control tasks (Knogler et al., 2017; Wagner et al., 2017; Giovannucci et al., 2017; Badura and De Zeeuw, 2017; Wagner et al., 2019), at odds with classic theories (Marr, 1969; Albus, 1971).’ In fact, this was precisely the issue that was addressed already by Jo¨rntell and Ekerot (2006) Journal of Neuroscience. The conclusion was that these actual recordings of granule cells in vivo provided essentially no support for the assumptions in the Marr-Albus theories.
In our reading, the main finding of J¨orntell and Ekerot (2006) is that individual granule cells are activated by mossy fibers with overlapping receptive fields driven by a single type of somatosensory input. However, there is also evidence of nonlinear mixed selectivity in granule cells in support of the re-coding hypothesis (Huang et al., 2013; Ishikawa et al., 2015). Jo¨rntell and Ekerot (2006) also suggest that the granule cell layer shares similar topographic organization as mossy fibers, organized into microzones. The existence of topographic organization does not invalidate Marr-Albus theories. As we have suggested earlier, a local combinatorial expansion can coexist with a global topographic organization.
We have described these considerations in the Assumptions and Extensions portion of the Discussion:
"Another key assumption concerning the granule cells is that they sample mossy fiber inputs randomly, as is typically assumed in Marr-Albus models (Marr, 1969; Albus, 1971; LitwinKumar et al., 2017; Cayco-Gajic et al., 2017). Other studies instead argue that granule cells sample from mossy fibers with highly similar receptive fields (Garwicz et al., 1998; Brown and Bower, 2001; J¨orntell and Ekerot, 2006) defined by the tuning of mossy fiber and climbing fiber inputs to cerebellar microzones (Apps et al., 2018). This has led to an alternative hypothesis that granule cells serve to relay similarly tuned mossy fiber inputs and enhance their signal-to-noise ratio (Jo¨rntell and Ekerot, 2006; Gilbert and Chris Miall, 2022) rather than to re-encode inputs. Another hypothesis is that granule cells enable Purkinje cells to learn piece-wise linear approximations of nonlinear functions (Spanne and J¨orntell, 2013). However, several recent studies support the existence of heterogeneous connectivity and selectivity of granule cells to multiple distinct inputs at the local scale (Huang et al., 2013; Ishikawa et al., 2015). Furthermore, the deviation of the predicted dimension in models constrained by electron-microscopy data as compared to randomly wired models is modest (Nguyen et al., 2022). Thus, topographically organized connectivity at the macroscopic scale may coexist with disordered connectivity at the local scale, allowing granule cells presynaptic to an individual Purkinje cell to sample heterogeneous combinations of the subset of sensorimotor signals relevant to the tasks that Purkinje cell participates in. Finally, we note that the optimality of dense codes for learning slowly varying tasks in our theory suggests that observations of a lack of mixing (J¨orntell and Ekerot, 2002) for such tasks are compatible with Marr-Albus models, as in this case nonlinear mixing is not required."
We have also included the Jo¨rntell and Ekerot (2006) study as a citation in the Introduction:
"Indeed, several recent studies have reported dense activity in cerebellar granule cells in response to sensory stimulation or during motor control tasks (Jo¨rntell and Ekerot, 2006; Knogler et al., 2017; Wagner et al., 2017; Giovannucci et al., 2017; Badura and De Zeeuw, 2017; Wagner et al., 2019), at odds with classic theories (Marr, 1969; Albus, 1971)."
11) Results: 1st para: There is no information about how the granule cells are modelled.
We agree that this should information should have been more readily available. We now more completely describe the model in the main text. Our model for granule cells can be found in Equation 1 in the Results section and also the Methods (Network Model):
"The activity of neurons in the expansion layer is given by: h = φ(Jeffx − θ), (2)
where φ is a rectified linear activation function φ(u) = max(u,0) applied element-wise. Our results also hold for other threshold-polynomial activation functions. The scalar threshold θ is shared across neurons and controls the coding level, which we denote by f, defined as the average fraction of neurons in the expansion layer that are active."
12) 2nd para: ‘A typical assumption in computational theories of the cerebellar cortex is that inputs are randomly distributed in a high-dimensional space.’ Yes, I agree, and this is in fact in conflict with the known topographical organization in the cerebellar cortex (see broader comment above). Mossy fiber inputs coding for closely related inputs are co-localized in the cerebellar cortex. I think for this model to be of interest from the point of view of the mammalian cerebellar cortex, it would need to pay more attention to this organizational feature.
As we discuss in our response to paragraphs 5 and 6, we see the random distribution assumption at the local scale (inputs presynaptic to a single Purkinje cell) as being compatible with topographic organization occurring at the microzone scale. Furthermore, as discussed earlier, we specifically model low-dimensional input as opposed to the random and high-dimensional inputs typically studied in prior models.
"A typical assumption in computational theories of the cerebellar cortex is that inputs are randomly distributed in a high-dimensional space (Marr, 1969; Albus, 1971; Brunel et al., 2004; Babadi and Sompolinsky, 2014; Billings et al., 2014; Litwin-Kumar et al., 2017). While this may be a reasonable simplification in some cases, many tasks, including cerebellumdependent tasks, are likely best-described as being encoded by a low-dimensional set of variables. For example, the cerebellum is often hypothesized to learn a forward model for motor control (Wolpert et al., 1998), which uses sensory input and motor efference to predict an effector’s future state. Mossy fiber activity recorded in monkeys correlates with position and velocity during natural movement (van Kan et al., 1993). Sources of motor efference copies include motor cortex, whose population activity lies on a low-dimensional manifold (Wagner et al., 2019; Huang et al., 2013; Churchland et al., 2010; Yu et al., 2009). We begin by modeling the low dimensionality of inputs and later consider more specific tasks. We therefore assume that the inputs to our model lie on a D-dimensional subspace embedded in the N-dimensional input space, where D is typically much smaller than N (Figure 1B). We refer to this subspace as the “task subspace” (Figure 1C)."
References
Albus, J.S. (1971). A theory of cerebellar function. Mathematical Biosciences 10, 25–61.
Apps, R., et al. (2018). Cerebellar Modules and Their Role as Operational Cerebellar Processing Units. Cerebellum 17, 654–682.
Babadi, B. and Sompolinsky, H. (2014). Sparseness and expansion in sensory representations. Neuron 83, 1213–1226.
Badura, A. and De Zeeuw, C.I. (2017). Cerebellar granule cells: dense, rich and evolving representations. Current Biology 27, R415–R418.
Barak, O., Rigotti, M., and Fusi, S. (2013). The sparseness of mixed selectivity neurons controls the generalization–discrimination trade-off. Journal of Neuroscience 33, 3844– 3856.
Bell, C.C., Han, V., and Sawtell, N.B. (2008). Cerebellum-like structures and their implications for cerebellar function. Annual Review of Neuroscience 31, 1–24.
Billings, G., Piasini, E., Lo˝rincz, A., Nusser, Z., and Silver, R.A. (2014). Network structure within the cerebellar input layer enables lossless sparse encoding. Neuron 83, 960–974.
Bordelon, B., Canatar, A., and Pehlevan, C. (2020). Spectrum dependent learning curves in kernel regression and wide neural networks. International Conference on Machine Learning 1024–1034.
Brown, I.E. and Bower, J.M. (2001). Congruence of mossy fiber and climbing fiber tactile projections in the lateral hemispheres of the rat cerebellum. Journal of Comparative Neurology 429, 59–70.
Brunel, N., Hakim, V., Isope, P., Nadal, J.P., and Barbour, B. (2004). Optimal information storage and the distribution of synaptic weights: perceptron versus Purkinje cell. Neuron 43, 745–757.
Canatar, A., Bordelon, B., and Pehlevan, C. (2021). Spectral bias and task-model alignment explain generalization in kernel regression and infinitely wide neural networks. Nature Communications 12, 1–12.
Cayco-Gajic, N.A., Clopath, C., and Silver, R.A. (2017). Sparse synaptic connectivity is required for decorrelation and pattern separation in feedforward networks. Nature Communications 8, 1–11.
Chadderton, P., Margrie, T.W., and Ha¨usser, M. (2004). Integration of quanta in cerebellar granule cells during sensory processing. Nature 428, 856–860.
Churchland, M.M., et al. (2010). Stimulus onset quenches neural variability: a widespread cortical phenomenon. Nature Neuroscience 13, 369–378.
Farris, S.M. (2011). Are mushroom bodies cerebellum-like structures? Arthropod structure & development 40, 368–379.
Garwicz, M., Jorntell, H., and Ekerot, C.F. (1998). Cutaneous receptive fields and topography of mossy fibres and climbing fibres projecting to cat cerebellar C3 zone. The Journal of Physiology 512 ( Pt 1), 277–293.
Gilbert, M. and Chris Miall, R. (2022). How and Why the Cerebellum Recodes Input Signals: An Alternative to Machine Learning. The Neuroscientist 28, 206–221.
Giovannucci, A., et al. (2017). Cerebellar granule cells acquire a widespread predictive feedback signal during motor learning. Nature Neuroscience 20, 727–734.
Huang, C.C., et al. (2013). Convergence of pontine and proprioceptive streams onto multimodal cerebellar granule cells. eLife 2, e00400.
Ishikawa, T., Shimuta, M., and Ha¨usser, M. (2015). Multimodal sensory integration in single cerebellar granule cells in vivo. eLife 4, e12916.
Jacot, A., Gabriel, F., and Hongler, C. (2018). Neural tangent kernel: Convergence and generalization in neural networks. Advances in Neural Information Processing Systems 31.
Jo¨rntell, H. and Ekerot, C.F. (2002). Reciprocal Bidirectional Plasticity of Parallel Fiber Receptive Fields in Cerebellar Purkinje Cells and Their Afferent Interneurons. Neuron 34, 797–806.
Jorntell, H. and Ekerot, C.F. (2006). Properties of Somatosensory Synaptic Integration in Cerebellar Granule Cells In Vivo. Journal of Neuroscience 26, 11786–11797.
Knogler, L.D., Markov, D.A., Dragomir, E.I., Stih, V., and Portugues, R. (2017). Senso-ˇ rimotor representations in cerebellar granule cells in larval zebrafish are dense, spatially organized, and non-temporally patterned. Current Biology 27, 1288–1302.
Litwin-Kumar, A., Harris, K.D., Axel, R., Sompolinsky, H., and Abbott, L.F. (2017). Optimal degrees of synaptic connectivity. Neuron 93, 1153–1164. Marr, D. (1969). A theory of cerebellar cortex. Journal of Physiology 202, 437–470.
Nguyen, T.M., et al. (2022). Structured cerebellar connectivity supports resilient pattern separation. Nature 1–7.
Saarinen, A., Linne, M.L., and Yli-Harja, O. (2008). Stochastic Differential Equation Model for Cerebellar Granule Cell Excitability. PLOS Computational Biology 4, e1000004.
Simon, J.B., Dickens, M., and DeWeese, M.R. (2021). A theory of the inductive bias and generalization of kernel regression and wide neural networks. arXiv: 2110.03922.
Sollich, P. (1998). Learning curves for Gaussian processes. Advances in Neural Information Processing Systems 11.
Spanne, A. and Jo¨rntell, H. (2013). Processing of Multi-dimensional Sensorimotor Information in the Spinal and Cerebellar Neuronal Circuitry: A New Hypothesis. PLOS Computational Biology 9, e1002979.
Spanne, A. and Jo¨rntell, H. (2015). Questioning the role of sparse coding in the brain. Trends in Neurosciences 38, 417–427.
van Kan, P.L., Gibson, A.R., and Houk, J.C. (1993). Movement-related inputs to intermediate cerebellum of the monkey. Journal of Neurophysiology 69, 74–94.
Wagner, M.J., Kim, T.H., Savall, J., Schnitzer, M.J., and Luo, L. (2017). Cerebellar granule cells encode the expectation of reward. Nature 544, 96–100.
Wagner, M.J., et al. (2019). Shared cortex-cerebellum dynamics in the execution and learning of a motor task. Cell 177, 669–682.e24.
Wolpert, D.M., Miall, R.C., and Kawato, M. (1998). Internal models in the cerebellum. Trends in Cognitive Sciences 2, 338–347.
Yu, B.M., et al. (2009). Gaussian-process factor analysis for low-dimensional single-trial analysis of neural population activity. Journal of Neurophysiology 102, 614–635.
Author Response
Reviewer #1 (Public Review):
In this manuscript, Huang et al., assess cognitive flexibility in rats trained on an animal model of anorexia nervosa known as activity-based anorexia (ABA). For the first time, they do this in a way that is fully automated and free from experimenter interference, as apparently experimenter interference can affect both the development of ABA as well as the effect on behaviour. They show that animals that are more cognitively flexible (i.e. animals that had received reversal training) were better able to resist weight loss upon exposure to ABA, whereas animals exposed to ABA first show poorer cognitive flexibility (reversal performance).
Strengths:
The development of a fully-automated, experimenter-free behavioural assessment paradigm that is capable of identifying individual rats and therefore tracking their performance.
The bidirectional nature of the study - i.e. the fact that animals were tested for cognitive flexibility both before and after exposure to ABA, so that direction of causality could be established.
The analyses are rigorous and the sample sizes sufficient.
The use of touchscreens increases the translational potential of the findings.
Weaknesses
- Some descriptions of methods and results are confusing or insufficiently detailed.
We have been through all methods and results to include additional details as requested by this reviewer below.
It seems to me that performance on the pairwise discrimination task cannot be directly (statistically) compared to performance on reversal (as in Figure 4E), as these are tapping into fundamentally different cognitive processes (discrimination versus reversal learning). I think comparing groups on each assessment is valid, however.
We agree that discrimination and reversal are different cognitive processes, and statistical comparisons between these two components of the task were only made when examining the speed of learning in the validation of the novel testing system. Moreover, our inclusion of the pink and purple bars on graphs such as Figure 4C & 4E represent “main effects of ABA exposure”, regardless of learning phase (PD or reversal) rather than, as you describe, comparing PD to R1. Perhaps this comparison wasn’t clear, so we have amended the text to say ‘main effect of ABA exposure p=.0017’ rather than just “exposure”.
Not necessarily a 'weakness' but I would have loved to see some assessment of the alterations in neural mechanisms underlying these effects, and/or some different behavioural assessments in addition to those used here. In particular, the authors mention in the discussion that this manipulation can affect cholinergic functioning in the dorsal striatum We (Bradfield et al., Neuron, 2013) and a number of others have now demonstrated that cholinergic dysfunction in the dorsomedial striatum impairs a different kind of reversal learning that based on alterations in outcome identity and thus relies on a different cognitive process (i.e. 'state' rather than 'reward' prediction error). It would be interesting perhaps in the future to see if the ABA manipulation also alters performance on this alternative 'cognitive flexibility' task.
This is an excellent suggestion and we have already begun exploring this in other ongoing work in the laboratory. Due to ‘compulsive’ wheel running being a hallmark of ABA, we are interested in determining if this also translates to a goal-directed action impairment using the well-established outcome-specific devaluation task. Perhaps with ABA it may be more relevant to investigate outcome-reversals rather than stimulus-reversals, and if this is the case, it would further support the use of the ABA model for investigating cognitive dysfunction relevant to AN. We have included an additional section in the discussion text relating to our hypotheses regarding outcome-specific reversal learning in the ABA model.
Nevertheless, I certainly think the manuscript provides a solid appraisal of cognitive flexibility using more traditional tasks, and that the authors have achieved their aims. I think the work here will be of importance, certainly to other researchers using the ABA model, but perhaps also of translational importance in the future, as the causal relationship between ABA and cognitive inflexibility is near impossible to establish using human studies, but here evidence points strongly towards this being the case.
Reviewer #2 (Public Review):
Huang and colleagues present data from experiments assessing the role of cognitive inflexibility in the vulnerability to weight loss in the activity-based anorexia paradigm in rats. The experiments employ a novel in-home cage touchscreen system. The home cage touch screen system allows reduced testing time and increased throughput compared with the more widely used systems resulting in the ability to assess ABA following testing cognitive flexibility in relatively young female rats. The data demonstrate that, contrary to expectations, cognitive inflexibility does not predispose to greater ABA weight loss, but instead, rats that performed better in the reversal learning task lost more weight in the ABA paradigm. Prior ABA exposure resulted in poorer learning of the task and reversal. An additional experiment demonstrated that rats that had been trained in reversal learning resisted weight loss in the ABA paradigm. The findings are important and are clearly presented. They have implications for anorexia nervosa both in terms of potentially identifying those at risk also in understanding the high rates of relapse.
Thanks for a great summary of the manuscript.
Reviewer #3 (Public Review):
Activity-based anorexia (ABA), which combines access to a running wheel and restricted access to food, is a most common paradigm used to study anorexic behavior in rodents. And yet, the field has been plagued by persistent questions about its validity as a model of anorexia nervosa (AN) in humans. This group's previous studies supported the idea that the ABA paradigm captures cognitive inflexibility seen in AN. Here they describe a fully automated touchscreen cognitive testing system for rats that makes it possible to ask whether cognitive inflexibility predisposes individuals to severe weight loss in the ABA paradigm. They observed that cognitive inflexibility was predictive of resistance to weight loss in the ABA, the opposite of what was predicted. They also reported reciprocal effects of ABA and cognitive testing on subsequent performance in the other paradigm. Prior exposure to the ABA decreased subsequent cognitive performance, while prior exposure to the cognitive task promoted resistance to the ABA. Based on these findings, the authors argue that the ABA model can be used to identify novel therapeutic targets for AN.
The strength of this manuscript is primarily as a methods paper describing a novel automated cognitive behavioral testing system that obviates the need for experimentalist handling and single housing, which can interfere with behavioral testing, and accelerate learning on the task. Together, these features make it feasible to perform longitudinal studies to ask whether cognitive performance is predictive of behavior in a second paradigm during adolescence, a peak period of vulnerability for many psychiatric disorders. The authors also used machine learning tools to identify specific behaviors during the cognitive task that predicted later susceptibility to the ABA paradigm. While the benefits of this system are clear, the rigor and reproducibility of experiments using this paradigm would be enhanced if the authors provided clear guidelines about which parameters and analyses are most useful. In their absence, the large amount of data generated can promote p-hacking.
The authors use their automated behavioral testing paradigm to ask whether cognitive inflexibility is a cause or consequence of susceptibility to ABA, an issue that cannot be addressed in AN. They provide compelling evidence that there are reciprocal effects of the two behavioral paradigms, but do not perform the controls needed to evaluate the significance of these observations. For example, the learning task involves sucrose consumption and food restriction, conditions that can independently affect susceptibility to the ABA. Similarly, the ABA paradigm involves exercise and restricted access to food, which can both affect learning.
In the Discussion, the authors hypothesize that the ABA paradigm produces cognitive inflexibility and argue that uncovering the underlying mechanism can be used to identify new therapeutic targets for AN. The rationale for their claim of translational relevance is undermined by the fact that the biggest effect of the ABA paradigm is seen in the pair discrimination task, and not reversal learning. This pattern does not fit clinical observations in AN.
In summary, the significance of this manuscript lies in the development of a new system to test cognitive function in rats that can be combined with other paradigms to explore questions of causality. While the authors clearly demonstrate that cognitive flexibility does not promote susceptibility to ABA, the experiments presented do not provide a compelling case that their model captures important features of the pathophysiology of AN.
We thank the reviewer for this detailed review and note that we have now both explicitly defined the most useful parameters for analyses from the novel touchscreen system as well as removed some comparisons that could be considered superfluous. We argue that the additional information provided by the machine learning analyses are, at this stage, exploratory, and rather than reveal independent descriptions of behavioural change in ABA exposed versus naïve rats this information will aid in the generation of hypotheses to be tested in future studies. Therefore, the figures pertaining to these analyses have now been provided as supplements to Figures 3 & 4 (Figure 3-figure supplement 3; Figure 4-figure supplements 3&4). We have also clarified our intention to explore possible behavioural differences using this technique in the methods and discussion.
We have also completed the essential control experiment, defined in the “essential revisions” section of this review, whereby we show only moderate impairments in reversal learning following a matched period of food restriction without rapid weight loss, suggesting that the substantial impairment seen following ABA exposure was not due to food restriction alone (see updated Figure 4 and supplements).
However, we do not agree with this reviewer “that the biggest effect of the ABA paradigm is seen in the pair discrimination task” and point to the outcomes of both reciprocal experiments.
In the first experiment, rats that went onto be susceptible or resistant to ABA did not differ on pairwise discrimination learning but specifically on performance at the reversal of reward contingencies (Figure 3B & E). Although this result was not in the hypothesised direction, this suggests that reversal learning specifically and not pairwise discrimination can differentiate those rats that go on to be susceptible to weight loss. We have included additional discussion in the text related to this finding (see line 490-497).
In the second experiment, it is clear by the number of ABA exposed rats that were unable to learn the reversal component even after being able to learn pairwise discrimination, that flexible learning is more impaired by ABA. While it is true that ABA exposed rats that were successful in learning the reversal task were slower to learn the pairwise discrimination component than naïve rats (Figure 4E), this was not related to their ability to learn the reversal task overall – with equivalent learning rates in pairwise discrimination to ABA exposed rats that failed to learn the reversal component (Figure 4G-I). The absence of significant differences between ABA exposed and naïve animals in Figure 4F relates to the fact that the large proportion of ABA exposed animals never reached performance criterion in the reversal phase of the task and therefore data from these animals could not be included in the figure. This is where the trials completed within each session becomes important for interpretation (i.e. Figure 4-figure supplement 1M-O), whereby ABA exposure caused impaired responding specifically within the reversal phase of the task. The results text has been updated to better reflect this critical point.
Overall, this suggests that the impairment in cognitive flexibility caused by ABA exposure was related both to an associative learning impairment (slower to learn PD than naïve animals) and an impairment in the integration of new and existing learning (failure to learn R1 in a large proportion of animals).
Gary Hall: You write that ‘our first shared commitment was to a notion of situated knowledges’. A lot of terms such as identity politics, decolonisation, intersectionality etc. have been divorced from their embeddedness in specific knowledge contexts to beome something of a fashionable floating signifier. Identity politics, for example, was developed by the radical Black feminist Combahee River Collective. Olúfémi O. Táíwò has recently emphasised how, for them, identity politics was about ‘fostering solidarity and collaboration’ across differences rather than about division based on narrow ‘conceptions of group interests’, which is what he sees it as having become (Olúfémi O. Táíwò, Elite Capture: How The Powerful Took Over Identity Politics (And Everything Else) (London: Pluto, 2022) 6-8). Is there a danger of something similar taking place with regard to Donna Haraway’s influential concept of situated knowledges (Donna Haraway, ‘Situated Knowledges: The Science Question In Feminism And The Privilege Of Partial Perspective’, Feminist Studies, Vol.14, No.3 (Autumn, 1988))?
Might we even go so far as to say that very often the last thing that is situated when it comes to situated knowledges is the very idea of situated knowledges itself? How might your shared commitment to situated knowledges be situated in this respect?
Reviewer #2 (Public Review):
Olszyński et al. claim that they identified a "new-type" ultrasonic vocalization around 44 kHz that occurs in response to prolonged fear conditioning (using foot-shocks of relatively high intensity, i.e. 1 mA) in rats. Typically, negative 22-kHz calls and positive 50-kHz calls are distinguished in rats, commonly by using a frequency threshold of 30 or 32 kHz. Olszyński et al. now observed so-called "44-kHz" calls in a substantial number of subjects exposed to 10 tone-shock pairings, yet call emission rate was low (according to Fig. 1G around 15%, according to the result text around 7.5%). They also performed playback experiments and concluded that "the responses to 44-kHz aversive calls presented from the speaker were either similar to 22-kHz vocalizations or in-between responses to 22-kHz and 50-kHz playbacks".
Strengths: Detailed spectrographic analysis of a substantial data set of ultrasonic vocalizations recorded during prolonged fear conditioning, combined with playback experiments.
Weaknesses: I see a number of major weaknesses.
While the descriptive approach applied is useful, the findings have only focused importance and scope, given the low prevalence of "44 kHz" calls and limited attempts made to systematically manipulate factors that lead to their emission. In fact, the data presented appear to be derived from reanalyses of previously conducted studies in most cases and the main claims are only partially supported. While reading the manuscript, I got the impression that the data presented here are linked to two or three previously published studies (Olszyński et al., 2020, 2021, 2023). This is important to emphasize for two reasons: 1) It is often difficult (if not impossible) to link the reported data to the different experiments conducted before (and the individual experimental conditions therein). While reanalyzing previously collected data can lead to important insight, it is important to describe in a clear and transparent manner what data were obtained in what experiment (and more specifically, in what exact experimental condition) to allow appropriate interpretation of the data. For example, it is said that in the "trace fear conditioning experiment" both single- and group-housed rats were included, yet I was not able to tell what data were obtained in single- versus group-housed rats. This may sound like a side aspect, however, in my view this is not a side aspect given the fact that ultrasonic vocalizations are used for communication and communication is affected by the social housing conditions. 2) In at least two of the previously published manuscripts (Olszyński et al., 2021, 2023), emission of ultrasonic vocalizations was analyzed (Figure S1 in Olszyński et al., 2021, and Fig. 1 in Olszyński et al., 2023). This includes detailed spectrographic analyses covering the frequency range between 20 and 100 kHz, i.e. including the frequency range, where the "new-type" ultrasonic vocalization, now named "44 kHz" call, occurs, as reflected in the examples provided in Fig. 1 of Olszyński et al. (2023). In the materials and methods there, it was said: "USV were assigned to one of three categories: 50-kHz (mean peak frequency, MPF >32 kHz), short 22-kHz (MPF of 18-32 kHz, <0.3 s duration), long 22-kHz (MPF of 18-32 kHz, >0.3 s duration)". Does that mean that the "44 kHz" calls were previously included in the count for 50-kHz calls? Or were 44 kHz calls (intentionally?) left out? What does that mean for the interpretation of the previously published data? What does that mean for the current data set? In my view, there is a lack of transparency here.
Moreover, whether the newly identified call type is indeed novel is questionable, as also mentioned by the authors in their discussion section. While they wrote in the introduction that "high-pitch (>32 kHz), long and monotonous ultrasonic vocalizations have not yet been described", they wrote in the discussion that "long (or not that long (Biały et al., 2019)), frequency-stable high-pitch vocalizations have been reported before (e.g. Sales, 1979; Shimoju et al., 2020), notably as caused by intense cholinergic stimulation (Brudzynski and Bihari, 1990) or higher shock-dose fear conditioning (Wöhr et al., 2005)" (and I wish to add that to my knowledge this list provided by the authors is incomplete). Therefore, I believe, the strong claims made in abstract ("we are the first to describe a new-type..."), introduction ("have not yet been described"), and results ("new calls") are not justified.
In general, the manuscript is not well written/ not well organized, the description of the methods is insufficient, and it is often difficult (if not impossible) to link the reported data to the experiments/ experimental conditions described in the materials and methods section. For example, I miss a clear presentation of basic information: 1) How many rats emitted "44 kHz" calls (in total, per experiment, and importantly, also per experimental condition, i.e. single- versus group-housed)? 2) Out of the ones emitting "44 kHz" calls, what was the prevalence of "44 kHz" calls (relative to 22- and 50-kHz calls, e.g. shown as percentage)? 3) How did this ratio differ between experiments and experimental conditions? 4) Was there a link to freezing? Freezing was apparently analyzed before (Olszyński et al., 2021, 2023) and it would be important to see whether there is a correlation between "44-kHz" calls and freezing. Moreover, it would be important to know what behavior the rats are displaying while such "44-kHz" calls are emitted? (Note: Even not all 22-kHz calls are synced to freezing.) All this could help to substantiate the currently highly speculative claims made in the discussion section ("frequency increases with an increase in arousal" and "it could be argued that our prolonged fear conditioning increased the arousal of the rats with no change in the valence of the aversive stimuli"). Such more detailed analyses are also important to rule out the possibility that the "new-type" ultrasonic vocalization, the so-called "44 kHz" call, is simply associated with movement/ thorax compression.
The figures currently included are purely descriptive in most cases - and many of them are just examples of individual rats (e.g. majority of Fig. 1, all of Fig. 2 to my understanding, with the exception of the time course, which in case of D is only a subset of rats ("only rats that emitted 44-kHz calls in at least seven ITI are plotted" - is there any rationale for this criterion?)), or, in fact, just representative spectrograms of calls (all of Fig. 3, with the exception of G, all of Fig. 4). Moreover, the differences between Fig. 5 and Fig. 6 are not clear to me. It seems Fig. 5B is included three times - what is the benefit of including the same figure three times? A systematic comparison of experimental conditions is limited to Fig. 7 and Fig. 8, the figures depicting the playback results (which led to the conclusion that "the responses to 44-kHz aversive calls presented from the speaker were either similar to 22-kHz vocalizations or in-between responses to 22-kHz and 50-kHz playbacks", although it remains unclear to me why differences were seen b e f o r e the experimental manipulation, i.e. the different playback types in Fig. 8B).
Related to that, I miss a clear presentation of relevant methodological aspects: 1) Why were some rats single-housed but not the others? 2) Is the experimental design of the playback study not confounded? It is said that "one group (n = 13) heard 50-kHz appetitive vocalization playback while the other (n = 16) 22-kHz and 44-kHz aversive calls". How can one compare "44 kHz" calls to 22- and 50-kHz calls when "44 kHz" calls are presented together with 22-kHz calls but not 50-kHz calls? What about carry-over effects? Hearing one type of call most likely affects the response to the other type of call. It appears likely that rats are a bit more anxious after hearing aversive 22-kHz calls, for example. Therefore, it would not be very surprising to see that the response to "44 kHz" calls is more similar to 22-kHz calls than 50-kHz calls. Of note, in case of the other playback experiment it is just said that rats "received appetitive and aversive ultrasonic vocalization playback" but it remains unclear whether "44 kHz" calls are seen as appetitive or aversive. Later it says that "rats were presented with two 10-s-long playback sets of either 22-kHz or 44-kHz calls, followed by one 50-kHz modulated call 10-s set and another two playback sets of either 44-kHz or 22-kHz calls not previously heard" (and wonder what data set was included in the figures and how - pooled?). Again, I am worried about carry-over effects here. This does not seem to be an experimental design that allows to compare the response to the three main call types in an unbiased manner. Of note, what exactly is meant by "control rats" in the context of fear conditioning is also not clear to me. One can think of many different controls in a fear conditioning experiment. More concrete information is needed.
para facilit
facilitou sua vida?
a frente, sentir o aroma e provar a primeira porção são Estímulos Incondicionados (EIs), que levam à Resposta Incondicionada (RI) d
Está me vendo?
ância deste tipo de condicionamento para a formação de padrões alimentares. Por mais que existam sinais de fome e saciedade que, em teoria, ditam o início e término de cada refeição, na maioria das vezes esta função pertence ao condicionamento respondente.Imagine um cenário no qual você come
Teste anotação pública
comportamento reflexo pode ser aprendido pelo processo conhecido como condicionamento respondente.
Nada
namento para a formação de padrões alimentares. Por mais que existam sinais de fome e saciedade que, em teoria, ditam o início e
Teste Teste
Page note teste
des de cuidados críticos o intensivos, y con frecuencia es resistente a múltiples antibióticos. La Burkh
mkmlml